

Page 1

CONTENT Page
I. SAFETY INFORMATION ----------------- 2
II. FEATURE ------------------------------------- 2
III. GENERAL SPECIFICATION ----------- 3
IV. NAME AND FUNCTION ------------------ 4
V. OPERATION INSTRUCTIONS:
5.1 Setup Menu ----------------------------- 6
5.2 Measurement ------------------------10
5.3 Print ---------------------------------------12
5.4 Load Thermal Paper -----------------14
5.5 Replace Battery ---------------------15
VI. ATTENTION
6.1 Cancel Timed Printing -------------16
6.2 Cancel Timed Recording -----------16
6.3 Master Reset -------------------------17
VII. Software
7.1 Installation --------------------------- 18
7.2 Introduction --------------------------19
Page 2

Temperature Recorder
SAFETY INFORMATION
1. Read the following safety information carefully before
attempting to operate or service the meter.
2. Only qualified personnel should perform repairs or
servicing not covered in this manual.
3. Periodically wipe the case with a dry cloth. Do not use
abrasives or solvents on these instruments.
4. Safety symbols: Dangerous , refer to this manual
Apply with European CE.
before using the meter.
. FEATURE
1. Graphic Print Out.
2. Text Print Out.
3. The easy access menu buttons and text area in the LCD
display provide a simple and intuitive hierarchical menu
operation for system setup.
4. Built in system clock.
5. Photo coupler isolated RS-232 interface.
6. With Windows software.
7. 32,000 Records Data Logger.
8. T1 & T2 dual display with swapping display area.
9. MAX / MIN function.
10. REL function.
2
Page 3

Temperature Recorder
I. GENERAL SPECIFICATION
1. Measurement Range: TYPE K -200¡C ~ 1370¡C 328¡F ~ 2498¡F
TYPE J -200¡C ~ 760¡C -328¡F ~
1400¡F
2. Accuracy: -200¡C ~ 1370¡C –0.1% + 0.8¡C
-328¡F ~ 2498¡F –0.1% + 1.6¡F
3. Resolution: 0.1¡C / 0.1¡F
4. Sample Rate: 2 times / second
5. Input Protection: 60V DC or 24Vrms AC
6. Data Logger: 32,000 Records
7. Storage Condition: -10¡C ~ 60¡C (14¡F ~ 140¡F)
8. Operating Condition: 0¡C ~ 50¡C (32¡F ~ 122¡F)
9. Battery: Size AA 1.5V x 6 (alkaline battery)
10. AC Adapter: DC 9V ~ 12V , 1A Min
11. Thermal Paper: 58mm width, 31_
12. Dimension: 242 x 98 x 42mm
13. Weight: 580g Approx.
14. Accessory: Tool Box
0 ~ 80% RH
0 ~ 80% RH
Alkaline Battery Size AA 1.5V x 6
Instruction Menu
K Type Sensor x 2 (-50¡C ~ 200¡C)
Thermal Paper x 2 (31_x 58mm)
RS-232 Connection Cable
Windows Software Disk
3
Page 4
Temperature Recorder
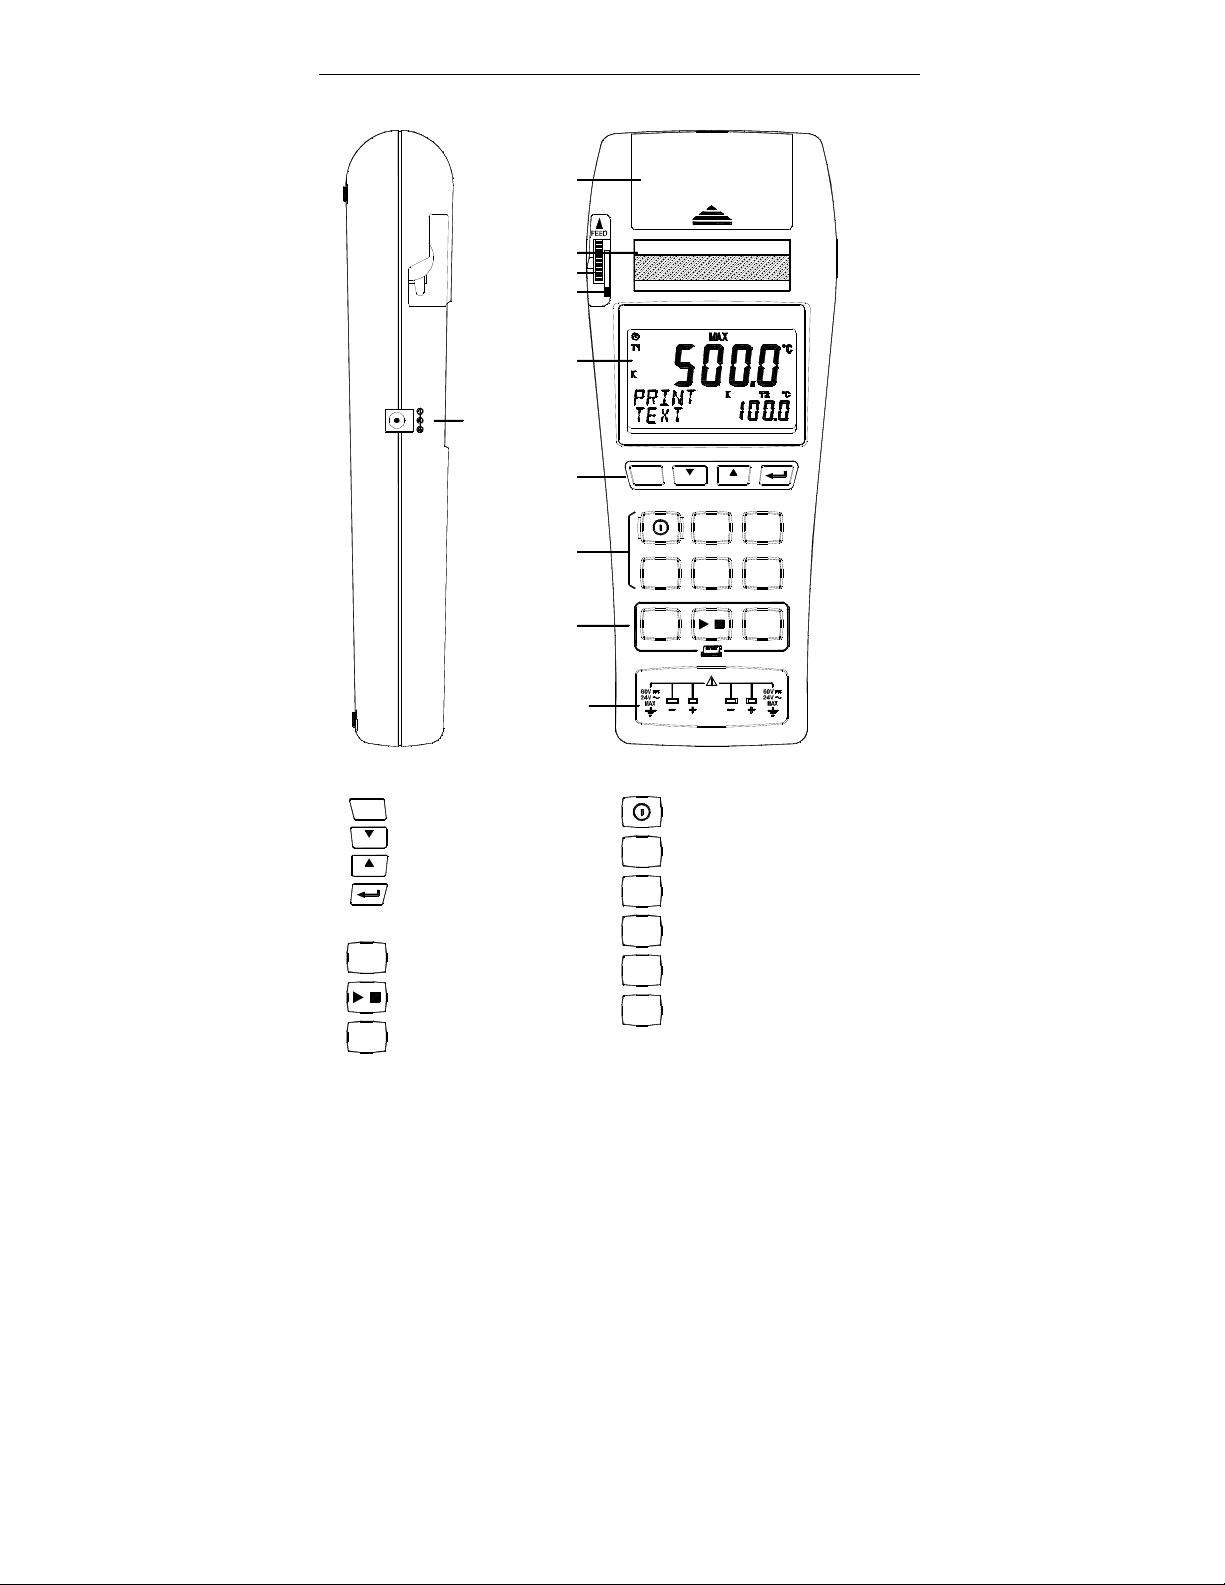
. NAME AND FUNCTION
Paper Solt
Paper Output
Manual Feed Knob
Print Head Level
DC 9V
DC 9V Jack
Setup Panel
Function Panel
Print Panel
Temperature Sensor
Input Connector
L C D
TEMPERATURE
C
REC
INST
PRINT
T2 T1
OPEN
MENUT1MENU
¢XC
REL
RECORDER
T2¢XF
MAX
MIN
FEED
Setup Panel:
C
Exit without saving
Browse menu or number down
MENU
Browse menu or number up
MENU
Enter
Print Panel:
INST
Print present data
PRINT
Start / Stop printing
FEED
Paper feed 2/3 inch
Function Panel:
Power button
¢XC
¢XC / ¢XF button
¢XF
T1
T1 / T2 button
T2
REC
Record button
REL
Relative readout button
MAX
MAX / MIN button
MIN
4
Page 5
Temperature Recorder
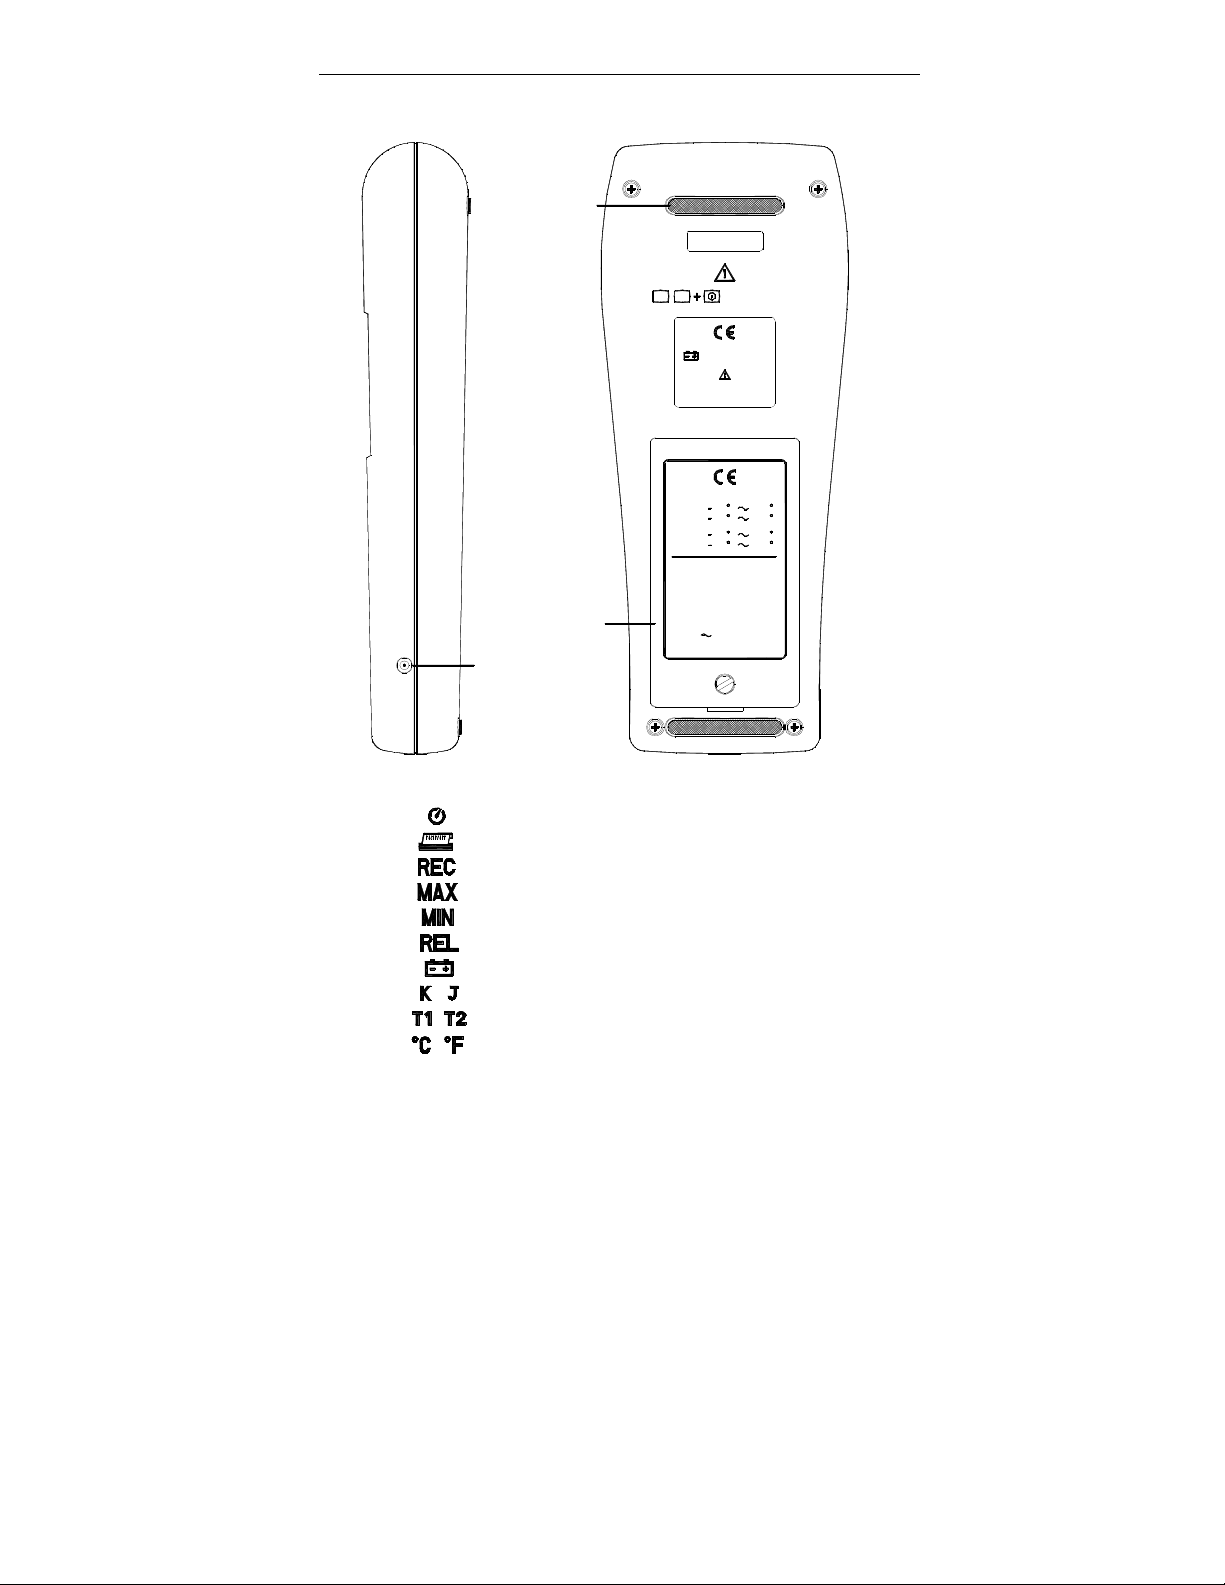
Slip Proof Rubber
Battery Cover
RS-232
RS-232 Jack
Function Panel:
Auto power off
Printing in process
Recording in process
Maximum display mode
Minimum display mode
Relative display mode
Low battery
Thermocouple Type
T1 / T2 Indication
Temperature unit
REC REL
SAZE AA 1.5V X 6
PLEASE READ
MANUAL FOR SAFET
RANGE :
TYPE K
200
328
TYPE J
200
328
Paper Spec. :
Thermal Paper
58 mm Width
31O
Diameter Max
AC Adaptor ( isolated ) :
DC 9V 12V
Connector 5.5O x 9.5mm
MASTER RESET
Y
1370
C
C
2498
F
F
760 C
C
F 1400 F
1A Min
5
Page 6
Temperature Recorder
. OPERATION INSTRUCTIONS
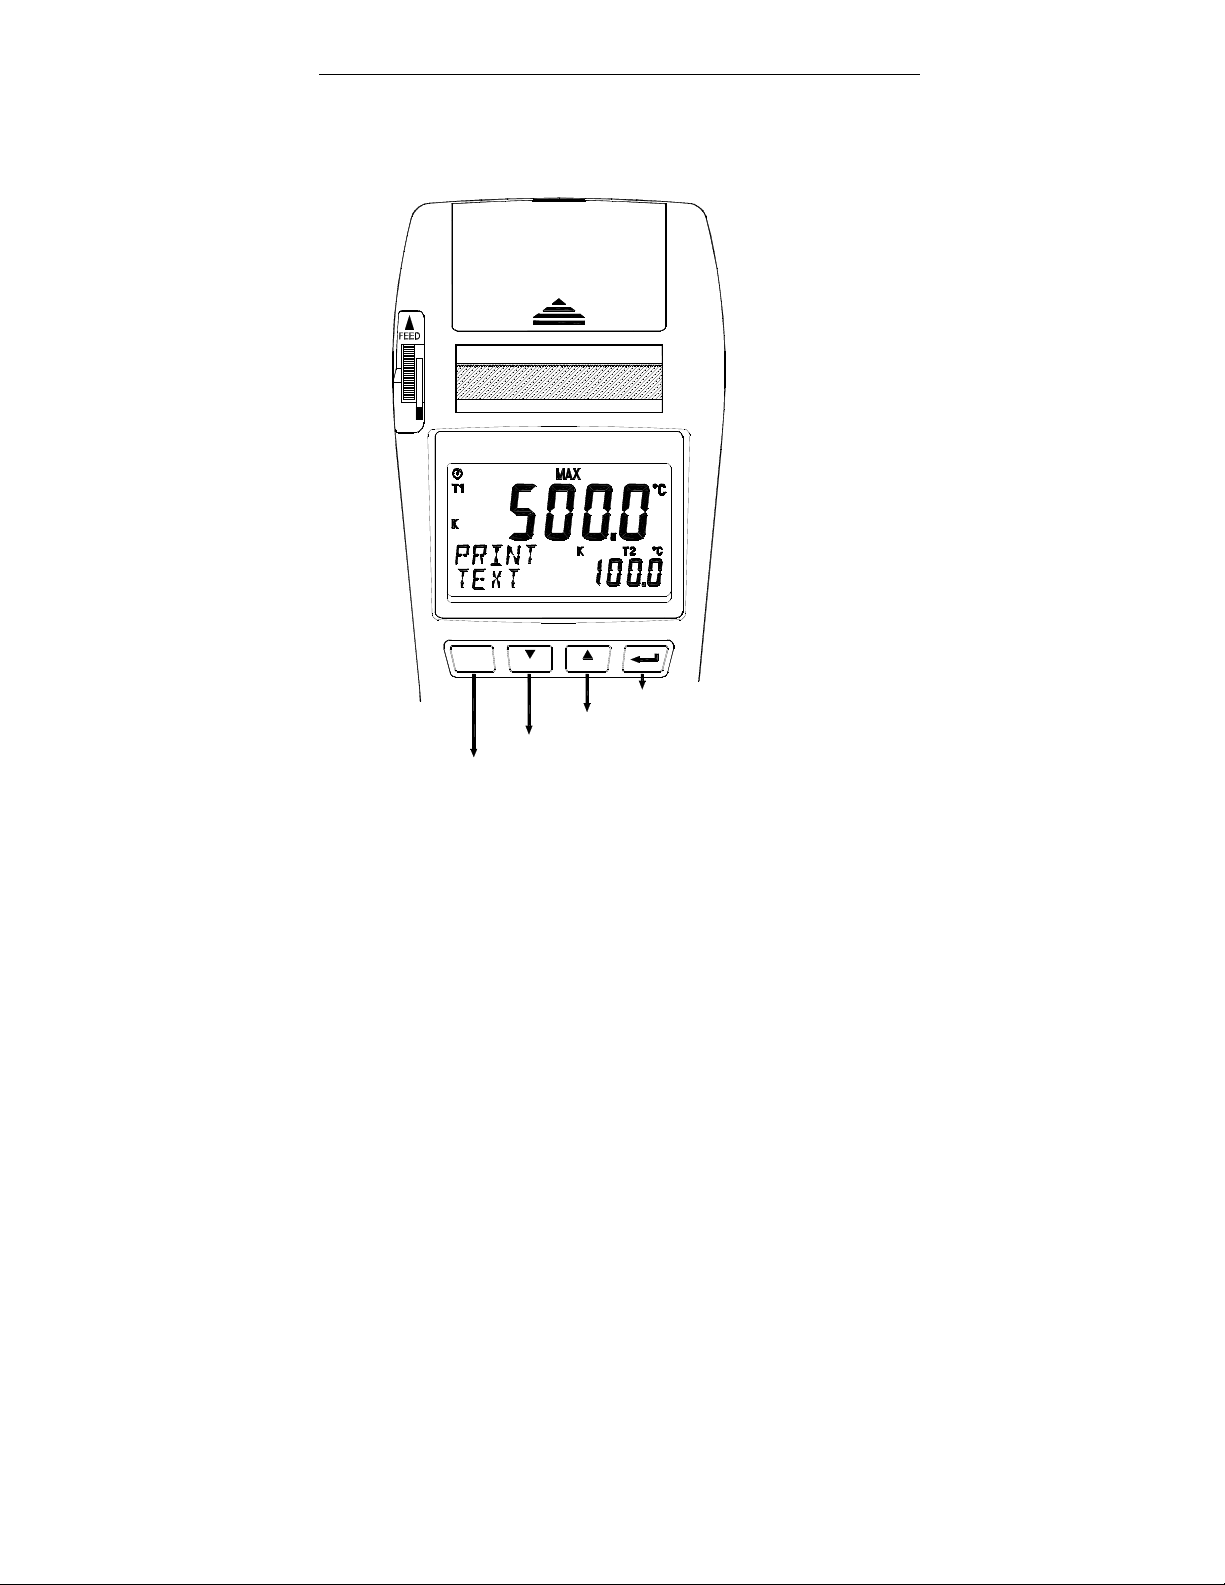
5.1 Setup Menu
Press Menu select button to select menu
OPEN
TEMPERATURE RECORDER
C
MENU MENU
Enter
Browse menu or number up
Browse menu or number down
Exit without saving
6
Page 7
Temperature Recorder
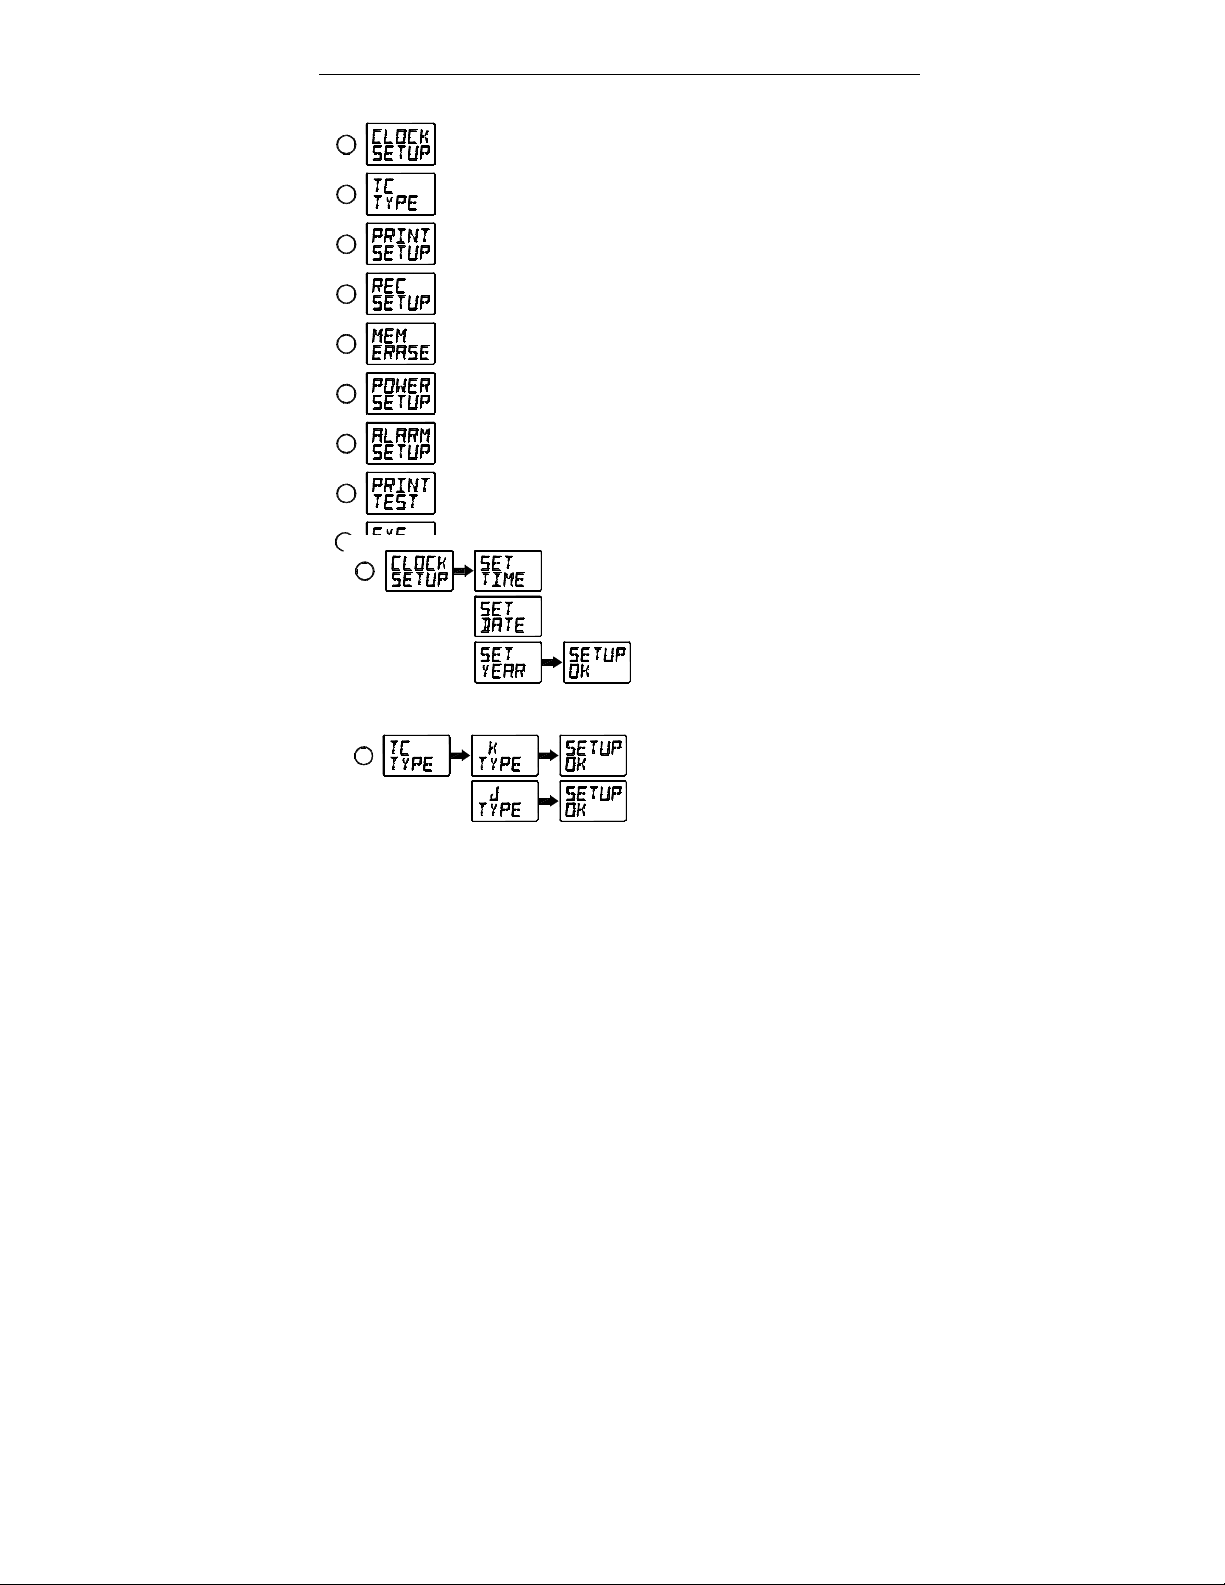
Menu item
1
2
3
4
5
6
7
Menu description
8
Set system clock
Set Thermocouple Type
Set start/stop printing time and print mode
Clear Datalogger memory
Power management setup
Alarm limit setup
Printer test printing
Set system clock
9
1
Print out setup information
Set thermocouple type
record intervalSet start/stop recording time and
Set time
Set date
Set year
2
Select K Type
Select J Type
Note: Thermocouple type must be the same as the
type of sensor.
7
Page 8

Temperature Recorder
et print start/stop time and print mode
3
Print mode
Text mode Text print interval
Graph mode Graphic print speed
Note: 1.Text print interval options :
2,5,10,15,30second,1,2,5,10,15,30,60minute.
2.Graph print speed options :
1,2,3,4,5,6,8,12,24inch/hour.
3.Graph print scale width options :
10,20,50,100,200,500,1000,2000
4.After setup is done and under normal mode
LCD will show TIMED PRINT and auto power
off will be disabled.
Set start time
Set start date
Set start year
Set stop time
Set stop date
Set stop year
Minimun scale
Scale range
8
Page 9

Temperature Recorder
atalogger start/stop time and Recording interval Setup
4
Note: 1.Recording interval options :
1,2,5,10,15,30second,1,2,5,10,15,30,60minute
2.When REC setup is done and under normal
mode LCD will show TIMED REC and auto
power off will be disabled.
5
6
Set power
mode
7
Alarm option Alarm active Upper limit Low limit
Erase memory
30 minutes
auto power off
Power continue on
Alarm inactive
Set start time
Set start date
Set start year
Set stop time
Set stop date
Set stop year
Set record
interval
Note: When Alarm is active and measurement is
outside the limit there will be a beeping until
measurement is inside the limit.
8
9
Printer diagnostic
Print all of the setup information
9
Page 10

Temperature Recorder
5.2 Temperature Measuring
¢
OPEN
RECORDERTEMPERATURE
MENUCMENU
T1
¢XC
T2
¢XF
REC
1.Power: Press to power on.
Press and hold for 3 seconds to turn off
the power, While power off, LCD will show the
following symbol.
MAX
REL
MIN
POWER OFF
2.Select unit: Press to select ¡C or ¡F scale and
¢XC
XF
the selection will be kept in the memory
after power off.
T1
3.T1/T2 switch: Press
T2
to exchange T1 T2 display
window.
ording data: Press to start recording, and
the LCD will show REC symbol.
Press it again to stop recording.
10
Page 11

Temperature Recorder
If REC symbol blinks, it indicate the memory is
full, and the LCD will show REC FULL .
Recording interval please refer to [Page 9] setup
recording interval.
5.Relative operation: Press
REL
, the meter will
memorize the present reading and the difference
between the new reading and the memorized
data will be shown on the display.
REL
Press it again to exit the relative operation.
MAX
6.MAX/MIN operation: Press
, and the LCD will
MIN
display MAX symbol and maximum reading.
MAX
MIN
again, and the LCD will display
Press
MIN symbol and minimum reading.
Press
MIN
MAX
again, MAX MIN symbols will blink
together, and the reading is the present
temperature.
Meter will keep maximum and minimum value
while you repeat these steps.
MAX
Press and hold for 3 seconds to exit this
MIN
11
Page 12

Temperature Recorder
mode.
5.3 Printing
Use the printer control buttons to start the printing
OPEN
C
REC
INST
PRINT
TEMPERATURE
MENU
¢XC
¢XF
REL
RECORDER
MENU
T1
T2
MAX
MIN
FEED
1.Instant printing:
l Press one time to print out the date, time
INST
PRINT
and the present temperature.
l Instant printing only can print text.
l If button is pressed during text printing
INST
PRINT
process, there will be one batch of text inserted
into the printing sequence which include date,
time and temperature data.
l If button is pressed during graphic printing
INST
PRINT
process, there will be a cross symbol to indicate
the data on the chart and the related time is
labeled by the side.
12
Page 13

Temperature Recorder
2.Start and stop printing:
Press to start printing.
Press again to stop printing.
LCD will display symbol while printing.
Please refer to [Page 8] about print setup.
3.Feed: Press one time printer will feed 2/3 inch
of paper out.
FEED
l Make sure to lower the printer head level before
printing.
Printer head lever
l When the printer head level is at the up position,
and one start printing, LCD will display
LEVER UP .
You have to push the lever down and print again.
l When paper is empty and the user start printing,
LCD will display NO PAPER .
Please refer to [Page 14] about loading thermal
paper.
13
Page 14

Temperature Recorder
5.4 Load Thermal Paper
1.Pull up the printer head lever.
2.Remove the paper cabinet cover.
3.Insert the paper into the slot.
1
3
MENU
REC REL
INST
PRINT
2
MENU
¢XC
T1
¢XF
T2
MAX
MIN
FEED
4
4.Press couple of times to load the paper into printer.
FEED
C
5.When paper comes out of the front slot, push down the
printer head lever.
5
RECORDER
TEMPERATURE
14
Page 15

Temperature Recorder
5.5 Replace Battery
1.Turn off power before replacing the battery.
2.Replace 6 size AA 1.5V Batteries.
If you want to operate for a long period, alkaline battery is
recommended.
15
Page 16

Temperature Recorder
I. ATTENTION
6.1 Cancel Timed Printing
You can cancel timed printing
by the following three methods:
1.Turn off the power.
2.Press one time.
3.Press to start printing.
Please refer to [Page 8] about
resume timed printing.
INST
PRINT
OPEN
RECORDERTEMPERATURE
6.2 Cancel Timed Recording
You can cancel timed recording
by the following two methods:
1.Turn off the power.
2.Press to start recording.
Please refer to [Page 9] about
resume timed recording.
REC
REC
INST
PRINT
MENUCMENU
¢XCT2T1
¢XF
REL
OPEN
MAXMIN¢XFREC RELMENUC ¢XCMENUT2T1RECORDERTEMPERATURE
MA X
MIN
FEED
16
Page 17

Temperature Recorder
.3 Master Reset
This is applied when the meter is under unknown
condition, it will resume the meter to default setup.
1.Turn off the power.
2.press and hold simultaneously, then press
, and LCD will display MASTE SETUP .
OPEN
RECORDERTEMPERATURE
MENUMENU
¢XC
T1
¢XF
T2
RECCREL
MAX
MIN
3.Release all button, LCD will display RESET OK .
OPEN
RECORDERTEMPERATURE
17
Page 18

Temperature Recorder
II. Software
7.1 Installation
System Required:
Windows 95 / Windows 98 / Windows ME
Windows NT 4.0.
Minimum Hardware Required:
PC with Pentium 90MHz or higher.
32 MB RAM.
4X CD-ROM Drive or higher.
Recommended resolution 800X600.
At least 5 MB byte hard disk space available to
install TestLink.
Installation :
1.We recommend close all other application
before installing TestLink.
2.Insert the setup CD disc to CD-ROM drive and the
installation program should start automatically.
3.If installation do not start automatically, choose the
start button on the Taskbar and select Run.
4.Type E:\SETUP and choose OK, then it will copy
SE500.exe (executable file) and help file to your
hard disk (default is c:\program
files\TestLink\SE500).
18
Page 19

Temperature Recorder
2 Introduction
Main Screen
Main menu
Tool menu
Real time
Data window
Graph option
Reading display
Real time graph
Real time list
Max/Min/Avg
display
disk.
Main Screen
File : Open - Open files saved previously from the
Save - Save the active window(when the caption bar
is highlighted) data to the disk.
Print - Print the data of the active window
(graph or list).
Printer Setup - Select printer.
Exit - Terminates TestLink program.
DataLogger
: By opening the DataLogger Window,
the user can load recorded data of
meter to PC in this window.
Real Time Data : Run - Start recording real time data.
Stop - Stop recording real time data.
Option : Setup Temperature Recorder from PC.
COM port : Select PC connector port manually.
View : LCD - Open LCD simulation window.
Real Time Graph - Open Real-Time Graph
window to graph the present
data.
Window : Arrange windows
Help : On line help.
19
Page 20

Temperature Recorder
DataLogger
ta Sets List
Data List
Graph
When you have Temperature Recorder meter connected
to PC and select "DataLogger" from main menu or click
from tool bar to load recorded data from the meter and
there will be a progress indicator to show the loading
progress. If error occurs, just click "DataLogger" again.
After the data was loaded completely, the top left hand side
will show how many data sets were loaded and detail
information for each data set (start data, start time,
recording rate and
record numbers).
For examples, the figure below means there are two data
sets, set 1 recorded 1325 records and set 2 recorded
19349 records.
It will transfer first data set to graph on the right hand side
and list data after loading, You can click other data set to
view the graph and list of the data
set you select.
Tutorial Quick Start
Recording real time data from PC.
1.Power on the Temperature Recorder first and connect
it to a PC RS-232 serial port wit the cable,
2.Run the Software.
3.If the connection is successful the LCD simulation will
20
Page 21

Temperature Recorder
display the same value as the Temperature Recorder.
If fail to connect the meter with PC, it will display "No
Connection" on the LCD simulation window .
4.When the connection is successful, select Real Time
Data | Run from main menu or click from tool bar,
there will be a dialog for you to select record interval
and record numbers and click start button to start
recording.
5. When the recorded data numbers reach to the
amount you set, it will stop recording, or click to stop
recording .
How to save the recorded real time data to a file ?
1.Click the window you want to save and the window
will become active , then choose File | Save from
main menu or click from the tool bar.
2.There will be a save dialog window for you to choose
the file name and file type to save.
3.There are three types of file name you can choose,
they are binary file(*.ghf), text file(*.txt) and EXCEL
format file(*.csv). The *.ghf file use much fewer disk
space to save the data than the other two file format,
but it can only be used in TestLink SE500. Text file
can be opened by TestLink SE500 and any other
word processor program like word, notepad etc.
EXCEL format file can
be opened by TestLink SE500
and Microsoft EXCEL.
21
Page 22

Temperature Recorder
How to load the recorded data from the memory
of
Temperature Recorder and save it to a file ?
1. Power on the Temperature Recorder.
2. Connect the Temperature Recorder to PC
3. Start SE500 program.
4. Choose Data Logger from main menu or click
from tool bar.
5. In reference to Data Logger, see [Page 20] about
DataLogger.
For more operation instruction, please refer to the
online help while executing SE500.
22
 Loading...