

Page 1
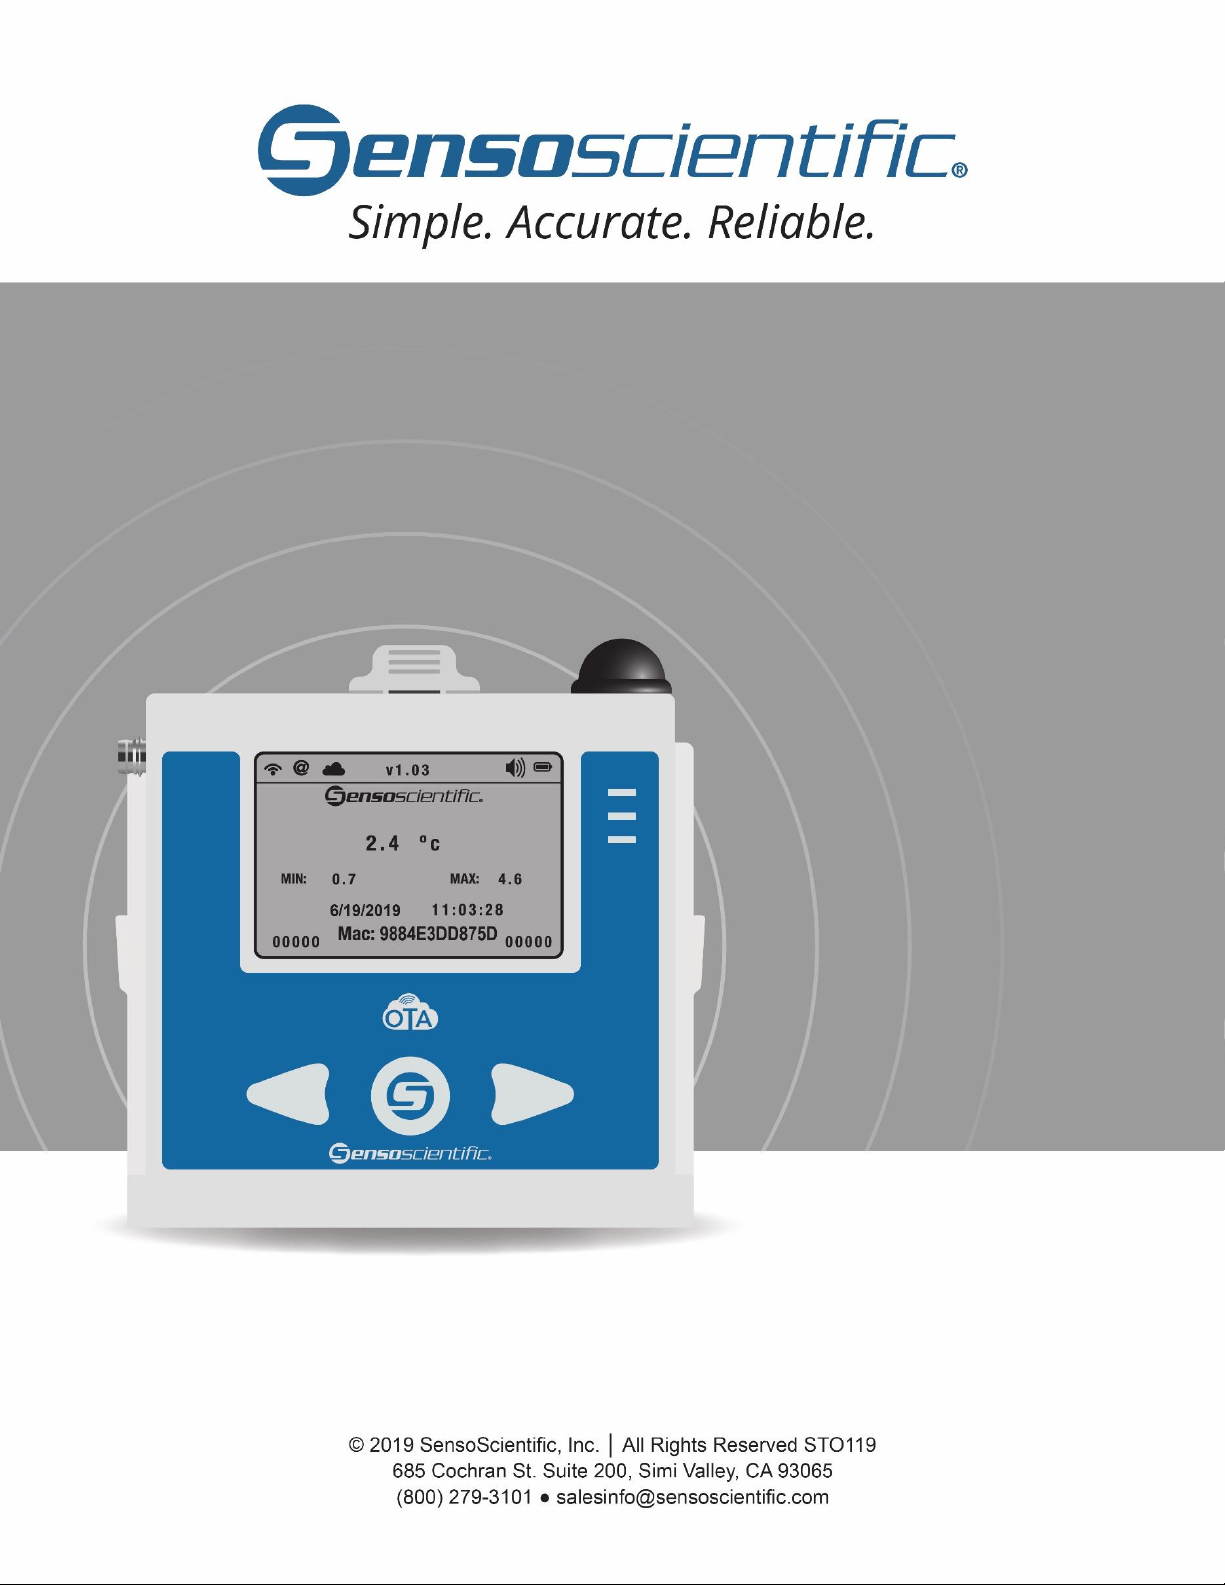
Cloud Monitoring System
User Manual V20.6
Page 2
Cloud User Manual V20.6 2
Document information, authorship and approvals
Author signs to confirm technical content
Prepared by:
Michael Black
Job title:
Quality Manager
Signature:
MB
Date:
6/3/2020
Subject matter expert reviewer signs to confirm technical content
Reviewed by:
Sundaresan Thangeswaran
Job title:
Software Engineer
Signature:
ST
Date:
6/3/2020
Quality representative signs to confirm document complies with quality management system
Authorized by:
Mike Zarei
Job title:
Managing Partner
Signature:
MZ
Date:
6/3/2020
Document review date
6/3/2020
Document
Cloud Monitoring System User Manual
Rev.
13
Modified
by
CA
Date
6/3/2020
File Name
Usermanuals
Approved
by
MB
Date
6/3/2020
Page 3
Cloud User Manual V20.6 3
TABLE OF CONTENTS
I. FCC APPROVAL STATEMENT .............................................................................................................. 6
II. GENERAL INFORMATION AND REQUIREMENTS ............................................................................. 7
III. INITIAL LOG-IN ................................................................................................................................ 9
IV. CONFIGURATION ........................................................................................................................... 10
IV.1 COMPANY INFORMATION ................................................................................................................... 10
IV.2 NODE CONFIGURATION....................................................................................................................... 11
NODE ID AND MAC ADDRESS ............................................................................................................. 14
OTA – FIRMWARE AND UPGRADING ................................................................................................. 14
NODE AND LOCATION NAMES ........................................................................................................... 15
TIME ZONE ............................................................................................................................................ 15
ALARM LIMITS AND ALARM DELAY .................................................................................................... 15
CRITICAL ALARM LIMITS ...................................................................................................................... 15
RE-ALARM DELAY (IN MINUTES) ......................................................................................................... 15
SIGNAL ALARM / BATTERY ALARM / DATA ALARM .......................................................................... 16
SET EMAIL / SMS / VOICE / FAX ALARM FUNCTION ......................................................................... 16
AUDIT NODE ......................................................................................................................................... 16
MEASUREMENT UNIT .......................................................................................................................... 16
SINGLE NODE CONFIGURATION VS. MULTIPLE NODE CONFIGURATION .................................... 16
NODE STATUS ....................................................................................................................................... 17
IV.2.A SINGLE TEMPERATURE, DOUBLE TEMPERATURE & TEMPERATURE/HUMIDITY NODES ..... 19
IV.2.B UNIVERSAL NODES ....................................................................................................................... 20
IV.2.C OPEN/CLOSED & WATER LEAK NODES....................................................................................... 22
IV.2.D LIGHT SENSOR ............................................................................................................................... 23
LIGHT SENSOR MULTIPLE ALARM SCHEDULE .................................................................................. 24
LIGHT SENSOR REPORTS..................................................................................................................... 26
IV.3 CREATE/DELETE USER ACCOUNTS ..................................................................................................... 26
IV.3.A PERMISSION ................................................................................................................................... 27
IV.4 NODE USERS .......................................................................................................................................... 28
IV.5 NODE GROUP ........................................................................................................................................ 29
IV.6 AUTO REFRESH ...................................................................................................................................... 30
IV.7 EXCEPTION REPORT ............................................................................................................................. 31
IV.8 PASSWORD ............................................................................................................................................ 33
IV.8.A CHANGING USER PASSWORD...................................................................................................... 33
IV.8.B RESET USER PASSWORD ............................................................................................................... 34
IV.9 ADD/REMOVE NODES .......................................................................................................................... 37
IV.10 CREATING GROUPS ............................................................................................................................ 40
IV.11 ADD/REMOVE NODES FROM GROUPS ............................................................................................ 40
IV.12 ADD/REMOVE USERS FROM A GROUP............................................................................................. 42
IV.13 SHOW GROUP USER ........................................................................................................................... 44
IV.14 SETTINGS ............................................................................................................................................. 44
IV.15 SCHEDULE USERS ............................................................................................................................... 45
IV.16 TEST NOTIFICATION ........................................................................................................................... 46
IV.17 TIME FORMAT ...................................................................................................................................... 47
IV.18 SPARE NODES ..................................................................................................................................... 49
Page 4
Cloud User Manual V20.6 4
IV.19 NODE REPLACEMENT ......................................................................................................................... 50
V. CALIBRATION .................................................................................................................................. 52
V.1 CALIBRATION ALARM NOTIFICATION ................................................................................................. 54
V.2 DEACTIVATING THE CALIBRATION ALARM NOTIFICATION .............................................................. 55
V.3 CALIBRATION GROUP ............................................................................................................................ 56
VI. REPORTING .................................................................................................................................... 60
VI.1 GRAPH REPORT ..................................................................................................................................... 60
VI.2 DAILY/WEEKLY/MONTHLY REPORTS .................................................................................................. 62
VI.3 ADVANCED REPORT SETTING .............................................................................................................. 64
VI.4 CORRECTIVE ACTION REPORT ............................................................................................................. 66
VI.5 PERFORMANCE REPORT ...................................................................................................................... 67
VI.6 TWO POINT MONITORING................................................................................................................... 69
VI.6.A AUTOMATIC TWO POINT MONITORING ......................................................................................... 71
VI.7 MEAN KINETIC TEMPERATURE REPORT ............................................................................................. 72
VI.8 AUDIT NODE REPORT ........................................................................................................................... 73
VI.9 ADMIN AUDIT REPORT ......................................................................................................................... 75
VI.10 AUDIT USER ACTION REPORT ........................................................................................................... 78
VI.11 CONNECTION REPORT ....................................................................................................................... 80
VI.12 LOW BATTERY REPORT ...................................................................................................................... 80
VI.13 DETAIL GRAPH REPORT ..................................................................................................................... 81
VI.14 SUSPENDED ACTION REPORT ........................................................................................................... 83
VI.15 AUTOMATED REPORTS ...................................................................................................................... 84
VI.15.A AUTOMATED DAILY SUMMARY REPORT .................................................................................. 87
VI.16 BULK DATA DOWNLOAD ................................................................................................................... 88
VI.17 CUSTOM REPORT ................................................................................................................................ 89
VII. MONITORING................................................................................................................................ 90
VII.1 CURRENT STATUS ................................................................................................................................ 90
VII.2 BATTERY STATUS ................................................................................................................................. 92
IV.11 ADD/REMOVE NODES FROM GROUPS ............................................................................................ 92
VII.3 GROUP NODES ..................................................................................................................................... 92
VII.4 RESET MIN/MAX ................................................................................................................................... 93
VII.5 MAINTENANCE ..................................................................................................................................... 93
VIII. OTA ............................................................................................................................................... 94
VIII.1 DISPLAY ................................................................................................................................................ 94
VIII.2 RESET MIN/MAX .................................................................................................................................. 95
VIII.2.A SCHEDULE RESET MIN/MAX ........................................................................................................... 95
VIII.3 CHANGE MEASUREMENT UNIT (°C/°F) ............................................................................................. 97
VIII.4 AUDIBLE ALARM ................................................................................................................................. 98
VIII.5 SAMPLE RATE ...................................................................................................................................... 99
IX. ALARM .......................................................................................................................................... 100
IX.1 VIEW ALARM ....................................................................................................................................... 101
IX.1.A SIGNAL ALARM............................................................................................................................ 102
IX.1.B BATTERY ALARM ......................................................................................................................... 102
IX.1.C DATA ALARM ............................................................................................................................... 103
Page 5
Cloud User Manual V20.6 5
DATA ALARM EMAIL NOTIFICATION ................................................................................................................. 103
IX.2 DIAGNOSE ALARM (WITH SUSPEND ACTION OPTION) ................................................................. 104
IX.3 CRITICAL ALARM ................................................................................................................................ 106
IX.4 NODE ALARM SCHEDULE .................................................................................................................. 107
IX.5 SUSPEND ALARM ............................................................................................................................... 109
X. HELP ............................................................................................................................................... 110
X.1 SUBMIT A TICKET ................................................................................................................................ 111
X.2 RECENT TICKETS .................................................................................................................................. 112
X.3 YOUR ORDERS ..................................................................................................................................... 113
X.4 TRAINING VIDEOS ............................................................................................................................... 114
X.5 TRAINING WEBINARS.......................................................................................................................... 115
X.6 USER INSTALLATION DOCS................................................................................................................ 115
X.7 CONFIGURATION FILES ...................................................................................................................... 116
X.8 RMA LABELS ......................................................................................................................................... 117
X.9 RELEASE NOTES ................................................................................................................................... 117
DOCUMENT INFORMATION ............................................................................................................. 119
Page 6
Cloud User Manual V20.6 6
I. FCC Approval Statement
OTA – Enterprise Series
FCC ID: Z64-CC3200MODR1
Enterprise Series
FCC ID: U30-G2M5477
This device complies with Part 15 of the FCC Rules.
Operation is subject to the following two conditions:
(1) This device may not cause harmful interference and
(2) This device must accept any interference received, including interference that may
cause undesired operation.
This equipment has been tested and found to comply with the limits for a class B
digital device, pursuant to part 15 of the FCC Rules. These limits are designed to
provide reasonable protection against harmful interference in a residential
installation. This equipment generates, uses, and can radiate radio frequency energy.
If not installed and used in accordance with the instructions, it may cause harmful
interference to radio communications. However, there is no guarantee that
interference will not occur in a particular installation. If this equipment does cause
harmful interference to radio or television reception, which can be determined by
turning the equipment off and on, the user is encouraged to try to correct the
interference by one or more of the following measures:
• Reorient or relocate the receiving antenna.
• Increase the separation between the equipment and Transceiver.
• Connect the equipment into an outlet on a circuit different from that to which the
transceiver is connected.
• Consult the dealer or an experienced radio/TV technician for help.
Page 7

Cloud User Manual V20.6 7
This equipment has been certified to comply with the limits for a class B computing
device, pursuant to FCC Rules. In order to maintain compliance with FCC regulations,
shielded cables must be used with this equipment. Operation with non-approved
equipment or unshielded cables is likely to result in interference to radio and TV
reception. The user is cautioned that changes and modifications made to the
equipment without the approval of manufacturer could void the user’s authority to
operate this equipment.
II. General Information and Requirements
Overview
This document provides user interface guidelines for the SensoScientific Wi-Fi
Monitoring System and covers system features and functions.
Common Terms
Wi-Fi Node
Probe
Administrator
Excursion
The physical hardware which receives environmental data
(temperature, humidity, differential pressure, etc…) and
transmits it to the cloud. Different terms concentrate on the
different functions the device performs. (i.e. transmits data,
logs data, senses temperature, etc…). Also Called: Node, Wi-Fi
Sensor, Data Logger, Transmitter, Wi-Fi Monitor, Monitor.
A device which is in direct contact with the parameter to
measure (temperature sensor, humidity sensor, etc…). This is
separate from and not to be confused with a Wi-Fi Sensor
which is synonymous with the Wi-Fi Node. Also called: Sensor
(i.e. Humidity Sensor or Temperature Sensor)
A title of a user with a greater authority/permission within the
cloud. Also called: Admin
When data goes out of the Alarm Limits by either too high or
too low. Also called: Data Alarm, Out of Range
OTA
Over the Air (OTA) refers to a series of products. Also called:
OTA series, OTA Node, OTA Wi-Fi Node
Page 8

Cloud User Manual V20.6 8
System Requirements
The personal computer that is used to connect to the system’s web server must run
on Windows 2000 Professional Service Pack 4, or a later version (Windows XP,
Windows Vista, Windows 7, etc.). The SensoScientific Cloud was developed to work
with Internet Explorer 6 Service Pack 1 or a later version (Internet Explorer 7, Internet
Explorer 8, etc.), Mozilla Firefox version 2 or later (Mozilla Firefox version 3, Mozilla
Firefox version 3.5, etc.), or Google Chrome Version 32.0.1700 (Jan. 14, 2014) or later.
If needed, the latest version of the above browsers can be downloaded from:
http://www.microsoft.com/windows/internet-explorer
http://www.mozilla.com/firefox
https://www.google.com/intl/en/chrome/browser/desktop/index.html
Page 9
Cloud User Manual V20.6 9
III. Initial Log-In
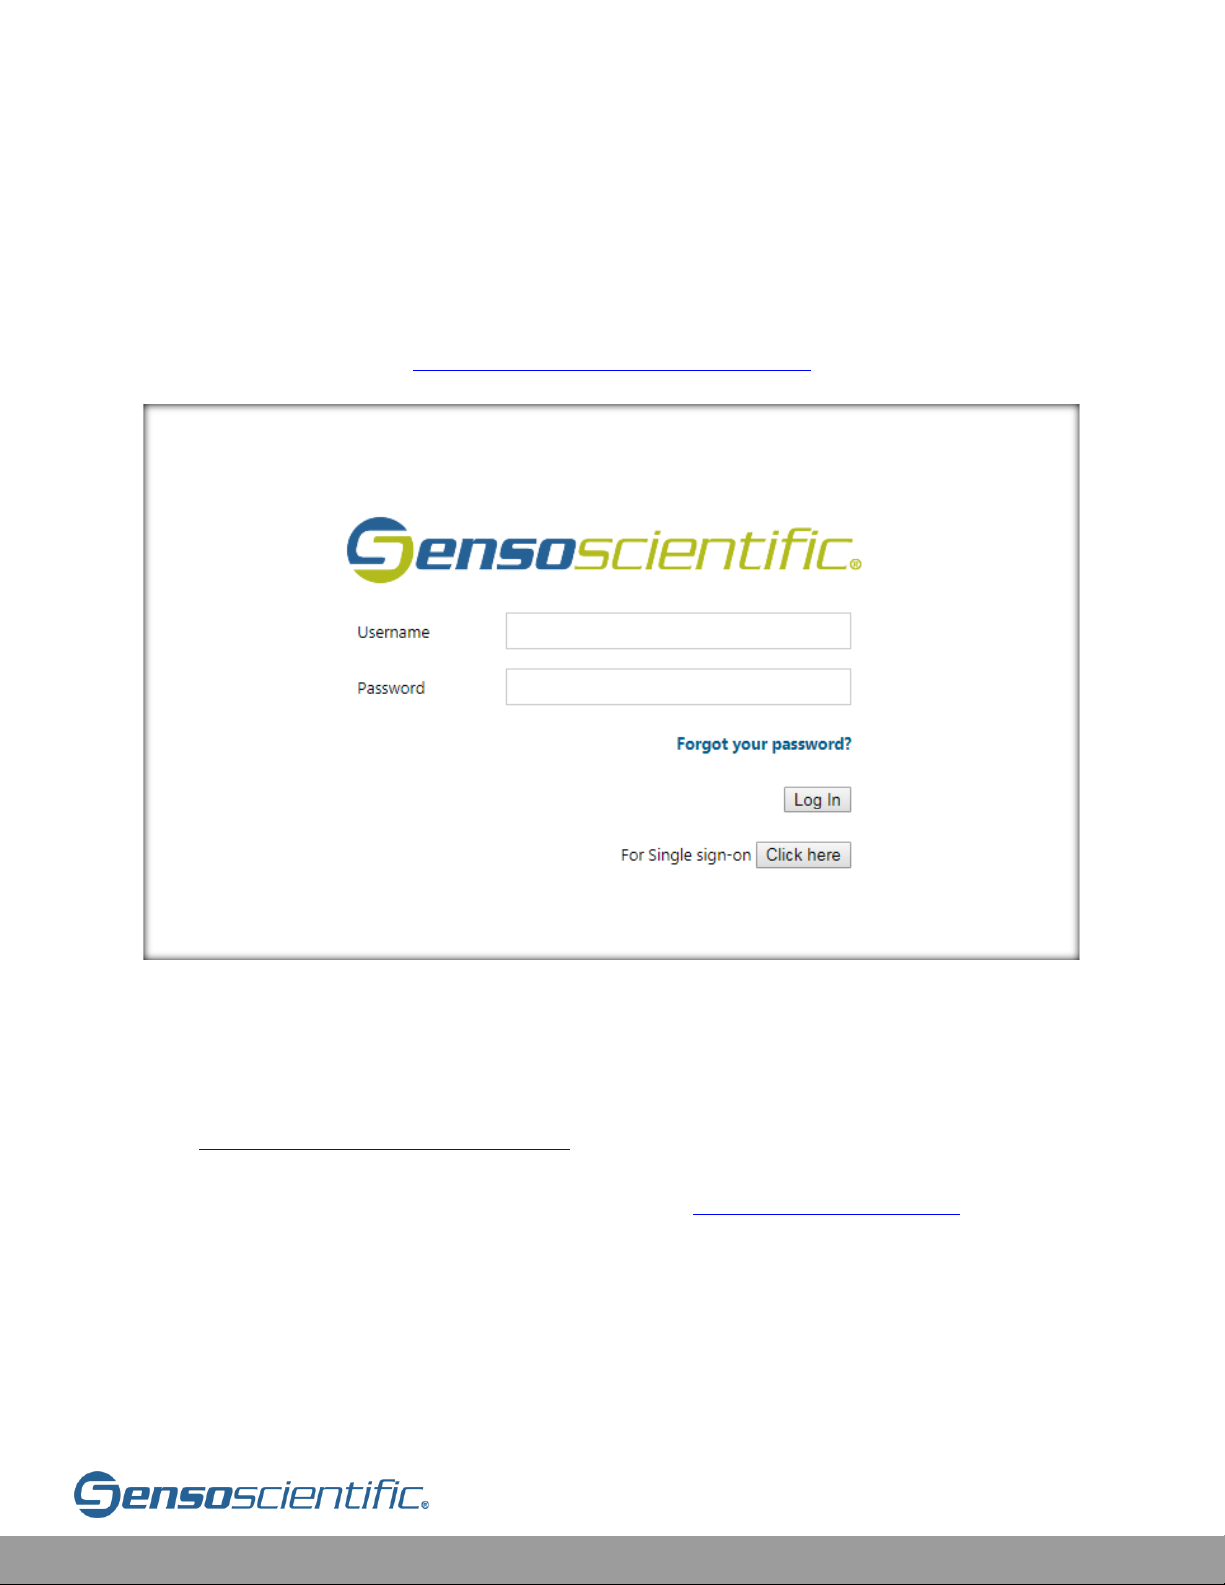
To access the SensoScientific Cloud Monitoring System, open a web browser. On the
navigation bar enter the following link:
https://cloud.sensoscientific.com
Figure III-1: Log in Page
A prompt to input SensoScientific log-in credentials will appear. The default
credentials will be provided to the System Administrator via the Installation Slip. The
System Administrator can then create additional users and credentials for this login
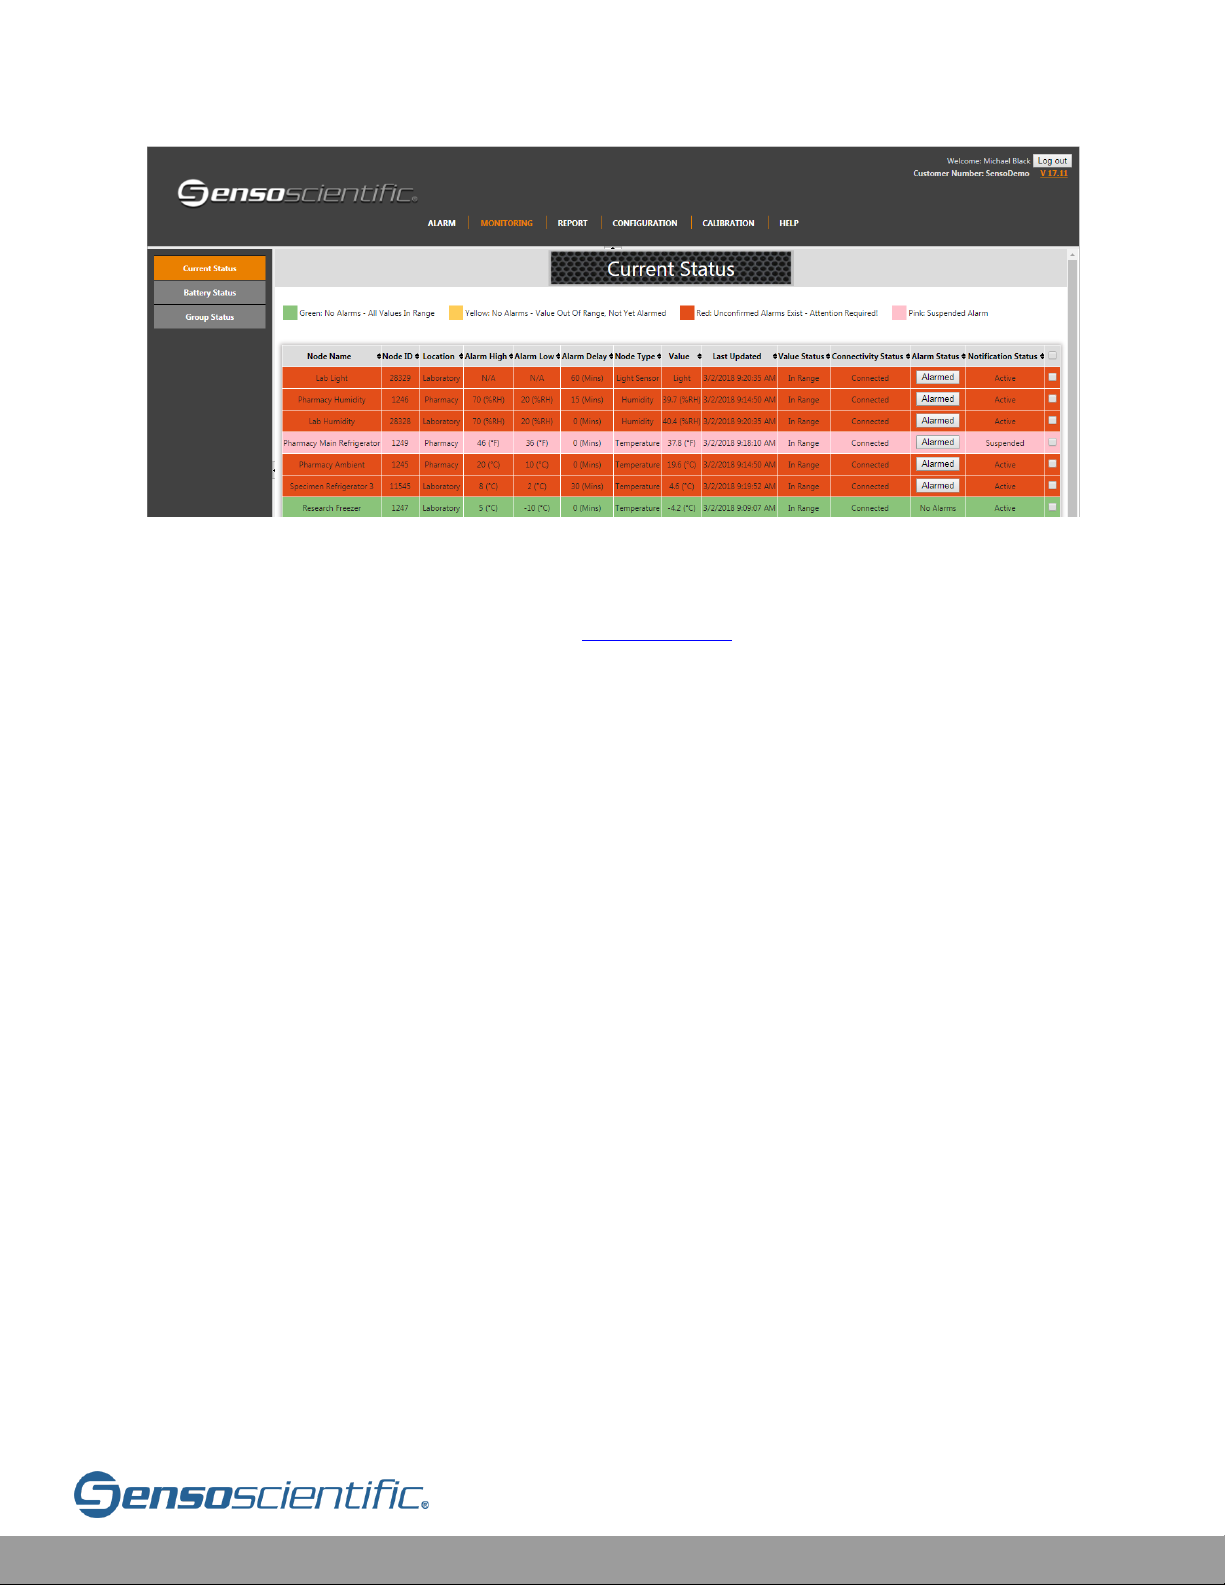
(See IV.3 Create/Delete User Accounts for creating users). A successful log-in brings
up the “Current Status” or “MONITORING” page. If no Wi-Fi sensors have appeared,
they have not yet been added to the account (See IV.9 Add/Remove Nodes for adding
nodes). The Main Menu Bar is at the top of the page including: ALARM,
MONITORING, REPORT, CONFIGURATION, CALIBRATION, and HELP.
There is a submenu bar on the left side with options depending on which main page
is being viewed.
Page 10
Cloud User Manual V20.6 10
Figure III-2: Current Status Page
Note: Default settings are set to log out any user after 20 minutes of inactivity and
will require the user to log back in (See IV.14 Settings to change settings).
IV. Configuration
When first logging into the system, some cloud configuration changes will be
required to customize the system – such as Minimum/Maximum Temperature limits
and Alerting preferences. The Wi-Fi sensor may arrive also requiring network
configuration (WiFi Configuration); however, these settings can be pre-configured to
any network configuration upon request prior to shipment. Pre-installation forms are
required to be filled out and sent to a Senso Representative. They can be received
from either a Sales or Technical Support Representative.
IV.1 Company Information
The company name and address provided in the installation form is inputted into the
cloud by SensoScientific staff. System Administrators can configure the company
information if desired at any time by following the procedures below.
Note: Any person who is not a System Administrator can view the company
information but cannot edit it.
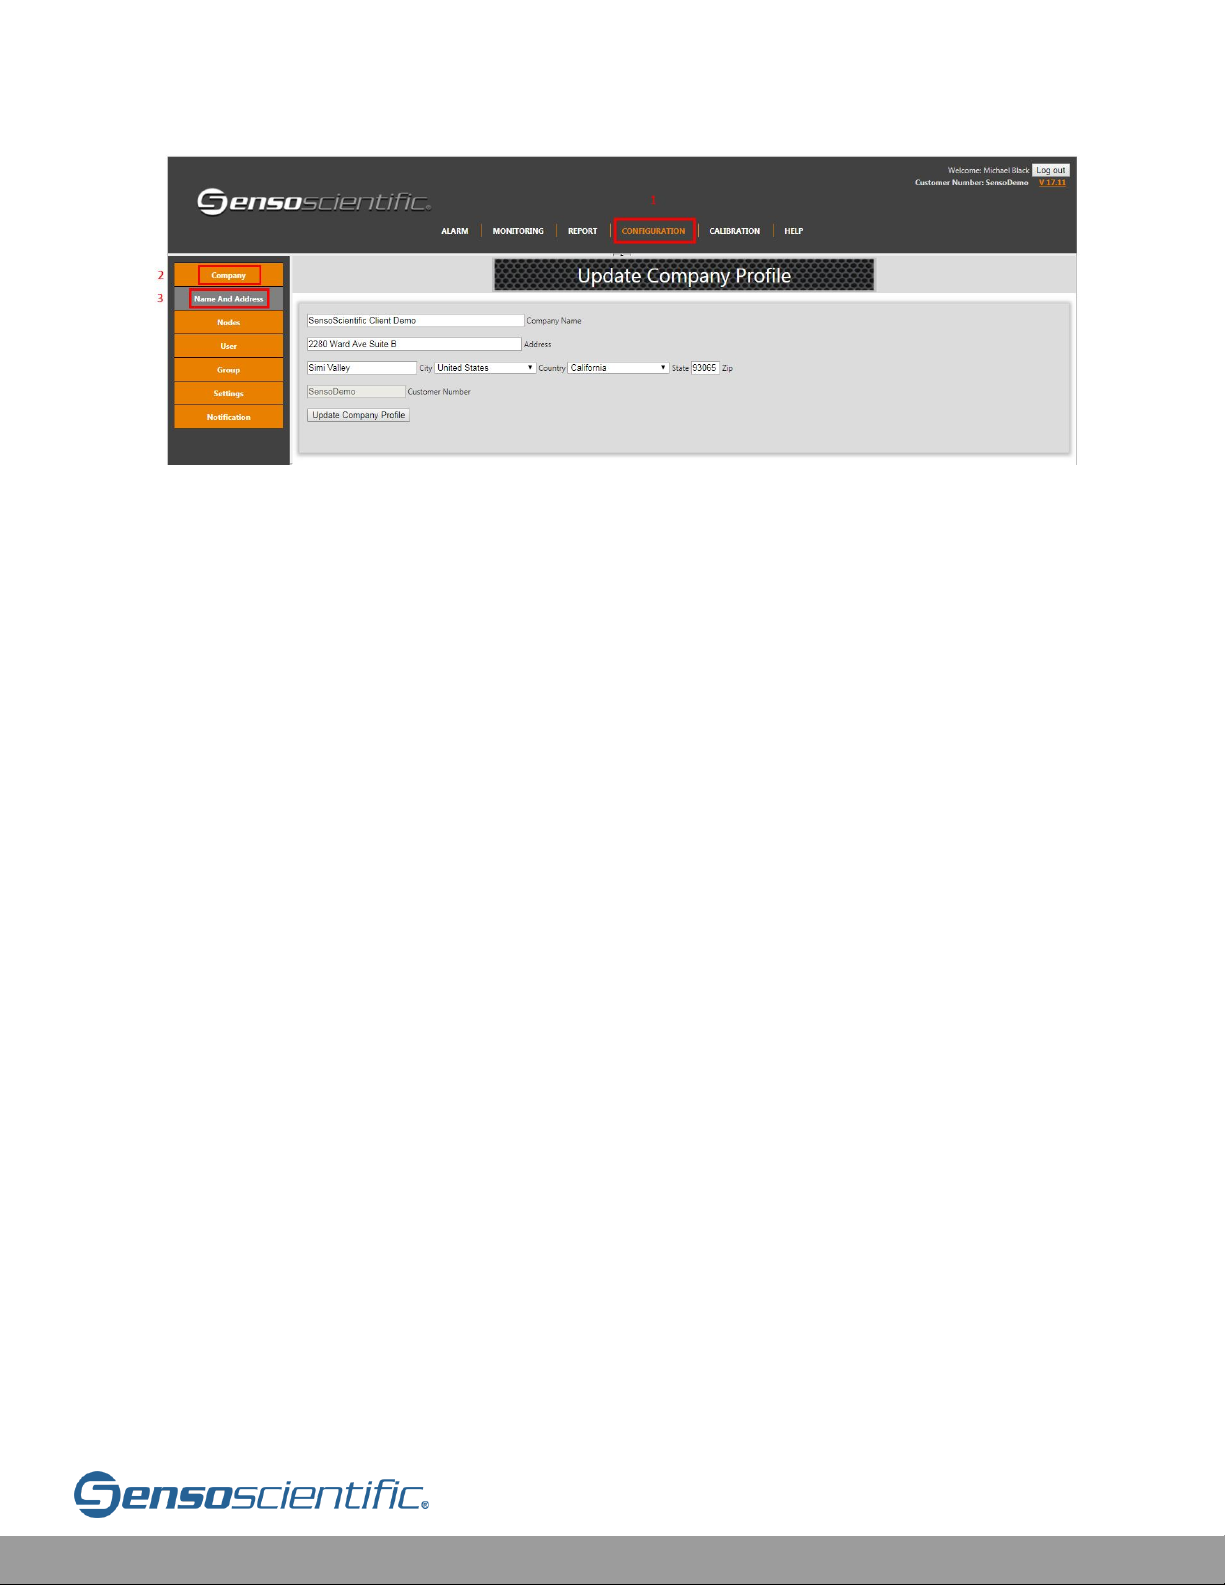
To change company info, click “CONFIGURATION” from the main menu bar, and
then click “Company” from the submenu bar. A grey dropdown will appear. Select
“Name And Address”.
Page 11
Cloud User Manual V20.6 11
Figure IV.1-1: Configuration of Company Information
Enter the information and click on “Update Company Profile”.
IV.2 Node Configuration
Before configuring the Cloud interface settings, the Wi-Fi sensor(s) should be
configured, installed, and powered ON (see HELP > User guide/Installation Docs >
Select the appropriate Guide – OTA, Enterprise, etc…). A few notes before beginning:
1) Initially, the node(s) will be added to the cloud account.
2) The node(s) will have default settings that MUST be customized.
3) The settings for the node will be specific to the products being refrigerated.
This information is not provided by SensoScientific.
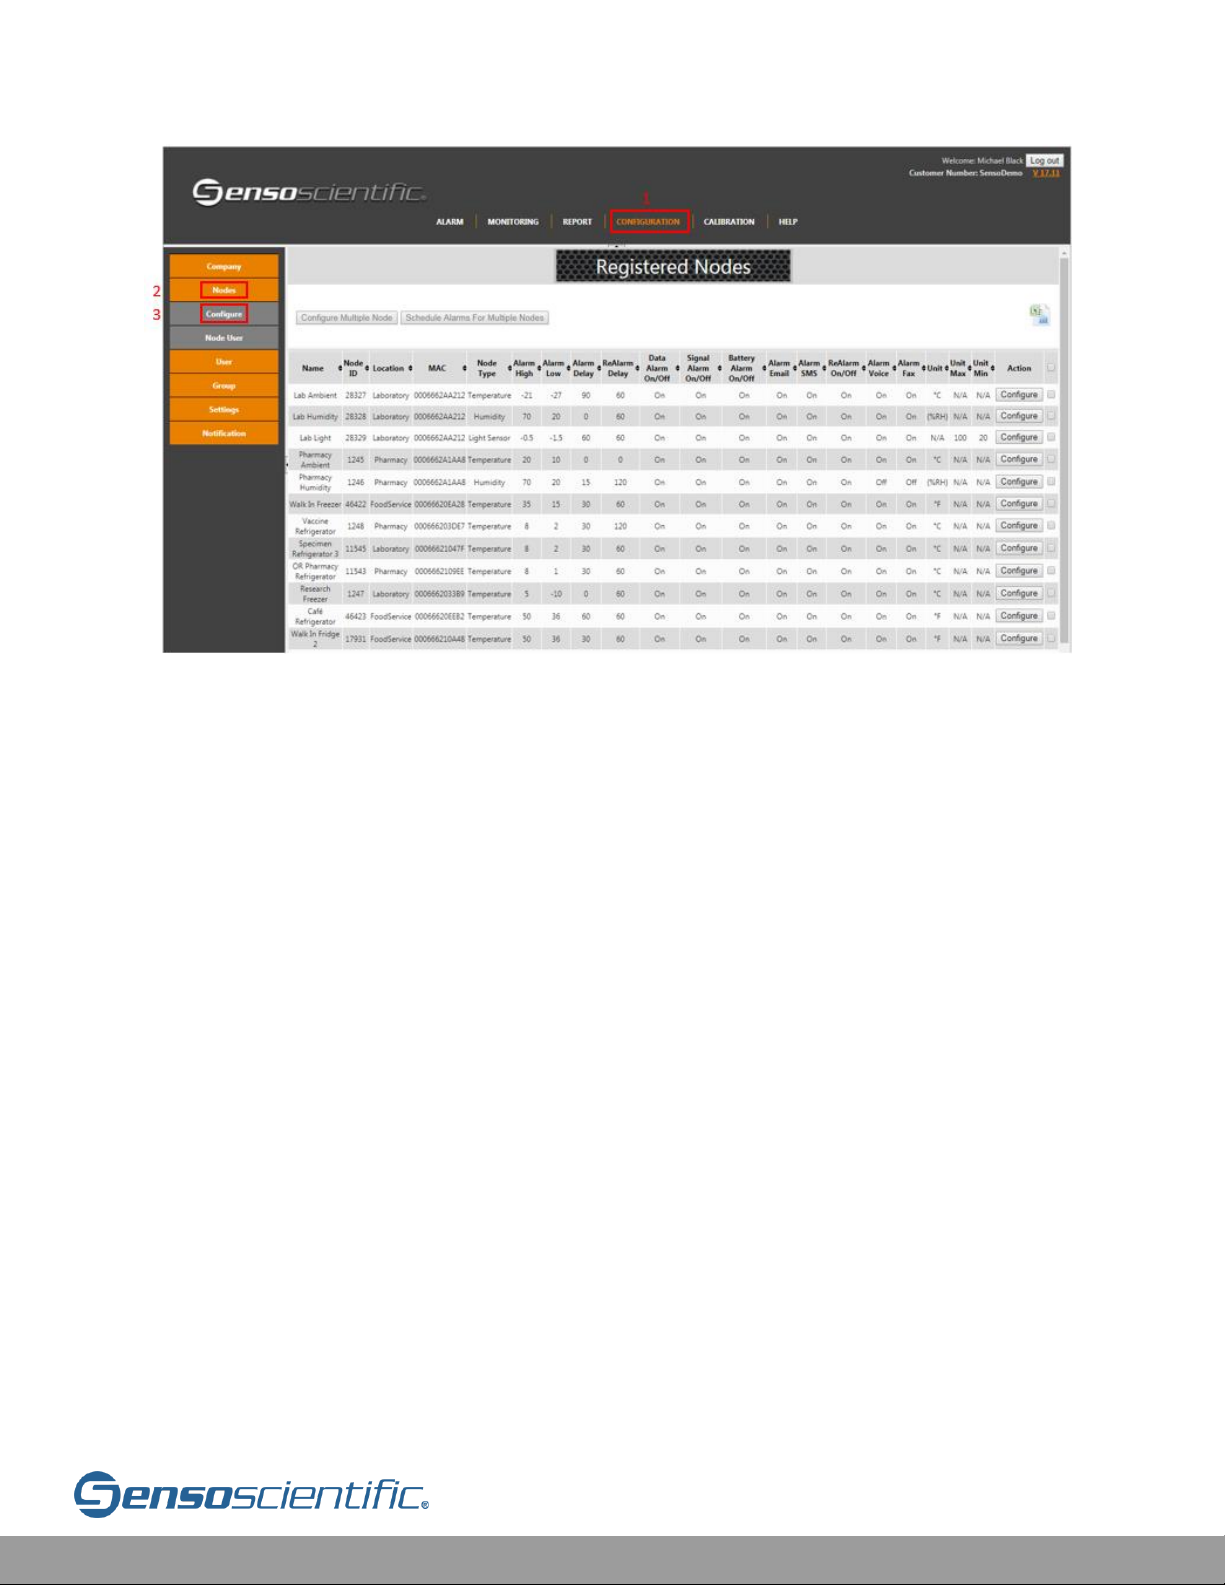
From the CONFIGURATION main menu, select “Nodes” from the sub menu, then
click on the “Configure” submenu button:
Page 12
Cloud User Manual V20.6 12
Figure IV.2-1: Node Configuration
A list of nodes will populate the screen. Each node is identified by the MAC address
that was assigned to it. Find the node to be configured by either the MAC address,
Location, or Name. Simply click “configure” directly to the right of the desired node.
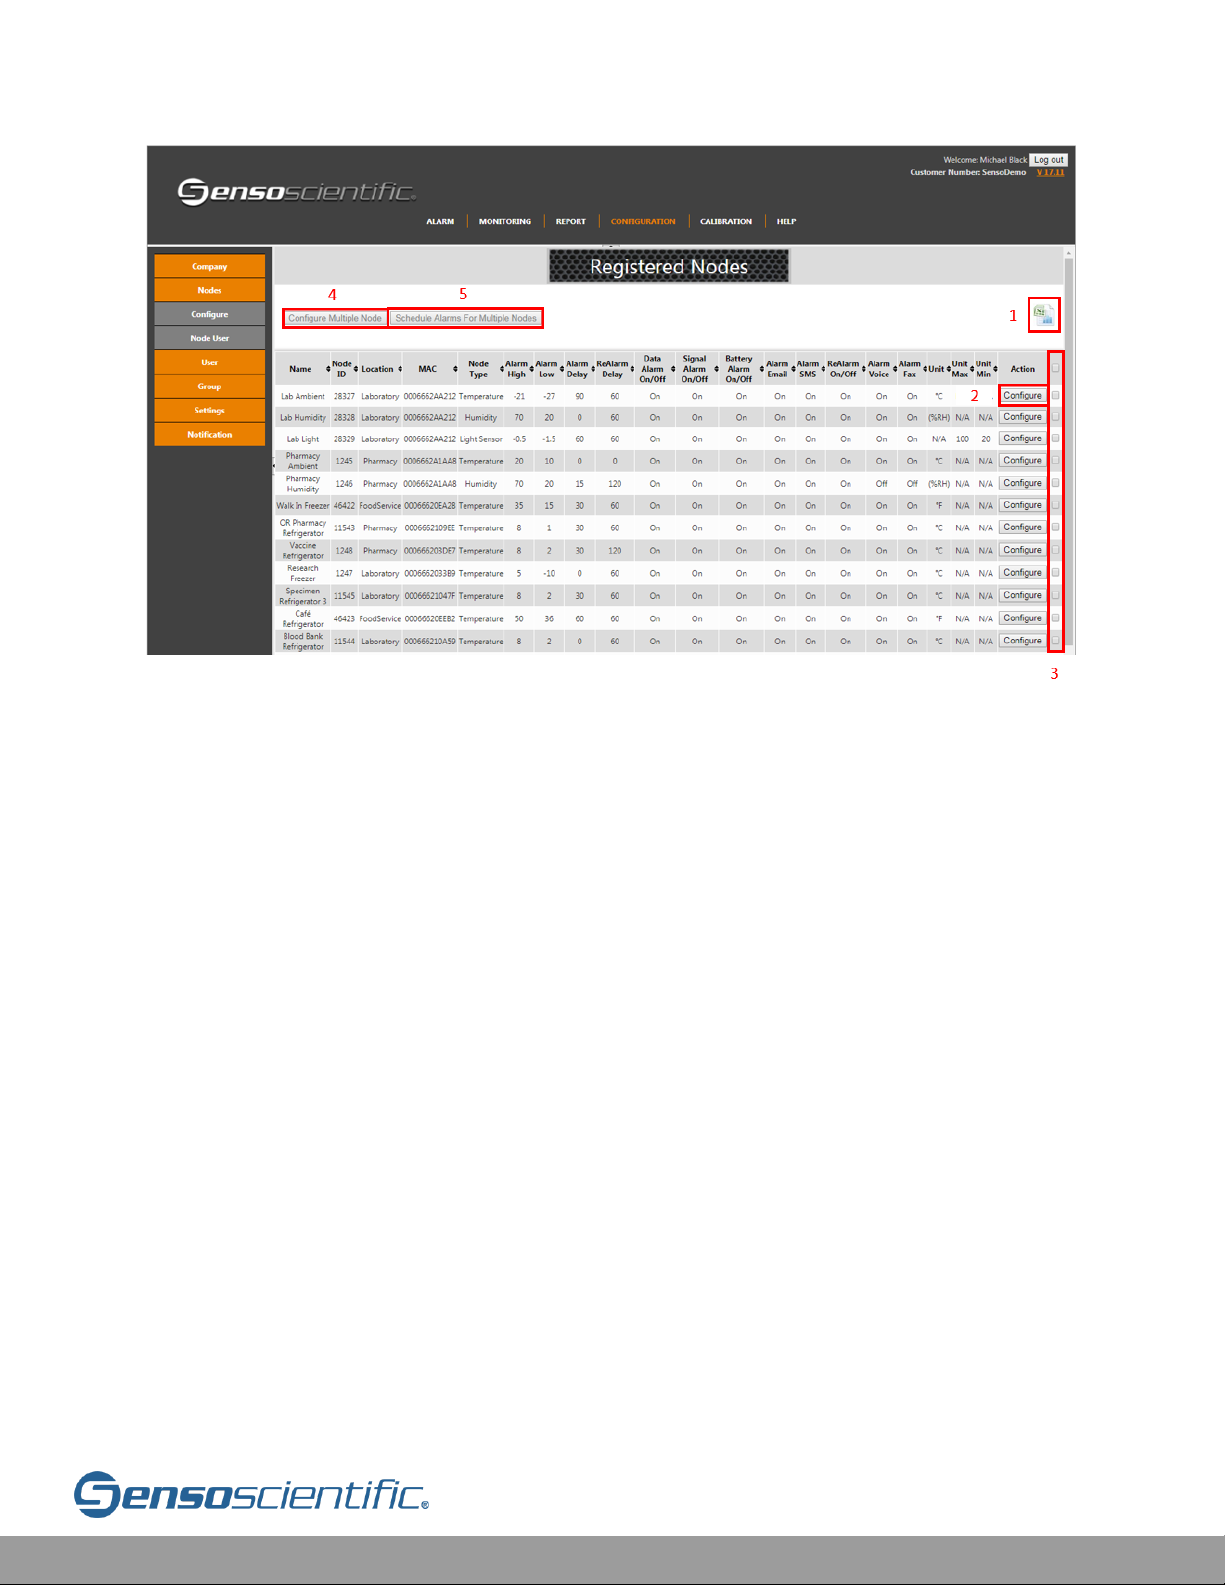
Features:
1. Export to Excel: Exports the current configuration settings to .xls format
2. Configure: Allows user to Edit the individual Nodes.
3. Check Boxes: Allows user to select multiple node and configure
4. Configure Multiple Nodes: Select Multiple nodes of the same Node type
and configure at the same time. New settings will be updated on all
selected nodes. User selects nod of different types then “Configure Multiple
Node” button will be disabled.
5. Schedule Alarms for Multiple Nodes: Select multiple nodes and schedule
the times (see below)
Page 13
Cloud User Manual V20.6 13
Figure IV.2-2: Configure Multiple Node
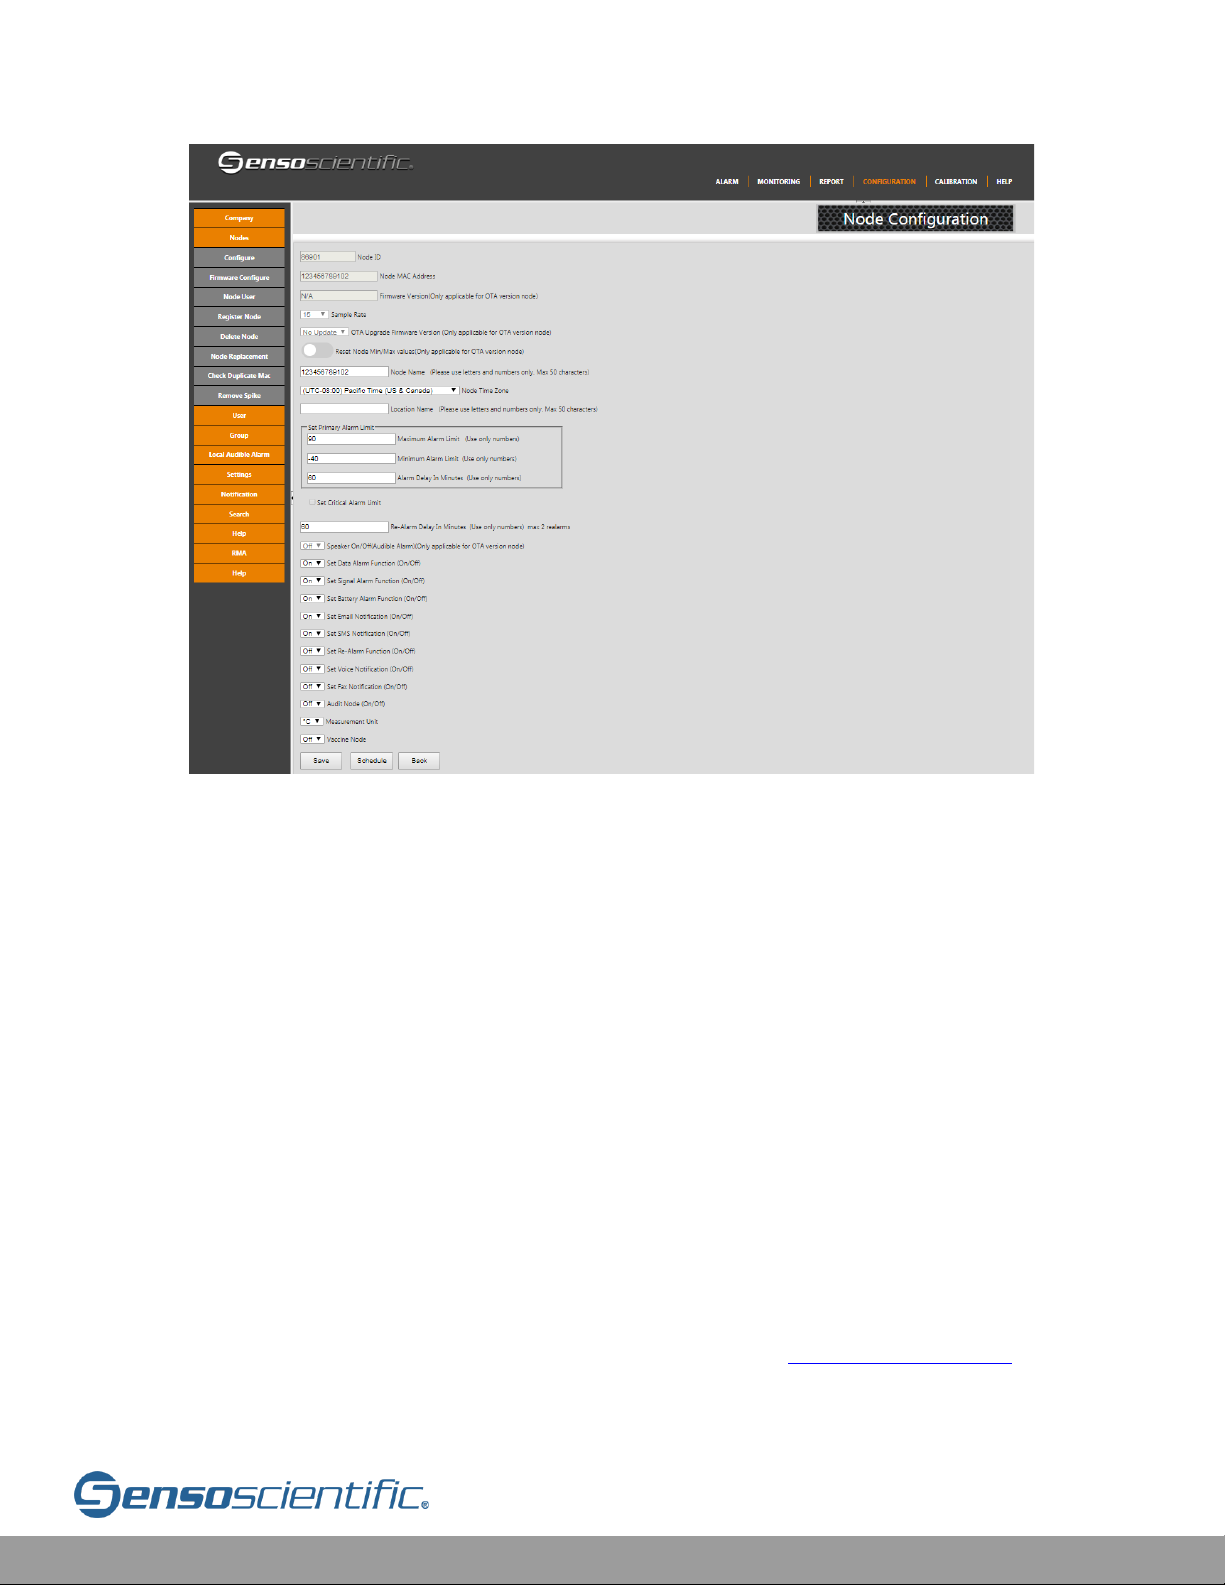
Starting from top to bottom, the following will explain the meaning and function of
each field listed in the Node Configuration page (see below screenshot in Figure 6 for
reference while reviewing).
Page 14
Cloud User Manual V20.6 14
Figure IV.2-3: Node Configuration Page
Node ID and MAC Address
“Node ID” is used by SensoScientific as a unique identifier of a node. This number
cannot be changed. “Node MAC Address” is a unique MAC address that allows the
device to connector to Wi-Fi. This address cannot be changed.
OTA – Firmware and Upgrading
A few dynamic features in the cloud are only available with the OTA Series node.
“Firmware Version” is an OTA features which shows the current firmware version of
a given node. OTA nodes can be upgraded to the latest firmware wirelessly via “OTA
Upgrade Firmware Version”. This feature allows a user to upgrade the firmware of
a device to a different firmware version without needing to send it back the
manufacturer or even touching the device itself. The “Sample Rate” can be changed
on Vaccine nodes between five (5) and fifteen (15) minutes. Also, the OTA device
offers the ability to “Reset Node Min/Max values” (See VII.4 Reset Min/Max more
info) from a previous set of values to the current state. The last OTA feature
accessible in the Node Configure menu is to turn the “Speaker On/Off”. This changes
Page 15

Cloud User Manual V20.6 15
the Audible Alarm on or off. When on, the audible alarm will sound on the device
during an alarm. Each of these dynamic features can be performed from the cloud
without the need to touch the device itself.
Node and Location Names
“Node Name” and “Location Name” can be changed to whatever helps the user best
identify the source of the data. This name will show up on the monitoring page.
Time Zone
The “Node Time Zone” can be configured to match the Time Zone of the user. This
is important when running reports and identifying the local time in which data is
recorded.
Alarm Limits and Alarm Delay
Input the parameter limits (temperature, humidity, etc.) under “Maximum Alarm
Limit” and “Minimum Alarm Limit” to define the allowable range of readings. When
data recorded by node(s) is outside the range defined in these fields, a data alarm
will be generated. Under, “Alarm Delay In Minutes”, an alarm delay can be defined
which will buffer the system against nuisance alarms. One example of a nuisance
alarm is if someone quickly opens and closes a refrigerator door. Normally, the node
would show a spike in temperature and begin to alarm. However, with an alarm
delay, the node accounts for this possibility and waits the set delay time before
activating a data alarm. See IX.1.c Data Alarm for more information.
Critical Alarm Limits
The “Critical Alarm” notifies users if the recorded data is outside the “critical alarm
limits”. This alarm is used as a secondary measure to escalate alarms to higher
officials if no actions are being taken. See IX.3. Critical Alarm for more information.
Re-Alarm Delay (in minutes)
The Re-Alarm Delay function is used in case someone does not confirm the first
alarm. Set a desired time for the system to wait before sending out a reminder alert.
It will send a reminder up to two (2) times about the alarm condition if it still exists
and needs attention.
Page 16

Cloud User Manual V20.6 16
Signal Alarm / Battery Alarm / Data Alarm
Different alarms are sent to users depending on different alerts. Nodes can send out
Data Alarms (i.e. temperature data is outside of alarm limits), Signal Alarms (if Wi-Fi
Network goes down), or Battery Alarms (if the battery level drops below 25%). Please
note this corresponds to each individual node. Set the corresponding fields to On or
Off according the application of the node. To configure Signal/Battery Alarms for the
entire system, please refer to the "Settings" submenu Tab on the left side (See IV.14
Settings). Be sure, also, to configure the user settings to the proper contact
information (email, phone number, etc…) in order to receive notification and turn ON
the desired notifications to be received.
Set Email / SMS / Voice / Fax Alarm Function
Enable, "Set Re-Alarm Function" to allow the node to send reminder alerts if the
alarm has not been confirmed. The system will send two (2) reminder alerts.
Audit Node
This feature allows the node to be audited. From the Current Status page, check the
nodes to Audit, and the system makes an un-editable stamp of the current Time,
Date, and Measurement along with the User who performed the Audit. This can be
viewed in the Audit Node Report (See VI.8 Audit Node Report).
Measurement Unit
Select Celsius or Fahrenheit units for all reports to show in the corresponding unit.
OTA Series nodes will change the unit of measurement on the device’s display.
Enterprise Series node, however, will not change from the manufacturer pre-selected
measurement unit.
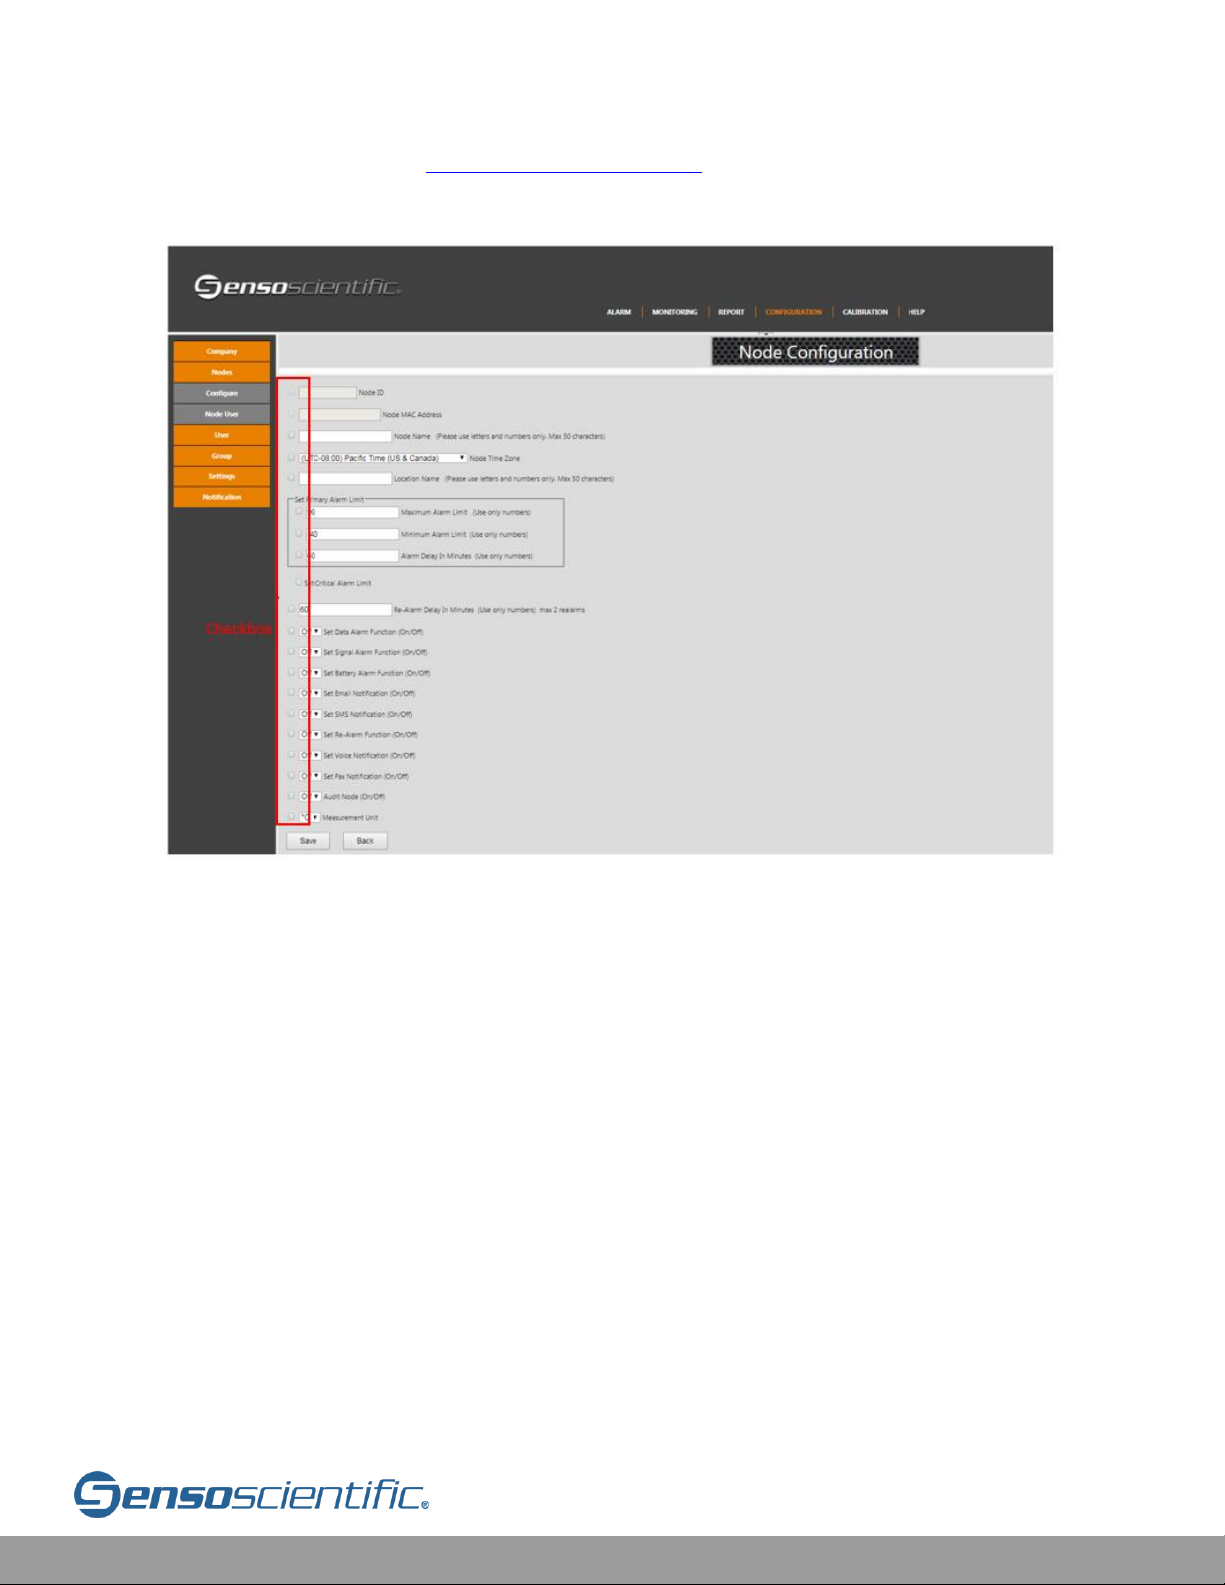
Single Node Configuration vs. Multiple Node Configuration
Multiple node configuration is similar to single node configuration. The major
difference is that the desired changes must be checked at the left of the field in
question. If the checkbox next to the field is not checked, this feature will not be
carried over to every node that is selected. Only select the checkbox of the fields that
Page 17
Cloud User Manual V20.6 17
must be the same (See IV.2 Node Configuration for how to get to the configure
multiple nodes screen)
Figure IV.2-4: – Multiple Node Configuration
Once all configuration changes have been made, be sure to select the “Save” button
at the bottom of the page so that all changes will be saved.
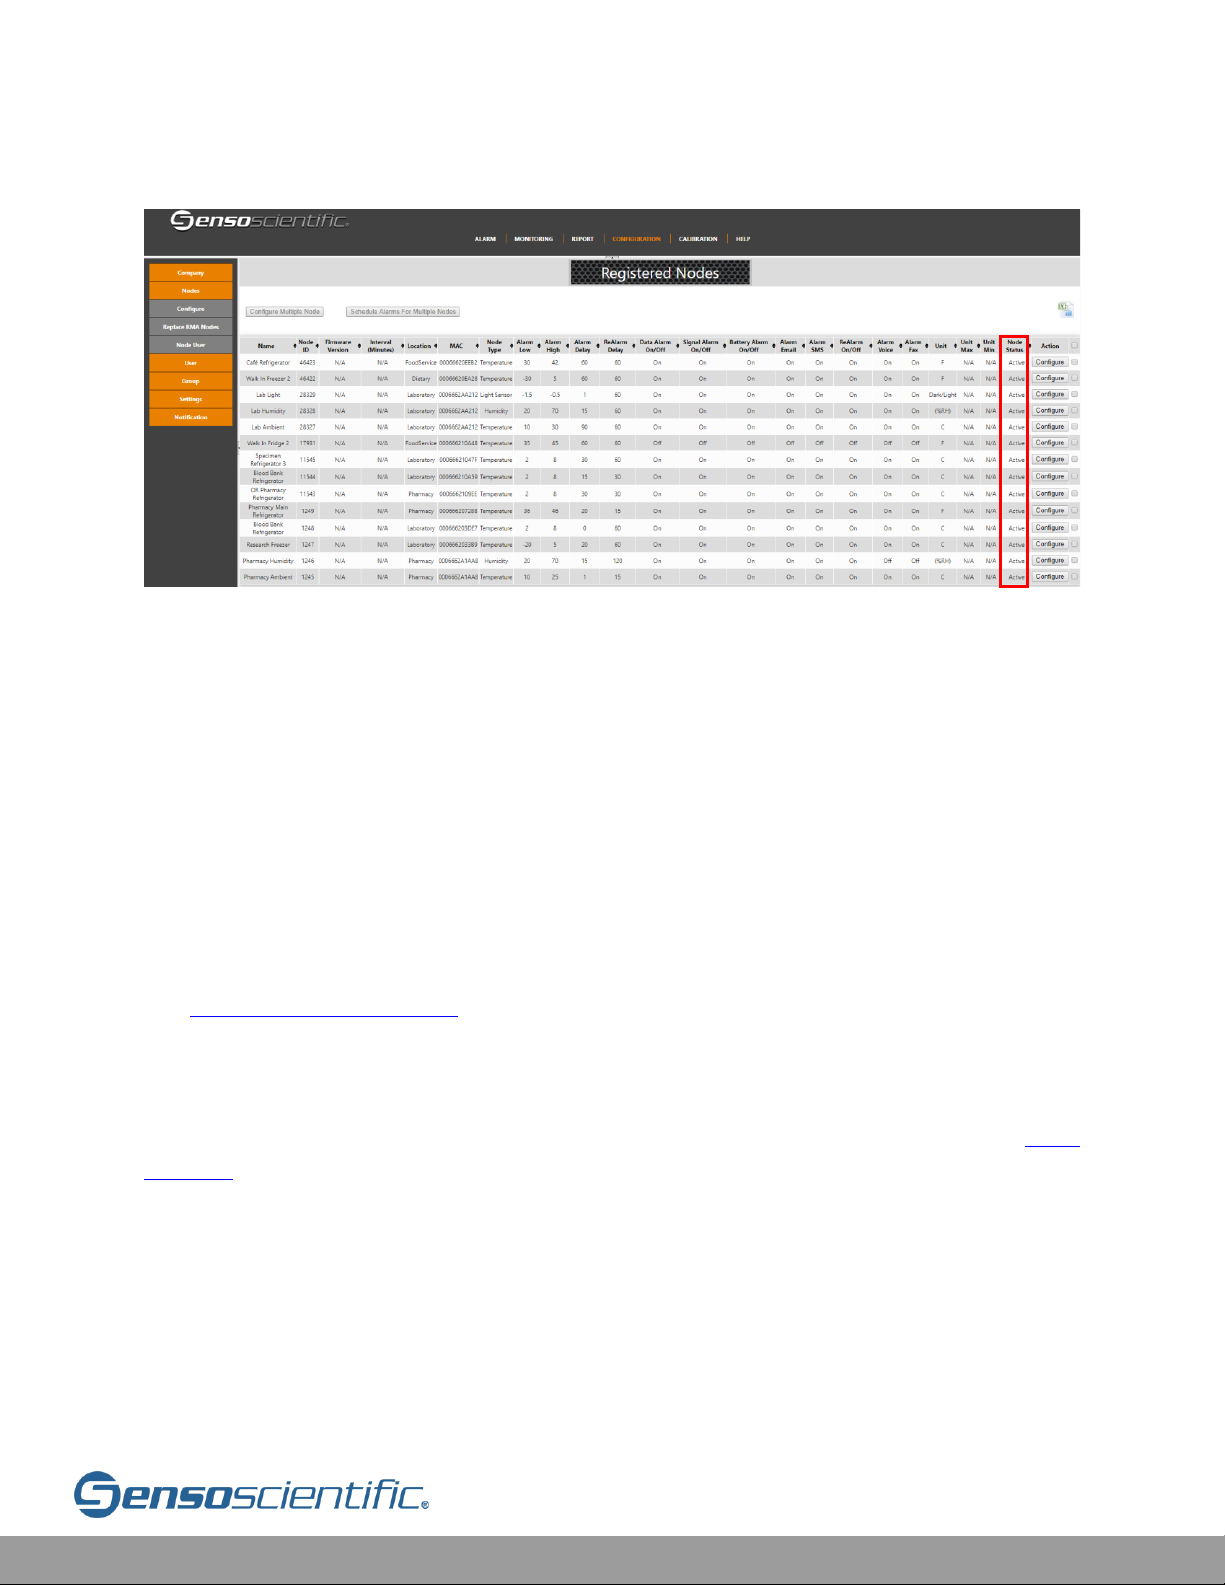
Node Status
Node status is an identifier which detailed the current status of a node. Status
indicates a nodes’ ability, intent, and/or payment status
There are five different status types:
Active
New Node (Inactive)
On-Hold
Spare
Nodes which are intended to be on and connected.
Nodes which are produces and being shipped to client.
Nodes which are suspended by Support due to
delinquency.
Extra nodes used as a backup for malfunctioning nodes.
Page 18
Cloud User Manual V20.6 18
Inactive
RMA
Nodes which are
identified as being
purposefully
disconnected.
Nodes which are
being used for a
replacement.
Page 19
Cloud User Manual V20.6 19
Figure IV.2-5: Node Status
IV.2.a Single Temperature, Double Temperature &
Temperature/Humidity Nodes
The Node Configuration page can be found by going to CONFIGURATION > Nodes
> Configure > Select Nodes to Configure for multiple or single configuration. From
within the Node Configuration Page, many different features can be added, edited,
and removed. This is where users can customize the node to perform in very specific
ways. For example, Name and Location of a node are editable to more easily organize
them. The Alarm settings can also be tailored to a node’s application in this page.
See IV.2 Node Configuration for details on each field.
To configure a Temperature or Humidity node, a few critical features are
recommended. Start by naming the device (Node Name and Location Name). The
Node Time Zone should automatically assign to the global settings (See IV.14
Settings); if it is different for the node it can be changed. Set the Maximum and
Minimum Alarm Limits. This is the most important feature of the configuration. The
standard Alarm Delay is 60 minutes. Turn on the Data Alarm, Signal Alarm, Battery
Alarm, and some form of notification method (email, SMS, voice, fax). Once these
critical features have been implemented the rest of the details are based on
preference. For example, the audible alarm can be turned on or off but does not
determine the critical functionality of the device. If all the above has been completed,
Page 20
Cloud User Manual V20.6 20
the node will notify the user upon excursion from the assigned
temperature/humidity limits.
IV.2.b Universal Nodes
Before configuring a Universal Node, it should be installed (secured in the location it
will be monitoring), powered ON, and connected to the network. To configure a
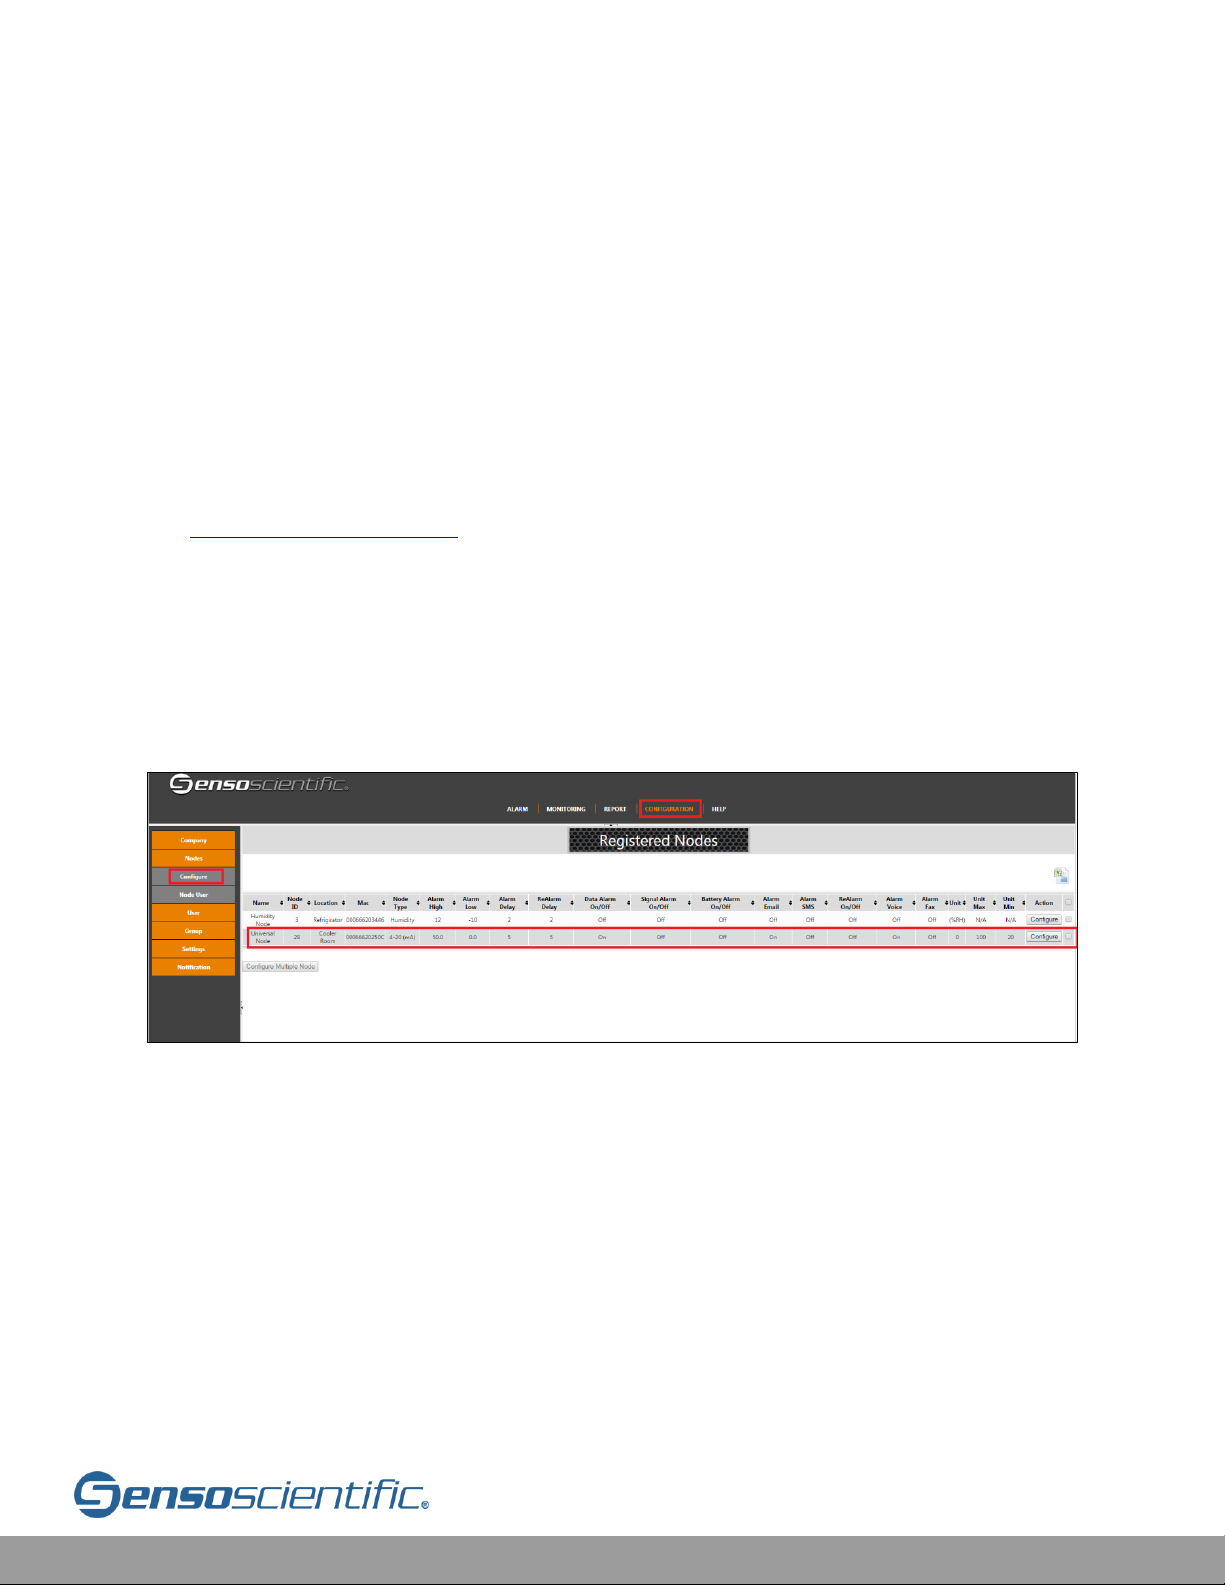
Universal Wi-Fi node in the cloud, click on “CONFIGURATION” on the top menu, then
on the left side bar, click “Nodes”. A submenu will appear below in grey; click
“Configure”. The screen will show all the nodes registered.
See IV.2 Node Configuration for details on each field.
There are 3 types of Universal node protocols: 4-20mA, 0-5V, 0-10V. These three
standard inputs are determined during manufacturer and cannot be changed from
within the cloud.
Click on the “Configure” button to the right of the desired node row.
Figure IV.2.b-1: Universal Node
In this example, a Universal 4-20mA node is being configured:
Page 21
Cloud User Manual V20.6 21
Figure IV.2.b-2: Universal Node Configuration
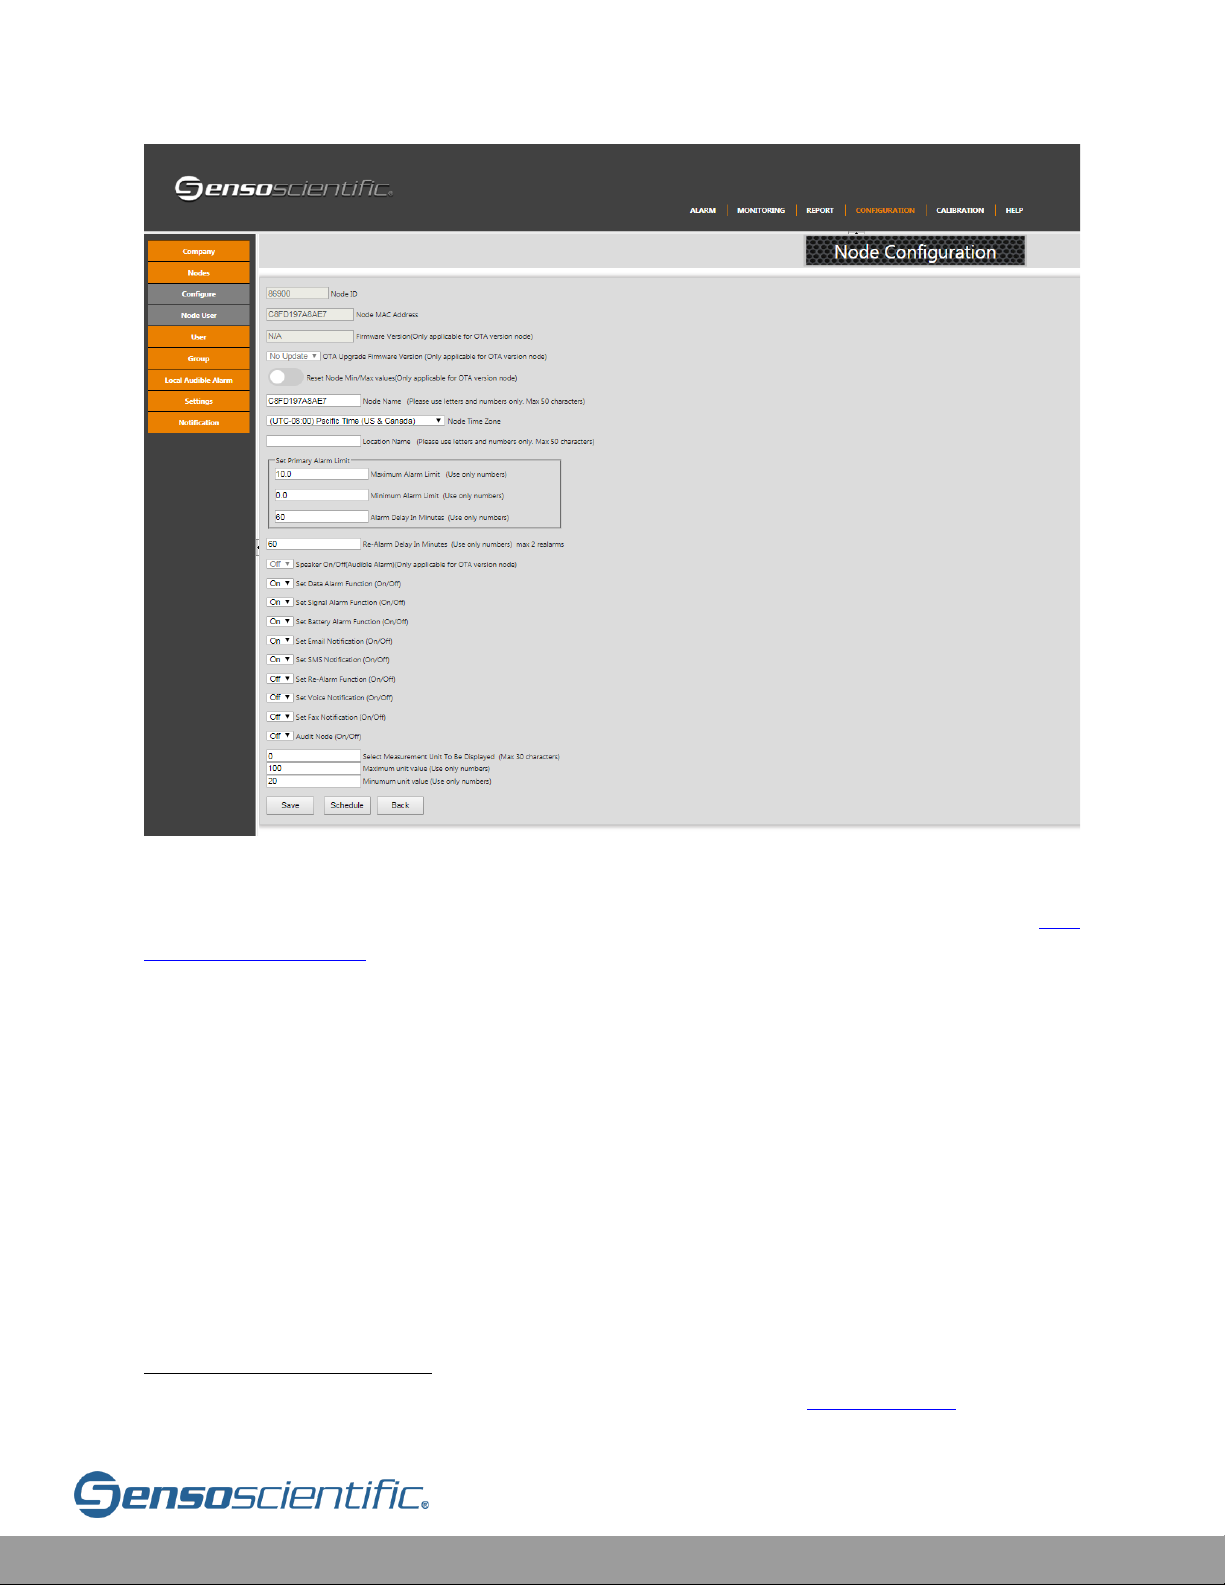
Most fields in the Node Configuration page are identical to the other nodes (See IV.2
Node Configuration for an explanation of all fields). There are two differences. The
unit value limits must be defined and there are no critical alarm limits.
The “Measurement Unit” and Max/Min “Unit Value” are the limits of the sensor1 being
used. Since the Universal Node can be used with any sensor of standard output 420mA, 0-5V, or 0-10V, there are multiple different ranges that can be used. The
sensor will output a signal which is received by the SensoScientific Universal Wi-Fi
Node. This value is received, recorded, and transmitted to the cloud. The value
received is in the form of the data output (voltage or current). To convert the
transmitted value into a measured quantity, the unit minimum and maximum values
of the sensor (see the sensor’s manual) must be inserted in the Node Configuration.
1
Sensor refers to the probe, not the Wi-Fi Node or Wi-Fi Sensor (See II. General Info for more on
common terms)
Page 22
Cloud User Manual V20.6 22
For example, a differential pressure sensor with a range of +/-0.25 in. W.C. is used;
therefore, the “Maximum Unit Value” is 0.25, the “Minimum Unit Value” is -0.25
and the unit type is also entered as in. W.C. in “Select Measurement Unit To Be
Displayed”. With this example, the system alarms when the differential pressure is
below 0 in. W.C. (“Minimum Alarm Limit”) or is higher than 0.20 in W.C. (“Maximum
Alarm Limit”).
If the differential pressure goes out of the specified range, the 1st alarm will trigger
after 30 minutes (“Alarm Delay In Minutes”), as long as the condition doesn't correct
itself. If the alarm is not confirmed, the system will send reminder alerts two (2) times
until the alarm has been corrected (“Re-Alarm Delay In Minutes”). Once all the
information has been entered, click “save” and the screen will go back to the
“Registered Nodes” window and the configured node will show the updated settings.
IV.2.c Open/Closed & Water Leak Nodes
Open/Closed and Water Leak Nodes monitor the presence according to preset
conditions. Each of the nodes will similarly notify the user immediately when the
state changes.
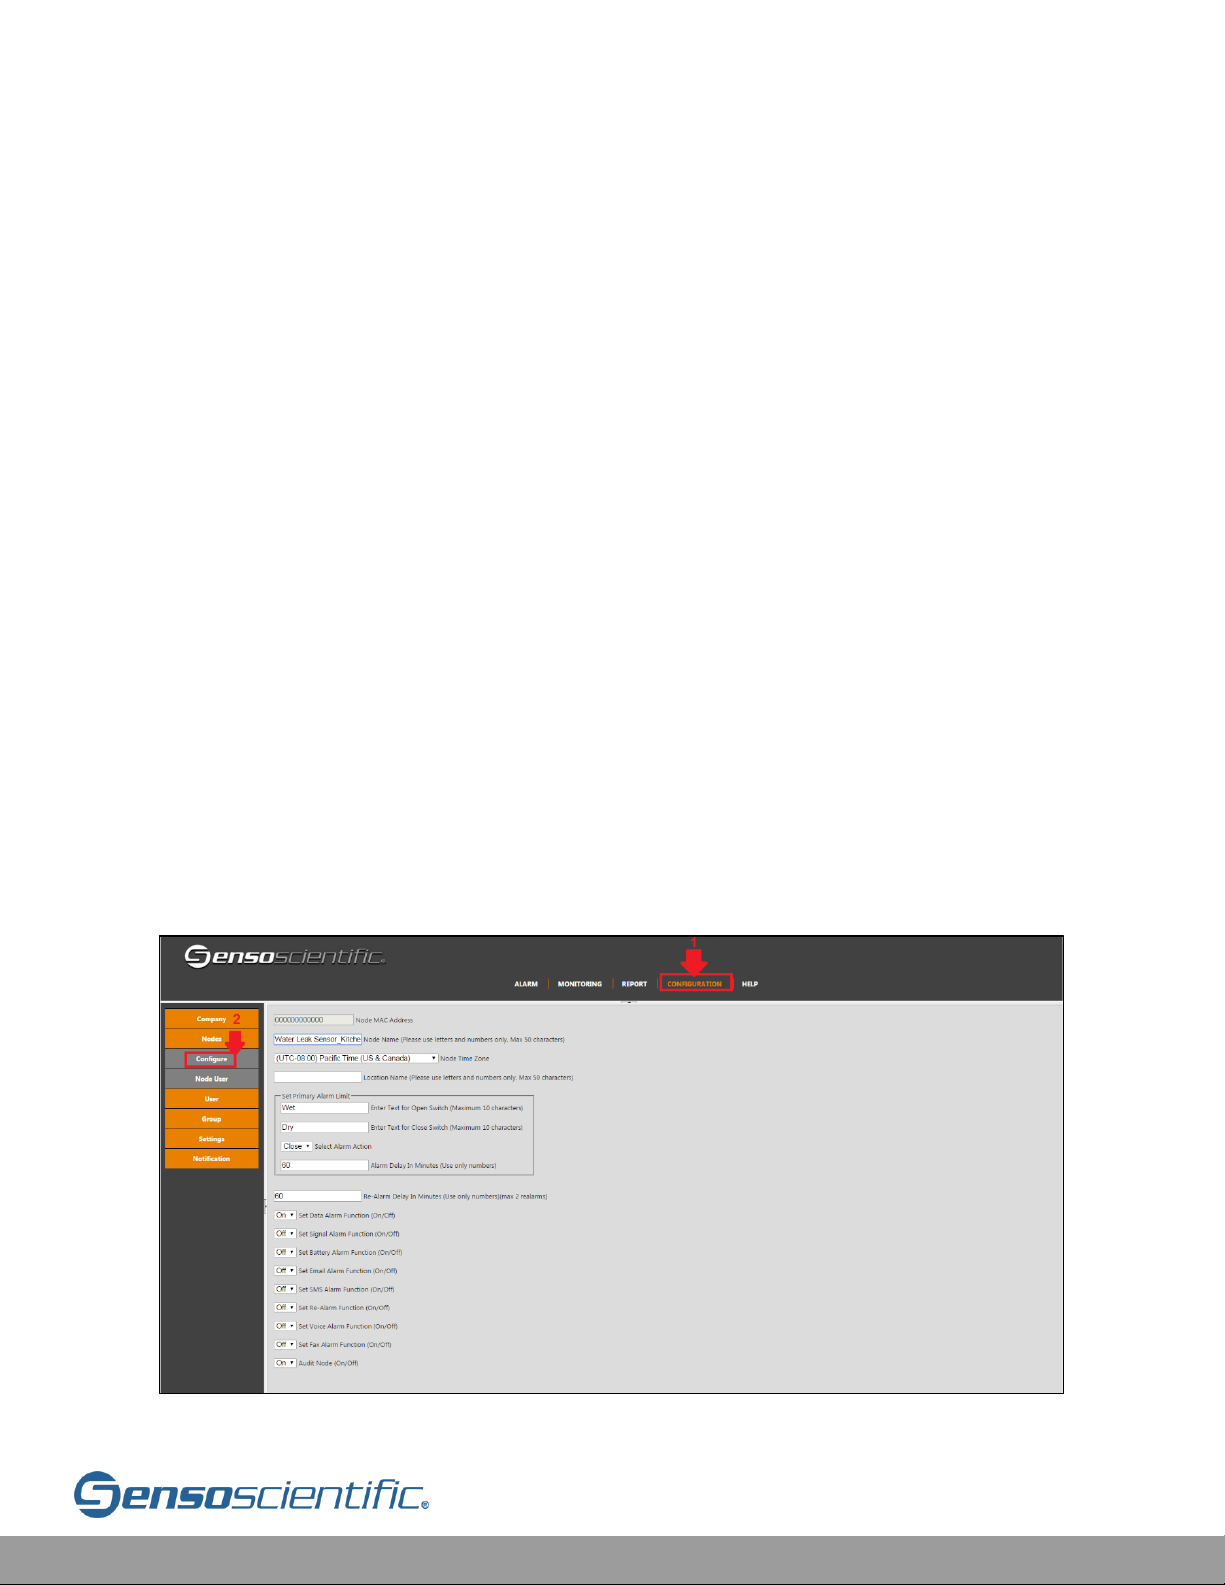
For a water leak sensor, go to the Primary Alarm Limit section and type the following
(Open as "Wet" and Closed as "Dry"). Then, “Select Alarm Action” whether to get an
alarm when it is open or closed (wet or dry) condition.
Figure IV.2.c-1: Open/Closed and Water Leak Node Configuration
Page 23
Cloud User Manual V20.6 23
Open/Close nodes work similarly but require the open switch state to be “Open” and
the closed state the be “Closed”.
See IV.2 Node Configuration for details on configuration for each of the other fields.
IV.2.d Light Sensor
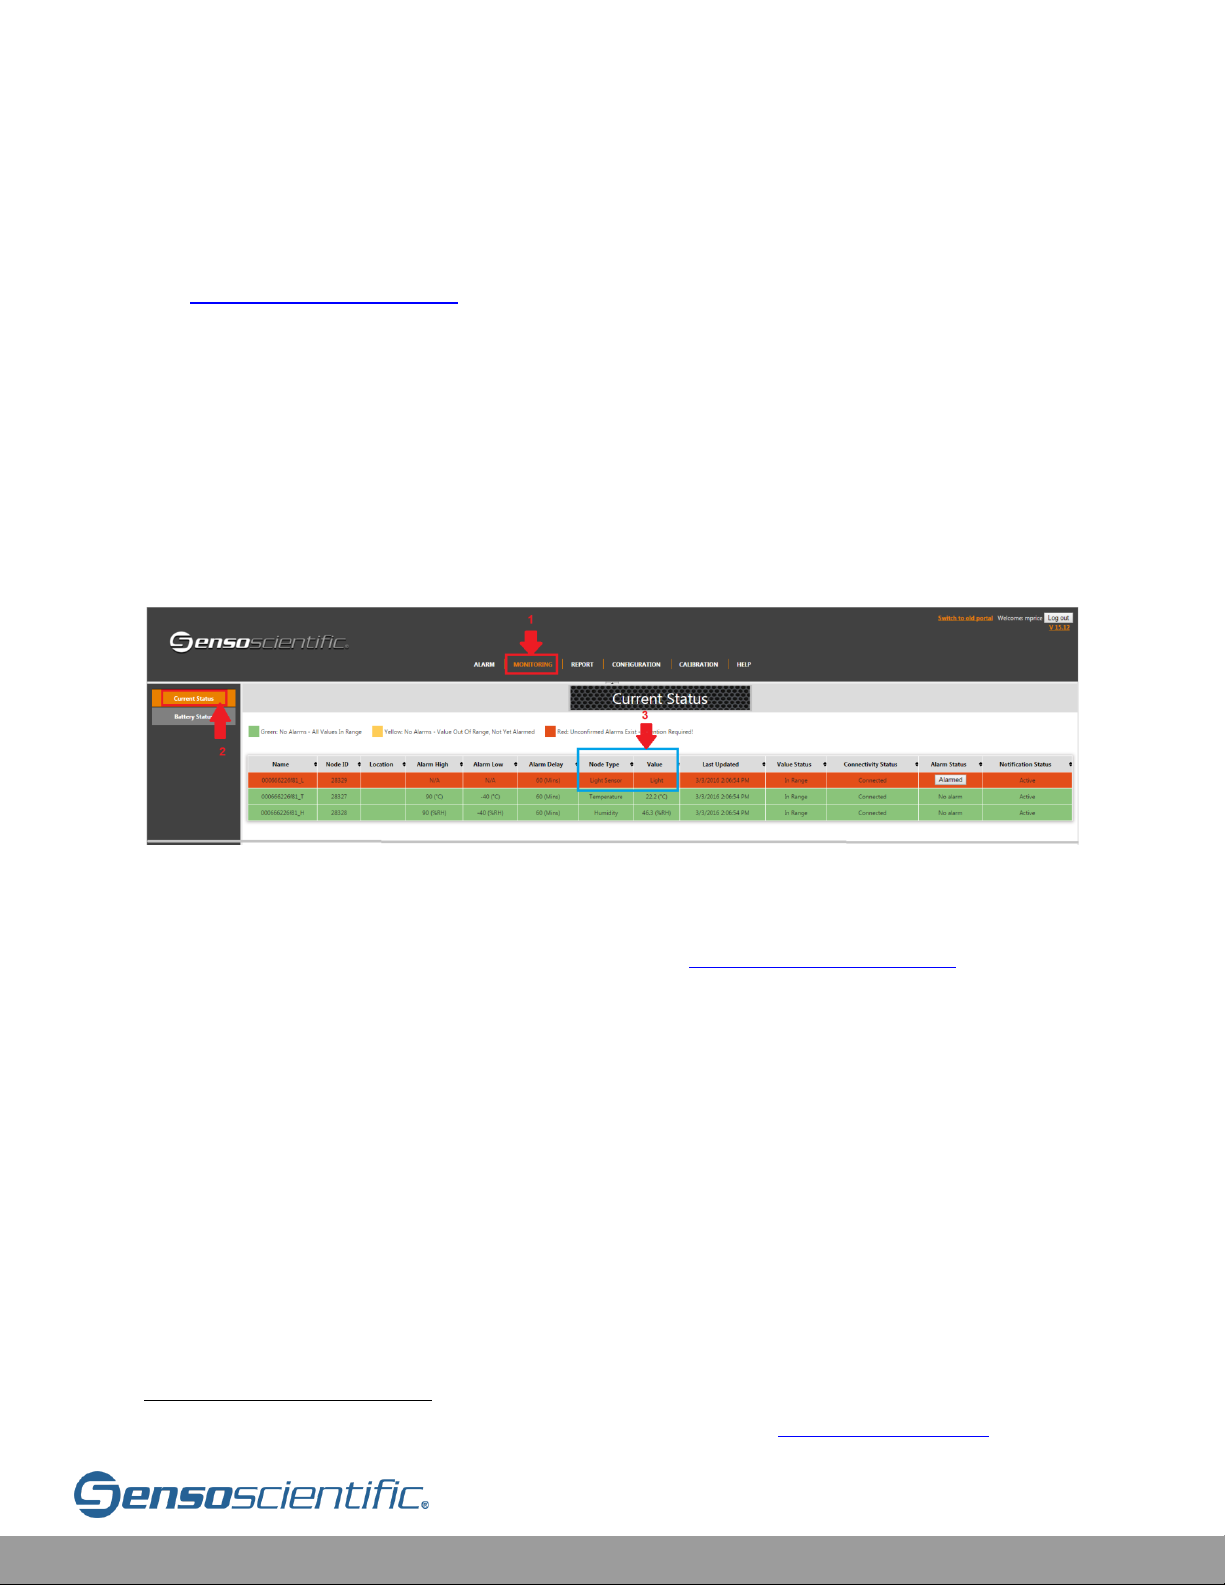
The light sensor2 Wi-Fi node integrates with the temperature/humidity probe. It will
detect the presence of light and report it to the cloud.
The light sensor node must always be connected to an external power supply.
Figure IV.2.d-1: Monitoring Page of a Light Sensor Node
To set up the light sensor, go to CONFIGURATION > Nodes > Configure and select
“Configure” at the right of the node desired (See IV.2 Node Configuration). The node
configuration page will include the following:
2
Sensor refers to a probe. Not to be confused the Wi-Fi Sensor (See II. General Information)
Page 24
Cloud User Manual V20.6 24
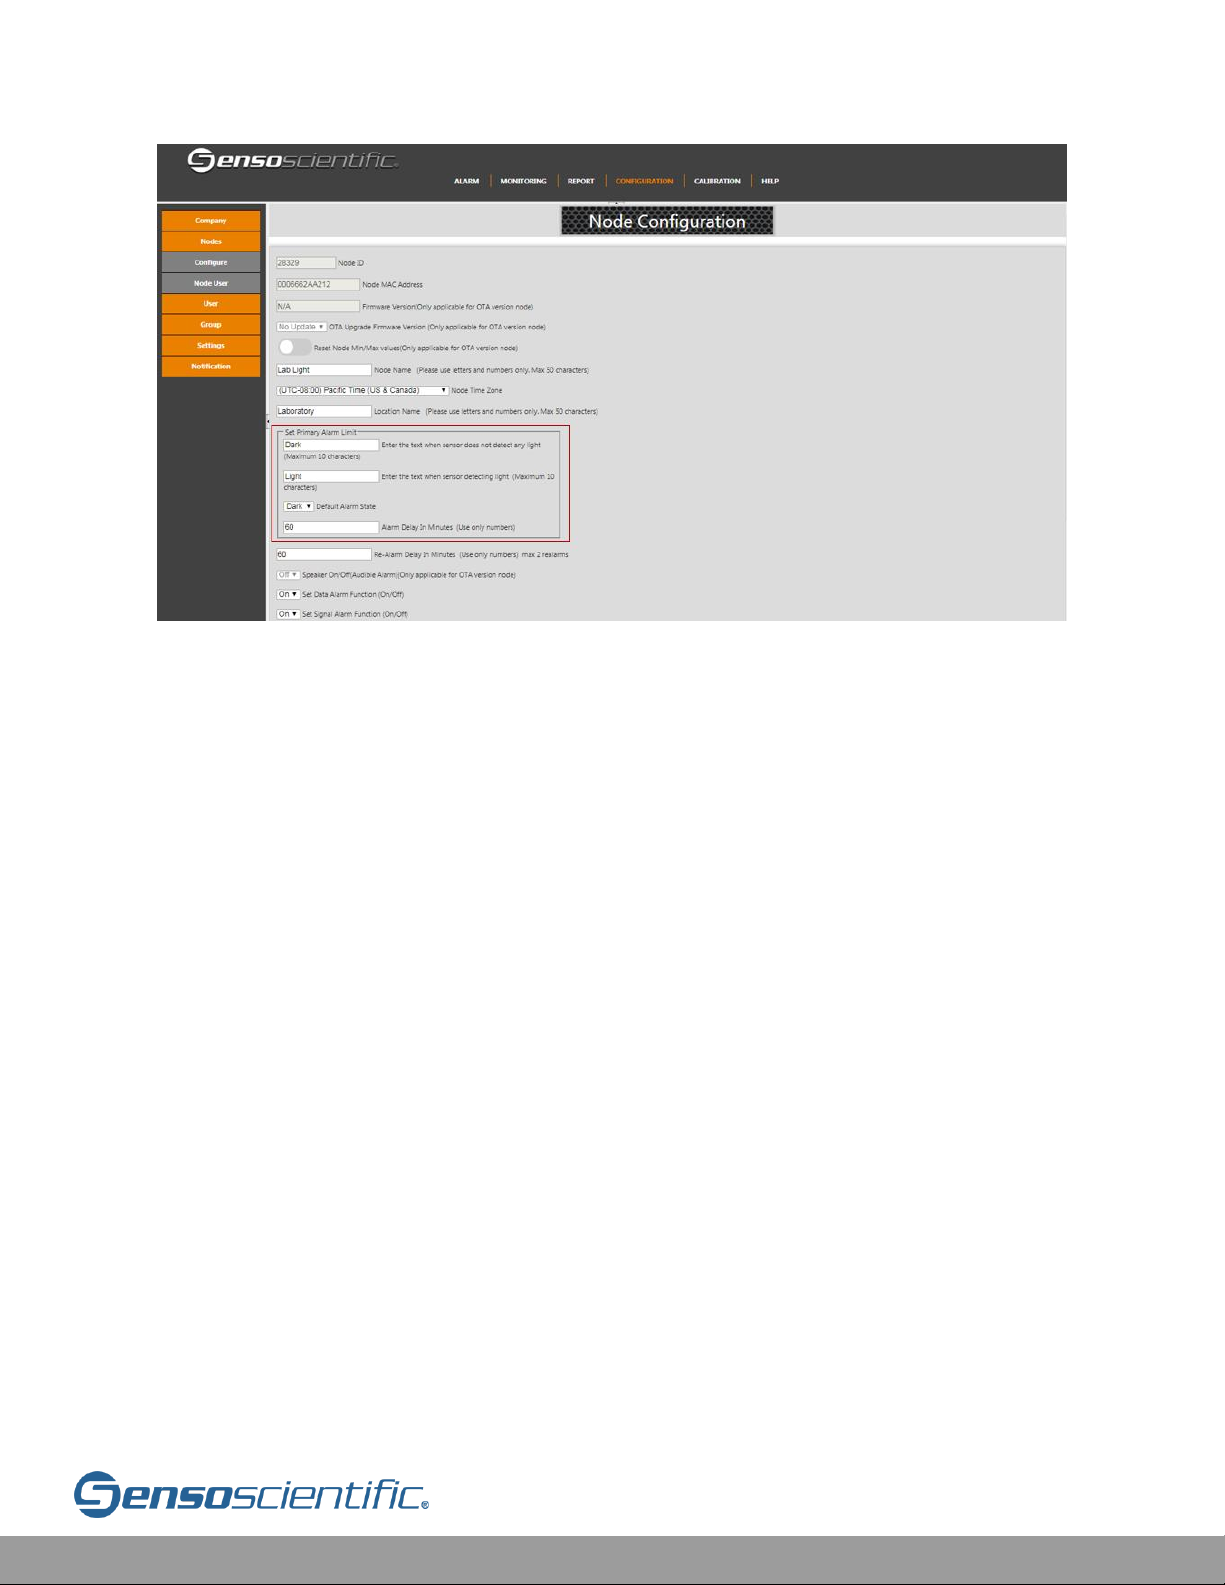
Figure IV.2.d-2: Light Configuration
In the Set Primary Alarm Limit section (the image above), input the details as
required. The Default Alarm states can be changed from Dark to Light as the
application permits.
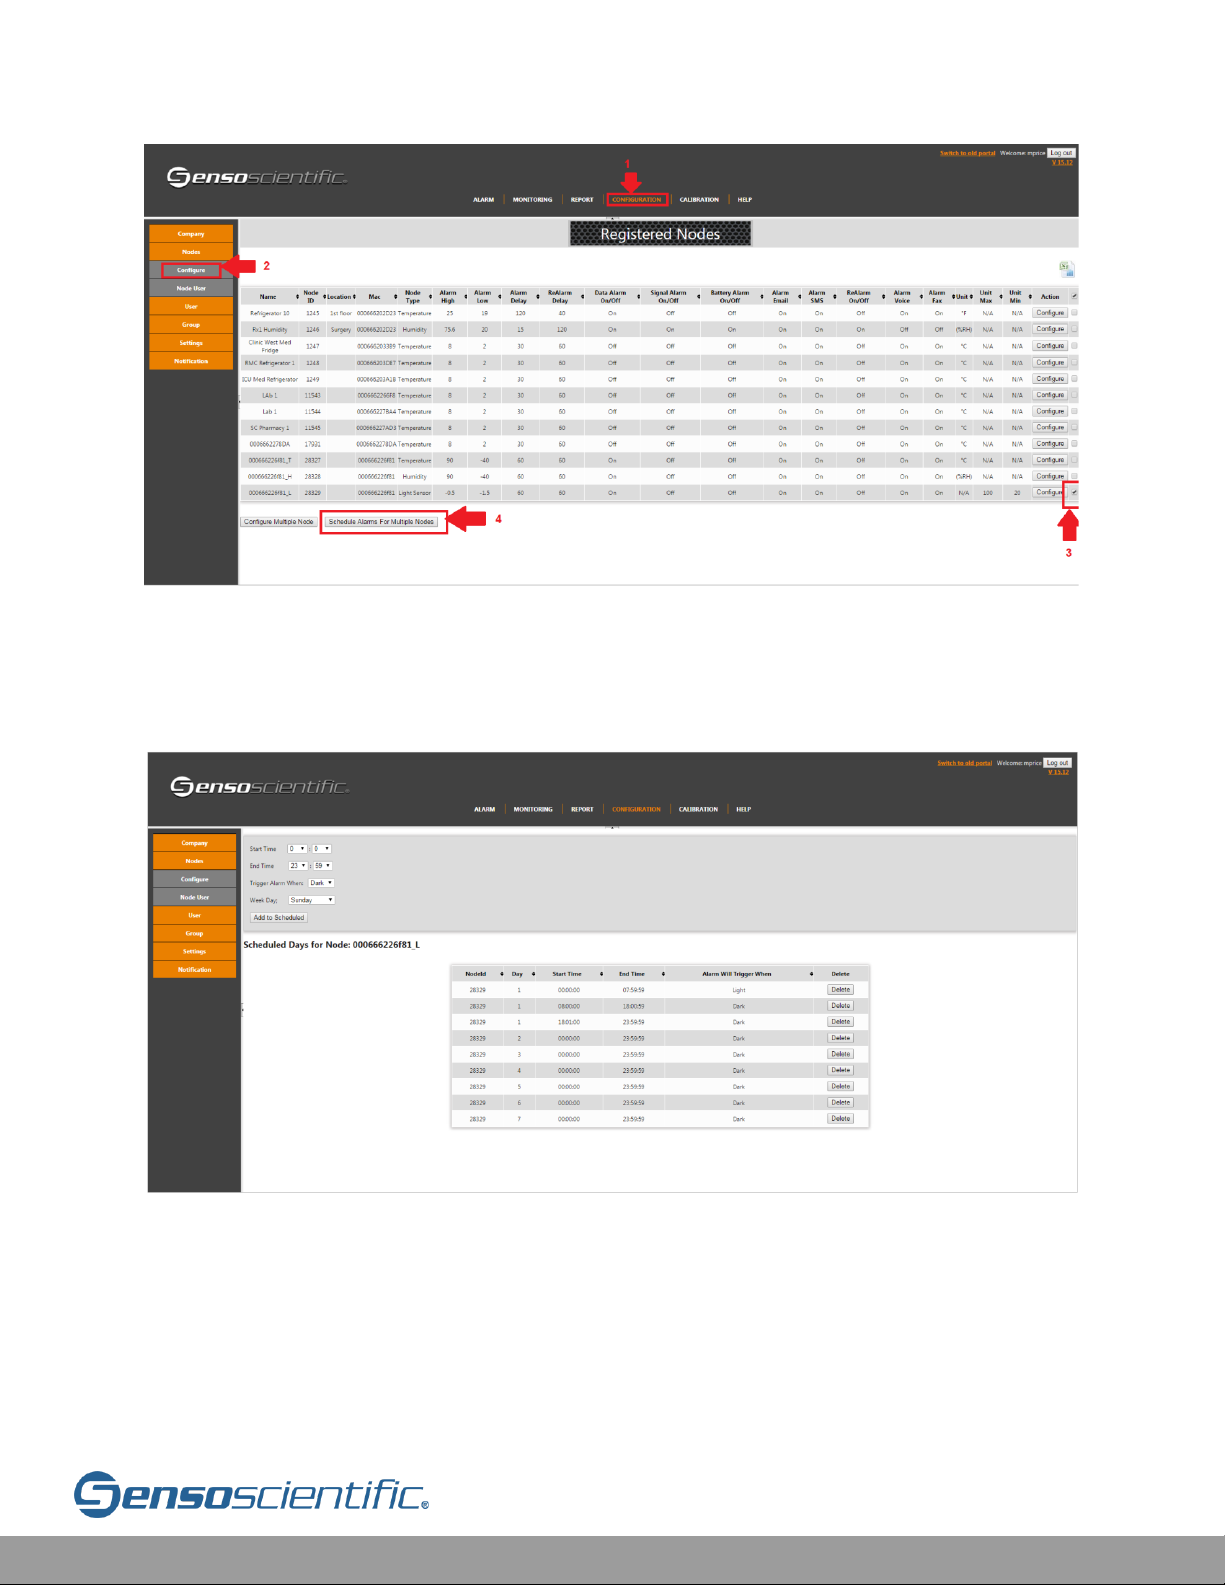
Light Sensor Multiple Alarm Schedule
In most cases, the light sensor doesn’t have one alarm state (light or dark). Instead,
there are times when the room should by lit and other times when the room should
be dark. These alarm settings can be scheduled. To schedule the alarm settings, go
to CONFIGURATION > Nodes > Configure > Select Light sensor Check box. Keep in
mind that multiple nodes can be configured at one time as is seen in the figure below.
Page 25
Cloud User Manual V20.6 25
Figure IV.2.d-3: Alarm Schedule for light Sensor
In scheduling the alarm, the user can set the alarm for different status of the node
on different time intervals on the same day.
Figure IV.2.d-4: Alarm Schedule for light Sensor
Page 26
Cloud User Manual V20.6 26
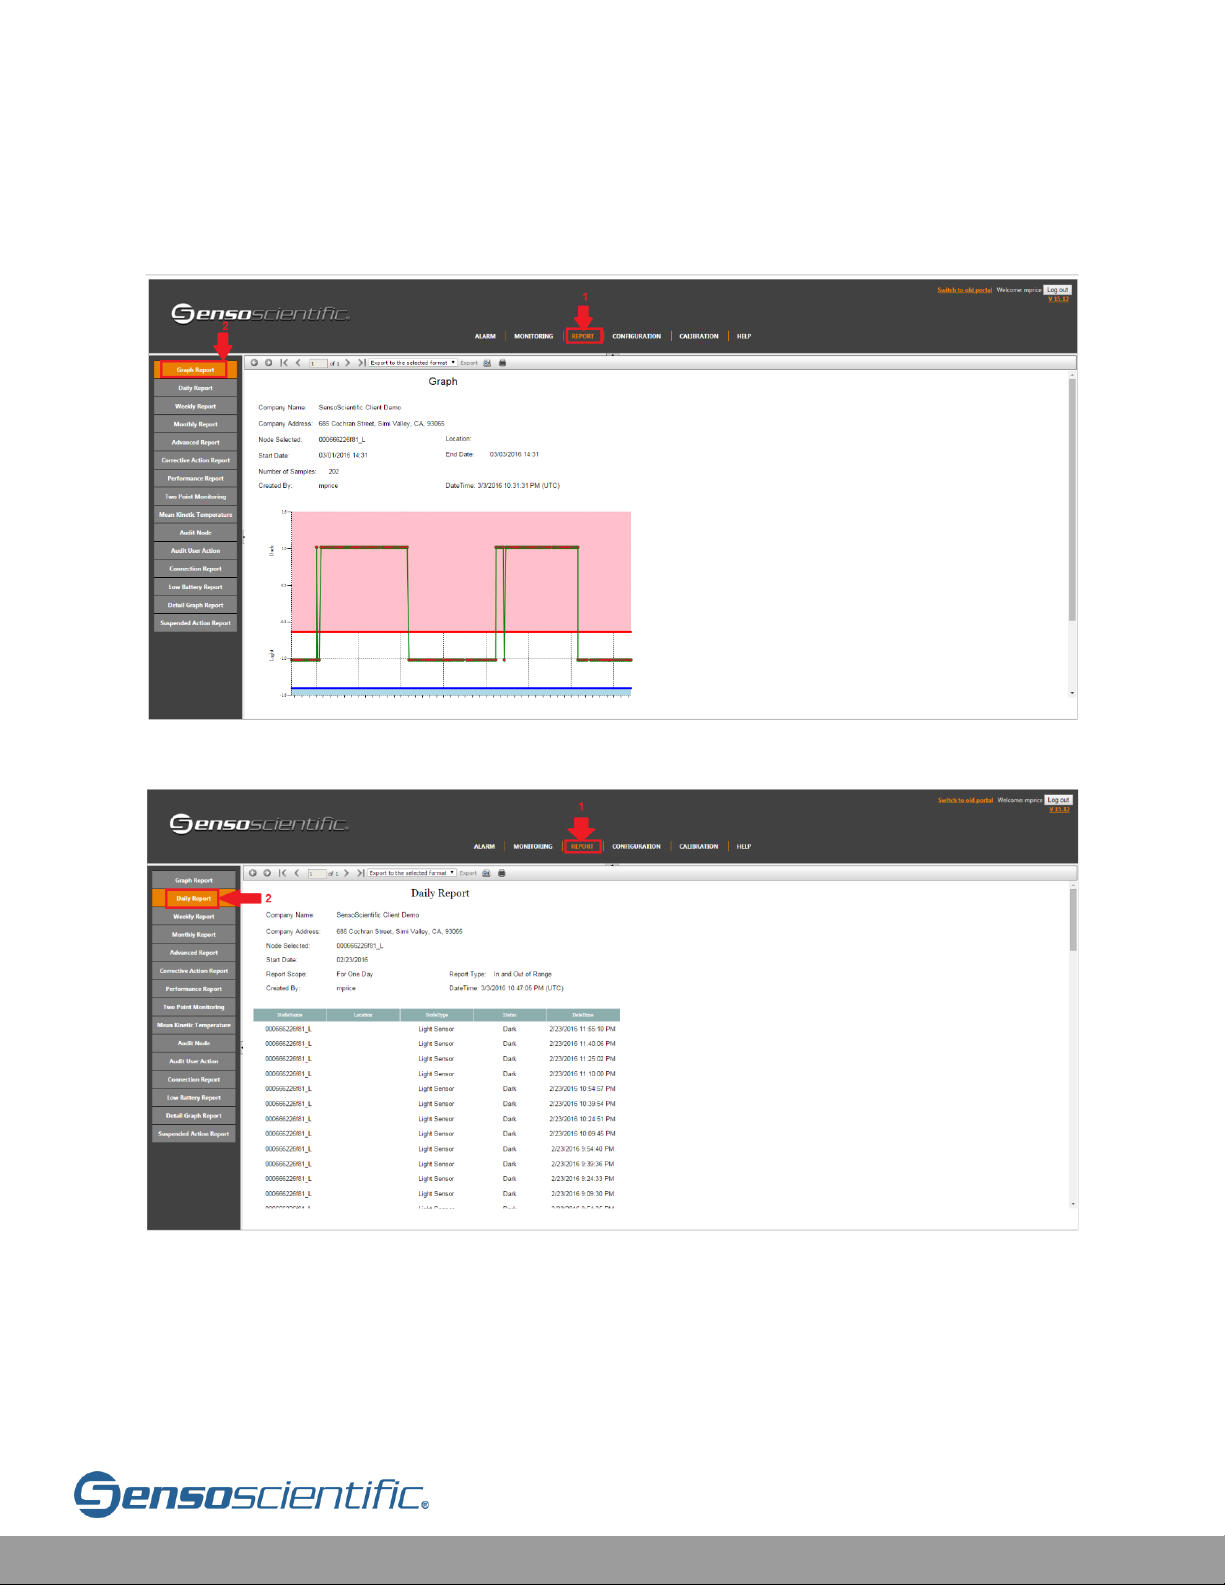
Light Sensor Reports
Some of the reports that are available for the light sensor are shown below:
Figure IV.2.d-5: Graph Report for Light Sensor
Figure IV.2.d-6: Daily Report for Light Sensor
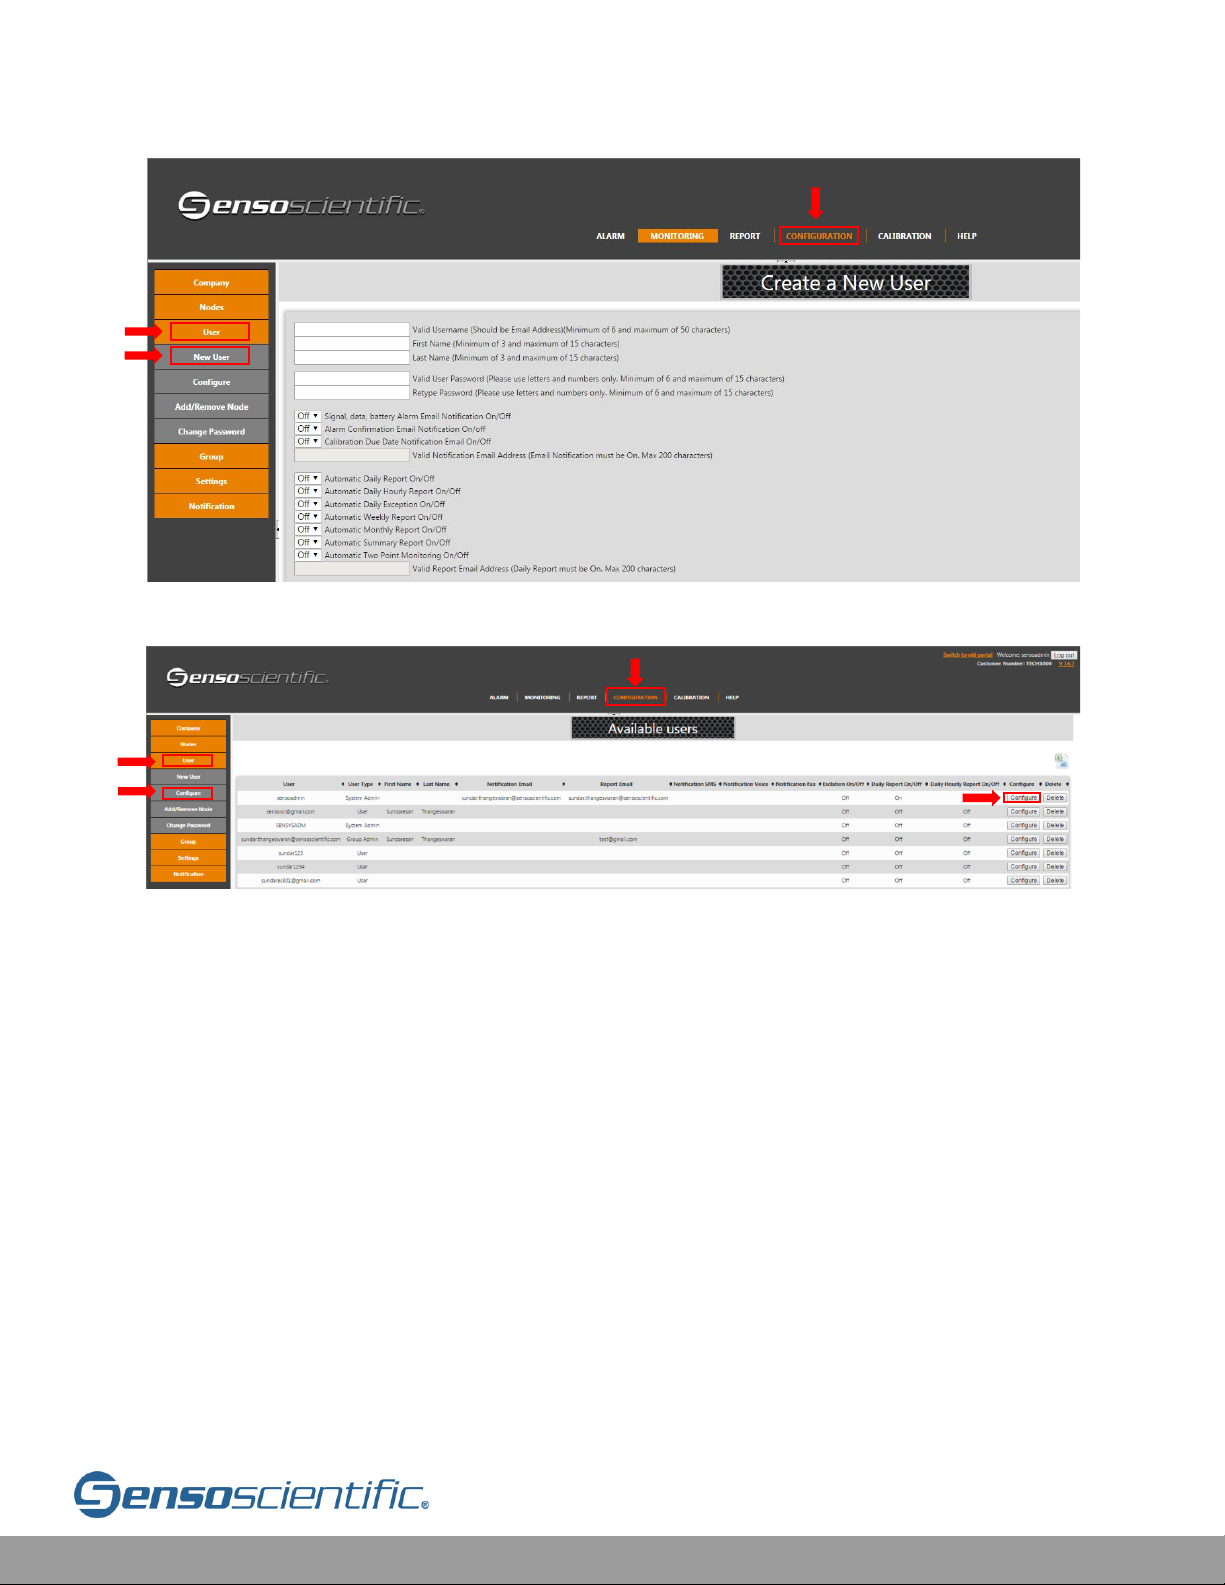
IV.3 Create/Delete User Accounts
Click the CONFIGURATION tab from the main menu, then on the left side, click
“User” from the sub menu, followed by “New User.” The "Create a New User" page
Page 27

Cloud User Manual V20.6 27
will be showing. To create a user, simply fill in the fields with a username (Email), first
name, last name, and password (Password can be changed by user at any time; this
will be covered following this step IV.8.a Changing User Password). Usernames can
be changed within the configuration under the user tab. The contact information will
be the way each user will be notified in an event of an alarm, whether it’s via email,
SMS text, phone, fax, etc… (it is not required to fill in all fields). To enable the contact
field, enable each Notification type to "ON".
IV.3.a Permission
Select user privilege based on the access level desired for each user to have. Below
is an example of privileges each account has:
System Administrator
Has complete access to the system. The System Administrator has the ability to add
ALL registered nodes on the system, they can configure ALL settings as far as node
configuration, creating/deleting/configuring users, creating groups, confirming
alarms, and running reports.
Group Administrator
Has access to registered nodes and users on a group that has been created.
Configuration can be done only to the nodes that were assigned to the group. The
Group Administrator does not have access to nodes and user configuration outside
their assigned group. They can run reports and confirm alarms.
User
Can view the monitoring of the Current Status and can confirm alarms and create
reports. Users do not have configuration privileges and must contact their
Group/System Administrator for any changes needed to the system.
Guest
Can simply view the monitoring where the current status of the nodes is displayed.
No other privileges are granted.
Once desired fields are completed, select “Add New User” and the user account will
display under Registered Users. Repeat this process to create additional accounts for
new users. Any user account can be deleted by the System Administrator only, by
selecting “delete” in the same menu as creating the user account.
Page 28
Cloud User Manual V20.6 28
Figure IV.3.a-1: New User Configuration
Figure IV.3.a-2: Edit Existing User
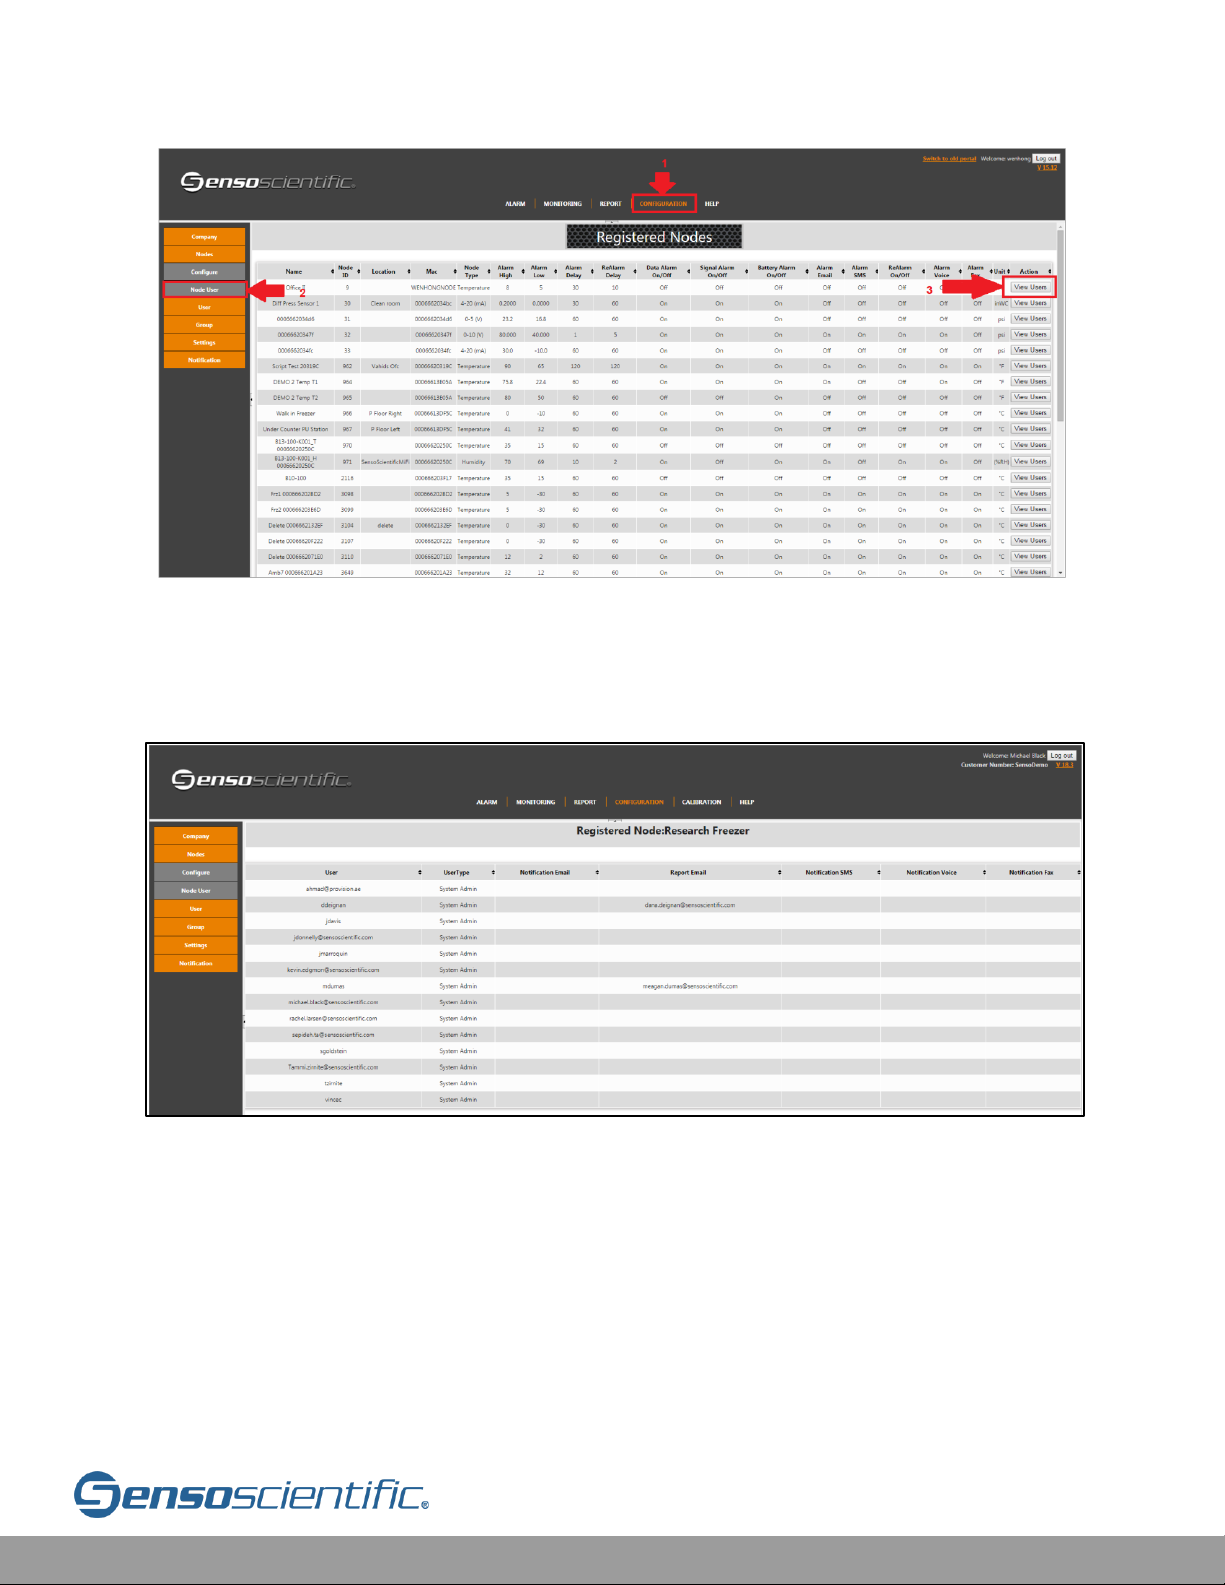
IV.4 Node Users
To see the users associated with a node, go to CONFIGURATION > Nodes > Node
User
This Page displays the list of nodes and their settings.
Click the “View Users” button to display the users associated with the Node.
1
2
3
2
3
1
4
Page 29
Cloud User Manual V20.6 29
Figure IV.4-1: List of Nodes with settings
The users shown in the figure below are the only users that can see the node that
has been selected.
Figure IV.4-2: Users Associate with Node
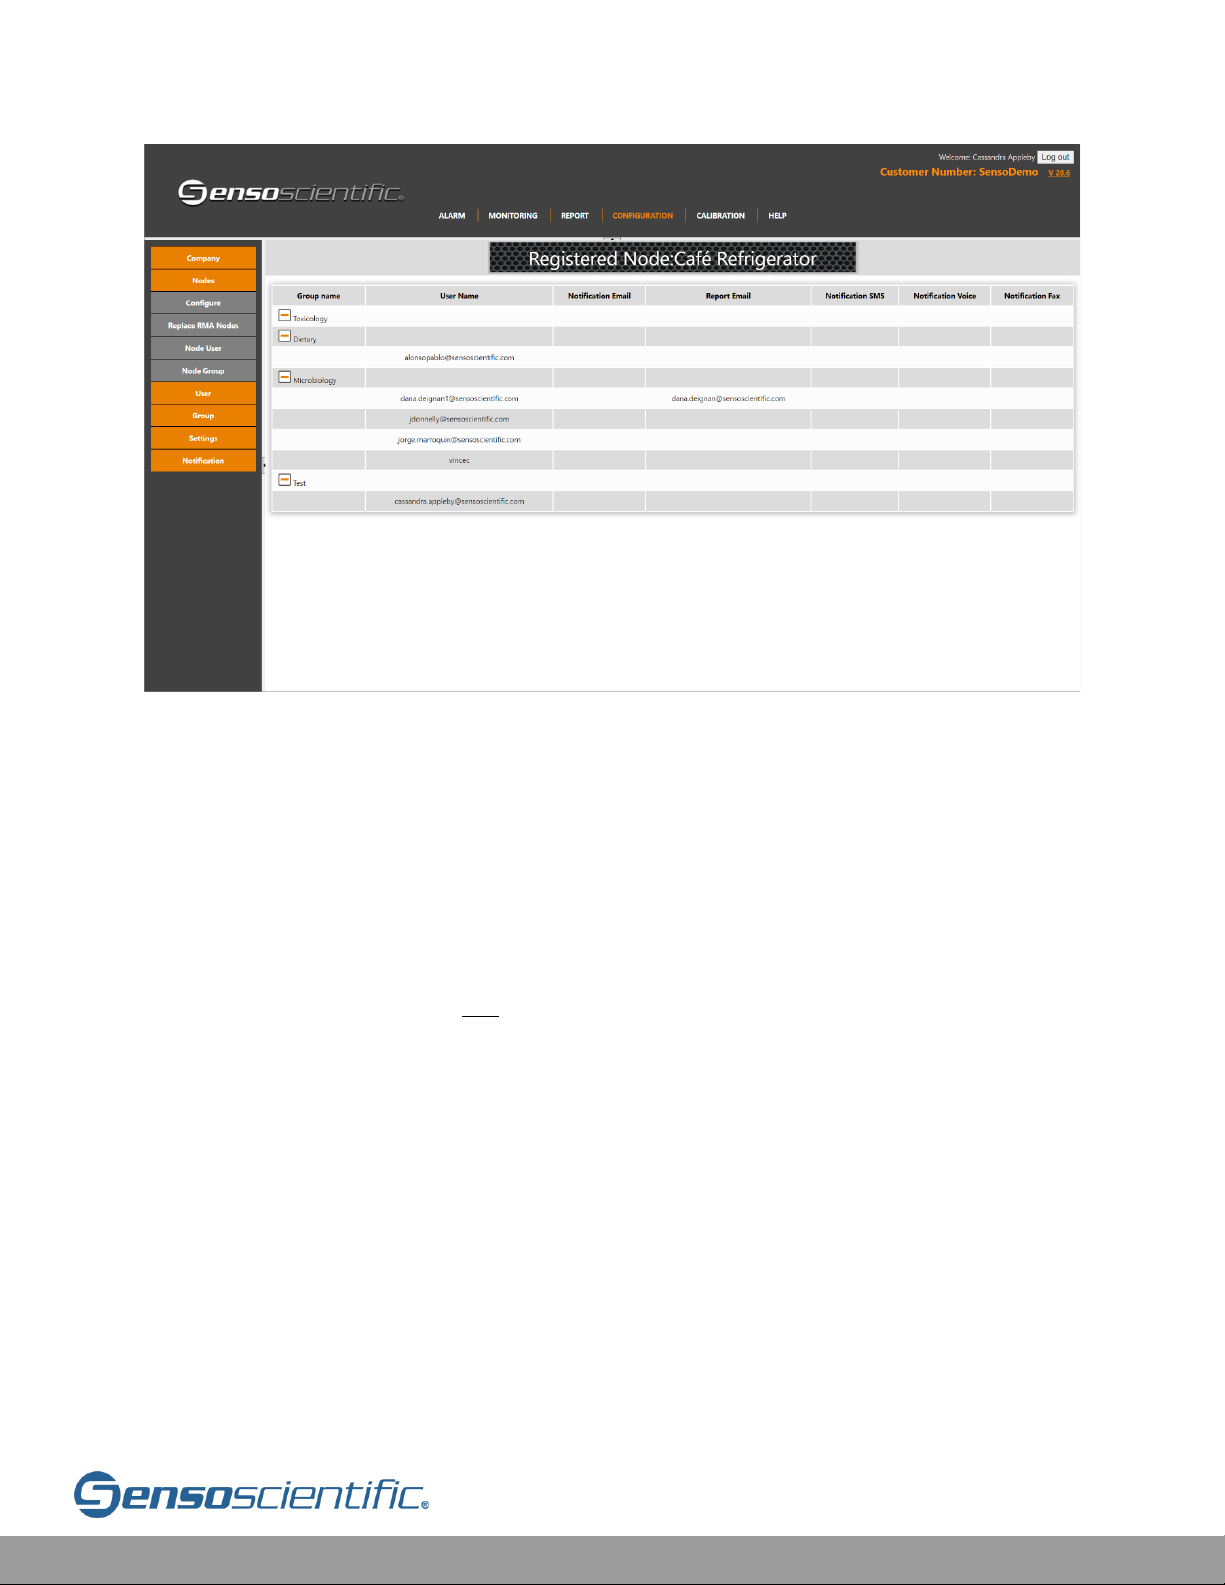
IV.5 Node Group
Navigate to CONFIGURATION > Nodes > Node Group.
This page allows you to select the node of choice, view its assigned groups, and
expand a list of users assigned to those groups.
Page 30
Cloud User Manual V20.6 30
Figure IV.5-1: Node Group – Groups and Users Associated with Selected Node
IV.6 Auto Refresh
This feature allows the user to select the time interval between refreshing the cloud
webpage. This is useful in scenarios where the user wishes to have the Current
Status page displayed on a monitor. With Auto Refresh enabled, the Current Status
page can be refreshed every 5, 10, 15, or 20 minutes
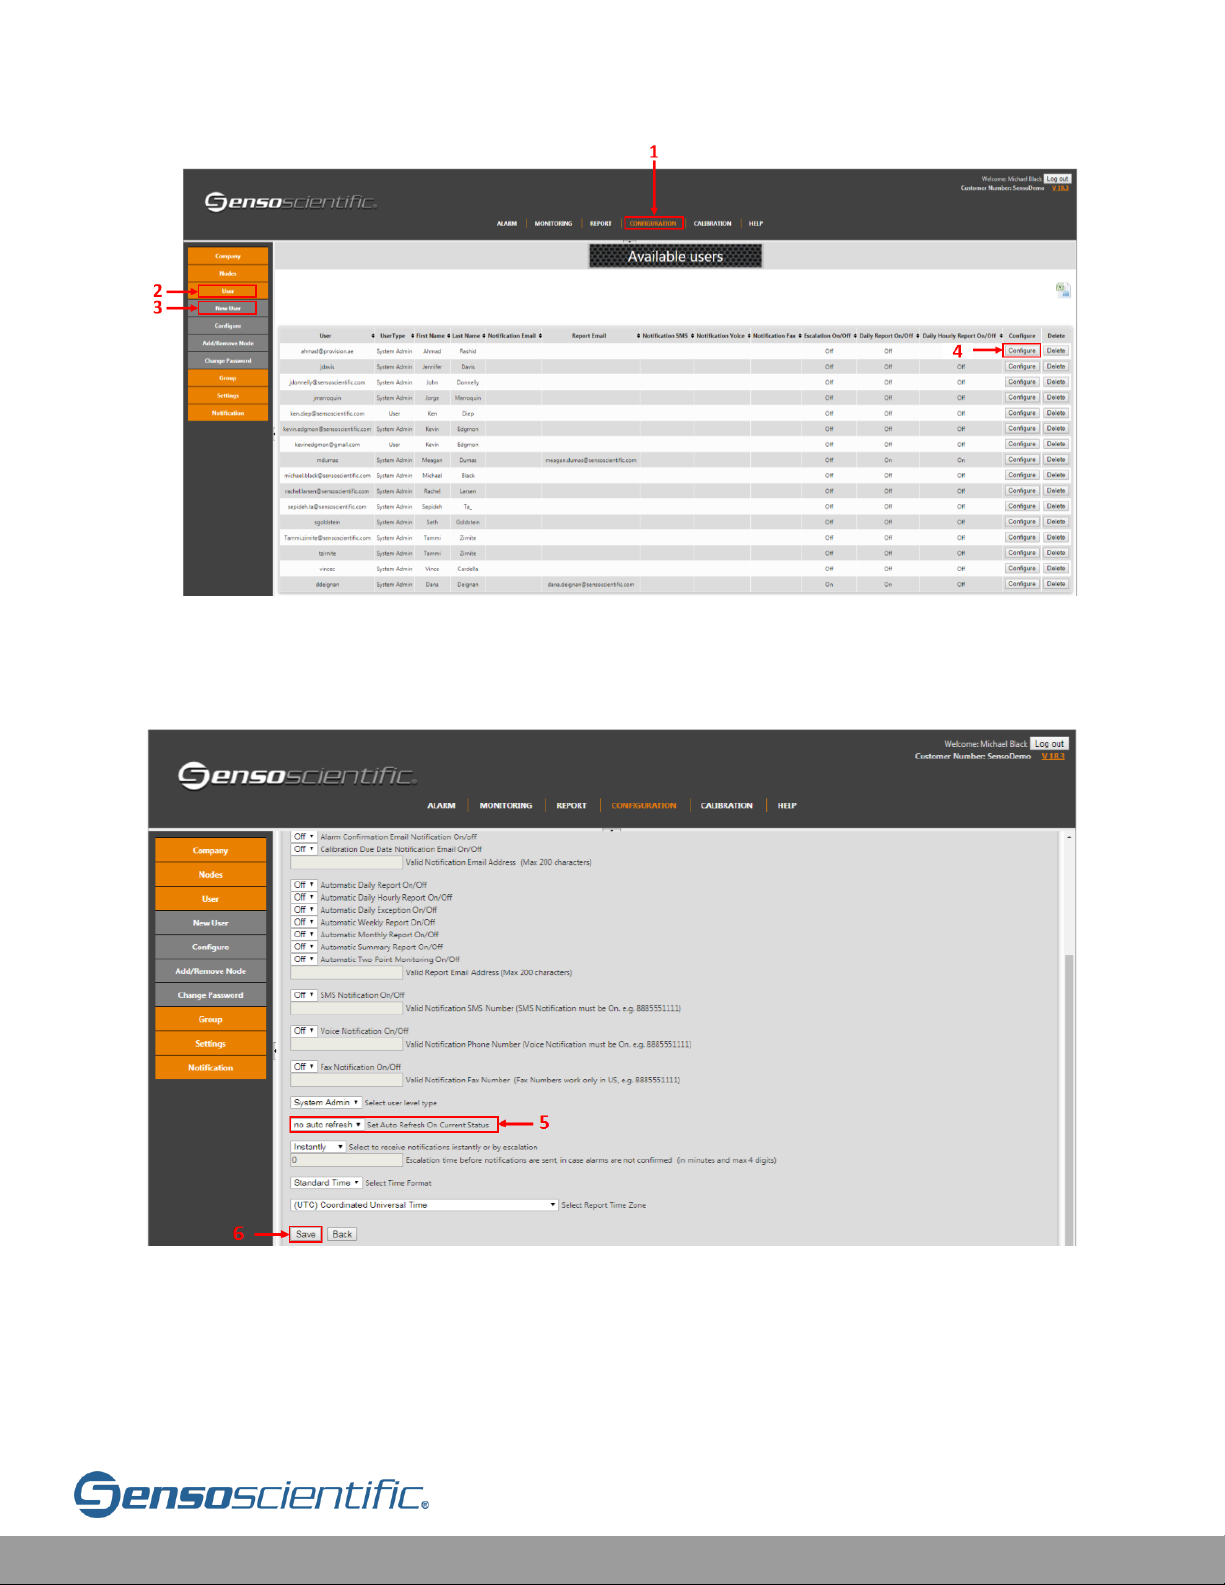
By default, Auto Refresh is not enabled, and the user will be logged out after 20
minutes of inactivity. To enable this feature, go to 1. CONFIGURATION > 2. User > 3.
Configure > 4. Select a user to Configure
Page 31
Cloud User Manual V20.6 31
Figure IV.6-1: User Configuration (Auto-Refresh)
5. Set Auto Refresh on Current Status > 6. Save.
Figure IV.6-2: Enable Auto Refresh (Change figure Number)
IV.7 Exception Report
Page 32
Cloud User Manual V20.6 32
By enabling the Exception Report, the system sends an email every day which only
contains the nodes that reported out of range data.
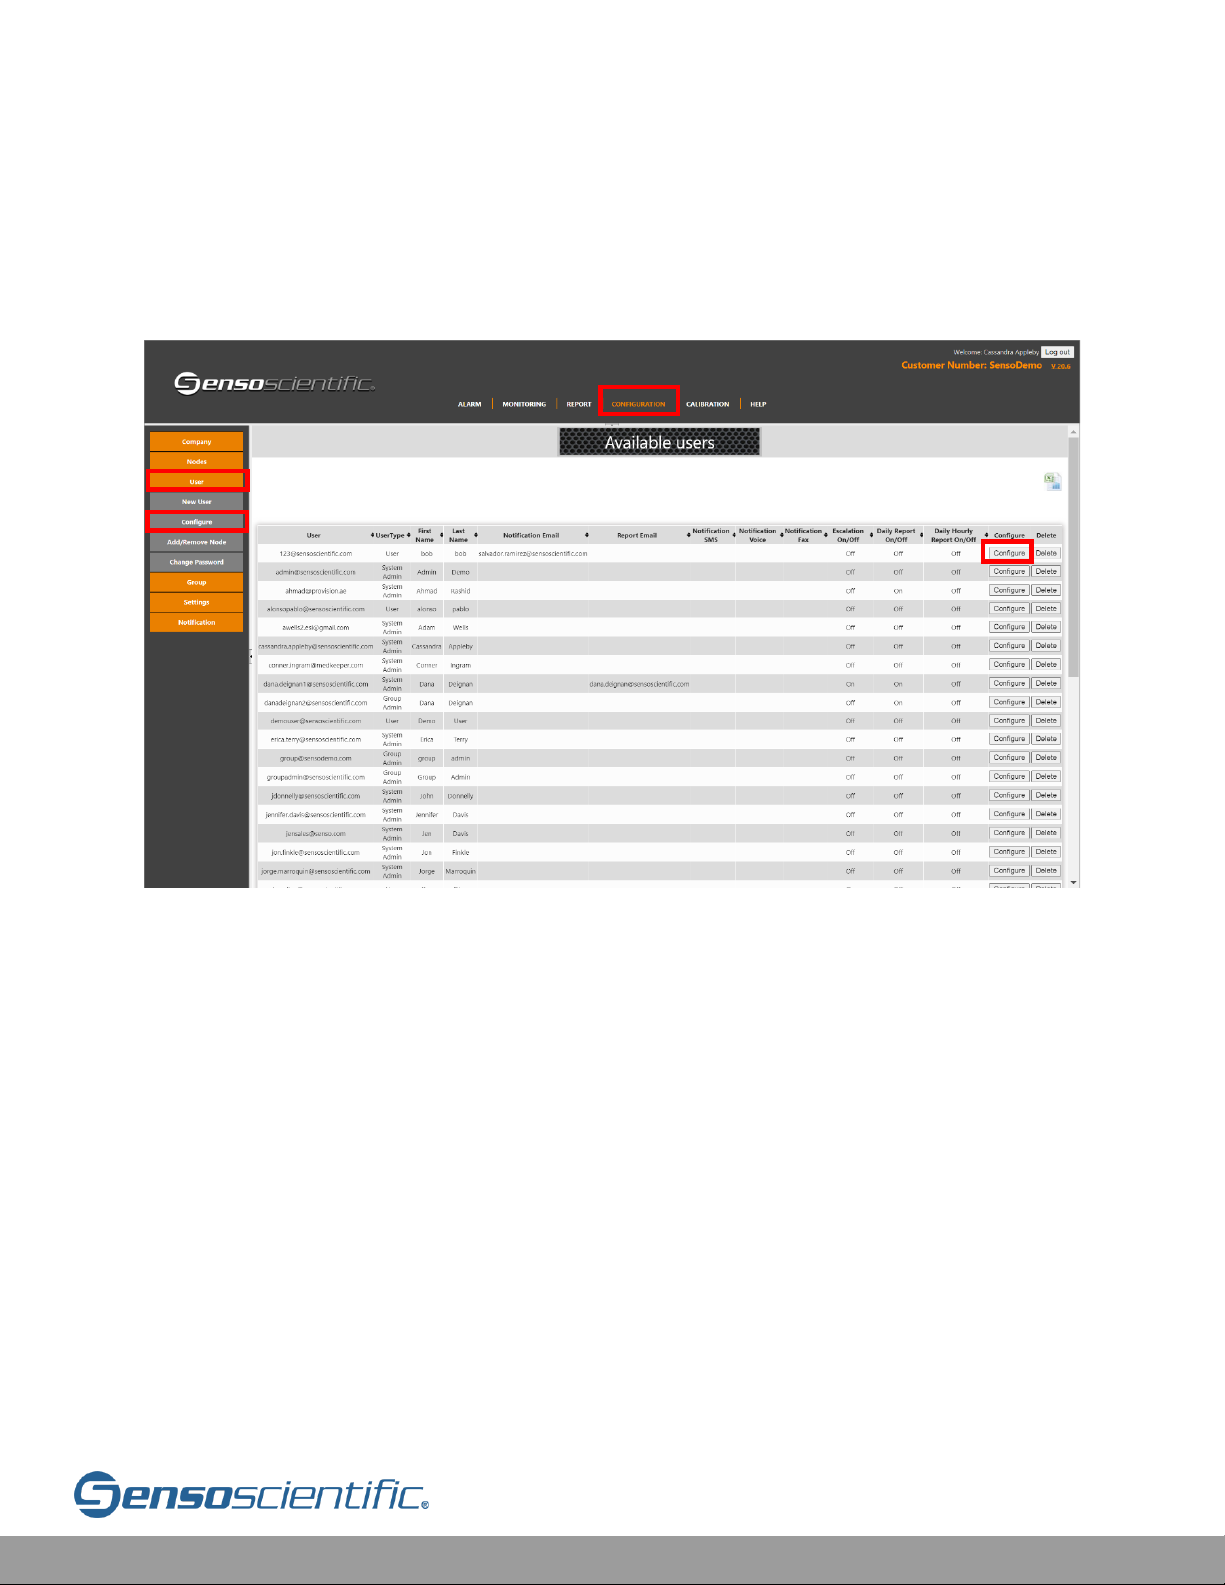
By default, the exception report is OFF for new users. To enable this feature, go to
1. CONFIGURATION > 2. User > 3. Configure > 4. Select a user to Configure.
Figure IV.7-1: Configure User (Exception Report)
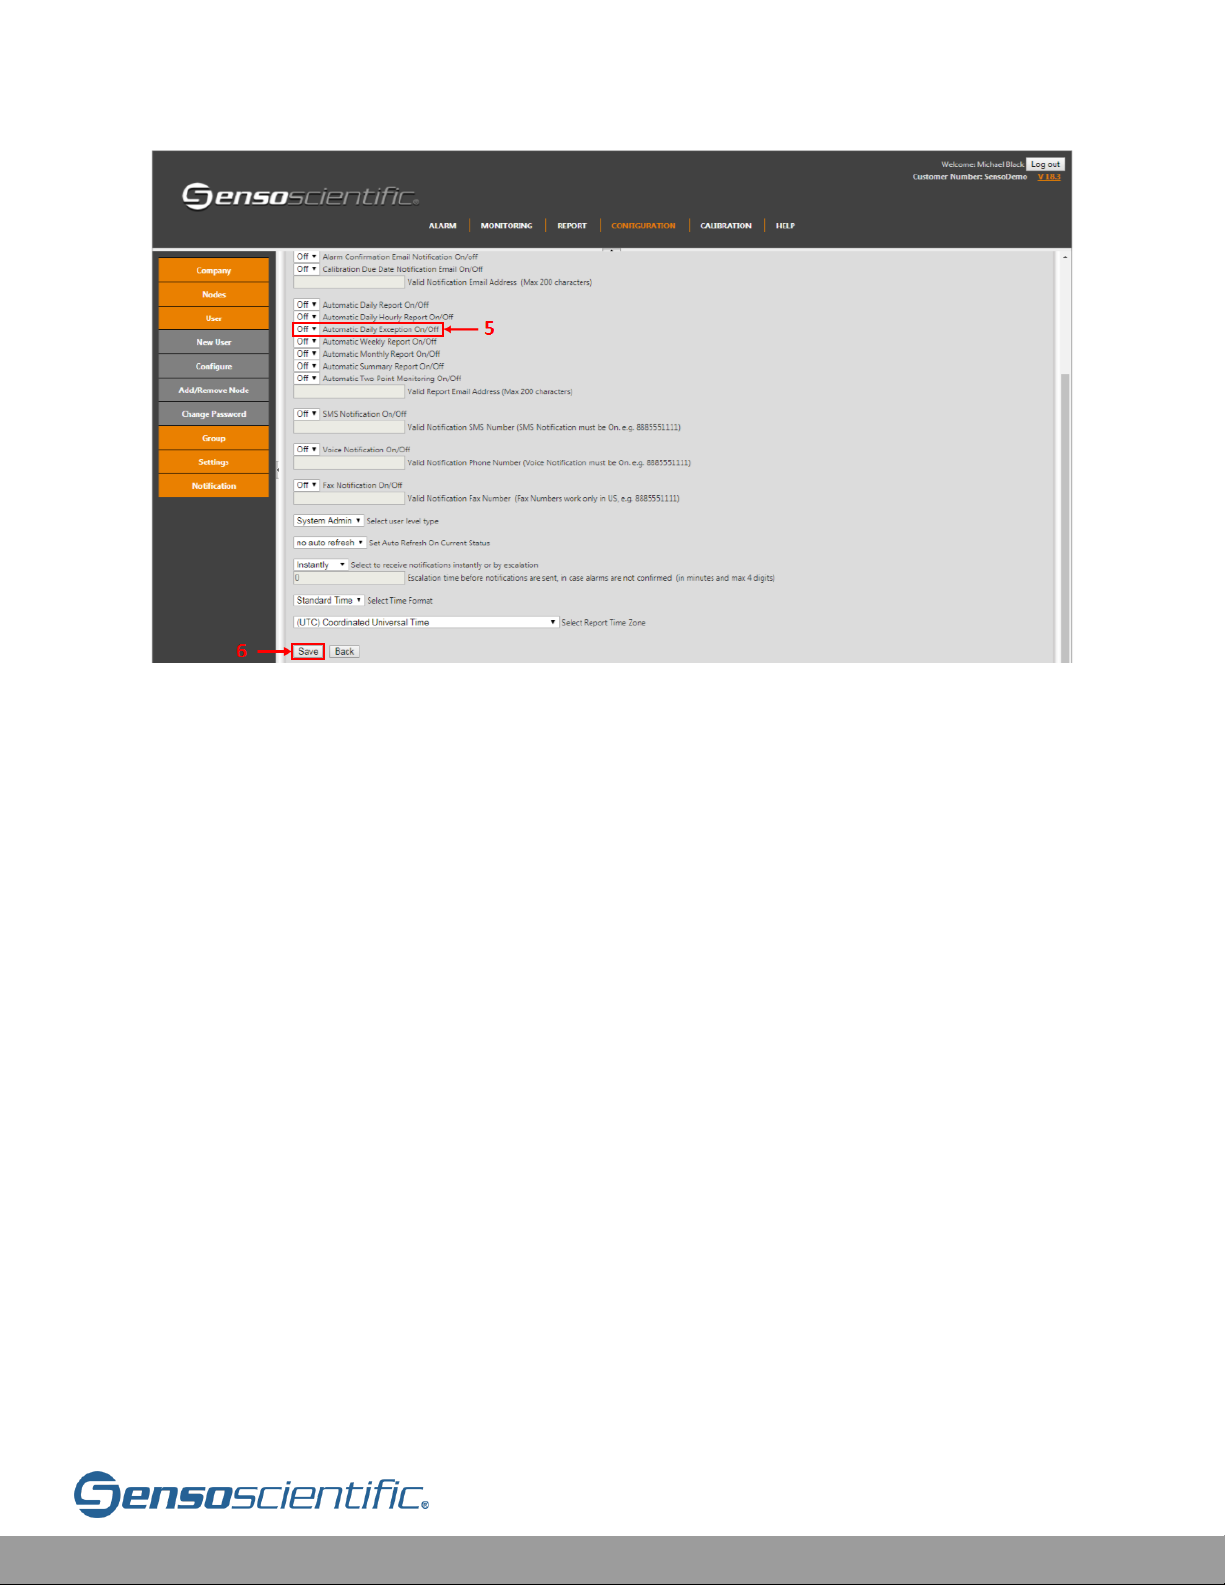
In the User Configuration screen, change 5. Daily Exception On/Off from Off to On
> 6. Save
1
2
3
4
Page 33
Cloud User Manual V20.6 33
Figure IV.7-2: Enable Exception Daily Report (Change figure Number)
IV.8 Password
IV.8.a Changing User Password
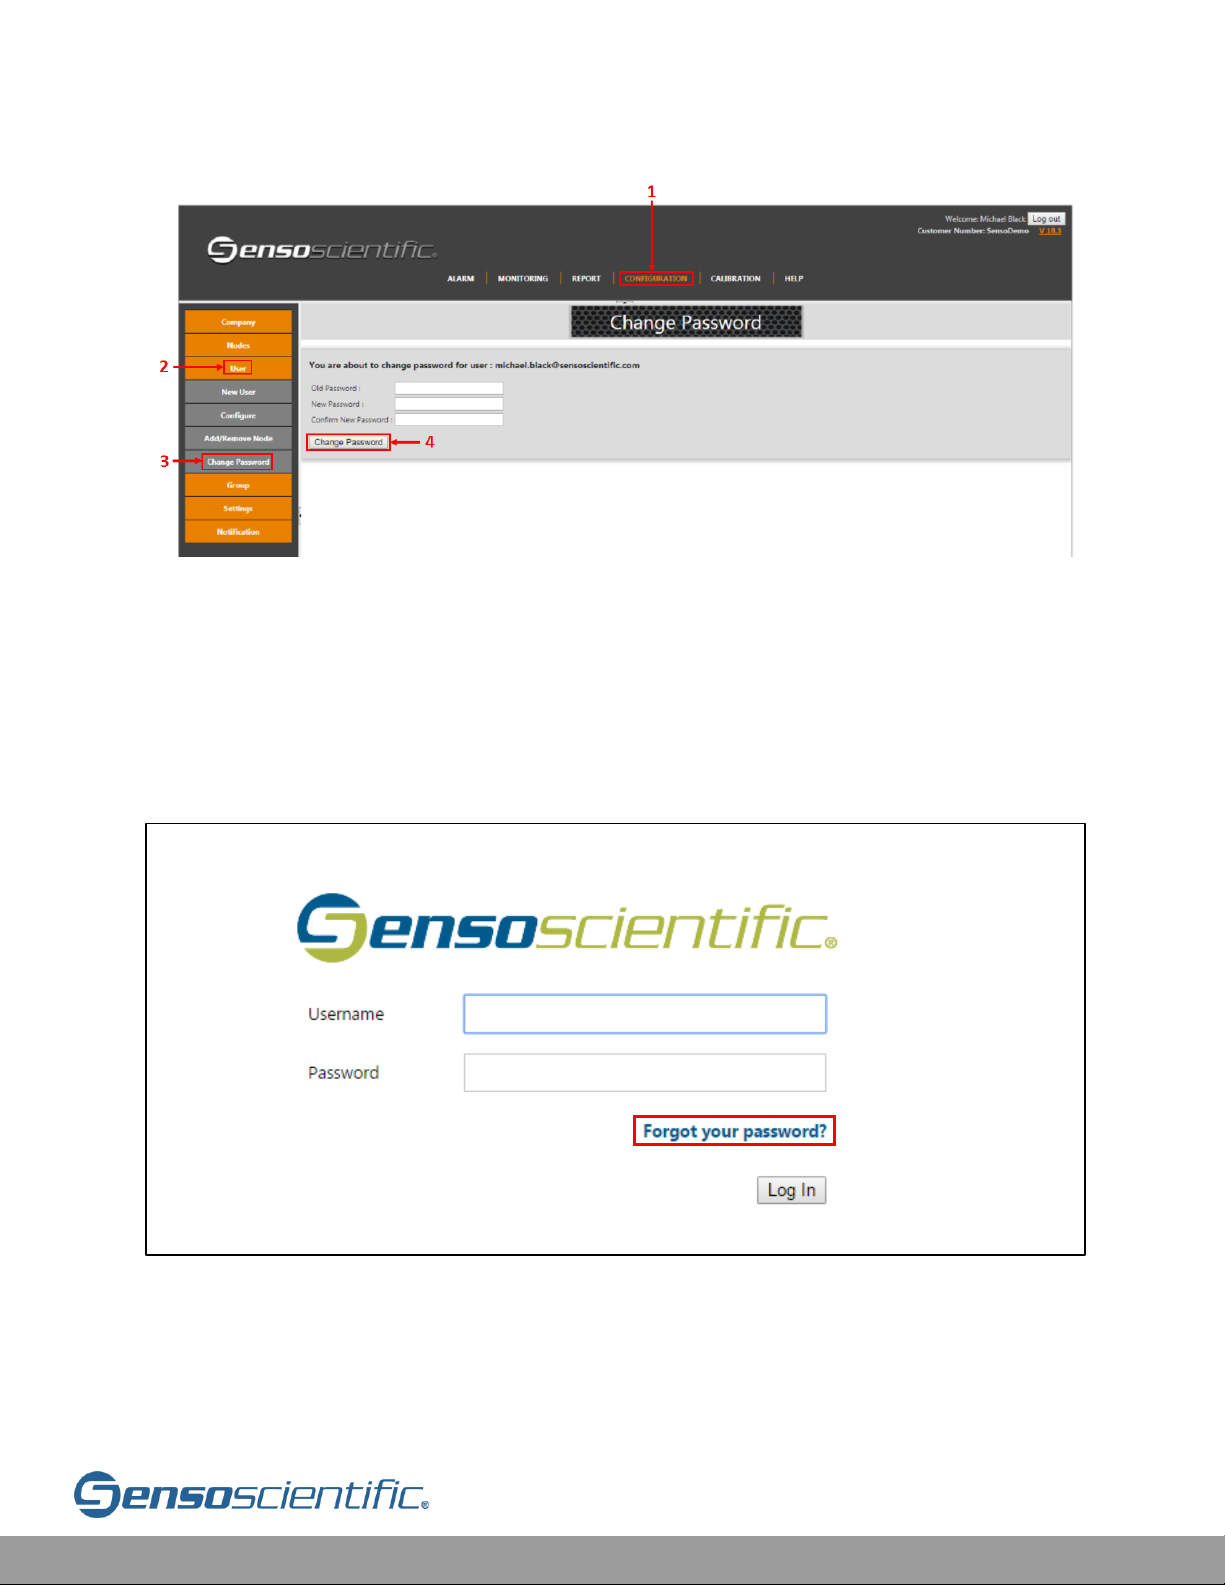
Click the main CONFIGURATION button, then, on the left side, click “User” from the
sub menu, followed by “Change Password” from the sub menu, fill in the fields and
click on “Change Password” button to save changes. Note: The password can only
be changed for the user logged in at that time.
Page 34
Cloud User Manual V20.6 34
Figure IV.8.a-1: Change Password
IV.8.b Reset User Password
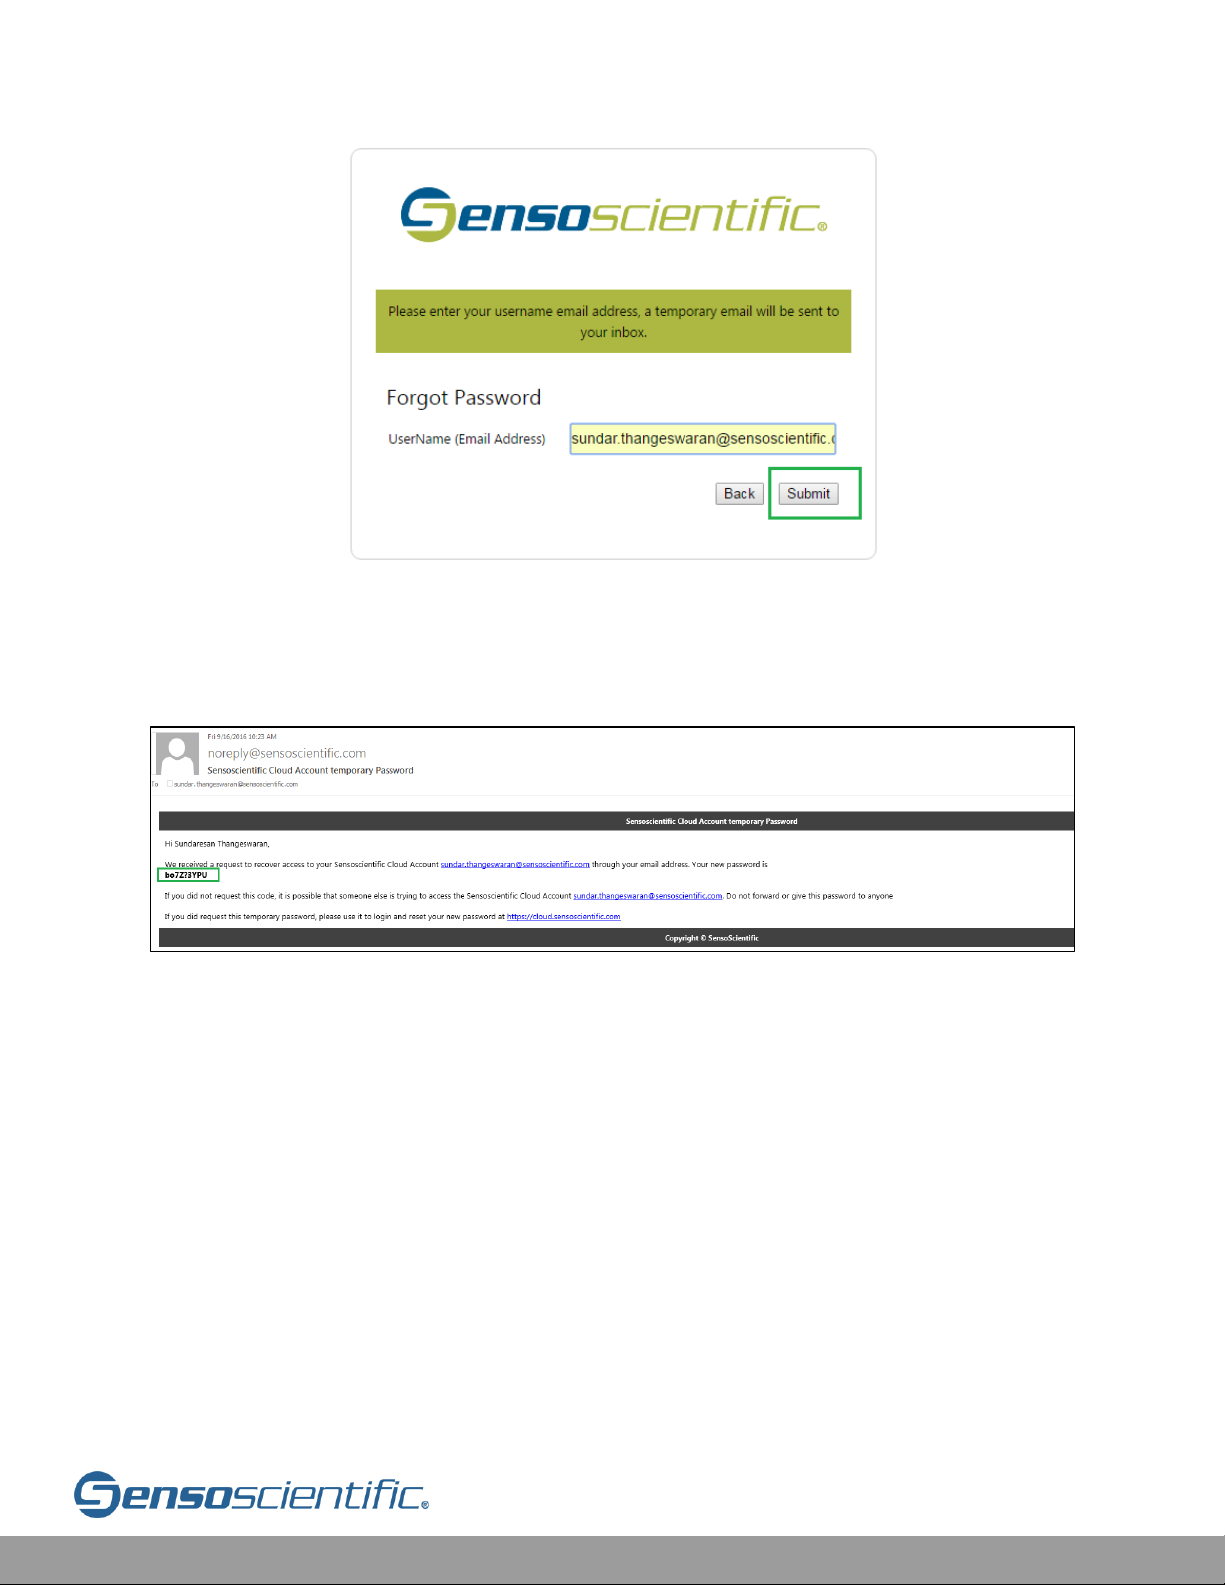
Password reset is available within the SensoScientific Cloud Portal Login. Note:
Username must be set as user email for this feature to work. To use this feature,
select the Forgot your password? Link above the “Log In” button.
Figure IV.8.b-1: Login
Input a UserName (Email Address) to submit a validated request for a temporary
password.
Page 35
Cloud User Manual V20.6 35
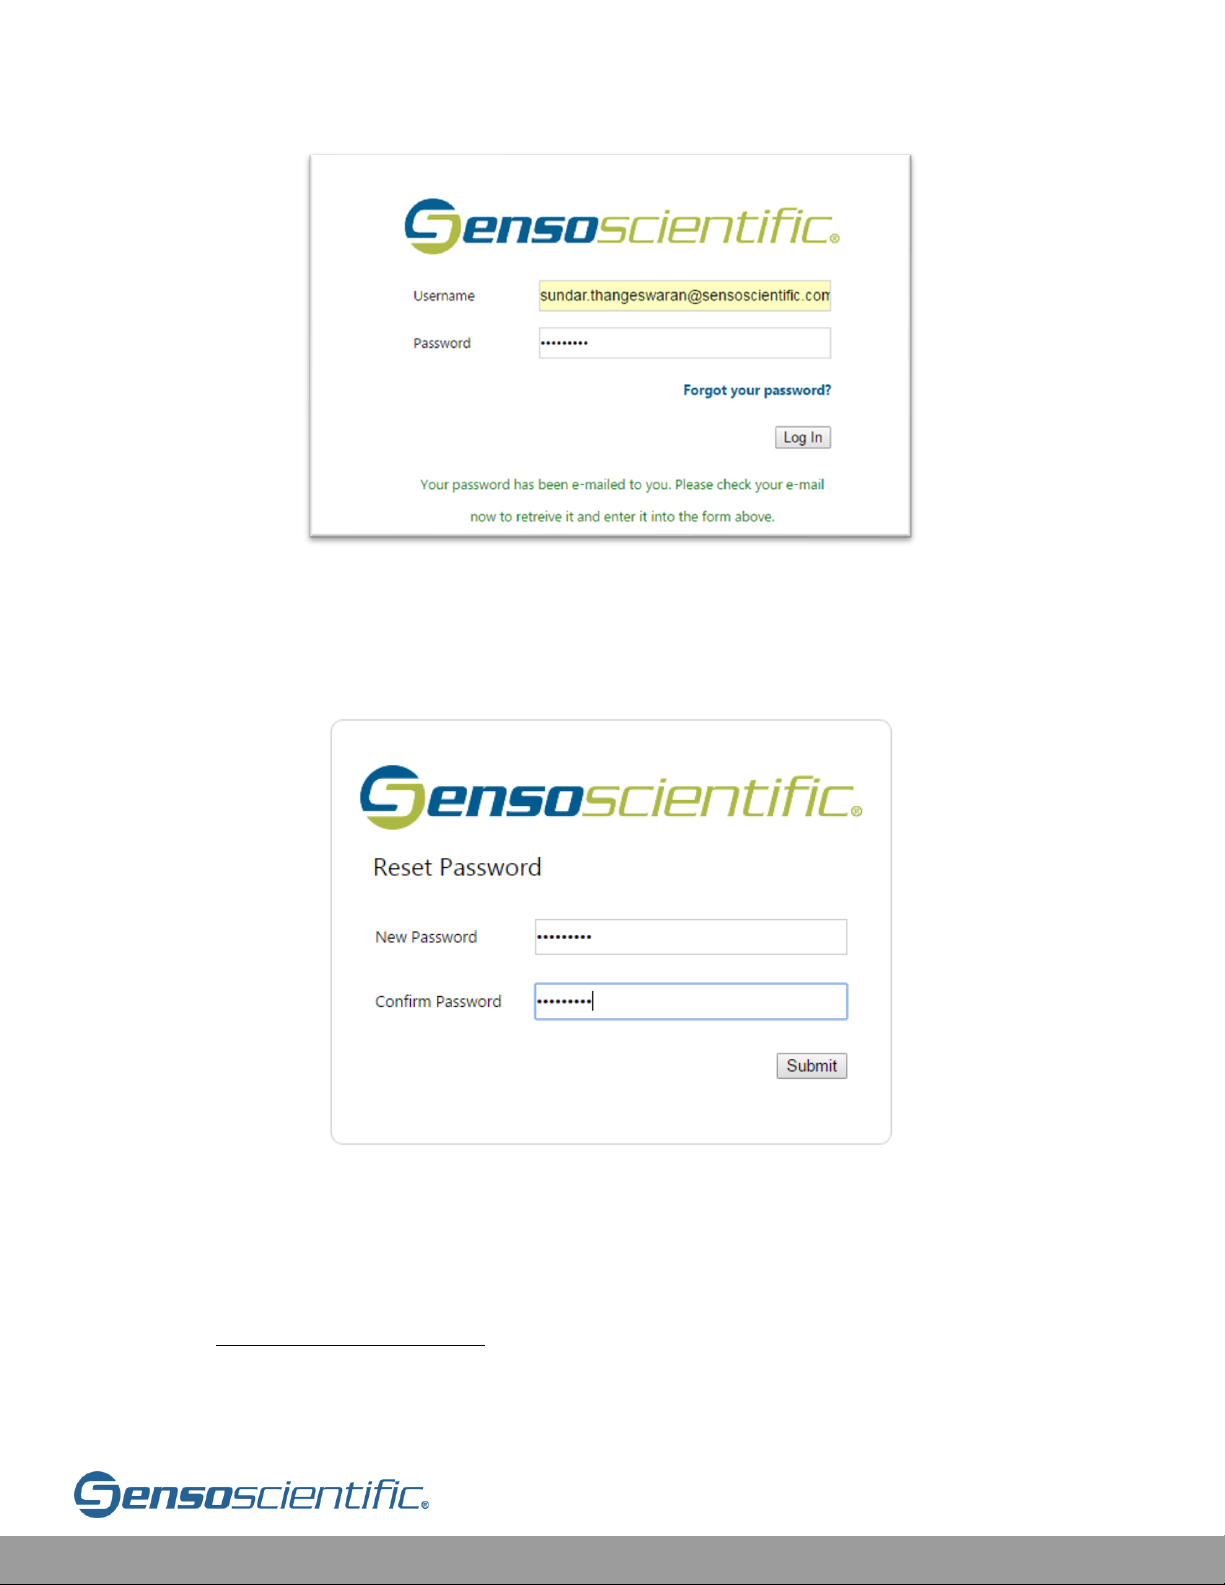
Figure IV.8.b-2: Forgot Password
An email will be sent to the email submitted or the notification email associated with
the username.
Figure IV.8.b-3: Temporary Password Email
Then use the temporary password to Log In.
Page 36
Cloud User Manual V20.6 36
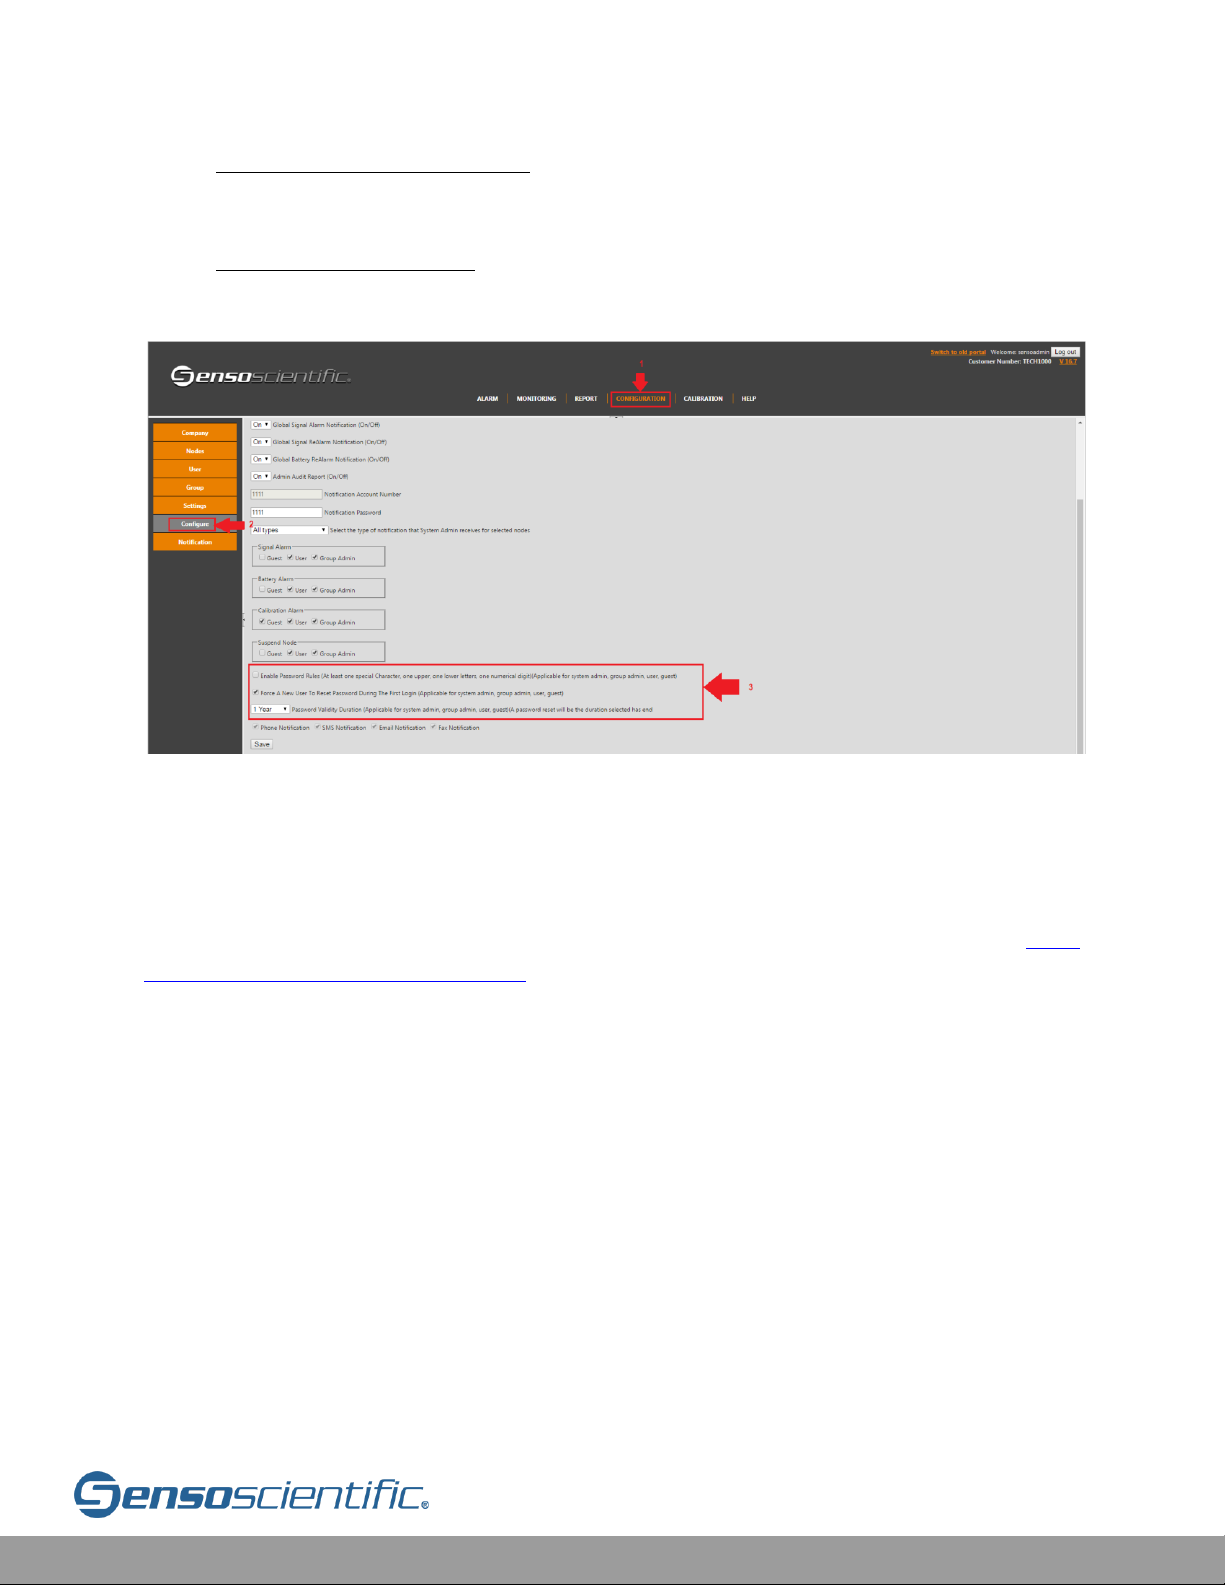
Figure IV.8.b-4: Use Temporary Password to Log In
Finally, a password reset prompt will show up upon initial login. Then, create a new
password that will be used for this username.
Figure IV.8.b-5: Reset Password
In addition, forced password reset options are available to be set up by System
Administrators within CONFIGURATION > Settings > Configure.
Forced Password Reset: Users will be required to create a new password
during the first login into a newly created user account.
Page 37
Cloud User Manual V20.6 37
Password Validity Duration: Set an interval for users that, when expired,
requires password reset.
Enable Password Rules: Password complexity requires one upper case letter,
one lower case letter, and one numeric character.
Figure IV.8.b-6: Password Settings
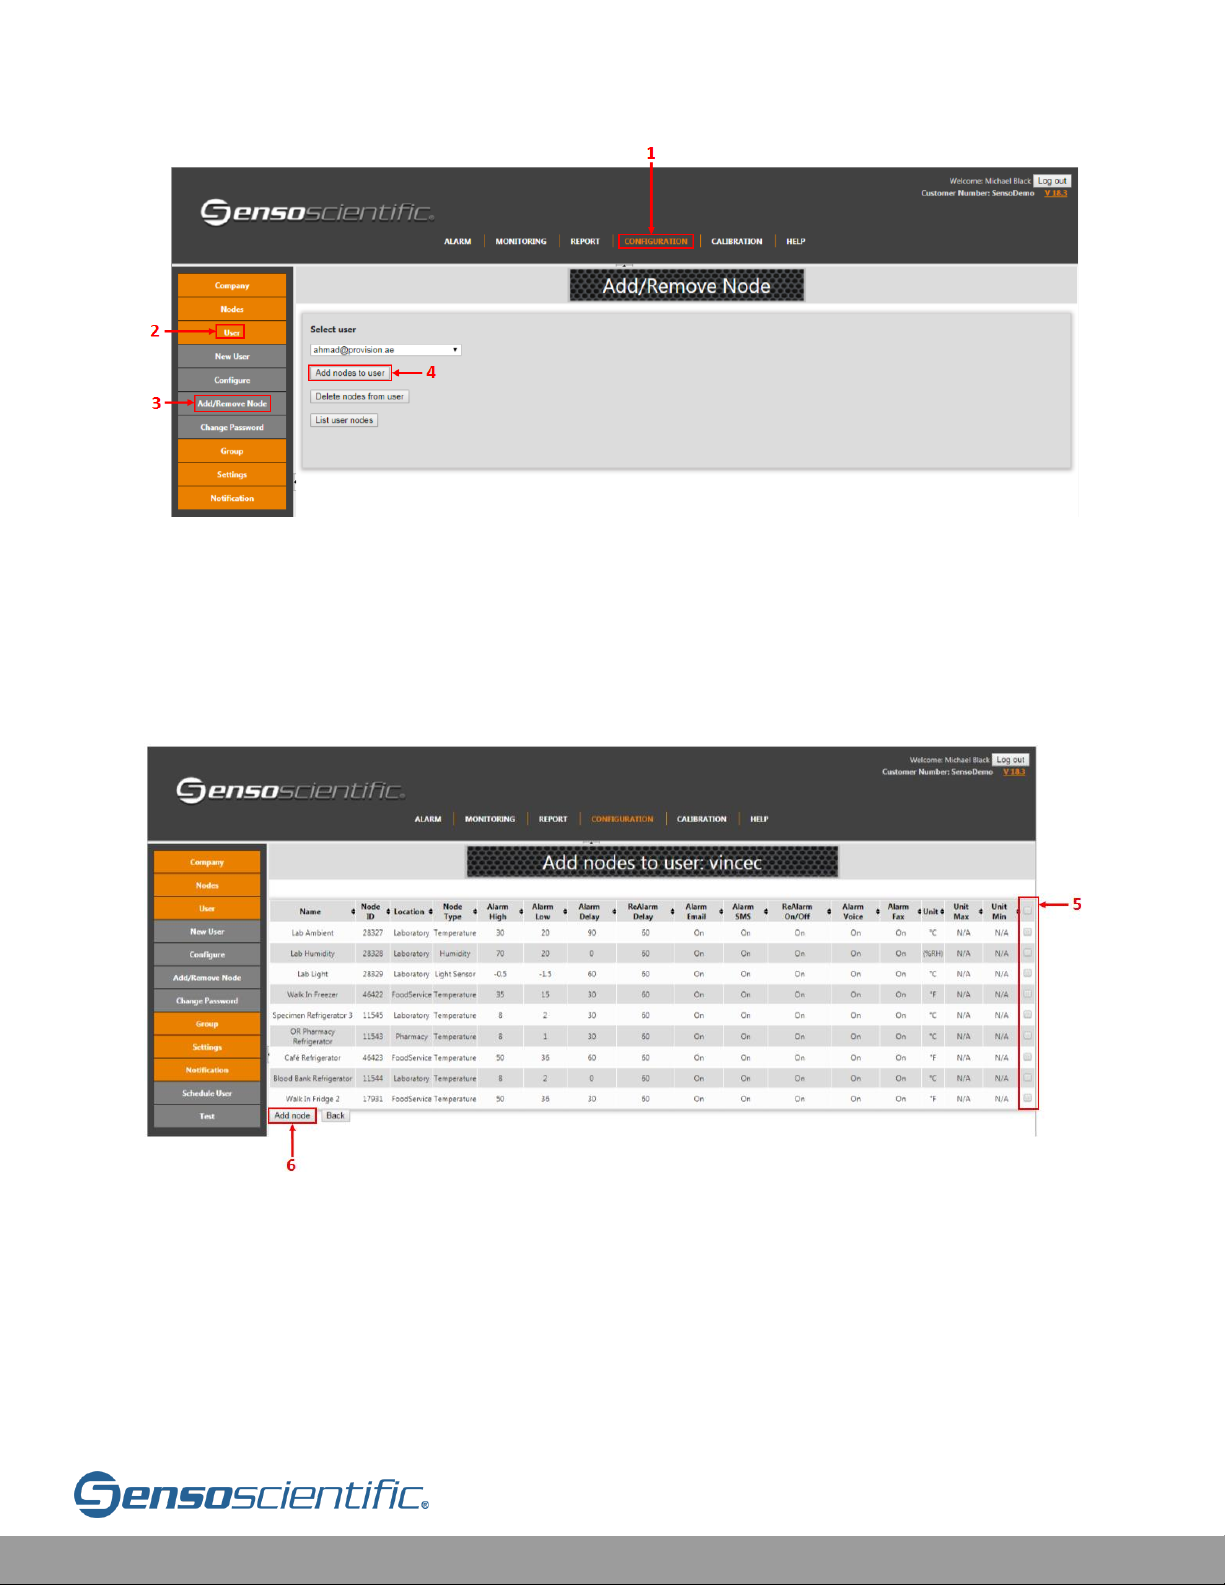
IV.9 Add/Remove Nodes
This feature allows for the System/Group Administrators to add or remove nodes
with respect to Users. Nodes can also be removed from groups (See IV.11
Add/Remove Nodes from Groups). Click the main “CONFIGURATION” button and
then select “User” from the sub menu. Select “Add/Remove Nodes”, and the page
will display a drop-down menu where users can be selected. The nodes of the
selected user can be listed, added, or removed (deleted). After selecting the user,
choose from one of the three choices. To Add Nodes, click on the “Add nodes to
user” button and a list of nodes that are currently registered to the system will be
displayed on this page.
Page 38
Cloud User Manual V20.6 38
Figure IV.9-1: Add/Remove Node
Choose to add ALL nodes listed or assign selected nodes. Notice on the right top
corner of the list (in the image below) the box with a check mark selected. To add ALL
nodes, select the box. Or, check the box of only certain nodes if not all need to be
added. When completed, click “Add node”.
Figure IV.9-2: Add Node
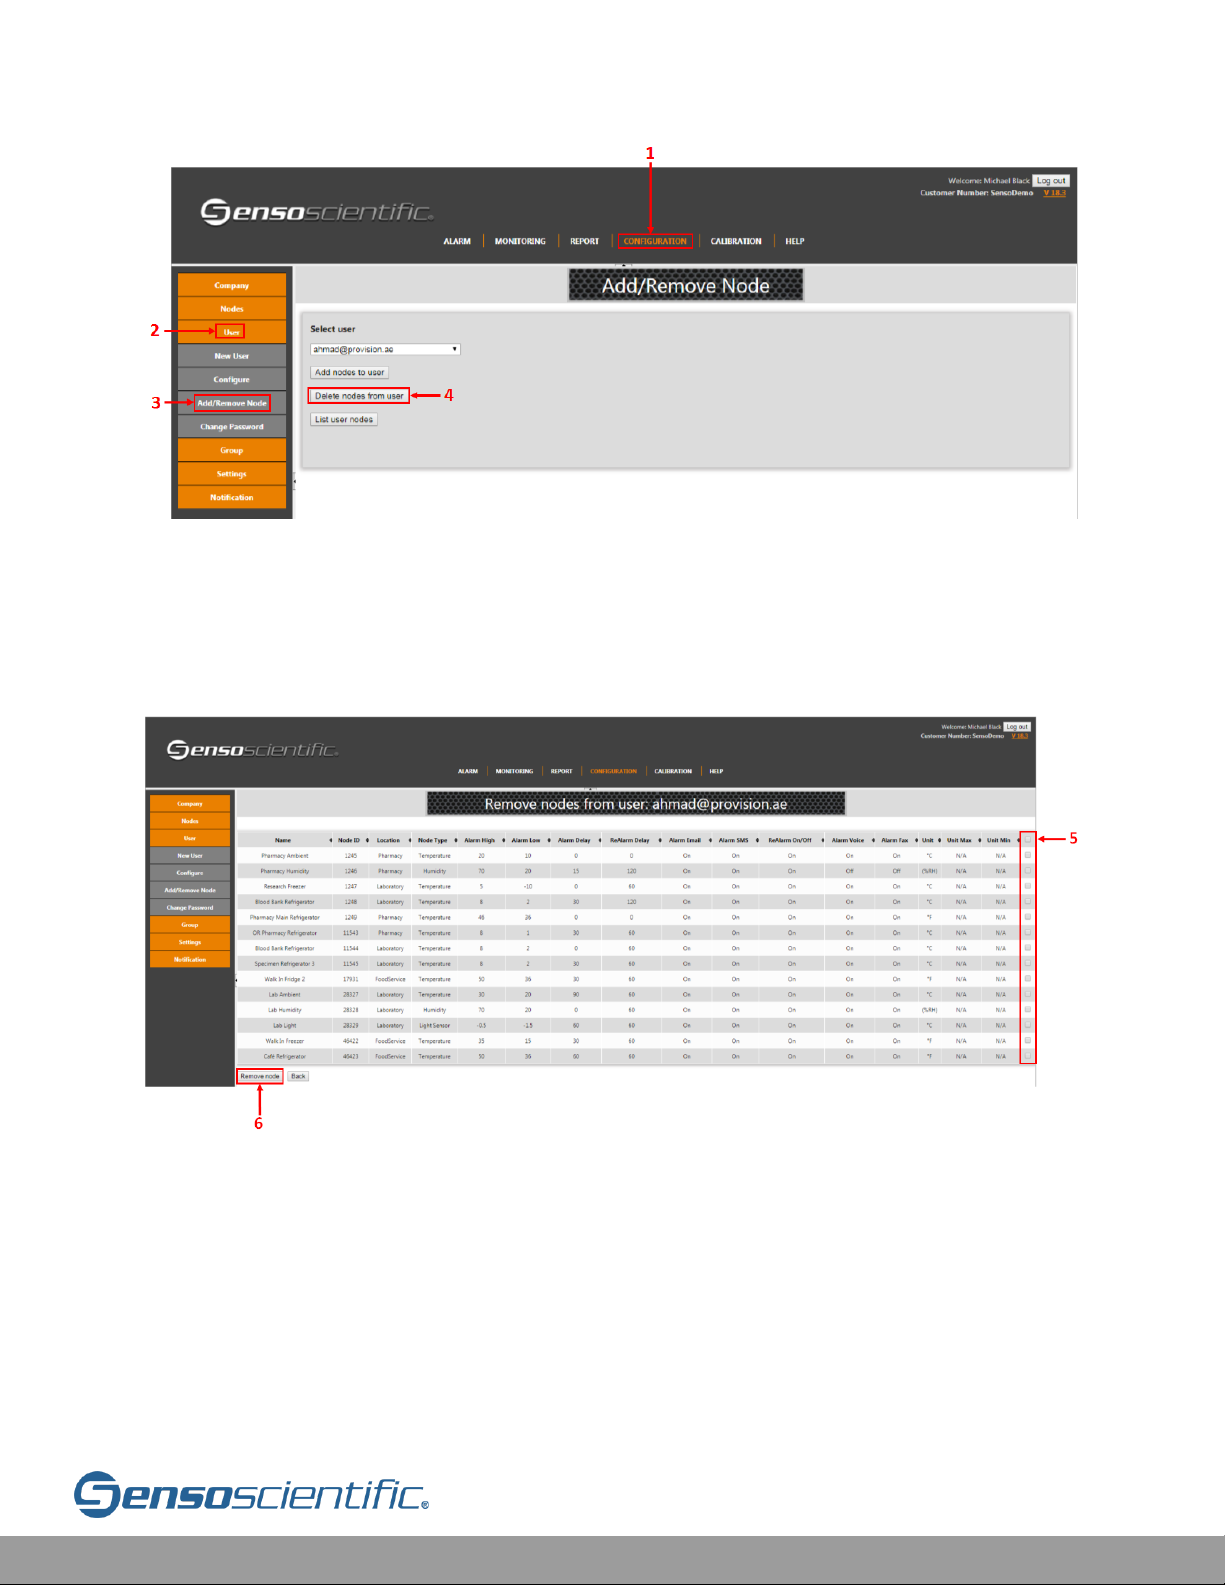
To delete nodes, click on “Delete node from user” and a list of all nodes will display.
Page 39
Cloud User Manual V20.6 39
Figure IV.9-3: Add/Remove Node
To delete ALL nodes listed or delete selected nodes. Notice on the top-right
corner of the list, this selects all nodes. Individual nodes can be selected by checking
off each box. When completed, click “Remove node” on the bottom of the page.
Figure IV.9-4: Remove Node
Clicking the “List user node” button displays the nodes the user has registered to
their account.
Page 40
Cloud User Manual V20.6 40
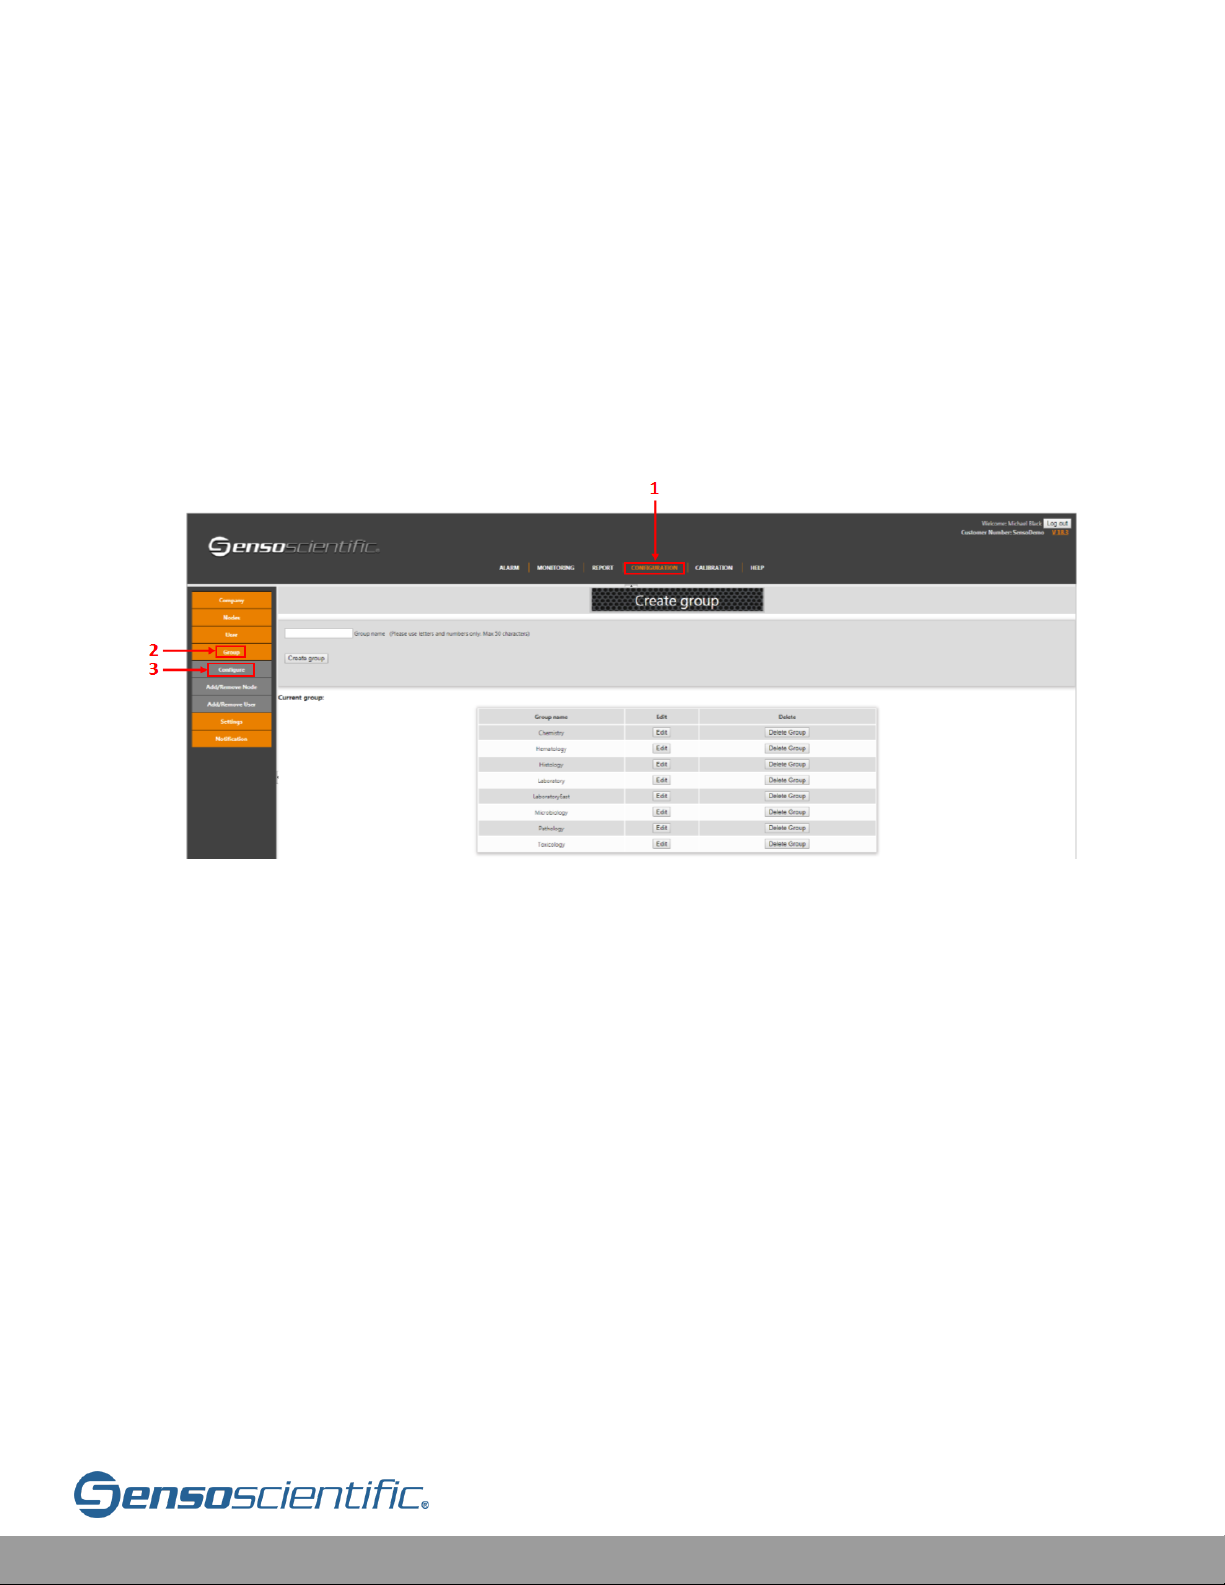
IV.10 Creating Groups
Creating groups allows for the system administrator to group both nodes and users
together that will be monitoring the same nodes (i.e. pharmacy, laboratory, nutrition,
etc…). To create a new group, select CONFIGURATION from the main menu, select
“Group” from the left sub menu, and click on “Configure”. Type in the name of the
group and complete by clicking “Create group”. Other created ground will display on
the “Create group” page. To delete the group, simply click the “Delete Group”
button.
Figure IV.10-1: Create Group
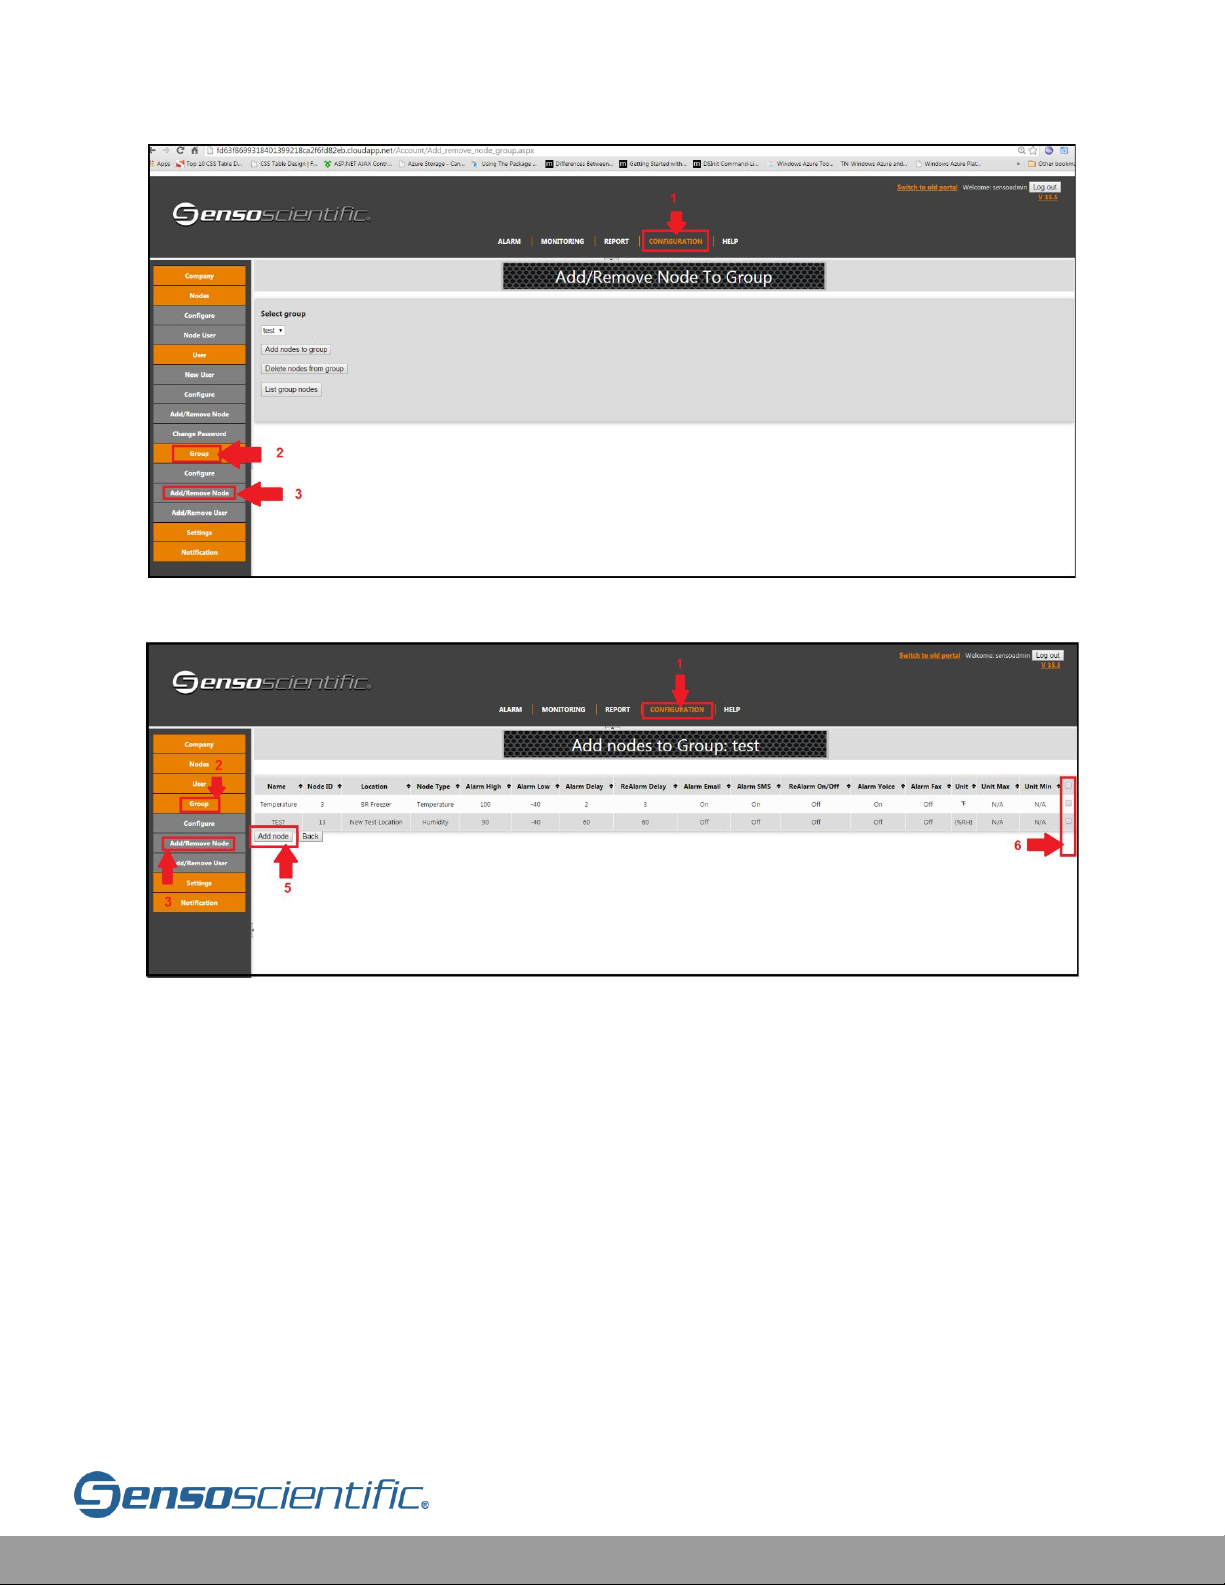
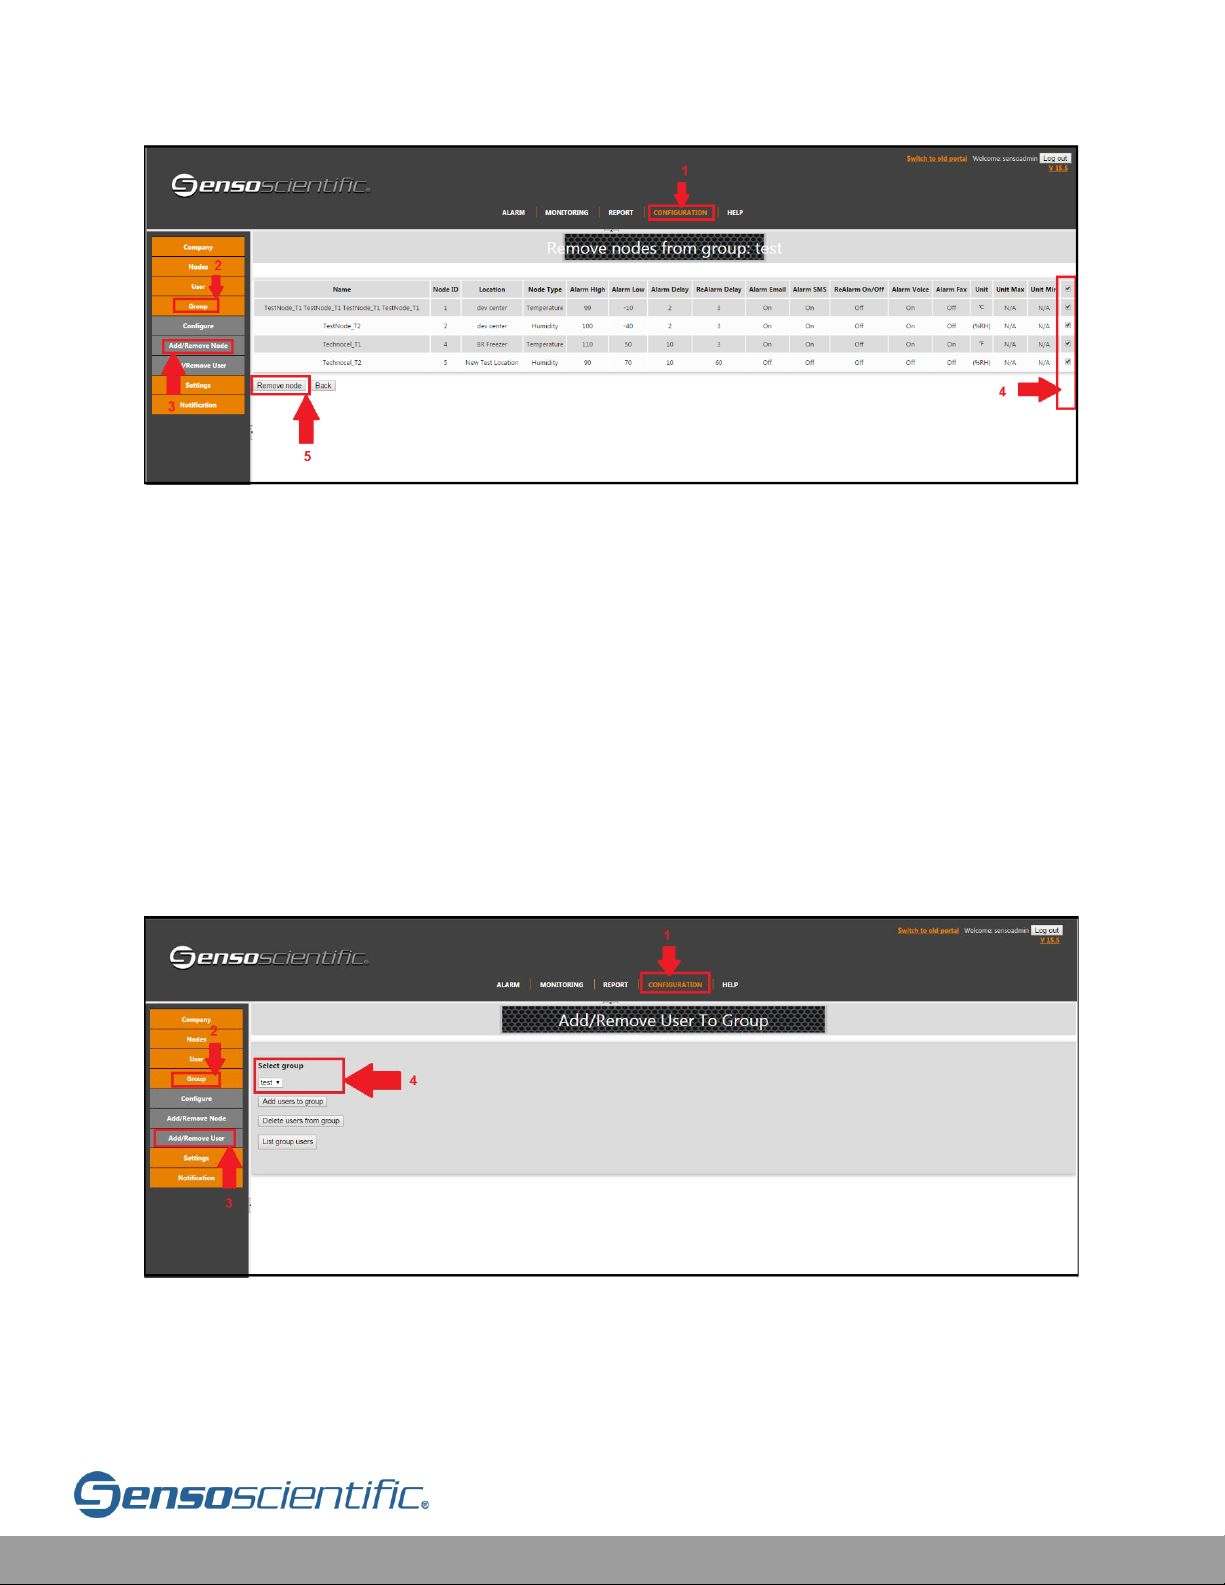
IV.11 Add/Remove Nodes from Groups
To add or delete nodes, select CONFIGURATION from the main menu, click “Group”
from the left sub menu, followed by “Add/Remove Node.” Select a group in which
nodes will be added by selecting from the drop-down list. After selecting the group,
click on one of the three choices displayed (Add nodes to group/Delete nodes from
group/List group nodes).
When adding nodes, all nodes can be selected by checking off the box on the top
right-hand corner of the list. Select individual nodes to add to the group by checking
boxes one by one. Complete the process by clicking the “Add node” button at the
bottom-left of the page.
Page 41
Cloud User Manual V20.6 41
Figure IV.11-1: Add Remove Node to Group
Figure IV.11-2: Adding Nodes to Group
If nodes are to be deleted, follow the same process and complete by clicking the
“Remove node" button.
Selecting “List Group Nodes” will display all nodes registered in that particular group
to delete.
Page 42
Cloud User Manual V20.6 42
Figure IV.11-3: Removing Nodes from Group
IV.12 Add/Remove Users from a Group
To add or delete users in a group, select CONFIGURATION from the main menu, and
then click “Groups” from the left sub menu, followed by “Add/Remove user”. Select
which group to add or delete users in the drop-down menu. After selecting the group,
click on one of the three choices displayed (Add users to group/Delete users from
group/List group users). In order to add users, Select the Group in the dropdown
and press the “Add users to group” button. Select or deselect users by checking off
the box on the top right-hand corner of the list. Individual users can be selected to
add to the group, complete process by clicking “Add user.”
Figure IV.12-1: Selecting Group
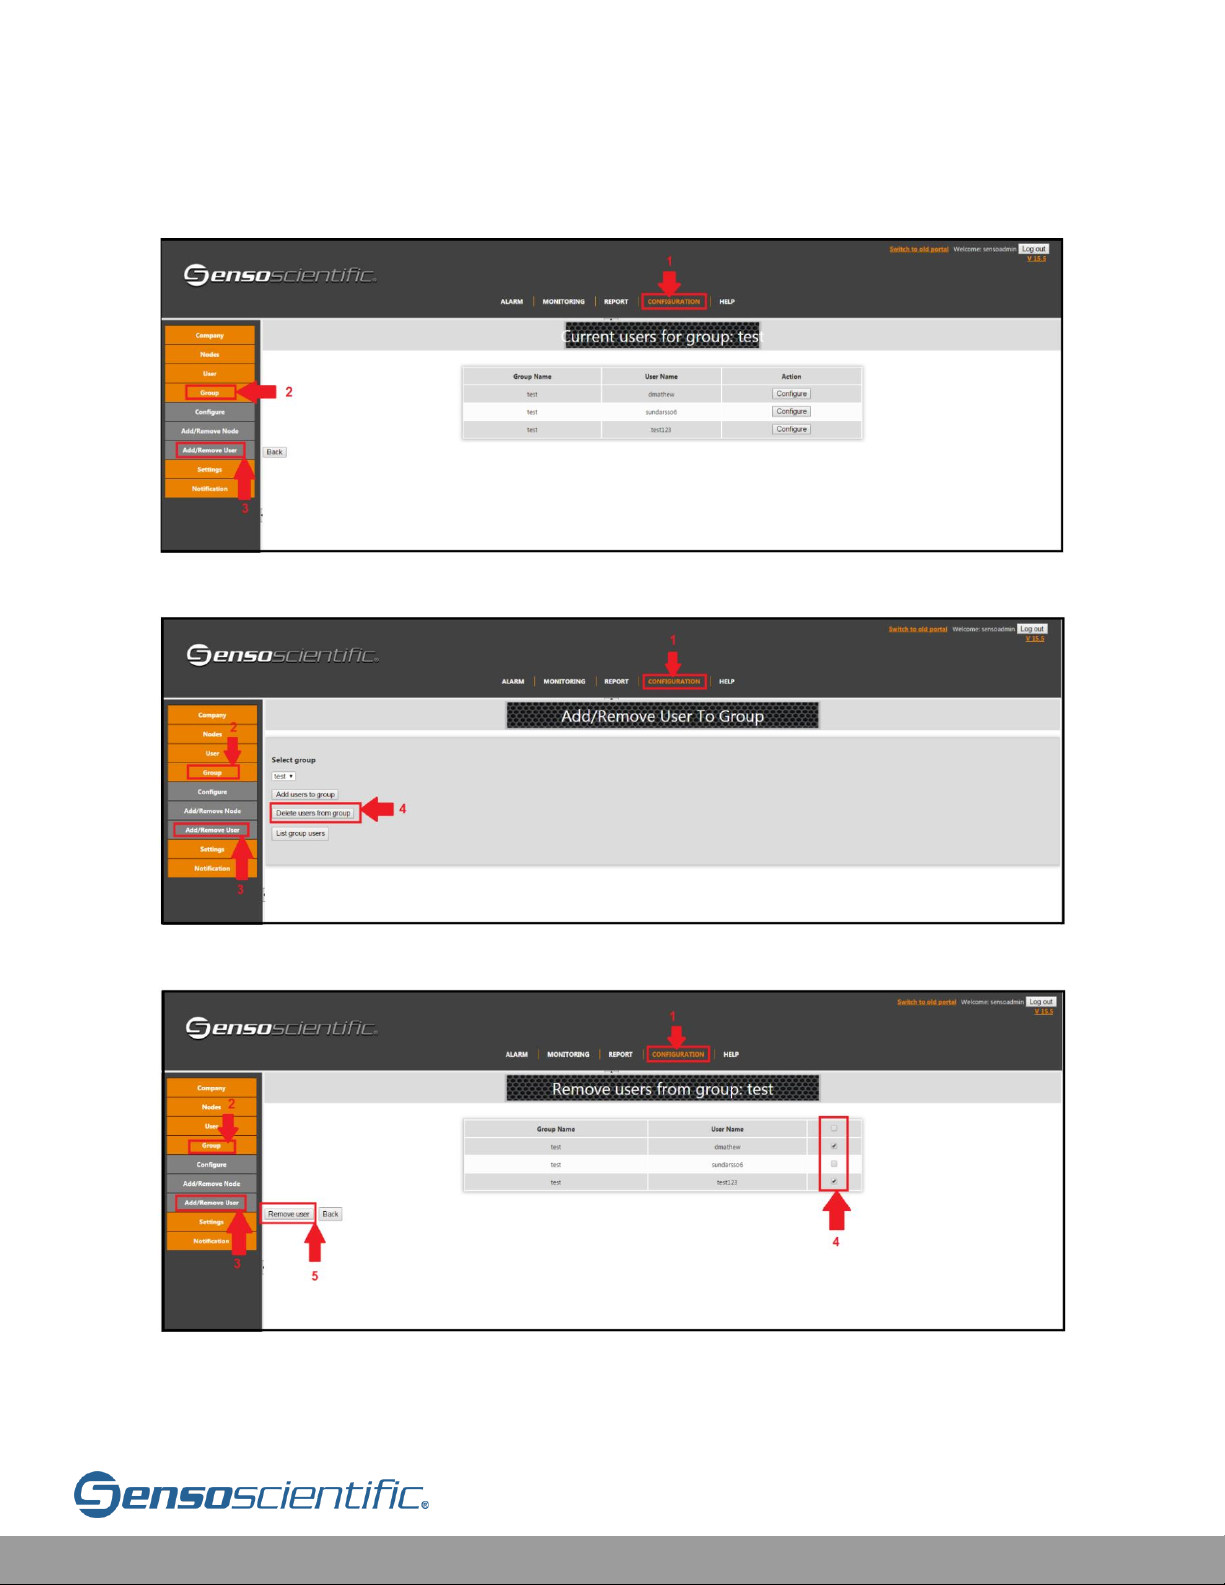
To delete users, select “Delete user from group”. In the next page, select or deselect
individual user(s) to be deleted from the group. Complete the process by selecting
Page 43
Cloud User Manual V20.6 43
“Remove user” at the bottom-left of the page. Selecting “List group users” will
display all users registered in that particular group.
Figure IV.12-2: Group Display
Figure IV.12-3: Deleting users from group
Figure IV.12-4: Registered Nodes removal from Groups
Page 44
Cloud User Manual V20.6 44
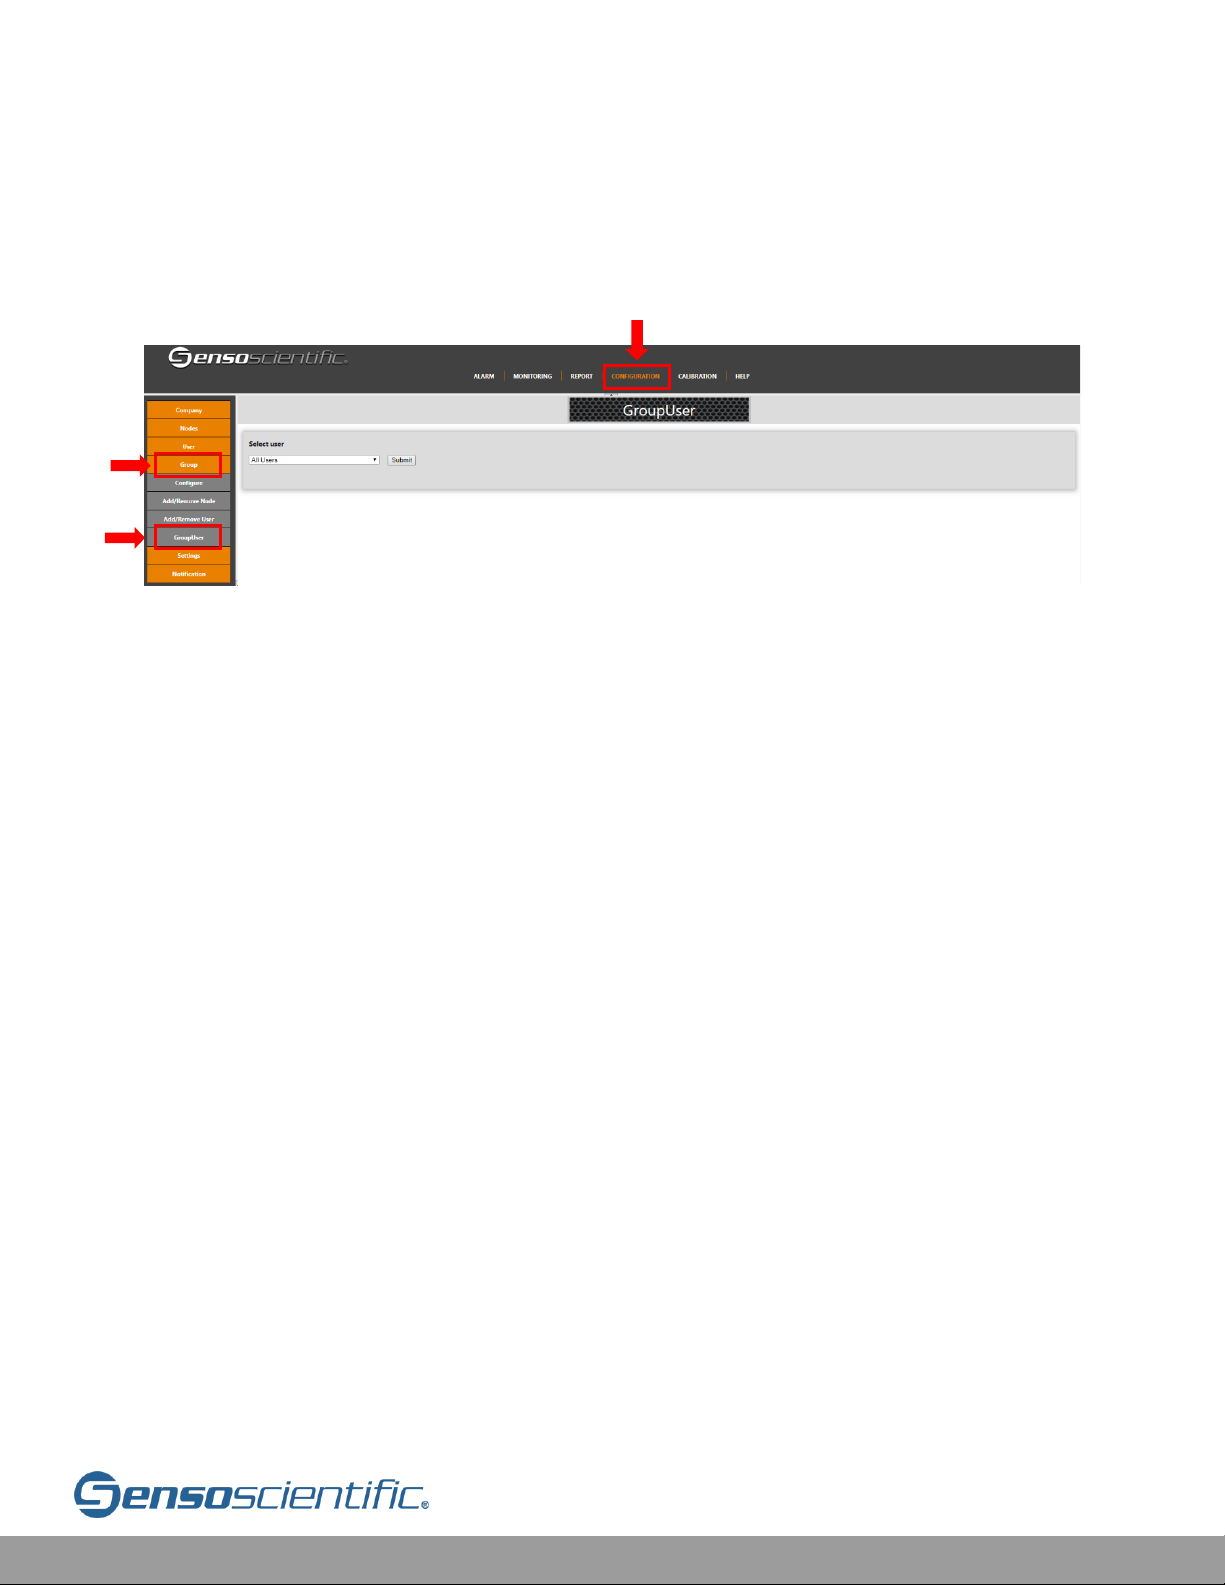
IV.13 Show Group User
Select CONFIGURATION from the main menu. Click on “Group” and select
“GroupUser”. This page will let you select a user of choice and view the groups this
user is assigned to.
Figure IV.13-1: GroupUser
IV.14 Settings
Select CONFIGURATION from the main menu, click on “Settings” from the left sub
menu, and select “Configure.” From this page, a System Administrator can configure
global notification settings and displays customer account information.
**CAUTION – TURNING GLOBAL NOTIFICATION OFF WILL PREVENT ANY USER FROM
RECEIVING ANY FORM OF NOTIFICATION IN THE EVENT OF AN ALARM**
** CAUTION – TURNING OFF GLOBAL ALARM GENERATION WILL PREVENT THE
SYSTEM FROM GENERATING AN ALARM STATE, AND THUS NO ALERTS WILL BE SENT
2
3
1
Page 45
Cloud User Manual V20.6 45
Figure IV.14-1: Account Settings
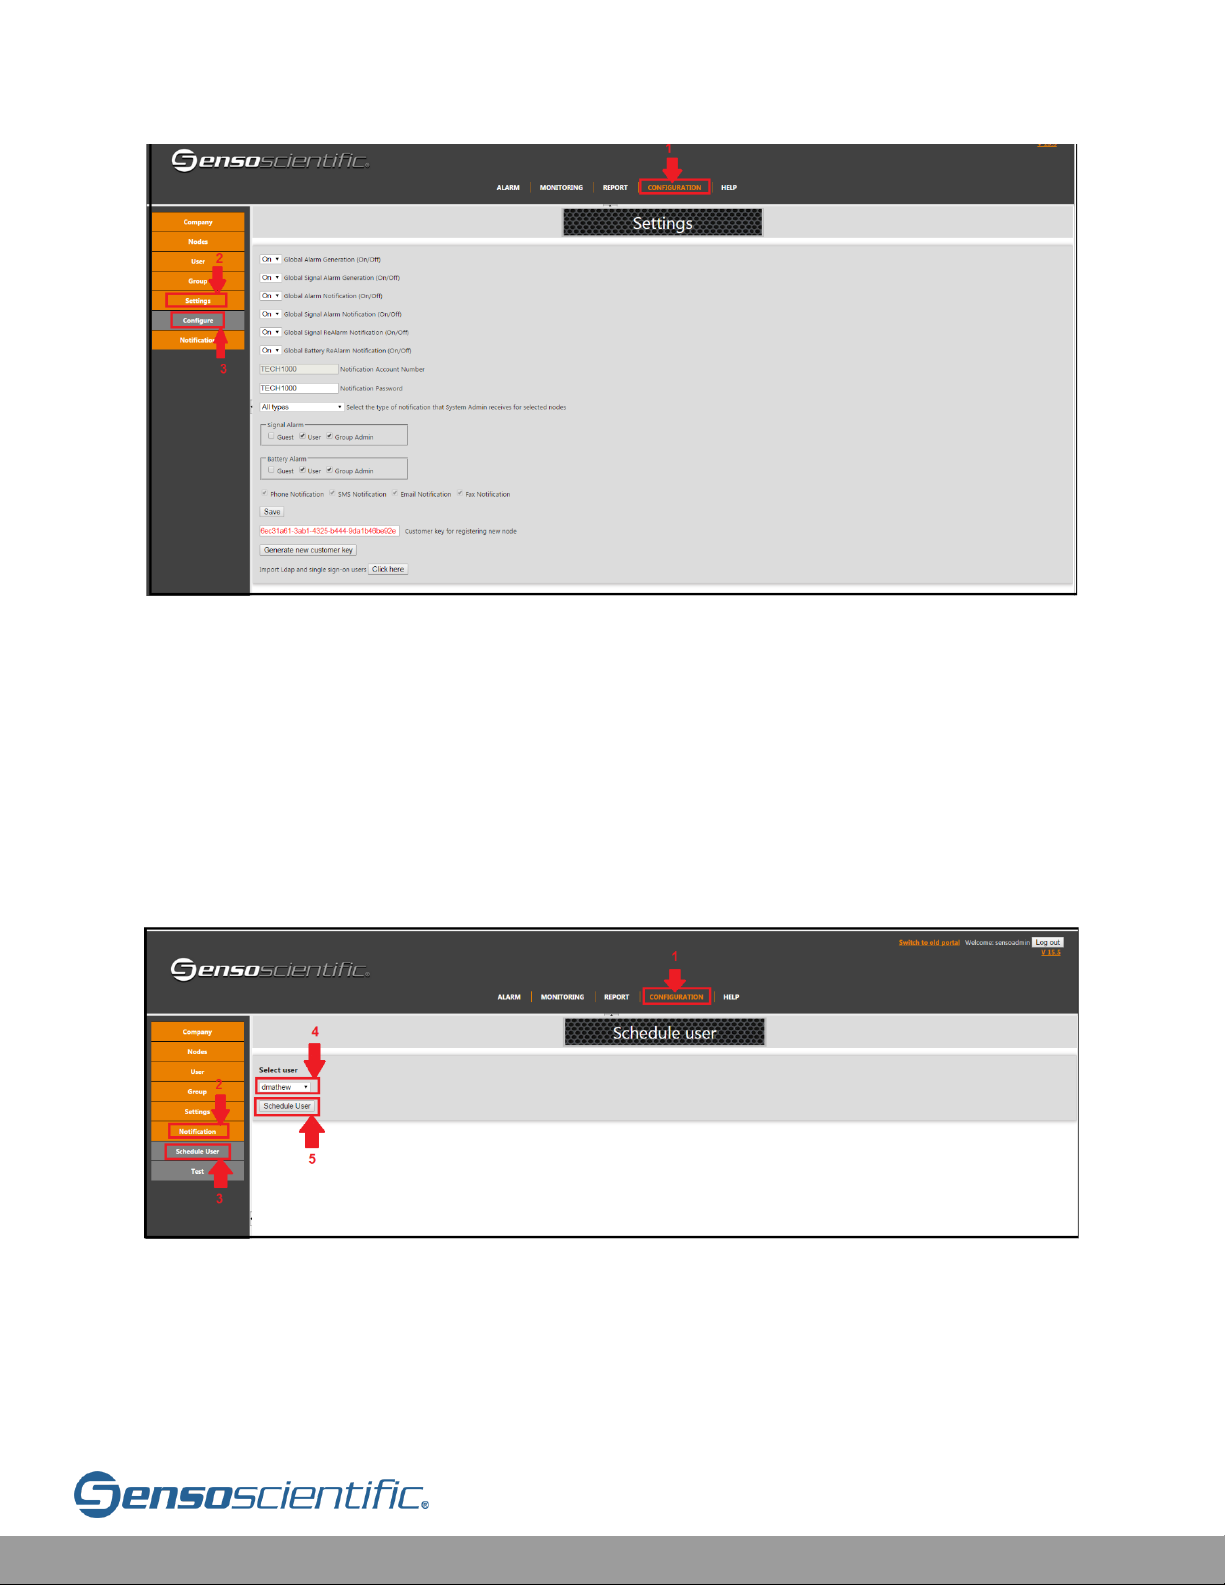
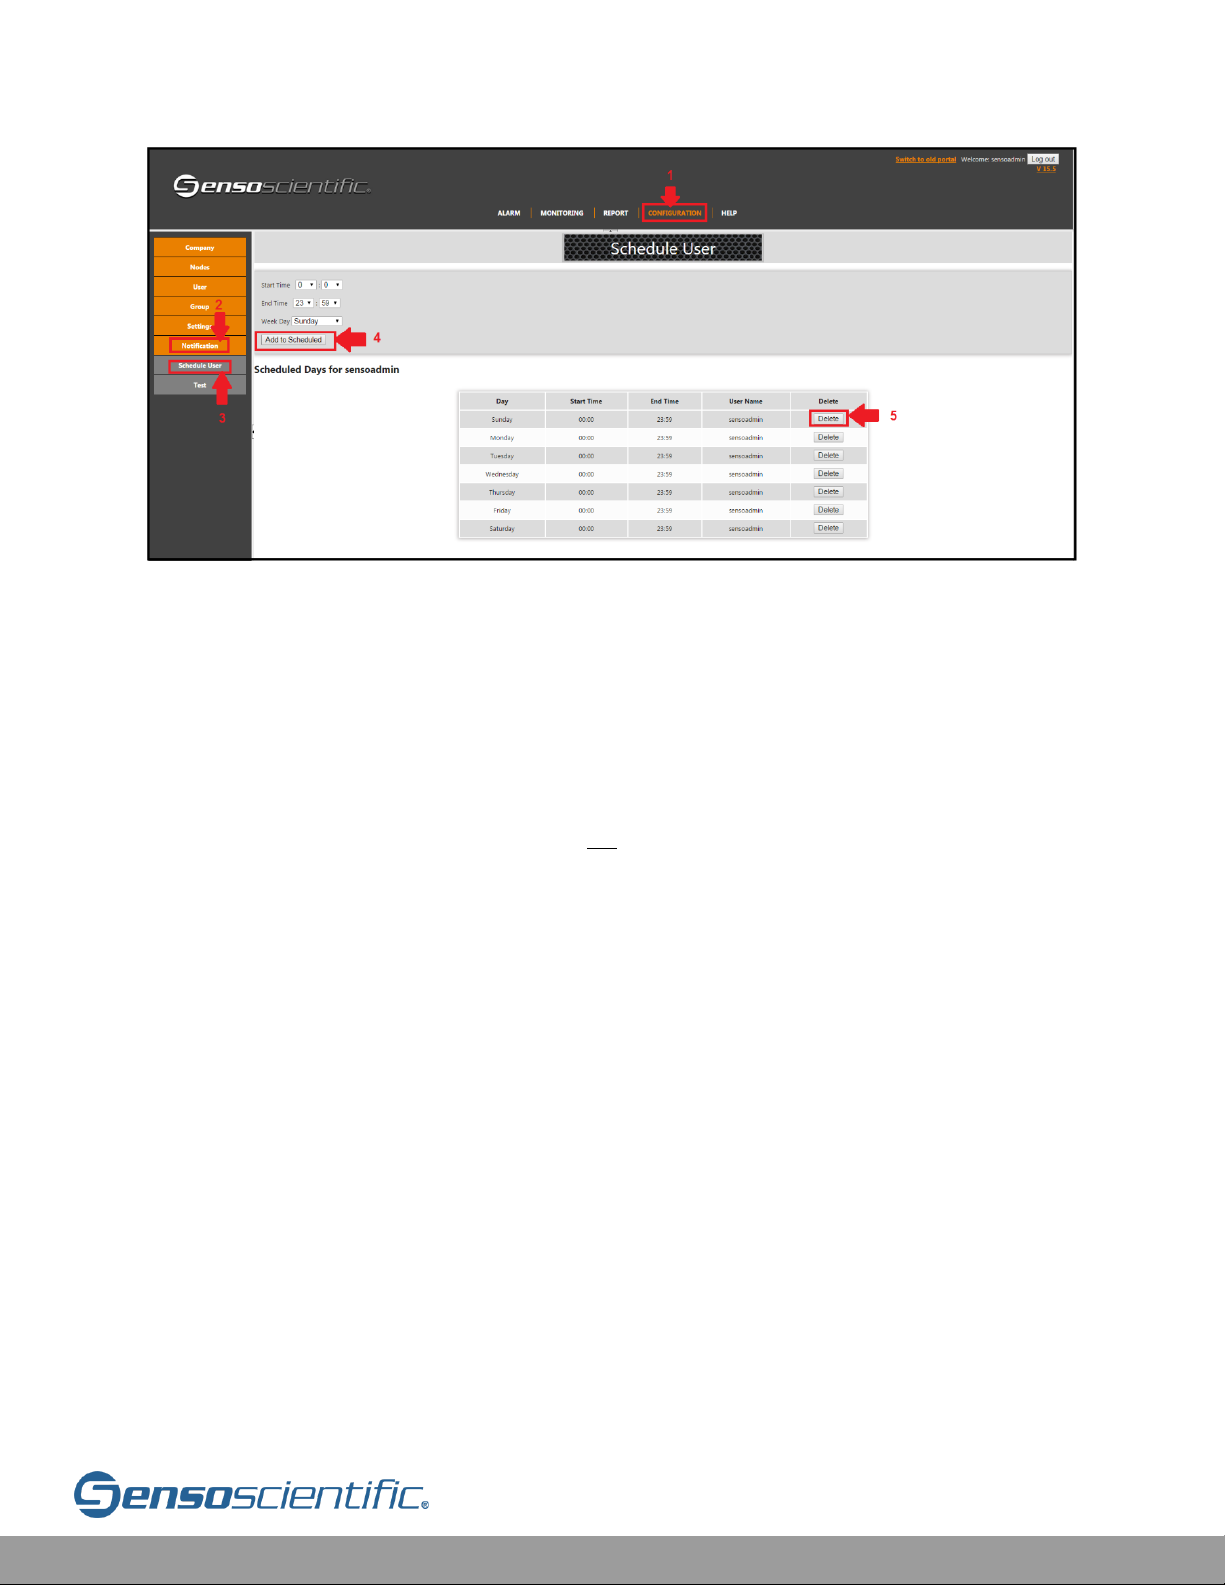
IV.15 Schedule Users
Users can be scheduled by the System or Group Administrator for the day and time
that they wish to receive notifications. By Default, the system is configured for 24/7
Alerting. To change this, select “CONFIGURATION” from the main menu and then
click the "Notification” button on the left sub menu. From there select “Schedule
User” from the configuration menu.
Figure IV.15-1: Select User
Page 46
Cloud User Manual V20.6 46
Figure IV.15-2: Scheduling User
Select the user to schedule from the drop-down menu and click on the “Schedule
User” button. By default, the schedule is Sunday through Saturday 12:00 AM to 11:59
PM (24/7 Alerting). Delete the day in questions from the list. Create a new time range
by clicking on the “Start Time” box and select the new start time. Click on the “End
Time” box and select the new end time. Select the day from the “Week Day” drop
down menu. Click on the “Add to Schedule” button and see the new schedule for
this user. The schedule allows for up to six entries per day with no overlaps.
NOTE: If the alarm delay is longer than the interval of measure scheduled, then no
alarms will take place. Change this by reducing the alarm delay to zero.
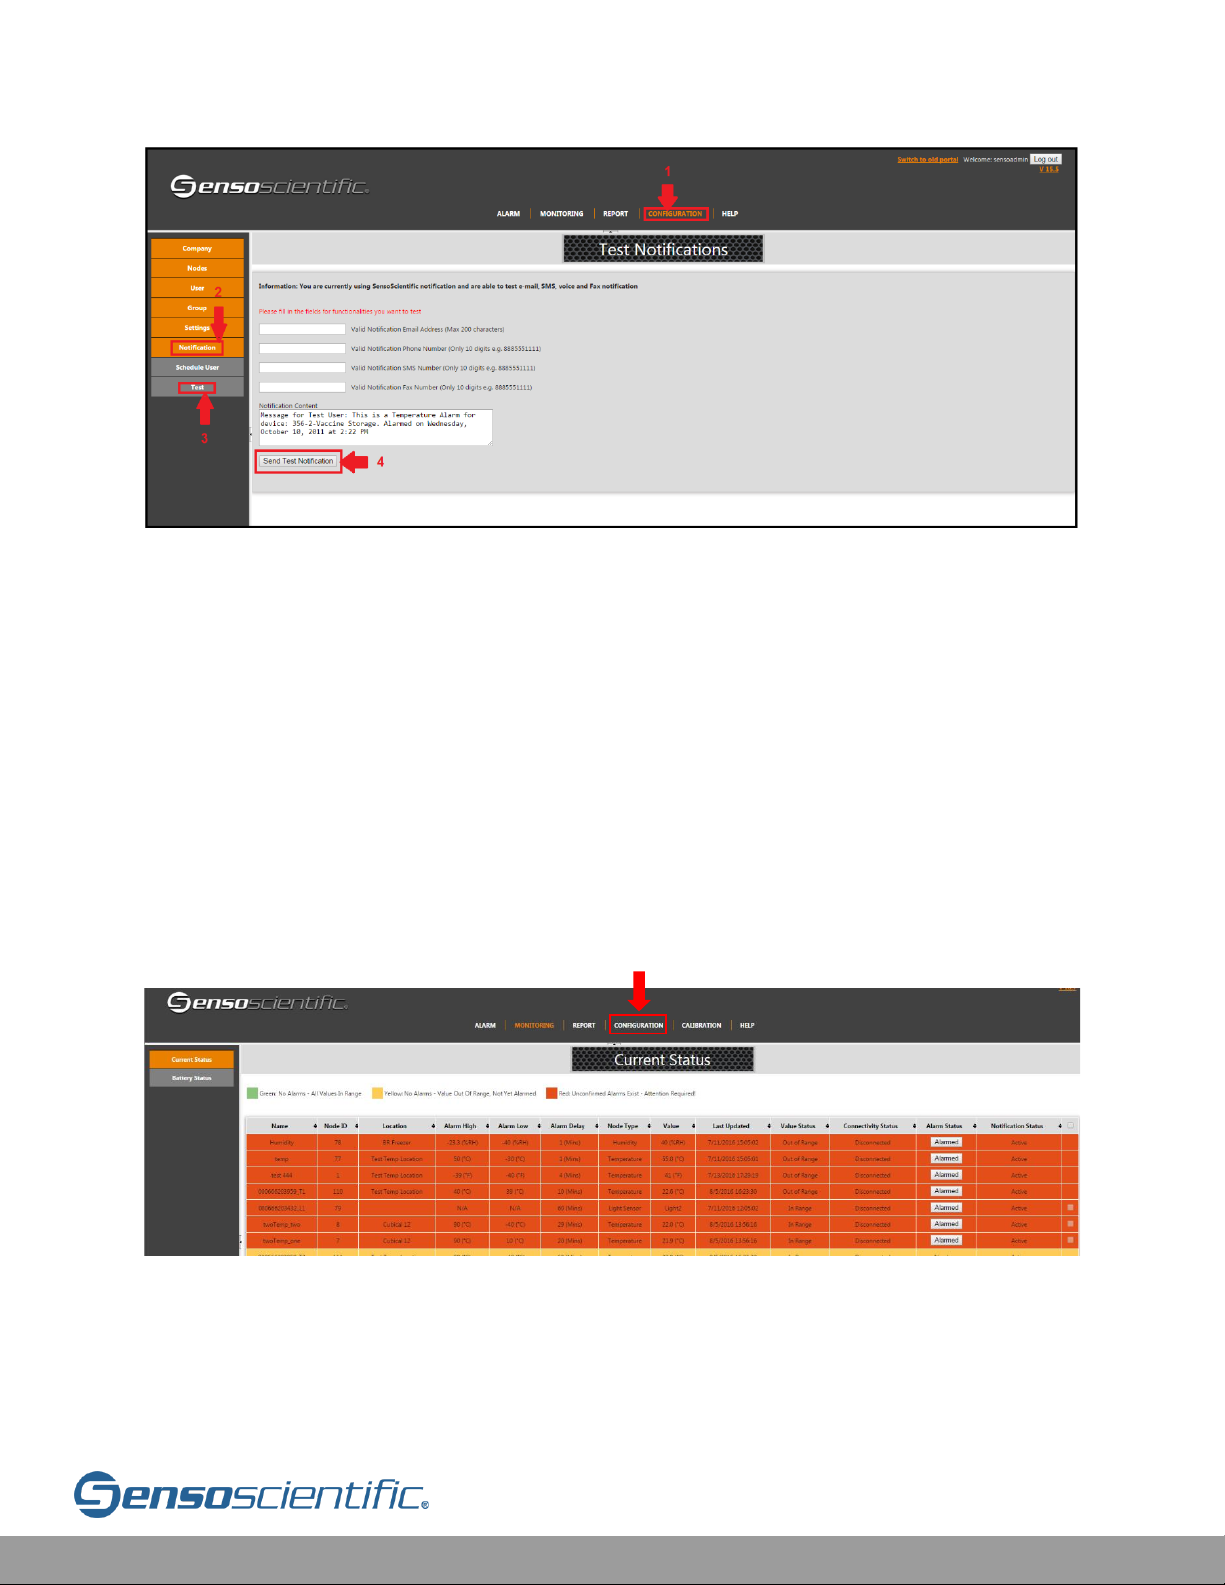
IV.16 Test Notification
Test Notifications are a preliminary measure taken in validating the contact
information that is provided. The user will be able to see a message as it will be
received during an incident.
Page 47
Cloud User Manual V20.6 47
Figure IV.16-1: Test Notifications
If an outgoing test was successful, “Notification Sent Successfully” will display on
the bottom of the screen. The user is able to test the mobile number and email IDs
using this tool.
IV.17 Time Format
The time can be changed within settings to meet user preference. By default, the
settings format time is set to am/pm throughout the cloud. However, this can be
changes so that nodes, reports, and all other functions display military time.
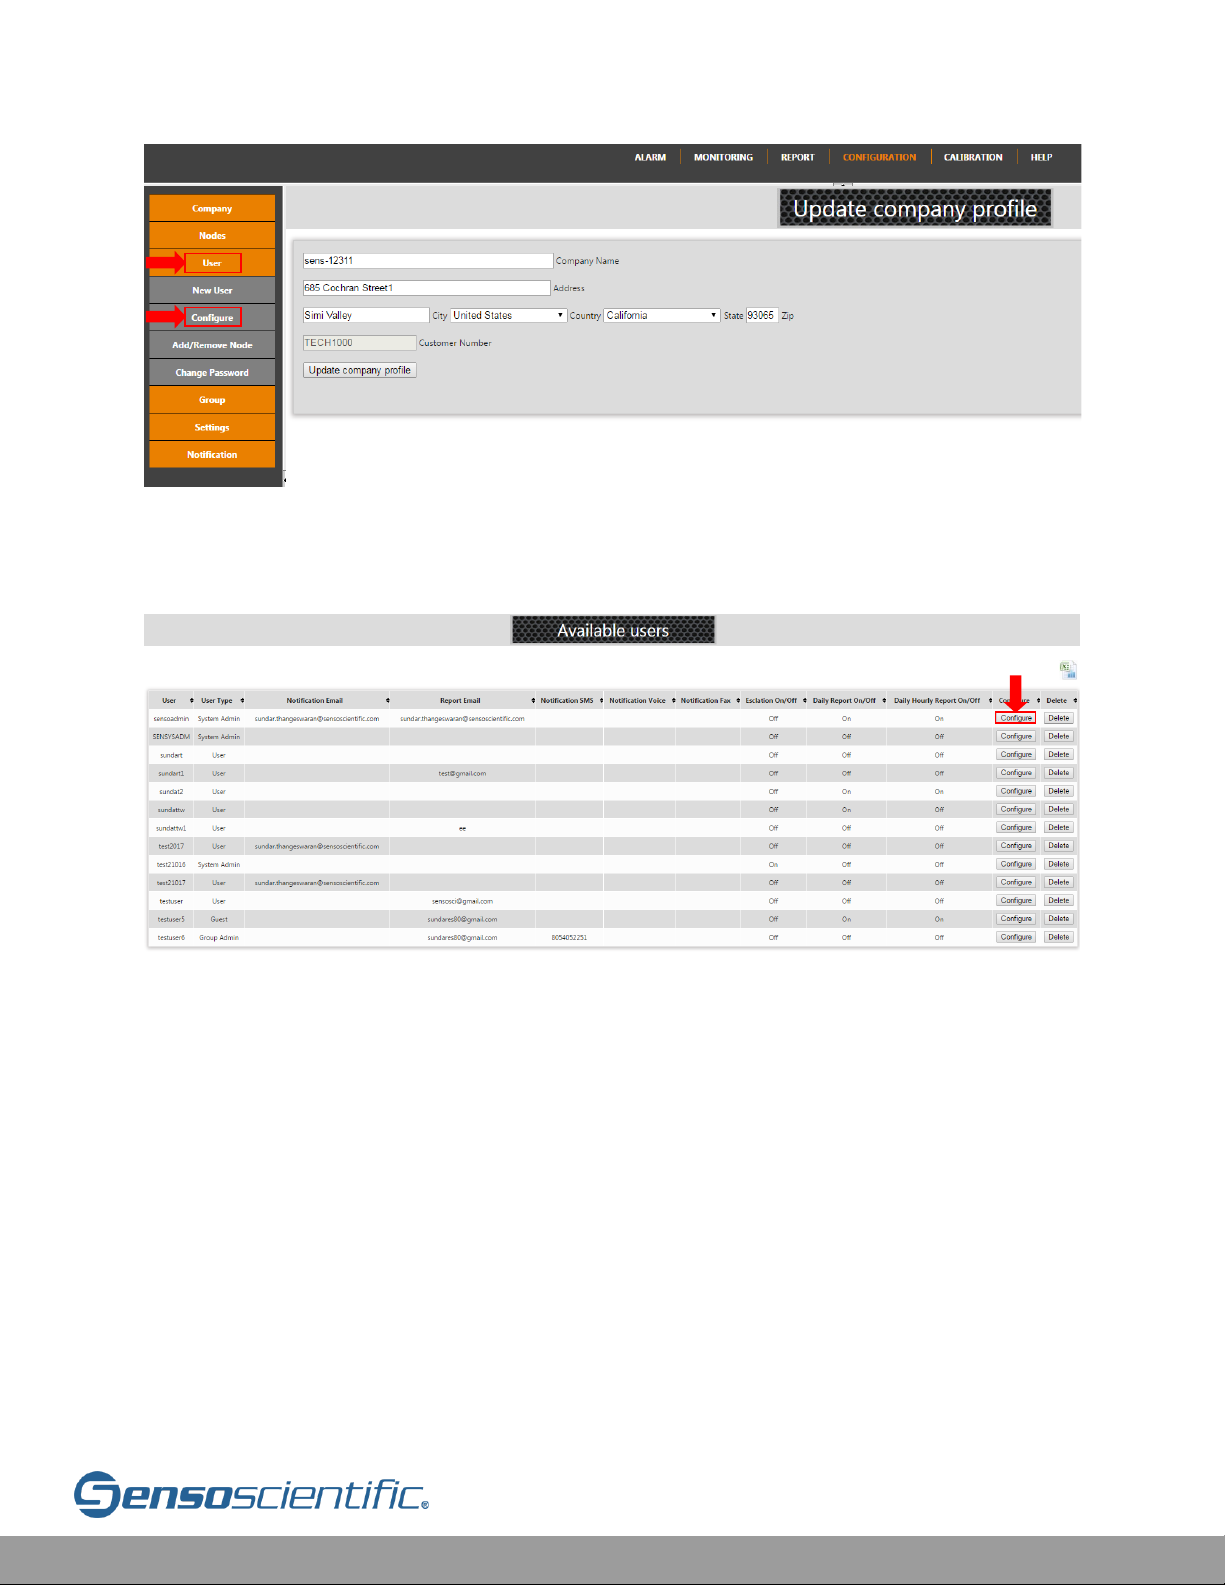
Select CONFIGURATION to begin.
Figure IV.17-1: Configuration
From the Configuration tab, select User. Then, from the dropdown menu that
appears select Configure.
Page 48
Cloud User Manual V20.6 48
Figure IV.17-2: Configure
Select a user to Configure.
Figure IV.17-3: Available Users
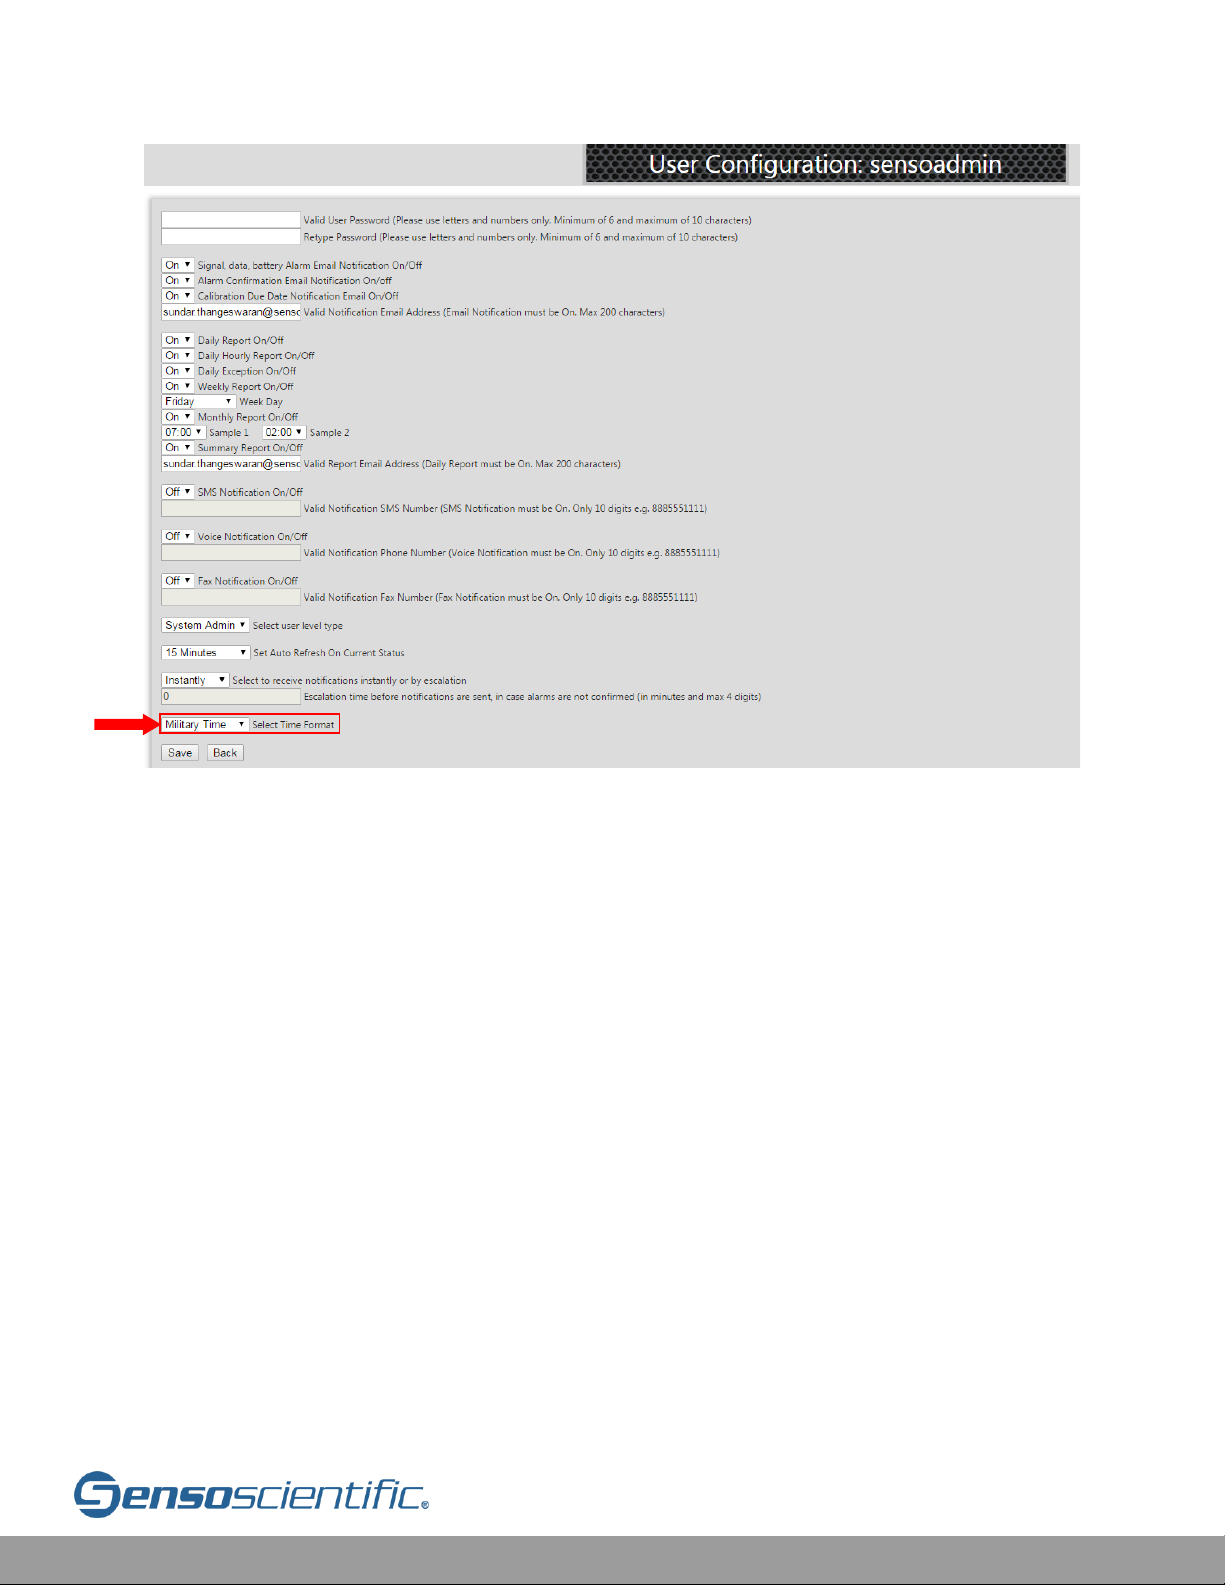
At the bottom of the User Configuration screen, select the dropdown menu next to
Time Format in order to toggle between Standard Time and Military Time.
1
2
Page 49
Cloud User Manual V20.6 49
Figure IV.17-4: Military Time
IV.18 Spare Nodes
Spare nodes are backup nodes which can replace damaged or malfunctioning nodes
without the need to wait for a replacement to be shipped. To use a spare node, it
must be activated then replaced with the given node. The following are 3 steps that
must be completed to properly activate a spare node for use:
1. Turn on the Node and Configure to Wi-Fi
Turn on the node by inserting the batteries.
If you have opted for pre-configuration, the node will automatically connect to your
Wi-Fi once it is turned on.
To perform self-configuration, go to HELP > User Guide/Installation Docs > OTA
User Guide for more information on how to properly configure the node to your
Wi-Fi network.
Page 50
Cloud User Manual V20.6 50
2. Contact the SensoScientific Technical Support Team to change the node’s
status from “Spare” to “Active”
Once the spare node connects to your Wi-Fi network, please Submit a Ticket, asking
the SensoScientific Technical Support team to activate the spare node. Please
provide the node’s MAC Address found on the screen or on the back of the device.
(See X.I Submit a Ticket)
3. Perform a Node Replacement to replace the node
Once the spare node is activated, go to IV.19 Node Replacement for instructions on
how to complete the replacement.
IV.19 Node Replacement
It may be determined after troubleshooting a device, a replacement is necessary to
resume functionality. Replacements can be sent to clients or retrieved from spare
inventory. If no spares exist, the new node will be sent by SensoScientific (For spares,
first see IV.18 Spare Nodes).
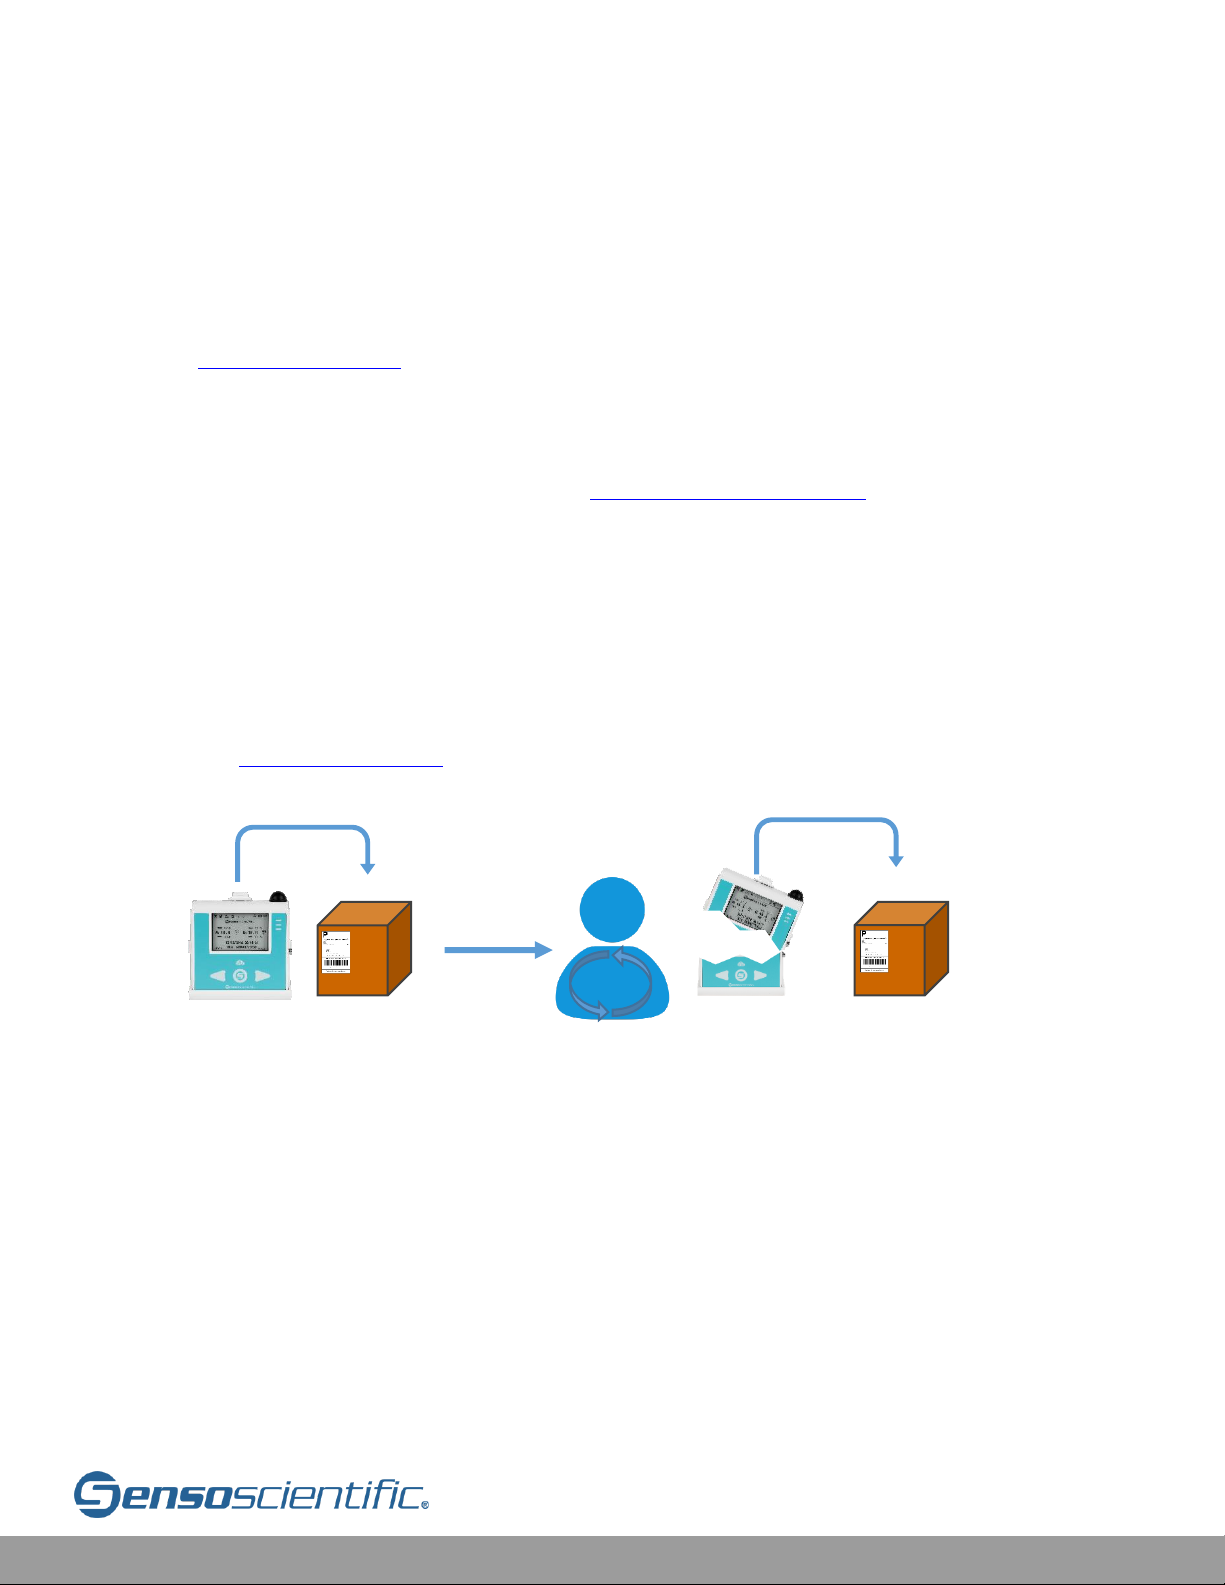
Figure IV.19-1: Shipping New Node
1. SensoScientific Ships Replacement to Client
2. Client Performs Replacement (see below process)
3. Client Ships Old Node to SensoScientific Using RMA Label (HELP > RMA Labels)
Once the new node is received by the client, data from the old node needs to be
transferred to the new device. This can be done simply by the Replace RMA Nodes
function.
New Node
Old Node
1
2
3
Page 51
Cloud User Manual V20.6 51
Replacement Process
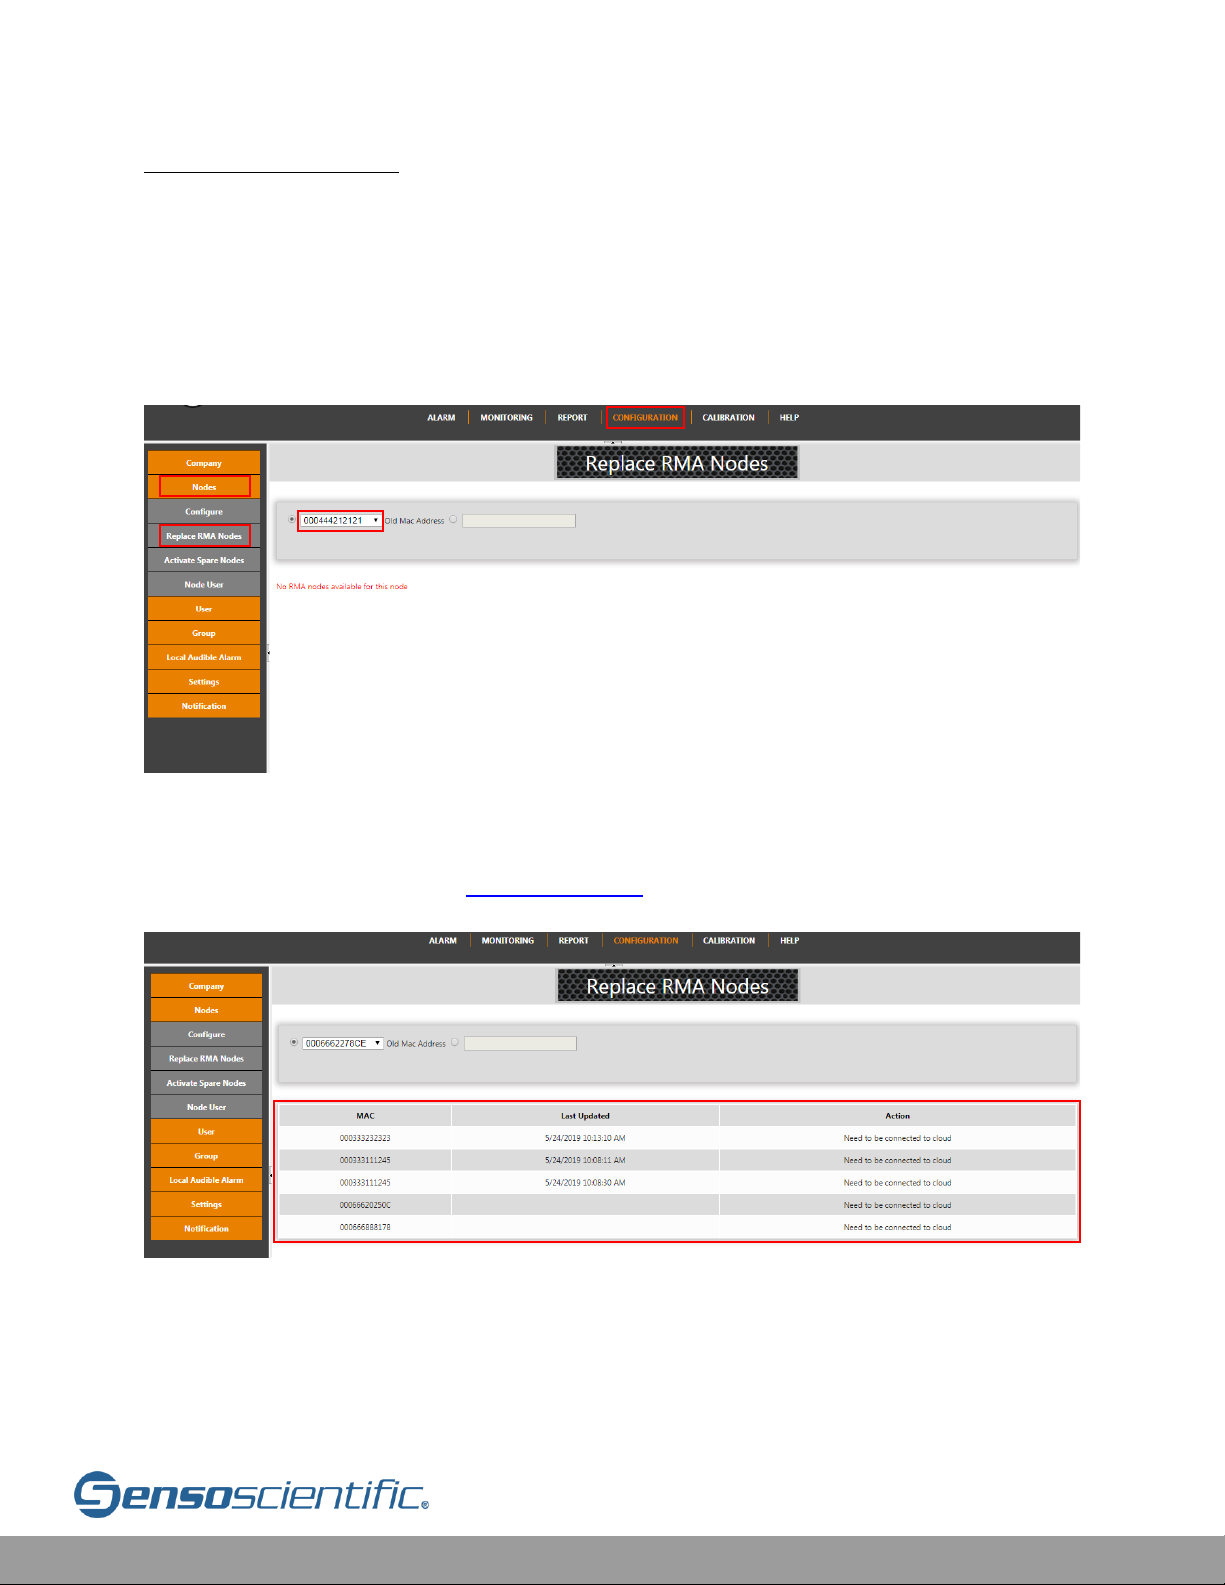
Go to the CONFIGURATION Tab. Press Nodes to open a dropdown and Select
Replace RMA Nodes. Each node has an individualized MAC address which identifies
it in the cloud. The option will be available to a select from a dropdown of Active
Nodes (MAC addresses). Select the MAC address to be replaced (alternatively type
the address into the field to the right).
Figure IV.19-2: Replace RMA Nodes
Once the correct MAC Address is selected, a field will populate at the bottom of the
screen (if no field populates, contact support).
Figure IV.19-3: Replacement Node
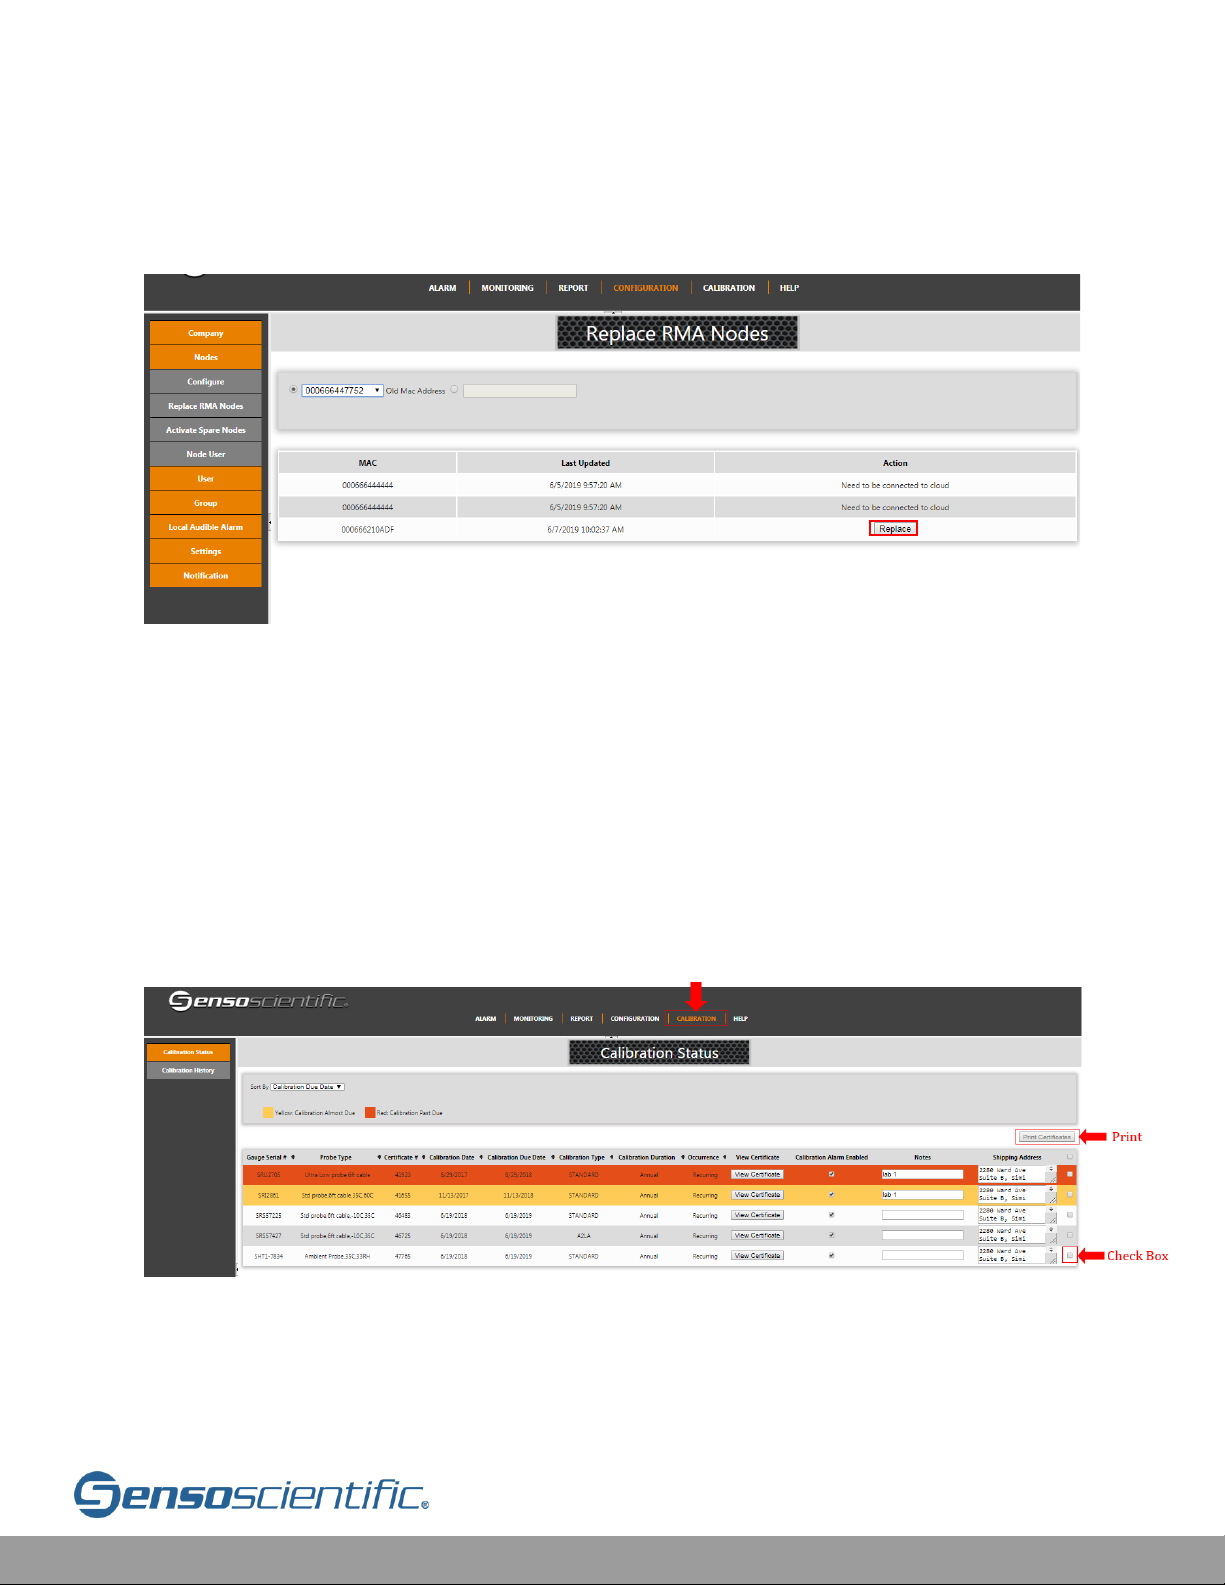
Once the fields populate at the bottom of the screen, turn the device on to connect
to the Wi-Fi (network information must be configured on the new node to connect to
Wi-Fi. This is done in-advance if pre-configuration is set-up. To perform self-
1
2
3
4
Page 52
Cloud User Manual V20.6 52
configuration, see OTA User Guide in the HELP tab under User Guide/Installation
Docs). Once the device connects, the option will become available to replace the
node. Press Replace to complete the replacement.
Figure IV.19-4: Replace Node
V. Calibration
If calibration certificates have been created in the user’s account, the “CALIBRATION”
tab at the top of the page will be visible. Select it to see the Calibration Portal. From
the Portal, all the certificates for probes are listed. This includes the calibration due
date and all important documentation for compliance.
Click on “CALIBRATION” from the main menu bar.
Figure V-1: Calibration Status
A list of Calibration certificate information will populate the screen, showing
information such as the Gage Serial Number, probe type, Calibration Date, etc.
Page 53
Cloud User Manual V20.6 53
Features
1. Navigate to Calibration Tab
2. Print Certificates: Print any number of selected calibration certificates. Select
one or more of the check boxes then press Print Certificates.
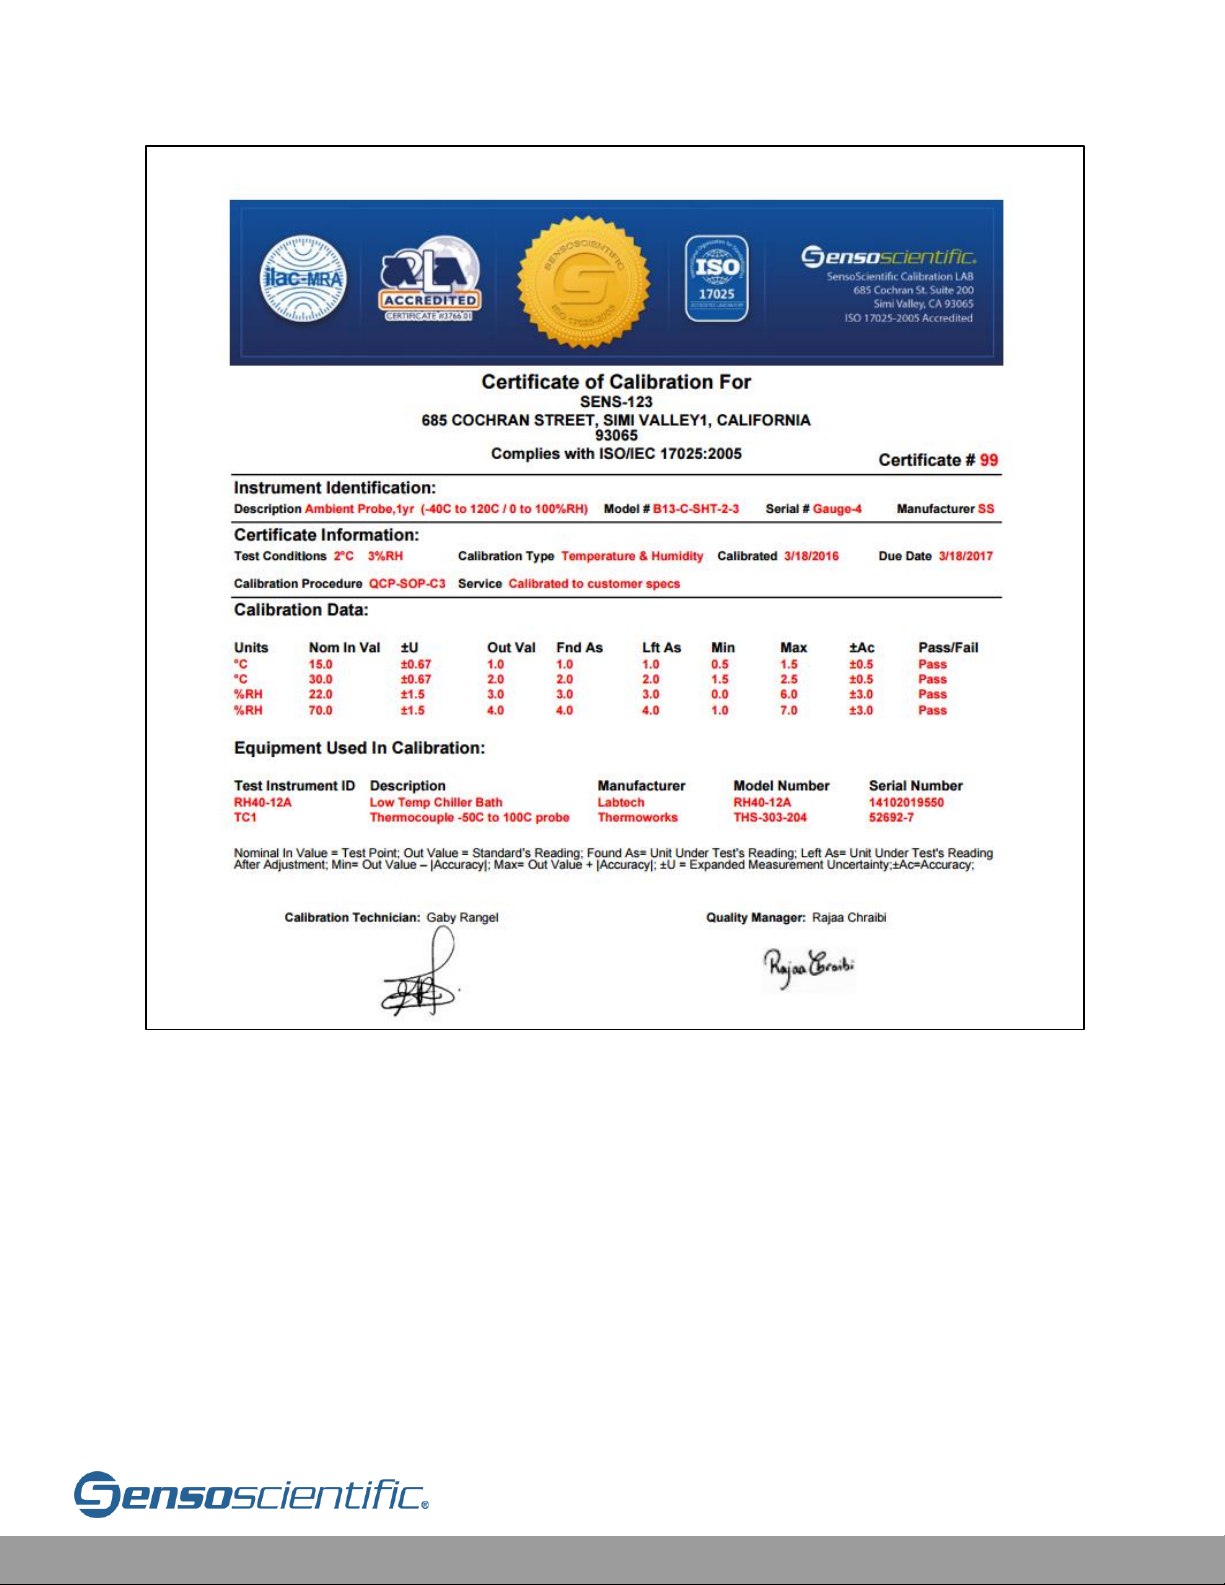
3. View Certificate: View the official calibration certificate PDF file.
4. Calibration Alarm Enabled Checkbox: Enable/Disable the Calibration Alarm
notification. The alarm will remind the user via email 3 months ahead of time
from the calibration due date that the probe is due for calibration. At 2 months
before calibration, the user is notified again. At one month, the customer is
notified, and the background color of the table row will turn yellow. On the
due date, the customer is notified again, and the background color will turn
red.
5. Notes: Allows the user to enter in notes of their choice relating to the probe
(Users often use this to input the node ID which the probe is attached to).
6. Sort By: Sort the list by Gage SN, Certificate Number, Probe Type, and Due
Date.
7. Calibration History: Shows all previous probes/certificates that were part of
the user’s account that are no longer in use. Inactive probes will have a
background color of orange.
Page 54
Cloud User Manual V20.6 54
Figure V-2: Calibration Certificate
V.1 Calibration Alarm Notification
Notification for the Calibration Due Alarm is sent by default to the email addresses
of the system administrator and the users of the cloud account.
For each calibration due, a total of 4 emails will be triggered to each user:
- 1st Email will be sent 3 months before the calibration due date.
- 2nd Email will be sent 2 months before the calibration due date.
- 3rd Email will be sent 1 month before the calibration due date.
- Last email will be sent when the calibration is past due.
Page 55
Cloud User Manual V20.6 55
V.2 Deactivating the Calibration Alarm Notification
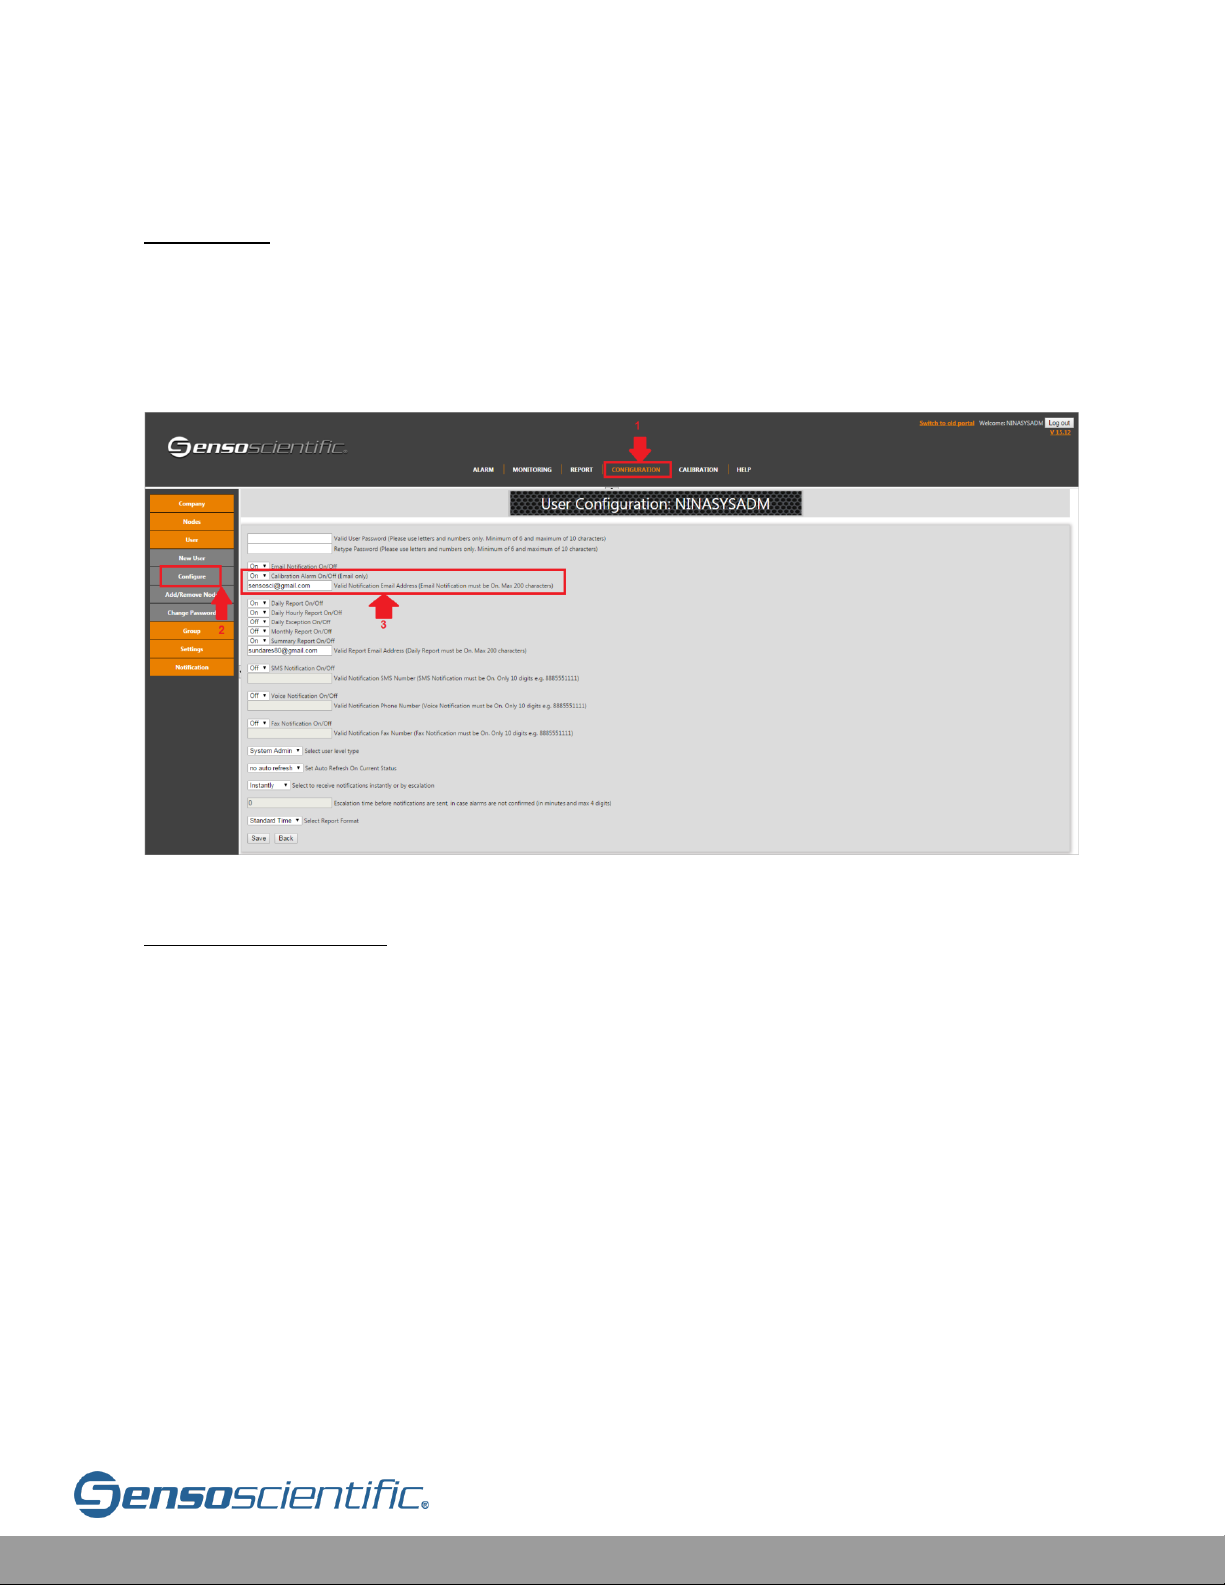
a. By User:
Any user can turn on/off their own calibration alarm notification through the user
configuration window below, which is visible if the cloud account contains a
calibration certificate.
Figure V.2-1: Calibration alarm Notification in User Configuration
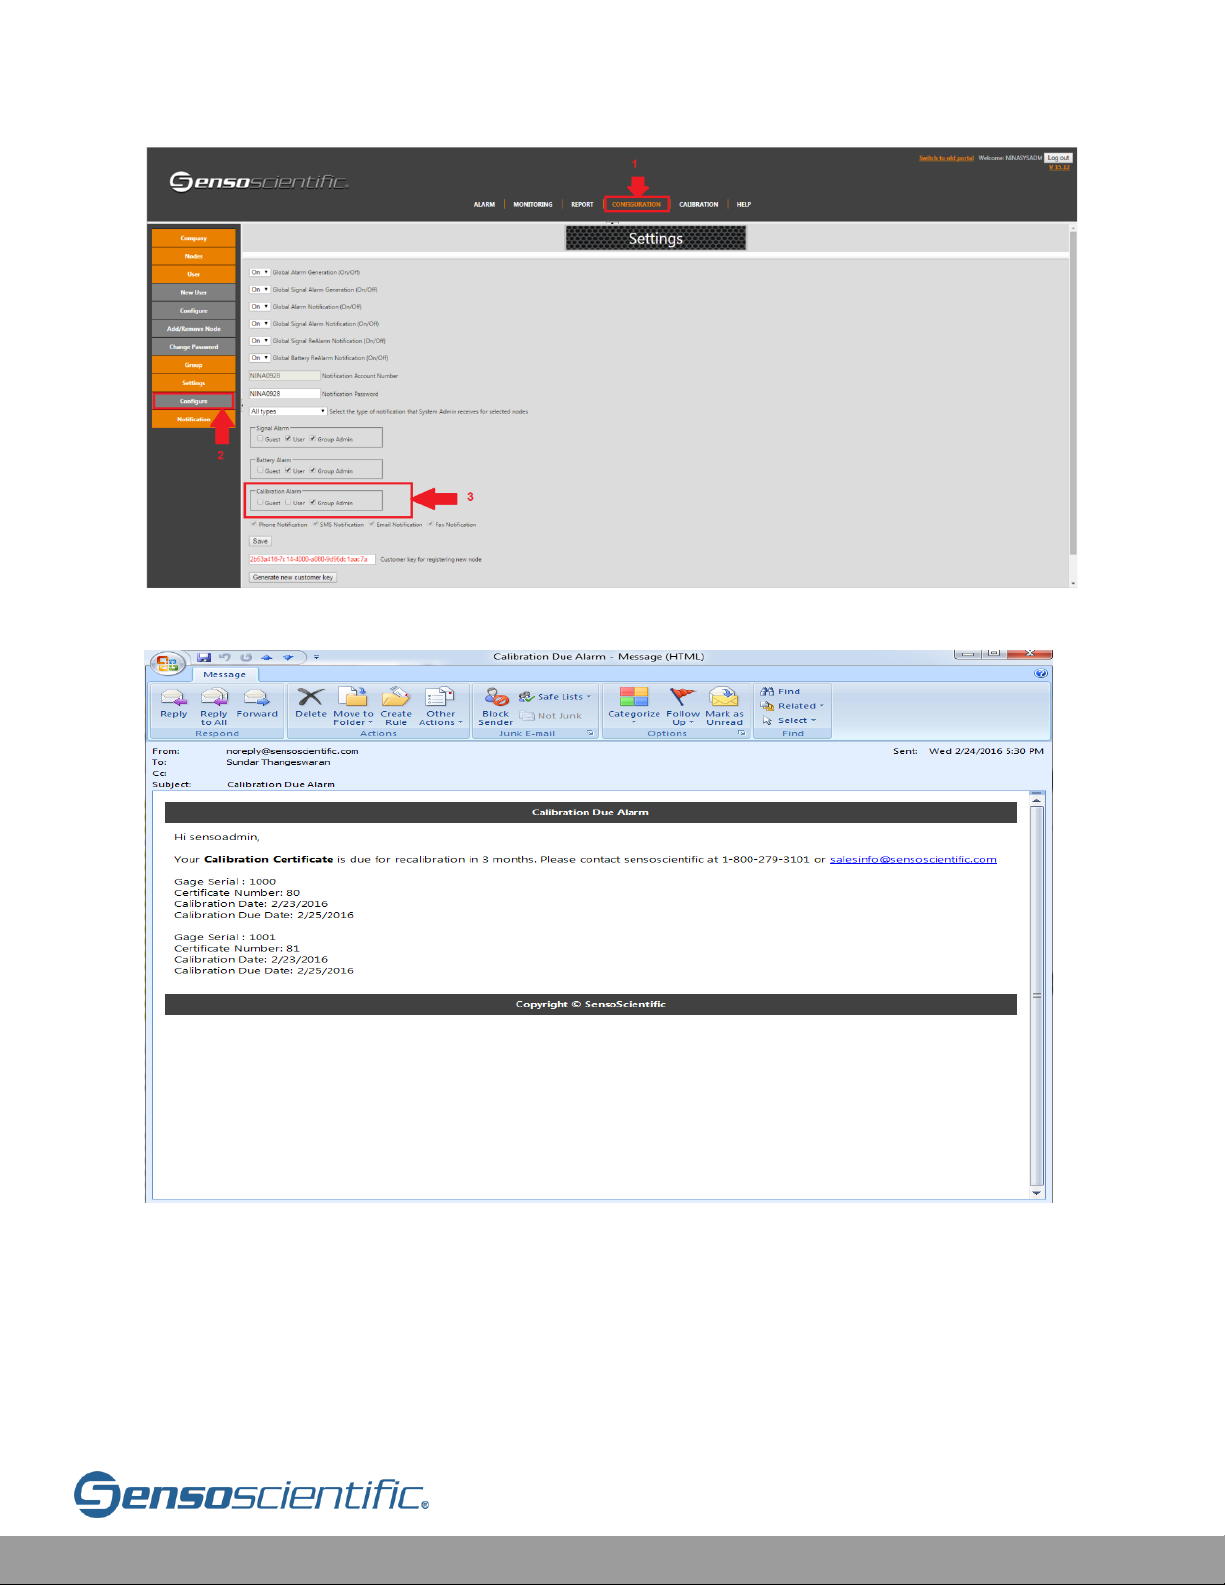
b. By System Admin:
The System admin can deactivate the calibration alarm notification for the different
user access levels using the Configuration> Settings >configure in the window below:
Page 56
Cloud User Manual V20.6 56
Figure V.2-2: Calibration settings on Company Settings
Figure V.2-3: Sample calibration Email notification
V.3 Calibration Group
Calibration Groups provide targeted notifications for calibration certificates. If no
calibration group is created, calibration due date notifications are sent to users for
all certificates on the account. To select which certificates should be notifying specific
Page 57
Cloud User Manual V20.6 57
users, a calibration group must be created. NOTE: Once a calibration group is
created, only certificates added to a group and users added to the group will send
and receive notifications respectively. So, the risk exists that a certificate is not added
and therefore does not provide a notification to anyone.
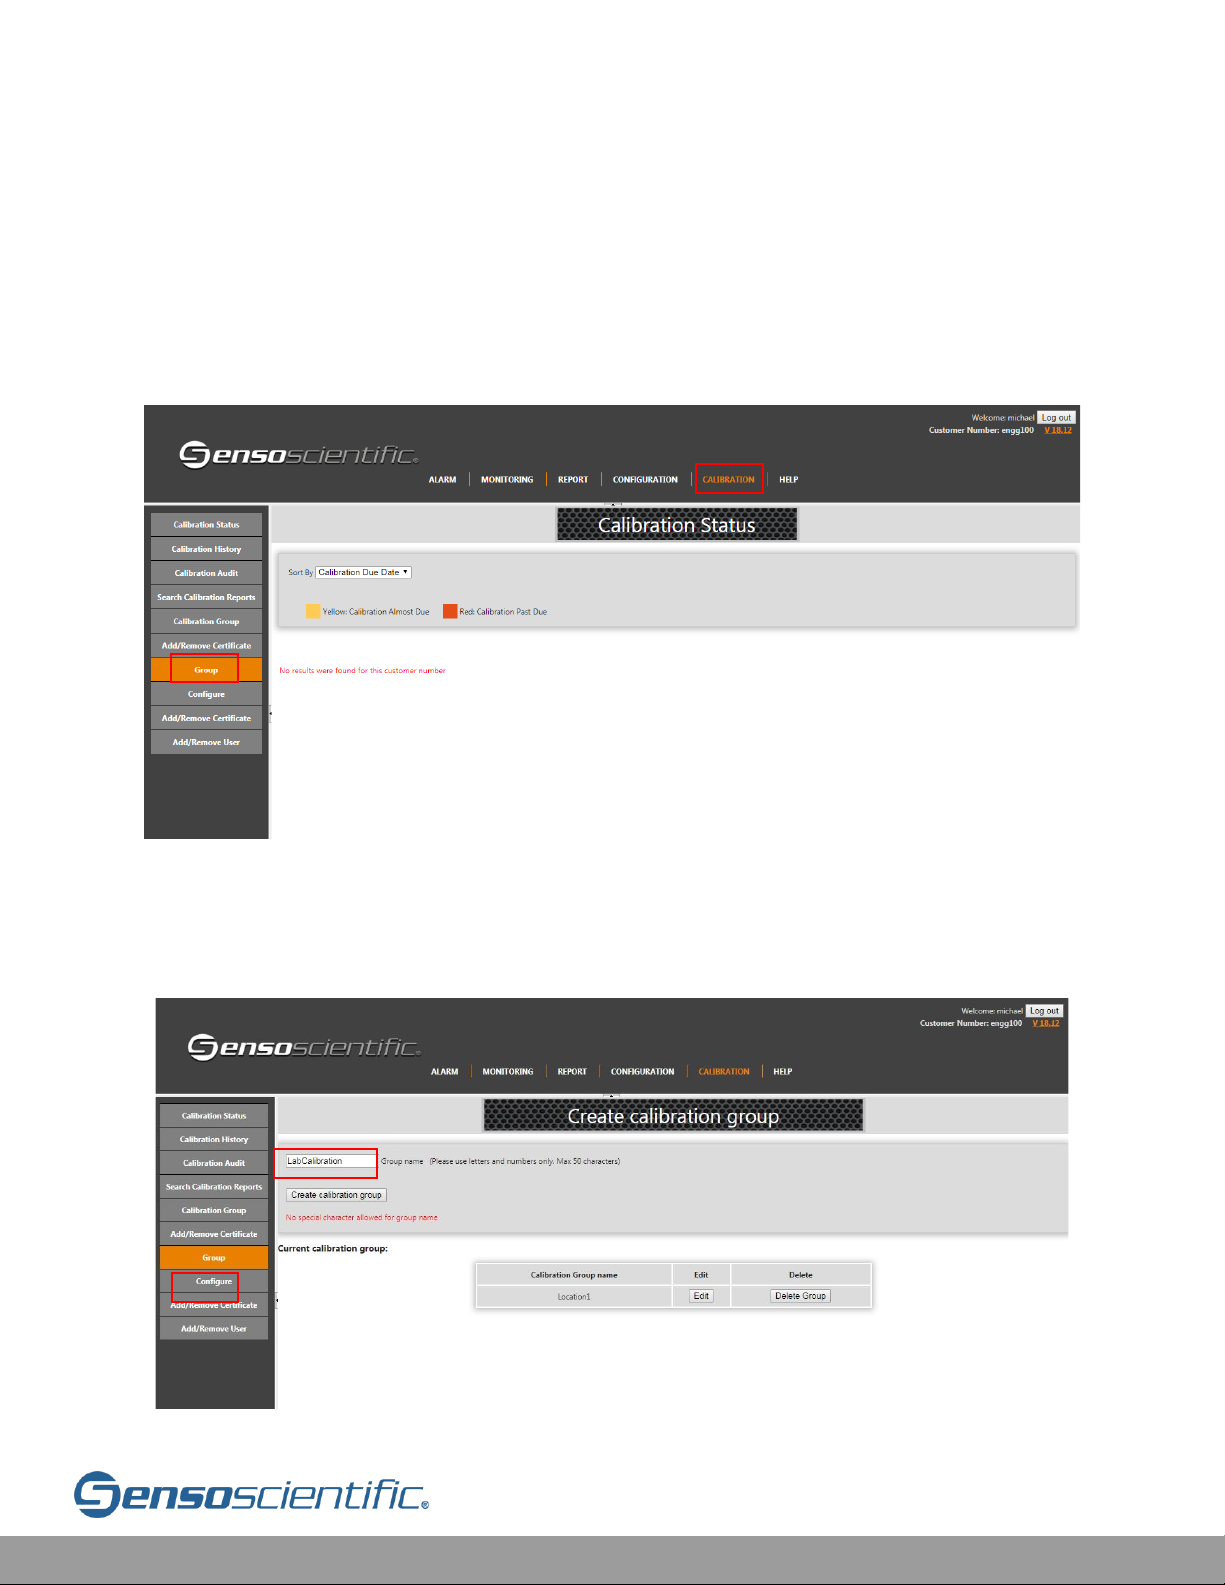
Start by going to the CALIBRATION tab and selecting Group at the bottom left. This
opens a dropdown.
Figure V.3-1: Calibration Group Tab
Select Configure from the dropdown on the left. Next, type the name of the group
to be created in the Group Name, then select Create Calibration Group.
Figure V.3-2: Create Calibration Group
Page 58
Cloud User Manual V20.6 58
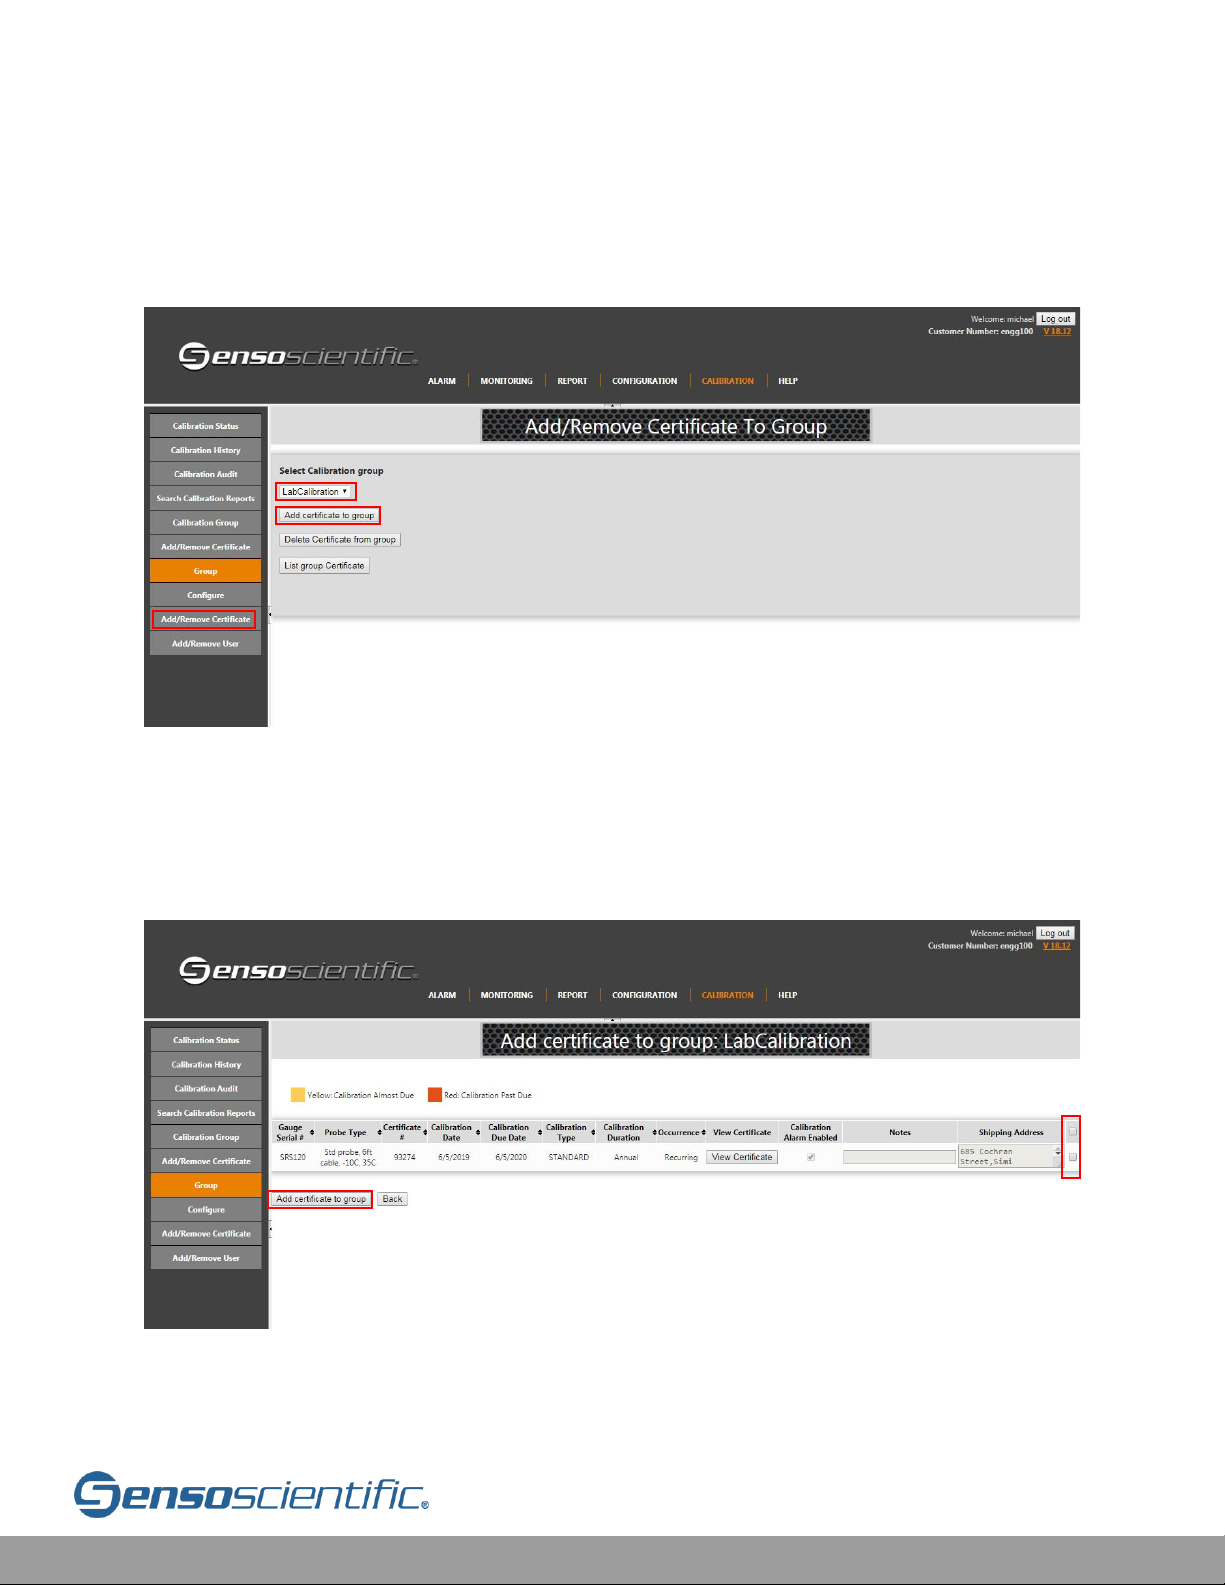
Next, go to Add/Remove Certificates to add the appropriate certificates to the
group. Select the appropriate Calibration group from the dropdown list▼ then select
Add certificate to group.
Figure V.3-3: Add/Remove Certificate to Calibration Group
The next page shows all certificates on the account. Select the certificates desired by
marking the checkbox at the right. Select Add certificate to group at the bottom when
all desired certificates were selected.
Figure V.3-4: Selecting Certificates to Add to Calibration Group
Page 59
Cloud User Manual V20.6 59
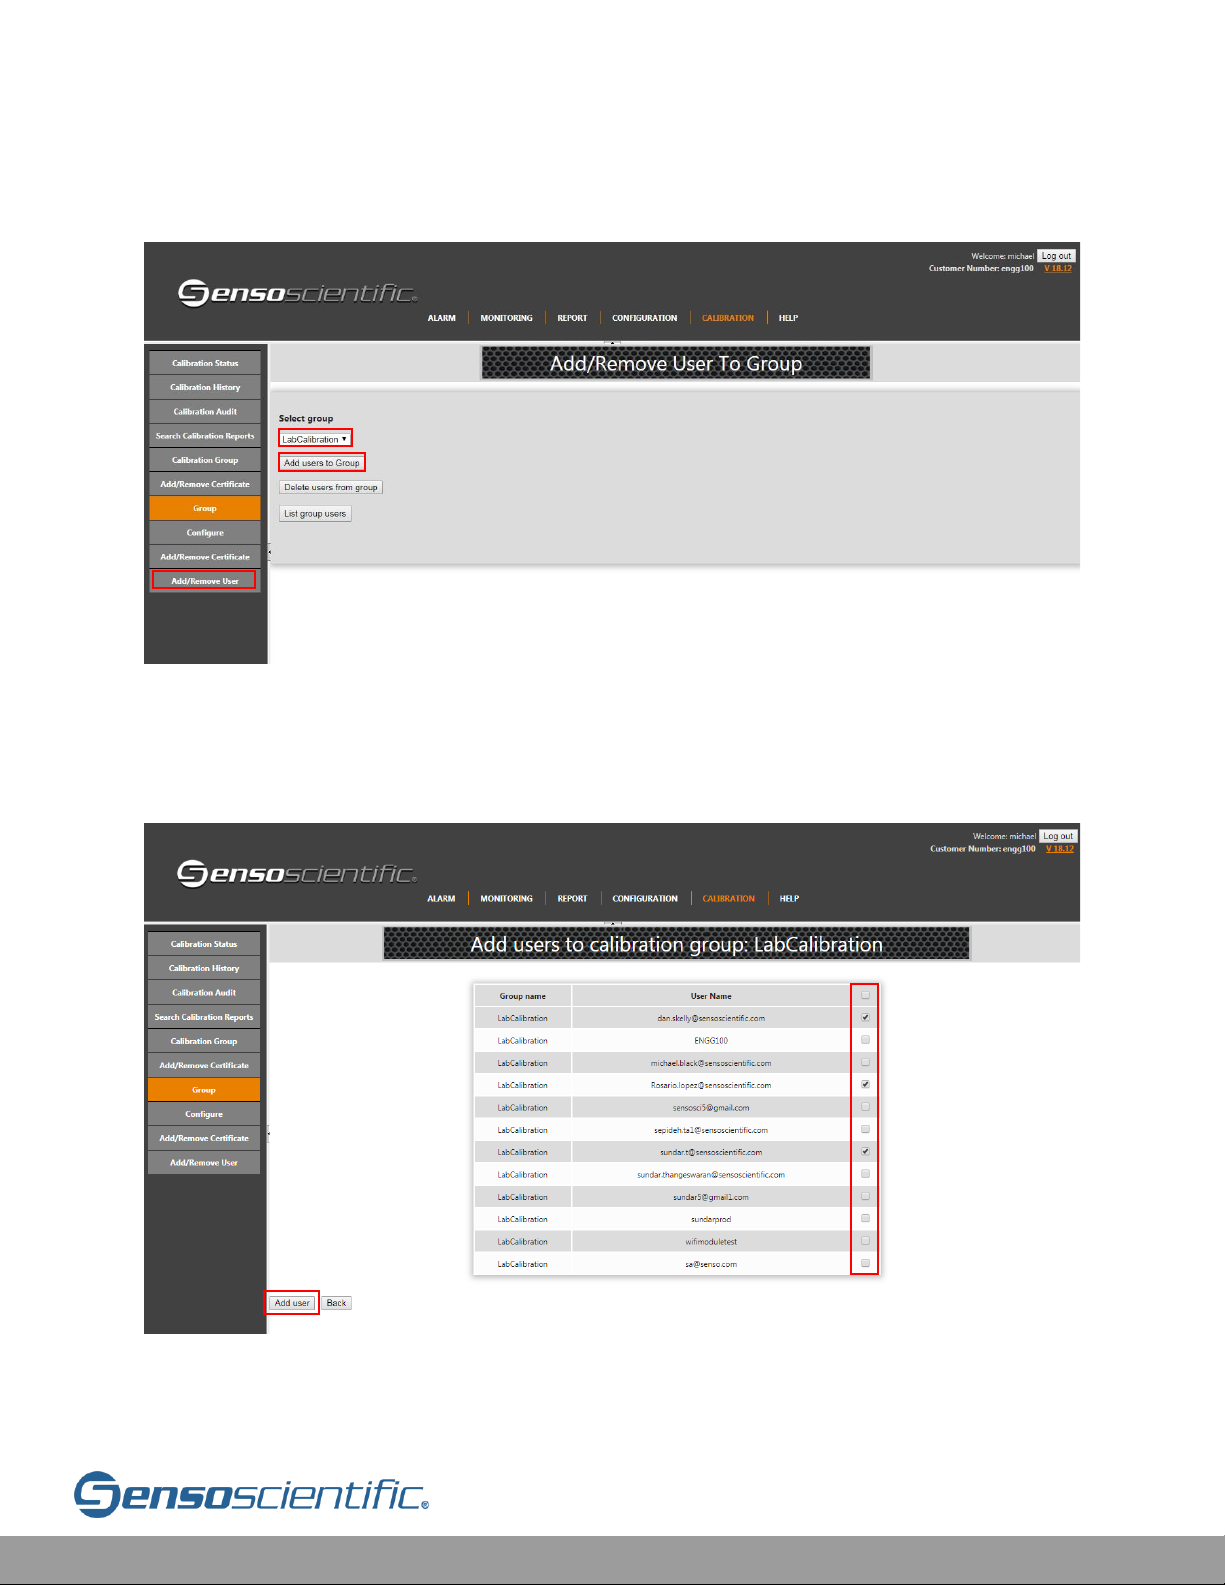
Go to Add/Remove User to select users who will receive notifications. Select the
Calibration group from the dropdown list▼ then select Add users to Group.
Figure V.3-5: Add/Remove User to Group
Select the users using the checkbox on the right of the User Name. Select Add user
when complete.
Figure V.3-6: Add Users to Calibration Group
Page 60
Cloud User Manual V20.6 60
VI. Reporting
Many different reporting options are available in the system. To access them, select
REPORT from the main menu bar. On the left side-bar, options for each report are
listed. Click on the tab of the report to run it.
All Reports can be exported to .pdf, .xls, .csv, ppt., .rtf, .tiff, or Web Archive file. Also,
hard copies can be printed to a local printer.
For automated graphing which is sent via email periodically, see VI.15 Automated
Reports.
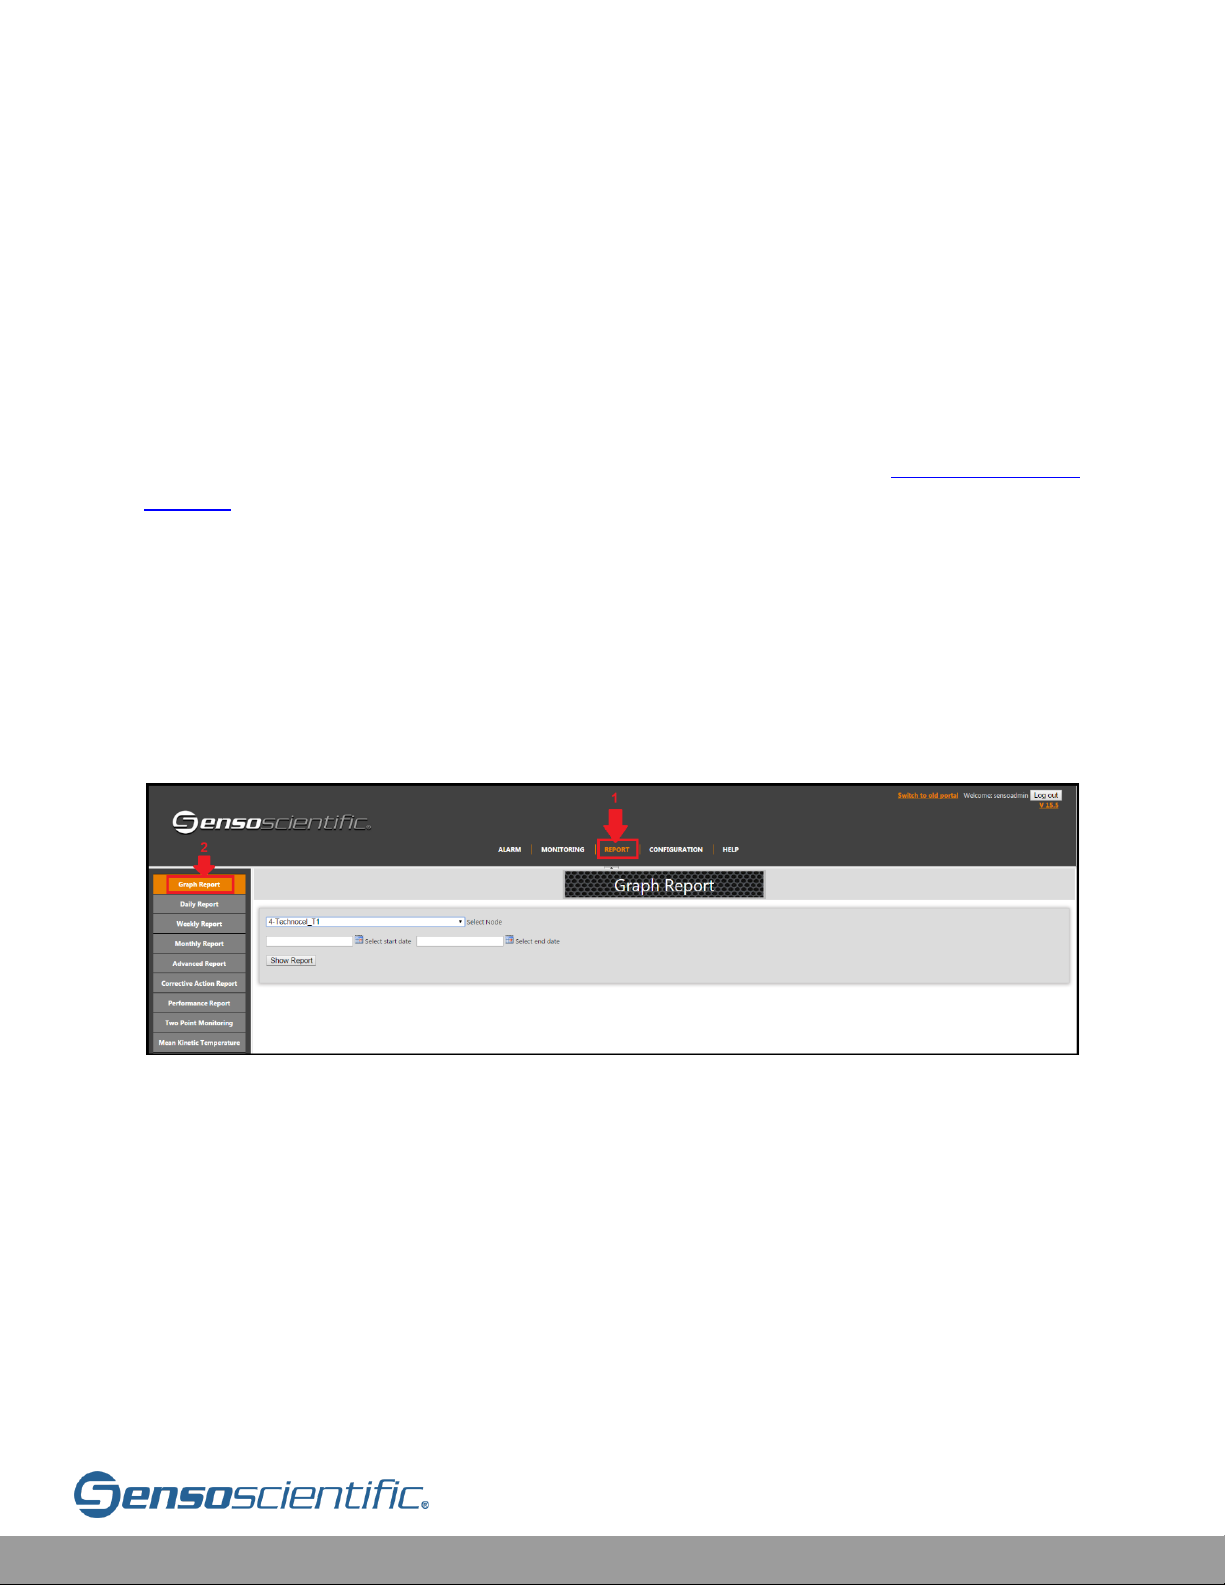
VI.1 Graph Report
A report will generate a list of data which is stored in the SensoScientific Cloud. The
data to be listed and the format it is shown depends on which report is chosen.
Below, a “Graph Report” is run. The data points are retrieved between a specified
time by the user.
Figure VI.1-1: Graph Options
Page 61
Cloud User Manual V20.6 61
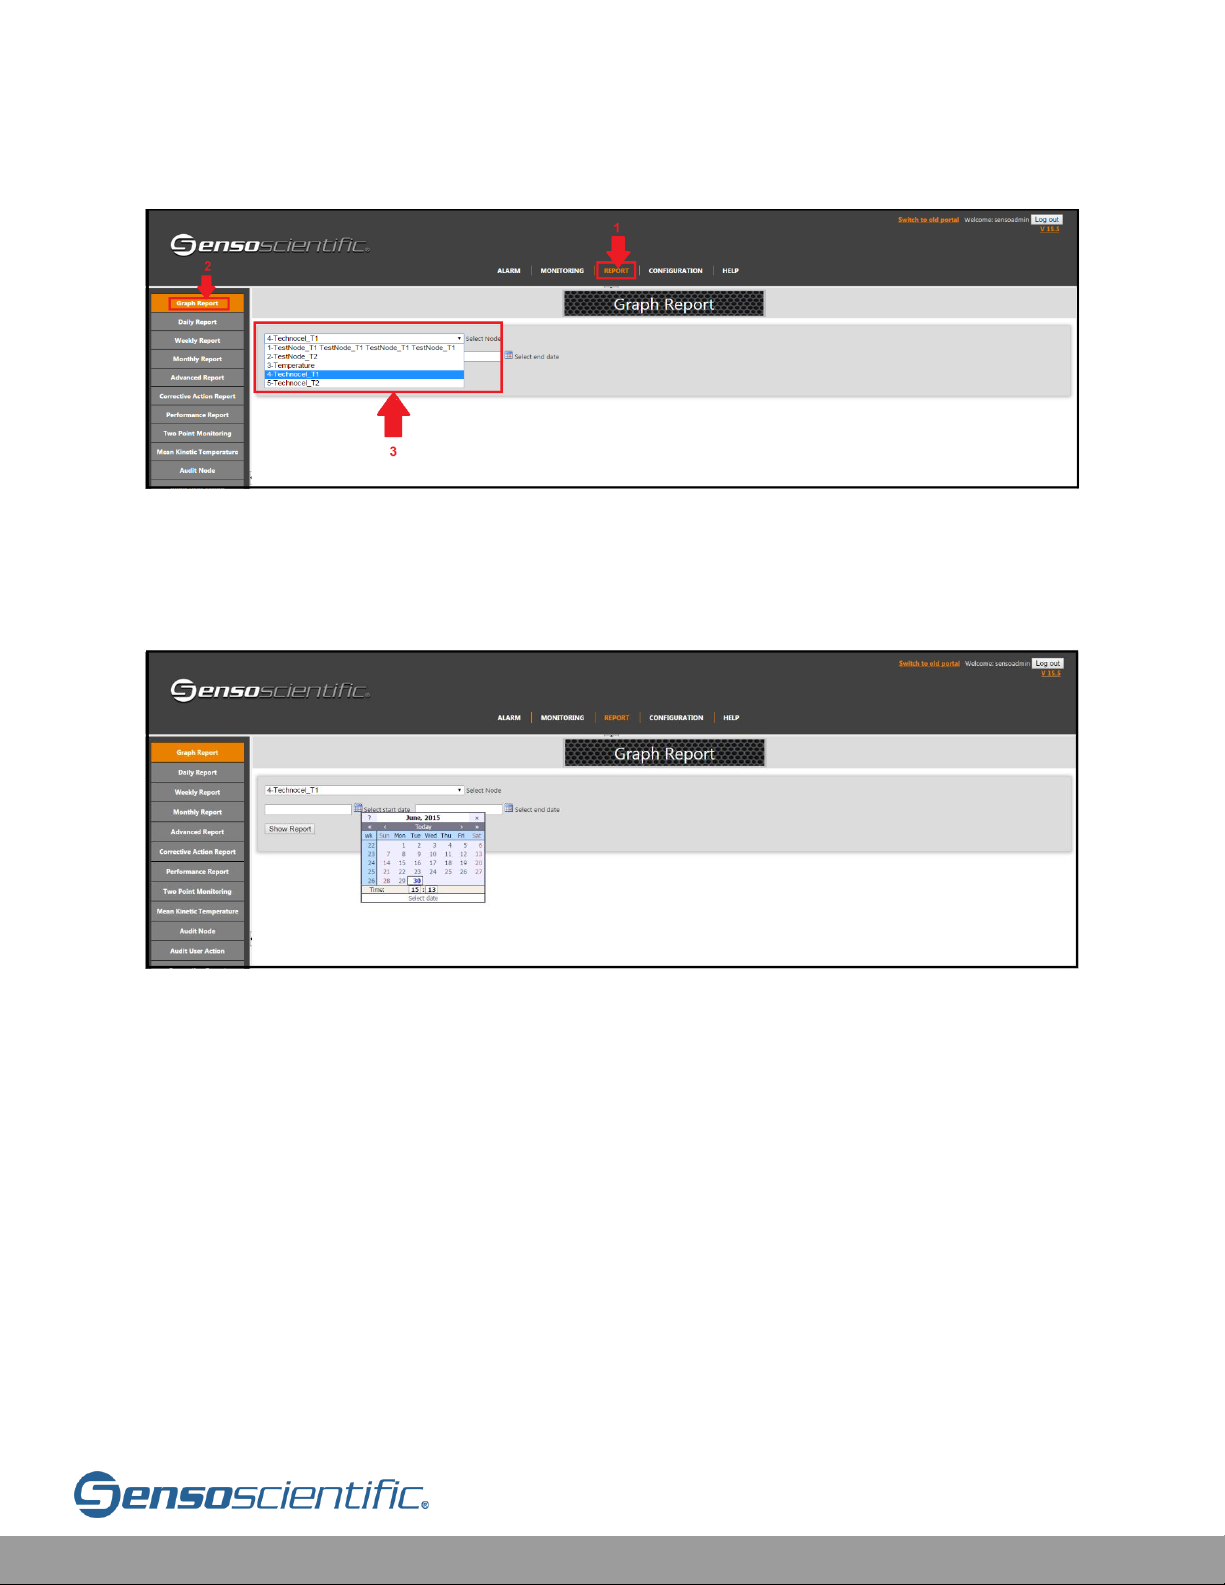
Select the node to graph. Only one node can be run at a time.
Figure VI.1-2: Node Selection
Select the time scope. To run a specific time frame, the time should be selected first,
followed by the calendar date. The maximum time frame is 60 days.
Figure VI.1-3: Select Time Scope
Page 62
Cloud User Manual V20.6 62
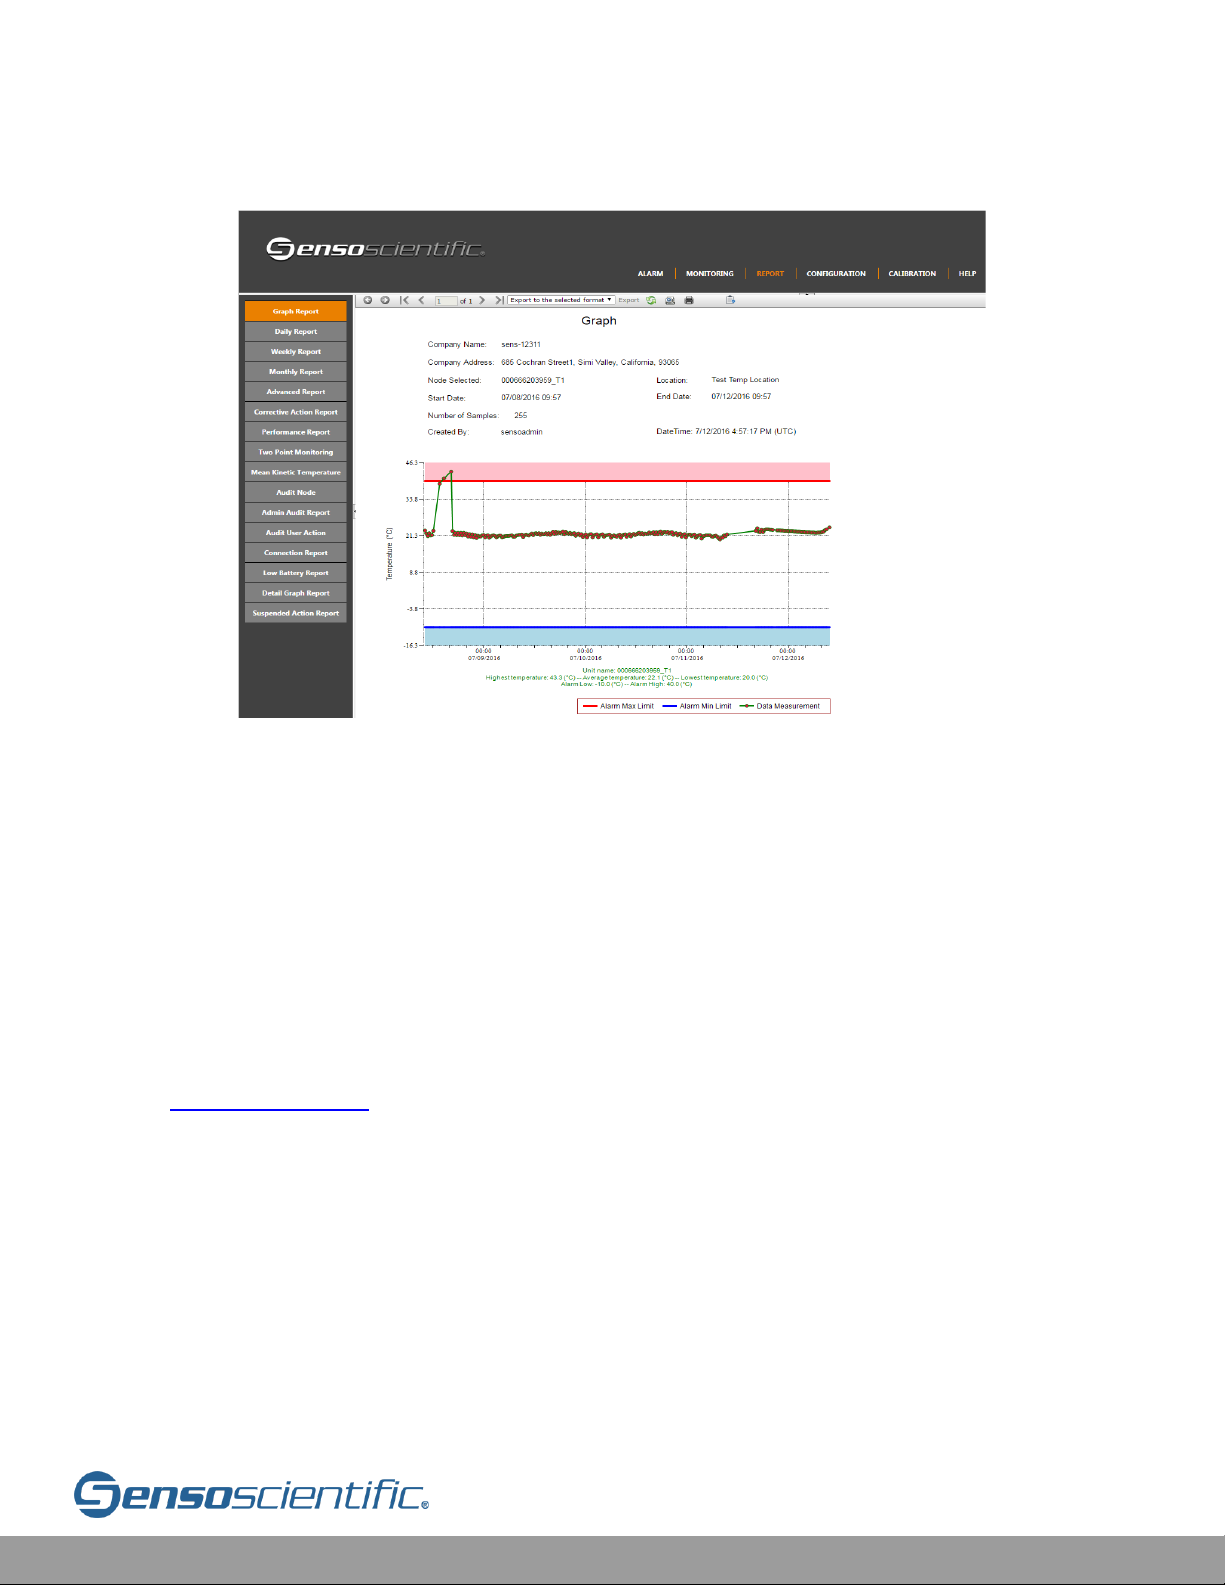
The graph of the selected node and date range will populate as shown below:
Figure VI.1-4: Graph Display
The graph includes: Company name and address, Node Selected, start and end
date/time, the user creating the report, as well as a time stamp. The graph displays
both the maximum (red) and minimum (blue) temperature limits and the data point
reading are green dots. Dates and time are displayed on the bottom of the graph.
Below the graph there is a high, low, and average temperature readout.
VI.2 Daily/Weekly/Monthly Reports
Creating daily, weekly, or monthly reports functions similarly to the example shown
in VI.1 Graph Report. The difference between them is in the date range required. For
Daily, Weekly, and Monthly Reports, only the start date is required. The report will
then run one Day, Week, or Monthly as determined by the selection. To create
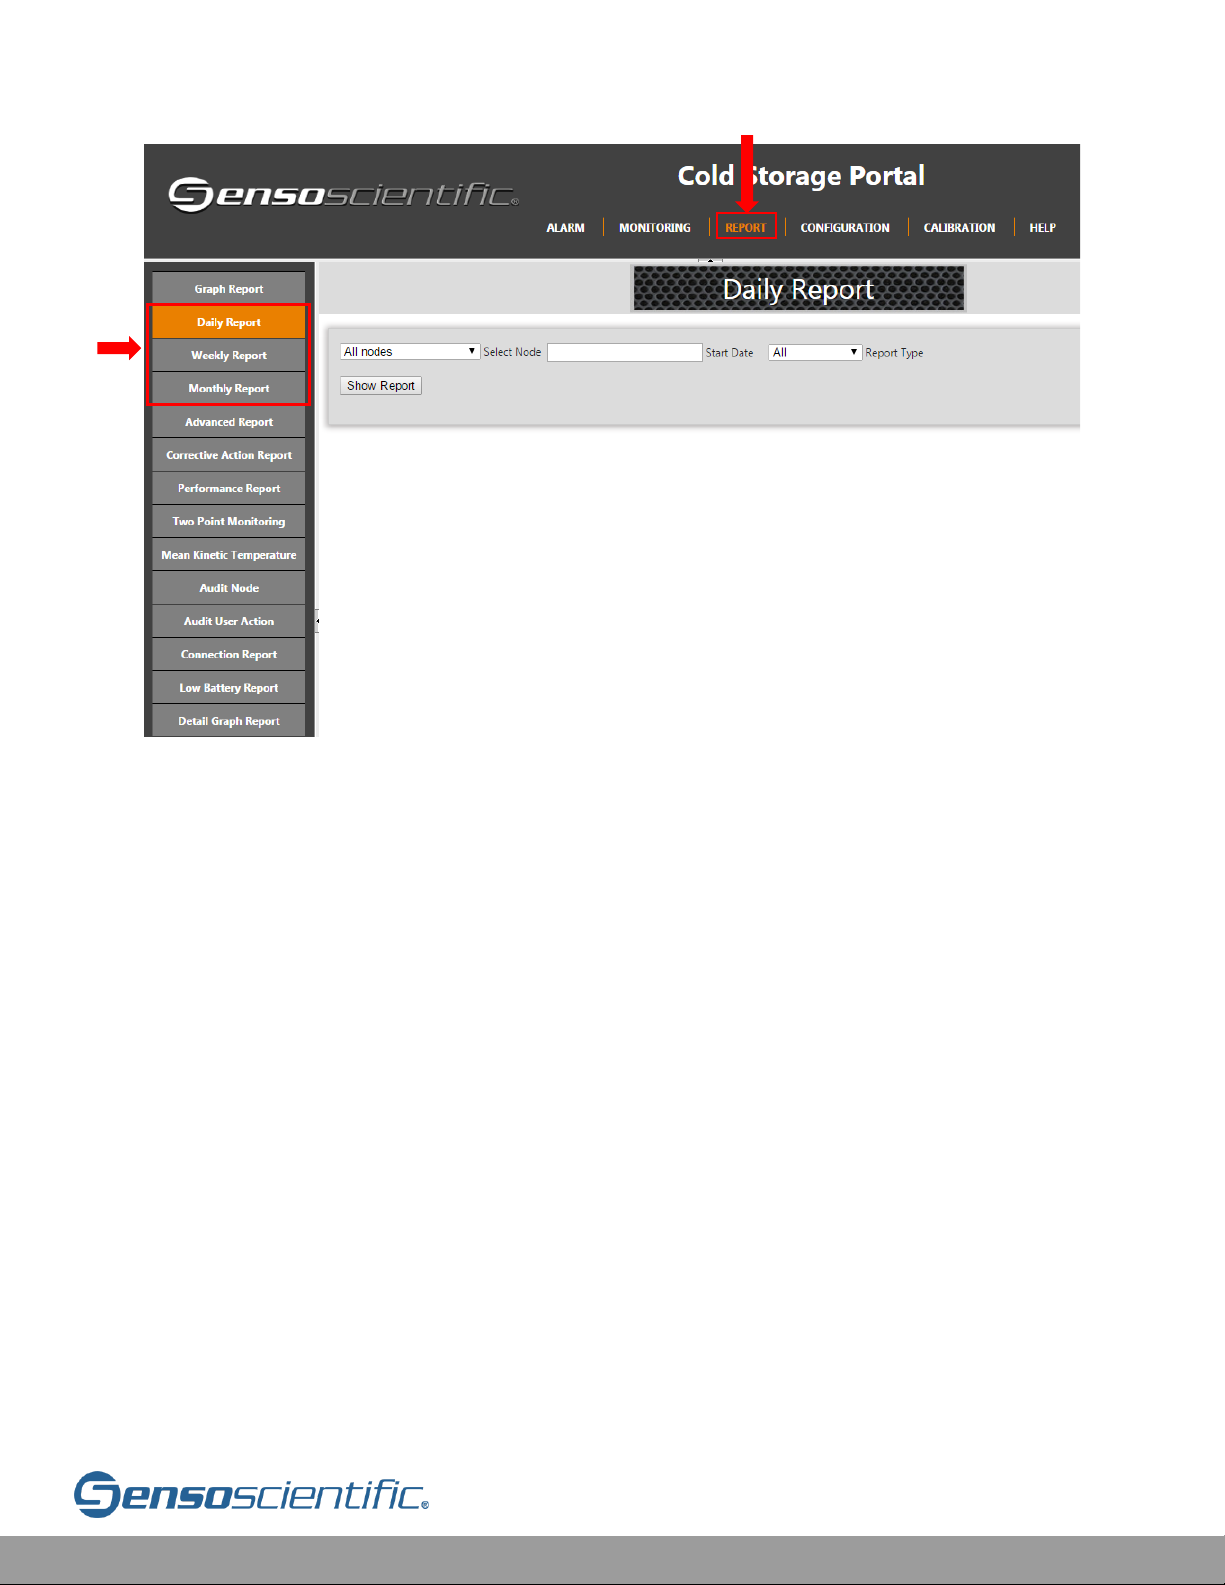
reports, select “REPORT” from the main menu, from the left sub menu, select from
“Daily Report”, “Weekly Report”, or “Monthly Report”. Once the type of report has
been selected, the page will display a drop-down menu where individual nodes or all
nodes can be selected. The report type allows you to select All, In Range, and Out of
Range data points.
Page 63
Cloud User Manual V20.6 63
Figure VI.2-1: Report Menu
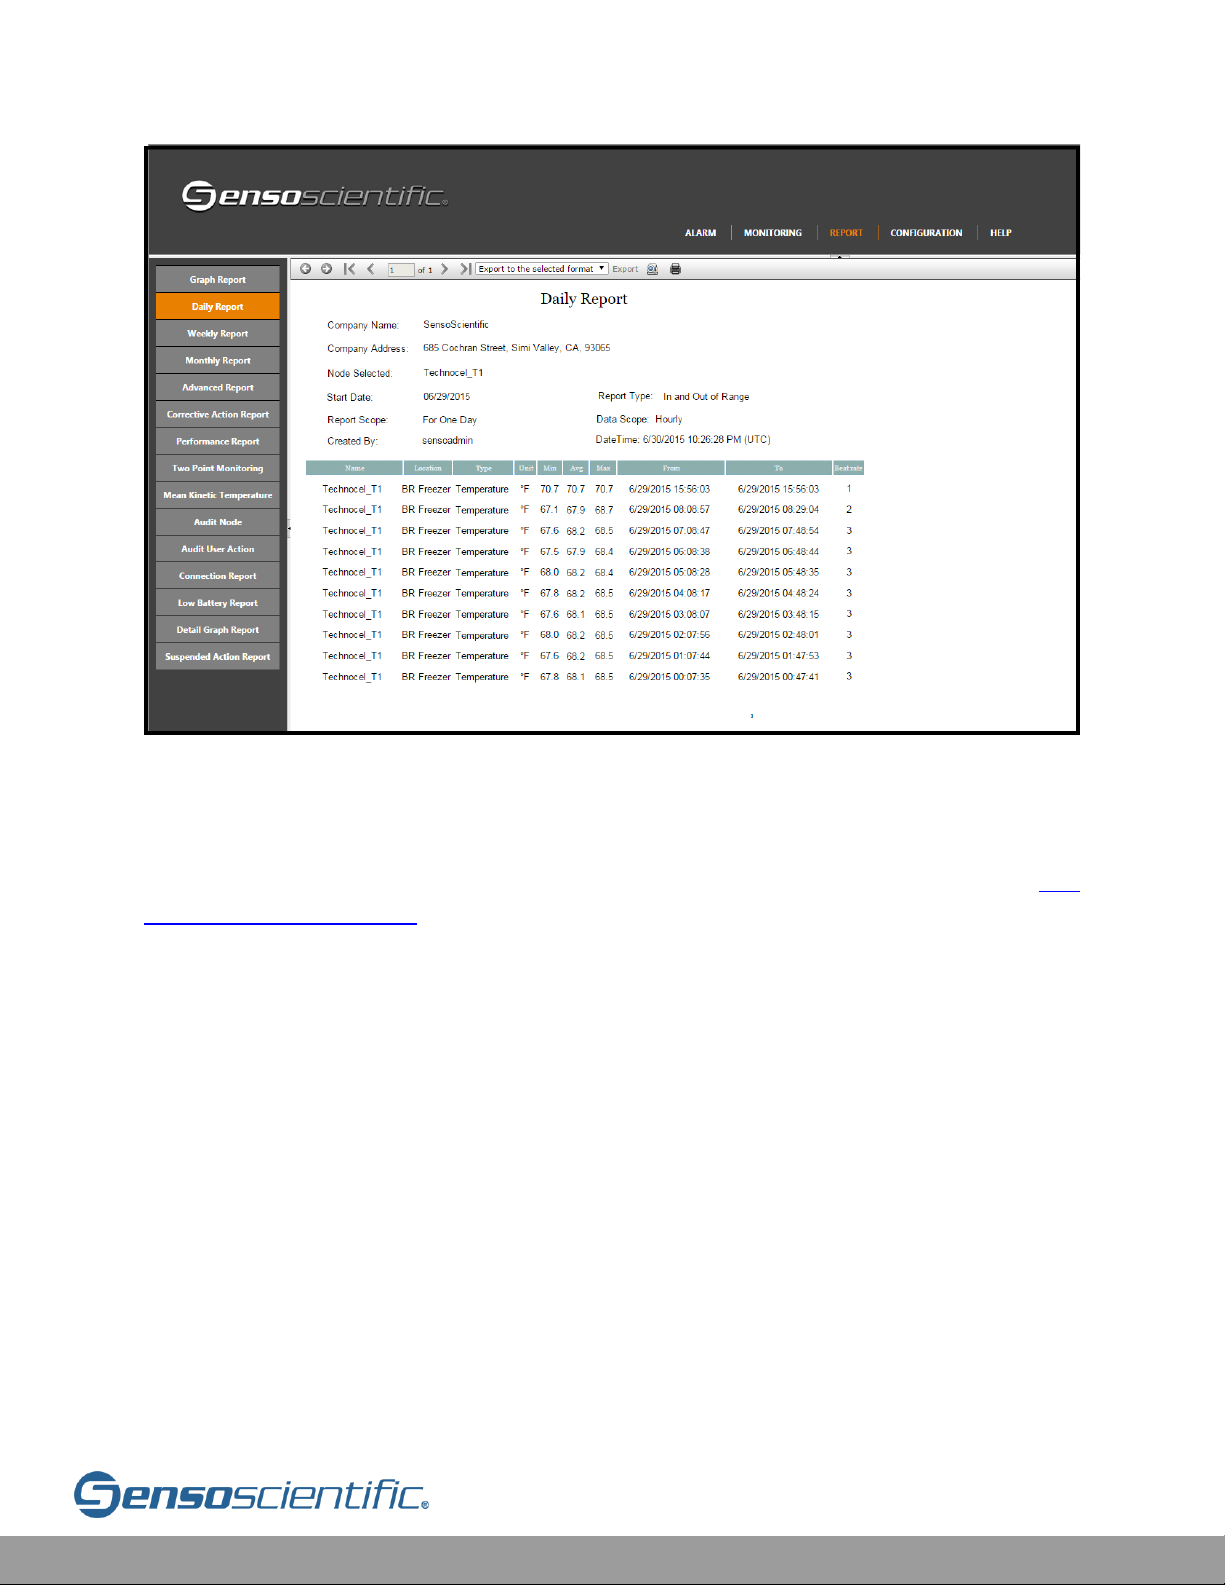
As with the Graph Report, when the reports have been generated, it will display
company information, creator of the report, time stamp, and node name. This, of
course, includes the data values in the specified time frame.
Change the page number (if multiple pages are returned) by selecting the right/left
arrow or entering a page number at the top of the page.
1
2
Page 64
Cloud User Manual V20.6 64
Figure VI.2-2: Report
SensoScientific recommends running a Corrective Action report in the same time
frame when running the Daily, Weekly, or Monthly Reports with the same time frame
to show a complete record of actions taken along with the data recorded (See VI.4
Corrective Action Report).
VI.3 Advanced Report Setting
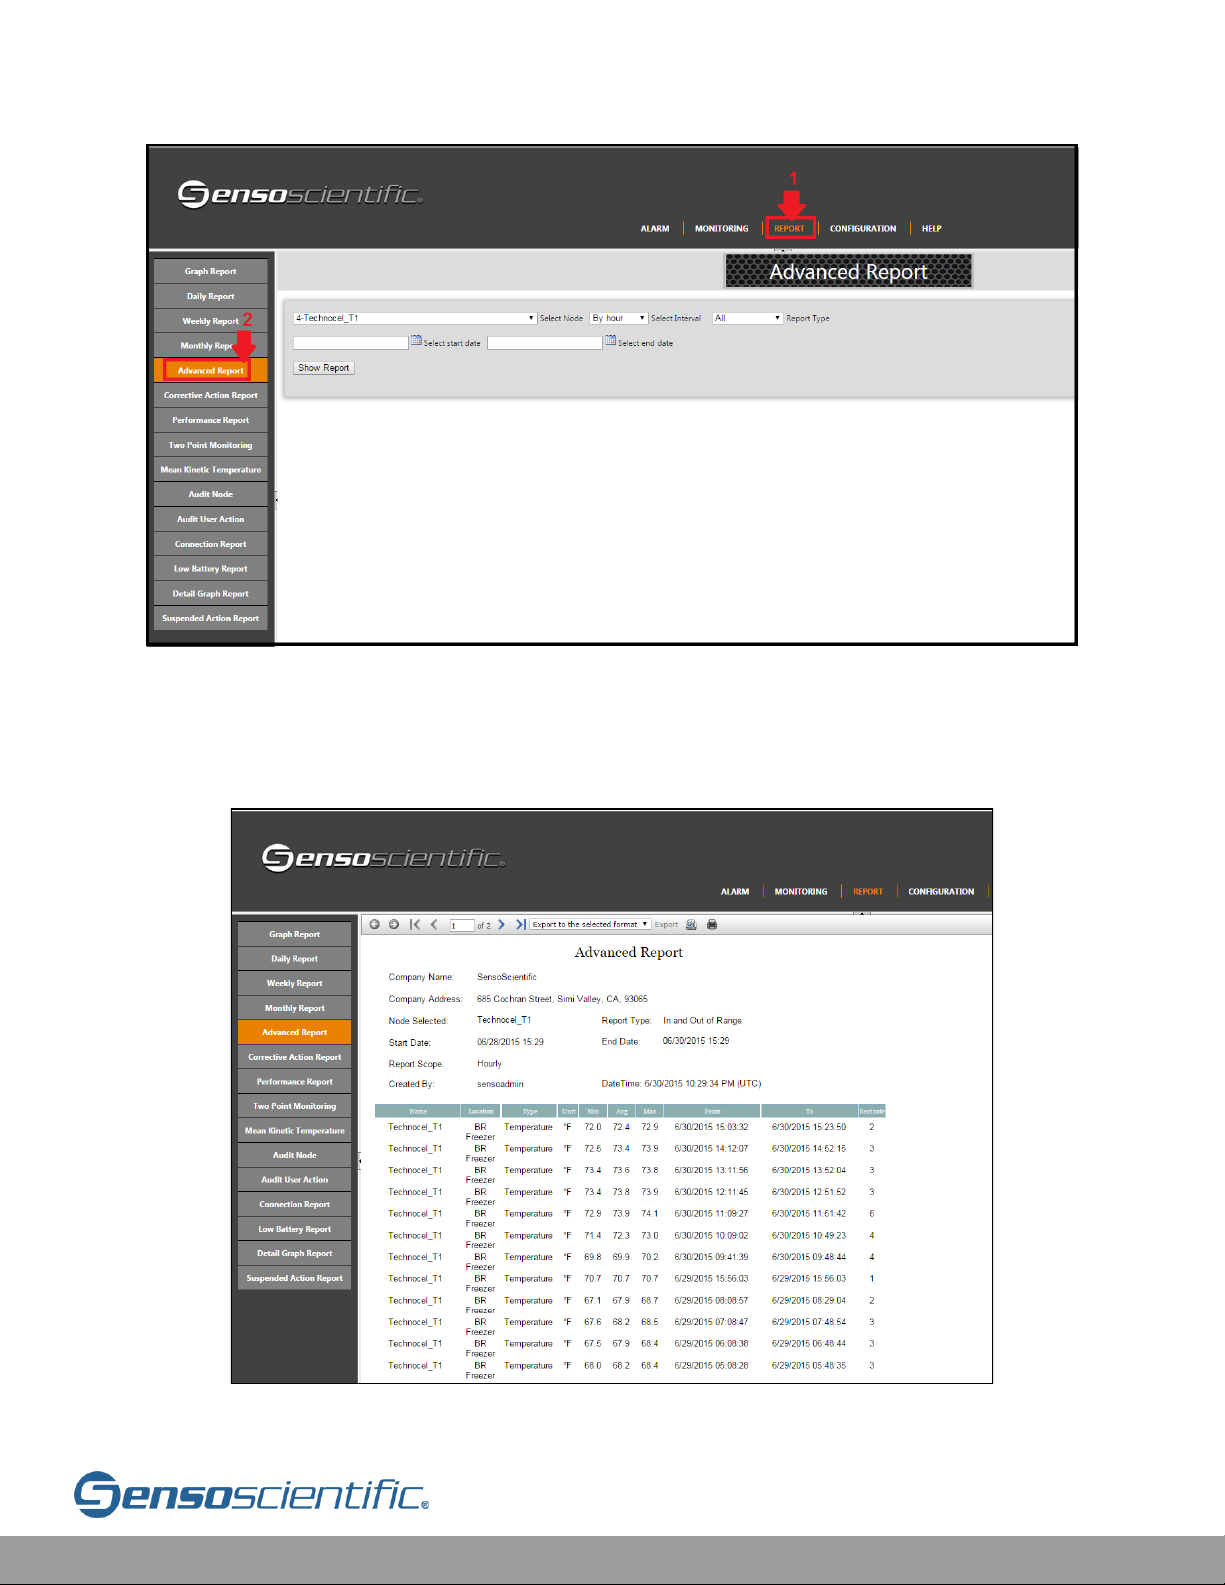
An advanced report gives the ability to run a more detailed report. It displays every
time a data reading was taken by each individual node. In addition, it shows the
Minimum, Average, and Maximum reading the node had at that moment. To access
this report, select REPORT from the main menu. Click on “Advanced Report” form
the sub menu.
Select the Node, Interval, Report Type, and Start/End date then click “Show Report”.
Page 65
Cloud User Manual V20.6 65
Figure VI.3-1: Advanced Report Settings
This detailed report displays company information, calendar date and time frame,
interval of each node(s) selected, the user creating the report and a time stamp.
Figure VI.3-2: Advanced Report
Page 66
Cloud User Manual V20.6 66
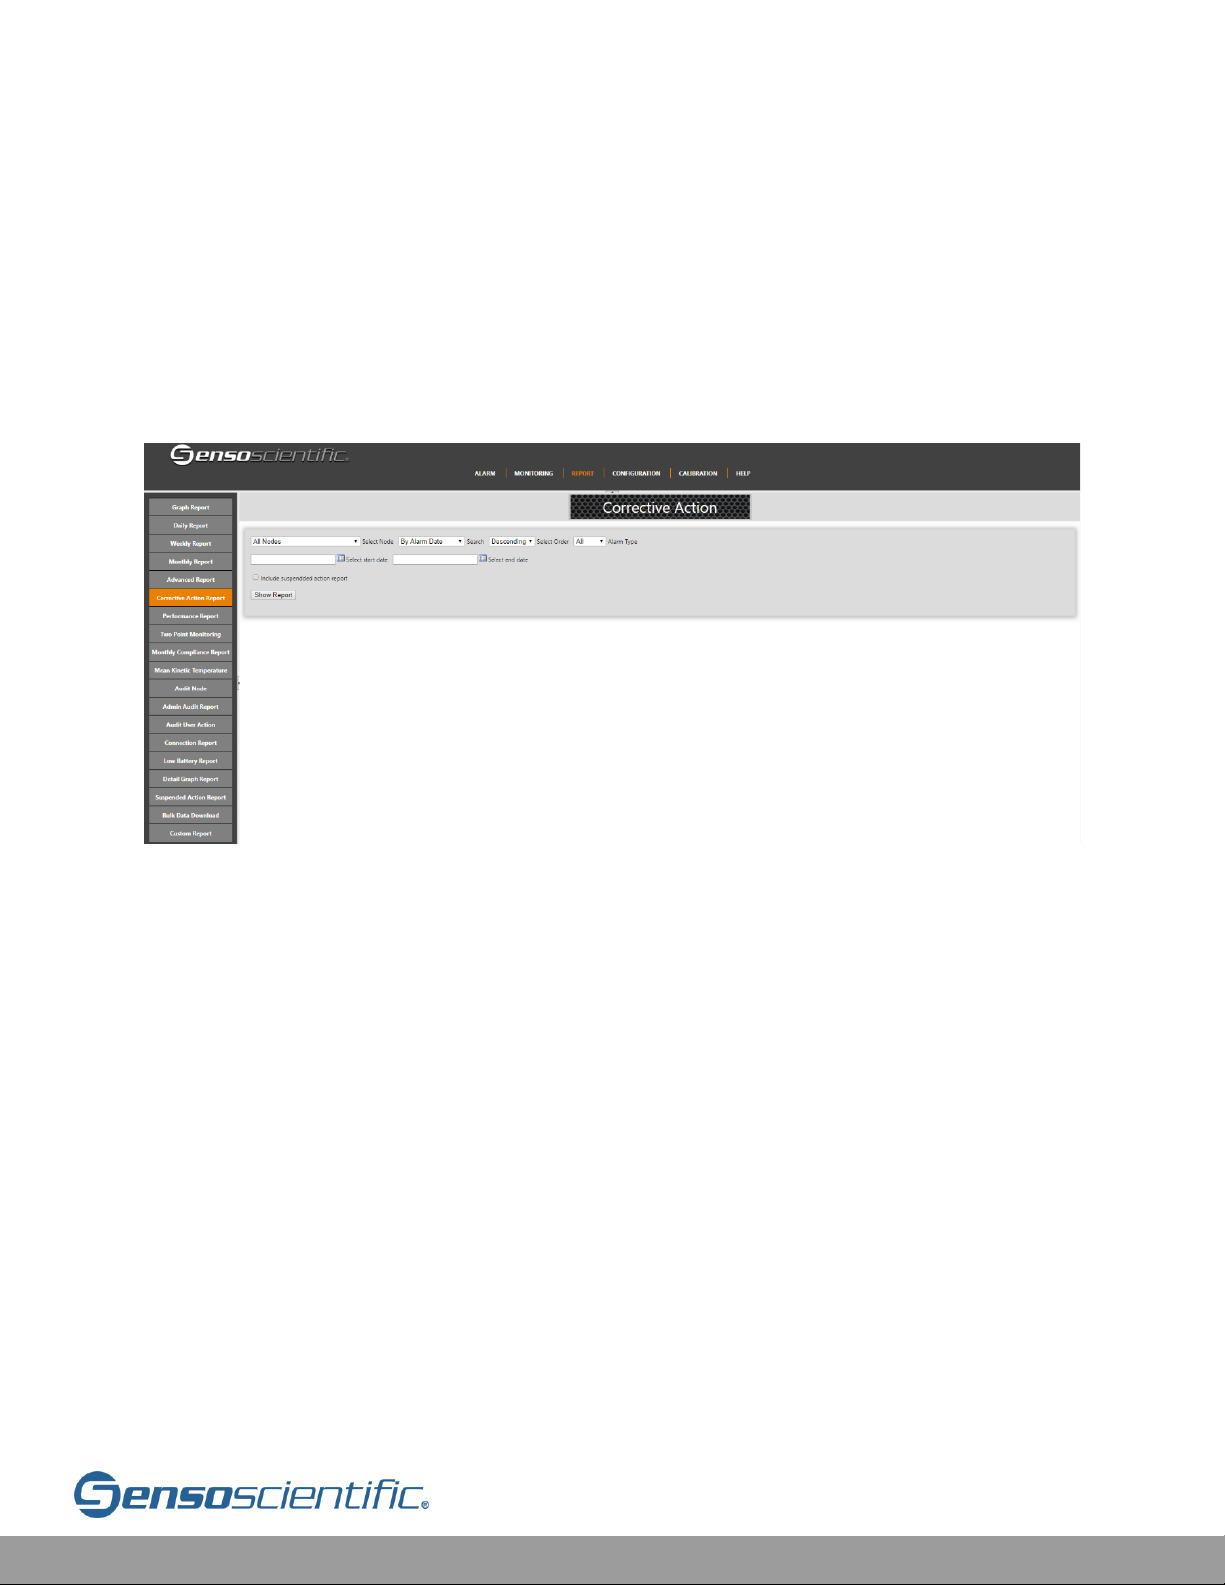
VI.4 Corrective Action Report
A Corrective Action report is generated to display the alarm history and corrective
action that was made to correct an alarm/excursion. From the main menu choose
REPORT and then select “Corrective Action Report” from the left sub menu. From
the drop-down menu, select desired node(s). The report allows for sort in
Ascending/Descending order of Alarm Trigger Date or Alarm Confirmation Date
primarily.
Figure VI.4-1: Corrective Action Report Settings
As with other reports – company Information, calendar date (time frame), creator of
the report, and a time stamp will populate on the report header. It additionally shows
Sort By and Select Order.
You also have the option to view all suspended actions by marking the checkbox next
to the “Include suspended action report” field.
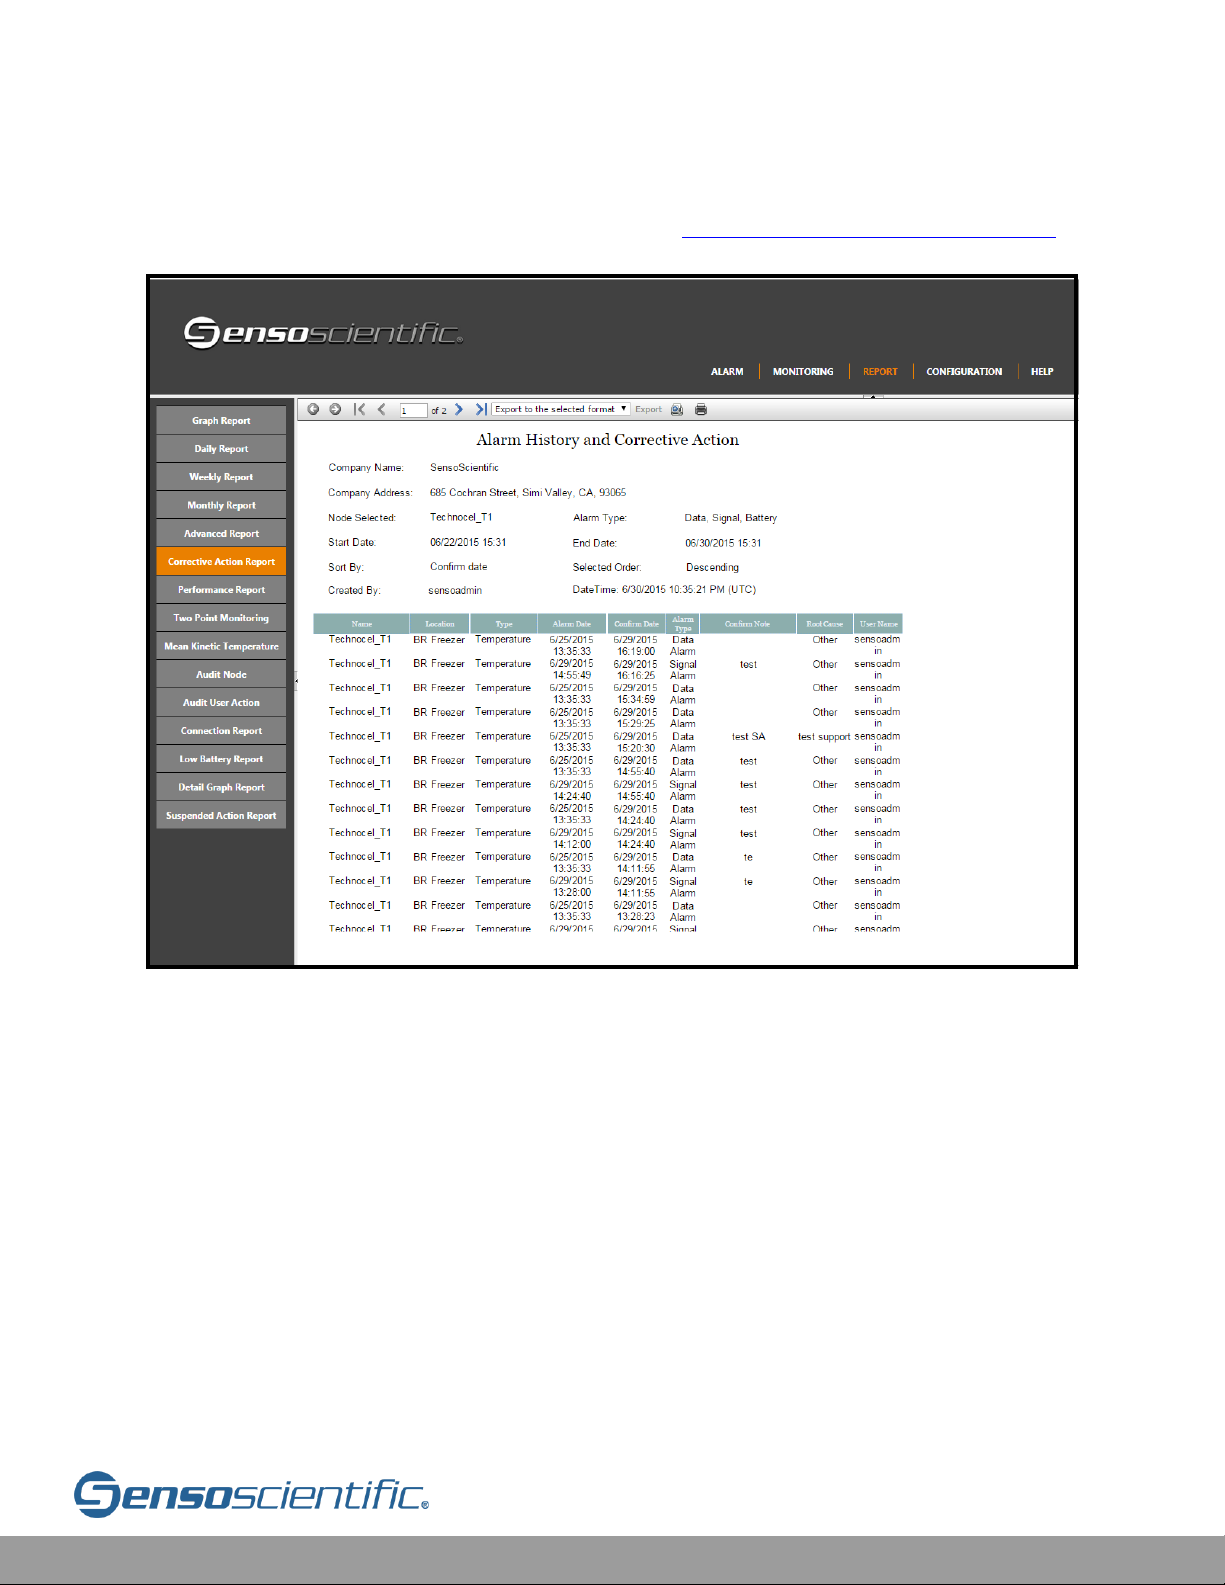
Once run, the report will show the node name, the time, and date that the node was
alarmed. It will describe the type of alarm (data/signal/battery) that was generated
and the time/date it was confirmed. The user who confirmed the alarm will be
indicated as well as the corrective action note stating the action that was taken by
the user to correct the alarm. The Root Cause is also displayed for recurring issues
(i.e. Open Door). The user can display a graph of the actual readings of the node as
well.
Page 67
Cloud User Manual V20.6 67
SensoScientific recommends running a corrective action report when creating a daily,
weekly, or monthly report with the same time frame to show a complete record of
actions taken along with the recorded data (See VI.2 Daily/Weekly/Monthly Report)
.
Figure VI.4-2: Corrective Action Report
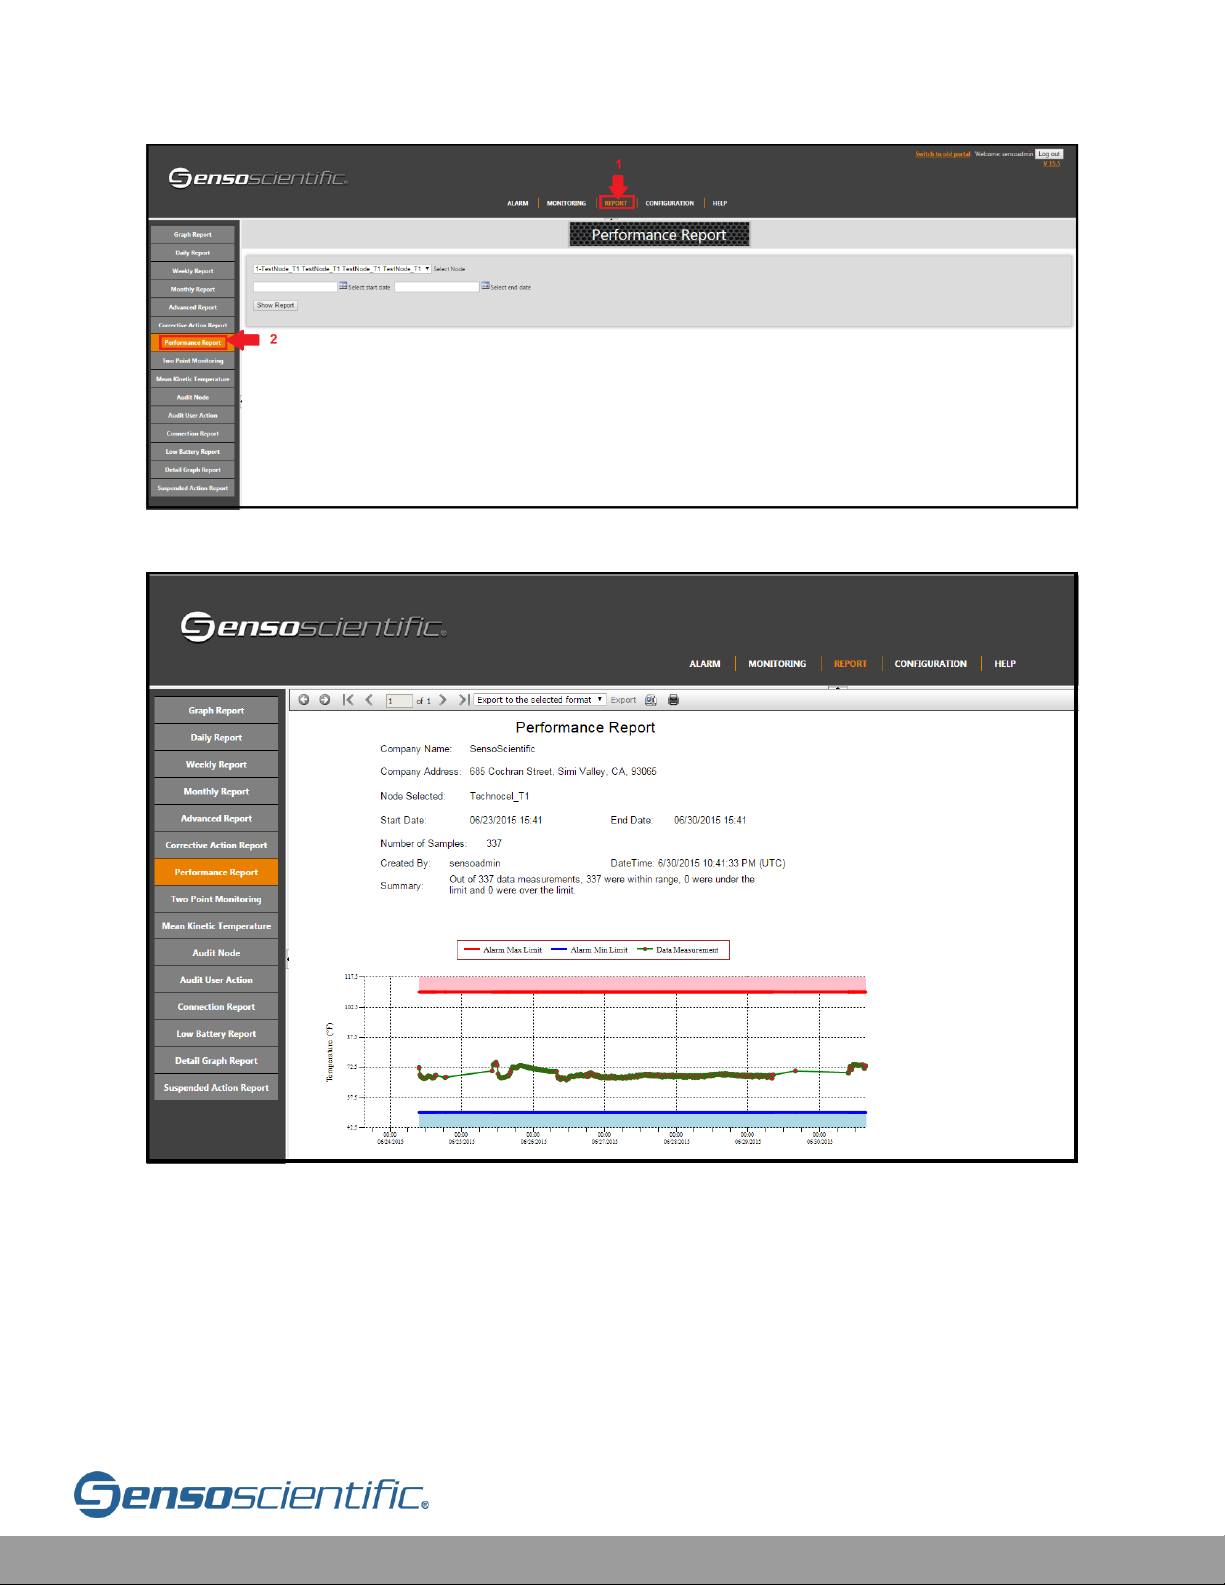
VI.5 Performance Report
The Performance Report helps users to test the performance of their units
(refrigerators/freezers). From the main menu choose REPORT and then select,
“Performance Report” from the left sub menu. Select node(s) and calendar start and
end date/time. When completed click on “show report.”
Page 68
Cloud User Manual V20.6 68
Figure VI.5-1: Performance Report Settings
Figure VI.5-2: Performance Report
Page 69
Cloud User Manual V20.6 69
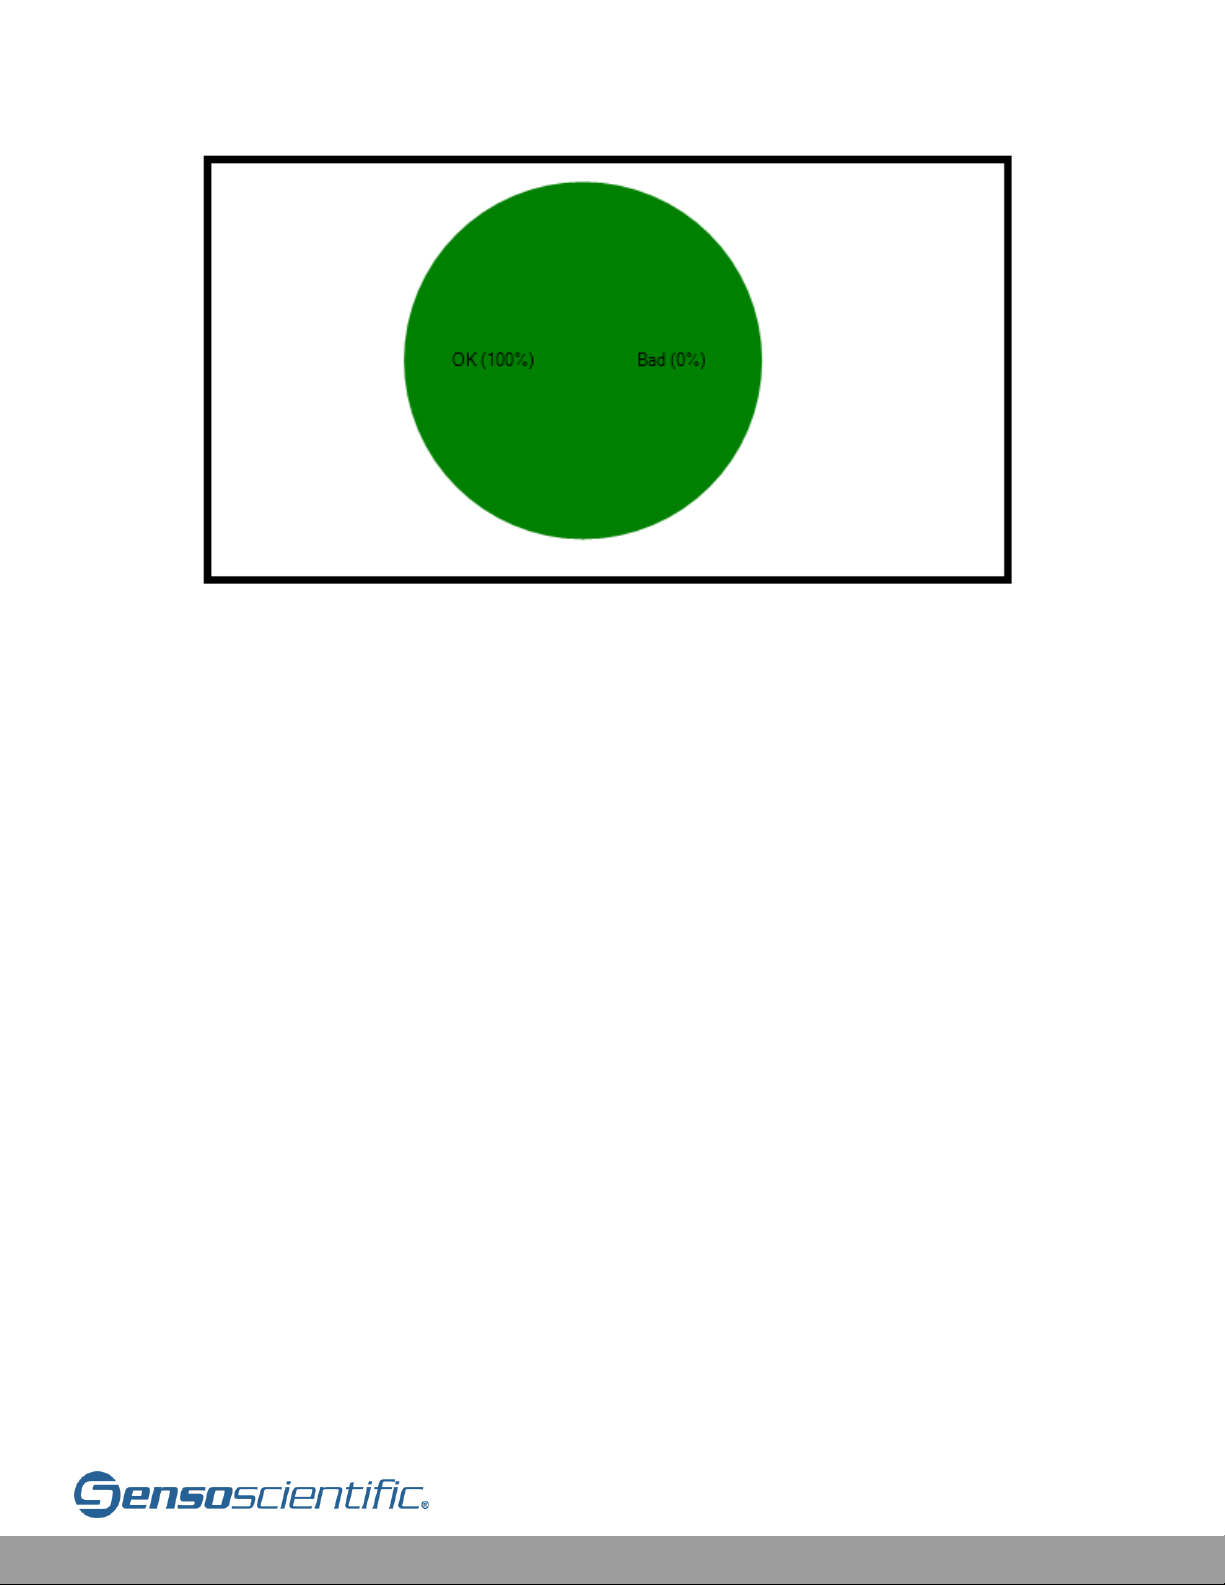
Figure VI.5-3: Performance Pi Chart
The report will display the Company information, date/time scope, user creating the
report, and a time stamp. It states the number of measurements in and out of range
in a graph and percentage populated by a pie chart.
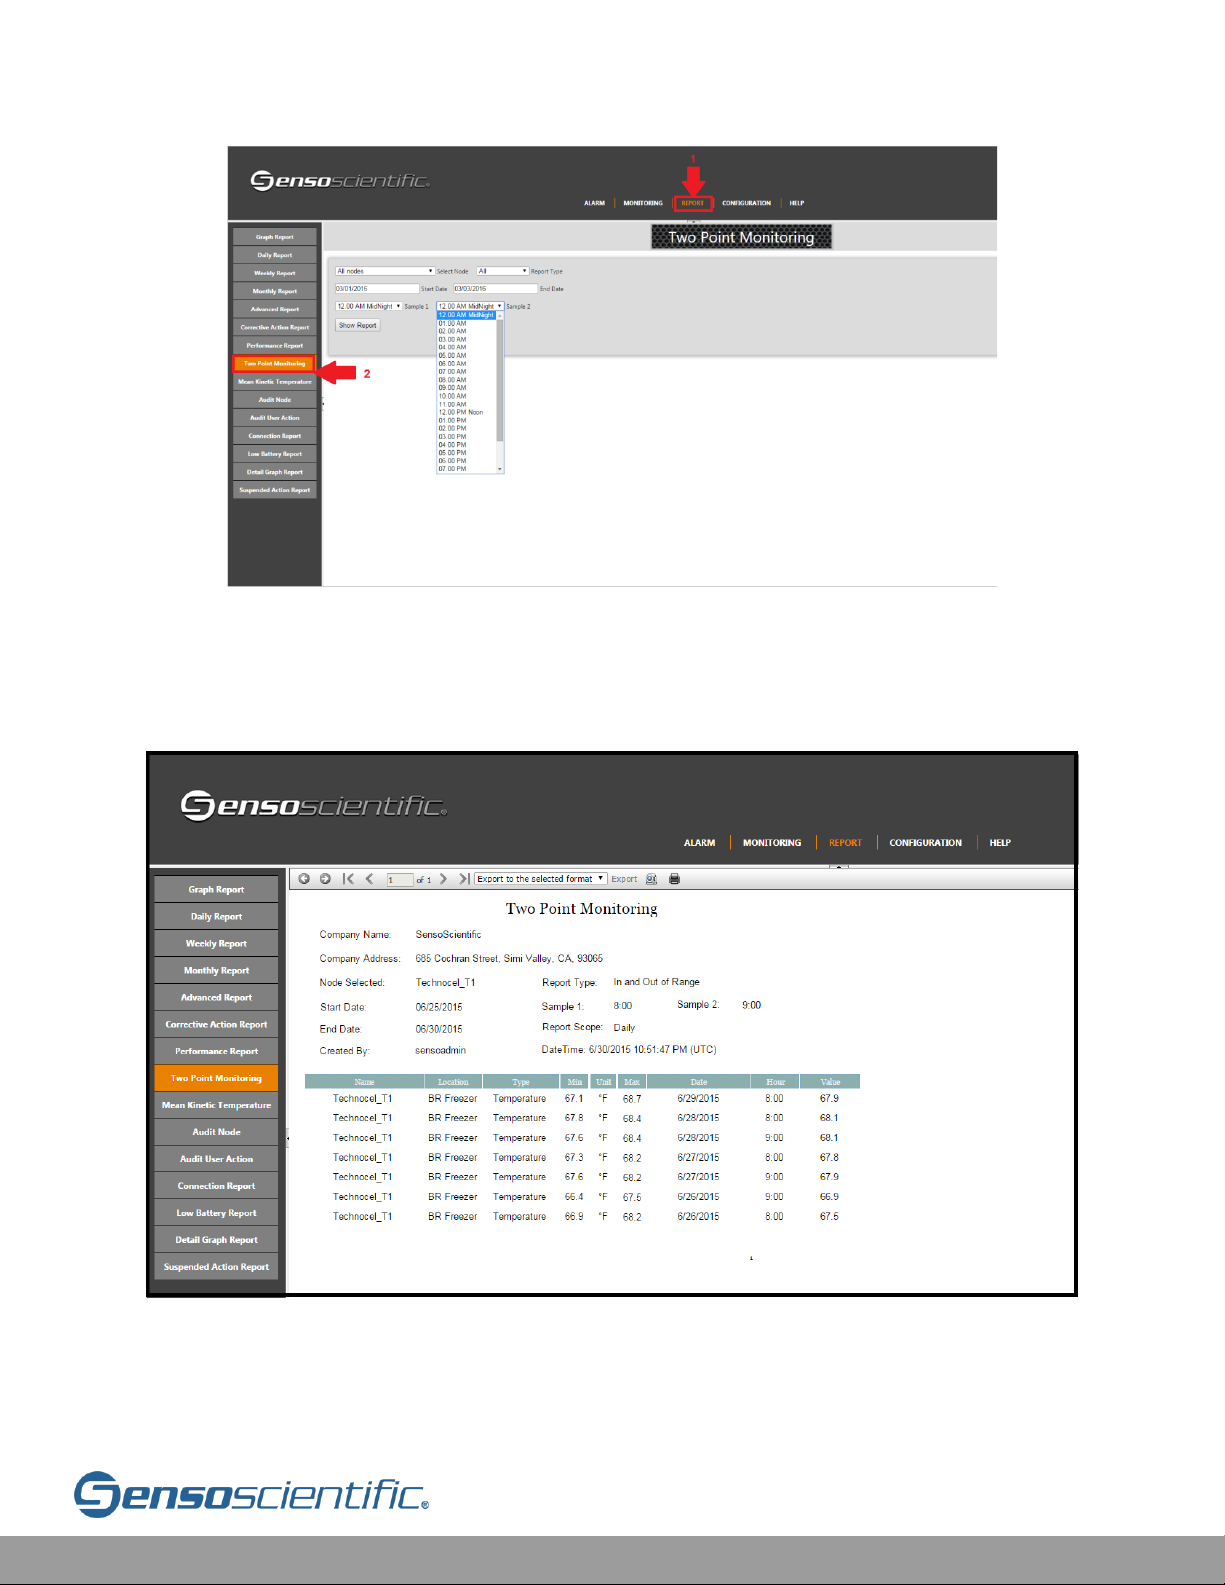
VI.6 Two Point Monitoring
The Two Point Monitoring report helps the user to view the readings of their units
(refrigerators/freezers) at two specific times each day. These times are specified by
the user running the report. From the main menu choose REPORT and then, select
“Two Point Monitoring” from the left sub menu. Select node(s), calendar date, and
the sample points (24 Hour Clock). When completed, click on the “Show Report”
button.
Page 70
Cloud User Manual V20.6 70
Figure VI.6-1: Two Point Monitoring Settings
In the figure below, the Two Point Monitoring report is shown. The minimum (Min),
maximum (Max), and closest value (Value) of temperature are displayed.
Figure VI.6-2: Two Point Monitoring Report
Page 71
Cloud User Manual V20.6 71
VI.6.a Automatic Two Point Monitoring
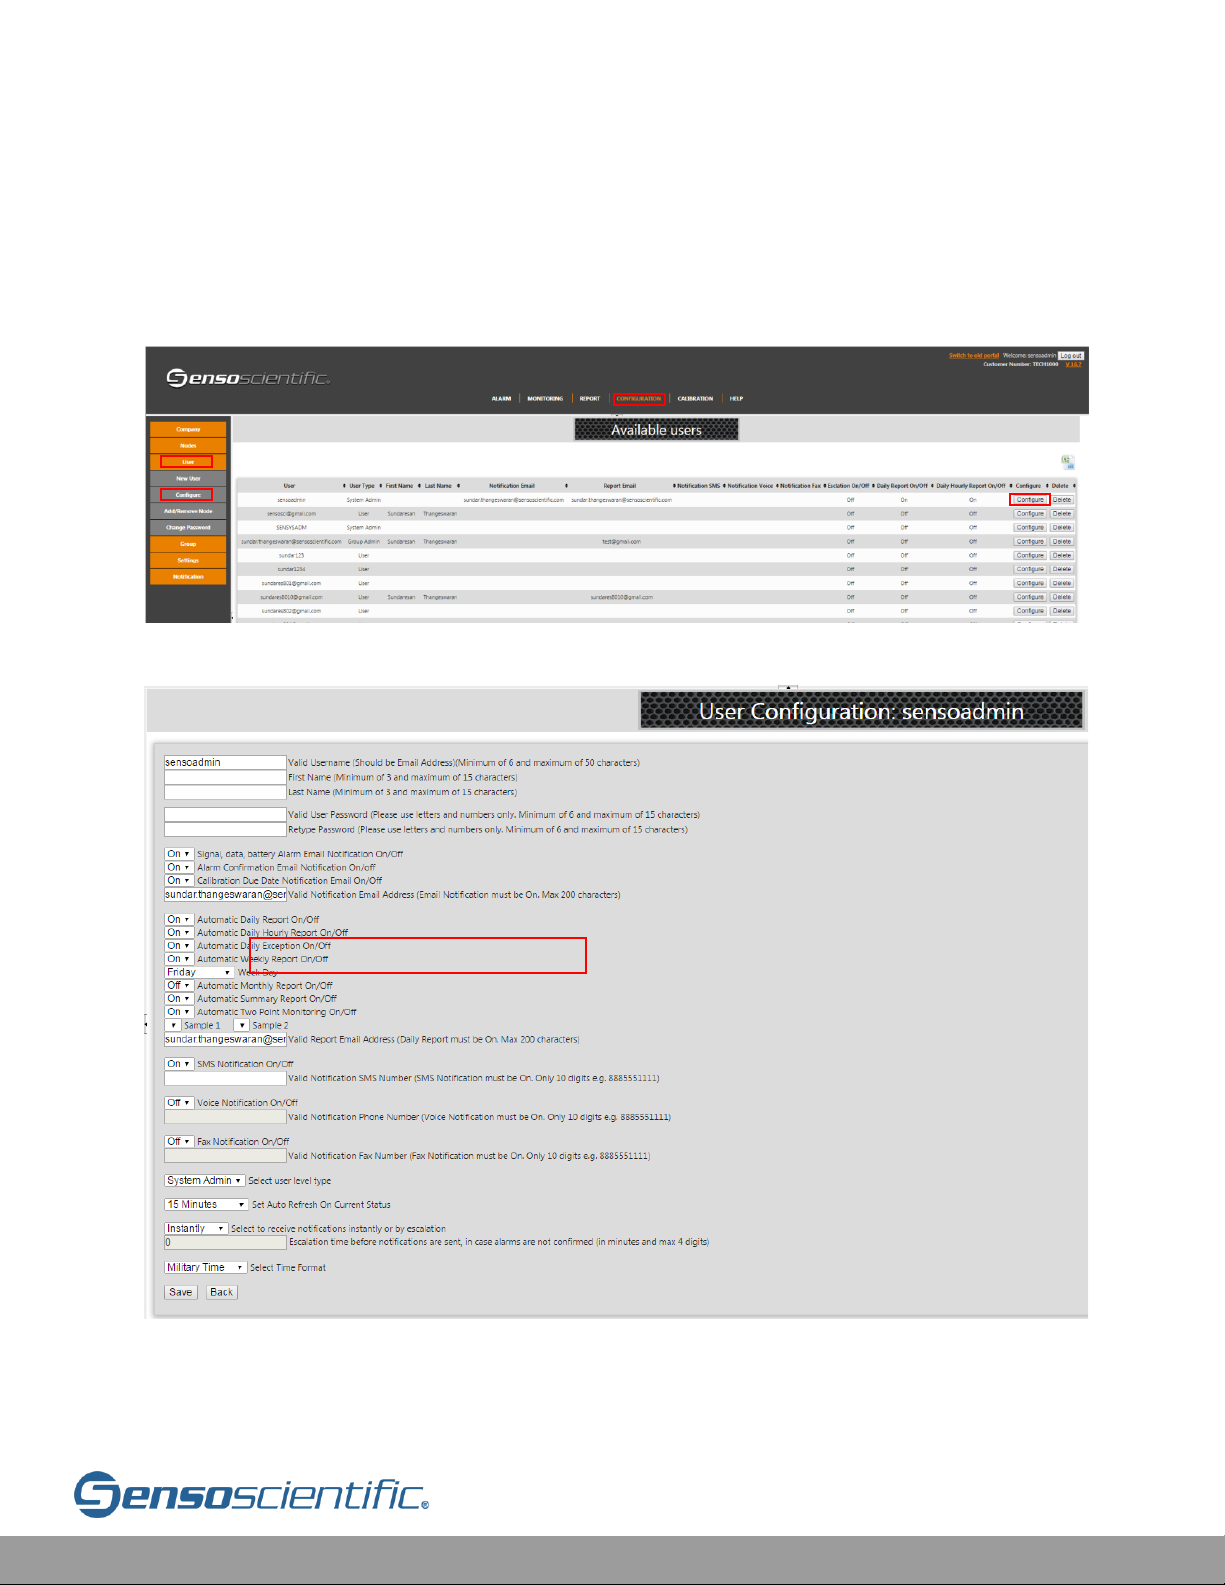
Two Point Monitoring is a feature which allows for a two-point monitoring report to
be sent via email to a designated user. If turned on, this report will be sent daily.
To turn on this feature, Go to: CONFIGURATION > User > Configure
Figure VI.6.a-1: User Configuration
Figure VI.6.a-2: Two Point Monitoring
2
3
4
Page 72
Cloud User Manual V20.6 72
VI.7 Mean Kinetic Temperature Report
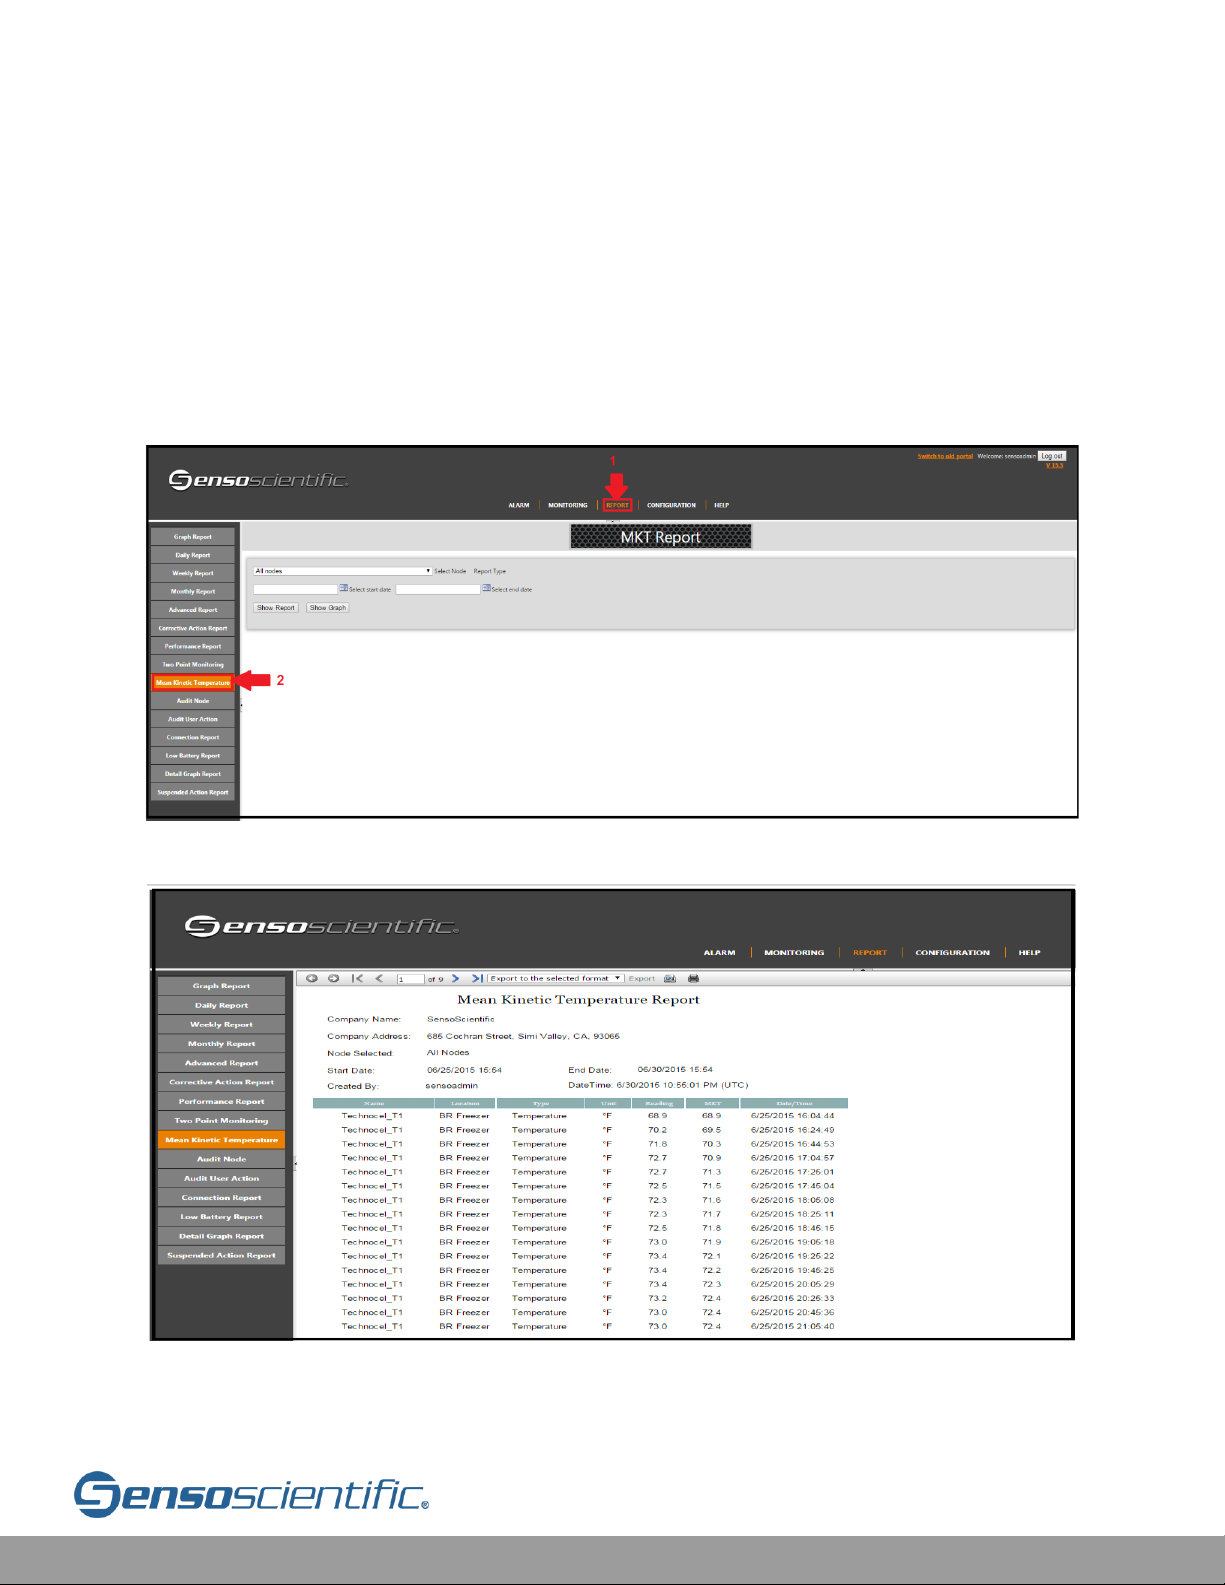
The Mean Kinetic Temperature exports the mean kinetic temperature of the data at
each time. From the main menu choose REPORT and then, select “Mean Kinetic
Temperature” from the left sub menu.
Select node(s) and calendar date/time. When completed, click on the “Show Report”
or the “Show Graph” button.
Figure VI.7-1: Mean Kinetic Temperature Report Settings
Figure VI.7-2: Mean Kinetic Temperature Report
Page 73
Cloud User Manual V20.6 73
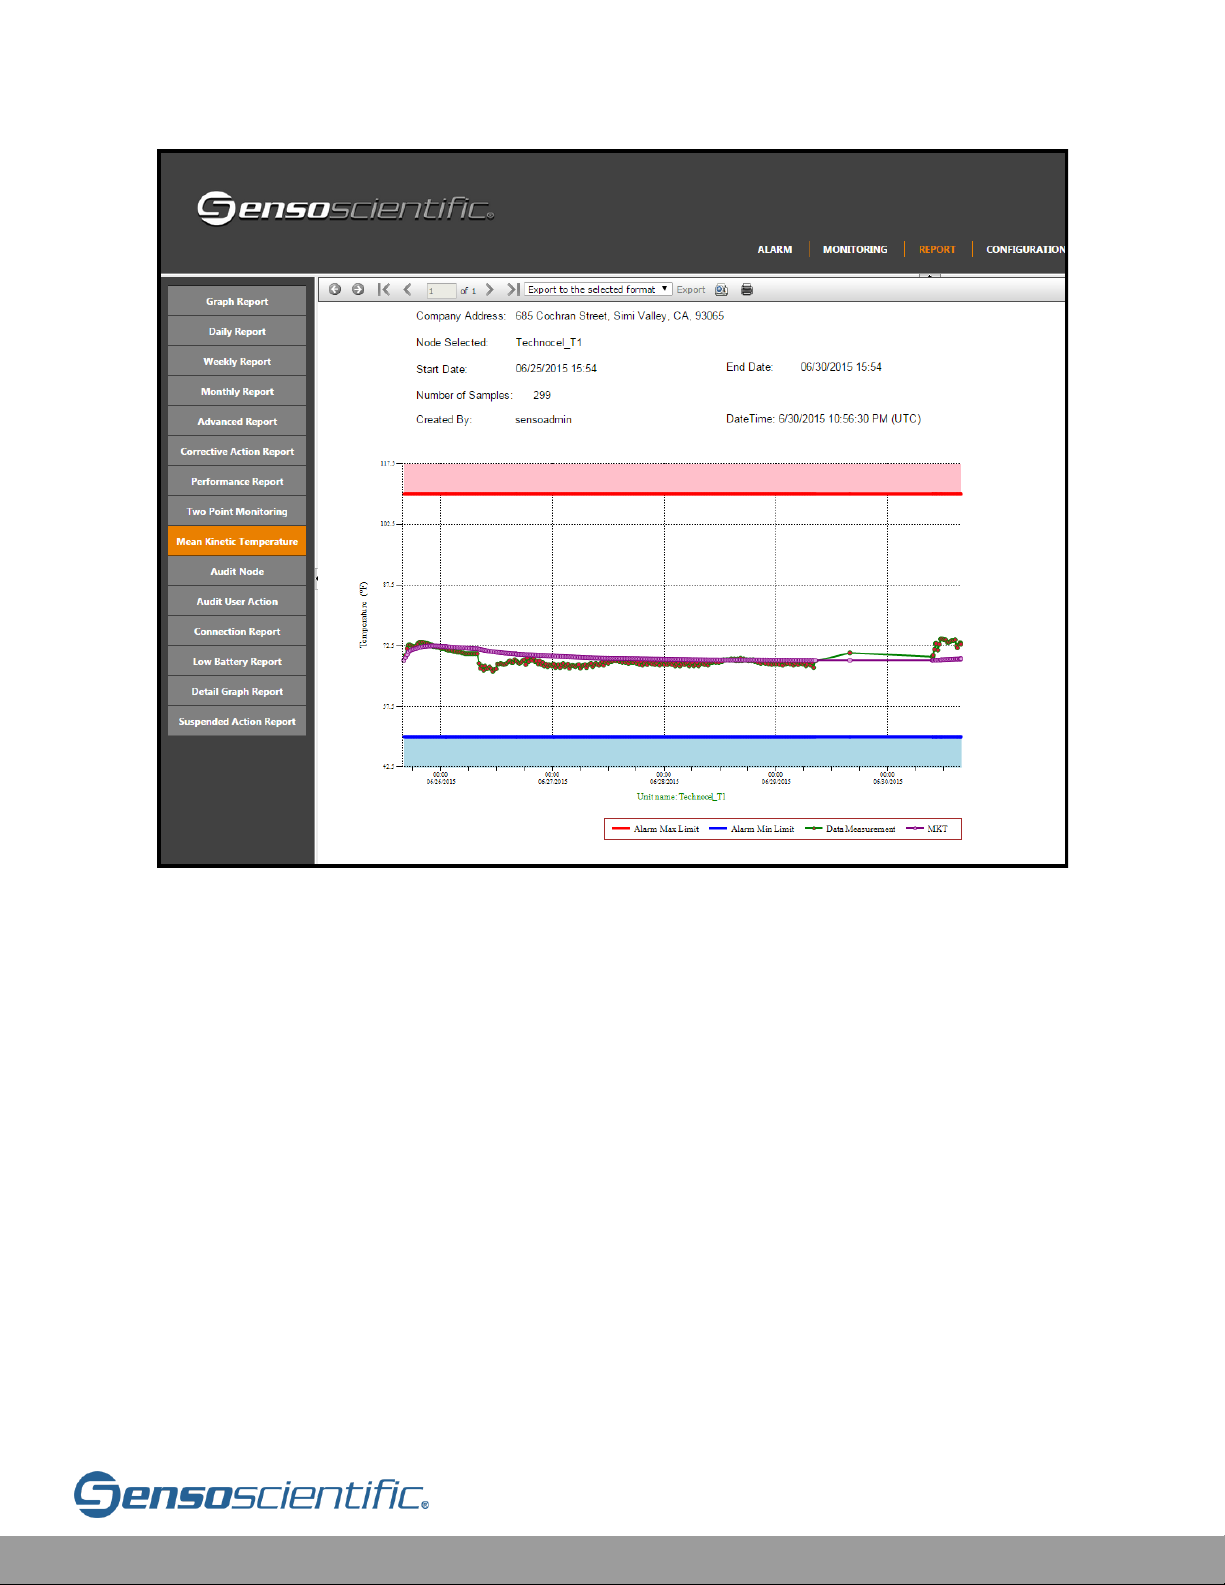
Figure VI.7-3: Mean Kinetic Temperature Graph Report
The report and graph will display the Company information, date/time scope, user
creating the report, a time stamp, data measurements, MKT. It states the
measurements in a chart and in a graph.
VI.8 Audit Node Report
The Audit Node Report helps the user capture one reading of a specific node at a
specific time while providing a user and time stamp, proving that the user logged in
and checked the status of the system.
This can be performed by going to “CONFIGURATION” from the main menu. Then,
from the left sub menu, click “Nodes” and then click “Configure” and then select the
desired node(s). Click the "Configure" button and scroll to the bottom where it reads
"Audit Node” and select ON and save the configuration.
Page 74
Cloud User Manual V20.6 74
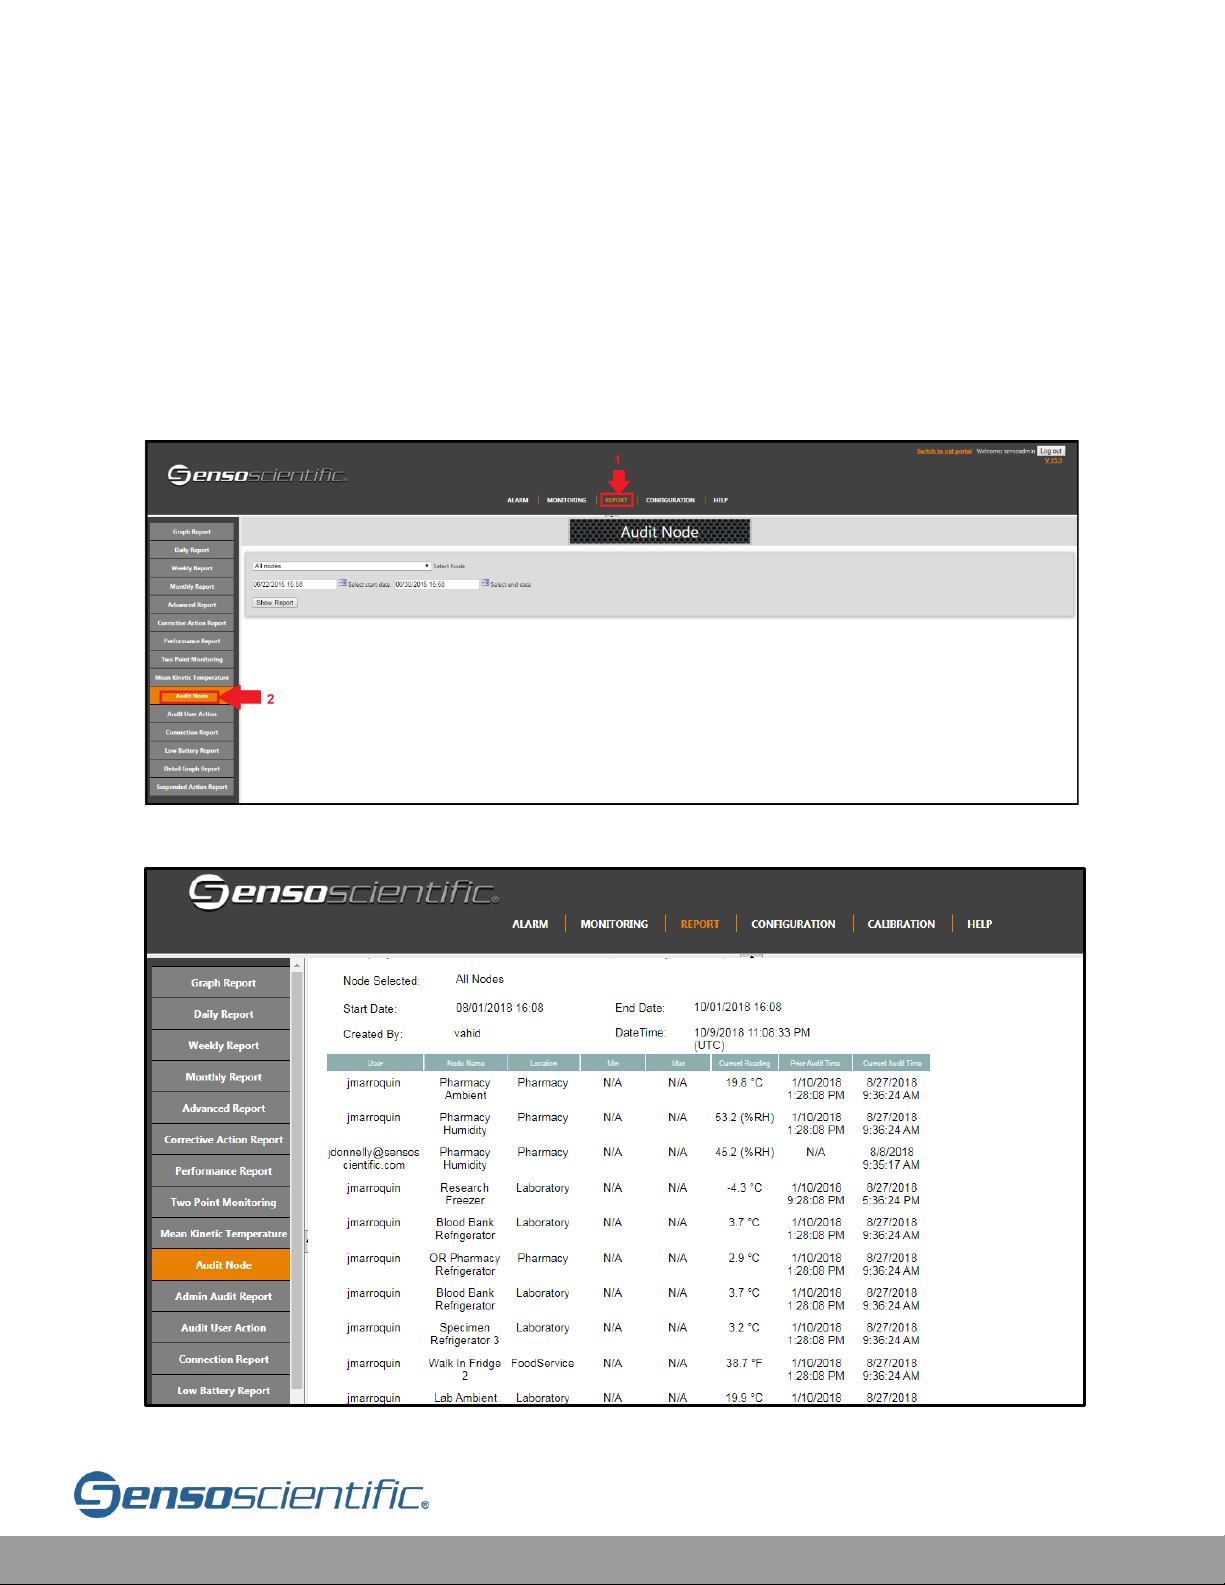
After that, the user can go to “Monitoring” and then check the box(es) of the node(s)
to be audited. Click the “Audit Node” button. Next, from the main menu choose
REPORT and then “Audit Node” from the left sub menu. Select node(s) and calendar
date/time. When completed, click on the “Show Report” button.
***PLEASE NOTE*** - Audit Node check box will be disabled if the Node has gone
more than 2 hours since connecting to the cloud. In this scenario, the Connectivity
Status will change to Disconnected.
Figure VI.8-1: Audit Node Report Settings
Figure VI.8-2: Audit Node Report
Page 75
Cloud User Manual V20.6 75
VI.9 Admin Audit Report
The Admin Audit Report feature allows the System Administrator to verify that a
report has been reviewed, approved or not approved. This feature gives the ability
for the user to create a paperless log.
Only the System Administrator can turn on this feature, and by default it is turned
off. From the main menu choose “CONFIGURATION” from the tabs on the top of the
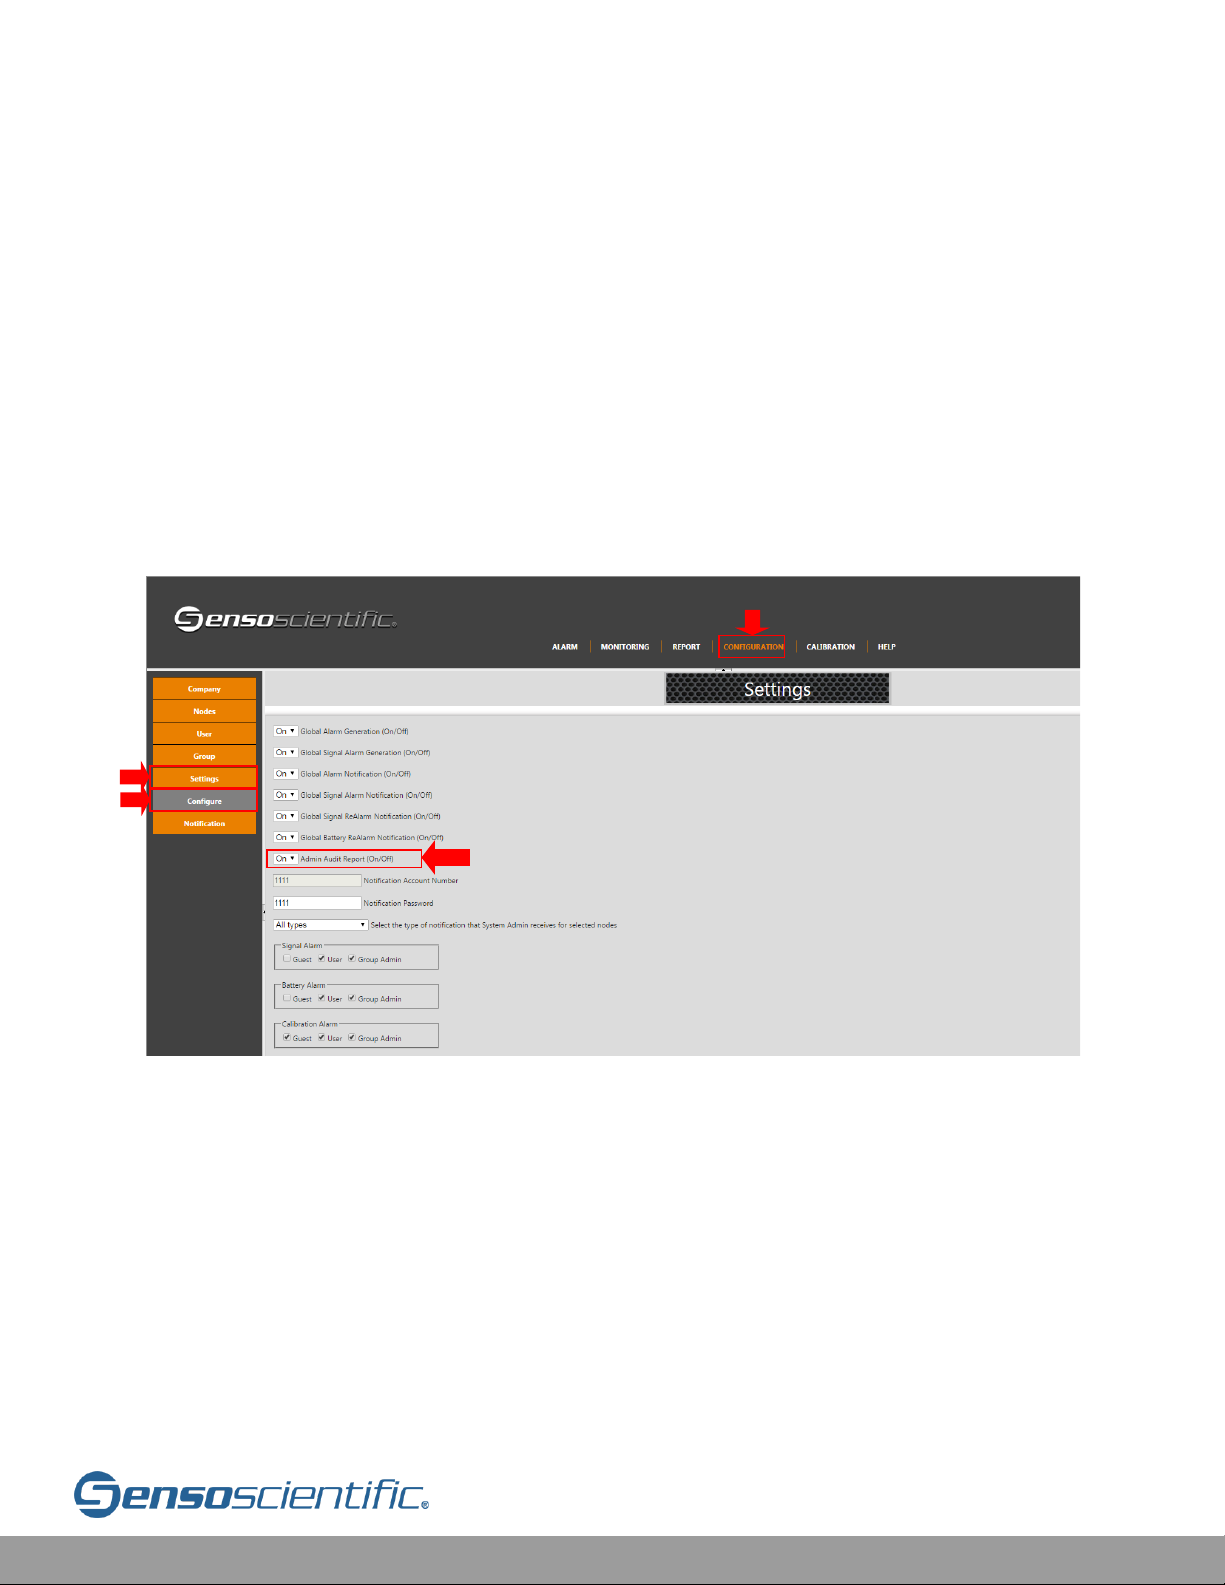
page. On the left tabs select “Settings” then “Configure”. Finally, click the dropdown
menu next to “Admin Audit Report” and select “On”. This feature will allow any user
to audit reports and log their review.
Figure VI.9-1: Admin Audit Report Settings
An example for the use of this feature is the following:
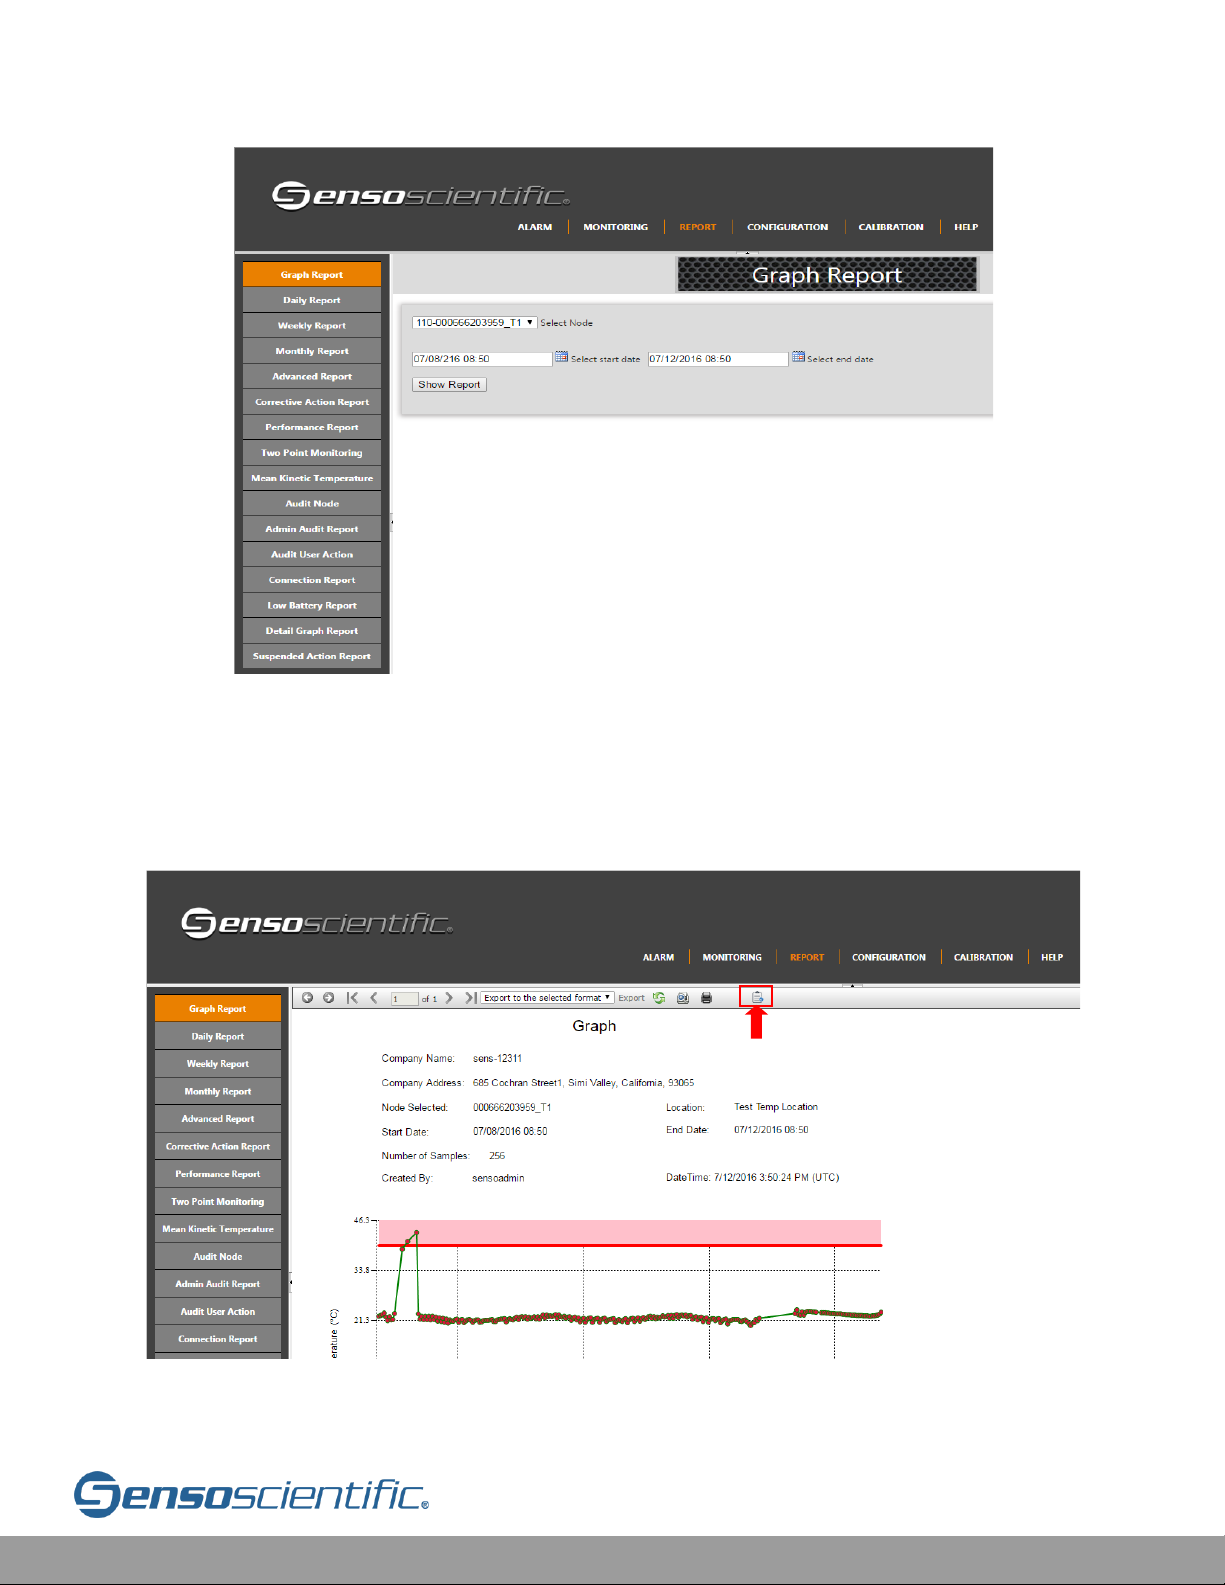
First, the user will need to run a report. This can be done by going to the
“REPORT” tab at the top of the page. Select one of the report options on the
left (Graph Report for example). Then, select parameters for the report: Node,
Start Date, and End Date. Finally press the “Show Report” button.
Page 76
Cloud User Manual V20.6 76
Figure VI.9-2: Run a Report
After the feature has been turned on, the audit report icon will appear at the top of
the report for any user when they run a report. When this icon is selected, an audit
report window will prompt to confirm the report audit.
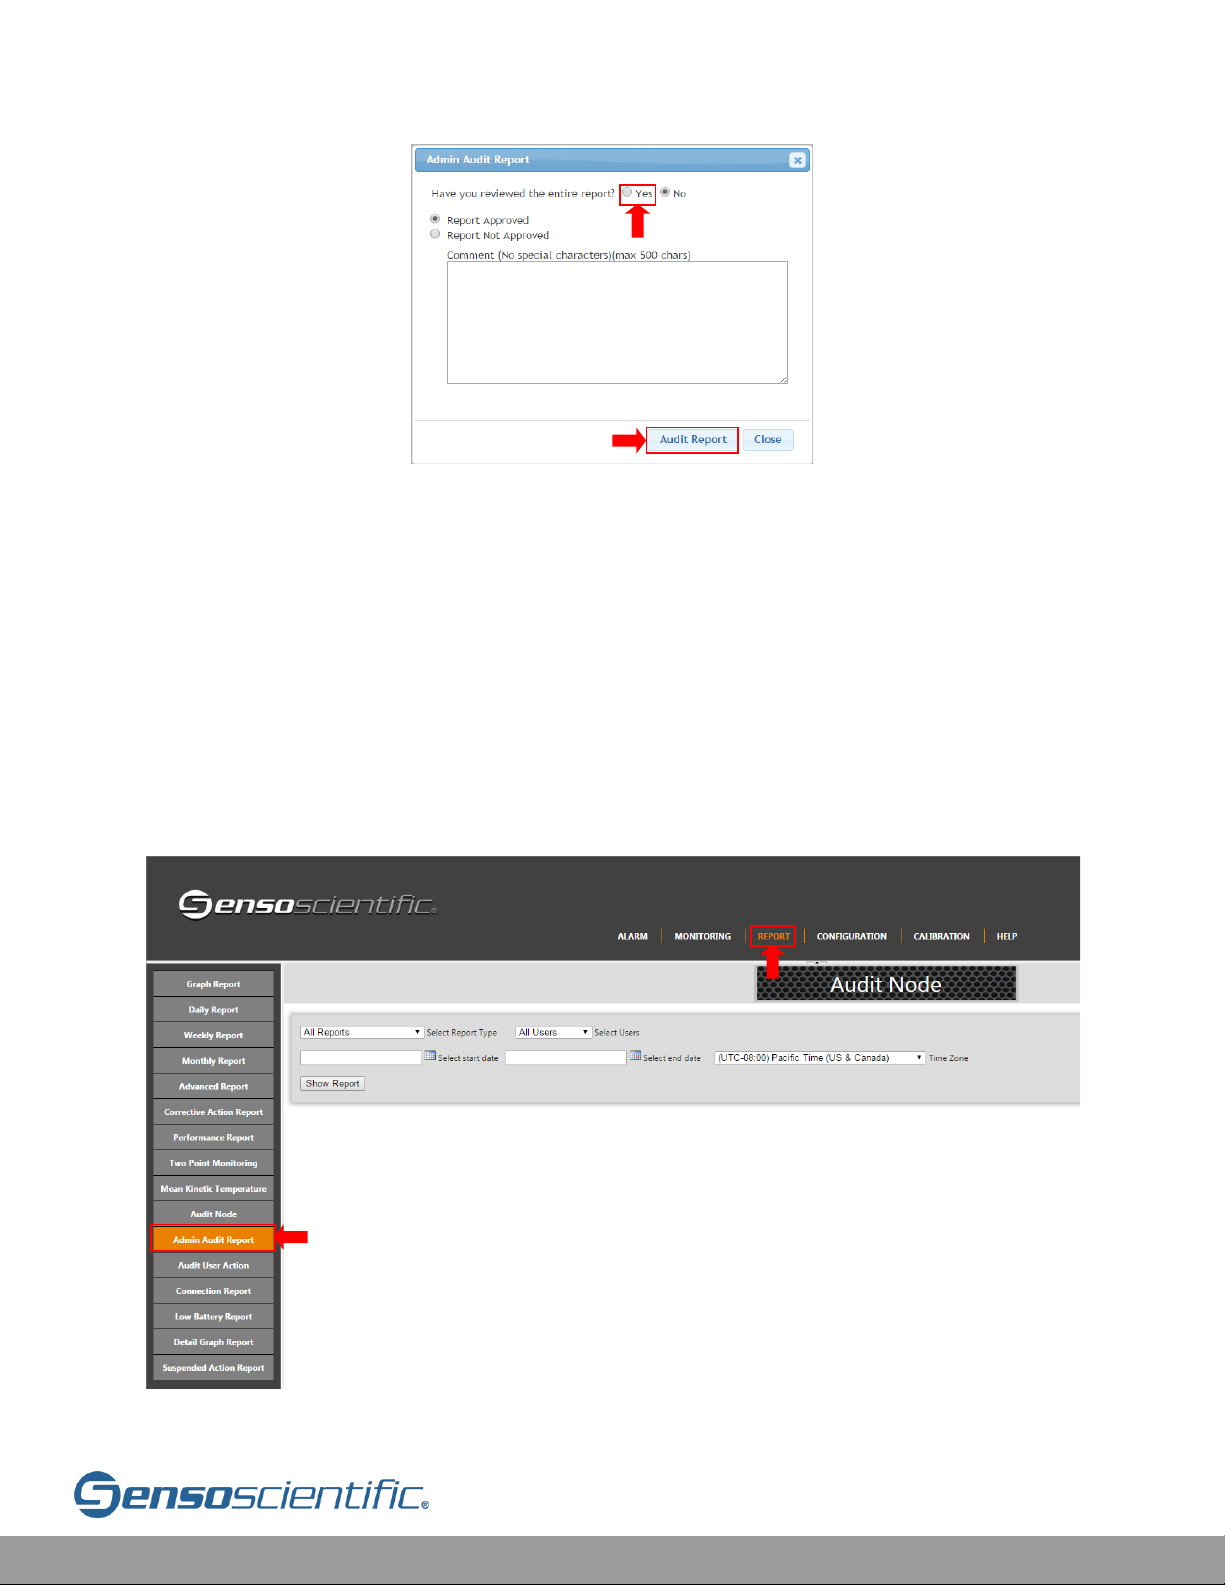
Figure VI.9-3: Audit Report
Page 77
Cloud User Manual V20.6 77
Figure VI.9-4: Audit Report window
To audit the report, the entire report must be reviewed. Select “Report Approved” if
no problem with the data is found, otherwise, select “Report Not Approved”. To
proceed with the audit, a comment must be entered. Please note that no special
characters are allowed in the comment section. Click the Audit Report button at the
bottom of the screen to complete the report audit.
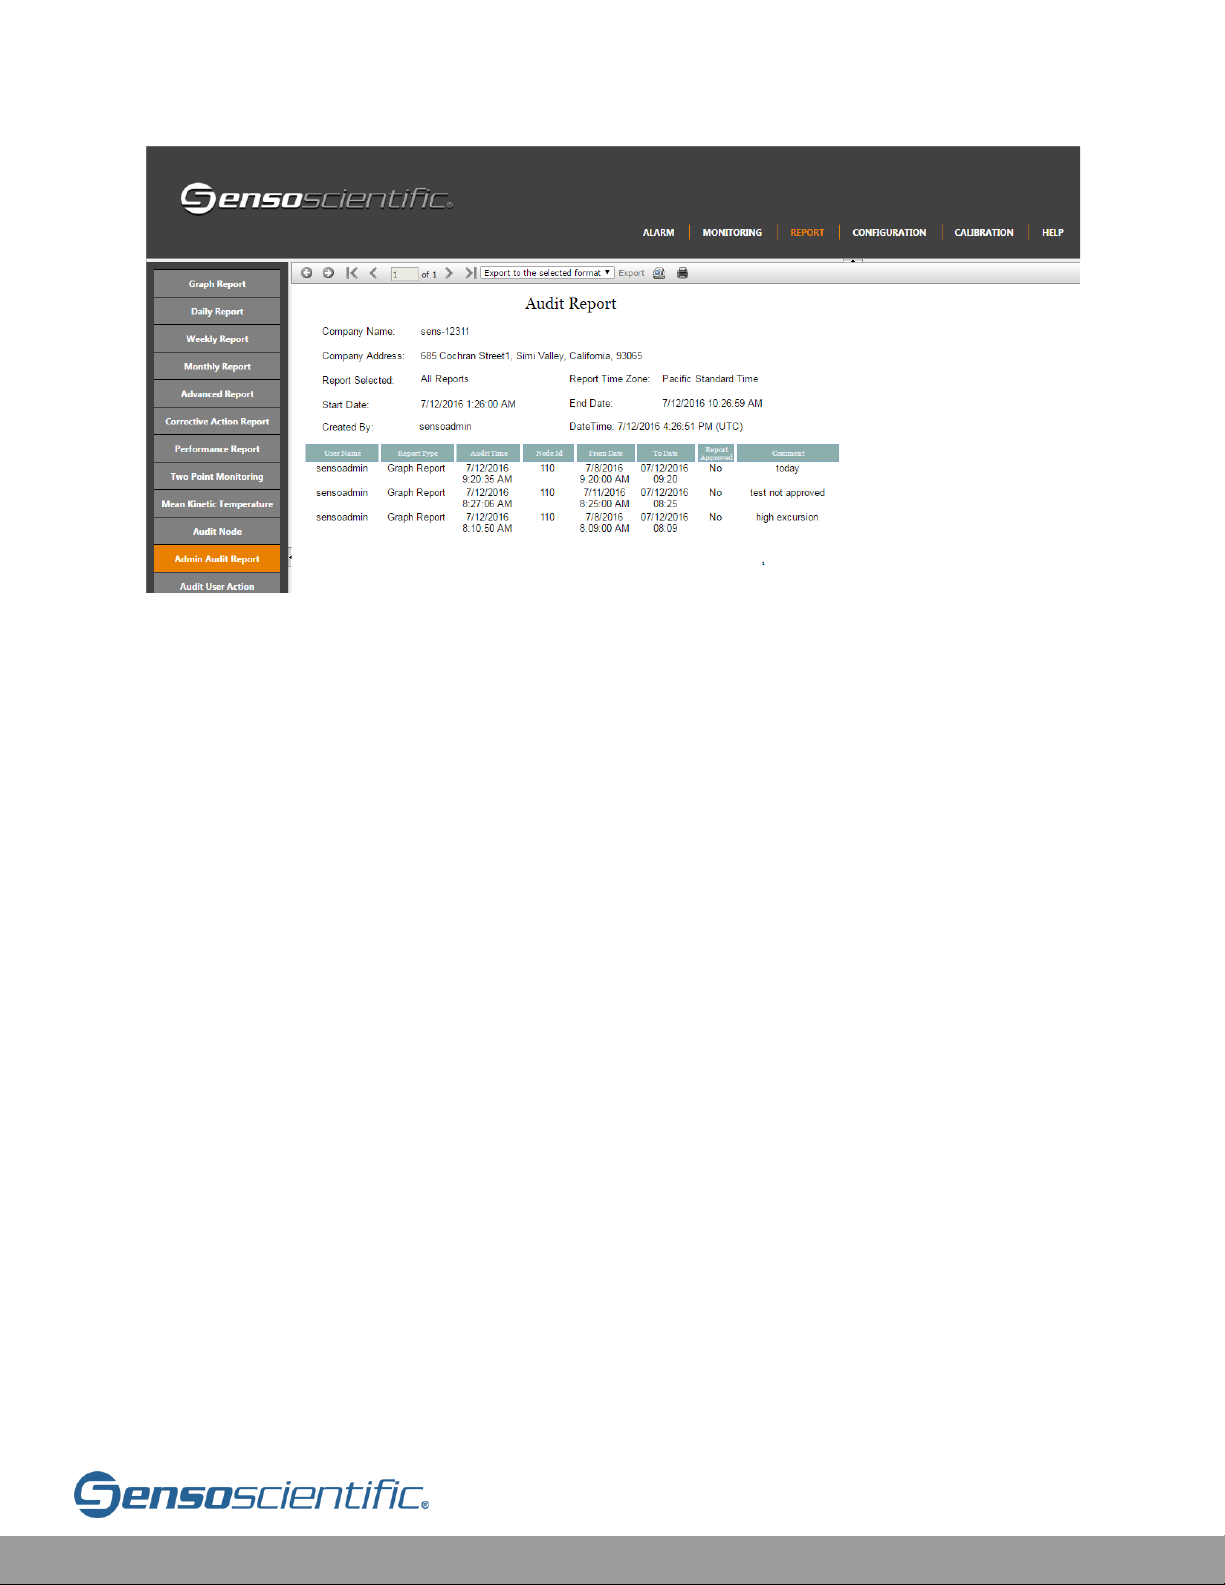
To view the audited reports, go to the “Report” tab then “Admin Audit Report” and
fill in the parameters of the report. Only the System Administrator will be able to run
the “Admin Audit Report”.
Figure VI.9-5: View Admin Audit Report
Page 78
Cloud User Manual V20.6 78
Figure VI.9-6: Admin Audit Report
VI.10 Audit User Action Report
The Audit User Action Report gives thorough visibility of what users are doing in
the system. It will track every user's log-in, alarm confirmation, reports created, as
well as any configurations made to the system (i.e. Nodes, Users, Global Settings,
etc). This report is designed for administrators to monitor the system. System
Administrators can run the report and see all user action. Group Administrators can
run the report and see only the users in their group.
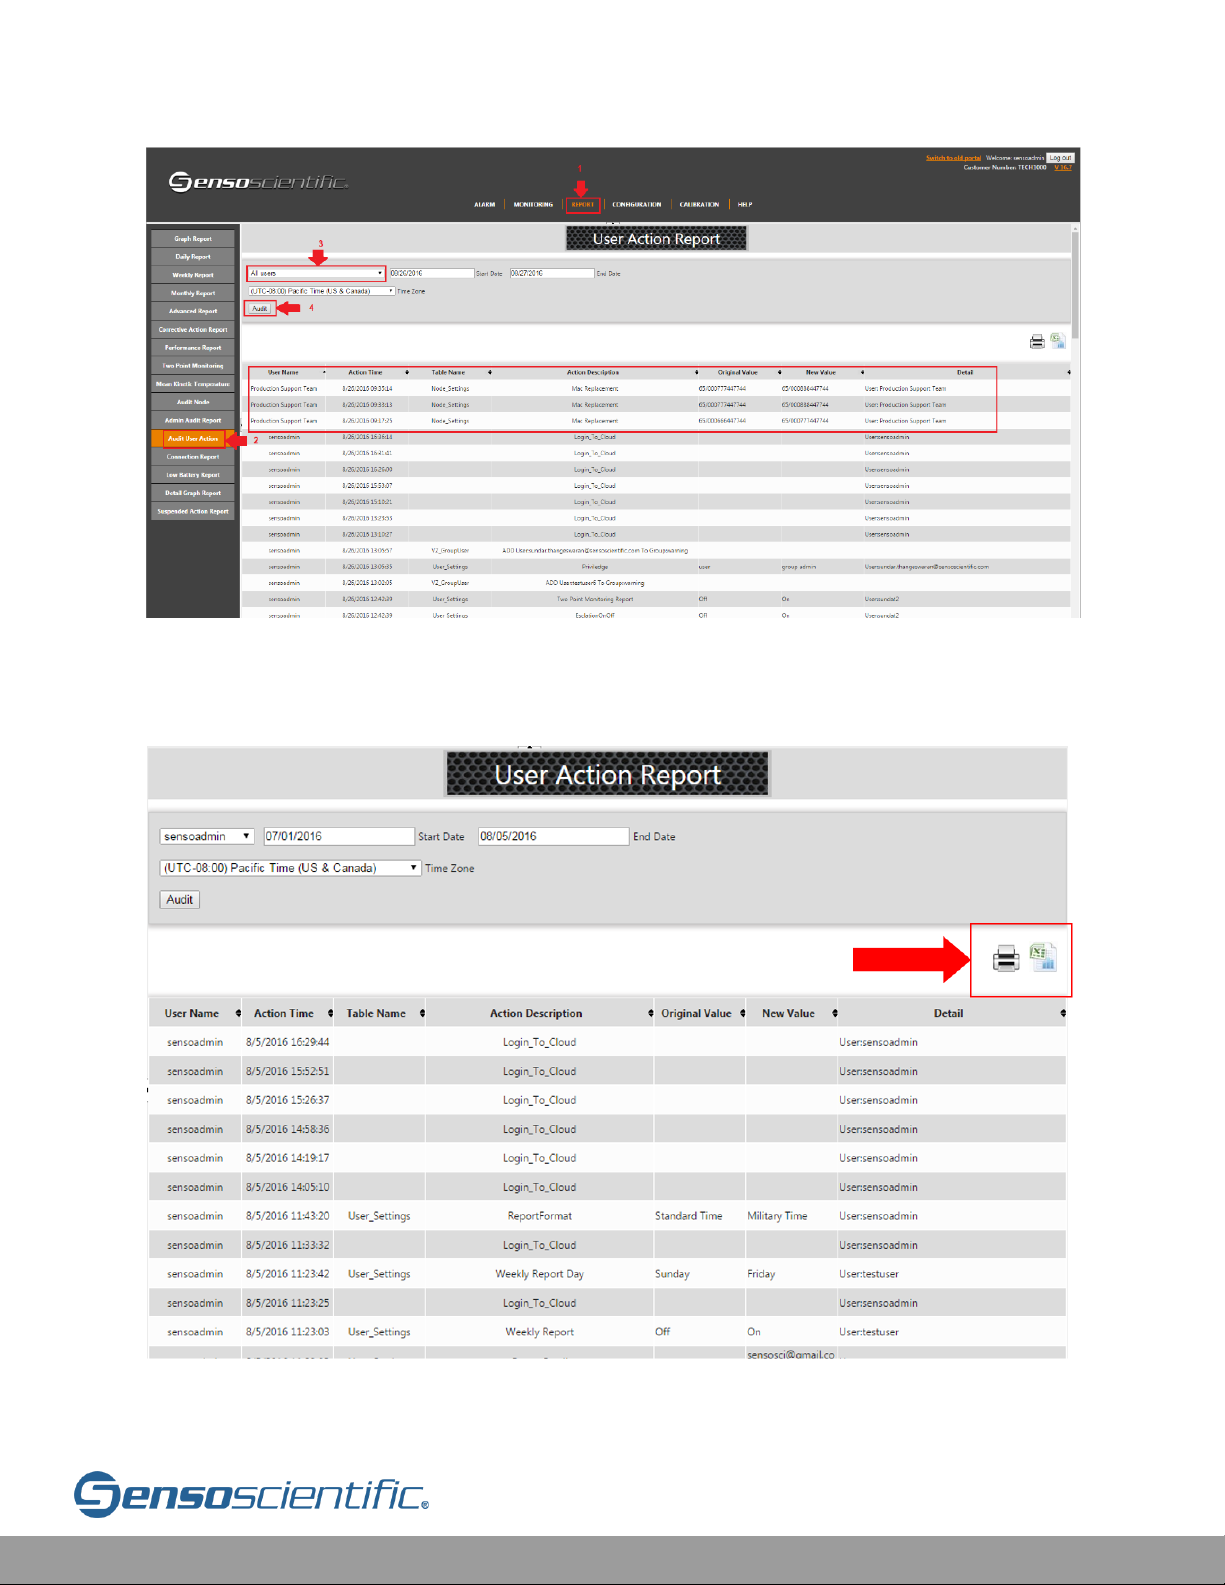
From the main menu, choose “REPORT”, and select “Audit User Action” from the left
sub menu. Select user(s), calendar date/time, and input the appropriate time zone.
When completed, click on the “Audit” button.
Page 79
Cloud User Manual V20.6 79
Figure VI.10-1: User Action Report Settings
From the User Action Report screen, data can be exported or printed.
Figure VI.10-2: User Action Report
Page 80
Cloud User Manual V20.6 80
VI.11 Connection Report
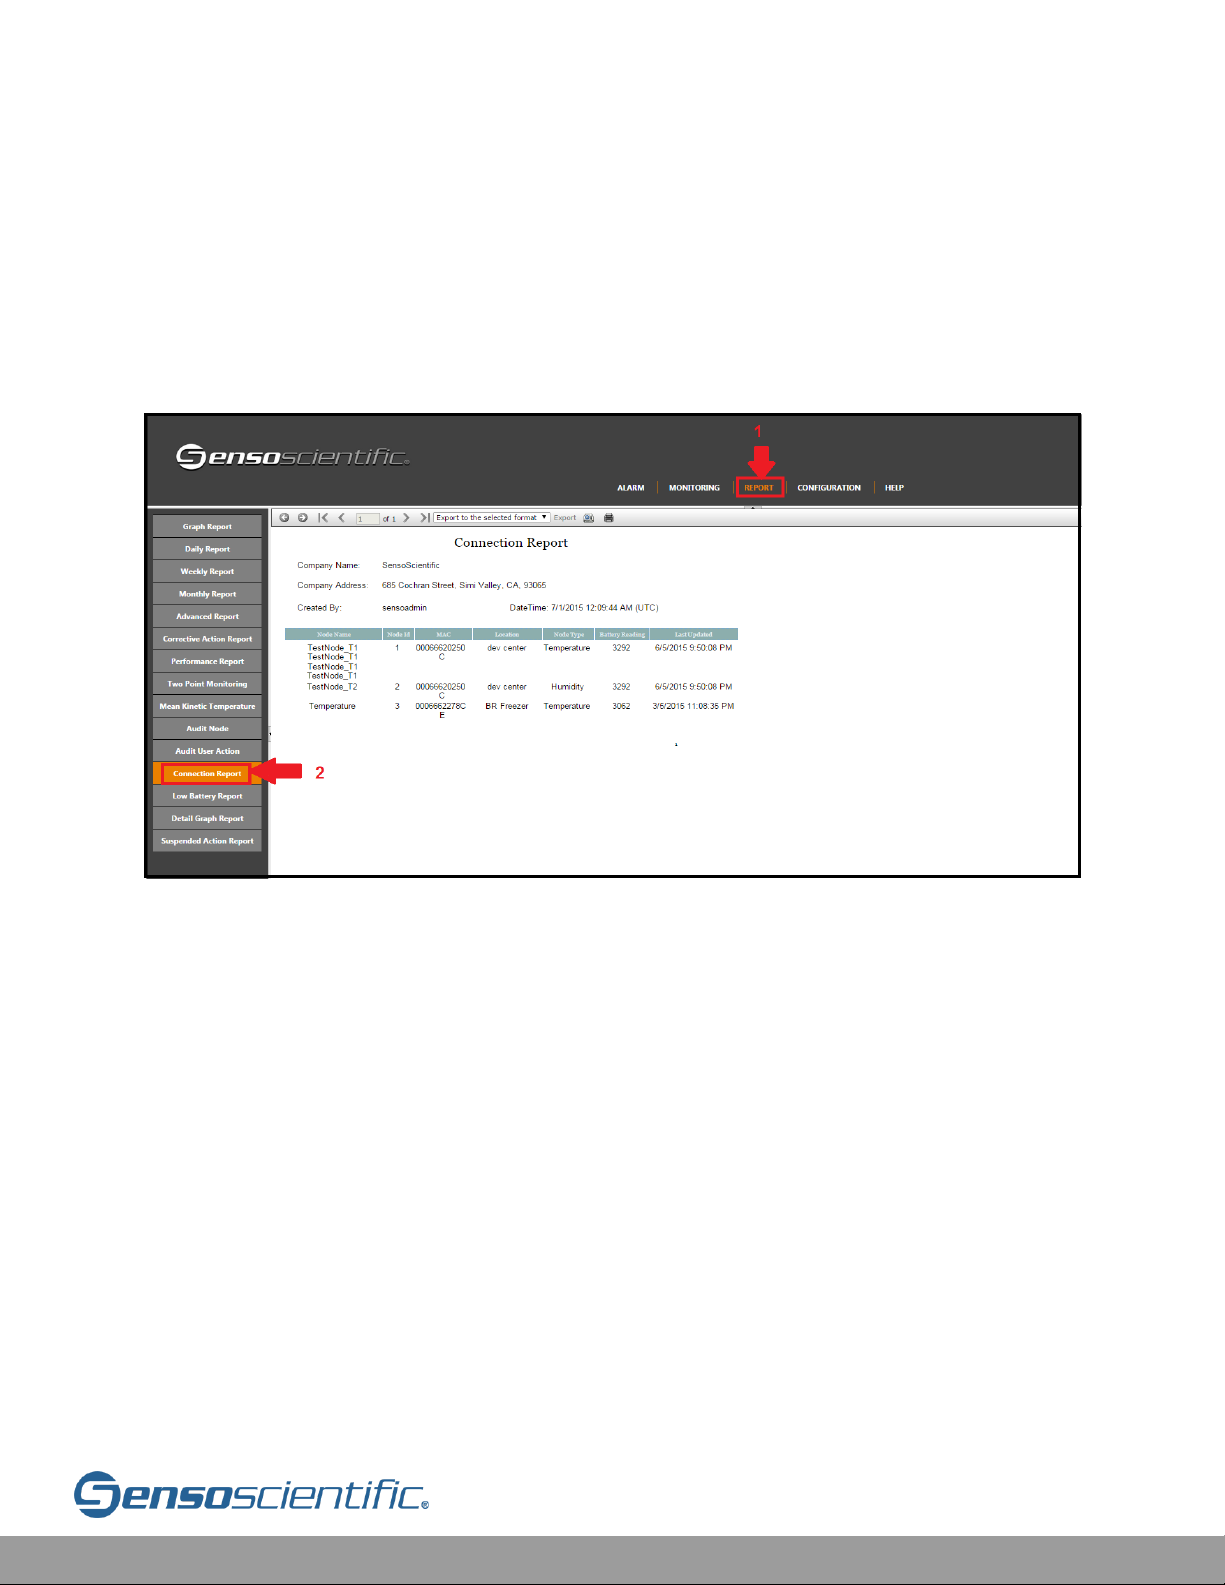
The Connection Report populates all the nodes where data is not being updated to
the cloud from the past one hour. It shows the below information:
Node Name, Node Id, Mac, Location, Node Type, Battery Reading, Last Updated
Time
Figure VI.11-1: Connection Report
VI.12 Low Battery Report
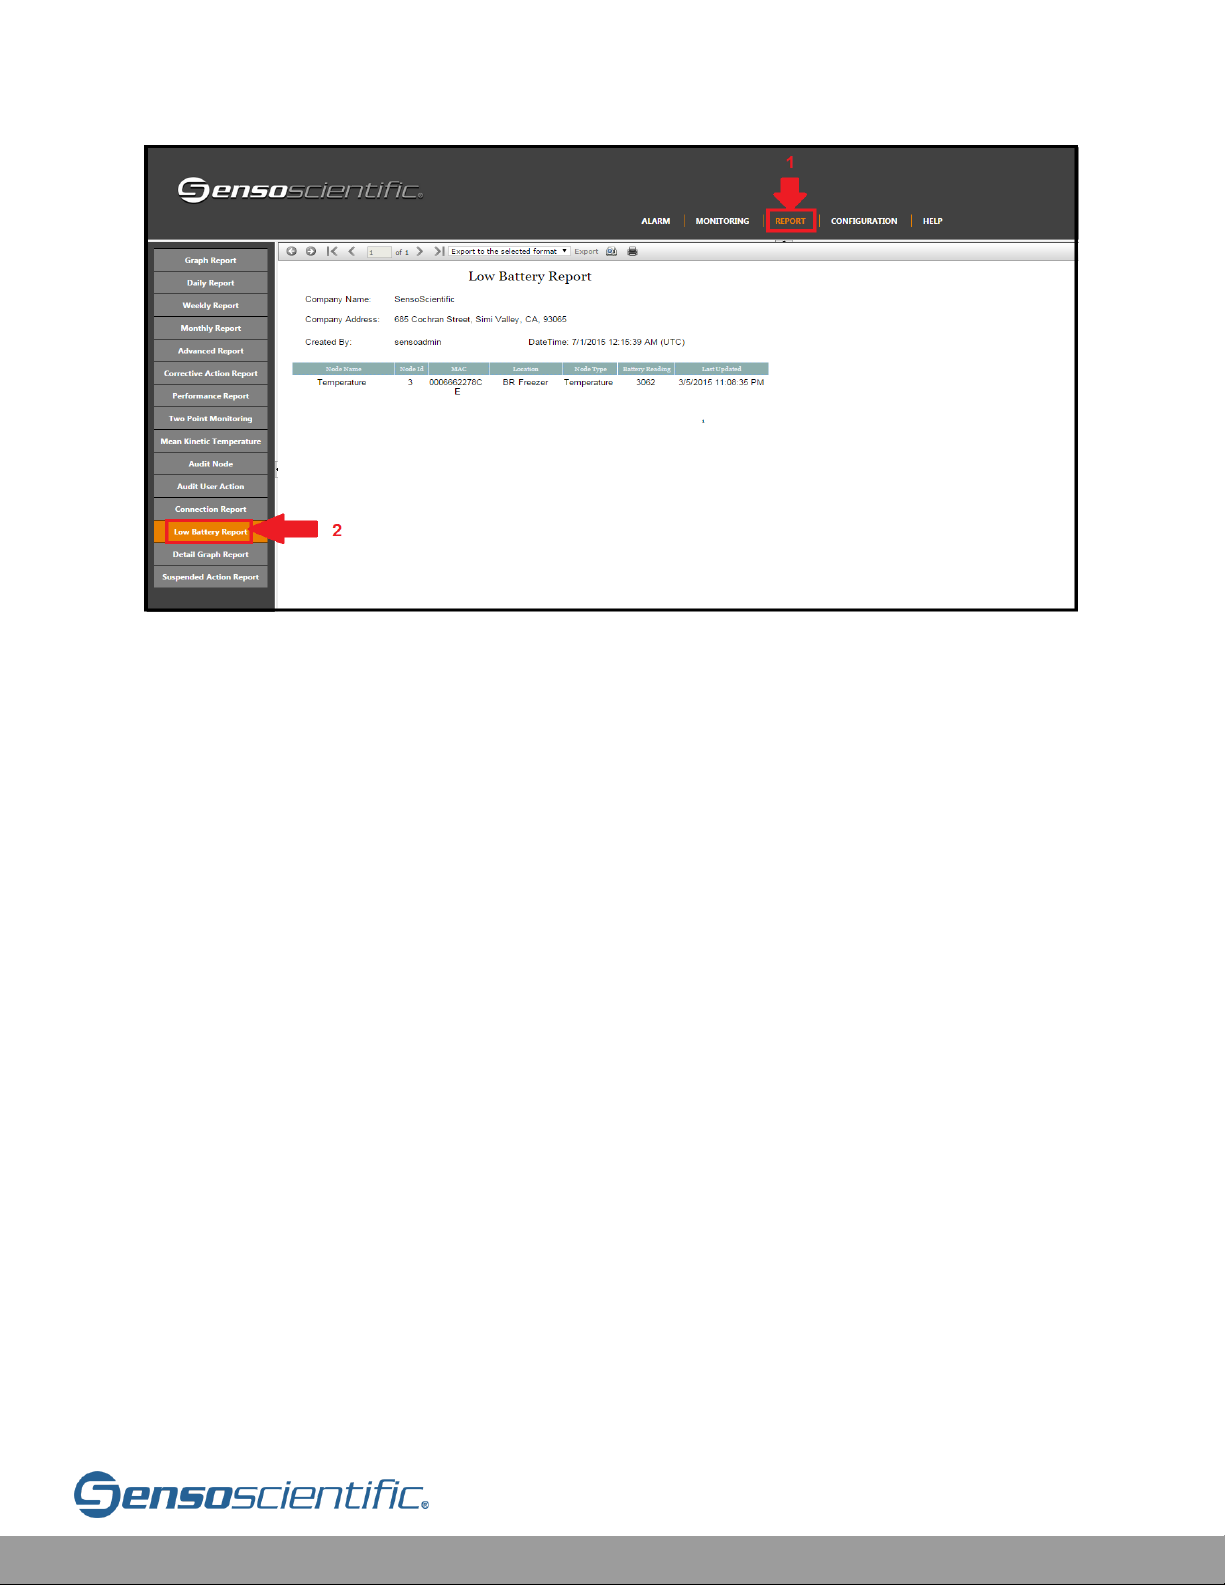
The Low Battery Report populates the nodes that have a battery level less than
3250mV (less than 25% battery life). It shows the below information.
Node Name, Node Id, Mac, Location, Node Type, Battery Reading, Last Updated
Time
Page 81
Cloud User Manual V20.6 81
Figure VI.12-1: Low Battery Report
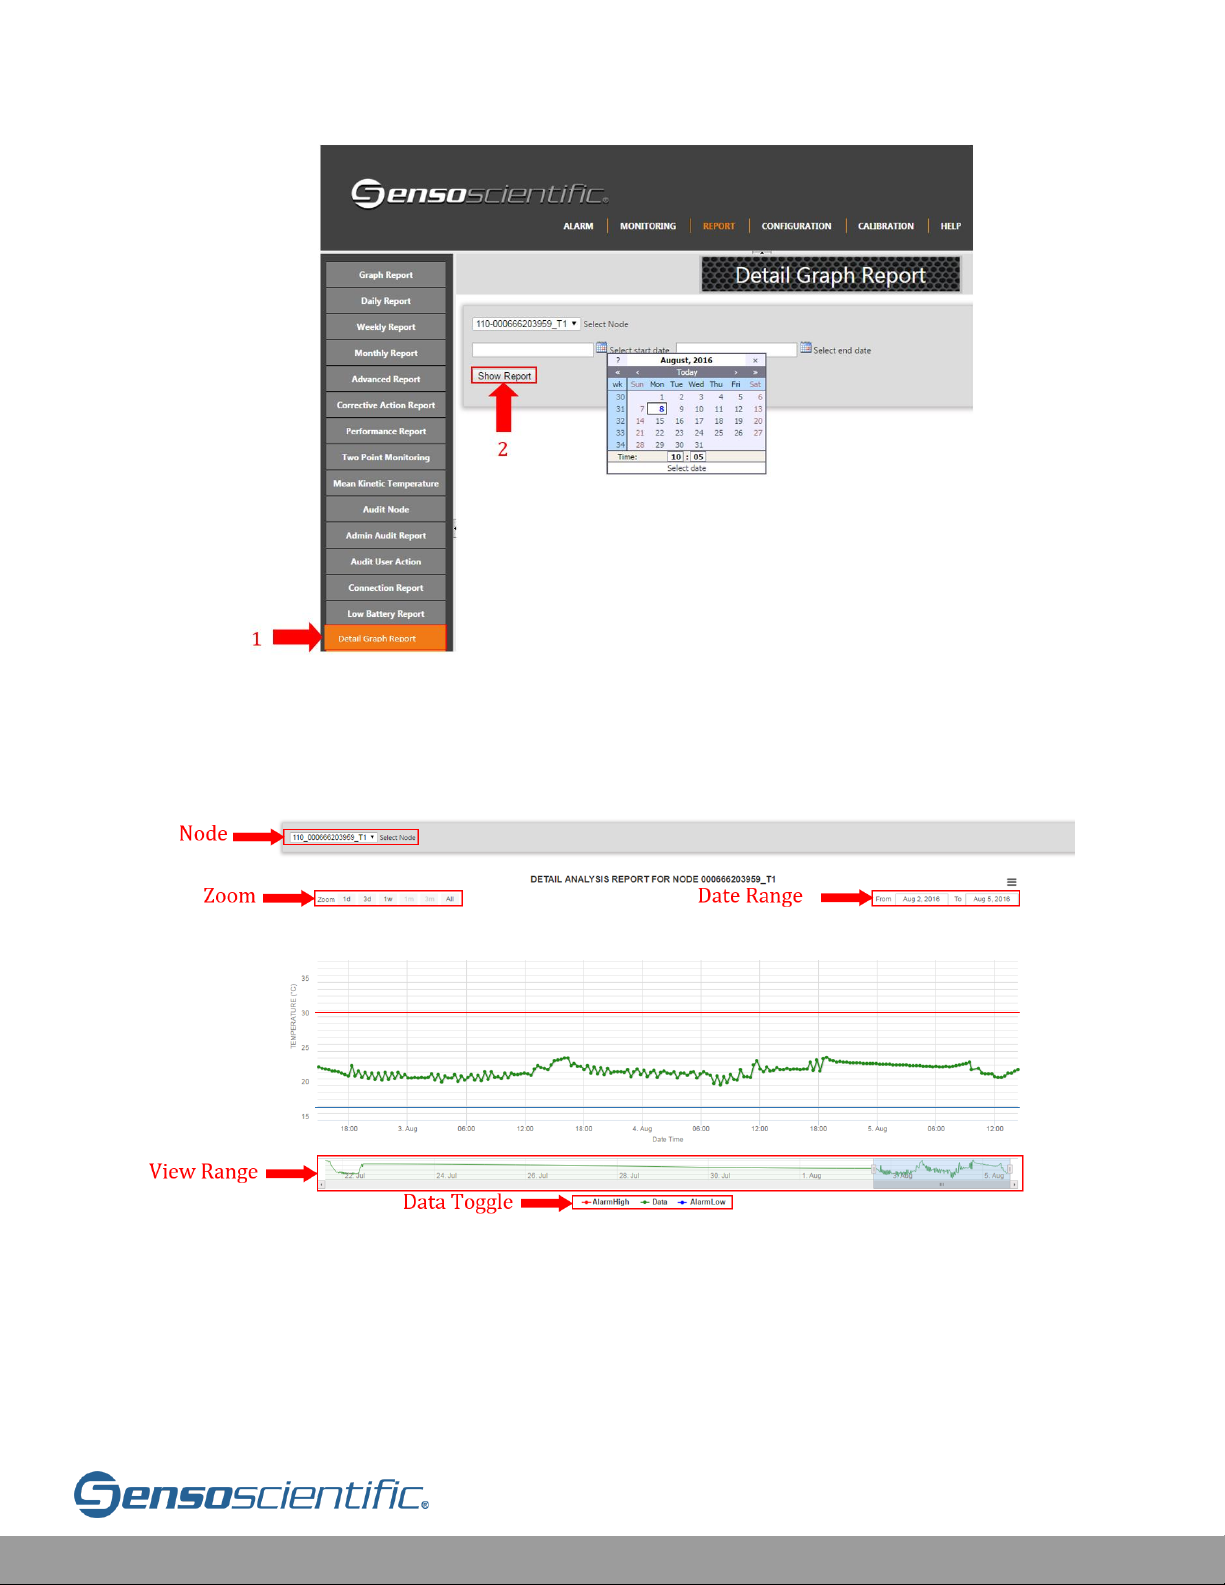
VI.13 Detail Graph Report
The Detail Graph allows users to change the viewing parameters of a graph report.
This can be done by first running a Detail Graph Report. Go to the “REPORT” tab to
begin.
On the left tabs, select “Detail Graph Report”. Select the node, start date, and the
end date in question. The interval between the start and end dates of this report can
be up to 6 months.
Page 82
Cloud User Manual V20.6 82
Figure VI.13-1: Detail Graph Report
Once run, the report will then show a series of options: Select Node, Zoom, Edit Date
Range, shift View Range, and set Data Toggle buttons.
Figure VI.13-2: Detail Graph Report
Select Node displays a new set of data from the selected node within the date
ranges.
Page 83
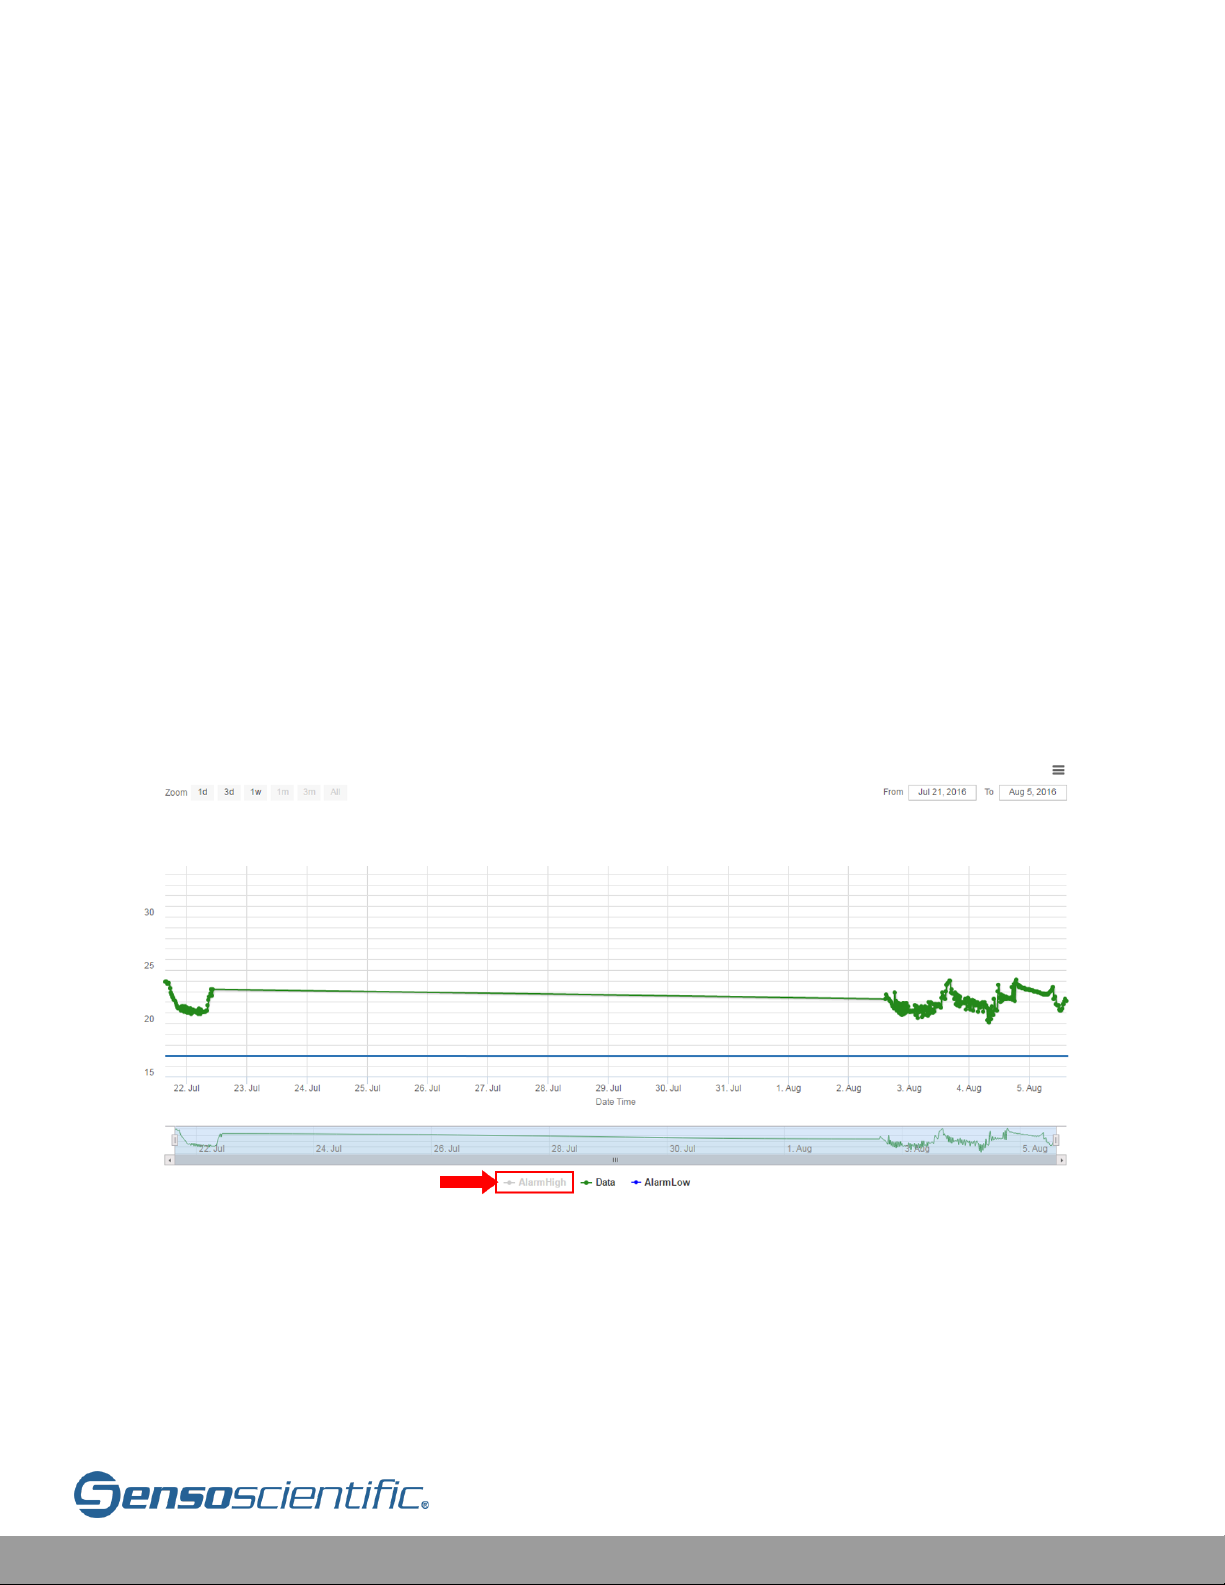
Cloud User Manual V20.6 83
The Zoom feature changes the time scale and range to see more or less data. To
activate this feature, move the View Range slider bars (see the View Range callout in
the image above).
The Date Range has the capability to change the view capacity to any date that is
within the range of the original dates that report was run for. To view a date range
outside of the pre-selected range, the report must be re-run.
The View Range, similar to the Date Range, scales or shifts the view parameters only
within the date ranges that were origonally set; furthermore, this feature allows
users to easily scroll through data to look for graphed patterns or a particular piece
of data.
Finally, the Data Toggle buttons at the bottom will hide or show sets of data
(AlarmHigh, Data, or AlarmLow) that are displayed on the report. For example, the
AlarmHigh can be hidden to clear up the screen for viewing data. To do this, the
AlarmHigh button should be selected and it will become unhighlighted. Then, only
the AlarmLow and the Data would be shown (see below).
Figure VI.13-3: Detail Graph Report AlarmHigh Toggle
VI.14 Suspended Action Report
The Suspended Action Report populates the nodes that have been suspended. It also
shows the history of the suspended nodes. It is similar to corrective action report. It
shows the below information:
Page 84
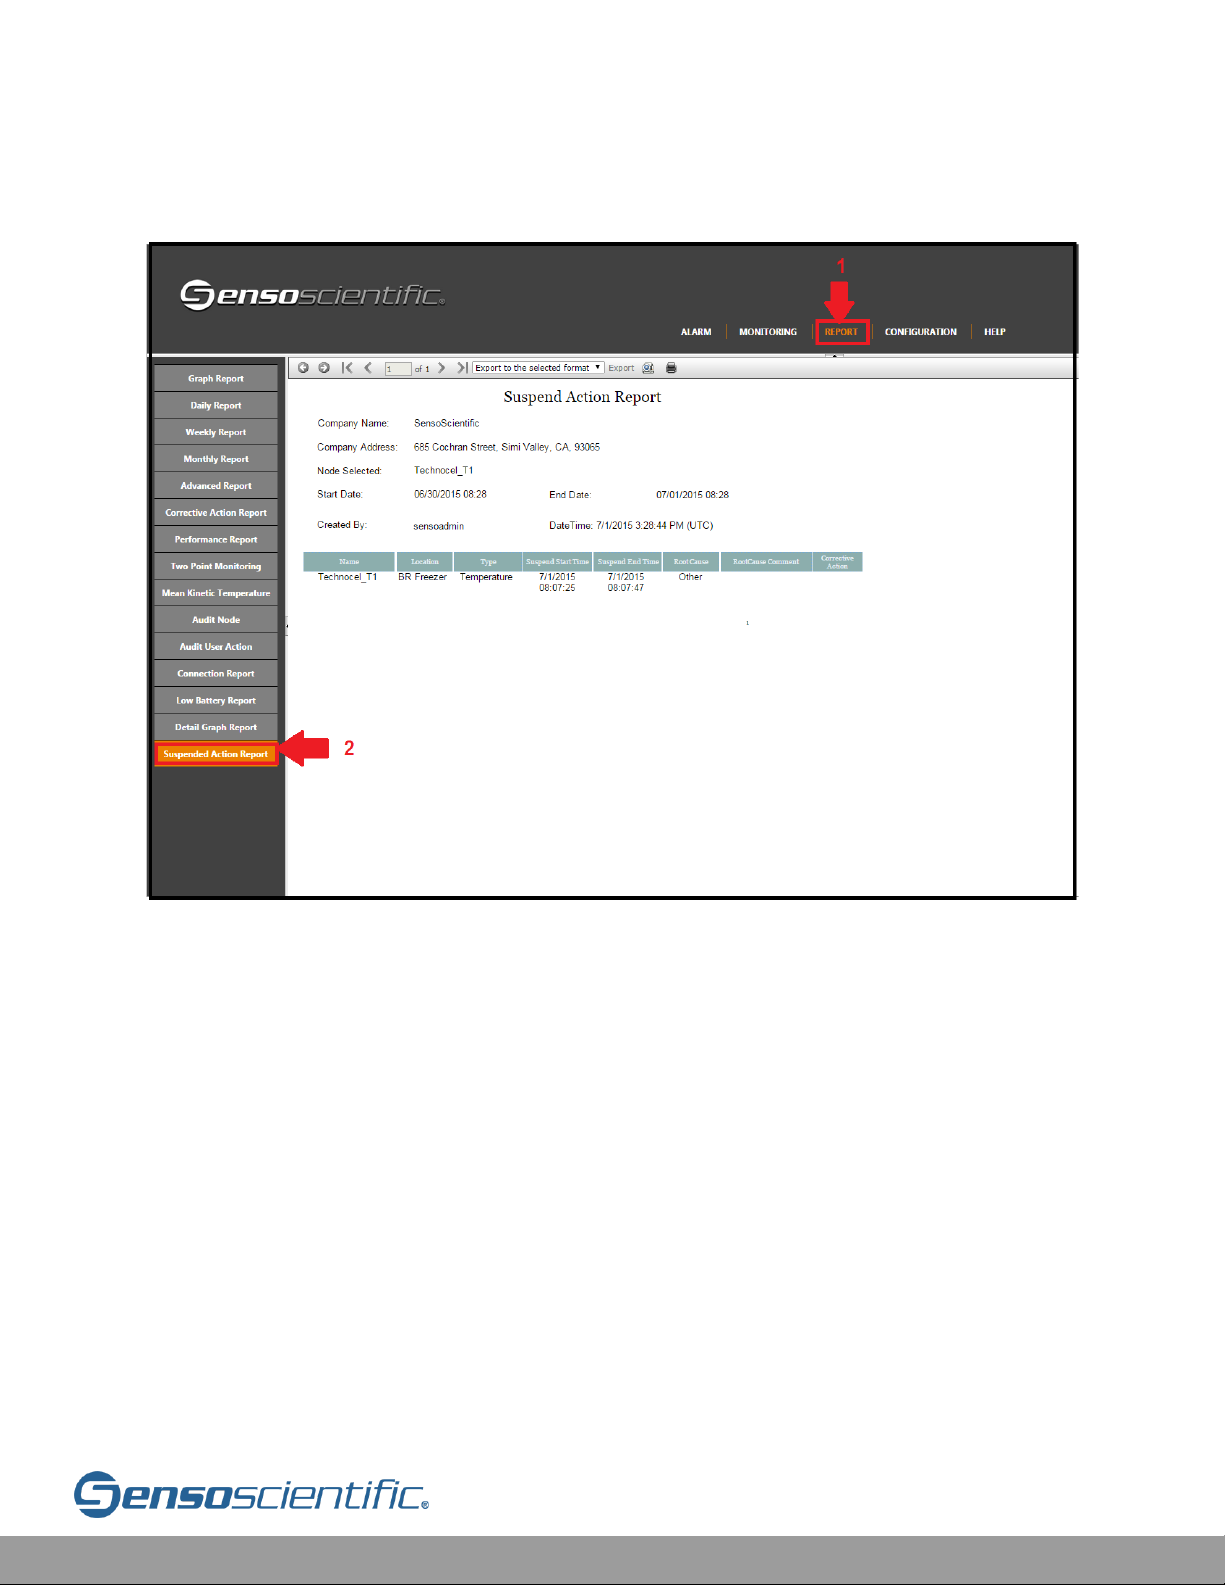
Cloud User Manual V20.6 84
Node Name, Location, Type, Suspend Start Time, Suspend End Time, Root
Cause, Root Cause Comment, Corrective Action
Figure VI.14-1: Suspended Action Report
VI.15 Automated Reports
This feature allows only the system admin to configure a schedule in the cloud that
will automatically send reports about the nodes under a certain user each week on
a specified day.
First, from the monitoring page, select CONFIGURATION.
Page 85
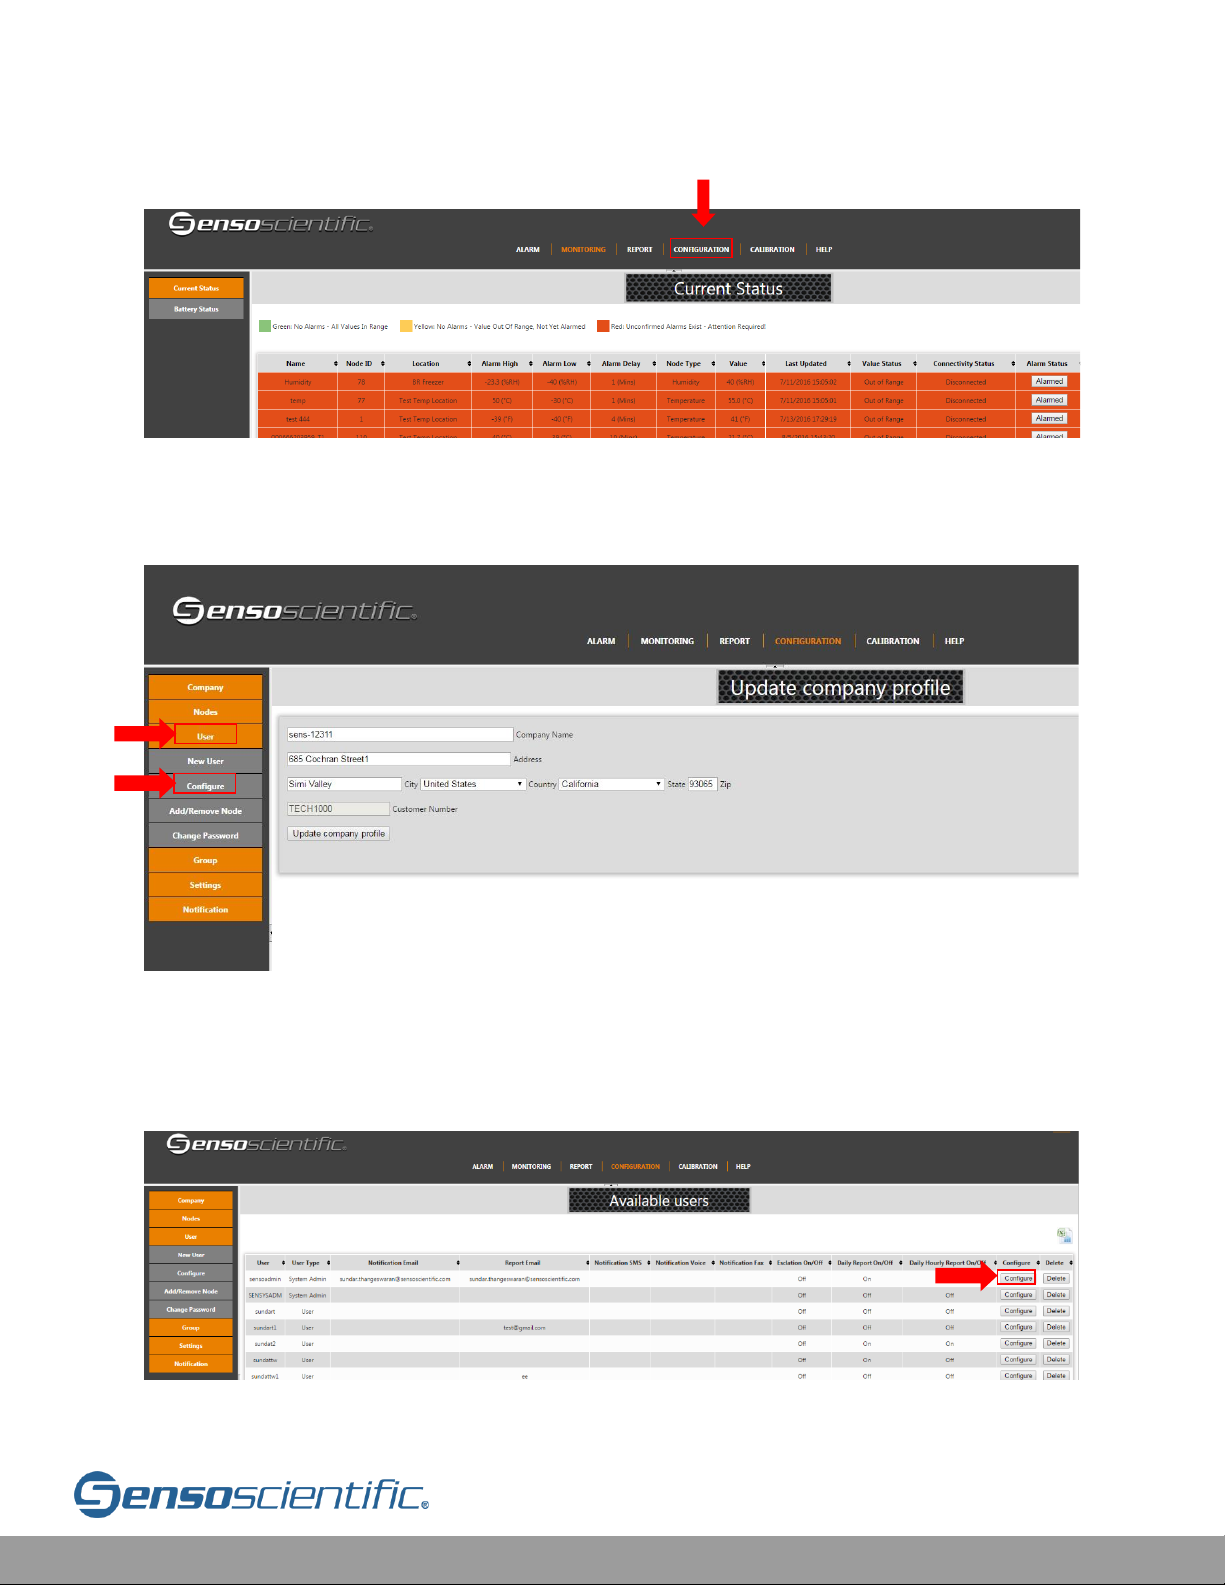
Cloud User Manual V20.6 85
Figure VI.15-1: Configuration
Second, select User from the left tabs then select Configure.
Figure VI.15-2: User Company Profile
Third, on the right select Configure to any user. Note that each user must be
configured for this.
Figure VI.15-3: Available Users
Page 86
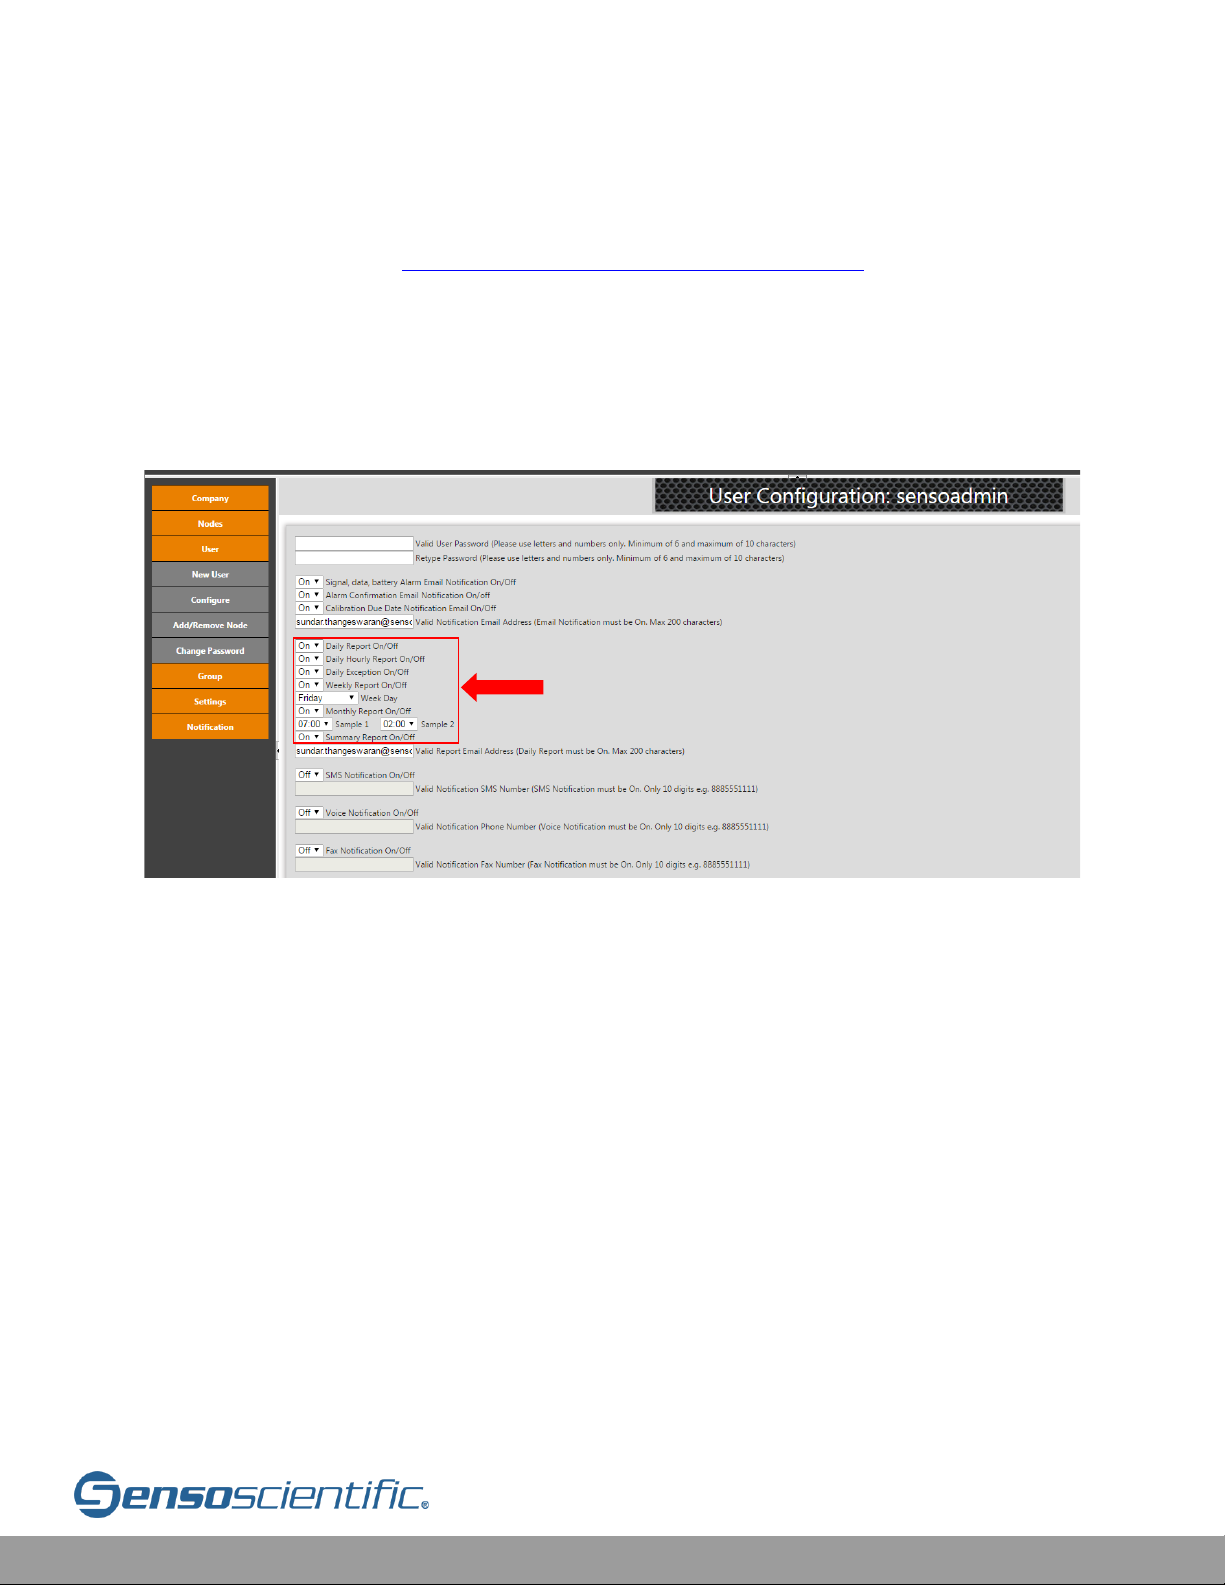
Cloud User Manual V20.6 86
Fourth, in the middle of the User Configuration screen, change the options according
to the user preference. Daily, Daily Hourly, Daily Exception, Weekly, Monthly, and
Summary Reports (see VI.15.a Automated Daily Summary Report) can be automated
to send to the email provided. To activate one or more features, change the
corresponding field to On and make sure to complete any peripheral fields (Weekly
Reporty requires a day of the week to be selected, Monthly report requires two
samples times, all of the reports require a valid report email address to receive the
reports).
Figure VI.15-4: User Configuration
Finally, the report will be emailed automatically to the user at the specified period. A
sample of a weekly report can be seen below.
1
Page 87
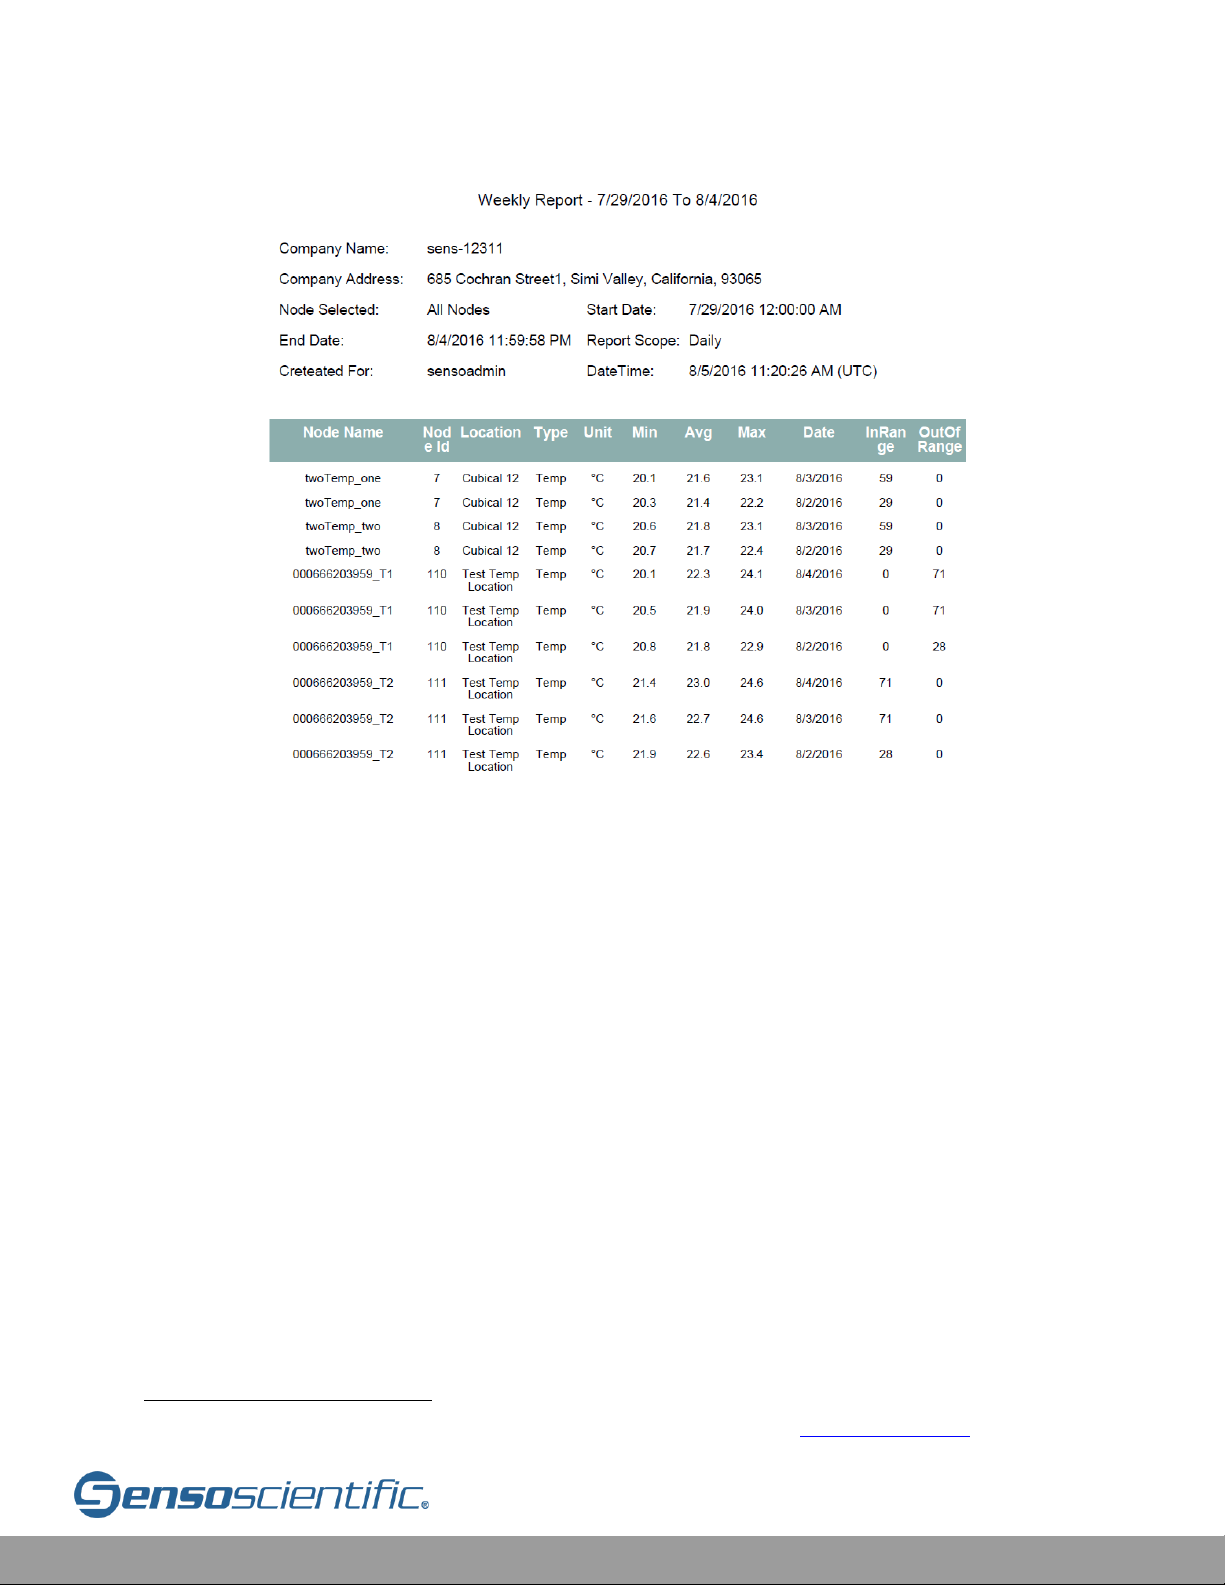
Cloud User Manual V20.6 87
Figure VI.15-5: Weekly Report
VI.15.a Automated Daily Summary Report
Customers with huge number of nodes will have difficulty tracking all the node
reports. The summary report helps users to quickly analyze the data by
concentrating on a few critical features: Minimum/Maximum/Average Temperature,
Number of Nodes in Range, and Number of Nodes Out of Range3. See an example of
this report below.
3
Out of Range refers to an excursion of a node (See common terms in II. General Information)
Page 88
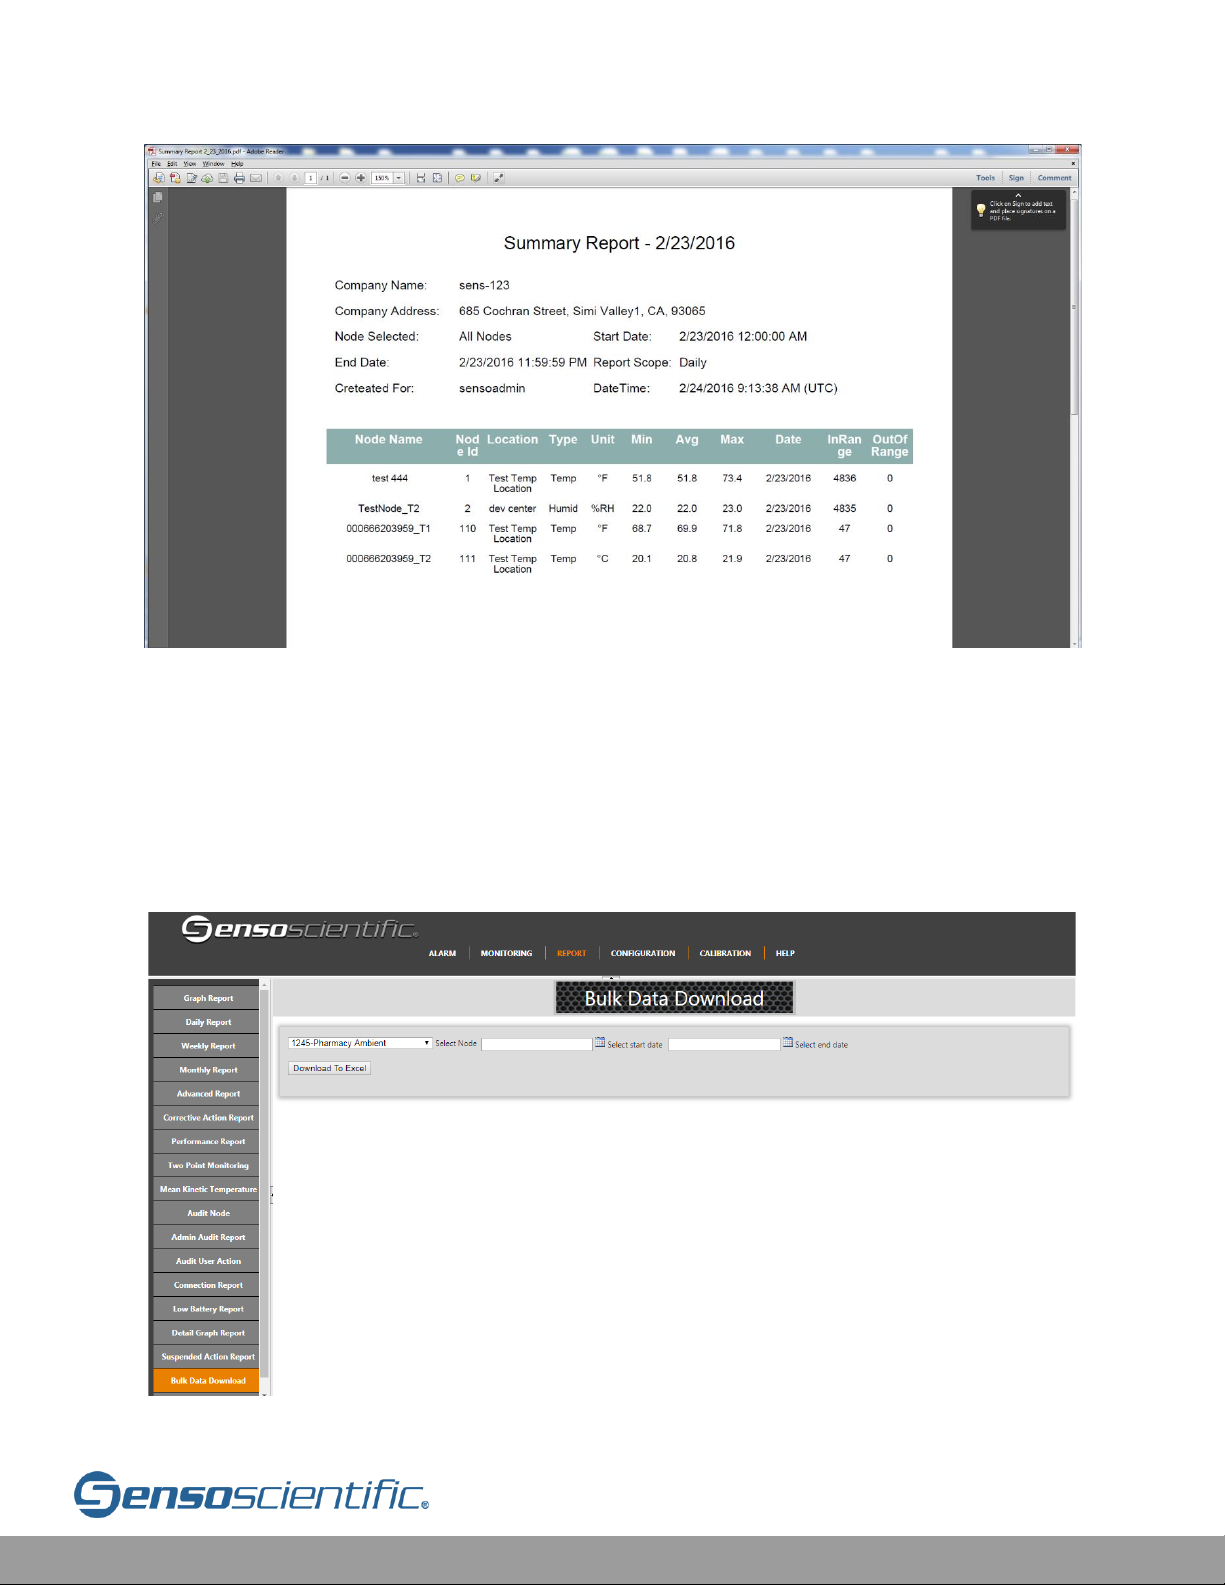
Cloud User Manual V20.6 88
Figure VI.15.a-1: Sample Summary Report file
VI.16 Bulk Data Download
The Bulk Data Download is a report which generates an excel document including all
data within two dates for a given sensor. To run this report, go to REPORT > Bulk
Data Download > Select the node > Select a Start and End date > Download To Excel.
Figure VI.16-1: Bulk Data Download
Page 89
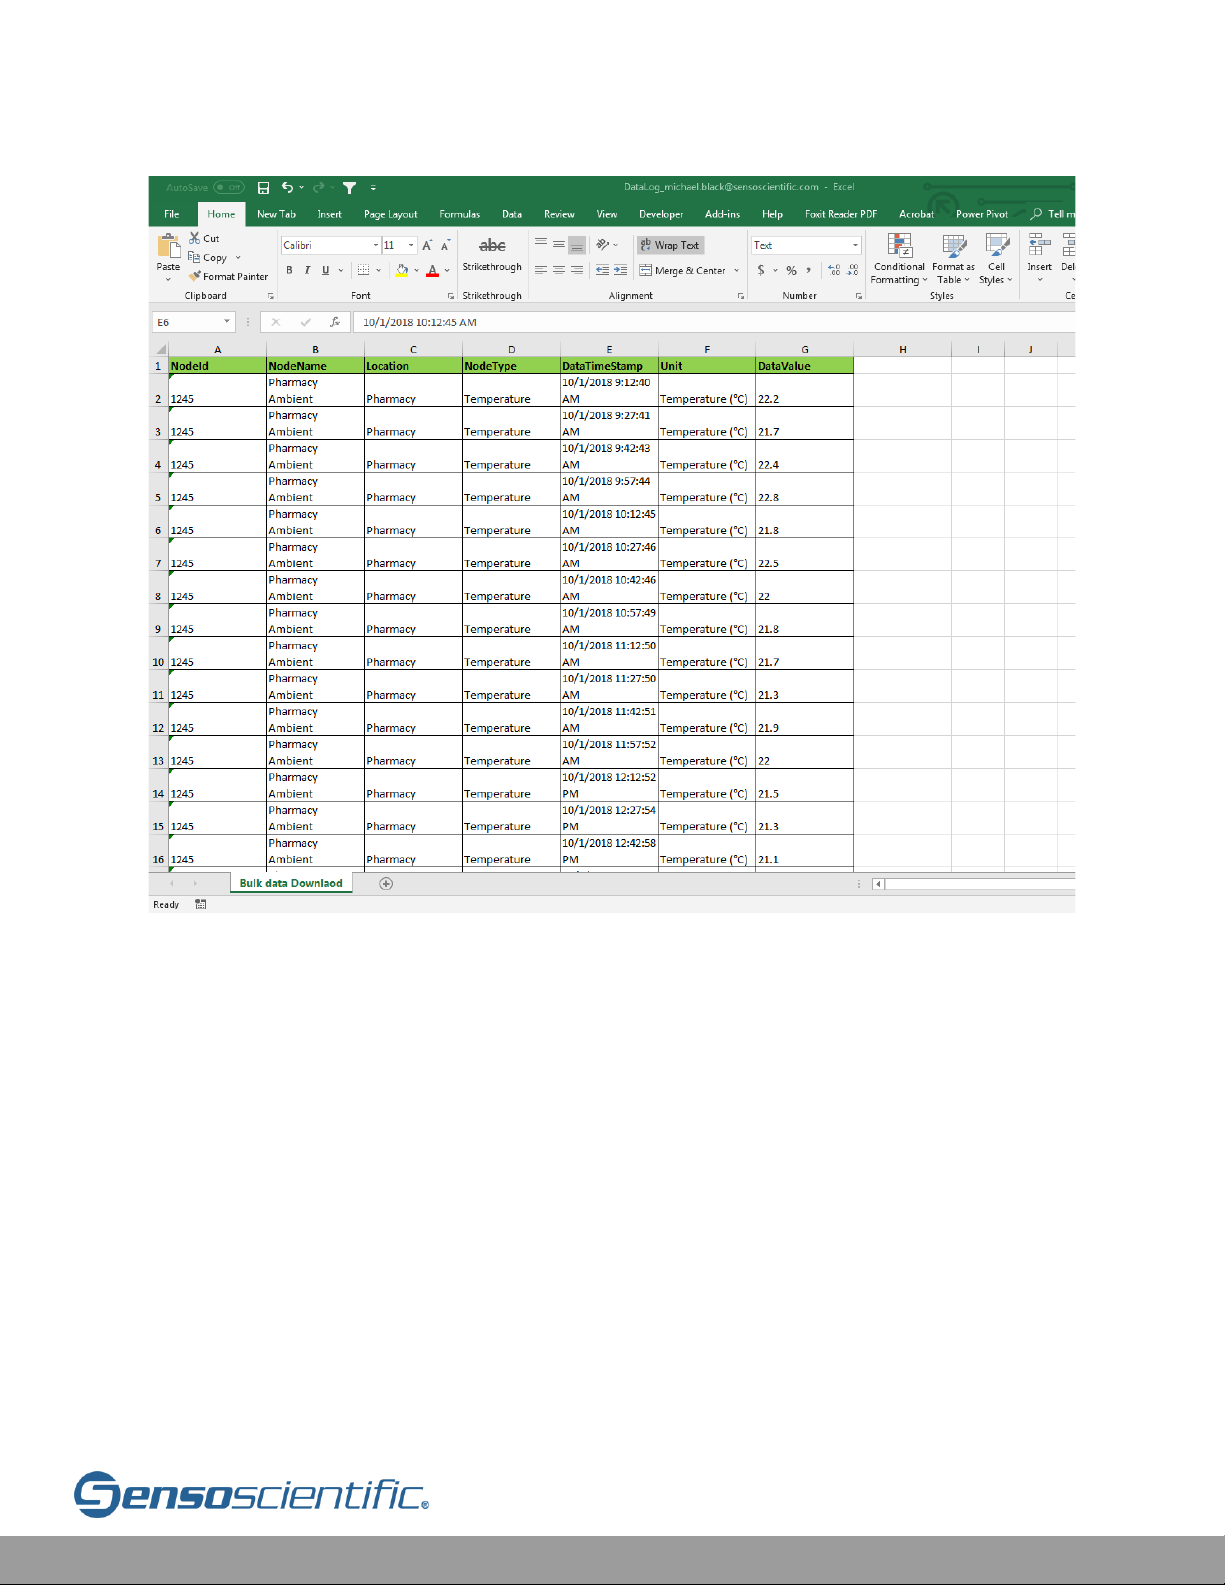
Cloud User Manual V20.6 89
Figure VI.16-2: Excel Bulk Data Download
VI.17 Custom Report
Custom Report is a dynamic report which can filter using a dialog box for live updated
view. The reports that are compatible are Daily, Weekly, and Monthly Reports. To run
this report, go to REPORT > Customer Report. A start date must be selected. The
report filter to see Nodes (individual sensors) or Groups. A node or group then needs
to be selected. The report will automatically generate upon changing filter settings.
Page 90
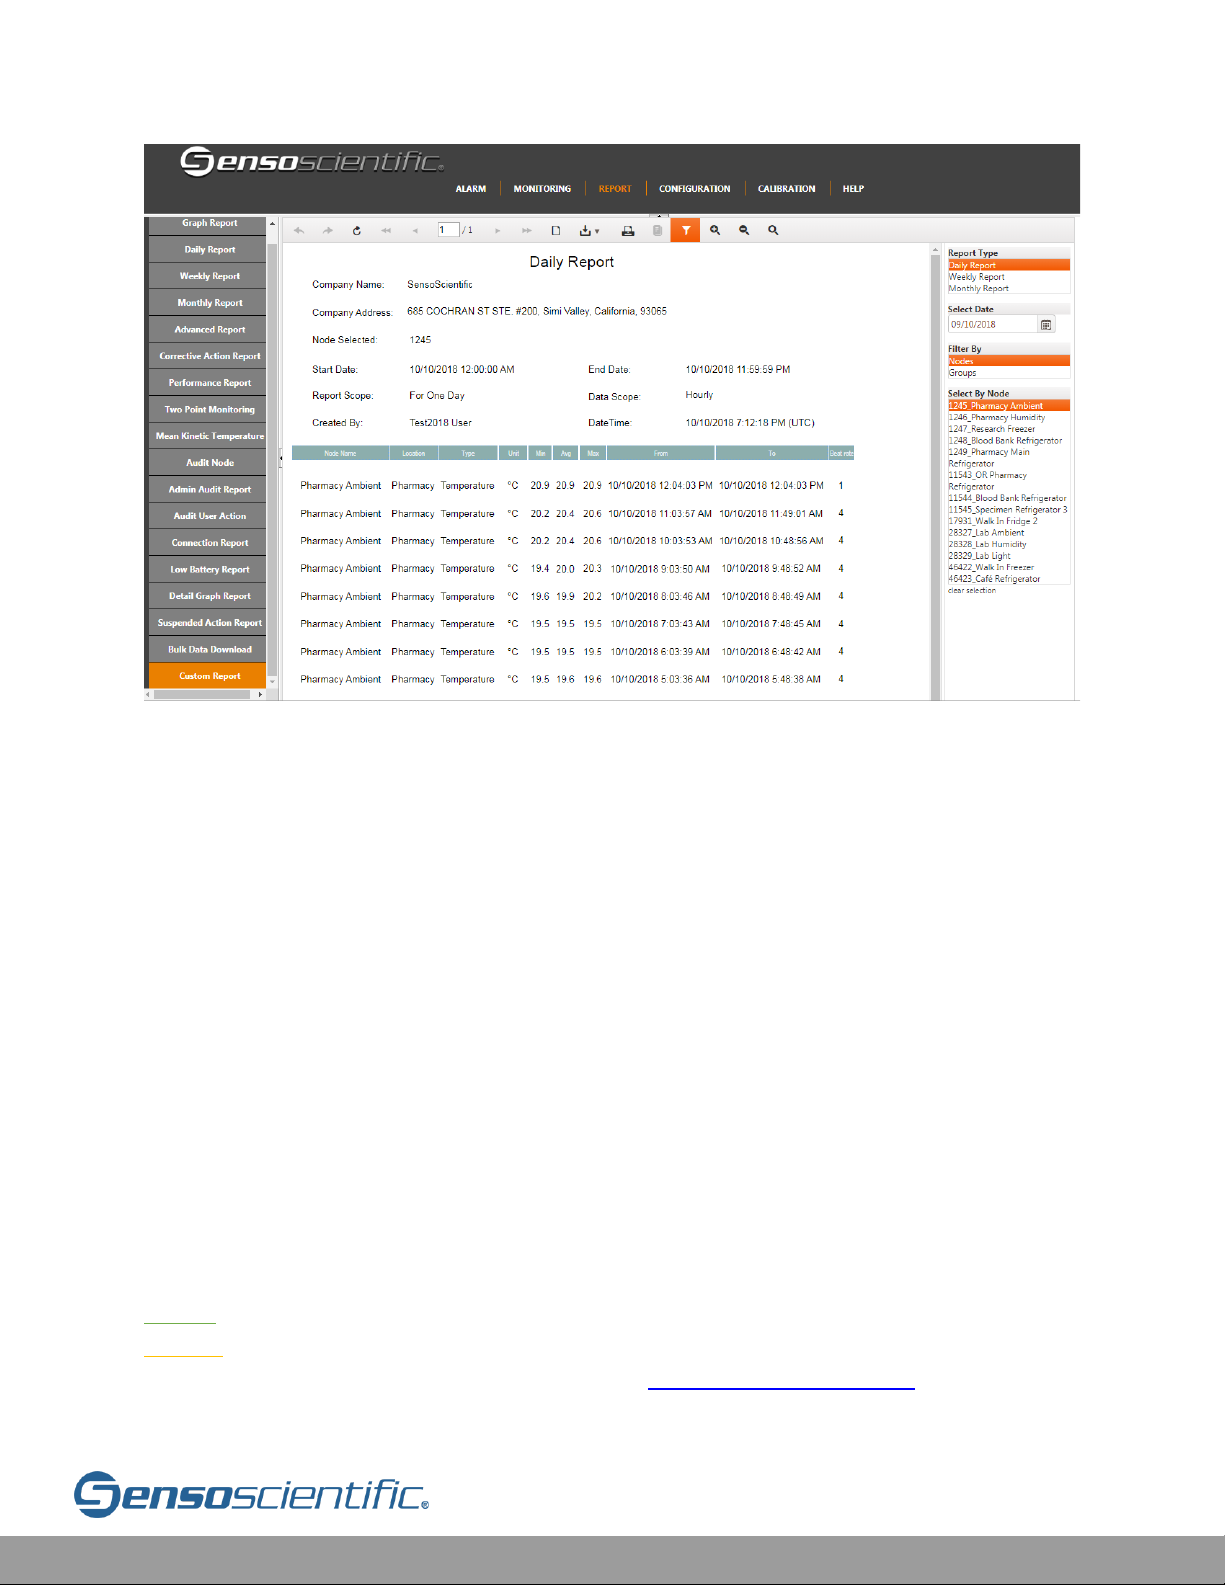
Cloud User Manual V20.6 90
Figure VI.17-1: Customer Report
VII. Monitoring
VII.1 Current Status
To monitor the current status of Wi-Fi Nodes and their probes, go to the “Current
Status” page under the “MONITORING” tab. It displays all the Wi-Fi nodes that are
registered and added to the current user's account. It shows the Name, Node ID,
and Location of the device for identification. For data, the page also displays the
Alarm High/Low, Alarm Delay, Node Type, Value, Last Updated (date and time
stamp), Value Status (In/Out of Range), Connectivity Status
(Connected/Disconnected), Alarm Status (Alarmed/No Alarm), and Notification
Status (Active/Inactive).
There is a color legend that explains the status of the system. A row of cells with
highlight in a color according to its status:
Green indicates all values are within range.
Yellow indicates temperatures/data are out of range, but the node has not yet
alarmed due to the Alarm Delay feature (See IV.2 Node Configuration for info).
Page 91
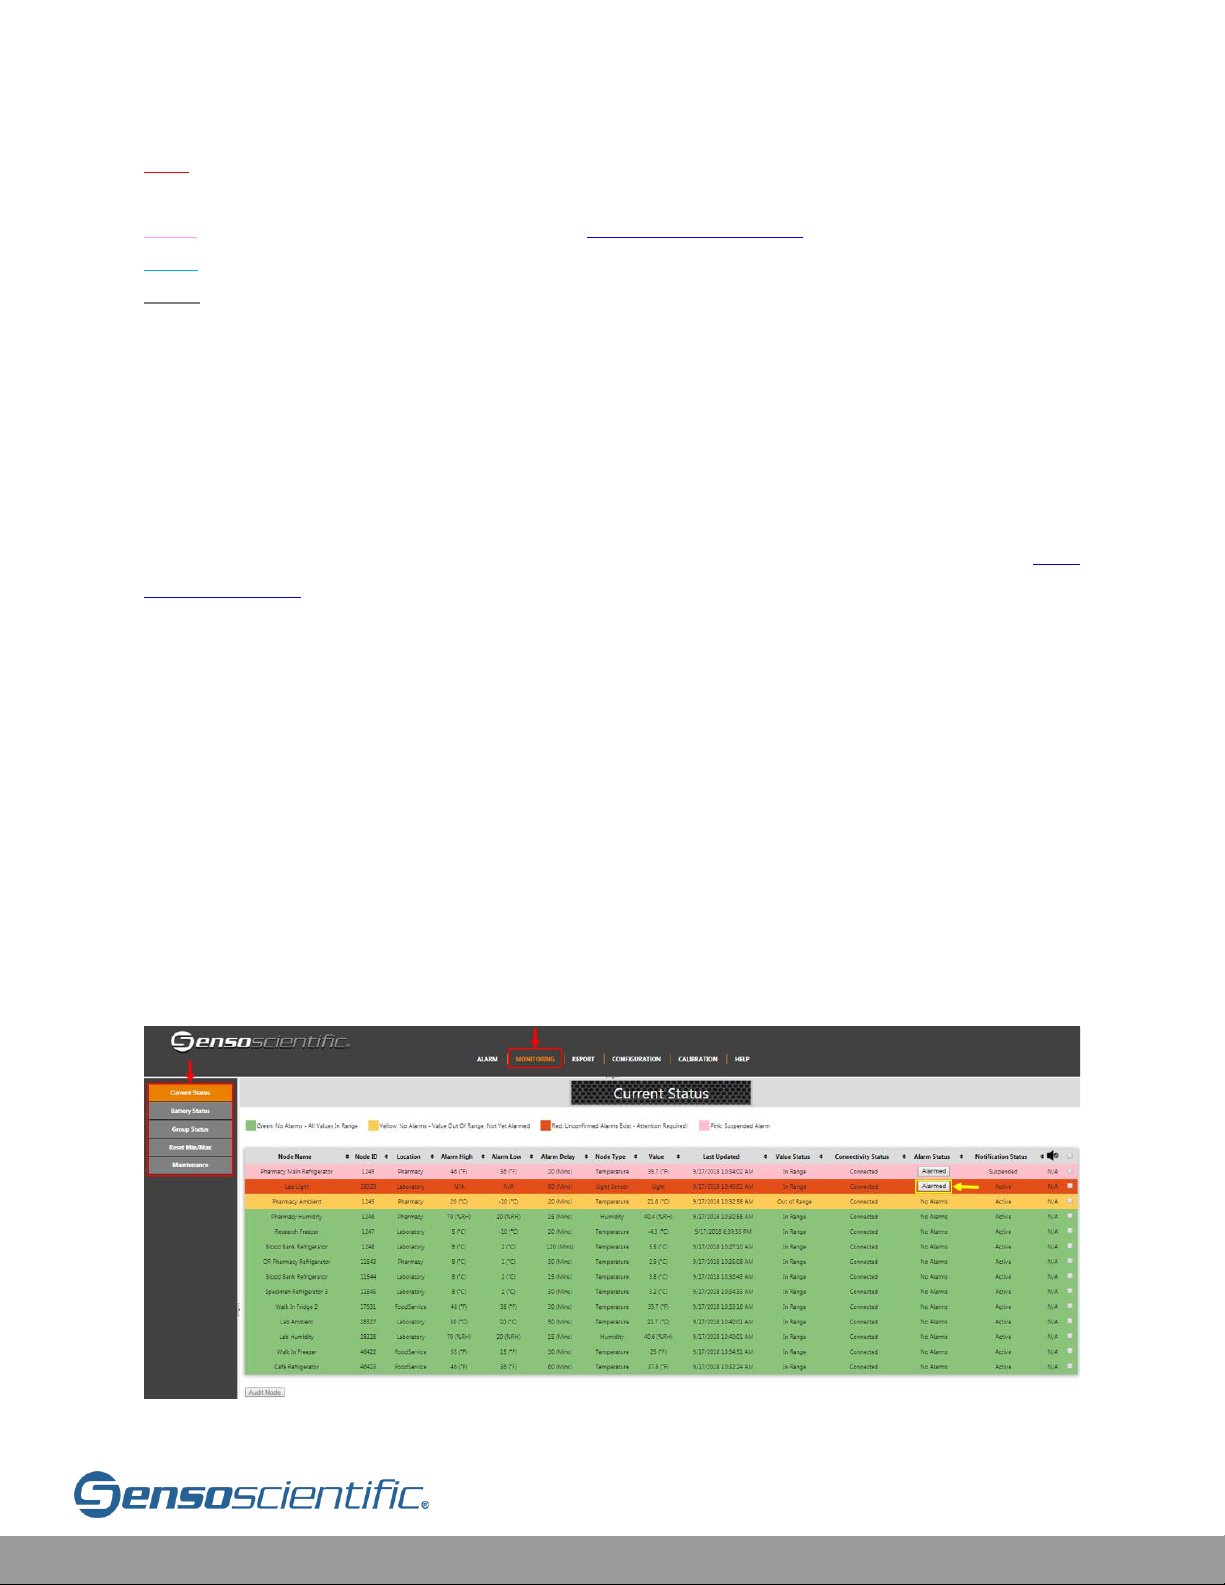
Cloud User Manual V20.6 91
Red indicates an alarmed status due to a data point out of range (Data Alarm),
connectivity issues (Signal Alarm), or low battery (Battery Alarm).
Pink indicates a Suspended Alarm (See IX.5 Suspend Alarm for info).
Blue indicates a Spare Node that is inactive on your account.
Grey indicates RMA Nodes that have been shipped to your facility and need to be
turned on and configured to Wi-Fi (See HELP > User Guide/Installation Docs > OTA
Node Quick Start Guide for more information)
From the current status page, the user has the ability to display a graph of an alarmed
Wi-Fi Sensor’s data by clicking the “Alarmed” button. Select the View Alarm Page to
analyze, document, and confirm alarms.
On the left sub menu, there is the option to view the “Battery Status” (See VII.2
Battery Status for more). Press the “Current Status” Button on the left sub menu to
refresh the page.
Please note that occasionally the node may still present itself in the alarmed (red)
state even if there is no out-of-range value, signal, or battery level issue. This can be
due to the fact that an alarm condition existed and was triggered. The node would
then enter an alarmed (red) state. There are two steps which must be taken
respectively return the node to a Normal (green) state.
1) The issue must be corrected so that the data is in range, the connection is
established, and/or the battery is full.
2) The alarm must then be confirmed by going to the ALARM tab and
confirming the alarm event.
Figure VII.1-1: Monitoring
Page 92
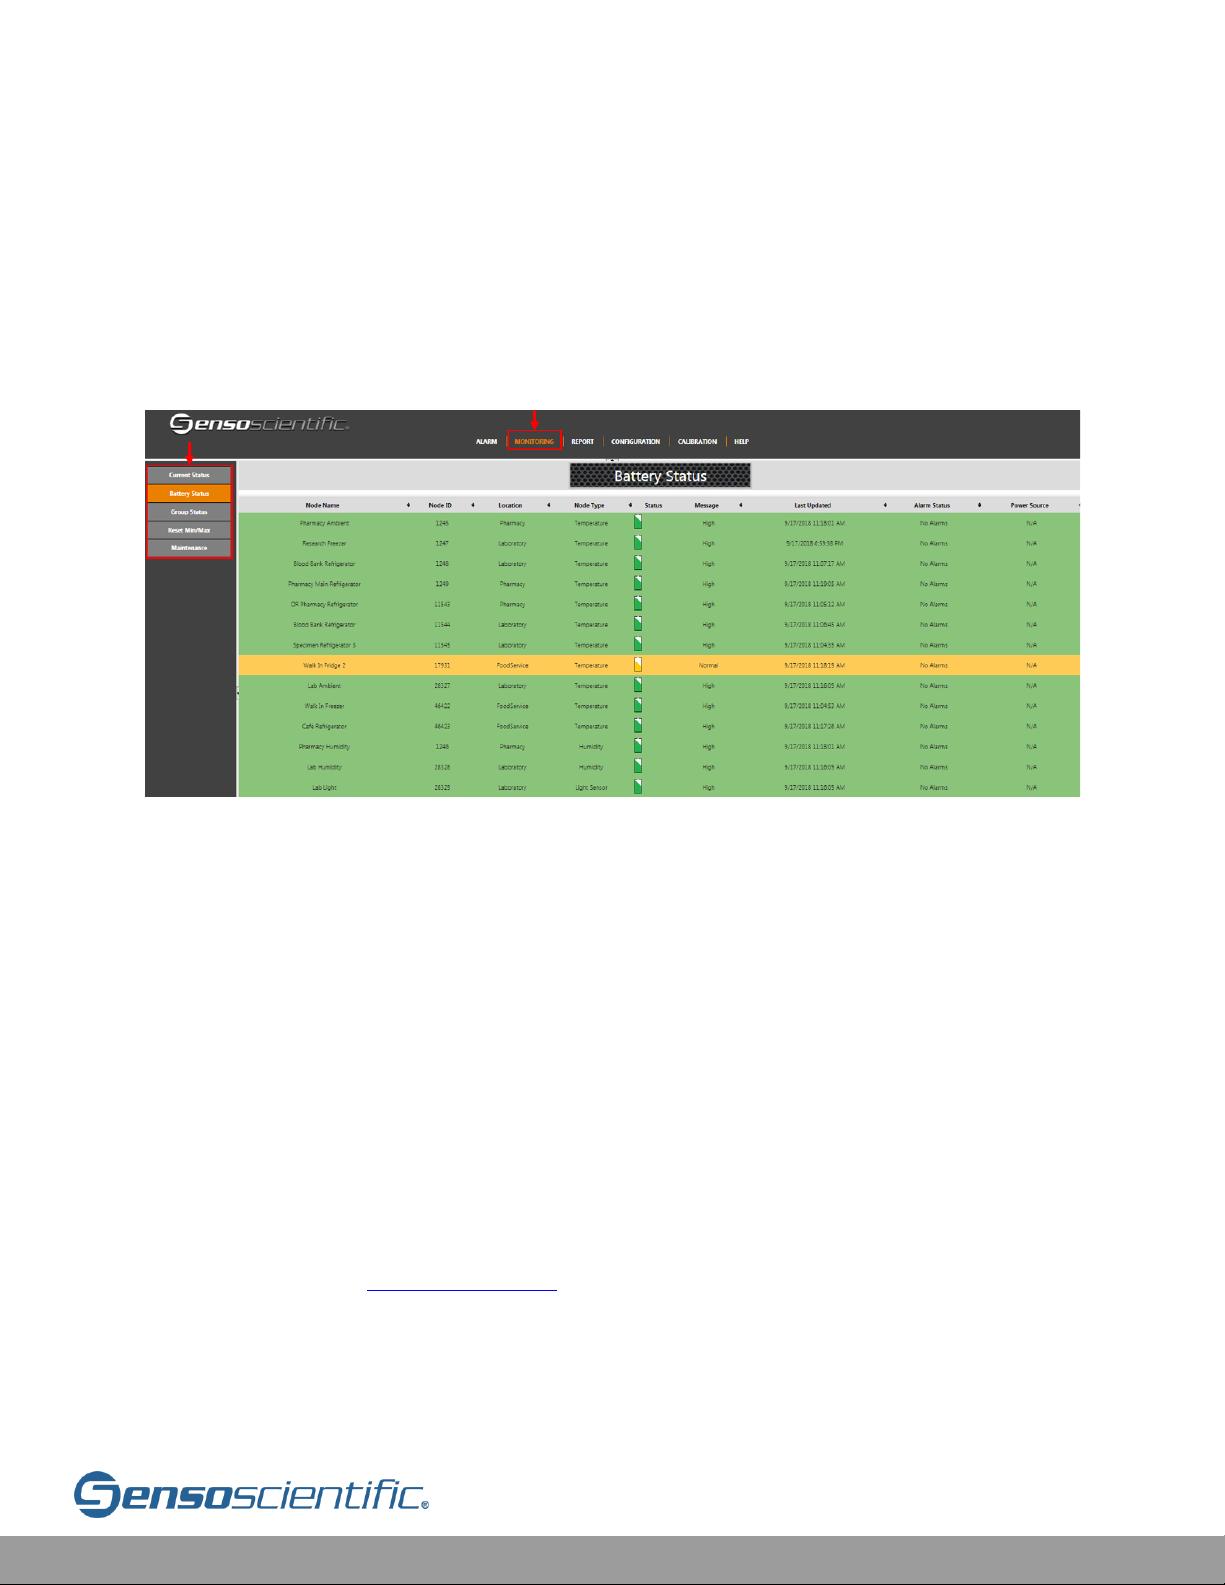
Cloud User Manual V20.6 92
VII.2 Battery Status
Every time each node updates with a temperature value, it sends its battery status
as well. For maintenance purposes to determine if a battery is high (green), medium
(yellow), or low (red). From the MONITORING page, select “Battery Status” from the
sub menu.
Figure VII.2-1: Battery Status
Under the “Power Source” column header, the source of the power is listed (i.e.
Internal Battery or External Power)
IV.11 Add/Remove Nodes from Groups
VII.3 Group Nodes
Monitoring can be made more intuitive by using the group selection interface. From
this screen, system and group administrators can view the status of entire groups.
By selecting a group in this screen, a monitoring page of only the nodes within that
group will be displayed. To use this feature, groups must be created by the system
administrator. Add certain nodes to each group and assign group administrators
over the group (See IV.3.a Permission for more on permission). They will only be able
to oversee the nodes in the group they’ve been assigned to. They can then add or
remove users to their group, audit user actions, and run reports on nodes. System
administrators, on the other hand, can view each group status from the Group Status
Page 93
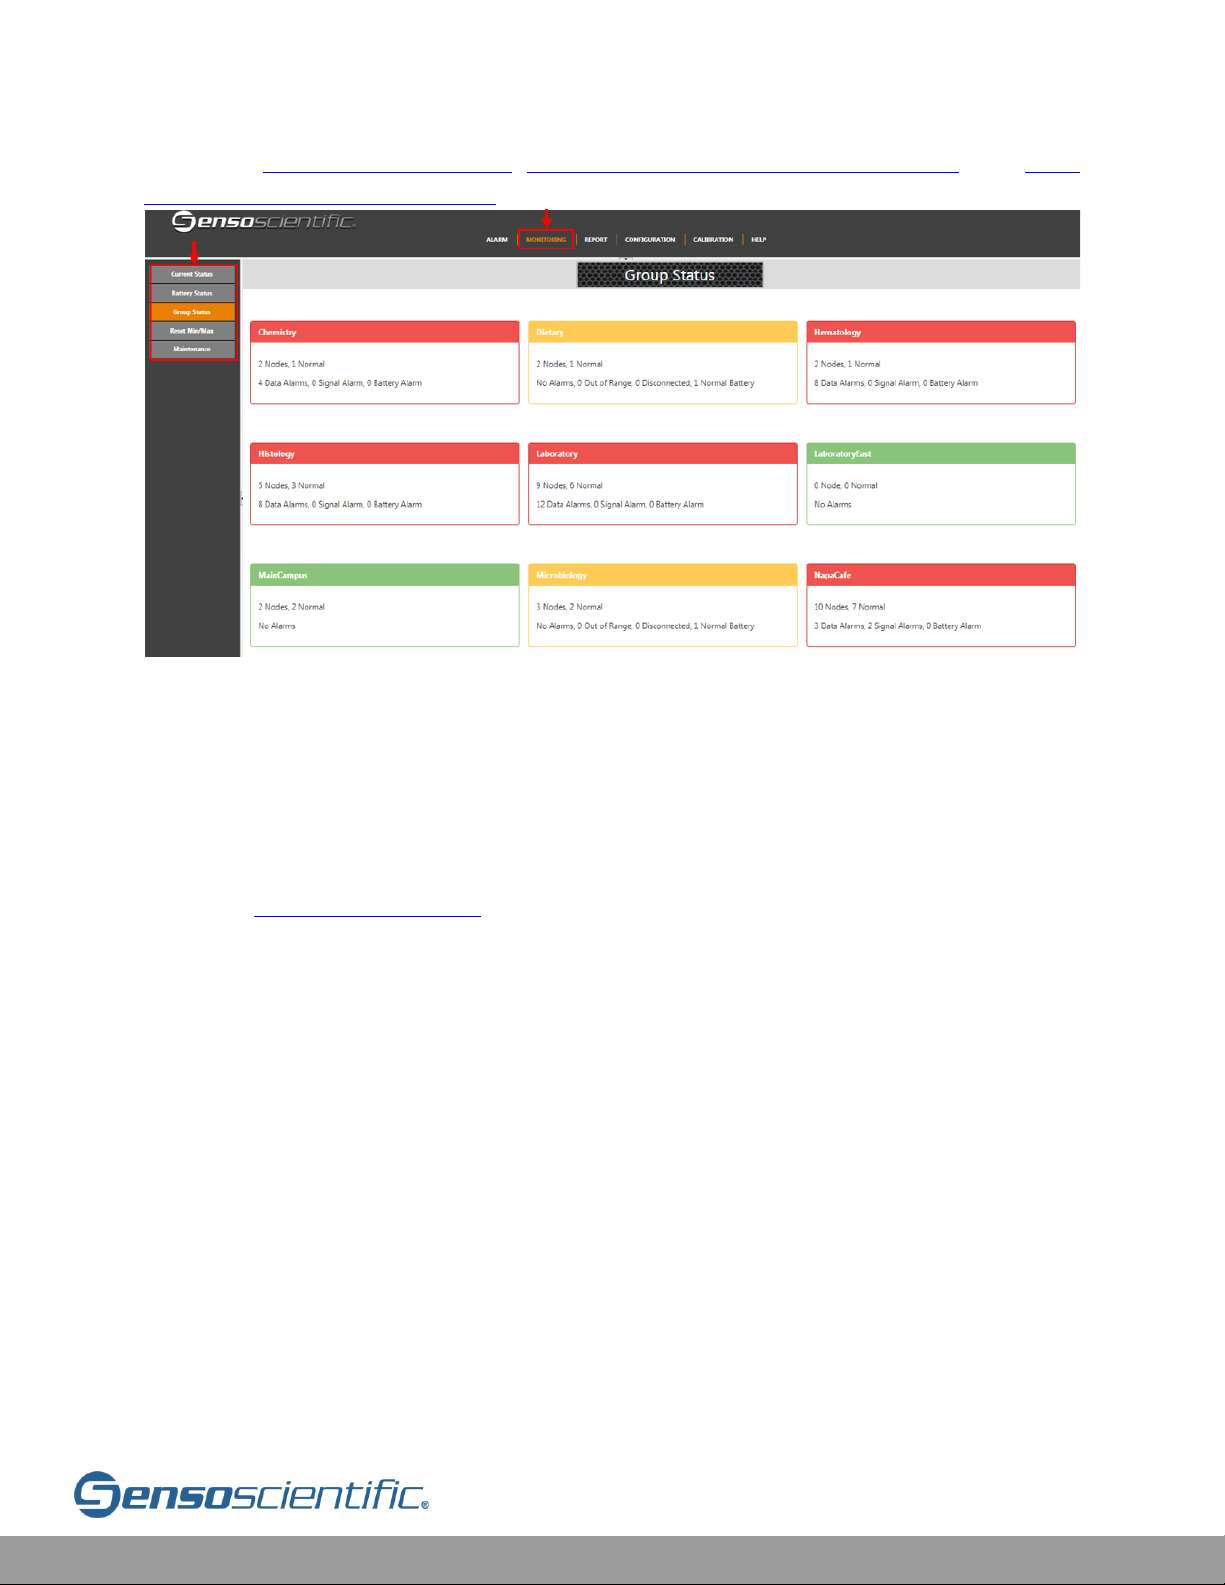
Cloud User Manual V20.6 93
page (See IV.10 Creating Groups, IV.11 Add/Remove Nodes from Group, and IV.12
Add/Remove Users from Group for more on Groups).
Figure VII.3-1: Group Nodes
VII.4 Reset Min/Max
This feature allows a user to reset the Minimum and Maximum data value recorded
for a given node. This is available only for OTA nodes. Go to MONITORING > Reset
Min/Max > Select the “Reset Min/Max” checkbox on the applicable node and press
save (See VIII.2 Reset Min/Max).
VII.5 Maintenance
The maintenance tab allows users to easily check what must be ordered in order to
maintenance their system. This tab can be found by going to the “MONITORING” tab
and selecting “Maintenance” from the left submenu. Details regarding each node
are included.
Page 94
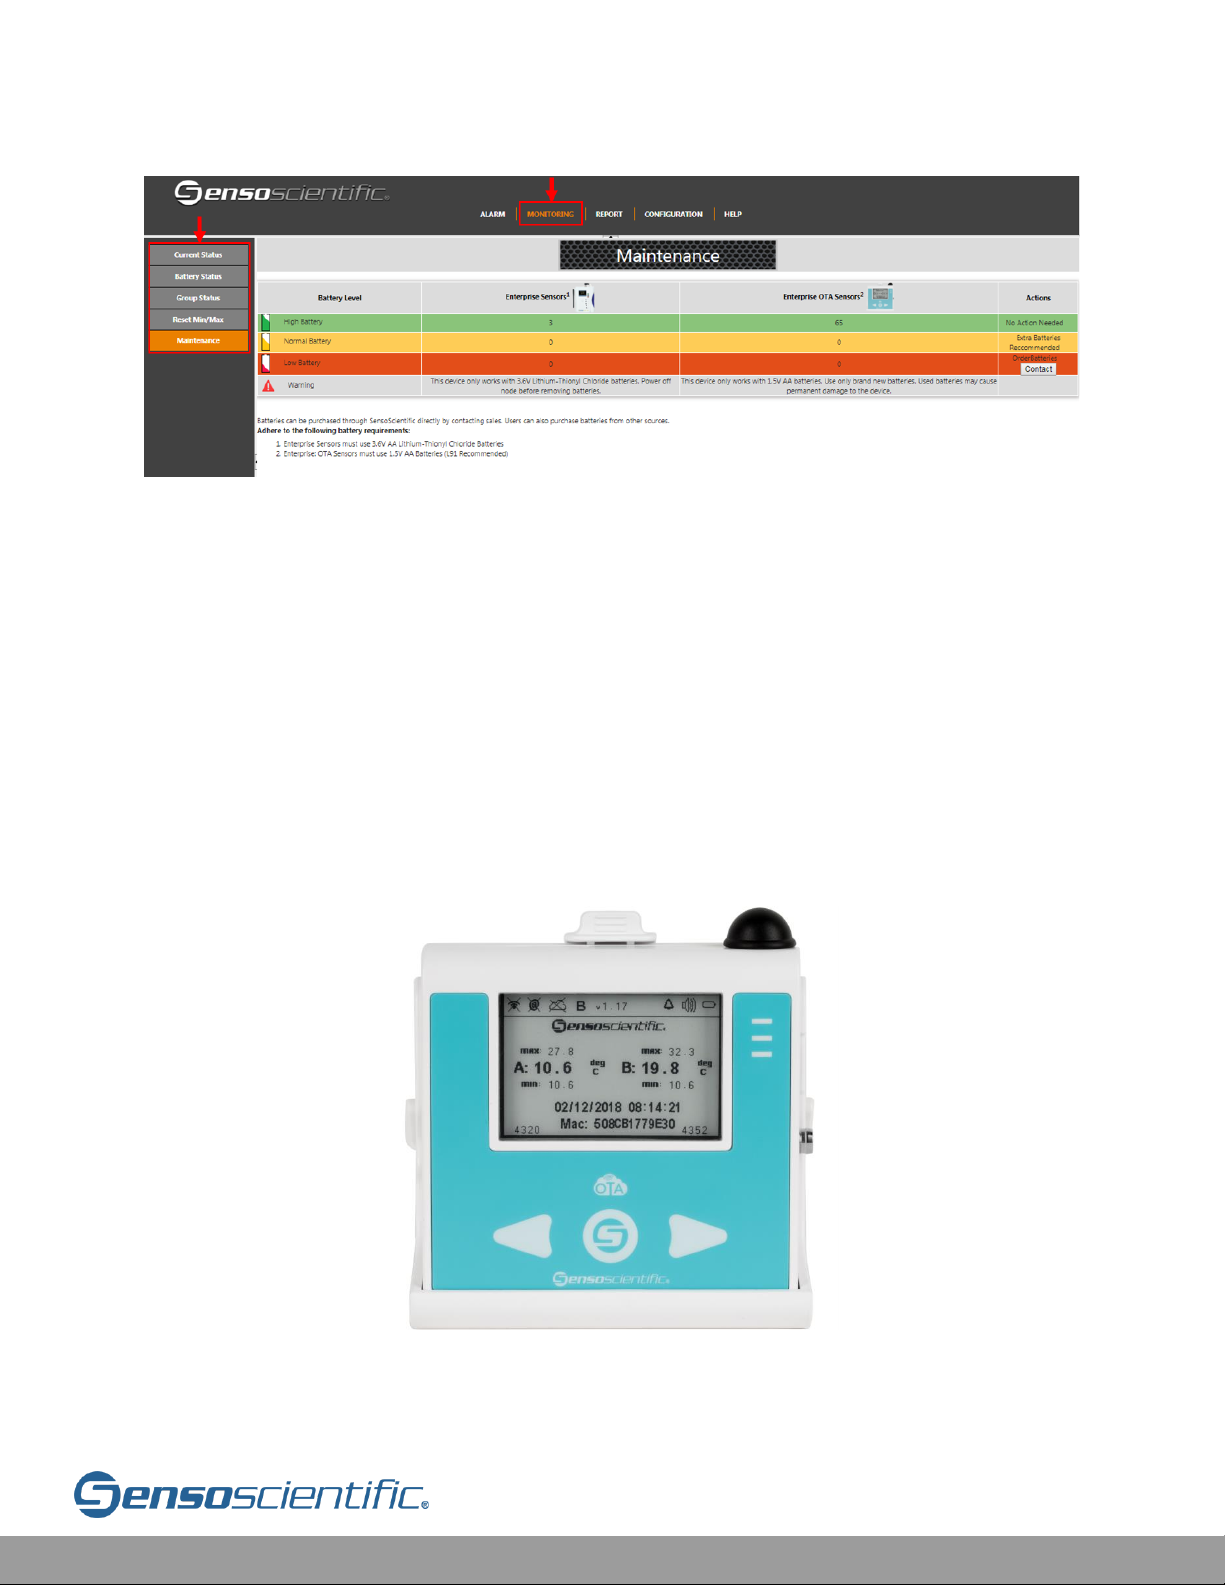
Cloud User Manual V20.6 94
Figure VII.5-1: Maintenance
VIII. OTA
Over the Air (OTA) is a set of functions and features which can be triggered remotely.
This includes functions like upgrading firmware, resetting device Min/Max, and other
tasks that would normally require someone interact at the device-level. The features
in the OTA section are only available with OTA Series nodes.
VIII.1 Display
The device display on the device can be altered from the cloud.
Figure VIII.1-1: Display
Page 95
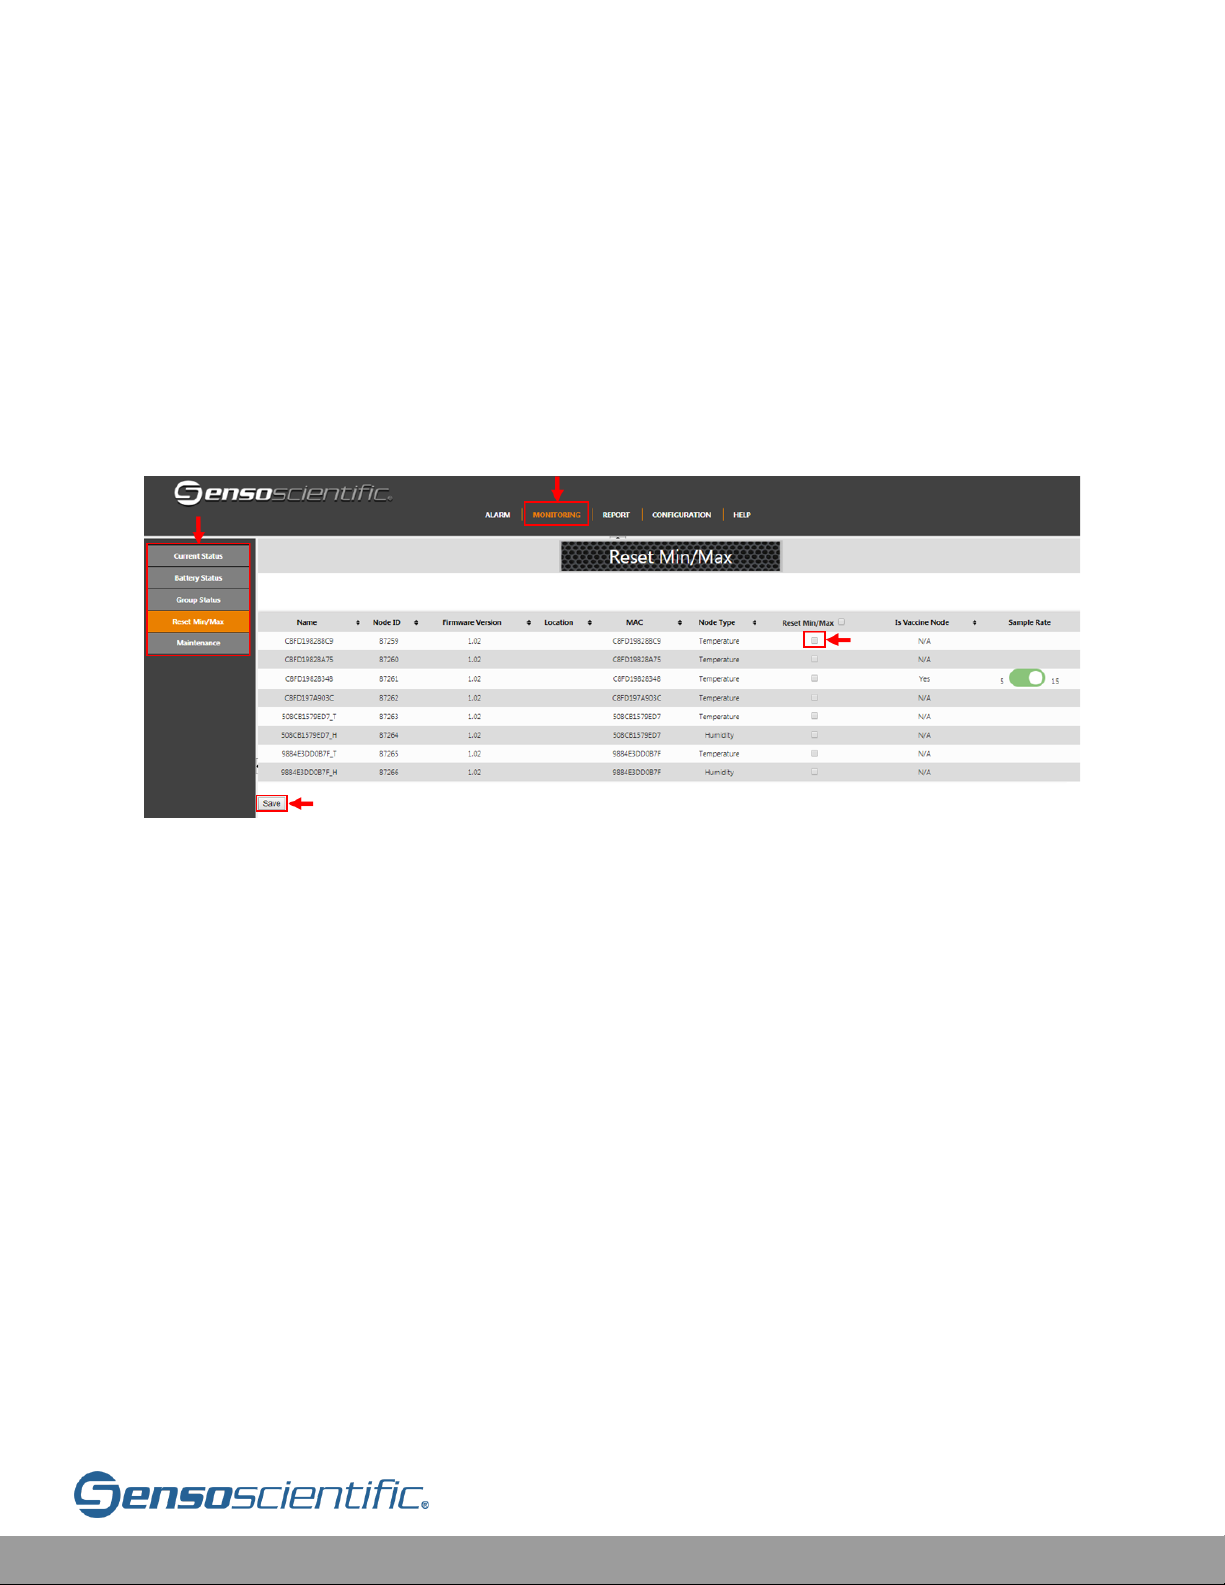
Cloud User Manual V20.6 95
VIII.2 Reset Min/Max
This feature allows a user to reset the minimum and maximum data value recorded
for a given node. To perform this, go to the “MONITORING” tab and then go to “Reset
Min/Max” on the left sub-menu. Click the check box of the node(s) to be reset or
select all clicking the checkbox at the top of the column. Finally, press “Save” at the
bottom of the screen to apply the settings. The next time communication between
the node(s) and cloud occurs, the changes will be applied to reset the minimum and
maximum temperatures.
Figure VIII.2-1: Reset Min/Max
VIII.2.a Schedule Reset Min/Max
Schedules can be created to reset the min/max of the OTA device at pre-determined
periodic intervals. To set up a schedule, start by going to CONFIGURATION then
select Nodes. From the dropdown, select Configure. Check the devices to schedule
(OTA only) on the right side. Then select, Schedule Reset Min/Max.
Page 96
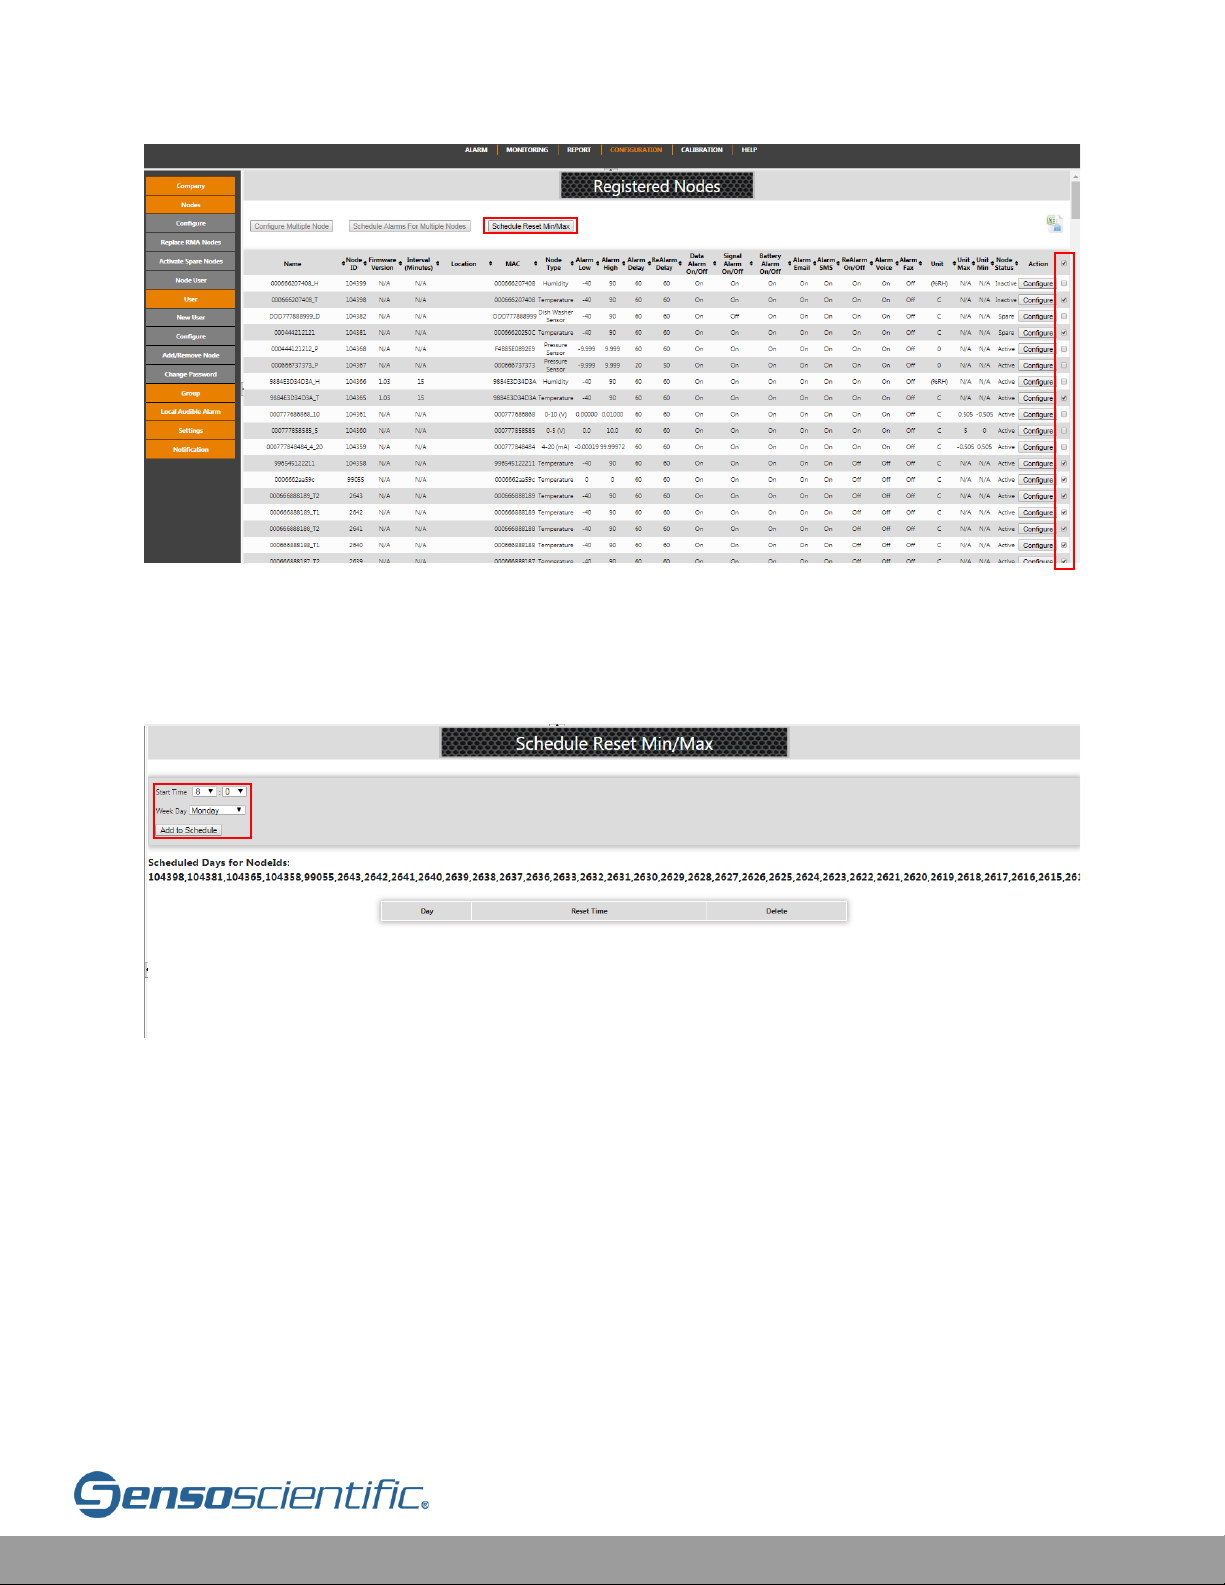
Cloud User Manual V20.6 96
Figure VIII.2.a-1: Schedule Reset Min/Max
Select the settings at the top left (Start Time and Day of Week) to schedule a reset.
Press Add to Schedule once all information is input.
Figure VIII.2.a-2: Schedule Days
The information will then populate in the schedule below.
Page 97
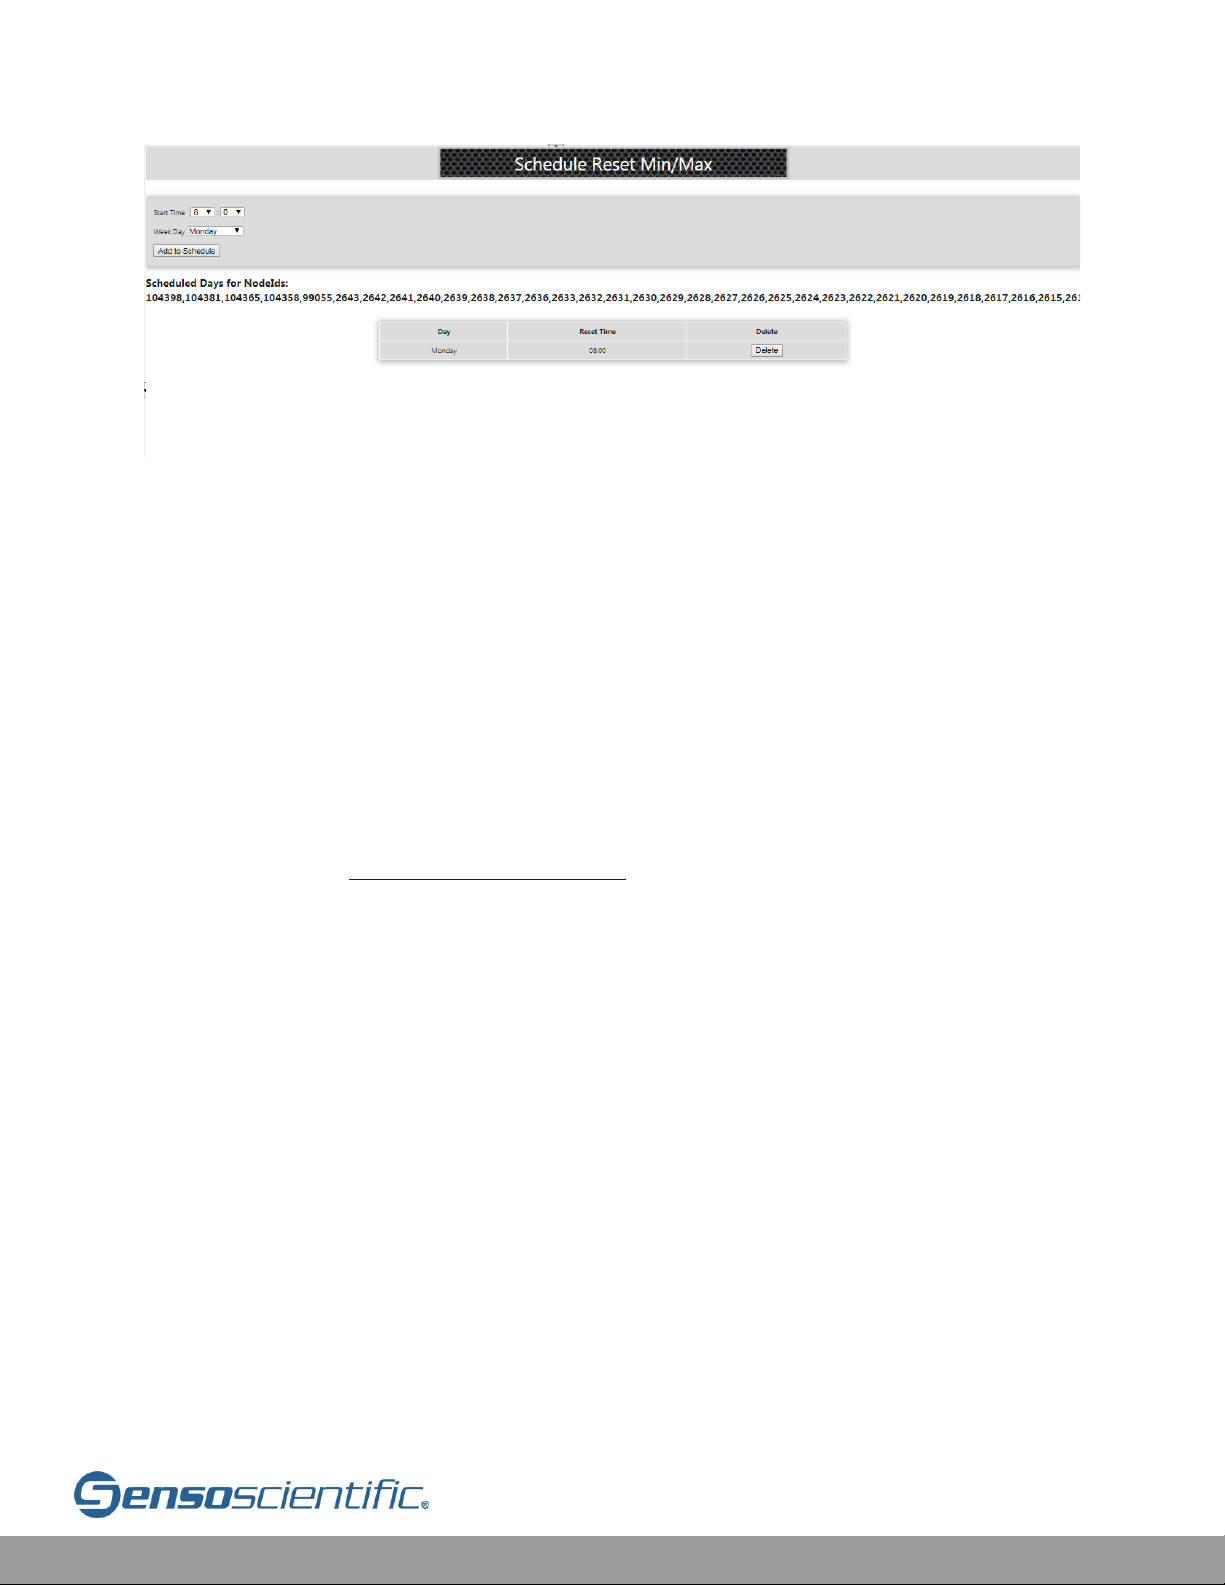
Cloud User Manual V20.6 97
Figure VIII.2.a-3: Schedule Populated
Once complete, the nodes selected will reset the min/max at the times listed in the
schedule. NOTE: The schedule allows for three resets in a single day and a total of 21
different times.
VIII.3 Change Measurement Unit (°C/°F)
The measurement unit on the device display can be changed to either Celsius or
Fahrenheit. This can be performed from the cloud under CONFIGURATION > Nodes
> Configure > Select the node to configure > Measurement Unit > Save. Multiple
nodes can be configured at once by selecting the checkboxes under the “Registered
Nodes” page (See IV.2 Node Configuration to configure multiple nodes).
Page 98
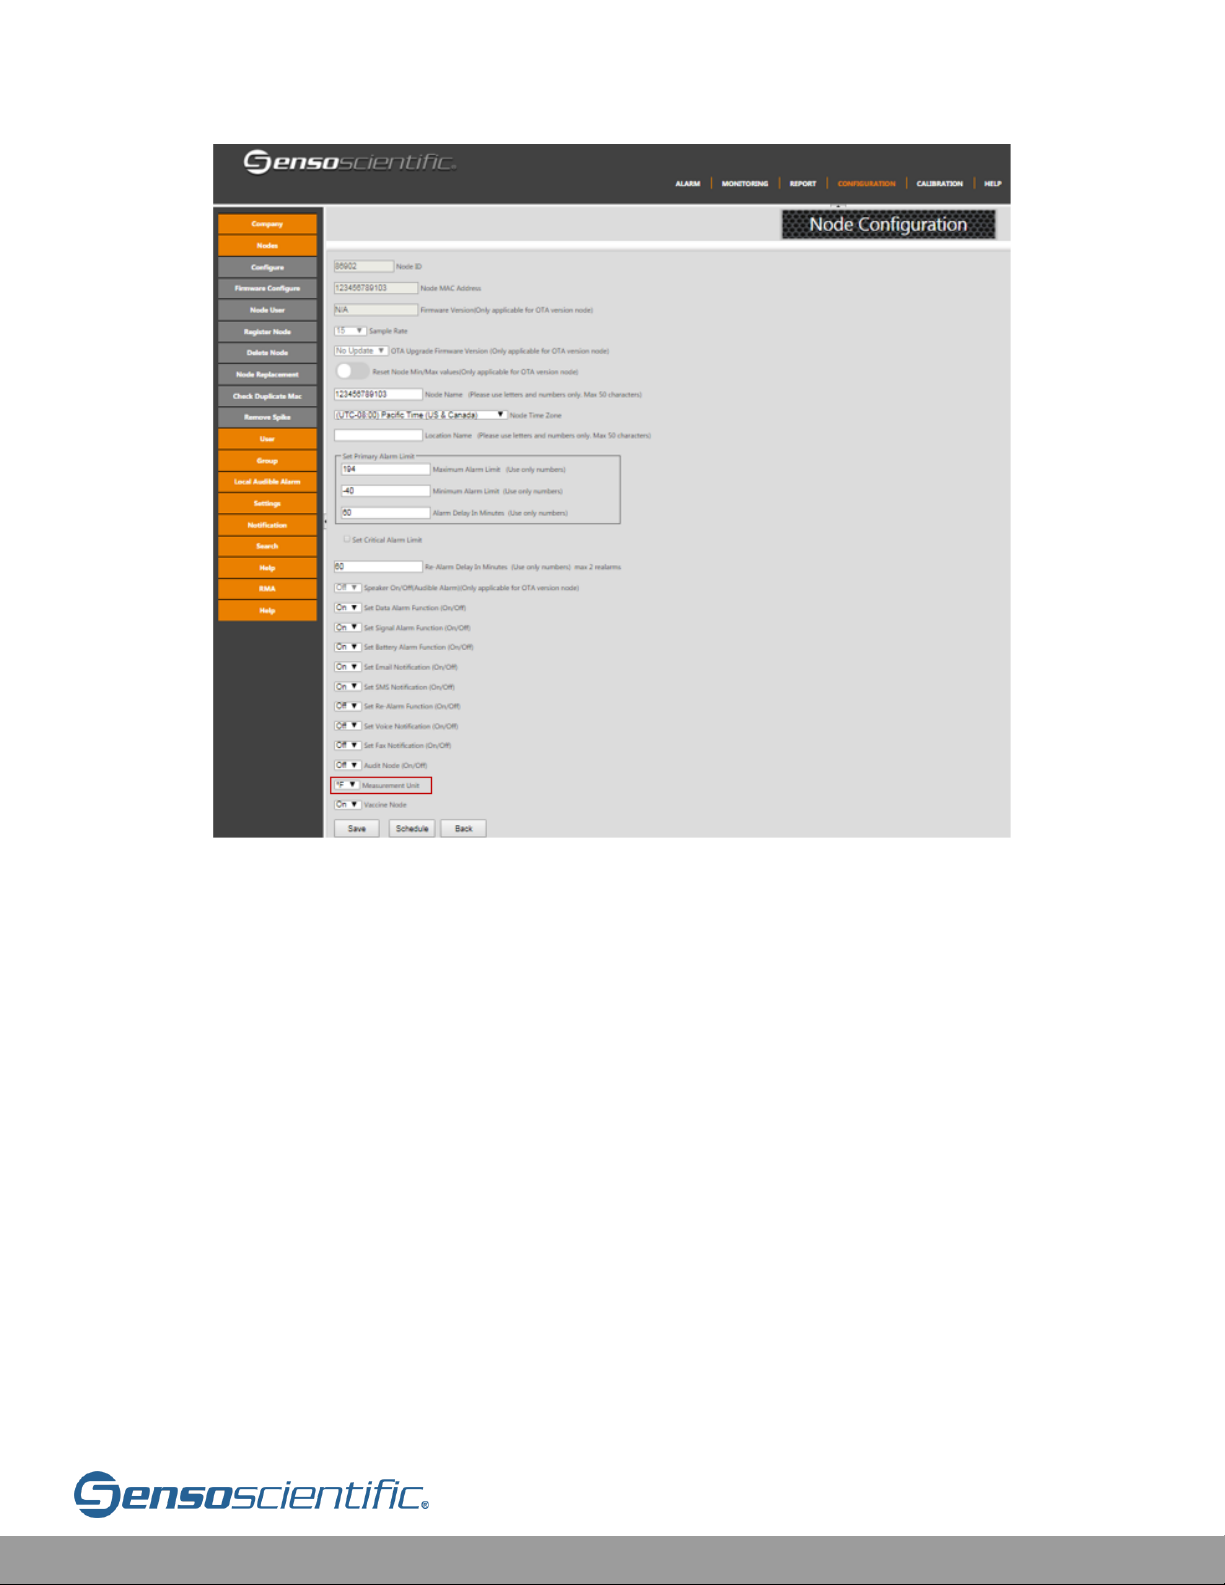
Cloud User Manual V20.6 98
Figure VIII.3-1: Measurement Unit
Select Celsius or Fahrenheit (°F) or Celsius (°C) and select “Save”.
VIII.4 Audible Alarm
By default, alarms trigger an audible speaker to turn ON to alert users that either a
battery or data alarm has occurred (Signal alarms will not cause the audible alarm to
sound). This can be permanently silenced from the device or the cloud. This will cause
the node to trigger silent alarms when a battery or data alarm has occurred. All other
notifications will be sent to the applicable users (email, SMS, etc…). To change the
audible alarm settings, go to the MONITORING tab.
Page 99
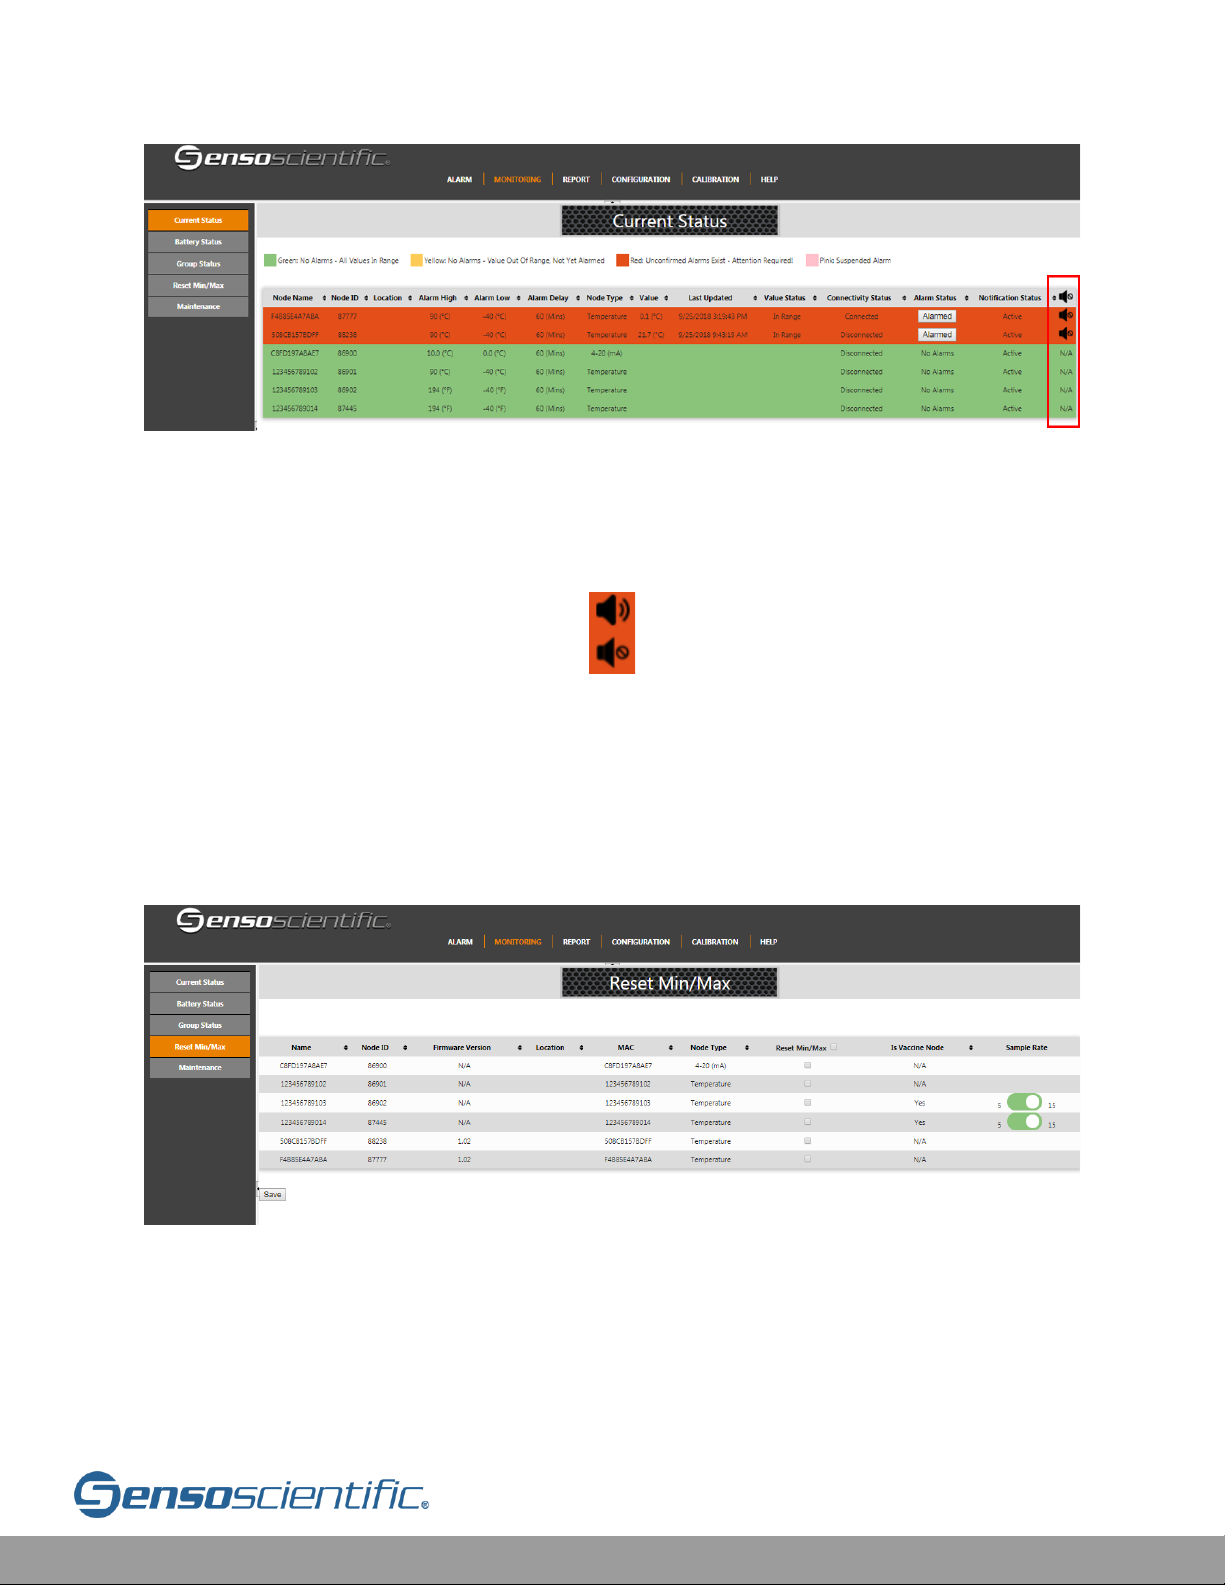
Cloud User Manual V20.6 99
Figure VIII.4-1: Silence Audible Alarm
Select the audible alarm symbol at the right to switch between Audible (top of figure
below) and Silenced (bottom of figure below).
Figure VIII.4-2: Audible Symbols
VIII.5 Sample Rate
The device’s sample rate can be changed to either 5 or 15 minutes. This can be
performed from the cloud under MONITORING > Reset Min/Max.
Figure VIII.5-1: Sample Rate
Select either 5 or 15 minutes. Once the changes have been made, select “Save”. The
next time communication between the node(s) and cloud occurs, the sample rate will
be updated to the preference selected.
Page 100

Cloud User Manual V20.6 100
IX. Alarm
Select ALARM from the main menu. To narrow the results, select individual nodes,
order, and start/end dates. Now select the “Retrieve” button. This populates the
screen with all the current alarms from the specified time frame
The user can confirm Alarms from this page by selecting the box corresponding to
the alarm they wish to confirm and then click the "Confirm" button. To view a
graphical representation of data alarms, click the "Show” button on the right side of
the screen.
Once the user clicks the "Confirm” button, the Confirm Alarm screen appears. This
is where alarms can be documented. First, select a Root Cause (i.e., Door Open,
Defrost Cycle, Restocking, etc). The option to provide a description about the issue is
available but not required to proceed. A Corrective Action Note must be entered,
however. Once this is complete, click the "Confirm” button. This will save and time
stamp the Corrective Action. Access this data by creating a Corrective Action
Report.
*** PLEASE NOTE *** If the out of range condition persists (i.e. Data, Battery, Signal)
then the node will revert to a yellow state. It will wait the allotted Alarm Delay period
and then generate another red state alarm. Fix the excursion and then confirm the
alarm for the node to return to a green state. For data alarms, be sure the
temperature/humidity has stabilized before confirming the alarm. For Signal Alarms,
be sure the Wi-Fi Network is functioning, and for Battery Alarms swap out the
batteries before confirming the alarm.
**WARNING – DISPLAYED ON THE REPORT TO THE LEFT OF “SORT ALARMS” IS THE
“Delete all alarms” FEATURE. BY SELECTING THIS, ALL ALARMS PRESENT WILL BE
PERMANENTLY DELETED AND NO RECORDS CAN BE RECOVERED. **
 Loading...