

Page 1
Extended Warranty
Program
SM
User’s Guide
Shop online at
omega.com
e-mail: [email protected]
For latest product manuals:
www.omegamanual.info
®
OMYL-SOFT-PLUS
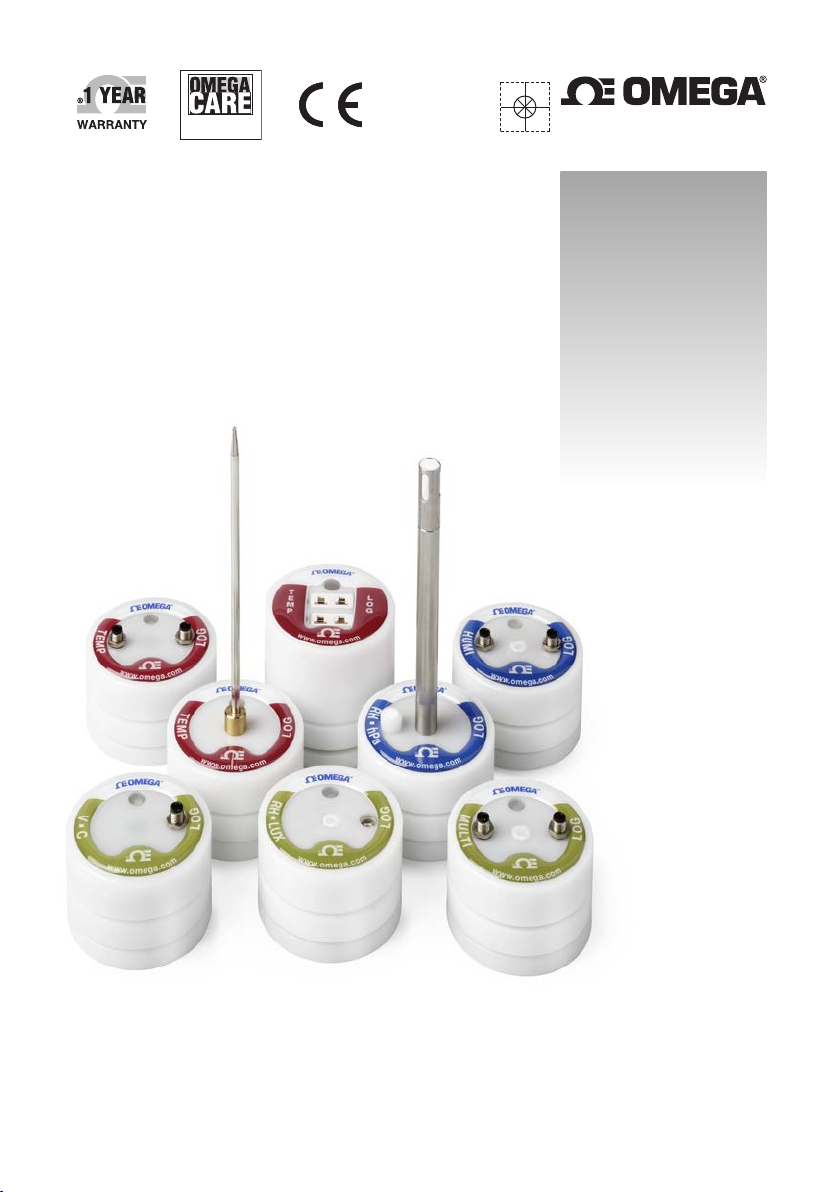
Omega View Plus Software for
OMYL Series Portable Data Loggers
Page 2

omega.com [email protected]
Servicing North America:
U.S.A.: Omega Engineering, Inc., One Omega Drive, P.O. Box 4047
Stamford, CT 06907-0047 USA
Toll-Free: 1-800-826-6342 (USA & Canada only)
Customer Service: 1-800-622-2378 (USA & Canada only)
Engineering Service: 1-800-872-9436 (USA & Canada only)
Tel: (203) 359-1660 Fax: (203) 359-7700
e-mail: [email protected]
For Other Locations Visit omega.com/worldwide
The information contained in this document is believed to be correct, but OMEGA accepts no liability for any errors it contains,
and reserves the right to alter specifications without notice.
WARNING: These products are not designed for use in, and should not be used for, human applications.
Page 3

Contents
Introduction .............................................................................. 1
Welcome to GraphTool ............................................................................ 1
What is GraphTool? ................................................................................. 1
Overview ................................................................................... 2
Delivery Contents .................................................................................... 2
System requirements ............................................................................... 2
Installing .................................................................................................. 3
Software-Versions and Options ............................................................... 4
Software-V ersions ................................................................................................................... 4
Activating the Options ............................................................................................................. 4
The User Interface.................................................................... 5
The Menu ................................................................................................ 5
The Toolbar ............................................................................................. 8
Selecting a Language ............................................................................ 10
Help ...................................................................................................... 11
Hints...................................................................................................... 12
The Background Color ........................................................................... 12
The Diagrams ......................................................................... 13
Representation Possibilities ................................................................... 13
Creating a Diagram ............................................................................... 15
Assigning a Channel .............................................................................. 15
Defining an Axis .................................................................................... 17
Setting of Line Parameters .................................................................... 18
Setting/Copying of Diagram Parameters ................................................ 19
Arranging Diagrams / Deleting / Copying to the memory clipboard ......... 20
OmegaView Plus 31437 V1
Operating Manual Page i
Page 4

Diagrams display On/Off / scale down / delete ....................................... 21
Channel list ............................................................................................ 22
The Y/t-Diagram .................................................................................... 23
The Y/t-Diagram in Partial View............................................................................................ 23
The Y/t-Diagram in Entire Screen View ................................................................................ 24
The Measurement Data S egment in Y/t-Diagram ................................................................ 25
Scaling the Y-Axes in Y/t-Diagram ....................................................................................... 26
Scaling the X-Axis in Y/t-Diagram ........................................................................................ 27
The Overview Diagram of Y/t-Diagram ................................................................................ 30
The Legend of Y/t-Diagram................................................................................................... 30
The second data cursor of the Y/t-Diagram ......................................................................... 31
The X/Y-Diagram ................................................................................... 32
The X/Y-Diagram in Partial View .......................................................................................... 32
The X/Y-Diagram in Entire Screen View .............................................................................. 33
The Measurement Data Segment in X/Y-Diagram .............................................................. 33
Scaling the Y-Axis in X/Y-Diagram ....................................................................................... 35
Scaling the X-Axis in X/Y-Diagram ....................................................................................... 36
The Legend of X/Y-Diagram ................................................................................................. 36
The Statistic Diagram ............................................................................. 37
Diagram Functions ................................................................................................................ 37
The Single Column Display of the Statistic Diagram ........................................................... 38
The local Menu (Context menu of diagrams) .......................................... 40
The Measuring Data Lists ..................................................... 42
The Global Measuring Data List ............................................................. 42
The Local Measuring Data List with Absolute Time Relation ................... 43
The Local Measuring Data List with Relative Time Relation .................... 43
Functions of the Measuring Data List ..................................................... 44
Data Entr y for the D ocumentation of the Measuring Data List ............................................ 44
Exporting Data from the Measuring Data List ...................................................................... 44
Printing Measuring Data List ................................................................................................. 46
31437 V1 OmegaView Plus
Page ii Operating Manual
Page 5

The Evaluation of the Measurement..................................... 47
Entering / Editing Formula (Standard) .................................................... 47
The Fields of the Formula Enter / Select Dialog Box ........................................................... 47
Creating a New Formula ....................................................................................................... 48
List of Implemented Mathematical Functions ....................................................................... 49
Special Function .................................................................................................................... 49
Applying / Saving a New Formula ........................................................................................ 50
Loading an Exist ing Formula ................................................................................................ 50
Using Variables ..................................................................................... 51
Enter / Edit Variables ............................................................................................................ 51
Editing Variables ................................................................................................................... 52
The Fields of the Variable Entry / Selection ......................................................................... 53
Formulate a New Variable .................................................................................................... 53
Accept / Save a N ew Variable .............................................................................................. 53
Load Variable / Merge Variable / Save................................................................................. 54
Printing-out of Measurements .............................................. 55
Configure Printer ................................................................................... 55
Diagram Preview ................................................................................... 56
Print Diagrams....................................................................................... 58
Multi-Plot (Standard) .............................................................................. 59
Print Measuring Data List ...................................................................... 61
Exporting Measuring Data ..................................................................... 62
The Files ................................................................................. 63
File Types ............................................................................................. 63
Open Measurement Files ...................................................................... 63
Join Several Measurement Data Files.................................................... 64
OmegaView Plus 31437 V1
Operating Manual Page iii
Page 6

Page 7
Introduction
Welcome to GraphTool
Welcome to the graphing tool “GraphTool”. This manual enables you to quickly get f amiliar with
the windows-program and to quickly get started.
It describes how to install the p ackage an d how to execute most common program operations. It
provides tips and makes you aware of some new features and functions.
If you want to know more details or technic al features about the graphing functionality, please
proceed to the corresponding sections, where the available inf ormation are described.
What is GraphTool?
GraphT ool is a windows-program used for graphing and evaluating measuring values bas ed on
files created by OMYL series data loggers. This program oper ates under W indows XP and
Win7.
The Online-Help is the main source of inf ormation about GraphTool. All necess ary program
functions are described in the menu Help under the item Contents. Further information can be
found in the respective sub item by clicking the mouse.
In all dialog boxes, quick help with hints and inf ormation to the respective entry fields and
processing possibilities are provided. Just activate the corresponding Help buttons
The program uses the keyboard as well as the mous e for easy handling. In the standard user
setting, the Icons in the menu bar are provided with short help.
OmegaView Plus 31437 V1
Operating manual Page1
Page 8
Overview
Delivery Contents
Your OmegaView or OmegaView Plus package should contain the f ollowing:
· 1 pc OmegaView incl. Graph Tool supplied on a USB Memory Stick
· OmegaView user guide manual as PDF, which will be installed in the directory DOCS.
· GraphTool license number as separate document. (only OmegaView Plus)
If any of the above listed part is missing, please contact Omega.
System requirements
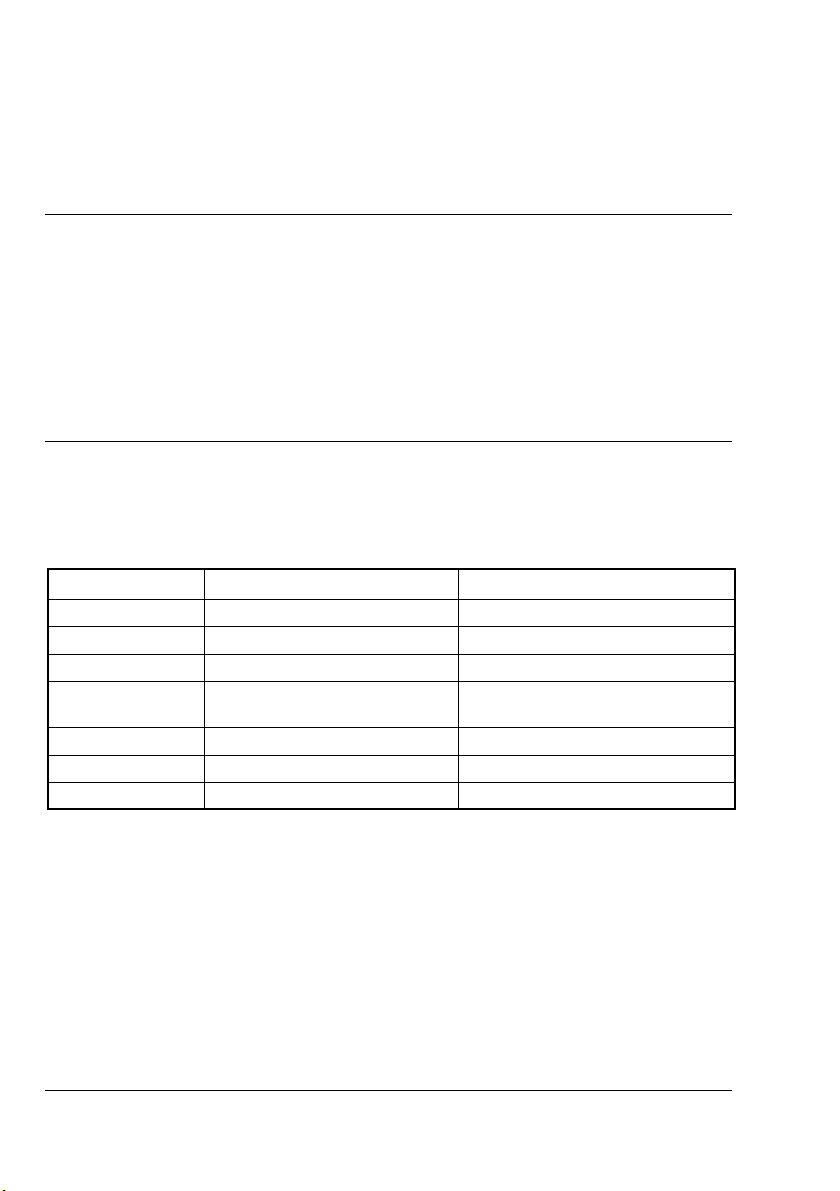
To run your OmegaView properl y, your system should at least meet the following requirements.
Normally, you can install and operate with OmegaView if your W indows is properly installed;
you have a free communication port USB and enough hard disk space available.
Hard-/Software Minimum-Conf iguration Recommended Configuration
Computer: Intel Pentium, 1 GHz Intel Pentium III, 2 GHz
Operating system: Windows XP/W in7 Windows XP/Win7
RAM: 512 MB 1 GB or more
Monitor: Any windows-supported monitor Monitor with VGA- or higher
Mouse: Any windows-supported mouse Any windows-supported mouse
Port: 1 free USB-port 1 free USB-port
Printer: Any windows-supported printer Any windows-supported printer
resolution graphic
31437 V1 OmegaYiew Plus
Page 2 Operating Manual
Page 9
Installing
GraphT ool is automatically installed, when OmegaView f or W indows has
been installed.
For using graph-functionality, you only need to enter the lic ense key number
as described in the next chapter.
ATTTENTION:
Some functions described in this manual will only be available if the
OmegaView Plus license has been installed.
OmegaView Plus 31437 V1
Operating manual Page3
Page 10
Software-Versions and Options
Software-Versions
The progr am OmegaView for Windows is the main software for setting up and using the data
loggers. It is available in two versions OmegaView and OmegaView Plus.
The basic – Version does not offer any graphing functionality while the Plus versions include the
graphing tools “GraphT ool”.
Activating the Options
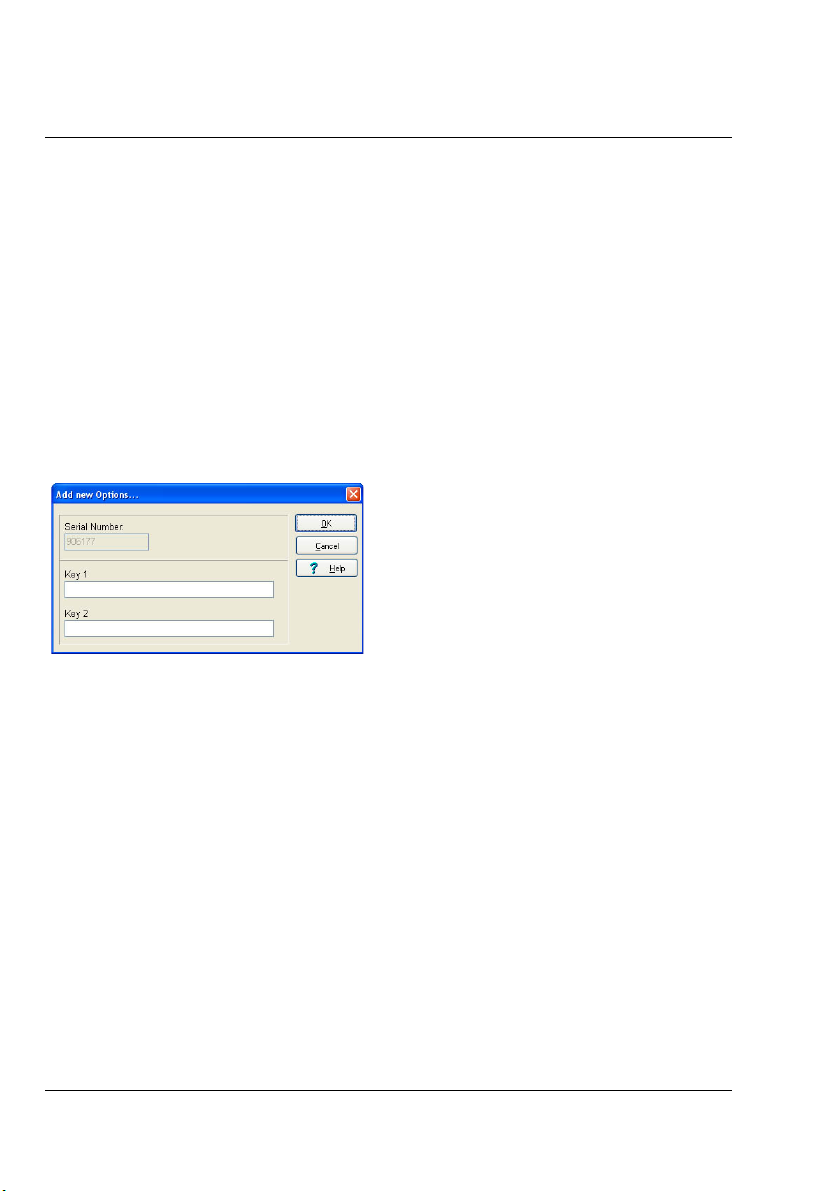
By choosing in the main menu Help the sub-menu activate options, the shown dialog box will
be opened. You may activate here further software options with the help of a registr ation key.
Please contact Omega to purc hase an OmegaV iew Plus registr ation key (P/N OMYL-SOFTPLUS).
31437 V1 OmegaYiew Plus
Page 4 Operating Manual
Page 11
The User Interface
The Menu
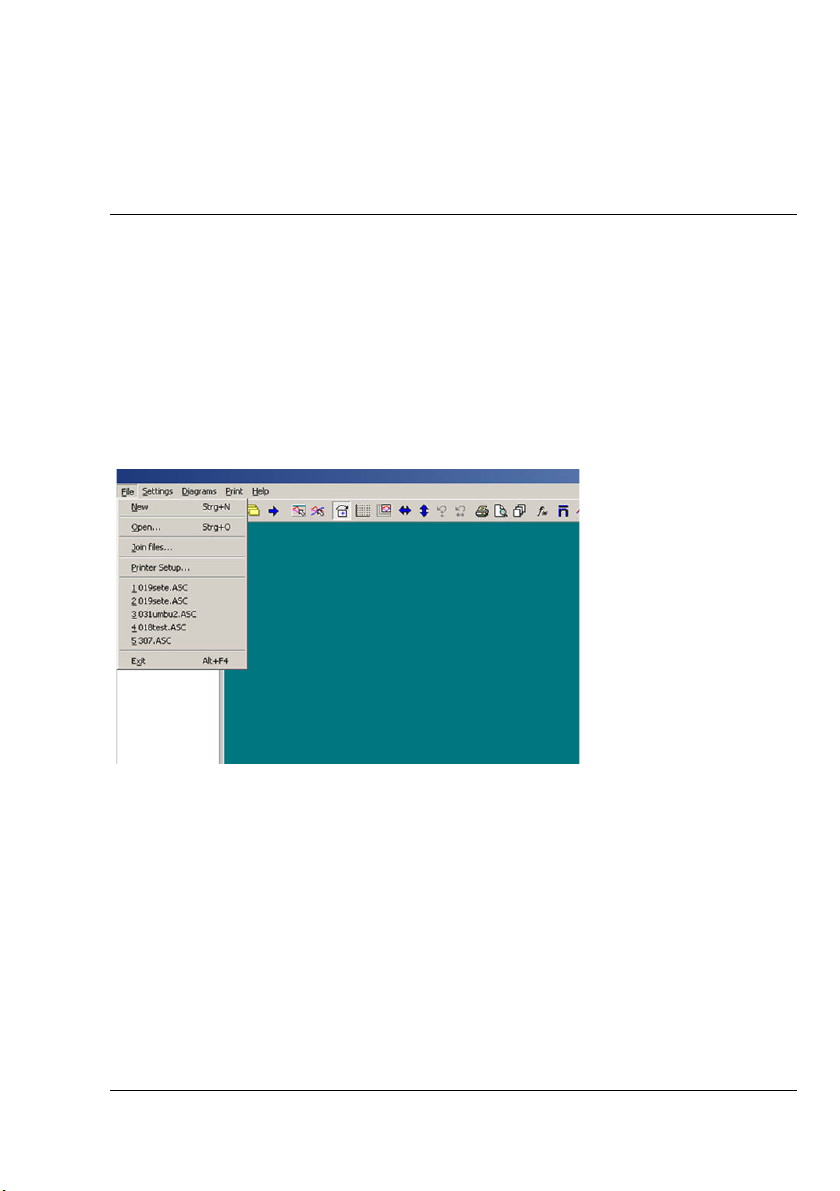
The user interface of the program is graphical and is in acc ordance to the common windowsstandard. You can activate each function either via M enu or via buttons in the toolbar. In
addition, the buttons contain short hints about its function. Please note, only menus and
buttons, which ar e necessary f or the program part, currently in use are active.
The menu is made up of seven functional groups.
The File group contains general information ab out program execution and managing, s aving of
measurement and configuration data and printer settings.
OmegaView Plus 31437 V1
Operating Manual Page 5
Page 12
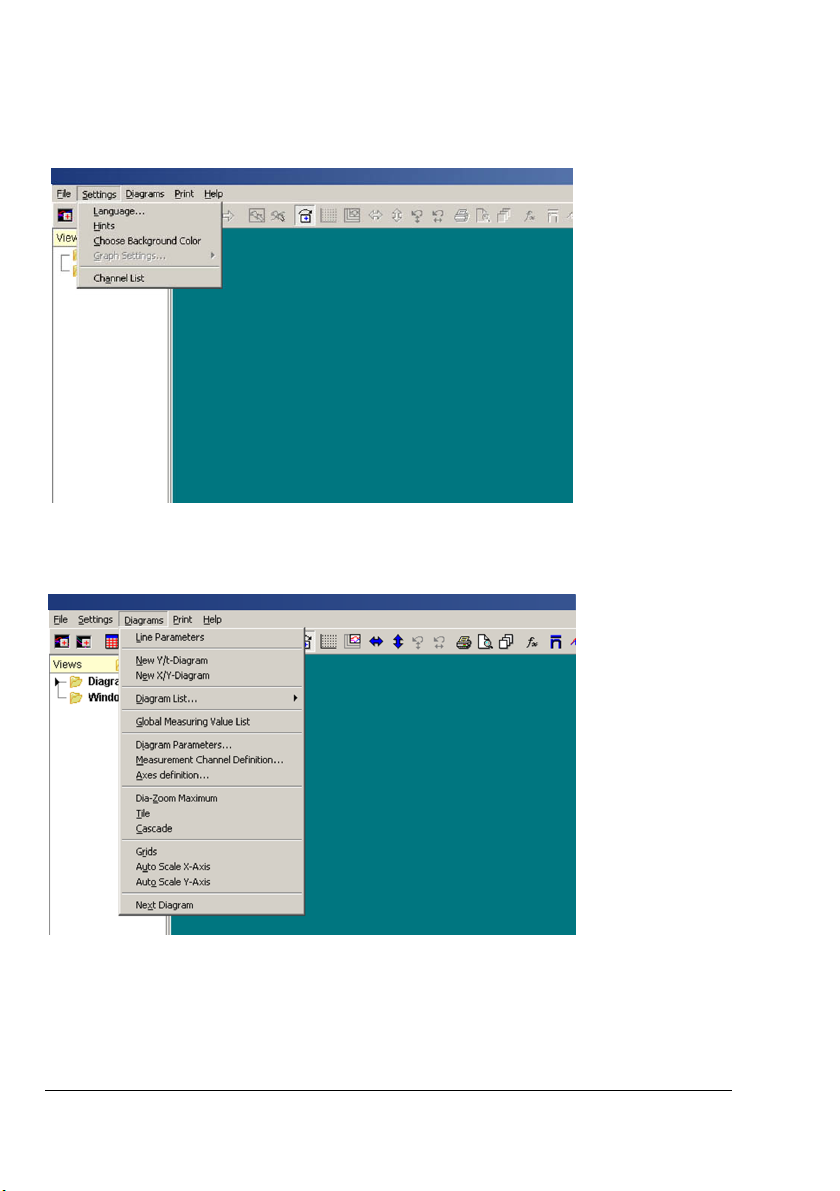
The Settings group allows a remote setup of all program devices setting of the connected
measuring devic es and sensors.
The Diagrams group covers all f unctions for the representation of the measurement data in
online mode and also for the representation of the saved and recorded measurements.
31437 V1 OmegaView Plus
Page 6 Operating Manual
Page 13
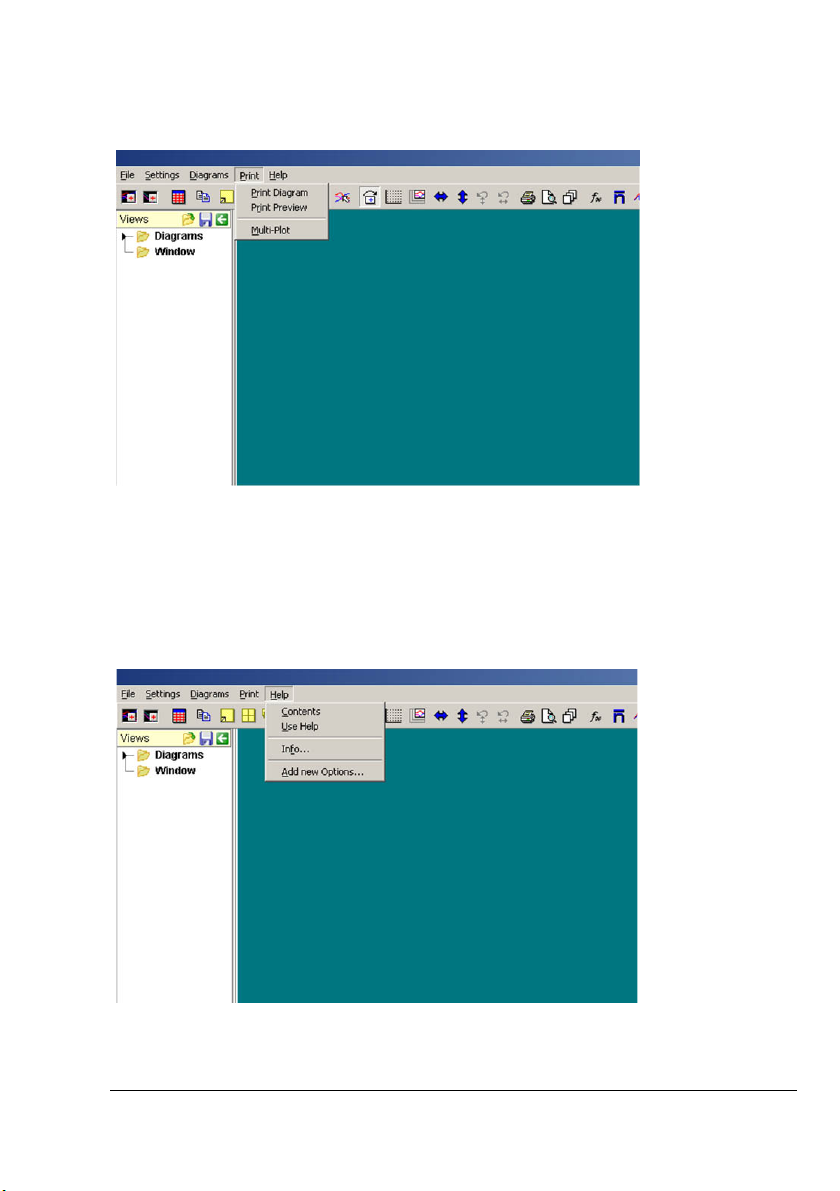
All printer- and output possibilities are defined and listed in the menu Print.
The Help group contains an extensive Online-Help system, which is available in different
languages. In addition, the current program version could be shown here and you may as well
do modifications in your program version ad apted to your own needs by activating the options.
OmegaView Plus 31437 V1
Operating Manual Page 7
Page 14
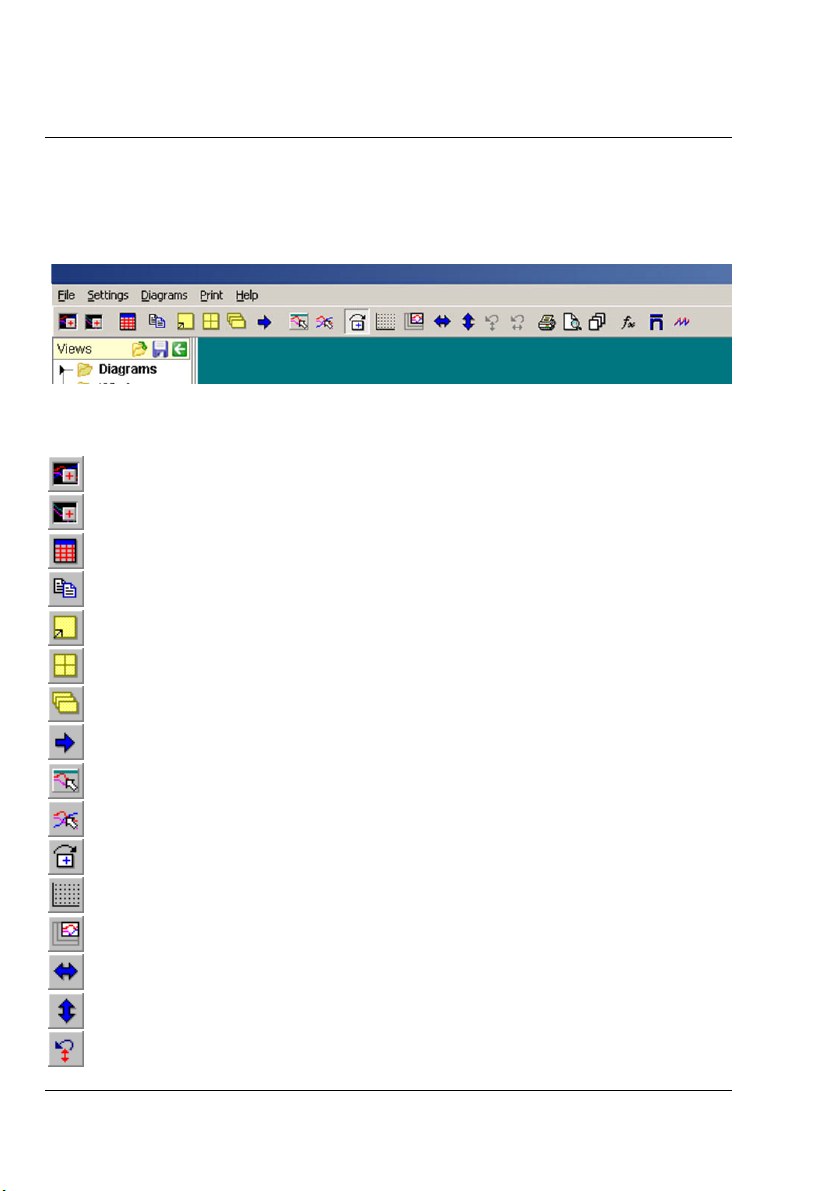
The Toolbar
In addition to menu bar, the functions of the menus may be activated via buttons in the toolbar
of each dialog box. Only buttons, which are necessary for the program part, currently in us e, are
active. The toolbar on the main screen essentially c ontains buttons for the menu “D iagrams”,
“Print”, “Evaluate”.
These button commands are described below:
Creates new Y/t-D iagram
Creates new X/Y-Diagram
Creates global measurement value list
Inserts Diagram in the memory clipboard
Display diagram in entire screen mode
Arrange diagrams in tiles
Arrange diagrams in cascades
Go to next diagram
Modify diagram parameters
Modify line parameters
Switches the function “Diagram-Settings Apply to All” ON and OFF
Switches the grid lines ON and OFF
Auto-Zoom
Automat ically scales the X-axis to maximum
Automatically scales the Y-axis (axes) to maximum
Previous view Y-axis
31437 V1 OmegaView Plus
Page 8 Operating Manual
Page 15
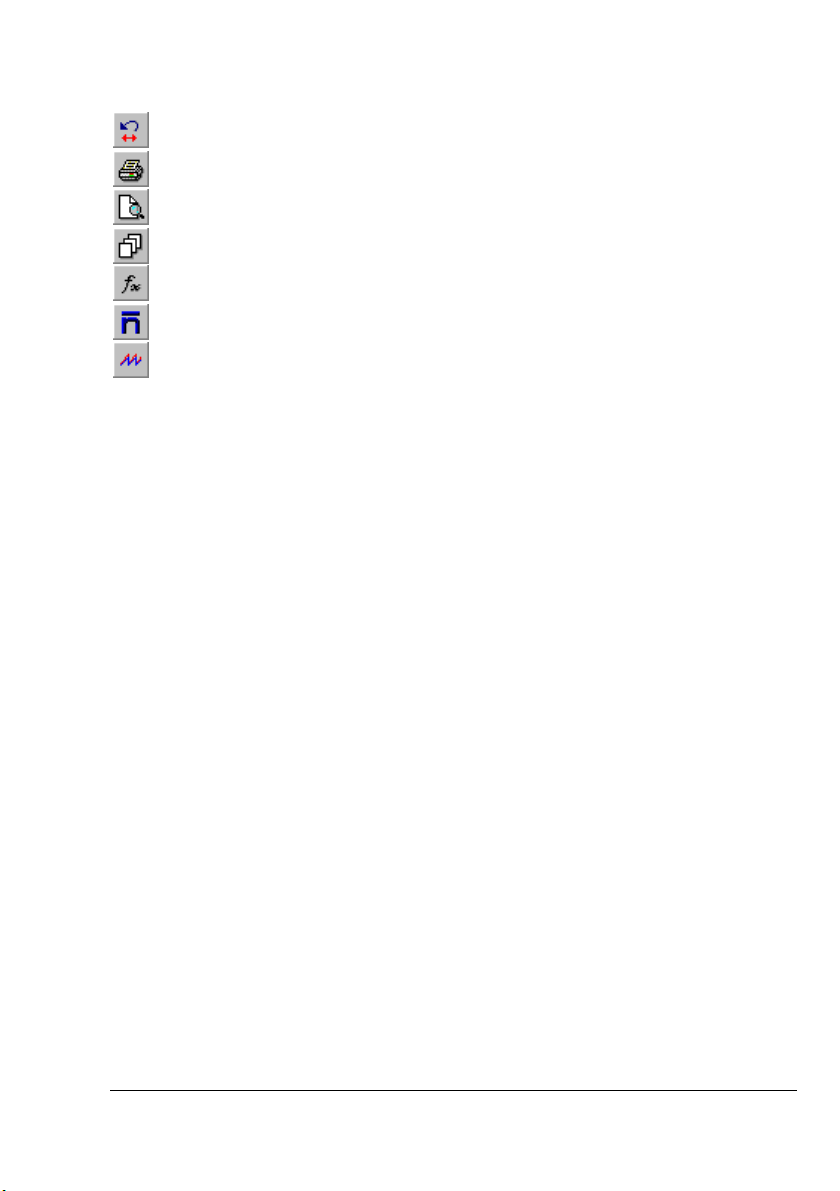
Previous view X-axis
Print
Page Preview
Multi-Plot (Standard)
Ent er / edit (Standard) Formulae
Mean Value Calculation (Standard)
Sum Calculation (Standard)
OmegaView Plus 31437 V1
Operating Manual Page 9
Page 16
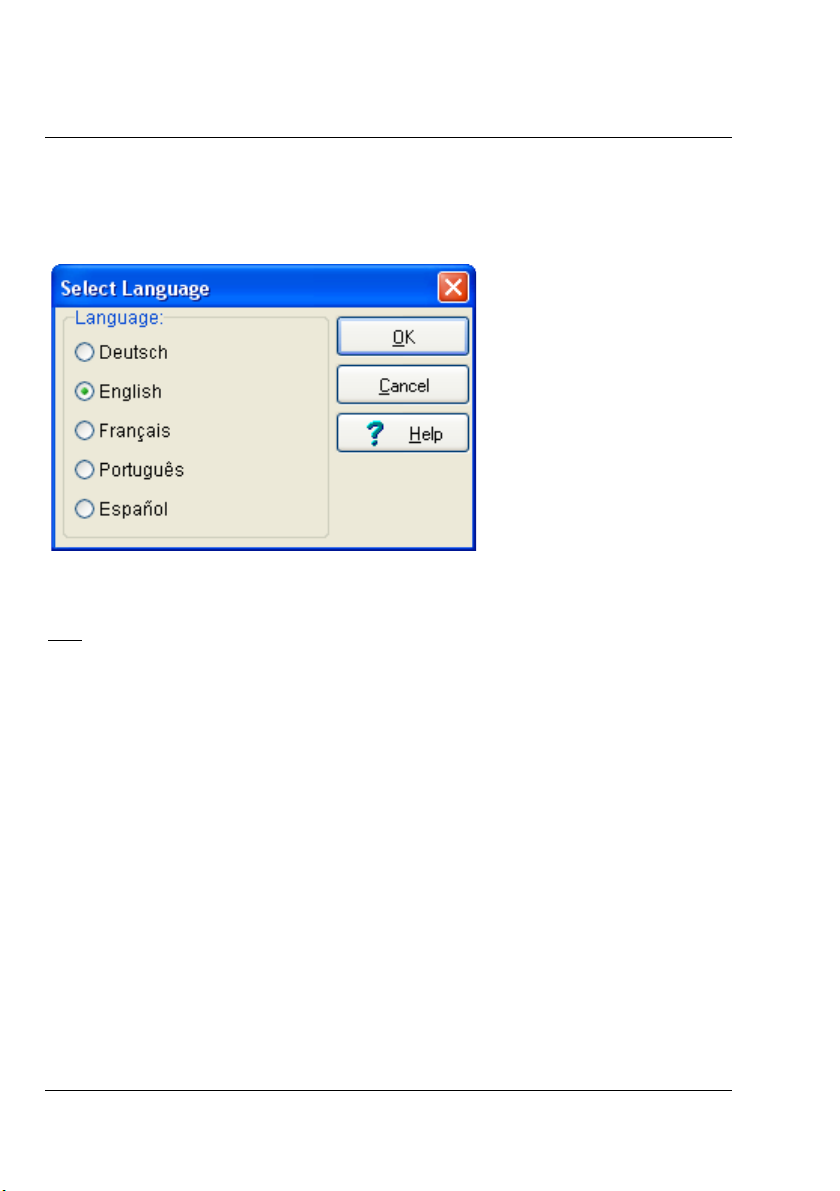
Selecting a Language
Select from the main menu Settings the item Language. The dialog box Select Language will
appear. You may choose here your desired language. All text and hints will be displayed in the
chosen language.
Checkmark your desired l anguage and click OK.
Note
: The selected language is immediately active. Re-starting the program is not necessary.
31437 V1 OmegaView Plus
Page 10 Operating Manual
Page 17
Help
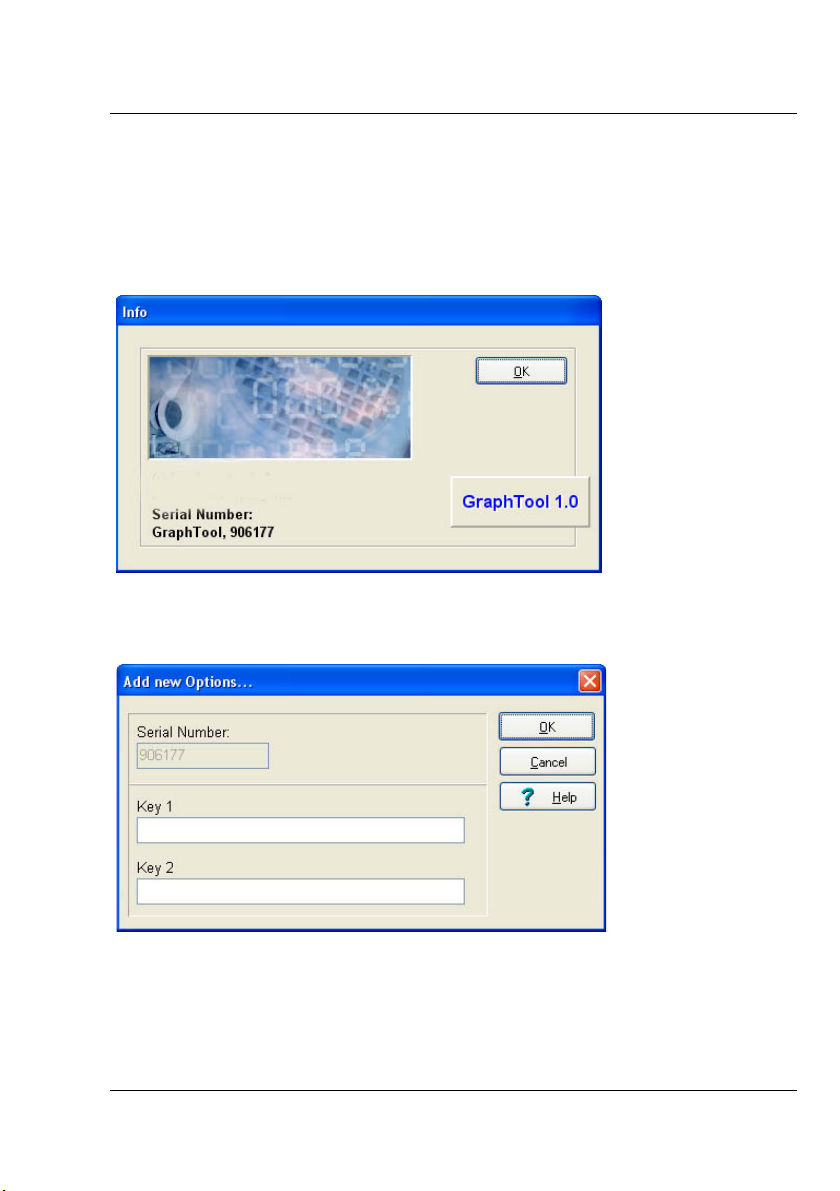
The Online-Help may be activated in the main menu Help under the item Contents. Just click
the colored marked help file with t he left mouse button to proceed to the corresponding help
topic. W ith the c ommand Use Help, you can proceed to the general help t opics of the W indows-
Operating S ystem.
Clicking Info enables you to obtain the displayed inf ormation about the program.
Via the menu item Add new options the shown dialog box will be opened. You may activate
here further software options with the help of a registration key. Please contact Omega to
purchas e an OmegaView Plus r egistration key (P/N OMYL-SOFT-PLUS).
OmegaView Plus 31437 V1
Operating Manual Page 11
Page 18
Hints
You may activate Hints in main menu Settings. The program dis plays the corresponding hints
for each buttons or menus, if you move the m ouse near the but tons or menus. Normally hints
are always s et active.
The Background Color
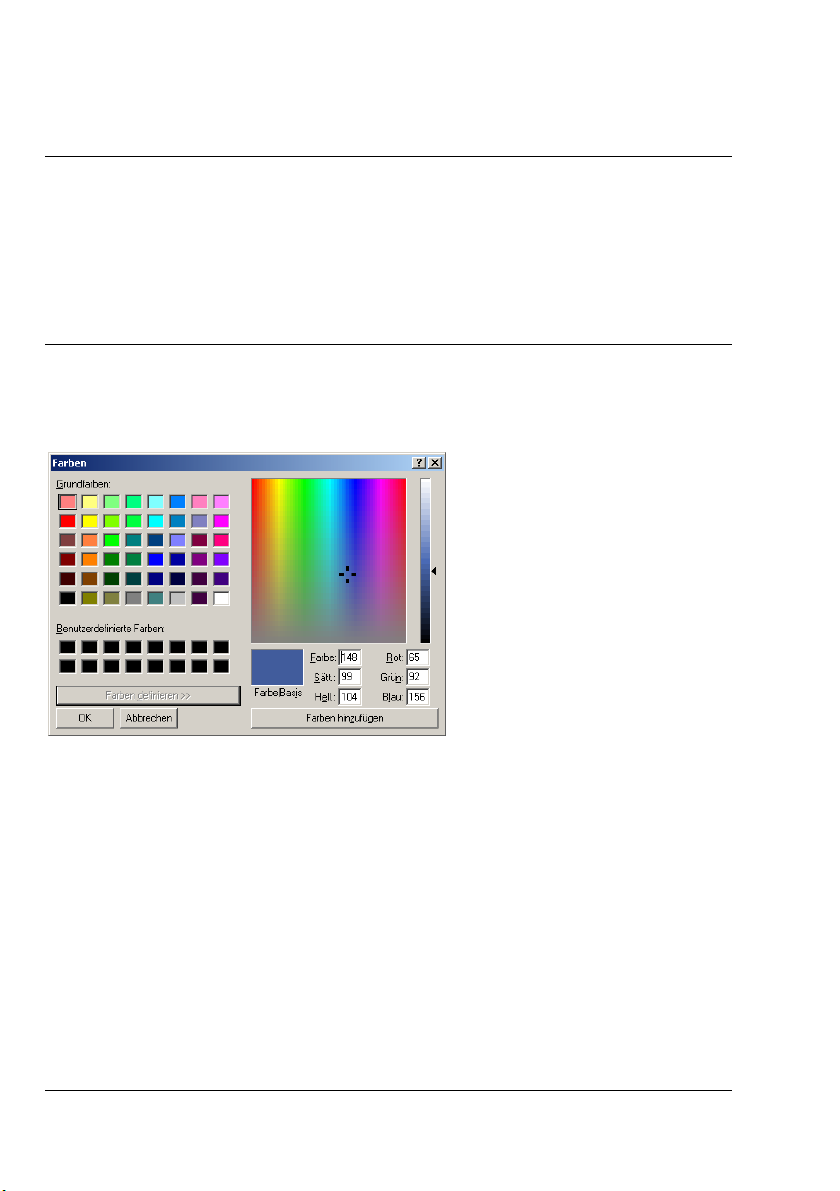
In the main menu Settings you may choose the Background Color for your screen. The
program will then display the chosen background color.
31437 V1 OmegaView Plus
Page 12 Operating Manual
Page 19
The Diagrams
Representation Possibilities
The program off ers you six possibilities to create diagrams from you r measuring and evaluation
data and to create a measurement data list that is described in the following chapter. W ith the
help of the diagrams and the measurement data list, you can cr eate a historic –already recorded
and stored – data and also an actual tr end data during the measuring process. The items in the
main menu Diagrams or the buttons in the toolbar enable you to create, delete, arr ange, scroll
and format each of these diagrams –als o during the measuring process.
You may als o enlarge your diagram view. To do so, position the mouse over the diagram b order
or corner, click the left mouse button and drag the diagram to the desired size. In addition, it is
always possible to obtain an entire screen view. Details about each of these diagrams are
described in the respective topics in this manual.
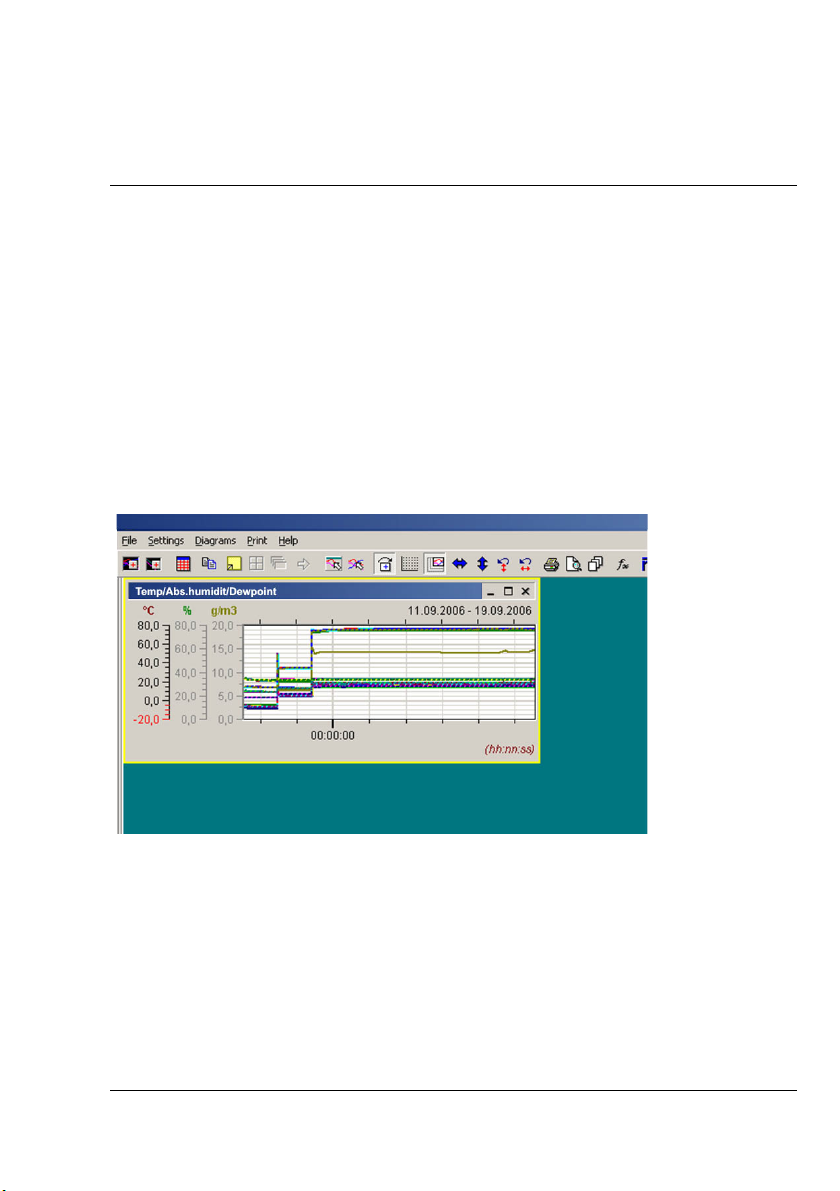
The Y/t - Diagram shows the measurement values with respect to time.
OmegaView Plus 31437 V1
Operating Manual Page 13
Page 20
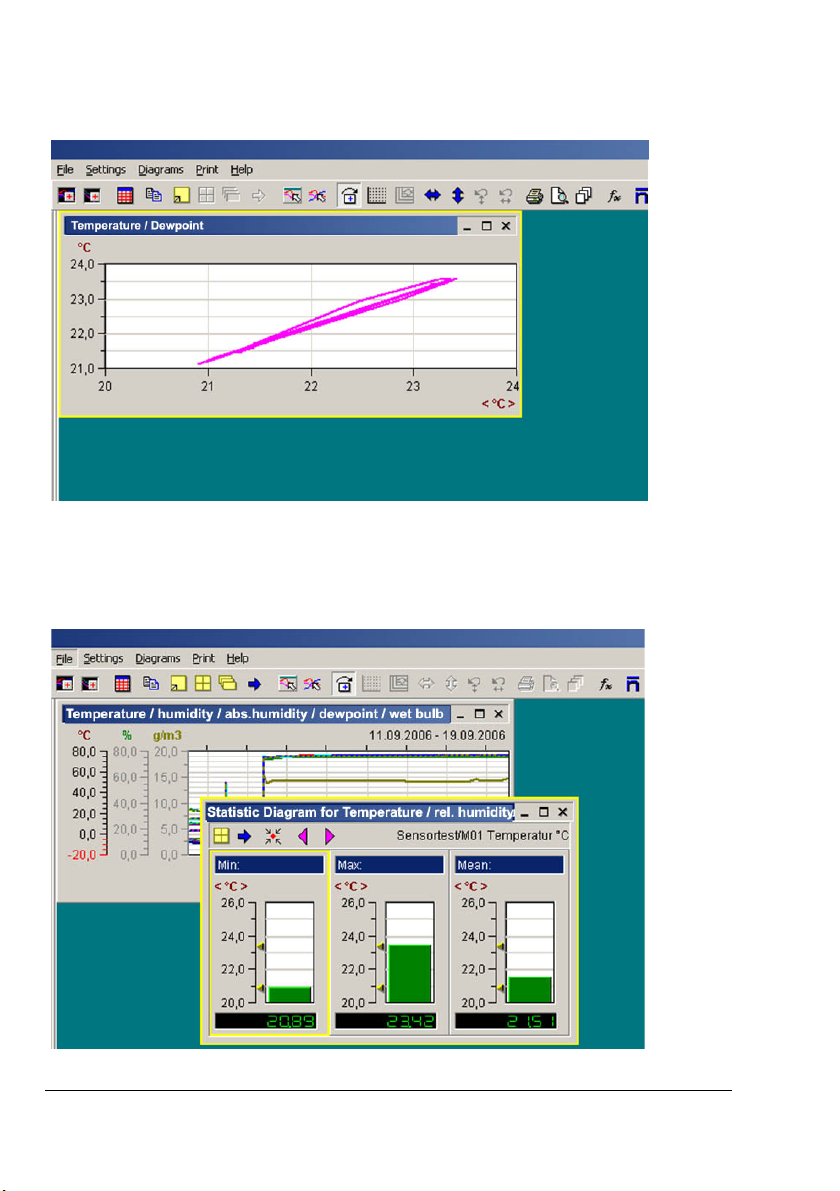
The X/Y - Diagr am shows the measurement values with r espect to a measurement channel.
The first value of the measurement channel definition determines the value of the x-axis.
The Statistic Diagram is an additional function to the Y/t-diagram. It displays the minimum,
mean and maximum values of a selected line in the Y/t-diagram.
31437 V1 OmegaView Plus
Page 14 Operating Manual
Page 21
Creating a Diagram
The diagrams f or the presentation of your measurement and evaluation data may be created
either via the items in the main menu Diagr ams or with the help of the Buttons in the toolbar.
Cr eates new Y/t-D iagram
Creates new X/Y-Diagram
After activating one of the functions mentioned above, the selected diagram will be displayed in
its partial view. The functions for creating and formatting a diagram are explained below.
Note
: The statistic diagram is a supplement function to the Y/t- diagram and c ould only be
drawn up from the local menu.
Assigning a Channel
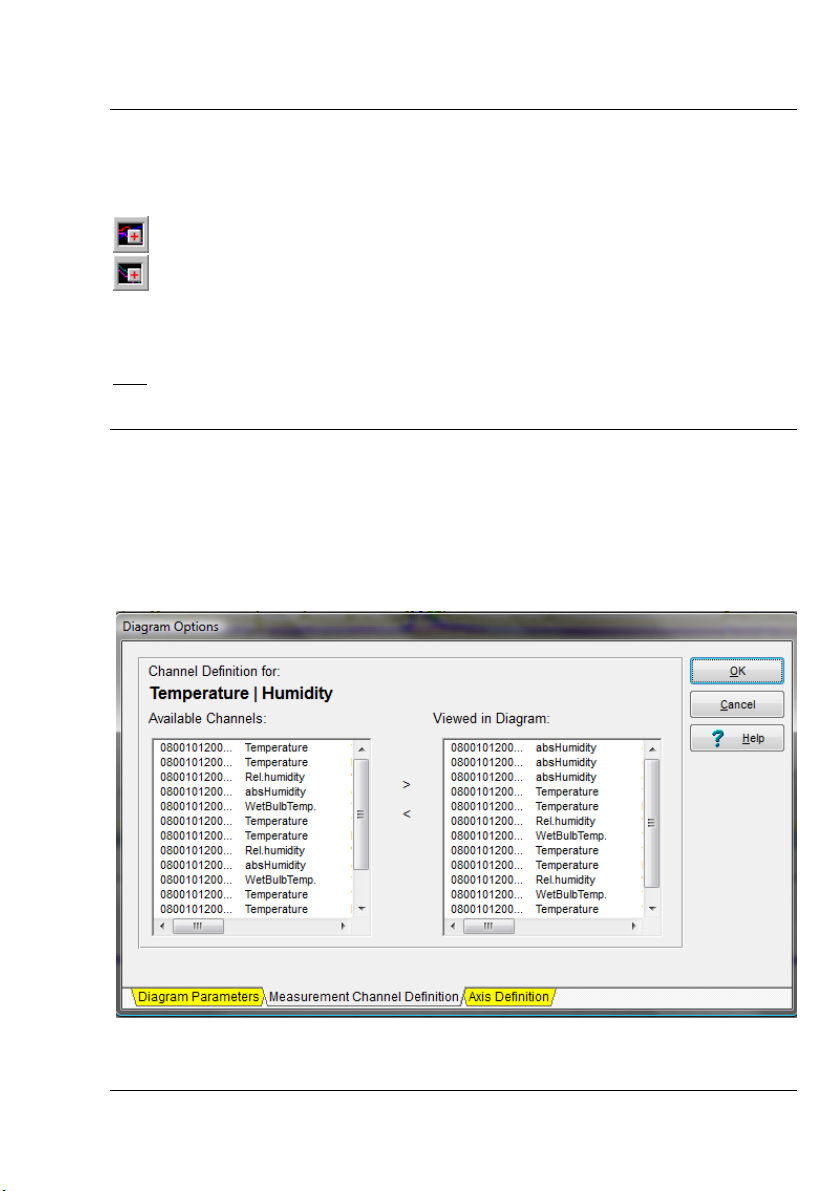
After selecting your desired diagram type, choos e in th e main menu Diagram the item
Measurement Channel Definition, In the dialog box you may define or modif y the measuring
or formula channels for each of your diagrams.
This dialog box appears automatic ally if an online connection to the available channels exists or
if a saved file is opened.
OmegaView Plus 31437 V1
Operating Manual Page 15
Page 22
To add channels to a diagram, click the desired channel on the left window with the
left mous e or hold the left mouse pressed to select more channels at a time, and then enter the
chosen channels into your diagr am by simply clicking the button.
To remove channels fr om a diagram, click the desir ed channels on the right window
then click the button to remove these channels from the diagram.
Note:
: You may also activate this function by double clicking a diagram title or via the local
menu.
31437 V1 OmegaView Plus
Page 16 Operating Manual
Page 23
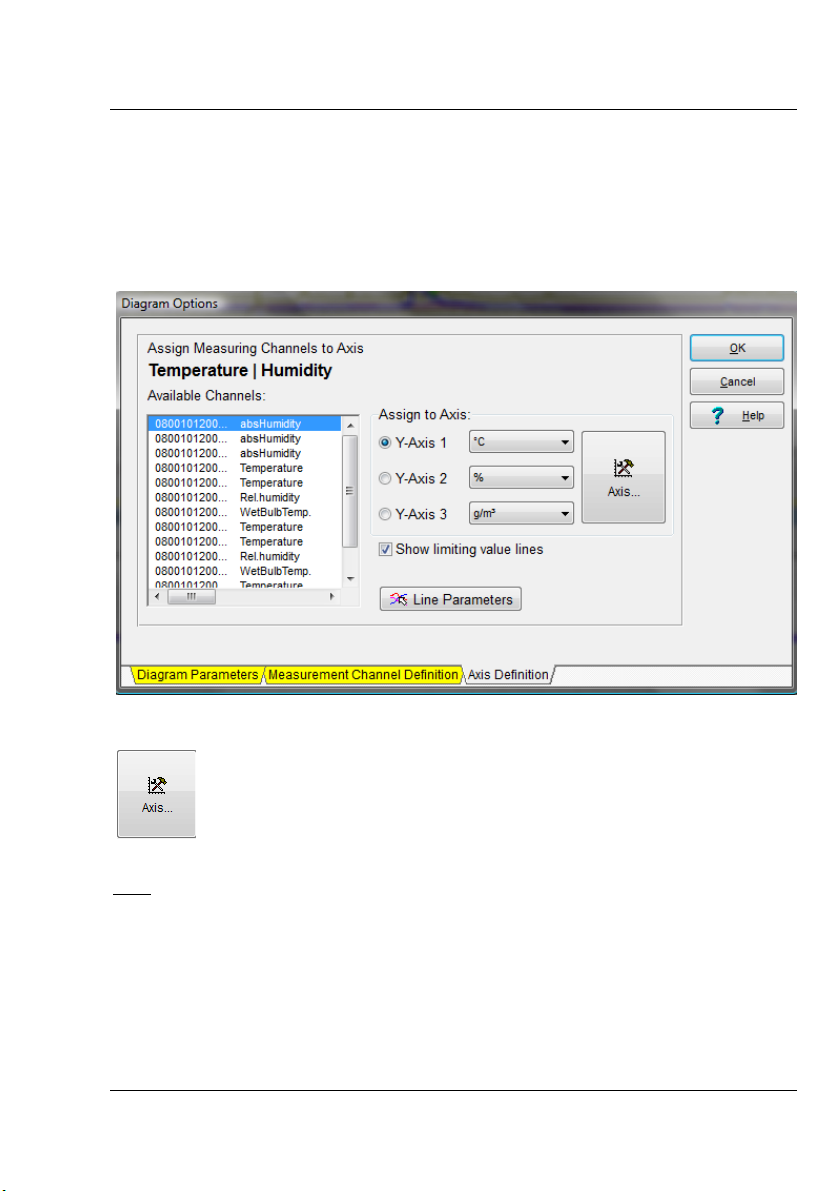
Defining an Axis
Select in the main menu Diagram the item Axes Definition, to choose a Y-axis f or the Y/t or
X/Y diagram. The corresponding diagram must be active.
A maximum of three Y-a xes at a time may be shown in a diagr am. A s election box displays all
possible units. Activate Show limiting values to show values defined as limits in the channel
table.
Note:
The function Axes Definition is only available for the Y/t and X/Y-diagrams. Digital
monitoring diagrams, function display panel, column monitoring diagrams and statistic
diagrams have no Y-axes.
Activates the axes scaling f or setting the display range.
OmegaView Plus 31437 V1
Operating Manual Page 17
Page 24
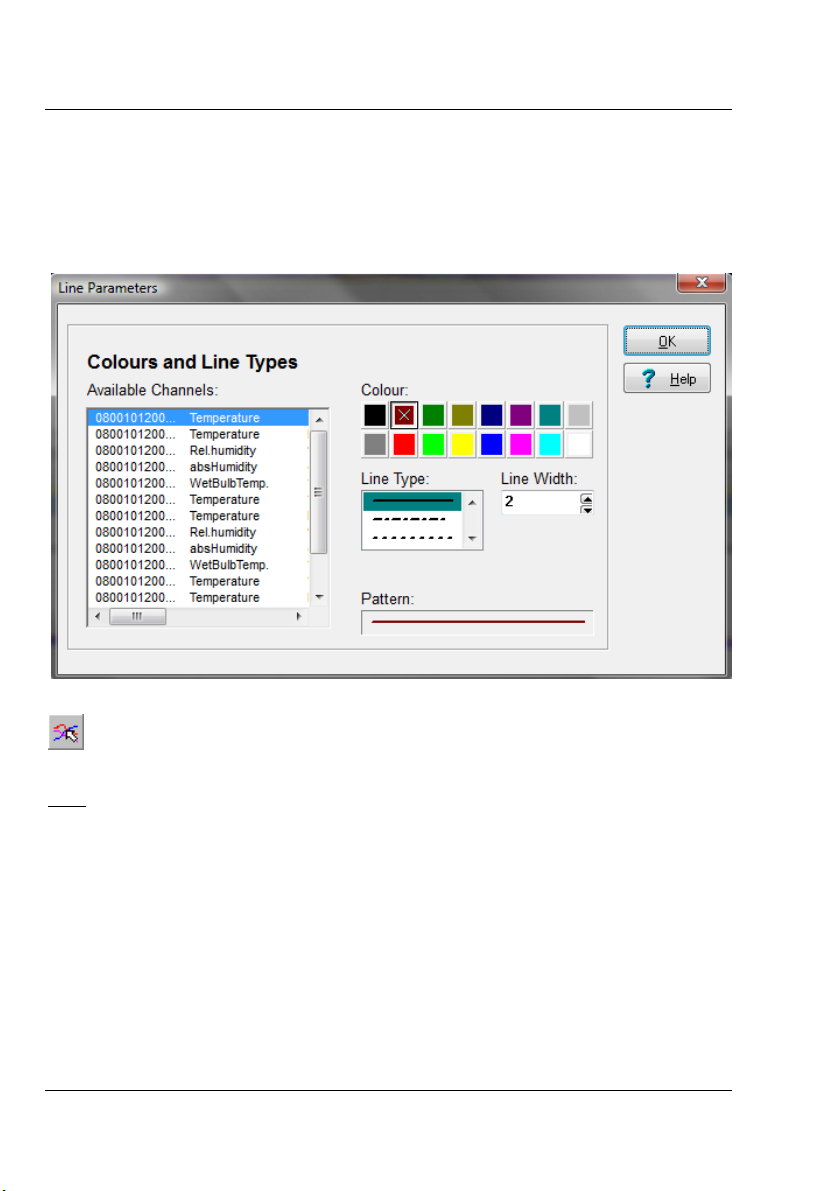
Setting of Line Parameters
Via the item Line Parameter in the main menu Diagram, you may get into the dialog box for the
line parameters. Here you may set for each measur ement line the color, line type, and line
width. Select a line on the left window and modif y the corresponding line parameter by clicking
with the left mouse button.
The line parameters are also available via this button in the toolbar.
Note:
The function Line Parameter is only available for the Y/t and X/Y-diagrams. The digital
monitoring diagrams, function display panel, the column monitoring diagrams and
statistic diagrams have no Y-axes.
31437 V1 OmegaView Plus
Page 18 Operating Manual
Page 25
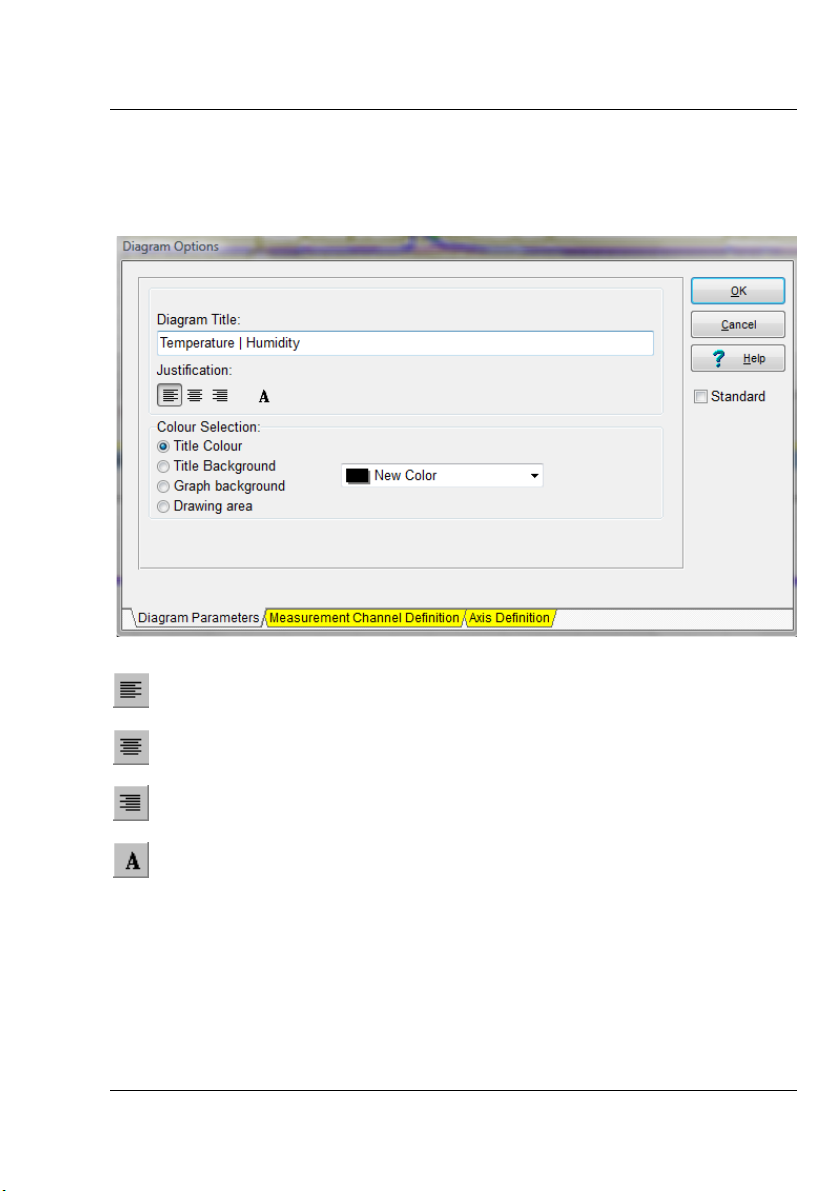
Setting/Copying of Diagram Parameters
To modif y diagr am title, text color, text background color, font type and text justification, choose
in the main menu Diagram the item Diagram Parameter.
Text left justified
Text center ed
Text right justified
Opens the selection menu to change the Font Type for the available font types.
OmegaView Plus 31437 V1
Operating Manual Page 19
Page 26
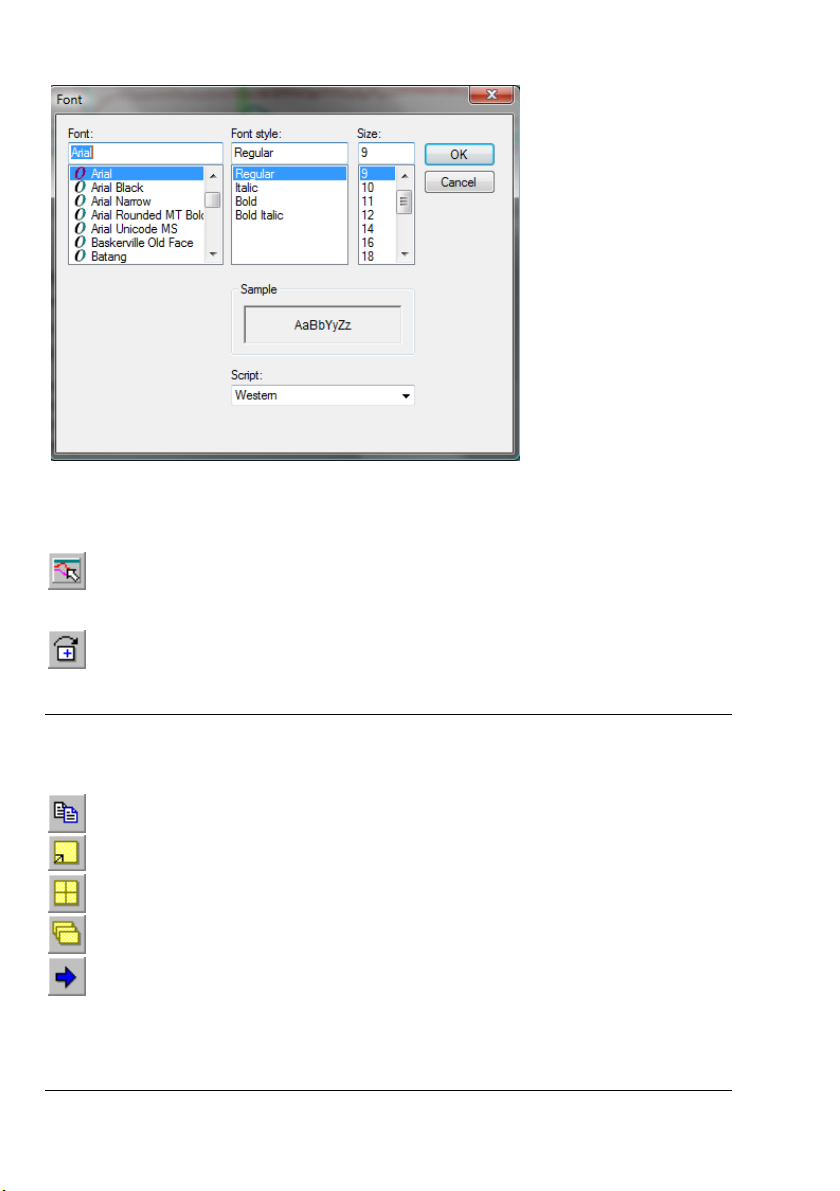
In the c olor selection you may chose the color of your text title and the background color.
Activate the checkbox Standard to s et your chosen s ettings as standards f or all other diagrams.
The diagram parameters may be activated via this button in the tool bar.
If this button in the tool bar is active, current diagram settings will be copied to other
diagram.
Arranging Diagrams / Deleting / Copying to the memory
clipboard
Copy the current diagram to the clipboard
Changes from a diagram partial view to an entire screen view and back.
Arranges your diagrams in tiles on the screen optimal.
Arranges the diagrams on screen in cascade.
Scroll from one diagram to the other.
31437 V1 OmegaView Plus
Page 20 Operating Manual
Page 27
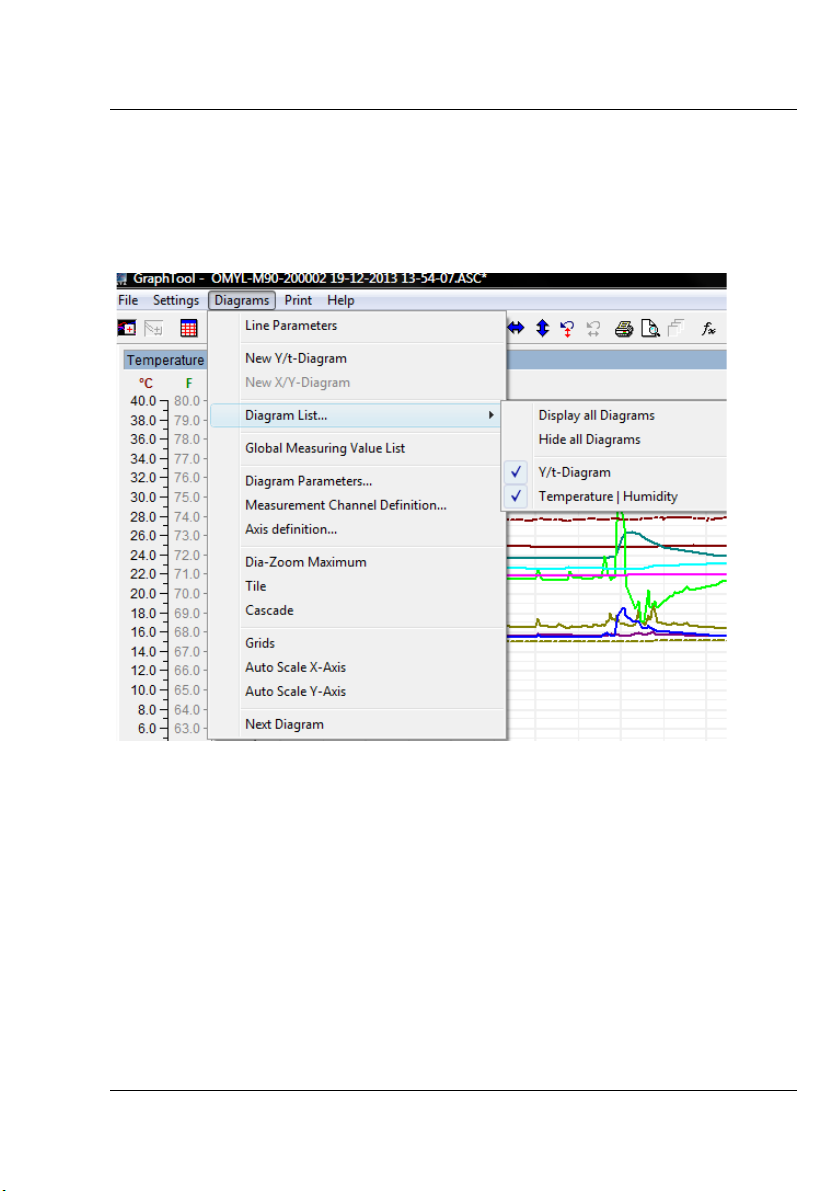
Diagrams display On/Off / scale down / delete
The diagr ams may be displayed On/Off, scaled down and deleted via normal windows
functions.
To display a diagram again, select in the main menu Diagrams the item Diagram List. Here
you may either display On/Off all diagrams or just a single diagram on the screen again.
OmegaView Plus 31437 V1
Operating Manual Page 21
Page 28
Channel list
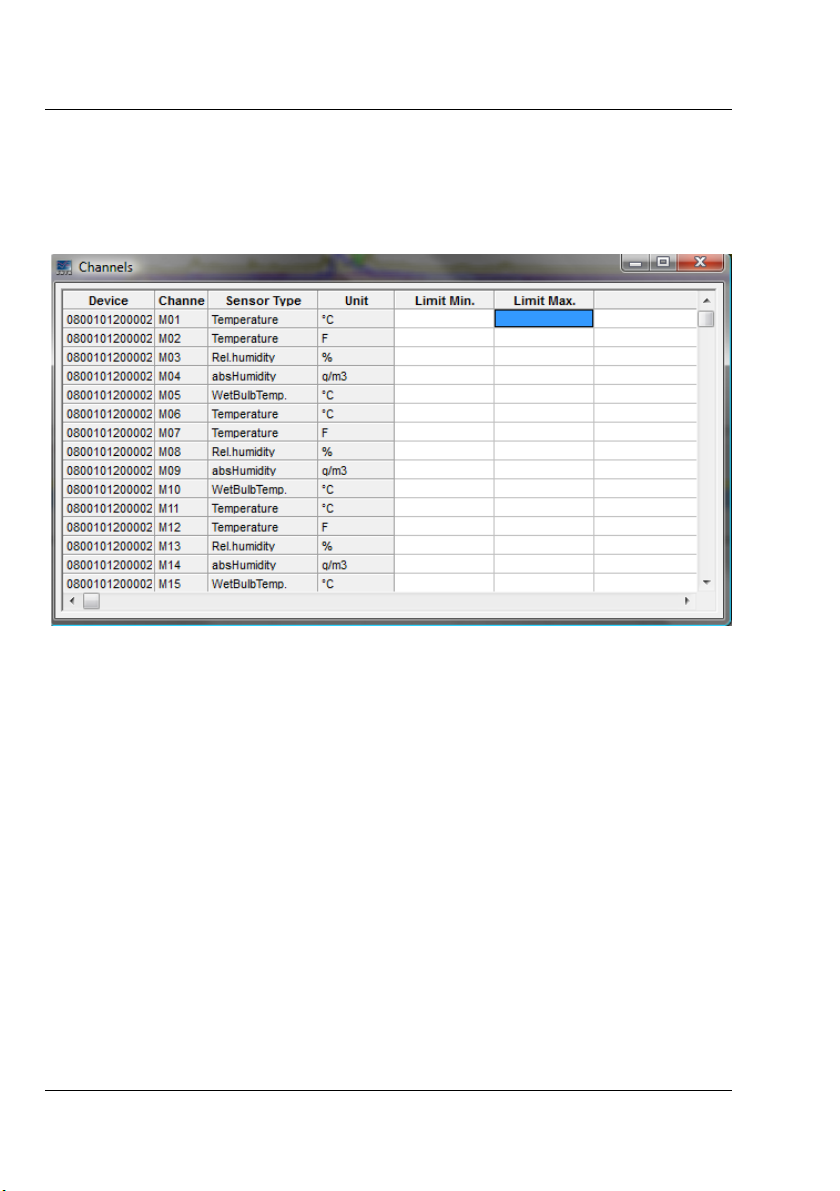
You may h ave the list of channels permanently displayed at your monitor. Choose hereby the
command Channel List in the main menu Settings. The table list shown above with the current
connected channels will be displayed. The table list remains active for all setting steps within the
program, until it is again turned off.
The Fields of the Channels List
Channel: measuring channel number of the connected sens or (starting with
M...) or formula channel number (starting with F...)
Sensor Type: factory name of the sensor
Unit: physical u nit of t h e sensor
Description: text box for user specifications
Formula: formula name of the formula channels
All highlighted fields in the channel table may be shown with the scroll bar. The field
description contains pre-settings that can be modified in the channel list.
To modif y the Column Width, clic k the column title border, hold the left mous e button pressed
and move to the desired width.
31437 V1 OmegaView Plus
Page 22 Operating Manual
Page 29
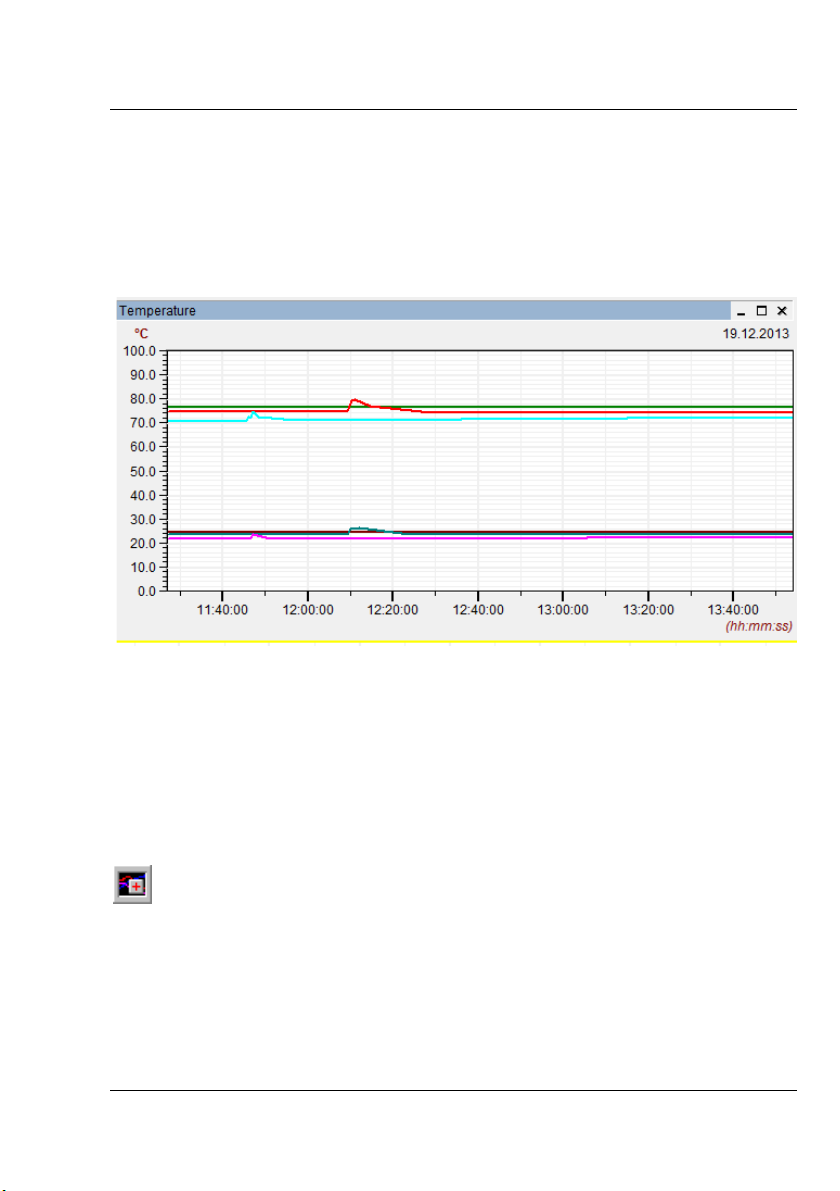
The Y/t-Diagram
The Y/t-Diagram in Partial View
To create an X/Y-diagram, select in the main menu Diagrams the item New Y/t-Diagram and
assign your desired channels. The Y/t-diagram appears in this Partial View, if you chart historic
data - already recorded and stored data. By clicking and moving the border or corner of the
diagram with the mouse, you may modify the diagr am size..
To show a Part of your meas urement and evaluation data in an enlarged form, m ove the mouse
in the diagram, press and hold the left mouse until you have the desired diagram section, then
release the mous e. The selected diagram part will be sh own in its enlarged view.
A doub le clic k at t he Axes Labels opens a control box, where you can enter the exact limits of
the diagram s ection in the Y- and X-direction. Using the arrow keys in the toolbar, you may
scale back the Y- and the X-axes to its maximum values.
Other Diagram Par ameter s may be activated by double clicking the diagram title with the left
mouse button.
creates a new Y/t-Diagram via the tool bar
OmegaView Plus 31437 V1
Operating Manual Page 23
Page 30
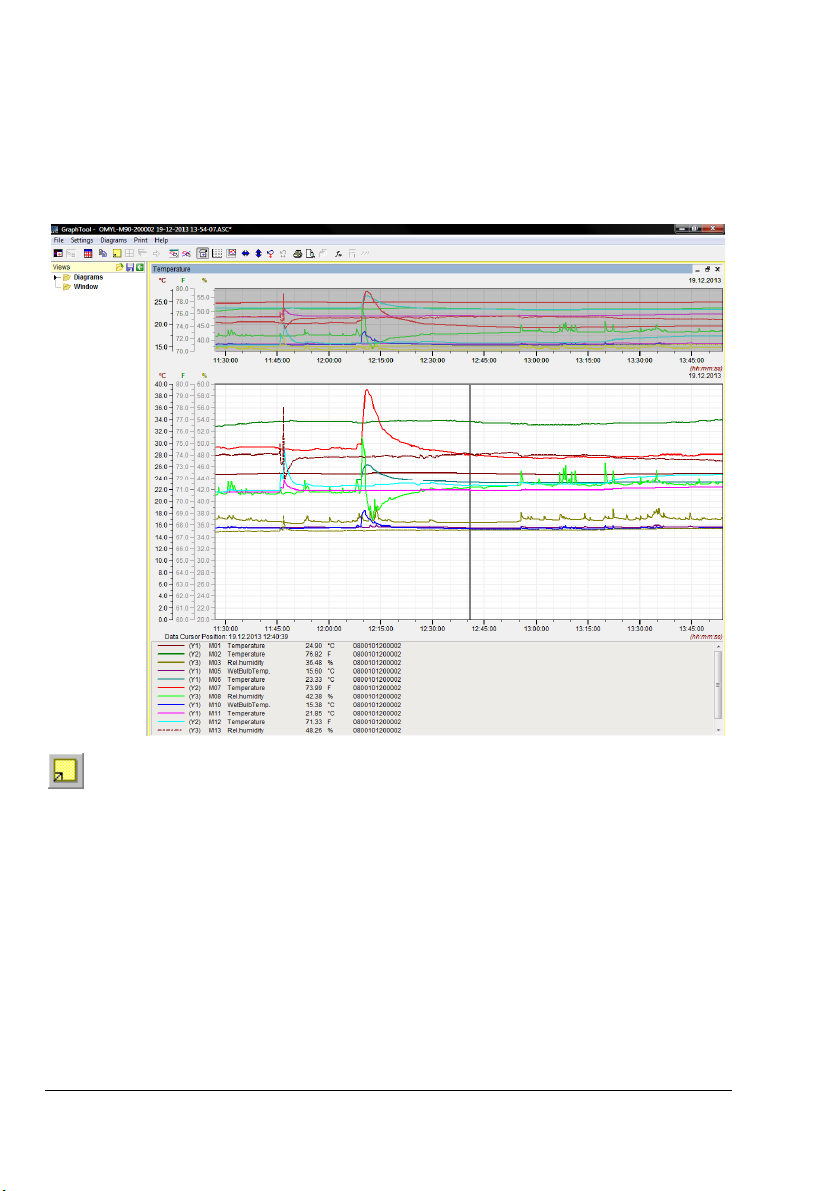
Further details are described with the Entire Screen View of the diagram in the next pages. For
explanati ons of further functions of the diagrams during the ONLINE-measur ement, please
refer to the corr esponding chapters in this manual.
The Y/t-Diagram in Entire Screen View
Press this button in the tool bar for an Entire Screen View or choose in main menu
Diagram the command Dia-Z oom to M aximum. Pr essing this button again will turn the
diagram view back to its original size.
· The Measurement Data Segment in the middle shows your desired range of
measurement data.
· The Overview Diagram shows the complete measurement data. The measurement data
segment is high lightened in the overview diagram. This overview may be switched
ON/OFF via local menu.
· The Legend below c ontains detail information about the measurement lines at the point of
the data cursor position. You may switc h the legend ON/OFF via local menu.
· To position the data cursor please click with the left mouse key your desired ar ea in the
measurement data segment. The data cursor may be switch ON/OFF via the local menu. If
you choose the option two data cursors, you will obt ain in the legend evaluation of both
values.
31437 V1 OmegaView Plus
Page 24 Operating Manual
Page 31
· Clicking the right mouse button may activate the Local Menu that is related to this
diagram.
· The Date may be switched ON/OFF via the command Show Date in main menu Settings.
The Measurement Data Segment in Y/t-Diagram
To select and to enlarge a Measurement Data Segment, move the mouse in the diagram,
press and hold, then move the left mouse button until you have the desired diagram segment.
The selected diagram segment will be shown in its enlarged view. At the same time the highlightened diagr am segment in the overview diagram changes accordingly.
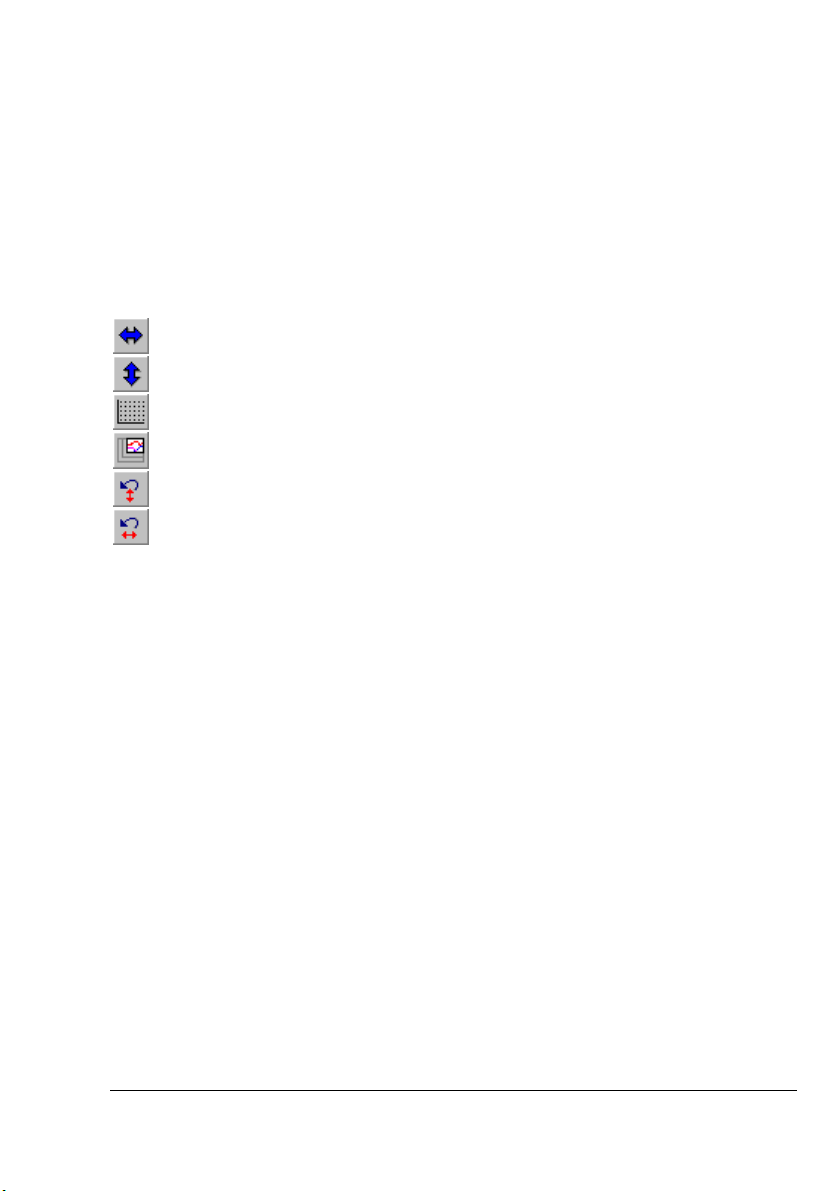
Sc ales back the X- Axis to maximum (Auto scale X-Axis).
Sc ales back the Y-Axis to maximum (Auto scale Y-Axis).
Switch the Grid ON/OFF. See als o local menu.
Auto-Zoom enables zooming in fixed time steps
Previous view Y-Axis
Previous view X-Axis
Via the local menu you may retrieve your last applied settings of the X- and Y-axes. If you
modify the measurement data segment during the measurement process, the progr am sets for
every new measurement data recording the actual segment again. If you want to evaluate, you
must hold the diagr am using the pause-key.
On the toolbar you may set with the button Auto-Z oom a fixed Z oom-Mode for Y /t-Diagrams.
If this mode is turned on, the display of the local menu is turned off. A double click with the
mouse acti vates an auto-zoom in the following steps
Year 1 h
Month 10 min
W eek 1 min
Day 10 s
12 h 1 s
6 h
By double click with the left mouse button, the zoom segment will be scaled down, by double
click with the right mouse button; the zoom segment will be scaled up.
OmegaView Plus 31437 V1
Operating Manual Page 25
Page 32
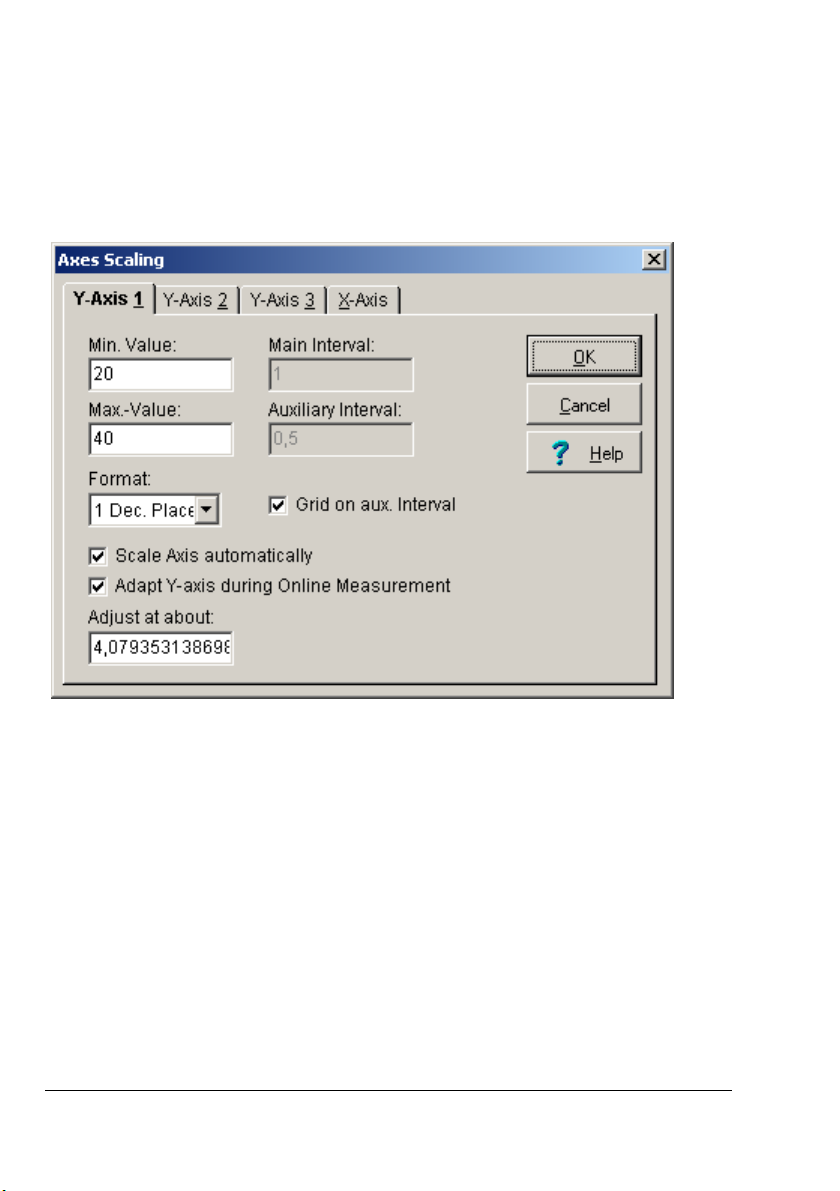
Scaling the Y-Axes in Y/t-Diagram
The measurement data segment of the Y-Axes may be set exactly as follows: A double click
with the left mouse button at the Y- or X-axes labels of the diagram, opens the dialog box Axes
Scaling.
Sel ec t a Y-Axis and enter the desired limits manually for your diagram.
Enter the interval for the graduation of the Y-Axis. The Main Interval marks the distance from
one value to the next on the Y-Axis. The Auxiliary Interval divides the main interval into its
corresponding subdivisions. The main i ntervals are labeled the auxiliary intervals are not.
Activate the Grids on the auxiliary interval to create addit ional grid lines.
For the Format of the values on the axes you may choose fr om 0 to 4 decimal places or you
may choos e the exponential f orm.
Activating th e option Axis automati c scaling, the program calculates the main and auxiliary
intervals automatic ally with respect to the Axis limit. The user cannot modify the values.
Activating the Y-Axis Adjustment during online measurement, will automatically adjust the
axis of the current channel in the diagram (at a value set in Adjust at about), if the measuring
values go out of the previous range.
31437 V1 OmegaView Plus
Page 26 Operating Manual
Page 33
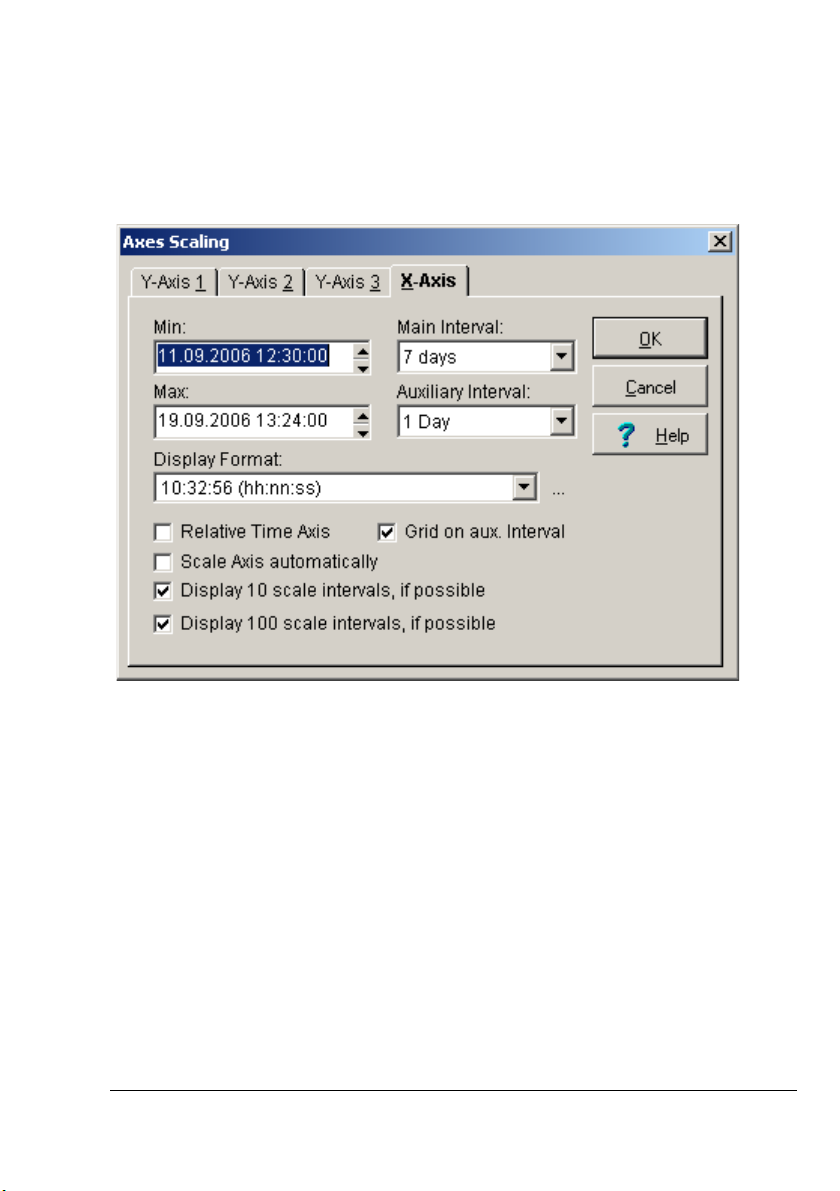
Scaling the X-Axis in Y/t-Diagram
The measurement data segment of the X-Axis may be set exactly as follows: A double click with
the left mouse button at the Y- or X-axes labels of the diagram, opens the dialog box Axes
Scaling.
Sel ec t t he X-Axis and enter the desired limits f or your diagram manually or scroll the
corresponding arrow buttons. Choose the interval for the graduation of the X-Axis from the
interval boxes. The Main Interval marks the distance of one value to the next on the X-axis.
The Auxiliary Interval divides the main interval into its corresponding subdivis ions. The main
intervals are labeled the auxiliary intervals are not. Activate the Grids on the auxiliary interval
to create additional grid lines. If needed switch ON the additional options 1 0th-graduations or
100th-graduations. Main and auxiliary int erval ar e adjustable to the following values:
1 s 10 min
2 s 15 min
5 s 20 min
10 s 30 min
15 s 1 h
20 s 2 h
30 s 6 h
1 min 12 h
2 min 1 day
5 min
OmegaView Plus 31437 V1
Operating Manual Page 27
Page 34
If the relative time axis is active, the diagram sets the chosen values to 00:00:00 hours. The
date is no longer active. For periods greater than 24 hours the program will show the number of
days pass ed and time, written day/time, e.g. 1/00:00:00. In the measurement data list the
relative data are als o listed.
Activating th e option Axis automati c scaling, the program calculates the main and auxiliary
intervals automatic ally with respect to the Axis limit. The user cannot modify the values.
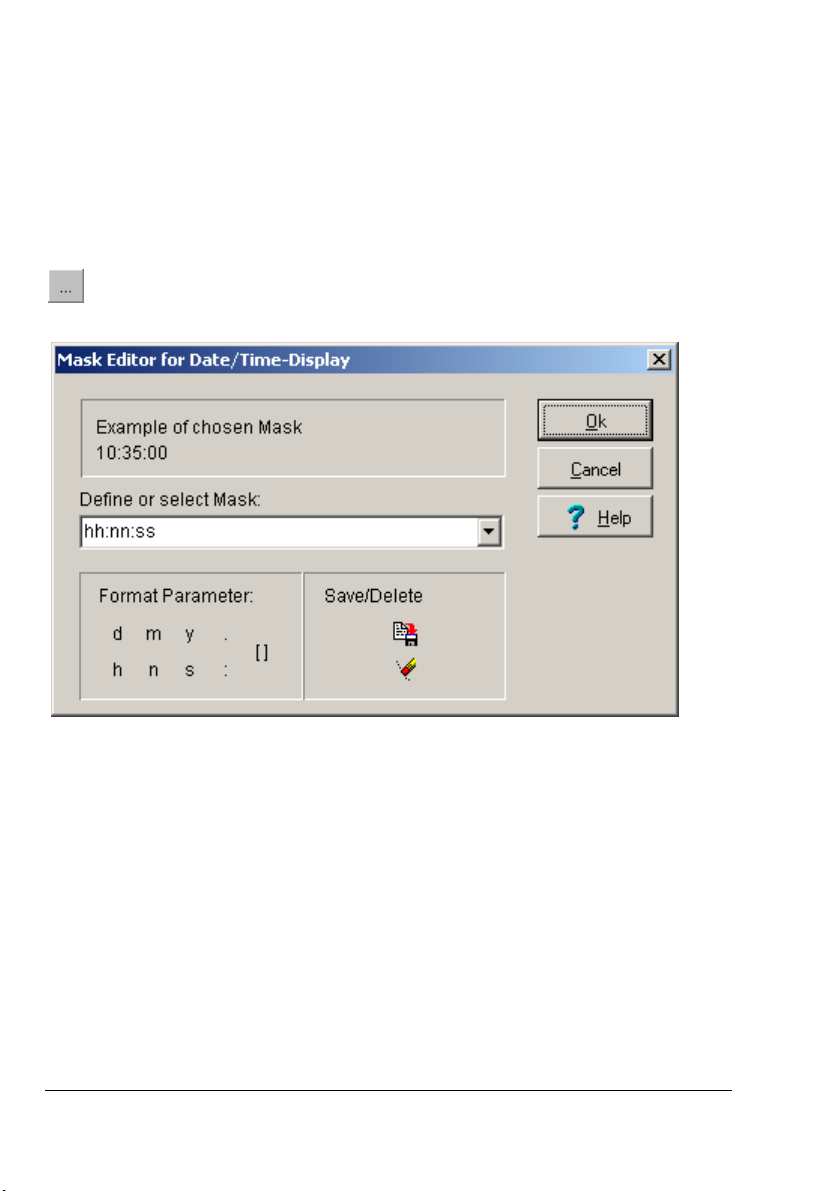
Select one of the predefined Display Formats for the axes marking. The button
opens the dialog-box for the individual time format on the X-Axis.
Sel ec t the desir ed time format for the X-Axis. The selected f ormat will be shown as example
and appears on t he diagram. With the Format Parameters you may generate your individual
format. Choose one f rom t he parameter box by clicking with the left mouse button. The
corresponding f ormat appears on the display box.
These symbols ar e defined as f ollows:
d Day
m Month
y Year
h Hour
n Minute
s Second
. (Separator)
: (Separator)
[ ] Blank
31437 V1 OmegaView Plus
Page 28 Operating Manual
Page 35
The format parameters have the following definition:
d represent the day as a number without zero preceding (1-31).
dd represent the day as a number with zero preceding (01-31)
ddd represent the day as abbreviation (Sun-Sat).
dddd represent the day with its whole n ame (Sunday-Saturday).
m represent the month as a number without zero pr eceding (1-12).
If m is directly followed by h or hh the minutes will be displayed
instead of the month.
mm represent the month as a number with zero preceding (01-12).
If mm is directly followed by h or hh the minutes will be displayed
instead of the month..
mmm represent the month as abbreviation (Jan-Dec).
mmmm represent the mon th with its whole name (January-December).
yy represent the year in 2 digits (00-99).
yyyy represent the year in 4 digits (0000- 9999).
h represent the hour without zero preceding (0-23).
hh represent the hour with zero preceding (00-23).
n represent the minute without zero pr eceding (0-59).
nn represent the minute with zer o preceding (00-59).
s represent the seconds without zero preceding (0-59).
ss represent the seconds with zero preceding (00-59).
All others are represented in its entry form.
Saves the displayed time format
Deletes the displayed time format
OmegaView Plus 31437 V1
Operating Manual Page 29
Page 36

The Overview Diagram of Y/t-Diagram
The overview diagram is only valid for Y/t-diagrams. You may switch the Overview Diagram
ON/OFF via local menu.
In the Overview D iagr am is the entire measurement range dis played. The current selected data
section is high lightened. Click with the left mouse button in the over view diagram and draw a
boundary square to choose a different or another data section. The new selected section will be
displayed in the measuring data segment.
The Legend of Y/t-Diagram
The Legend m ay be switched ON/OFF via local menu.
The legend contains detail inform ation about the measurement lines such as line type,
measuring devic e, channel, measurement values at the m easuring curs or and d escription.
A double click with the left mouse button in th e measuring data segment r esets the Data
cursor. The corresponding measurement values of each measur ement lines appear in the
legend as numbers with the assigned units. The measuring cursor is valid only for Y/t-diagram
and disappears in the measuring data segment, if the legend is tur ned off.
31437 V1 OmegaView Plus
Page 30 Operating Manual
Page 37
The second data cursor of the Y/t-Diagram
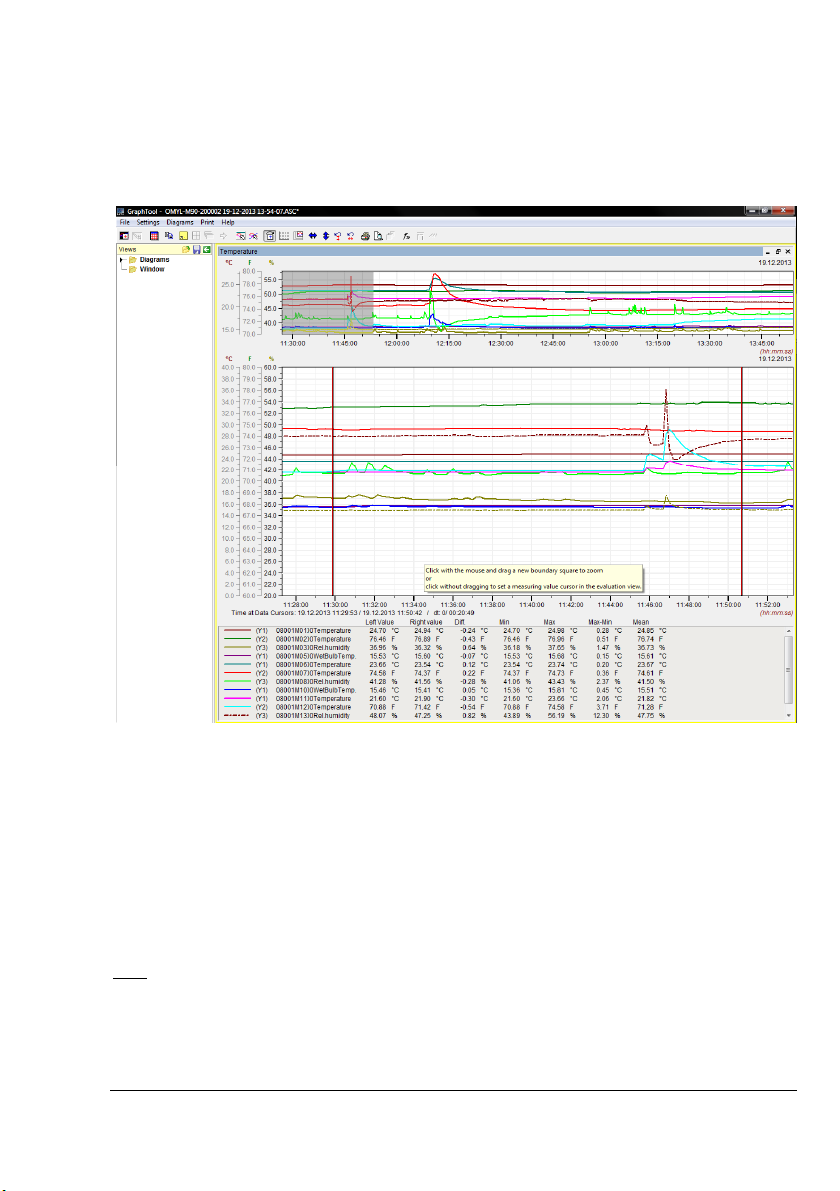
The second data cursor may be s witch ON/OFF via the local menu. Instead of one data
cursor in the diagram, two dat a cursors will be displayed.
The legend covers first of all general information about the measurement lines like line type,
measuring devic es, measurement channels and sens or designations.
Then the measurement values on both data cursor are shown and also the differenc e between
the two measurement values. Furthermore the program calculates the minimal-, maximal- and
the mean value of the channels between the two cursors and the difference of the minimal- and
maximal values and charts it on the diagram.
If you wish to move one of the data cursor, direct the mouse t o the curs or and hold the left
mouse button pressed while moving. The c orresponding measur ement values of each
measurement lines will be displayed in the legend as numbers with the corresponding unit.
Note
: The data cursor is available only for the Y/t-d iagram and disappears from the
measurement data segment, if you switch off the legend or the data cursor via the local menu.
OmegaView Plus 31437 V1
Operating Manual Page 31
Page 38
The X/Y-Diagram
The X/Y-Diagram in Partial View
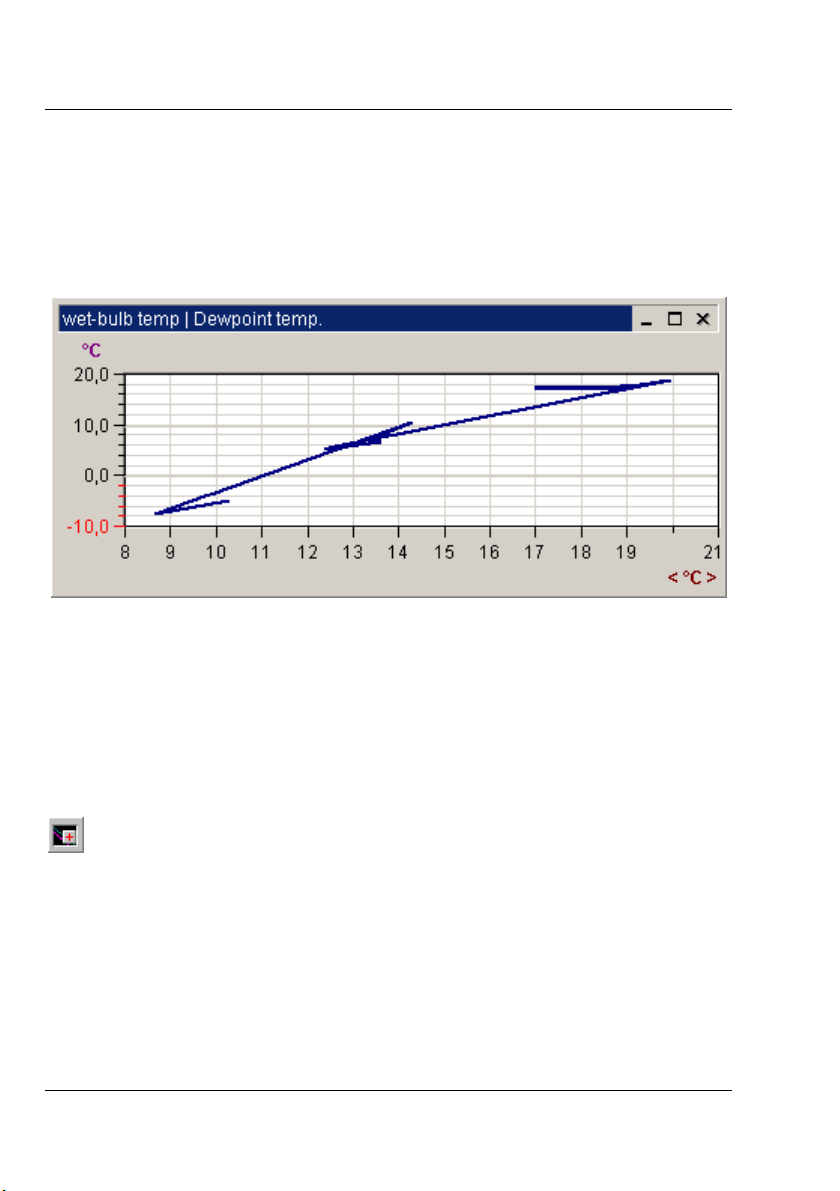
Um Select in the main menu Diagrams the item New X/Y-Diagram and assign your desired
channels. The X/Y-Diagram appears in this Partial View, if you chart historic data - already
recorded and stored data. By clicking and moving the border or corner of the diagram with the
mouse, you may modify the diagram size.
To show a Part of your meas urement and evaluation data in an enlarged form, m ove the mouse
in the diagram, press and hold the left mouse until you have the desired diagram section, then
release the mous e. The selected diagram part will be sh own in its enlarged view.
A doub le clic k at t he Axes Labels opens a control box, where you can enter the exact limits of
the diagram s ection in the Y- and X-direction. Using the arrow keys in the toolbar, you may
scale back the Y- and the X-axes to its maximum values.
Other Diagram Par ameter s may be activated by double clicking the diagram title with the left
mouse button.
Creates a new X/Y-Diagram via the tool bar.
Further details are described together with the Entire Screen View of the diagram in the next
pages. For explanations of further functions of the diagrams during the ONLINE-measurement,
please refer to the corresponding chapters in this manual.
31437 V1 OmegaView Plus
Page 32 Operating Manual
Page 39
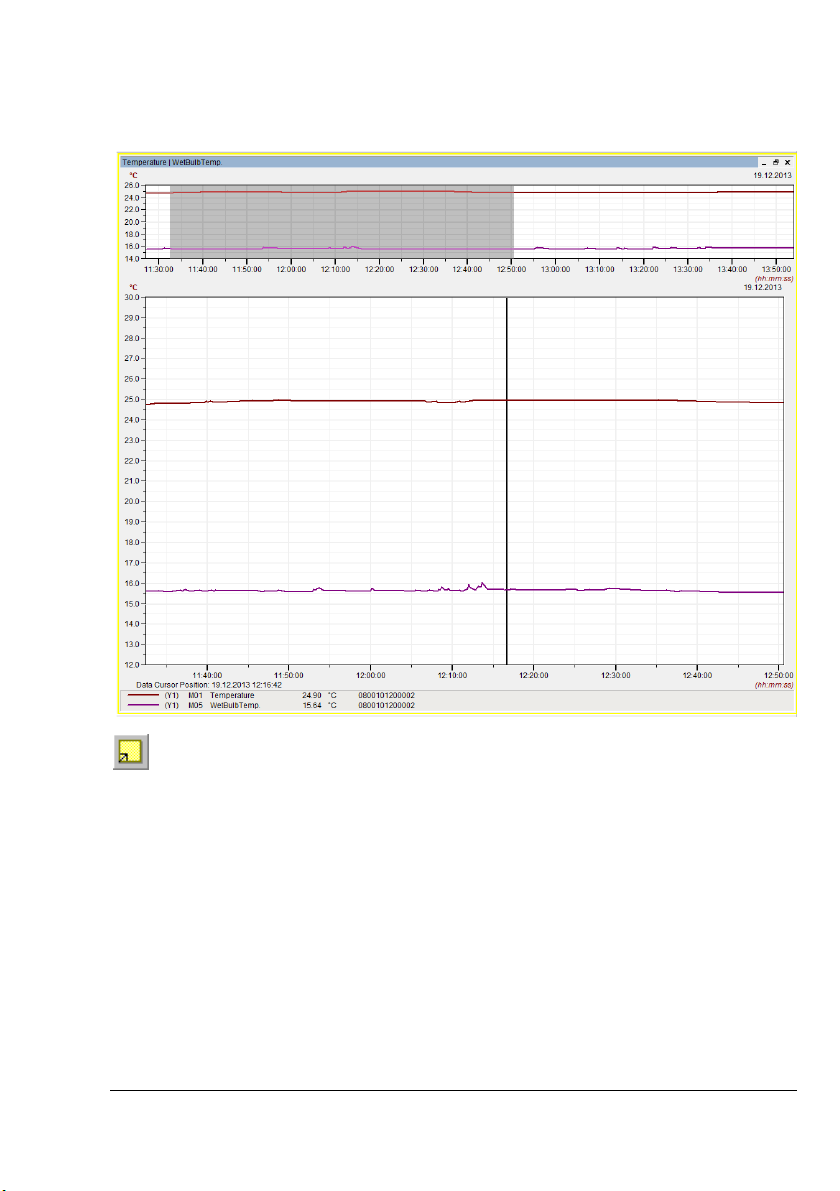
The X/Y-Diagram in Entire Screen View
Press this button in the tool bar for an Entire Screen View or choose in menu Diagram
the c ommand Dia-Z oom to Maximum. Pressing this button again will turn the diagram view
back to its original size.
· The Measurement Data Segment shows your desired range of measurement data.
· The Legend below contains detail information of the measurement lines. You may switch
the legend ON/OFF via loc al menu and you may configure the diagram.
· clicking the right mouse button may activate the Local Menu related to this diagram.
The Measurement Data Segment in X/Y-Diagram
To select and to enlarge a M easurement Data Segment, move the mous e in the diagram,
press and hold then move the left mous e button until you have the desired diagram segment.
The selected diagram segment will be shown in its enlarged view.
OmegaView Plus 31437 V1
Operating Manual Page 33
Page 40
Sc ales back the X- Axis to maximum (Auto scale X-Axis).
Sc ales back the Y-Axis to maximum (Auto scale Y-Axis).
Switch the Grid ON/OFF. You may also switc h the grid ON/OFF via Local Menu.
31437 V1 OmegaView Plus
Page 34 Operating Manual
Page 41
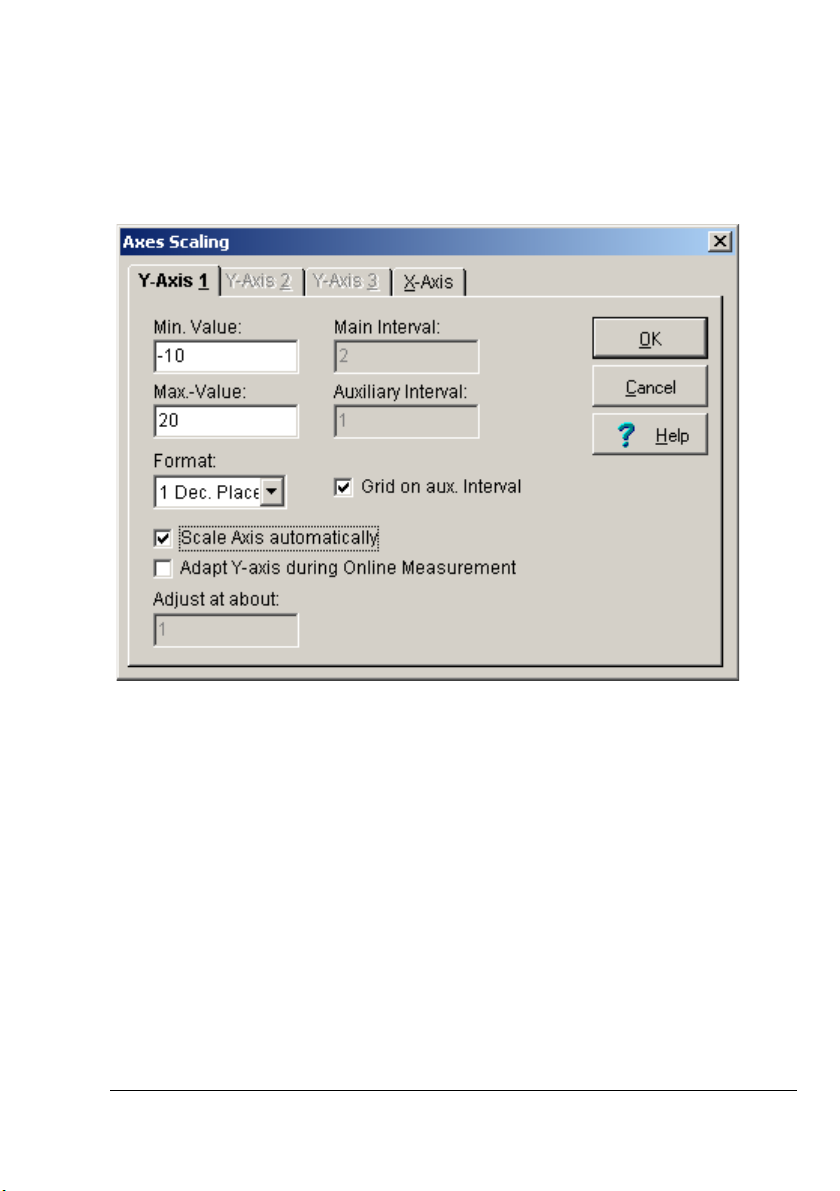
Scaling the Y-Axis in X/Y-Diagram
The measurement data segment of the Y-Axes may be set exactly as follows: A double click
with the left mouse button at the Y- or X-axes labels of the diagram, opens the dialog box Axes
Scaling.
Sel ec t a Y-Axis and enter the desired limits manually for your diagram.
Enter the interval for the graduation of the Y-Axis. The M ain Interval marks the distance from
one value to the next on t he Y-Axis. The Auxiliary Interval divides the main interval into its
corresponding subdivisions. The main i ntervals are labeled the auxiliary intervals are not.
Activate the Grids on the auxiliary interval to create additional grid lines.
For the Format of the values on the axes you may choose fr om 0 to 4 decimal places or you
may choos e the exponential f orm.
Activating th e option Axis automati c scaling, the program calculates the main and auxiliary
intervals automatic ally with respect to the Axis limit. The user cannot modify the values.
Activating the Adapt Y-Axis during online measurement, will automatically adjust the axis of
the current channel in the diagram (at a value set in Adjust at about), if the measuring values
go out of the previous range.
OmegaView Plus 31437 V1
Operating Manual Page 35
Page 42
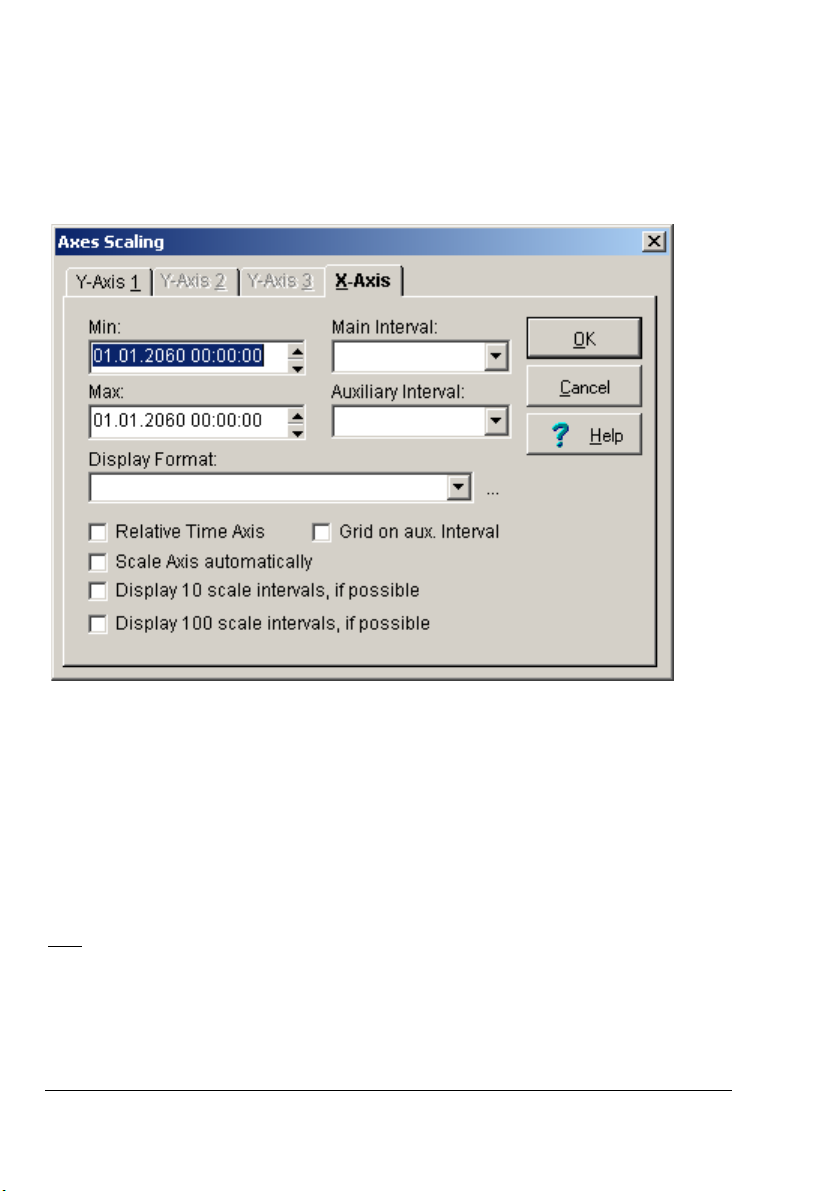
Scaling the X-Axis in X/Y-Diagram
The measurement data segment of the X-Axis may be set exactly as follows: A double click with
the left mouse button at the Y- or X-axes labels of the diagram, opens the dialog box Axes
Scaling.
Select the X-Axis and enter the desired limits manually f or your diagram. After all modifications
are done, press OK to confirm and to enter these ch anges.
The Legend of X/Y-Diagram
The legend m ay be switched ON/OFF via local menu and may also b e configured. The Legend
contains detail information about the measur ement lines such as line type, measuring device,
channel and description.
Note
: Through a double click at the c olumn in the display, the column will aut omatic ally be
scaled to ±10% of the actual measuring value. Activate the option adapt Y-axis during ONLINEmeasurement in the menu item A xes Sc aling t o adjust the axes automat ically to the n ew
measurement values.
31437 V1 OmegaView Plus
Page 36 Operating Manual
Page 43
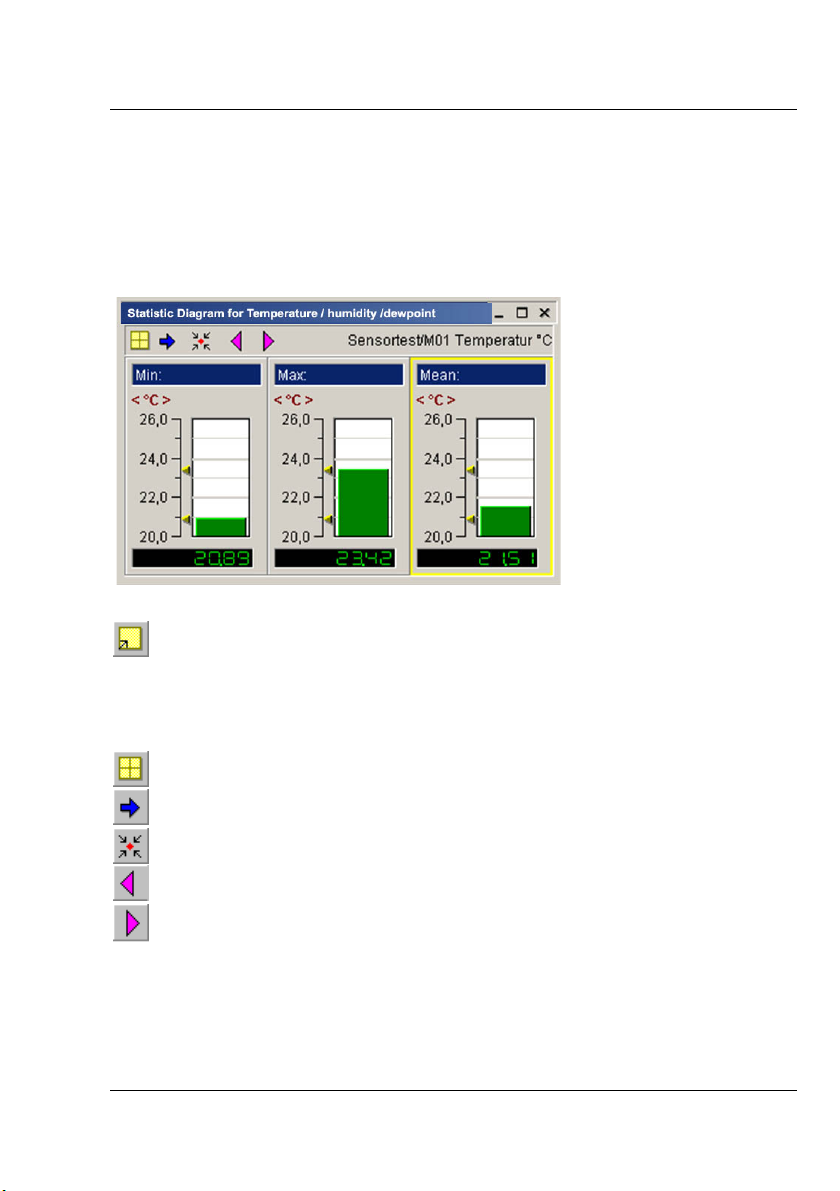
The Statistic Diagram
Diagram Functions
The Statistic Diagram contains the minimum, maximum and mean value of a measur ement
line in a Y/t-diagram. The diagram can only be created fr om an activ e Y/t diagram. To d o
so, click an existing Y/t diagram activate the „local menu” with the rig ht mouse button
and create your desired statistic diagram.
Press this button in the tool bar for an Entire Screen View or choose in menu
“Diagram” the command “D ia-Zoom to Maximum”. Pressing this button again will turn the
diagram view back to its original size.
The buttons in the toolbar within the diagram are:
Positions your statistic display optimal within the display area.
Changes from one statistic display to the next display.
Fits your diagram area optimal to the statistic diagram to be displayed.
Previous measurement channel of the Y/t-diagram
Next measurement channel of the Y/t-diagram
To change the Settings of the Statistic Diagram just double click the diagram title with the left
mouse but ton. The dialog box with diagram options appears. Here you may change your
diagram parameter settings and your measurement channel definition. This function is available
via button in the tool bar in the main menu and in the local menu.
OmegaView Plus 31437 V1
Operating Manual Page 37
Page 44
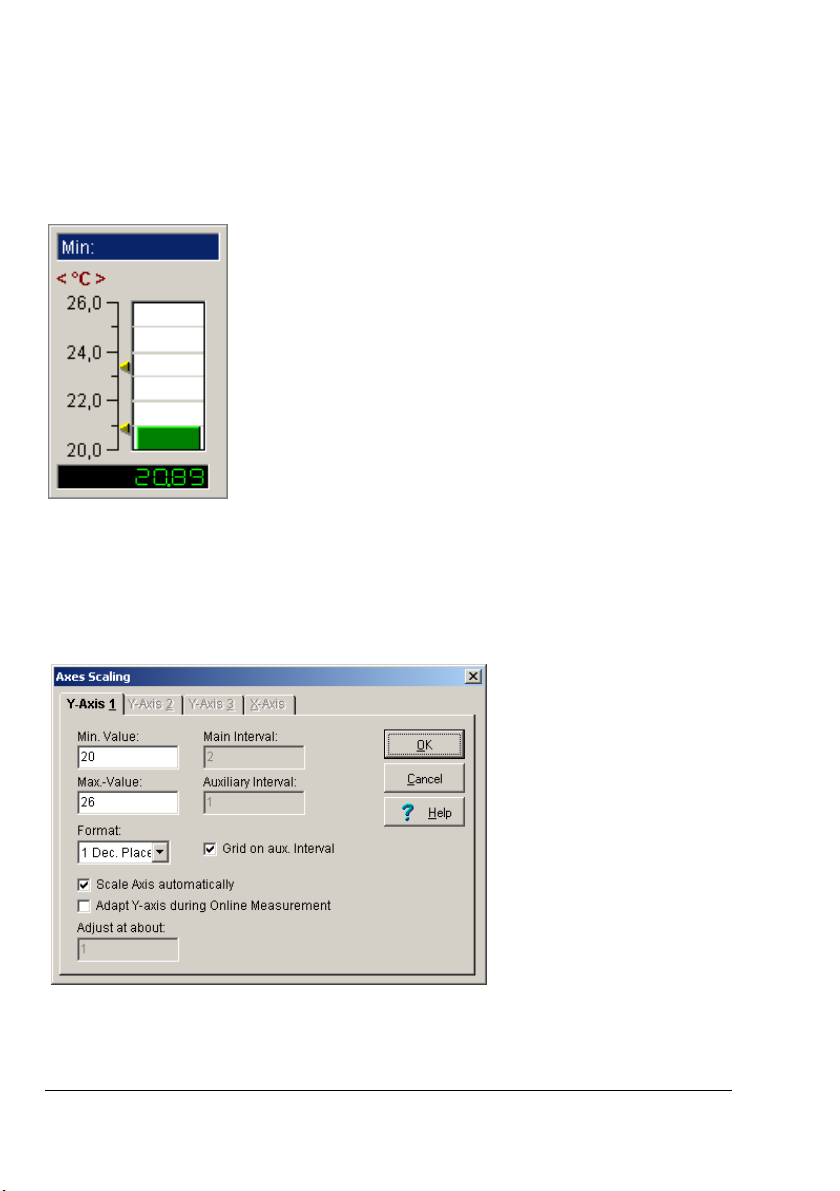
The Single Column Display of the Statistic Diagram
In the single column display the arrows left of c olumn indicate the highest and the lowest
measuring value. The current measuring value is digitally shown. The two arrows to the right of
the column correspond t o the upper and lower limits programmed in the sensor.
If the measurement value exceeds the upper limit the column color turns to red, if the value is
below the lower limit, the column turns to blue. If no exceeding of limits, the columns r emain
green.
To set the display range of the statistic scale, double click with the left mouse button on the
axes labels. This opens the dialog box Axes Scaling. E nter here your desired diagram limits
manually.
Enter the interval for the graduation of the Y-Axis. The Main Interval marks the distance from
one value to the next on the Y-Axis. The Auxiliary Interval divides the main interval into its
corresponding subdivisions. The main i ntervals are labeled the auxiliary intervals are not.
Activate the Grids on the auxiliary interval to create additional grid lines.
31437 V1 OmegaView Plus
Page 38 Operating Manual
Page 45

For the Format of the values on the axes you may choose fr om 0 to 4 decimal places or you
may choos e the exponential f orm.
Activating th e option Axis automati c scaling, the program calculates the main and auxiliary
intervals automatic ally with respect to the Axis limit. The user cannot modify the values.
Activating the Y-Axis Adjustment during online measurement, will automatically adjust the
axis of the current channel in the diagram (at a value set in Adjust at about), if the measuring
values go out of the previous range.
Note
: Through a double click at the c olumn in the diagram the column will automatically be
scaled to ±10% of the actual measuring value.
OmegaView Plus 31437 V1
Operating Manual Page 39
Page 46
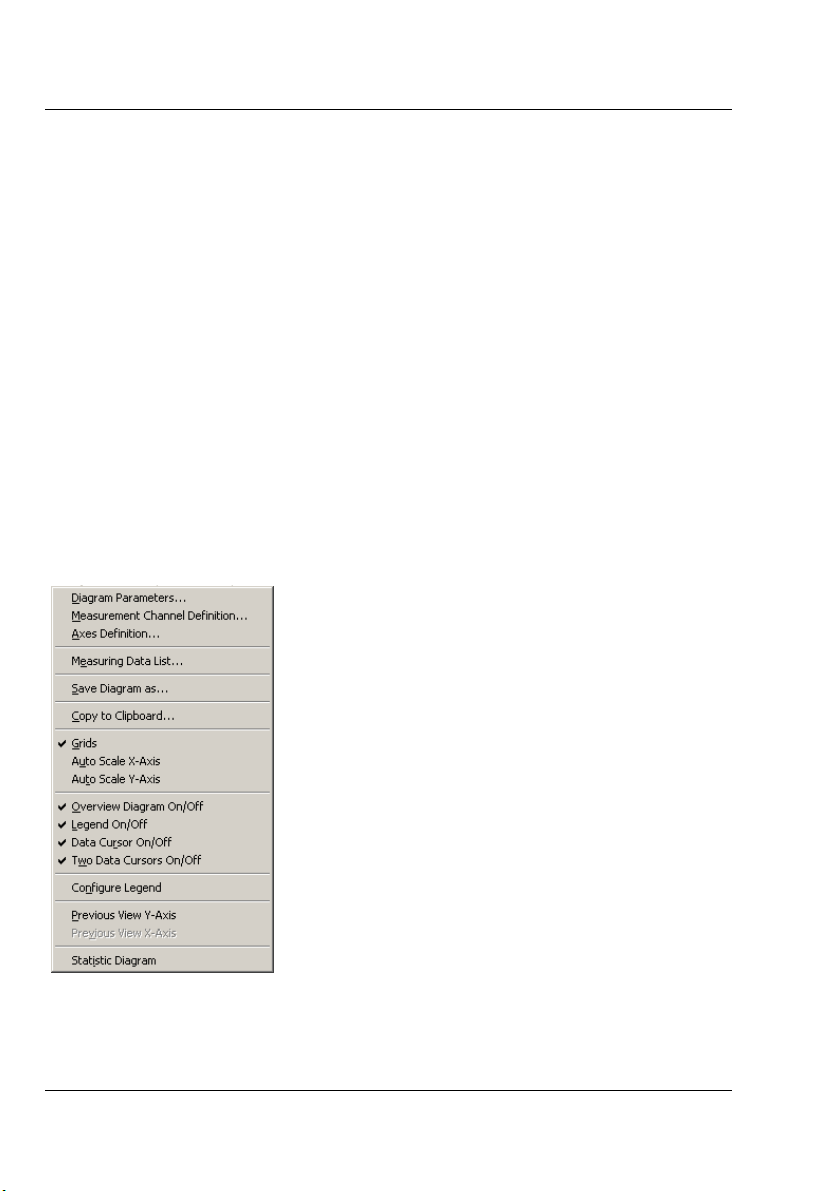
The local Menu (Context menu of diagrams)
For every diagram is a Local Menu available. The diagram functions may be executed
comfortably. Just activate with the right mouse button.
For a Y/t-Diagram, the following functions are available in the local menu:
· Diagram Par ameter
· Measurement Channel Definition
· Axes Definition
· Measuring Data List
· Save Diagram
· Copy current diagram to the clipboard)
· Grids ON/OFF
· Auto scaling X-Axis
· Auto scaling Y-Axis
· O verview Diagram ON/OFF
· Legend ON/OFF
· Data Cursor ON/OFF
· Two Data Curs or ON/OFF
· Configure Legend
· Previous view Y-Axis
· Previous view X-Axis
· Statistic Diagram
31437 V1 OmegaView Plus
Page 40 Operating Manual
Page 47
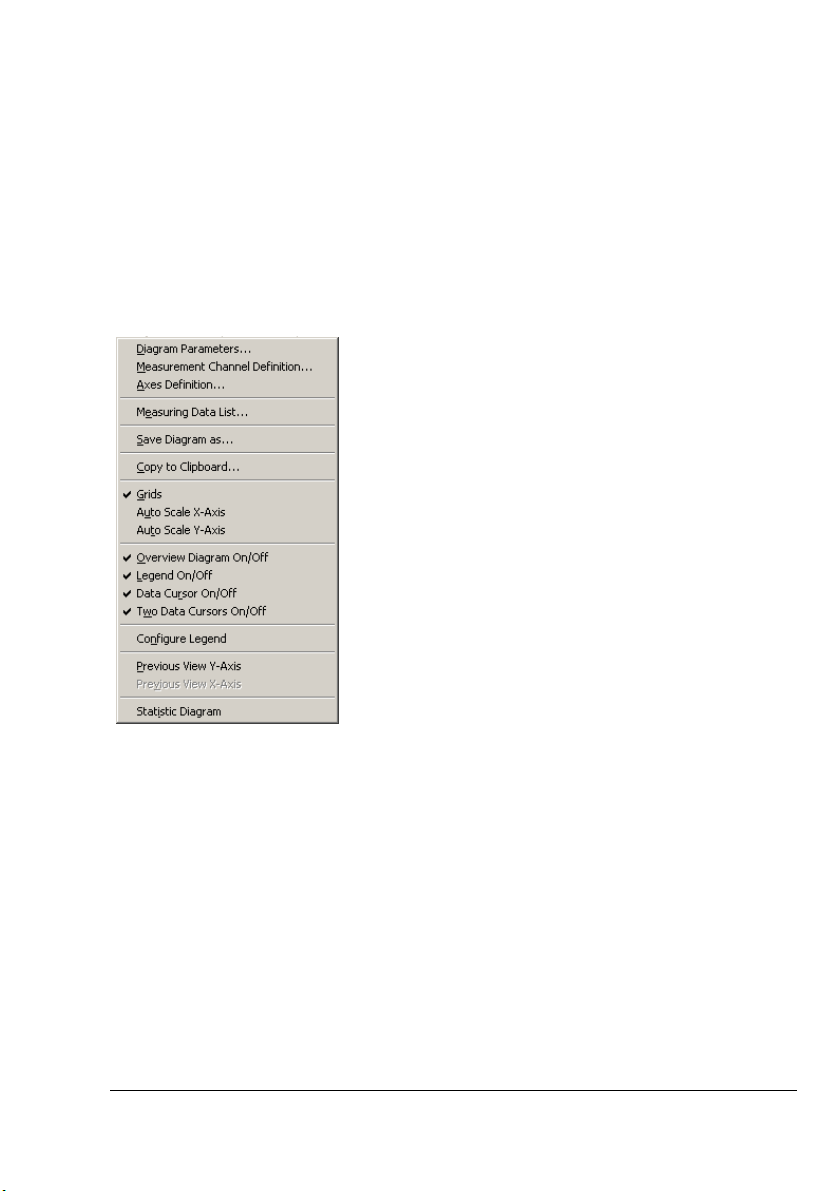
For an X/Y-Diagram, only the following high-lightened f unctions are available:
· Diagram Par ameter
· Measurement Channel Definition
· Axes Definition
· Measuring Data List
· Save Diagram
· Copy current diagram to the clipboard
· Grids ON/OFF
· Auto scale X-Axis
· Auto scale Y-Axis
· Legend ON/OFF
· Configure Legend
OmegaView Plus 31437 V1
Operating Manual Page 41
Page 48
The Measuring Data Lists
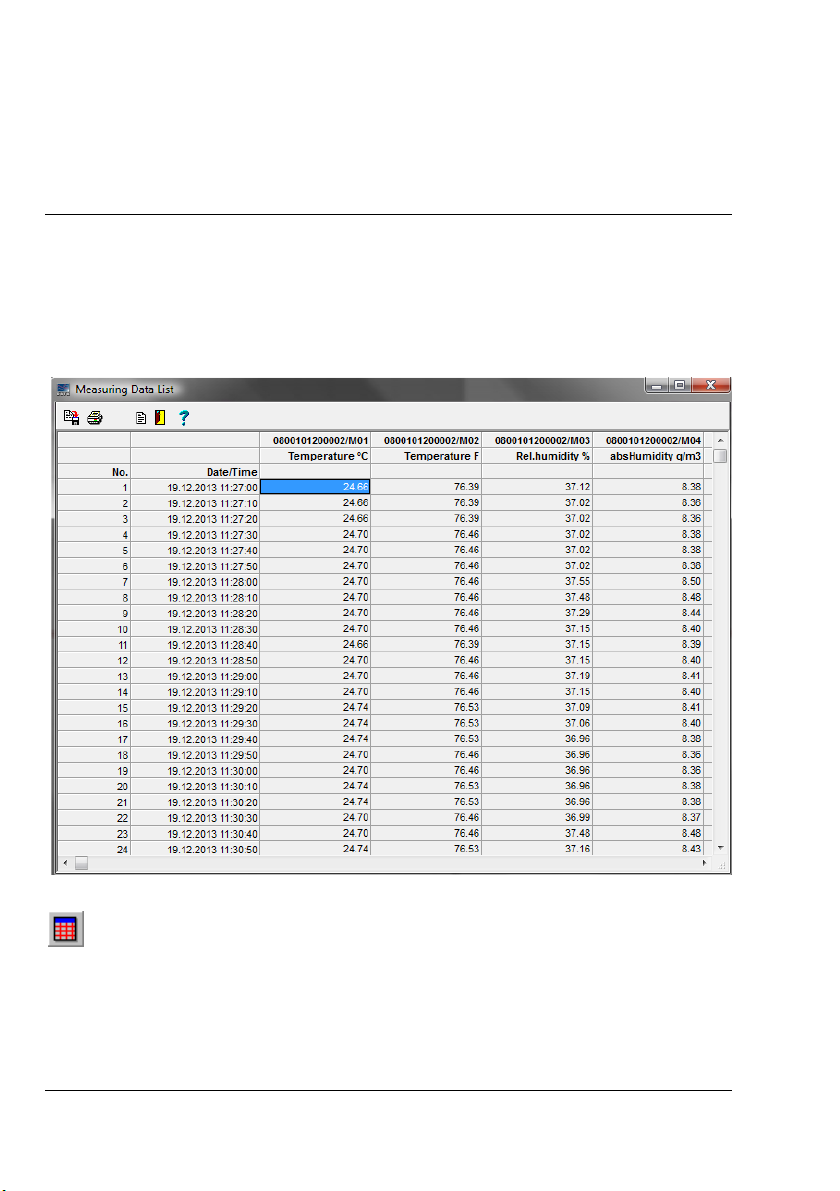
The Global Measuring Data List
The program shows in the measuring data list all measuri ng data in a single list. Select in the
main menu Diagrams the menu item global measurement value list, t o write down all up to
this point recor ded measuring data in a single list. The measurement values are arranged
according to absolute time relation (date and time).
With this button in the tool bar you may likewise activate the global measurement
value list.
31437 V1 OmegaView Plus
Page 42 Operating Manual
Page 49
The Local Measuring Data List with Absolute Time Relation
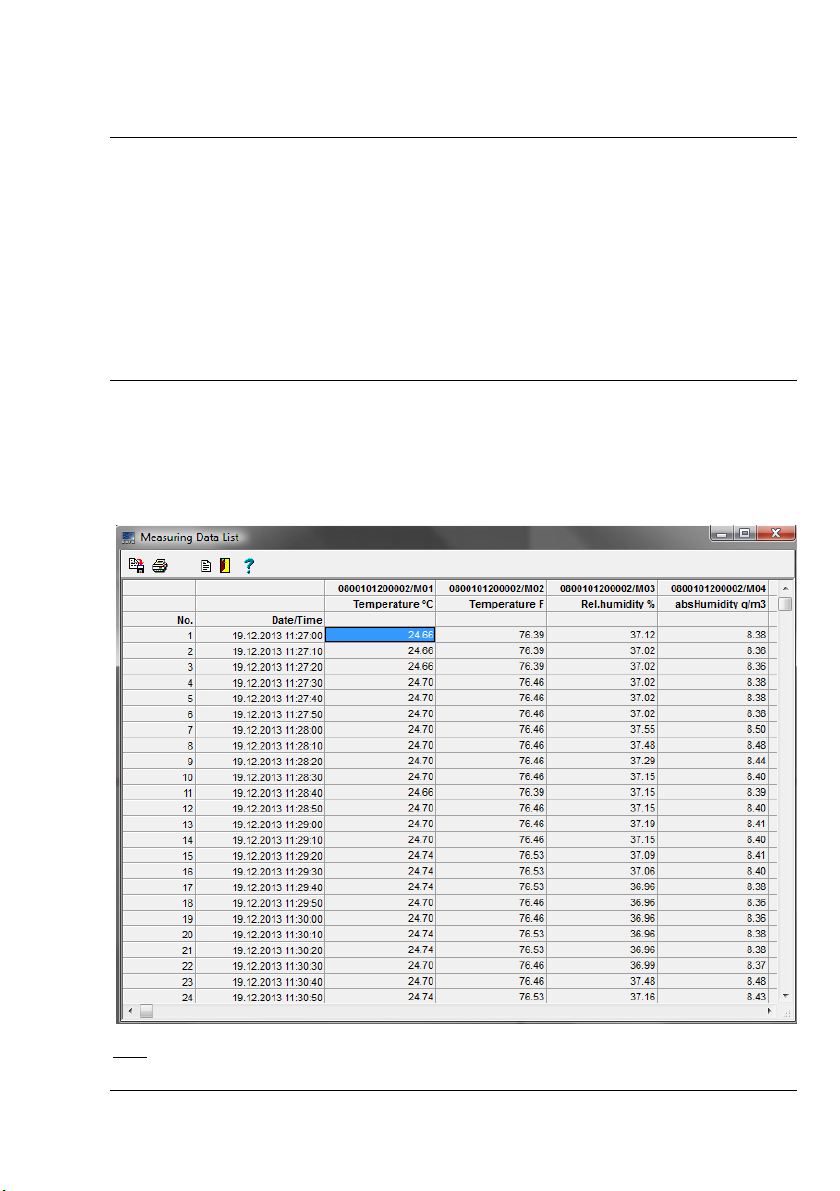
In the local measuring data list, the program shows the measuring data of the actual chosen
diagram. Set as standard is the local measuring data list with abs olute time relation.
If you activate the measuring data list via the local menus of the diagram (with exception of the
statistic diagram), you obtain the local measuring data list with absolute time relation. Each
of this contains only the measuring values of all channels of the actual diagram with date and
time of the measurement.
The Local Measuring Data List with Relative Time Relation
From the Y/t-Diagram you may additionally create a measuring data list with relative
measuring Date/Time. To do so activate the option relative time axis in the X-axis scale. This
list always starts at 00:00 hours and has no date display. This option allows you to display
measuring series simultaneously if only the measuring progression is relevant and not the
measuring time.
Note
: This option is valid only for Y/t-Diagrams and not f or other diagram types!
OmegaView Plus 31437 V1
Operating Manual Page 43
Page 50
Functions of the Measuring Data List
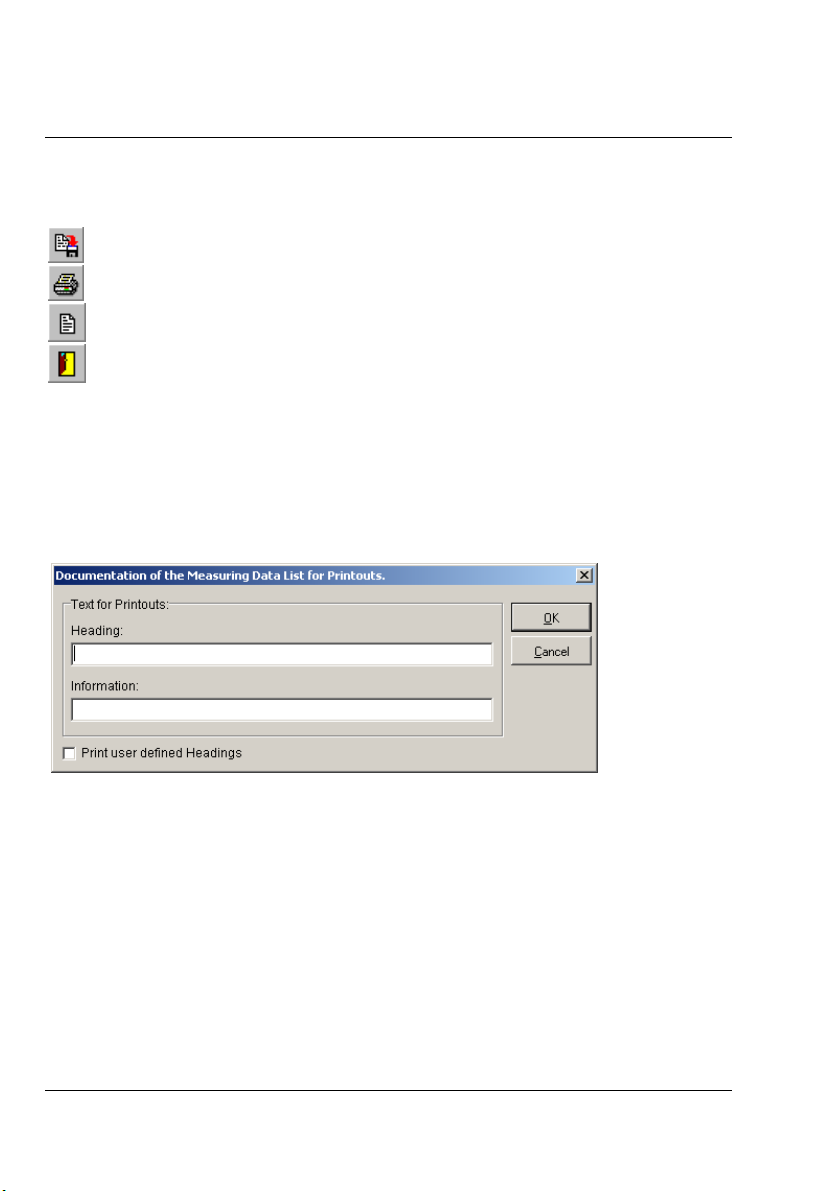
The Buttons in the tool bar of the measuring data list are:
Exports data from the measuring data list in EXCEL- or ASCII-Format
Prints table
Enters text for output
Exits measuring data list
Data Entry for the Documentation of the Measuring Data List
To enter data for the documentation of the output of t he measuring data list, press the
data entry button. A dialog box appears where you may enter the heading or title of the list and
other additional information. If the option user-defined heading is active, this inf ormation will
then be printed out.
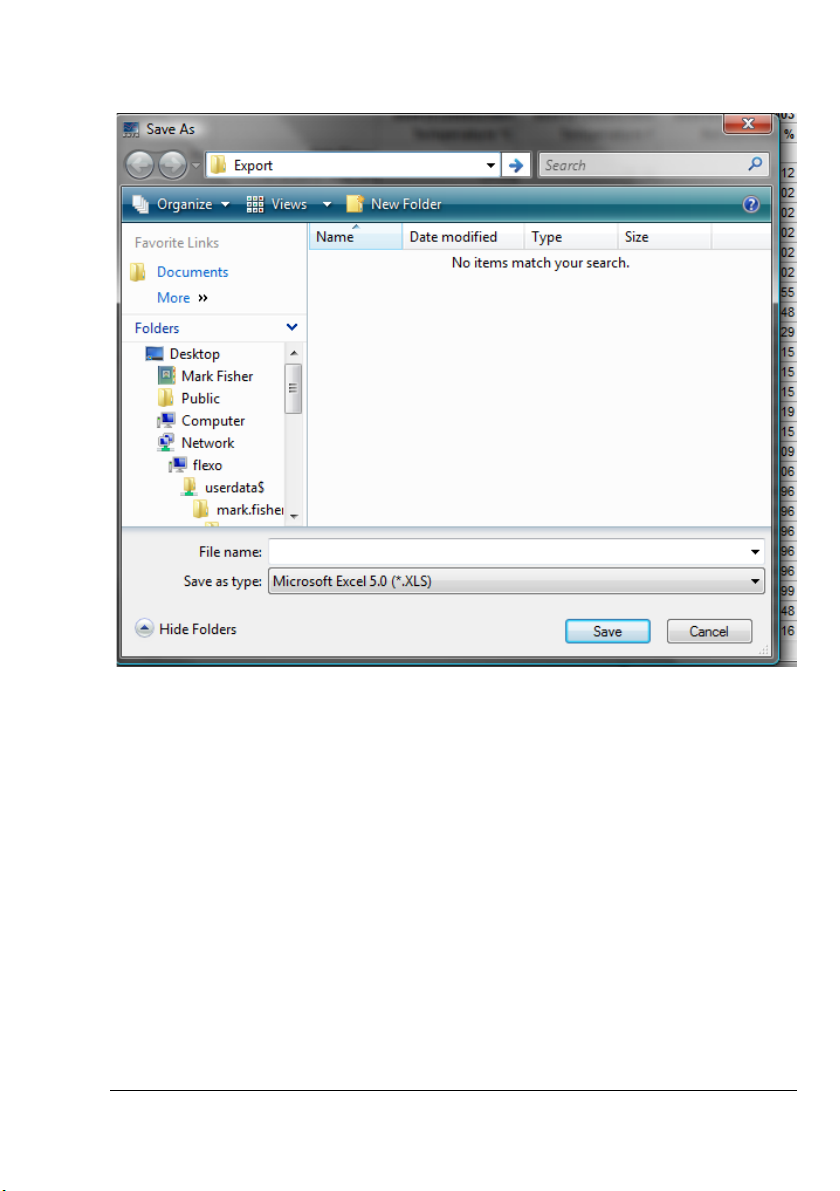
Exporting Data from the Measuring Data List
To export data from the measuring data list, pr ess the export butt on and select your desired
export format. Enter in the text box the directory and the file name. At present export formats
available are EXCEL- and ASCII-Format.
31437 V1 OmegaView Plus
Page 44 Operating Manual
Page 51
OmegaView Plus 31437 V1
Operating Manual Page 45
Page 52
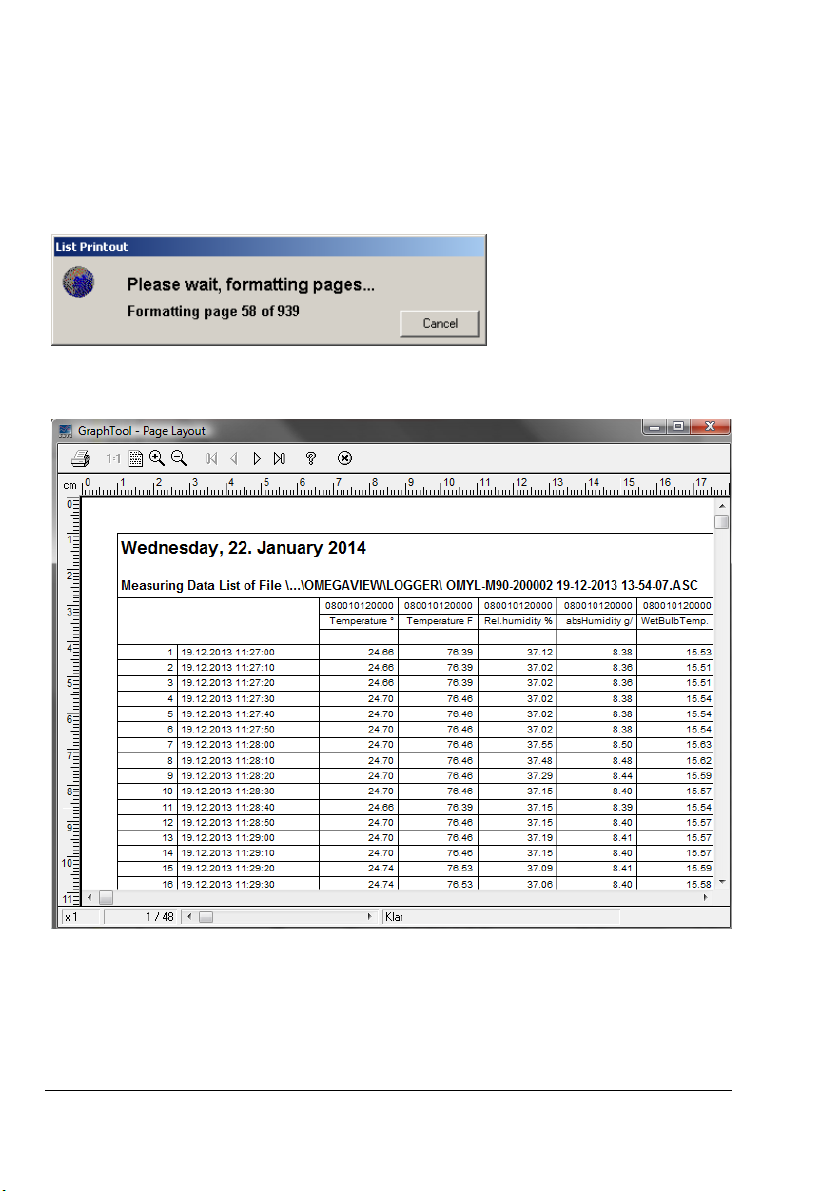
Printing Measuring Data List
Press the button Print Table to print the displayed measuring data list as a table. This hint box
appears.
Finally an evaluation view opens where you may print your table.
31437 V1 OmegaView Plus
Page 46 Operating Manual
Page 53
The Evaluation of the Measurement
Entering / Editing Formula (Standard)
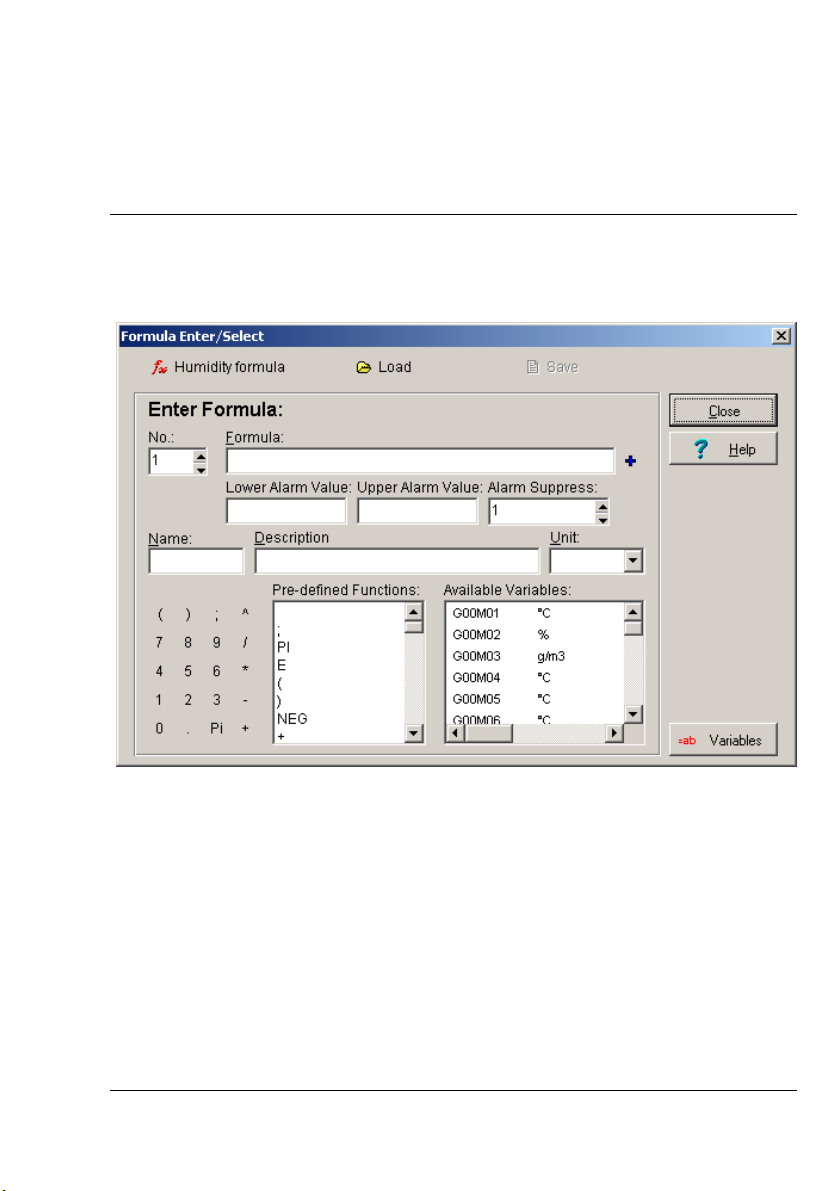
Select in the main menu Evaluate the command Formula Enter / Edit, to create the f ormula
you need for the evaluation of your measurement values. This dialog box appears.
You may s elect an existing f ormula from the formula data bank and enter this as formula
channel in die channel table.
The Fields of the Formula Enter / Select Dialog Box
No.: Formula channel number to be entered in the channel table
analog to measurement channel number (starting with F..)
Formula: Mathematical term consisting of variables (Measurement and
Formula Channel) combined with mathematical functions
Name Short description of the formula for the channel table and formula
data bank
Description: Text box for user specific comments about the f ormula
Unit: Physical unit selectable from the units list
Predefined Functions: Mathematical functions for combining variables
OmegaView Plus 31437 V1
Operating Manual Page 47
Page 54
Available Variables Measurement or f ormula channels consisting of device number
and measurement channel number or device number and formula
channel number.
you may additionally us e as part of the formula for the formula definition.
Note
: A formula channel f or combining meas urement data wil l be entered in the channel table of
the measurement setup like a measurement channel. A maximum of 99 formula channels is
possible. A formula can only be saved, if the mathematical term is valid and if the formula name
is defined. The Limits of a formula are to be entered in the channel table.
Opens an additional dialog box with user specific defined variable which
Creating a New Formula
To create a new formula, proceed as follows:
1. First choose a free formula channel number.
2. Enter your mathematical term in the formula box. Signs from the keyboard block may be
applied by clicking the left mouse button. Mathematic al functions and variables such as
measurement channel and other predefined formula channel may also be applied in your
mathematical term by double clicking the left mouse butt on.
3. Al ways add at the end of your mathematical term a semicolon „;”. Only then is your
formula complete.
4. Assign your formula a name, which will be used as a short description for the channel
table and f or the formula data bank.
5. S elect a physical unit for your formula.
6. Describe briefly the function of the formula in the respective text box.
Note
: If you want to repeat the calculation with different parameters just change the desired
formula channel. Calculations fr om combination of f ormula channels will be considered and
automatically be computed.
31437 V1 OmegaView Plus
Page 48 Operating Manual
Page 55

List of Implemented Mathematical Functions
+ - * / ( ) < > = basic math ematical operations
DIV, MOD integral division and module (the remainder from division)
GGT, KGV largest common divisor and smallest common multiple.
^ r aise to a higher mathematical power
SQR, SQRT square and square root
EXP exponent ial function
LN, LG, LD natural logarithm, base 10 logarithm and base 2 logarithm
PI pi
E exponential function (invers e logarithm
NEG negation
SIN, COS, TAN, COT, trigonometric functions
ARCSIN, ARCCOS,
ARCTAN, ARCCOT,
SINH, COSH, TANH, COTH,
ARCSINH, ARCCOSH,
ARCTANH, ARCCOTH angle functions
ABS absolute value
REZ r ecipr ocal
FAK faculty
INT integer (whole number form floating point number)
DEG conversion from radial to degrees
RAD conversion from degrees to radian
RND rounding
SGN determines sign (-X = 1, 0 = 0, +X = 1)
Special Function
The f ollowing ar e special functions, where you c an get a direct access to the channel and to
the contained data. The variable name must have a prefix „I” (for Index) to enable the program
to determine the correct value.
Example:
special function variable name: IG00M01
I Index Designation
INDEX value of the channel at index x Example
MEAN mean value of the channel data Example
MIN smallest value of the channel data Example: MIN(IG00M01)
MAX largest value of the channel data Example
LAST last recorded value of the channel data Example
FIRST first recorded value of the channel data Example
SUM summation of all values of the channel data Example
normal variable name: G00M01
: (IG00M01 INDEX 10)
: MEAN(IG00M01)
: MAX(IG00M01)
: LAST(IG00M01)
: FIRST(IG00M01)
: SUM(IG00M01)
OmegaView Plus 31437 V1
Operating Manual Page 49
Page 56
Applying / Saving a New Formula
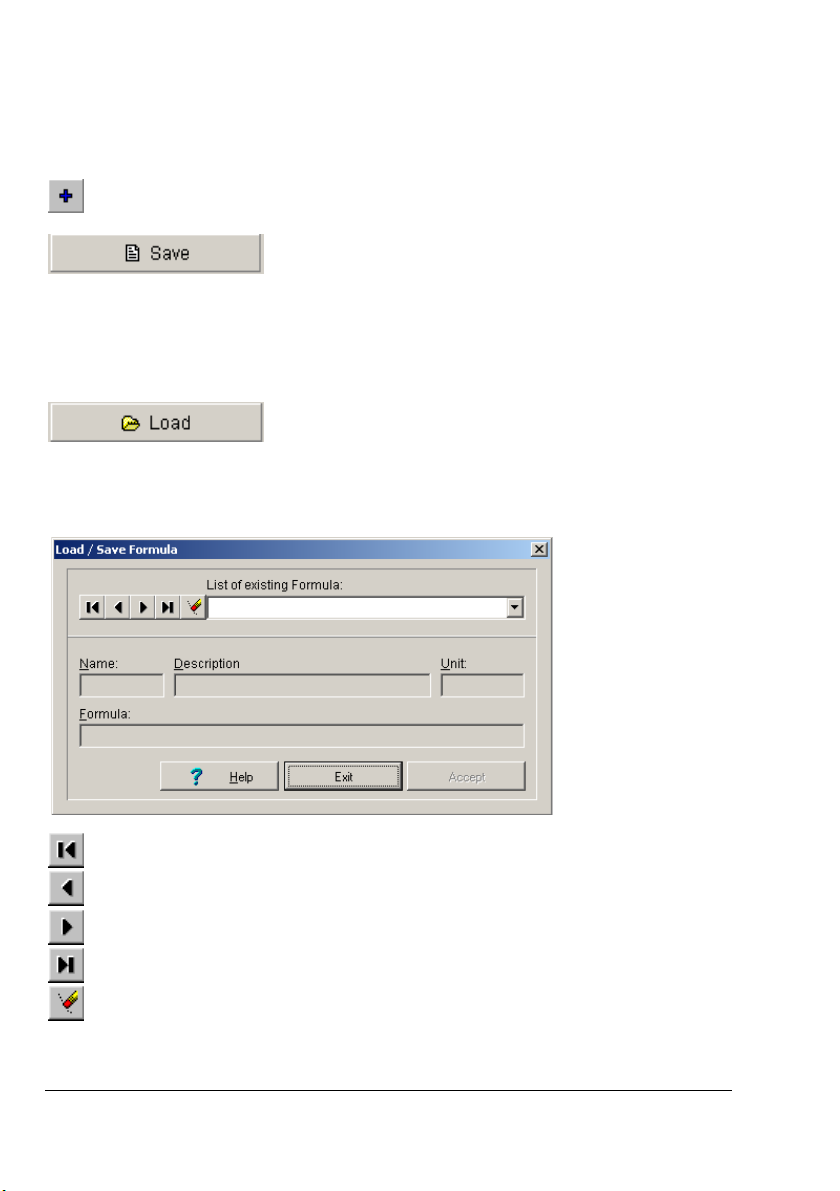
Adds your formula as formula channel to your channel table in the measurement setup.
If your desired formula name already exists in the data bank, you can either overwrite the
existing formula name or change your f ormula name.
Saves the valid and complete f ormula in the for mula data bank.
Loading an Existing Formula
open this dialog box where existing formulas are listed. Select your desired formula from the list
of existing formula and enter this in the Formula Enter / Select box. Formula characteristics will
be displayed in the respective fields. Us e buttons to go from one data record to the other or to
del et e unnec es s ary f ormula.
In the dialog box of Formula Enter/Edit click the load button to
Go to first data record
Go to previous data r ecord
Go to next data record
Go to end of data record
Delete current formula
31437 V1 OmegaView Plus
Page 50 Operating Manual
Page 57
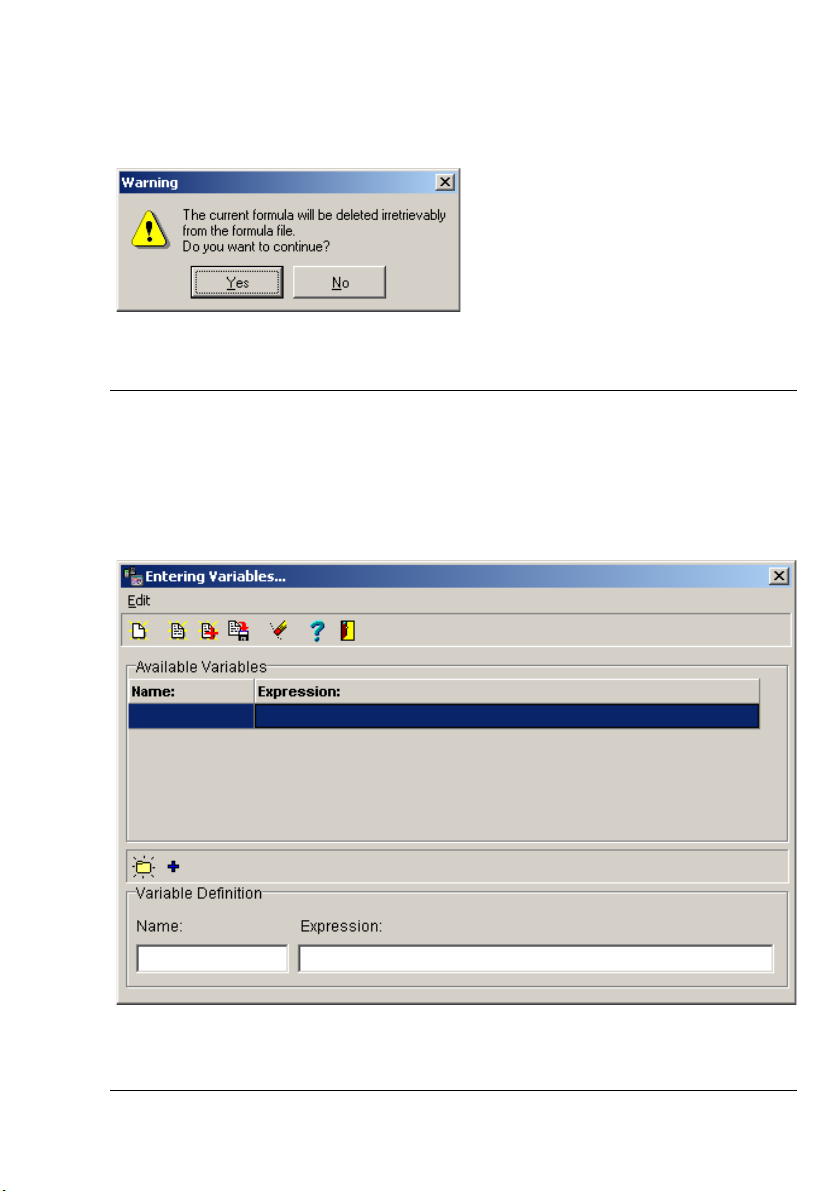
This security check will be displayed before a formula from the formula data bank will be finally
deleted.
Using Variables
Enter / Edit Variables
Use variables to save often recurring f ormula part. Hereby you may reduce eff ort in entering
your formula. Select in the main menu Evaluate the menu it em entering/editing variables to
define the variables for the processing of your measur ement data. This dialog box will appear.
You may save a variable in a variable data bank, or you may save in a file and us e in any
formula.
OmegaView Plus 31437 V1
Operating Manual Page 51
Page 58
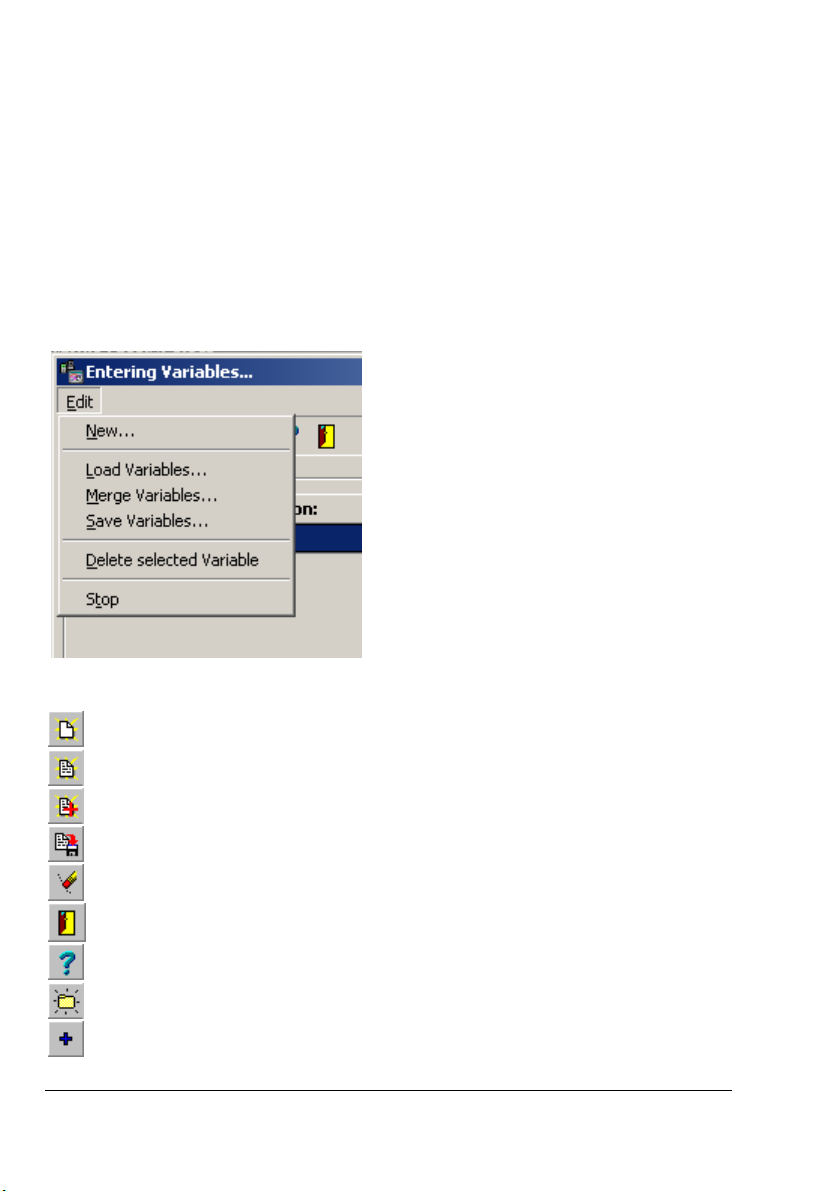
Editing Variables
Select in the submenu of the variables the item Edit the shown menu will appear with the
following functions:
· Add new variable
· Load variable
· Merge variable
· Save variable
· Delete marked variable
· Stop (close table)
The functi ons ar e als o vi a the tool bar of the variable table comfortable to handle. T he buttons
in particular means:
D elete all variables
Load variables
Merge variables to existing configuration
Save variables in files
D elete marked variables
Close variable table
Activate help t o variables
Ent er new vari ables
Ent ered variables verify and insert
31437 V1 OmegaView Plus
Page 52 Operating Manual
Page 59
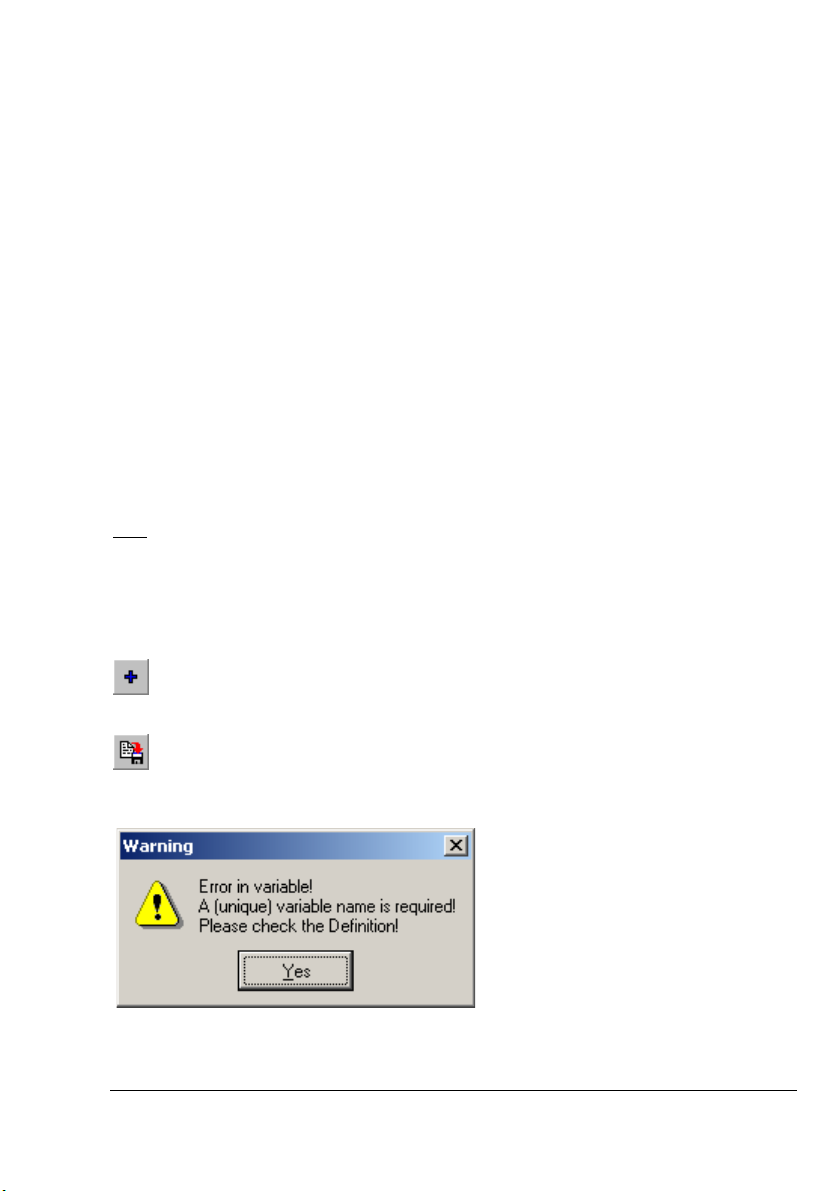
The Fields of the Variable Entry / Selection
At the upper part of the dialog box the available variables are listed. At the lower part you may
enter and insert in the definition of variables new variable and modify existing variables. The
entry fields means :
Name: Short description of the variable for the variable data bank (file).
Expression: Calculation equation for variables to be use in the measuring and
formula channels.
Formulate a New Variable
To formulate a new variable, please proceed as follows:
1. Enter your Calculation equation in the field terms.
2. End-up your calculation equation with a Semicolon „;”. Only then is your equation
complete.
3. Give your variable a Name as short description for the variable data bank.
Note
: If you want to repeat the calculation with a different parameter, you only have to modify
the desired term. Calculations from interdependent formulas will automatically be recalculated.
Accept / Save a New Variable
Verifies the entered variable and insert a valid and complete variable in the variable
data bank.
Saves the existing variables in a file.
If the definition of the variable is incorrect this message will appear.
OmegaView Plus 31437 V1
Operating Manual Page 53
Page 60
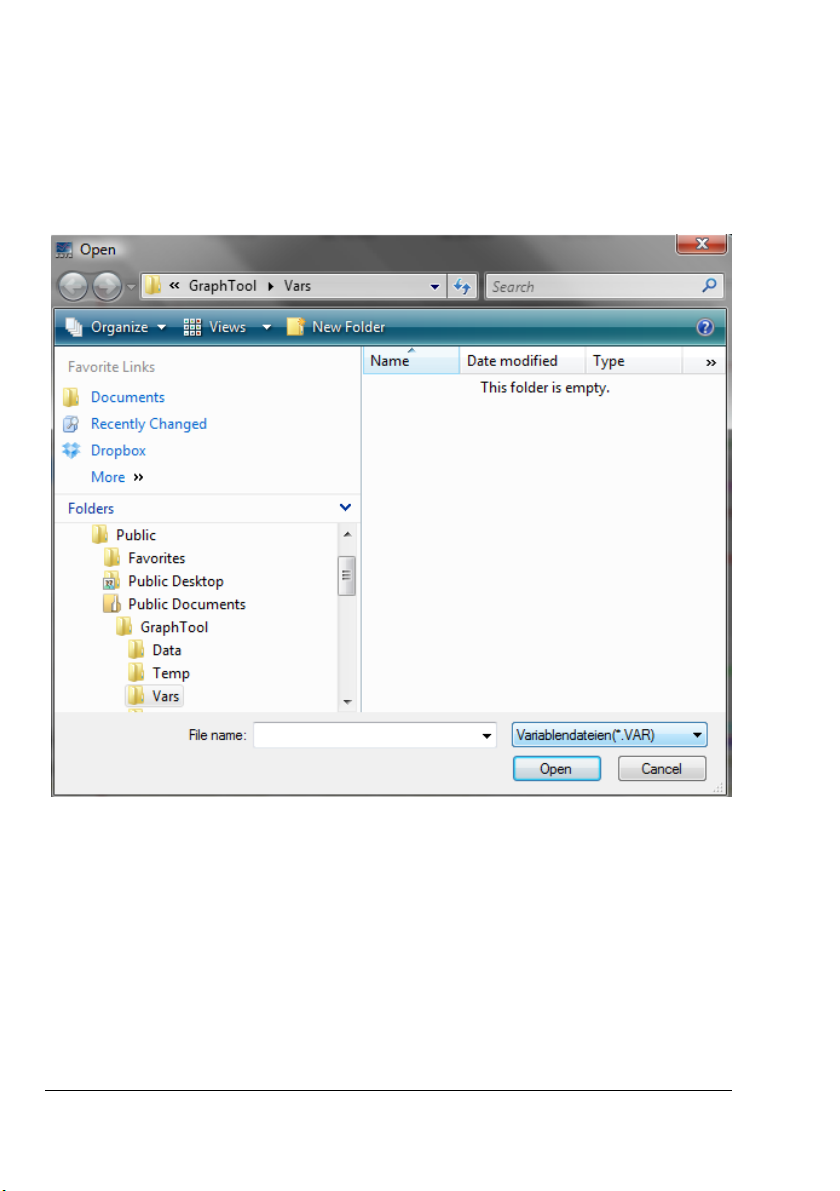
Load Variable / Merge Variable / Save
Select in the submenu variabl es the item load/ merge/ save variable or the corresponding
button in the tool bar. This d ialog box appears . Files for variable have the ending *.var.
31437 V1 OmegaView Plus
Page 54 Operating Manual
Page 61
Printing-out of Measurements
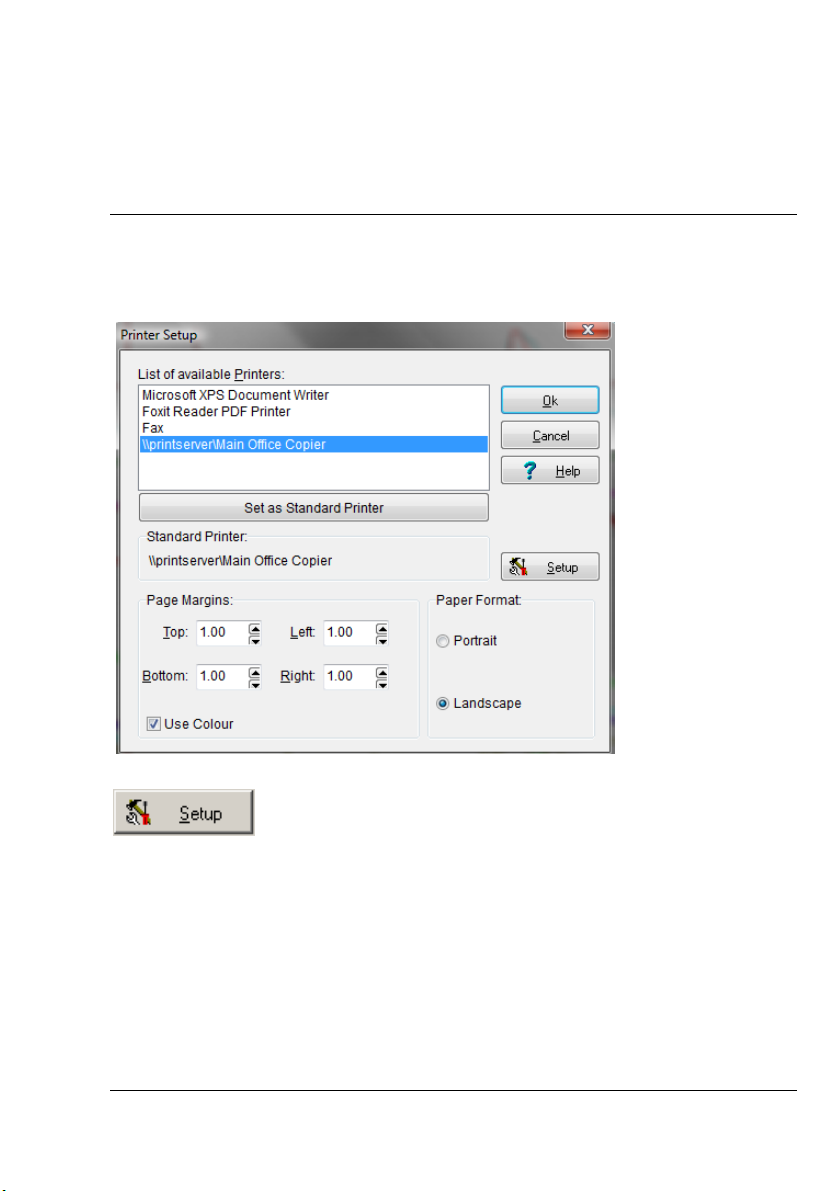
Configure Printer
Select in main menu File the command Printer Setup, to configure your printer. The dialog box
on the left will appear.
Opens the printer setup according to W indows-Standard. You may set
here further options of your printer.
OmegaView Plus 31437 V1
Operating Manual Page 55
Page 62
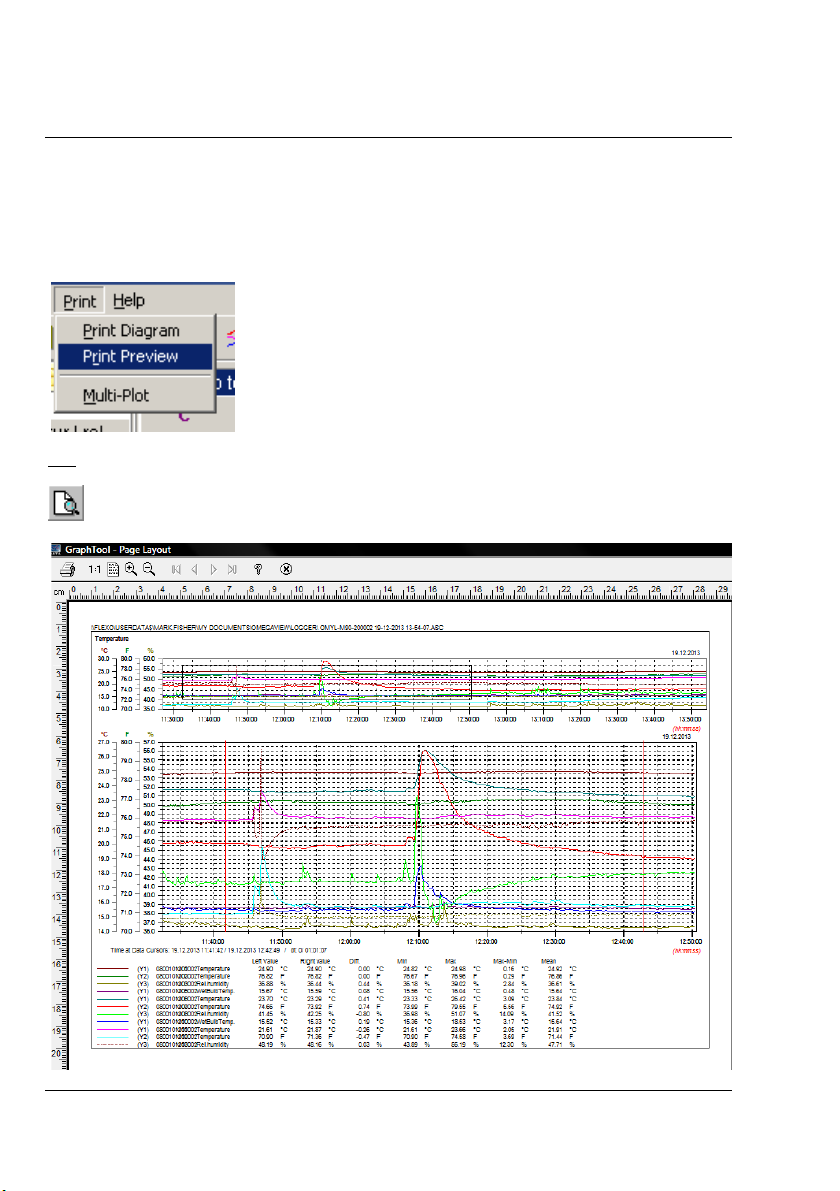
Diagram Preview
Select in the main menu Print the c ommand Page Preview. The page preview shows the
page, which will b e printed later. This view mode is only available for the Y/t-diagram and for the
X/Y-diagram. The digital and c olumn monitoring diagrams and function indic ating panel do not
have page previews.
Hint
: By activating the page preview via Menu Print, the printer selection box will first appear..
go to diagr am preview.
31437 V1 OmegaView Plus
Page 56 Operating Manual
Page 63
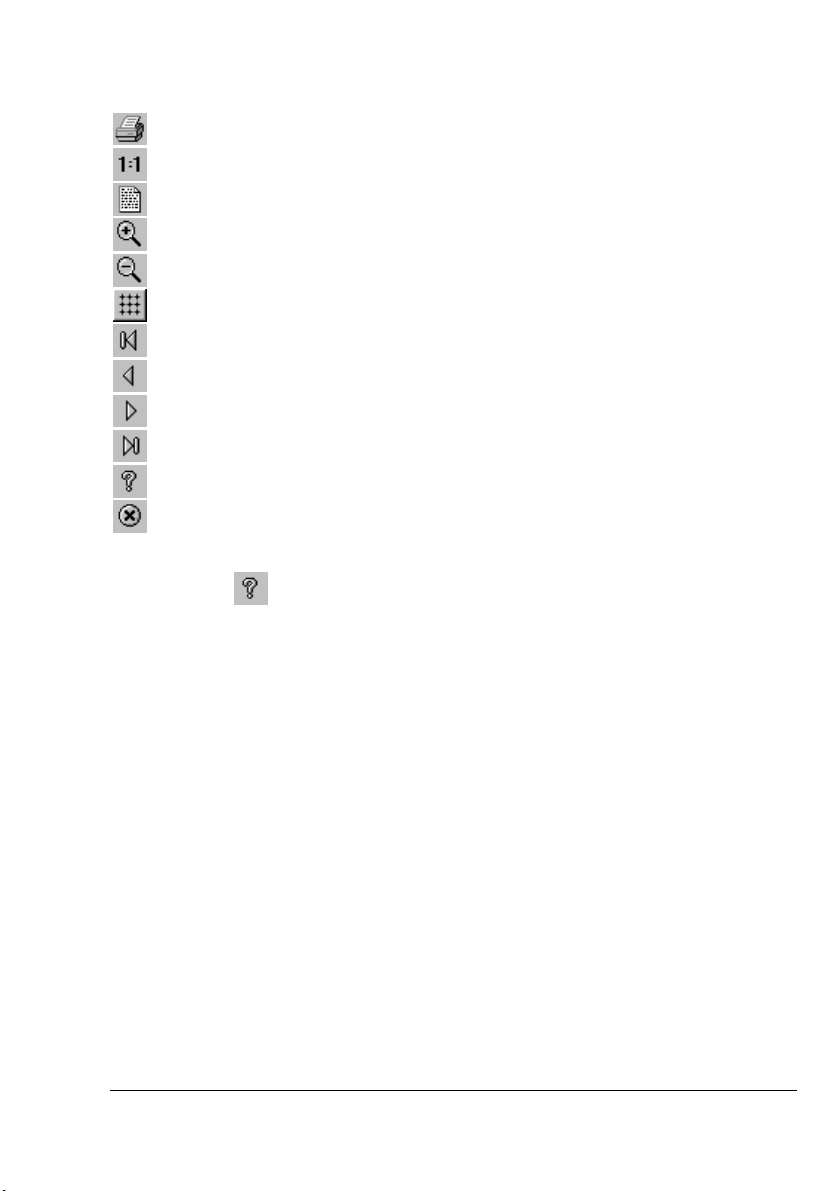
Go to printer setup
Shows view in scale 1:1
Shows all pages at the same time
Enlarges view
Reduces view size
Apply grid
Go to page one of view
Go to previous page
Go to next page
Go to last page of view
Displays help for mouse button and key functions
Exits page preview
Press the button
, to activate the help functions.
OmegaView Plus 31437 V1
Operating Manual Page 57
Page 64
Print Diagrams
The function Print Diagram is available only for active Y/t-diagrams or X/Y-diagrams. Digital
and column monitoring diagrams cannot be printed.
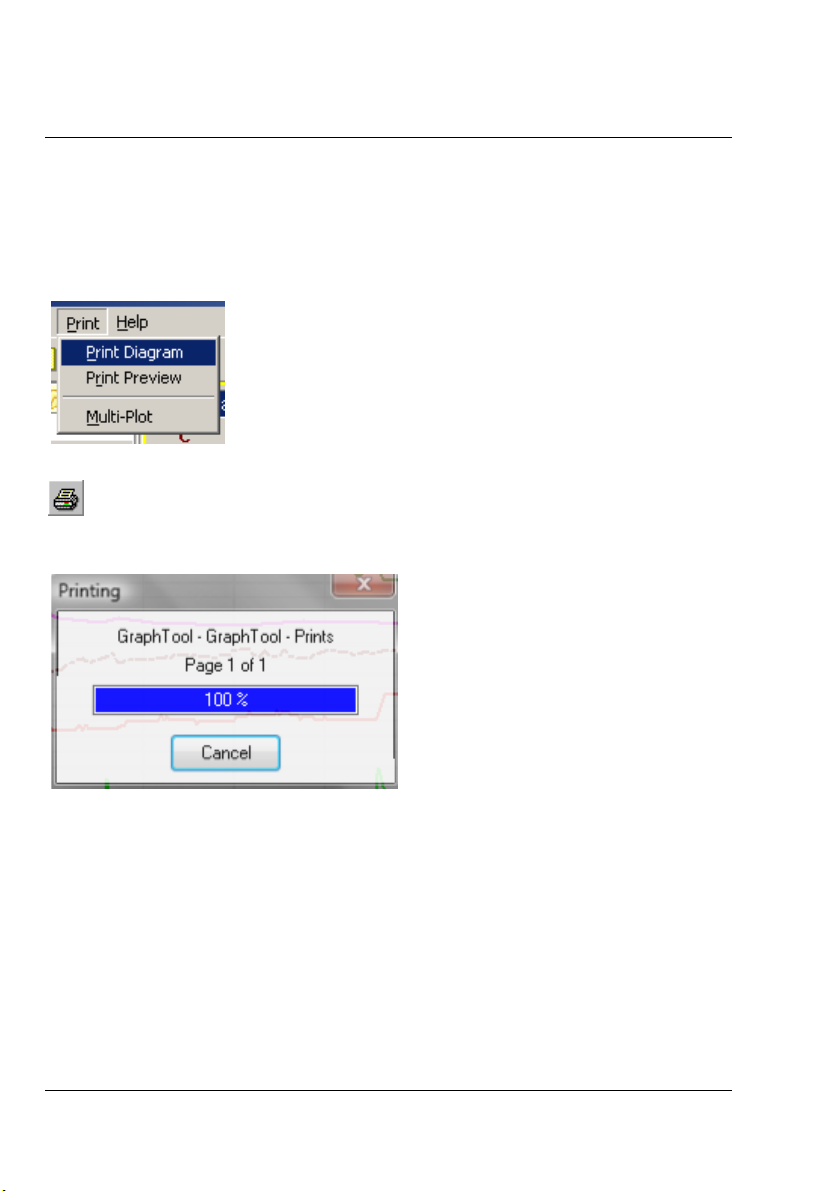
Select in main menu Print the command Print Diagram, t o directly print your diagrams. The
page preview will not be shown anymore.
Print your Y/t- or X/Y-diagrams directly without printer setup and page preview.
During printing, the box on the left appears. You may canc el printing here.
31437 V1 OmegaView Plus
Page 58 Operating Manual
Page 65
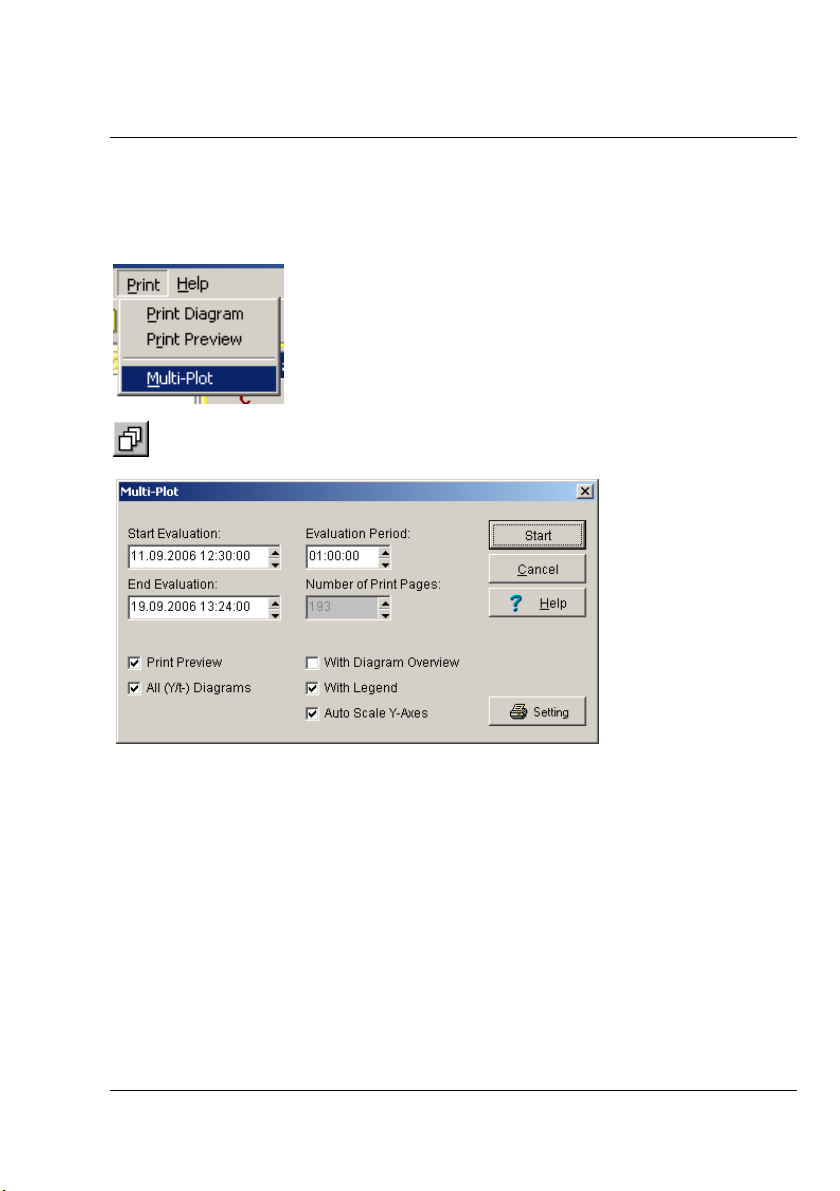
Multi-Plot (Standard)
The function Multi-Plot is available only for active Y/t-diagram. It allows to print your
measurement data in several cons ecutive pages. Select in main menu Print the command
Multi-Plot, to print your measurement data in s everal c onsecutive pages.
Activates the function Multi-Plot from the toolbar.
Enter the Start and End Time of the measuring data to be printed. With th e Evaluatio n Time
you may determine the interval between two consecutive measurement values. The number of
pages to be printed will be automatically calculated by the program. Set your printer if necessary
and select from the following options for your printouts
· Page preview
· Print all Y/t-diagrams
· Print with overview diagram
· Print with legend
· Automatic scaling of the Y-axes
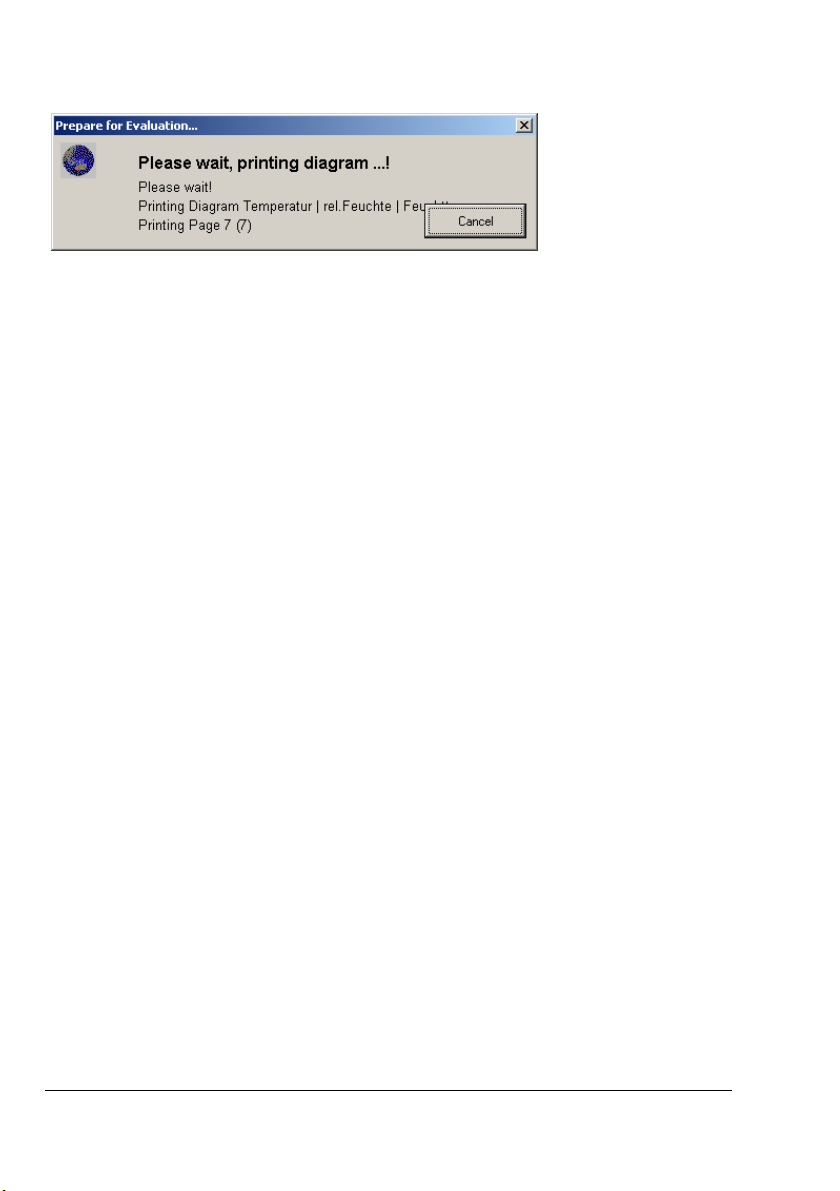
After confirming your entries this notic e appears during printing. You may canc el here your
printing job.
OmegaView Plus 31437 V1
Operating Manual Page 59
Page 66
31437 V1 OmegaView Plus
Page 60 Operating Manual
Page 67
Print Measuring Data List
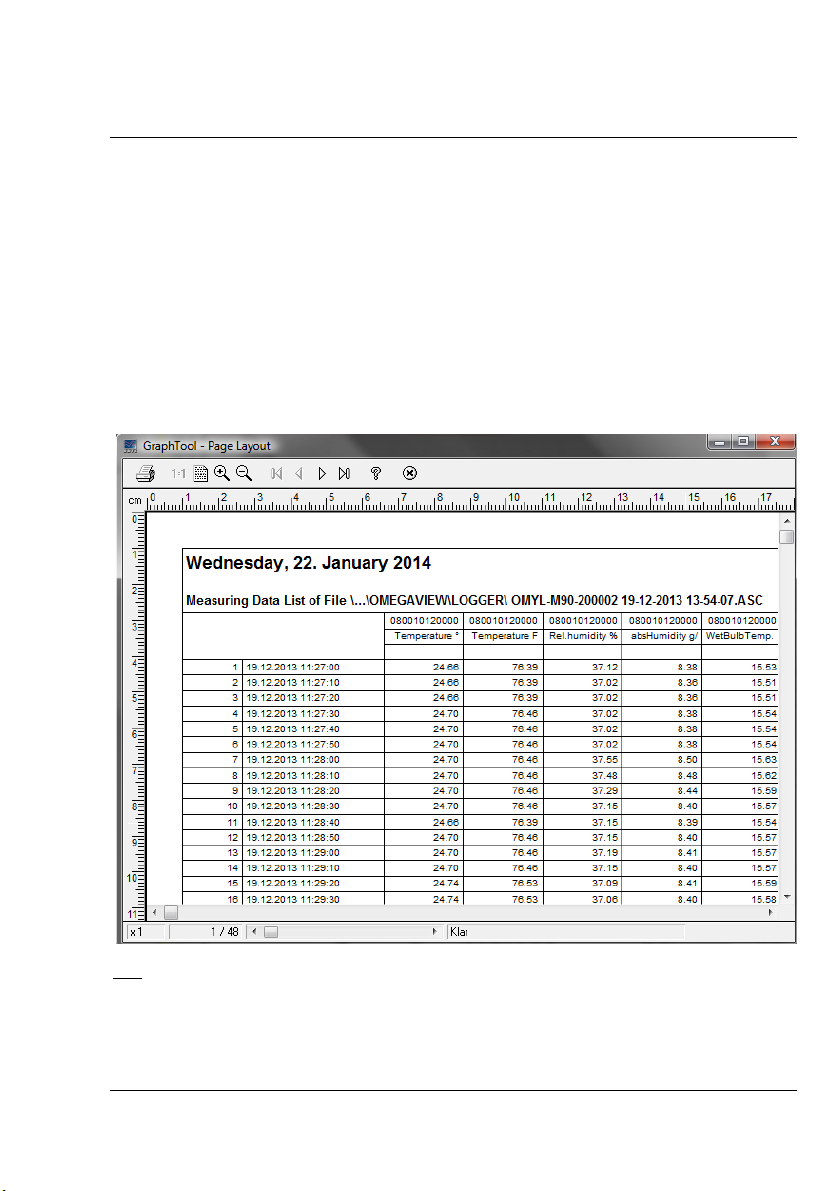
Select in the main menu Diagrams the menu item Global Measuring Value List and press
here the b utton Print Table. The preview of the measuring data list appears on the screen. You
may print fr om here your measuring data list.
To print a loc al measuring data list, proceed as follows:
· Create a Diagram and assign your desired measurement channels.
· Activate the Local Menu by clicking the right mouse button.
· Select here the command Measuring Data List
· Press the button Print Table
The program goes to the page preview. From here you may print your measuring data list.
Hint
: You may print your data from a Y/t-diagram independent of the exact measuring time. In
case the option relative time axis is activated, the diagram shows the chosen values starting
from 00:00:00 hours. The date is no longer active.
OmegaView Plus 31437 V1
Operating Manual Page 61
Page 68
Exporting Measuring Data
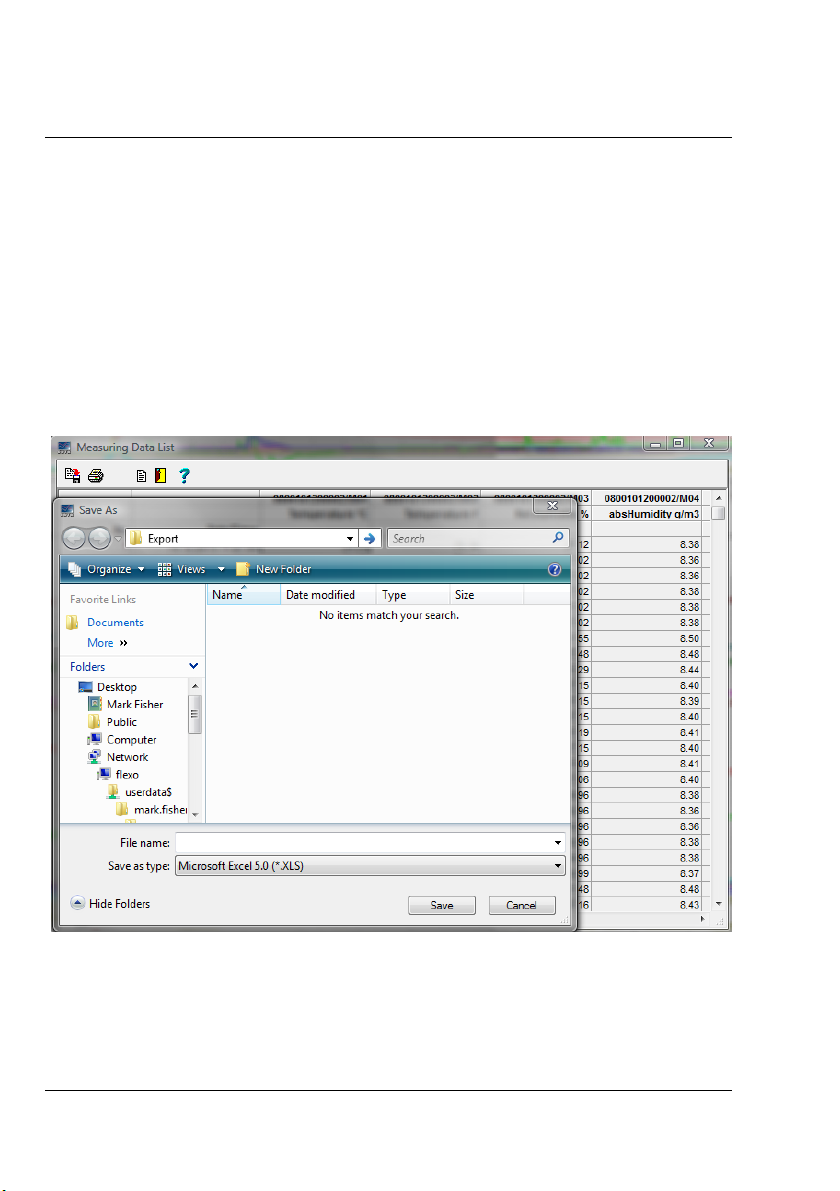
Select in the main menu Diagrams the menu item Global Measuring Value List and press the
button Export Data .A dialog box with formula selection will be open. From here you may then
export your measuring data list
To export a local measuring data list in EXCEL- or ASCII-Format proceed as follows:
· Create a Diagr am and assign your desired measurement channels
· Activate the Local Menu by clicking the right mouse button
· Select here the command Measuring Data List
· Press the button Export Data
· Choose a File Name
· Choose a Data Format
31437 V1 OmegaView Plus
Page 62 Operating Manual
Page 69
The Files
File Types
All document processing is carried out in main menu File. The Software OmegaView software
can open ASCII formatted files, which are created by OMYL series dat a loggers.
The file extension must be .ASC.
The layout for the ASCII files is determined through specifications from Omega. As separation
character, the semic olon or the tabulator character are allowed, and will be recognized
automatically by the software:
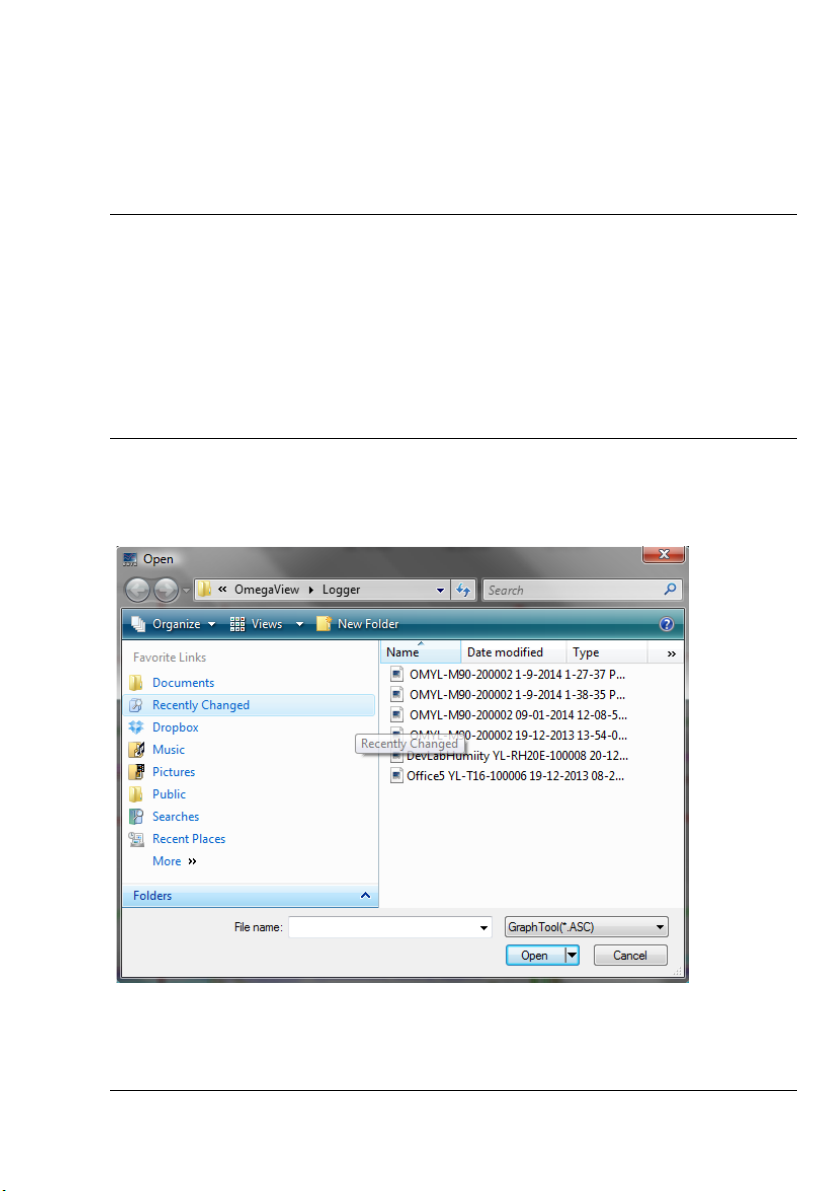
Open Measurement Files
Select in the main menu File the command Open, to open your measurement data and its
corresponding c onfigurations.
Enter in the text box, dri ve, pat h and name of the file to be opened.
Enter the dri ve, the path and the name within the dialog. The chosen file will then be imported
and the data will be represented in a Y/t-Graph.
OmegaView Plus 31437 V1
Operating Manual Page 63
Page 70

Join Several Measurement Data Files
With this function you may join together s everal measurement data files to one file. For
example, files from two cons ecutive days with the same measur ement setup. You may however
also join any other files together; configuration data from the files t o be added will not be applied
to the current file.
How to join files:
1. First open the file, where the new data are to be added.
2. Select in the main menu File the c ommand Join File.
3. Mark out and open the file(s) to be added and confirm to join files.
Same devic es will be recognized by the entry “Logger serial number” within the ASCII file. Files
from the same logger will be joined; the new data will be sorted in to the exis ting channel.
Duplicated data, recognized by the same timestamp, will be ignored.
For new channels, a new Y/t-Graph will be created and d isplayed.
Note
: Transferring of data may take some time depending on data size. Please wait .... .
31437 V1 OmegaView Plus
Page 64 Operating Manual
Page 71

WARRANTY/DISCLAIMER
OMEGA ENGINEERING, INC. warrants this unit to be free of defects in materials and
workmanship for a period of 13 months from date of purchase. OMEGA’s WARRANTY adds
an additional one (1) month grace period to the normal one (1) year product warranty to
cover handling and shipping time. This ensures that OMEGA’s customers receive maximum
coverage on each product.
If the unit malfunctions, it must be returned to the factory for evaluation. OMEGA’s Customer
Service Department will issue an Authorized Return (AR) number immediately upon phone
or written request. Upon examination by OMEGA, if the unit is found to be defective, it
will be repaired or replaced at no charge. OMEGA’s WARRANTY does not apply to defects
resulting from any action of the purchaser, including but not limited to mishandling, improper
interfacing, operation outside of design limits, improper repair, or unauthorized modification.
This WARRANTY is VOID if the unit shows evidence of having been tampered with or shows
evidence of having been damaged as a result of excessive corrosion; or current, heat, moisture
or vibration; improper specification; misapplication; misuse or other operating conditions
outside of OMEGA’s control. Components in which wear is not warranted, include but are not
limited to contact points, fuses, and triacs.
OMEGA is pleased to offer suggestions on the use of its various products. However,
OMEGA neither assumes responsibility for any omissions or errors nor assumes
liability for any damages that result from the use of its products in accordance
with information provided by OMEGA, either verbal or written. OMEGA warrants
only that the parts manufactured by the company will be as specified and free of
defects. OMEGA MAKES NO OTHER WARRANTIES OR REPRESENTATIONS OF ANY
KIND WHATSOEVER, EXPRESSED OR IMPLIED, EXCEPT THAT OF TITLE, AND ALL
IMPLIED WARRANTIES INCLUDING ANY WARRANTY OF MERCHANTABILITY AND
FITNESS FOR A PARTICULAR PURPOSE ARE HEREBY DISCLAIMED. LIMITATION
OF LIABILITY: The remedies of purchaser set forth herein are exclusive, and the
total liability of OMEGA with respect to this order, whether based on contract,
warranty, negligence, indemnification, strict liability or otherwise, shall not exceed
the purchase price of the component upon which liability is based. In no event shall
OMEGA be liable for consequential, incidental or special damages.
CONDITIONS: Equipment sold by OMEGA is not intended to be used, nor shall it be used: (1)
as a “Basic Component” under 10 CFR 21 (NRC), used in or with any nuclear installation or
activity; or (2) in medical applications or used on humans. Should any Product(s) be used in or
with any nuclear installation or activity, medical application, used on humans, or misused in
any way, OMEGA assumes no responsibility as set forth in our basic WARRANTY / DISCLAIMER
language, and, additionally, purchaser will indemnify OMEGA and hold OMEGA harmless from
any liability or damage whatsoever arising out of the use of the Product(s) in such a manner.
Direct all warranty and repair requests/inquiries to the OMEGA Customer Service Department.
RETURN REQUESTS/INQUIRIES
BEFORE RETURNING ANY PRODUCT(S) TO OMEGA, PURCHASER MUST OBTAIN AN
AUTHORIZED RETURN (AR) NUMBER FROM OMEGA’S CUSTOMER SERVICE DEPARTMENT
(IN ORDER TO AVOID PROCESSING DELAYS). The assigned AR number should then be
marked on the outside of the return package and on any correspondence.
The purchaser is responsible for shipping charges, freight, insurance and proper packaging to
prevent breakage in transit.
FOR WARRANTY RETURNS, please have
the following information available BEFORE
contacting OMEGA:
1. Purchase Order number under which
the product was PURCHASED,
2. Model and serial number of the product
under warranty, and
3. Repair instructions and/or specific
problems relative to the product.
OMEGA’s policy is to make running changes, not model changes, whenever an improvement is possible.
This affords our customers the latest in technology and engineering.
OMEGA is a registered trademark of OMEGA ENGINEERING, INC.
© Copyright 2014 OMEGA ENGINEERING, INC. All rights reserved. This document may not be copied, photocopied,
reproduced, translated, or reduced to any electronic medium or machine-readable form, in whole or in part, without
the prior written consent of OMEGA ENGINEERING, INC.
FOR NON-WARRANTY REPAIRS,
consult
OMEGA for current repair charges. Have the
following information available BEFORE
contacting OMEGA:
1. Purchase Order number to cover the
COST of the repair,
2. Model and serial number of theproduct, and
3. Repair instructions and/or specific problems
relative to the product.
Page 72

Where Do I Find Everything I Need for
Process Measurement and Control?
OMEGA…Of Course!
Shop online at omega.com
TEMPERATURE
MU
Thermocouple, RTD & Thermistor Probes, Connectors, Panels & Assemblies
MU
Wire: Thermocouple, RTD & Thermistor
MU
Calibrators & Ice Point References
MU
Recorders, Controllers & Process Monitors
MU
Infrared Pyrometers
PRESSURE, STRAIN AND FORCE
MU
Transducers & Strain Gages
MU
Load Cells & Pressure Gages
MU
Displacement Transducers
MU
Instrumentation & Accessories
FLOW/LEVEL
MU
Rotameters, Gas Mass Flowmeters & Flow Computers
MU
Air Velocity Indicators
MU
Turbine/Paddlewheel Systems
MU
Totalizers & Batch Controllers
pH/CONDUCTIVITY
MU
pH Electrodes, Testers & Accessories
MU
Benchtop/Laboratory Meters
MU
Controllers, Calibrators, Simulators & Pumps
MU
Industrial pH & Conductivity Equipment
SM
DATA ACQUISITION
MU
Data Acquisition & Engineering Software
MU
Communications-Based Acquisition Systems
MU
Plug-in Cards for Apple, IBM & Compatibles
MU
Data Logging Systems
MU
Recorders, Printers & Plotters
HEATERS
MU
Heating Cable
MU
Cartridge & Strip Heaters
MU
Immersion & Band Heaters
MU
Flexible Heaters
MU
Laboratory Heaters
ENVIRONMENTAL
MONITORING AND CONTROL
MU
Metering & Control Instrumentation
MU
Refractometers
MU
Pumps & Tubing
MU
Air, Soil & Water Monitors
MU
Industrial Water & Wastewater Treatment
MU
pH, Conductivity & Dissolved Oxygen Instruments
M5382/0114
 Loading...