

Page 1
omega.com
e-mail: [email protected]
For latest product manuals:
omegamanual.info
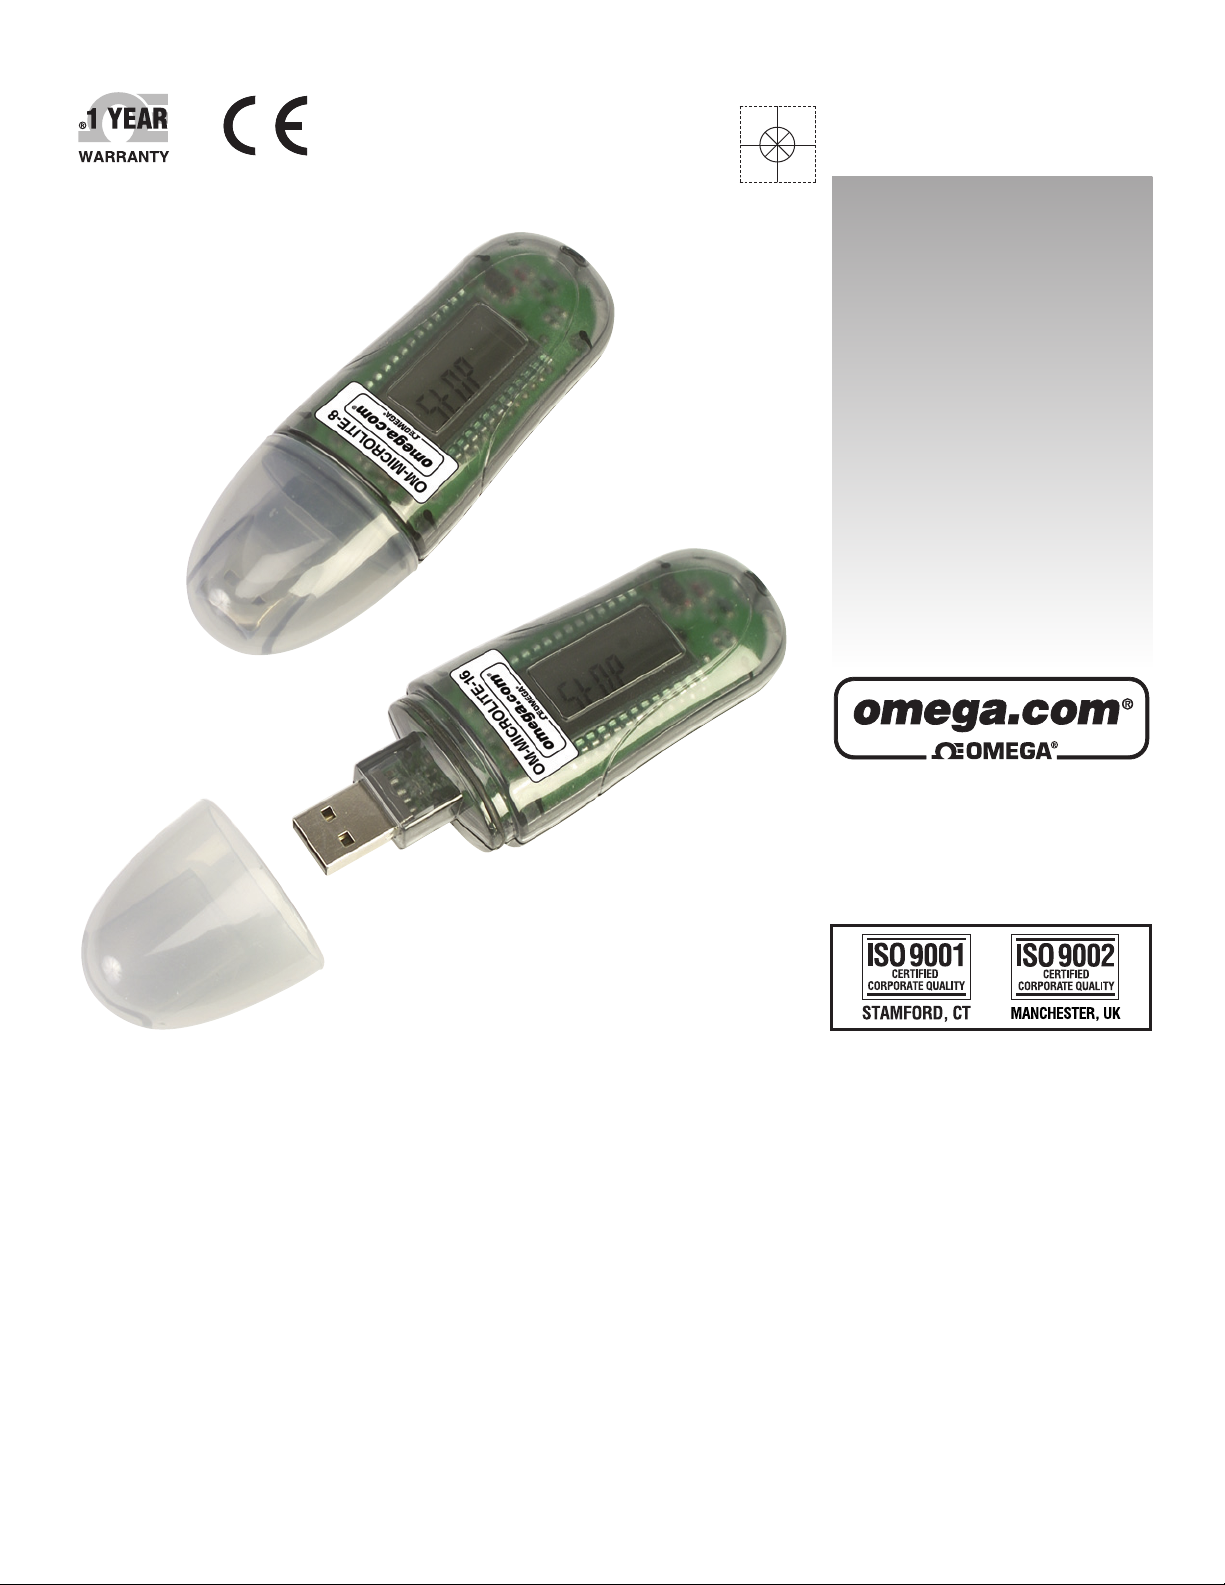
OM-MICROLITE-8 AND OM-
MICROLITE-16 DATA LOGGERS
AND OM-MICROLAB
And DatPass Administration Software
Includes Validation Manual
For compliance with the United States Food and Drug Administration
Title 21 Code of Federal Regulations Part 11 and with GAMP 4
Shop online at
User’s Guide
Page 2

Servicing North America:
U.S.A.: One Omega Drive, P.O. Box 4047
ISO 9001 Certified Stamford, CT 06907-0047
TEL: (203) 359-1660
FAX: (203) 359-7700
e-mail: [email protected]
Canada: 976 Bergar
Laval (Quebec) H7L 5A1, Canada
TEL: (514) 856-6928
FAX: (514) 856-6886
e-mail: [email protected]
For immediate technical or application assistance:
U.S.A. and Canada: Sales Service: 1-800-826-6342/1-800-TC-OMEGA
®
Customer Service: 1-800-622-2378/1-800-622-BEST
®
Engineering Service: 1-800-872-9436/1-800-USA-WHEN
®
Mexico: En Espan˜ ol: (001) 203-359-7803
e-mail: [email protected]
FAX: (001) 203-359-7807
[email protected]
Servicing Europe:
Czech Republic: Frystatska 184, 733 01 Karviná, Czech Republic
TEL: +420 (0)59 6311899
FAX: +420 (0)59 6311114
Toll Free: 0800-1-66342
e-mail: [email protected]
Germany/Austria: Daimlerstrasse 26, D-75392 Deckenpfronn, Germany
TEL: +49 (0)7056 9398-0
FAX: +49 (0)7056 9398-29
Toll Free in Germany: 0800 639 7678
e-mail: [email protected]
United Kingdom: One Omega Drive, River Bend Technology Centre
ISO 9002 Certified Northbank, Irlam, Manchester
M44 5BD United Kingdom
TEL: +44 (0)161 777 6611
FAX: +44 (0)161 777 6622
Toll Free in United Kingdom: 0800-488-488
e-mail: [email protected]
OMEGAnet®Online Service Internet e-mail
omega.com [email protected]
It is the policy of OMEGA Engineering, Inc. to comply with all worldwide safety and EMC/EMI
regulations that apply. OMEGA is constantly pursuing certification of its products to the European New
Approach Directives. OMEGA will add the CE mark to every appropriate device upon certification.
The information contained in this document is believed to be correct, but OMEGA accepts no liability for any
errors it contains, and reserves the right to alter specifications without notice.
WARNING: These products are not designed for use in, and should not be used for, human applications.
Page 3

MicroLab and DatPass
Administration Software
For use with MicroLite Data Logger
Includes Validation Manual
For compliance with the
United States Food and Drug Administration
Title 21 Code of Federal Regulations Part 11
and with GAMP 4
First Edition
December 2008
Copyright © Omega Engineering Inc. 2008
- 1 -
Page 4

Contents
Chapter 1: Introduction................................................................................................ 4
Chapter 2: What is Title 21 CFR Part 11?................................................................... 5
Title 21 CFR Part 11 Definitions.............................................................................. 5
Omega's Software ................................................................................................... 5
Chapter 3: Compliance with Title 21 CFR Part 11 ...................................................... 6
References ............................................................................................................ 11
Chapter 4: DatPass Validation Tests ........................................................................ 12
1 - Initial Login ....................................................................................................... 12
2 - File Menu.......................................................................................................... 12
3 - Administration................................................................................................... 15
4 - Help.................................................................................................................. 18
5 - Toolbar Icons.................................................................................................... 18
Chapter 5: MicroLab Validation Tests....................................................................... 19
1 - Login................................................................................................................. 19
2 - File Menu.......................................................................................................... 19
3 - View Menu........................................................................................................ 21
4 - Graph Menu ..................................................................................................... 22
5 - Logger Menu .................................................................................................... 24
6 - Help Menu ........................................................................................................ 27
7 – Main Toolbar Icons.......................................................................................... 27
8 - Graph Toolbar Icons......................................................................................... 29
Chapter 6: MicroLite User Guide............................................................................... 30
Introduction............................................................................................................ 30
Using the MicroLite................................................................................................ 30
Getting Started ...................................................................................................... 30
Reading the MicroLite Display............................................................................... 30
Data Displays ........................................................................................................ 31
MicroLite Working Modes ...................................................................................... 32
USB Port Connection ............................................................................................ 32
The MicroLite Battery ............................................................................................ 33
Battery Level.......................................................................................................... 33
- 2 -
Page 5

Replacing the Battery ............................................................................................ 33
Using the MicroLite Magnet................................................................................... 34
Chapter 7: DatPass User Guide................................................................................ 35
Introduction............................................................................................................ 35
Installing DatPass.................................................................................................. 35
First Time Running DatPass.................................................................................. 35
Login to DatPass ................................................................................................... 36
User Administration ............................................................................................... 38
Group Administration............................................................................................. 41
Audit Trail .............................................................................................................. 44
Moving the Current Database................................................................................ 45
Chapter 8: MicroLab User Guide .............................................................................. 47
MicroLab Software Overview................................................................................. 47
Software Installation .............................................................................................. 47
Getting Started ...................................................................................................... 49
MicroLab Basics .................................................................................................... 54
Viewing the Data ................................................................................................... 55
Analysis Tools ....................................................................................................... 59
Toolbar Buttons ..................................................................................................... 61
Specifications ........................................................................................................ 63
- 3 -
Page 6

Chapter 1: Introduction
This manual will guide you through the process of validating the DatPass and MicroLab
software package to GMP 4 and FDA Title 21 CFR Part 11 guidelines. This manual will
provide users with a test plan for their own performance and operational qualification of
DatPass and MicroLab, together with the MicroLite data logger.
This document is comprised of the following main sections:
• Overview of FDA Title 21 CFR Part 11 and the implementation of these sections in
the Omega software package.
• Necessary validation test sheets for DatPass and MicroLab.
• User guide for using the DatPass software.
• User guide for using the MicroLite data logger.
• User guide for using the MicroLab software.
It is important to understand that the implementation of the CFR guidelines is not the
sole responsibility of Omega Engineering. The software user must undertake a large
portion of the responsibility through the appropriate validation tests.
The software package consists of two programs:
• DatPass –MicroLab administration application
• MicroLab – Data acquisition and analysis application
To validate the software package, start by testing DatPass, followed by MicroLab.
Some of these tests assume that the user is familiar with the Windows interface in
addition to the DatPass and MicroLab software.
- 4 -
Page 7

Chapter 2: What is Title 21 CFR Part 11?
The Food and Drug Administration (FDA) issued the regulations Title 21 Code of Federal
Regulations Part 11. These regulations provide criteria for acceptance by FDA, under certain
circumstances, of electronic records, electronic signatures, and handwritten signatures executed
to electronic records as equivalent to paper records and handwritten signatures executed on
paper. The regulations apply to all FDA program areas, and are intended to permit the widest
possible use of electronic technology, compatible with FDA’s responsibility to promote and protect
public health. Part 11 applies to any record governed by an existing FDA predicate rule that is
created, modified, maintained, archived, retrieved, or transmitted using computers and/or saved
on durable storage media.
Title 21 CFR Part 11 Definitions
Electronic Record
Any combination of text, graphics, data, audio, pictorial or other information representation in
digital form, that is created, modified, maintained, archived, retrieved or distributed by a computer
system.
Electronic Signature
A computer data compilation of any symbol or series of symbols, executed, adopted or authorized
by an individual to be the legally binding equivalent of the individual’s handwritten signature.
Digital Signature
An electronic signature based upon cryptographic methods of originator authentication, computed
by using a set of rules and a set of parameters such that the identity of the signer and the integrity
of the data can be verified.
Closed System
An environment in which system access is controlled by persons who are responsible for the
content of electronic records that is on the system.
Open System
An environment in which system access is not controlled by persons who are responsible for the
content of electronic records that is on the system.
Standard Operating Procedures (SOPs)
Guidelines and rules defined by the organization implementing Title 21 CFR Part 11 compliance
to instruct users what they are and are not permitted to do and how they are to perform the
relevant tasks.
Omega's Software
The dual program software package achieves compliance with FDA Title 21 CFR Part 11 with:
MicroLab and DatPass. The DatPass software is the administration software, which includes
features that define the users that can log into the MicroLab software, their passwords and the
digital signatures the users are permitted to sign data within electronic records (files). The
MicroLab software is used to access the electronic records, display the logger data, analyze the
data and allow the user to add the appropriate digital signatures to the electronic records, in
addition to other features. An additional security feature is the USB port dongle, without which the
MicroLab and DatPass software packages will not operate.
- 5 -
Page 8

Chapter 3: Compliance with Title 21 CFR Part 11
Title 21 CFR Part 11 Requirements Comments on Compliance or Requirements
§11.10 Controls for Closed Systems
(a) Validation of systems to ensure
accuracy, reliability, consistent
intended performance, and the
ability to discern invalid or altered
records.
(b) The ability to generate accurate
and complete copies of records in
both human readable and
electronic form suitable for
inspection, review, and copying
by the agency.
(c) Protection of records to enable
their accurate and ready retrieval
throughout the records retention
period.
(d) Limiting system access to
authorized individuals.
(e) Use of secure, computer-
generated, time- stamped audit
trails to independently record the
date and time of operator entries
and actions that create, modify, or
delete electronic records. Record
changes shall not obscure
previously recorded information.
Such audit trail documentation
shall be retained for a period at
least as long as that required for
the subject electronic records and
shall be available for agency
review and copying.
(f) Use of operational system checks
to enforce permitted sequencing
of steps and events, as
appropriate
Yes MicroLab will not open invalid or
altered data.
Yes To ensure data integrity, MicroLab
stores data with specific formats (mlb
and mpj). Data can be exported to
Excel™ and stored in common
formats, such as an Excel workbook
or for example comma delimited or
tab delimited. Only through the (mlb)
and (mpj) formats can data be read
back into MicroLab and only these
formats support electronic signatures.
N/A The customer chooses which data
directory to save files to. Otherwise,
the default directory C:\Program
Files\Omega\MicroLab for
DatPass\MicroLab Data is used.
System owners must establish their
own SOPs to protect and restore data
files.
Yes For limited access, the customer must
purchase a valid software license and
dongle device, preventing access to
unauthorized users.
Yes Every action that generates or alters
an electronic record (mlb or mpj),
automatically generates an entry into
an encrypted log file, which can be
used in audit trail. The entries are
chronologically organized and cannot
be edited or deleted. The entries can
only be viewed using the DatPass
software. It is the system owner's
responsibility to create SOPs to
protect and restore audit trail files.
Yes A smart and user friendly interface
ensures all MicroLab operations
follow a specified order. This ensures
all stages are followed.
- 6 -
Page 9

Title 21 CFR Part 11 Requirements Comments on Compliance or Requirements
(g) Use of authority checks to ensure
that only authorized individuals
can use the system, electronically
sign a record, access the
operation or computer system
input or output device, alter a
record, or perform the operation
at hand.
(h) Use of device (e.g. terminal)
checks to determine, as
appropriate, the validity of the
source of data input or
operational instruction.
(i) Determination that persons who
develop, maintain, or use
electronic record/electronic
signature systems has the
education, training, and
experience to perform their
assigned tasks.
(j) The establishment of, and
adherence to, written policies that
hold individuals accountable and
responsible for actions initiated
under their electronic signatures,
in order to deter record and
signature falsification.
(k) Use of appropriate controls over
systems documentation including:
(k)(1) Adequate controls over the
distribution of, access to, and use
of documentation for system
operation and maintenance.
(k)(2) Revision and change control
procedures to maintain an audit
trail that documents timesequenced development and
modification of systems
documentation.
Yes When using MicroLab, users logon
with a valid username and password.
Further security is ensured by a USB
dongle having to be connected to the
workstation. All actions are recorded
in an encrypted audit trial log file.
Yes MicroLab checks the status of the
logger at each communication –
errors are automatically reported.
N/A System owners must provide their
authorized users with relevant
training.
N/A System owners must develop written
policy in which reliability and
responsibility of each user is
documented.
N/A The MicroLab and DatPass Package
for Title 21 CFR Part 11 compliance
are supplied with detailed user guides
and help files, which can be used to
create SOP. Distribution, access and
implementation of this documentation
are the responsibility of the system
owner.
N/A This is the responsibility of the system
owner.
§11.30 Controls for Open Systems
- 7 -
Page 10
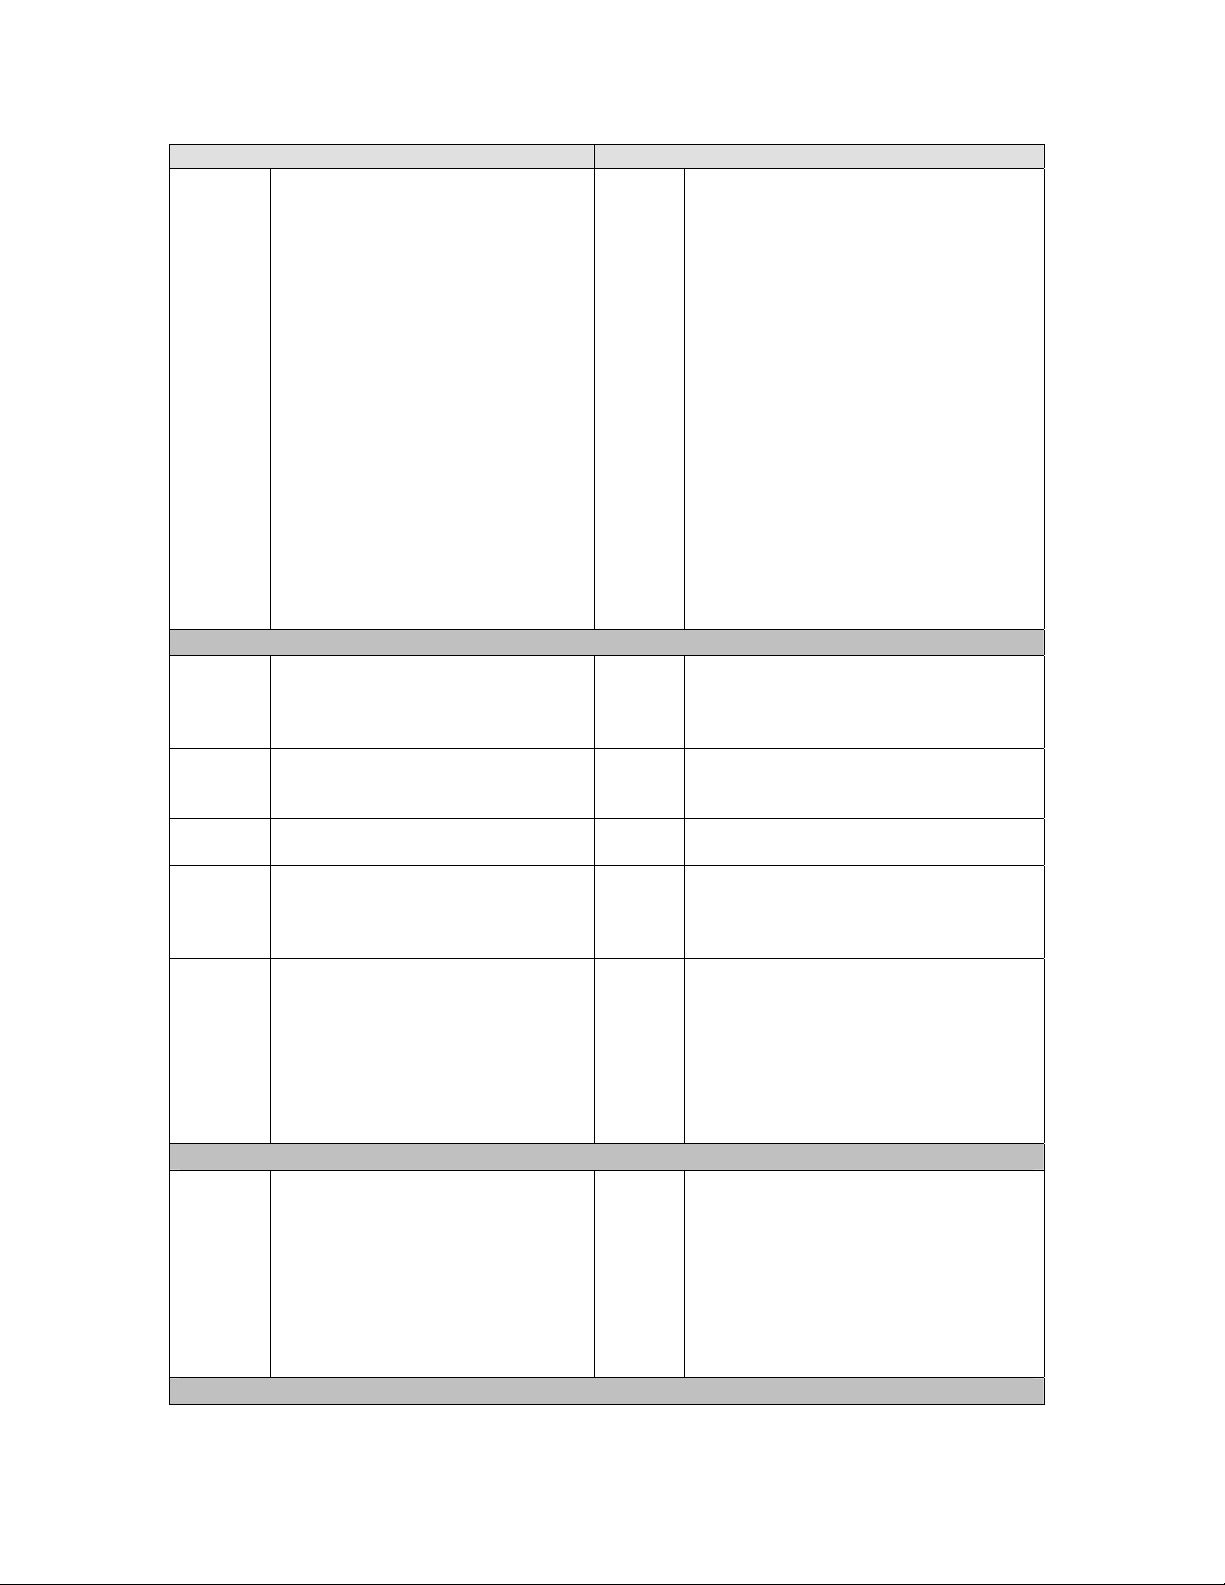
Title 21 CFR Part 11 Requirements Comments on Compliance or Requirements
Persons who use open systems
to create, modify, maintain, or
transmit electronic records shall
employ procedures and controls
designed to ensure the
authenticity, integrity, and, as
appropriate, the confidentiality of
electronic records from the point
of their creation to the point of
their receipt. Such procedures
and controls shall include those
identified in §11.10, as
appropriate, and additional
measures such as document
encryption and use of appropriate
digital signature standards to
ensure, as necessary under the
circumstances, record
authenticity, integrity, and
confidentiality.
N/A MicroLab has been implemented as a
closed system.
§11.50 Signature Manifestations
(a) Signed electronic records shall
contain information associated
with the signing that clearly
indicates all of the following:
(a)(1) The printed name of the signer; Yes Stored and printed data contains:
(a)(2) The date and time when the
signature was executed;
(a)(3) The meaning (such as review,
approval, responsibility, or
authorship) associated with the
signature
(b) The items identified in paragraphs
(a)(1),(a)(2), and (a)(3)of this
section shall be subject to the
same controls as for electronic
records and shall be included as
part of any human readable form
of the electronic record (such as
electronic display or printout).
User login name, time/date stamp,
and user signature meaning(s).
Yes
Yes
Yes Electronic signatures in MicroLab are
subject to the same requirements as
electronic records. Electronic
signatures can be viewed
electronically and can be included on
a printout.
§11.70 Signature/Record Linking
Electronic signatures and
handwritten signatures executed
to electronic records shall be
linked to their respective
electronic records to ensure that
the signatures cannot be excised,
copied or otherwise transferred so
as to falsify an electronic record
by ordinary means.
Yes In MicroLab, raw data and electronic
signatures are permanently linked in a
single file, and as such cannot be
edited, deleted or separated.
§11.100 General Requirements
- 8 -
Page 11
Title 21 CFR Part 11 Requirements Comments on Compliance or Requirements
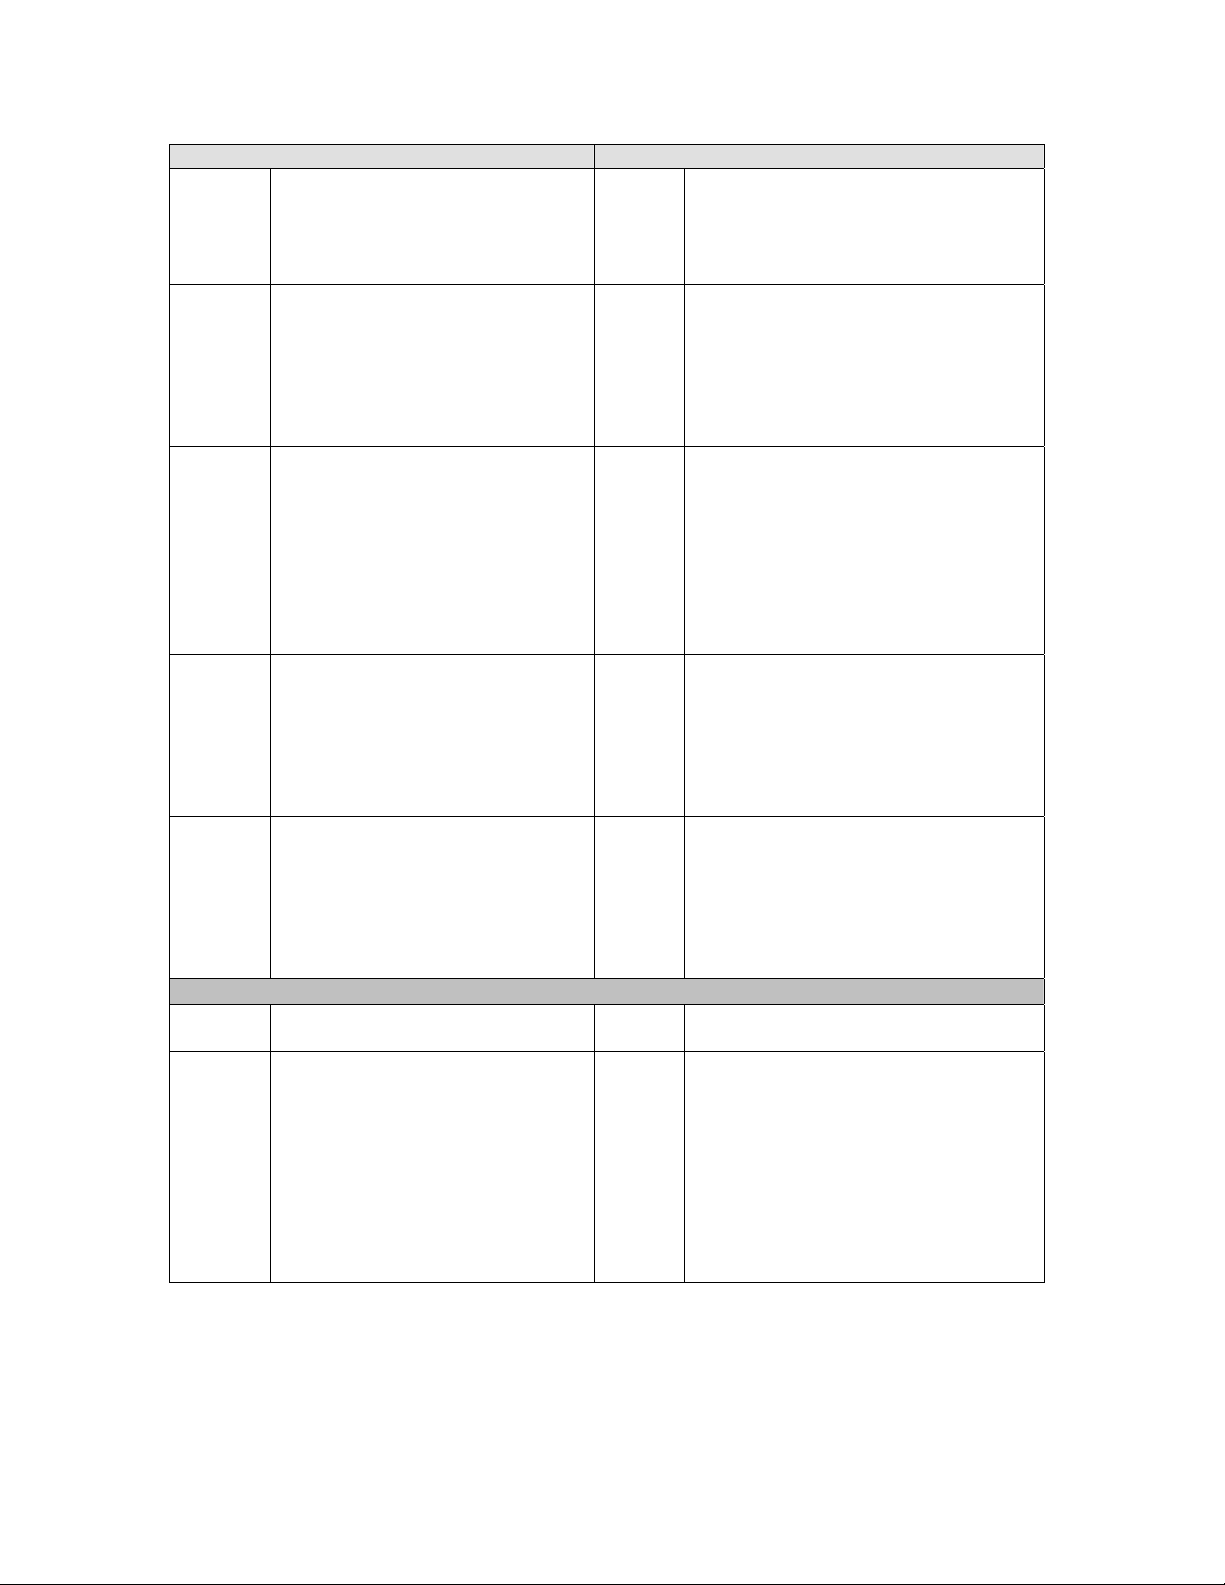
(a) Each electronic signature shall be
unique to one individual and shall
not be reused by, or reassigned
to, anyone else.
(b) Before an organization
establishes, assigns, certifies or
otherwise sanctions an
individual's electronic signature,
or any element of such electronic
signature, the organization shall
verify the identity of the individual.
(c) Persons using electronic
signatures shall, prior to or at the
time of such use, certify to the
agency that the electronic
signatures in their system, used
on or after August 20, 1997, are
intended to be the legally binding
equivalent of traditional
handwritten signatures.
(c)(1) The certification shall be
submitted in paper form, and
signed with a traditional
handwritten signature, to the
Office of Regional Operations
(HFC-100),5600 Fishers Lane,
Rockville, MD 20857.
(c)(2) Persons using electronic
signatures shall, upon agency
request, provide additional
certification or testimony that a
specific electronic signature is the
legally binding equivalent of the
signer's handwritten signature.
Yes DatPass software contains an
authorized user list containing login
name, password, and meanings list,
making every user unique to the
system.
N/A This is the responsibility of the system
owner.
N/A This is the responsibility of the system
owner.
N/A This is the responsibility of the system
owner.
N/A This is the responsibility of the system
owner.
§11.200 Electronic Signature Components and Controls
(a) Electronic signatures that are not
based upon biometrics shall:
(a)(1) Employ at least two distinct
identification components such as
an identification code and
password.
Yes DatPass Software for Title 21 CFR
Part 11 compliance uses a unique
dual component combination: Login
username and password. Every login
and new digital signature with
MicroLab requires a valid username
and password. MicroLab enforces the
user to re-logon after a time period,
which is defined by the administrator
via the DatPass software.
- 9 -
Page 12
Title 21 CFR Part 11 Requirements Comments on Compliance or Requirements
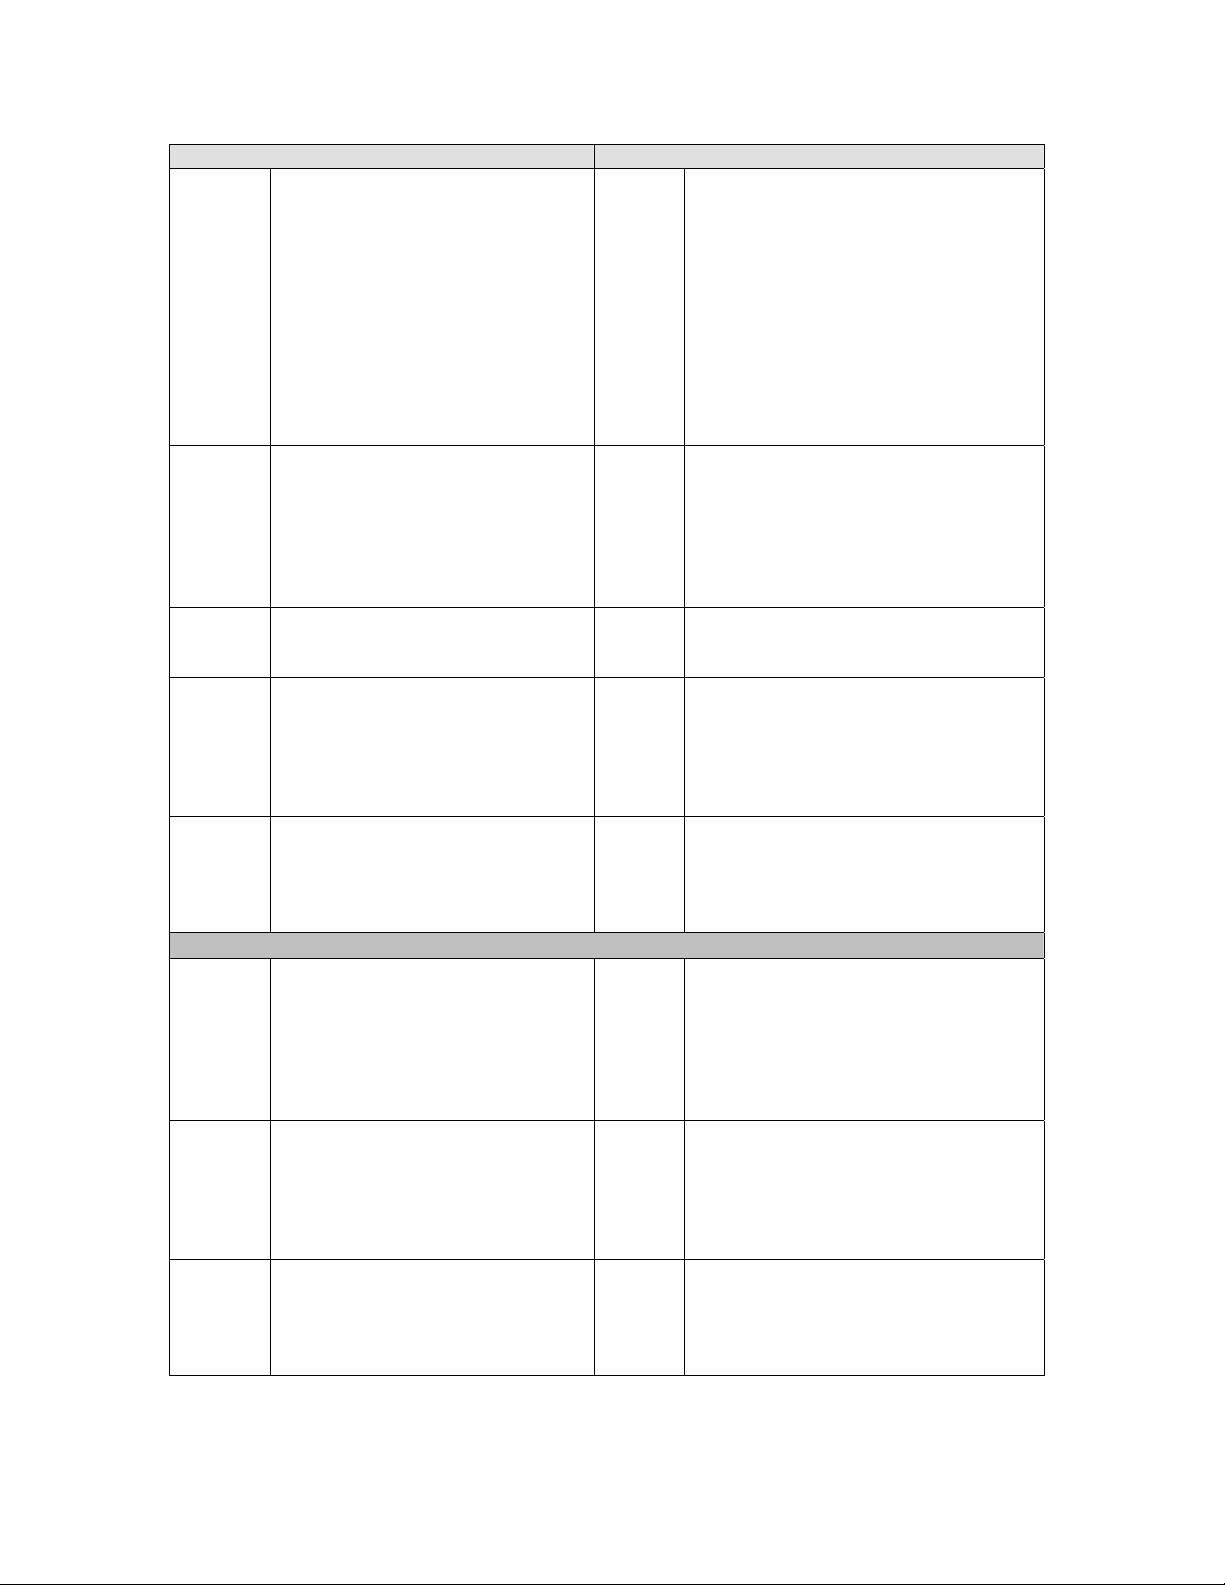
(a)(1)(i) When an individual executes a
series of signings during a single,
continuous period of controlled
system access, the first signing
shall be executed using all
electronic signature components;
subsequent signings shall be
executed using at least one
electronic signature component
that is only executable by, and
designed to be used only by, the
individual
(a)(1)(ii) When an individual executes one
or more signings not performed
during a single continuous period
of controlled system access, each
signing shall be executed using
all of the electronic signature
components.
(a)(2) Be used only by their genuine
owners;
(a)(3) Be administered and executed to
ensure that attempted use of an
individual's electronic signature
by anyone other than its genuine
owner requires collaboration of
two or more individuals.
(b) Electronic signatures based upon
biometrics shall be designed to
ensure that they cannot be used
by anyone other than their
genuine owners.
Yes
Yes
N/A Information confidentiality is the
responsibility of the system owner
and users.
N/A Information confidentiality is the
responsibility of the system owner
and users.
N/A Biometrics are not the basis of
electronic signatures generated by
DatPass software for Title 21 CFR
Part 11 compliance.
§11.300 Controls for Identification Codes/Passwords
Persons who use electronic
signatures based upon use of
identification codes in
combination with passwords shall
employ controls to ensure their
security and integrity. Such
controls shall include:
(a) Maintaining the uniqueness of
each combined identification code
and password, such that no two
individuals have the same
combination of identification code
and password.
(b) Ensuring that identification code
and password issuances are
periodically checked, recalled, or
revised, (e.g. to cover such
events as password aging).
Yes Since every user is unique in the
MicroLab and DatPass systems,
duplicate combinations of username
and password are impossible.
Yes Adequate aging of passwords is the
responsibility of the system owner.
MicroLab allows authenticated users
to change their own logon password.
- 10 -
Page 13

Title 21 CFR Part 11 Requirements Comments on Compliance or Requirements
(c) Following loss management
procedures to electronically
deauthorize lost, stolen, missing,
or otherwise potentially
compromised tokens, cards, and
other devices that bear or
generate identification code or
password information, and to
issue temporary or permanent
replacements using suitable,
rigorous controls.
(d) Use of transaction safeguards to
prevent unauthorized use of
passwords and/or identification
codes, and to detect and report in
an immediate and urgent manner
any attempts at their
unauthorized use to the system
security unit, and, as appropriate,
to organizational management.
(e) Initial and periodic testing of
devices, such as tokens or cards,
that bear or generate
identification code or password
information, to ensure that they
function properly and have not
been altered in an unauthorized
manner.
N/A Unauthorized access is vetoed by the
DatPass software since an
administrator can disable or remove
any user from the system.
Yes All unsuccessful logons are recorded
in the audit trail log file.
N/A This is the responsibility of the system
owner.
References
For further information on FDA Title 21 CFR Part 11, please visit the FDA website:
www.fda.gov
For FDA guidance documents:
www.fda.gov/ora/compliance_ref/part11/
- 11 -
Page 14

Chapter 4: DatPass Validation Tests
1 - Initial Login
Ensure that the DatPass security plug is connected to your computer’s USB port.
Note: After installation, the first user to login to the DatPass software is automatically
assigned the user name Admin. He is classified as an administrator.
Test # Test Description Expected Result Result
1.1
1.2
1.3
Double click the DatPass
icon on the Desktop.
Click New User in the login
window.
a. Populate the New User
ID, Confirm User ID,
New Password and
Confirm Password fields,
and click OK.
b. Exit the DatPass
software.
c. Launch the DatPass
software.
Verify that the User Login dialog box
opens.
a. Verify that the New User Login
window opens.
b. Verify that the New User drop-
down menu displays the Admin
user name.
a. Once DatPass is launched,
verify that the User Login
window opens.
b. Verify that the newly created
User ID and User Password are
correct (click OK and verify
successful login to DatPass).
2 - File Menu
Test #
2.1
2.2
2.3
Test Description Expected Result Result
On the File menu, click
Open.
Navigate to:
My
Documents\Omega\DatPass.
Note: You will only find files
saved in this directory if
data, such as the Audit Trail
log, has been previously
saved.
On the File menu, click New. Verify that the DatPass main
On the File menu, click
Print.
Note: For this action to
succeed, the main DatPass
window must be populated
a. Verify that the Open
dialog box opens.
b. Select a file to open, and
click Open.
c. Verify that the file opens,
and the table data is
displayed in the main
DatPass window.
window is clear i.e. there is no Audit
Trail log data.
Verify that the Print Dialog dialog
box opens.
- 12 -
Page 15
Test #
2.4
2.4.1
2.4.2
2.4.3
2.4.4
2.4.5
2.4.6
2.4.7
2.5
Test Description Expected Result Result
with Audit Trail log data.
On the File menu, click Print
Preview.
a. In the Print Preview
dialog box, click Print.
b. In the Print Dialog dialog
box, using the From and
To drop-down menus,
choose the time period to
be printed.
c. Select the page
orientation, either Portrait
or Landscape.
d. Click OK.
e. In the Print dialog box,
ensure that the correct
printer is selected in the
Name field and click OK.
In the Print Preview dialog
box, click Next Page.
Note: This button is only
active if the data has more
than one page.
In the Print Preview dialog
box, click Prev Page.
Note: This button is only
active if the data has more
than one page.
In the Print Preview dialog
box, click Two Page.
Note: This button is only
active if the data has more
than one page.
In the Print Preview dialog
box, click Zoom In.
In the Print Preview dialog
box, click Zoom Out.
In the Print Preview dialog
box, click Close.
On the File menu, click Print
Setup.
Verify that the Print Preview dialog
box opens, and the file you chose to
print is displayed.
Verify that the data is printed at the
selected printer and fits the time
range chosen and desired page
orientation.
Verify that the next page of data is
displayed.
Verify that the previous page of data
is displayed.
a. Verify that the data is displayed
on two pages.
b. Verify that the Two Page button
is now inactive and the One
Page button appears next to it.
Verify that the data displayed on the
screen now appears larger (has
zoomed in).
Verify that the data displayed on the
screen has now returned to the
previous (normal) size (has zoomed
out).
a. Verify that the Print Preview
dialog box closes.
b. Verify that you have now
returned to the main DatPass
window.
Verify that the Print Setup dialog
box opens.
- 13 -
Page 16

Test #
2.6
Test Description Expected Result Result
On the File menu, click Log
off.
Verify that the User Login dialog box
opens.
- 14 -
Page 17

3 - Administration
Test #
3.1
3.1.1
3.1.2
Test Description Expected Result Result
On the Administration
menu, click User
Administration.
a. In the User
Administration dialog
box, click Add User.
b. Enter a new user name
in the User Name field.
c. Select a Group from the
Group drop-down menu:
Administrator, Approver,
or User.
Under the Login Settings
heading:
d. Enter a number in the
Password min length
field (for example, 4).
e. Enter a number in the
User ID min length field
(for example, 4).
f. Enter number of days in
the Password expiration
time (days) field (for
example, 1).
g. Use the drop-down
menu in the Inactivity
Timeout field to select
the duration (for
example, 00:05:00).
h. Click OK.
a. Launch the DatPass
software and add click
New User.
b. Using the new user
account created in test
3.1.1, fill in the New User
ID, Confirm New User
ID, New Password and
Confirm Password fields.
c. Click OK.
a. Verify that the User
Administration dialog box opens.
b. Verify that Admin appears under
the User Name tab and
Administrator appears under the
Group tab.
Verify that a new user has been
added to the User Administration
dialog box, listing the correct User
Name and Group.
Verify that the DatPass software
opens.
- 15 -
Page 18
Test #
3.1.3
3.2
3.2.1
3.2.2
3.3
3.3.1
3.3.2
Test Description Expected Result Result
Launch the DatPass
software. In the User Login
dialog box:
a. Enter an incorrect user
name and a correct
password.
b. Enter a correct user
name and an incorrect
password.
c. Enter an incorrect user
name and password.
In the User Administration
dialog box, select the newly
added user (see test 3.1.1)
and click Properties.
a. In the User Properties
dialog box, change the
user group using the
drop-down menu in the
Group field. For
example, from User to
Approver).
b. Click OK.
a. In the User Properties
dialog box, change the
Login Settings.
b. Click OK.
In the User Administration
dialog box, select a user and
click Deactivate.
Open the DatPass software
and attempt to login with the
user name and password of
the newly deactivated user.
a. In the User
Administration dialog
box, select the
previously deactivated
user and click Activate.
b. Exit DatPass, then
reopen DatPass and
login with the user name
and password of the
newly activated user.
Verify that in all three login tests, the
DatPass software does not open.
a. Verify that the User Properties
dialog box opens.
b. Verify that the properties entered
when adding the user (in test
3.1.1) are correct.
Verify that the user group was
successfully changed by reopening
the User Properties dialog box and
checking the Group field.
Verify that the Login Settings were
successfully changed by reopening
the User Properties dialog box and
checking the relevant Login
Settings.
Verify that the user icon is now
marked with a white cross in a red
background, as follows:
Verify that a dialog box opens with
the message:
Your user account was deactivated.
Please refer to your system
administrator.
Verify that you are able to
successfully login to DatPass.
- 16 -
Page 19
Test #
3.3.3
3.3.4
3.3.5
3.4
3.4.1
3.4.2
3.4.3
3.4.4
3.4.5
Test Description Expected Result Result
a. In the User
Administration dialog
box, select a user and
click Renew Password.
b. Exit DatPass, and then
reopen DatPass and
attempt to login with that
user.
a. In the Change Password
dialog box, enter a new
password and then
confirm this password.
b. Click OK.
Launch the DatPass
software and login using the
user name and new
password created in step
3.3.4.
On the Administration
menu, click Group
Administration.
In the Group Administrator
dialog box, click Add Group.
a. In the Group Properties
dialog box, enter a new
name in the Group
Name field.
b. Click the New check box.
c. Click OK.
In the Group Administrator
dialog box, select the newly
created group and click
Properties.
In the Group Administrator
dialog box, select one of the
listed groups and click
Remove Group.
Note: You will not be able to
remove a group if there are
still users who are members
of this group.
On the Administration
menu, click Group
Administration.
a. Verify that a new DatPass dialog
box opens with the message:
Your password was reset.
Please enter a new password.
b. After clicking OK, verify that a
new Change Password dialog
box opens.
Verify that the DatPass software
opens.
Verify that the DatPass software
opens.
a. Verify that the Group
Administration dialog box opens.
b. Verify that the group names
User, Approver and
Administrator are displayed.
Verify that the Group Properties
dialog box opens.
a. Verify that the Group
Administration dialog box opens.
b. Verify that the newly created
group is displayed in the Group
Name list.
Verify that there is only one check
box selected (in this case, New).
a. Verify that a dialog box opens
with the message:
Are you sure you want to
remove <Group Name> group?
b. Click Yes.
Verify that the group you have
removed is no longer displayed in
the Group Name list.
- 17 -
Page 20
4 - Help
Test #
4.1
Test Description Expected Result Result
On the Help menu, click
About DatPass.
5 - Toolbar Icons
Test #
5.1
5.2
5.3
Open
Print
User Administration
a. Verify that the About DatPass
dialog box opens.
b. Verify that the DatPass version
number and copyright are
displayed.
c. Verify the link
http://www.omega.com/
Icon Test and Expected Result Result
Refer to test 2.1.
Refer to test 2.3.
Refer to tests 3.1 to 3.3.
works.
5.4
5.5
5.6
Group Administration
Refresh
Calendar
Refer to test 3.4.
a. Wait several minutes (for users
to perform actions) and click
Refresh.
b. Verify that the Audit Trail data
has been refreshed (you will see
new actions added to the table).
Use the drop-down menu to open
the calendar and select a date.
Verify that the data from this date is
displayed on your screen.
Note: Only those dates with
recorded data will be displayed.
- 18 -
Page 21
Chapter 5: MicroLab Validation Tests
1 - Login
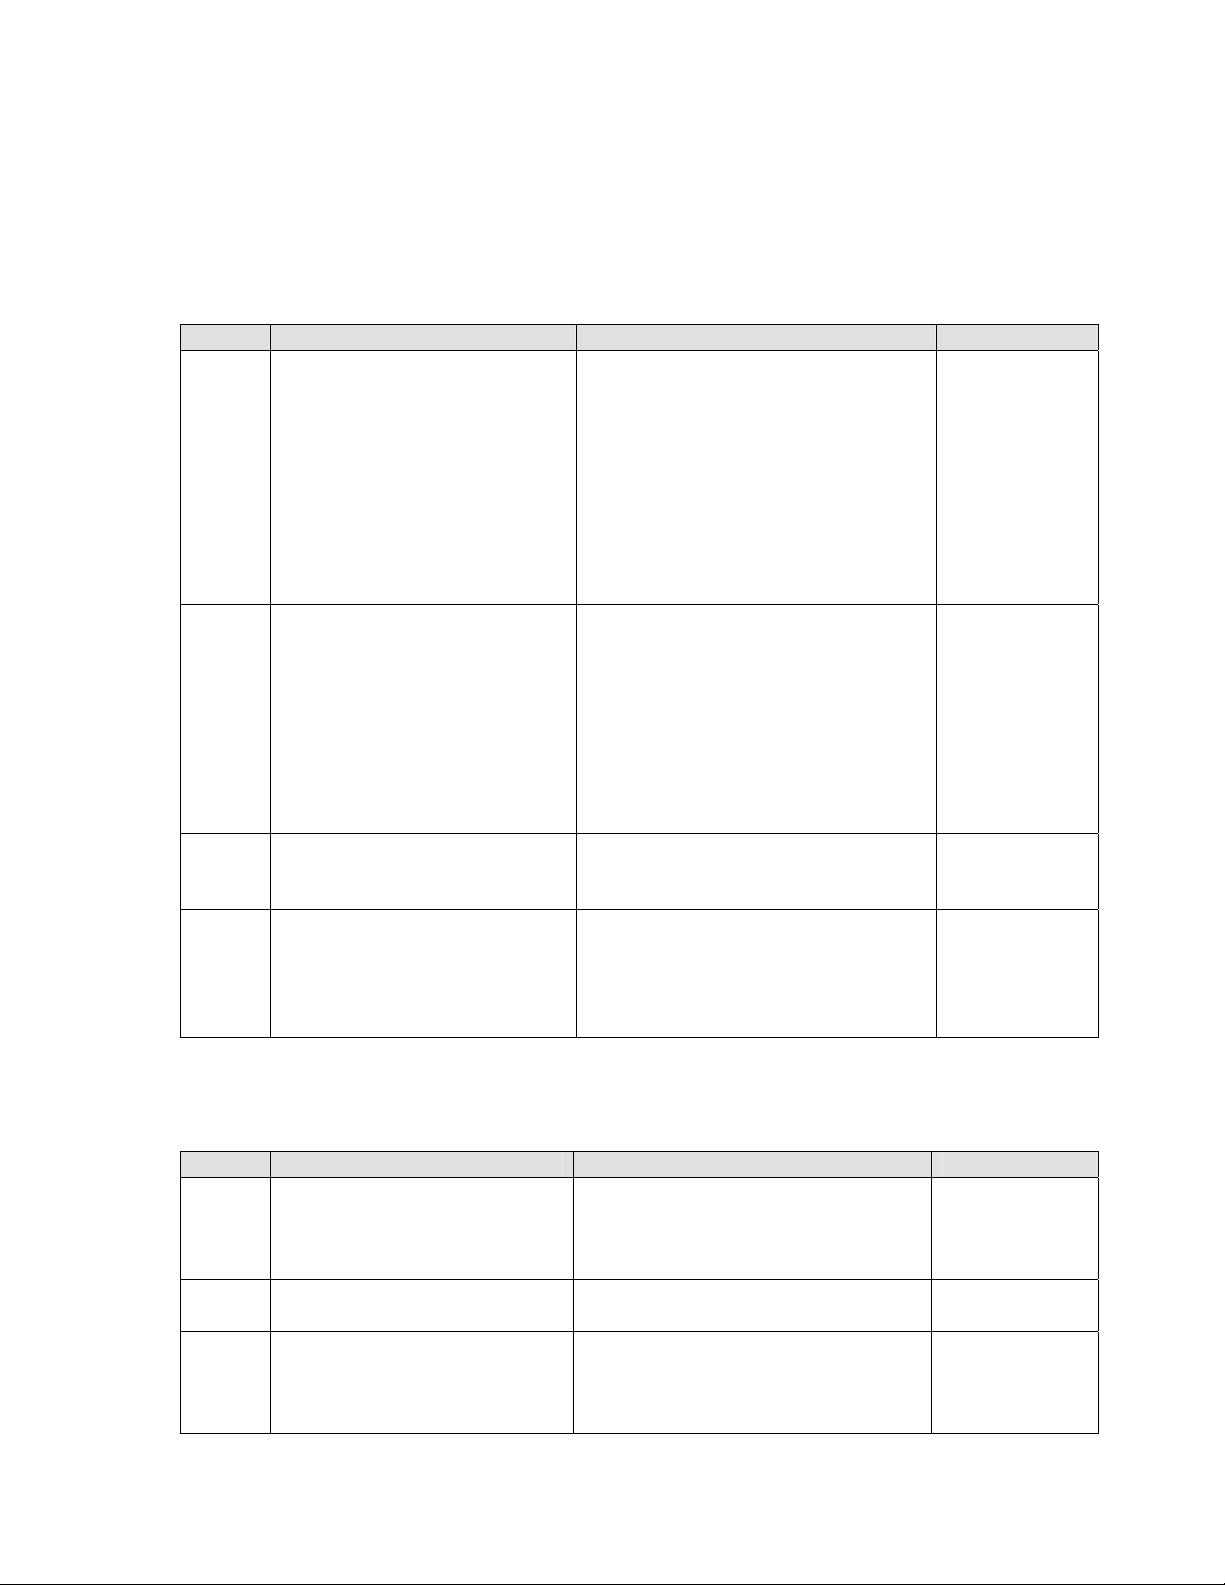
Test # Test Description Expected Result Result
Verify that the MicroLab software
does not open and an Incorrect
Password message window
opens.
Verify that the MicroLab software
does not open and an Incorrect
User ID message window opens.
Verify that the MicroLab software
does not open and an Incorrect
User ID message window opens.
Verify that the MicroLab software
is launched.
1.1
1.2
1.3
1.4
a. Launch the MicroLab
software. The User Login
dialog box opens.
b. In the User ID field, enter
the User ID created in
test 1.3 of the DatPass
Validation Test.
c. In the User Password
field, enter an incorrect
password.
a. In the User Login dialog
box, in the User ID field,
enter an incorrect User
ID.
b. In the User Password
field, enter the User
Password created in test
1.3 of the DatPass
Validation Test.
In the User Login dialog box,
enter an incorrect User ID
and User Password.
In the User Login dialog box,
login using the User ID and
User Password created in
test 1.3 of the DatPass
Validation Test.
2 - File Menu
Test # Test Description Expected Result Result
2.1
2.2
2.2.1
- 19 -
On the File menu, click
New.
On the File menu, click
Open.
In the Open dialog box,
select a file and click Open.
Verify that the MicroLab main
window is clear i.e. there is no
data in the graph and table in the
main window.
Verify that the Open dialog box
opens.
Verify that the selected file opens,
and that the appropriate data is
displayed in the graph and table in
the main window.
Page 22
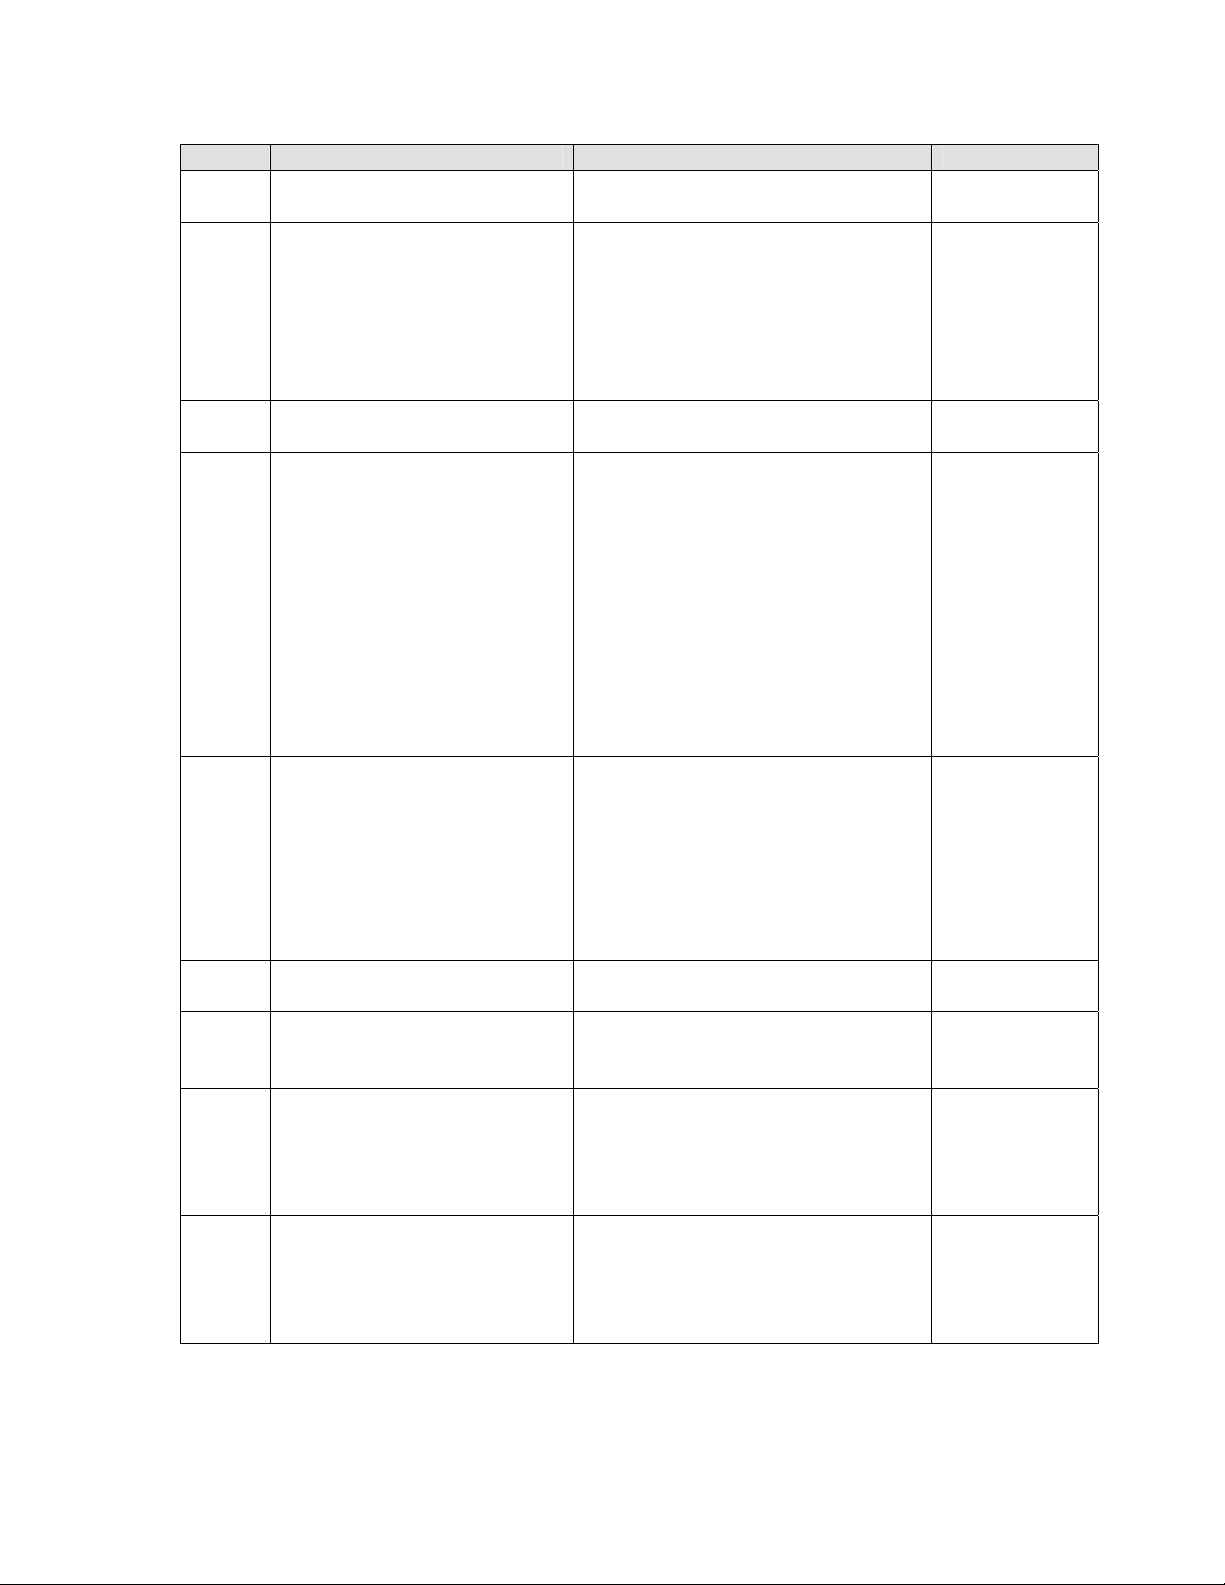
Test # Test Description Expected Result Result
2.3
2.3.1
2.4
2.4.1
2.4.2
2.5.
2.5.1
2.5.2
2.5.2.1
On the File menu, click
Save As.
a. In the Save As dialog
box, in the File name
field, enter the name of
the file to be saved.
b. Click Save.
On the File menu, click
Display Properties.
Under the Decimal place
settings heading in the
Display Properties dialog
box:
a. Change the
Temperature data field
to 3.
b. Change the Humidity
data field to 2.
c. Change the External
data field to 1.
d. Click OK.
In the Display properties
dialog box, under the Date
format settings heading are
four options for the date
format.
Click on any one of the
formats not already
selected.
On the File menu, click
Print.
In the Print options dialog
box, click the Graph radio
button.
In the Print options dialog
box:
a. Click the Graph radio
button.
b. Click Print.
In the Print dialog box,
confirm that the correct
printer is selected in the
Name drop-down menu and
click OK.
Verify that the Save As dialog box
opens.
a. Verify that the file was actually
saved. Navigate to:
C:\Programs
Files\Omega\MicroLab\MicroL
ab Data.
b. Verify that the file was saved
in the MicroLab folder.
Verify that the Display properties
dialog box opens.
Verify that in the data table in the
main MicroLab window, the
decimal places for the
temperature and humidity data
(and any external sensors) have
been updated accordingly.
a. Verify that for the graph in the
main MicroLab window, the
Time (x) axis has been
updated accordingly.
b. Verify that for the data table in
the main MicroLab window,
the Time (Date) column has
been updated accordingly.
Verify that the Print options dialog
box opens.
Verify that the Report data
selection option is disabled.
Verify that the Print dialog box
opens.
Verify that the graph was printed
at the selected printer.
- 20 -
Page 23
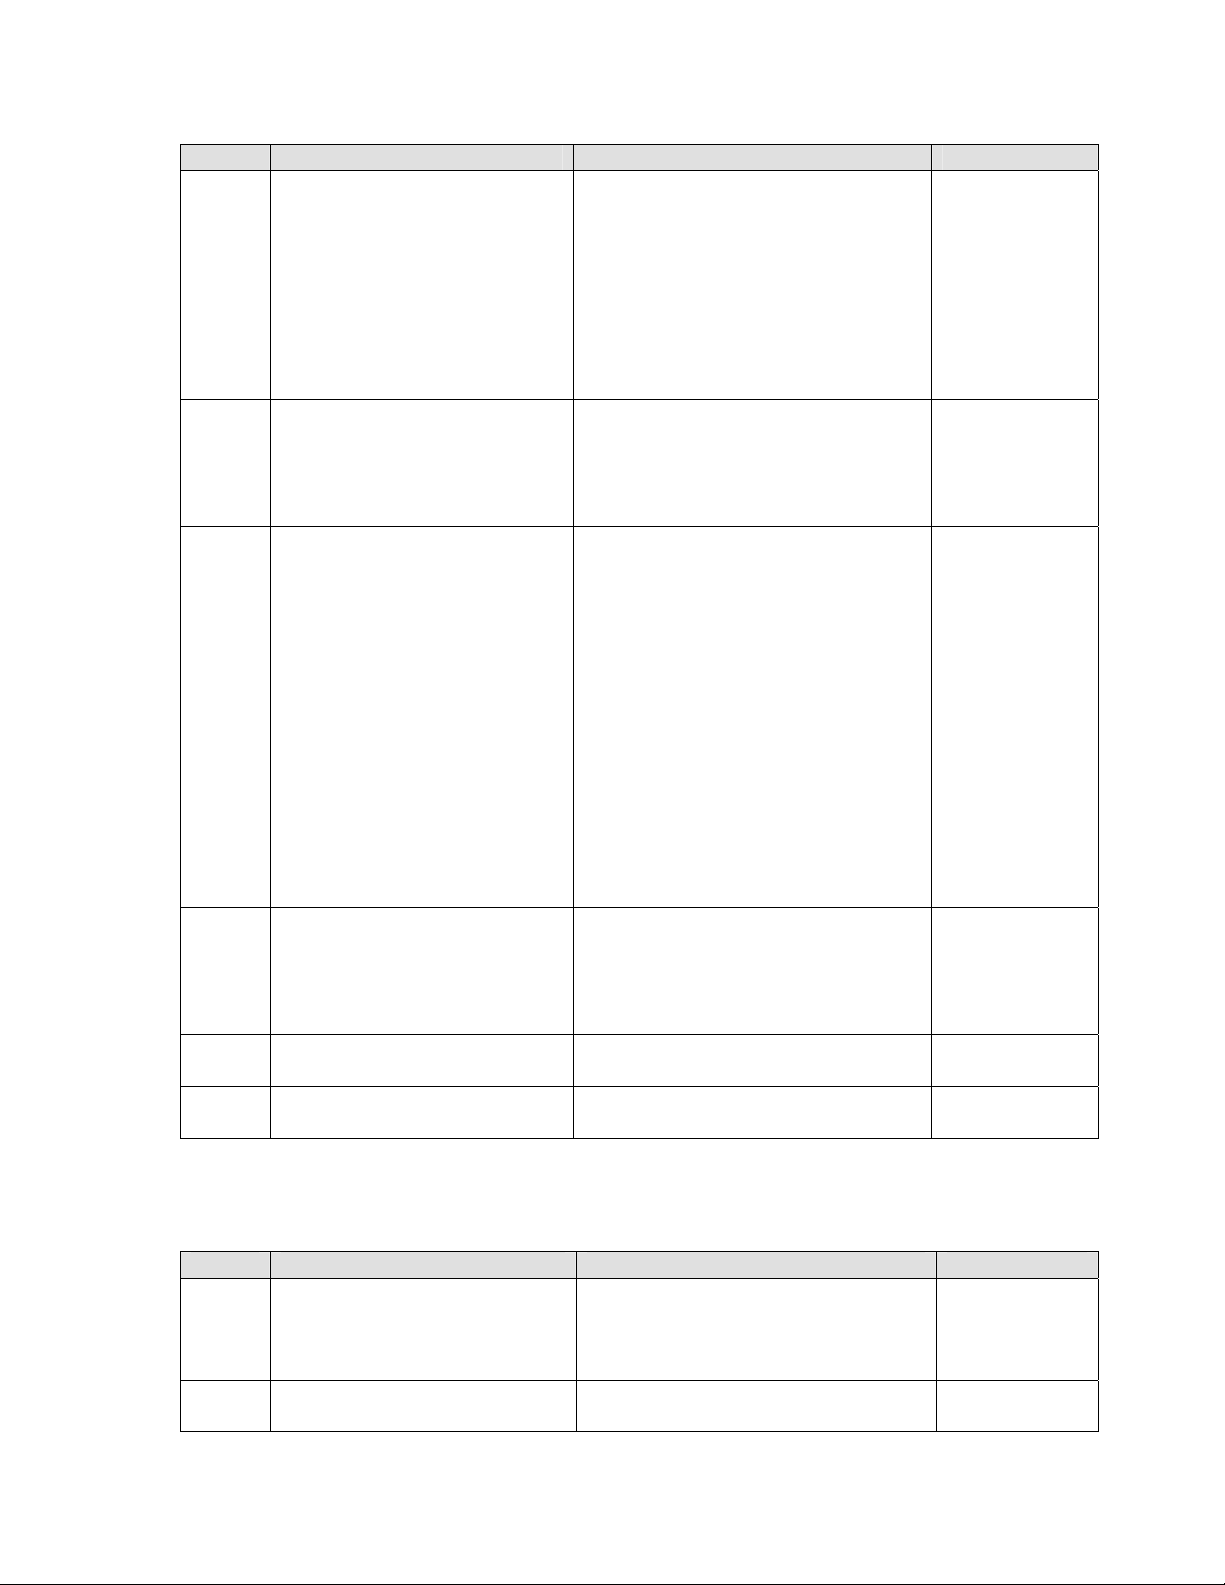
Test # Test Description Expected Result Result
2.5.3
2.5.3.1
2.5.4
2.5.4.1
2.6
2.7
In the Print options dialog
box:
a. Click the Table radio
button.
b. Under the Report data
selection heading,
ensure the Print all data
check box is selected.
c. Click Print.
In the Print dialog box,
confirm that the correct
printer is selected in the
Name drop-down menu and
click OK.
In the Print options dialog
box:
a. Click the Table radio
button.
b. Under the Report data
selection heading,
ensure the Print all data
check box is not
selected, thereby
enabling the From and
To fields.
c. Using the From and To
fields, define the date
and time range to print.
d. Click Print.
In the Print dialog box,
confirm that the correct
printer is selected in the
Name drop-down menu and
click OK.
On the File menu, click
Print Setup.
On the File menu, click Log
Off.
Verify that the Print dialog box
opens.
Verify that the graph was printed
with all of its data (as defined in
test 2.5.3), at the selected printer.
Verify that the Print dialog box
opens.
Verify that the graph was printed
with the specific date and time
range (as defined in test 2.5.4), at
the selected printer.
Verify that the Print Setup dialog
box opens.
Verify that the User Login dialog
box opens.
3 - View Menu
Test # Test Description Expected Result Result
3.1
3.2
- 21 -
On the View menu, click
Display Data map to
unselect it (removing the tick
by the menu entry).
On the View menu, click
Display Graph to unselect it
Verify that the Data Map pane has
been removed from the left of the
main MicroLab window.
Verify that the graph has been
removed from the center of the
Page 24

3.3
(removing the tick by the
menu entry).
On the View menu, click
Display Table to unselect it
(removing the tick by the
menu entry).
main MicroLab window.
Verify that the table has been
removed from the right of the main
MicroLab window.
4 - Graph Menu
Note: In order to perform the tests in this section, a graph must be displayed in the main
MicroLab window. Refer to test 2.2 regarding opening a file.
Test # Test Description Expected Result Result
4.1
4.1.1
a. On the Graph menu,
click Graph Properties.
b. Ensure that Time is
selected in the Select
axis drop down menu.
c. Ensure the Auto scale
check box is not
selected, thereby
enabling the From and
To fields.
d. Using the From and To
fields, define a new date
and time range.
e. Click OK.
a. In the Graph properties
dialog box, click Set
default zoom.
b. In the Default zoom
setting dialog box, enter
a time range in the Start
and End fields.
c. Click Set.
d. Click the Use default
zoom check box.
e. Click OK.
Verify that the time scale of the
graph in the main MicroLab
window has been updated
accordingly.
Verify that the time scale of the
graph in the main MicroLab
window has been updated
accordingly.
- 22 -
Page 25

Test # Test Description Expected Result Result
4.1.2
4.1.3
4.1.4
4.1.5
4.2
a. In the Graph properties
dialog box, select
Temperature in the
Select axis drop-down
menu.
b. The Min and Max
temperature
fields are now
active. Enter –26
in the Min field
and 22 in the
Max field.
c. Click OK.
a. In the Graph properties
dialog box, click the
Lines tab.
b. Select Time in the Select
plot drop-down menu.
c. Change the X Axis color
to red, by using the Color
drop-down menu.
a. In the Graph properties
dialog box, click the
Lines tab.
b. Select Temperature in
the Select plot drop-
down menu.
c. Under the Line heading,
ensure the Visible check
box is selected.
d. Change the Temperature
axis color to green, using
the Color drop-down
menu.
e. Using the Style drop-
down menu, select the
solid line option.
f. Using the Weight drop-
down menu, select the
thinnest line option.
a. In the Graph properties
dialog box, click the
Lines tab.
b. Click Restore defaults.
On the Graph menu, click
Export Graph to Excel.
Verify that the temperature scale
of the graph in the main MicroLab
window has been updated
accordingly.
Verify that the Time axis of the
graph in the main MicroLab
window is now red.
In the graph in the main MicroLab
window, verify that the
Temperature axis is green and the
line plotting the temperature data
is green, solid and thin.
Verify that all axis and line defaults
have been restored in the graph in
the main MicroLab window.
Verify that the displayed graph is
exported to Excel.
- 23 -
Page 26
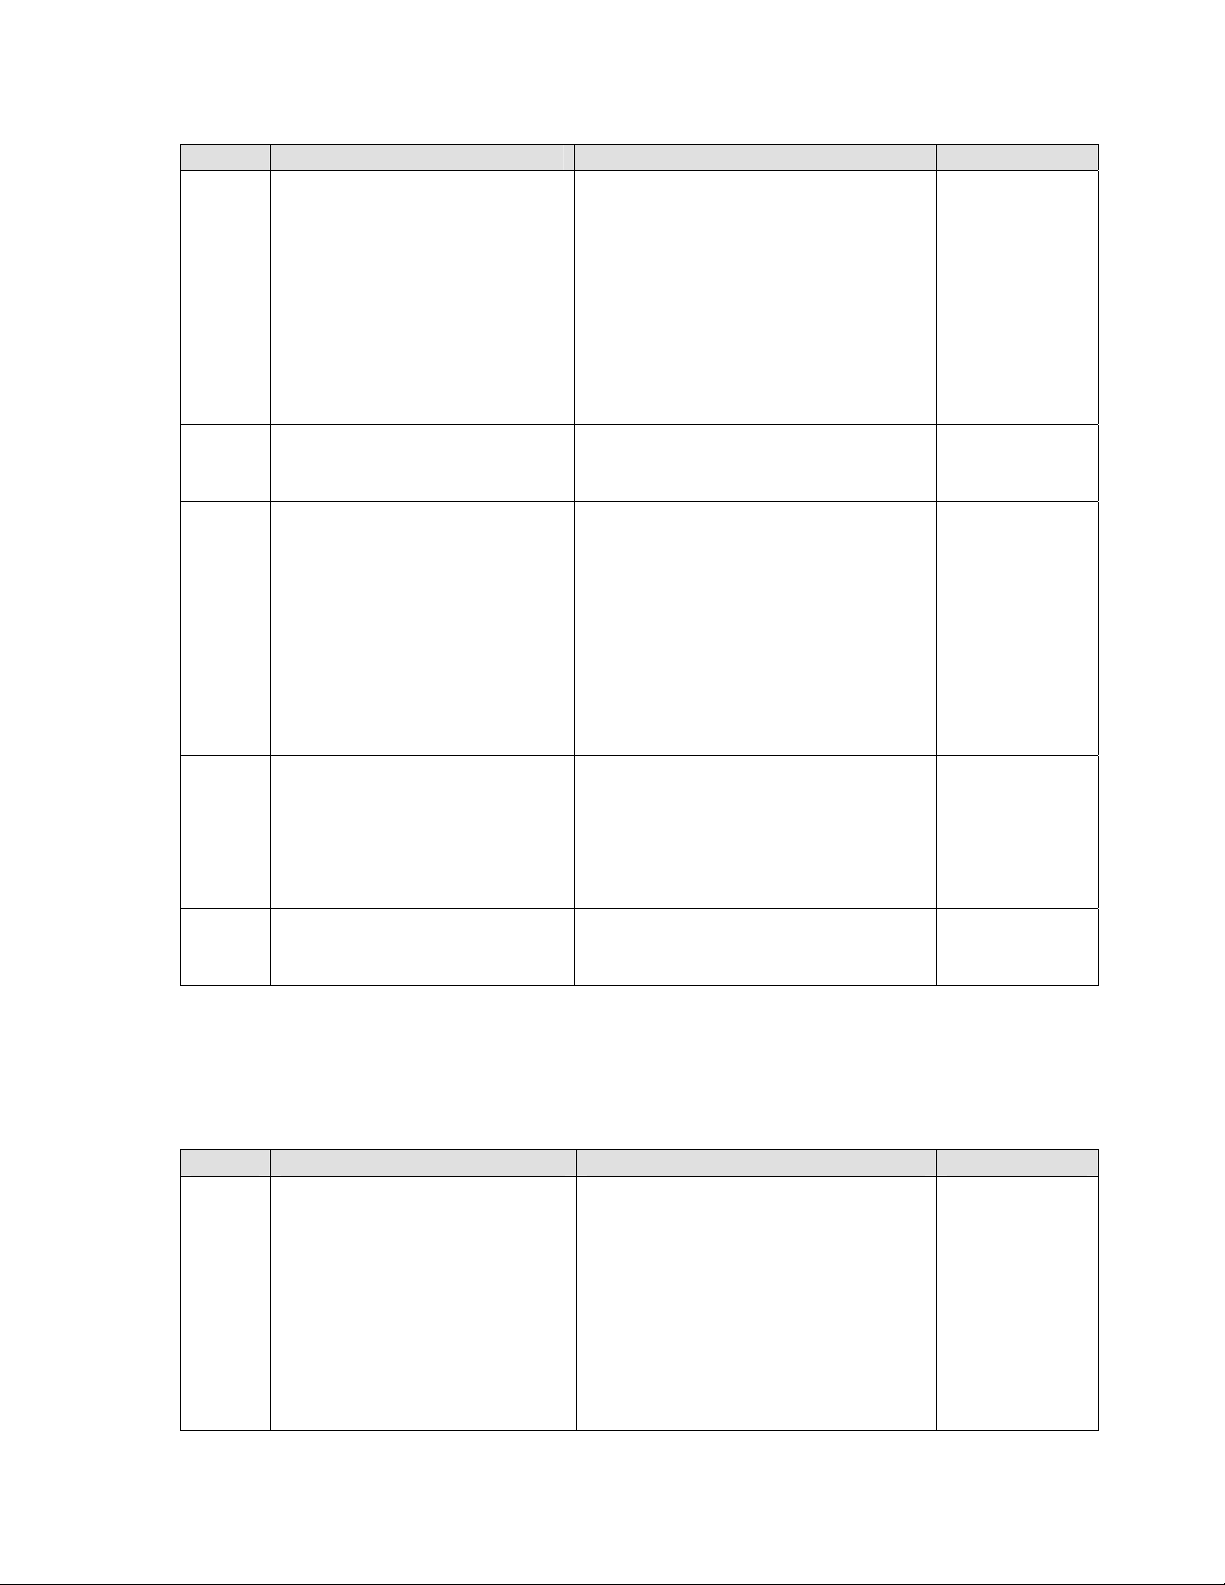
Test # Test Description Expected Result Result
4.3
4.4
4.5
4.6
4.7
a. On the Graph menu,
click Zoom.
b. Click down and hold the
left mouse button and
drag the Zoom cursor
over the area of the
graph to be zoomed.
c. Release the left mouse
button to set the zoom
area.
On the Graph menu, click
Autoscale.
a. On the Graph menu,
click Crop.
b. Click down and hold the
left mouse button and
drag the Crop cursor
over the area of the
graph to be cropped.
c. Release the left mouse
button to crop the
selected area.
a. On the Graph menu,
click Copy Graph.
b. Paste the graph into
another application such
as Microsoft Office
Word.
On the Graph menu, click
Dew Point and select
Internal Temperature.
Verify that the selected area of the
graph is zoomed in.
Verify that the graph in the main
MicroLab window is restored and
displayed in full.
Verify that the selected area of the
graph has been cropped – only the
selected area should be visible.
Verify that the graph has been
successfully copied.
Verify that the dew point is shown
on the graph in the main MicroLab
window.
5 - Logger Menu
Note: Ensure that the MicroLite is connected to the PC and is recognized by the
MicroLab software.
Test # Test Description Expected Result Result
5.1
- 24 -
a. On the Logger menu,
click Setup Logger.
b. In the MicroLite info
section of the Setup
dialog box, enter a new
name to identify the
MicroLite in the
Comment field.
c. Click Send Setup.
MicroLite Info Section Verification
a. Enter the Setup dialog
b. Verify that the S/N is
box and verify that the
Comment field is
correctly updated.
correct for the
MicroLite that is
currently connected to
the MicroLab.
Page 27

Test # Test Description Expected Result Result
c. Verify that the
MicroLite firmware
version number is
displayed.
d. Verify that the arrow on
the Battery Level meter
is located on the far
right of the green bar.
5.2
5.3
a. On the Logger menu,
click Setup Logger.
In the Setup section of the
Setup dialog box:
b. Click either the º C or º F
radio button next to the
Temperature unit
heading.
c. In the Interval
(hh:mm:ss) field, select
the time interval for
MicroLite sampling (from
1 sec to 2 hours).
d. Click the Timer run check
box. Using the Timer run
date and time fields, set
the time for the MicroLite
to begin sampling.
e. Click Send Setup.
a. On the Logger menu,
click Setup Logger.
In the Alarm levels section of
the Setup dialog box:
b. Enter new Low and High
values in the
Temperature and
Humidity fields.
c. Click Send Setup.
d. Download data from the
MicroLite into MicroLab,
so that the data is
displayed in a graph in
the main MicroLab
window.
e. Click the Show Alarm
Setup Section Verification
a. Enter the Setup dialog
box.
b. Verify that when the
Interval is adjusted
(test 5.2c), so does the
Recording time.
c. Verify that all updates
made in test 5.2 have
been updated in the
Setup dialog box.
d. After exiting the Setup
dialog box, download
the MicroLite data and
verify (in the data table)
that the data date and
time range, as well as
the data interval,
correspond with what
you defined in Setup.
a. In the MicroLab main window,
verify that the Low and High
alarm levels for Temperature
on the graph as a light blue
and light red line respectively.
b. Verify that these alarm levels
correspond to the alarm levels
previously defined in the
Setup.
levels icon
MicroLab tool bar.
- 25 -
in the
Page 28

Test # Test Description Expected Result Result
5.3.1
5.4
5.5
5.6
5.7
a. On the Logger menu,
click Setup Logger.
In the Alarm levels section of
the Setup dialog box:
b. Click Cancel alarm
levels to restore the
default levels adjusted in
test 4.2.
c. Click Send Setup.
d. Repeat tests 5.3d and
5.3e above.
a. On the Logger menu,
click Setup Logger.
b. In the Setup dialog box,
click Send Setup.
On the Logger menu, click
Download.
On the Logger menu, click
Run.
On the Logger menu, click
Stop.
a. In the MicroLab main window,
verify that the Low and High
alarm levels for Temperature
appear on the graph as a light
blue and light red line
respectively.
b. Verify that the default alarm
levels have been restored as
follows:
Temperature: Low: -40 °C/-40
°F, High: 80 °C/176 °F
a. Verify that the message: Setup
will clear the MicroLite
memory. Do you want to
proceed? appears. Click Yes.
b. Verify that the Reason Dialog
box opens. Enter a reason for
performing this action e.g.
Test.
c. Verify that the Status window
opens and that all statuses are
successfully sent (noted with a
green check mark). A
Completed status should
appear at the bottom of this
window.
d. Click Close.
Verify that the MicroLite data is
downloaded into the MicroLab
main window.
Note: Ensure that the MicroLite
has been recording data to
download.
a. Verify that the message:
Logger is already running. Do
you wish to proceed with a
new logging session? appears.
b. Verify that the Reason Dialog
box opens. Enter a reason for
performing this action e.g.
Test.
c. Verify that the MicroLite LCD
starts collecting data.
a. Verify that the Reason Dialog
box opens. Enter a reason for
performing this action e.g.
Test.
b. Verify that Stop appears in the
MicroLite LCD display,
- 26 -
Page 29
Test # Test Description Expected Result Result
indicating that the MicroLite is
now in Stop mode and will
stop collecting data.
5.8
5.9
5.10
5.10.1
On the Logger menu, click
Set Celsius.
On the Logger menu, click
Set Fahrenheit.
On the Logger menu, click
Com Setup.
On the Logger menu, click
Com Setup.
In the Communication Setup
dialog box, click Try to
connect.
Verify that the temperature data is
shown in the MicroLite LCD
display in Celsius.
Verify that the temperature data is
shown in the MicroLite LCD
display in Fahrenheit.
a. Verify that the Communication
Setup dialog box opens.
b. Verify that the MicroLite you
have connected to the PC is
identified. The check box for
the port to which the MicroLite
is connected should be
selected. Verify that the
message MicroLite is
connected appears.
a. Verify that the PC ports are
being scanned.
b. Verify that a confirmation
message appears indicating
that the MicroLite is detected.
6 - Help Menu
Test # Test Description Expected Result Result
6.1.
On the Help menu, click
About MicroLab.
a. Verify that the About MicroLab
dialog box window opens.
b. Verify that the MicroLab version
number and copyright are
displayed.
c. Verify the link
http://www.omega.com/
works.
7 – Main Toolbar Icons
Test #
7.1
7.2
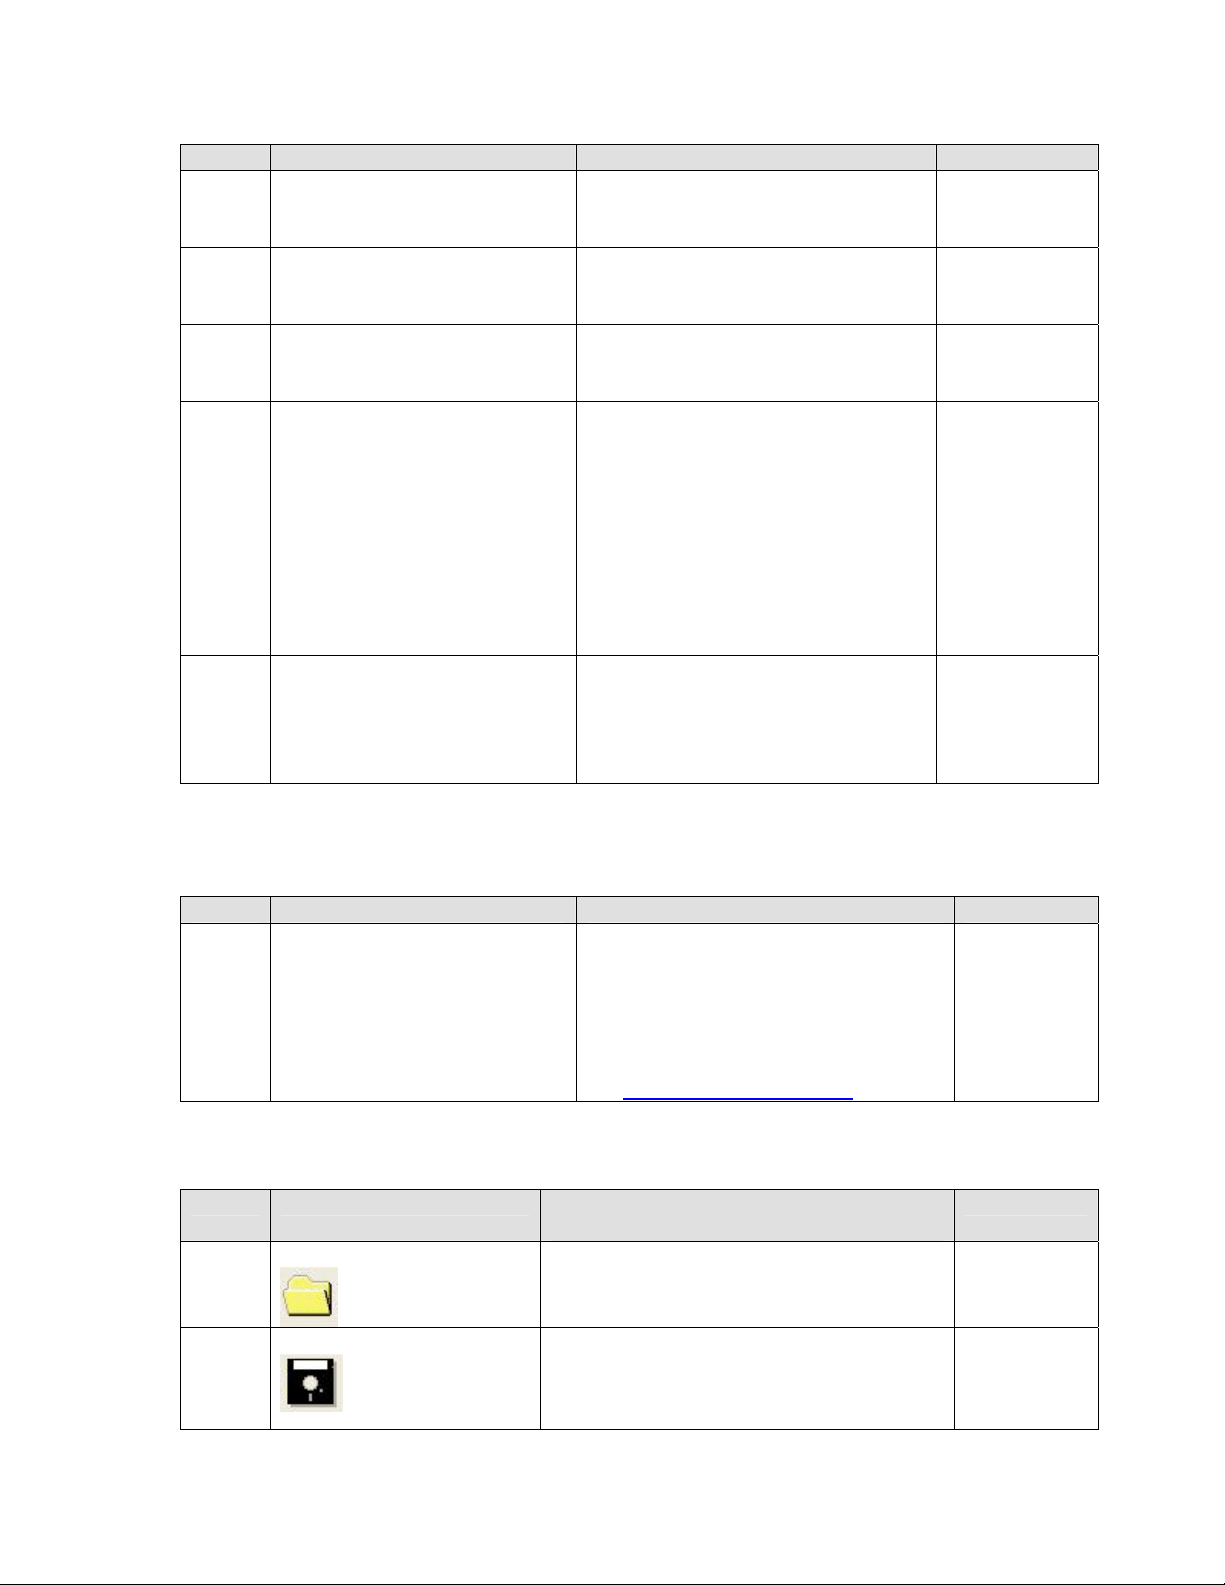
Open
Save
Icon Test Description and Expected
Result
Click this icon and refer to test 2.2.
a. Clicking the Save icon will save the
current data.
b. Verify that the data was saved by
following test 2.2 and opening the
Result
- 27 -
Page 30
Test #
7.3
7.4
7.5
7.6
7.7
7.8
7.9
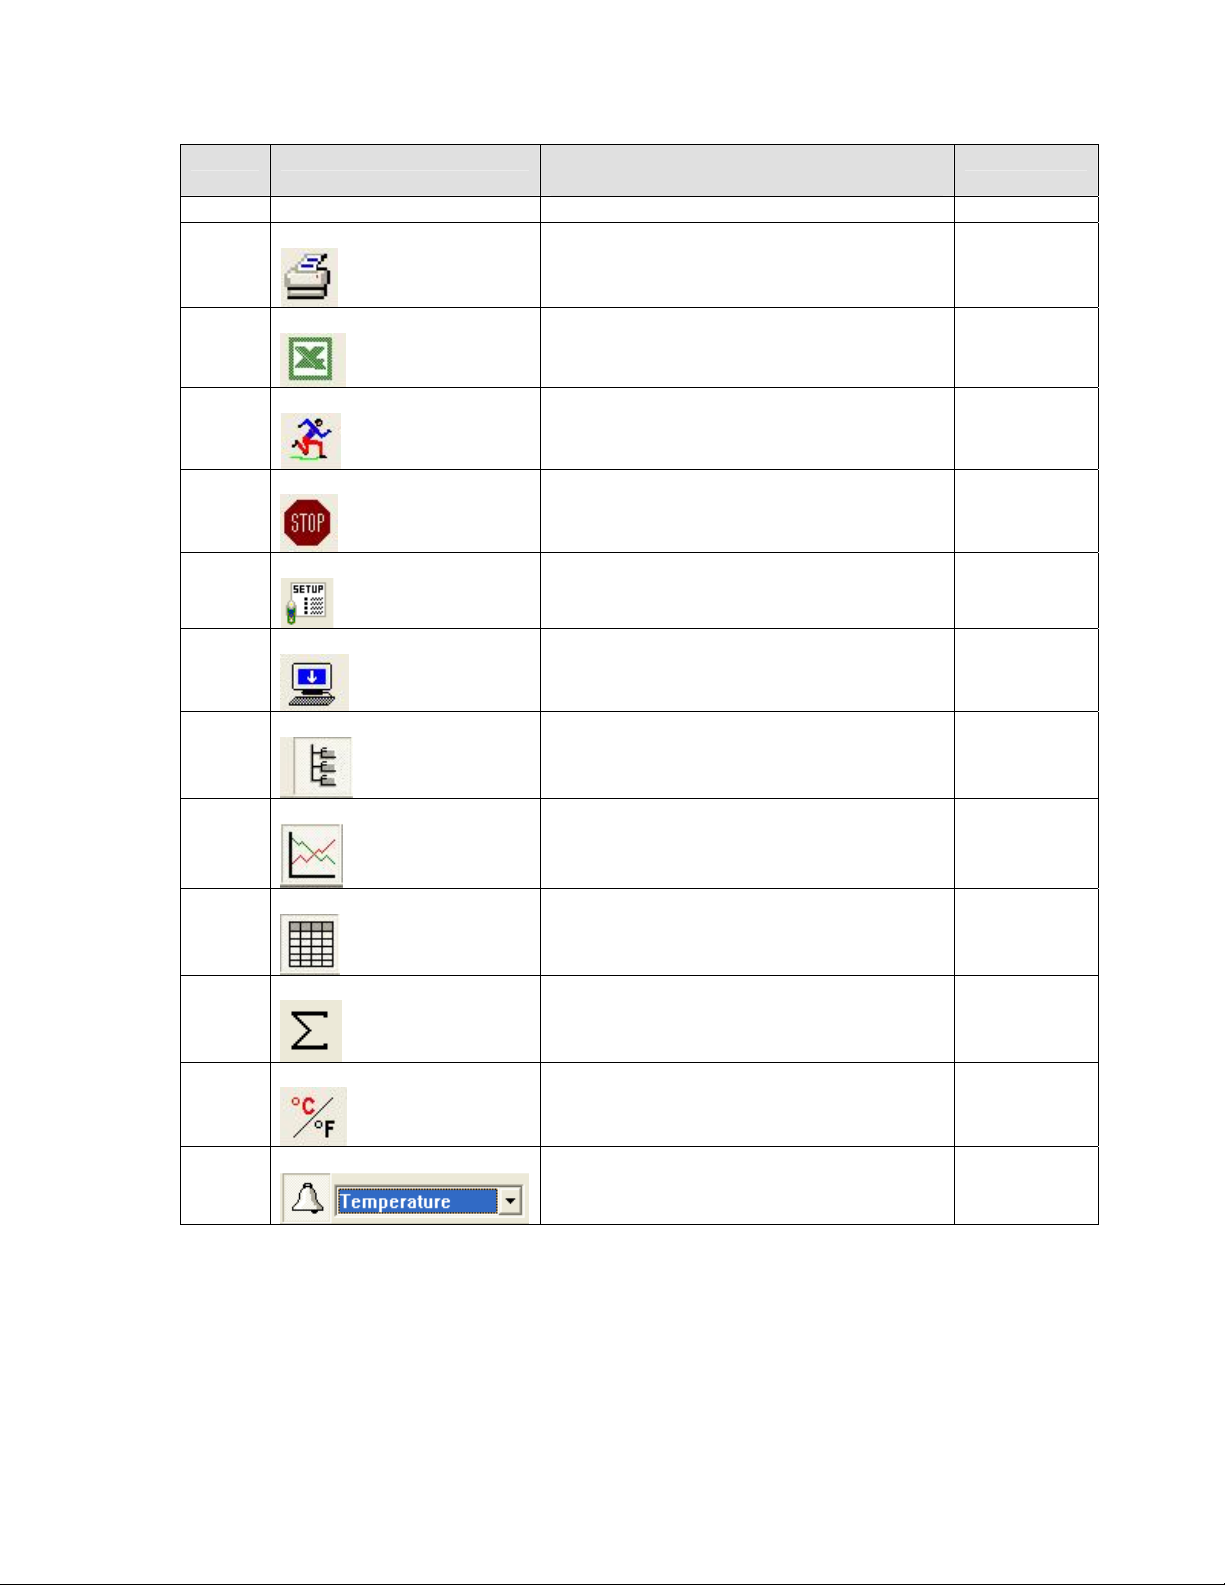
Print
Export
Run
Stop
Setup
Download
Data Map
Icon Test Description and Expected
Result
data file which was just saved.
Click this icon and refer to test 2.5.
Click this icon and refer to test 4.2.
Click this icon and refer to test 5.6.
Click this icon and refer to test 5.7.
Click this icon and refer to tests 5.1 -
5.4.
Click this icon and refer to test 5.5.
Click this icon and refer to test 3.1.
Result
7.10
7.11
7.12
7.13
7.14
Graph
Table
Statistics
°C/°F
Alarm
Click this icon and refer to test 3.2.
Click this icon and refer to test 3.3.
Click this icon and verify that statistics
such as Min, Max and Average values
appear on the bottom of the graph.
Click this icon and verify that the units
on the graph and table are toggled
between Celsius and Fahrenheit.
Click this icon and refer to test 5.3.
- 28 -
Page 31
8 - Graph Toolbar Icons
Test #
8.1
8.2
8.3
8.4
8.5
Icon Test Description Expected Result Result
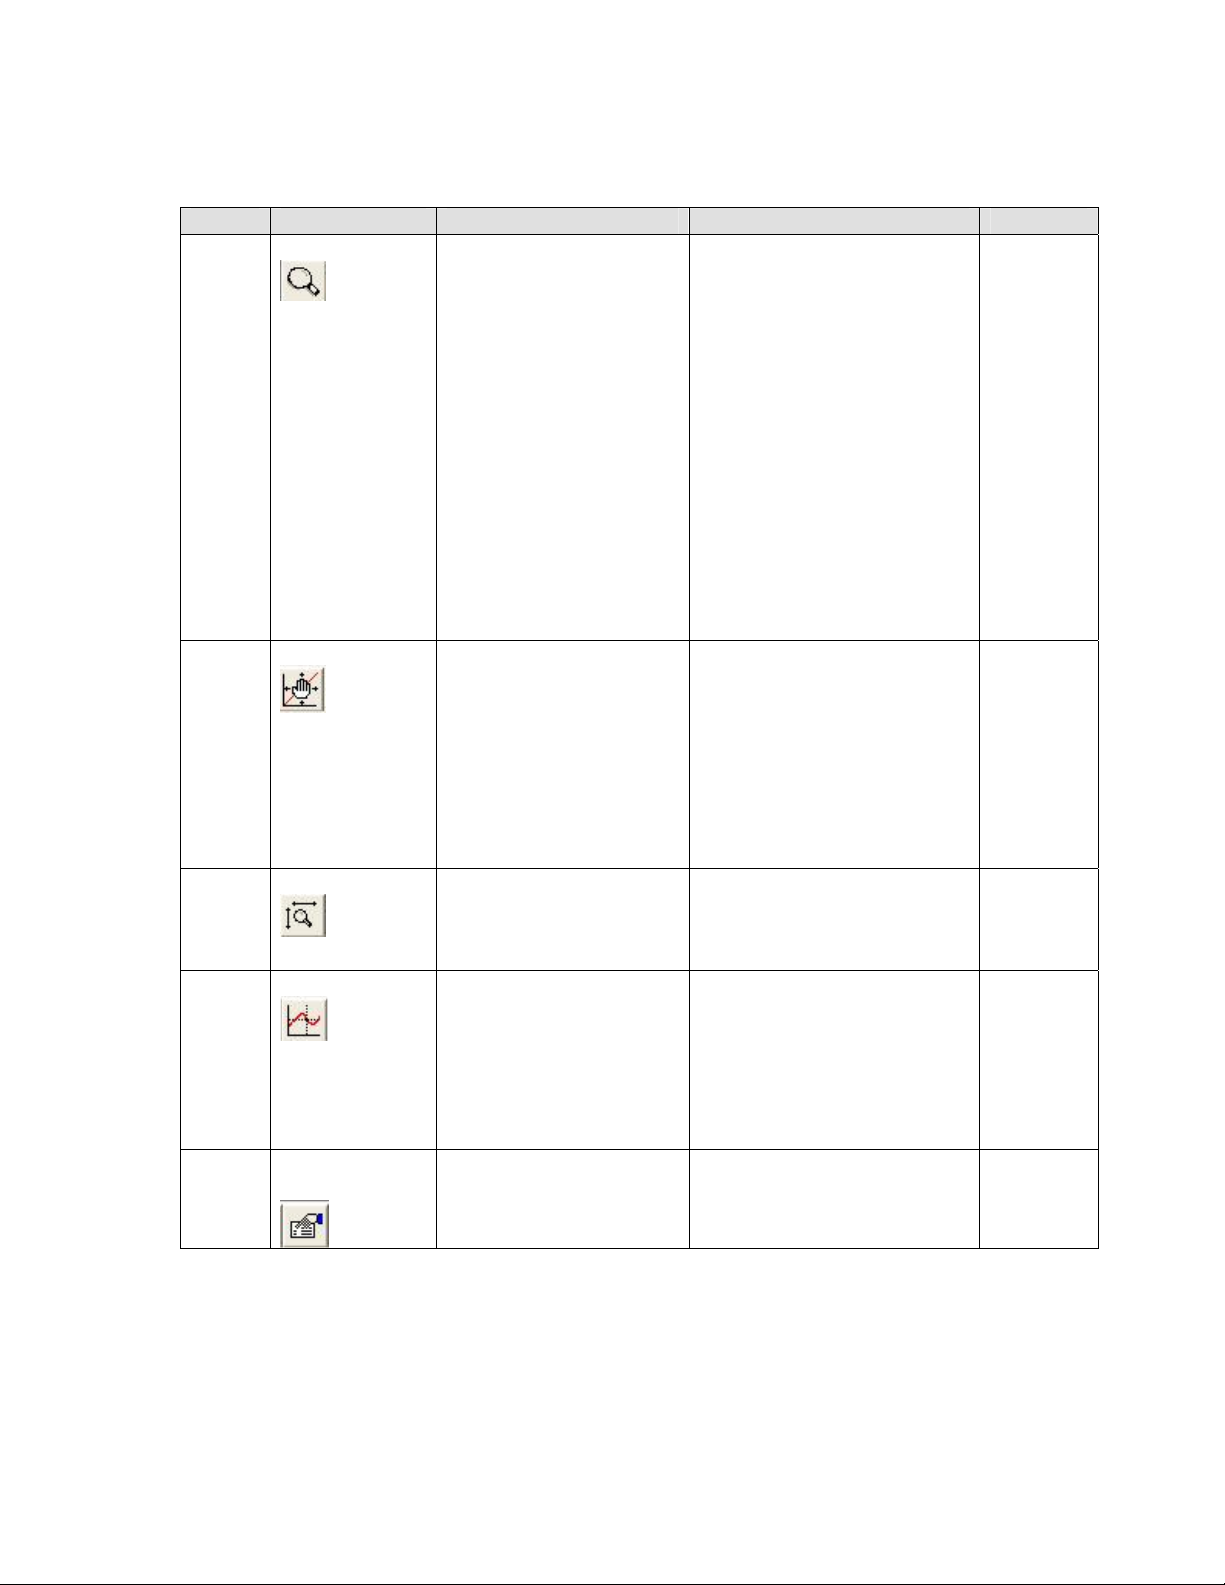
Zoom In
Pan
Auto scale
Cursor
Graph
Properties
a. Click the Zoom In
icon.
b. Click down and
hold the left mouse
button and drag the
Zoom In cursor
over the area of the
graph to be
zoomed.
c. Release the left
mouse button to set
the zoom area.
Note: Repeat this
step to continue
zooming in. Right
click to zoom out.
a. Click the Pan icon.
b. Place the Pan
cursor over the
graph, hold down
the left mouse
button and proceed
to pan the graph
up, down, left and
right.
a. Zoom in on an area
of the graph.
b. Click the Auto
scale icon
a. Click the Cursor
icon.
b. Drag the graph
cursor to any
coordinate on the
graph.
Click this icon and refer
to tests 4.1 and 4.2.
a. Verify that the selected
area of the graph is
zoomed in.
b. Verify that the right
click option zooms out.
Verify that the graph pans
up, down, left and right.
Verify that the graph is
restored and displayed in
full.
a. Verify the graph cursor
is displayed.
b. Verify that the chosen
coordinate is displayed
in the first row of the
table in the MicroLab
main window.
Refer to test 4.1.
- 29 -
Page 32
Chapter 6: MicroLite User Guide
Introduction
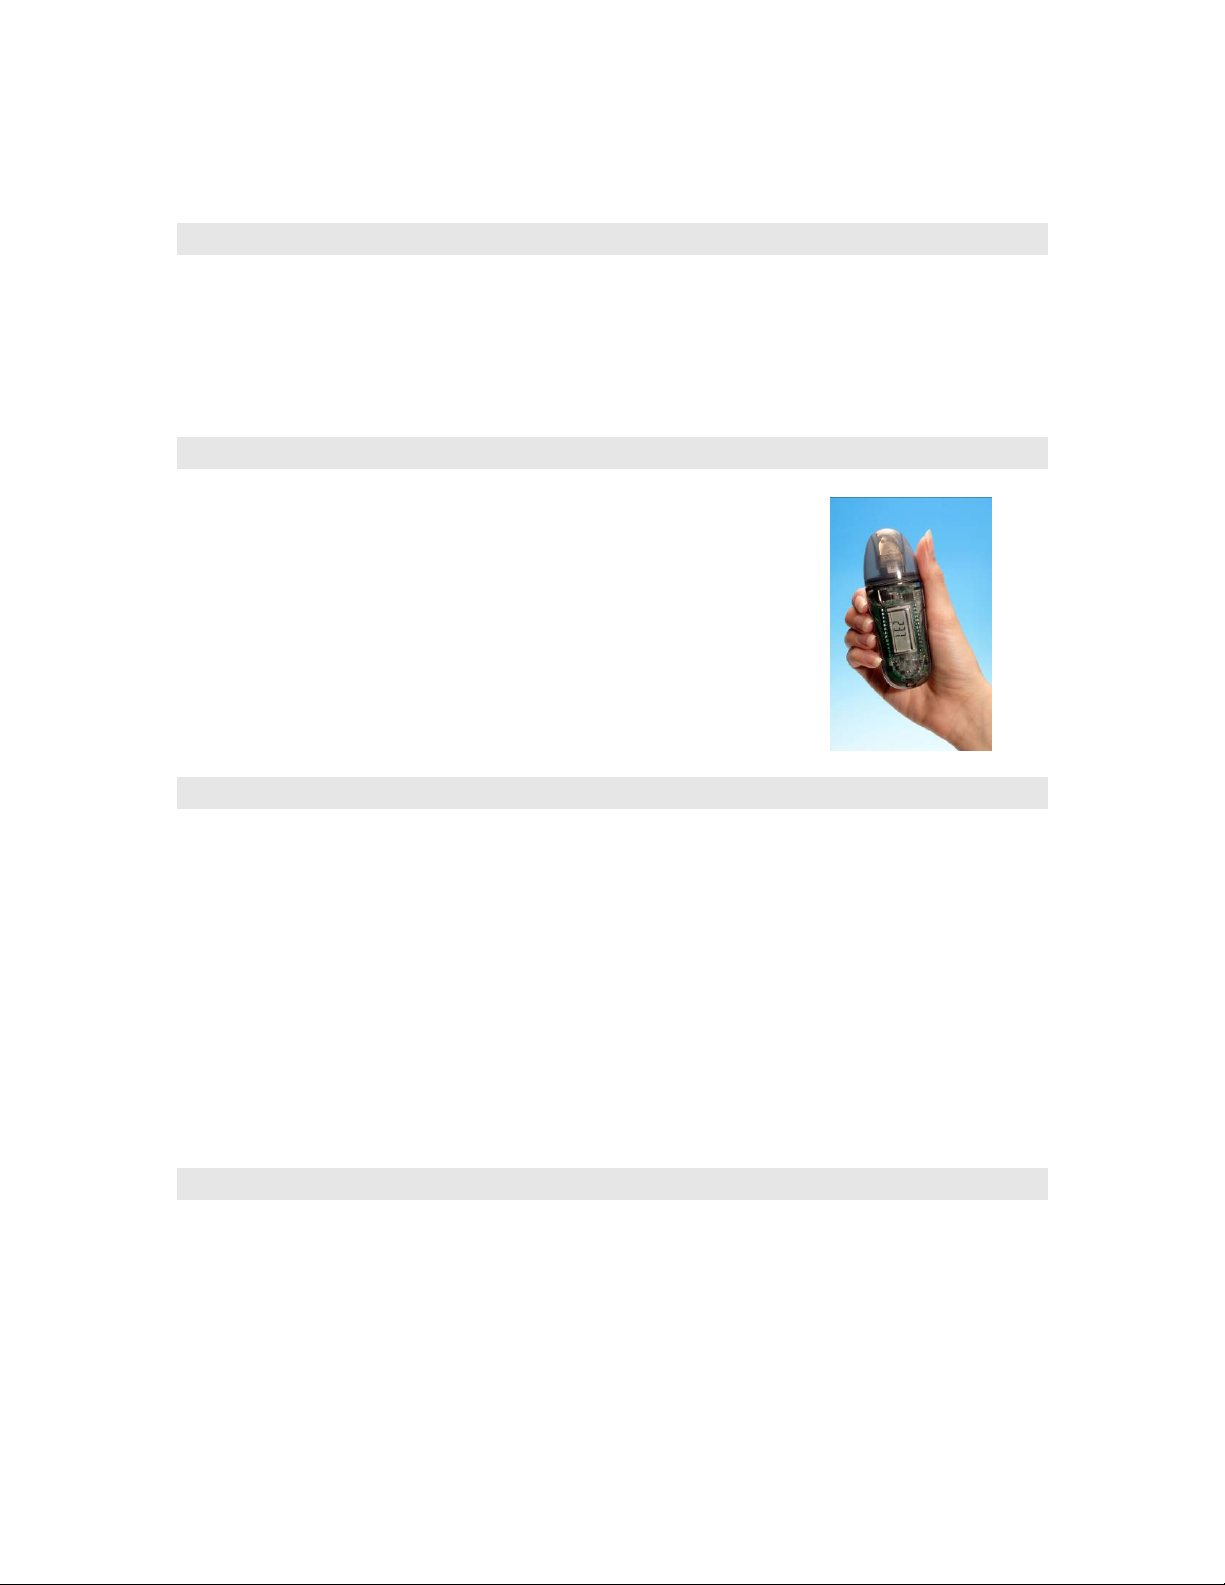
The MicroLite is a compact 16-bit USB data logger designed for accurate temperature
monitoring for a wide range of applications. Due to its low cost, the MicroLite can be
used as a One Trip Logger, for monitoring temperature of perishable goods during
transportation, for example. Other typical applications include warehousing of food,
monitoring of controlled environments i.e. in the pharmaceutical industry, and many
more.
Using the MicroLite
The MicroLite can be used as a standalone device to monitor
temperature levels. The MicroLite LCD screen continuously
displays the current temperature recordings and the maximum
and minimum temperature readings. You can also define
minimum and maximum alarm levels for a specific data logging
session, and the LCD screen will also show any alarm levels that
may have been breached as well as the duration of the alarm.
The data stored by MicroLite can be easily downloaded to any
computer for further viewing and analysis using the MicroLab
software, and can also be exported to an Excel spreadsheet.
Getting Started
The MicroLite data logger you have purchased is shipped in a plastic box with a Quick
Start Guide printed on the rear of the box.
The box contains one MicroLite data logger and one small magnet accessory (located in
the placeholder on the MicroLite packaging). Read more about the purpose of this
magnet on page 34.
In order to save battery life, MicroLite is shipped in Stop Mode. This means that before
you can start recording, you must first connect MicroLite to the PC and set it up with the
MicroLab software.
Refer to Chapter 8: MicroLab User Guide to learn how to run the MicroLite from the
software, including how to set up the logger. Once MicroLite receives the Setup
command from the software, it begins logging the temperature data immediately or waits
for a predefined time to start logging.
Reading the MicroLite Display
The MicroLite has a 3-digit (with one decimal place) 7-segment LCD screen, which is
able to display the following information:
• The temperature reading currently recorded
• The lowest and highest temperature recorded to that point
• Low and/or high alarm level breach
• Duration of low and/or high alarm level breach
• Low battery warning
- 30 -
Page 33
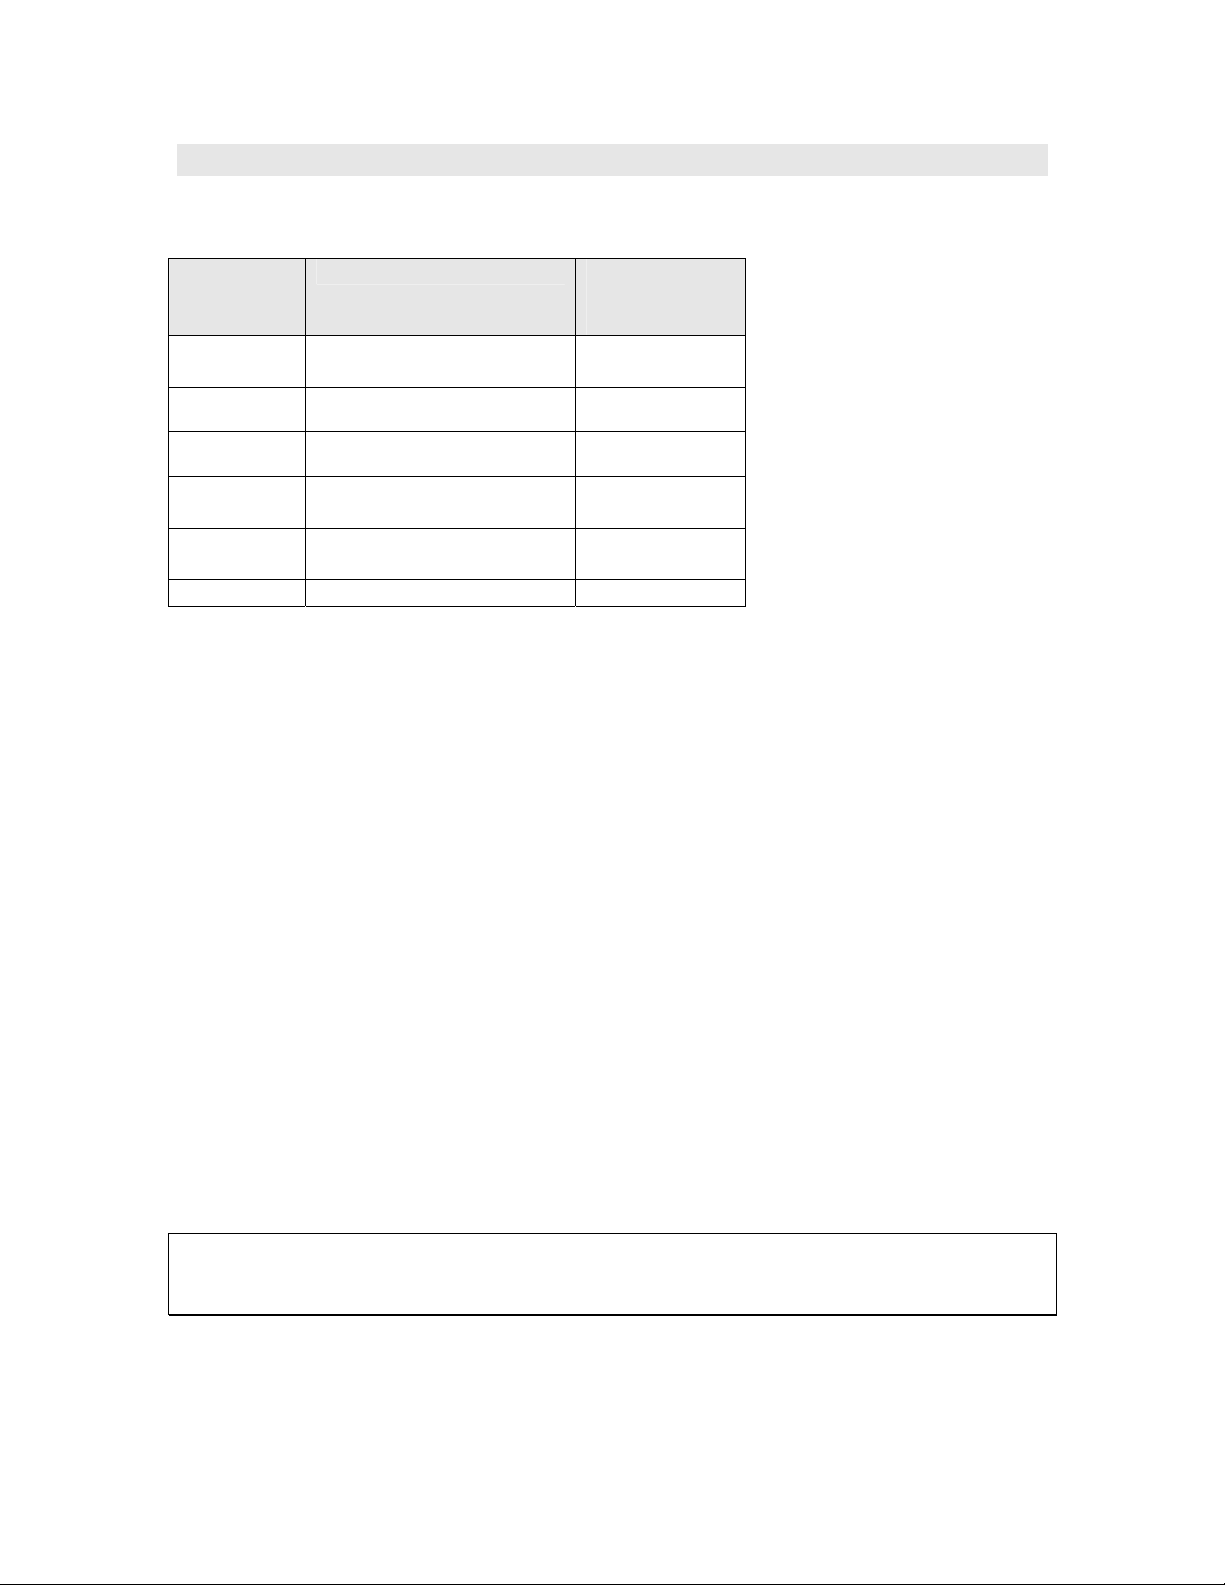
Data Displays
The LCD displays the data in a continuous cycle, alternating in duration according to the
order shown in the table below:
Time on
Screen
(seconds)
8 Temperature (in Celsius
2 Low alarm duration *
2 High alarm duration *
2 Minimum temperature
2 Maximum temperature
2 Low battery warning * BATT LO
* If relevant (only displayed in event of alarm/low battery)
Data Reading Example of
Reading on
or Fahrenheit)
reading
MAX
reading
Screen
25.5 ˚C
AL-L
1.55H
AL-H
1.05H
MIN
23.2 ˚C
30.1 ˚C
Current Temperature Reading
This is the last temperature reading recorded by the MicroLite. If the sampling interval is
once per second, then the reading will be updated for each of the four seconds it
displayed on the LCD. Therefore you will be looking at the actual temperature recorded
at that very moment.
MicroLite Alarm
MicroLite displays an alarm notification whenever any alarm level is exceeded.
AL-L – The temperature reading is lower than its low alarm level (as defined in the logger
Setup).
AL-H – The temperature reading is higher than its high alarm level (as defined in the
logger Setup).
The alarm notification remains until the next time you download data to a PC.
The alarm duration on the logger’s LCD is calculated in hours. For example, the shortest
possible duration of 0.01 hours means the logger has been in alarm for between 0 and
36 seconds.
A duration of 1.55 hours means the logger has been in alarm for 93 minutes.
If the MicroLite is in a Low and High alarm simultaneously, then it will show the duration
for both alarms.
Note: When the MicroLite is in Cyclic mode, the Low or High alarm level displayed
represents the lowest or highest readings recorded since the MicroLite starting logging
data, irrelevant of how many cycles the logger has recorded.
Minimum and Maximum Temperature Readings
The logger display automatically scrolls through the Min/Max temperature readings while
sampling.
- 31 -
Page 34

These readings are simply the minimum and maximum temperature values recorded by
the MicroLite up until that point. If your logger has breached an alarm level, look at the
MIN and MAX readings to see the extent of the low or high alarm level breach.
These readings are constantly updated.
MicroLite Working Modes
MicroLite is always set in one of five possible modes. These modes are all activated via
the MicroLab software.
Stop
MicroLite is idle and is not recording.
When pressing Stop in the MicroLab software, the logger LCD immediately ceases to
record data, instead displaying STOP and scrolling through the alarm durations (if
alarms were previously recorded).
Run
MicroLite is recording data. It will stop recording automatically when its memory has
reached full capacity (8,000 or 16,000 samples depending on the model).
Cyclic Run
Similar to Run mode, but MicroLite will continuously sample data, recording over old
data when the memory reaches its capacity, beginning with the earliest data recording.
Timer Run
MicroLite can be configured to start recording at a predetermined time. When MicroLite
is set for such a run, its status is set to Timer Run. The logger LCD displays tRUN.
Push to Run
MicroLite will only begin logging data when the user operates the logger’s reed switch
with the MicroLite magnet. The logger LCD displays PUSH.
USB Port Connection
The MicroLite interfaces with the computer via any of its USB Host ports. In order to be
detected by the computer and by the MicroLab software, the USB driver must first be
installed. USB driver installation is part of the software installation.
MicroLite LCD Status when Connected to USB
The USB connection status is always displayed on the MicroLite LCD when connected
or disconnected from a USB port.
The LCD flashes USB ON once when connected and flashes USB OFF once when
disconnected from the USB port.
The logger LED (located adjacent to the logger’s USB connector) also lights up green
when connected to the USB port.
If the MicroLite is in Run mode when connected to the USB port, the LCD will only
display the current temperature reading and will not scroll through the other readings.
- 32 -
Page 35
If the MicroLite is in Stop mode when connected to the USB port, the LCD will display
STOP. If the logger had recorded an alarm during the previous data logging session,
then the LCD will also scroll through the alarm durations.
The MicroLite Battery
The MicroLite runs on a standard 3V CR2032 lithium battery.
The battery maintains the MicroLite’s Real-Time Clock (RTC). The logger’s time/date
settings are synchronized with the PC when you perform a Setup. Removing the battery
will return the logger’s time/date settings to the default of 01 Jan 2004.
Battery Level
The MicroLite battery level indication is provided in the MicroLab software’s Setup
dialog.
The MicroLite battery’s maximum lifespan is approximately two years. This long battery
life is achieved by the MicroLite putting itself to sleep between data recordings. While in
sleep mode, the data logger consumes a minimal amount of power.
MicroLite wakes up for a few micro-seconds whenever it has to record a data sample or
display new data on the LCD screen.
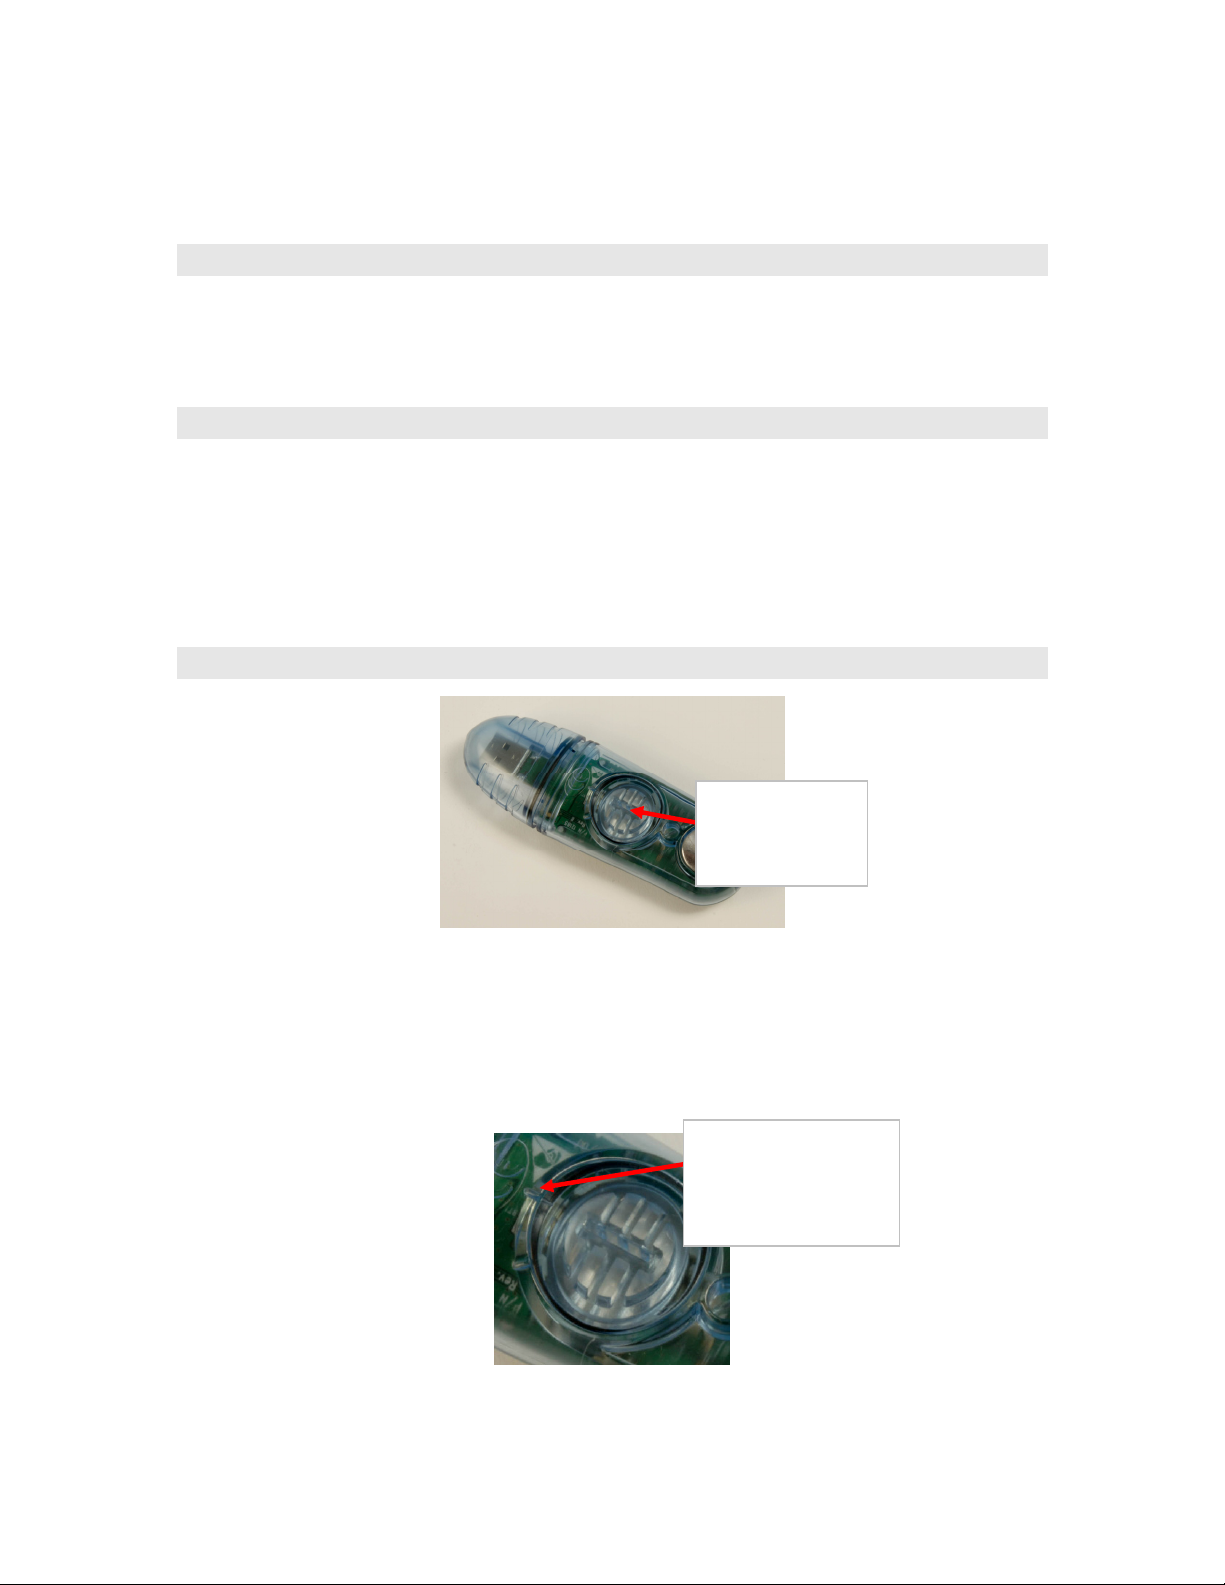
Replacing the Battery
Internal
battery
compartment
Figure 1: MicroLite battery compartment
As shown in the figure above, the MicroLite internal lithium battery is located under a
removable plastic cover.
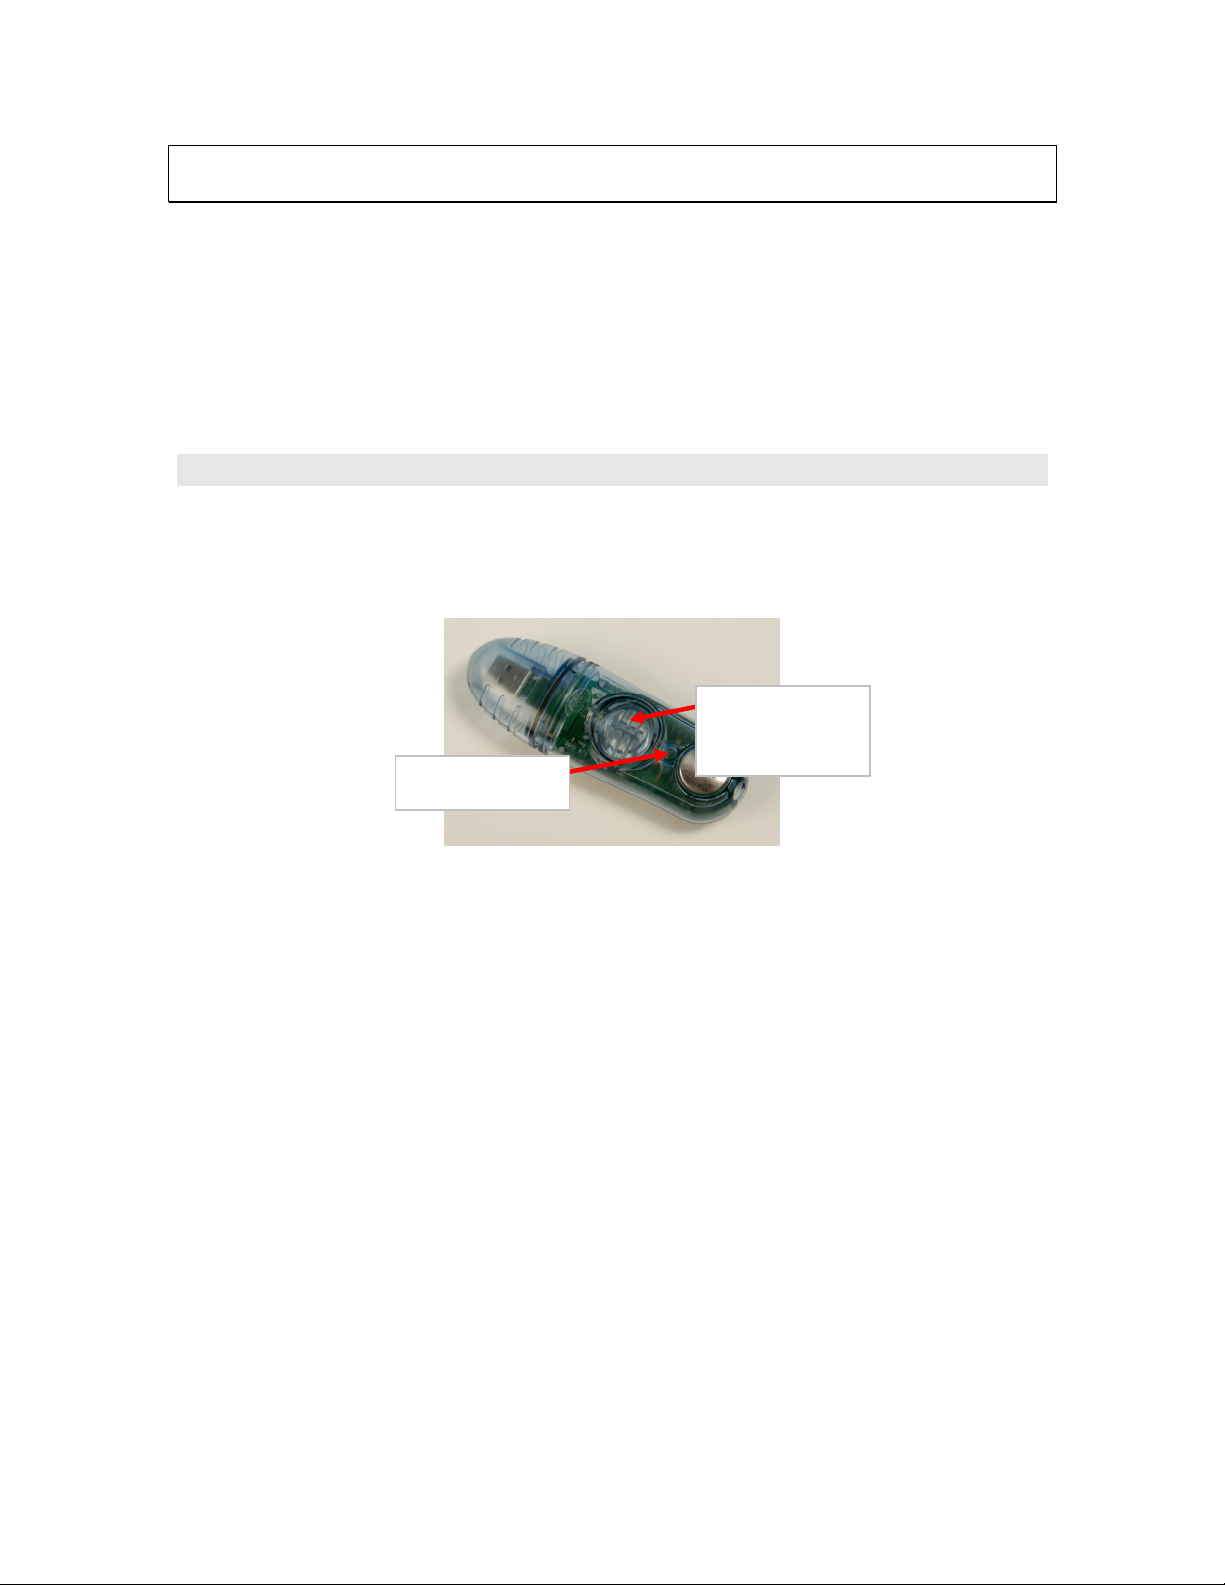
To replace the battery, simply use the groove in the plastic cover to twist the cover open,
and pull out the battery. When twisting the cover back into position, ensure that the small
ridge on the battery cover is in line with the similar ridge on the logger case, as indicated
in the figure below.
Ensure ridge on
cover and on
logger case are in
line
Figure 2: Closing battery compartment
- 33 -
Page 36
p
Note: Be sure to twist the plastic cover properly back into a sealed position, to maintain
the MicroLite’s dust and waterproof IP68 compliancy.
As stated previously, replacing the battery will lose the MicroLite’s time/date settings.
These can be restored the next time you Setup the logger using MicroLab.
After replacing the battery, the MicroLite LCD will display PUSH, indicating it is in Push
to Run mode.
Once you connect the logger to the PC’s USB port, you will be able to run the logger
without the need for the magnet.
In addition, you will still be able to download the data previously recorded onto the
MicroLite, before you removed the battery. This data is not lost.
Using the MicroLite Magnet
The MicroLite includes the magnet accessory (stored in the magnet placeholder in the
MicroLite packaging).
This magnet is used to activate the logger when in Push to Run mode. There is a reed
relay on the MicroLite’s circuit board which is closed using the magnet, thereby
activating the logger.
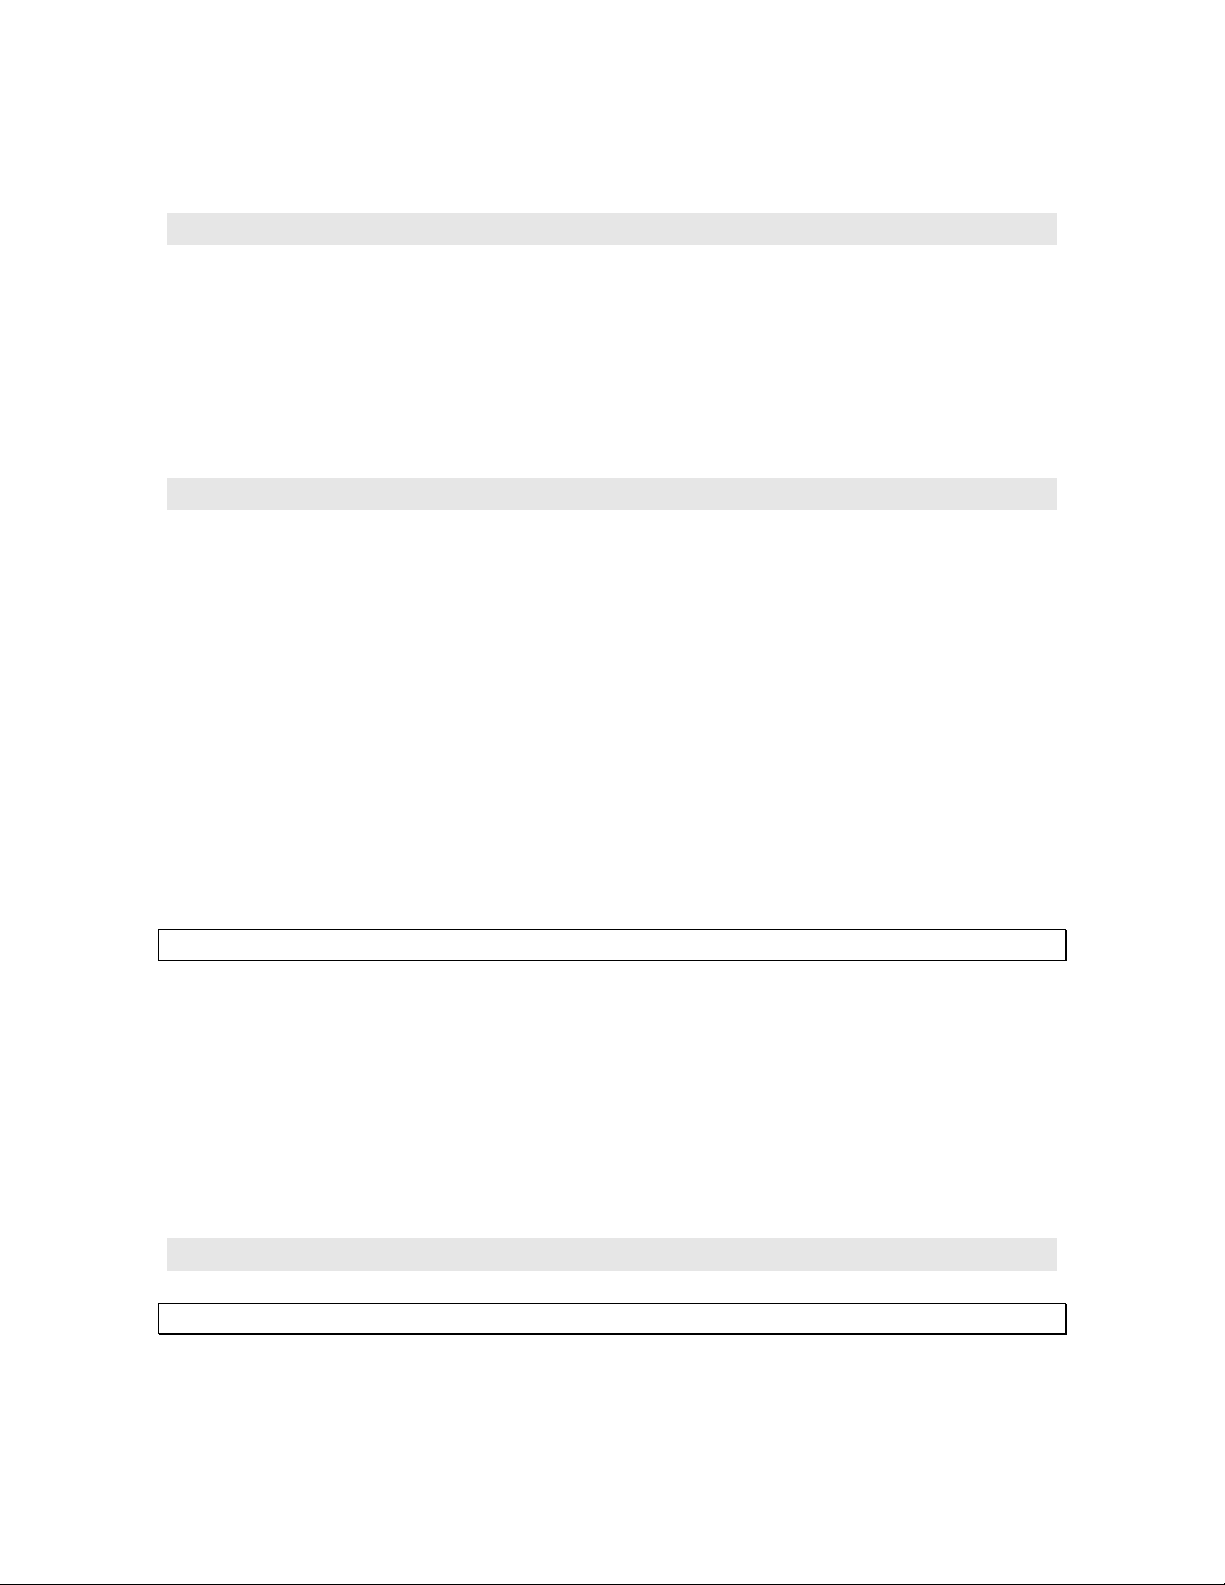
Internal
battery
com
Magnet holder
Figure 3: MicroLite magnet holder
To activate the MicroLite when in Push to Run mode, place the magnet inside the small
holder next to the battery compartment for two seconds, and then remove the magnet.
The MicroLite LCD will immediately move to Run mode and live temperature data will be
displayed.
artment
- 34 -
Page 37
Chapter 7: DatPass User Guide
Introduction
DatPass is administration software which supports the assignment of passwords and
operating privileges for Omega’s MicroLab CFR software.
DatPass defines the users that can log onto DatPass, their passwords, digital signatures
and the action they are permitted to take.
DatPass also maintains an audit trail that keeps track of all users’ activities.
Together with MicroLab, DatPass forms a dual program software package that complies
with FDA Title 21 CFR Part 11.
Installing DatPass
System requirements
To work with DatPass and MicroLab software, your system should be equipped with the
following:
Software
• Windows 95, 98, 2000, XP and Vista (Windows 95 will not support USB)
• Internet Explorer 4.0, or later
Hardware
• Pentium 300 MHz or higher
• 32 MB RAM (64 MB recommended)
• 5 MB available disk space
Installing the software
Note: Do not connect the USB Security dongle to the PC until the installation is complete
1. Insert the Omega software CD into your CD drive.
2. Enter the DatPass folder on the CD and click the setup.exe file.
3. The DatPass software installation process will begin. The USB Security dongle
HASP device drivers will first be installed. Upon completion, the message The
operation was successfully completely will be displayed. Click OK to continue to
the next stage of the DatPass installation.
4. Follow the on-screen instructions to complete the DatPass installation.
5. Once the installation is complete, you may then connect the USB Security dongle
to the PC. The dongle will be automatically recognized as new hardware by the PC.
First Time Running DatPass
Note: DatPass will not run unless the USB Security dongle is connected to the PC
The first user that opens DatPass is automatically assigned as an Administrator and is
given the user name Admin. To start working with DatPass the administrator needs to
define his own user ID and password:
- 35 -
Page 38
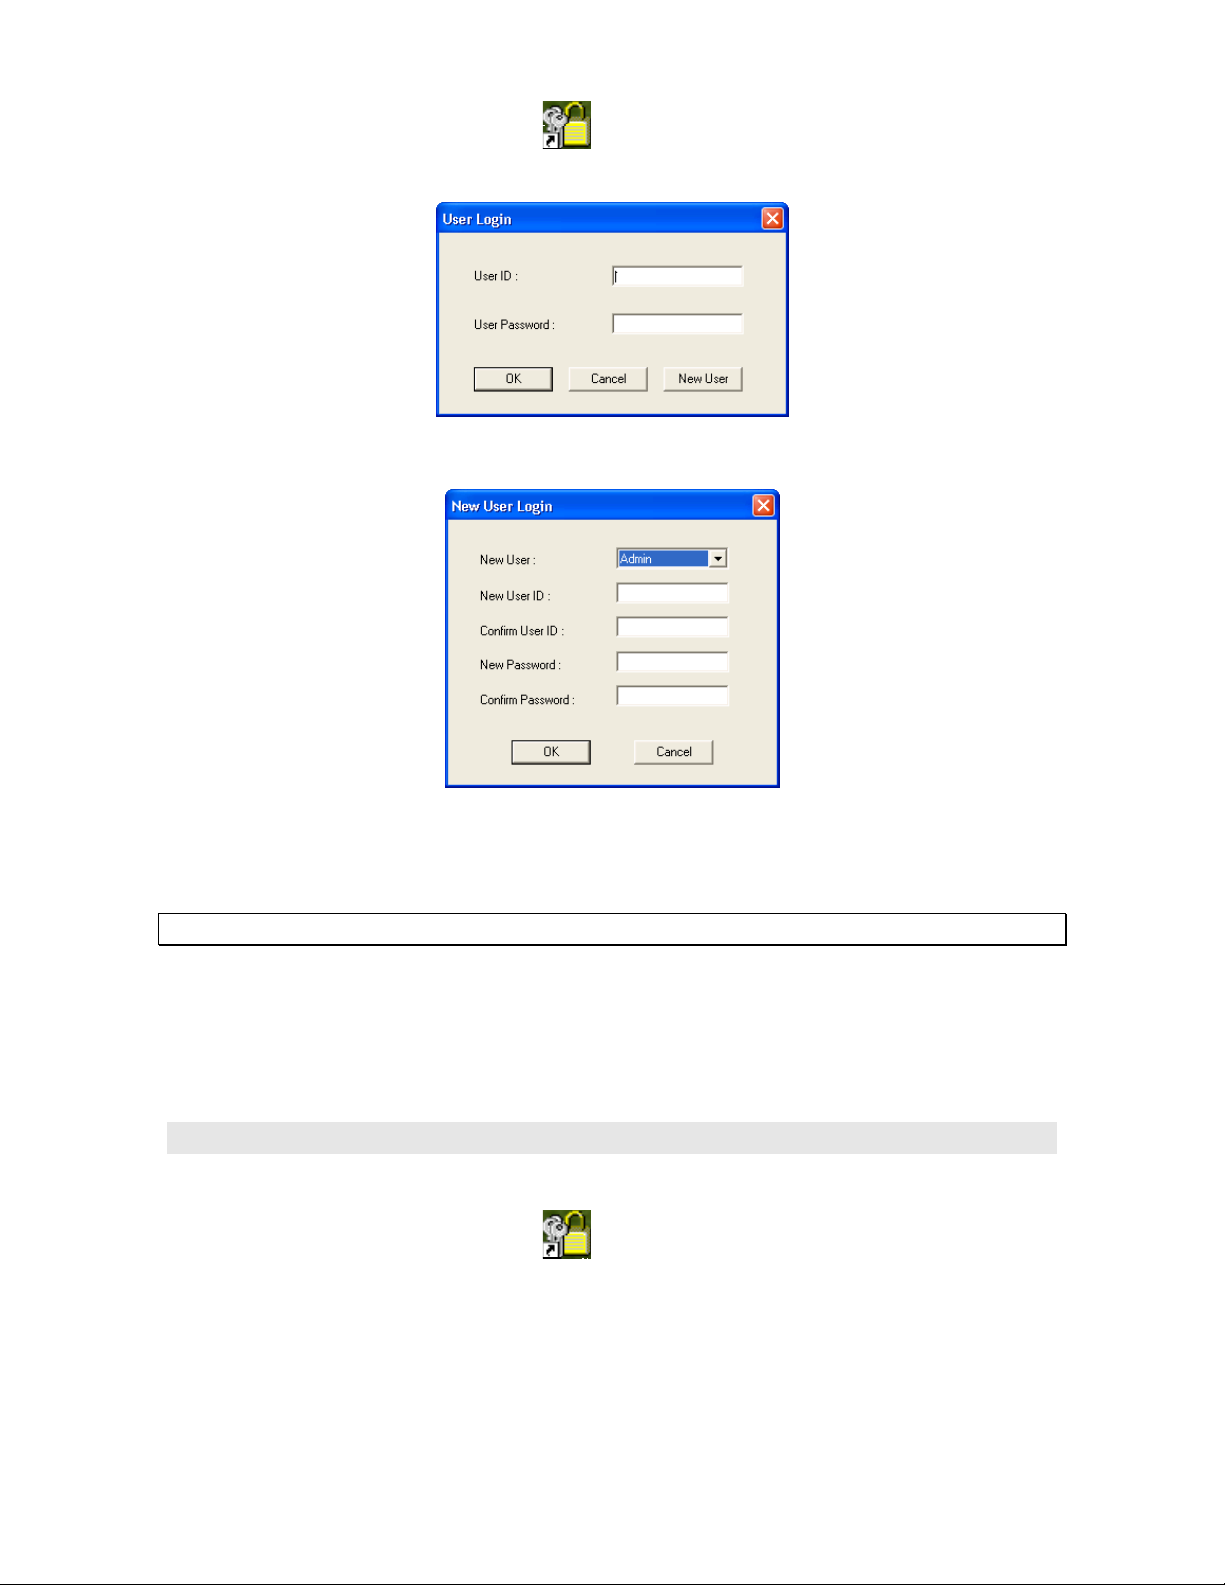
1. Double click the DatPass icon
dialog box:
2. Click New User.
on your desktop to display the User Login
3. Enter a user ID in the New User ID text box.
4. Confirm the user ID in the Confirm User ID text box.
5. Enter a password in the New Password text box.
Note: The password is case sensitive
6. Confirm the password in the Confirm Password text box.
7. Click OK.
The User ID and Password created here can also be used to access the MicroLab
software.
Login to DatPass
Old User
1. Double click the DatPass icon
dialog box:
on your desktop to display the User Login
- 36 -
Page 39
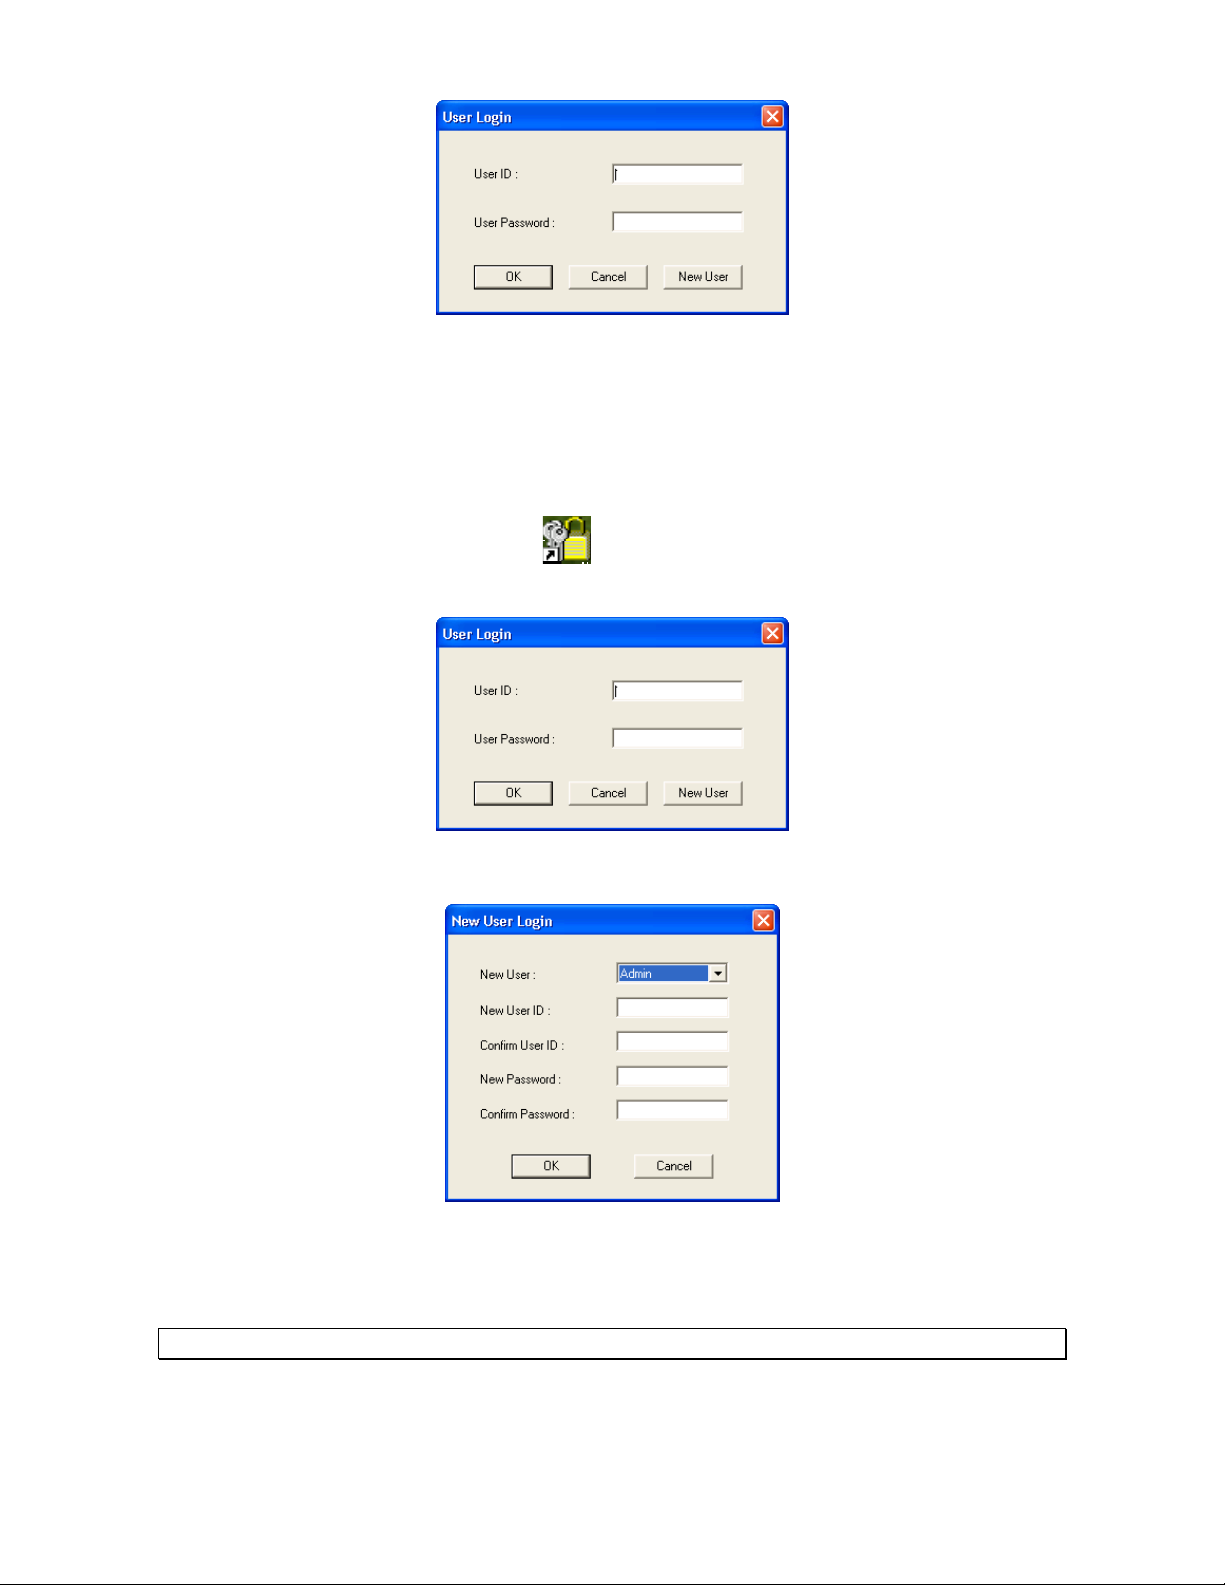
2. Enter your user ID and password, and then click OK.
New User
You can only login as a new user to DatPass or MicroLab if the Admin has created a new
user in DatPass. Refer to the Adding a New User section on page 38.
1. Double click the DatPass icon
dialog box:
2. Click New User.
on your desktop to display the User Login
3. Select your user name in the New User text box.
4. Enter a user ID in the New User ID text box.
5. Confirm the user ID in the Confirm User ID text box.
6. Enter a password in the New Password text box.
Note: The password is case sensitive
7. Confirm the password in the Confirm Password text box.
8. Click OK.
- 37 -
Page 40
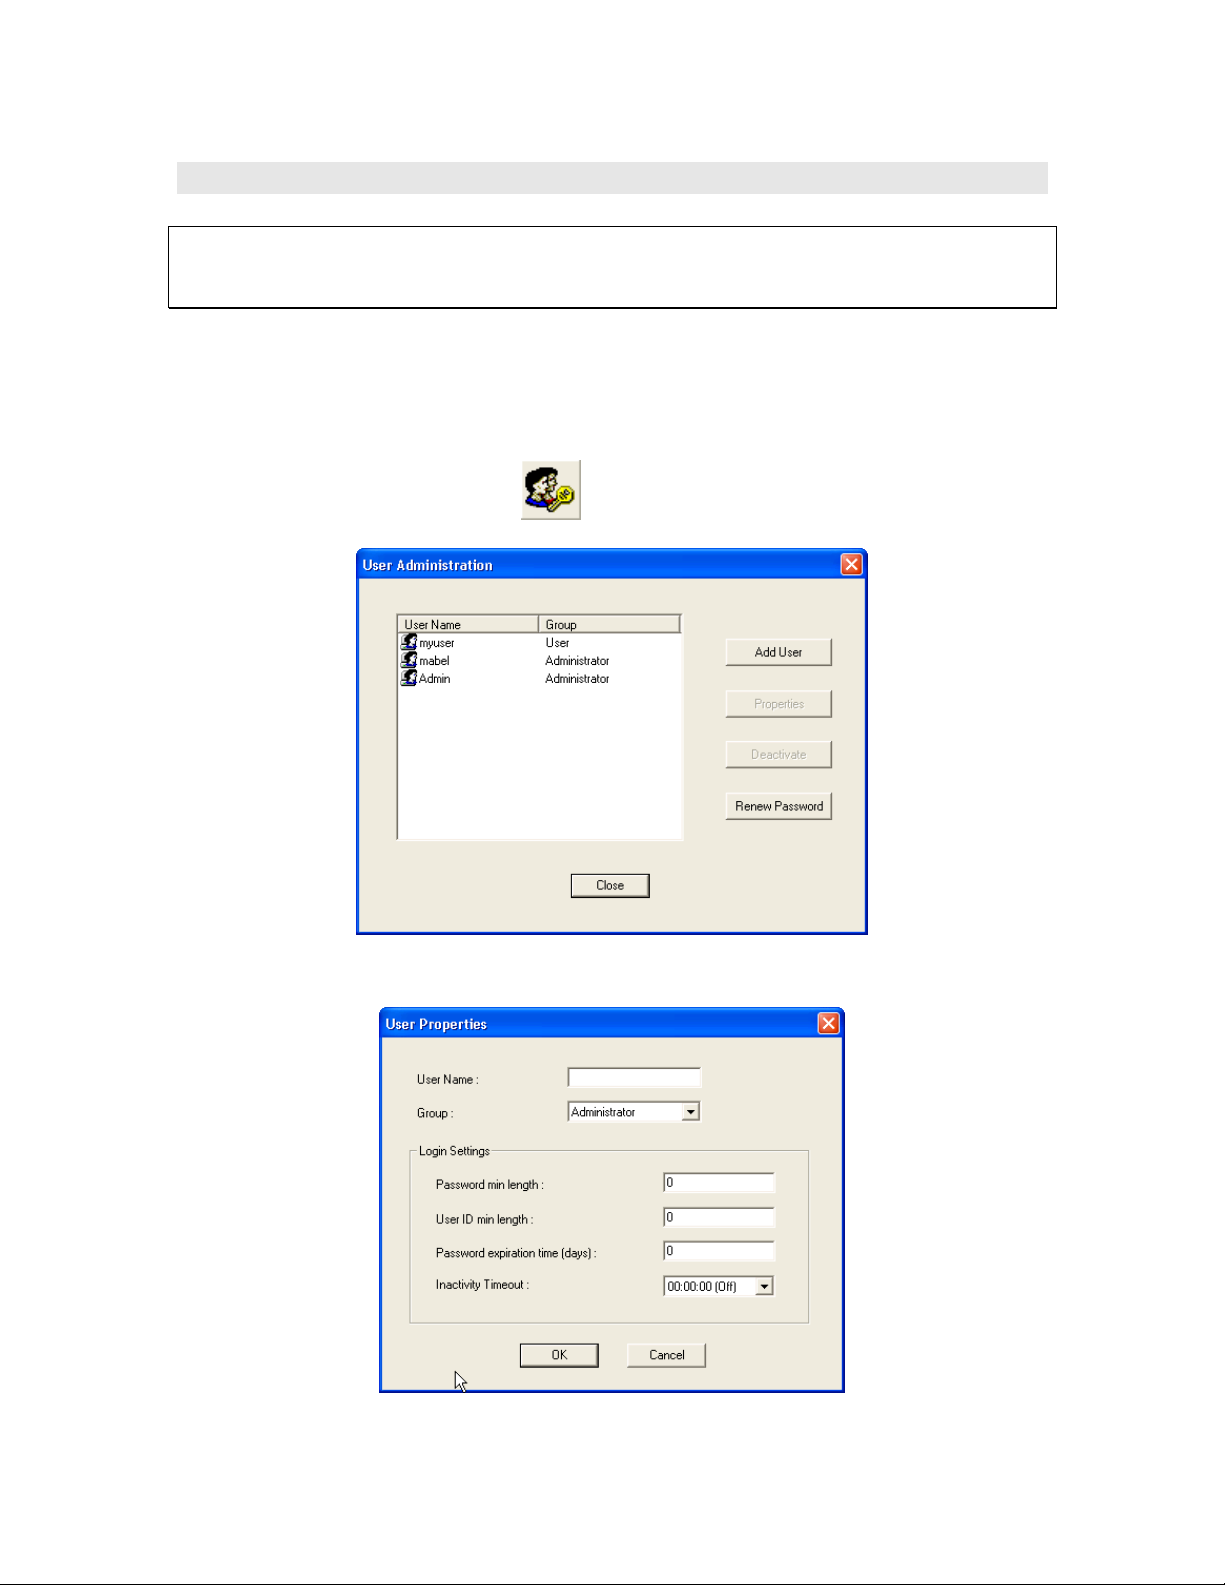
User Administration
Note: If are working in an archived audit trail (refer to page 44), then to access User
Administration you must first exit DatPass and login again to load the Current
database.
Adding a User
An administrator can add new users, assign privileges to the user and set the login
preferences.
To add a new user:
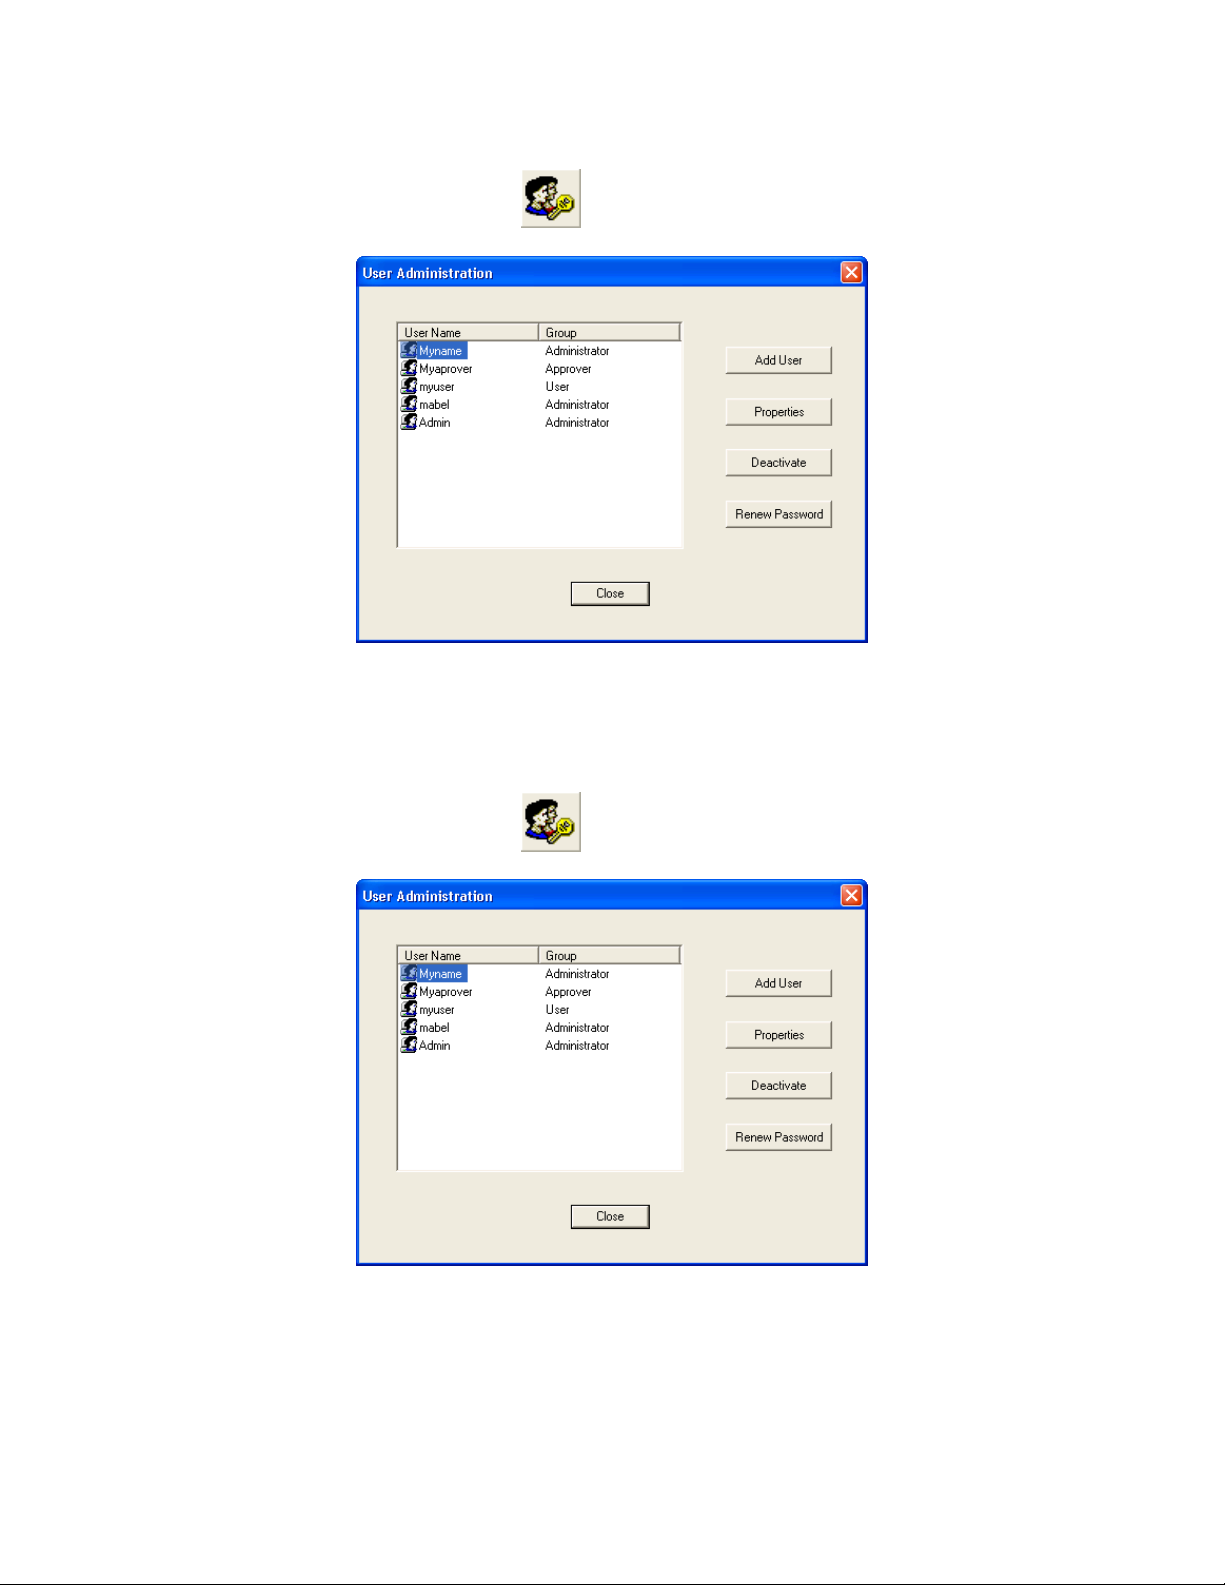
1. Click User Administration
2. Click Add User.
on the main toolbar.
- 38 -
Page 41
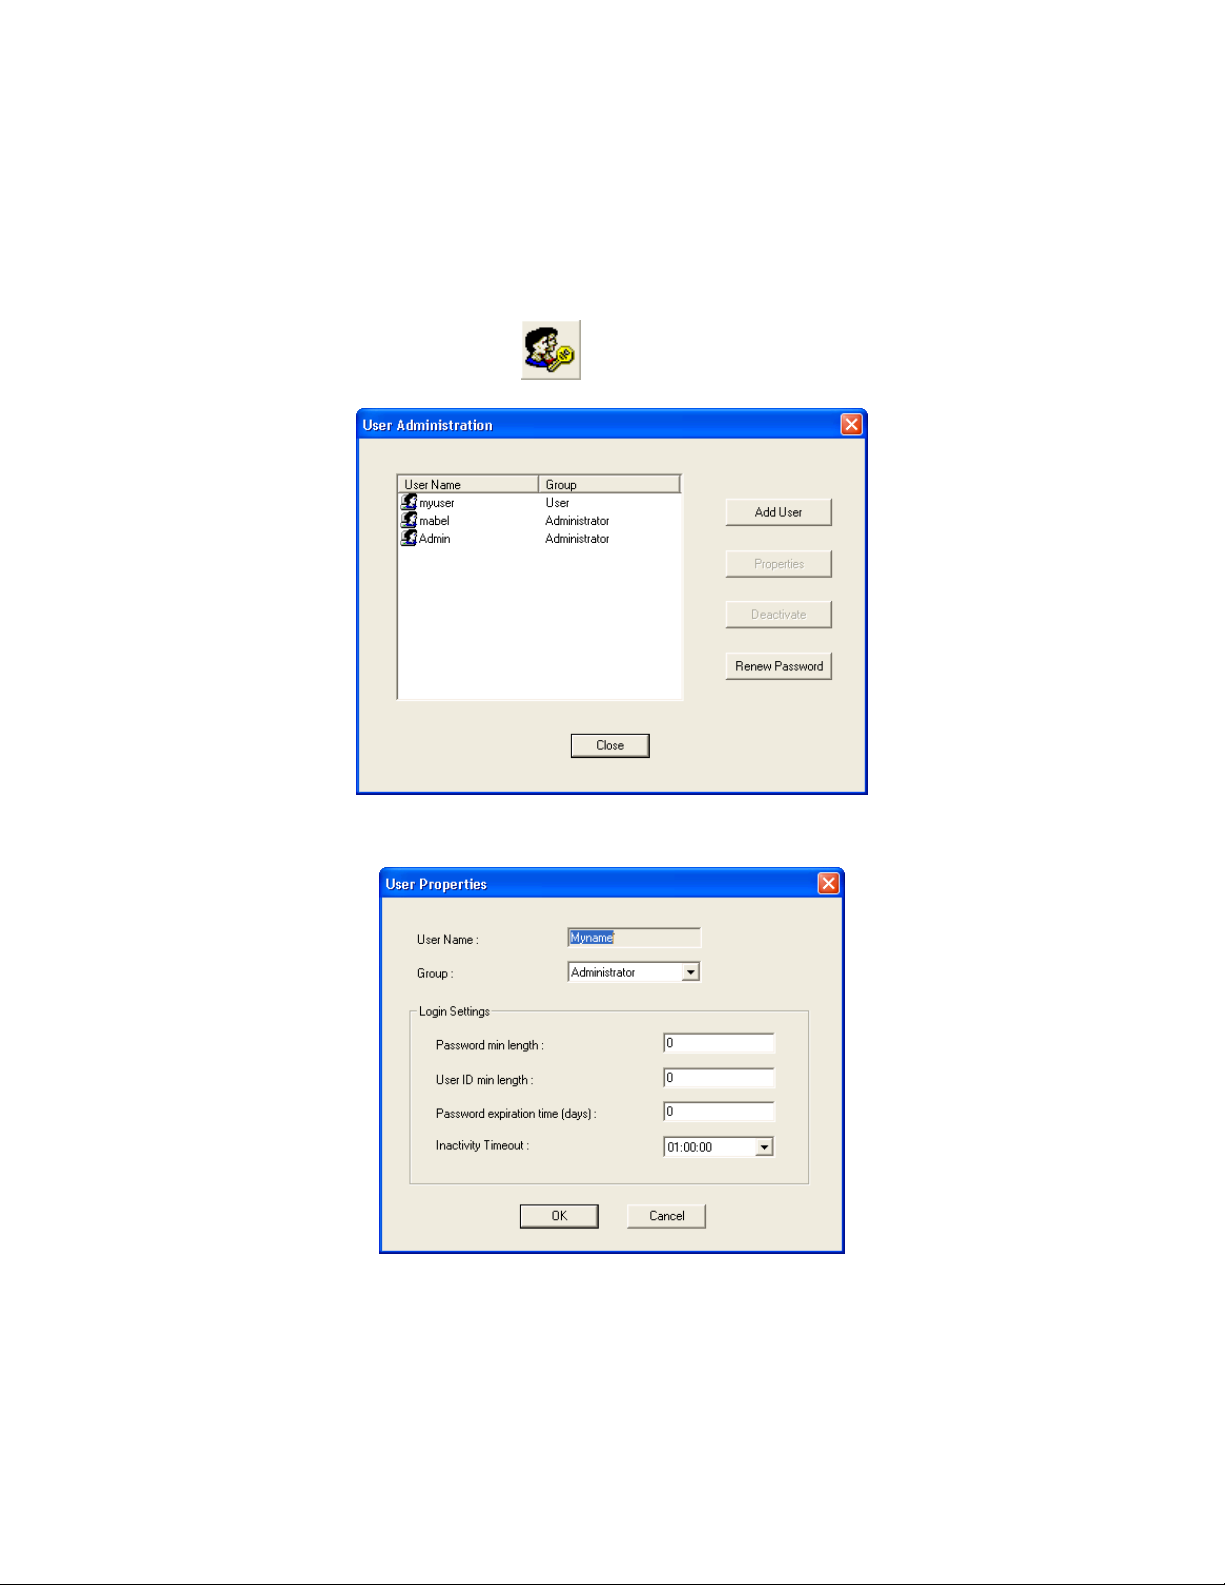
3. Enter a user name in the User Name text box.
4. Select a user group in the Group drop-down menu.
5. Set the login preferences in the Login Settings area.
6. Click OK.
Changing User Properties
1. Click User Administration
2. Select a user name from the list, then click Properties.
on the main toolbar.
3. Modify the user group and/or the settings, and then click OK.
- 39 -
Page 42
Deactivating a User
1. Click User Administration
2. Select a user name from the list, and then click Deactivate.
You can always reactivate the user by repeating the process, and then clicking
Activate.
Changing Password
on the main toolbar.
1. Click User Administration
2. Select a user name from the list, and then click Renew Password.
The next time the user will open DatPass, he will be prompted to enter a new
password.
on the main toolbar.
- 40 -
Page 43
Group Administration
Note: If are working in an archived audit trail (refer to page 44), then to access Group
Administration you must first exit DatPass and login again to load the Current
database.
Group Privileges
Users are assigned to user groups and are granted the privileges granted to the group.
A privilege is a user’s right to perform a specific task in DatPass or MicroLab.
DatPass comes with three predefined user groups: Administrator, Approver and User.
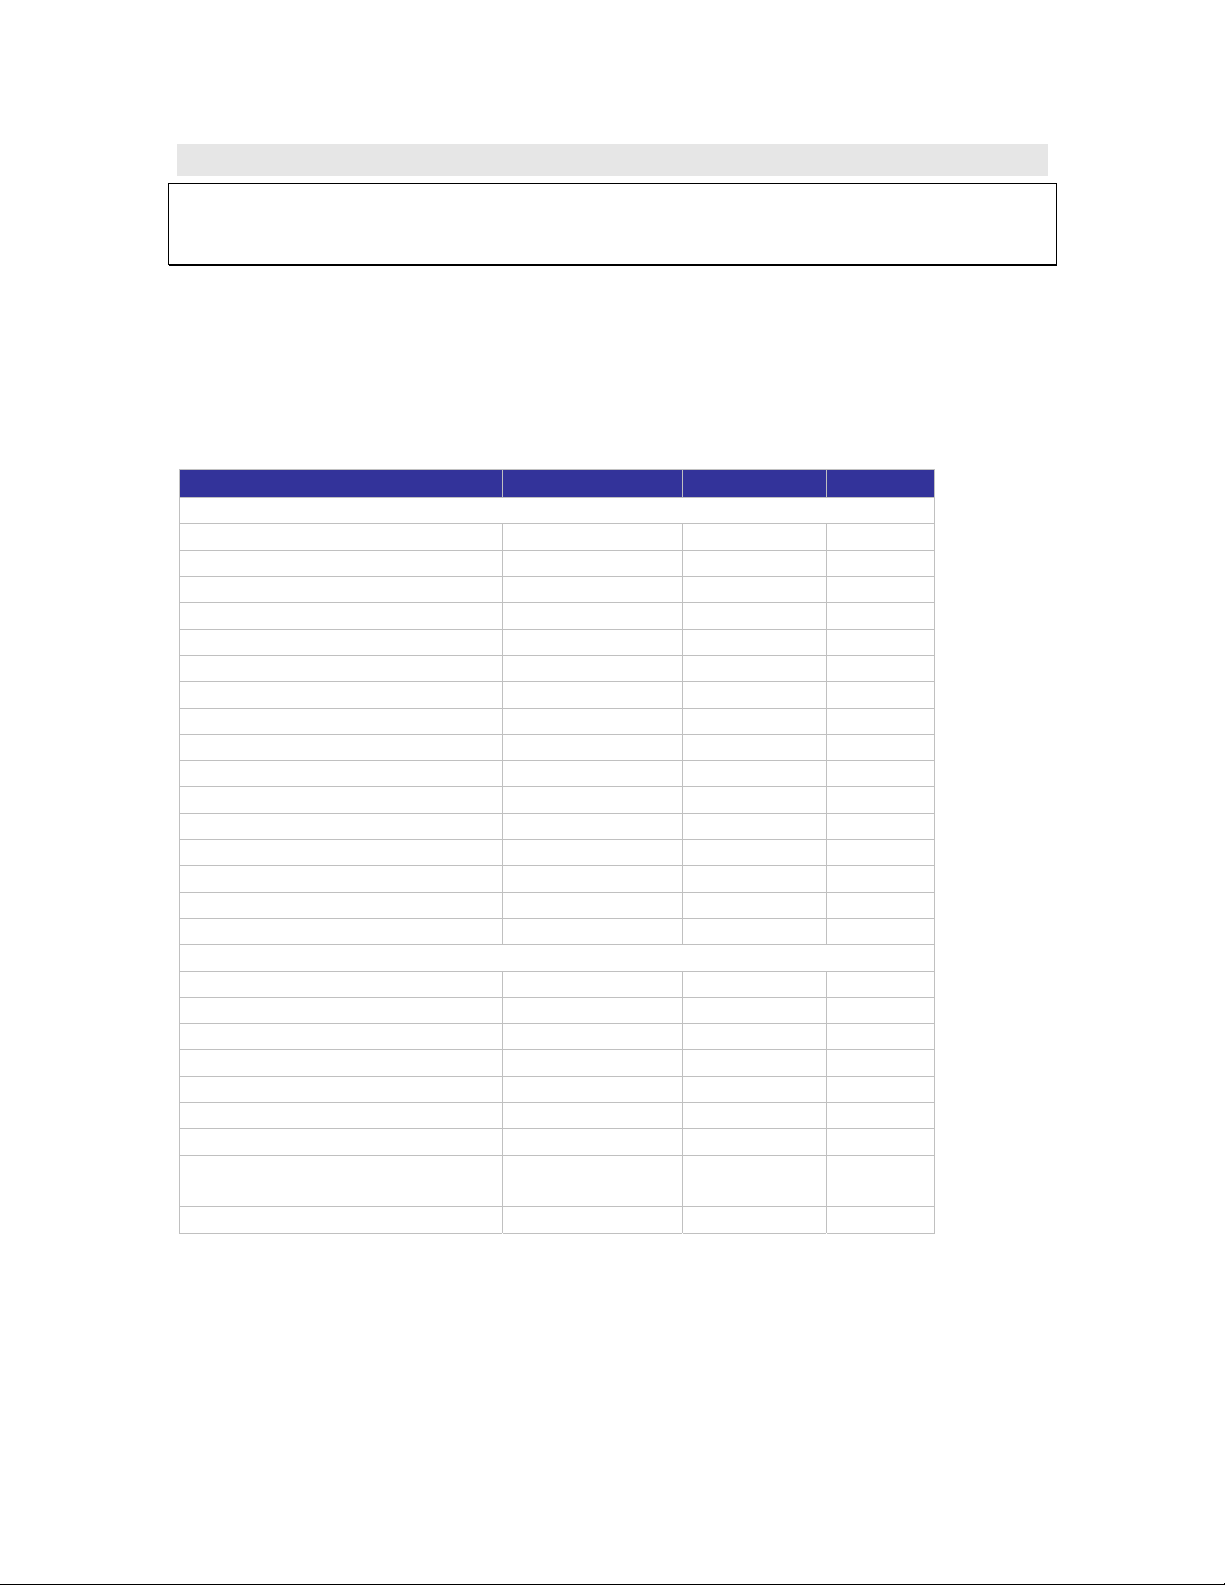
See the table below for the privileges granted to each group.
Privilege Administrator Approver User
Data
New
Open files
Save files
Save as
User administration
View/Maintain Audit trail
Exit application
Copy graph
Crop data
Export data to Excel
Printout
Update email settings
Update store data folder
Edit cradle map
Set active cradle range
Add electronic signature
Logger controls
Communication setup
Download
Setup
Run
Stop
Calibrate
Temp units
Daily download software
settings
Define sensors
The administrator can create a new user group and delete unused groups.
9 9 9
9 9 9
9 9 9
9 9 9
9
9
9 9 9
9 9 9
9 9 9
9 9 9
9 9 9
9 9 9
9 9 9
9 9 9
9 9 9
9 9
9 9 9
9 9 9
9 9 9
9 9 9
9 9 9
9
9 9 9
9 9 9
9 9 9
- 41 -
Page 44
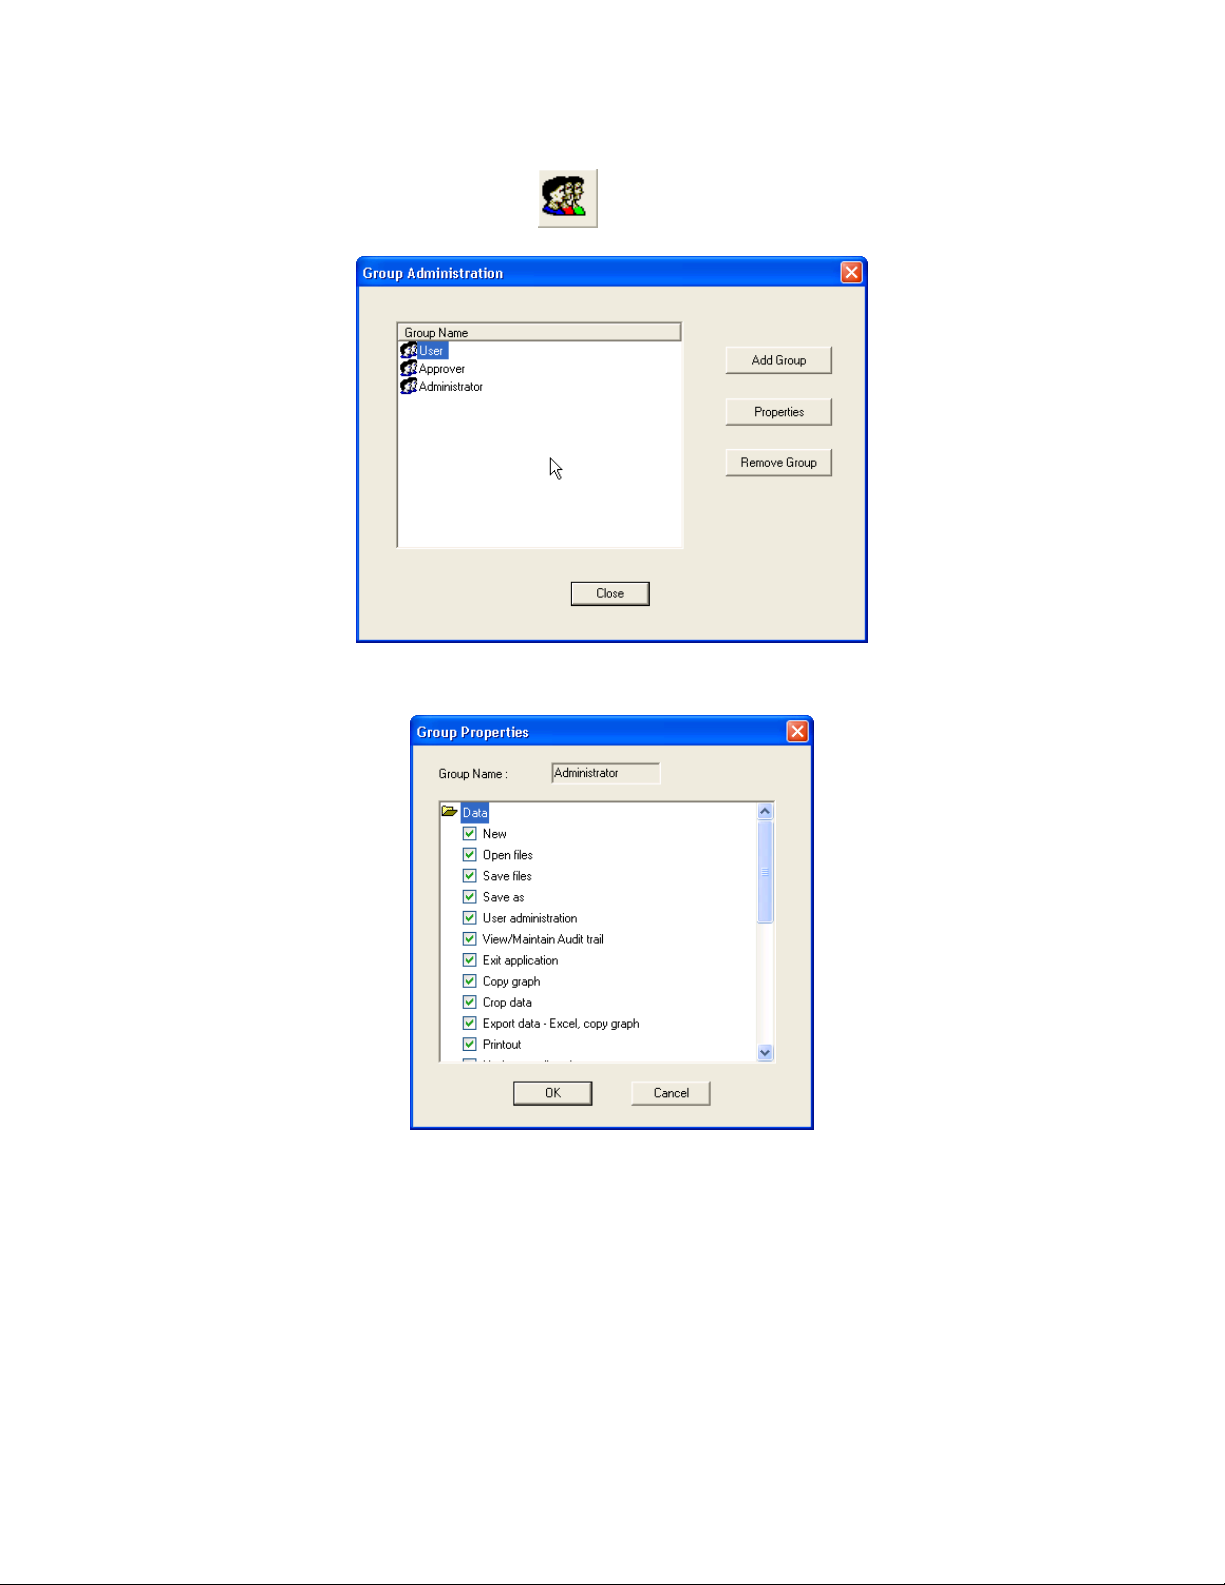
Changing Group Privileges
1. Click Group Administration
2. Click a group name to select it, and then click Properties.
on the main toolbar.
3. To add a privilege to the group, check the check box next to it.
4. To remove a privilege from the group, uncheck the check box next to it.
5. Click OK.
- 42 -
Page 45
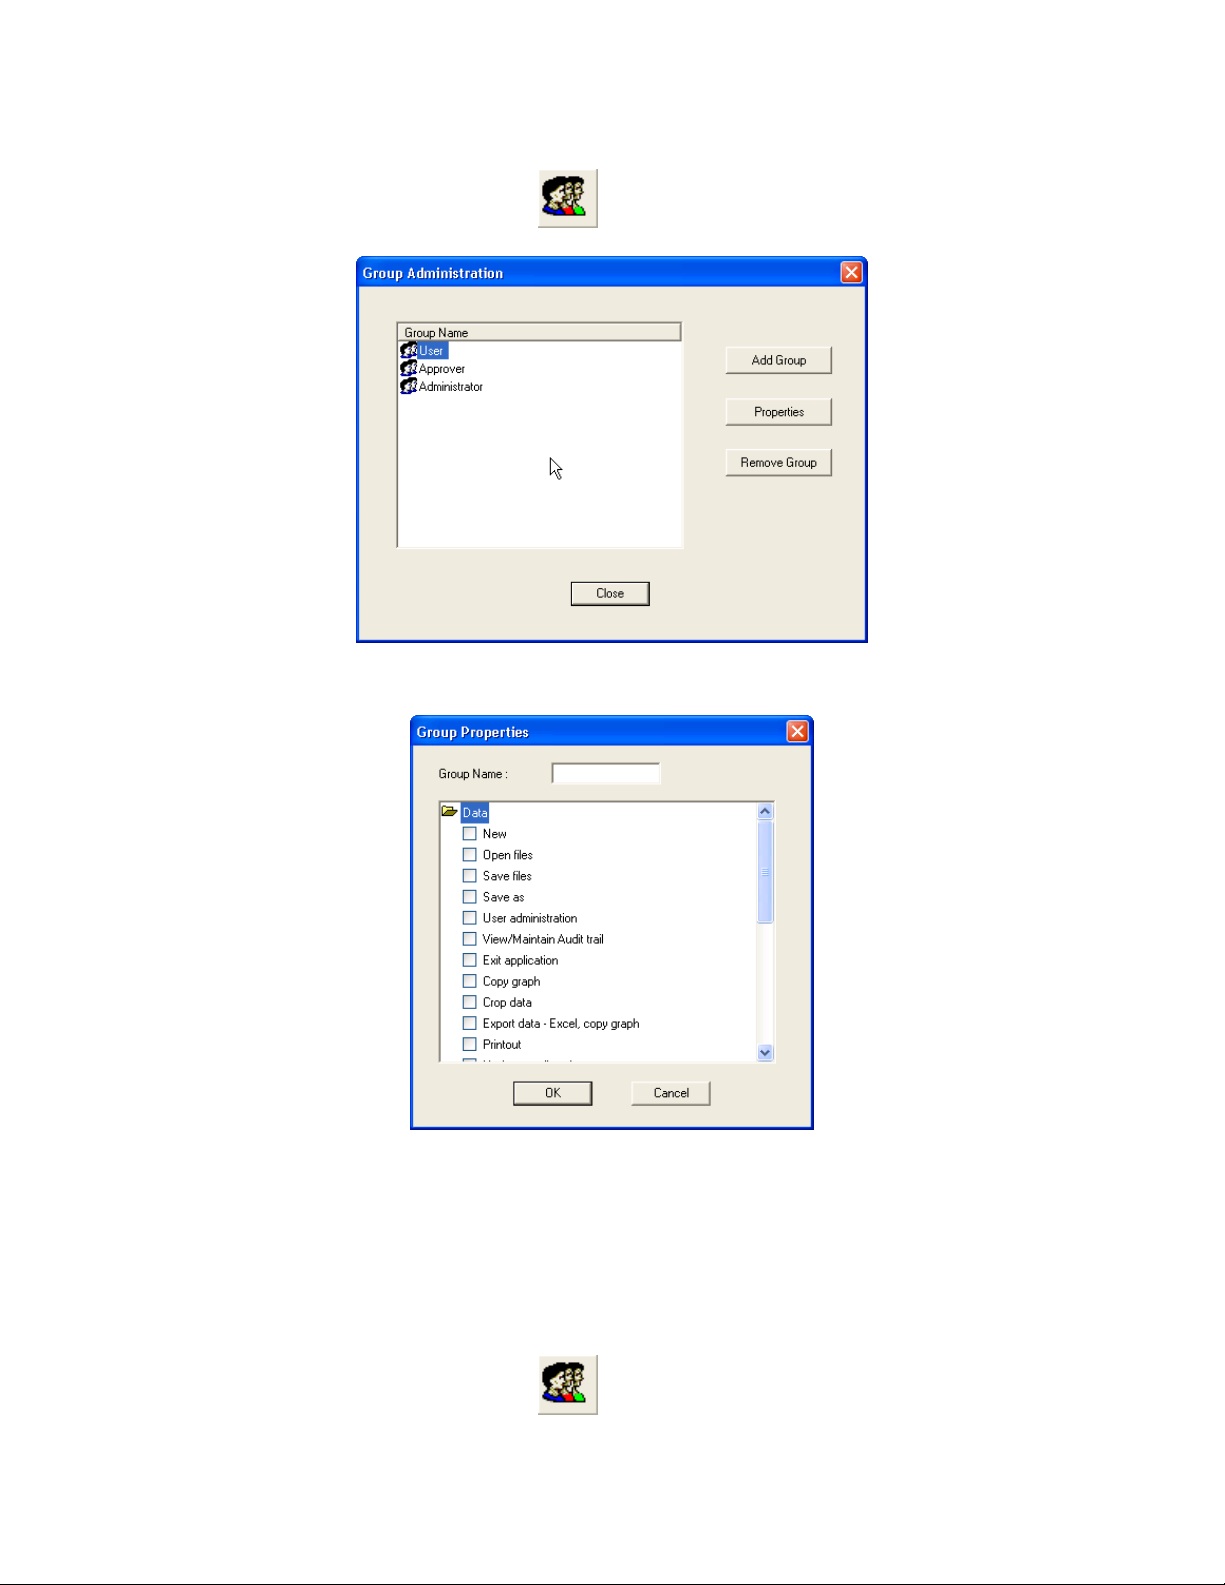
Adding a New Group of Users
1. Click Group Administration
2. Click Add Group.
on the main toolbar.
3. Type in a group name in the Group Name text box.
4. To add a privilege to the group, check the check box next to it.
5. To remove a privilege from the group, uncheck the check box next to it.
6. Click OK.
Removing a User Group
1. Ensure that the group you want to remove is not assigned to any user.
2. Click Group Administration
- 43 -
on the main toolbar.
Page 46
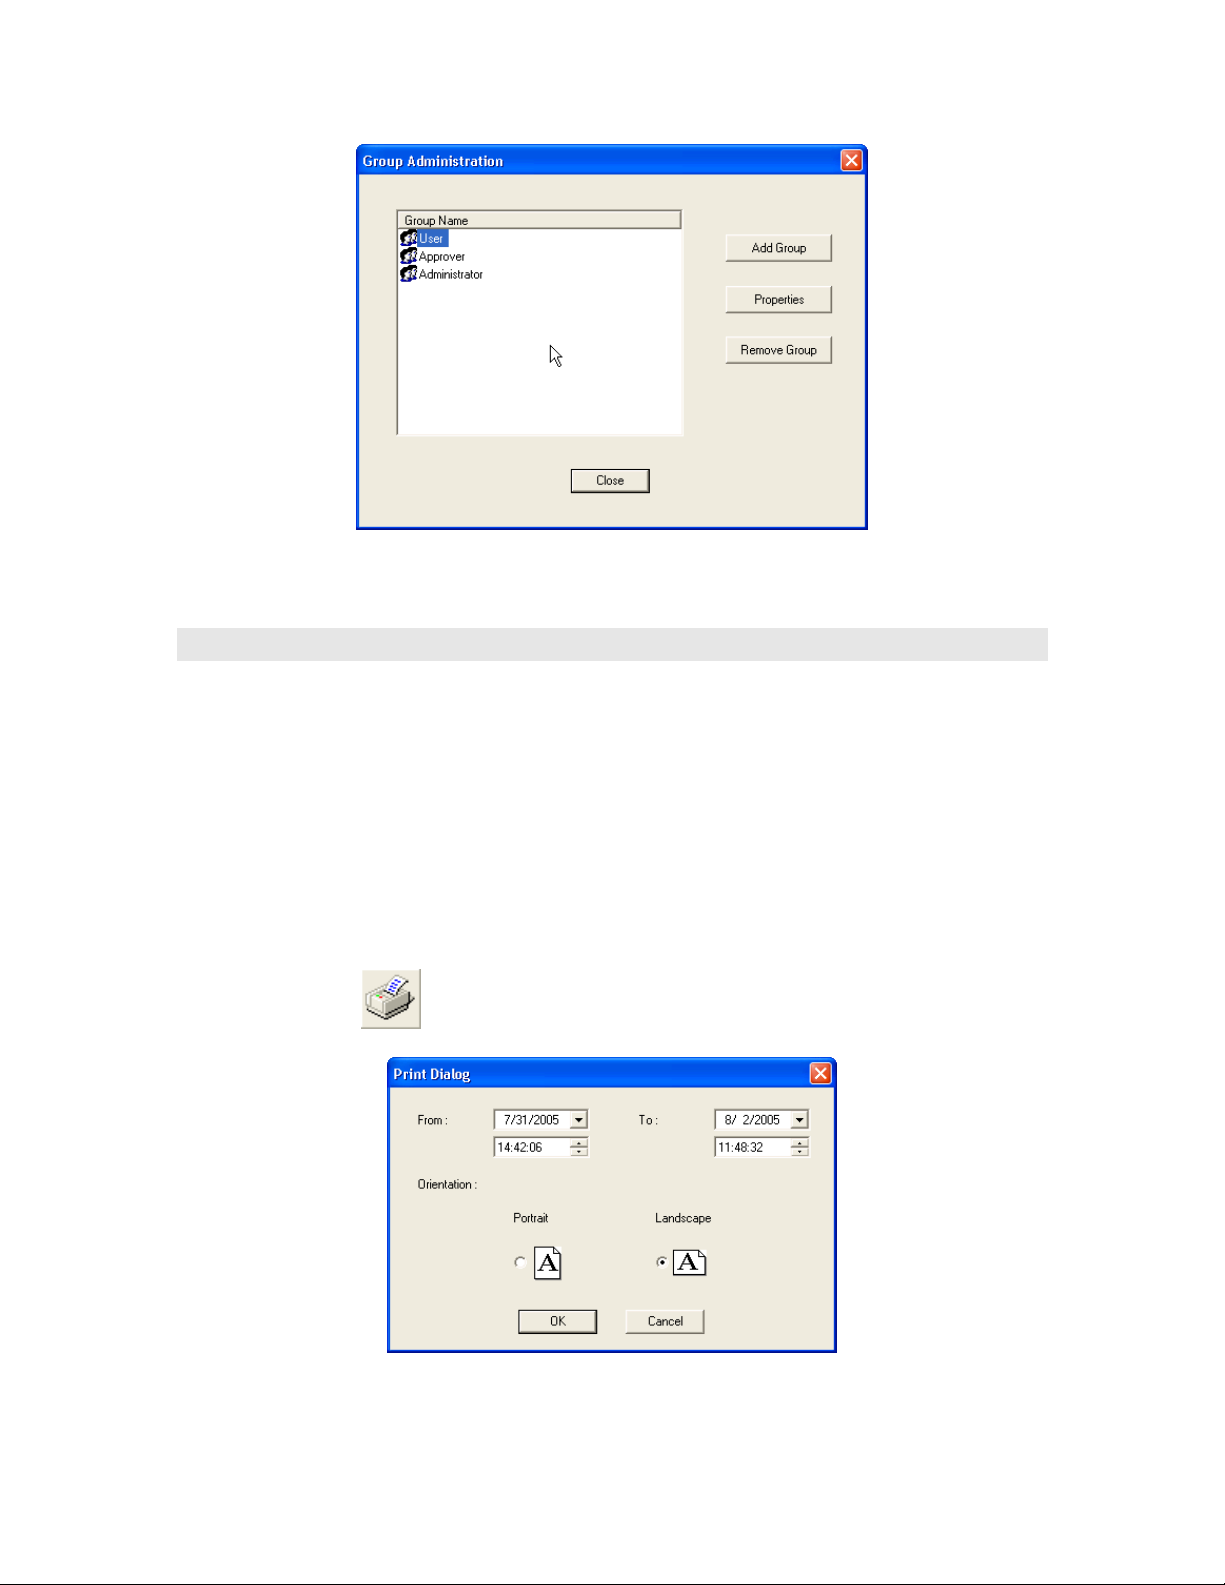
3. Click the group name to select it, and then click Remove Group.
4. Click Close.
Audit Trail
DatPass maintains an audit trail that automatically records any user activity within
DatPass or MicroLab software.
The audit trail shows who has accessed the system and what operations he has
performed, along with a date & time stamp of the activity. The audit trail also tracks
invalid logins to the system.
The administrator can view the audit trail on screen or print any part of it.
DatPass allows you to create new audit trails while automatically saving the current trail.
Whenever a user uses the command Run, Stop or Setup for a MicroLite, from
MicroLab, the user is prompted to type a reason for his action. In such cases the audit
trail records and displays the reason.
Printing the Audit Trail
1. Click Print
2. Select the start date and time in the From pick lists.
3. Select the end date and time in the To pick lists.
- 44 -
on the main toolbar.
Page 47
4. Select the page orientation.
5. Click OK.
Refreshing the Audit Trail
To refresh the audit trail display click Refresh
Viewing a Specific Date
To view audit trail entries on a specific date:
1. Click the down arrow next to the date drop-down list
main toolbar.
2. Select the desired date.
The display will automatically scroll to the selected date.
Starting a New Audit Trail
Click File on the main menu, and then click New.
DatPass will automatically save the current audit trail, and open a new blank audit trail
log.
DatPass saves the audit trail under the name: DatPass [date and time].
Note: You can only open a new audit trail when working in the Current database
Opening an Old Audit Trail
1. Click Open
2. Navigate to the folder: My Documents\Omega\DatPass
3. Double click the desired file name.
Note: DatPass saves the audit trail under the name: DatPass [date and time]
To return to the current audit trail, repeat steps 1 and 2, then double click the file:
Current
on the main toolbar.
on the main toolbar.
on the
Moving the Current Database
The Current.mdb file is by default located in the DatPass directory on your local
computer. This file contains the current audit trail of user activity in DatPass and
MicroLab.
When the Current database is located locally, it only tracks user activity on your
computer. In order to maintain an audit trail of user activity over a network, rather than
locally, you must store the DatPass Current.mdb file in a directory on the main network
server to which the MicroLab users are connected.
To move the database file in DatPass:
1. Click Move Database on the File menu.
- 45 -
Page 48
2. In the Set Database Path dialog box, click Browse and browse to the new
location of the database file.
3. Ensure that all MicroLab software is closed and exit DatPass, then re-enter
DatPass.
4. You should receive a system message confirming the database move, and you
should also be able to view the action in the Audit Trail.
Note: You will only be able to move the database if you have the Group privilege to do
so. The Move Database check box must be checked in the Group Properties dialog
box.
When the Current.mdb file has been moved using DatPass, the database path must also
be updated for all MicroLab software users on the network.
To correct the database file path in MicroLab:
1. When logging into the software for the first time following a database move, you
will see a system message stating that the database file was not found.
In the next dialog box, enter the default system password (refer to the
Move Database Password section below) and click Browse.
2. Browse to the new path of the database file, as defined in DatPass, and click OK.
3. Login in to the software as you normally would.
The DatPass Admin will now be able to view the audit trail of all users of the MicroLab
software on the network.
Move Database Password
The default password allowing users of MicroLab to correct the database file path once it
has been moved is:
omega
This password is case sensitive and cannot be changed.
- 46 -
Page 49
Chapter 8: MicroLab User Guide
MicroLab Software Overview
The MicroLab software was designed to allow for the programming of the desired data
recording specifications for MicroLite, to enable the downloading of recorded data to a
PC, and to store, view and analyze the data. This software is also integrated with the
DatPass Administration application, as outlined earlier in this document. Any activity in
MicroLab is monitored in the DatPass Audit Trail.
The Logger menu handles all communication between the PC and MicroLite, such as
programming the desired recording mode, starting or stopping data recording, as well as
downloading the data.
The View menu controls the various data display options. Data can be viewed in graph
format, in table format, or in both. The Data Map is a separate pane that displays a list of
the open data sets. It can also be used to quickly navigate through the data sets.
The Graph menu contains all the commands needed to format and edit the graph.
The most common tasks and commands are available as buttons on the main toolbar
and on the graph toolbar.
Software Installation
System Requirements
To work with MicroLab your system should be configured with the following:
Software
• Windows 98 SE, Windows 2000, Windows XP, Server 2003 and Vista
• Internet Explorer 5.0 or higher
Hardware
• Pentium 200 MHz or higher
• 32 MB RAM (64 MB recommended)
• 5 MB available disk space for the MicroLab application
Installation Procedure
Note: Do not connect the MicroLite to the computer until installation of software and
USB driver is complete.
1. Insert the Omega software CD into your PC CD drive and browse to the MicroLab
folder. Run the setup.exe installation file.
2. The MicroLab software will first be installed. Follow the on-screen instructions to
continue the installation process.
3. Once the MicroLab software has been installed the Silicon Laboratories USB driver
installation will begin automatically. The driver is required in order for the computer to
detect the MicroLite logger.
4. Follow the on-screen instructions to continue the installation process. The default
installation location is C:\SiLabs.
- 47 -
Page 50
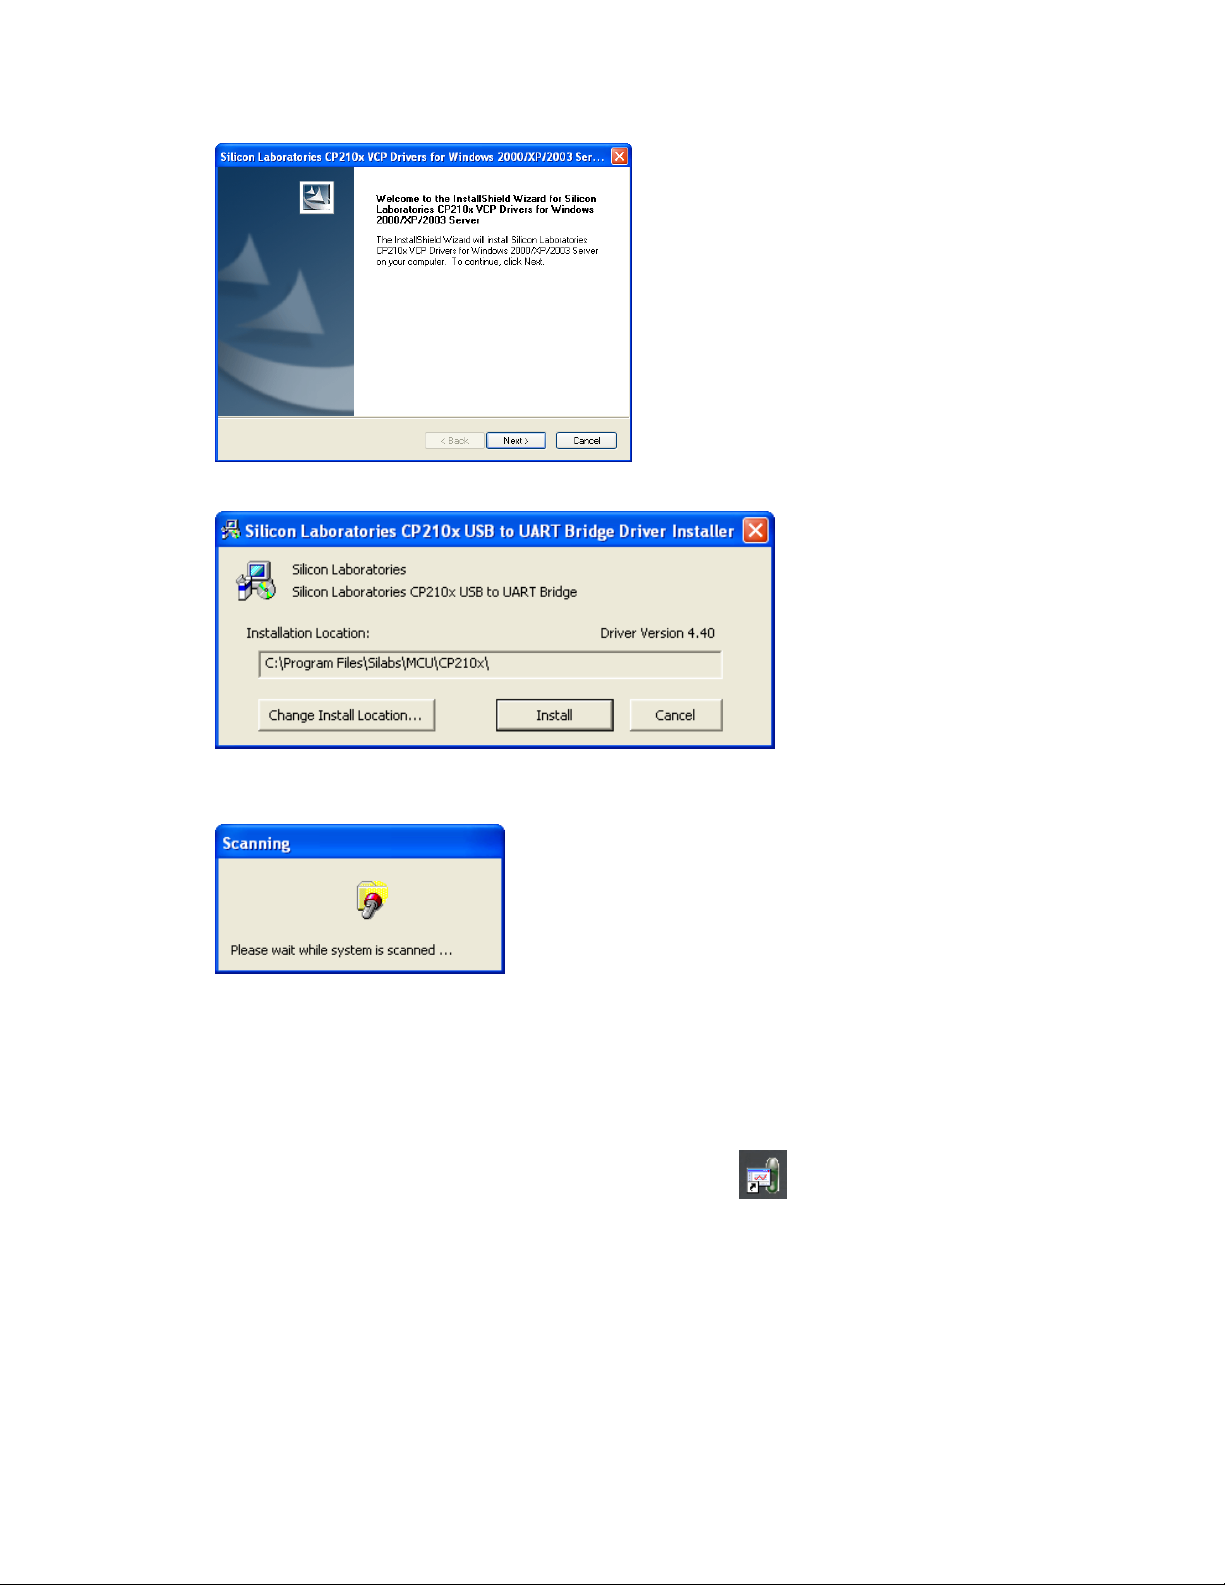
5. When the following dialog pops up, click Install.
6. The installation of the driver could take up to one minute or more, depending on the
system.
7. Once installed, click Finish to close the USB driver Install Wizard dialog.
8. The main MicroLab InstallShield Wizard now resumes.
9. After a few more seconds, the installation process is completed. Click Finish.
10. Connect the MicroLite to a USB port on your PC. The PC will automatically detect
the MicroLite as new hardware. After a few seconds you will see a message stating
that the device is ready for use.
11. Double click the MicroLab shortcut on your desktop
the MicroLite is connected to the PC the software will automatically detect it.
Troubleshooting
When connected to the PC USB port the MicroLite was not detected by the software.
Ensure that the USB driver was installed properly.
If it is, then the MicroLite LED will light green when connected to the USB.
to launch the software. If
- 48 -
Page 51
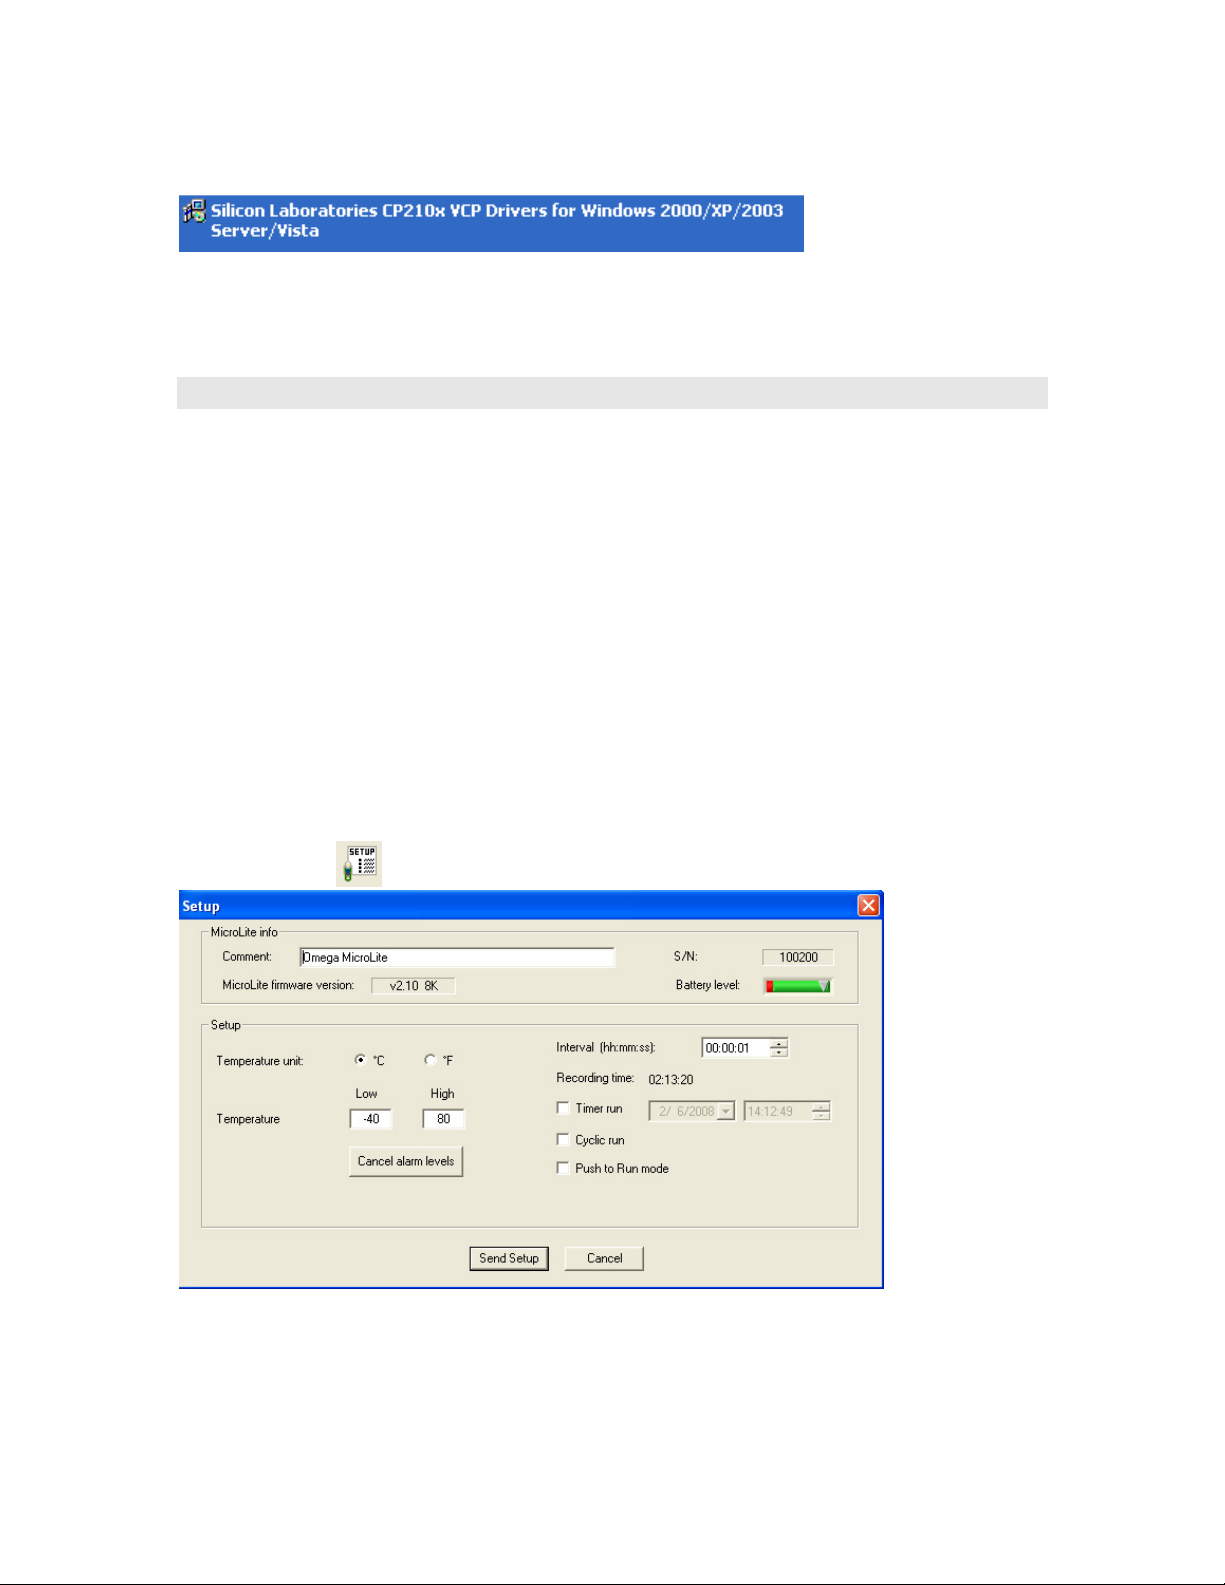
Go to Control Panel > Add/Remove Programs (in WinXP), and check that the driver is
installed:
If not, you must rerun the MicroLite setup.exe to install the driver.
If the driver is installed, ensure that there is no other device sharing the USB com port
with the MicroLite.
Getting Started
Logging in to MicroLab
When launching the MicroLab application you will need a username and password in
order to access the software. The USB security dongle must also be connected to the
PC. Please read Chapter 7: DatPass User Guide to learn how to use the dongle and
how to define a user for MicroLab.
Logging Off from MicroLab
When you have finished using the MicroLab software you may go to File > Log Off to
sign out from the application without exiting it altogether. To access the MicroLab
functionality again simply enter the login details in the User Login dialog that is open on
the screen.
Setting up the MicroLite
Use the Setup dialog box to view or change the MicroLite settings.
1. Connect MicroLite to the PC.
2. Click Setup
Figure 4: Setup dialog box
to open the Setup dialog box.
- 49 -
Page 52

The dialog box consists of two main sections:
• MicroLite info
Comment
S/N
Battery Level
Shows the current status of the MicroLite battery. If the indicator is
MicroLite firmware version
Displays the firmware version and the memory capacity, either 8K
• Setup
Temperature unit
To set the temperature unit in the MicroLite display, select the option
Temperature alarm
Type in the desired Low and High alarm levels. If the MicroLite
Interval
This determines the logging interval, or the time interval between
Recording Time
Displays the total recording time according to the logging interval
Timer run
Select the Timer run check box if you want MicroLite to start
Cyclic run
In Cyclic run mode, the MicroLite overwrites the old measurements
Click the text box and type a name that will serve to identify the
specific MicroLite (e.g. its location).
Displays the MicroLite’s serial number.
in the red zone the battery should be replaced.
(8,000) or 16K (16,000) samples.
you want (Celsius or Fahrenheit).
records a reading that exceeds either of these levels, the MicroLite’s
LCD will display an alarm notification.
The default alarm levels are the lower and upper ends of the
temperature sensor range. Click Cancel Alarm to restore the default
levels.
successive data recordings.
The time format is hh:mm:ss. Set the time setting to select a
recording time interval from 1 second to 2 hours. For example, to
set a time interval of one hour, five minutes and thirty seconds, click
the hours (hh) and type 1 or use the arrows to select 01. Click the
minutes (mm) and type 5 or use the arrows, and finally, click the
seconds (ss) and type 30 or select 30 using the arrows.
selected.
recording at a predetermined time. This option is convenient if you
are using several MicroLite at once and want them to all begin
logging at the same time.
Use the time and date selectors to set the start time.
(starting with the oldest recorded data) once the MicroLite’s memory
is full. Click the Cyclic run check box to operate in this mode.
If the check box is unselected, MicroLite will operate in Normal run
mode and will stop recording when the memory is full.
- 50 -
Page 53
Push to run
In Push to run mode, the MicroLite will only start recording data
when you use the MicroLite magnet to close the reed relay on the
MicroLite’s circuit board, thereby causing the logger to start recording
data. This is convenient for when you wish to start recording data
soon (but not immediately) following setup, or at an unspecified time.
Completing the Setup
Click Send Setup to send the new settings to the MicroLite and begin recording. This
will complete the setup. Click Cancel if you do not wish to change the setup at this
stage.
Note: The Send Setup command erases all existing data in the MicroLite.
If you select Timer run mode, MicroLite will wait in standby mode, displaying tRUN. It
will begin recording at the specified time.
If you select Push to Run mode, MicroLite will also wait in standby mode, displaying
PUSH until the magnet is used to start the logger.
Starting Data Recording
Click Run every time you want to start a new recording. The Run command erases
all previous data in the MicroLite memory and begins recording.
Note: If you setup the MicroLite using the Setup command, it will automatically begin
recording, and you don’t have to click Run.
Stopping Data Recording
Click Stop to stop recording. In Stop mode, MicroLite keeps all recorded data but
does not record new data. Use this mode to save battery power.
Temperature Sensor Calibration
A new MicroLite comes fully calibrated. After a long period of use however, you may
want to recalibrate the Temperature sensor.
The calibration is made directly to the MicroLite firmware i.e. the calibrated data is
displayed on the logger LCD, not just in the software following data download.
Calibration must be carried out while MicroLite is connected to the PC.
Calibration Password
To prevent accidental change of the calibration, the calibration procedure is protected by
a password.
The default password is: 1234.
To change the password:
1. Click Logger on the main menu, and then click Calibration.
2. Click Change Password to open the Change Password dialog box.
3. Enter the current password in the Current Password field.
4. Enter the new password in the New Password field.
- 51 -
Page 54
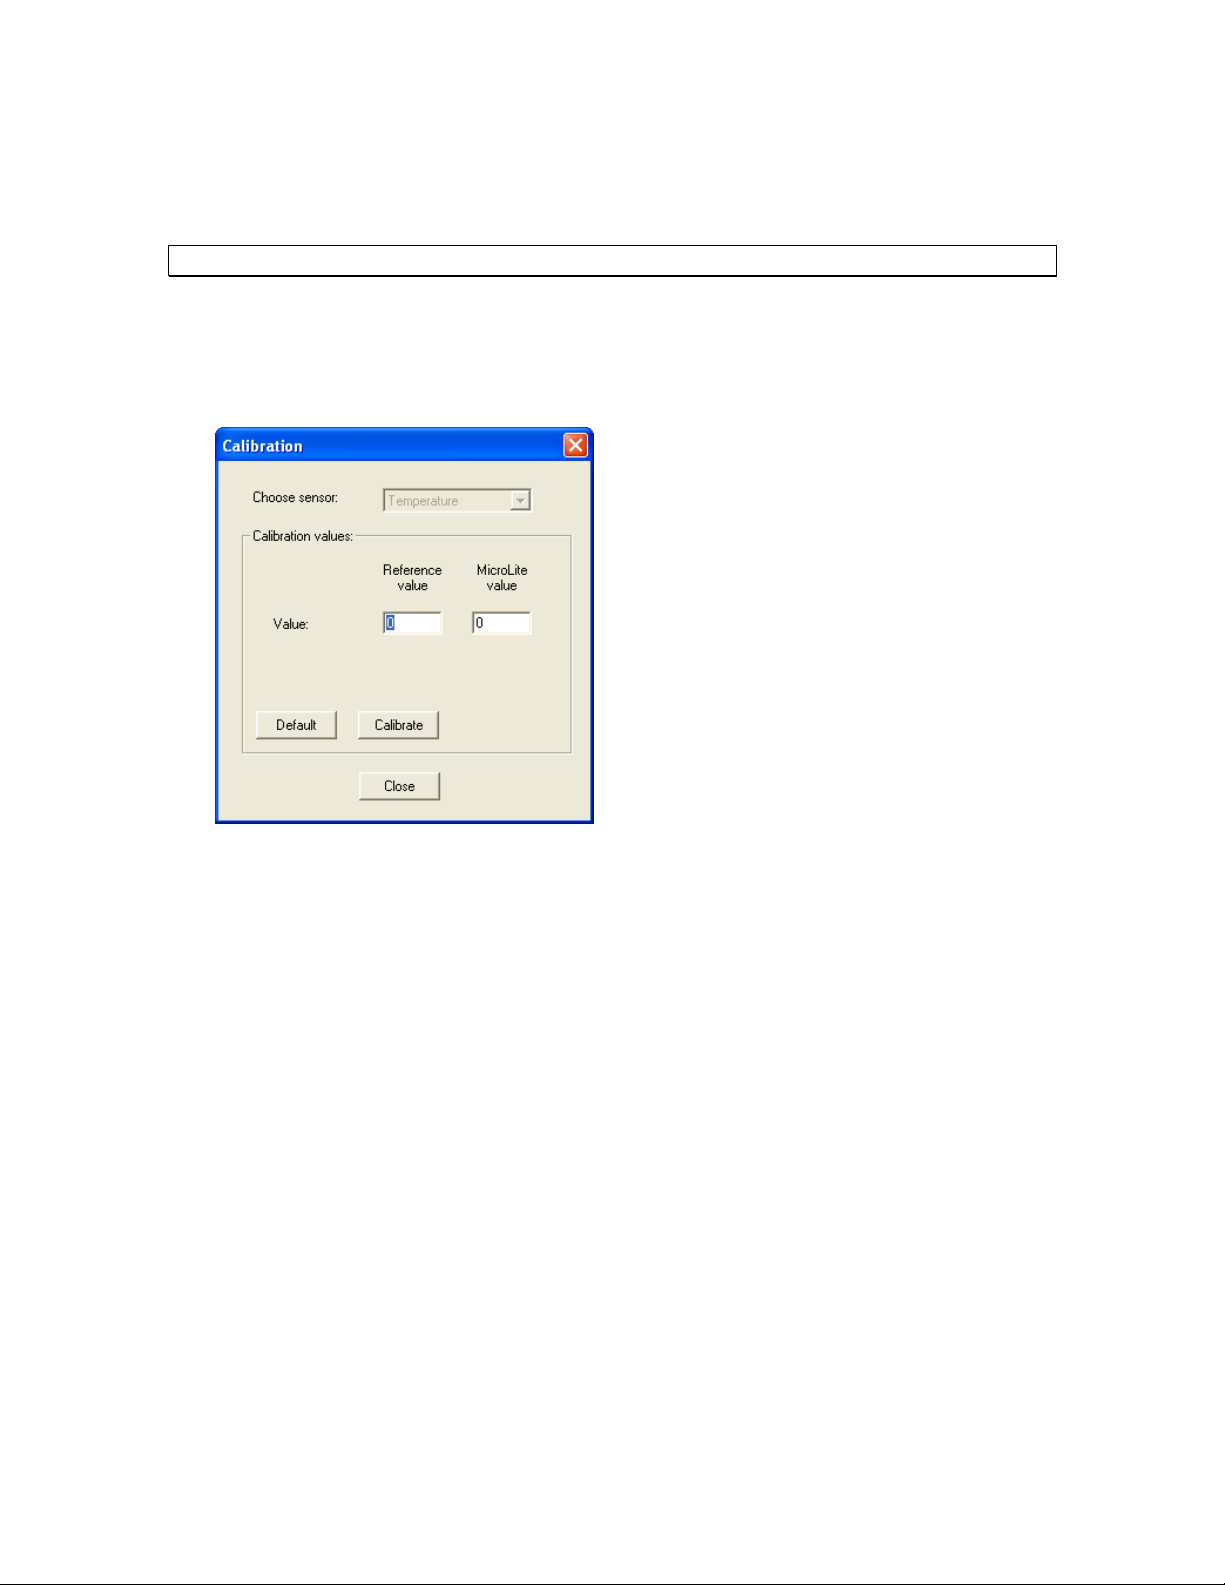
5. Enter the new password a second time in the Confirm New Password field to
confirm your new password.
6. Click OK.
Note: The password must include at least 4 characters and is case sensitive.
Temperature Calibration
1. Connect the MicroLite to the PC.
2. Click Logger on the main menu, and then click Calibration.
3. Enter the calibration password, and then click OK.
4. The Calibration dialog will open.
5. Enter the Reference value: this is the temperature value you expect the logger to
display.
6. Enter the MicroLite value: this is the temperature value the logger is currently
displaying, when compared with the reference value.
7. Click Calibrate.
To restore default calibration, click Default. This will remove any calibration applied to
the MicroLite.
Communication Setup
Communication between the PC and the MicroLite unit takes place automatically
whenever you send a command to the MicroLite. However, the Communication Setup
dialog box can be used for more advanced communication options.
Click Logger on the main menu and select Com setup to open the Communication
Setup dialog box:
- 52 -
Page 55
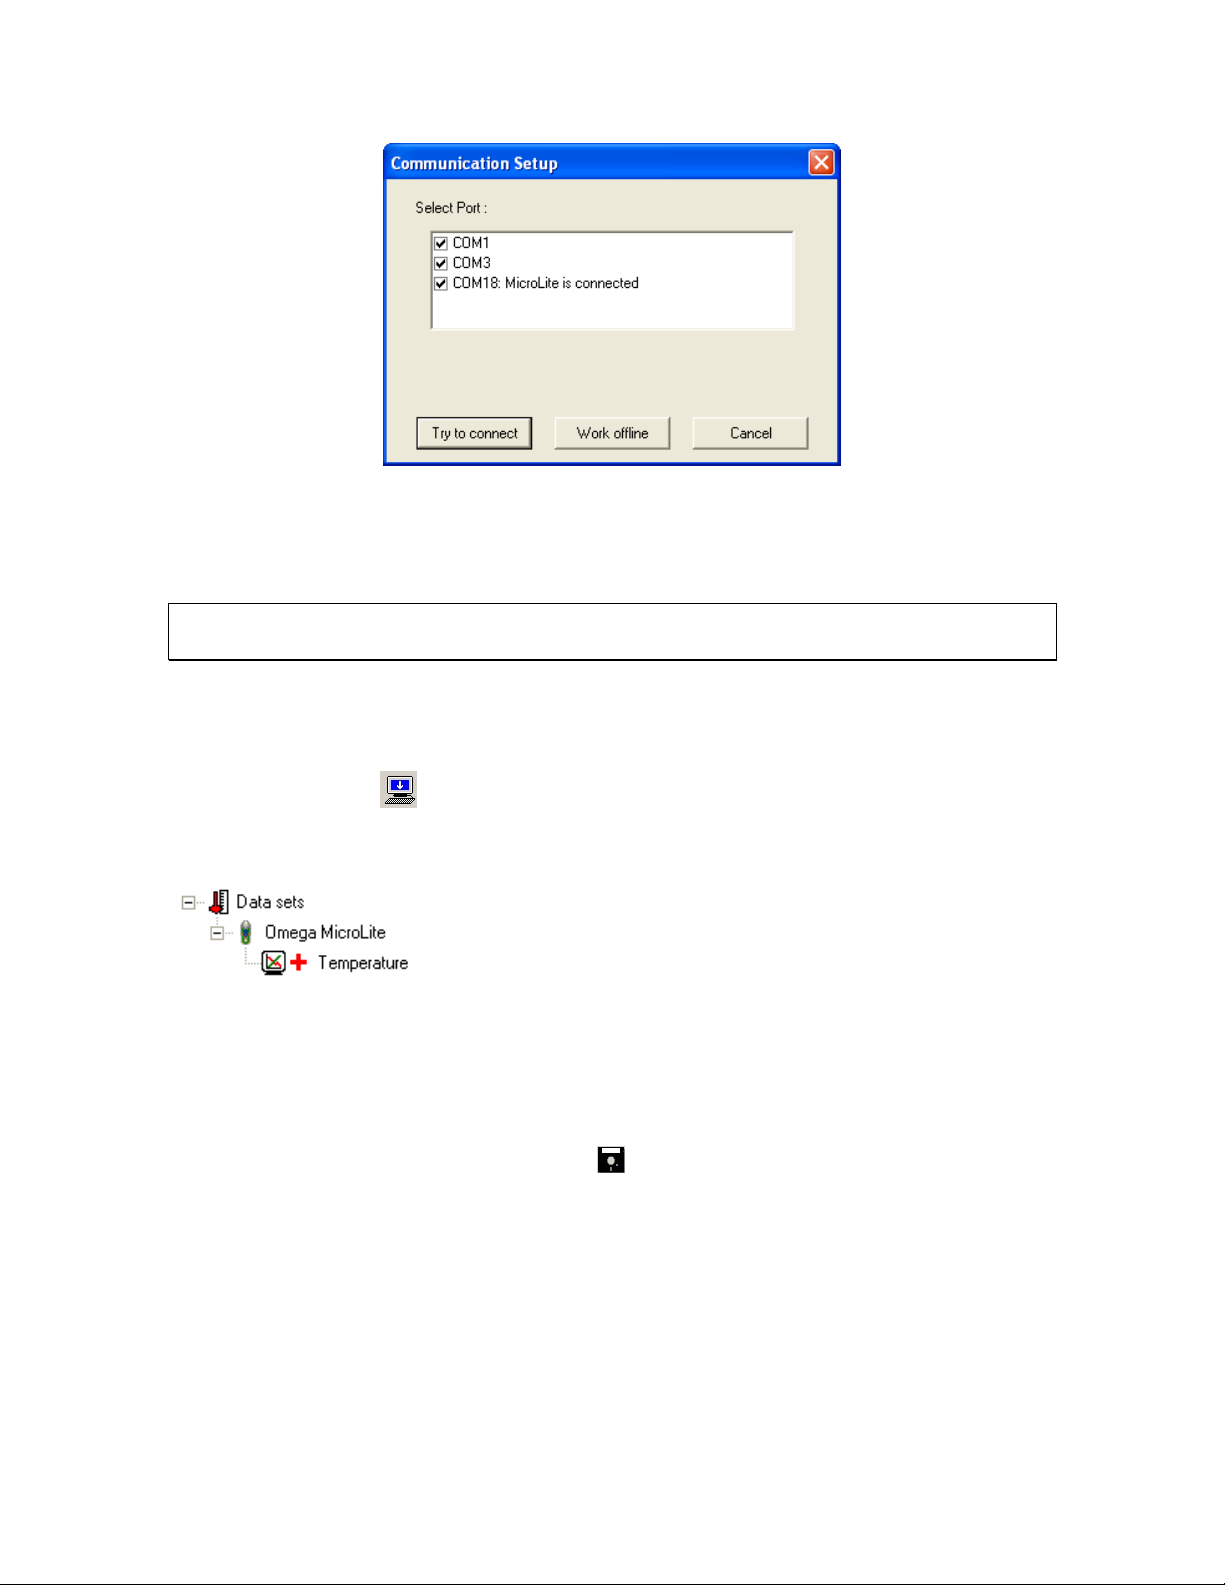
Figure 5: Communication Setup dialog box
The selected COM ports are available for communication.
1. Click Try to connect to establish communication.
2. Click Work offline to work with saved files and no logger detection is required.
Note: You can speed up the MicroLite detection process by only selecting the COM
which is being used by the MicroLite.
Downloading Data
1. Connect MicroLite to the PC.
2. Open the MicroLab software.
3. Click Download
The MicroLite will first be detected and then the download will begin. Once the data has
been downloaded, it will be displayed both in the graph and in the table, and a new data
icon will be added to the Data Map:
You can now connect a different MicroLite to the PC and download its data as well. The
number of downloads is limited only by the memory available on the computer.
Use the Data Map (refer to page 55) to navigate between the different data sets.
on the main toolbar.
Saving Data
To save the displayed data, click Save on the main toolbar. The data currently
displayed by the graph will be saved in the MicroLite Data folder:
C:\Program Files\Omega\MicroLab\MicroLite Data
The data file name consists of the MicroLite name (Comment, refer to page 50) and of
the time and date at which it was saved.
To save data in a different location or under a different name, use the Save as…
command from the File menu:
1. Select Save as… from the File menu.
2. Enter a new name in the File name box.
- 53 -
Page 56
3. To save the data in a different folder, select a drive and/or folder from the Save in
dialog box.
4. Click Save.
If you’ve downloaded data from more than one MicroLite and you want to save all the
data sets, select Save all from the File menu.
Note: If you want to remove unwanted data before saving, apply the Crop tool (refer to
page 57).
MicroLab Basics
Opening Files
1. Click Open on the main toolbar.
2. To open a file that was saved in a different folder, select a drive and/or folder in the
Look in dialog box.
3. Double-click the file you want to open.
Displaying Properties
You can change the way numbers and dates will be displayed on screen.
1. Click File on the main menu, and then click Display properties.
2. Under Decimal place settings, enter the number of decimal places you want to
display (enter a number between 0 and 4) for each sensor.
3. Under the Date format settings, select the desired format option.
4. Click OK.
Printing a Graph
1. Click Print on the main toolbar to open the Print Options dialog box.
2. Click the Graph option.
3. Click Print to open the Print dialog box.
4. Click OK.
Printing a Table
The displayed data can also be printed as a table. The printed table will include data
from all MicroLite’s that are currently represented on the graph (to learn how to add or
remove data sets from the graph, refer to page 55) as well as the MicroLite name, serial
number and the alarm level setup. Data that exceeds any of the alarm levels will be
highlighted by arrows.
1. Click Print
2. Click the Table option.
3. If you want to print only part of the data, uncheck the check box and select the
desired time and date in the From and To boxes.
4. Click Print to open the Print dialog box and click OK.
on the main toolbar to open the Print Options dialog box.
- 54 -
Page 57
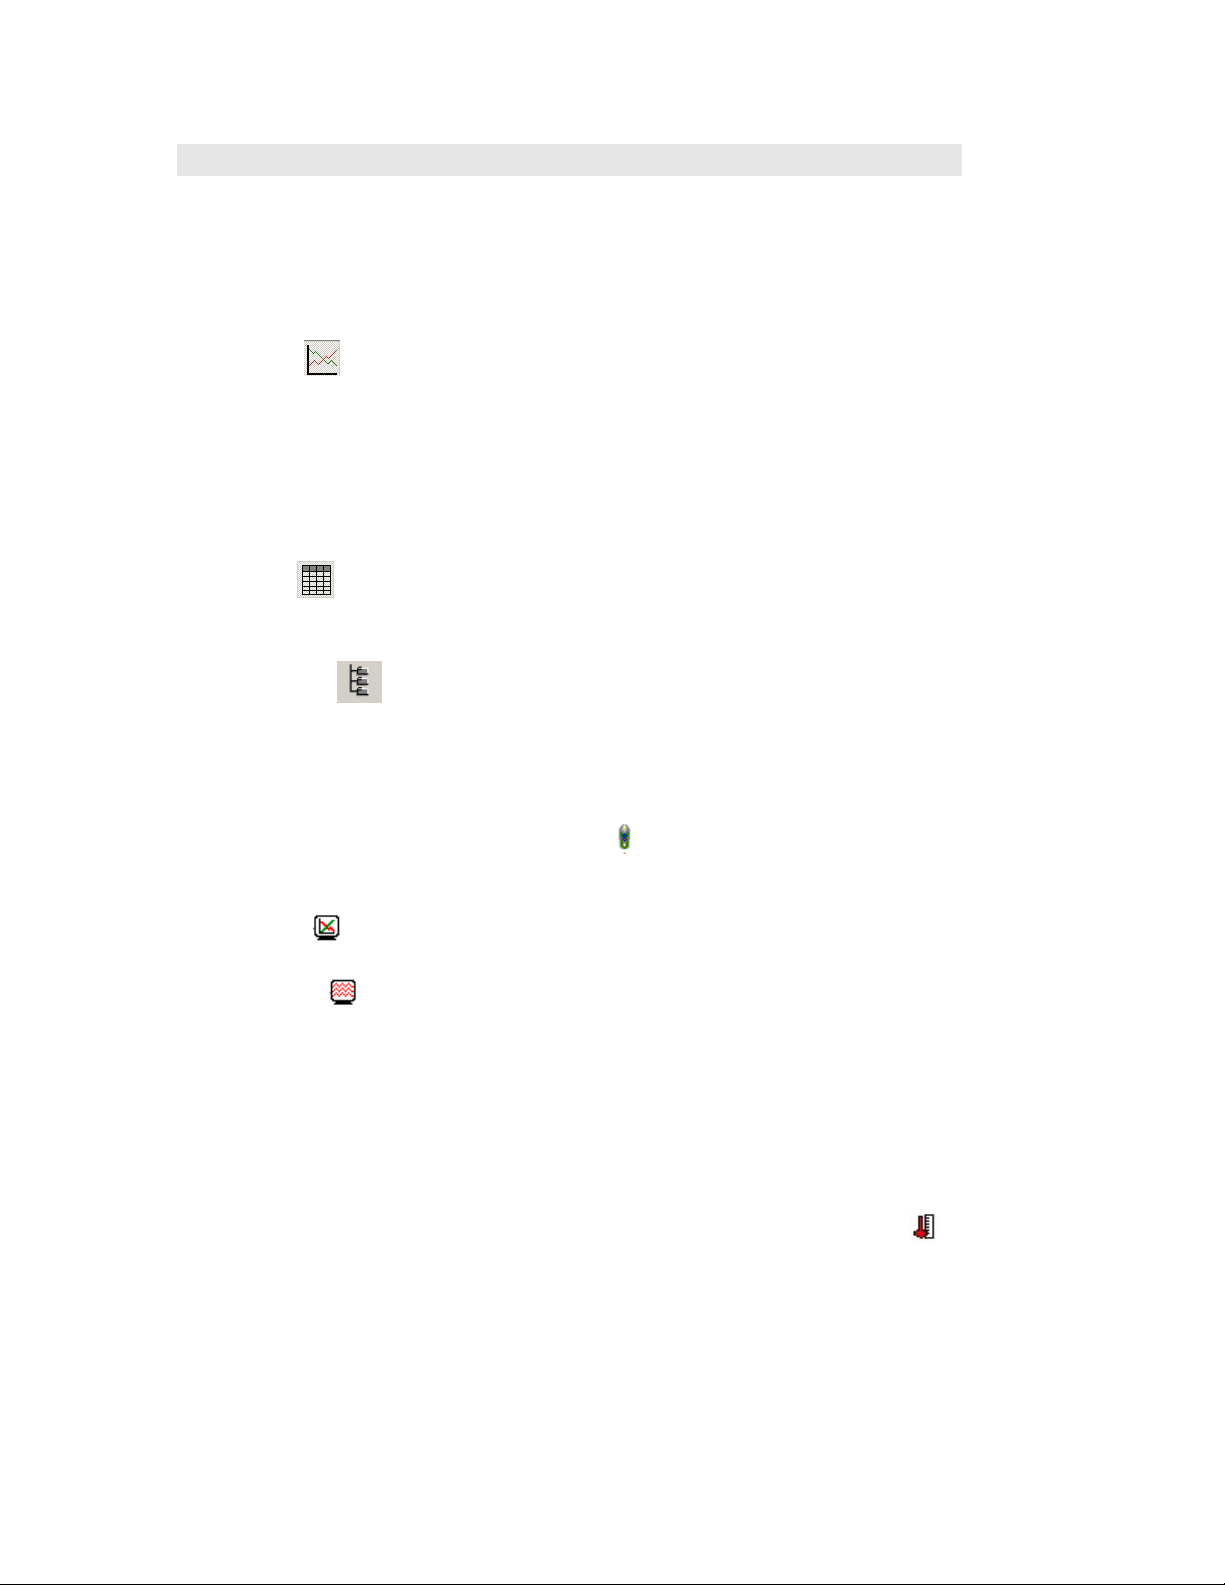
Viewing the Data
Display Options
MicroLab’s main window consists of three parts: the graph, the table and the Data Map.
You can display all three parts simultaneously (the default view) or any combination of
them.
Graph
Click Graph to display or remove the graph. The graph displays the data sets
plotted vs. time.
In order to keep the graph clear and simple, only two Y-axes can be shown on the graph
simultaneously. If there are three curves in the graph, one of the Y-axes will be hidden.
To make this axis visible, select the corresponding plot with the cursor (refer to page 55).
You can identify the Y-axis by its color, which matches the plot color.
Table
Click Table to display or remove the table.
The data in the table always matches the data that is currently displayed on the graph.
Data Map
Click Data Map to display or remove the Data Map.
The Data Map is a separate window that displays the list of data sets that were
downloaded or opened in the current session. Use the Data Map to navigate through the
available plots and to keep track of the data that is displayed in the graph and/or table
windows.
When you double-click on a MicroLite icon
corresponding data and displays it in the graph and table windows. It also expands the
Data Map to show the Temperature sensor data set.
A graph icon
the icon to clear the data set from the display.
An empty icon
icon to add the data set to the display.
To collapse the sensor list under an individual MicroLite, click the minus sign (-) next to
the MicroLite icon.
To expand the sensor list under an individual MicroLite, click the plus sign (+) next to the
MicroLite icon.
To remove an individual MicroLite from the Data Map, right-click on its icon, then click
Remove data.
To remove all data sets from the Data Map, right-click the Data Sets icon
Remove all data.
indicates that the data set is currently being displayed. Double-click on
indicates that the data set is not being displayed. Double-click on the
in the Data Map, MicroLab jumps to the
, then click
The Cursor
Use the cursor to view individual data recording values, or to reveal a hidden Y-axis.
MicroLab enables you to display up to two cursors simultaneously.
- 55 -
Page 58
To display the first cursor, double-click on an individual data point or click Cursor
the graph toolbar. You can drag the cursor with the mouse to any other point on the plot,
or to another plot altogether.
The point coordinates of the selected data recording will appear in the status bar at the
bottom of the graph window.
To display a second cursor, double-click anywhere on the graph or click Second cursor
on the graph toolbar.
on
Graph Features
1. Zooming
Click Zoom in
you want to magnify. Release the mouse button to zoom in to the selected area.
Click on the Zoom in button a second time to turn off the Zoom tool.
2. Autoscale
Click Autoscale
Double-click on an individual axis to auto scale it separately.
3. Manual scaling
a. Click Graph properties
Properties dialog box.
b. Select the Scale tab, and choose the axis you want to scale in the Select
axis drop-down menu.
c. Unselect the Auto scale check box and enter the new values in the value
fields.
d. In the time axis, you can either enter the time and date manually, or select
it with the up and down arrow buttons.
e. Click OK.
on the graph toolbar and drag the cursor diagonally to select the area
on the graph toolbar for the full data display.
on the graph toolbar to open the Graph
To restore auto scaling, click Autoscale
4. Default zooming
If you usually need to view a specific time frame (i.e. workday hours), use the Default
zooming tool. You can set the start and end time of the time span and then use it
whenever you open a file or download data from the MicroLite.
To set the default zoom:
a. Click Graph Properties
Zoom.
b. Enter the start and end times, then click Set.
To zoom to the default zoom:
a. Click Graph Properties
b. Check the Use default zoom check box and click OK.
Every file and every data recording you download will automatically open in the default
zoom as long as the Use default zoom check box remains selected.
To restore auto scaling, click Autoscale
on the graph toolbar, then click Set Default
on the graph toolbar.
.
.
- 56 -
Page 59
5. The Stretch/Compress Axis Tool
Move the cursor onto one of graph axes. The cursor icon changes to a double arrow
symbol (
to the desired location. Repeat the procedure for the other axis, if necessary.
6. Panning
Use the pan tool after zooming any part of the graph that is outside the zoomed area.
↔), indicating that you can stretch or compress the axis scale. Drag the symbol
To do so, click Pan
the graph to view another area.
Click Pan a second time to turn off the Pan tool.
on the graph toolbar, then click anywhere on the graph and drag
Cropping the Data
Cropping enables you to trim the edges of a data set. Use it to remove unwanted data.
1. Zoom to the data range you want to keep.
2. Click Graph on the menu bar, and then click Crop.
All data outside the zoomed area will be permanently removed.
Formatting the Graph
You can change a data line’s color, style or width. You can also add markers that
represent the data points on the graph and format their style and color.
The Y-axis color matches the corresponding plot’s color and will change accordingly.
The Time axis color can be changed separately:
1. Click Graph properties
dialog box.
2. Select the Lines tab, and then select the plot or axis you want to format in the Select
plot drop-down menu.
3. From here, you can format the line’s color, style and width, as well as the markers’
color and style. To remove the line or the marker, uncheck the corresponding visible
check box.
4. To restore the default formatting, click Restore default, and click OK.
on the graph toolbar to open the Graph Properties
Displaying Alarm Levels
Click the Display Alarm Level icon on the main toolbar
to enable the Temperature alarm levels to be displayed on the
graph.
Changing the Temperature Units
Click Toggle °C/°F button to change the temperature scale from Fahrenheit to
Celsius and vice versa.
Note: To change the units in the MicroLite display, use the Setup dialog box.
Adding Annotations to the Graph
MicroLab allows you to add annotations to the graph. An annotation is always attached
to a specific data point.
To add an annotation:
- 57 -
Page 60
1. Place the cursor on the point to which you want to add the annotation.
2. Click Add new annotation
3. Type the annotation in the New annotation caption text box.
4. Click OK.
To move an annotation:
1. Click Move annotation
2. Drag the annotation to any location on the graph you choose.
3. Click Move annotation a second time.
To edit an annotation:
1. Place the cursor on the point to which the annotation is attached.
2. Click Graph on the menu bar.
3. Click Edit annotation.
4. Edit the annotation in the text box.
5. Click OK.
To delete an annotation:
1. Place the cursor on the point to which the annotation is attached.
2. Click Graph on the menu bar.
3. Click Delete annotation.
To hide all annotations:
1. Click Graph on the menu bar.
2. Click Show annotations to uncheck it.
on the graph toolbar
on the graph toolbar
Exporting Data to Excel
Click Export to Excel to export the currently displayed data to an Excel
spreadsheet. MicroLab will open a new Excel workbook displaying the data along with
the MicroLite info, including the MicroLite name, serial number and alarm levels setup.
If Excel is not installed on the PC then the data will be exported to a CSV text file.
Export File Settings
If MicroLab fails to export the data properly i.e. all of the data is displayed in one row of
the worksheet, you can change the export file settings. This ensures that the data is
exported using comma separated values (CSV).
1. Click File on the main menu, then click Export file settings,
2. Select the Ignore regional settings check box.
3. Click OK.
Copying the Graph as a Picture
You can copy the graph to the clipboard as a picture and then paste it into other
Windows programs, such as Word and PowerPoint:
1. On the Graph menu, click Copy graph.
2. Open the destination file.
3. In the destination file, right-click and select Paste.
- 58 -
Page 61
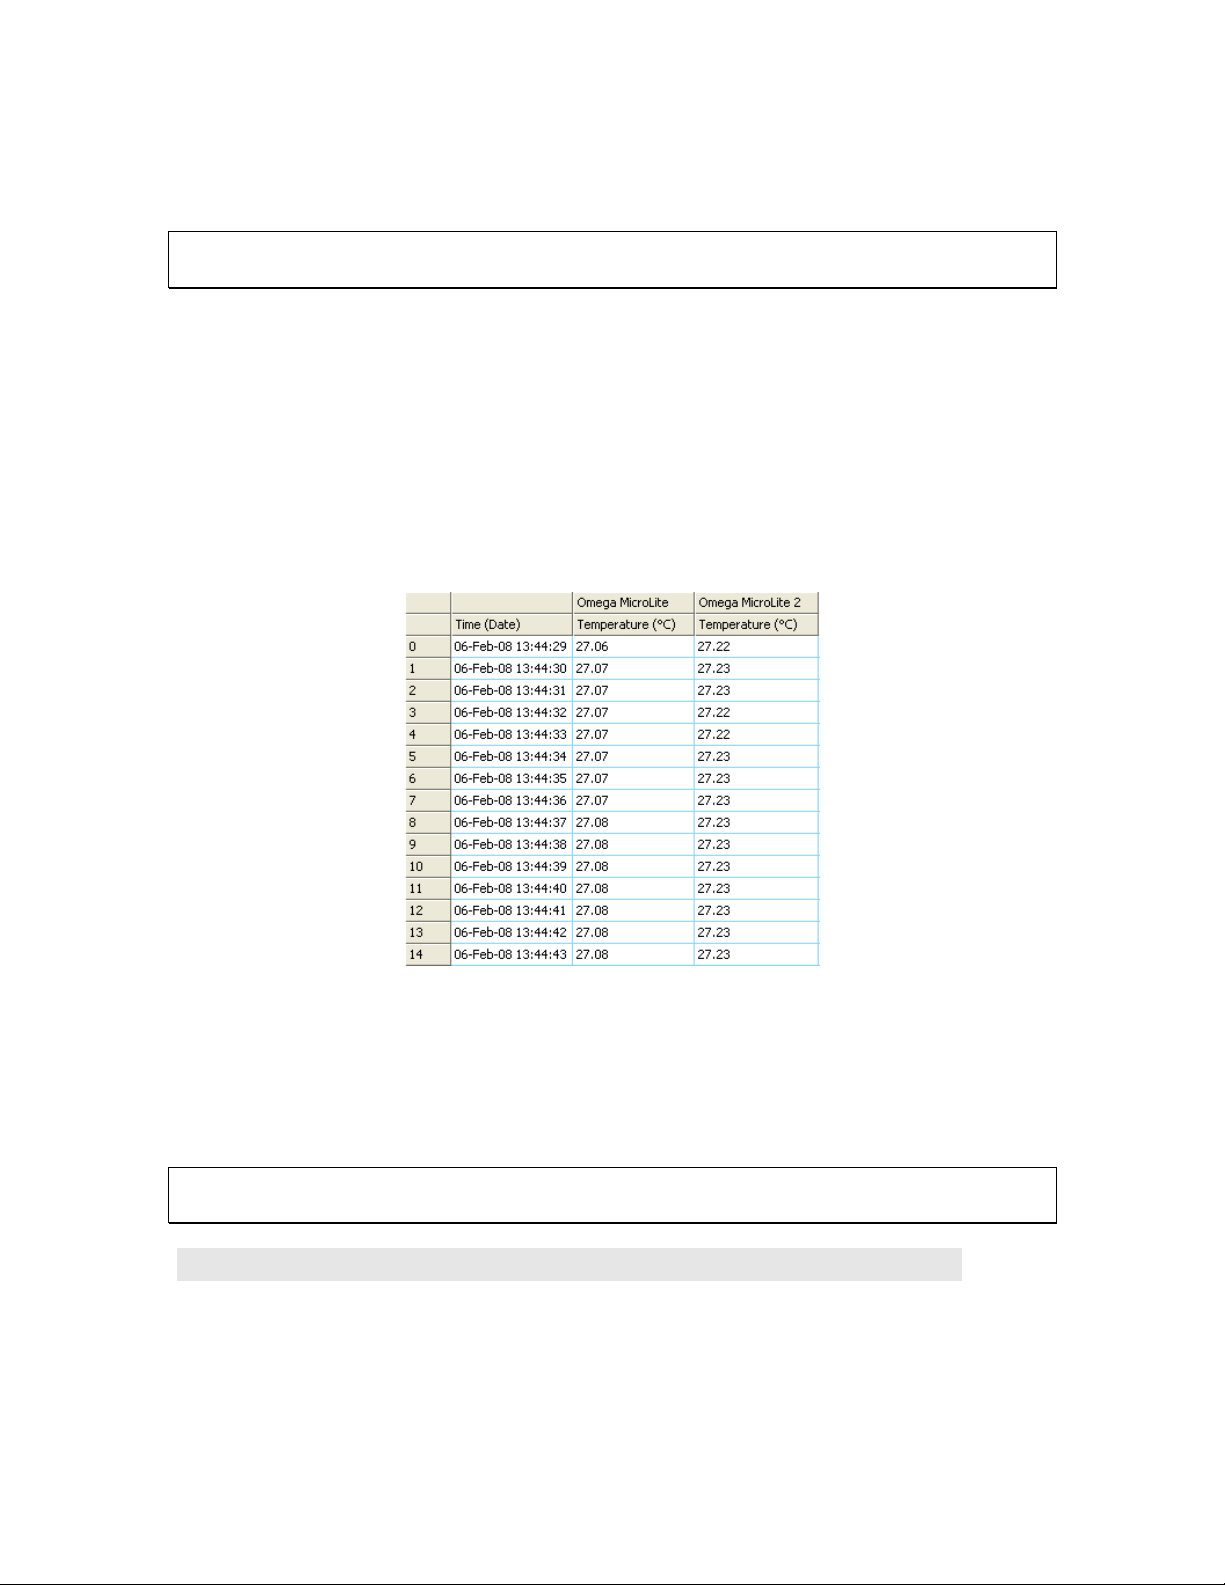
Viewing more than one Data Set on the Graph
MicroLab lets you view more than one data set in Graph and Table view at the same
time, allowing you to compare the data from several data sets side by side.
Note: To use this feature the data sets must have been recorded using the same
sampling rate e.g. every 1 minute
There are two modes when using the Multi-graph feature:
Standard mode
The time scale of all data on the graph is the same. The time and date of data recorded
in the first data set included on the graph is used.
For example, if you have a graph whose data was recorded starting 10:00AM on August
11, then all additional data added to the graph will be displayed with the same recording
date.
The MicroLab data table below shows all data in the graph having the same time scale:
Figure 6: MicroLite data table
Plot sync mode
To display data on the graph using the data’s actual time scale i.e. the time and date
when the data was actually recorded, use the Plot sync feature. This will also shift all
data in the data table accordingly.
Once you’ve added the data to the graph, on the Graph menu, select Plot sync to
enable the feature. To return to Standard mode, unselect Plot sync.
Note: The time scale of all data is rounded to the same resolution as the time scale of
the original data on the graph.
Analysis Tools
Setting the Analysis Tools Parameters
1. Click Analysis on the menu bar, then click Set Functions’ Parameters to open a
dialog box:
- 59 -
Page 62
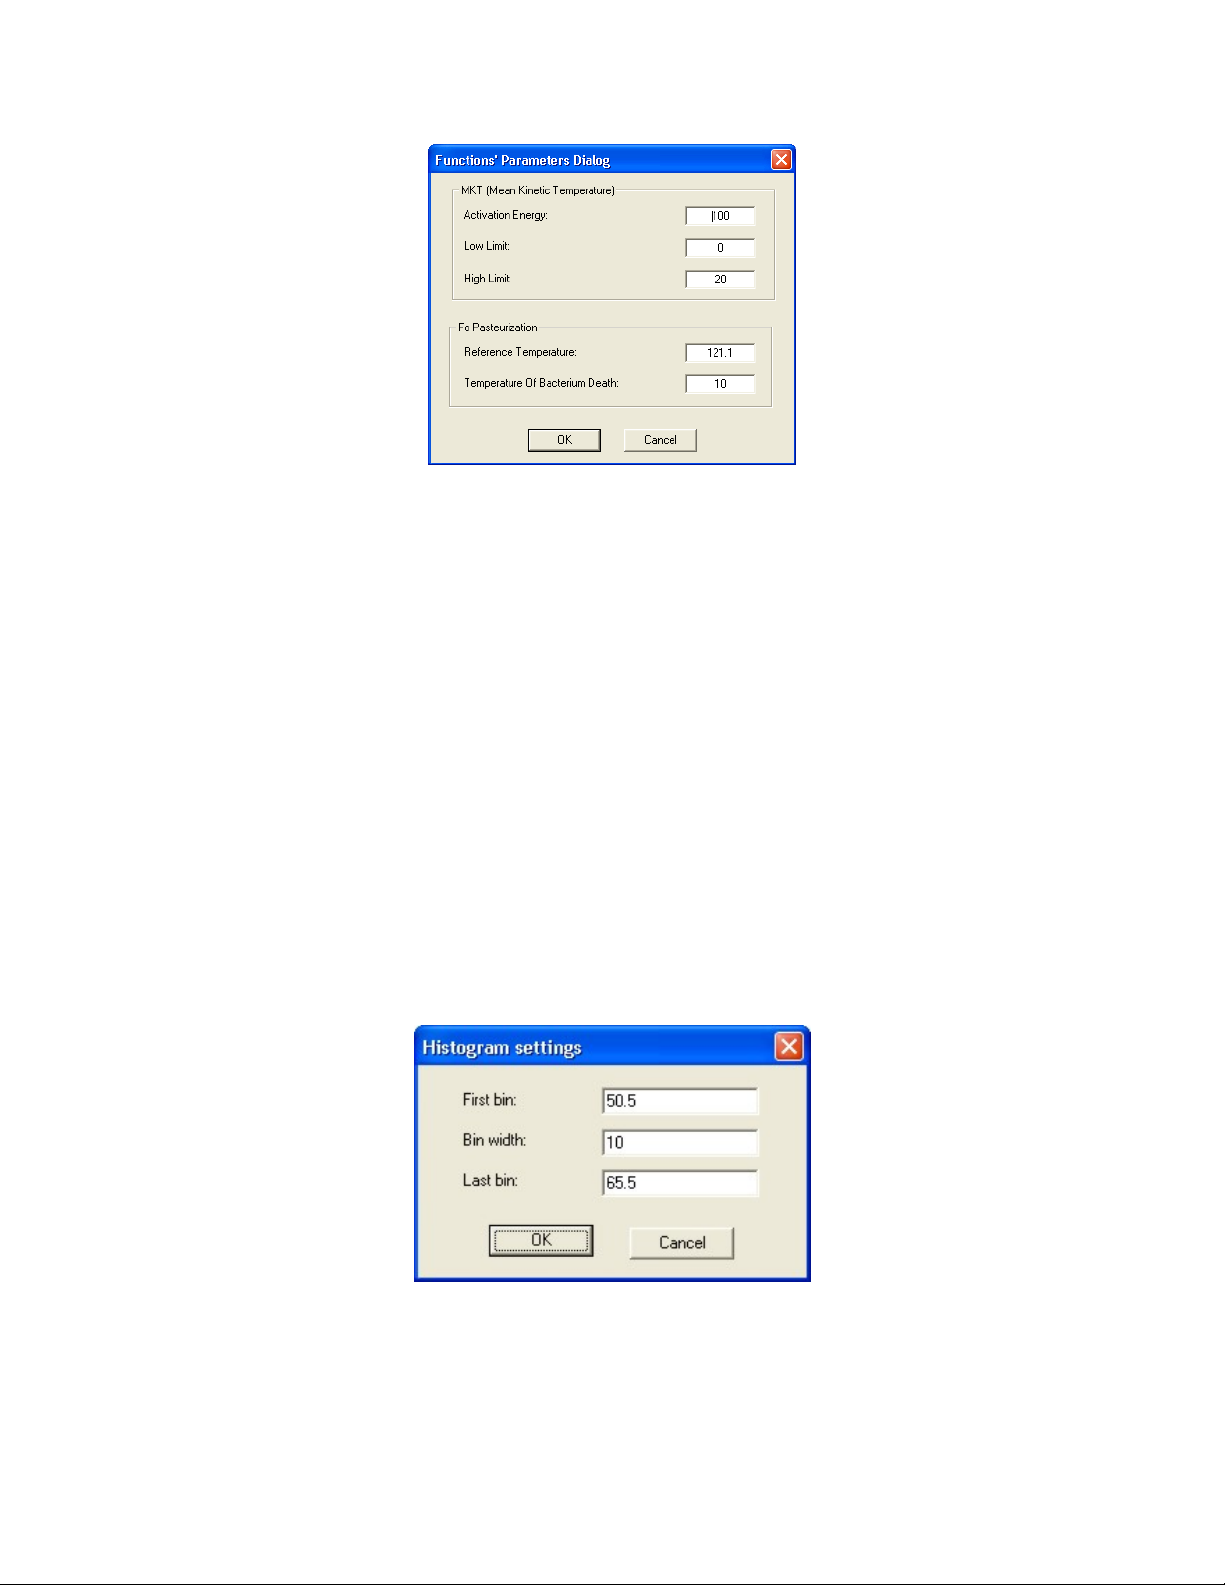
Figure 7: Functions Parameters
2. Type in the desired parameters, and then click OK.
Histogram
Use this tool to create a frequency distribution of the selected data set.
To create a histogram:
1. Use the cursor to select a plot on the graph.
2. Click Analysis on the main menu bar, then click Histogram.
MicroLab displays a histogram of the selected data and creates a new entry in the Data
Map.
Use the Data Map (refer to page 55) to hide the histogram or to return to the original
data sets.
You can modify the histogram to your needs. You can set the upper limits of the first bin
and the lower limit of the last bins, and refine the histogram by increasing the number of
bins.
To modify the histogram:
1. Click Analysis on the main menu, then click Histogram a second time to open a
dialog:
Figure 8: Histogram settings
2. Enter the desired values for the first bin, the bin width and last bin, and then click
OK.
You can repeat the process for further modification.
- 60 -
Page 63
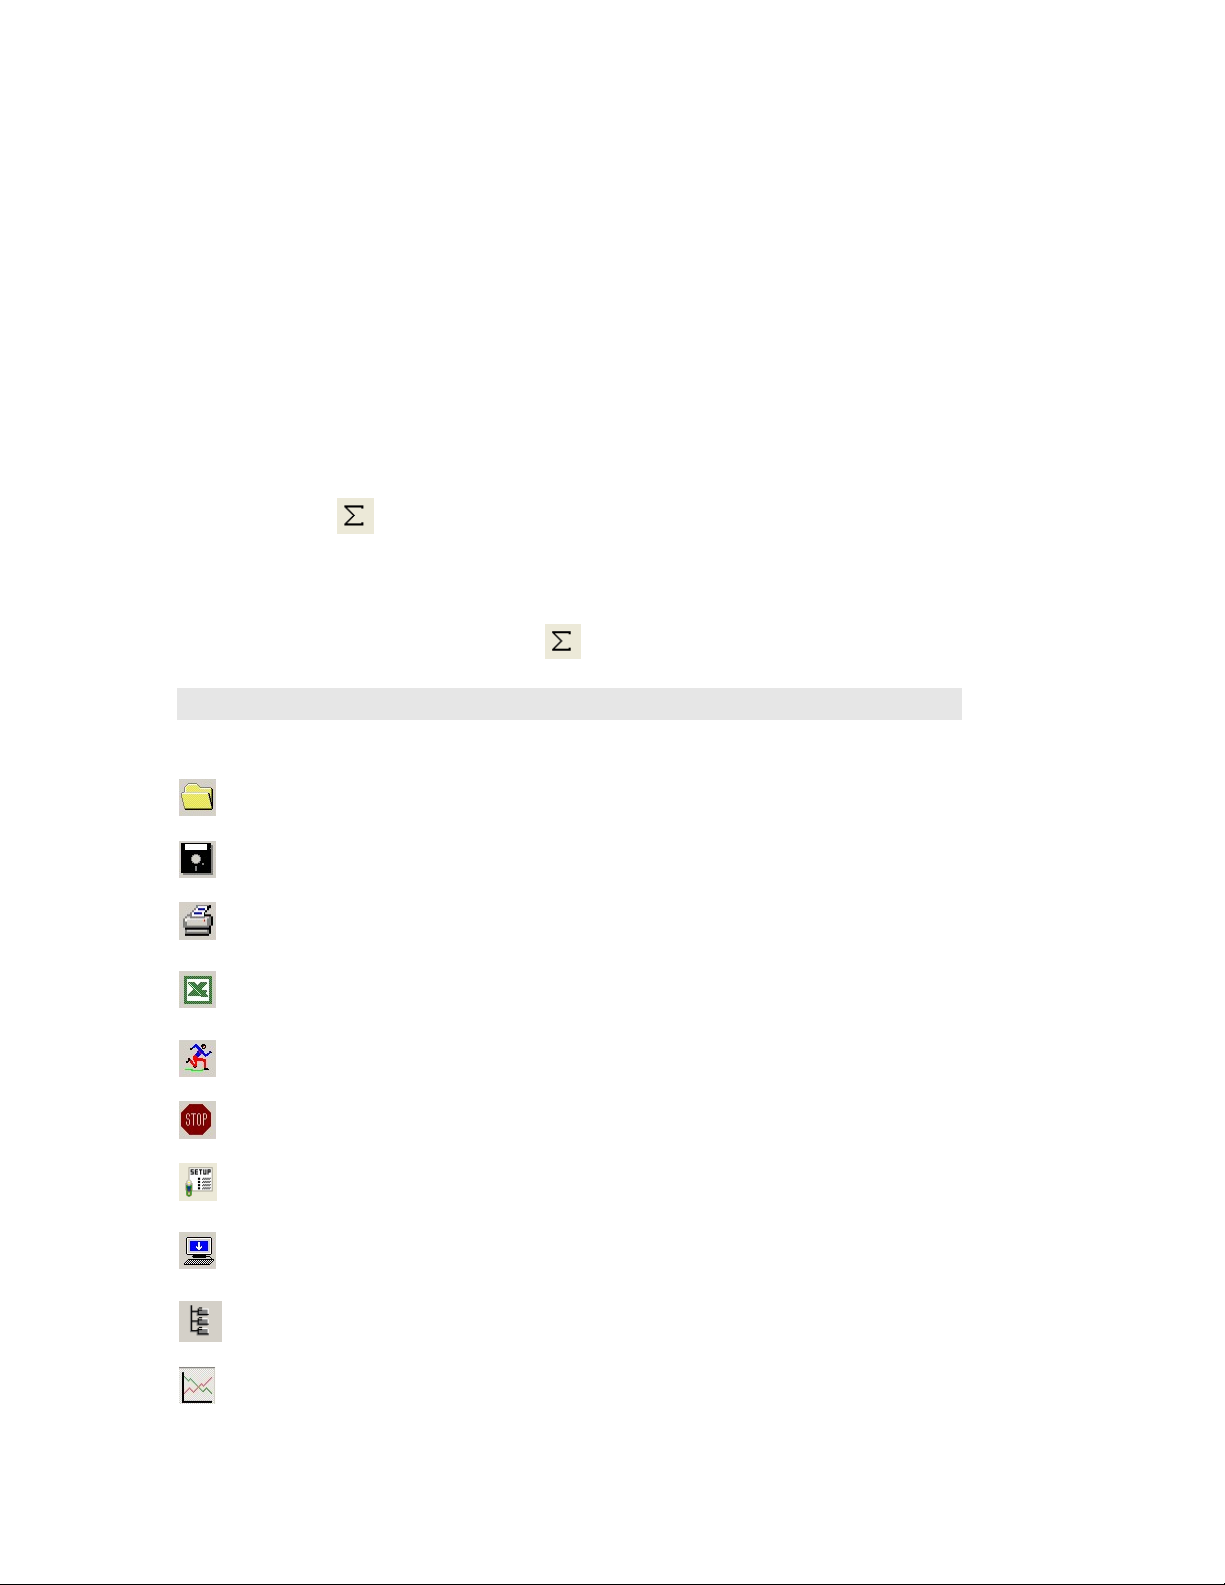
Pasteurization
Use this tool to create and display an FO Pasteurization curve:
Click Analysis on the menu bar, then click FO pasteurization.
Statistics
Use the statistics tool to display statistics of each data set in the graph.
The statistics include:
Minimum – The smallest value in the data set.
Maximum – The largest value in the data set.
Average – The average of all the numbers in the data set.
MKT – The Mean Kinetic Temperature.
To display statistics:
Click Statistics
MicroLab will display the statistics in the information bar at the bottom of the graph
window.
To hide the statistics, click Statistics
on the main toolbar.
a second time.
Toolbar Buttons
Main (Upper) Toolbar
Open
Save
Print…
Export
Run
Stop
Setup
Download
Data Map
Graph
Opens saved files
Saves the data that is currently displayed
Opens the Print Option dialog box
Exports the displayed data to an Excel
spreadsheet
Begins recording data
Stops recording data
Opens the Setup dialog box
Downloads data from the MicroLite onto the
PC
Displays or removes the Data Map
Displays or removes the graph
- 61 -
Page 64
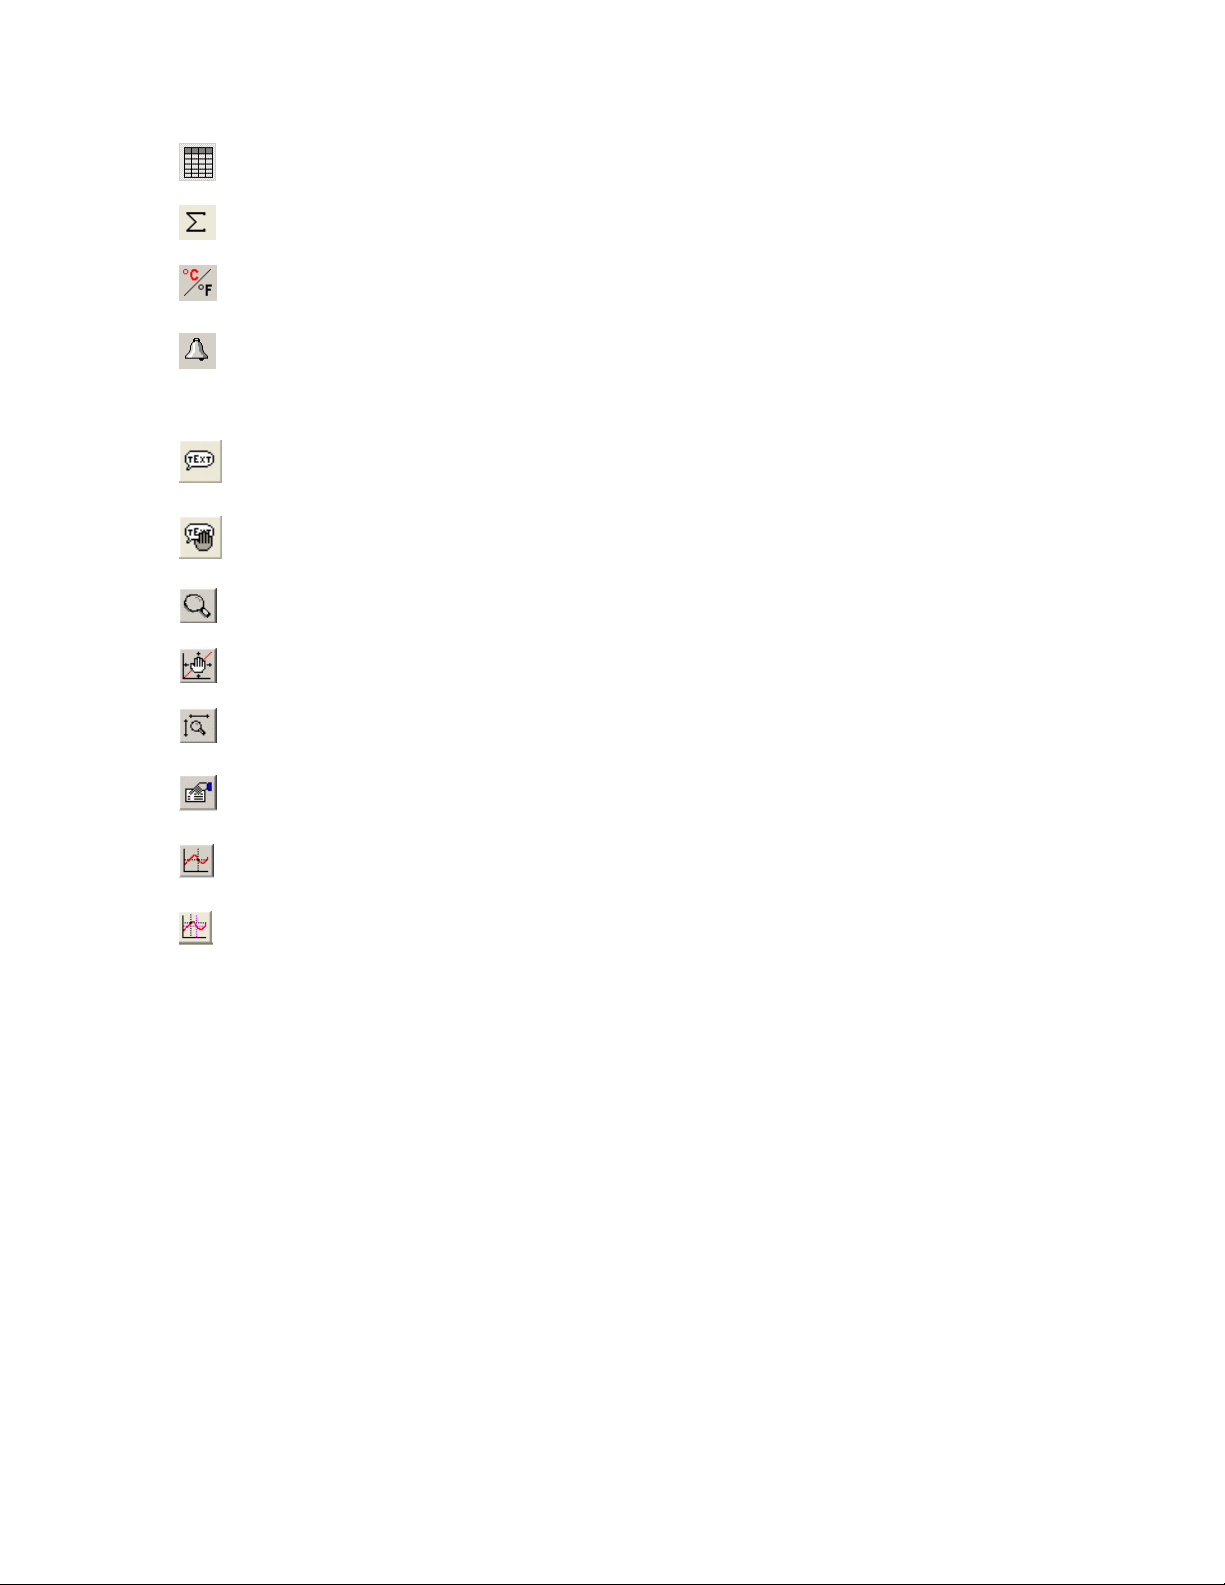
Table
Statistics
°C/°F
Alarm
Displays or removes the table
Displays or removes the data’s statistics
Displays the desired unit of temperature
Displays or removes temperature alarm
levels from the graph
Graph (Lower) Toolbar
Add
annotation
Move
annotation
Zoom in
Pan
Autoscale
Graph
properties
Cursor
Second
cursor
Adds new annotation to the graph
Relocates the annotation on the graph
Activates the zoom tool
Activates the pan tool
Returns the graph to full view
Opens the Graph Properties dialog box
Toggles the first cursor
Toggles the second cursor
- 62 -
Page 65

Specifications
MicroLite
Models:
OM-MICROLITE-8 - Temperature sensor; 8,000 sample memory
OM-MICROLITE-16 - Temperature sensor; 16,000 sample memory
Internal Temperature sensor:
Range: -40 ˚C to 80 ˚C
Resolution: A/D resolution: 16-bit, 0.1°C
Accuracy (all ranges): 0.3 ˚C
Response time: ~ 20 minutes
(Thermal conductor enabling fast response time)
Software calibration is possible
Outputs:
3-digit 7-segment LCD with decimal point
USB 2.0 interface
Memory Capacity:
8,000 samples or 16,000 samples, depending on MicroLite model
LCD Unit Icons:
˚C, ˚F, AL-H, AL-L, MIN, MAX
Power Supply:
Internal Lithium Battery: 3V, CR2032
Battery Life: Approximately two years
Sampling Rate:
User defined: From once every second to once every two hours
Dimensions:
11 x 3.9 x 2.6 cm
Weight:
45.5 g
Standards:
Water and dust proof IP68 compliance (submerged at 0.5 meters for 30 minutes)
CE and FCC standard compliance
Software
MicroLab Software Features
Runs on Windows 98/2000/ME/XP/VISTA
Integration with DatPass Admin application
Fast data download from the MicroLite
Graphic visualization of the MicroLite data
Data displayed in graphs and tables
- 63 -
Page 66

Data export to EXCEL
Graphic analysis tools such as Markers, Zoom
Setup windows, for setting the MicroLite unit name, sampling rate and alarm level
Sampling rate: Once every second to once every two hours
MicroLite sensor calibration
Display of MicroLite battery level
Visual alarm levels on the graph and table
MicroLab System Requirements
Software
Windows 98 or later
Internet Explorer 4.0 or later
Hardware
Pentium 200 MHz or higher
32 MB RAM (64 MB recommended)
5 MB available disk space for the MicroLab application
- 64 -
Page 67

WARRANTY/DISCLAIMER
OMEGA ENGINEERING, INC. warrants this unit to be free of defects in materials and workmanship for a
period of 13 months from date of purchase. OMEGA’s WARRANTY adds an additional one (1) month
grace period to the normal one (1) year product warranty to cover handling and shipping time. This
ensures that OMEGA’s customers receive maximum coverage on each product.
If the unit malfunctions, it must be returned to the factory for evaluation. OMEGA’s Customer Service
Department will issue an Authorized Return (AR) number immediately upon phone or written request.
Upon examination by OMEGA, if the unit is found to be defective, it will be repaired or replaced at no
charge. OMEGA’s WARRANTY does not apply to defects resulting from any action of the purchaser,
including but not limited to mishandling, improper interfacing, operation outside of design limits,
improper repair, or unauthorized modification. This WARRANTY is VOID if the unit shows evidence of
having been tampered with or shows evidence of having been damaged as a result of excessive corrosion;
or current, heat, moisture or vibration; improper specification; misapplication; misuse or other operating
conditions outside of OMEGA’s control. Components in which wear is not warranted, include but are not
limited to contact points, fuses, and triacs.
OMEGA is pleased to offer suggestions on the use of its various products. However,
OMEGA neither assumes responsibility for any omissions or errors nor assumes liability for any
damages that result from the use of its products in accordance with information provided by
OMEGA, either verbal or written. OMEGA warrants only that the parts manufactured by the
company will be as specified and free of defects. OMEGA MAKES NO OTHER WARRANTIES OR
REPRESENTATIONS OF ANY KIND WHATSOEVER, EXPRESSED OR IMPLIED, EXCEPT THAT OF
TITLE, AND ALL IMPLIED WARRANTIES INCLUDING ANY WARRANTY OF MERCHANTABILITY
AND FITNESS FOR A PARTICULAR PURPOSE ARE HEREBY DISCLAIMED. LIMITATION OF
LIABILITY: The remedies of purchaser set forth herein are exclusive, and the total liability of
OMEGA with respect to this order, whether based on contract, warranty, negligence,
indemnification, strict liability or otherwise, shall not exceed the purchase price of the
component upon which liability is based. In no event shall OMEGA be liable for
consequential, incidental or special damages.
CONDITIONS: Equipment sold by OMEGA is not intended to be used, nor shall it be used: (1) as a “Basic
Component” under 10 CFR 21 (NRC), used in or with any nuclear installation or activity; or (2) in medical
applications or used on humans. Should any Product(s) be used in or with any nuclear installation or
activity, medical application, used on humans, or misused in any way, OMEGA assumes no responsibility
as set forth in our basic WARRANTY/D ISCLAIMER language, and, additionally, purchaser will indemnify
OMEGA and hold OMEGA harmless from any liability or damage whatsoever arising out of the use of the
Product(s) in such a manner.
RETURN REQUESTS/INQUIRIES
Direct all warranty and repair requests/inquiries to the OMEGA Customer Service Department. BEFORE
RETURNING ANY PRODUCT(S) TO OMEGA, PURCHASER MUST OBTAIN AN AUTHORIZED RETURN
(AR) NUMBER FROM OMEGA’S CUSTOMER SERVICE DEPARTMENT (IN ORDER TO AVOID
PROCESSING DELAYS). The assigned AR number should then be marked on the outside of the return
package and on any correspondence.
The purchaser is responsible for shipping charges, freight, insurance and proper packaging to prevent
breakage in transit.
FOR WARRANTY
RETURNS, please have the
following information available BEFORE
contacting OMEGA:
1. Purchase Order number under which the product
was PURCHASED,
2. Model and serial number of the product under
warranty, and
3. Repair instructions and/or specific problems
relative to the product.
FOR NON-WARRANTY REPAIRS,
consult OMEGA
for current repair charges. Have the following
information available BEFORE contacting OMEGA:
1. Purchase Order number to cover the COST
of the repair,
2. Model and serial number of the product, and
3. Repair instructions and/or specific problems
relative to the product.
OMEGA’s policy is to make running changes, not model changes, whenever an improvement is possible. This affords
our customers the latest in technology and engineering.
OMEGA is a registered trademark of OMEGA ENGINEERING, INC.
© Copyright 2008 OMEGA ENGINEERING, INC. All rights reserved. This document may not be copied, photocopied,
reproduced, translated, or reduced to any electronic medium or machine-readable form, in whole or in part, without the
prior written consent of OMEGA ENGINEERING, INC.
Page 68

M4617/0208
Where Do I Find Everything I Need for
Process Measurement and Control?
OMEGA…Of Course!
Shop online at omega.com
SM
TEMPERATURE
䡺⻬
Thermocouple, RTD & Thermistor Probes, Connectors, Panels & Assemblies
䡺⻬
Wire: Thermocouple, RTD & Thermistor
䡺⻬
Calibrators & Ice Point References
䡺⻬
Recorders, Controllers & Process Monitors
䡺⻬
Infrared Pyrometers
PRESSURE, STRAIN AND FORCE
䡺⻬
Transducers & Strain Gages
䡺⻬
Load Cells & Pressure Gages
䡺⻬
Displacement Transducers
䡺⻬
Instrumentation & Accessories
FLOW/LEVEL
䡺⻬
Rotameters, Gas Mass Flowmeters & Flow Computers
䡺⻬
Air Velocity Indicators
䡺⻬
Turbine/Paddlewheel Systems
䡺⻬
Totalizers & Batch Controllers
pH/CONDUCTIVITY
䡺⻬
pH Electrodes, Testers & Accessories
䡺⻬
Benchtop/Laboratory Meters
䡺⻬
Controllers, Calibrators, Simulators & Pumps
䡺⻬
Industrial pH & Conductivity Equipment
DATA ACQUISITION
䡺⻬
Data Acquisition & Engineering Software
䡺⻬
Communications-Based Acquisition Systems
䡺⻬
Plug-in Cards for Apple, IBM & Compatibles
䡺⻬
Datalogging Systems
䡺⻬
Recorders, Printers & Plotters
HEATERS
䡺⻬
Heating Cable
䡺⻬
Cartridge & Strip Heaters
䡺⻬
Immersion & Band Heaters
䡺⻬
Flexible Heaters
䡺⻬
Laboratory Heaters
ENVIRONMENTAL
MONITORING AND CONTROL
䡺⻬
Metering & Control Instrumentation
䡺⻬
Refractometers
䡺⻬
Pumps & Tubing
䡺⻬
Air, Soil & Water Monitors
䡺⻬
Industrial Water & Wastewater Treatment
䡺⻬
pH, Conductivity & Dissolved Oxygen Instruments
 Loading...