

Page 1
TM
User’s Guide
Shop online at
omega.com
e-mail: [email protected]
For latest product manuals:
www.omegamanual.info
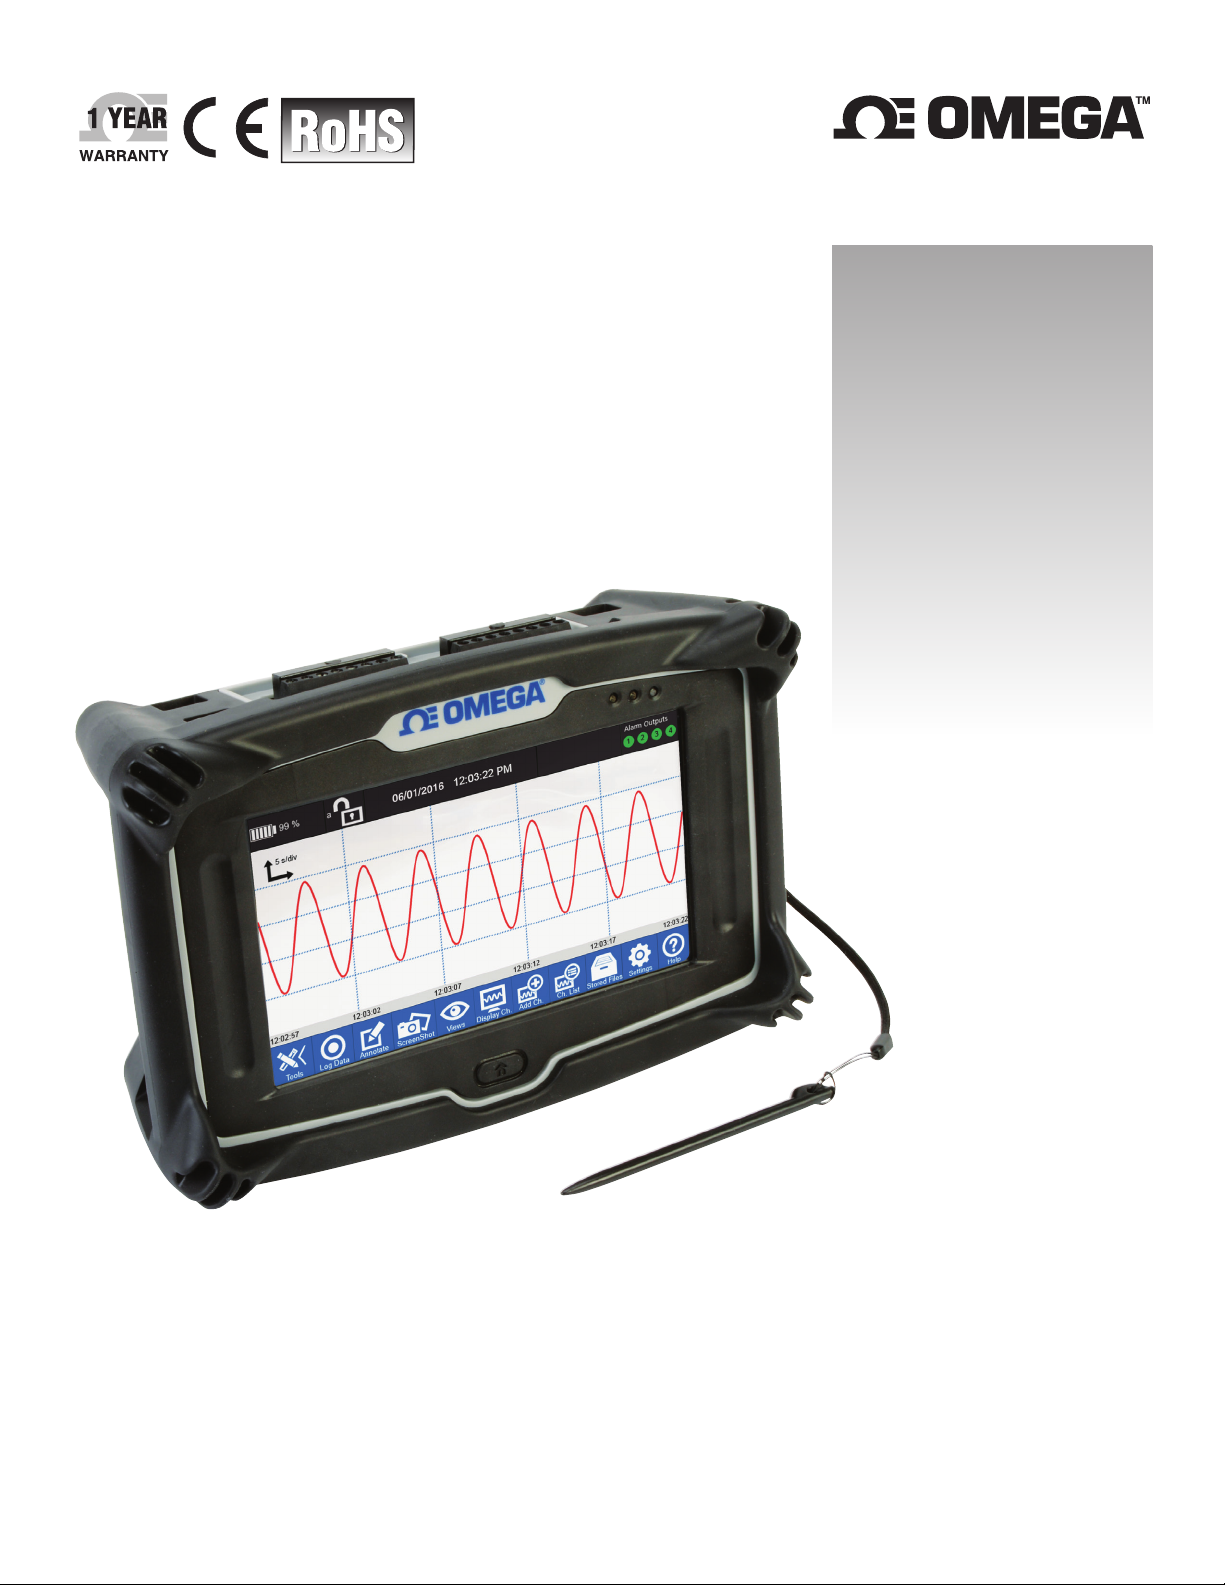
OM-DAQXL
Multi-Channel Universal Input
Touch Screen Data Logger
Page 2

omega.com [email protected]
Servicing North America:
U.S.A.: Omega Engineering, Inc.,
800 Connecticut Ave
Toll-Free: 1-800-826-6342 (USA & Canada only)
Customer Service: 1-800-622-2378 (USA & Canada only)
Engineering Service: 1-800-872-9436 (USA & Canada only)
Tel: (203) 359-1660 Fax: (203) 359-7700
e-mail: [email protected]
For Other Locations Visit omega.com/worldwide
The information contained in this document is believed to be correct, but OMEGA accepts no liability for any errors it contains, and reserves
the right to alter specifications without notice.
Page 3

OM-DAQXL
Multi Channel
TABLE OF
CONTENTS
Touch Screen Data Logger
Section Page
Section 1 - Introduction ....................................................................... 1-1
1.1 Precautions ............................................................................................................. 1-1
1.2 Safety Warnings and IEC Symbols ..................................................................... 1-1
1.3 Statement on CE Marking .................................................................................... 1-1
1.4 Overview ................................................................................................................ 1-2
1.4.1 Operating Environment ............................................................................... 1-2
Section 2 - Hardware .......................................................................... 2-1
2.1 Package Inspection ................................................................................................ 2-1
2.2 Included Items ........................................................................................................ 2-1
2.3 Part Names and Functions .................................................................................. 2-2
2.3.1 Front ................................................................................................................ 2-2
2.3.2 Back ................................................................................................................. 2-3
2.3.3 Left Side .......................................................................................................... 2-3
2.3.4 Right Side ....................................................................................................... 2-4
2.3.5 Top .................................................................................................................. 2-4
2.3.6 Bottom ............................................................................................................ 2-4
2.4 Removing and Installing Rubber Boot .............................................................. 2-5
2.5 Wall Mounting ...................................................................................................... 2-5
2.6 Sensor Connections................................................................................................ 2-6
2.6.1 Two Wire Sensors ......................................................................................... 2-6
2.6.1.1 Thermocouples ....................................................................................... 2-6
2.6.1.2 Voltage Wiring ...................................................................................... 2-6
2.6.1.3 Current Wiring ...................................................................................... 2-7
2.6.2 Three and Four Wire Sensors ............................................................................ 2-7
2.6.2.1 Two Wire RTD Wiring .......................................................................... 2-7
2.6.2.2 Three Wire RTD Wiring ........................................................................ 2-8
2.6.2.3 Four Wire RTD Wiring .......................................................................... 2-8
2.6.2.4 Thermistor Wiring ................................................................................. 2-9
2.6.2.5 Bridge Sensor Wiring ............................................................................ 2-9
2.7 Digital I/O Connections ..................................................................................... 2-10
2.8 Alarm, Excitation and Trigger ........................................................................... 2-11
2.9 USB Host Ports ..................................................................................................... 2-11
2.10 LED Indication ................................................................................................... 2-12
2.11 Battery Pack and Power Adapter .................................................................... 2-13
2.11.1 Connecting the Battery Pack ................................................................... 2-13
2.11.2 Connecting the AC Adaptor ................................................................... 2-14
2.11.3 Powering on the Data Logger ................................................................. 2-14
Section 3 - Standalone Operation ....................................................... 3-1
3.1 Login Window ....................................................................................................... 3-1
3.2 Home Screen .......................................................................................................... 3-2
3.2.1 Status/Information Display ....................................................................... 3-2
3.2.2 Data Display Area ........................................................................................ 3-3
3.2.3 Home Toolbar ............................................................................................... 3-3
3.2.4 User Interface Flowchart ............................................................................. 3-4
i
Page 4

TABLE OF
CONTENTS
OM-DAQXL
Multi Channel
Touch Screen Data Logger
3.3 Setting Screens ....................................................................................................... 3-5
3.3.1 Add Channels ............................................................................................... 3-5
Input Type–Physical Input Channel ............................................................... 3-5
Temperature Inputs ........................................................................................... 3-5
Strain Gage Inputs ............................................................................................. 3-7
Voltage Inputs .................................................................................................... 3-9
Current Inputs .................................................................................................. 3-11
Digital Inputs .................................................................................................... 3-13
Totalizer ............................................................................................................. 3-16
Resettable Counter ........................................................................................... 3-18
Input Setup - Virtual Math Channel ............................................................. 3-19
3.3.2 Channel List ................................................................................................ 3-21
3.3.3 Trigger Settings .......................................................................................... 3-22
Timer Trigger Events ....................................................................................... 3-23
Date and Time Trigger Events ....................................................................... 3-23
Weekday and Time Trigger Events ............................................................... 3-24
Alarm Output Trigger Events ........................................................................ 3-24
External Trigger Events .................................................................................. 3-25
3.3.5 Data Session Settings ................................................................................. 3-26
3.3.6 Alarm Settings ............................................................................................ 3-27
Main Alarm Screen .......................................................................................... 3-27
Alarm Status ..................................................................................................... 3-27
Alarm Table ...................................................................................................... 3-27
Alarm Toolbar .................................................................................................. 3-28
Add/Edit Alarm Screen .................................................................................. 3-29
3.3.7 Device Settings ........................................................................................... 3-30
General/Data and Time .................................................................................. 3-30
Display Options ............................................................................................... 3-31
Communication Settings ................................................................................. 3-32
Diagnostics ........................................................................................................ 3-34
User Management ............................................................................................ 3-35
Change Password ............................................................................................ 3-37
About Your Logger/Firmware ...................................................................... 3-38
3.4 Viewing Data ....................................................................................................... 3-40
3.4.1 Select Channels ........................................................................................... 3-41
3.4.2 Waveform View ......................................................................................... 3-42
3.4.3 Waveform and Table View ....................................................................... 3-43
3.4.4 Table Only View ........................................................................................ 3-44
3.4.5 Digital View ................................................................................................ 3-45
3.4.6 Screenshot ................................................................................................... 3-46
3.4.7 Annotate ....................................................................................................... 3-46
3.5 Operating Modes ................................................................................................ 3-47
3.5.1 Free-Running ............................................................................................... 3-47
3.5.2 Armed Mode ............................................................................................... 3-47
3.5.3 Logging Mode ............................................................................................. 3-47
3.5.4 Data Review Mode ..................................................................................... 3-47
ii
Page 5
OM-DAQXL
Multi Channel
TABLE OF
CONTENTS
Touch Screen Data Logger
Section 4 - CE Conformity ..................................................................... 4-1
Section 5 - Troubleshooting ................................................................. 5-1
5.1 Hardware Issues ................................................................................................... 5-1
5.2 Display Issues ........................................................................................................ 5-1
5.3 Logging Issues ....................................................................................................... 5-1
5.4 Setup Issues ........................................................................................................... 5-1
5.5 Error Messages ...................................................................................................... 5-1
Section 6 - Service and Calibration ...................................................... 6-1
Section 7 - Specifications ..................................................................... 7-1
7.1 General ................................................................................................................... 7-1
7.2 Inputs ...................................................................................................................... 7-1
7.3 Functions ................................................................................................................ 7-3
7.4 Communication ...................................................................................................... 7-4
7.5 External I/O ............................................................................................................ 7-4
7.6 Dimensions ............................................................................................................. 7-5
Section 8 - International Approvals ..................................................... 8-1
OM-DAQXL
Multi Channel
LIST OF
TABLES
Touch Screen Data Logger
List of Tables
Table Description ......................................................................................... Page
Table 2-1 OM-DAQXL Models ............................................................................... 2-1
Table 2-2 OM-DAQXL Included Items ................................................................. 2-1
Table 2-3 Two Wire Sensor Connections .............................................................. 2-6
Table 2-4 Three and Four Wire Sensor Connections ........................................... 2-7
Table 2-5 Digital I/O Cable Pinout ...................................................................... 2-10
Table 2-6 Alarm Terminal Block Signals ............................................................. 2-11
Table 2-7 Status LED States ................................................................................... 2-12
Table 3-1 Alarm Type/Status Indicator Color. .................................................. 3-27
OM-DAQXL
Multi Channel
LIST OF
FIGURES
Touch Screen Data Logger
List of Figures
Figure Description ......................................................................................... Page
Figure 2-1 Included Items ......................................................................................... 2-2
Figure 2-2 OM-DAQXL Front View ........................................................................ 2-2
Figure 2-3 OM-DAQXL Back View ......................................................................... 2-3
Figure 2-4 OM-DAQXL Left Side View .................................................................. 2-3
Figure 2-5 OM-DAQXL Right Side View ................................................................ 2-4
Figure 2-6 OM-DAQXL Top View ........................................................................... 2-4
Figure 2-7 OM-DAQXL Bottom View ..................................................................... 2-4
iii
Page 6

LIST OF
FIGURES
OM-DAQXL
Multi Channel
Touch Screen Data Logger
List of Figures (Continued)
Figure Description ......................................................................................... Page
Figure 2-8 Removing and Installing Rubber Boot ................................................. 2-5
Figure 2-9 OM-DAQXL Wall Mounting ................................................................. 2-5
Figure 2-10 Thermocouple Wiring Example ............................................................ 2-6
Figure 2-11 Voltage Wiring Example ........................................................................ 2-6
Figure 2-12 DC Current Wiring Example - External Excitation ............................ 2-7
Figure 2-13 2-Wire RTD Wiring Example ................................................................. 2-7
Figure 2-14 3-Wire RTD Wiring Example ................................................................. 2-8
Figure 2-15 4-Wire RTD Wiring Example ................................................................. 2-8
Figure 2-16 Thermistor Wiring Example .................................................................. 2-9
Figure 2-17 Bridge Sensor Wiring Example ............................................................. 2-9
Figure 2-18 Digital I/O Connector Pin Numbers. ................................................. 2-10
Figure 2-19 Connecting the Digital I/O Cable. ...................................................... 2-10
Figure 2-20 Alarm Terminal Block. .......................................................................... 2-11
Figure 2-23 Inserting USB Memory ......................................................................... 2-11
Figure 2-24 Status LED Locations ............................................................................ 2-12
Figure 2-25 Removing Battery Door. ....................................................................... 2-13
Figure 2-26 Connecting Battery ................................................................................ 2-13
Figure 3-1 Login Window ......................................................................................... 3-1
Figure 3-2 Home Screen ............................................................................................ 3-2
Figure 3-3 Status Display .......................................................................................... 3-2
Figure 3-4 Home Toolbar .......................................................................................... 3-3
Figure 3-5 Menu Flowchart ....................................................................................... 3-4
Figure 3-6 Settings Fly-Out Menu ............................................................................ 3-5
Figure 3-7 Input Type - Temperature ...................................................................... 3-5
Figure 3-8 Data Ranges - Temperature ................................................................... 3-6
Figure 3-9 Input Type - Strain Gage ........................................................................ 3-7
Figure 3-10 Data Ranges - Strain Gage ...................................................................... 3-8
Figure 3-11 Input Type - Voltage ............................................................................... 3-9
Figure 3-12 Data Ranges - Voltage ........................................................................... 3-10
Figure 3-13 Input Type - Current ............................................................................. 3-11
Figure 3-14 Data Ranges - Current .......................................................................... 3-12
Figure 3-15 Input Type - Digital Frequency ........................................................... 3-13
Figure 3-16 Data Ranges - Digital Frequency ......................................................... 3-14
Figure 3-17 Data Range - Volumetric Flow ............................................................ 3-15
Figure 3-18 Input Type Digital Totalizer ................................................................ 3-16
Figure 3-19 Data Ranges - Digital Totalizer ........................................................... 3-17
Figure 3-20 Input Type Digital Resettable Counter .............................................. 3-18
Figure 3-21 Data Ranges - Resettable Counter ....................................................... 3-18
Figure 3-22 Input Type - Virtual Math .................................................................... 3-19
iv
Page 7

OM-DAQXL
Multi Channel
LIST OF
FIGURES
Touch Screen Data Logger
List of Figures (Continued)
Figure Description ......................................................................................... Page
Figure 3-23 Data Ranges - Virtual Math ................................................................. 3-20
Figure 3-24 Channel List screen ............................................................................... 3-21
Figure 3-25 Trigger Settings ...................................................................................... 3-22
Figure 3-26 Timer Trigger Event .............................................................................. 3-23
Figure 3-27 Date and Time Trigger Event .............................................................. 3-23
Figure 3-28 Weekday and Time Trigger Event ...................................................... 3-24
Figure 3-29 Alarm Trigger Event ............................................................................. 3-24
Figure 3-30 External Trigger Event .......................................................................... 3-25
Figure 3-31 Data Session Screen ............................................................................... 3-26
Figure 3-32 Main Alarm Screen ................................................................................ 3-27
Figure 3-33 Alarm Toolbar ........................................................................................ 3-28
Figure 3-34 Add/Edit Alarm Screen ....................................................................... 3-29
Figure 3-35 Device Settings ....................................................................................... 3-30
Figure 3-36 General Settings Screen ........................................................................ 3-30
Figure 3-37 Display Options Screen ........................................................................ 3-31
Figure 3-38 Communication Setting - Ethernet ..................................................... 3-32
Figure 3-39 Communication Setting - Wi-Fi ........................................................... 3-33
Figure 3-40 Device Settings Diagnostics Screen .................................................... 3-34
Figure 3-41 User Management Screen ..................................................................... 3-35
Figure 3-42 Add User ................................................................................................. 3-36
Figure 3-43 Change Password Screen ..................................................................... 3-37
Figure 3-44 About Screen .......................................................................................... 3-38
Figure 3-45 Firmware Upgrade Screen ................................................................... 3-39
Figure 3-46 Firmware Upgrade Success.................................................................. 3-39
Figure 3-47 Display Channel Fly-Out Menu .......................................................... 3-40
Figure 3-48 Views Fly-Out Menu ............................................................................. 3-40
Figure 3-49 Select Channels Screen.......................................................................... 3-41
Figure 3-50 Waveform View ..................................................................................... 3-42
Figure 3-51 Graph Scale Selector .............................................................................. 3-42
Figure 3-52 Waveform and Table View .................................................................. 3-43
Figure 3-53 Table Only View .................................................................................... 3-44
Figure 3-54 Four Channel Digital View .................................................................. 3-45
Figure 3-55 Single Channel Digital View ................................................................ 3-45
Figure 3-56 Annotate ................................................................................................. 3-46
Figure 3-57 Stored File Directories........................................................................... 3-48
Figure 3-58 Stored Files List ...................................................................................... 3-49
Figure 3-59 Data Review Screen ............................................................................... 3-50
Figure 3-60 Review Mode Channel List .................................................................. 3-51
v
Page 8

1
Introduction
Section 1 - Introduction
Thank you for purchasing the OMEGA® OM-DAQXL portable data logger. This
User’s Guide describes the functions of the OM-DAQXL as well as its operating
methods and handling precautions. Read this manual thoroughly before using
the OM-DAQXL to ensure correct use.
In addition to this manual a Quick Start Guide is available separately for
download at omega.com/manuals. The Quick Start Guide briefly describes the
main functions and the basic procedures for performing such tasks as setup
and measurement operations. Use the Quick Setup Manual together with this
in-depth User’s Guide.
After reading this manual, keep it in an easily accessible place for later reference.
This manual will come in handy when you are unsure of how to operate the
product.
Please read this manual completely before installing and operating your
OMEGA data logger system. It’s important to read and follow all notes, cautions,
warnings and safety precautions before operating this device. “Device” refers to
your data logger device.
1.1 Precautions
• This device is not designed for use in any medical or nuclear applications.
• Do not operate this device in flammable or explosive environments.
• Never operate with a power source other than the one recommended in this
manual or listed on product labels.
• This device has been designed for dry, moisture free applications only.
• Do not operate this device outside of the recommended use outlined in this
manual.
1.2 Safety Warnings and IEC Symbols
This device is marked with international safety and hazard symbols in
accordance with IEC standards. It is important to read and follow all precautions
and instructions in this manual before operating or commissioning this device as
it contains important information relating to safety and EMC. Failure to follow
all safety precautions may result in injury and or damage to your device. Use of
this device in a manner not specified will void your warranty.
1.3 Statement on CE Marking
It is the policy of OMEGA® to comply with all worldwide safety and EMI/
EMC regulations that apply. OMEGA is constantly pursuing certification of its
products to the European New Approach Directives. OMEGA will add the CE
mark to every appropriate device upon certification. For additional information
see Section 8 - International Approvals.
1-1
Page 9

1.4 Overview
The OM-DAQXL is an 8 or 16 analog input portable data logger with a color
7” resistive touch screen display. It has user programmable inputs that can be
configured for several different types of sensors including temperature sensors
(thermocouple, RTD, thermistor), strain gage, process inputs (voltage and
current) and digital pulse inputs. All configurable options (including individual
channel input type and range) are software programmable. The device is
powered by a 7.2V, 4.8 Ah Li-ion battery. In addition an external 12V, 5A AC
adapter can be used to power the device for extended periods.
The compact, portable packaging ensures ease of use in a variety of applications.
Devices can be wall mounted using the provided keyhole mount or easily
operated on a bench.
The device has four operating modes:
1. Free Running – In this mode the device measures and displays configured
analog / digital inputs. No Logging is performed. No Trigger conditions are
set.
2. Armed Mode – In this mode the device measures and displays configured
analog / digital inputs. A Start Trigger condition is set. No Logging is
performed until the Start trigger condition is met.
Introduction
1
3. Logging Mode – In this mode the device measures and displays configured
analog / digital inputs. The device is also logging data from the input channels
to the designated memory location, either the SD card or the USB drive or the
internal memory.
4. Data Review Mode – In this mode users can review previously recorded data
in a graphical view. Zoom in and out. Scroll through the data back and forth in
time. Review recorded data from any 4 channels on one screen.
1.4.1 Operating Environment
The OM-DAQXL has been designed to meet its stated specifications when
operating within the ambient conditions outlined below.
Temperature: 0 to 50 deg C (32 to 122 deg F)
Humidity: 0 to 95% RH non-condensing
In addition to restricting operation of the data logger to the given temperature
and humidity ranges, a warmup period of 30 minutes is recommended to ensure
best accuracy of measurements.
1-2
Page 10
2
Hardware
2 Hardware
2.1 Package Inspection
2.2 Included Items
Remove the packing list and verify that you have received all your equipment.
If you have any questions about the shipment, please call our Customer Service
Department at the number listed on the first page of this manual or reaching us
on the Internet at omega.com, e-mail: [email protected]. When you receive
the shipment, inspect the container and equipment for any signs of damage.
Note: Report any evidence of rough handling in transit. Immediately report any
damage to the shipping agent. The carrier will not honor any damage claims
unless all the shipping materials are saved for inspection. After examination
and removal of contents, save packing material and carton in the event that
reshipment is necessary.
The following items are supplied in the box:
Data Logging Instrument
Verify the model number shown on the rear label of your data logger matches
what was ordered.
Model Specifications
OM-DAQXL-1-*
OM-DAQXL-2-*
8 channel data logger with USB Host/Device
16 channel data logger with USB Host/Device
Table 2-1 OM-DAQXL Models
Included Items (see figure 2-1)
No. Model No. Description
1
2
3
4
5
6
7
8
9
10
OM-DAQXL-RB
SD32GB
OM-DAQXL-USB
OM-DAQXL-CABLE6
OM-DAQXL-TB8
OM-DAQXL-ADAPTOR-*
SCREWDRIVER-2.5mm
MQS-5570
5TC-TT-K-20-36
NA
Rubber boot for impact resistance
32GB SD card
6' USB cable
Digital I/O cable ,6 ft.
Alarm/excitation terminal block
12Vdc, 5A power adaptor
Omega screwdriver
OM-DAQXL Series quick start guide
Type K thermocouples
5 pack with stripped leads
Crimp on ground lug
11
12
* Specifies the country code.
2-1
PT-USB-1
OM-DAQXL-RF
1GB Flash drive
Snap-on round cable ferrite
Table 2-2 OM-DAQXL Included items.
Page 11
HOME BUTTON
Hardware
2
3
2
1
8
9
Figure 2-1 Included Items.
2.3 Part Names and Functions
The figures in this section show the different parts of the data logger and provide
a brief description of their functions.
2.3.1 Front
4
5
11
12
13
6
7
10
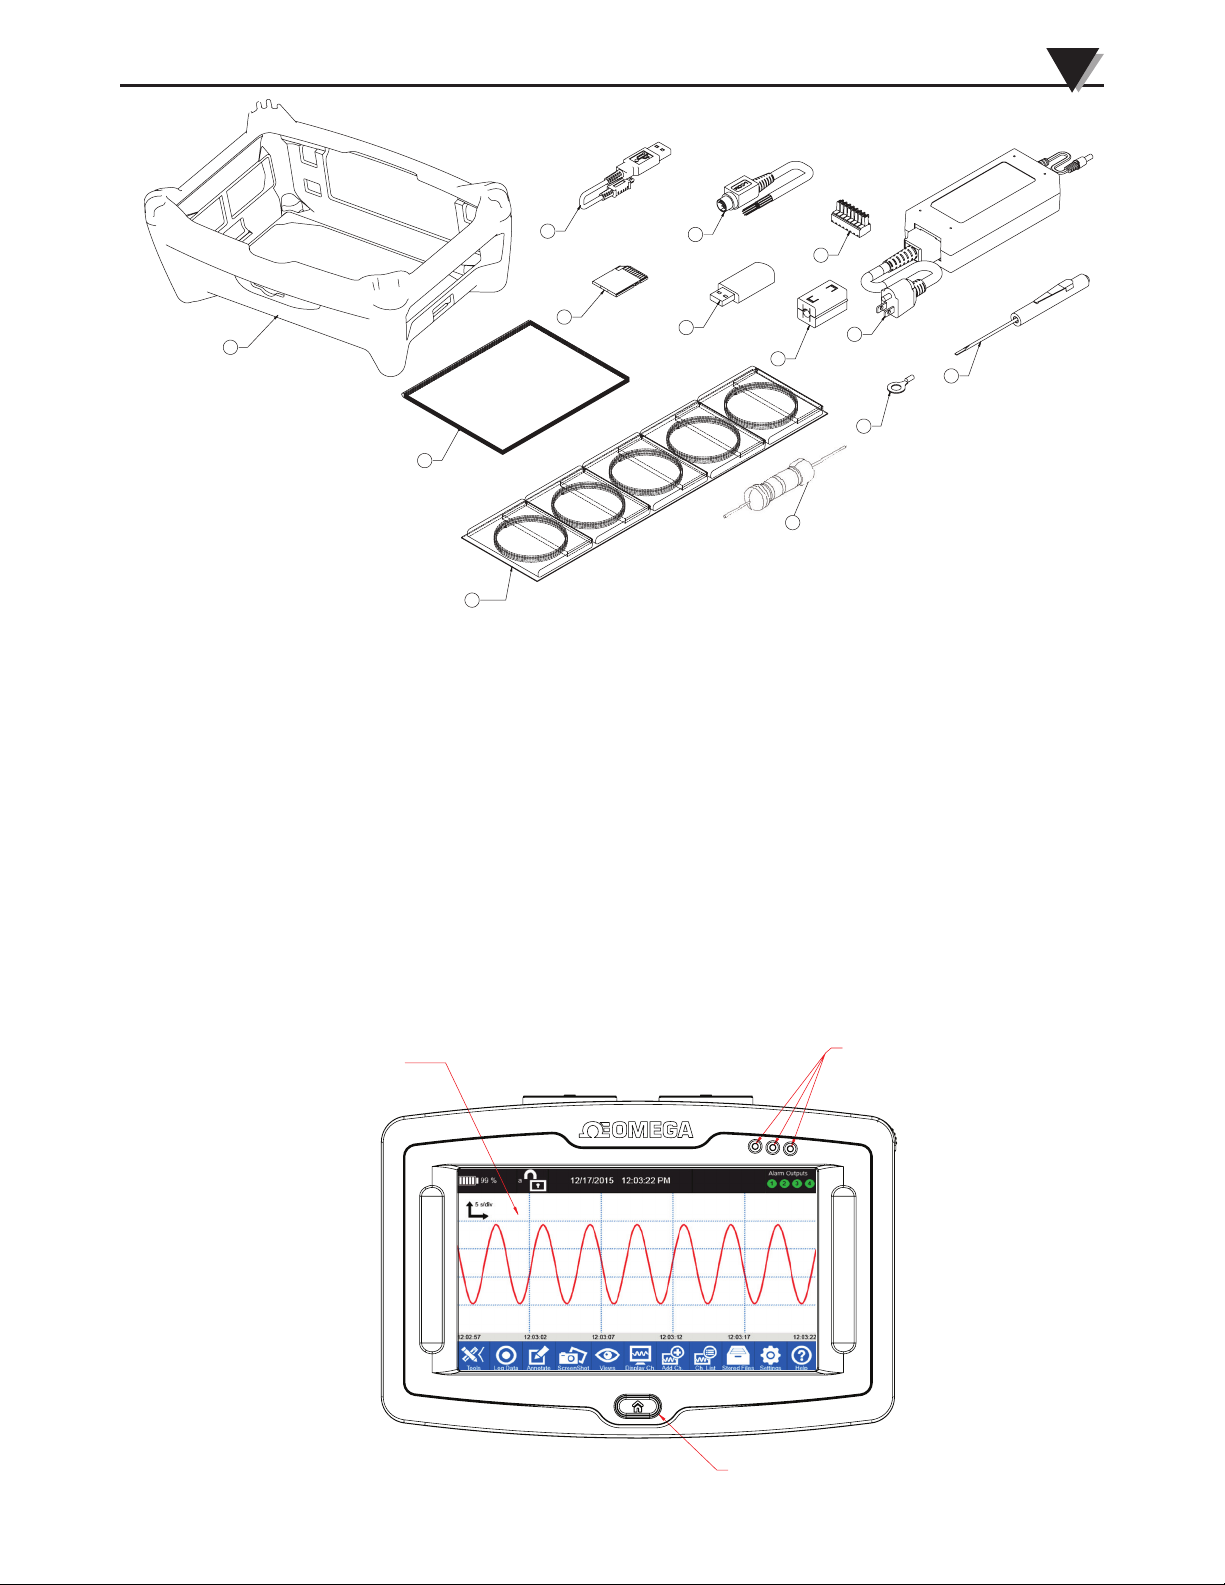
The front of the data logger is comprised of 3 user interface elements. These are
the 7” touch screen LCD, three status LEDs and the home button. The touch
screen display is used to display all measured data, settings & configuration
menus and status information. The three status LEDs provide visible indications
of power & battery charging status, data logging status, and alarm status.
Depending on the current status the color of the LEDs will vary. For LED color
indications, see Section 2.10. The Home button is the single hardware button for
the user interface. It provides a quick and easy way to return to the Home screen
from any other screen with one button press.
LCD DISPLAY
TM
STATUS LEDS
Figure 2-2 OM-DAQXL Front View.
2-2
Page 12
2
Hardware
2.3.2 Back
The back side of the data logger has a kickstand which allows the device to sit at
a 30 degree angle when sitting on a hard surface and snaps into place when not
in use. The kickstand has 2 keyhole slots allowing it to act as a wall mounting
bracket. See Section 2.5 for information on how to wall mount the device. The
battery compartment door is also located on the back of the device. See Section
2.11 for information on how to replace the battery.
2.3.3 Left Side
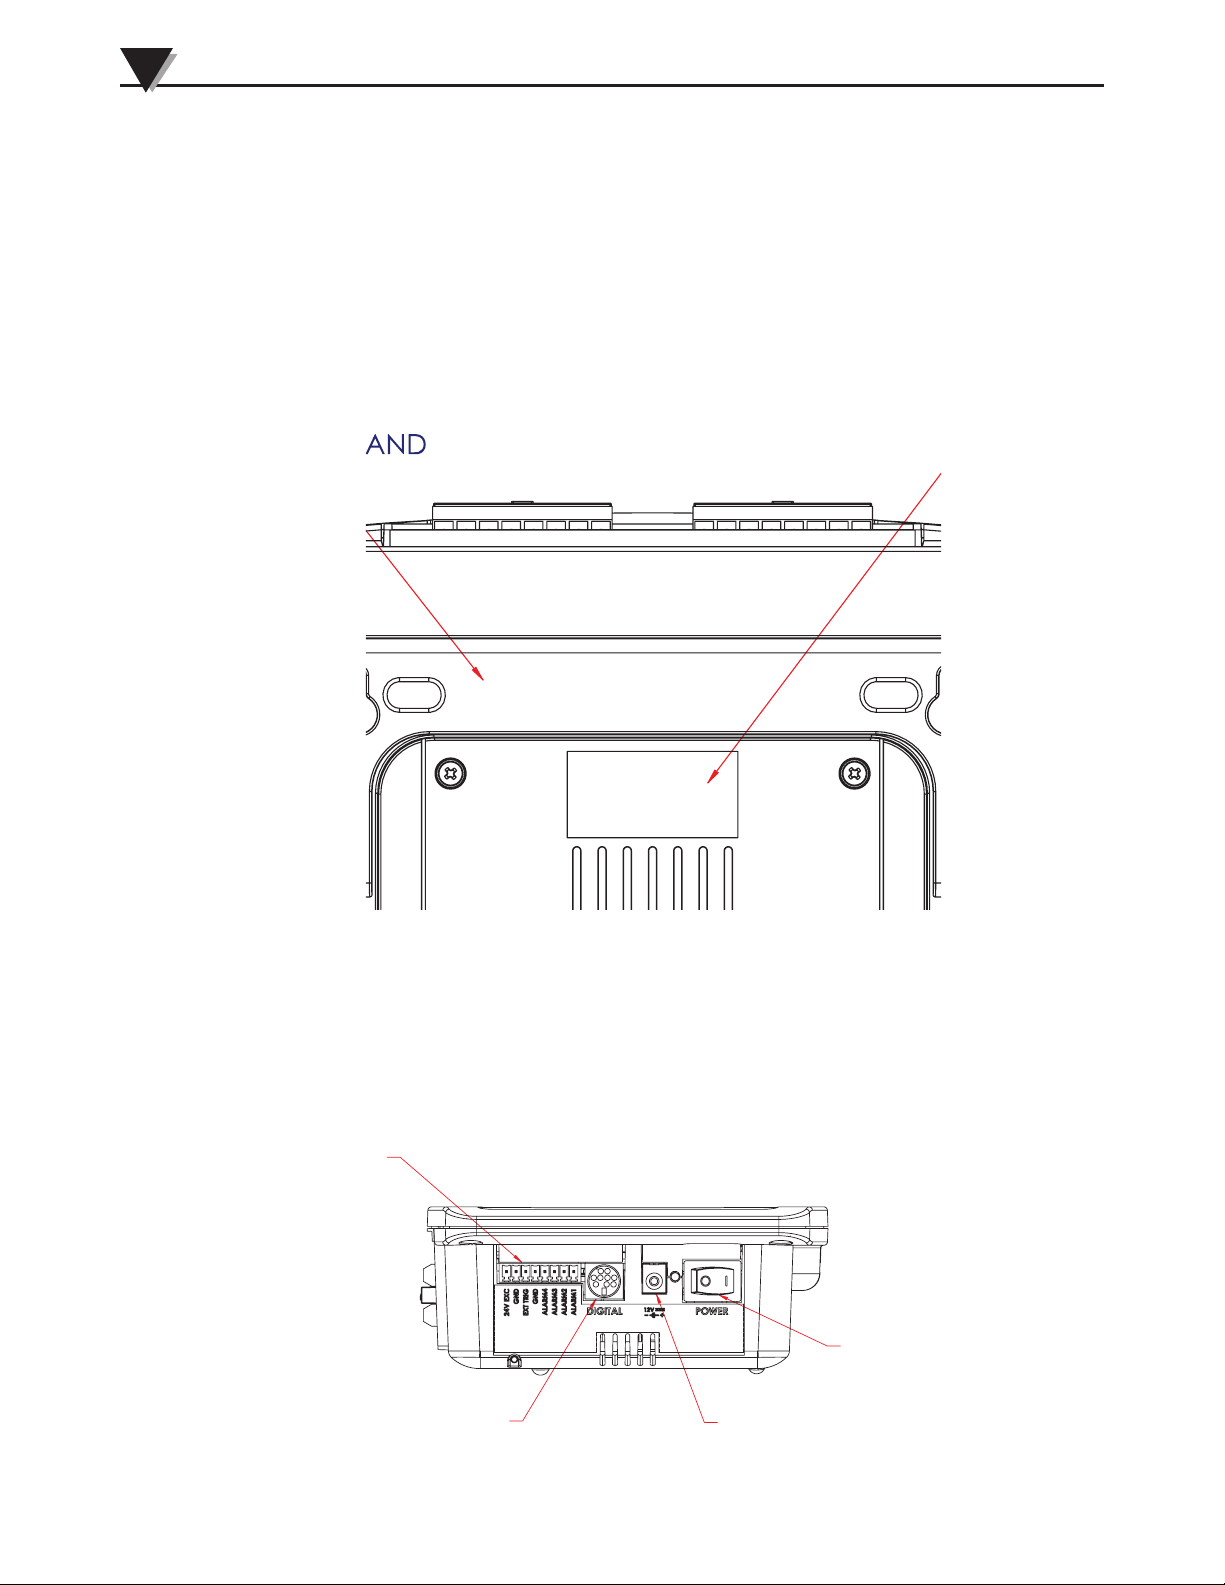
The left side of the data logger features connections for alarm outputs, digital
I/O and DC power.
$/$50(;7(51$/75,**(59
(;&,7$7,217(50,1$/
',*,7$/,2
Figure 2-4 OM-DAQXL Left Side View
Figure 2-3 OM-DAQXL Back View.
32:(56:,7&+
9'&,1387
2-3
Page 13
Hardware
2.3.4 Right Side
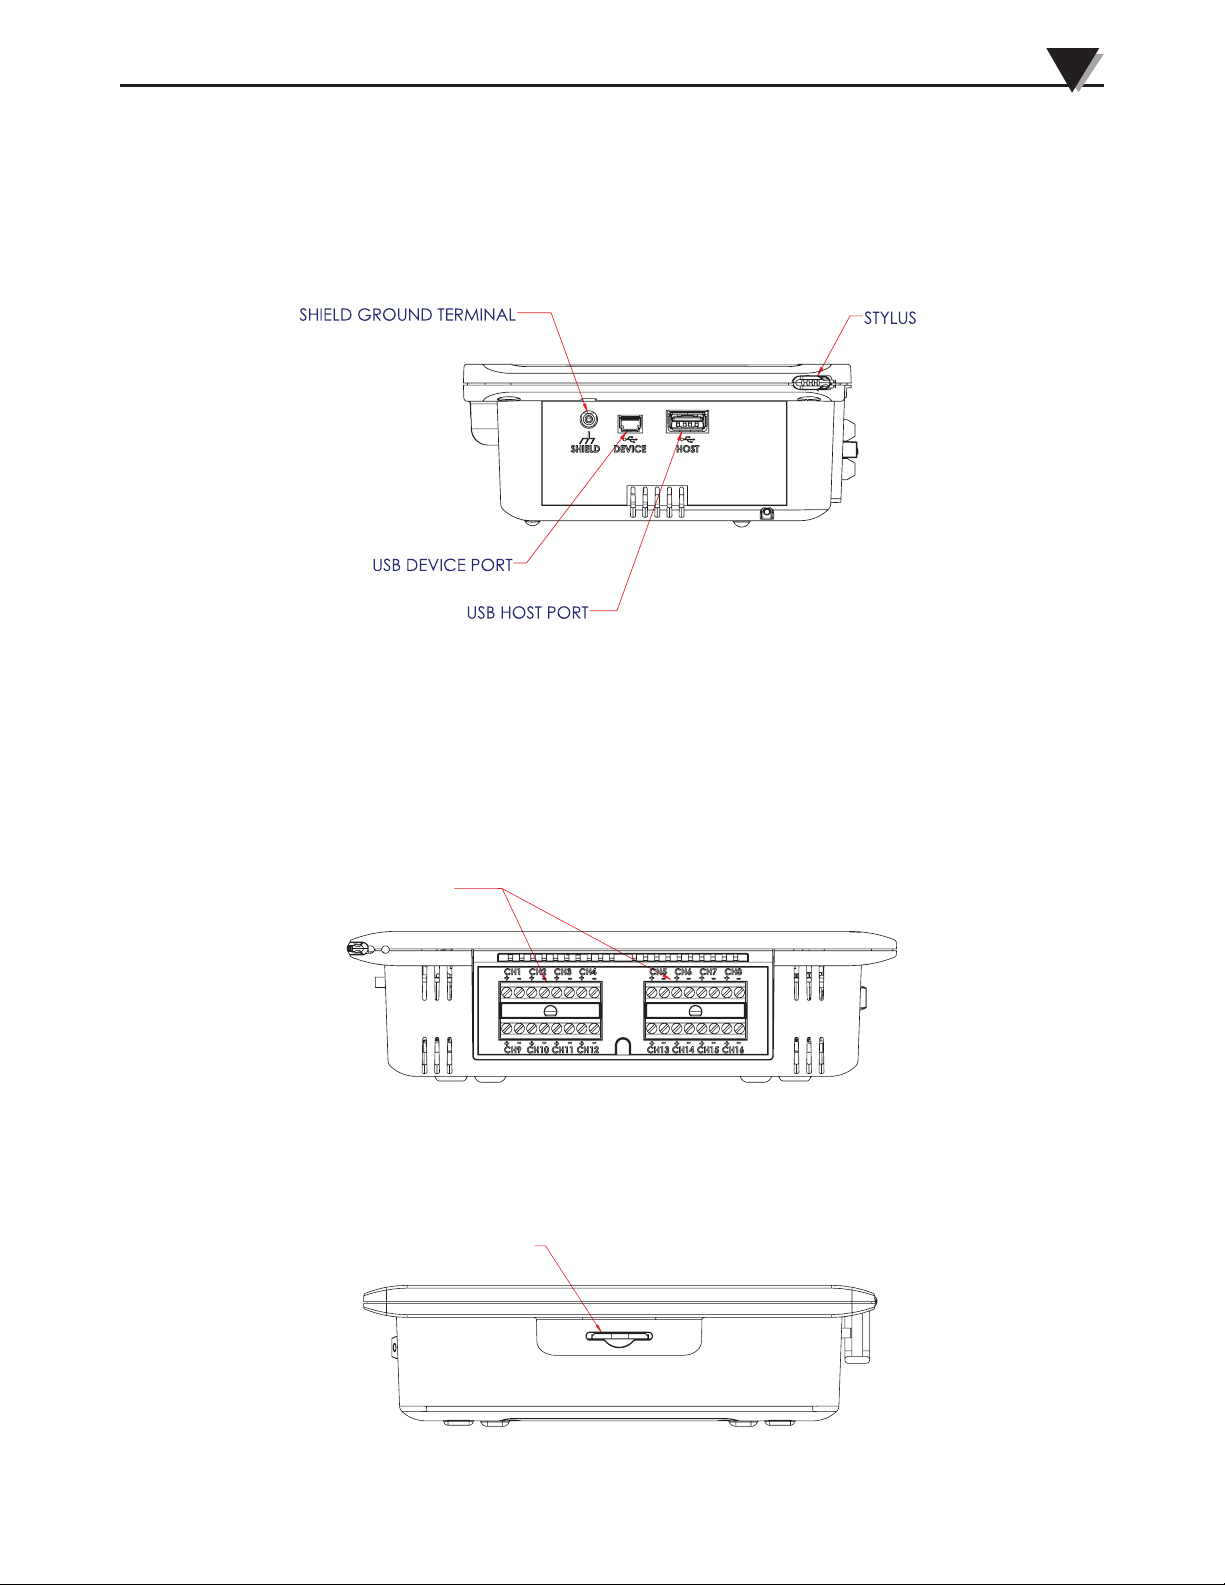
The right side of the data logger features the USB host and device connectors
as well as the shield ground terminal. The shield ground terminal may be
connected to earth ground to minimize sensor noise pickup. In addition the
stylus is stored in a slot on this side of the device.
2
Figure 2-5 OM-DAQXL Right Side View
2.3.5 Top
The top of the data logger provides analog input terminal blocks for either 8
or 16 channels depending on the model. The terminal blocks are designed to
accommodate wire between sizes 26 -14 AWG. See Section 2.6 for information on
how to connect sensors.
$1$/2*,13877(50,1$/6
Figure 2-6 OM-DAQXL Top View
2.3.6 Bottom
6'&$5'6/27
Figure 2-7 OM-DAQXL Bottom View
2-4
Page 14
2
Hardware
2.4 Removing & Installing Rubber Boot
The data logger ships with an impact resistant rubber boot pre-installed.
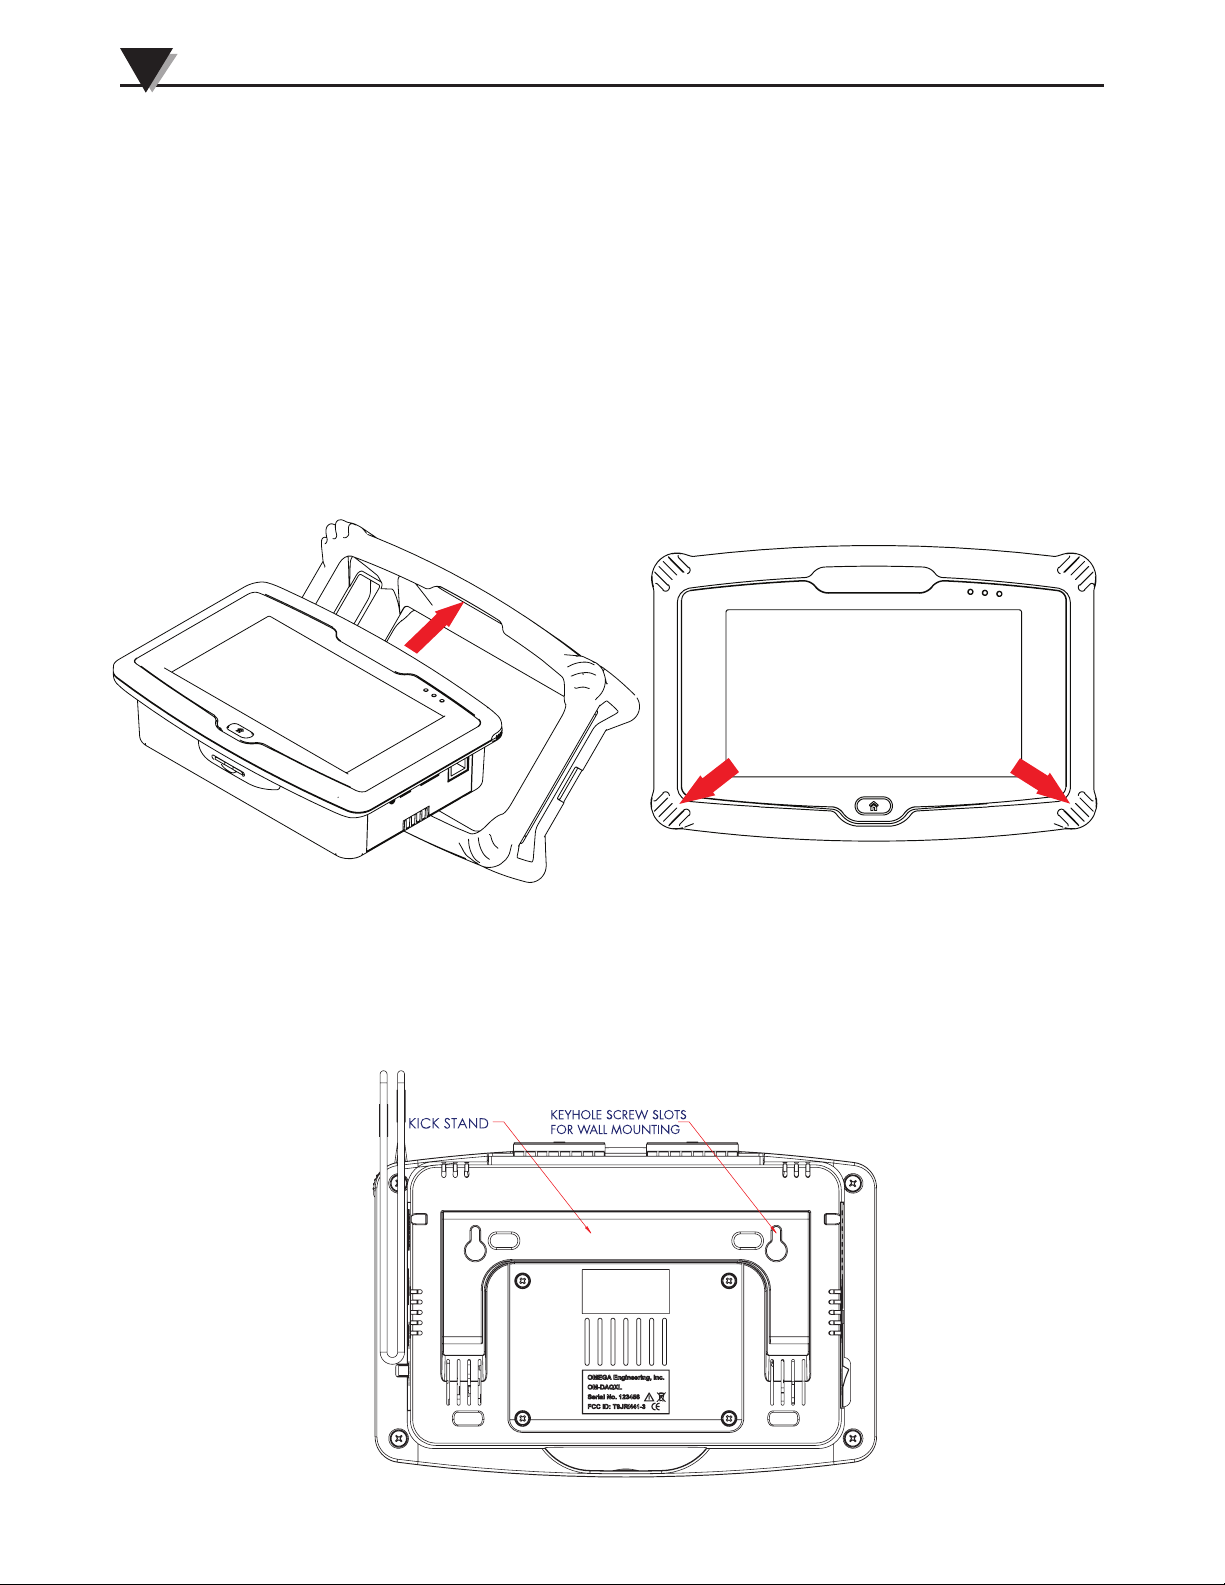
OMEGA recommends leaving the protective rubber boot installed, but it can be
removed for convenience. When removing the rubber boot be sure to do so with
a support surface not more than 1 foot beneath the device to protect in the case of
an accidental drop.
To remove the device from the rubber boot first power off the device and
disconnect all external connections including power, analog & digital inputs,
and communication interfaces. Next while holding the device with one hand
gripping the top of the device, use the other hand to pry one of the bottom
corners of the rubber boot outward and downward until the corner of the device
pops free from the boot. Repeat for the other bottom corner of the device. With
both of the bottom corners free of the boot, continue to tilt the bottom of device
upward and pull it outward until it is free from the boot. Installation is the
reverse of removal.
Figure 2-8 Removing Rubber Boot
2.5 Wall Mounting
The data logger features a built in kick stand with keyhole screw slots that fit #6
(M3.5 metric) sized screws for wall mounting.
2-5
Figure 2-9 OM-DAXL Wall Mounting.
Page 15
2.6 Sensor Connections
This section shows how to connect sensors to your analog input terminals.
There are 8 or 16 analog input channels (depending on the model) each having
one positive terminal and one negative terminal clearly shown on the input
label. Depending on the type of sensor being connected 2 input channels may
be required. Input tables and figures are shown for each type of input. Bridged
based sensors (strain gages, load cells and mV output pressure transducers)
require excitation voltage which is provided on channels 1 and 2, 3 and 4,
9 and 10, 11 and 12 only. See tables 2-3 and 2-4 for wiring information.
2.6.1 Two wire sensors
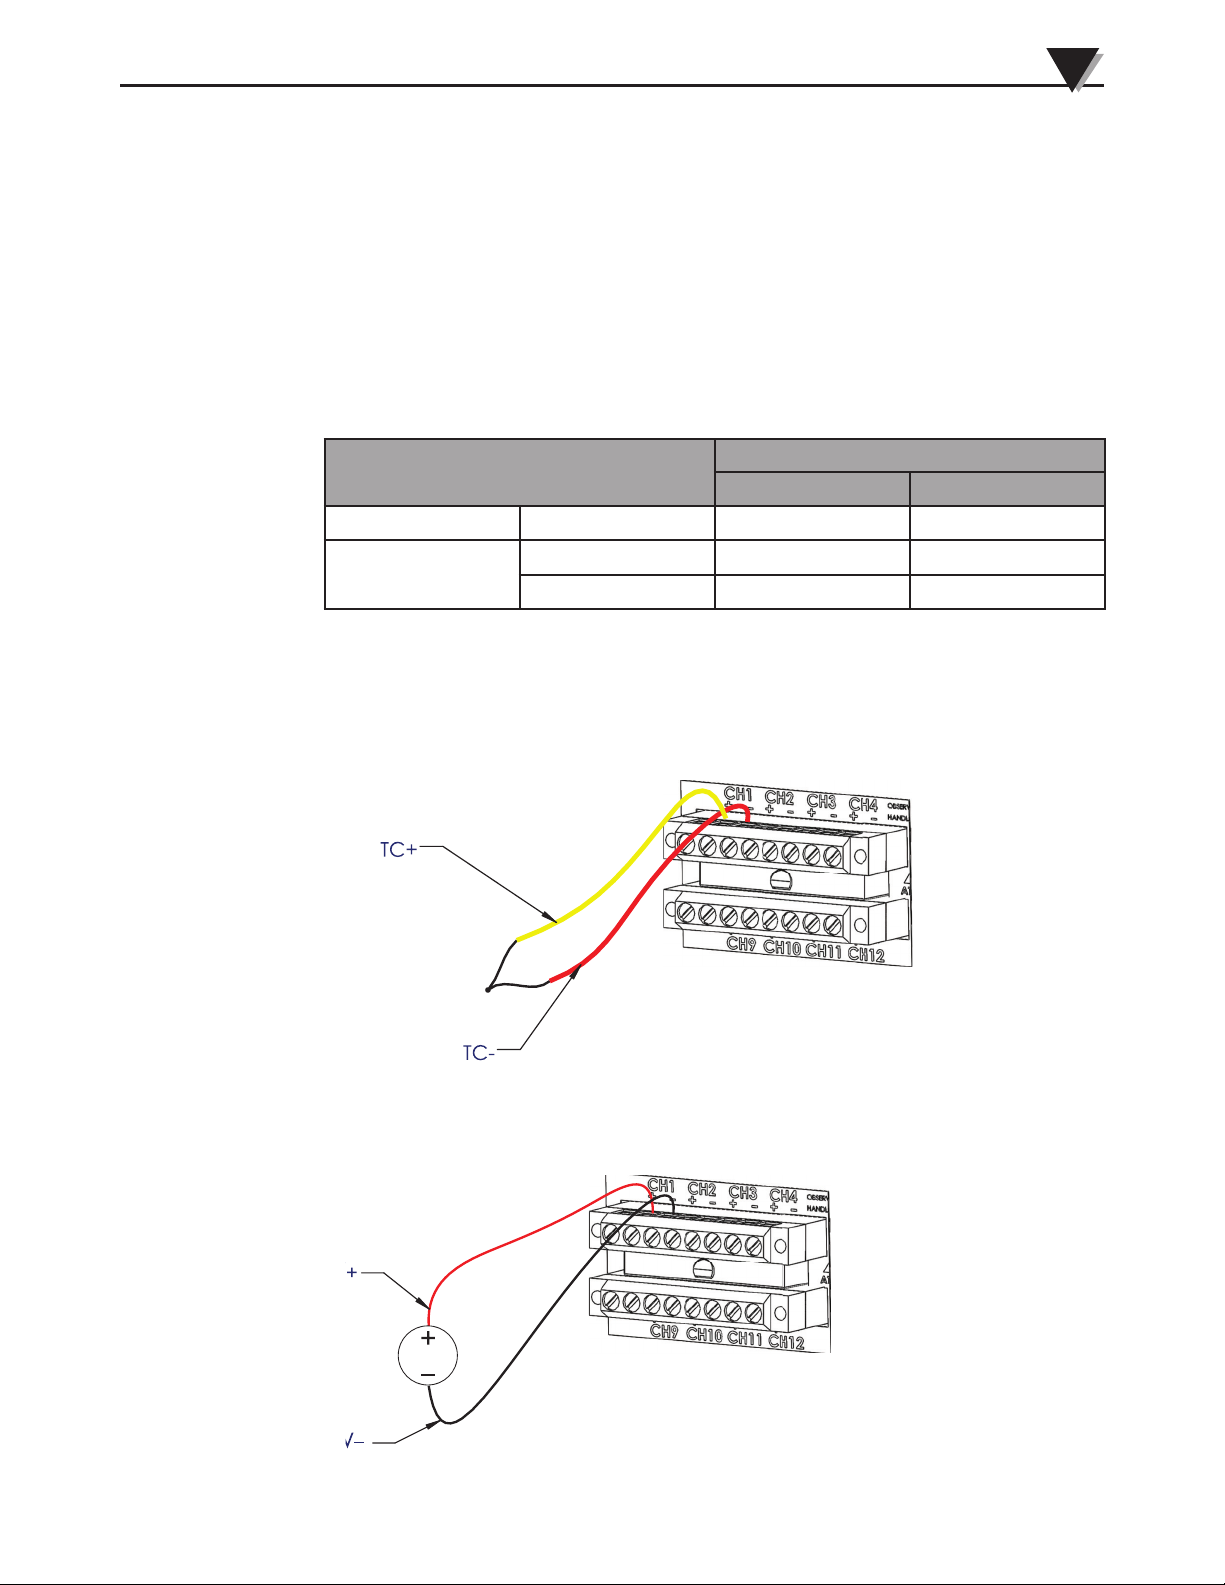
For two wire sensors any open channel can be configured to read the sensor.
Sensor Type
Temperature Thermocouple TC+ TC-
Hardware
Any Channel
+ –
2
Process
Voltage V+ V-
Current I+ I-
Table 2-3 Two wire sensor connections.
2.6.1.1 Thermocouples
For thermocouple sensors the negative lead is always colored red
(USA and Canada) or white (IEC 584-3).
Figure 2-10 Thermocouple Wiring Example
2.6.1.2 Voltage Wiring
Figure 2-11 DC Voltage Wiring Example
2-6
Page 16
2
Hardware
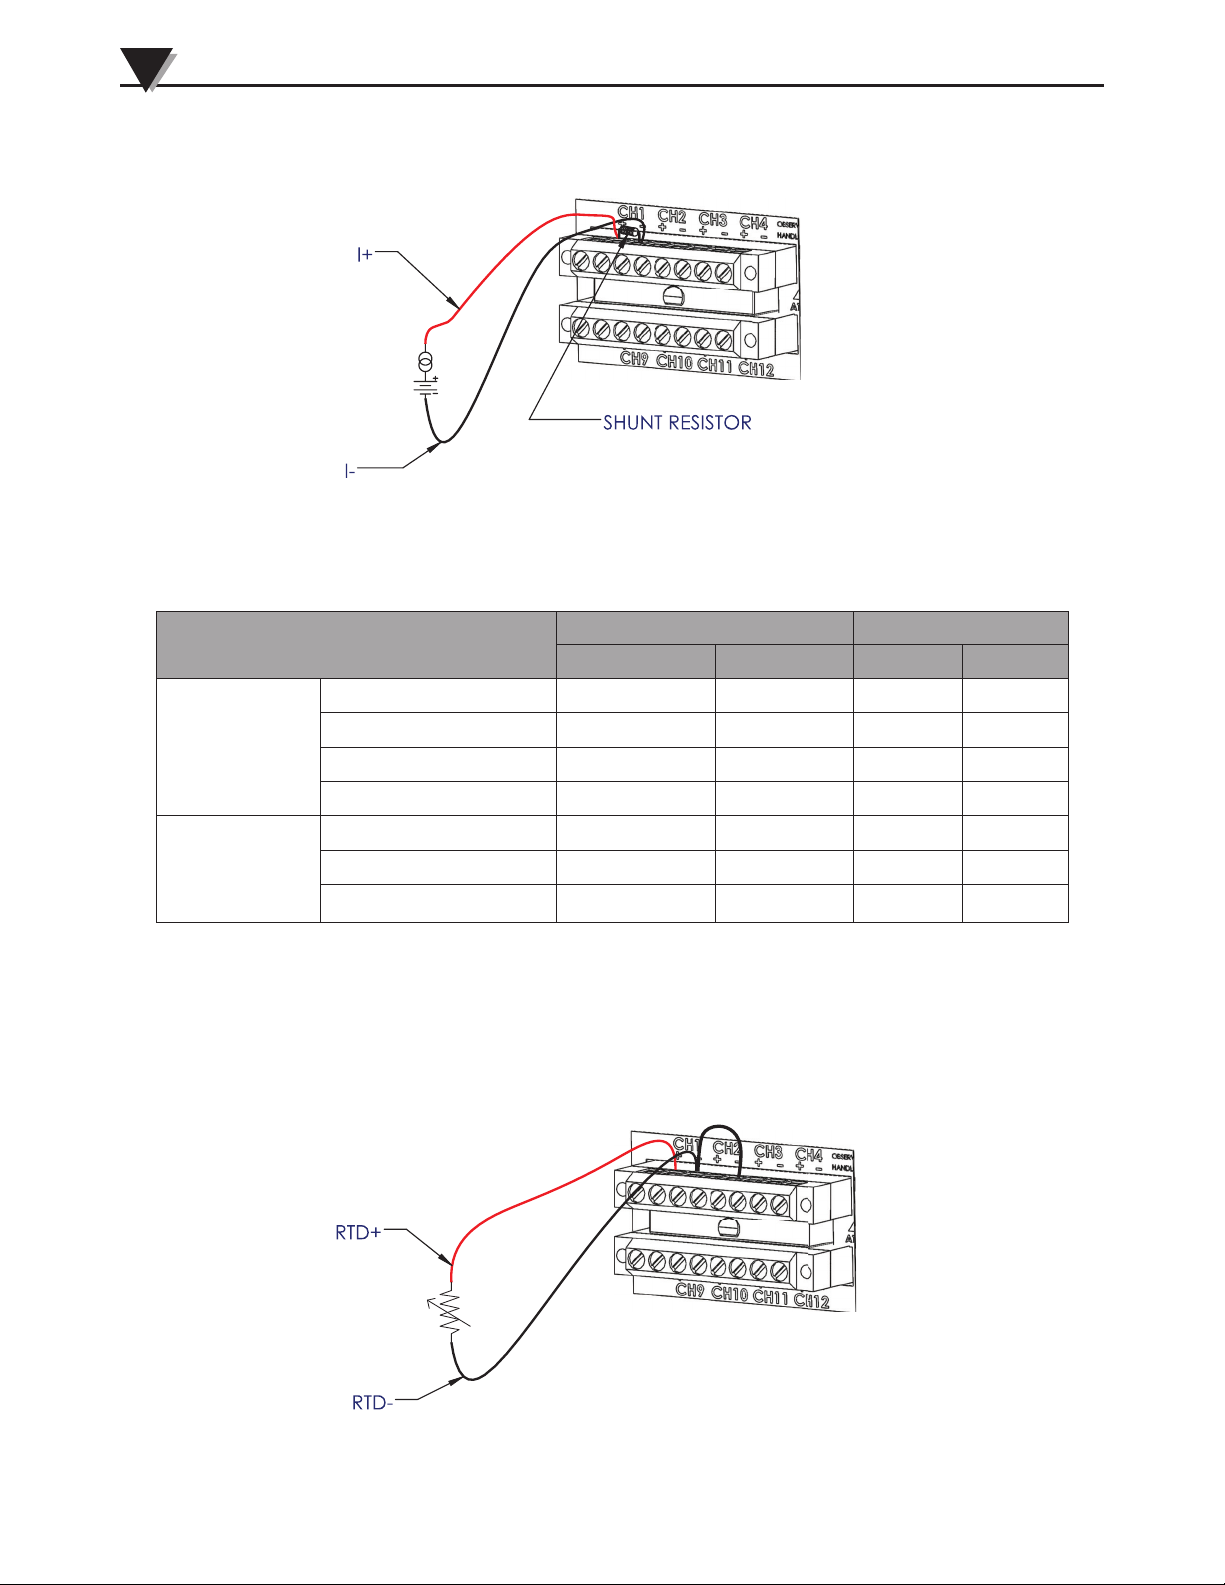
2.6.1.3 Current Wiring
For current measurement a 50Ω shunt resistor is provided.
Figure 2-12 DC Current Wiring Example - External Excitation
2.6.2 Two, Three & Four Wire Sensors
Sensor Type
Temperature
Bridge
Odd Channel Even Channel
+ - + -
2 Wire RTD RTD+ RTD– RTD3 Wire RTD RTD+ RTD– RTD4 Wire RTD RTD+ RTD– RTD+ RTD-
Thermistor Th+ Th- Th-
Strain Gage EXC+ EXC- V+ V-
Load Cell EXC+ EXC- V+ V-
Pressure Transducer EXC+ EXC- V+ V-
Table 2-4 Three and Four Wire Sensor Connections
2.6.2.1 Two-Wire RTD Wiring
For RTD sensors the positive colored red and the common lead can be either
black or white. A jumper wire must be connected between the negative leads of
the two assigned channels as shown in figure 2-13.
2-7
Figure 2-13 Two-Wire RTD Wiring Example
Page 17
Hardware
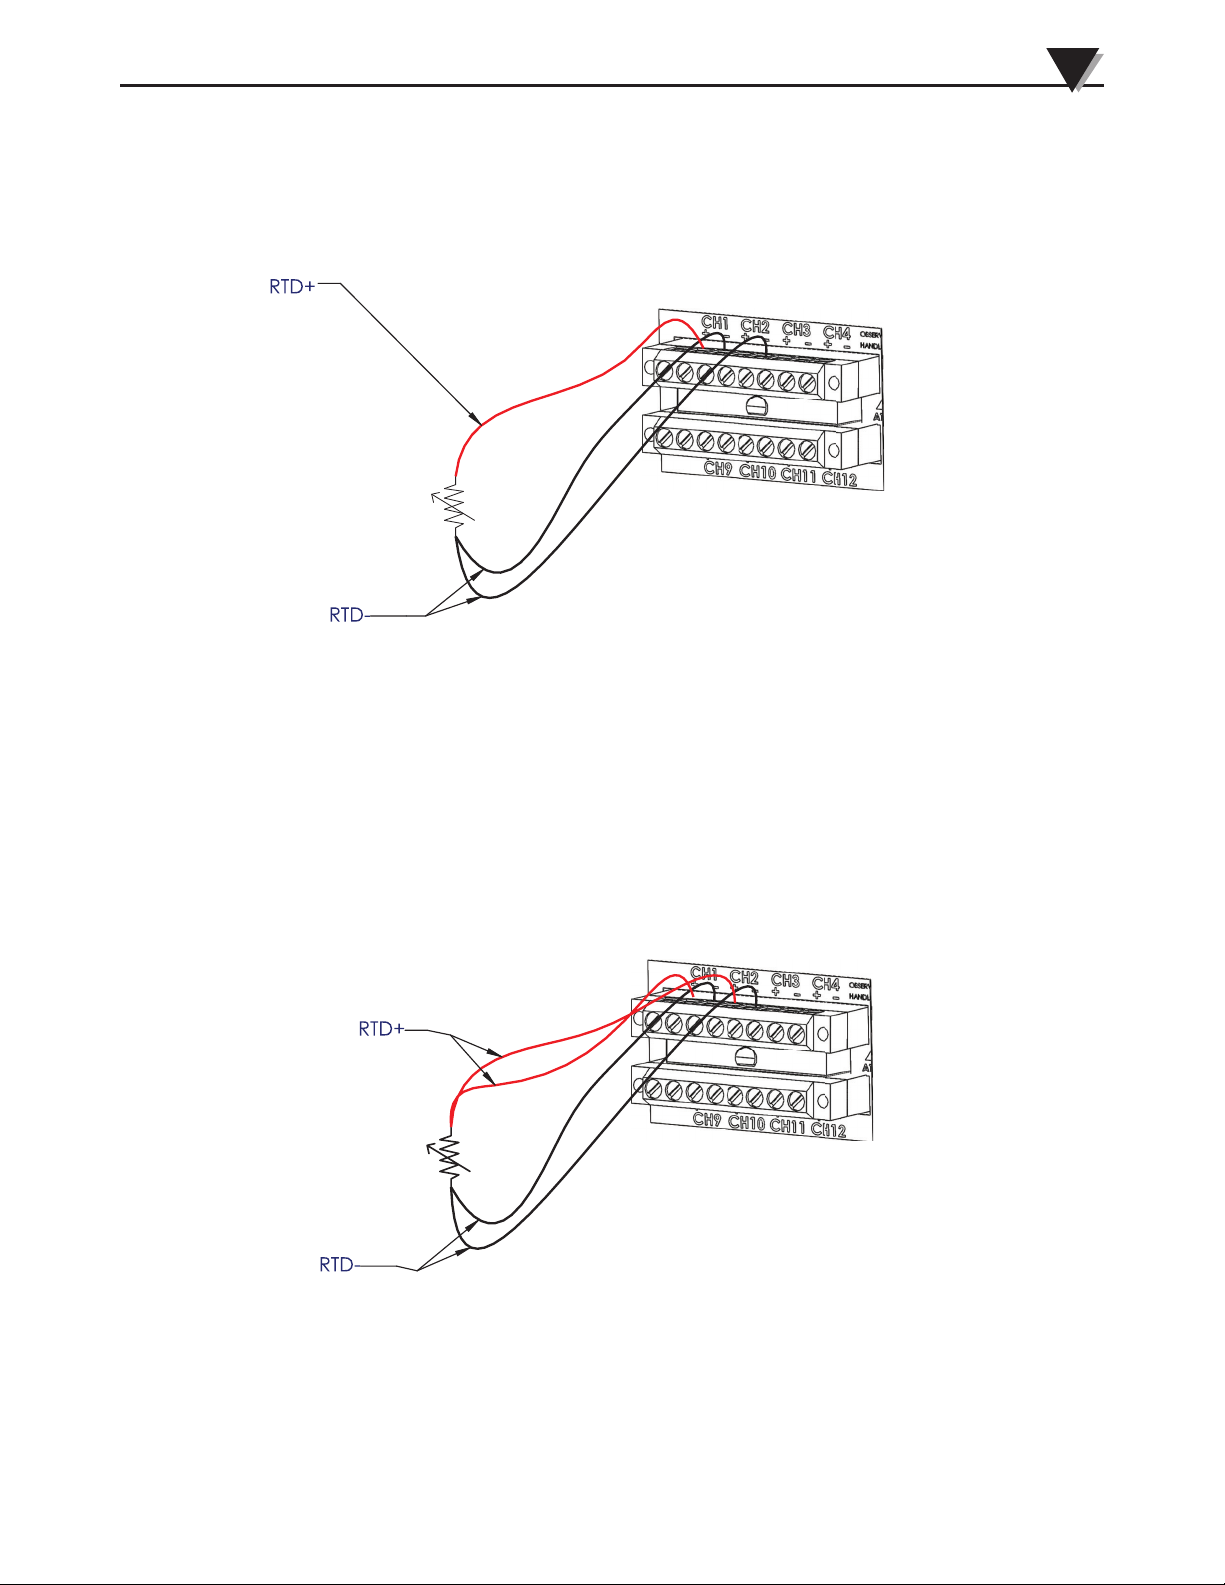
2.6.2.2 Three-Wire RTD Wiring
For 3-wire RTD sensors the second common lead must be connected to the
negative terminal of the next consecutive even channel.
2
Figure 2-14 Three-Wire RTD Wiring Example
2.6.2.3 Four-Wire RTD Wiring
For 4-wire RTD sensors the data logger performs a Kelvin resistance
measurement using 1 channel to supply excitation voltage and the next channel
to sense the voltage across the RTD.
Figure 2-15 Four-Wire RTD Wiring Example
2-8
Page 18
2
Hardware
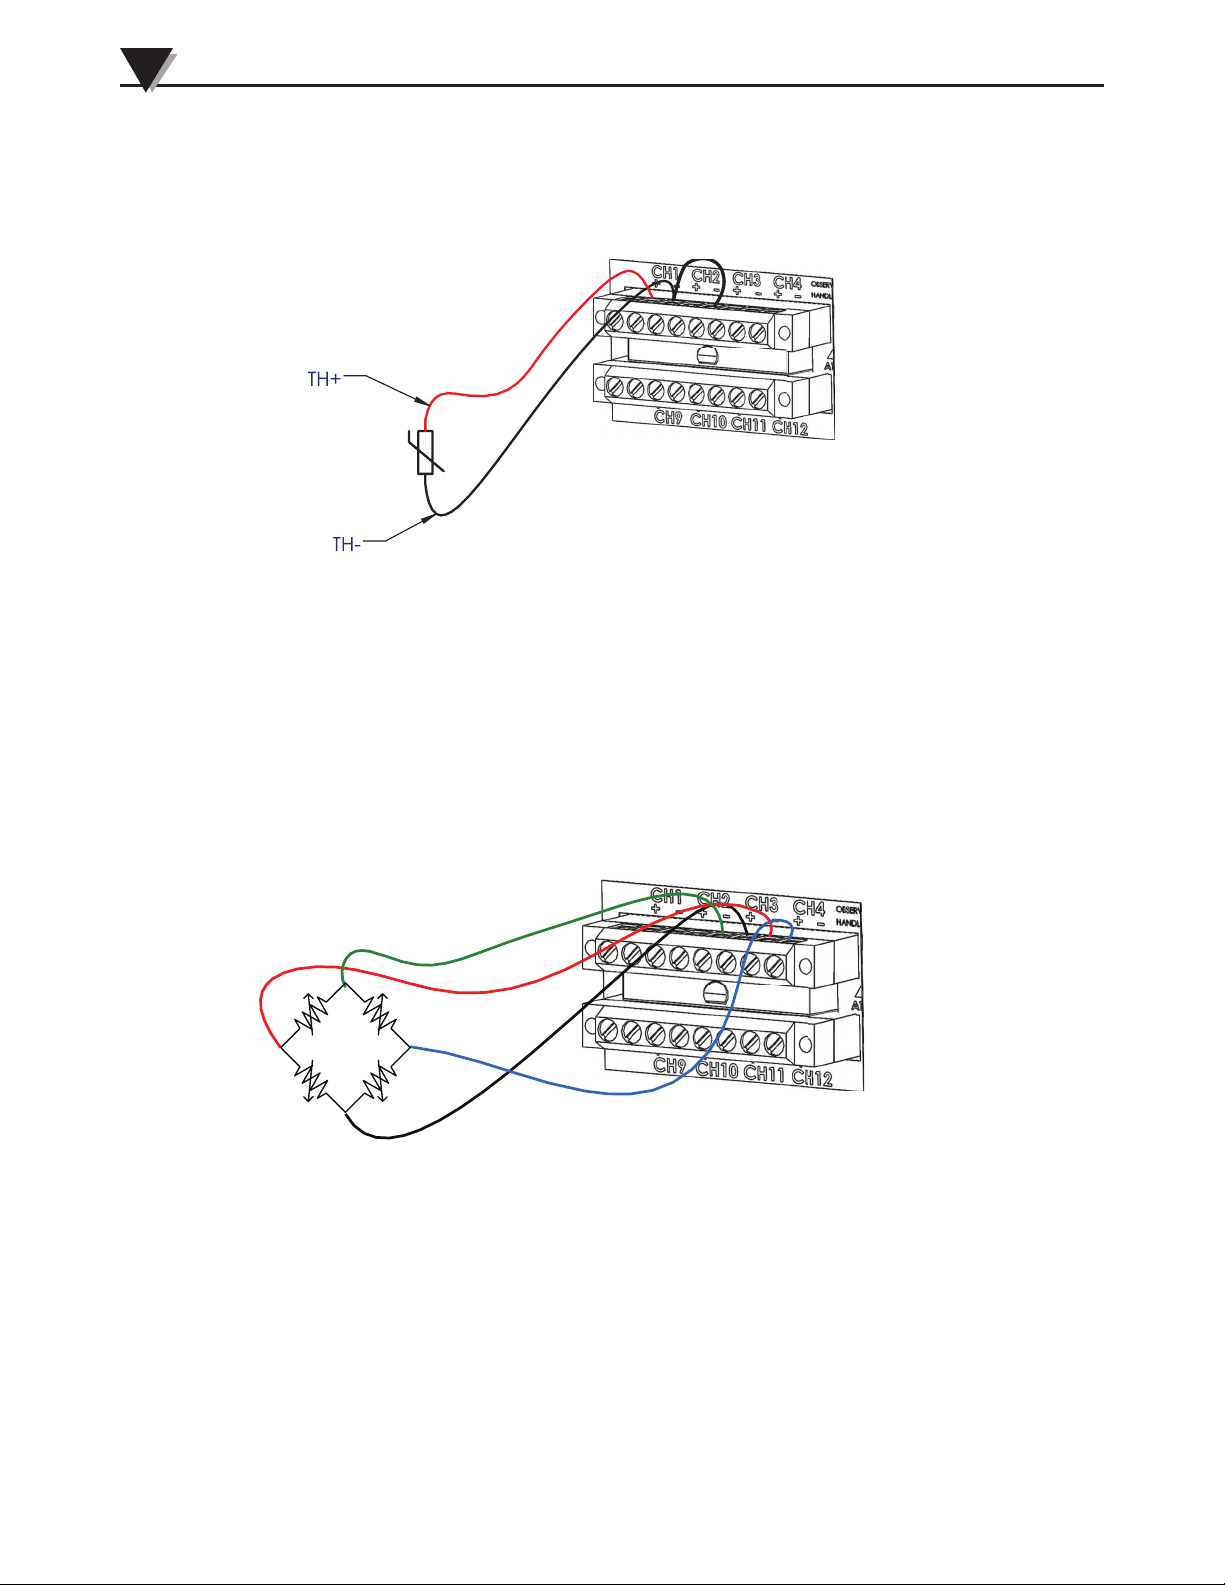
2.6.2.4 Thermistor Wiring
For thermistor sensors connection, 2 channels are required as shown in Figure 2-16.
Figure 2-16 Thermistor Wiring Example
2.6.2.5 Bridge Sensor Wiring
For bridge based sensors excitation voltage is supplied on channels 1, 3, 9 and
11. The next consecutive even channels must be used to measure the sensor
output.
Figure 2-17 Bridge Sensor Wiring Example
2-9
Page 19
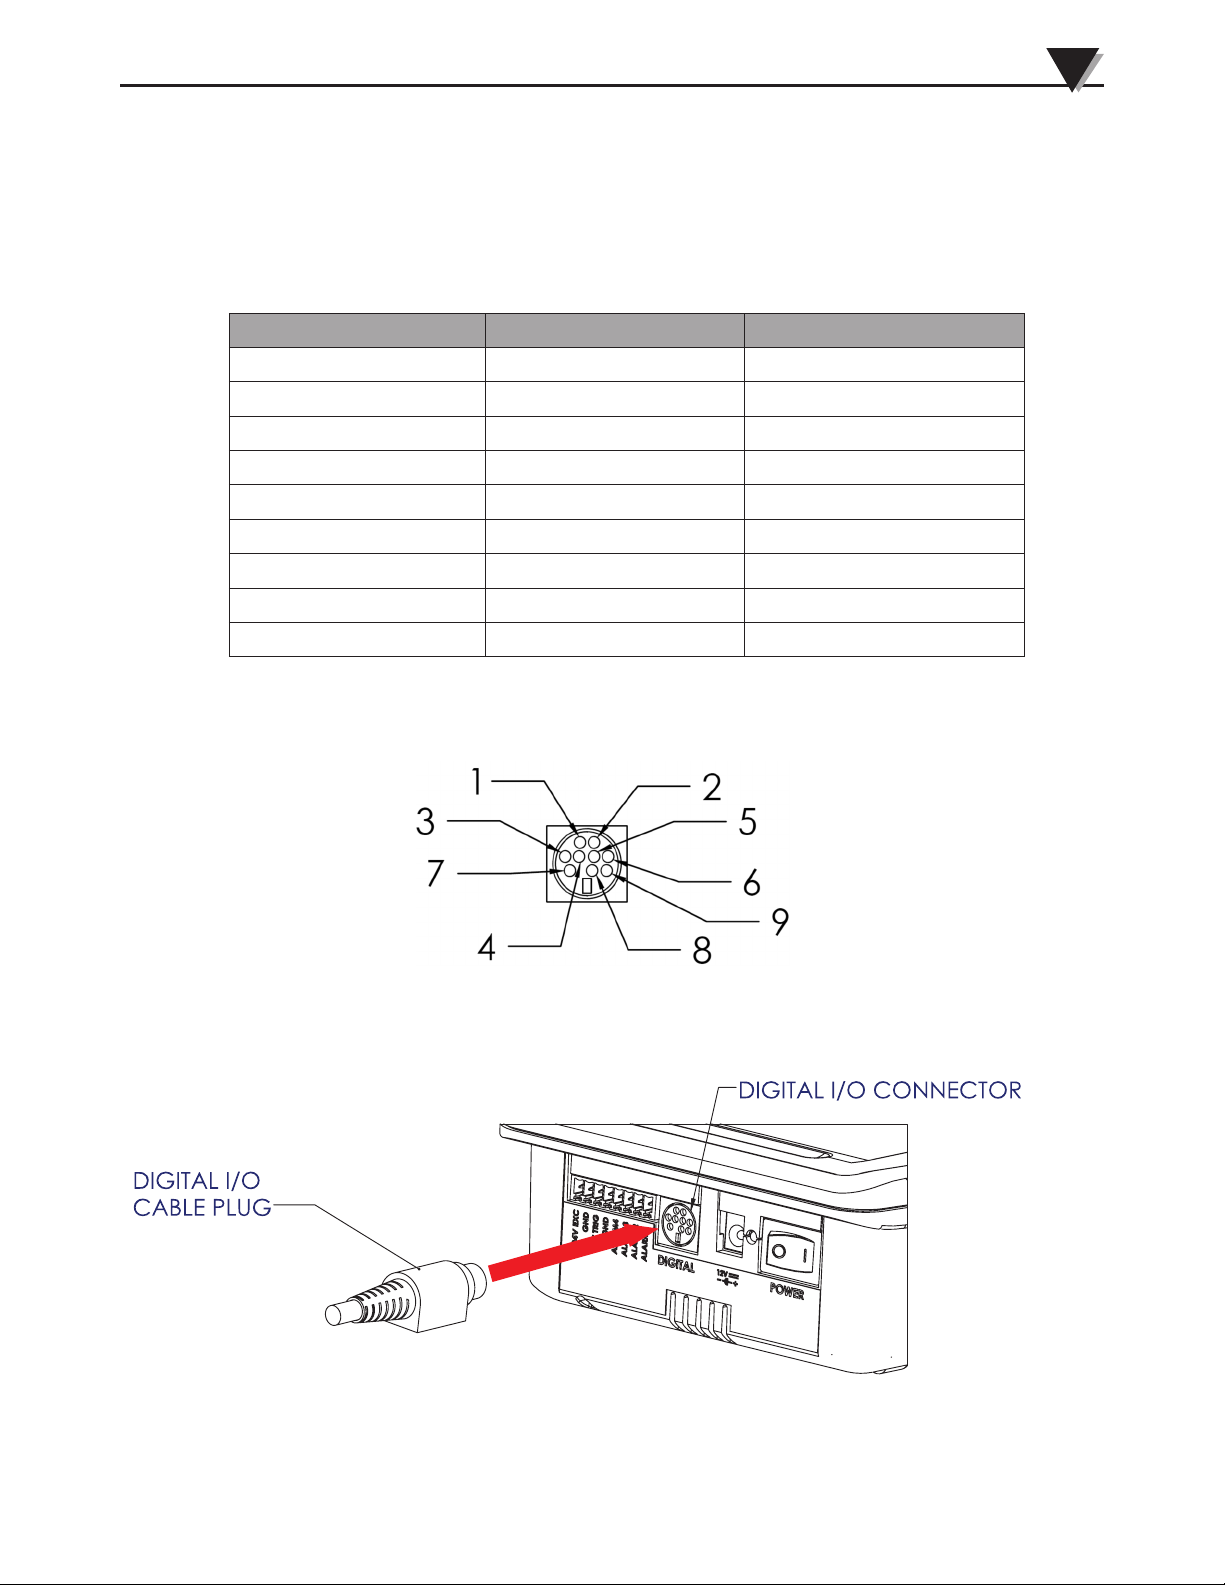
2.7 Digital I/O Connections
The included 6’ digital I/O cable with stripped leads and mini-DIN connector
makes connecting digital I/O to the data logger quick and simple. Table 2-5
shows the cable pinout and figure 2-18 shows the corresponding pins on the data
logger connector.
Signal Name Pin # Wire Color
Digital Input 1 1 White
Digital Input 2 2 Red
Digital Input 3 3 Orange
Digital Input 4 4 Purple
Digital Output 1 5 Brown
Digital Output 2 6 Black
Digital Output 3 7 Blue
Digital Output 4 8 Green
Hardware
2
Isolated Ground 9 Yellow
Table 2-5 Digital I/O cable pinout.
Figure 2-18 Digital I/O Connector Pin Numbers.
Figure 2-19 Connecting the Digital I/O Cable.
2-10
Page 20
2
Hardware
2.8 Alarm, Excitation & Trigger
The eight position terminal block on the left side of the device has terminal
positions for four alarm outputs, an isolated 24 VDC excitation supply and
an external trigger input. Connections are made easy through the included
pluggable terminal block. Follow the terminal indications on the label and
connect to the appropriate position
Signal Name Terminal #
Alarm 1 1
Alarm 2 2
Alarm 3 3
Alarm 4 4
Ground 5
External Trigger 6
Isolated Ground 7
+24 Vdc 8
Table 2-6 Alarm Terminal Block Signals
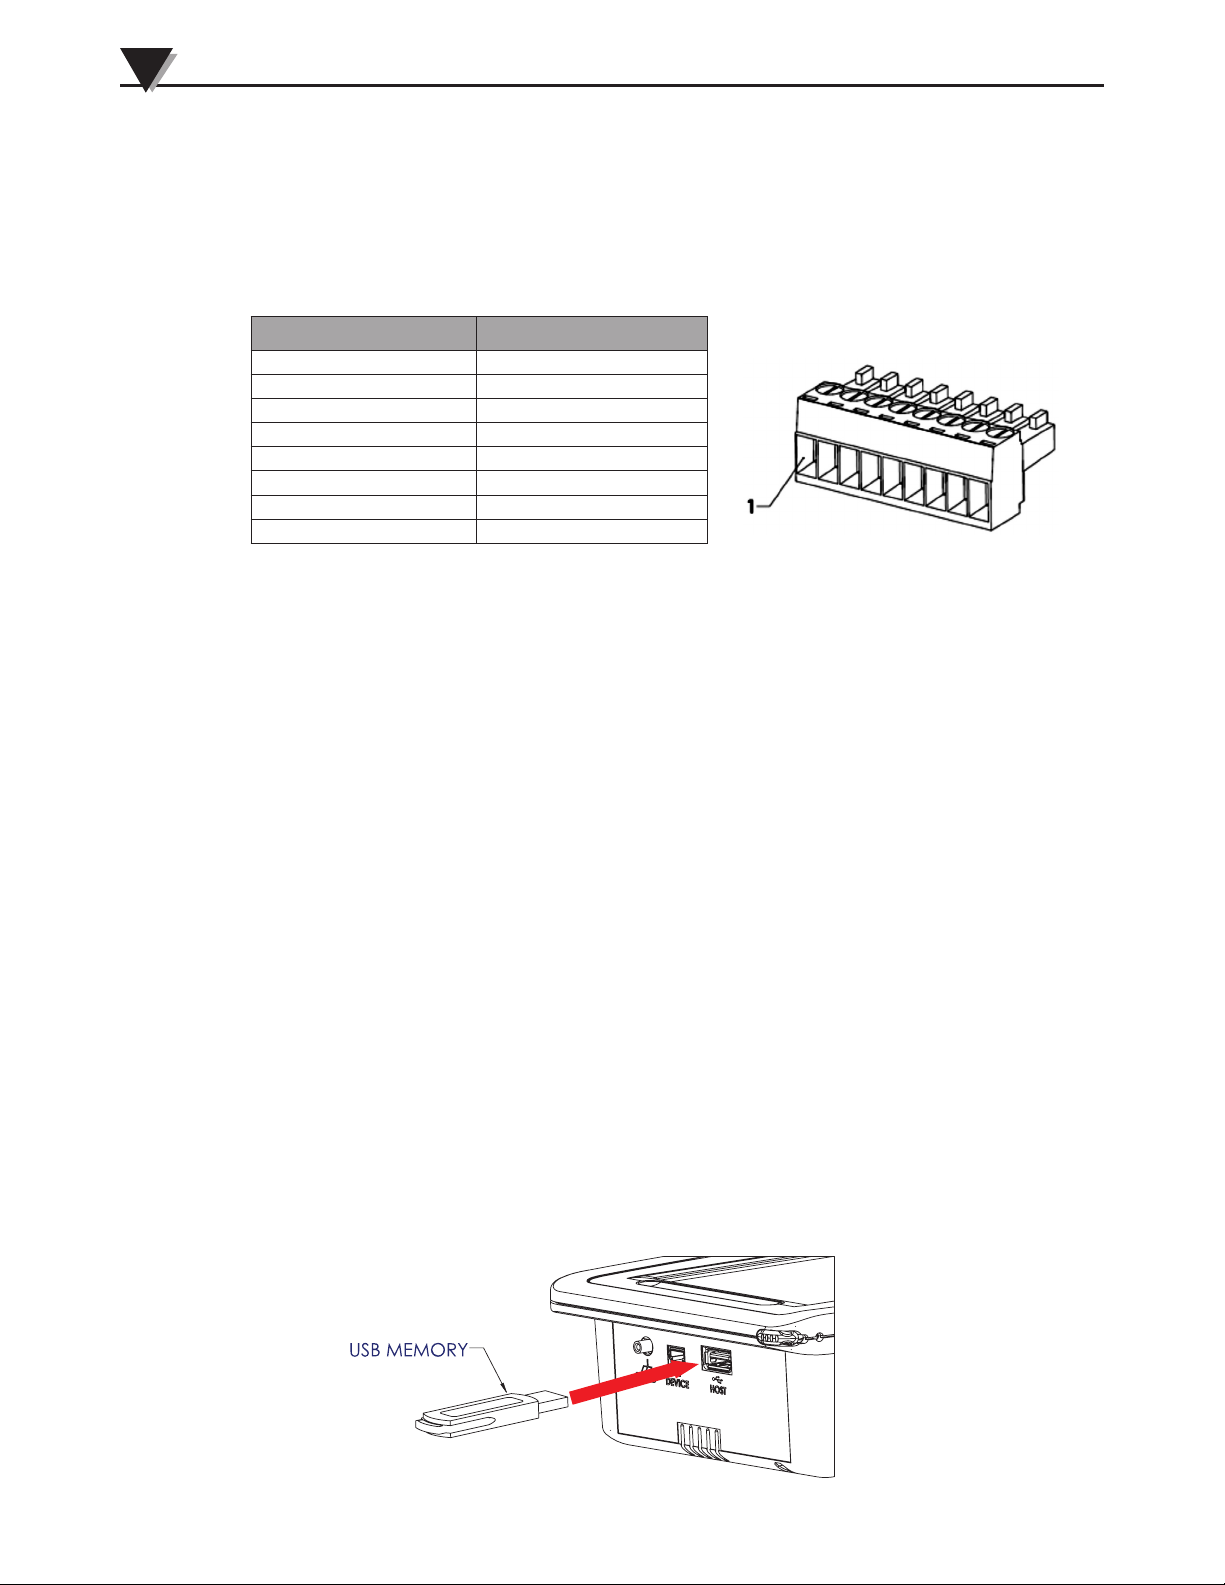
2.9 USB Host ports
Figure 2-20 Alarm Terminal Block
The USB host port allows external USB memory to be used for data storage. USB
Memory up to 64GB in size can be used with the data logger. The USB host can
also be used to connect a USB mouse.
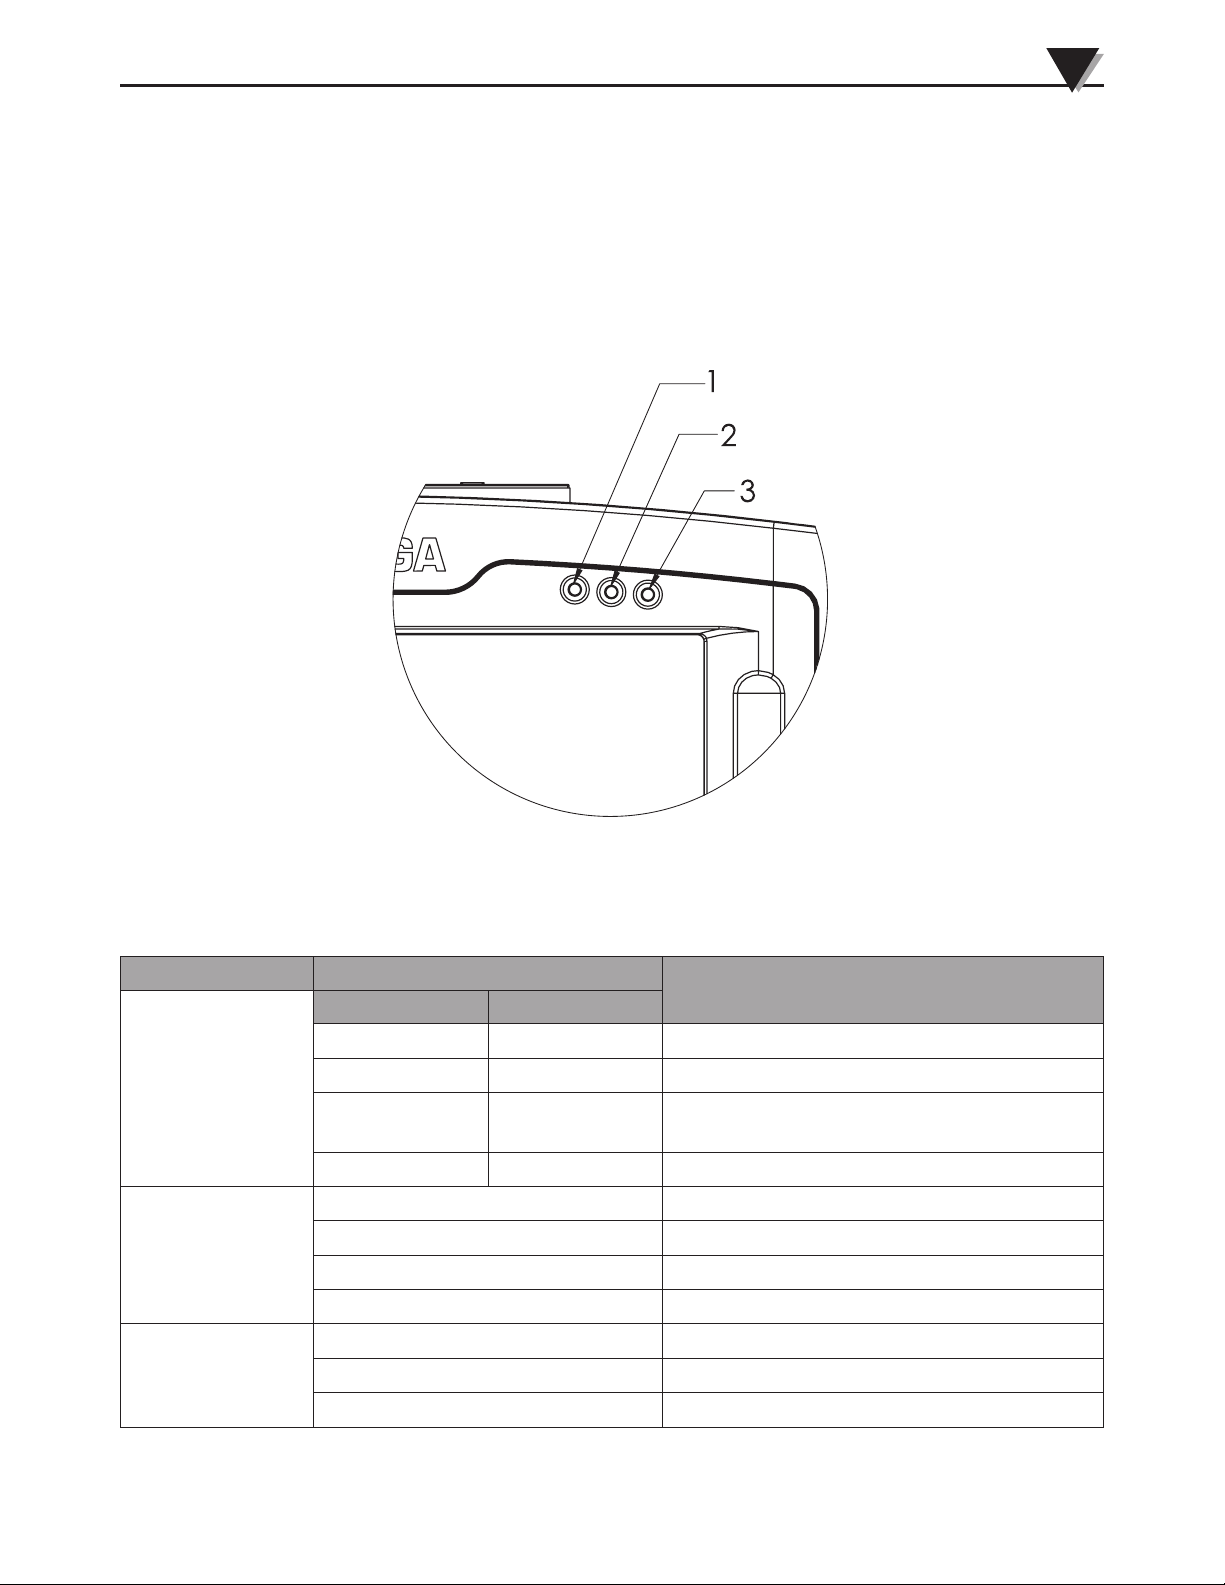
2.10 LED Indication
The three status LEDs on the front of the data logger provide an easy to see
visual indication of the status of the device. This is useful when the LCD has
been turned off or is difficult to read due to glare or distance. See figure 2-24 and
table 2-7 for information on the different LED indications.
2.11 Battery Pack and Power Adapter
The data logger is a portable device and can operate on battery power for several
Figure 2-21 USB Cable Connection to Data Logger.
hours before requiring recharging. The included battery is a 7.2V, 4.8 Ah Li-Ion
battery. Also included is an AC adapter to provide 12VDC power for longer
term data logging and battery recharging.
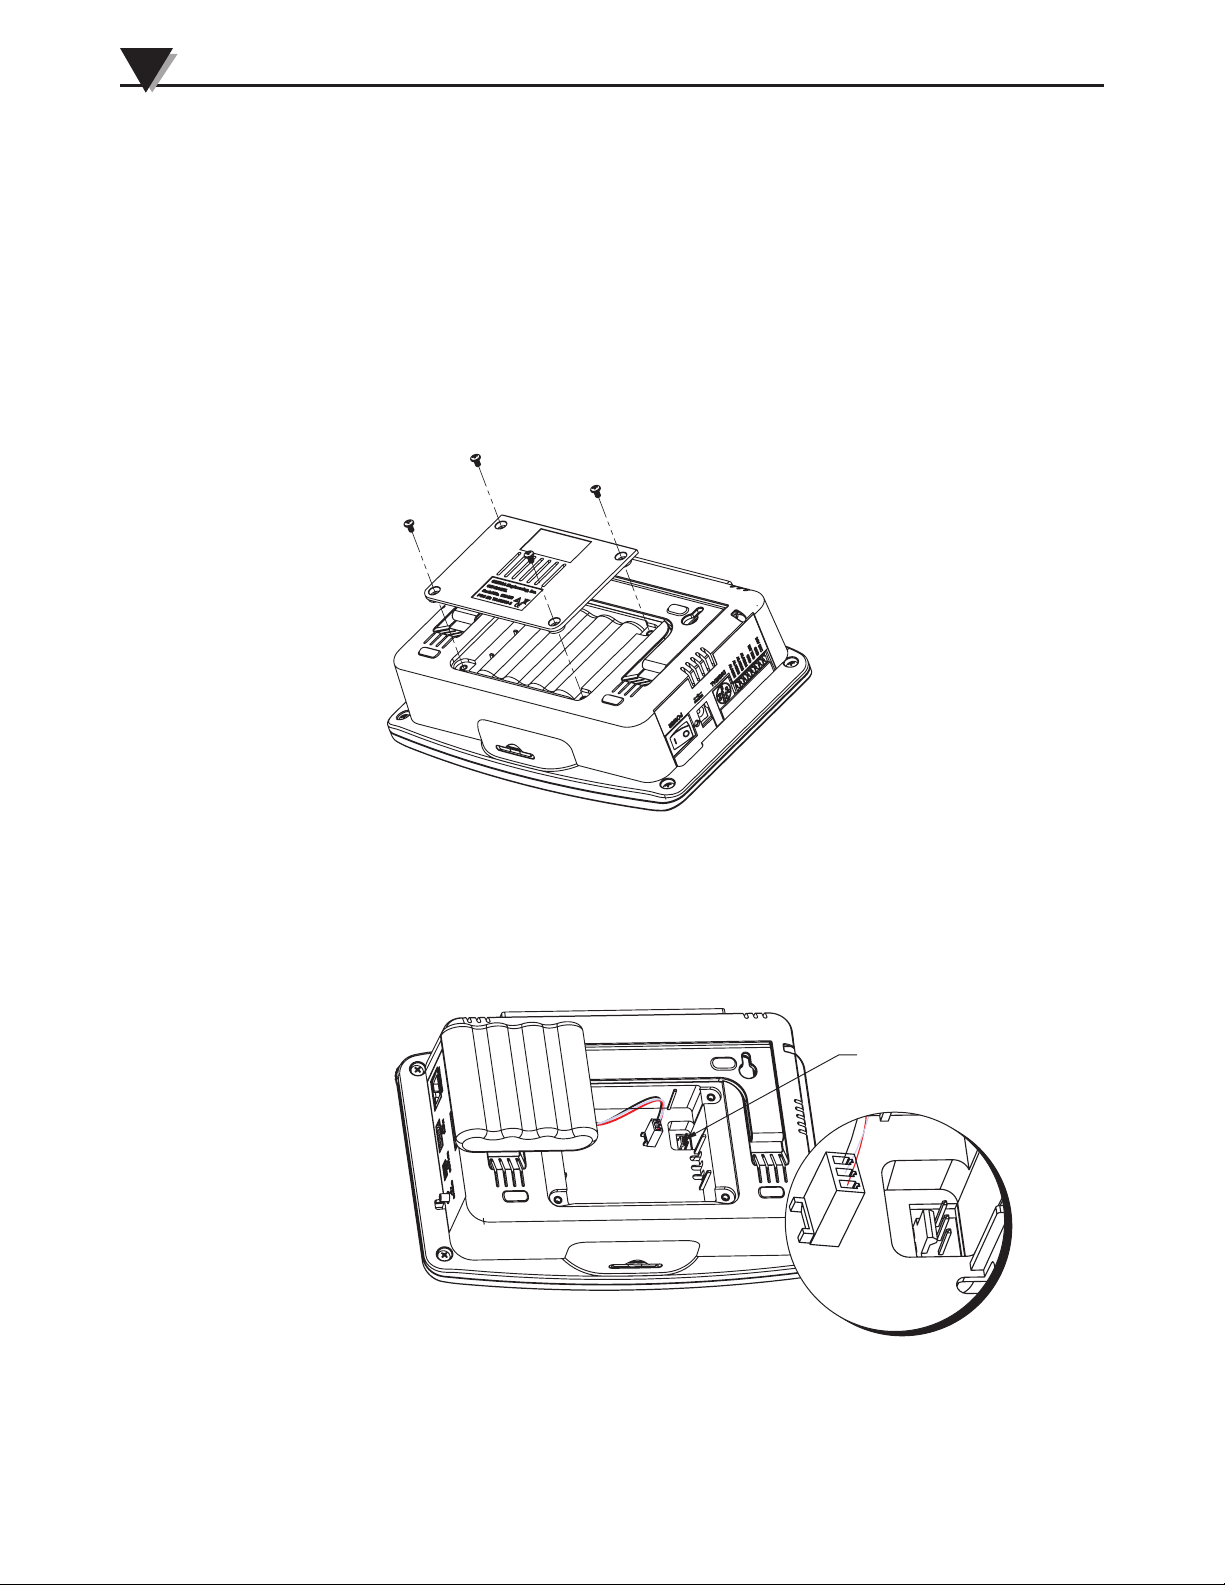
2.11.1 Connecting the battery pack
The data logger ships with the battery installed, but disconnected to keep it from
completely draining during shipment. To connect the battery pack:
2-11
Figure 2-23 Inserting USB Memory.
Page 21
Hardware
1. Remove the four screws securing the battery door using the included screw
driver.
2. Remove the battery from the compartment.
TM
2
Led Status
DC Adapter Battery
Connected Charged Green
1 – Power/
Charging
Connected Charging Green Flashing
Not connected Discharging Green, amber battery <40% remaining,
Connected No battery Flashing amber
Not logging - Error Red
2 – Logging
Armed mode Amber
Free running Green
Alarm condition Red
3 - Alarm
Alarms disabled Off
Figure 2-24 Status LED Locations
Color and State
red battery <15% remaining.
Logging Flashing Green
No alarm Green
Table 2-7 Status LED States
2-12
Page 22
2
,16(57%$77(5<
3/8*+(5(
Hardware
3. Plug the keyed connector on the end of the battery leads into the power
connector in the battery compartment. IMPORTANT! Observe the correct
polarity when plugging the battery into the data logger.
4. Reinstall the battery in the compartment placing the leads under the battery.
Be sure not to crimp the battery leads.
5. Reinstall the battery compartment door and tighten the 4 battery door
screws.
It is recommended to fully charge the battery using the included AC adapter
after installation. When the device is powered off the LED next to the power
switch will be illuminated to indicate that the battery is charging. In addition,
when the device is powered on, the Power/Charging LED will be flashing green
Figure 2-25 Removing Battery Door.
and the battery life indication on the LCD will show a lightning bolt symbol over
the battery to indicate that it is being charged.
2.11.2 Connecting the AC Adapter
The AC adapter is a universal input (100 – 240 VAC) adapter that provides 12
,16(57%$77(5<
3/8*+(5(
Close-Up of
Battery Plug
Figure 2-26 Connecting Battery
VDC output to power the data logger. The device ships with a power cord with
the appropriate plug for the outlet type in your country or region.
2-13
1. Plug the AC cord into the AC adapter.
2. Connect the DC output plug of the adapter into the OM-DAQXL power port.
Page 23

Hardware
2
3. Plug the AC cord into the AC power outlet.
4. Turn on the power switch on the OM-DAQXL.
2.11.3 Powering on the Data Logger.
After you have connected the battery and/or AC adapter you can now power
on the data logger by pushing the power switch to the on position. The data
logger will begin the boot process at which time a boot splash screen showing
the OMEGA logo and a progress bar will appear. After approximately 30
seconds the data logger login screen will be shown. At this point you can login
and begin configuring the data logger. The following chapter details all of the
configuration steps necessary to begin using the data logger.
2-14
Page 24
3
Standalone Operation
3 Standalone Operation
The OM-DAQXL’s touch screen user interface makes configuring the data logger
for operation straight forward and simple. The touch screen UI and associated
menu screens allows the user to configure all of the parameters for data
collection, while the home screen’s data display area provides a convenient and
versatile indication of the data being monitored. It also facilitates easy review
and analysis of previously recorded data without the need of a laptop or PC.
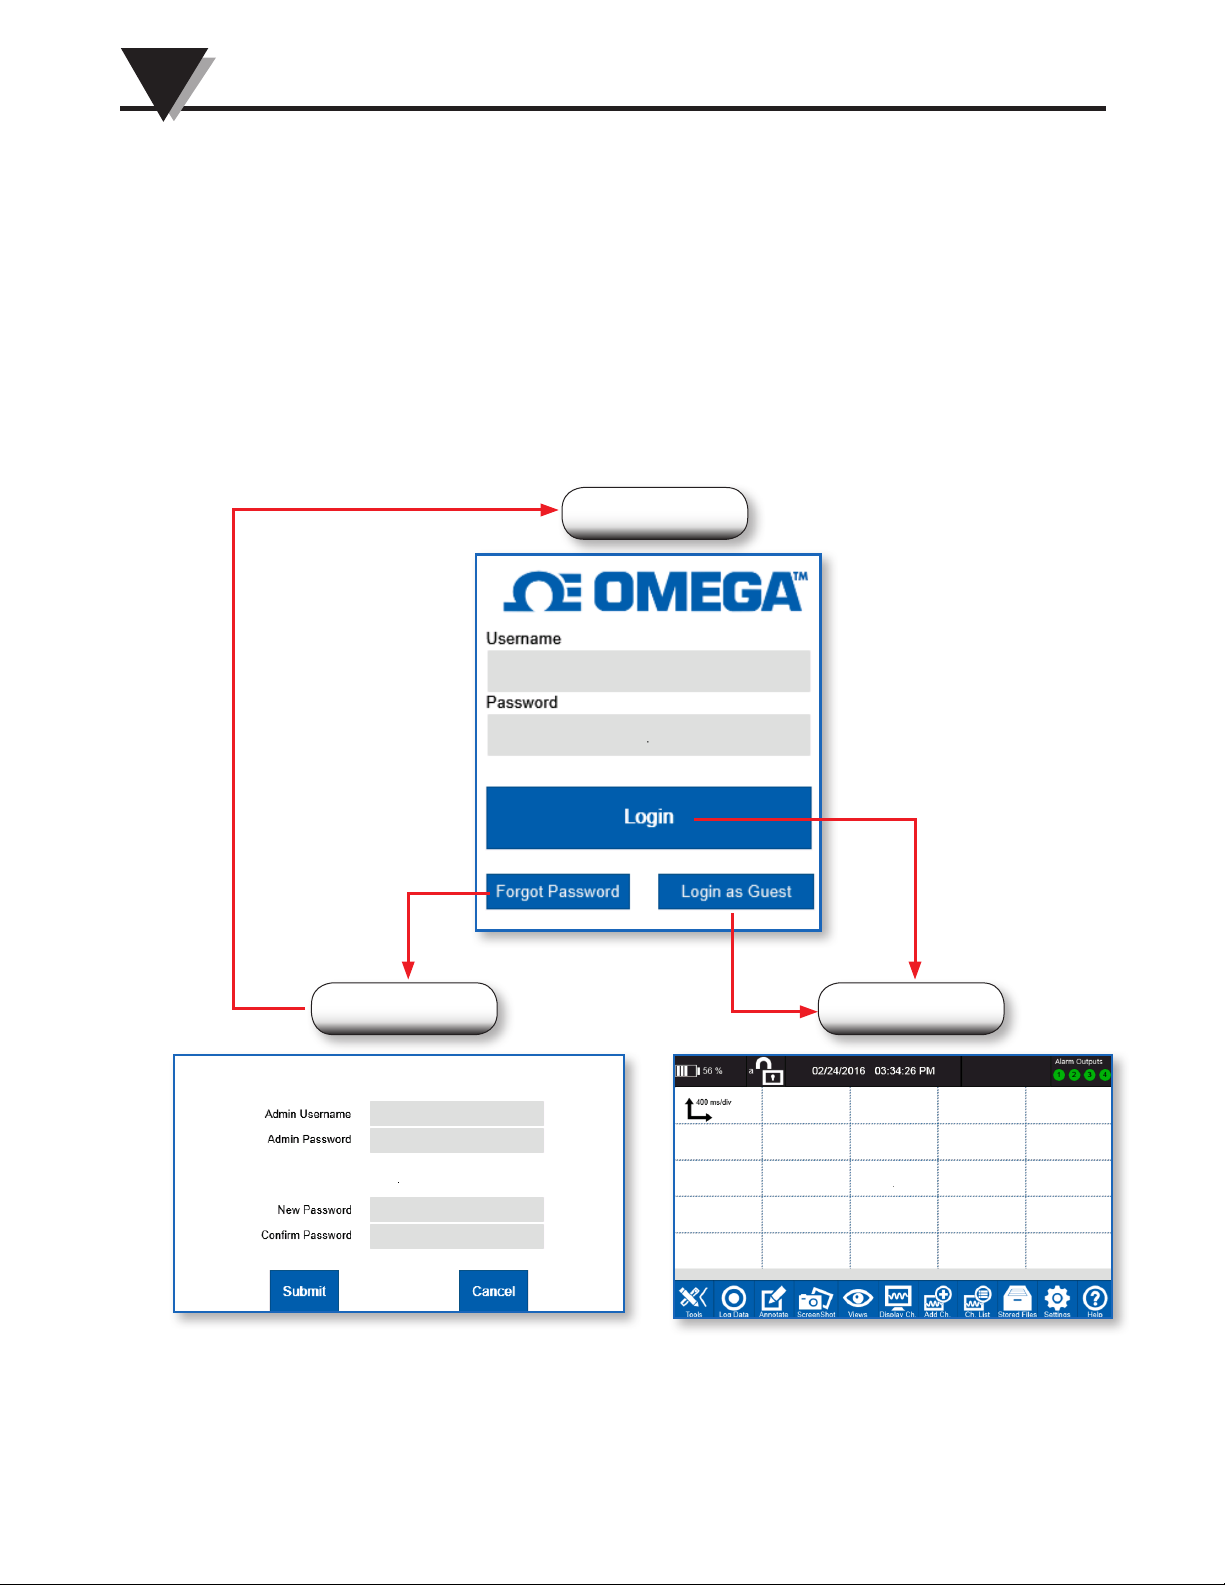
3.1 Login Window
When the OM-DAQXL first boots up, the user is greeted with the login window.
Here the user can either login with their username and password, login as a
guest or hit Forgot Password to go to the Reset Password window.
Login Window
Normal user login
Guest login
Home ScreenForgot Password
Figure 3-1 Login Window
NOTE: For initial login use the default account with user name and password:
omega, omega. This is an administrator account allowing additional users to be
created.
3-1
Page 25
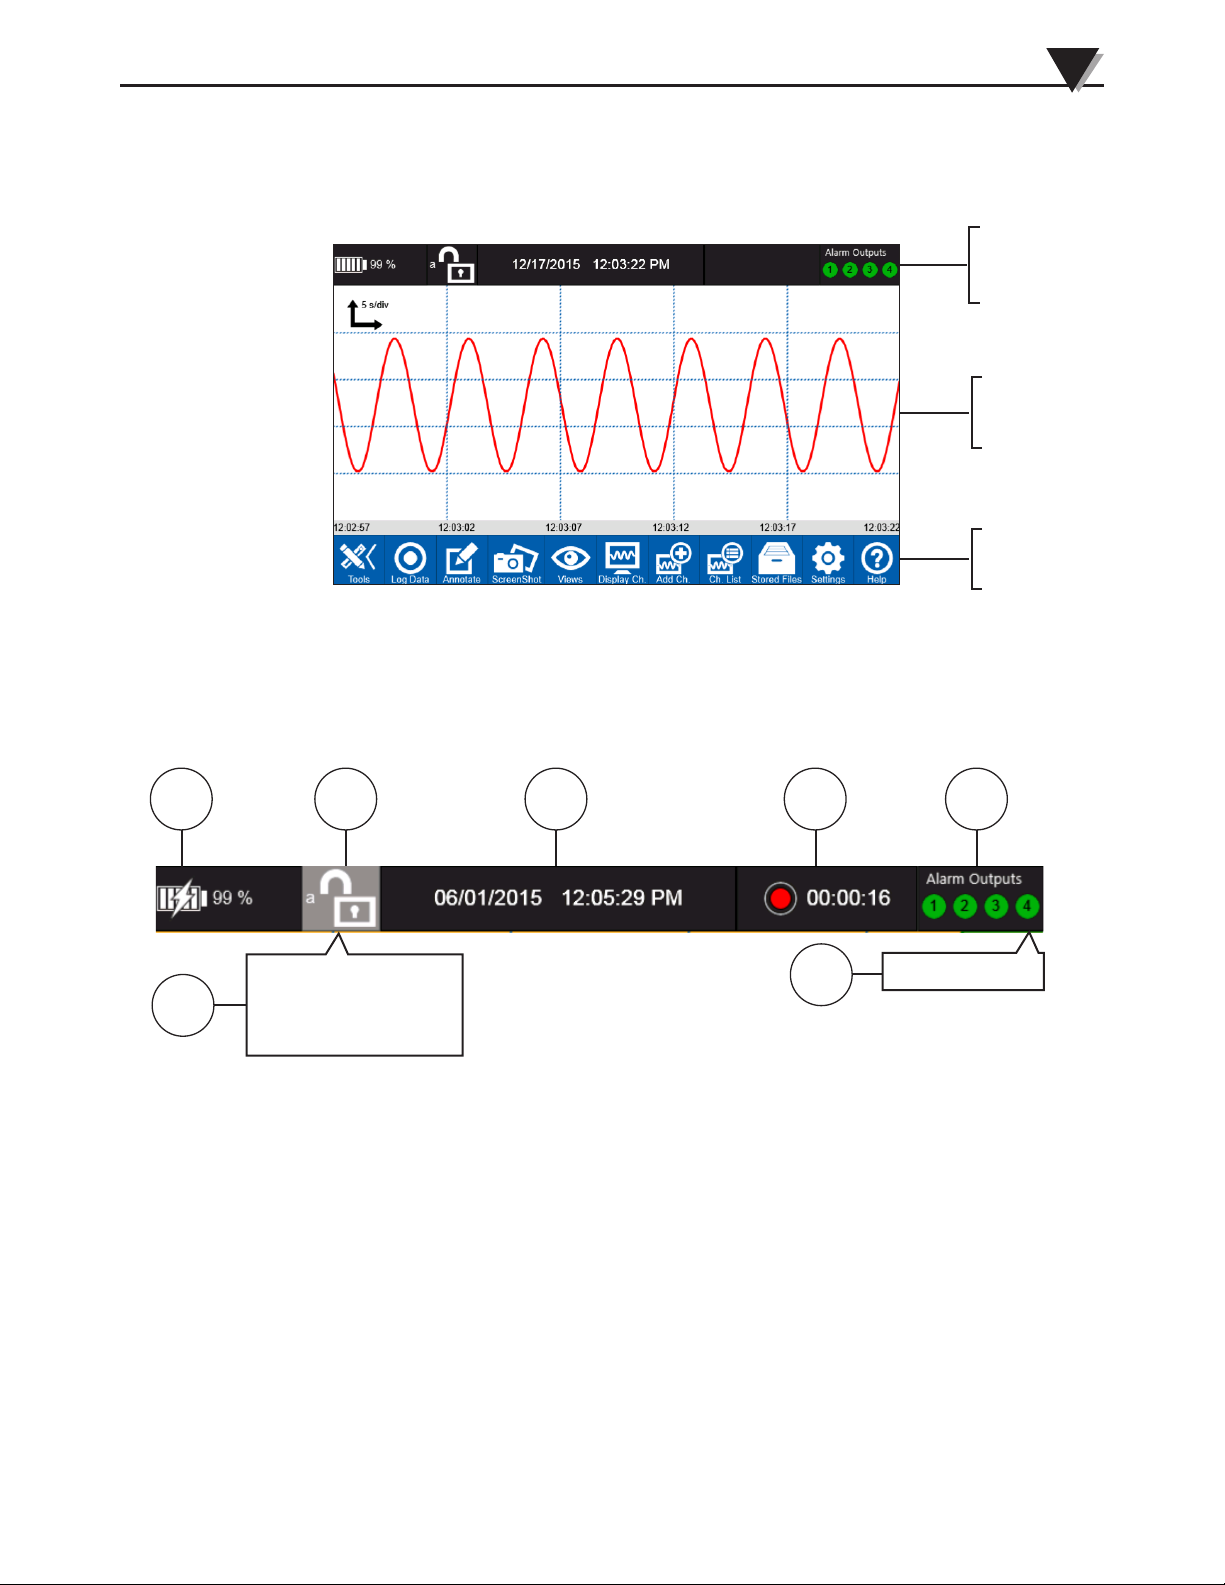
3.2 Home Screen
After logging in, the home screen is displayed. The home screen is the main
screen of the data logger user interface. It is divided into 3 distinct sections as
shown in figure 3-2.
Figure 3-2 Home Screen
Standalone Opteration
Status/
Information
display
Data
display
area
Navigation
toolbar
3
3.2.1 Status/Information Display
The small black strip at the top of the home screen is the status and information
display. It has indications for battery life, current user, data & time, operating
mode and alarm outputs.
54321
Lock Data Logger
6
Change Password
7
Logout
Figure 3-3 Status Display
1. Battery Status – A single tap on this icon will provide remaining run time
information.
2. Username/Login – A single tap on this icon will invoke a fly-out menu.
3. System Clock – Displays the current date and time.
Show Alarm
4. Data Logging Mode/Status – Shows the current logging mode: Free
running, armed or logging.
5. Alarm Status – Shows the current status of the alarm outputs. A single tap
on this icon will invoke the Show Alarm fly-out menu.
6. User Options Fly-Out Menu – This menu allows the current user to lock
the data logger, change their password or logout.
7. Show Alarm Fly-Out Menu – A single tap on this show alarm menu will
bring up the Alarm Settings menu.
3-2
Page 26
3
Standalone Operation
3.2.2 Data Display Area
The data display area shows the current values of the measure data for up to 4
channels simultaneously. There are four views available for this area: waveform,
waveform & table, table only and digital.
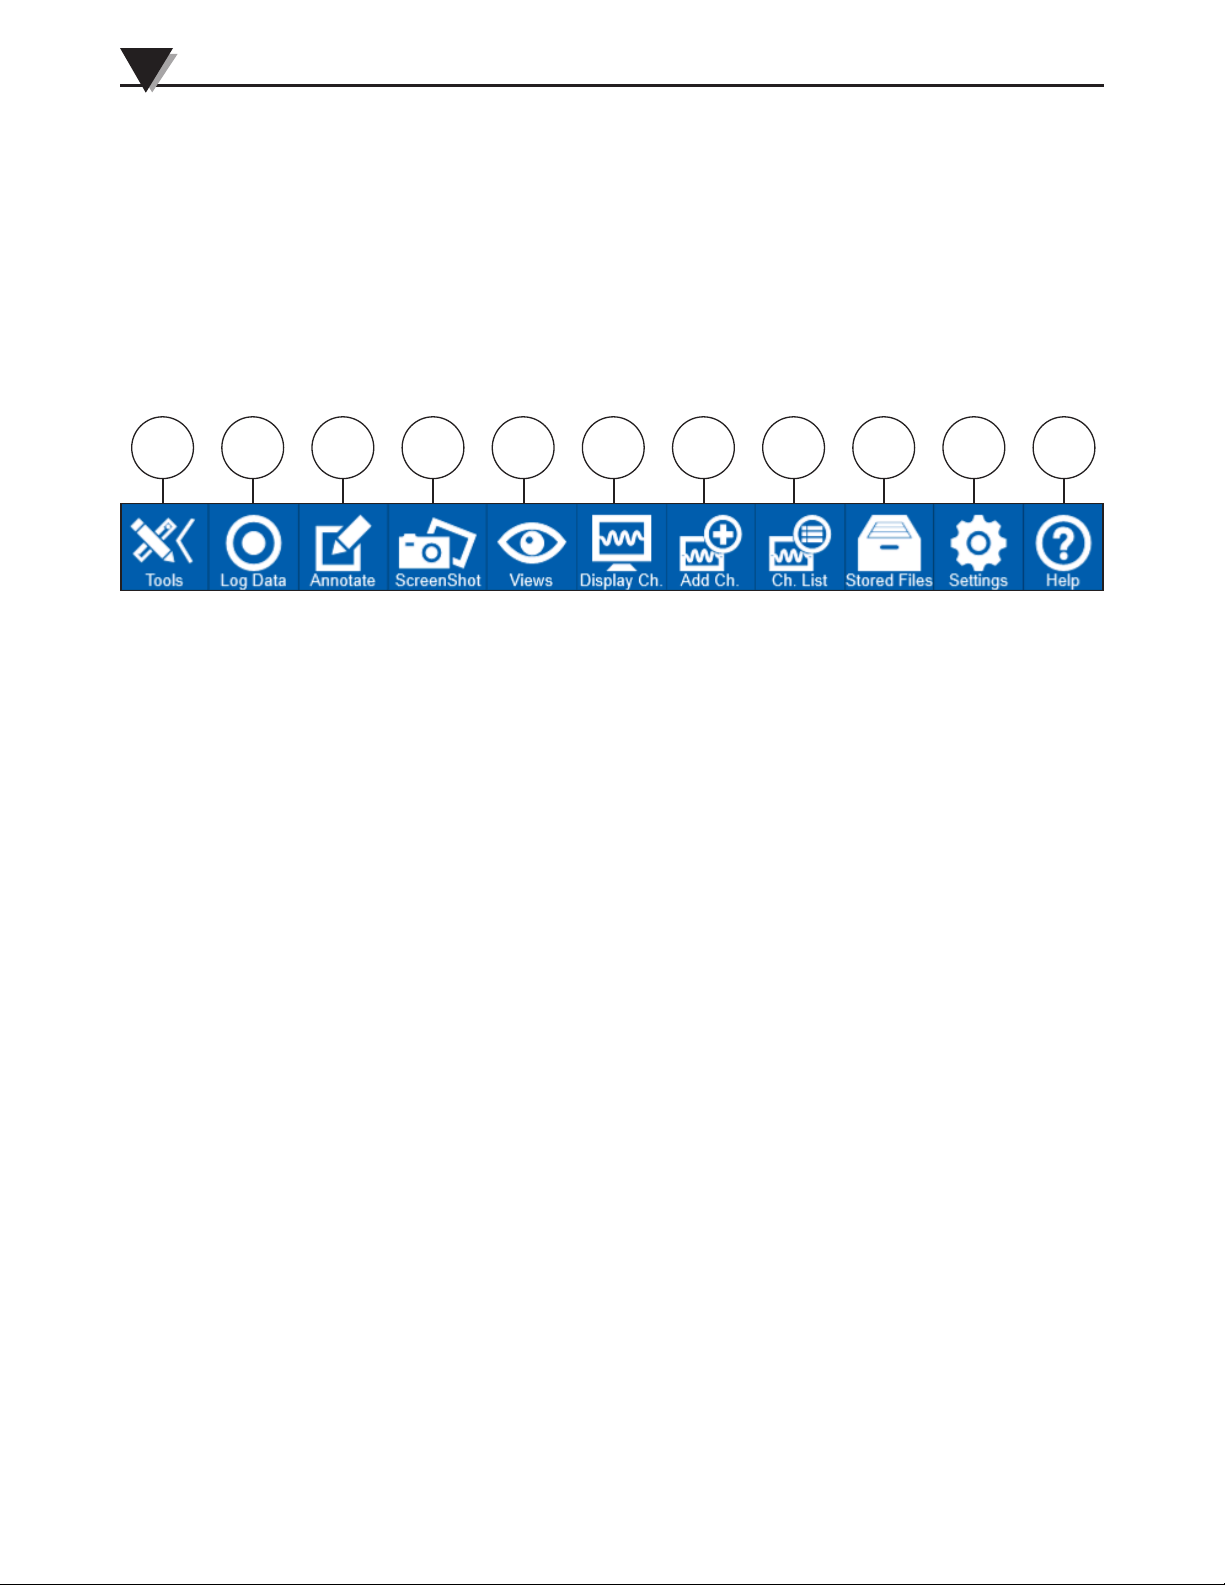
3.2.3 Home Toolbar
At the bottom of the home screen is the toolbar. The toolbar is where all the
major functions and menus of the data logger can be accessed. It consists of 11
buttons each with a distinctive icon and text to provide a quick visual indication
of the associated function. The buttons on the toolbar either perform an action or
navigate to additional screens where settings can be configured
321 654 7 8 9 10 11
Figure 3-4 Home Toolbar
1. Tools Button - Extends or retracts the toolbar with each tap. When the
toolbar is retracted there is additional channel information displayed in the
toolbar area.
2. Log Data - The log data button is used to change the logging state of the
data logger. Depending upon the current state this button will appear white
(free running), red (logging) or orange (armed).
3. Annotate – The annotate button freezes the current display and allows
the user the ability to make annotations on the display using the stylus. A
screenshot will then be saved showing the annotation.
4. Screen Shot – Takes a screenshot of the current display and saves it to the
memory location specified in the data session settings.
5. Views – Invokes a fly-out menu list with selections for the 4 different view
modes as well as a selection for toggling the slide show feature.
6. Display Channels – Invokes a fly-out menu list with selections for the four
channel groups as well as selection to bring the user to the channel group
channel selection screen.
7. Add Channel – Opens the add channel screen with the next available
channel selected for configuration.
8. Channel List - Opens the channel list screen which lists all the currently
configured channels.
3-3
9. Stored Files – Opens the stored files screen to perform various operations
on files in stored in memory.
10. Settings – Invokes a fly-out menu list with selections for trigger, alarm,
and data session and device settings. Each selection opens a screen where
settings related to that function can be set and saved.
11. Help – Opens a context sensitive help screen which will display content
appropriate to the current screen. This button is present in all of the various UI
screens.
Page 27
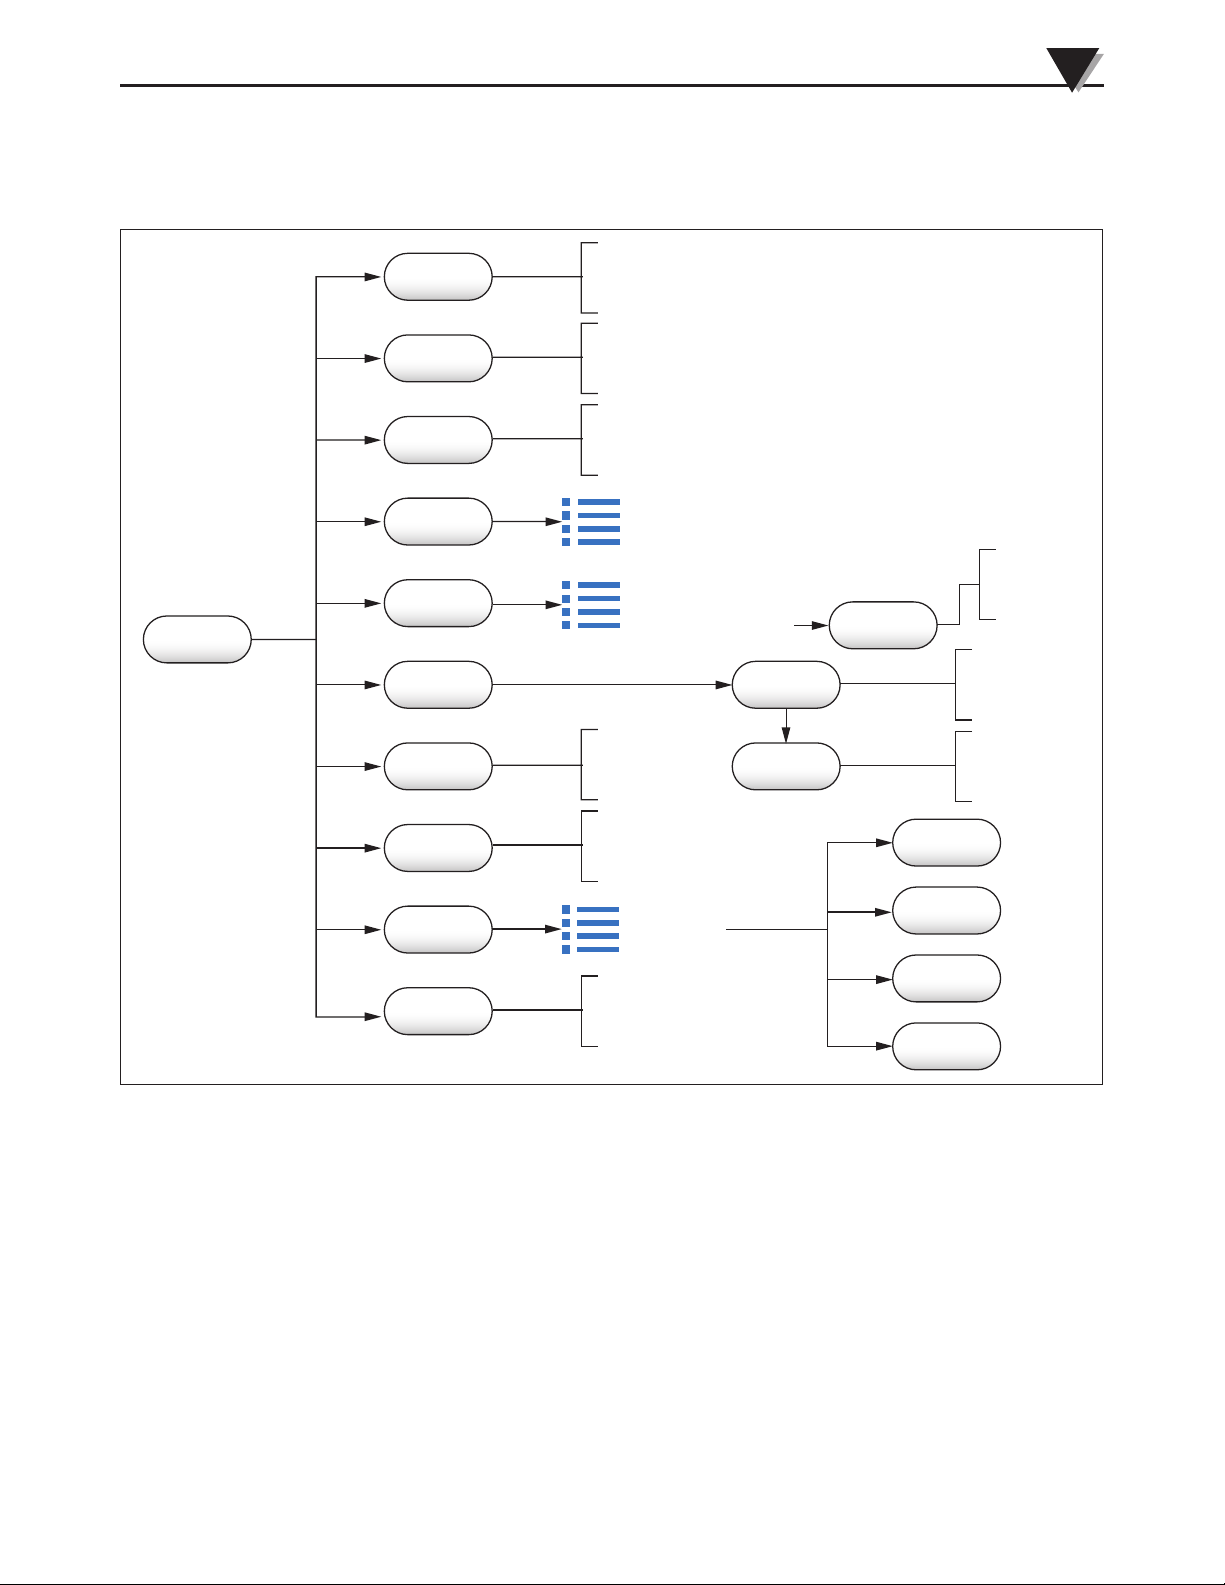
3.2.4 User Interface Flowchart
Standalone Operation
3
Toolbar
Log Data
Annotate
Screenshot
Views
Display
Channel
Add
Channel
Channel
List
Stored
Files
Depending on current
state, starts logging or
arms data logger.
Pauses display and allows
annotation on the display
using the stylus.
Immediately
takes a
screenshot.
Select data view
or
Toggle slide show
Select channel group
or
Assign channels to groups
Shows a tabular list
of all currently
configured channels
Allows access to all
stored data files for
reviewing or copying.
Input
Type
Data
Ranges
Channel
Groups
Allows
assignment of
channels to
4 groups.
Configure a new
channels input
type setting.
Configure a new
channels data
range settings.
Trigger
Settings
Settings
Help
Select the type
of settings you
wish to change.
Provides access to
context appropriate
help screens
Figure 3-5 Menu Flowchart
Alarm
Settings
Data Session
Settings
Device
Settings
3-4
Page 28
3
Standalone Operation
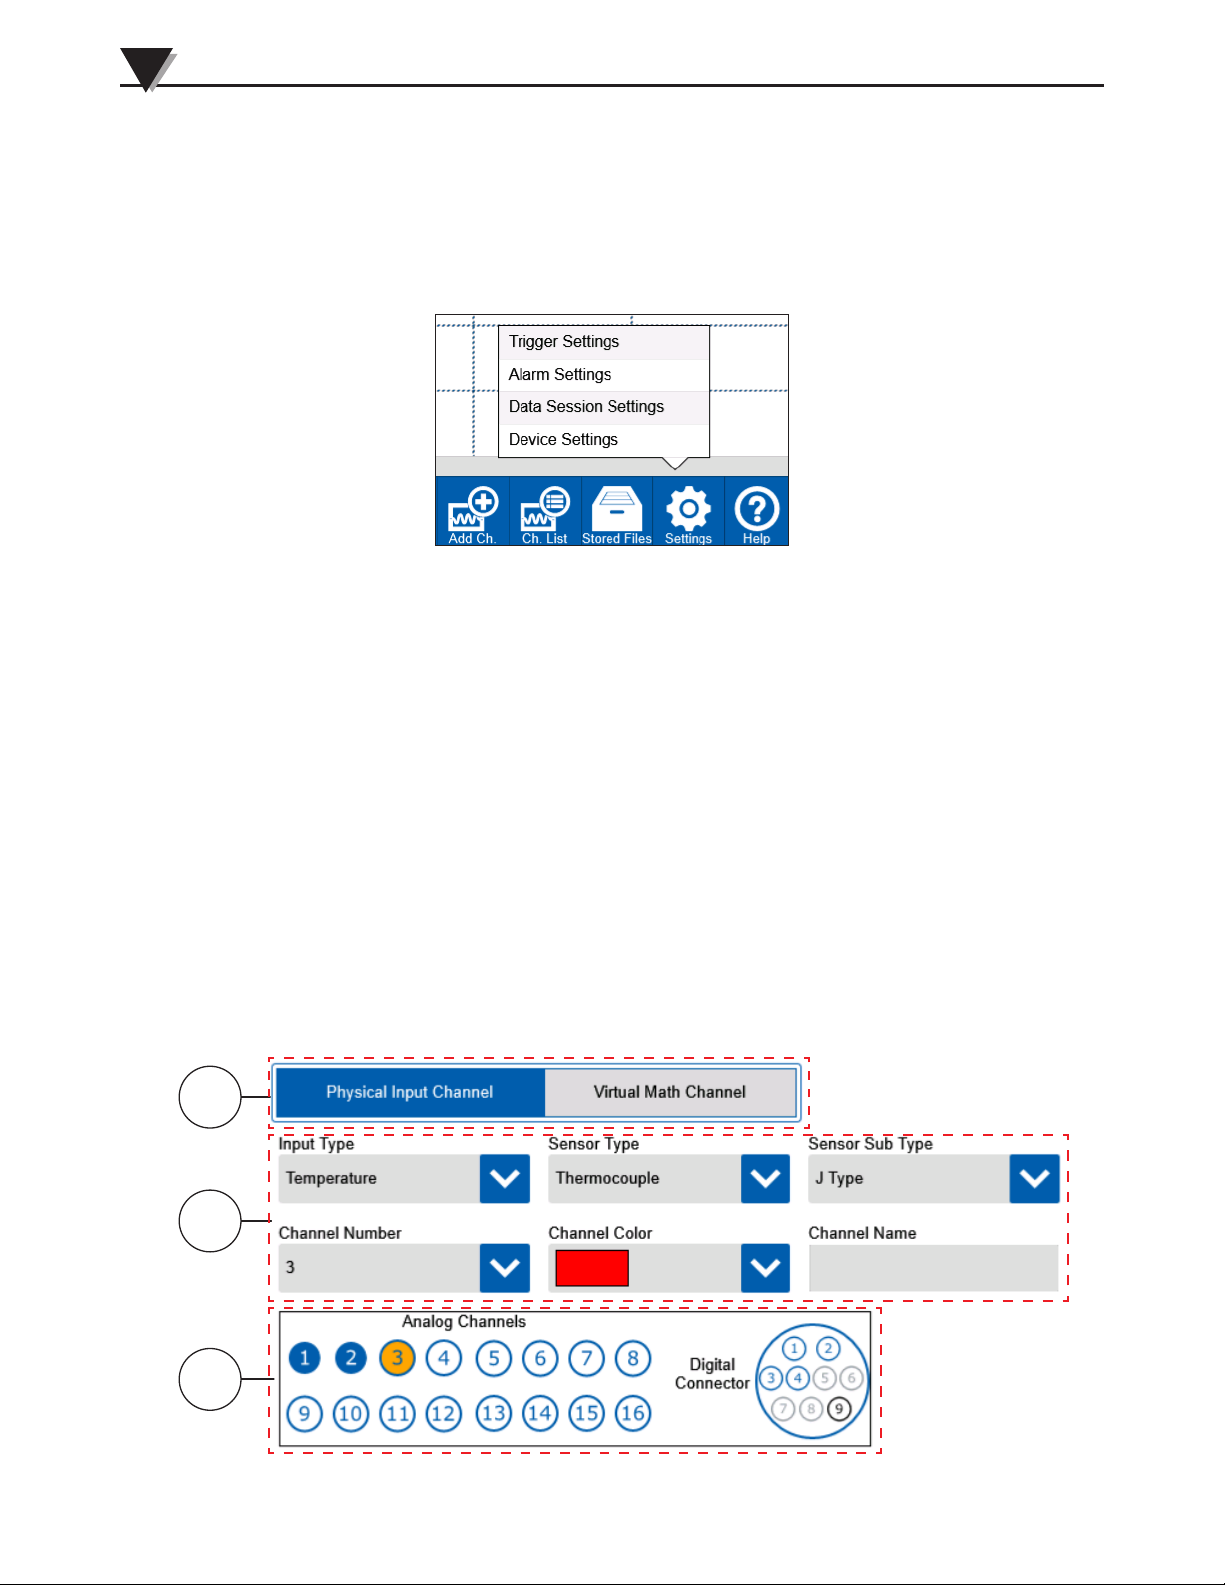
3.3 Settings Screens
Most of the data logger settings are accessible through the settings button on the
toolbar. Hitting the settings button invokes a small fly-out menu for selecting
the specific settings screen to navigate to. Additional settings related to specific
toolbar buttons functions are found in the associated screens or menus.
3.3.1 Add Channels
Figure 3-6 Settings Fly-Out Menu
Channel settings can be configured for new channels using the Input Type and
Data Ranges screens. To add a new input channel and configure its settings, hit
the Add Channel button on the toolbar to navigate to the Input Type screen.
There are two types of channels which can be configured, physical input
channels and virtual math channels. Depending on the type of channel being
configured, the Input Type screen will have different settings available. The
toolbar appears as shown below when adding channels.
Input Setup – Physical Input Channel
The Input Type screen is used to configure the basic settings for an input
channel. For physical input channels the input type selected will determine the
settings available.
Temperature Inputs
For temperature input types the Input Type screen will appear as shown below.
1
2
3-5
3
Figure 3-7 Input Type - Temperature
Page 29
Standalone Operation
1. Channel Type Button
The channel type selects between physical and math channel input types.
Temperature inputs are physical input channels.
2. Input Type Settings
For temperature inputs there are multiple sensor types available. These include
thermocouple, RTD and thermistor. Each of these sensor types have additional
sensor sub types available. The sub type drop-down list will populate with the
appropriate subtypes for each sensor type. A channel number, color and name
must be assigned for each channel.
3. Channel Map
The channel map provides a quick view of which channels have already
been configured (blue) and the currently selected channel (orange). Some
temperature input types require the use of two input channels.
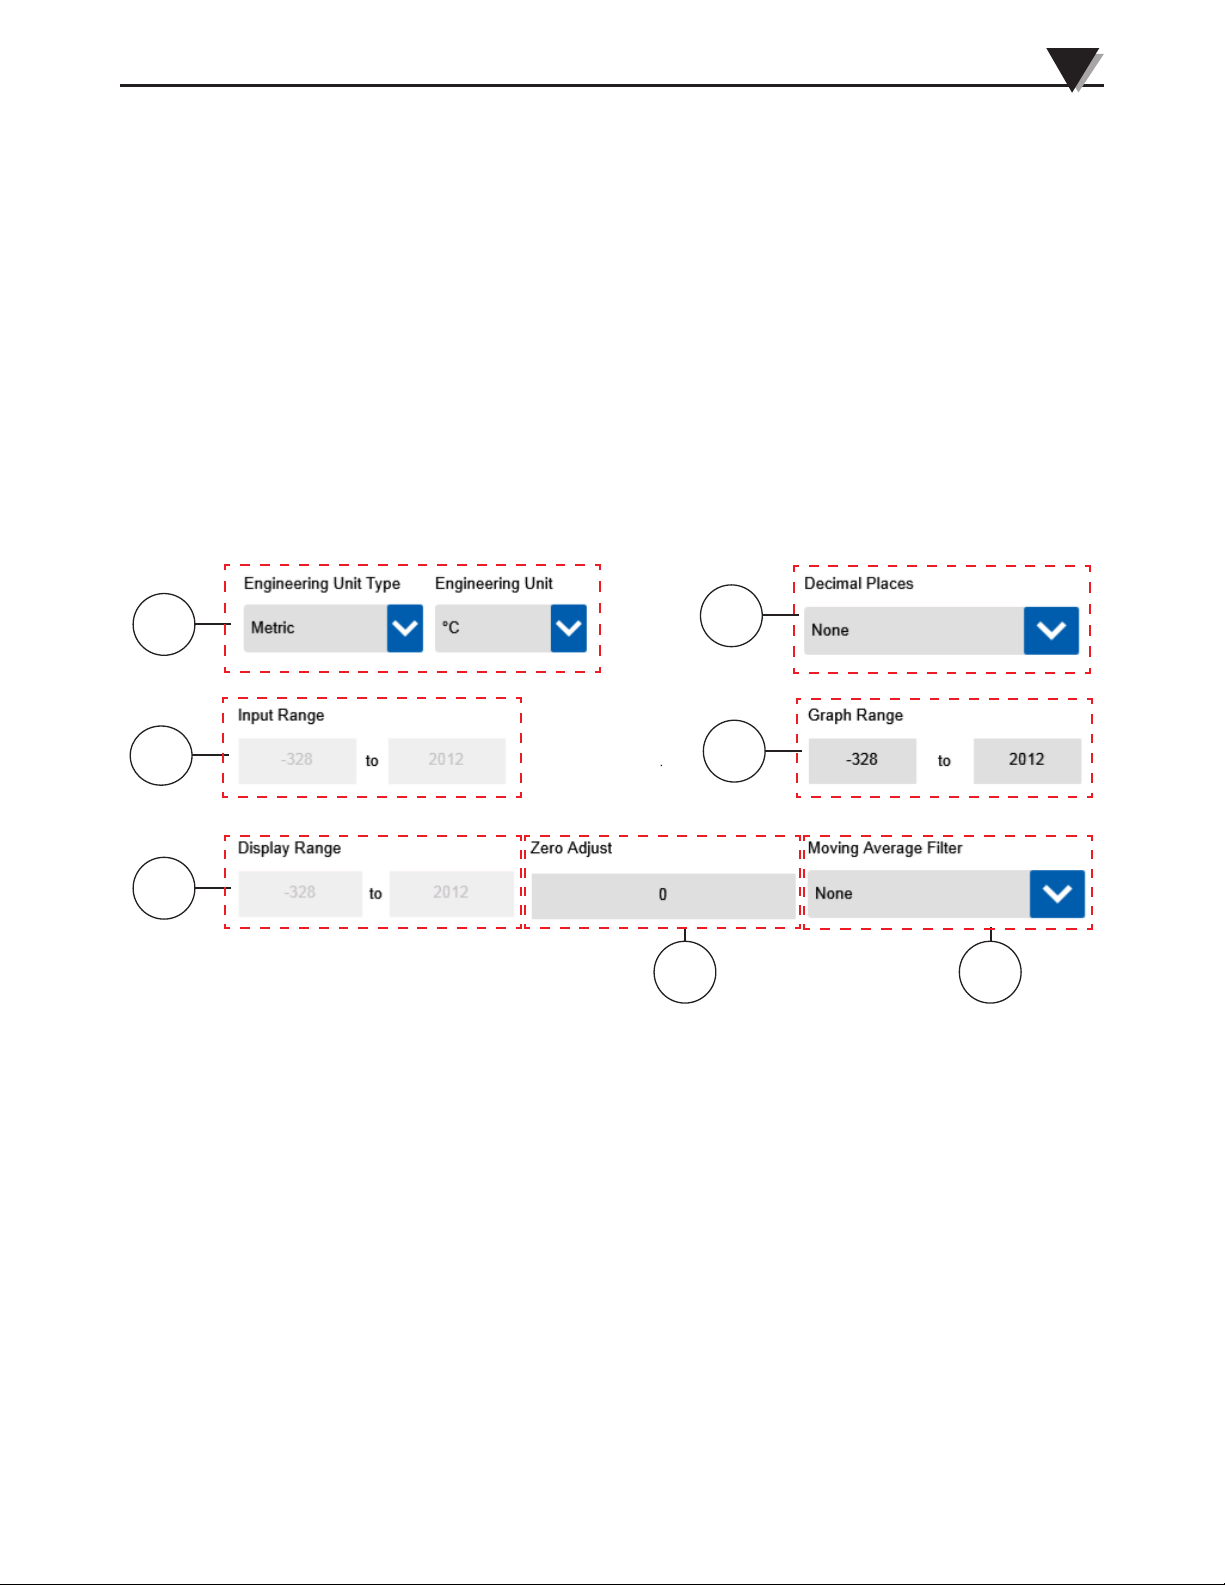
The Data Ranges screen appears the same for all temperature input types.
Depending on the sensor type selected the fixed values shown for the input and
display range will vary.
3
1
2
7
6
3
54
Figure 3-8 Data Ranges - Temperature
1. Engineering Units
The two drop downs allow selection of various engineering units for
display.
2. Input Range
The input range boxes show the full measureable input of the data logger
for the sensor type being configured. These are not editable.
3. Display Range
The display range boxes show the full display range available on the data
logger. The graph range can be any subset of this range. This range is fixed
for all temperature inputs.
4. Zero Adjust
The zero adjust provides a user configurable offset adjustment, in
engineering units, which will be applied to measurements across the full
range of input.
3-6
Page 30
3
Standalone Operation
1
5. Moving Average Filter
This setting provides the option to average an individual channels input
samples.
6. Graph Range
The graph range is the y-axis range that will be shown on the waveform
view of the data logger. This can be any subset of the display range and
is defined in the assigned engineering units. It can also be adjusted on the
waveform view.
7. Decimal Places
Selects the number of decimal place to display.
Strain Gage Inputs
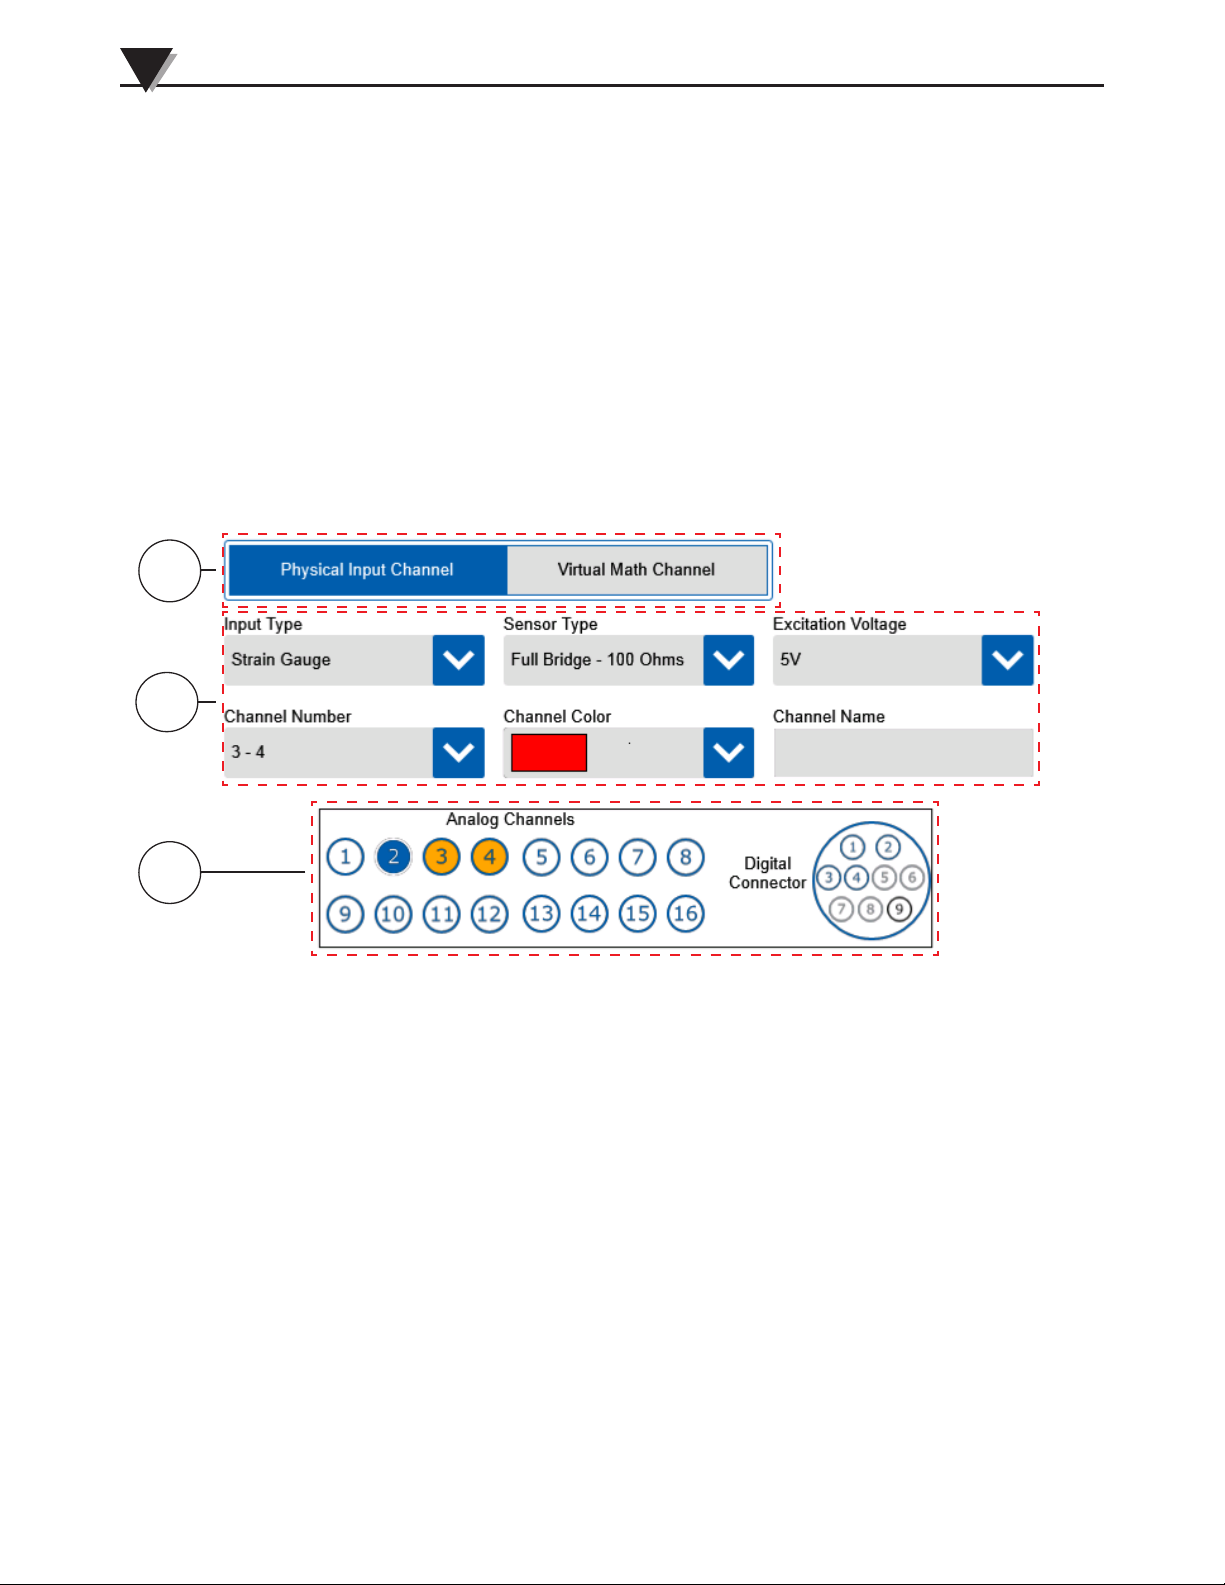
For stain gage inputs the Input Type screen will appear as shown below.
2
3
Figure 3-9 Input Type - Strain Gage
1. Channel Type Button
The channel type selects between physical and math channel input types.
Strain gage inputs are physical input channels.
2. Input Type Settings
For strain gage inputs there are two sensor types available. These are full
bridge 100Ω or full bridge 350Ω. In addition to the sensor type, an excitation
voltage must be selected. You can select between 5V and 10V excitation.
Two channels are required per strain gauge and excitation is provided on
channel 1 or channel 3. A channel number, color and name must be assigned
for each channel.
3-7
3. Channel Map
The channel map provides a quick view of which channels have already
been configured (blue) and the currently selected channel (orange).
Page 31
Standalone Operation
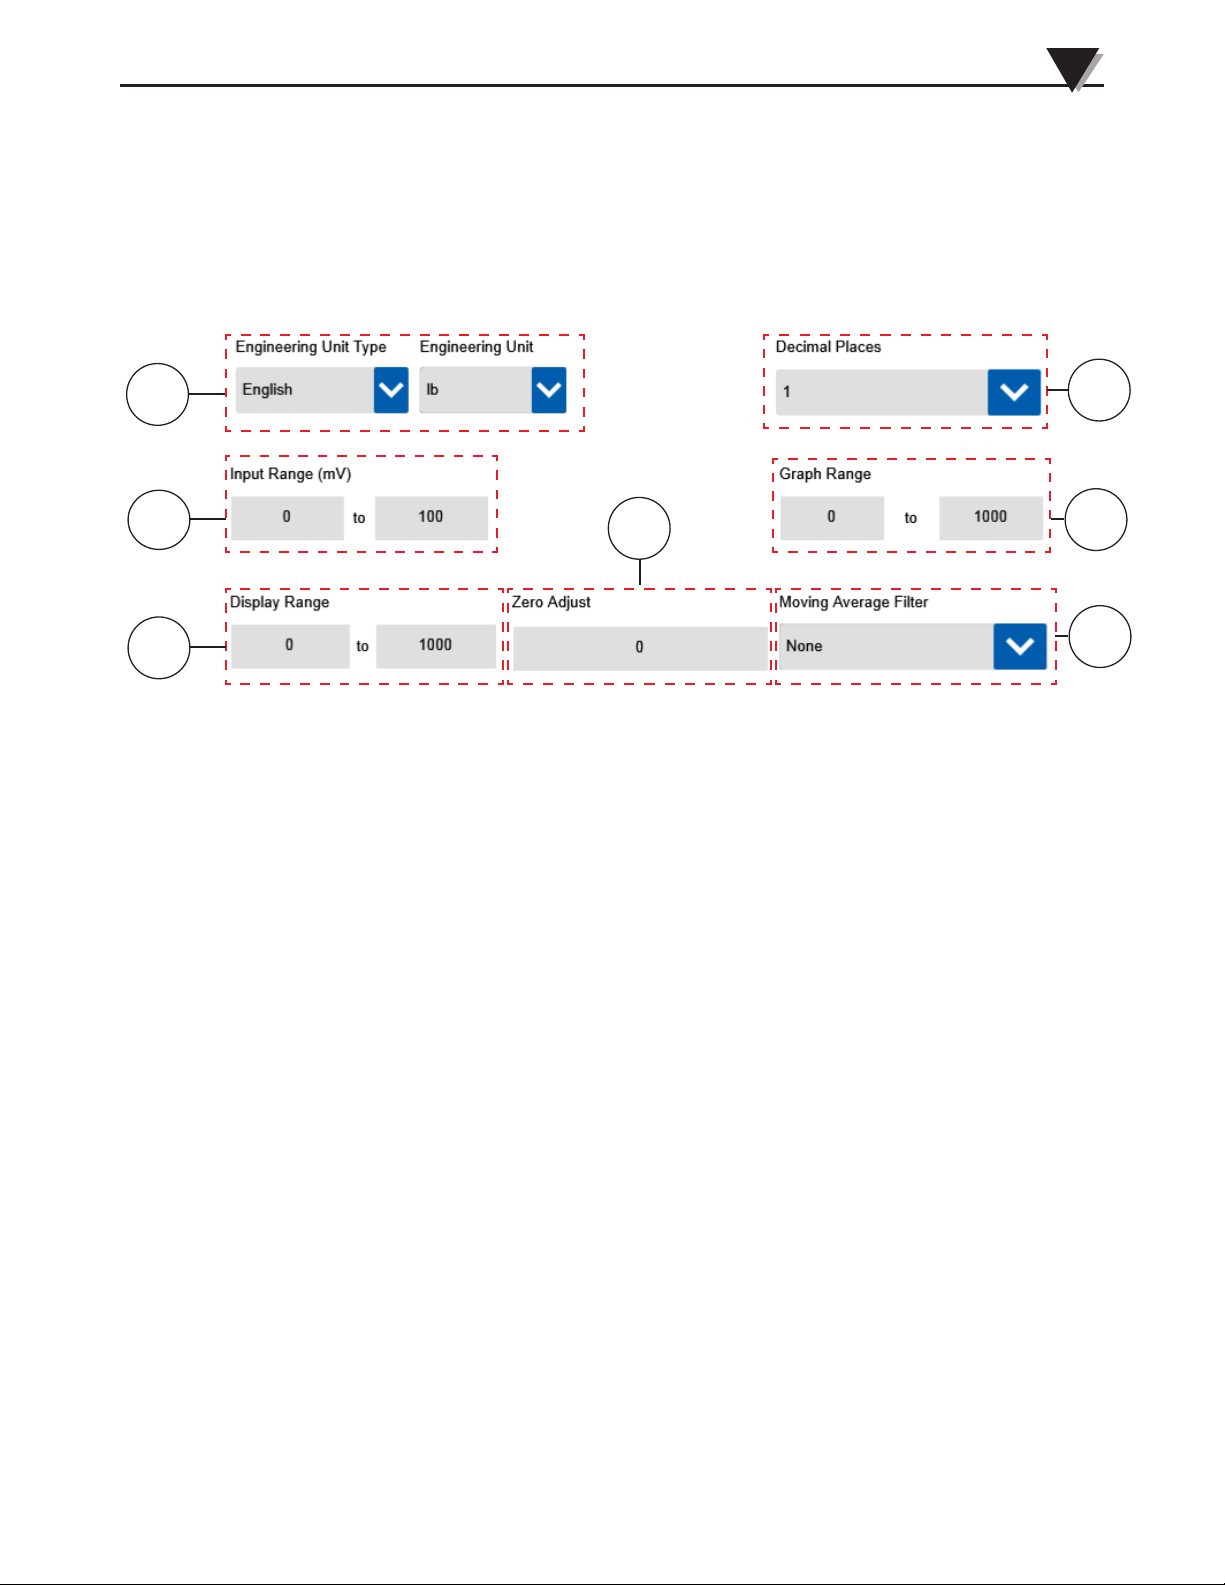
For strain gage inputs the data ranges screen has user editable input and display
ranges. The input range values should correspond to the millivolt output of
the transducer at 0% and 100% of the transducers range. The display range
values should be set to the corresponding 0% and 100% values of the selected
engineering units. The graph range can be a subset of the display range.
3
1
2
4
3
Figure 3-10 Data Ranges - Strain Gage
1. Engineering Units
The two drop downs allow selection of various engineering units for
display.
2. Input Range
The input range boxes show the full measureable input of the data logger
for the sensor type being configured. For the case of strain gage, it is the full
scale output of the bridge which is equal to bridge sensitivity (mV/V)
multiplied by the excitation voltage across the bridge.
7
6
5
3. Display Range
The display range boxes show the full display range available on the data
logger. This should correspond the full scale output the sensor in terms of
engineering units. The graph range can be any subset of this range.
4. Zero Adjust
The zero adjust provides a user configurable offset adjustment, in
engineering units, which will be applied to measurements across the full
range of input.
5. Moving Average Filter
This setting provides the option to average an individual channels input
samples.
6. Graph Range
The graph range is the y-axis range that will be shown on the waveform
view of the data logger. This can be any subset of the display range and
is defined in the assigned engineering units. It can also be adjusted on the
waveform view.
7. Decimal Places
Selects the number of decimal place to display.
3-8
Page 32
3
Standalone Operation
1
2
3
Voltage Inputs
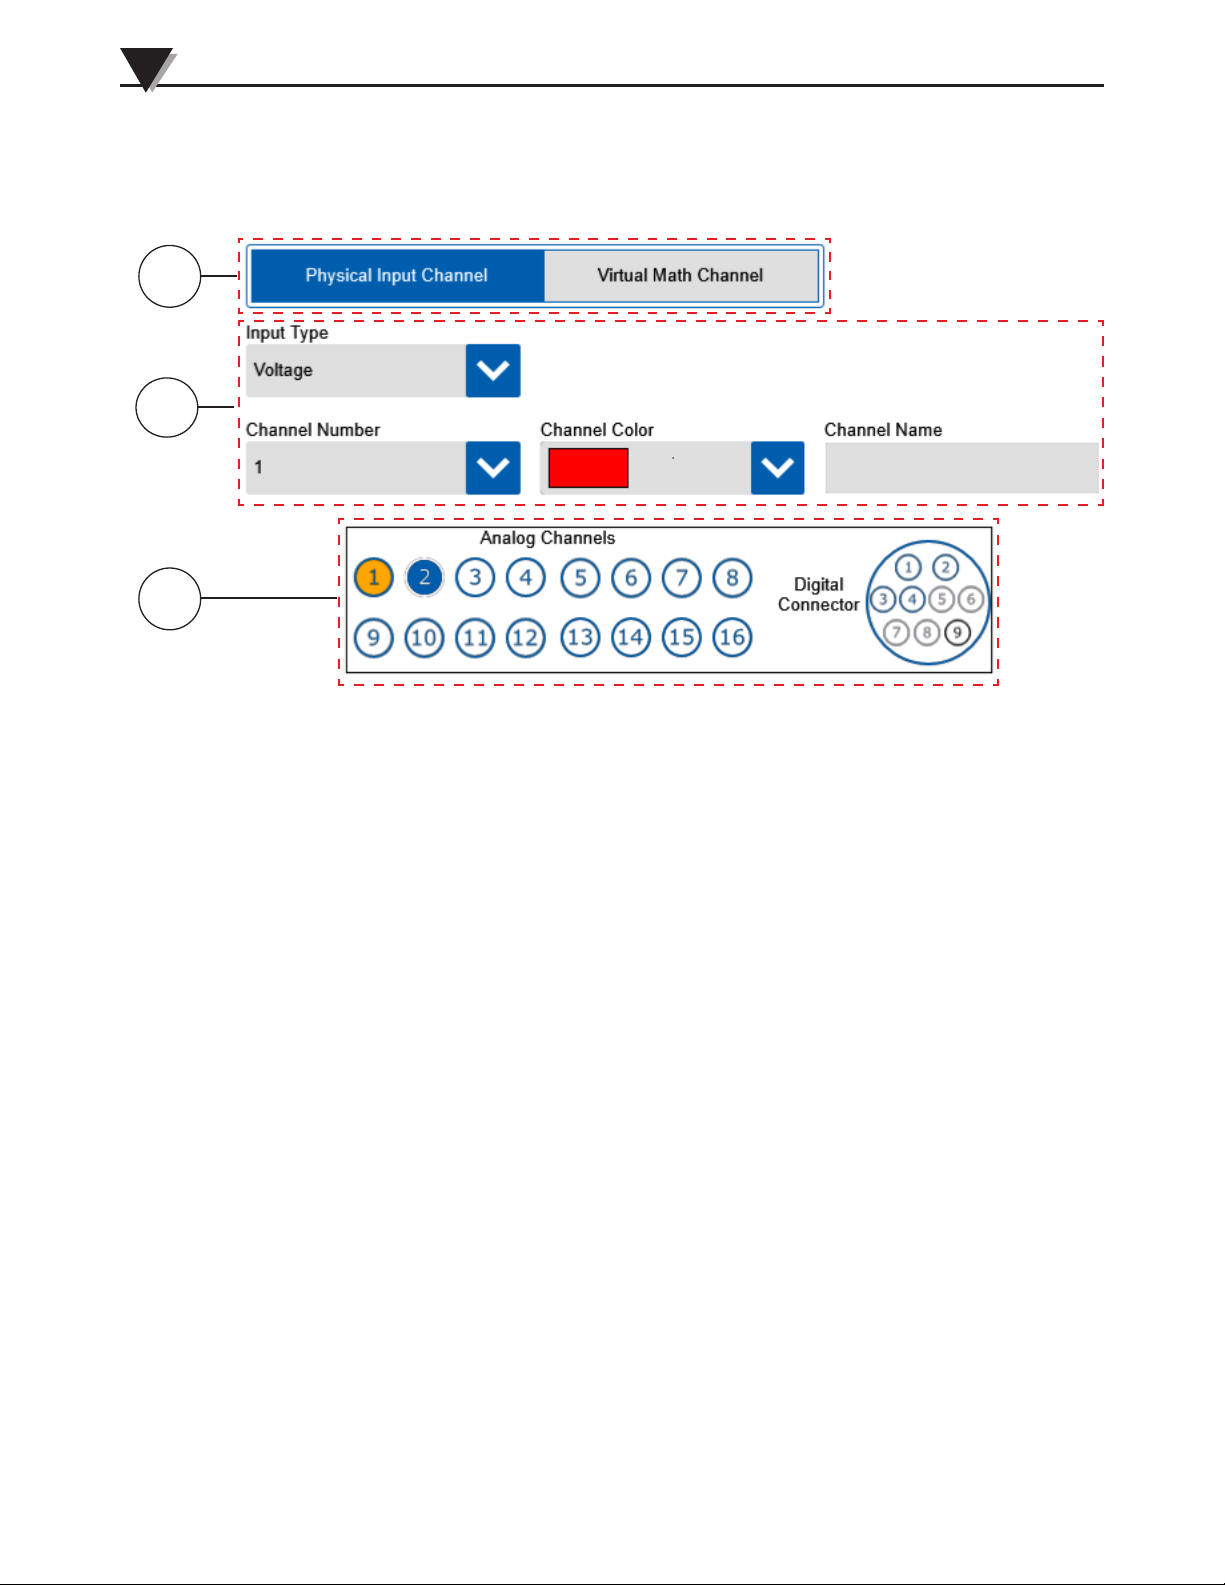
For voltage inputs the Input Type screen appears as shown below.
Figure 3-11 Input Type - Voltage
1. Channel Type Button
The channel type selects between physical and math channel input types.
Voltage inputs are physical input channels.
2. Input Type Settings
For voltage inputs there no sensor types or sub types available. Only 1
channel is required per voltage input. A channel number, color and name
must be assigned for each channel.
3. Channel Map
The channel map provides a quick view of which channels have already
been configured (blue) and the currently selected channel (orange).
3-9
Page 33
Standalone Operation
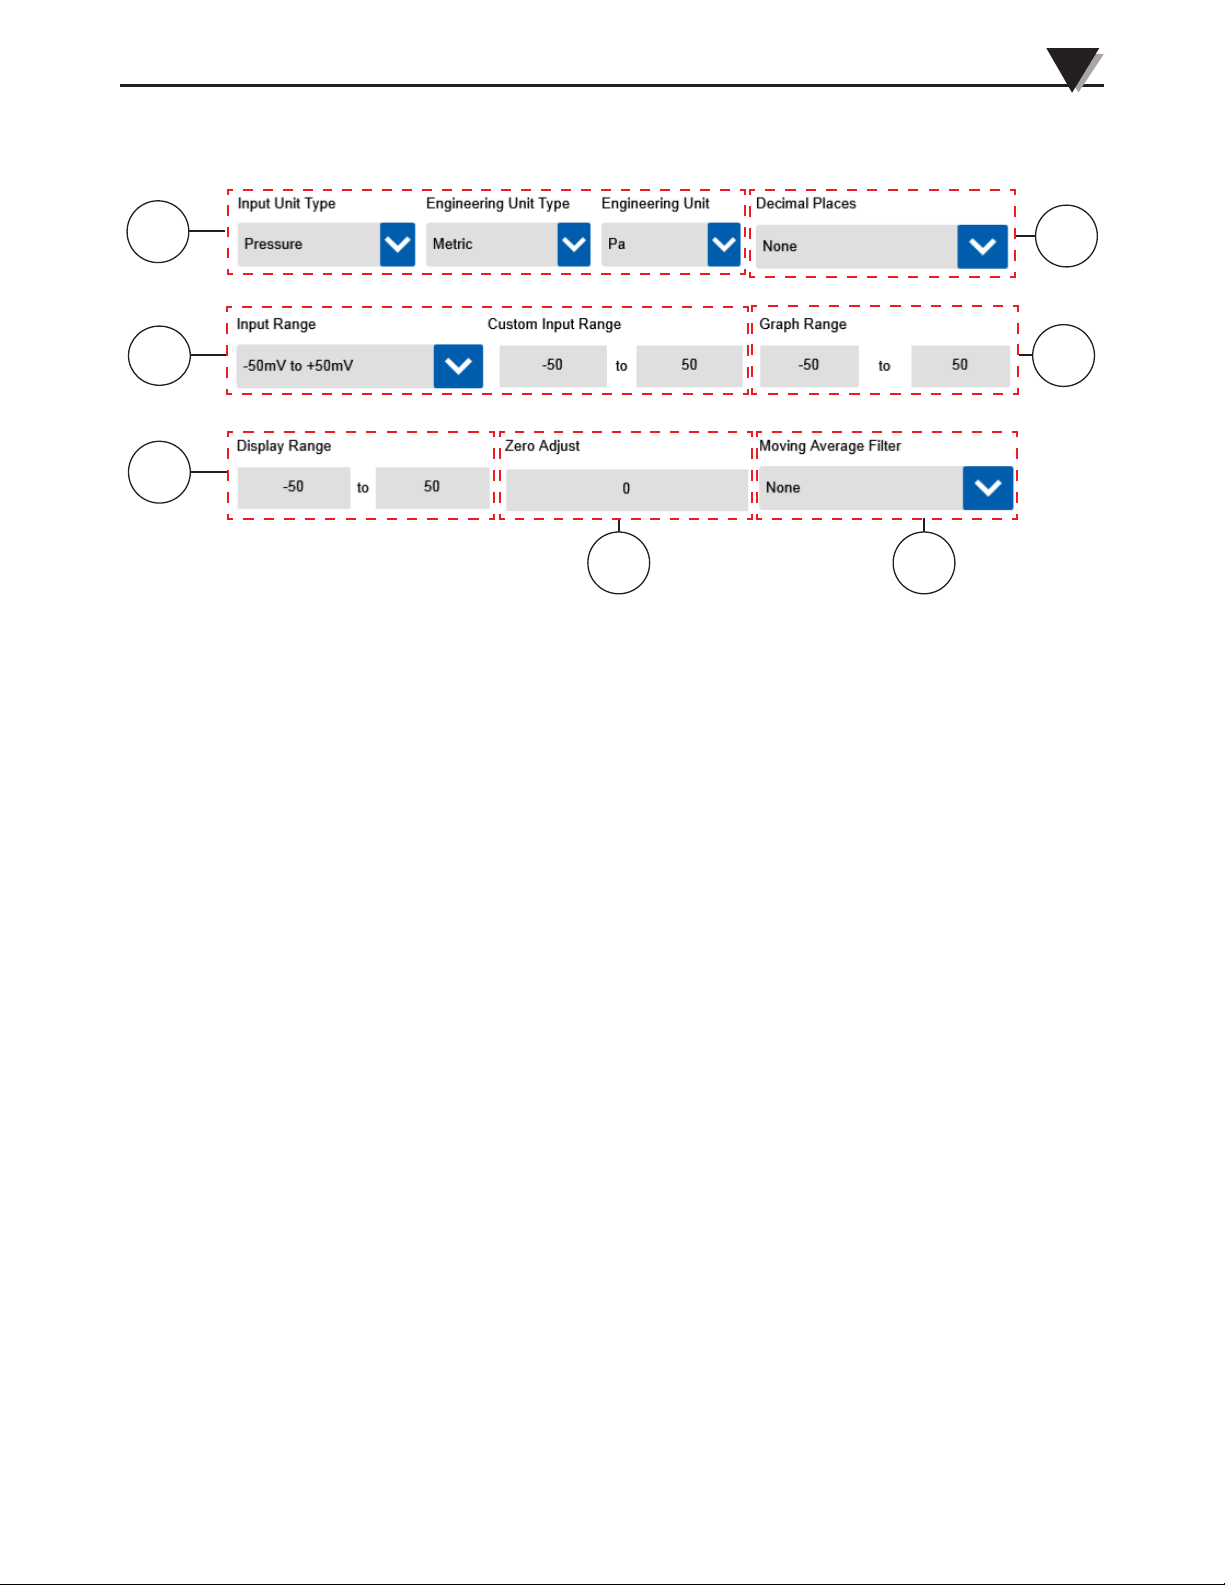
The Data Ranges screen for voltage inputs has several user editable fields which
are used for linear scaling of a voltage input to the desired engineering units for
display.
3
1
2
7
6
3
4
Figure 3-12 Data Ranges - Voltage
1. Engineering Units
The three drop downs allow selection of various engineering units for
display depending on the type parameter being measured.
2. Input Range
The input range drop down shows the full measureable input of the data
logger. For voltage inputs there are seven ranges available. In addition
a custom input range can be assigned as a subset of any of the standard
ranges. This allows easier scaling of transducer output that is a subset of the
standard ranges to the display range.
3. Display Range
The display range boxes show the full range in engineering units for the
voltage input being configured. The graph range can be any subset of this
range.
4. Zero Adjust
The zero adjust provides a user configurable offset adjustment, in
engineering units, which will be applied to measurements across the full
range of input.
5. Moving Average Filter
This setting provides the option to average an individual channels input
samples.
6. Graph Range
The graph range is the y-axis range that will be shown on the waveform
view of the data logger. This can be any subset of the display range and
is defined in the assigned engineering units. It can also be adjusted on the
waveform view.
7. Decimal Places
Selects the number of decimal place to display.
Example: In this channel configuration, 0 to 5V input corresponds to 0 to 100 PSI.
Engineering Unit = PSI
Input Range = -5V to +5V
Custom Input Range = 0 to +5V
Display Range = 0 to 100
Graph Range = 3 to 15
5
3-10
Page 34
3
Standalone Operation
1
2
Current Inputs
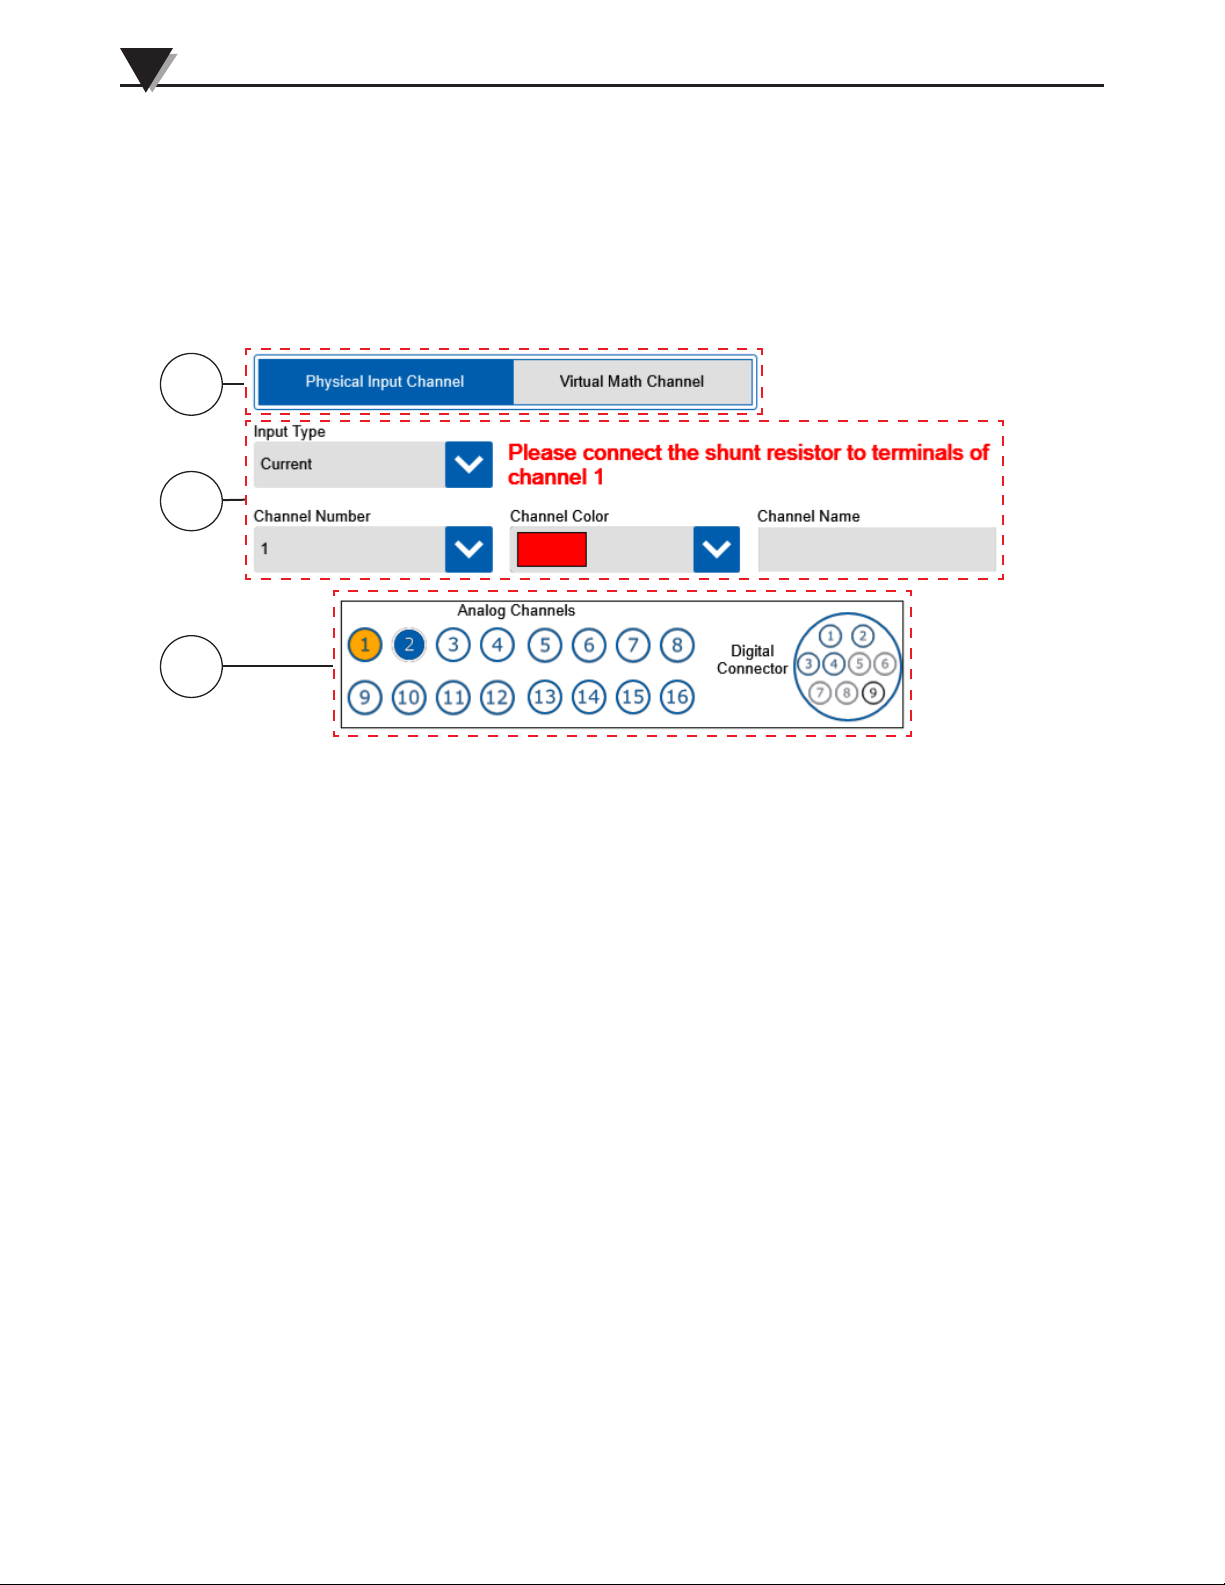
For current inputs the Input Type screen appears as shown below. A 50 Ω shunt
resistor is required across the input terminals for current inputs.
3
Figure 3-13 Input Type – Current
1. Channel Type Button
The channel type selects between physical and math channel input types.
Current inputs are physical input channels.
2. Input Type Settings
For current inputs there no sensor types or sub types available. Only 1
channel is required per current input, but a 50 Ω shunt resistor must be
installed across the input terminal. A channel number, color and name must
be assigned for each channel.
3. Channel Map
The channel map provides a quick view of which channels have already
been configured (blue) and the currently selected channel (orange).
3-11
Page 35
Standalone Operation
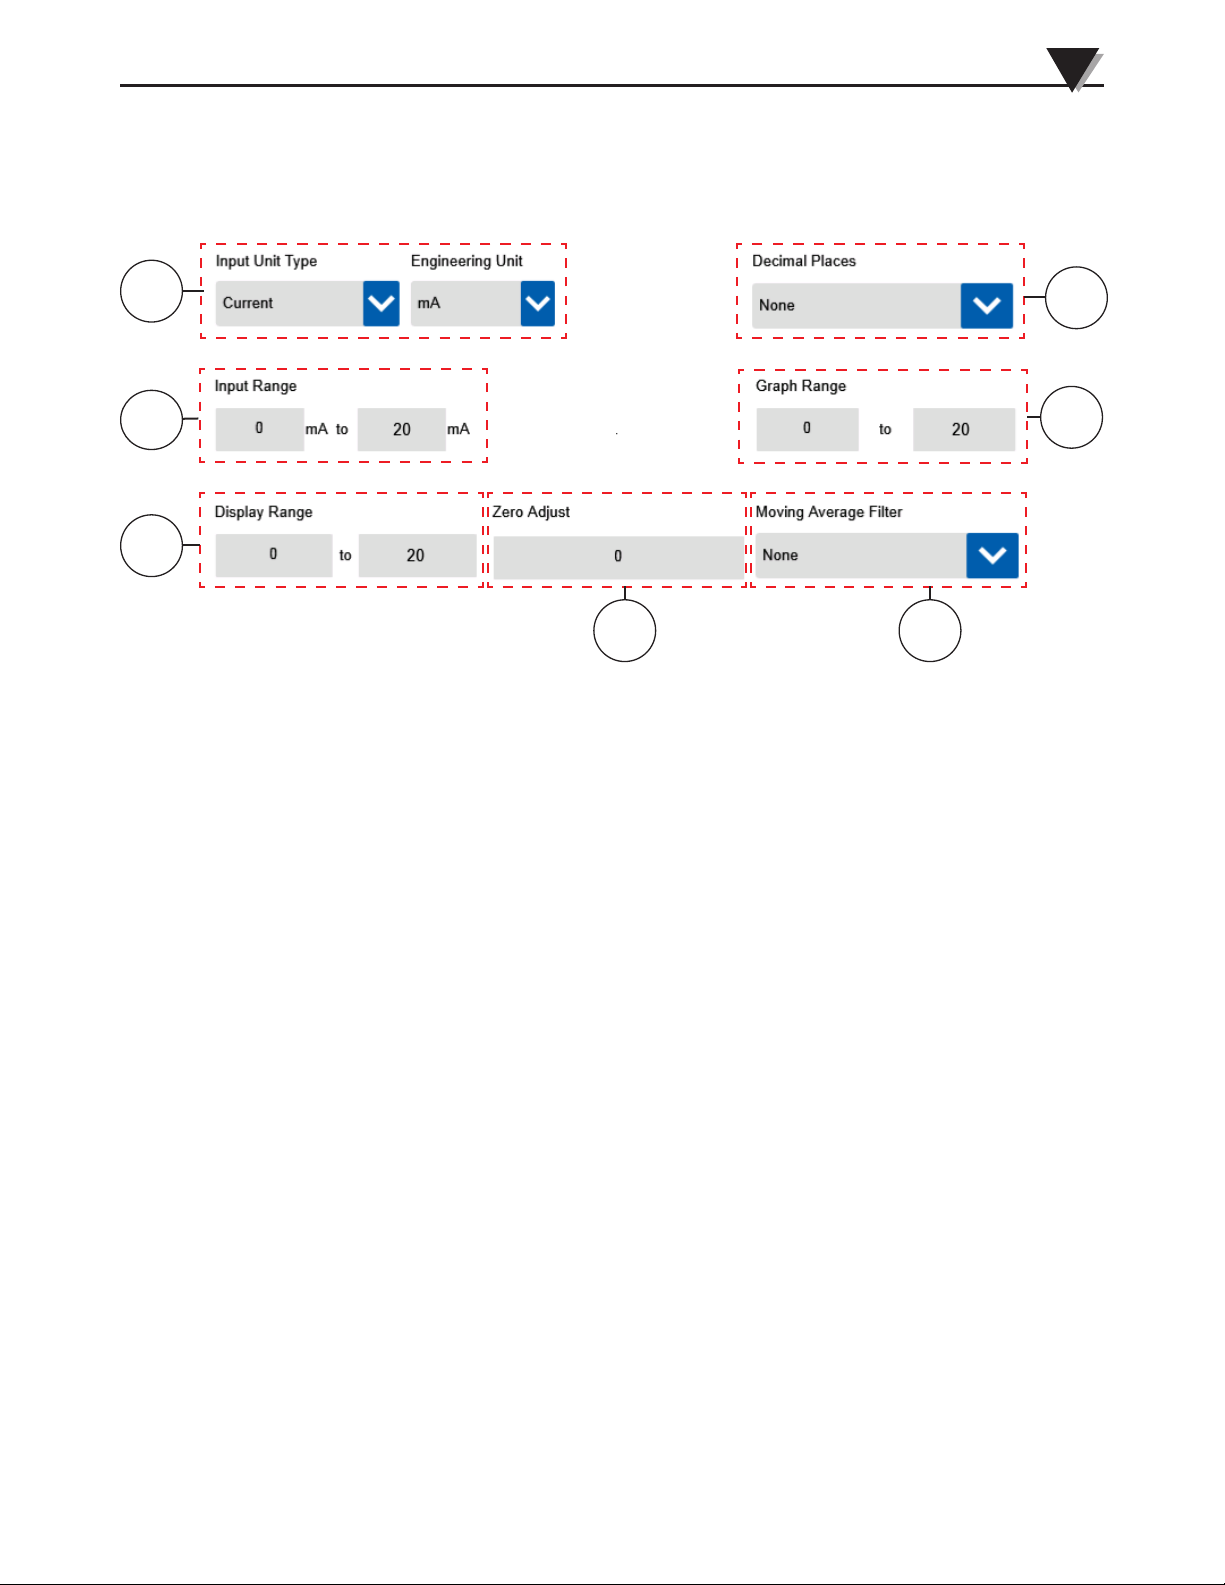
The Data Ranges screen for current inputs has several user editable fields which
are used for linear scaling of a current input to the desired engineering units for
display.
3
1
2
7
6
3
54
Figure 3-14 Data Ranges – Current
1. Engineering Units
These drop downs allow selection of various engineering units for display
depending on the type parameter being measured.
2. Input Range
The input range drop down shows the full measureable input of the data
logger. For current inputs there is a single range available. In addition
a custom input range can be assigned as a subset of any of the standard
ranges. This allows easier scaling of transducer output that is a subset of the
standard ranges to the display range.
3. Display Range
The display range boxes show the full range in engineering units for the
current input being configured. The graph range can be any subset of this
range.
4. Zero Adjust
The zero adjust provides a user configurable offset adjustment, in
engineering units, which will be applied to measurements across the full
range of input.
5. Moving Average Filter
This setting provides the option to average an individual channels input
samples.
6. Graph Range
The graph range is the y-axis range that will be shown on the waveform
view of the data logger. This can be any subset of the display range and
is defined in the assigned engineering units. It can also be adjusted on the
waveform view.
7. Decimal Places
Selects the number of decimal place to display.
3-12
Page 36
3
Standalone Operation
1
2
Digital Inputs
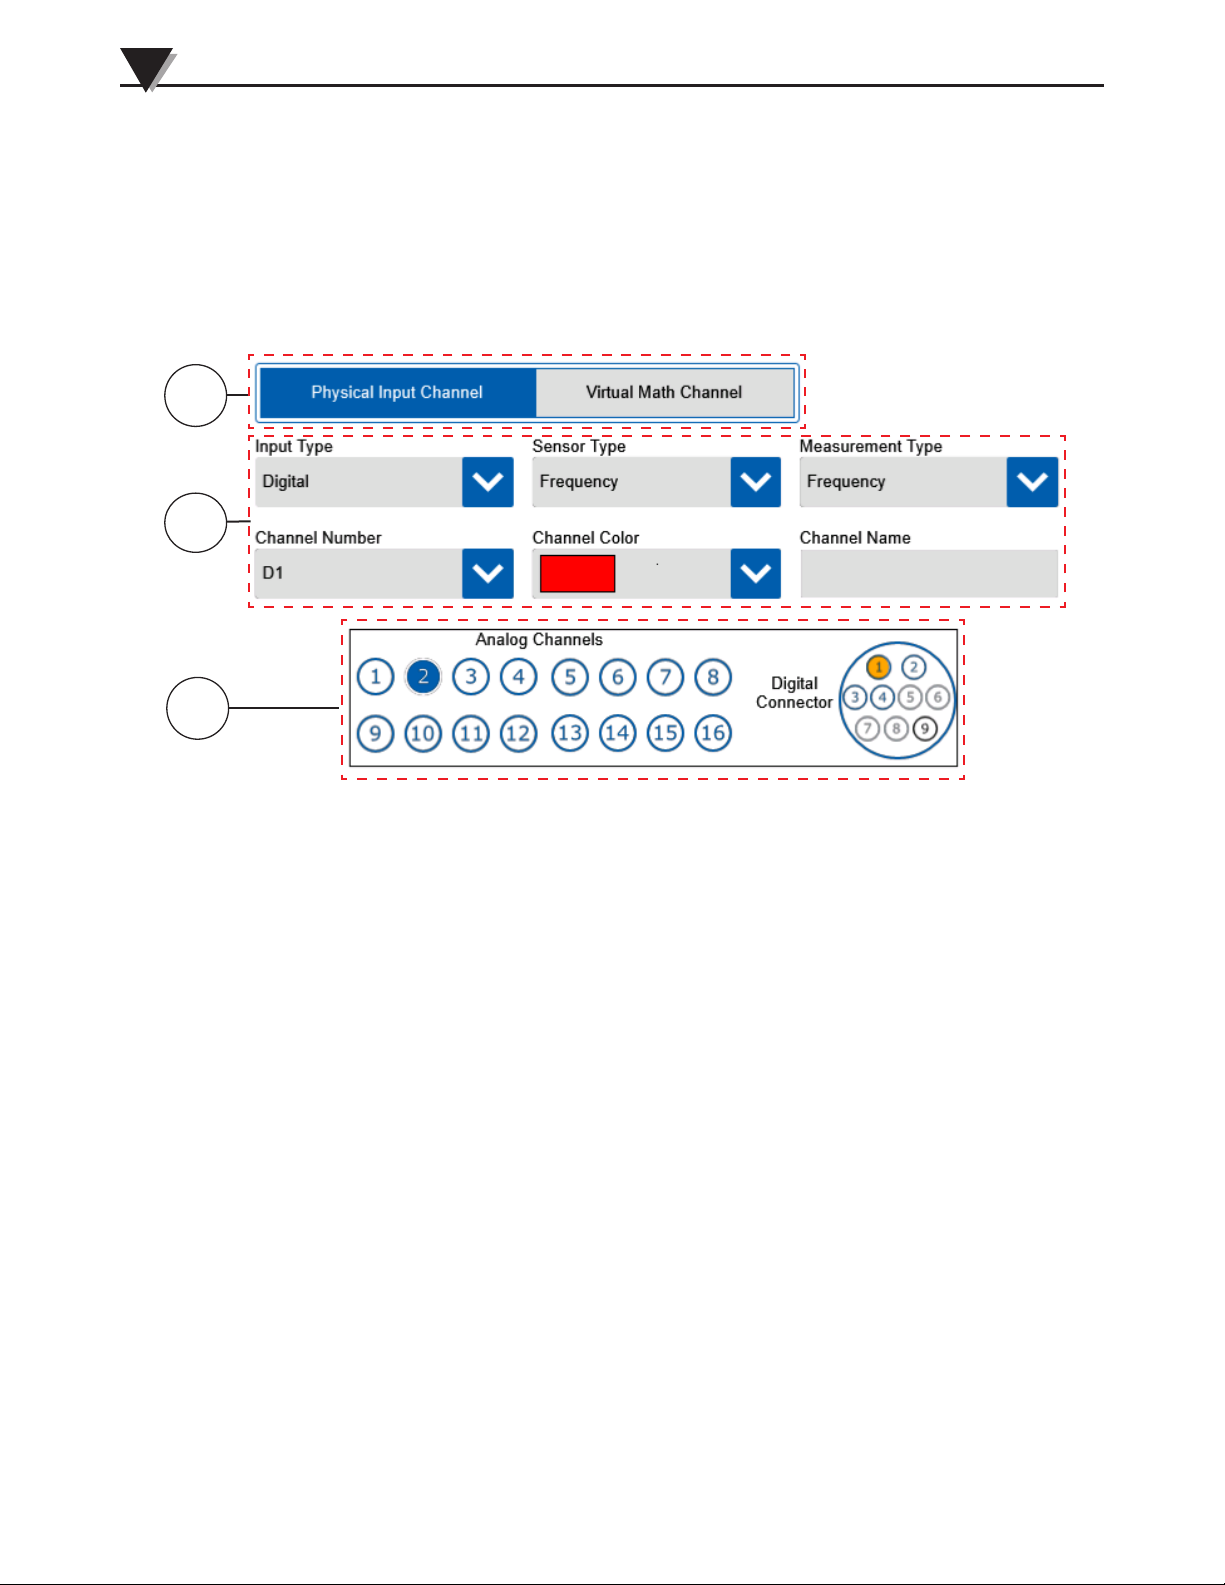
For digital inputs a sensor type must first be selected. The available selections
are frequency, totalizer and resettable counter.
Frequency
For frequency type digital inputs, the Input Type screen will appear as shown
below. Additional measurement type drop-down selections are available.
3
Figure 3-15 Input Type - Digital Frequency
1. Channel Type Button
The channel type selects between physical and math channel input types.
Frequency inputs are physical input channels.
2. Input Type Settings
For digital inputs there are 3 different sensor types to choose from. The
frequency type has two sub-types which affect the selects in the Data Ranges
screen. Select frequency if you are measuring purely frequency and do not
wish to convert to an engineering unit. Select volumetric flow rate if you are
measuring flow using a frequency or pulse output flowmeter.
3. Channel Map
The channel map provides a quick view of which channels have already
been configured (blue) and the currently selected channel (orange).
3-13
Page 37
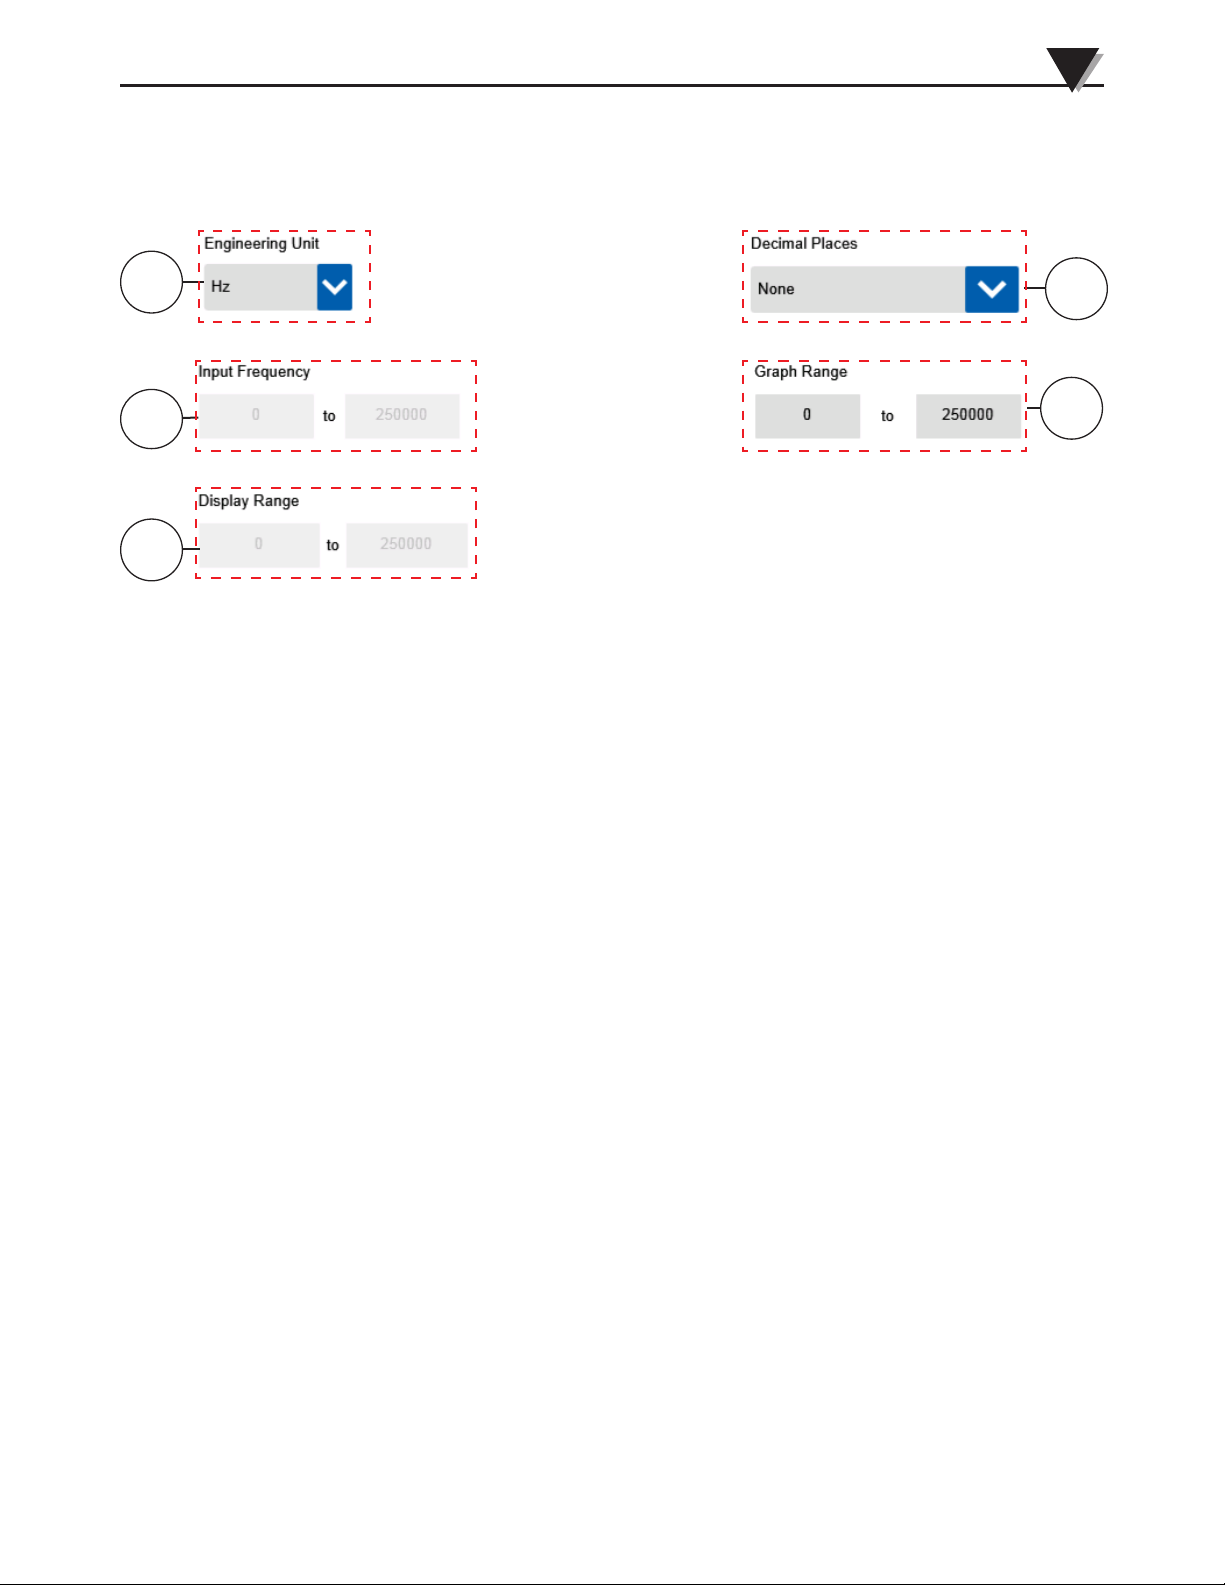
Standalone Operation
When configured for frequency measurement mode and measurement type
frequency, the data ranges screen will appear as shown below.
3
1
2
5
4
3
Figure 3-16 Data Ranges - Digital Frequency
1. Engineering Unit
Allows selection of various units for frequency measurement.
2. Input Frequency
Shows the input range in terms of the selected engineering units.
3. Display Range
Shows the display range also in terms of the selected engineering units.
4. Graph Range
This is a subset of the display range. This determines what portion of the
full display range will be shown initially in the waveform views. This range
can also be adjusted from the waveform view.
5. Decimal Places
Select the number of decimal places for display here.
3-14
Page 38
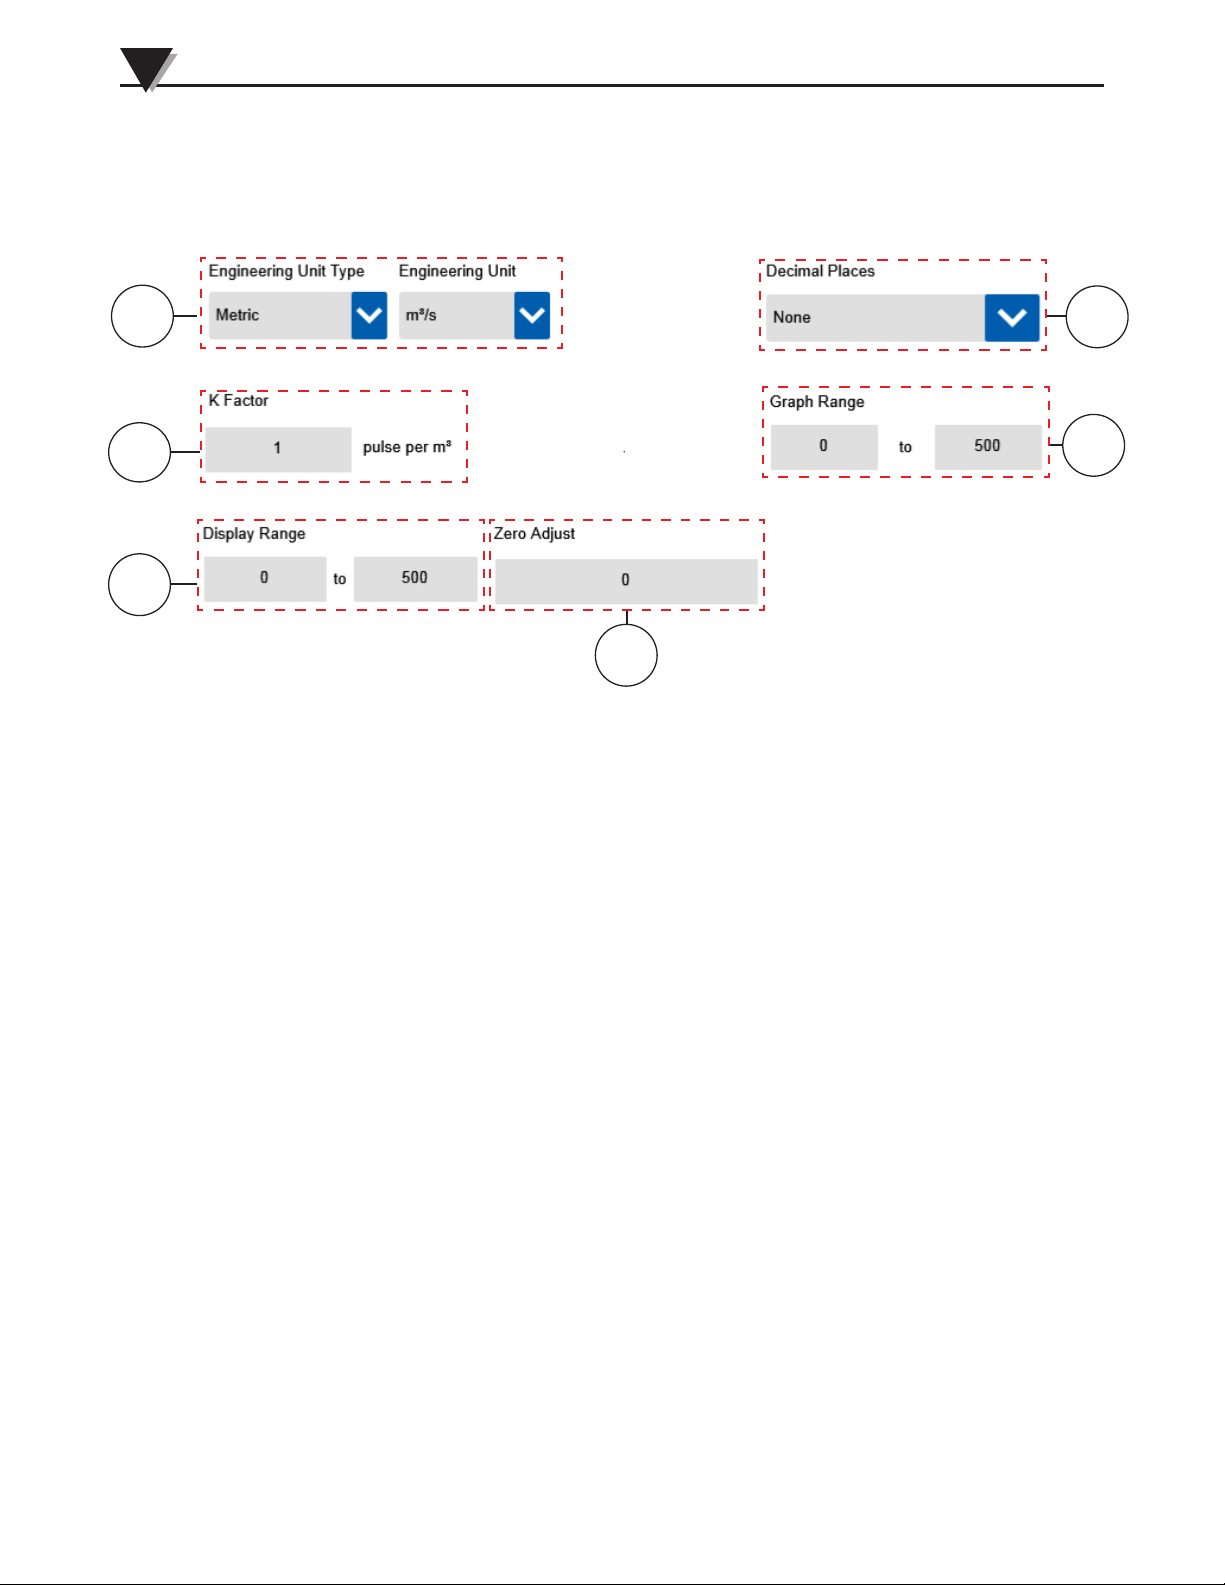
3
Standalone Operation
The frequency measurement mode can also be configured for a volumetric flow
measurement type in which case the data ranges screen will have different
configuration options as shown below.
1
2
6
5
3
4
Figure 3-17 Data Range - Volumetric Flow
1. Engineering Units
Allows selection of various flow measurement units.
2. K Factor
Enter the K factor provided on by the flow meter manufacturer.
3-15
3. Display Range
This is the linear mapping of the input range in terms of engineering units.
This determines what will be shown in the data display area for a given
input value.
4. Zero Adjust
This allows for a single offset value to be entered which will be applied to all
readings in terms of the selected engineering units.
5. Graph Range
This is a subset of the display range. This determines what portion of the full
display range will be displayed initially in the waveform views. This range
can also be adjusted from the waveform view.
6. Decimal Places
Select the number of decimal places for display here.
Example: Frequency=250 Hz.
Flow Rate Engineering Unit=GPM
K Factor=135.6 Pulse/Gallon
Flow Rate=(Frequency / K) *60=110.6 GPM
Page 39
Standalone Operation
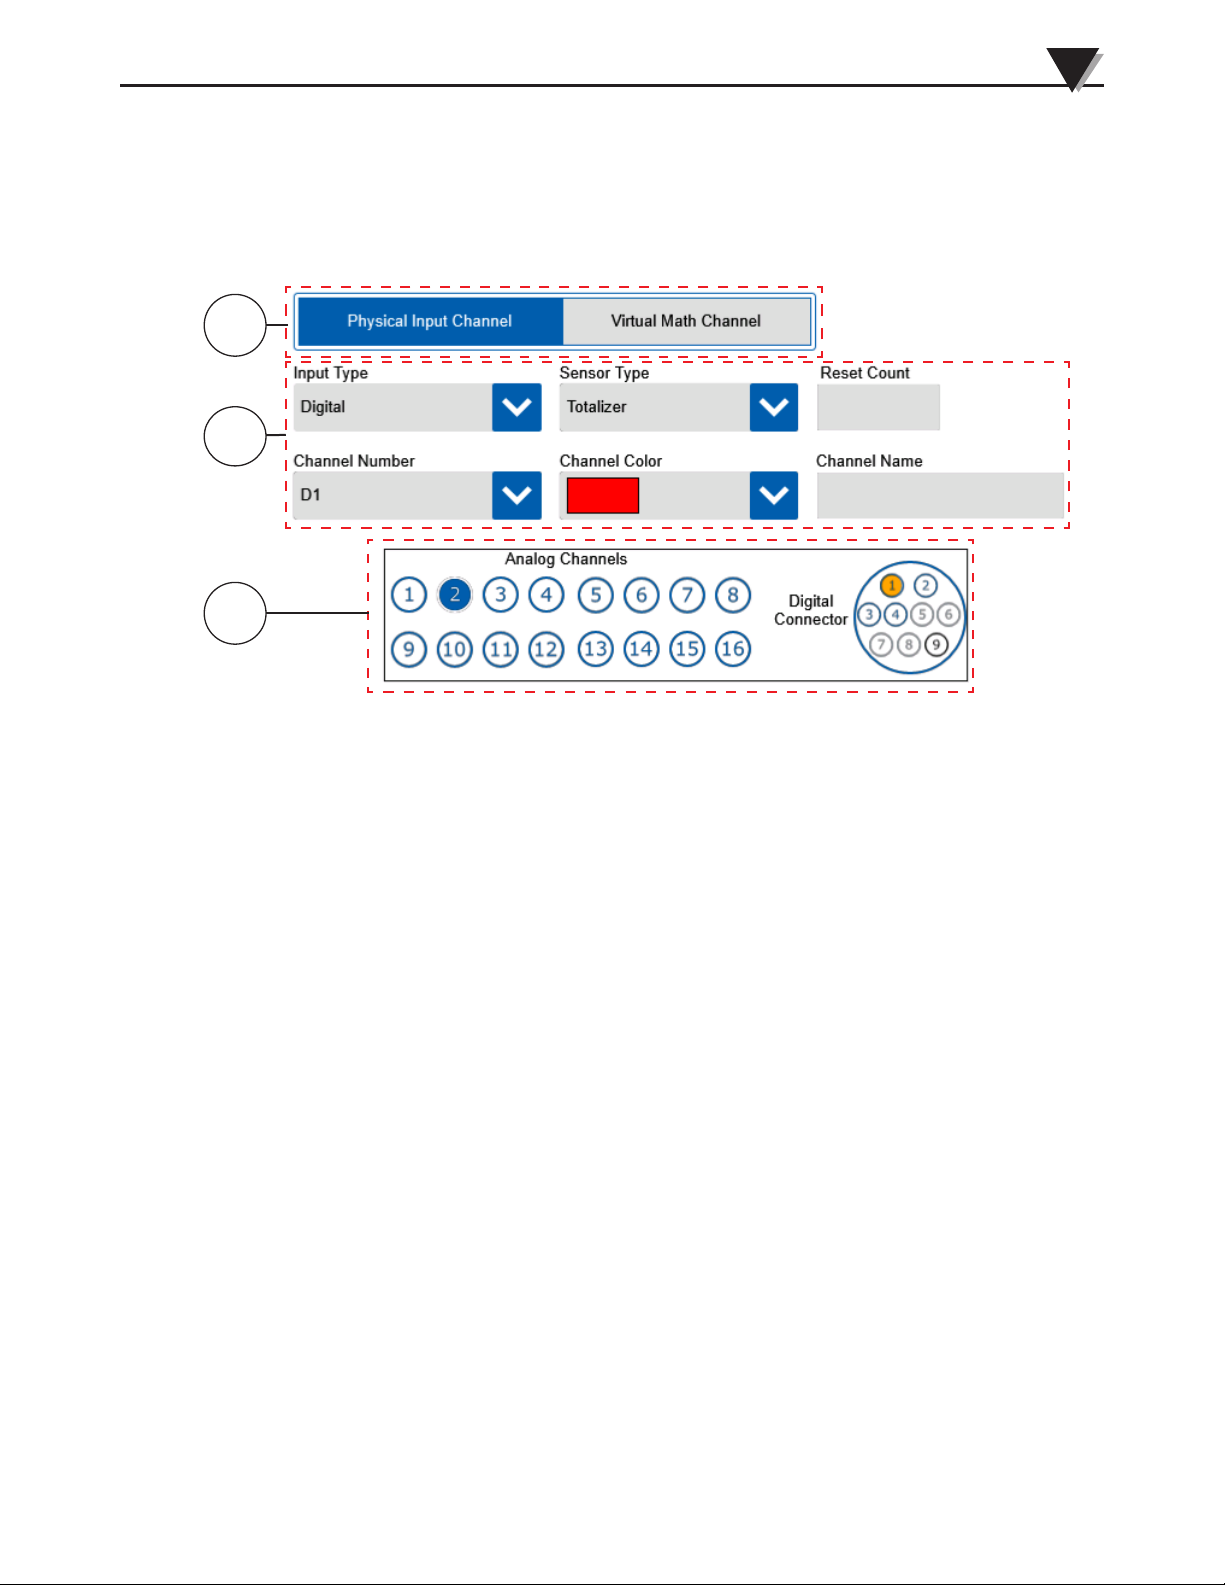
Totalizer
For totalizer type digital inputs the device will keep a running total of the
volumetric flow monitored by the digitals input until the reset count is reached.
The reset count is in terms of the engineering units assigned on the Data Ranges
screen.
3
1
2
3
Figure 3-18 Input Type Digital Totalizer
1. Channel Type button
The channel type selects between physical and math channel input types.
Frequency inputs are physical input channels.
2. Input Type Settings
For digital inputs there are 3 different sensor types to choose from. The
totalizer type requires a reset count to be entered as well. The reset count is
the volumetric flow total at which you wish to have the totalizer reset back
to zero.
3. Channel Map
The channel map provides a quick view of which channels have already
been configured (blue) and the currently selected channel (orange).
3-16
Page 40
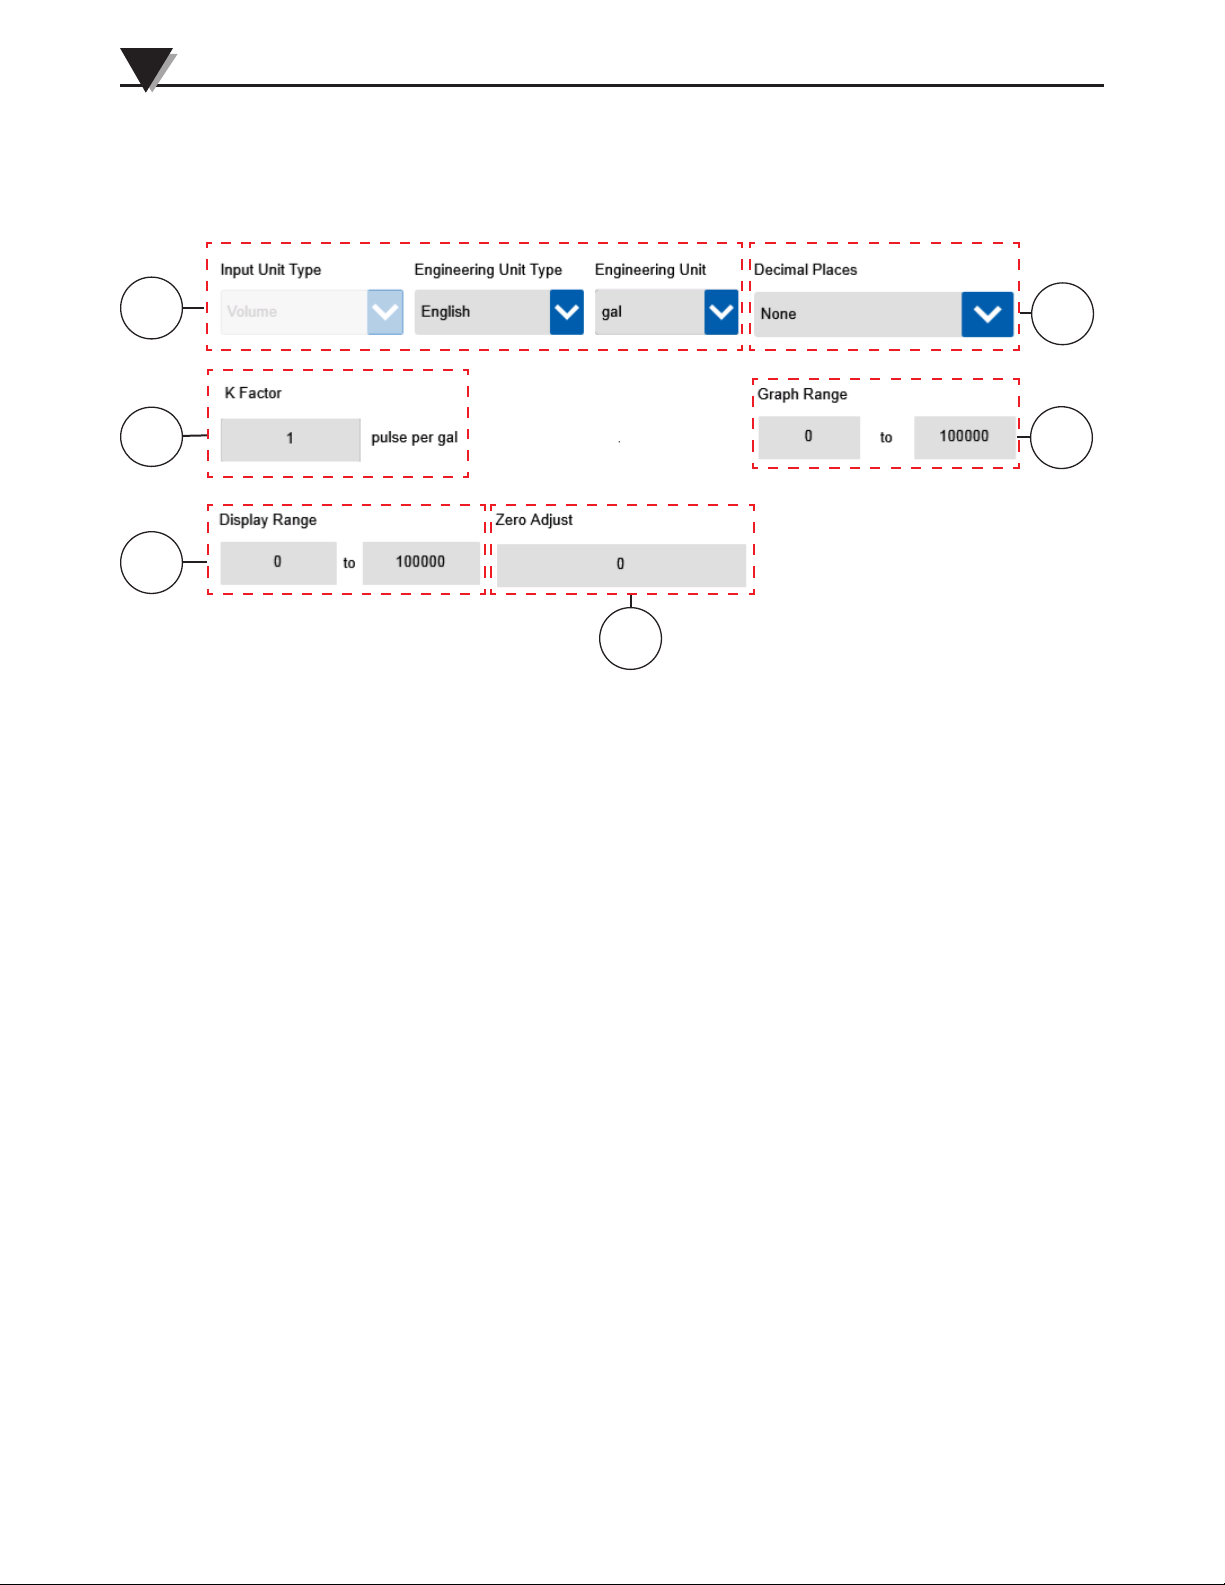
3
Standalone Operation
Totalizer inputs type must be configured in terms of volumetric flow. The Data
Ranges screen provides configuration options as shown below.
1
2
6
5
3
4
Figure 3-19 Data Ranges - Digital Totalizer
1. Engineering Units
Allows selection of various flow measurement units.
2. K Factor
Enter the K factor provided on by the flow meter manufacturer.
3. Display Range
This is the linear mapping of the input range in terms of engineering units.
This determines what will be shown in the data display area for a given
input value.
4. Zero Adjust
This allows for a single offset value to be entered which will be applied to
all readings in terms of the selected engineering units.
5. Graph Range
This is a subset of the display range. This determines what portion of the
full display range will be displayed initially in the waveform views. This
range can also be adjusted from the waveform view.
6. Decimal Places
Select the number of decimal places for display here.
3-17
Page 41
Standalone Operation
Resettable Counter
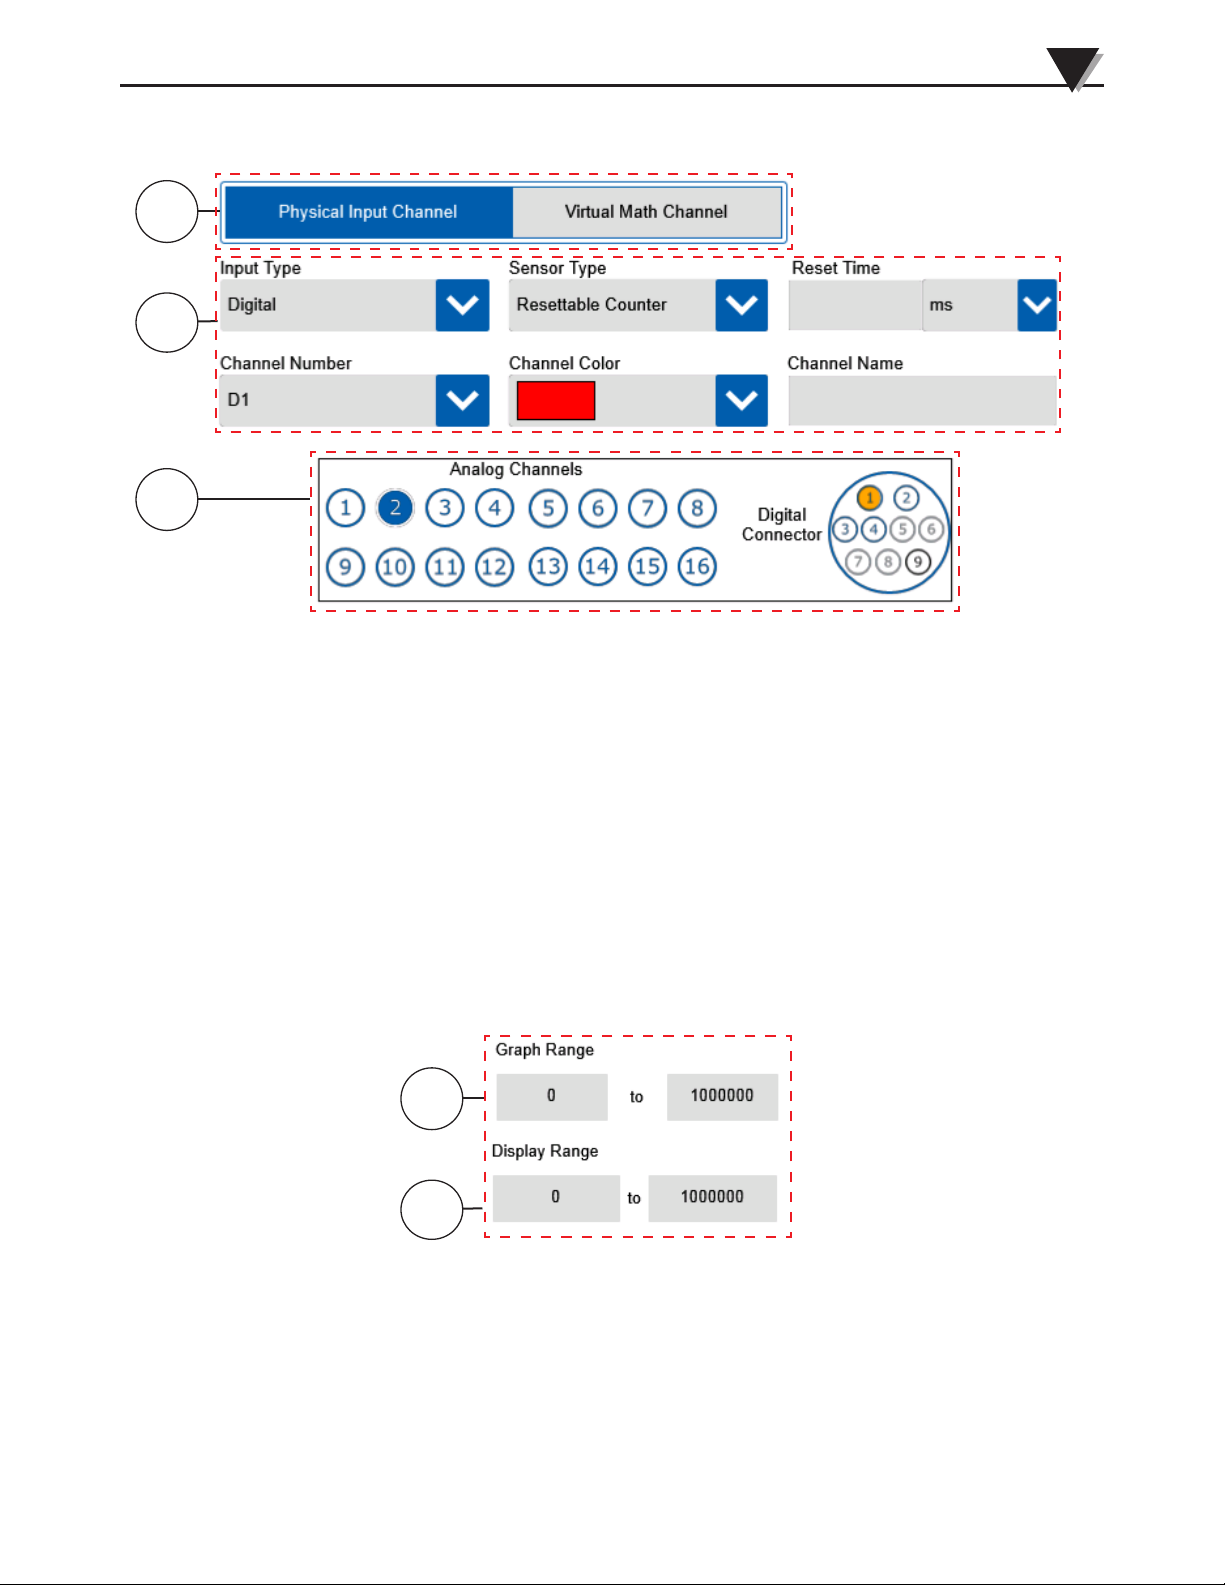
For resettable counter digital inputs the device will count the number of pulses
received on the digital input until the reset time is reached.
3
1
2
3
Figure 3-20 Input Type Digital Resettable Counter
1. Channel Type Button
The channel type selects between physical and math channel input types.
Frequency inputs are physical input channels.
2. Input Type Settings
For digital inputs there are 3 different sensor types to choose from. The
resettable counter type requires a reset time to be entered as well. The reset
time is the period after which you wish to have the counter reset back to
zero.
3. Channel Map
The channel map provides a quick view of which channels have already
been configured (blue) and the currently selected channel (orange).
For resettable counter digital inputs, the only additional settings required on the
Data Ranges screen are the graph and display ranges.
1
2
Figure 3-21 Data Ranges - Resettable Counter
1. Graph Range
The graph range is the y-axis range that will be shown on the waveform
view. It defaults to the same value as the display range, but must be a subset
of the display range. This can be adjusted from the waveform display as
well.
2. Display Range
The display range is the full range value that the device will display. This is
a user editable setting.
3-18
Page 42
3
Standalone Operation
1
2
3
4
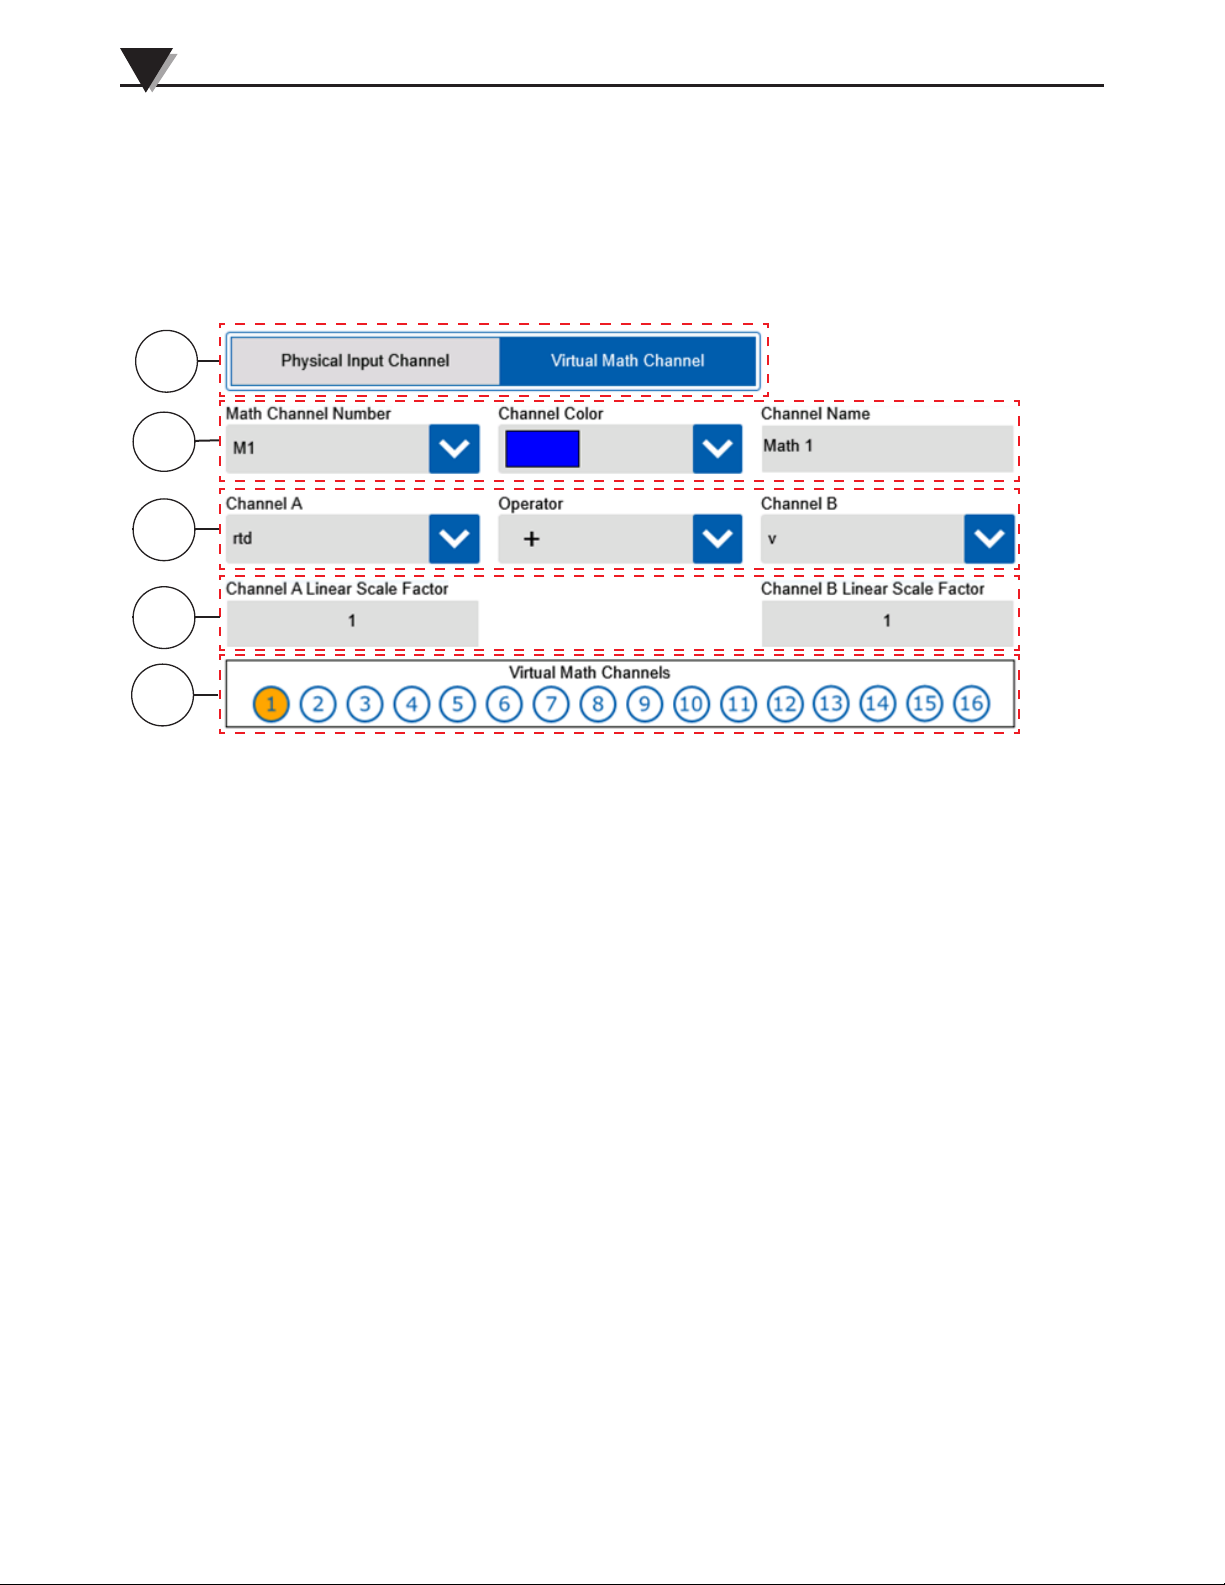
Input Setup – Virtual Math Channel
Virtual math channels allow you to perform math functions on the data from
two physical channels and store the calculated result as a virtual channel. Up to
16 virtual channels can be configured.
5
Figure 3-22 Input Type - Virtual Math
1. Channel Type Buttons
Allows selection of either a real physical input channel or a virtual Math
channel.
2. Math Channel Settings
Selects the channel number, color and name to assign to the new math channel.
3. Channel Operations
Selects the two physical channels and math operation to perform.
4. Scaling Factors
Multiplies the channel value by the selected scale factor before performing the
math operation to the two channels. The scaling factor can be either whole or
decimal numbers.
5. Channel Map
The channel map provides a visual indication of the previously configured
channels (shown in blue) and the currently selected channel (shown in orange).
3-19
Page 43
Standalone Operation
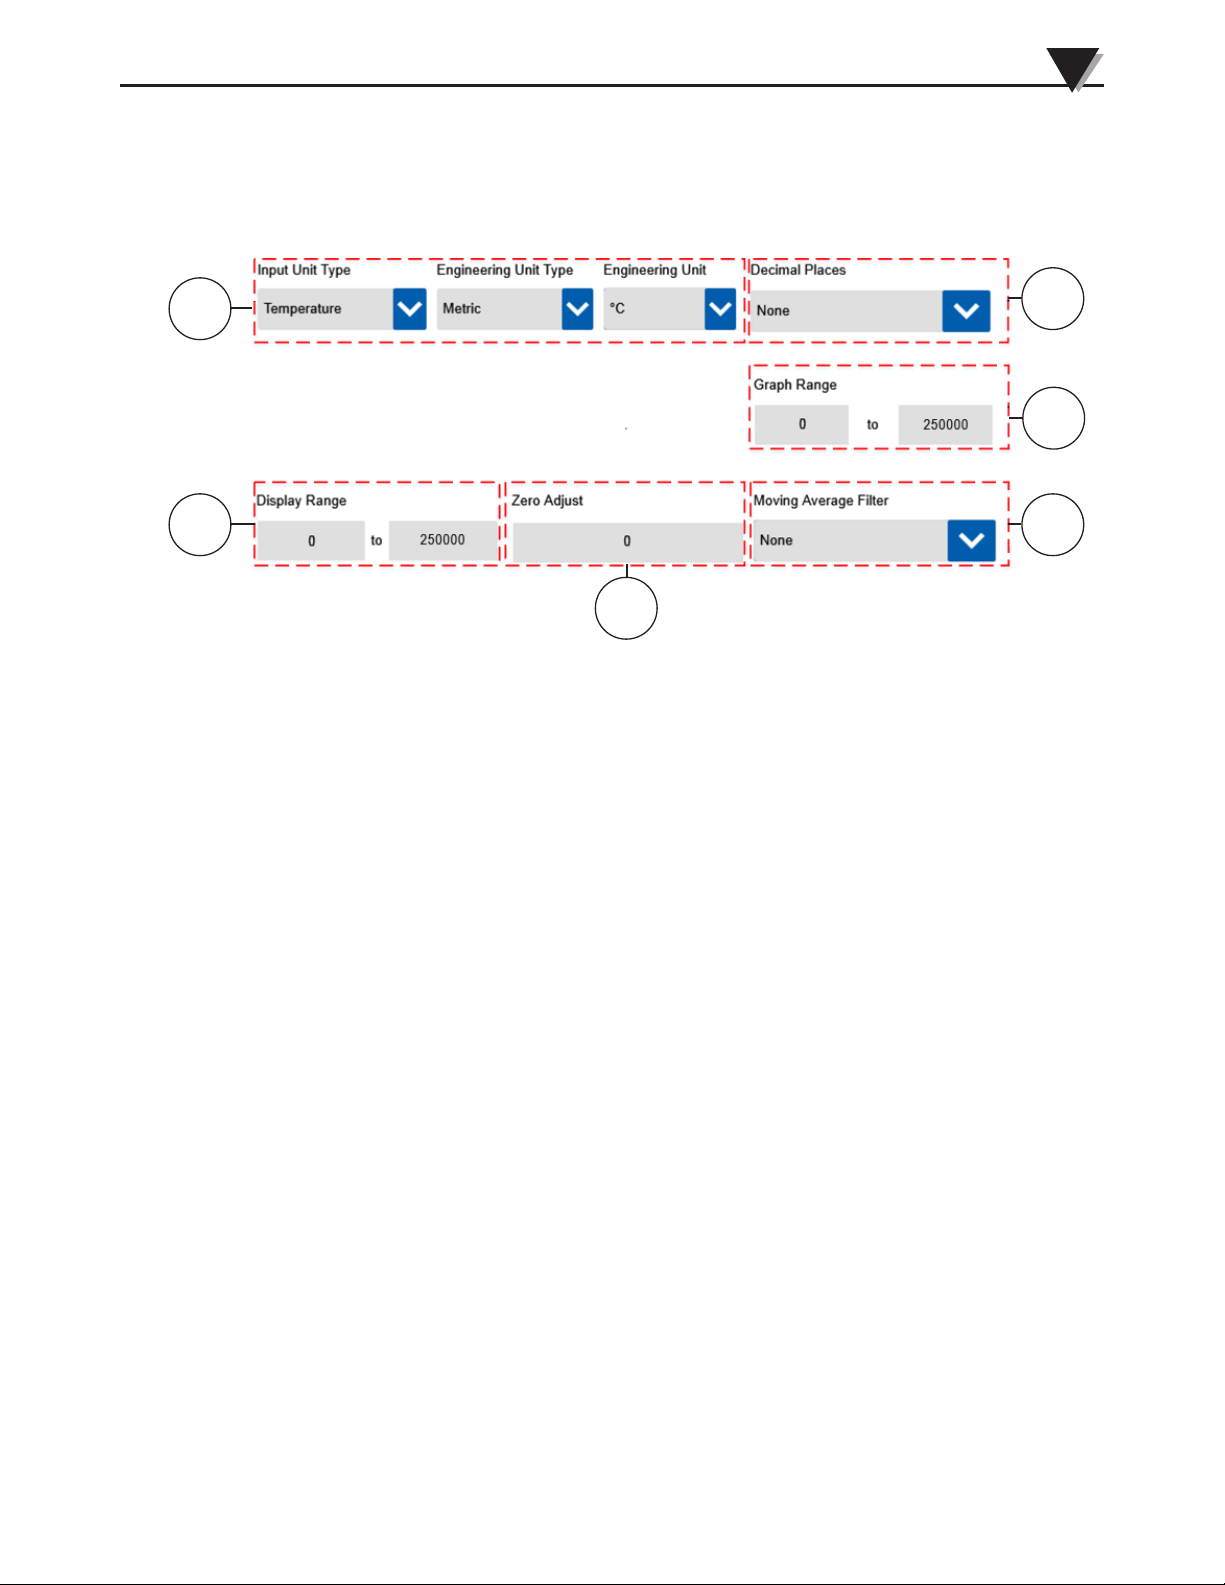
After configuring the channels and math operations for the virtual math channel
on the Input Type screen, you can set up the engineering units and ranges for the
calculated results on the Data Ranges screen.
3
1
6
5
2
4
3
Figure 3-23 Data Ranges - Virtual Math
1. Engineering Units
These drop downs allow selection of various engineering units for display.
2. Display Range
The display range boxes show the full display range available on the data
logger. The graph range can be any subset of this range. This range should be
set to cover all possible values of the calculated results based on the scaling
and math operations.
3. Zero Adjust
The zero adjust provides a user configurable offset adjustment, in engineering
units, which will be applied to measurements across the full range of input.
4. Moving Average Filter
This setting provides the option to average an individual channels input
samples.
5. Graph Range
The graph range is the y-axis range that will be shown on the waveform view
of the data logger. This can be any subset of the display range and is defined
in the assigned engineering units. It can also be adjusted on the waveform
view.
6. Decimal Places
Selects the number of decimal place to display.
3-20
Page 44
3
Standalone Operation
1
2
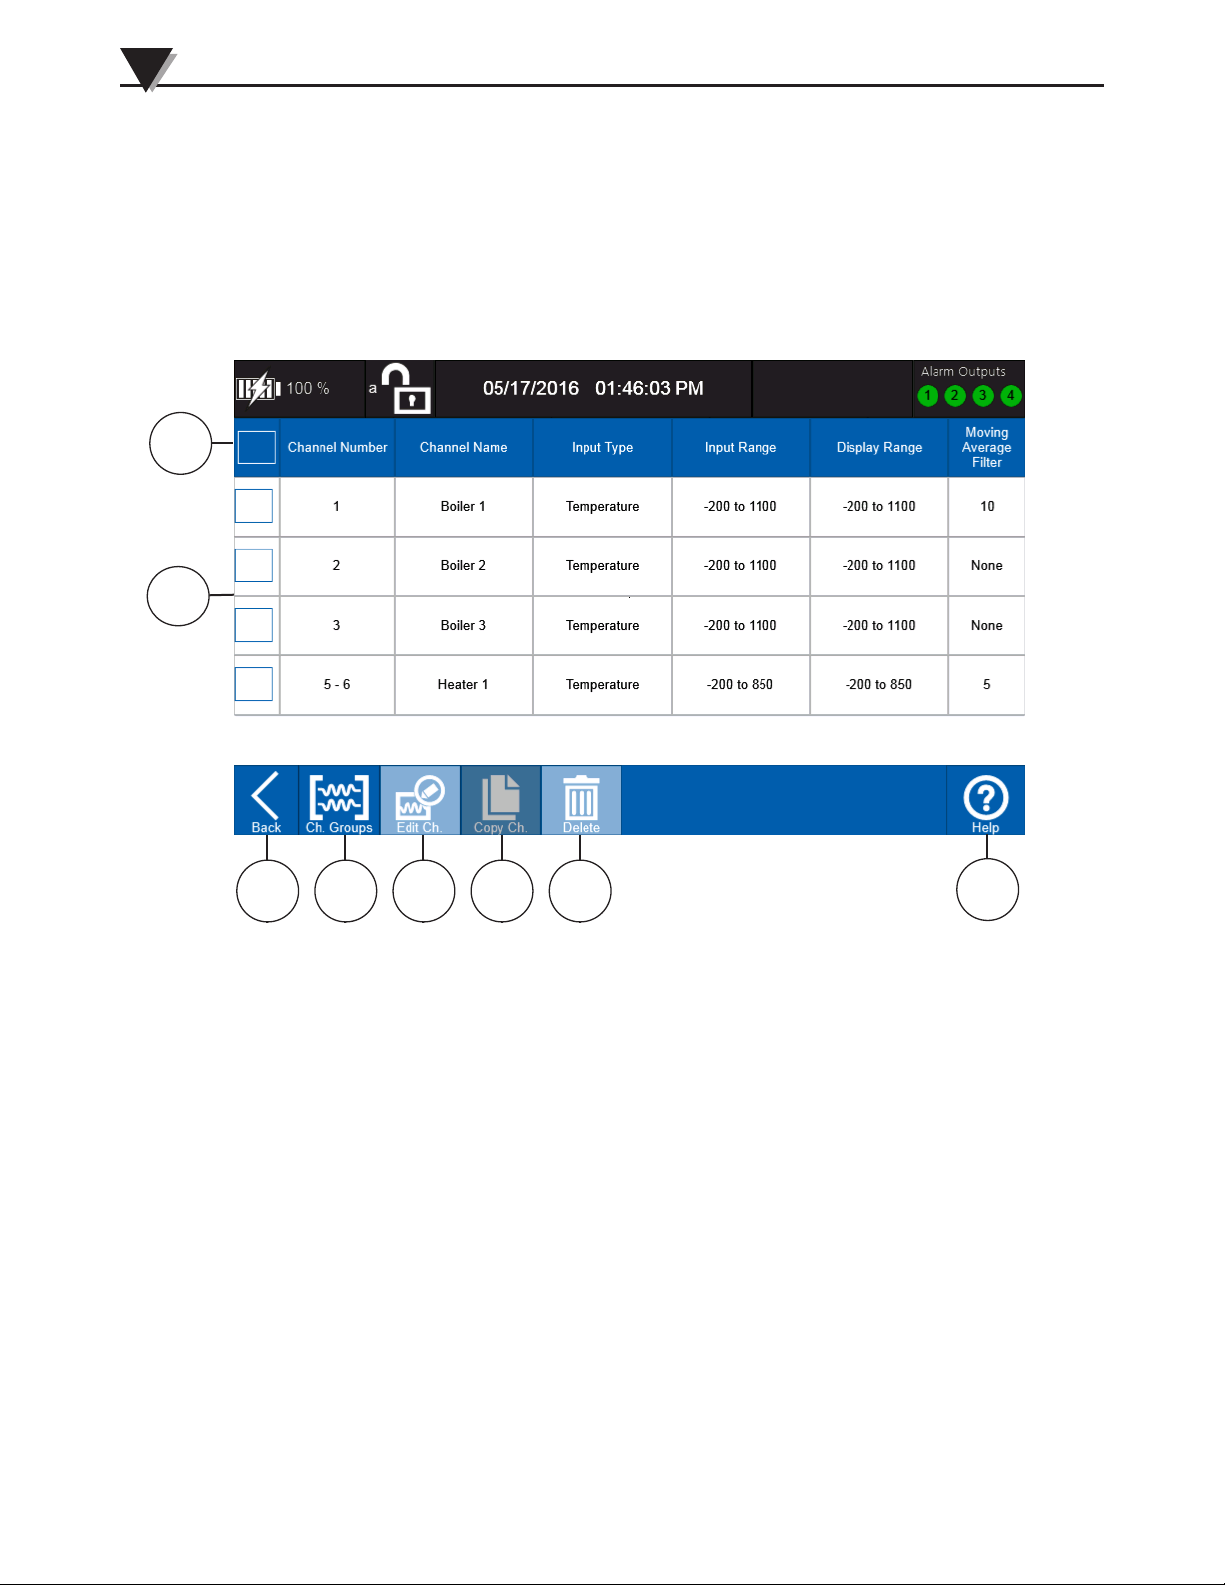
3.3.2 Channel List
The Channel List screen can be used to edit channels after their initial
configuration as long as the data logger is in the free running mode of operation.
To edit channels hit the Channel List button on the Home Screen toolbar to go to
the Channel List screen. Then select the channel you would like to edit and hit
the Edit Channel button.
3-21
3 4 5 6 7
Figure 3-24 Channel List screen
1. Table Header – Indicates the channel settings shown in each column of the
channel list.
2. Channel List – A table showing all of the currently configured channels and
their values for each of the settings in the table header.
3. Back – The back button returns to the Home Screen.
4. Channel Groups – This button navigates to the Select Channels screen
where channel groups can be configured.
5. Edit – The edit button is used to edit a channels settings. Only one channel
can be edited at a time.
6. Copy – The copy button copies the currently select channels settings to the
next available channel and navigates to the Input Type screen where the
new channel can be further edited or saved. Only one channel can be copied
at a time.
7. Delete – The delete button can be used to delete one or more channels using
the checkboxes.
8. Help - Provides context-sensitive help based on the current screen.
8
Page 45
Standalone Operation
3
3.3.3 Trigger Settings
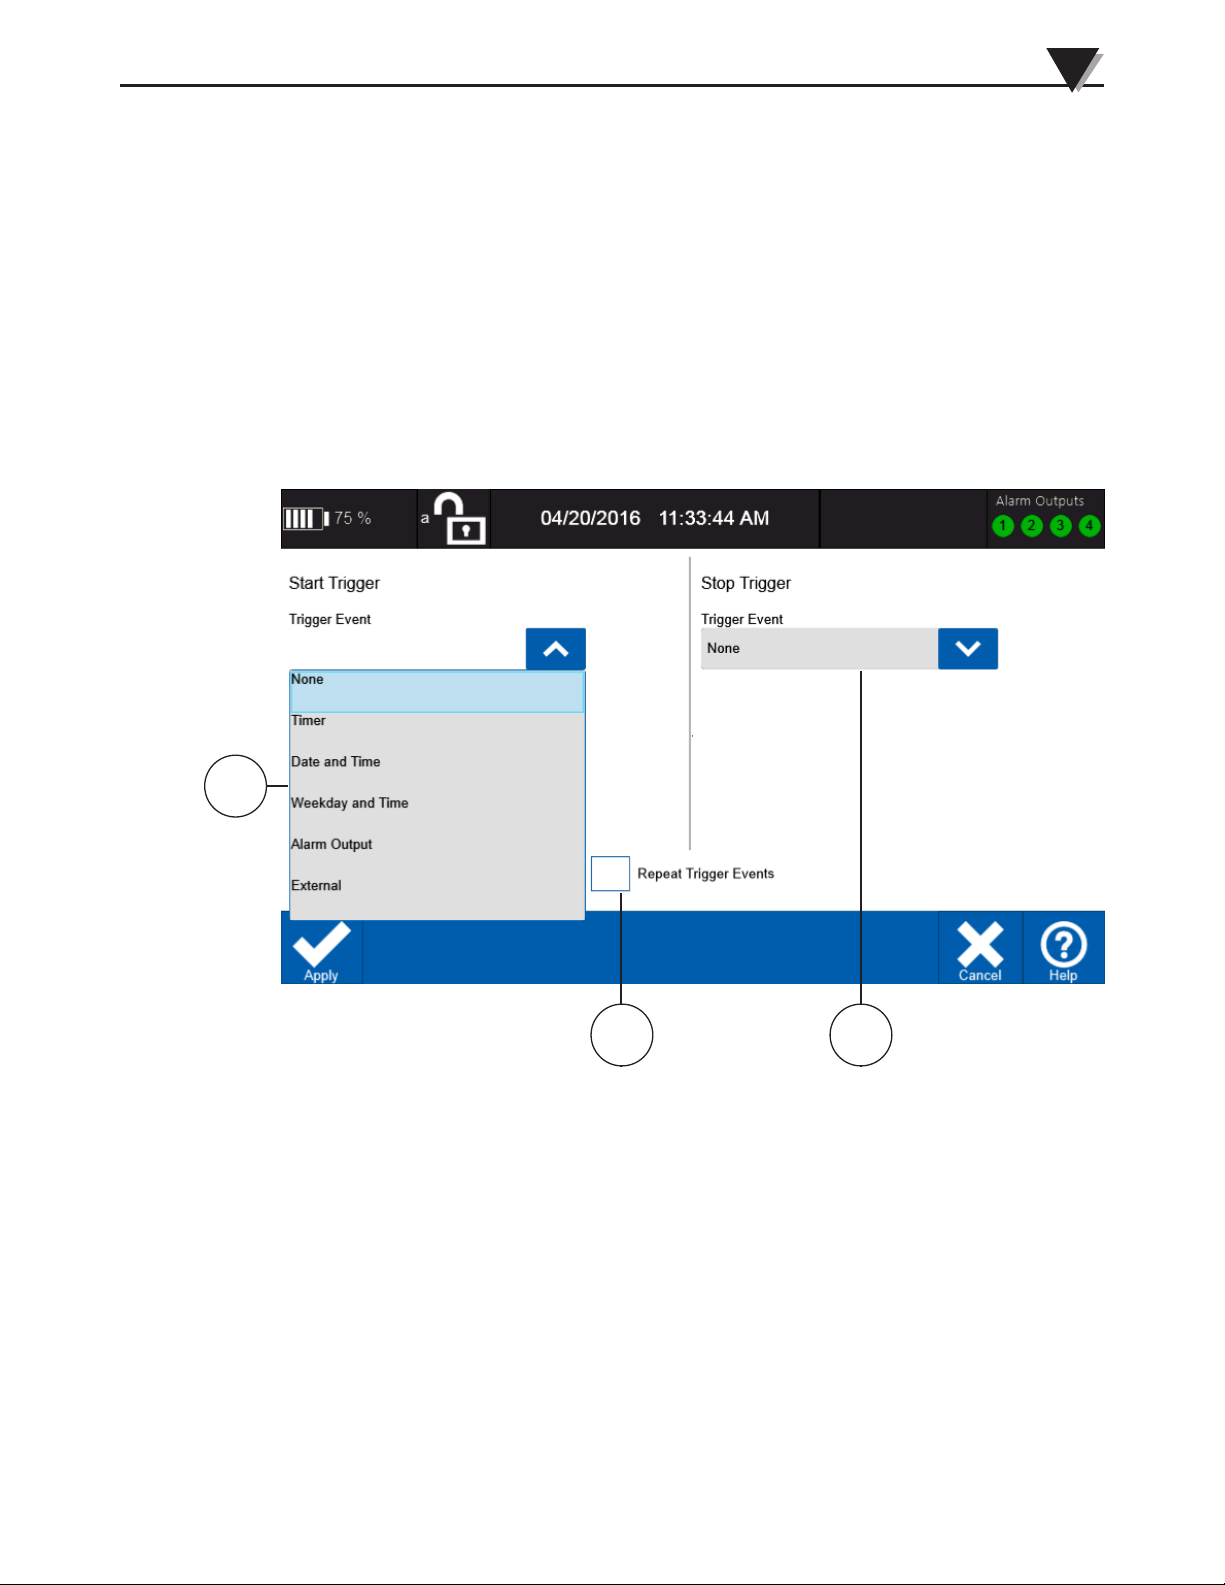
The Trigger settings screen can be accessed through settings button of the home
screen toolbar. Trigger events can be used to start and stop a data logging
session. It is even possible to trigger multiple sessions using repeat trigger
events. Start and stop trigger events can be used independently or together,
allowing many different ways to control data logging sessions. There are five
types of trigger events available. When no start trigger event is configured,
data logging will commence immediately upon pressing the Log Data button.
Otherwise the data logger will enter into the Armed mode and it will await a
start trigger event before commencing data logging. When no stop trigger event
is configured, data logging will continue until the user presses the Stop Log
button or the selected memory device is full.
1
2 3
Figure 3-25 - Trigger Settings
1. Start Trigger Event
The Start Trigger Event drop down menu is used to select the type of trigger
to use for starting a logging session.
2. Repeat Trigger Event
The Repeat Trigger Events checkbox determines whether or not the device
will trigger (log) more than once. This also depends on the type of trigger
events configured.
3. Stop Trigger Event
This drop down menu is used to select the type of stop trigger event to use
to end a data logging session.
3-22
Page 46
3
Standalone Operation
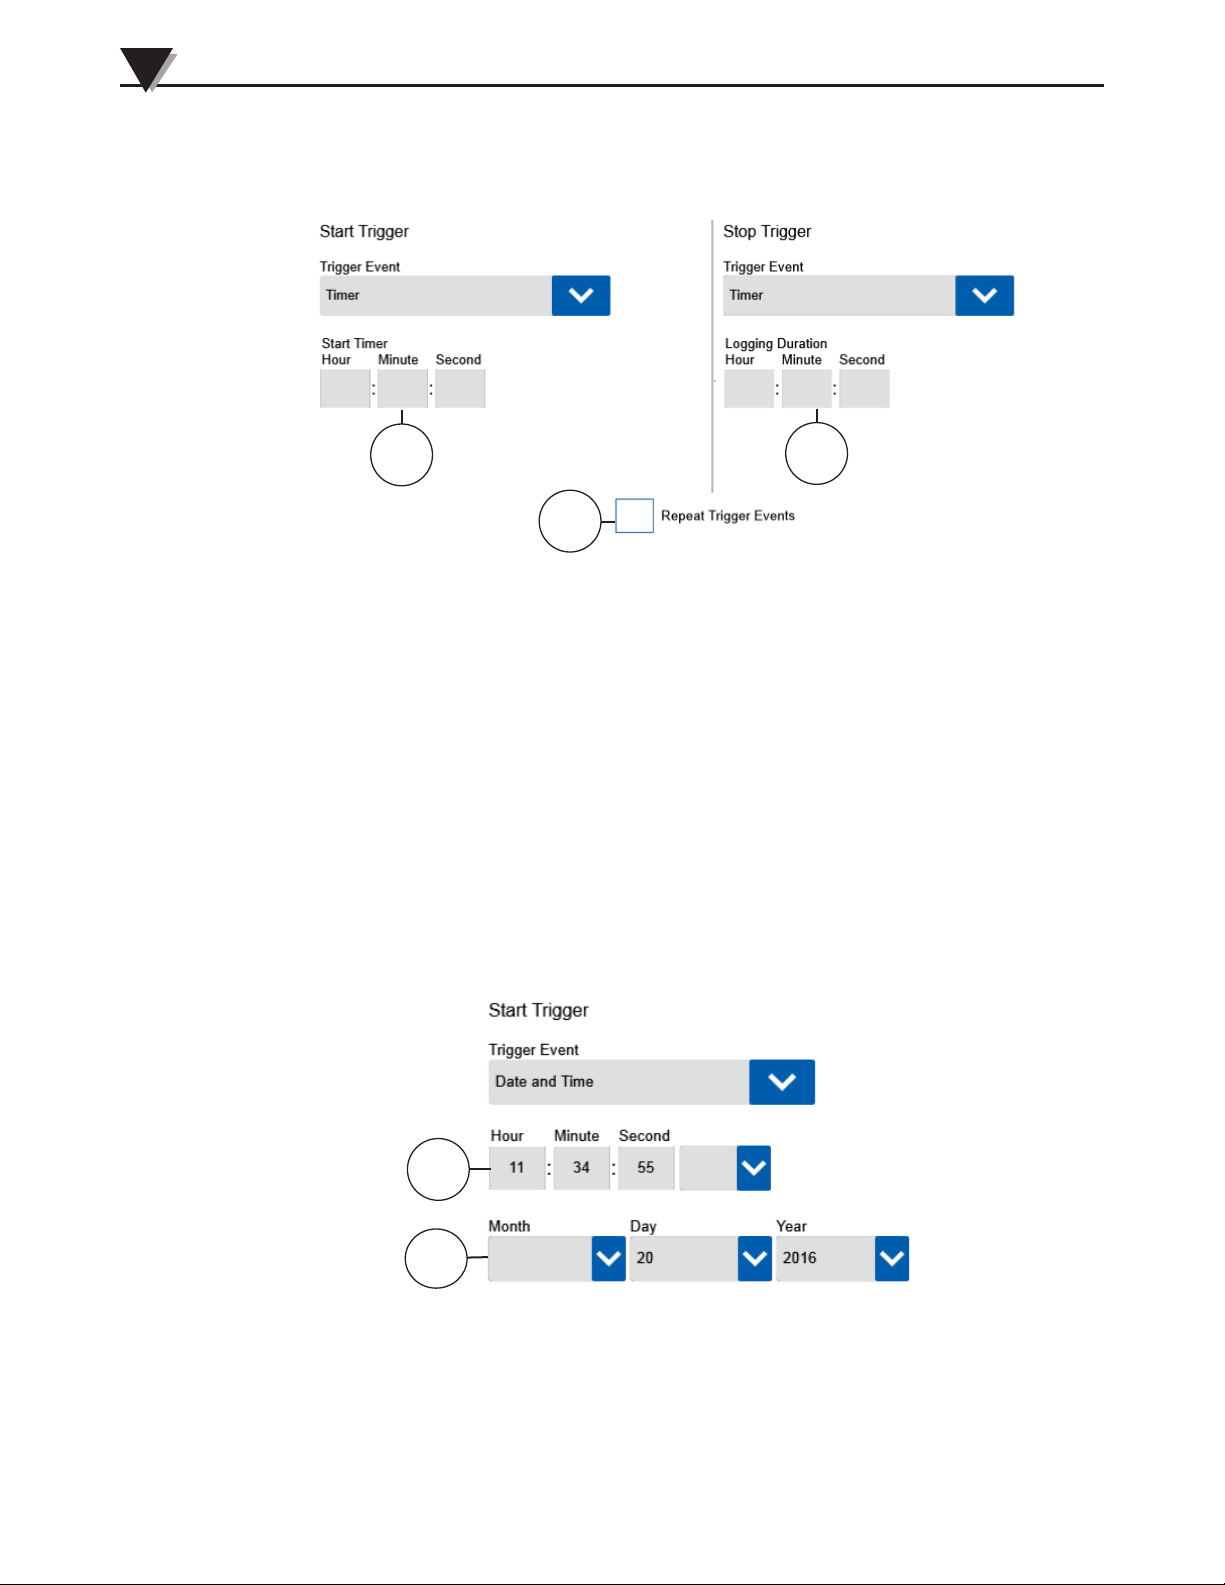
Timer Trigger Events
When used as a start trigger event the logging session will commence after the
data logger has been armed and the configured time period has elapsed. When
used as a stop trigger the timer sets the duration of the logging session.
1
2
3
Figure 3-26 Timer Trigger Event
1. Start Timer
The Start Timer sets the delay before logging commences in HH:MM:SS
format.
2. Logging Duration
The logging during determines how long the logging session continues in
HH:MM:SS.
3. Repeat Trigger Events
If repeat trigger events are enabled, the device will automatically re-arm
itself after each logging session ends.
Date and Time Trigger Events
This trigger event option allows a specific date and time to be selected to start
and/or stop a logging session. Repeat triggers are not available for this event.
3-23
1
2
Figure 3-27 Date and Time Trigger Event
1. Trigger Time
Sets the time that the start or stop trigger occurs.
2. Trigger Date
Sets the date for the start or stop trigger.
Page 47
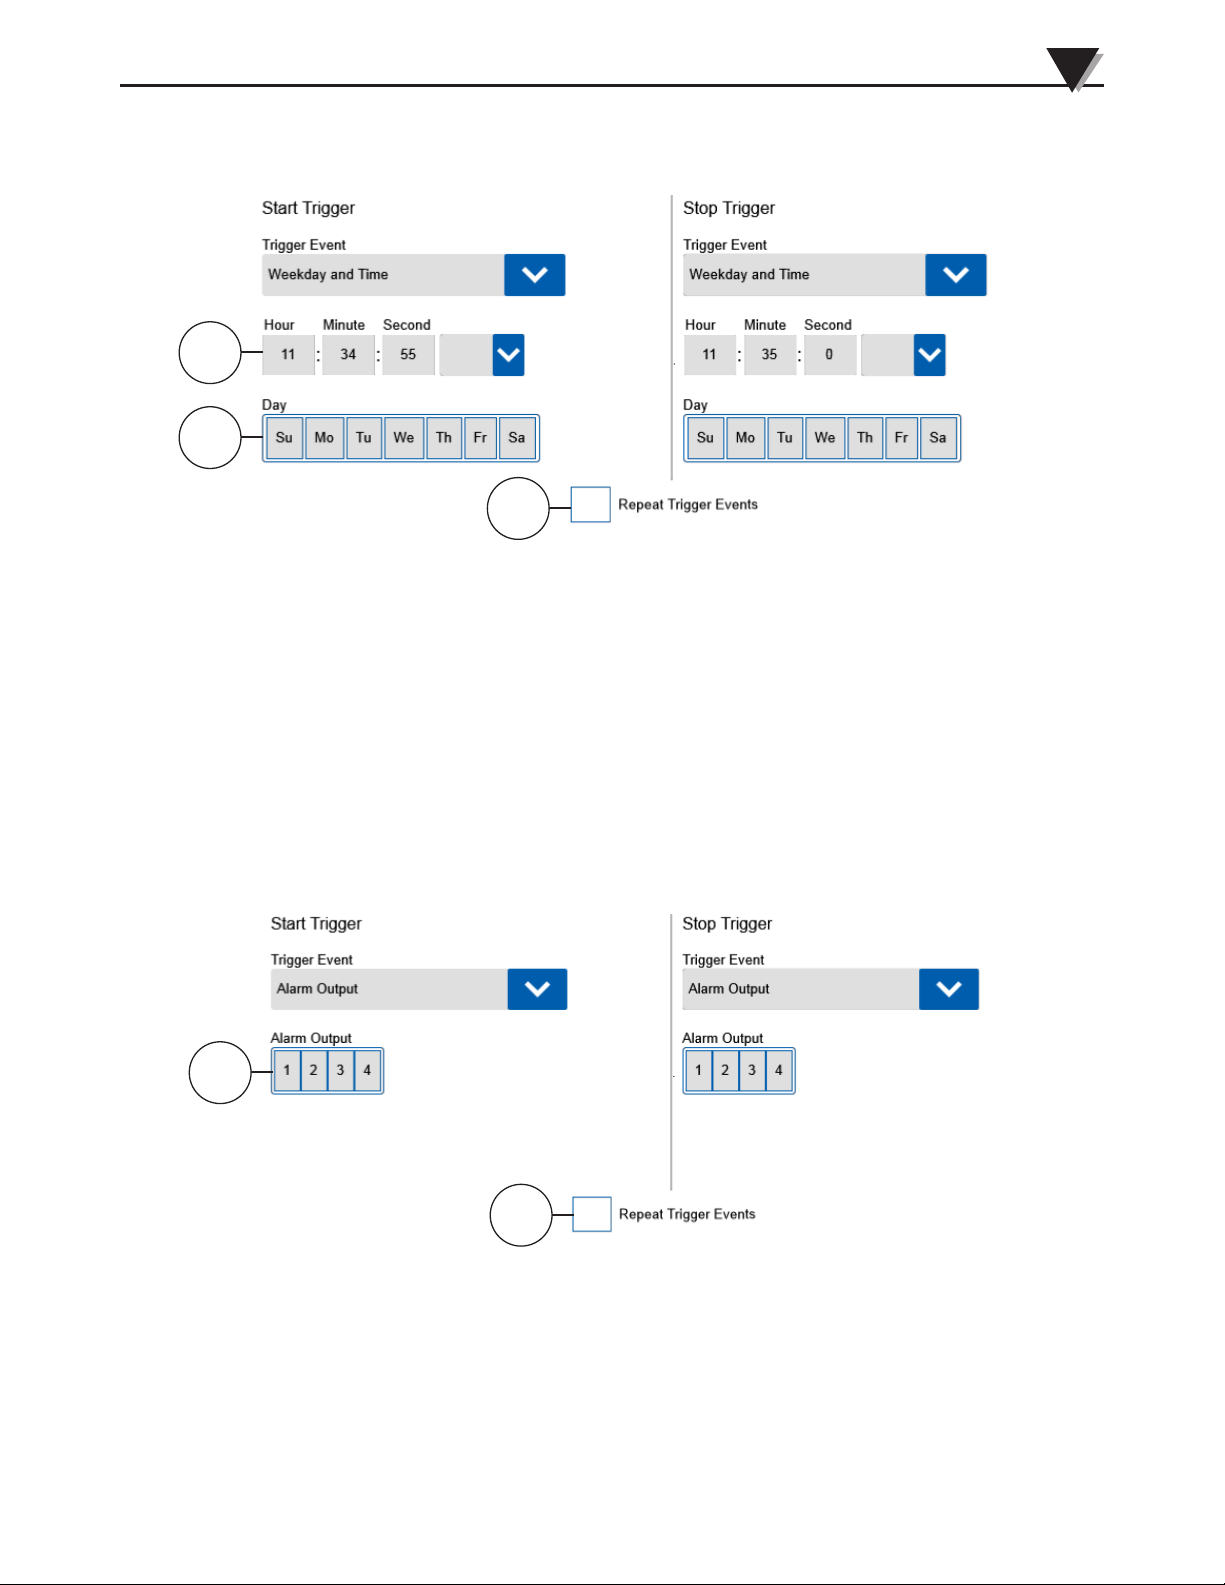
Standalone Operation
Weekday and Time Trigger Events
Using this option a time and day of the week can be configured as a start or stop
trigger.
3
1
2
3
Figure 3-28 Weekday and Time Trigger Event
1. Trigger Time
Sets the time that the trigger event occurs.
2. Trigger Day
Sets the day of the week that the trigger even will occur on.
3. Repeat Trigger Events
If repeat trigger events are enabled the device will automatically re-arm
itself after the logging session ends. A stop trigger event must be configured
for this to occur.
Alarm Output Trigger Events
The Alarm output option allows any of the alarms currently configured and
enabled to activate an alarm output to also trigger a logging session.
1
2
Figure 3-29 Alarm Trigger Event
1. Alarm Output
Selects the alarm output to be used as a trigger event. When an alarm
mapped to the corresponding output is generated, the trigger condition is
met.
2. Repeat Trigger Events
If repeat trigger events are enabled the device will automatically re-arm
itself after the logging session ends. A stop trigger event must be configured
for this to occur.
3-24
Page 48
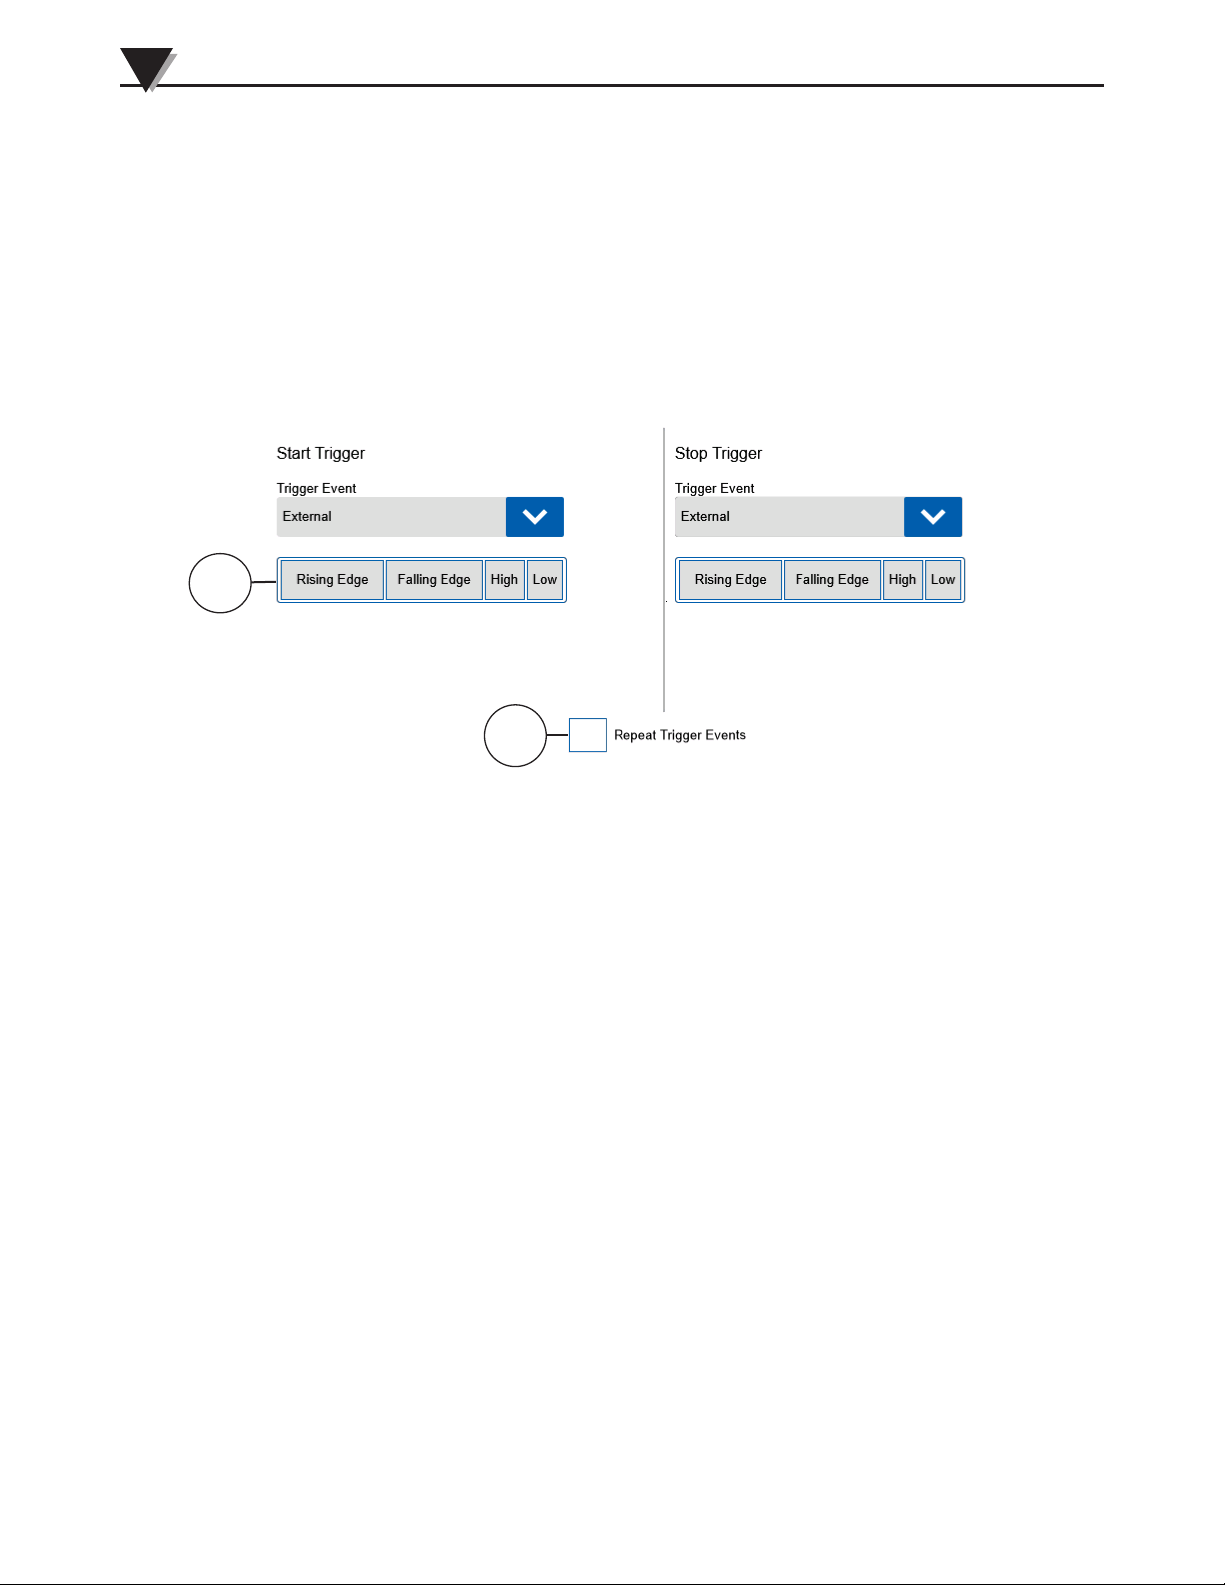
3
Standalone Operation
1
External Trigger Events
This option allows the external trigger input to be used as a start and stop
trigger. The external trigger input can accept signals from 0 to 24 Vdc. The input
threshold voltage is ≥ 2.5 Vdc for a logic high level and ≤ 1.5 Vdc for a logic low
level. There are four detection options which determine when an external trigger
event is generated.
2
Figure 3-30 External Trigger Event
1. External Trigger Detection Options
These options determine when a logging session is triggered by the external
trigger input. For the high and low options, a trigger event is generated
immediately if the trigger condition is met when the Log Data button is
pressed. For the rising and falling edge options, the corresponding edge
transition must be seen on the external trigger input before a logging session
will begin.
2. Repeat Trigger Events
If repeat trigger events are enabled the device will automatically re-arm
itself after the logging session ends. A stop trigger event must be configured
for this to occur.
3-25
Page 49
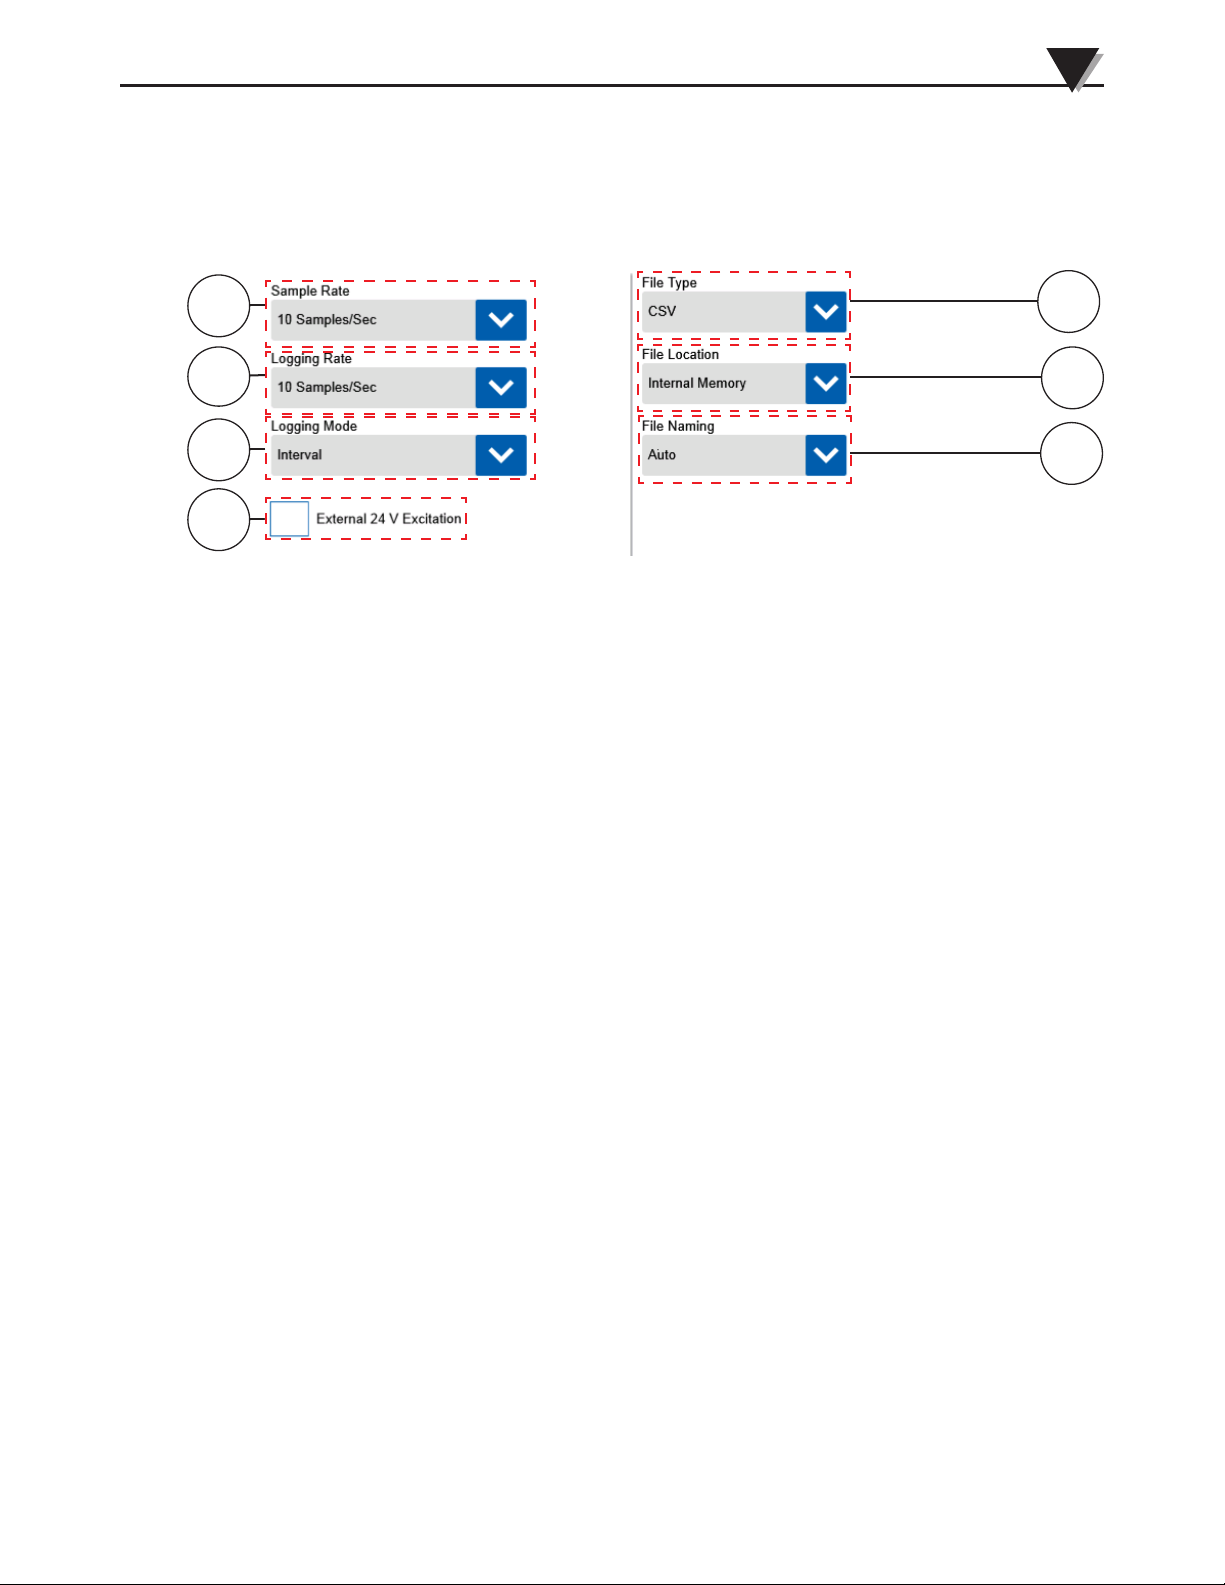
Standalone Operation
3.3.5 Data Session Settings
The Data Session Settings screen is accessible from the settings button on the
home screen toolbar. This screen is where you configure all the settings that
control how data is logged.
3
1
2
3
5
6
7
4
Figure 3-31 Data Session Screen
1. Sample Rate
The sample rate setting determines how often the data logger takes
a reading on each of its inputs and updates its display. The sample
rates available will vary depending on the number and type of sensors
configured.
2. Logging Rate
The logging rate determines how often sampled data is saved to the log file.
Allowable selections are always less than or equal to the sampling rate.
3. Logging Mode
The logging mode determines what data is saved to the log file at each
logging interval. If set to Interval, the most recent data sample is saved in
the log file. If set to Average, all of the data samples taken over the logging
interval are averaged and the average value is saved to the log file.
4. External 24V Excitation
This selection turns on the built in 24 Vdc excitation. This excitation voltage
is available at the alarm/excitation terminal block on pins 7 & 8. This
voltage can power one external transmitter.
5. File Type
Data session logs can be saved as either CSV or text files.
6. File Location
The file location setting determines which memory location log files are
saved to. In addition, any screenshots will be saved in the same location.
7. File Naming
This setting determines if the system generates log file names automatically
or the user enters a name. Auto generated file names have the OM-DAQXL_
(MM_DD_YYYY HH_MM_SS_AM/PM). The manual file naming option
allows the user to enter a prefix for all log files which will be followed by the
same date and time stamp as the automatic setting.
3-26
Page 50
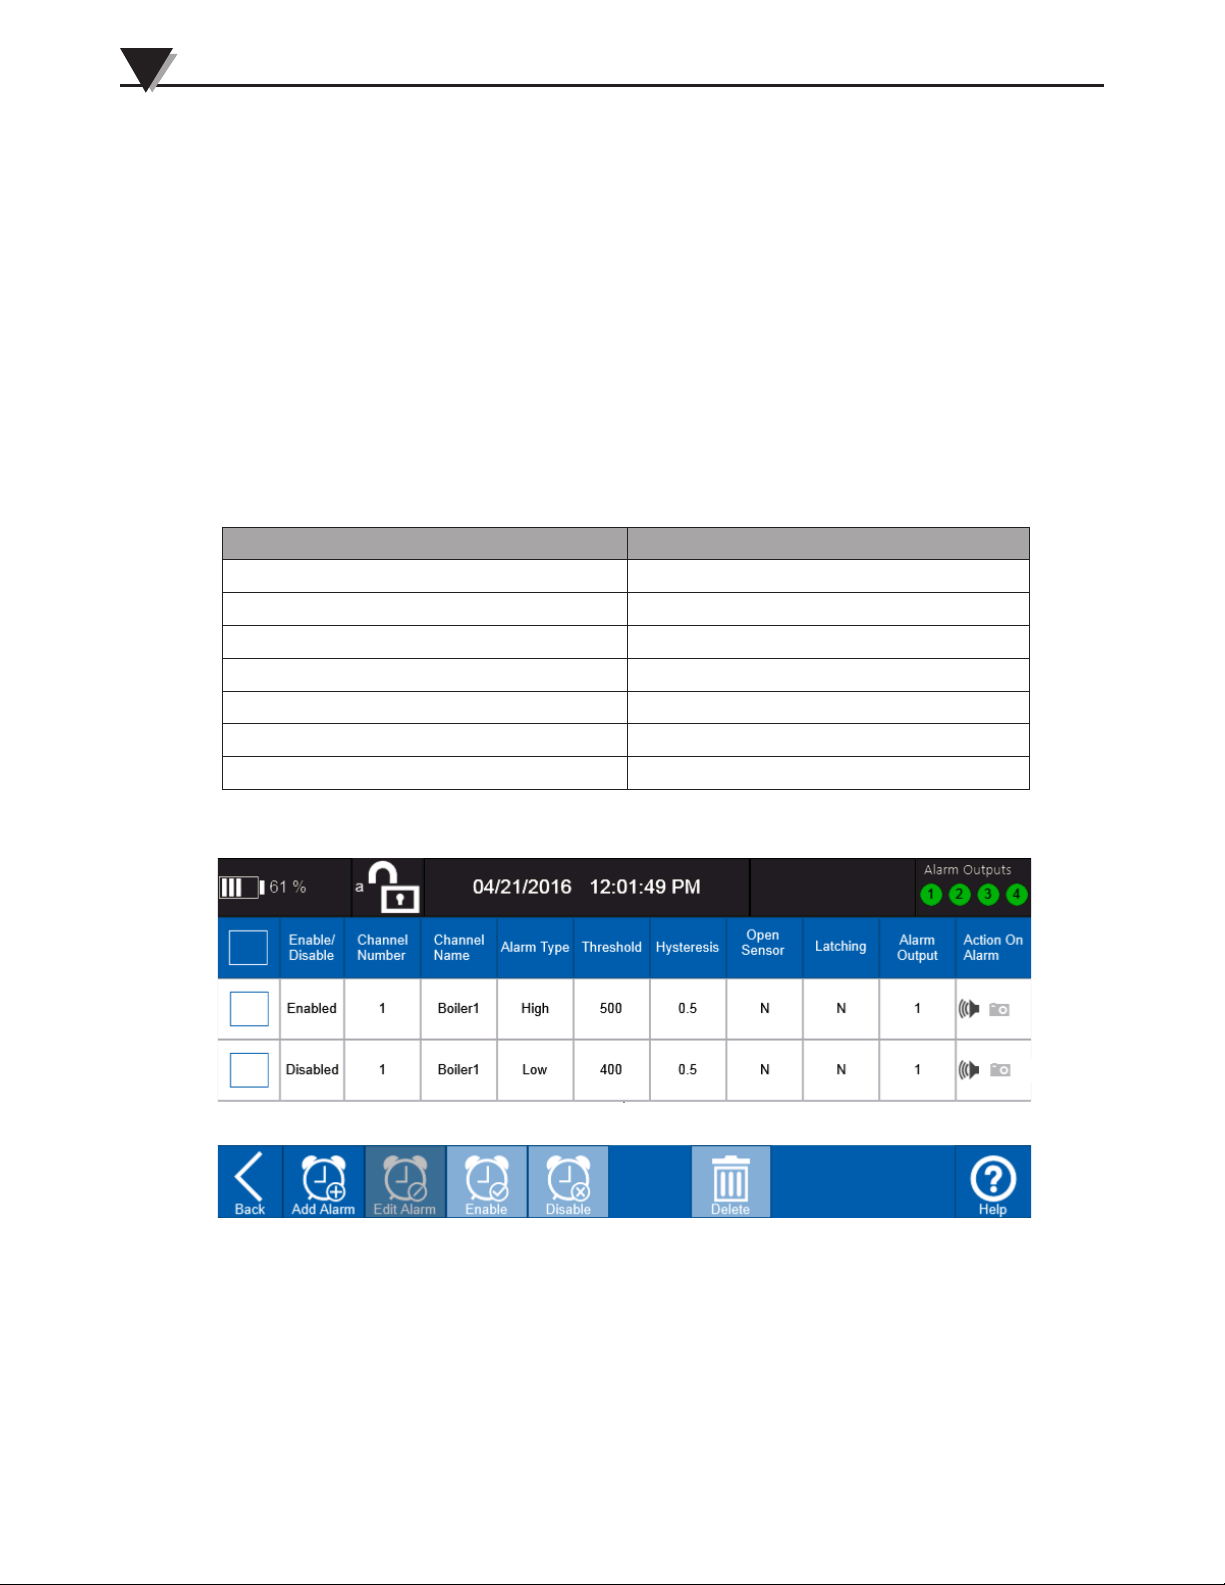
3
Standalone Operation
2 alarms mapped to one alarm output Orange
3.3.6 Alarms Settings
Alarms can be generated when the measured/calculated value meets an alarm
condition. If an alarm is mapped to one of the four physical alarm outputs, the
alarm status indicator will display the alarm condition. When in alarm condition
the status indicator for the corresponding alarm output changes color as shown
in the following table. In addition, an alarm signal (open collector) is delivered to
the alarm output terminal block and the digital I/O connector on the left side of
the OM-DAQXL. Alarm Settings are accessible through the settings button of the
home screen toolbar. There are two screens associated with the alarms settings,
the main alarm screen and the add/edit alarm screen.
Main Alarm Screen
The main alarm screen shows all of the currently configured alarms in a table
format. From this screen you can perform various task including adding new
alarms, editing existing alarms, enabling or disabling alarms and deleting
alarms.
Alarm Type Alarm Status Indicator-Color
High Red
Low Blue
Window Out Red
Window In Blue
Open Sensor Purple
Latched Alarm Flashing
Table 3-1 Alarm Type/Status Indicator Color.
Alarm
Table
Alarm
Toolbar
Alarm
Status
Figure 3-32 Main Alarm Screen
Alarm Status
Shows the current status of the alarm outputs. A single tap on this icon will
invoke the Show Alarm fly-out menu.
Alarm Table
The alarm table provides a quick view of all of the currently configured alarms
and their settings. Alarms can be selected for editing or deletion using the
checkboxes in the leftmost column of the table.
3-27
Page 51
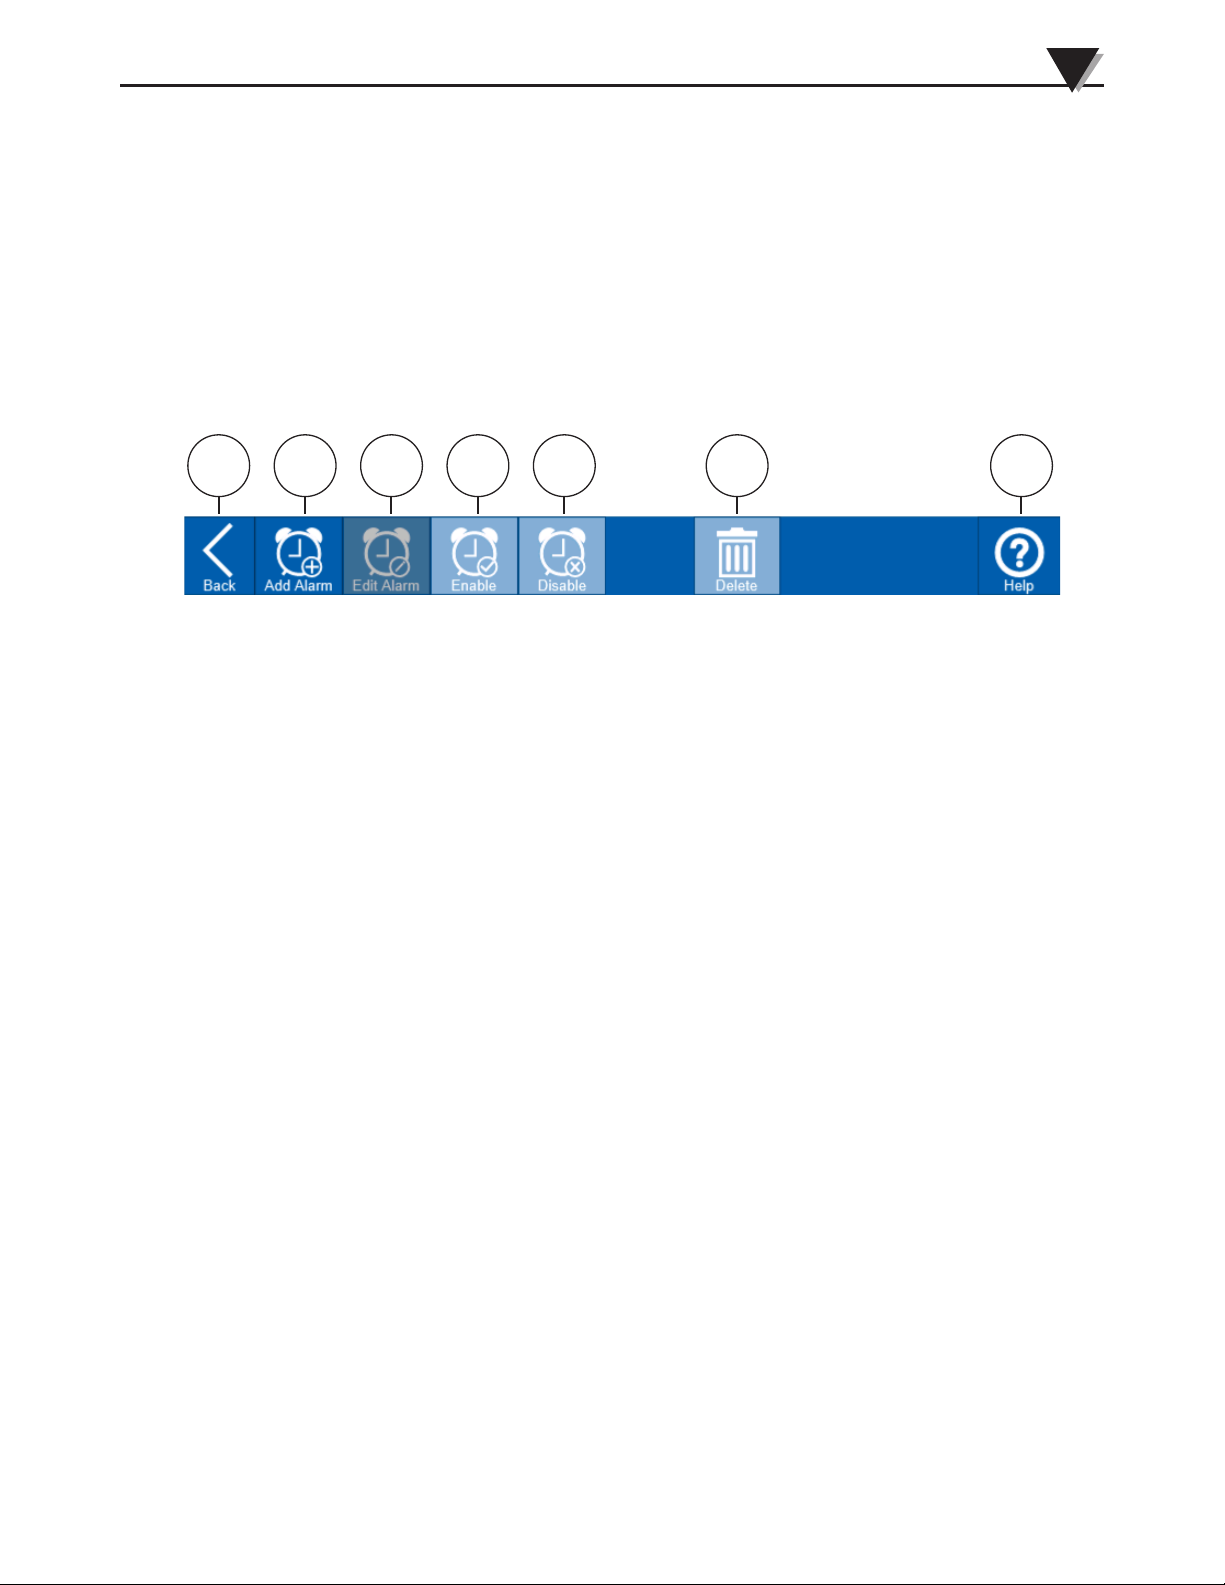
Standalone Operation
Alarm Toolbar
The alarm toolbar features buttons for performing all of the actions related to
alarm settings.
1 2 3 4 5 6 7
Figure 3-33 Alarm Toolbar
3
1. Back
Returns to the home screen.
2. Add Alarm
The Add Alarm button takes you to the screen where new alarms are set up.
Several settings can be configured to determine when alarms are generated
and what actions the data logger performs in response to those alarms.
3. Edit Alarm
Returns to the alarm setup screen allowing change to be made to a
previously configured alarm. This options is only available when a single
alarm is selected from the table.
4. Enable
Enables any alarms currently selected in the alarm table. Alarms must be
enabled before their settings become active and will generate an alarm.
5. Disable
Disables any alarms currently selected in the alarm table. If an alarm is
disabled, no alarm will be generated even if its alarm conditions are met.
6. Delete
Deletes any alarms currently selected in the alarm table. A confirmation will
be required before alarms are deleted.
7. Help
Provides context-sensitive help based on the current screen.
3-28
Page 52
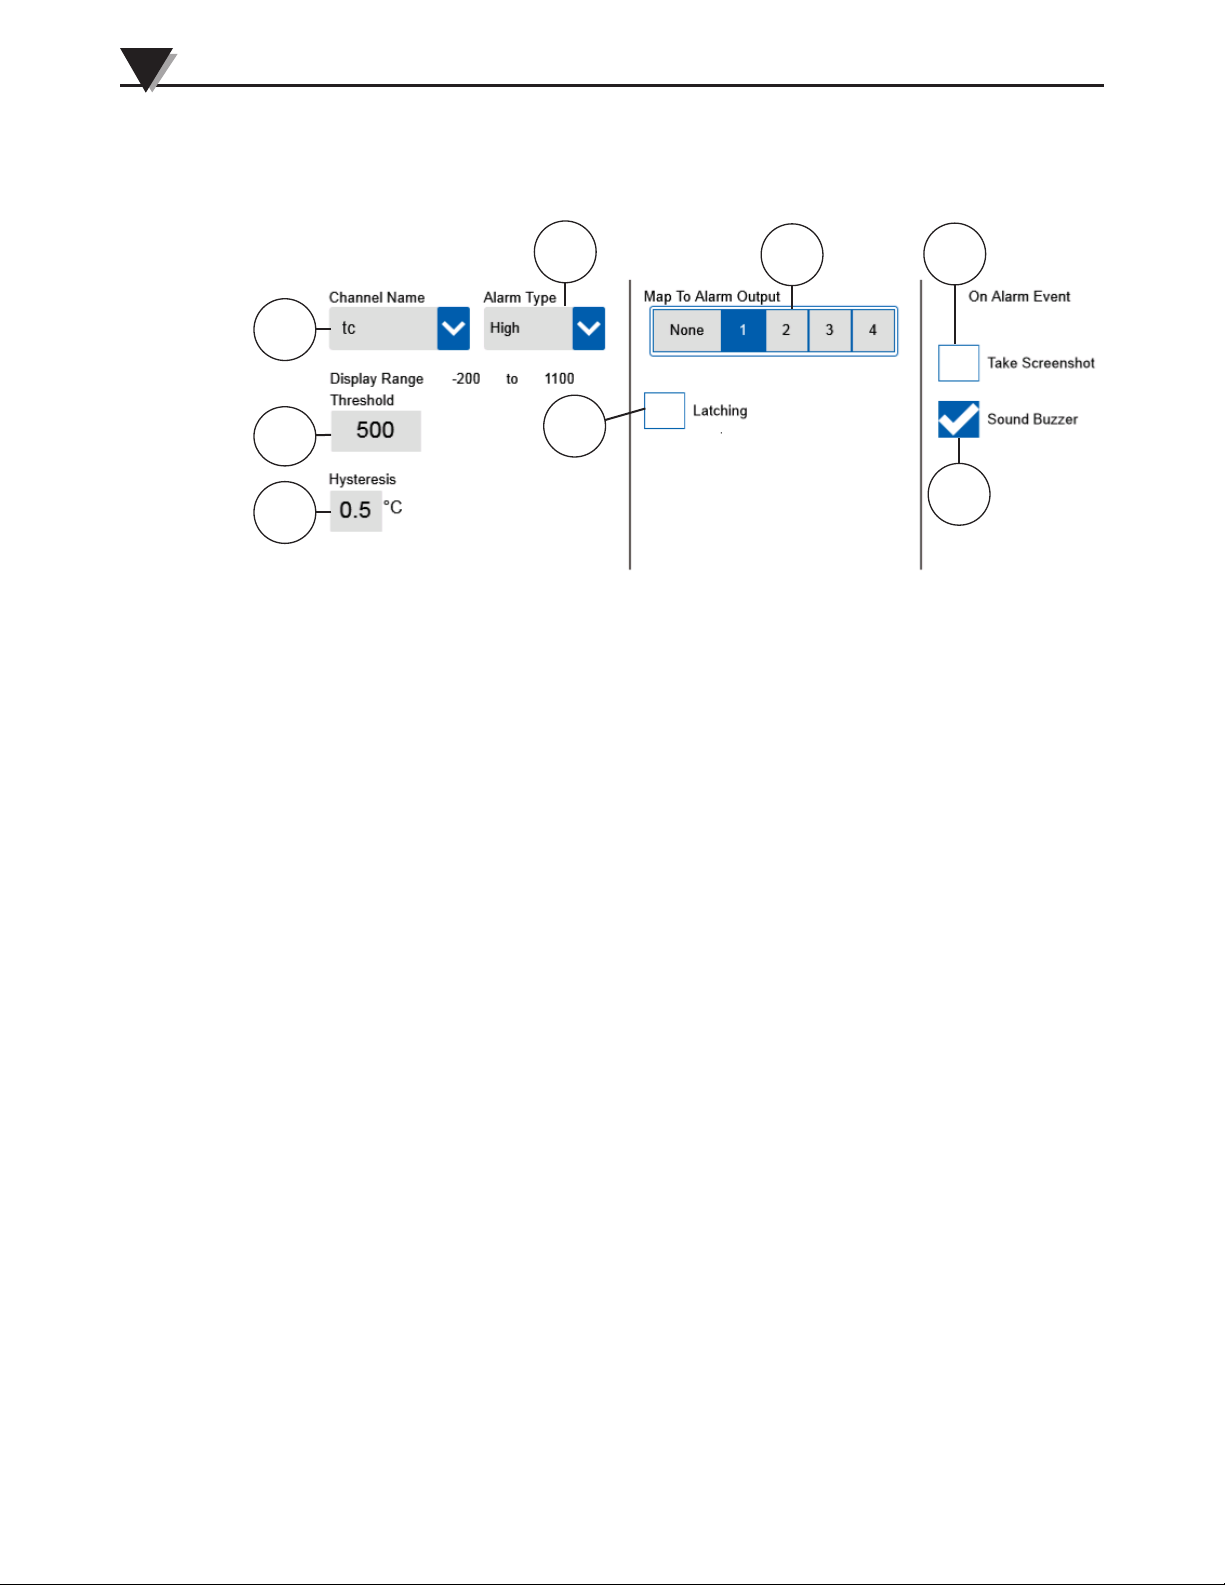
3
Standalone Operation
Add/Edit Alarm Screen
The add/edit alarm screen is where alarm settings are configured. Here you can
select the type of alarm you wish to create and also the actions the data logger
will take when an alarm occurs.
2
5
7
1
3
6
8
4
Figure 3-34 Add/Edit Alarm Screen
1. Channel Name - This drop down list is used to select the channel which you
would like to configure and alarm. Up to two alarms can be configured for
each channel.
2. Alarm Type - The alarm type drop down list is used to select from
High, Low, Window In and Window Out, and Open Sensor type alarms.
For window alarms there will be both a high and low threshold value
configured. Window In alarms will be generated when the process value is
within the window set by the two thresholds and Window Out alarms will
be generated when the process value is outside that window.
3. Threshold Value - The threshold value sets the limit at which, when
exceeded, an alarm will be generated.
4. Hysteresis - The hysteresis setting determines the difference between the
alarm threshold value and the value at which the alarm will be deactivated.
It is always in the same engineering units as the channel for which the alarm
is being configured.
5. Alarm Output - The alarm output setting maps the alarm to one of the four
physical alarm outputs. This allows an alarm control an external event such
as sounding a buzzer, turning on a warning light or relay.
6. Latching - The latching setting determines the action taken once an alarm
condition has cleared. Normally an alarm will deactivate when the alarm
condition has cleared based on the hysteresis value set. When latching is
selected and alarm will not deactivate until the user manually disables by
selecting it in the alarm table and pressing the disable button on the alarm
toolbar.
7. Screenshot - The screenshot setting will take a screenshot of the current
display when an alarm condition is met and saves it to the same memory
location selected for the logging session files.
8. Buzzer - The buzzer setting allows the internal buzzer to be used when an
alarm condition is met. There are two distinct tones used to distinguish the
two alarms for each channel.
3-29
Page 53
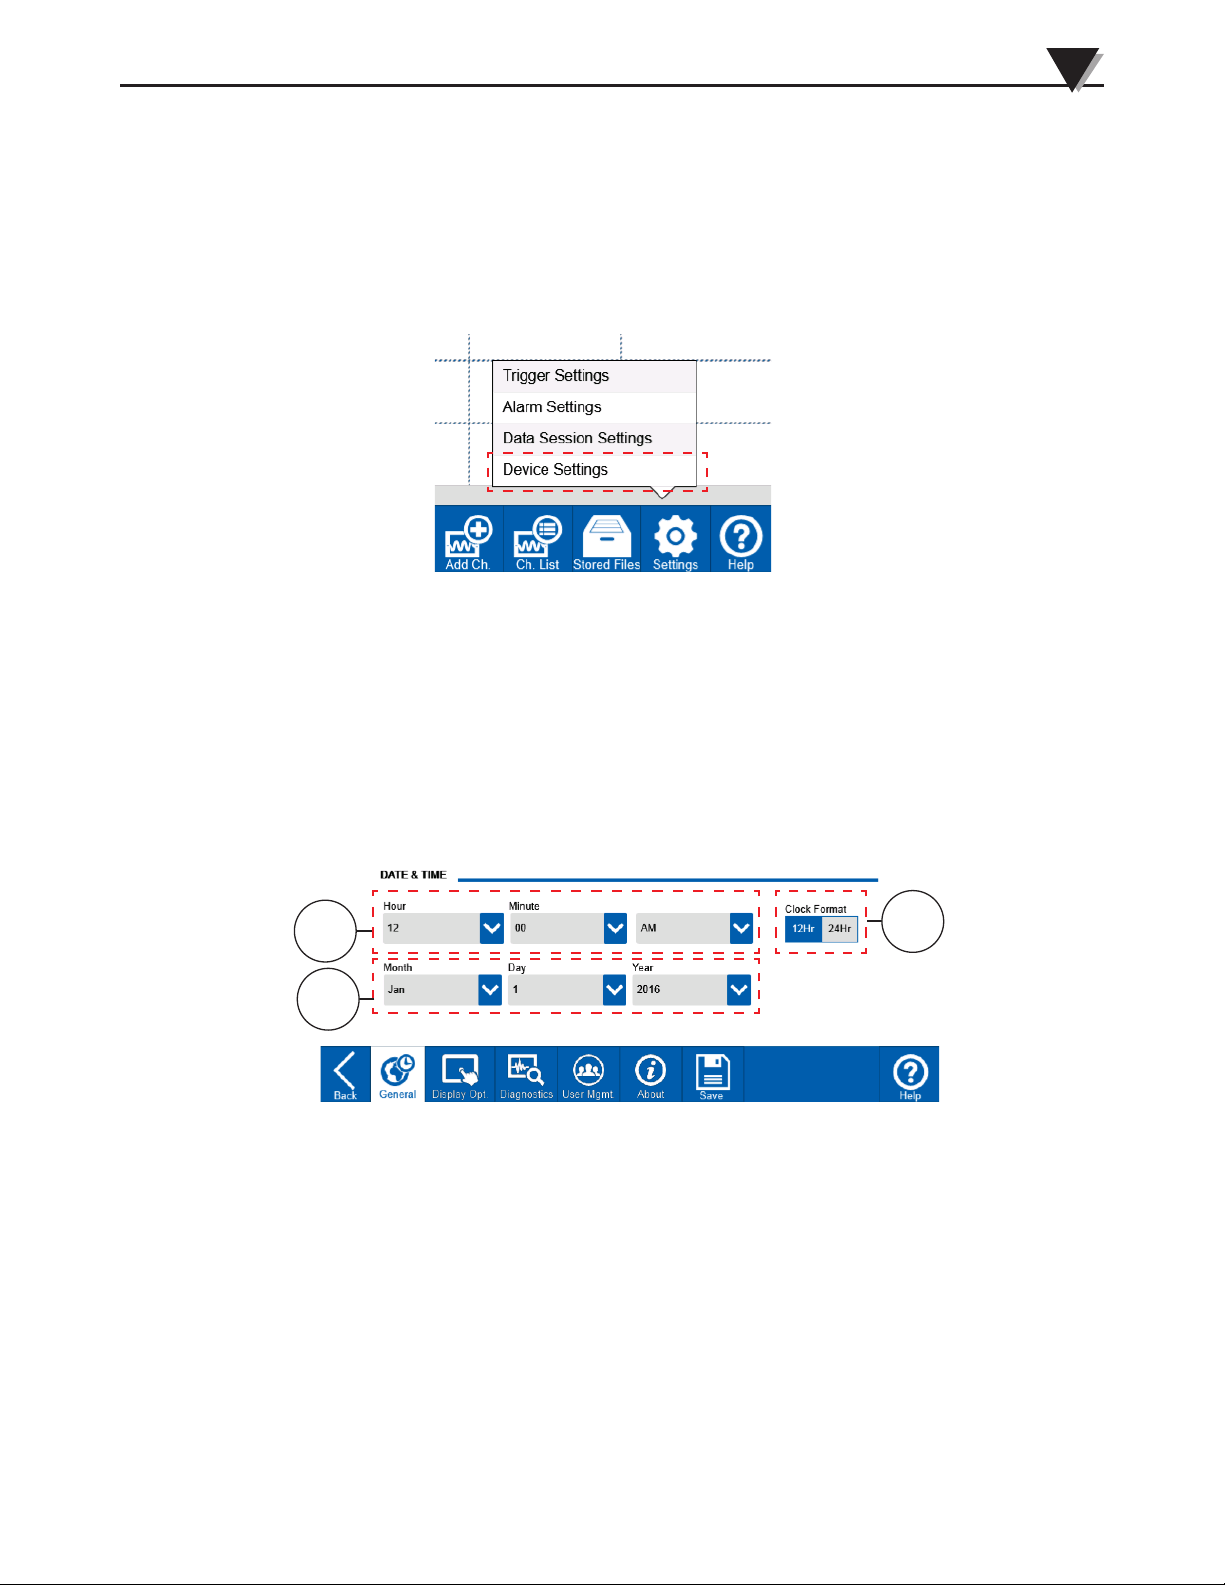
Standalone Operation
3.3.7 Device Settings
The device settings are five different screens which allow you to configure
the way your device looks and works in addition to setting the date & time,
managing users, running diagnostics and performing firmware updates. The
device settings screens are accessible through the settings button of the home
screen toolbar.
Figure 3-35 Device Settings
3
After selecting device settings from the settings fly-out menu, you will navigate
to the settings menus. By default the General settings screen is shown and
additional device settings screens are available through the toolbar buttons.
General/Data and Time
The General settings screen is where you set the system date & time. Use the
drop down menus to select the appropriate values for each field. You can also
select a clock format.
1
3
2
Figure 3-36 General Settings Screen
1. Time
Use these three drop down menus to set the system time for the data logger.
2. Date
Use these three drop down menus to set the system date for the data logger.
3. Clock Format
Use the clock format buttons to select 12 or 24 hour time format.
NOTE: You must press the save button to save the new data and time.
3-30
Page 54
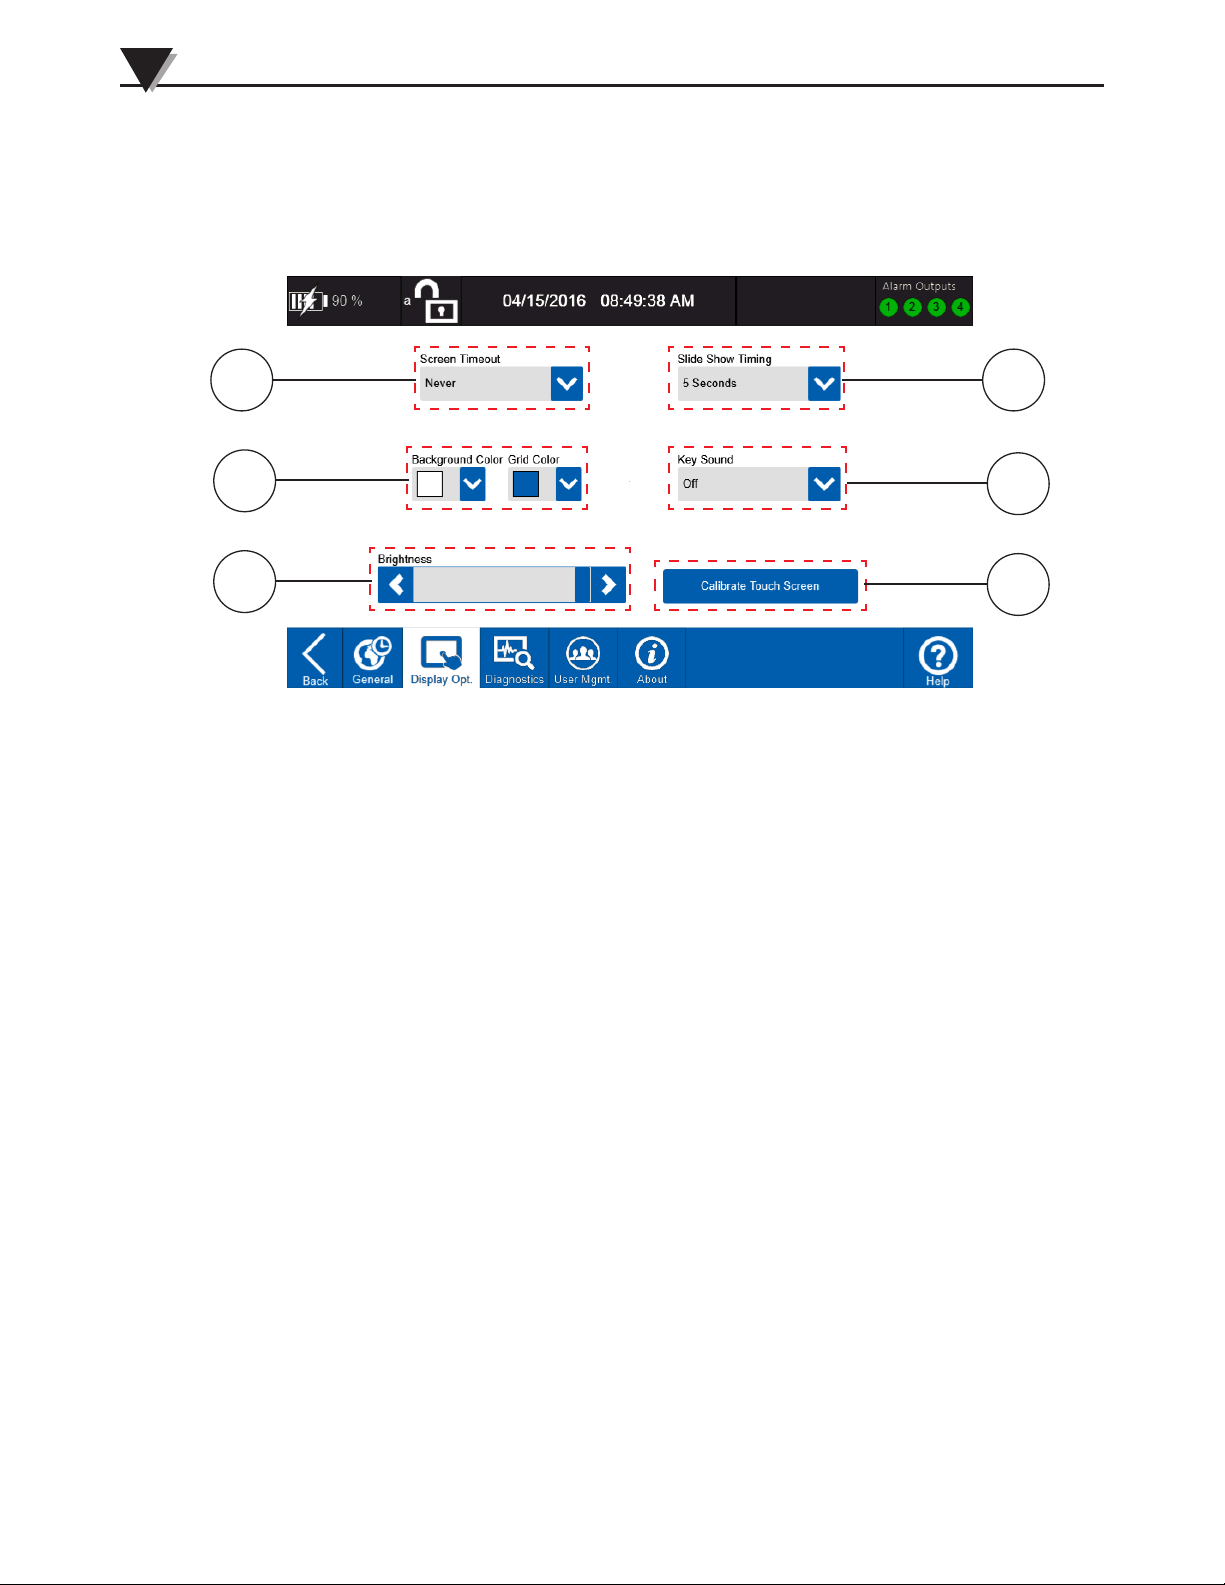
3
Standalone Operation
1 4
Display Options
The Display Options screen is where you can make changes to the settings
related to the 7” touch screen in addition to settings for the color scheme and
other user interface related settings.
2
3
Figure 3-37 Display Options Screen
1. Screen Timeout
When operating on battery power this setting determines how long the
display will stay on after the last user interaction. After this time period
the display will shut off to conserve battery life. The current user will also
be logged out. Within the first 5 minutes after the display is turned off, the
user can turn the display on and get back to Login screen by touching the
screen or pressing the Home button. After the 5 minute period without user
interaction the data logger will automatically power off. The device can be
restarted by cycling the power switch.
When an AC adapter is connected the screen will remain on, but the current
user will still be logged out and the login screen will be displayed. Any data
logging sessions under way or awaiting a trigger will proceed as normal.
2. Background and Grid Color
These options set the background color for the menu screens and the grid
color for the Waveform views.
5
6
3-31
3. Brightness
This slider sets the display brightness. Using a reduce brightness can
increase battery life.
4. Slide Show Timing
This setting controls the amount of time each channel group is displayed
when the slide show options is enabled in the views fly-out menu.
5. Key Sound
This setting allows you to select a number of different feedback sounds
to provide additional indication that a touch input on the display was
detected.
6. Calibrate Touch Screen
Occasionally the touch screen may need to be calibrated to ensure more
accurate detection of touch inputs. This button allows you to run a
calibration routine for the touch screen.
Page 55
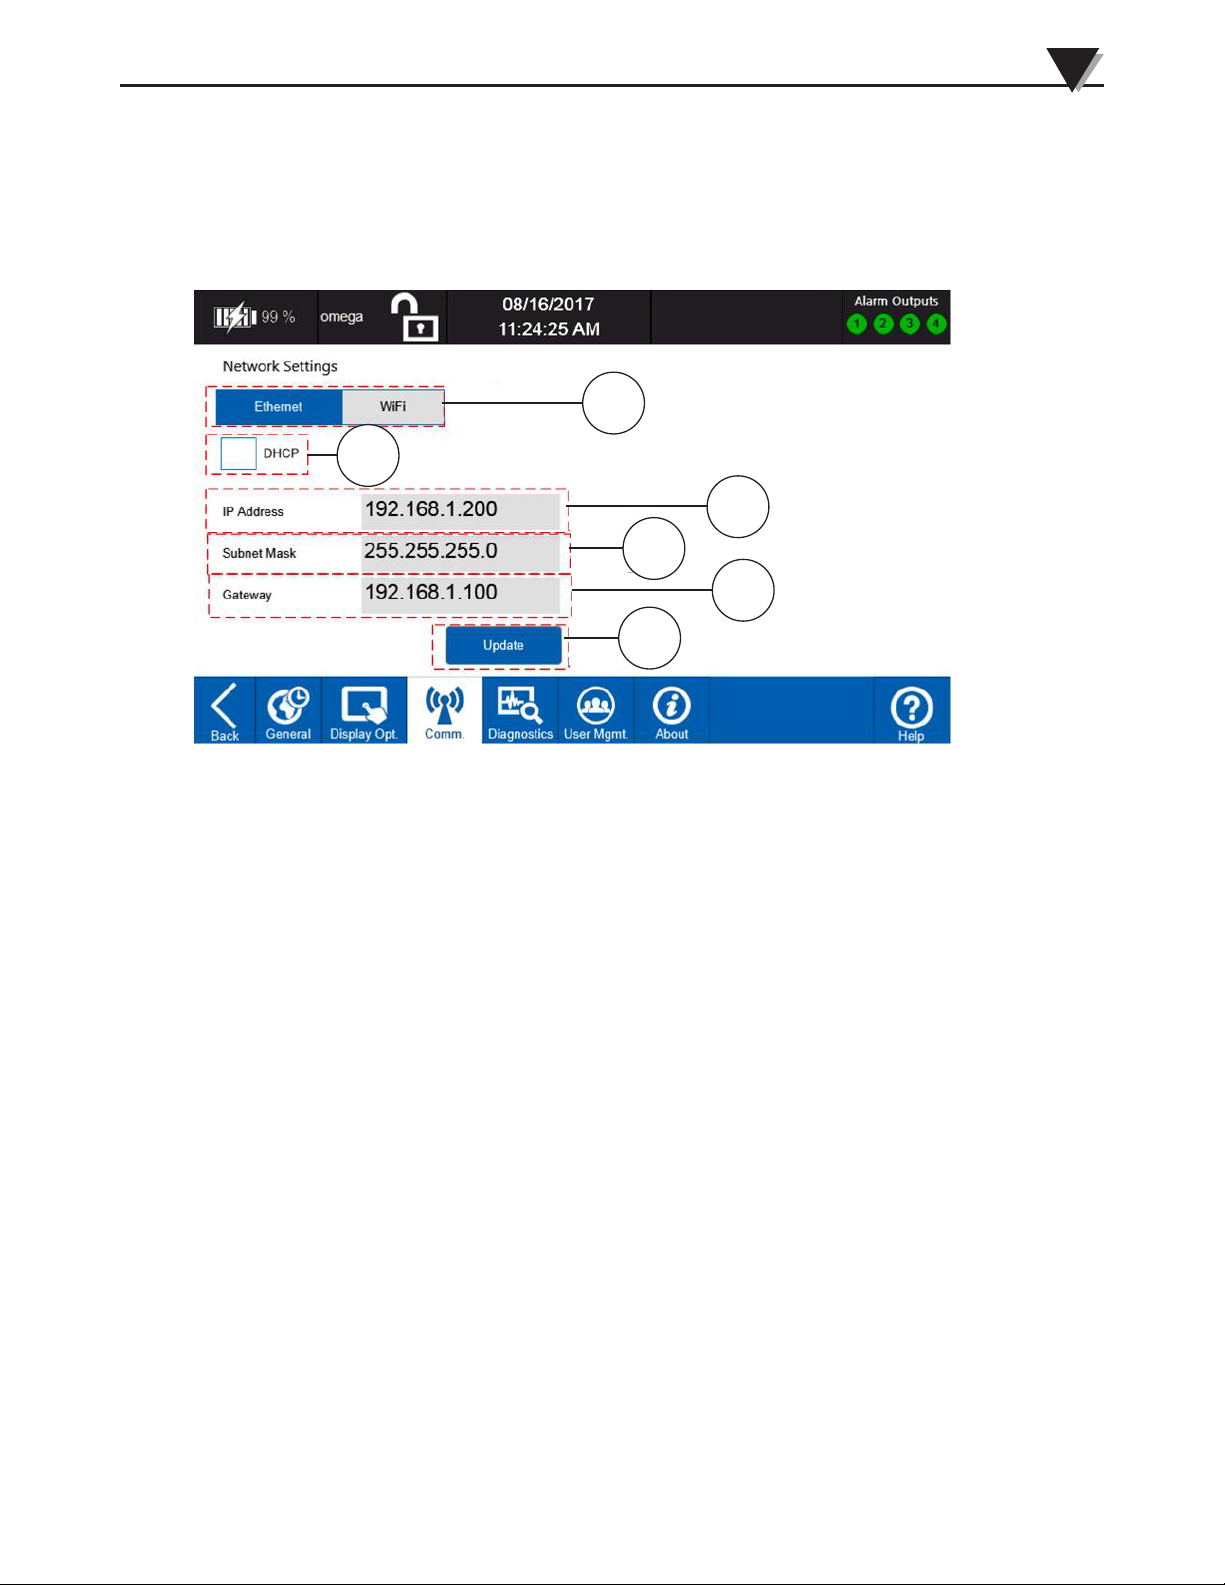
Standalone Operation
Communication Settings (if applicable)
If you purchased a model 3 or 4 data logger, your tool bar will have a communications
settings button. The Comm settings screen is where you can configure the Ethernet or
optional WiFi communication settings.
3
1
2
3
4
5
6
Figure 3-38 Comm Settings – Ethernet
1. Connection Selection
This button is used to select the network adapter. The settings for the currently
selected network adapter will be shown below.
2
. DHCP
This checkbox is used to enable or disable DHCP for the currently selected
network adapter. DHCP Dynamic Host Configuration Protocol (DHCP) is a
client/server protocol that automatically provides an Internet Protocol (IP) host
with its IP address and other related configuration information such as the subnet
mask and default gateway.
3. IP Address
If DHCP is checked the DHCP assigned IP address is shown for the selec
adapter. If DHCP is not checked, a static IP address can be entered using the
keypad.
4. Subnet Mask
If DHCP is checked the DHCP assigned subnet mask is shown for the selected
adapter. If DHCP is not checked, a subnet mask can be entered using the keypad.
5. Gateway
6. If DHCP is checked the DHCP assigned gateway IP is shown for the selected
adapter. If DHCP is not checked, a gateway IP can be entered using the keyp
7. Update
After configuring the settings, hit the update button to apply the settings to the
selected network adapter.
ted
ad.
3-32
Page 56
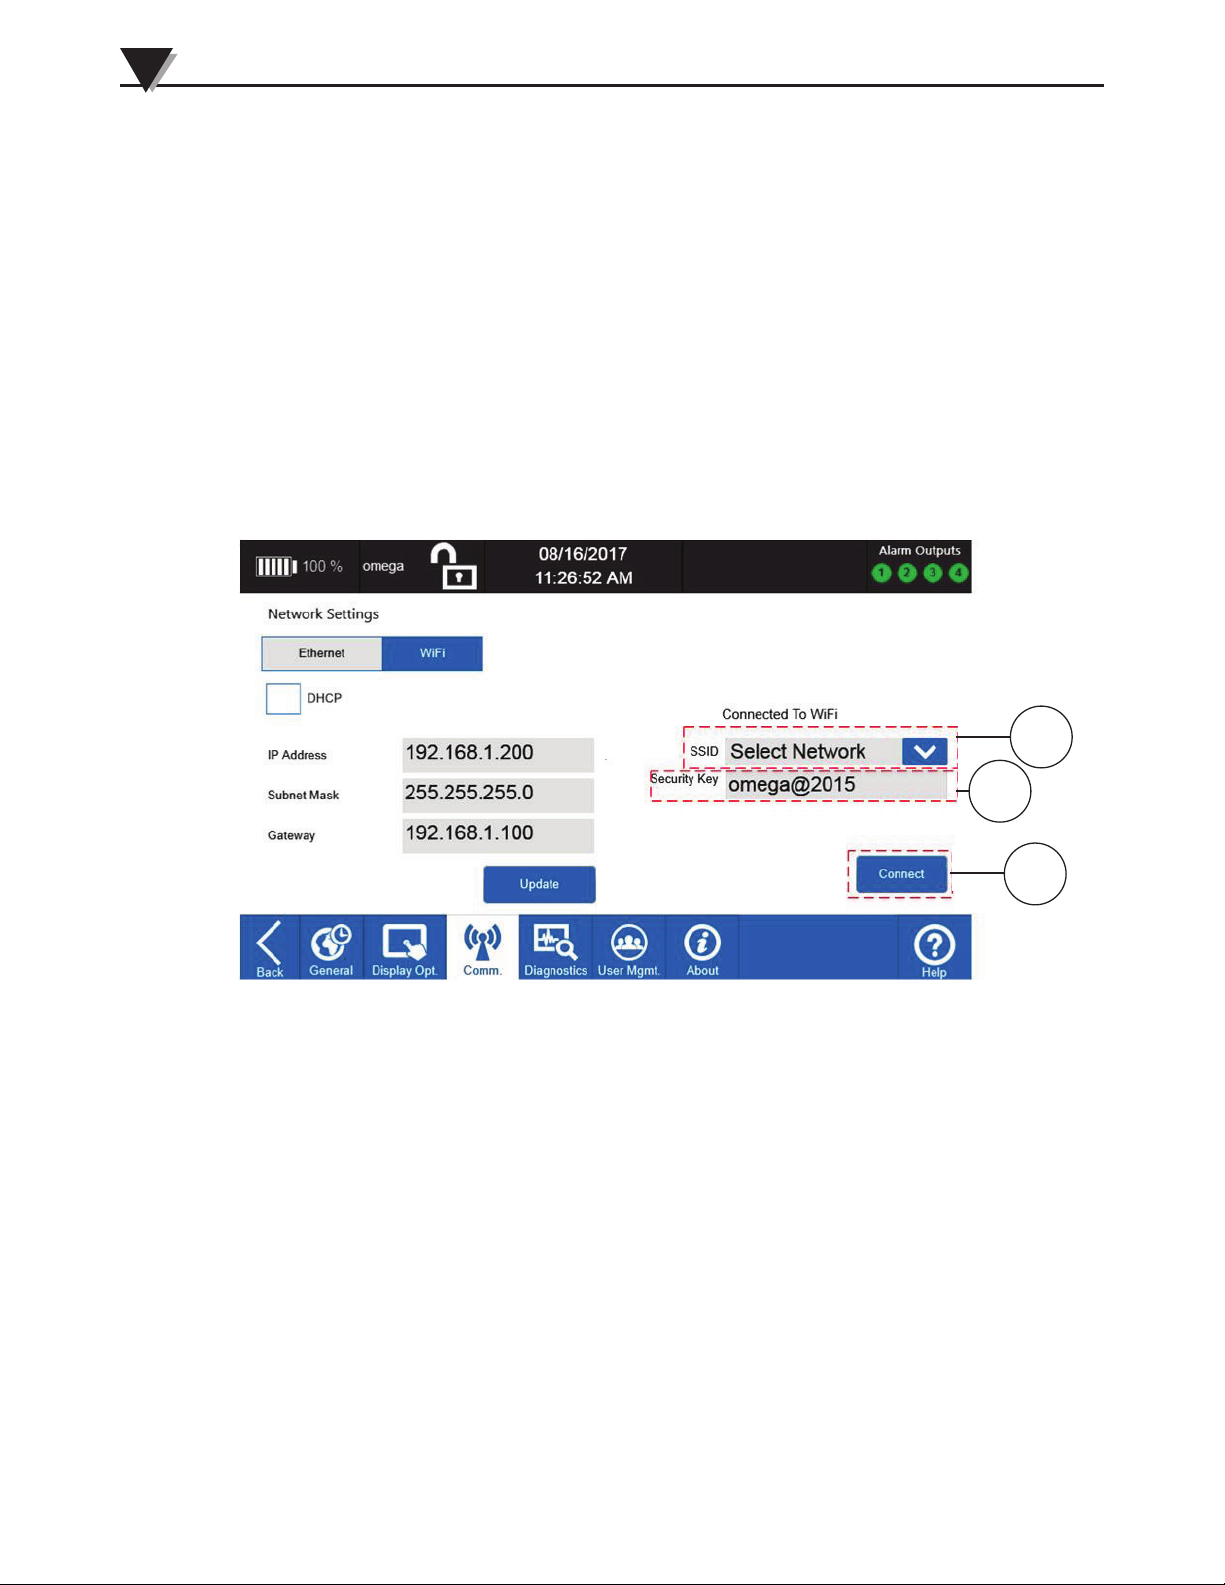
3
Standalone Operation
8
Figure 3-39 Comm Settings - WiFi
7. SSID – Select Network
This dropdown selection will show all of the WiFi networks within range.
8. Security Key
Enter the passphrase or security key for the selected network. If it is an open network,
leave this field blank.
9. Connect
Hit the connect button to connect to the selected network.
7
9
3-33
Page 57
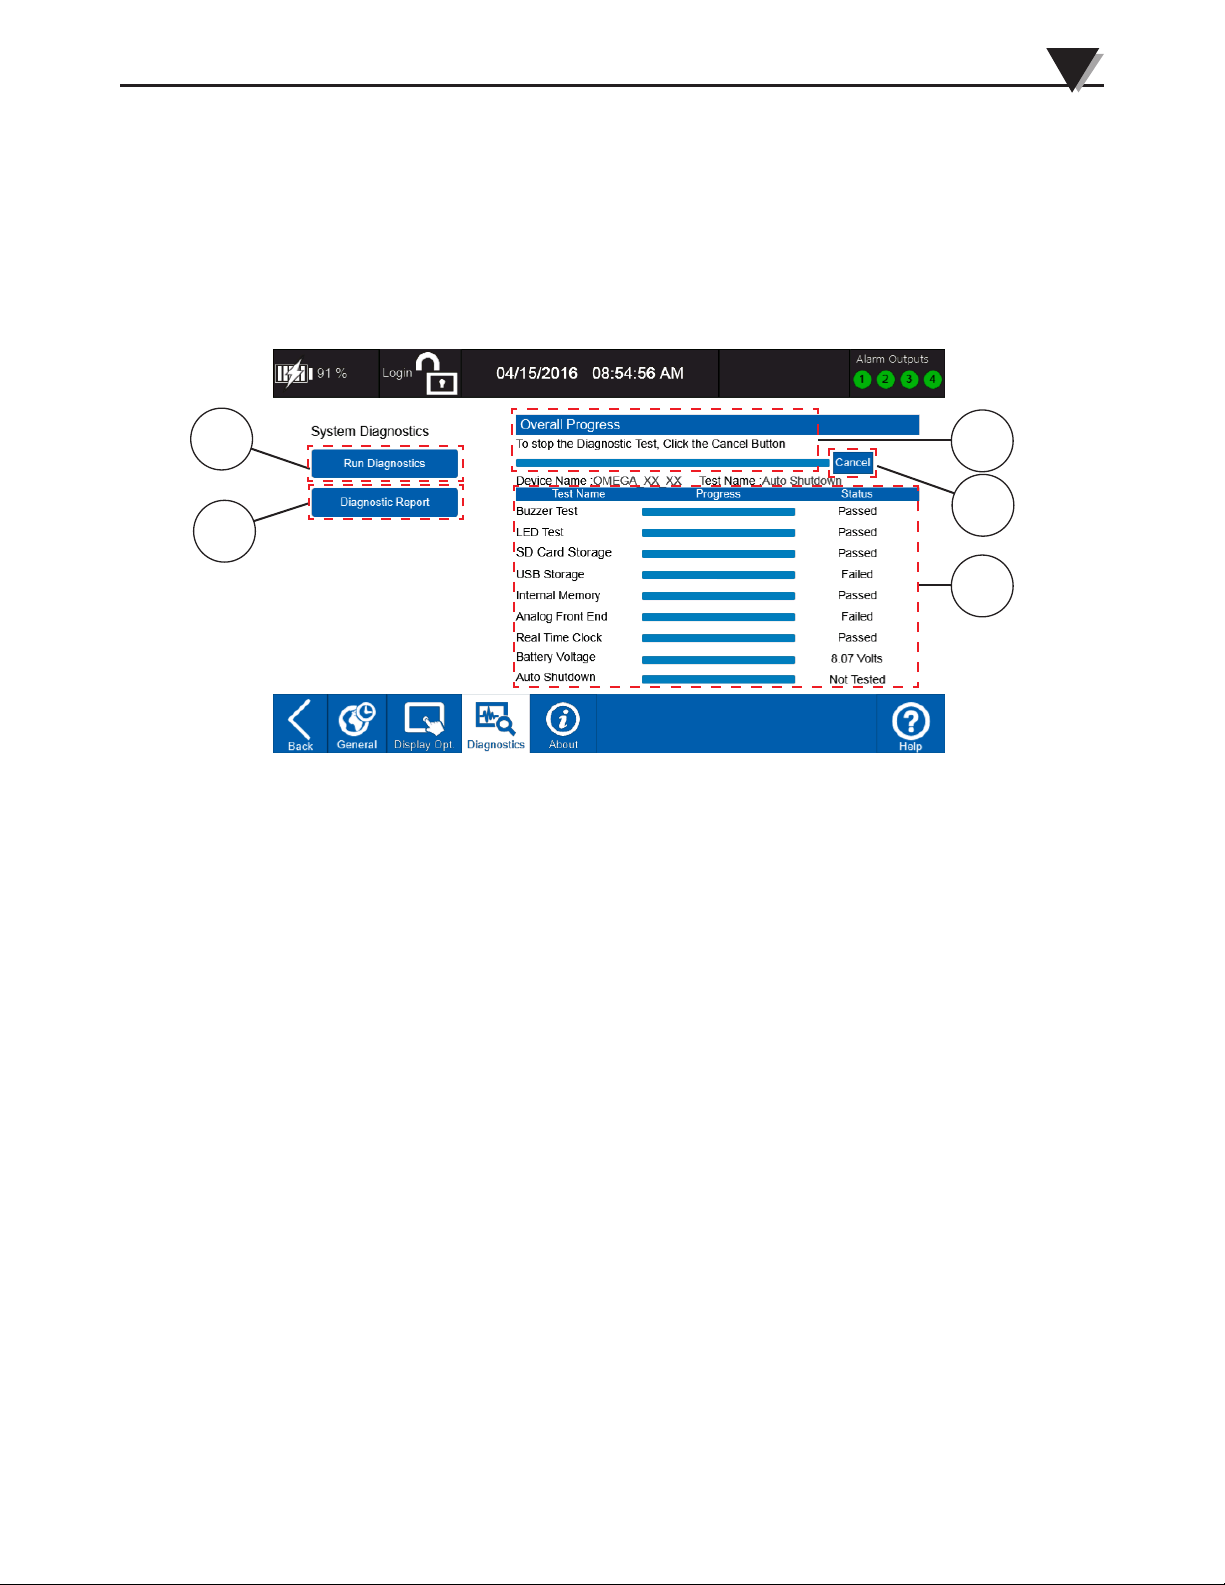
Standalone Operation
Diagnostics
The diagnostics screen is where you can run the built in diagnostics routine and
view reports from previous diagnostic runs. The diagnostic routine will run
several tests on the various sub-systems of the data logger and provide a status
indication for each test. At the end, you can perform the Power shut down test
(Optional) which will require recycling power to the unit.
3
1
3
4
2
5
Figure 3-40 Device Settings Diagnostics Screen
1. Run Diagnostics
This button runs the system diagnostics tests.
2. Diagnostic Report
Hitting this button will display a report of the most recent diagnostics
results.
3. Overall Progress Bar
This progress bar shows the progress of the overall system diagnostics
currently being run.
3-34
4. Cancel Button
Hitting this button will cancel the current system diagnostics run.
5. Test Information
This table shows the progress of each test as it is being run as well as the
status and result of the test.
Page 58
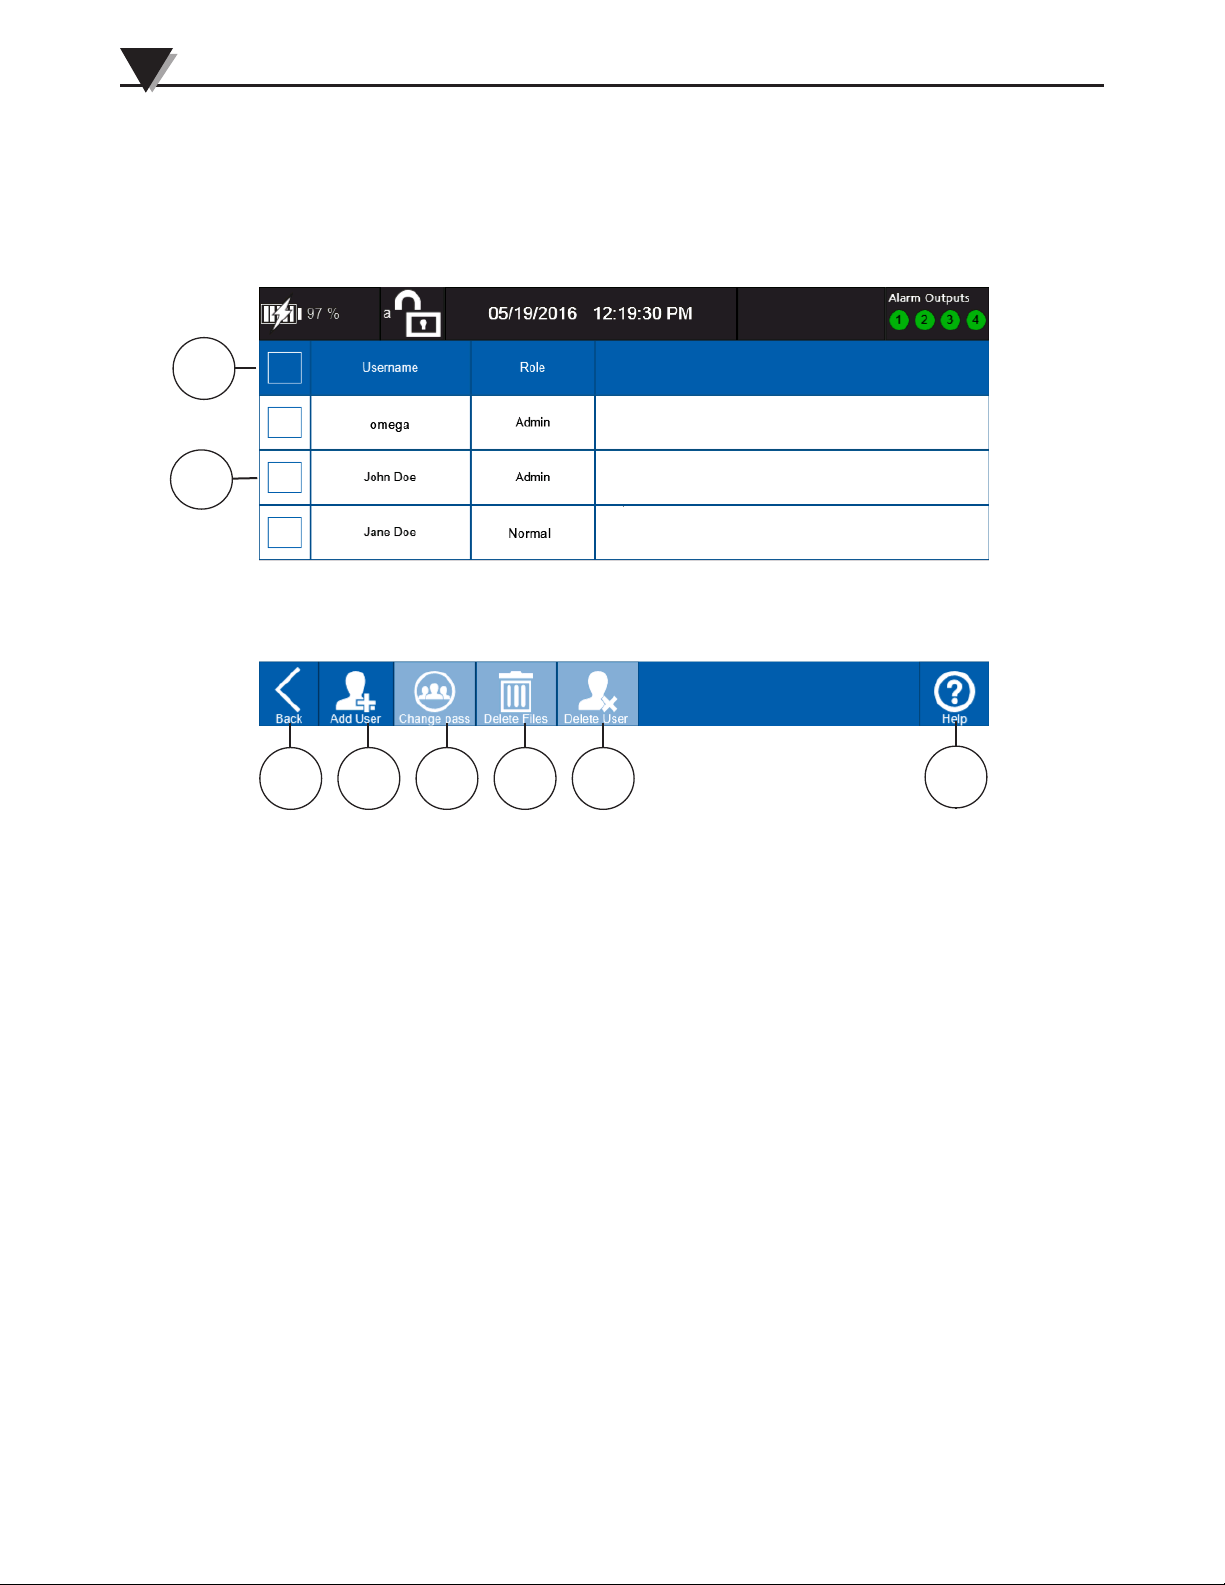
3
Standalone Operation
1
2
User Management
All settings related to user accounts are accessible from the user management
screen. The user management setting screens are only available for Admin users.
3 4 5 6 7
Figure 3-41 User Management Screen
1. Table Header
Indicates the type of information in each column of the user table.
2. User Table
Provides a list of all the current user accounts set up on the data logger.
3. Back
This button returns to the General settings screen of the device settings.
4. Add User
This button navigates to the Add User screen to allow a new user account to
be created.
5. Change Password
This button navigates to the Change Password screen. Here the user can
enter a new password.
6. Delete Files
This button will delete all of the configuration file for the currently selected
users.
7. Delete User
This button will permanently delete the currently selected user accounts.
Only Admin users can delete or add users.
8
3-35
8. Help
Provide context sensitive help information.
Page 59
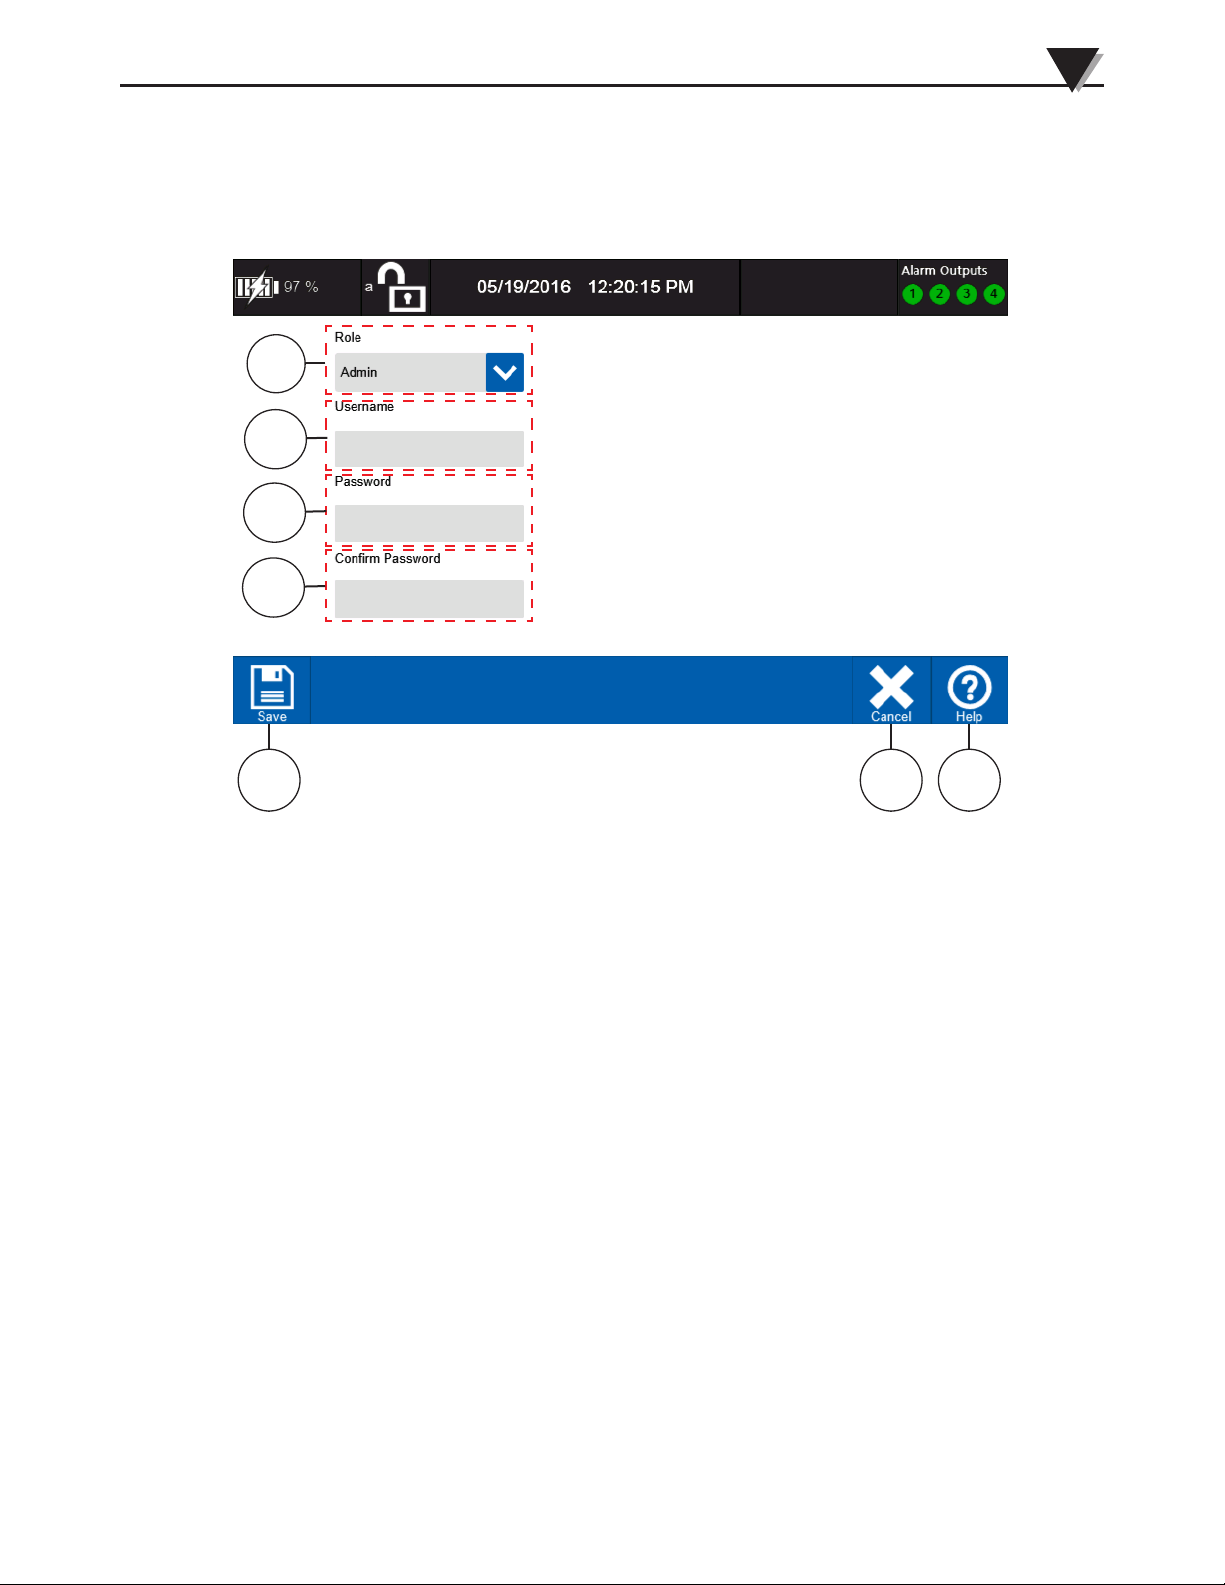
Standalone Operation
Add User
This screen is where new user accounts can be added to the data logger.
1
2
3
4
3
5 6 7
Figure 3-42 Add User
1. User Role
Here you can assign new user a role of either Admin or Normal. Admin
users have the ability to create or delete new users or their files. Normal
users only have access to their own files.
2. Username
The name assigned to the new user account. Username’s must be between 4
and 10 characters in length.
3. Password
The password for the new user account. Passwords must be between 4 and
10 characters in length.
4. Confirm Password
Re-enter the password for the new user account. It must match the
password entered in the previous field.
5. Save
Saves the new user account.
6. Cancel
Cancels new user account creation and returns to the User Management
screen.
7. Help
Provides context sensitive help information about the current screen.
3-36
Page 60
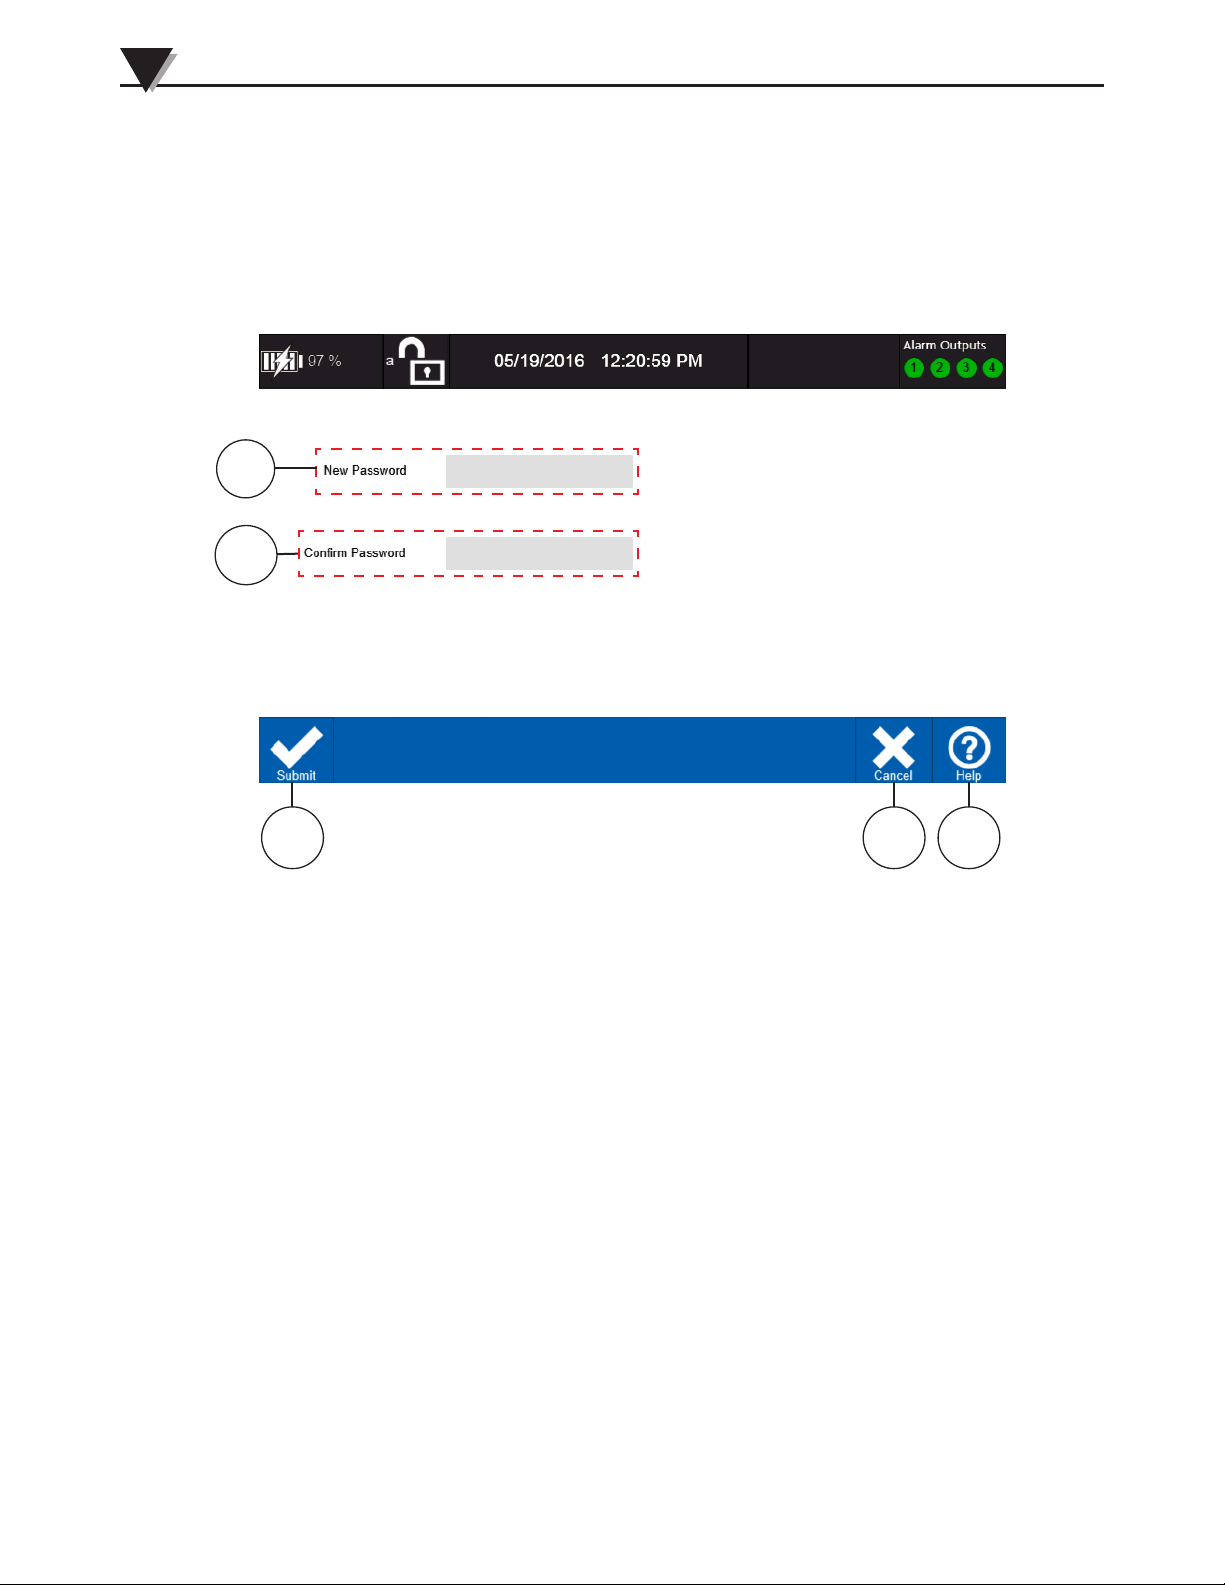
3
Standalone Operation
1
2
Change Password
This screen is where you can change the password for any user. Normal users
can change their password from using the change password option in the status
bar fly-out menu.
3 4 5
Figure 3-43 Change Password Screen
1. New Password
Enter the new password for the user account. Password must be between
4 to 10 characters in length.
2. Confirm Password
Enter the same password as the previous field.
3. Submit
Submit and save the new password.
4. Cancel
Return to the User Management screen without saving the new password.
5. Help
Provides context sensitive help for the current screen.
Note: omega Admin user can not be deleted.
Only Admin users can add or delete users.
Guest users do not require any Password.
3-37
Page 61
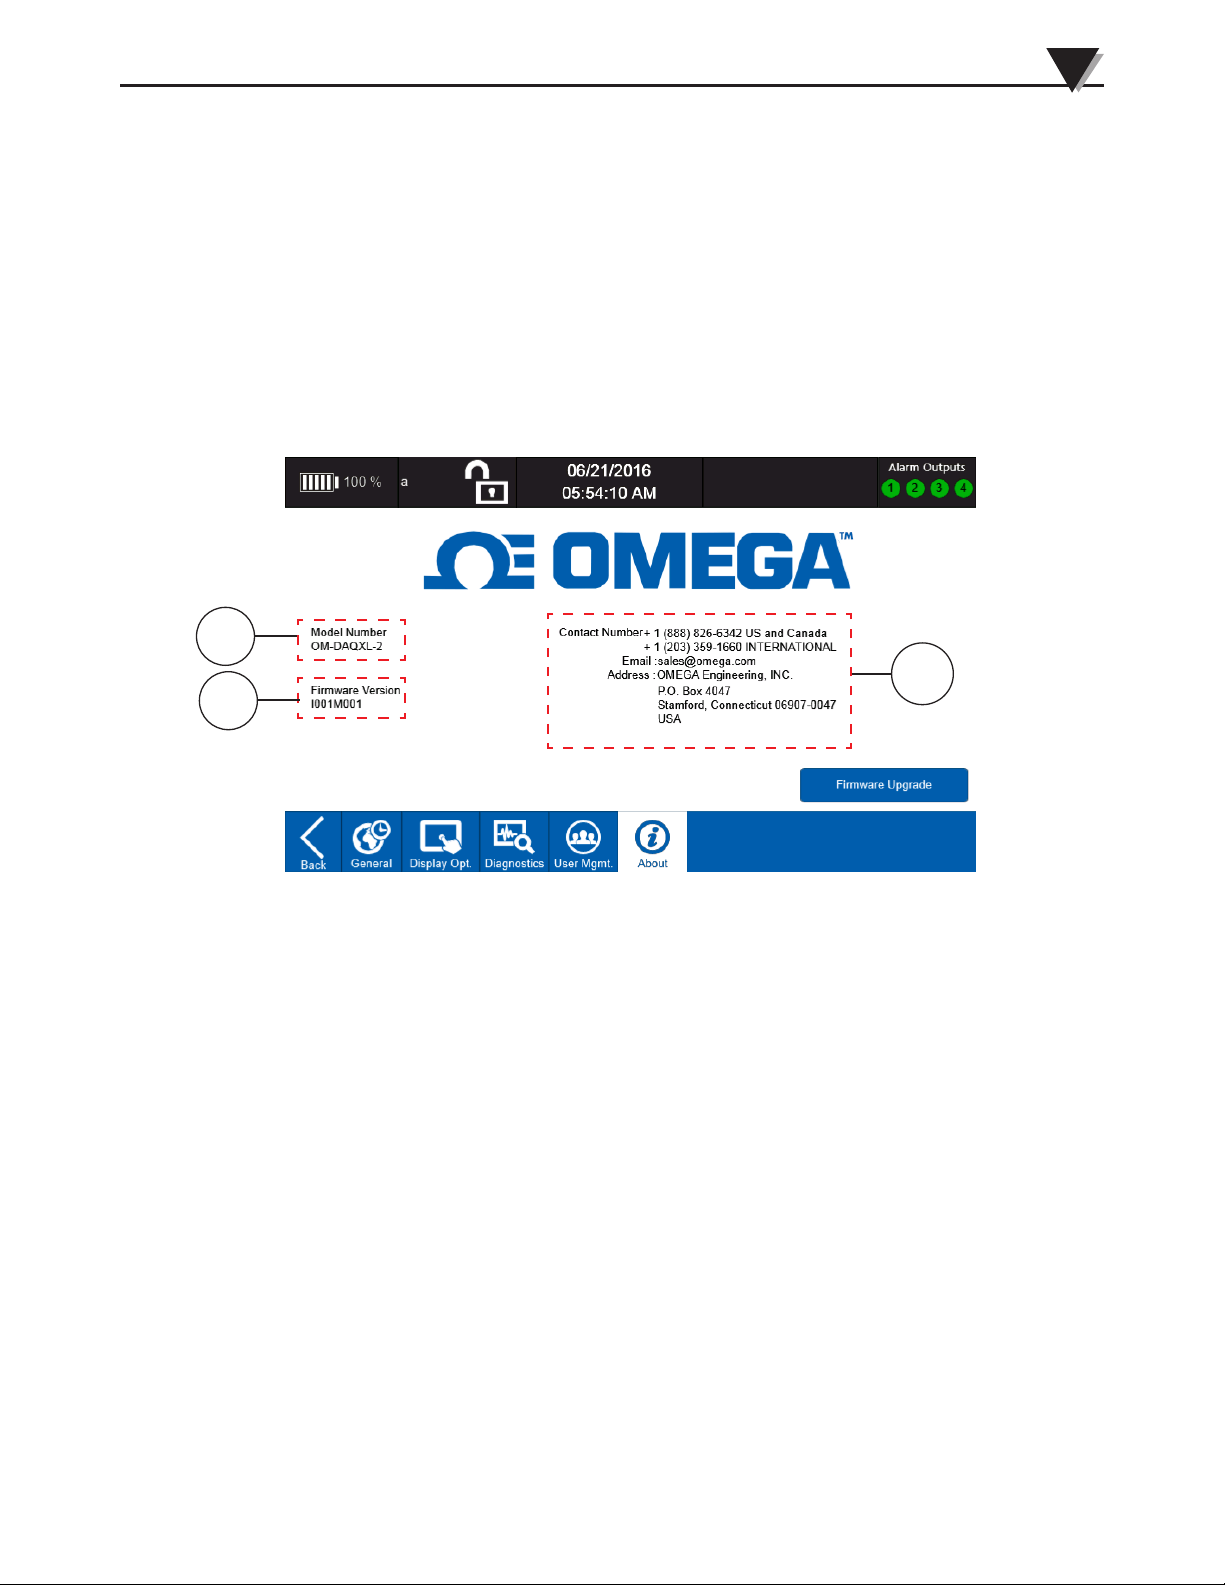
Standalone Operation
About Your Logger/Firmware
The About screen provides model number information, current firmware
version, OMEGA’s contact information and a Firmware Upgrade option.
Occasionally OMEGA releases updates to the data logger firmware. These
updates can be downloaded from the OMEGA FTP site, which can be accessed
through the main OMEGA website by visiting www.omega.com/ftp and
navigating to the OM-DAQXL folder under Data Acquisition folder.
3
1
3
2
Figure 3-44 About Screen
1. Model Number
Shows the model number of your data logger.
2. Firmware Version
This shows the firmware version currently installed on your device.
3. Contact Information
Omega Engineering contact information.
4. Firmware Update
The firmware update button is used to initiate an update. Make sure you
have a valid firmware update file on your SD or USB memory before
proceeding.
3-38
Page 62
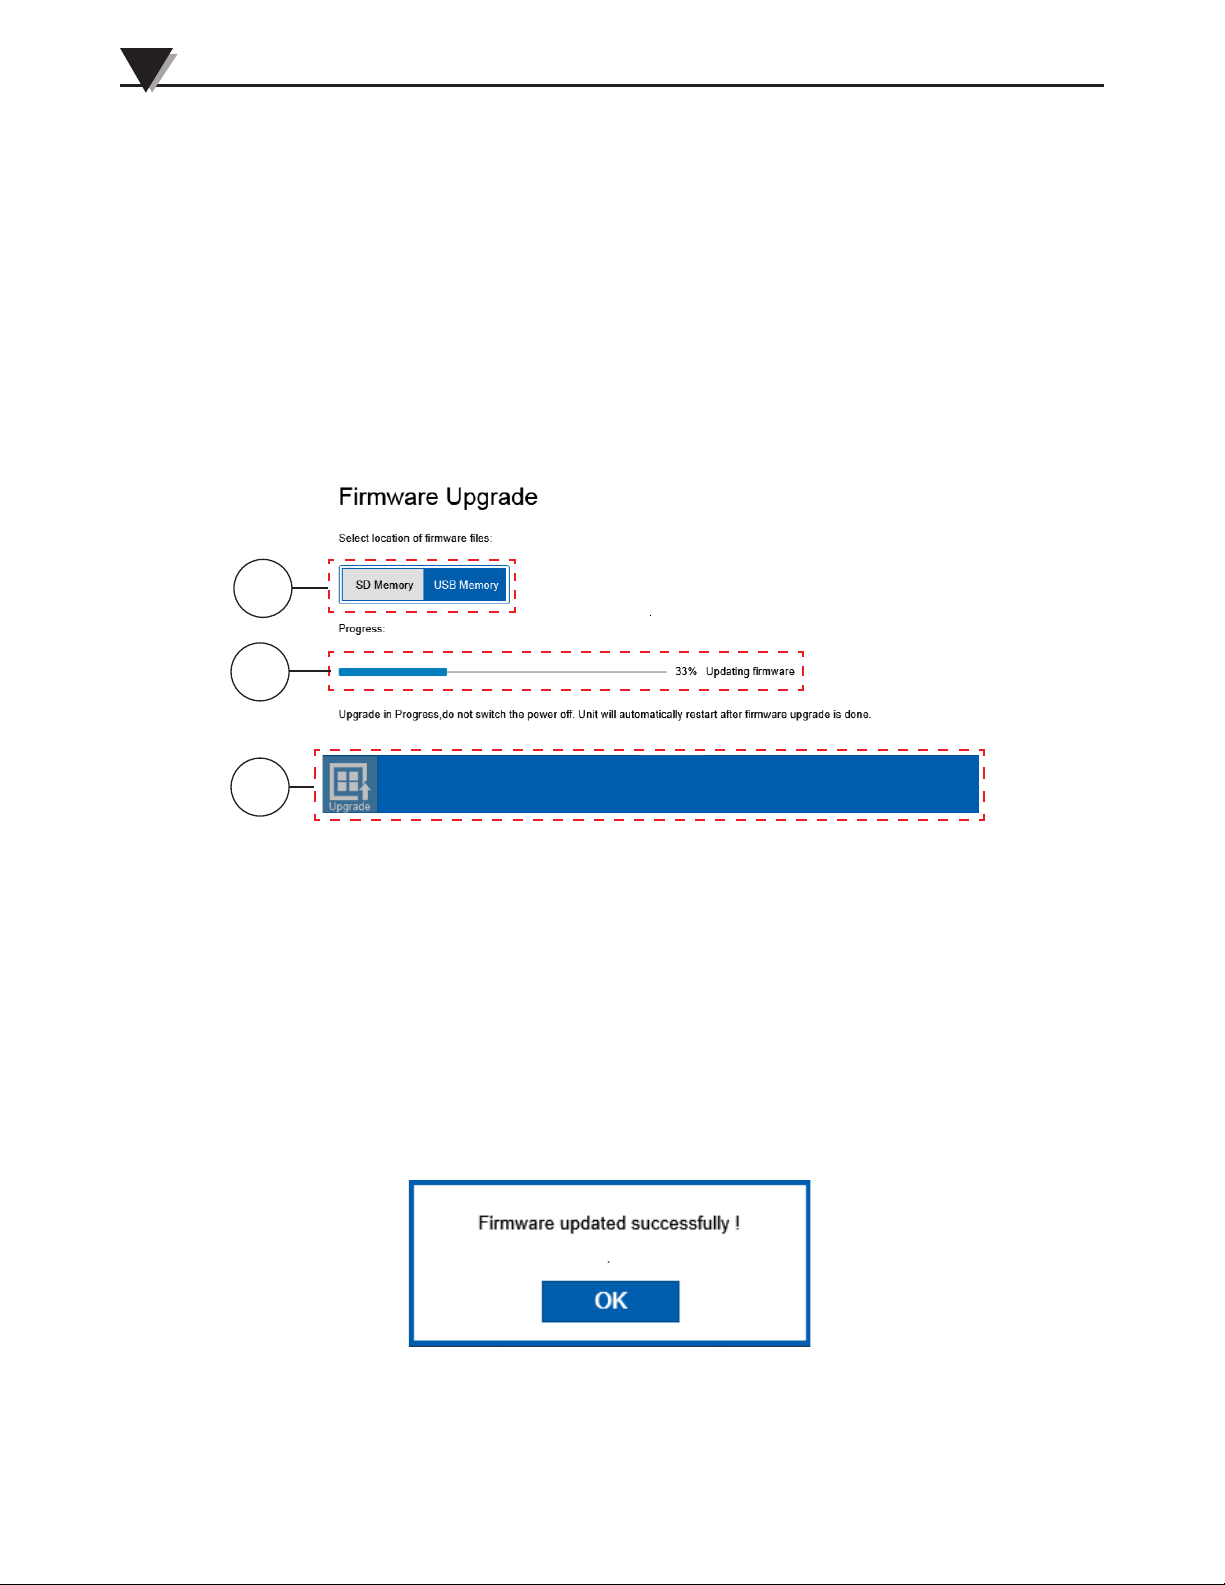
3
Standalone Operation
1
Firmware Upgrade
When performing a firmware upgrade, be sure that you have at least 50%
battery life remaining. To install a firmware upgrade, save the .zip file to either
a USB Flash drive or an SD card. Be sure to save the .zip file in the root directory
of the memory device and do not unzip the file. On the about screen press the
Firmware Upgrade button to proceed to the Firmware Upgrade screen as shown
in figure 3-43. On the firmware upgrade screen select the location (SD card or
USB memory) of the firmware upgrade file by pressing the appropriate button.
Then press the Upgrade button on the toolbar to begin the firmware upgrade
process. The progress will be indicated on the progress bar. The device will reset
itself to complete the firmware upgrade process.
2
3
Figure 3-45 Firmware Upgrade Screen
1. Memory Location
Select the location of the firmware update file.
2. Update progress Bar
Shows the progress of the firmware update.
3. Update Button
Initiates the firmware update process.
Once the device has rebooted you have logged in, you should see a message
indicating that the upgrade was successful. You can verify that you have an
update firmware version by returning to the About screen and checking the
version number.
3-39
Figure 3-46 Firmware Upgrade Success
Page 63
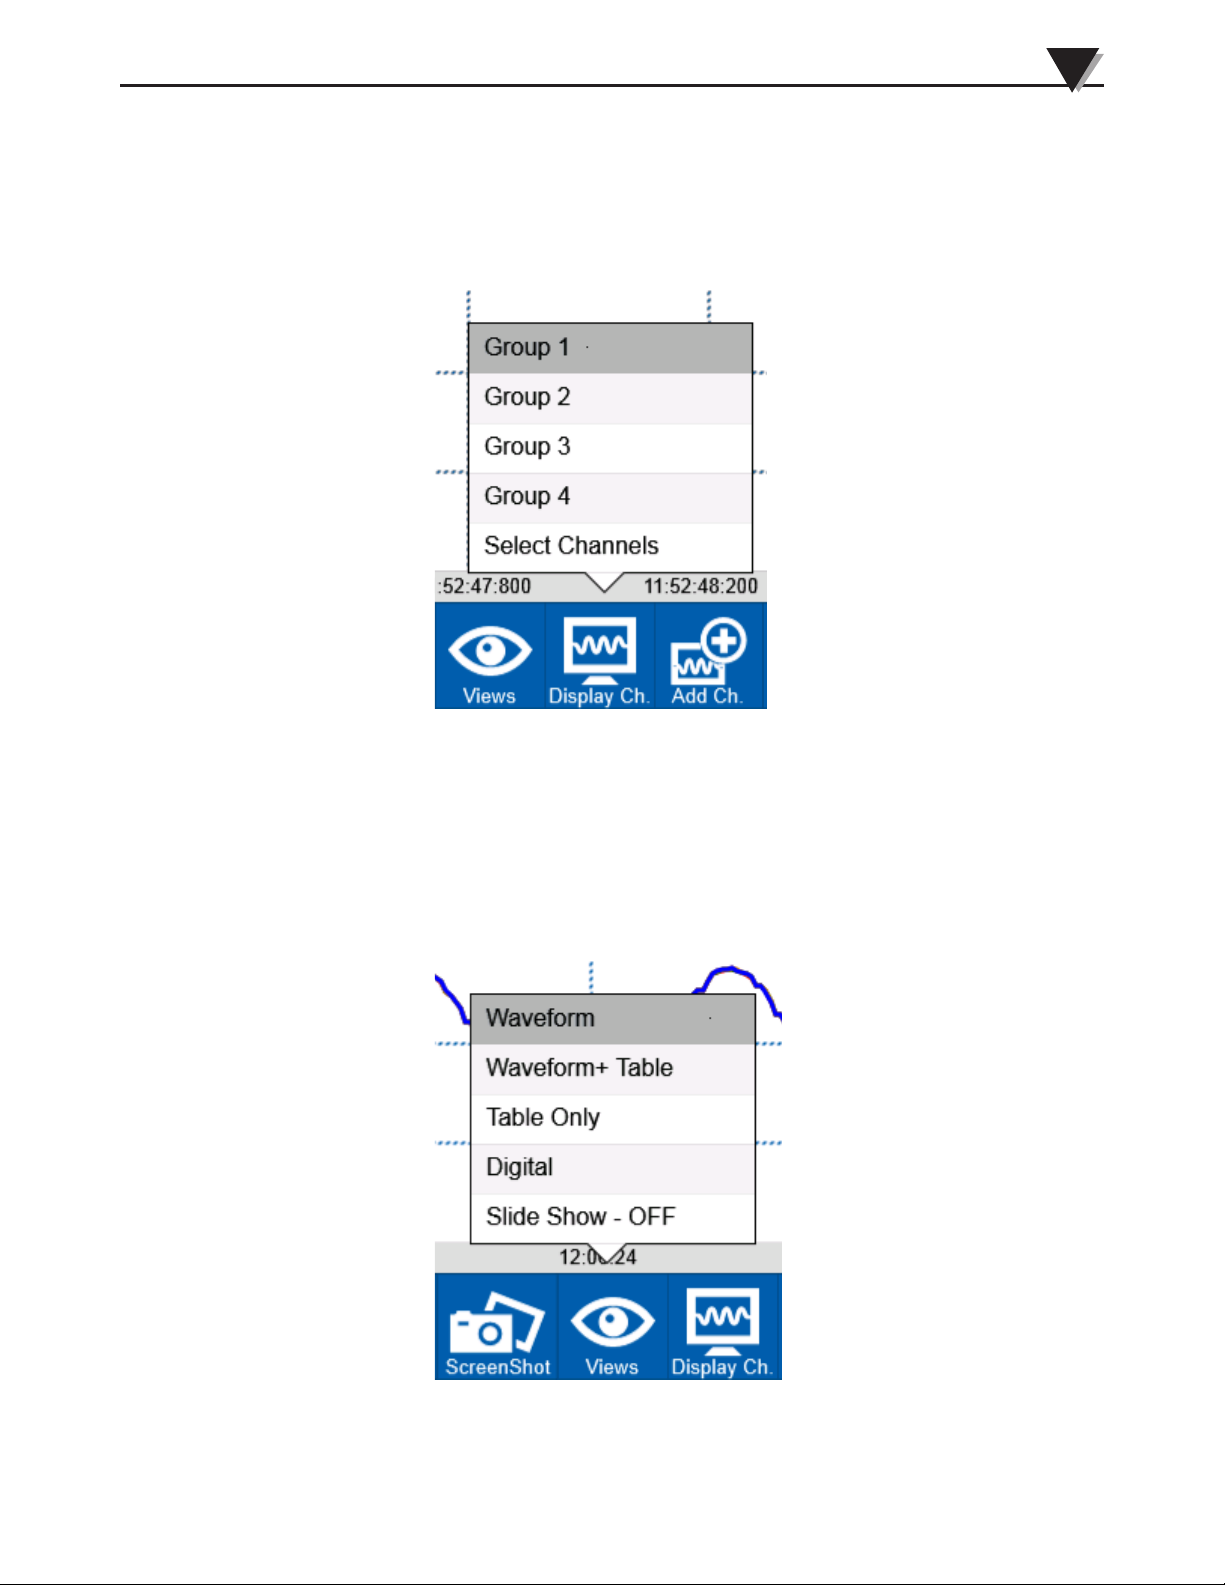
3.4 Viewing Data
To view data on the OM-DAQXL at least one input must be connected,
configured and assigned to a channel group for display. There are two toolbar
buttons which determine what data is shown in the data display area.
Standalone Operation
3
Figure 3-47 Display Channel Fly-Out Menu
The Display Channels button fly-out menu allows you to select which group of
channels you would like to display and also provides quick access to the Select
Channels screen where channel groups can be configured.
The Views button fly-out menu allows you to select between four display modes
to view data. It also has a selection to toggle the slide show feature on or off.
Figure 3-48 Views Fly-Out Menu
3-40
Page 64
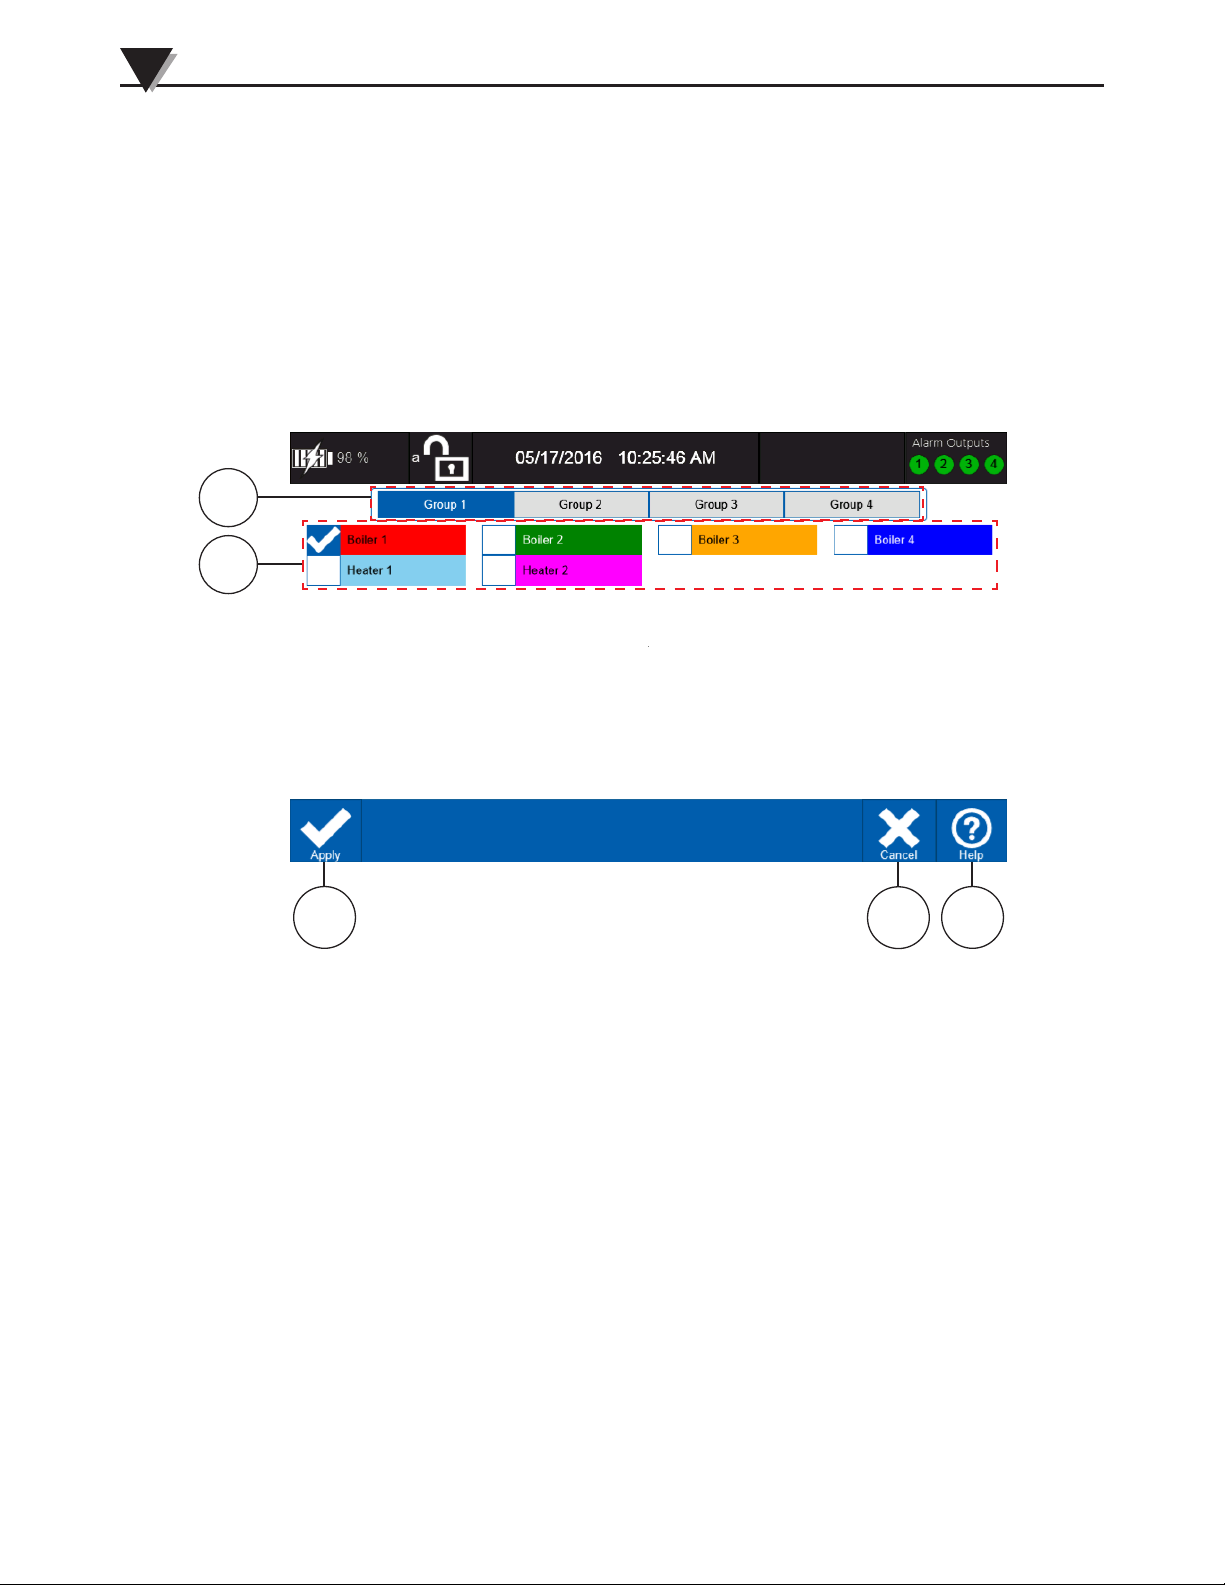
3
Standalone Operation
1
2
3.4.1 Select Channels
Before channel data can be viewed, it must first be assigned to a group. This
is done through the Select Channels screen which can be accessed through the
Display Channels button on the home toolbar or from the Channel List screen
toolbar. The Select Channels screen will display all configured channels and
indicate a check mark next to any channels assigned to the currently selected
group. Channels can be assigned to multiple groups.
3
Figure 3-49 Select Channels Screen
1. Group Selection
These buttons let you select one group at a time to assign channels to.
2. Channel Selection
All currently configured channels are shown in this area. You can select four
channels per group using the checkboxes. No two channels assigned to the
same group can have the same color.
3. Apply
This saves the current channels selections and returns to the previous screen.
4. Cancel
Immediately cancel the operation and returns to the previous screen.
5. Help
Provides context-sensitive help based on the current screen.
4
5
3-41
Page 65
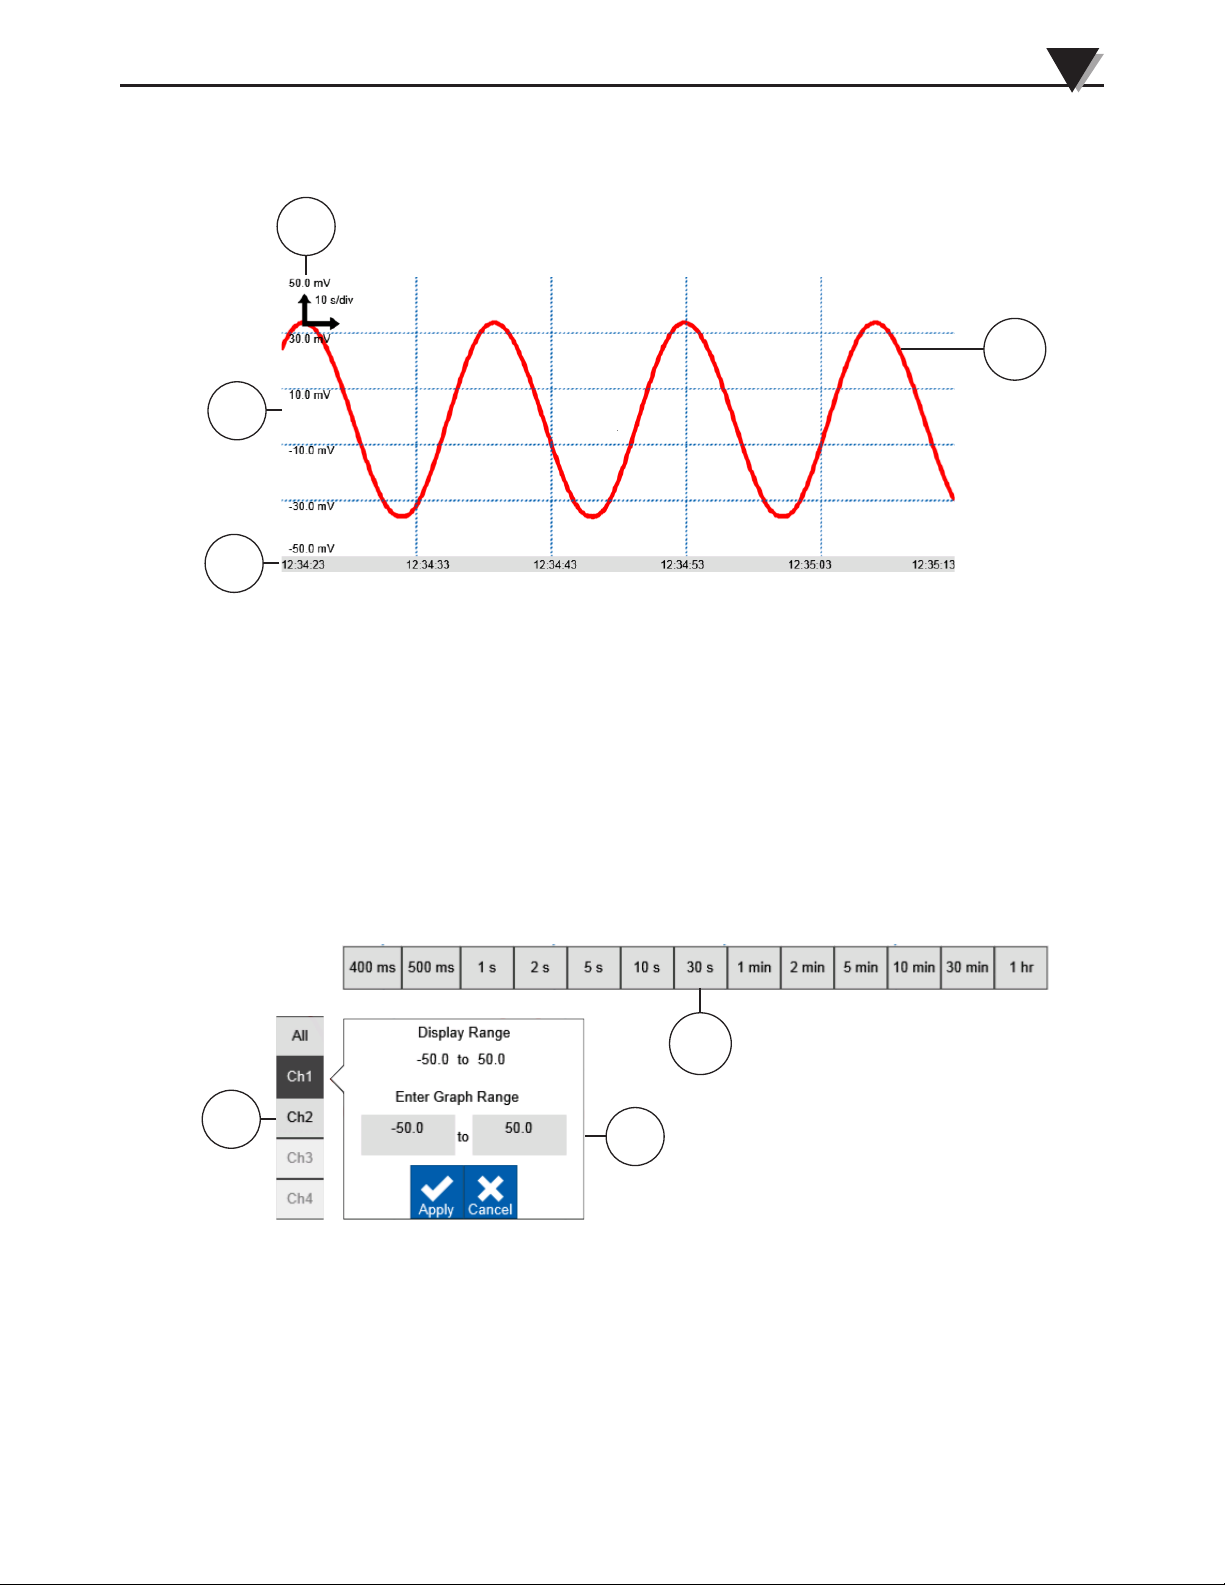
Standalone Operation
3.4.2 Waveform View
The waveform view uses the full display width to plot a graph of the channel
data. This maximizes the amount of data that can be viewed.
3
4
3
2
1
Figure 3-50 Waveform View
1. Time Stamp Indicator
Shows the time stamp for each graph division.
2. Y-Axis Scale
Shows the value at each division of the Y-Axis. With multiple channels
visible, these values will be for the currently selected channel.
3. Channel Trace
Shows the waveform for each input channel in the selected color.
4. Scale Selector
Shows the current time per division for the X-Axis. A single tap on this
arrow icon will invoke the scale selection fly-out.
1
2
3
Figure 3-51 Graph Scale Selector
1. Time Scale
Shows the available time per division settings based on the currently
selected sample interval.
2. Channel Selector
Allows the user to select which channel to adjust the Y-axis scale for.
3. Y-Axis Graph Range Entry
Allow entry of a custom graph range for each channel.
3-42
Page 66
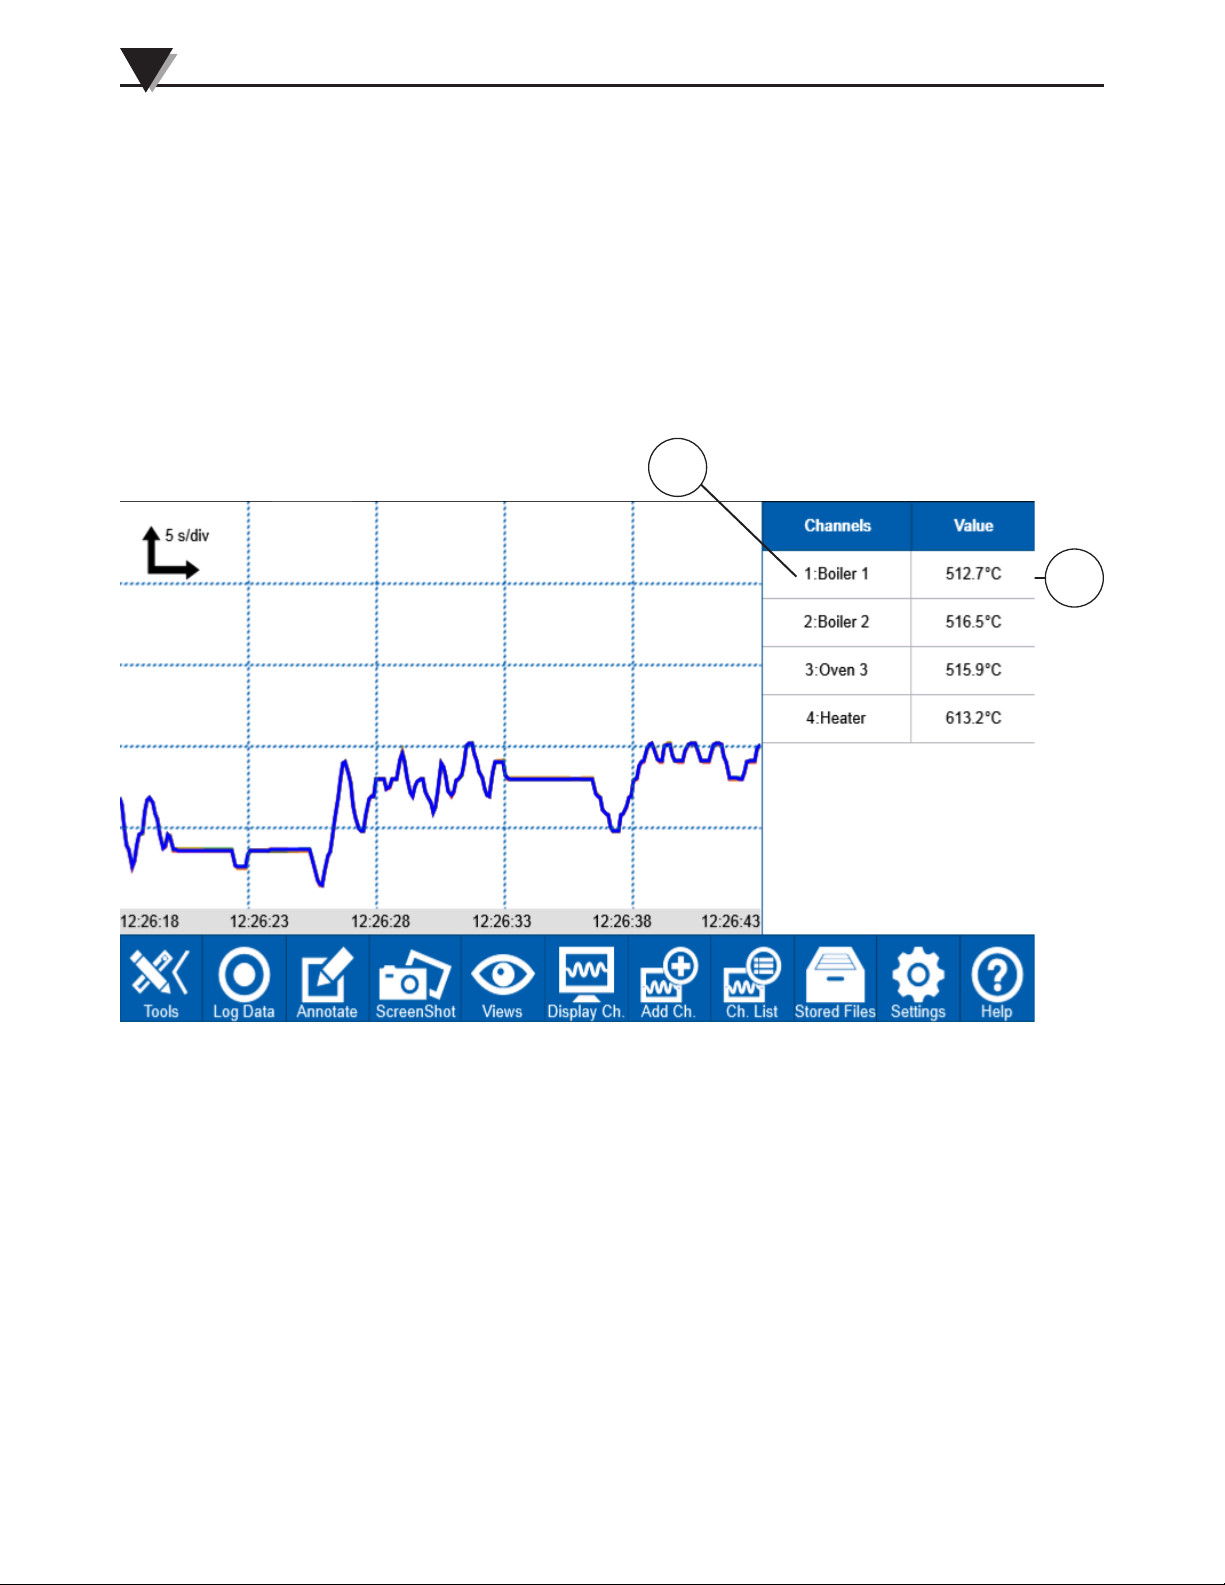
3
Standalone Operation
3.4.3 Waveform and Table view
The waveform & table view has the same features as the waveform view with
the addition of a table showing the current values for all configured channels
can be displayed on the right third of the display area. The graph scales can be
adjusted using the scale selector in the same way as in the waveform view.
1
2
3-43
Figure 3-52 Waveform and Table View
1. Channel Number and Name.
2. Channel Value
Shows the current value for the measured or calculated data for each
channel along with the selected engineering units.
Page 67
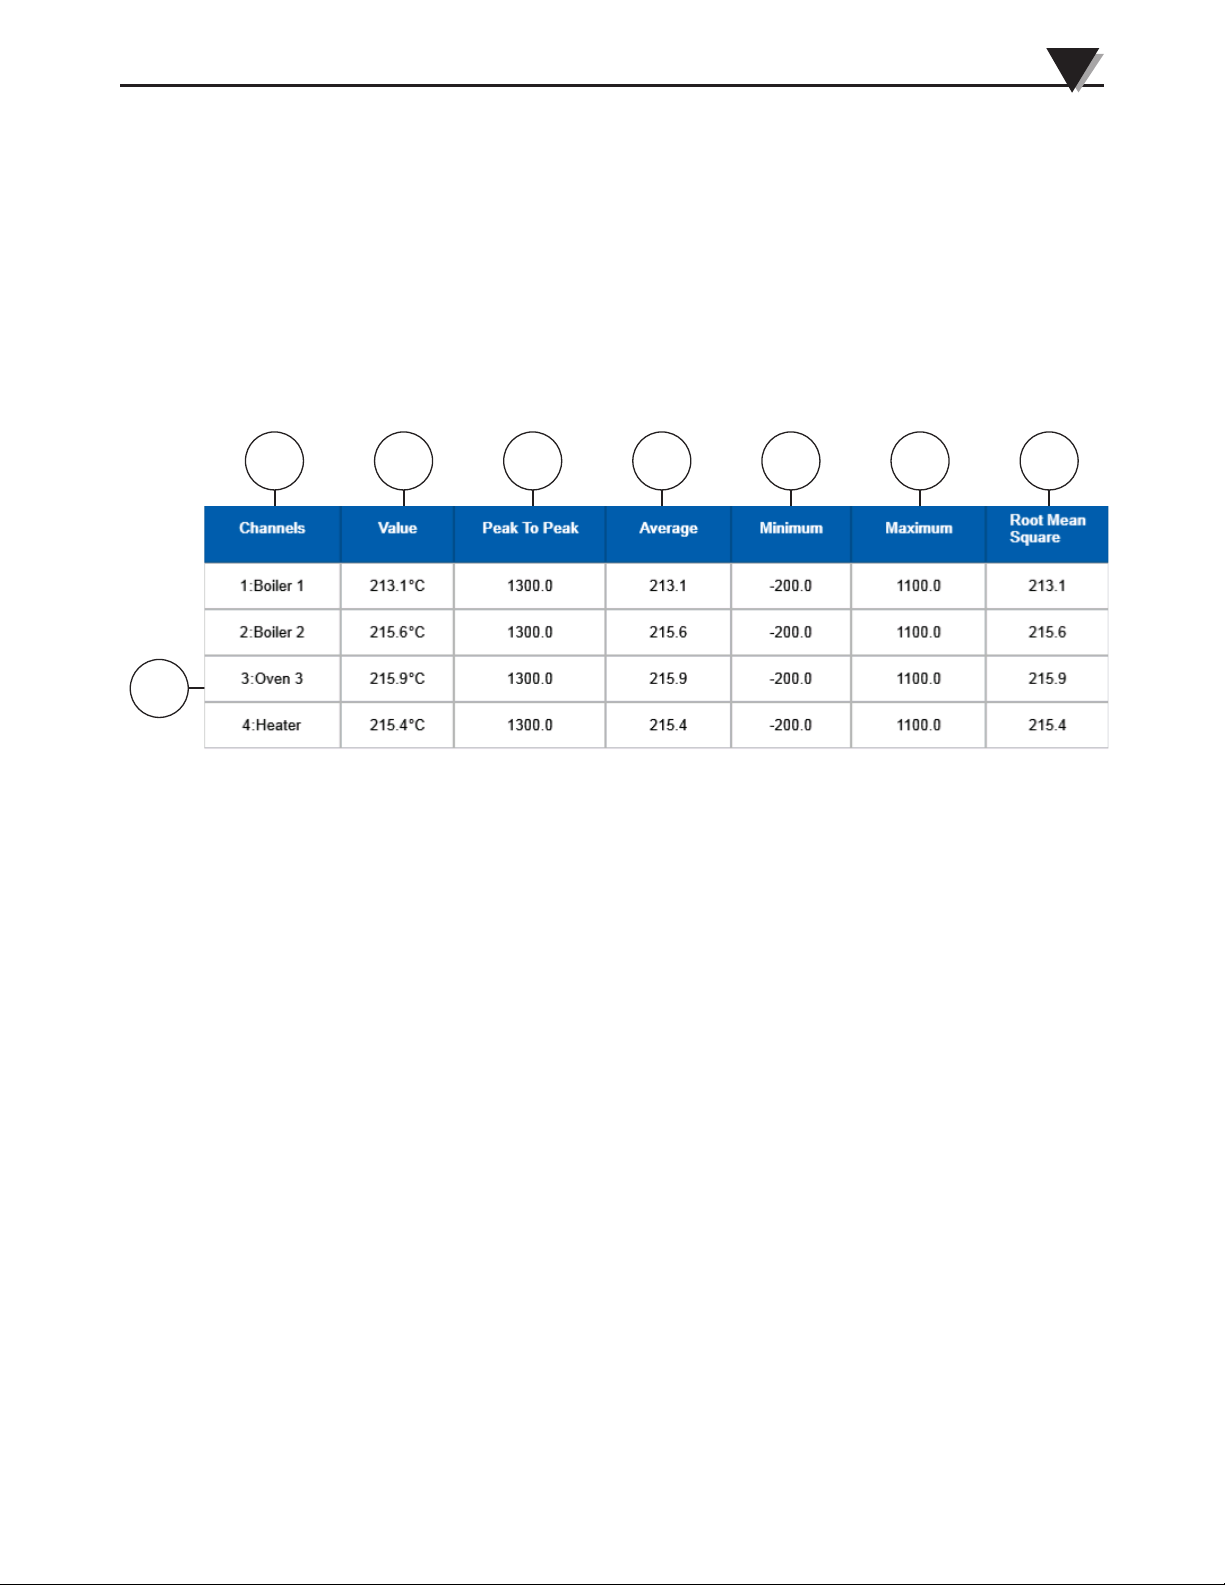
Standalone Operation
3.4.4 Table Only view
The table only view provides a tabular view of statistical values for all currently
configured channels.
1 2 3 4 5 6 7
3
8
Figure 3-53 Table Only View
1. Channels
This column shows the channel number and name assigned to each channel.
2. Value
This column shows the current calculated value for each input in the
engineering units configured.
3. Peak to Peak
This column gives an indication of the difference between the maximum
and minimum values of the data for each channel.
4. Average
This column shows the average value of the data for each channel.
5. Minimum
This column indicate the minimum value of the data for each channel.
6. Maximum
This column indicates the maximum value of the data for each channel.
7. Root Mean Square
This column indicates the RMS value of the data for each channel.
8. Table
Shows the channel data for all currently configured channels.
3-44
Page 68
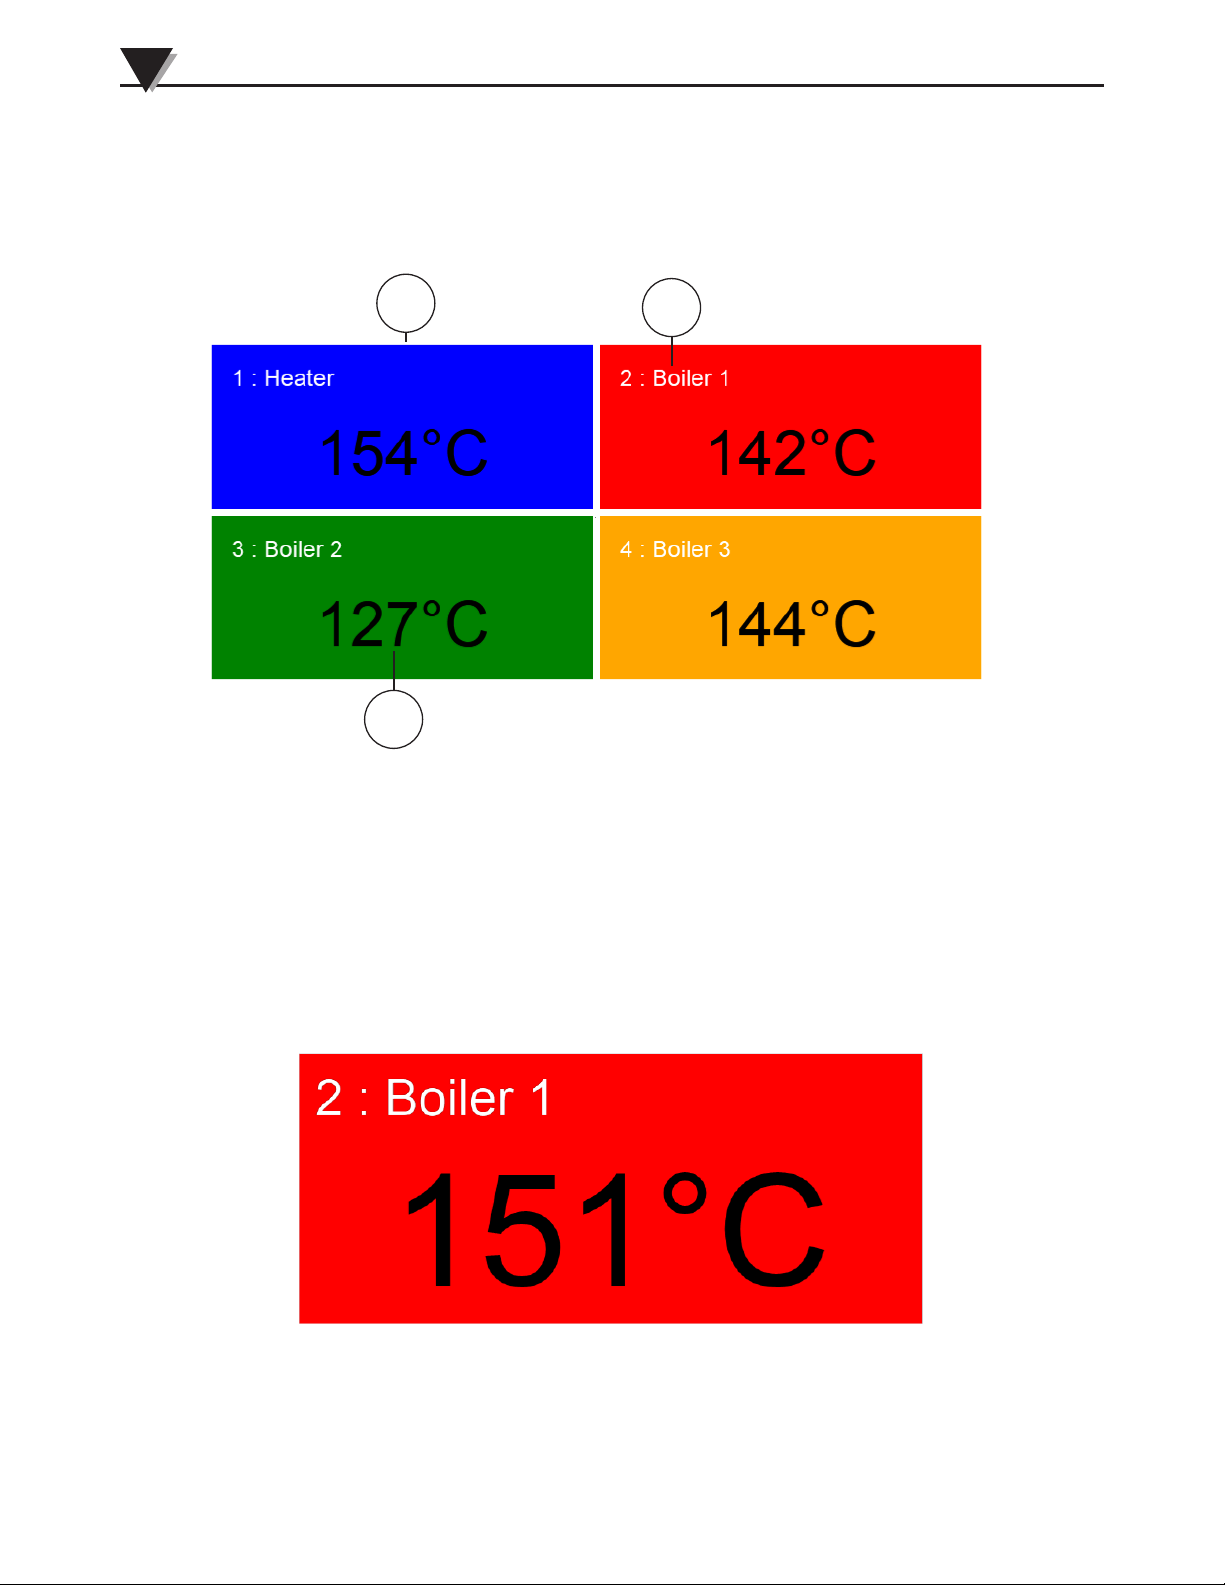
3
Standalone Operation
3.4.5 Digital View
The digital view shows the user a digital indication of up to four channels (1
group) simultaneously. It has two display modes, four channel or single channel.
1
3
1. Channel Display
A single tap on any of the four digital displays will switch the display mode
to show a single channel display for that channel.
2. Channel Number and Channel Name
Shows the channel number and user assigned name for each channel.
Figure 3-54 Four Channel Digital View
2
3-45
3. Digital Display
Shows the current value for each channel included user selected engineering
units.
Figure 3-55 Single Channel Digital View
Page 69
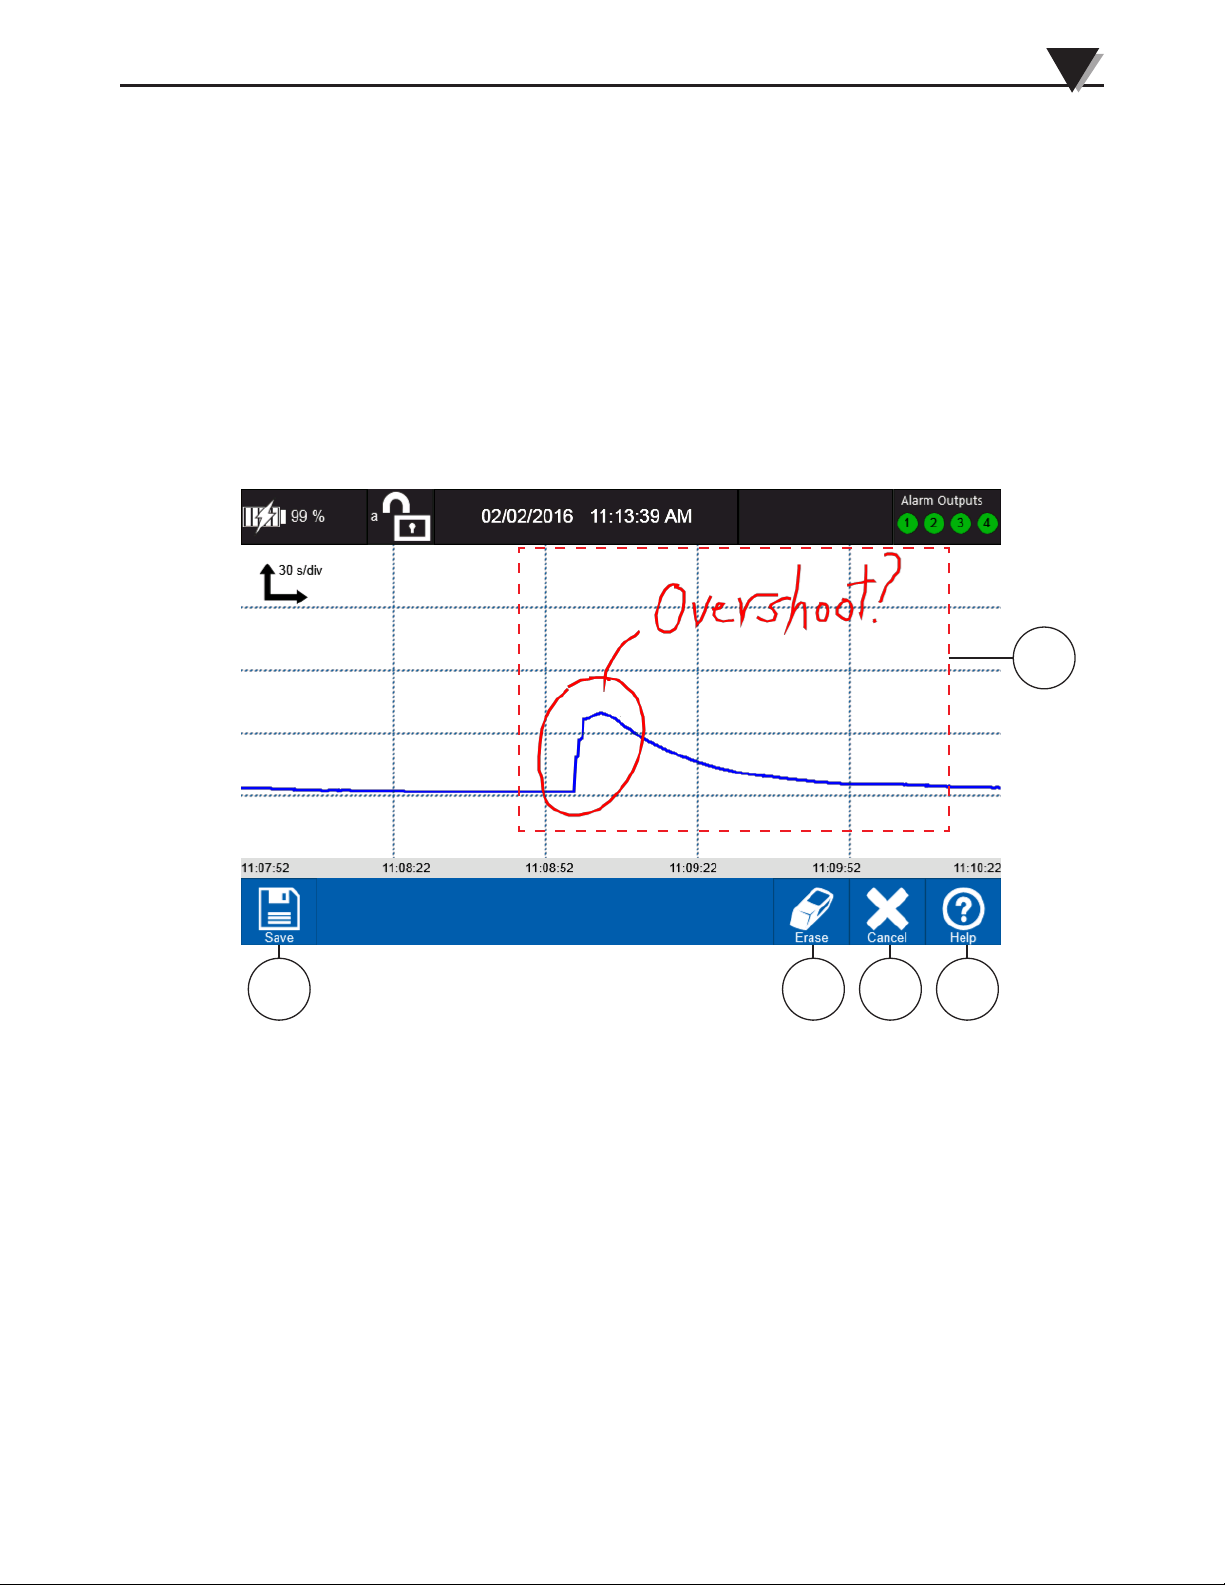
Standalone Operation
3.4.6 Screenshot
At any point during operation a screenshot of the current home screen can
be captured simply by pressing the Screenshot button on the toolbar. This is
a convenient way to capture information especially in the free-running mode
when data is not being recorded to a file. Each time the button is pressed a
message will appear for approximately 3 seconds indicating the path and name
of the saved screenshot image.
3.4.7 Annotate
The annotate button allows the user to freeze the current display and make
annotations using the stylus. Then a screenshot including the annotation can be
saved in the directory configured in the data session settings.
3
1 2
Figure 3-56 Annotate
1. Save
Saves the screenshot with annotations to the user folder in the currently
configured memory location.
2. Erase
Erases the last annotation stroke made. Each additional press erases the
previous stroke.
5
3 4
3. Cancel
Clears all annotations and unfreezes the display.
4. Help
Provides context-sensitive help based on the current screen.
5. Annotation
Shows an example of a typical user annotation.
3-46
Page 70

3
Standalone Operation
3.5 Operating Modes
The OM-DAQXL has four modes of operation. They are described in the
following section.
3.5.1 Free-Running
This mode is used mainly for set up. The device measures and displays all
configured analog and digital inputs. No data is logged and all settings can be
edited. While in the free-running mode the data logging mode area of the status
bar is blank.
3.5.2 Armed Mode
The OM-DAQXL will enter the Armed mode when a start trigger is configured
and the Log Data button is pressed. The data logging mode indicator in the
status bar will show an orange dot and the toolbar icon will also be an orange
color with the word Armed shown. When the configured trigger condition is
met, the device will automatically enter the logging mode of operation.
Pressing the Log Data button while in the armed mode will cause a fly-out menu
to appear. You can either skip trigger detection and enter the logging mode
automatically by pressing the red Log Data button or revert to the free running
mode by pressing the white Free running button.
3.5.3 Logging Mode
In the logging the OM-DAQXL will save data from all configured channels to
the memory location specified in the Data Session Settings. This location must
be specified prior to entering the logging mode. A maximum of 1 million data
points will be logged to a file after which a new log file will be started. When
in the logging mode new channels cannot be configured and trigger and data
session settings cannot be changed.
The OM-DAQXL features multiple options for logging data. It comes with 1GB
of internal flash memory standard in addition to both an SD card slot and a USB
host port allowing up to 64GB memory capacities to be used for storing user
data.
3.5.4 Data Review Mode
The data review mode allows you to review previously logged data or view
previously captured screenshots. The Stored Files button on the toolbar gives
access to all previously stored data for the currently logged in user. Pressing the
Stored Files button will bring you to the directories screen as shown below.
3-47
Page 71
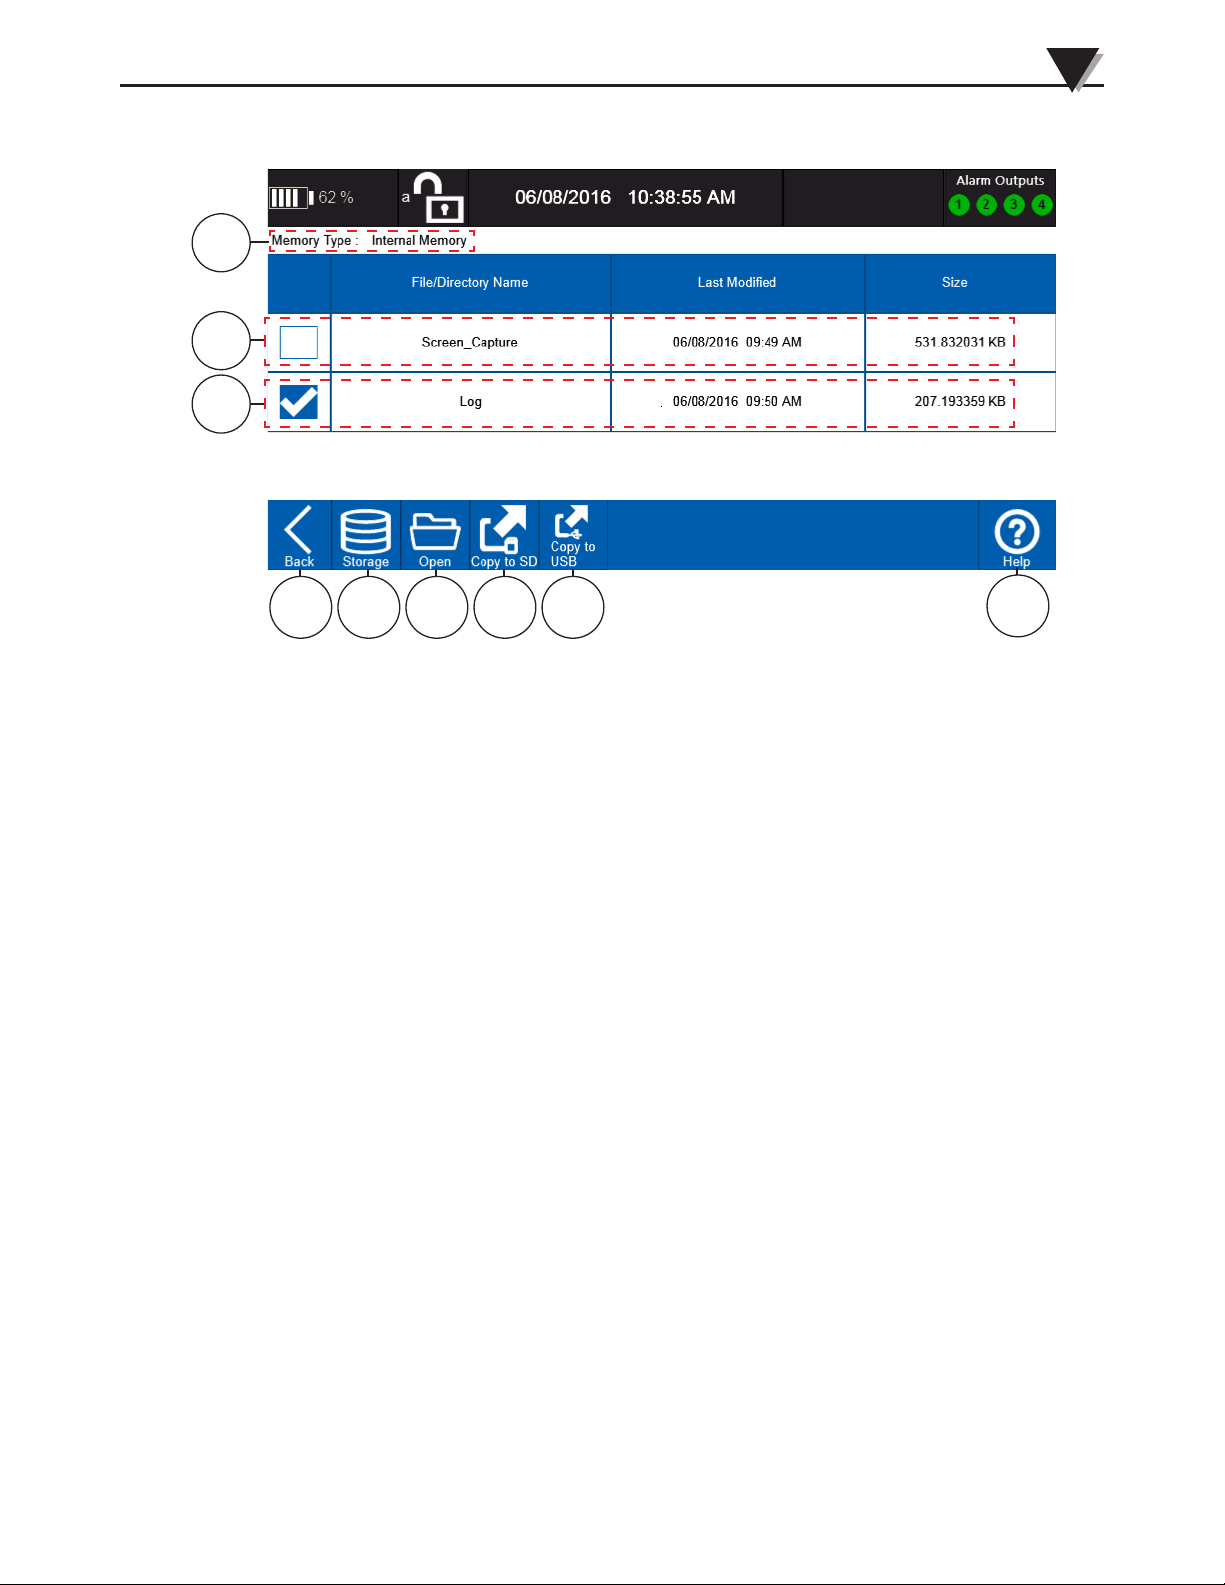
Standalone Operation
3
1
2
3
4 5 6 7 8
Figure 3-57 Stored File Directories
1. Memory Type
Shows the currently selected memory type. This defaults to the internal
memory.
2. Screen Capture Directory
Directory where all screen captures for the currently logged in user are
stored.
3. Log Files Directory
Directory where all data log files for the currently logged in user are stored.
4. Back
Returns to the home screen.
5. Storage
Invokes a fly-out menu that allows you to select which memory type to
browse. If you select a memory type not present a pop-up message will
indicate the memory type is not found.
6. Open
Opens the selected directory.
7. Copy to SD
Copies the selected file or directories to the SD card if present.
9
8. Copy to USB
Copies the selected file or directories to the USB memory if present.
9. Help
Provides context-sensitive help based on the current screen.
3-48
Page 72
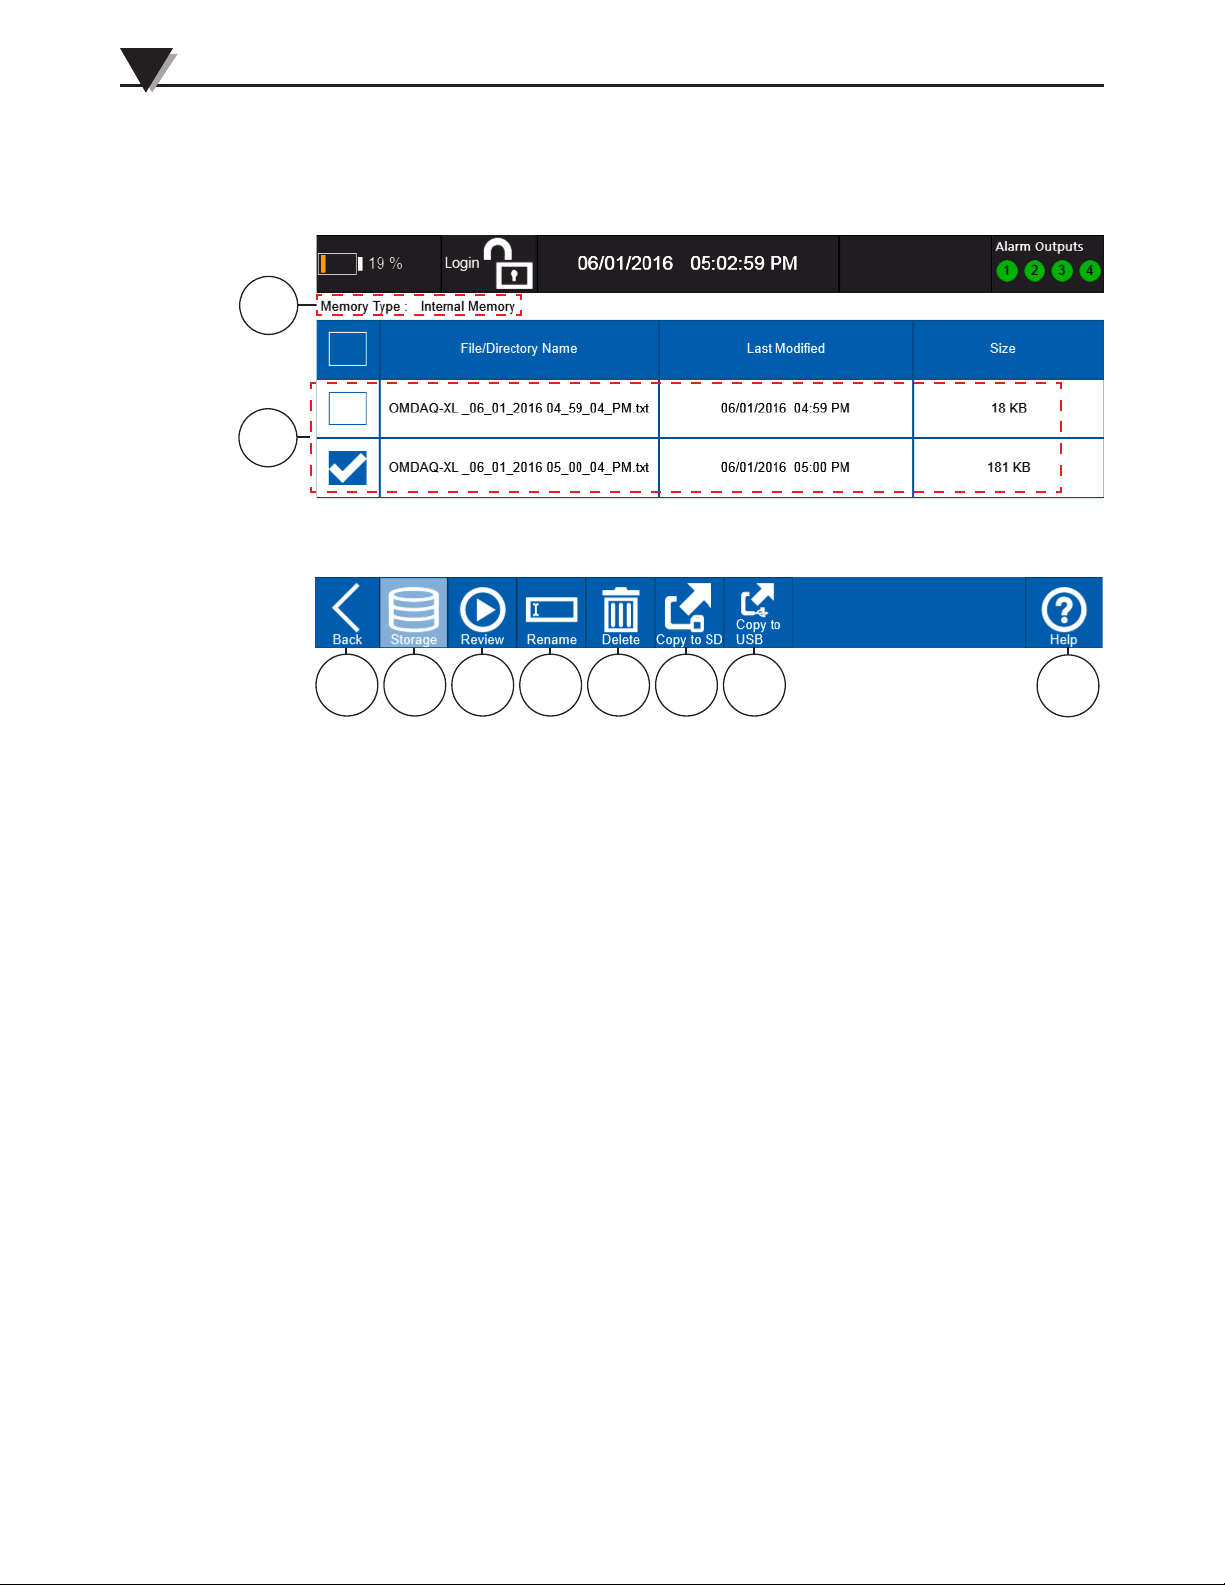
3
Standalone Operation
To browse files in a particular directory you can select the directory using the
checkbox and then press the Open button on the toolbar. The selected directory
will be opened and all the files in the directory will be presented in a scrollable
list as shown below.
1
2
3 4 5 6 7 8 9
Figure 3-58 Stored Files List
1. Memory Type
Shows the currently selected memory type. Must be selected prior to
opening the directory.
2. File List
A scrollable list view of all data files or screen captures in the current
directory.
3. Back
Returns to the stored files directory list.
4. Storage
Not selectable in the stored files list view.
5. Review
Opens the selected file in the review screen, Depending on the size of the file
it may take several seconds to load. Only one file can be selected at a time
for review.
6. Rename
Opens screen where you can rename a file.
7. Delete
Deletes the selected files. You will be asked to confirm this action before any
files are deleted.
10
3-49
8. Copy to SD
Copies the selected file or files to the SD card if present.
9. Copy to USB
Copies the selected file or files to the USB memory if present.
10. Help
Provides context-sensitive help based on the current screen.
Page 73
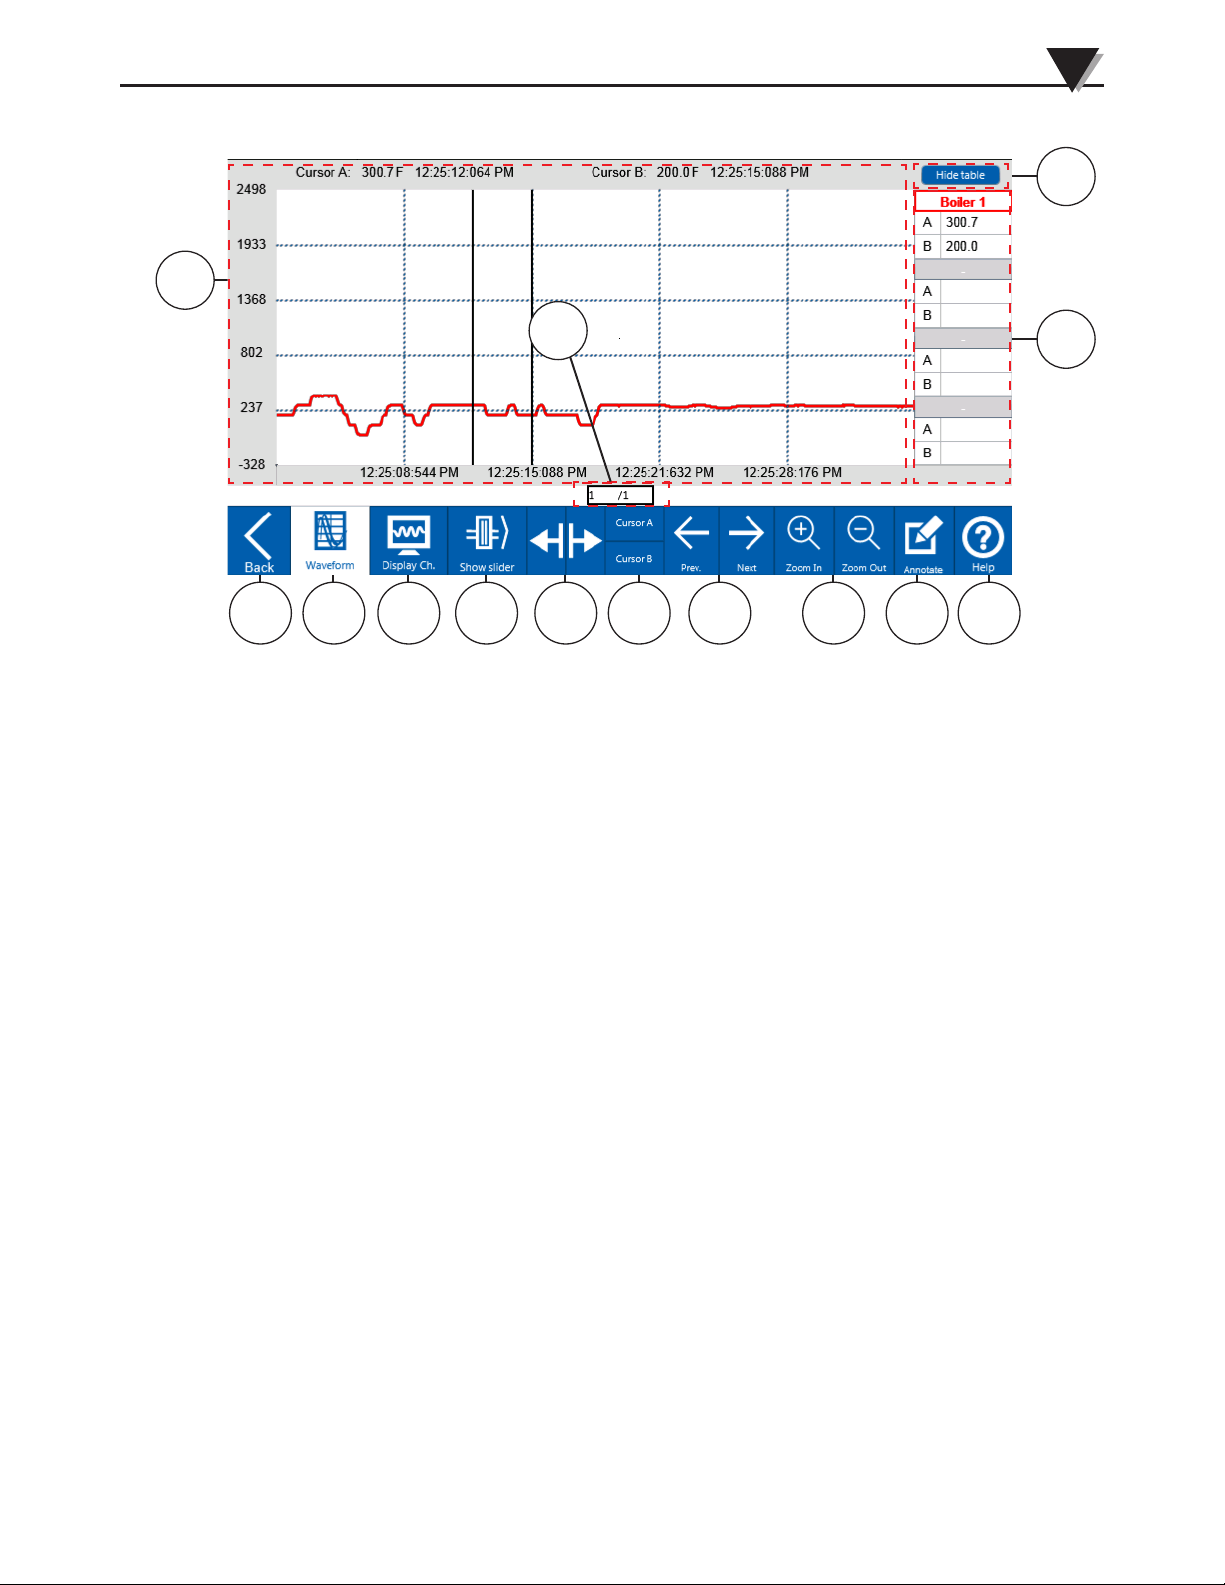
Standalone Operation
After selecting a particular file for review and pressing the Review button, the
data logger will load the file and show the data review screen.
3
2
1
4
5 6 7 8 9 10 11 12 13 14
Figure 3-59 Data Review Screen
1. Waveform Graph
Shows a graphical plot of data for the file currently under review. Information
displayed includes the y-axis scale for the channel currently highlighted,
timestamp indicator, engineering unit value for the currently selected channel
at each cursor location and time value at for each cursor.
2. Hide Table
Hides or shows the table showing the channel data values at each cursor
location.
3. Cursor Table
Table showing the channel data values at each cursor location. Tapping on a
channel name will show the corresponding channels data values at each cursor
location on the top of the graph.
4. Page indicator
Shows the current page displayed and the total number of pages at the current
zoom level.
5. Back
Returns to the stored files list for the currently selected memory location.
6. Waveform
Shows the waveform view of the file under review.
7. Display Channels
Navigates to the channel list for the file currently under review. Here you can
select the channels you wish to have displayed on the waveform view.
8. Show slider
Shows a slider tool that can be used to quickly move to different pages of the
file under review.
9. Cursor Controls
Moves the selected cursor forward or backward in time on the waveform
display.
10. Cursor selection
Selects the cursor you wish to move using the cursor controls.
A single cursor or both cursors can be selected.
3
3-50
Page 74
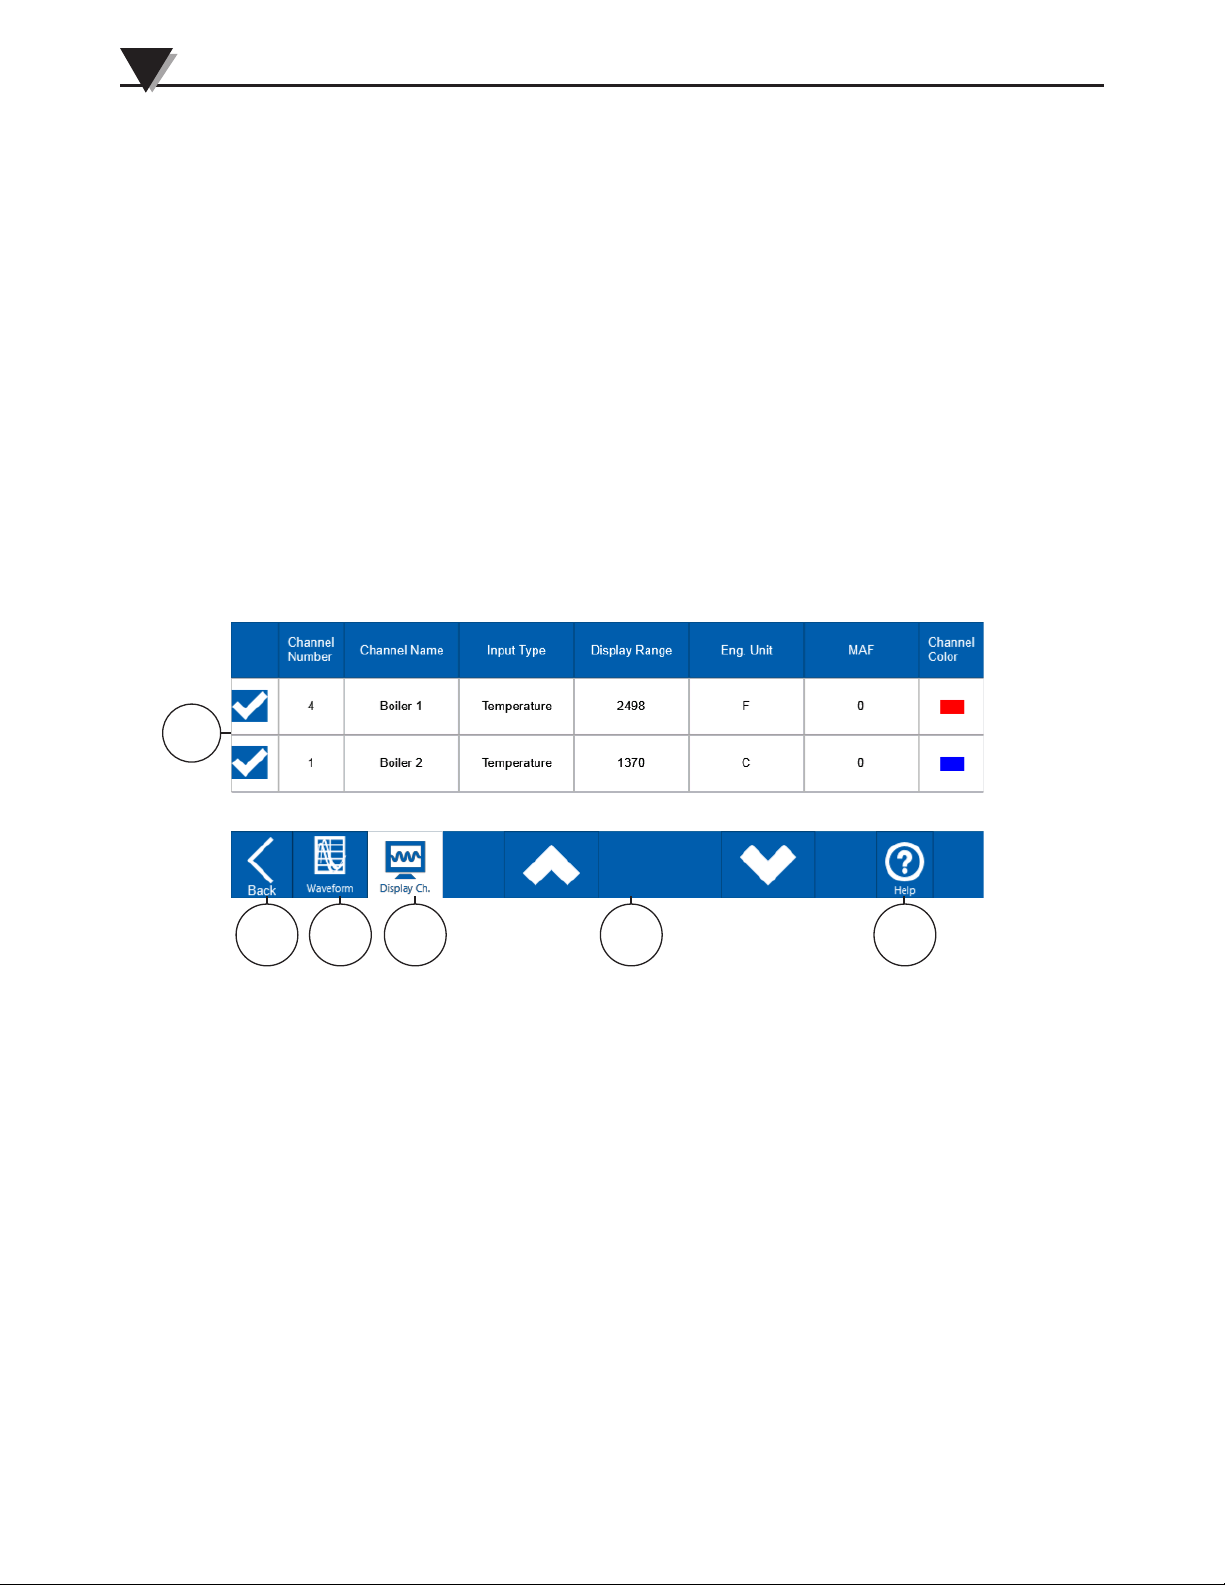
3
Standalone Operation
11. Previous and Next
Advances to the next page or returns to the previous page of the waveform
data.
12. Zoom In and Zoom Out
Zooms in or out on the waveform graph. Zooming is controlled using the
cursors. Position the cursors around the area of interest and use the Zoom
In button to magnify the area. The Zoom Out button will return to the fully
zoomed out view.
13. Annotate
Allows annotation of the current waveform graph. Annotations can be
saved as screenshots in the same directory as screenshots taken in the free
running or logging modes.
14. Help
Provides context-sensitive help based on the current screen.
At any time while reviewing a data file, you can select which channels you
would like to view on the waveform graph. Pressing the Display Channels
button on the data review screen toolbar will take you to the review mode
channel list screen where you can select the channels for display.
1
2 3 4
Figure 3-60 Review Mode Channel List
1. Channel List
List of all channels with data in the file under review. Select that channels
you wish to view on the waveform graph.
2. Back
Returns to the stored files list.
3. Waveform
After selecting the channels you would like to view, pressing the Waveform
button returns to the waveform graph.
4. Display Channels
Takes you to the review mode channel list to select channels to display.
5 6
3-51
5. Up/Down
When the channel list has more channels than can fit on the display, these
buttons allow you to scroll through the list.
6. Help
Provides context-sensitive help based on the current screen.
Page 75

4. CE Conformity
The OM-DAQXL has been designed to meet requirements as outlined
in European Community EMC Directive EN61326. Five ferrite cores
(PN: OM-DAQXL-RF) are included in the OM-DAQXL package. When
using thermocouple temperature sensors with the OM-DAQXL it is
recommended to pass the thermocouple through the supplied ferrite
2 turns before connecting it to the device.
CE Conformity
4
4-1
Page 76
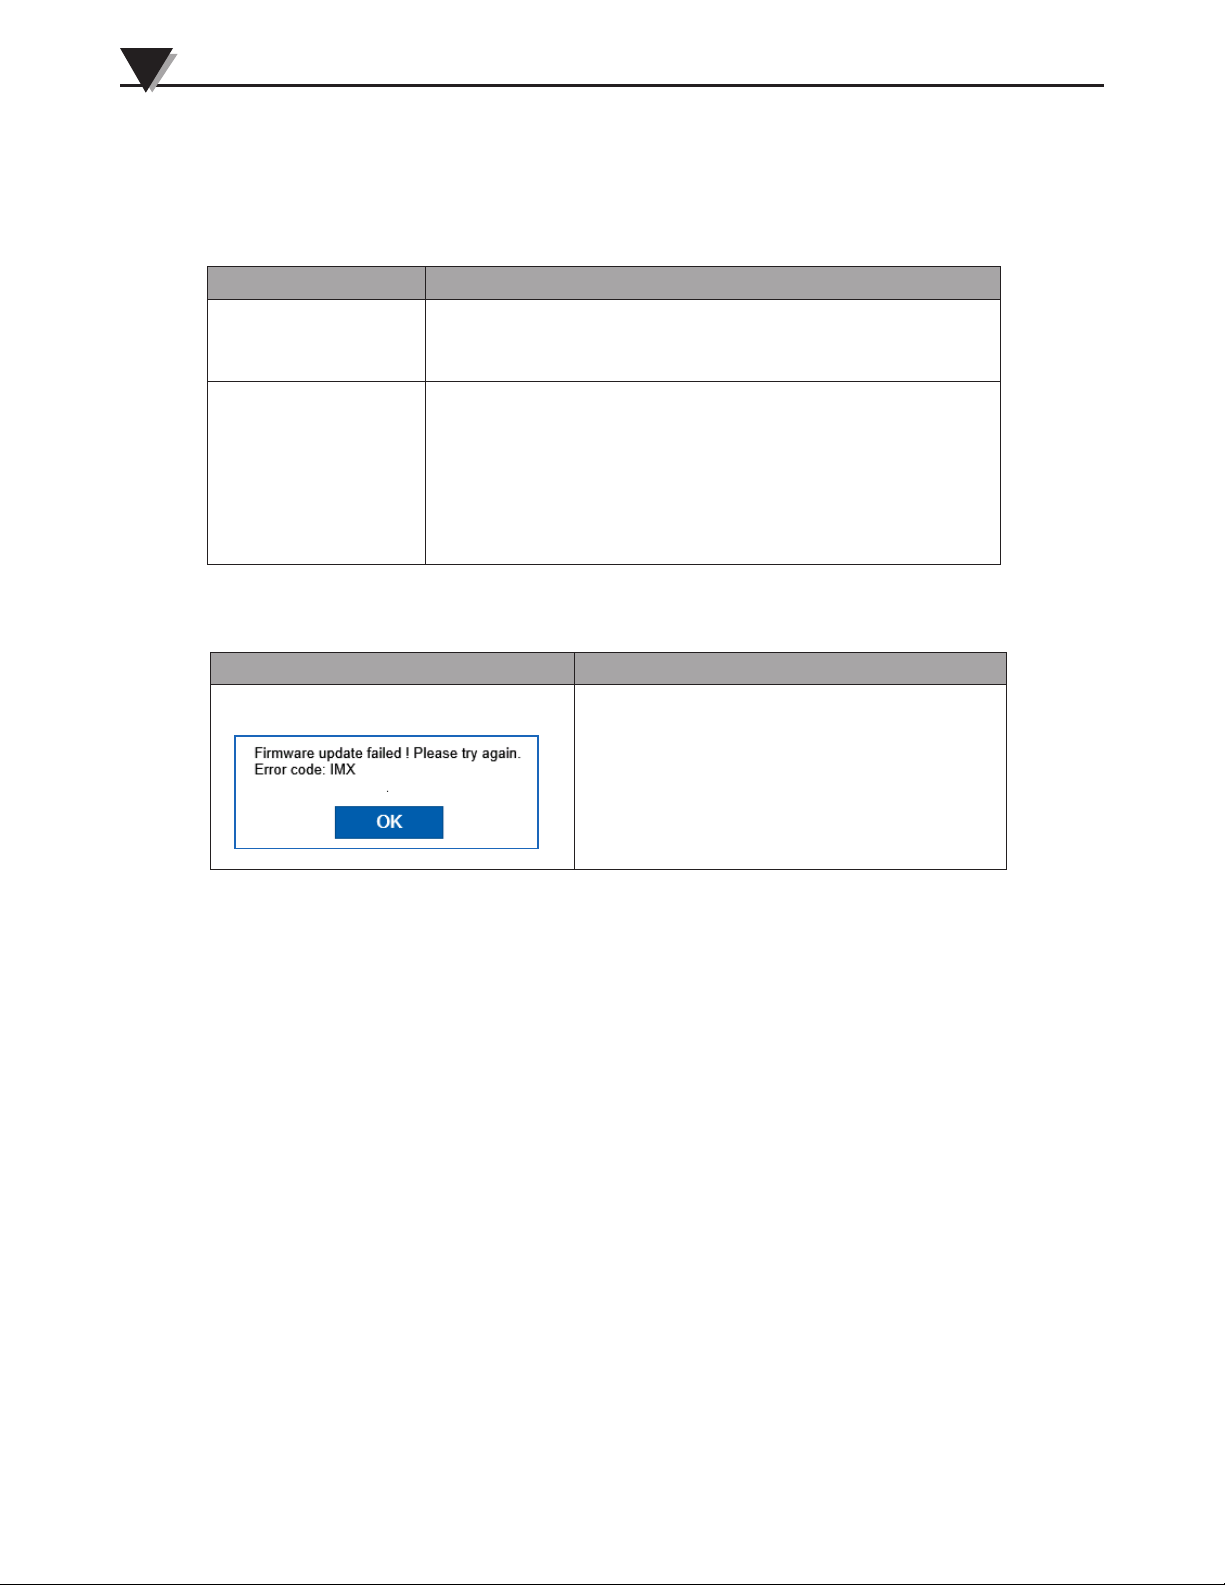
5
Troubleshooting
5 Troubleshooting
5.1 Hardware Issues
5.1.1 Power
Symptom Possible Solution
The device does not
power up when the
power switch is on.
Erratic input signal. Check signal lines and terminal connections. Connections
5.2 Error Messages
Make sure the battery or AC adapter is properly
connected. See section 2.11.
must be free of corrosion. Signal lines should be
undamaged and free of sharp bends and twists. Signal
paths should avoid potential sources of noise (high
voltage and electromagnetic interference). You can also
connect the Shield ground to Earth ground to minimize
sensor noise pickup.
Symptom Possible Solution
Firmware update fails. Verify that the firmware update file is a
later release than the currently installed
firmware.
5-1
Page 77

6 Service and Calibration
Your OM-DAQXL components have been built and factory calibrated to meet or
exceed the specifications listed here in this manual. If your OM-DAQXL system
requires service or calibration, please call our Customer Service Department at
1-800-622-2378 or 203-359-1660. They will assist you in arranging the return and
service of your device. We can also be reached on the Internet at www.omega.
com, e-mail: [email protected]
Service and Calibration
6
6-1
Page 78

7
Specifications
7 Specifications
7.1 General
Display: 7.0" TFT color LCD (WVGA: 800 x 480 pixels) with chemically
hardened touch panel.
Internal Memory: 1 GB FLASH Memory
SD Memory Card: 32 GB
USB Flash Drive: 1GB
Operating Environment: 0 to 50°C (32 to 122°F), 0 to 95% RH non-condensing
Storage Conditions: -10 to 60°C (32 to 140°F)
Dimensions
With Rubber Boot: (9.00 X 6.5 X 3.5")
Without Rubber Boot: (8.75 X 5.75 X 2.42')
Weight: 3.2 lbs (1.45 kg)*
Power Supply: AC Adapter Input:100 to 240 Vac, 50 to 60 Hz, 1.5 A max
AC Adapter Output: 12 Vdc, 5A max
Battery: Lithium Ion Rechargeable (7.2 V, 4800 mAh)
Battery Life: Approximately 4-8 hours depending on display settings before
recharge
Screen Time Out: 30 sec, 1 min, 2 min, 5 min, 10 min, Never
Slide Show Timing: 5 sec, 10 sec, 15 sec, 20 sec, 30 sec
Auto Power Shut Down: 5 minutes after screen time out
Line Graph Time Scale: From 400 msec/div up to 1 hr/div
External Excitation Output: 24 Vdc, regulated (±2%) isolated.
Maximum current output 50 mA.
External I/O: 4 digital inputs, 4 digital outputs, 4 alarm outputs,
1 external trigger input.
*Includes battery and rubber boot
7-1
Page 79
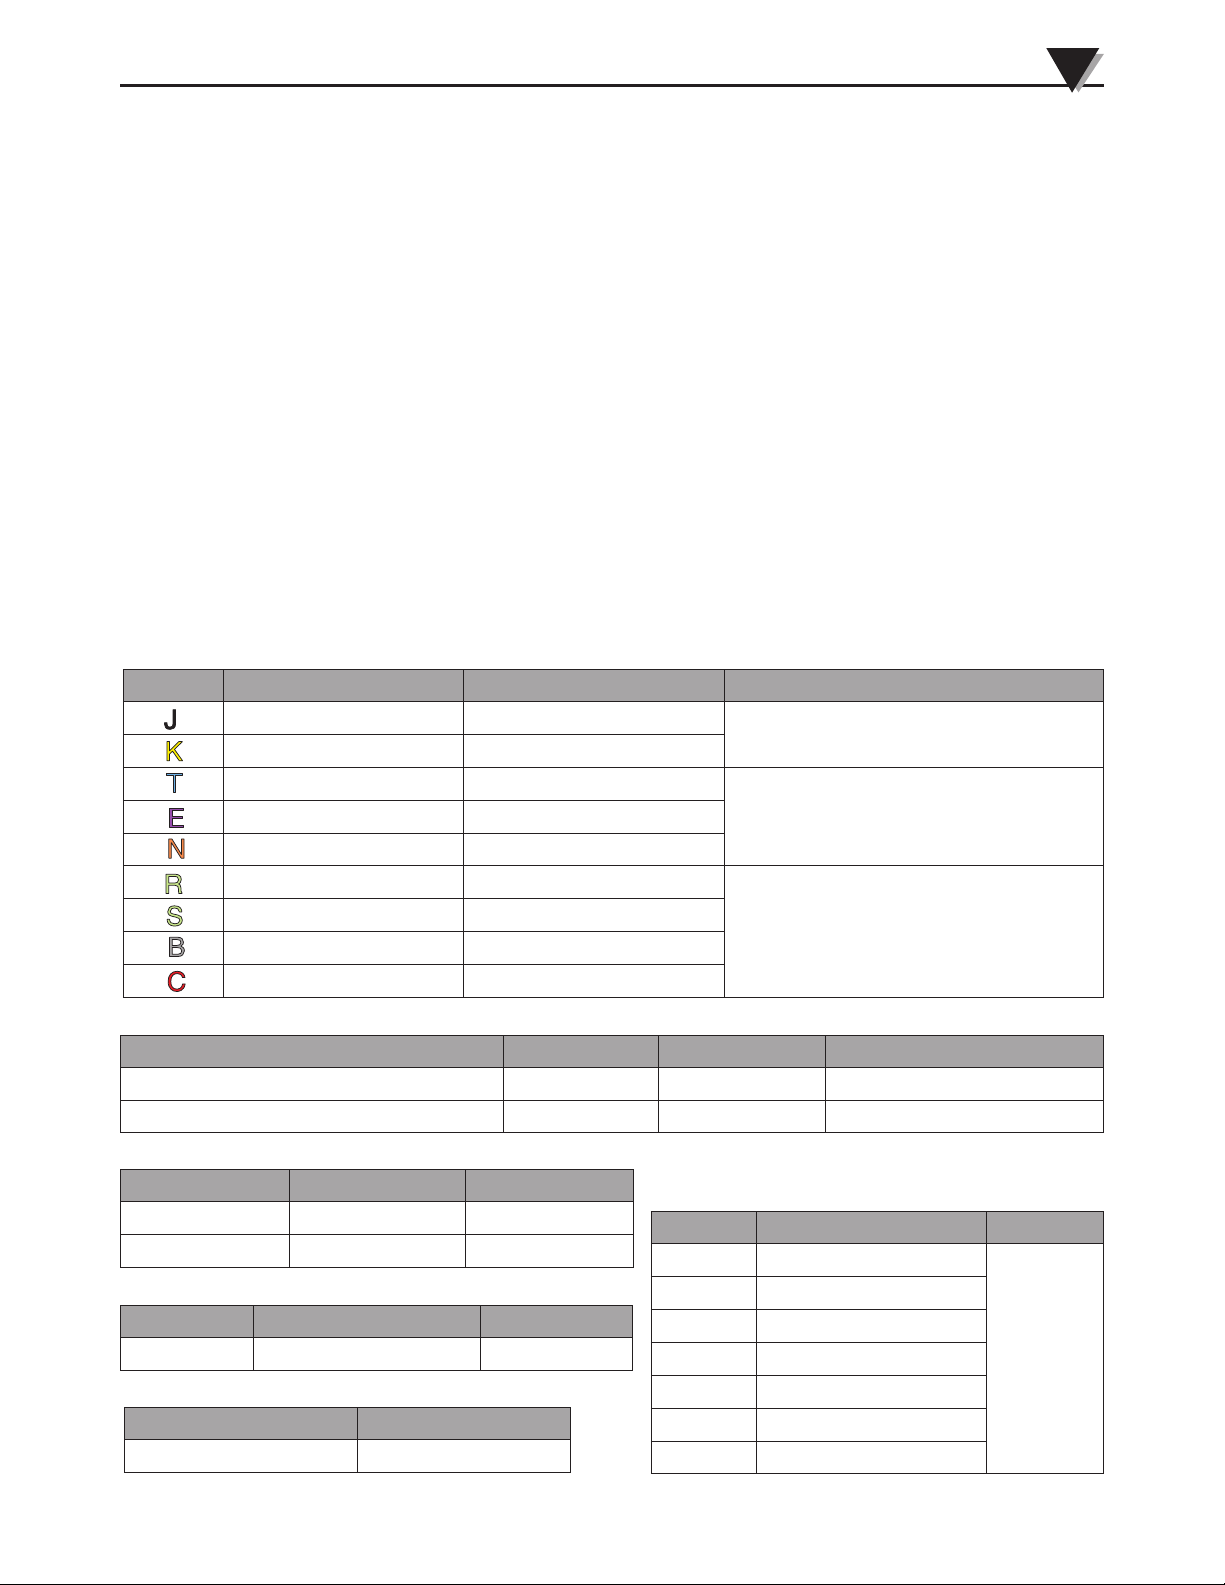
7.2 Inputs
Number of Analog Inputs: 8 or 16
Sampling Rate
Maximum Sampling Rate per Number of Channels
Logging Rate
Maximum logging Rate per Number of Channels
(Analog and Digital):
1 Channel: 125 s/sec
2 Channels: 50 s/sec
4 Channels: 25 s/sec
8 Channels: 10 s/sec
16 Channels: 5 s/sec
(Analog and Digital):
1 Channel: 125 s/sec
2 Channels: 50 s/sec
4 Channels: 25 s/sec
8 Channels: 10 s/sec
16 Channels: 5 s/sec
Specifications
7
Thermocouple
Type Range (°C) Range (°F) Accuracy
J -200 to 1100°C -328 to 2012°F
±(0.15% of reading +1.1°C)
K -200 to 1370°C -328 to 2300°F
T -200 to 400°C -328 to 752°F
E -200 to 1000°C -328 to 1832°F
±(0.15% of reading + 1.7°C)
N -100 to 1300°C -148 to 2372°F
R 0 to 1760°C 32 to 3200°F
S 0 to 1760°C 32 to 3200°F
±(0.15% of reading + 2.0°C)
B 500 to 1820°C 932 to 3308°F
C 0 to 2315°C 32 to 4200°F
RTD
Type Range (°C) Range (°F) Accuracy
Pt 100, Pt 500, Pt 1000 (0.00385 curve) -200 to 850°C -328 to 1562°F ±(0.25% of reading +1°C)
Pt 100, Pt 500, Pt 1000 (0.00392 curve) -200 to 660°C -328 to 1220°F ±(0.25% of reading +1°C)
Thermistor
Type Range Accuracy
2252 Ω -30 to 150°C ±1°C
10,000 Ω -5 to 150°C ±1°C
Current
Range Measurement Range
20mA -20 to 20mA ±0.1% of FS
Frequency
Measurement Range Accuracy
0 to 250 KHz ±2 Hz
Voltage
Range Measurement Range Accuracy
50mV -50 to 50mV
100mV -100 to 100mV
1V -1.00 to 1.00V
5V -5.00 to 5.00V
±0.1%
of FS
10V -10.00 to 10.00V
20V -20.00 to 20.00V
50V -50.00 to 50.00V
7-2
Page 80

7
Specifications
Measurement Accuracy
*At room temperature after 30 minute warm up period.
Input Type: Thermocouple, RTD, Thermistor, Voltage, Current, Strain Gage
Strain Gage Input: Only Channels 1, 2, 3, 4, 9, 10, 11, 12 are available.
Frequency Update Rate: 250 msec
Digital Input and Functions: Frequency, volumetric flow rate, totalization,
resettable counter
Virtual Math Channels 1 to 16: Math equation of any two physical channels
Filter:
•Per channel selectable moving average filter: None, 2, 5, 10, 20 or 50 samples
Resolution: One to four decimal places depending on the Input type
Statistics: Peak to peak, average, minimum, maximum, RMS
Input Sampling/Logging Rate: 125 s/sec (1 Channel), 50 s/sec (2 Channels),
25 s/sec (4 Channels), 10 s/sec (8 Channels), 5 s/sec, 1 s/sec, 12 s/min,
6 s/min, 2 s/min, 1 s/min, 12 s/hr, 6 s/hr, 2 s/hr, 1 s/hr (For All Channels)
Logging Mode: Interval, average
Trigger Conditions (Start & Stop): Timer, date and time, weekday and time,
alarm output, external trigger
Logging Condition: On command or trigger condition
7.3 Functions
Display
Views: Waveform, waveform and table, table only, digital, slide show
Display Channels: 4 channels per group – 4 groups
Stored Files: Screen capture and log (internal, SD card, USB drive)
Data Review: Up to any 4 channels – scroll or page right and left, zoom in,
zoom out, annotate
Device Settings:
• General – Set current Time & Date
• Display Option – Screen Timeout, Background & Grid color, Brightness,
Slide show timing, Key sound, Calibrate Touch screen
• Diagnostics – Analog, Digital, Power shut down test & generate report
• User Management – Admin, Normal User (Set User ID & Password)
7-3
• About – Firmware Upgrade
Help:
• Help screen for every menu screen
Page 81

Specifications
Virtual Math Channels: Up to 16 virtual channels can be created.
Statistics: Peak to Peak, Average, Minimum, Maximum, RMS
Triggers
Trigger Types:
• Start, Stop, Repeat
Trigger Conditions:
• Timer, Date & Time, Weekday & Time, Alarm Output, External Trigger
Logging
Logging Modes:
• Interval, Average
Logging Conditions:
• On demand or trigger condition
Digital input functions:
7
Frequency, Volumetric flow, Totalization, Resettable counter
7.4 Communication
Protocol: Modbus TCP / IP
7.5 External I/O:
Alarm Outputs: 4 open collector alarm outputs rated for 0.5A @ 30 Vdc with
audible alarm buzzer
Digital Outputs: 4 open collector digital outputs rated to 30 mA @ 5 Vdc
logically tied to alarm outputs
Digital Inputs: 4 Schmitt trigger based inputs
• 0 to 24 Vdc single ended, grounded input range
• Logic high threshold 2.5 V; Logic low threshold 1.5 V
• Contact closure detection
• Maximum input frequency: 250 kHz
Power Input to Digital I/O Isolation: 1.5 kVrms
Alarm Condition: High, Low, Window In, Window Out, Open Sensor
On Alarm Event: Map to 4 Alarm outputs, Sound Buzzer, Take Screen shot
Alarm Type: Latch, Non-Latch
Alarm per Channel: Two
7-4
Page 82
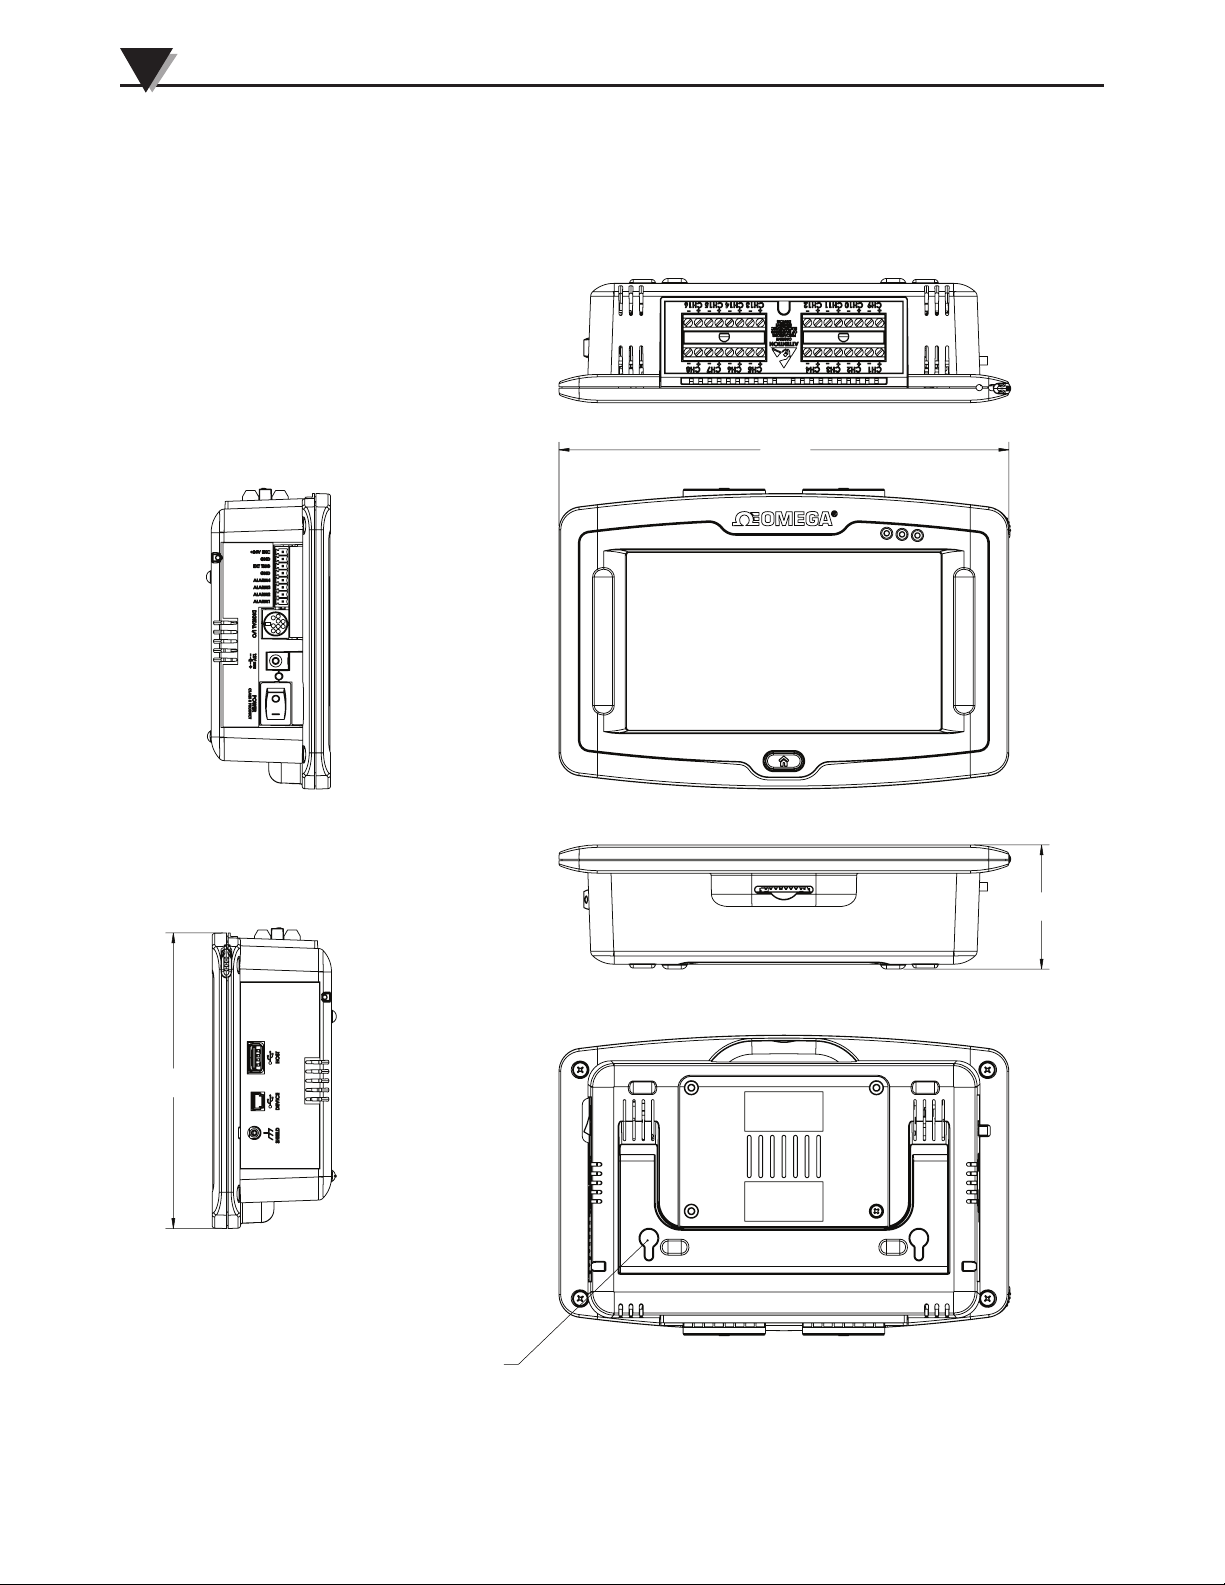
146
(5.75)
SYM
REVISION RECORD
7
REVISIONS
SYM
REVISION RECORD
ECN
DATE
DR
CHK
ENG
Specifications
7.6 Dimensions
Dimensions: mm (inch)
222 (8.75)
61.4
(2.42)
7-5
146
(5.75)
M4 INSERT SCREW
Page 83

International Approvals
8 International Approvals
CE Conformity:
The OM-DAQXL has been designed to meet requirements as outlined in European
Community EMC Directive EN61326. Five ferrite cores (PN: OM-DAQXL-RF) are
included in the OM-DAQXL package. When using thermocouple temperature sensors
with the OM-DAQXL it is recommended to pass the thermocouple through the supplied
ferrite two turns before connecting it to the device.
When communicating with the OM-DAQXL via Ethernet it is recommended to pass the
Ethernet cable through a ferrite two turns before connecting it to the OM-DAQXL. It is
not recommended to have the AC adapter plugged in during normal operation. The AC
adapter is intended to charge the battery only.
Emissions:
8
EN 61326-1 Class A
Immunity:
EN61000-4-3
EN61000-4-4
EN61000-4-6
8-1
Page 84

WARRANTY/DISCLAIMER
OMEGA ENGINEERING, INC. warrants this unit to be free of defects in materials and workmanship for a
period of 13 months from date of purchase. OMEGA’s WARRANTY adds an additional one (1) month grace
period to the normal one (1) year product warranty to cover handling and shipping time. This ensures
that OMEGA’s customers receive maximum coverage on each product.
If the unit malfunctions, it must be returned to the factory for evaluation. OMEGA’s Customer Service
Department will issue an Authorized Return (AR) number immediately upon phone or written request.
Upon examination by OMEGA, if the unit is found to be defective, it will be repaired or replaced at no
charge. OMEGA’s WARRANTY does not apply to defects resulting from any action of the purchaser,
including but not limited to mishandling, improper interfacing, operation outside of design limits,
improper repair, or unauthorized modification. This WARRANTY is VOID if the unit shows evidence of
having been tampered with or shows evidence of having been damaged as a result of excessive corrosion;
or current, heat, moisture or vibration; improper specification; misapplication; misuse or other operating
conditions outside of OMEGA’s control. Components in which wear is not warranted, include but are not
limited to contact points, fuses, and triacs.
OMEGA is pleased to offer suggestions on the use of its various products. However,
OMEGA neither assumes responsibility for any omissions or errors nor assumes liability for
any damages that result from the use of its products in accordance with information provided
by OMEGA, either verbal or written. OMEGA warrants only that the parts manufactured by the
company will be as specified and free of defects. OMEGA MAKES NO OTHER WARRANTIES OR
REPRESENTATIONS OF ANY KIND WHATSOEVER, EXPRESSED OR IMPLIED, EXCEPT THAT OF
TITLE, AND ALL IMPLIED WARRANTIES INCLUDING ANY WARRANTY OF MERCHANTABILITY
AND FITNESS FOR A PARTICULAR PURPOSE ARE HEREBY DISCLAIMED. LIMITATION OF
LIABILITY: The remedies of purchaser set forth herein are exclusive, and the total liability of
OMEGA with respect to this order, whether based on contract, warranty, negligence,
indemnification, strict liability or otherwise, shall not exceed the purchase price of the
component upon which liability is based. In no event shall OMEGA be liable for
consequential, incidental or special damages.
CONDITIONS: Equipment sold by OMEGA is not intended to be used, nor shall it be used: (1) as a “Basic
Component” under 10 CFR 21 (NRC), used in or with any nuclear installation or activity; or (2) in medical
applications or used on humans. Should any Product(s) be used in or with any nuclear installation or
activity, medical application, used on humans, or misused in any way, OMEGA assumes no responsibility
as set forth in our basic WARRANTY/DISCLAIMER language, and, additionally, purchaser will indemnify
OMEGA and hold OMEGA harmless from any liability or damage whatsoever arising out of the use of the
Product(s) in such a manner.
RETURN REQUESTS/INQUIRIES
Direct all warranty and repair requests/inquiries to the OMEGA Customer Service Department. BEFORE
RETURNING ANY PRODUCT(S) TO OMEGA, PURCHASER MUST OBTAIN AN AUTHORIZED RETURN (AR)
NUMBER FROM OMEGA’S CUSTOMER SERVICE DEPARTMENT (IN ORDER TO AVOID PROCESSING
DELAYS). The assigned AR number should then be marked on the outside of the return package and on any
correspondence.
The purchaser is responsible for shipping charges, freight, insurance and proper packaging to prevent
breakage in transit.
FOR WARRANTY RETURNS, please have the
following information available BEFORE contacting
OMEGA:
1. Purchase Order number under which the product
was PURCHASED,
2. Model and serial number of the product under
warranty, and
3. Repair instructions and/or specific problems
relative to the product.
OMEGA’s policy is to make running changes, not model changes, whenever an improvement is possible. This affords our
customers the latest in technology and engineering.
OMEGA is a trademark of OMEGA ENGINEERING, INC.
© Copyright 2017 OMEGA ENGINEERING, INC. All rights reserved. This document may not be copied, photocopied,
reproduced, translated, or reduced to any electronic medium or machine-readable form, in whole or in part, without the prior
written consent of OMEGA ENGINEERING, INC.
FOR NON-WARRANTY REPAIRS, consult
OMEGA for current repair charges. Have
the following information available BEFORE
contacting OMEGA:
1. Purchase Order number to cover the COST
of the repair,
2. Model and serial number of the product, and
3. Repair instructions and/or specific problems
relative to the product.
Page 85

Where Do I Find Everything I Need for
Process Measurement and Control?
OMEGA…Of Course!
Shop online at omega.com
TEMPERATURE
MU
Thermocouple, RTD & Thermistor Probes, Connectors,
Panels & Assemblies
MU
Wire: Thermocouple, RTD & Thermistor
MU
Calibrators & Ice Point References
MU
Recorders, Controllers & Process Monitors
MU
Infrared Pyrometers
PRESSURE, STRAIN AND FORCE
MU
Transducers & Strain Gages
MU
Load Cells & Pressure Gages
MU
Displacement Transducers
MU
Instrumentation & Accessories
FLOW/LEVEL
MU
Rotameters, Gas Mass Flowmeters & Flow Computers
MU
Air Velocity Indicators
MU
Turbine/Paddlewheel Systems
MU
Totalizers & Batch Controllers
SM
pH/CONDUCTIVITY
MU
pH Electrodes, Testers & Accessories
MU
Benchtop/Laboratory Meters
MU
Controllers, Calibrators, Simulators & Pumps
MU
Industrial pH & Conductivity Equipment
DATA ACQUISITION
MU
Communications-Based Acquisition Systems
MU
Data Logging Systems
MU
Wireless Sensors, Transmitters, & Receivers
MU
Signal Conditioners
MU
Data Acquisition Software
HEATERS
MU
Heating Cable
MU
Cartridge & Strip Heaters
MU
Immersion & Band Heaters
MU
Flexible Heaters
MU
Laboratory Heaters
ENVIRONMENTAL
MONITORING AND CONTROL
MU
Metering & Control Instrumentation
MU
Refractometers
MU
Pumps & Tubing
MU
Air, Soil & Water Monitors
M
U
Industrial Water & Wastewater Treatment
MU
pH, Conductivity & Dissolved Oxygen Instruments
M5570/1218
 Loading...