

Page 1

Extended Warranty
Program
SM
®
OM-DAQLINK-TEMP
User’s Guide
Shop online at
®
omega.com
e-mail: [email protected]
For latest product manuals:
omegamanual.info
OM-DAQLINK-TEMPRH
OM-DAQLINK-TEMP
AND OM-DAQLINK-TEMPRH
Data Loggers
Page 2

OMEGAnet®Online Service Internet e-mail
®
omega.com [email protected]
Servicing North America:
U.S.A.: Omega Engineering, Inc., One Omega Drive, P.O. Box 4047
ISO 9001 Certified Stamford, CT 06907-0047 USA
Canada: 976 Bergar
Laval (Quebec), H7L 5A1 Canada
Toll-Free: 1-800-826-6342 TEL: (514) 856-6928
FAX: (514) 856-6886 e-mail: [email protected]
For immediate technical or application assistance:
U.S.A. and Canada: Sales Service: 1-800-826-6342/1-800-TC-OMEGA
Customer Service: 1-800-622-2378/1-800-622-BEST
Engineering Service: 1-800-872-9436/1-800-USA-WHEN
Mexico/ En Español: 001 (203) 359-7803 FAX: 001 (203) 359-7807
Latin America: [email protected] e-mail: [email protected]
®
®
®
Servicing Europe:
Benelux: Managed by the United Kingdom Office
Czech Republic: Frystatska 184
733 01 Karviná, Czech Republic
Toll-Free: 0800-1-66342 TEL: +420-59-6311899
FAX: +420-59-6311114 e-mail: [email protected]
France: Managed by the United Kingdom Office
Toll-Free: 0800 466 342 TEL: +33 (0) 161 37 29 00
FAX: +33 (0) 130 57 54 27 e-mail: [email protected]
Germany/ Austria: Daimlerstrasse 26
D-75392 Deckenpfronn, Germany
Toll-Free: 0800 6397678 TEL: +49 (0) 7056 9398-0
FAX: +49 (0) 7056 9398-29 e-mail: [email protected]
United Kingdom: OMEGA Engineering Ltd.
ISO 9001 Certified One Omega Drive, River Bend Technology Centre, Northbank
Irlam, Manchester M44 5BD United Kingdom
Toll-Free: 0800-488-488 TEL: +44 (0) 161 777-6611
FAX: +44 (0) 161 777-6622 e-mail: [email protected]
It is the policy of OMEGA Engineering, Inc. to comply with all worldwide safety and EMC/EMI
regulations that apply. OMEGA is constantly pursuing certification of its products to the European New
Approach Directives. OMEGA will add the CE mark to every appropriate device upon certification.
The information contained in this document is believed to be correct, but OMEGA accepts no liability for any
errors it contains, and reserves the right to alter specifications without notice.
WARNING: These products are not designed for use in, and should not be used for, human applications.
Page 3

OM-DAQLINK Series
Data Loggers
Page 4

Table of Contents
CHAPTER 1: INTRODUCTION 1
CHAPTER 2: OM-DAQLINK OVERVIEW 3
2.1. The OM-DAQLINK System 3
2.1.1. The Data Logger 3
2.1.2. Hardware Accessories 4
CHAPTER 3: OM-DAQLINK IMPLEMENTATION GUIDE 5
3.1. Pre-setup Requirements 5
3.2. Launching the Software 5
3.3. Connecting the Logger 6
3.4. Charging OM-DAQLINK Loggers 7
3.5. Loading Map View Background 7
3.6. Configuring the Logger 8
3.7. Viewing Data 9
3.7.1. Online Data Views 9
3.7.2. Logger Tooltip 10
3.7.3. Sensor View 10
3.8. Downloading Data 11
CHAPTER 4: OM-DAQLINK HARDWARE OVERVIEW 12
4.1. Data Logger Front Panel Layout 12
4.1.1. OM-DAQLINK-TEMP and OM-DAQLINK-TEMPRH 12
4.2. Data Logger External Connections 12
4.2.1. OM-DAQLINK-TEMP and OM-DAQLINK-TEMPRH 12
4.3. Data Logger Sensor Overview 13
4.3.1. Internal Sensor Types 13
4.3.2. External Sensor Types 14
4.3.3. Sensor Connection 15
4.3.4. Programming Limitations for OM-DAQLINK-TEMP and OM-DAQLINK-TEMPRH 15
4.3.5. External Alarm Output 16
4.3.6. Polarity 17
4.3.7. Frequency/Pulse Counter 17
4.3.8. User Defined Sensors 17
4.3.9. Sensor Alarms 17
4.3.10. Sensor Calibration 17
4.4. Unit Serial Number and Comment 18
Page 5

4.5. Power Supply 18
4.5.1. OM-DAQLINK-TEMP and OM-DAQLINK-TEMPRH Data Loggers 18
4.5.2. Power Adapter 19
4.5.3. Data Logger Battery Life 19
4.6. USB Communication Cable 19
4.7. OM-DAQLINK Keypad Overview 20
4.7.1. OM-DAQLINK-TEMP and OM-DAQLINK-TEMPRH Keypad 20
4.8. Operating the OM-DAQLINK-TEMP and OM-DAQLINK-TEMPRH 20
4.8.1. Turning on the Unit 20
4.8.2. Display Shutdown 21
4.8.3. Main Menu Options 21
4.8.4. Additional Logger Screens 23
CHAPTER 5: USING THE DATASUITE SOFTWARE 25
5.1. Installing DataSuite Software 25
5.1.1. System Requirements 25
5.1.2. Language Support 25
5.1.3. Installation Procedure 25
5.1.4. Working with Multiple User Accounts 29
5.1.5. Installation Troubleshooting 29
5.2. DataSuite Software Registration 29
5.2.1. Software Registration Process 30
5.3. System Password 33
5.4. DataSuite Software Layout 33
5.4.1. Map View 33
5.4.2. Sensor View 34
5.4.3. History View 36
5.4.4. Data Map 37
5.4.5. DataSuite Toolbar Icons 37
5.4.6. Map View Icons 38
5.4.7. Graph (Lower) Toolbar Icons 39
5.4.8. Data Map Icons 40
5.5. File Menu Items 41
5.5.1. Open 41
5.5.2. Open Project File 41
5.5.3. Save Project 41
5.5.4. Save Project As 41
5.5.5. Backup System Files 41
5.5.6. Restore System Files 41
5.5.7. Print Map View 42
5.5.8. Exit 42
5.6. Tools Menu Items 42
5.6.1. Define Sensor 42
5.6.2. Switch Sensor View Mode 43
5.6.3. Lock Map View 43
5.6.4. Options Menu 43
Page 6

5.6.5. Manage Contacts 43
5.6.6. Email Alarm Notifications 43
5.6.7. SMS Alarm Notifications 43
5.6.8. Firmware Update Center 44
5.7. Tools > Options Menu Items 44
5.7.1. Preferences Tab 44
5.7.2. Device Settings Tab 47
5.7.3. Email Settings Tab 47
5.7.4. SMS Settings Tab 49
5.7.5. Analysis Menu Items 50
5.8. Devices Menu Items 52
5.8.1. Detect Device 52
5.8.2. Stop All 53
5.8.3. Run All 53
5.9. Search Devices 53
5.10. Data Recovery 54
5.11. Saving Data 54
5.12. Viewing Archived (Offline) Data 55
5.13. Viewing Online Data 57
5.13.1. Showing/Hiding the Data Sets 57
5.14. Working in Map View 58
5.14.1. Loading Map View Wallpaper 58
5.14.2. Printing the Map View 59
5.14.3. Displaying Icon Name Tags 59
5.14.4. Moving Icons around the Screen 59
5.14.5. OM-DAQLINK Logger Icon Connection Options 59
5.15. Configuring the Logger 60
5.15.1. OM-DAQLINK Setup Window – Device Setup Tab 60
5.15.2. OM-DAQLINK Alarm Setup Tab 63
5.16. Alarm Notifications Setup 65
5.16.1. Contacts Tab 66
5.16.2. Groups Tab 67
5.16.3. Notifications Setup Tab 68
5.16.4. Email and SMS Notification Formats 68
5.17. Calibration 69
5.17.1. Introduction to Calibration 69
5.17.2. Calibrating the Data Logger 71
5.17.3. Performing a Two-point Calibration 72
5.17.4. Performing an Offset Calibration 72
5.17.5. Setting the Offset to a Specific Input 72
5.17.6. Calibrating the Internal Temperature Sensor on the OM-DAQLINK-TEMP 73
5.17.7. Calibrating the External PT-100 Sensor Input 73
5.17.8. Saving Calibration Settings 73
5.17.9. Loading Calibration Settings 73
Page 7

5.18. Analyzing the Data 74
5.18.1. Using the Graph Features 74
5.18.2. Changing the Graph, Table or Statistics View Header 78
5.18.3. Statistical Analysis 78
5.19. Exporting Data to Excel or CSV Formats 78
5.20. Printing the Data 79
5.21. Reports Module 80
5.21.1. Creating a Report Profile 80
5.21.2. Report Types 82
5.21.3. Removing a Report Profile 84
5.21.4. The Report Browser 84
CHAPTER 6: UPDATING DATASUITE SOFTWARE AND FIRMWARE 85
6.1. Using the Uptodata Client 85
6.2. Updating Device Firmware 87
6.2.1. Downloading the Firmware File 87
6.2.2. Using the Firmware Update Center 87
6.2.3. Manual Firmware Update via Map View Icon 89
6.2.4. Cancelling Firmware Update 90
6.2.5. Interrupted Firmware Update 90
APPENDIX A: OM-DAQLINK SPECIFICATIONS 91
A.1. Data Logger Input Types 91
A.2. OM-DAQLINK-TEMP and OM-DAQLINK-TEMPRH Outputs 92
A.3. Logger Input Specifications OM-DAQLINK-TEMP and OM-DAQLINK-TEMPRH 92
A.4. General Specifications 93
A.5. System Requirements 94
APPENDIX B: SAFETY INFORMATION 95
Page 8

Chapter 1:
Introduction
Light, Portable and Independent Logging
With built-in temperature and humidity sensors, plus four external probe inputs the OMDAQLINK Series standalone data loggers ensure a low cost, reliable and accurate solution.
OM-DAQLINK Series data loggers are 16-bit, mobile data acquisition devices for continuous
indoor or outdoor data monitoring.
The OM-DAQLINK Series is comprised of two data logger models, measuring a broad range of
parameters on four external inputs for direct measurement and recording of PT-100,
thermocouple, 0 to 1 V, 4 to 20 mA, contact, frequency and pulse sensors, as well as internal
temperature and relative humidity sensors.
With its high resolution and fast Analog to Digital converter (ADC), OM-DAQLINK Series data
loggers meet the majority of data acquisition requirements in most industrial applications. Every
OM-DAQLINK Series data logger is embedded with a unique serial number and can be loaded
with a descriptive comment for safe identification. An internal clock and calendar keeps track of
the time and date of every sample measured.
OM-DAQLINK Series data loggers can automatically activate external alarm events when data
is outside a specified range. Email and SMS notifications can be sent to predefined contacts.
OM-DAQLINK key benefits include:
Real-time logging - Online operation with data results on screen
Independence - Manual or PC operation with on-site monitoring via two-row LCD display
Intuitively - Simple keypad and easy-to-navigate menus
Long life - Low-power consumption and rechargeable battery lasting up to six months
Flexibility - Four alarm levels with visual LCD, and audible alarms
Non-stop logging - Continuous data storage to large onboard memory and periodic USB
downloads
DataSuite Software Support
The OM-DAQLINK system is powered by the powerful DataSuite software. The Windows
based software is the central management interface of the OM-DAQLINK network. When
connected via USB cable to the PC, OM-DAQLINK data can be monitored online and displayed
in real-time graphs or tables. Analyze data with various mathematical tools, or export data to a
spreadsheet.
The software also enables you to configure, calibrate or update the firmware of OM-DAQLINK
units via direct USB connection.
DataSuite provides one software platform for a wide range of Omega products in addition to the
OM-DAQLINK data loggers, such as the OM-DATANET wireless system and OM-MICROLITE
and OM-MICROLOGPRO portable, standalone loggers. DataSuite lets you monitor and
compare data from multiple systems in a singular, uniform view.
1
Page 9

DataSuite key benefits include:
Software GUI based on proven Omega platforms
Multiple data view features
Map view displaying unit location, signal path and strength
Alarm features with 4 alarm levels sending email and SMS notifications
Reporting module for creating and generating reports with selected distribution
Analysis features including dew point analysis, FO Pasteurization, histogram, statistics with
export to Excel and CSV formats
2
Page 10

OM-DAQLINK Data Loggers
Part Number: OM-DAQLINK-TEMP
Part Number: OM-DAQLINK-TEMPRH
Four external channel data logger with
two internal sensors, Humidity and
Temperature
Four external channel data logger with
internal Temperature sensor
Memory Capacity: ~59,000 samples
Power supply: AC or battery operated
Memory Capacity: ~59,000 samples
Power supply: AC or battery operated
Chapter 2:
OM-DAQLINK Overview
2.1. The OM-DAQLINK System
The basic OM-DAQLINK system contains at least one of the following units:
OM-DAQLINK data logger – Part Number OM-DAQLINK-TEMP or OM-DAQLINK-TEMPRH
Mini-USB communication cable
Power adapter (one per OM-DAQLINK unit ordered)
DataSuite software CD containing user guide
2.1.1. The Data Logger
There are two data logger models compatible with the OM-DAQLINK system. These loggers
support up to four external sensors and two internal sensors, temperature and humidity,
depending on the specific model. Data is recorded and stored to the logger’s internal memory
and transmitted over the network to the DataSuite software running on the PC.
The data logger is programmed to consume as little power as possible during operation, in order
to conserve the battery life. When not transmitting or recording data the units are in sleep mode
and they wake up when needed.
The battery for the OM-DAQLINK-TEMP and OM-DAQLINK-TEMPRH is rechargeable and can
run up to several months on one charge, depending on the logger configuration.
Note: Battery life depends on the logger sampling rate, transmission rate, type of sensor, and
number of measured sensors.
3
Page 11

2.1.2. Hardware Accessories
The OM-DAQLINK system includes the following accessories:
Mini-USB cable for connecting data logger to PC
Power adapter to power the data logger
4
Page 12

Chapter 3:
OM-DAQLINK Implementation Guide
Omega recommends first time users of the OM-DAQLINK system read this chapter before
drilling down into the many features of the system described later in the user guide. The
Implementation Guide will give you a clear understanding of the basic aspects of setting up the
system, and getting the data logger up and running.
3.1. Pre-setup Requirements
Prior to commencing with the OM-DAQLINK implementation you must have the following
requirements in place:
PC
24/7 availability, if online data monitoring is required
Reliable AC power
Sufficient hard disk space to store loggers’ data
One free USB port
OM-DAQLINK devices
At least one OM-DAQLINK logger OM-DAQLINK-TEMP or OM-DAQLINK-TEMPRH.
Mini-USB cable
The mini-USB cable connects the data logger to the PC for logger configuration and data
download (and is supplied with the DataSuite software kit).
3.2. Launching the Software
1. Install the DataSuite software on the PC workstation. Refer to section 5.1: Installing
DataSuite Software on page 25 for more details.
2. Once the software and associated components have been installed, launch DataSuite from
your DataSuite desktop shortcut.
3. The main DataSuite window is launched. The default view is called Map View.
5
Page 13

Figure 1: Main DataSuite window
4. Check for DataSuite updates. Go to Help > Check for Updates from the DataSuite main
menu to check for newer versions of the OM-DAQLINK module software and firmware
released since you purchased your system. For more details on the Update feature go to
Chapter 6: Updating DataSuite Software and Firmware.
3.3. Connecting the Logger
Note: Multiple OM-DAQLINK loggers may be detected by the PC at a time.
1. Only once the DataSuite software and USB driver have been installed, connect the OMDAQLINK data logger (OM-DAQLINK-TEMP or OM-DAQLINK-TEMPRH) to the Omegasupplied power adapter.
Note: Only use adapters provided by Omega. Use of the wrong adapter could damage your
OM-DAQLINK units.
2. Turn on the unit by pressing the Scroll button on the front keypad. The unit will
beep when turned on.
3. Connect the mini-USB cable to the computer and to the data logger’s mini-USB port.
4. From the DataSuite main menu, go to Devices > Detect Device. The data logger icon will
appear in the Map View indicating that the logger is detected.
6
Page 14

Figure 2: Adding data logger icon to Map View
Note: If the logger is not recognized by the software try connecting the mini-USB cable to
another USB port on the PC. Or select Devices > Detect Device again in the main menu.
5. Should you disconnect the logger’s USB cable or power adapter (and the battery eventually
dies), the logger icon will be grayed out:
Note: You can move the logger icon elsewhere on the screen by going to Tools > Lock Map
View and unselecting this option.
3.4. Charging OM-DAQLINK Loggers
This section refers to charging the OM-DAQLINK-TEMP or OM-DAQLINK-TEMPRH loggers.
Note: Only use adapters provided by Omega. Use of the wrong adapter could damage your
OM-DAQLINK units.
If the loggers will run from the battery supply make sure to first charge each of the loggers for 16
hours before use in order maximize the battery life. A fully charged battery can last several
months, depending on your logger configuration.
If the loggers will run from the AC power supply, when first connected to the AC adapter the
logger will always initiate the 16 hour charge cycle.
Note: For loggers measuring data with the internal temperature sensor, it is critical to note that
during the charge cycle the logger will heat up thereby causing the internal temperature sensor
reading to rise up to 10 ˚C above ambient temperature. Once the charging process is complete,
the logger will cool down and the internal temperature sensor readings will return to normal.
For loggers remaining connected to AC power, to prevent the logger from heating up again
following the initial charge cycle, the logger will receive a one minute trickle charge each day
rather than stay continually charged. This is sufficient to ensure the logger doesn’t selfdischarge and will maintain the logger’s full charge status.
3.5. Loading Map View Background
Load an image into the DataSuite software showing a map of your facility in order to place the
Logger icons in their relative positions. As you deploy more standalone loggers, this will prove
very helpful.
Double click the Map View background to browse to the image directory and load the image.
Remember to unlock the Map View in order to move the icons around.
7
Page 15

Right-click the Map View background and two options will be available: Load Wallpaper
and Reset Wallpaper, which resets to the default Omega wallpaper.
3.6. Configuring the Logger
Once the software has detected the OM-DAQLINK logger, you must configure the unit in order
to start acquiring data.
1. Right-click on the Logger icon. Select Setup from the context menu.
2. The Setup window will be launched.
Figure 3: OM-DAQLINK Logger Setup window
This dialog provides non-editable information such as the serial number, battery level, and
firmware version of the current unit.
On the Device Setup and Alarm Setup tabs, the user is able to configure the following
parameters:
Unit's comment
Sampling rate
Memory State
Averaging points
Temperature units °C/°F (on the logger LCD)
Anti-tamper mode
Active sensors
Custom sensors' names
Alarm levels
Alarm duration
8
Page 16

Alarm delay
Alarm pre delay
3. Select the Memory State, Online or Optimized Memory Modes.
4. Select the sensors you wish to connect to the logger for data acquisition. It doesn’t matter
which order you select the sensors. You may only have Input 4 selected, for example, and
Inputs 1 to 3 left unselected.
5. Select the sampling rate anywhere from 1 every second to 1 every 18 hours.
6. Unless you have Alarm levels you wish to edit (see the Alarms Setup tab), click either Setup
and Run (to send the setup and immediately log data), or Setup Only (to send the setup
but only log data at your command).
7. If you selected Setup Only in step 5, right-click the Logger icon and select Run from the
context menu to start logging data or click in the main tool bar.
8. The Logger icon will appear as follows when in Run mode: .
9. To stop the logger, right-click the Logger icon and select Stop from the context menu.
Note: Running the logger clears the logger memory. All previously recorded data will be erased
when you begin a new logging session.
3.7. Viewing Data
Once you run the logger, you have several ways of viewing the online data that is being
acquired.
Online graph/table/statistics views
Logger icon tooltip
Sensor view
3.7.1. Online Data Views
Double clicking the Logger icon or selecting Display Data in the Logger icon context menu will
open the online graph.
This graph is updated in real-time with the newly recorded data.
You can switch between Graph, Table and Statistics views to view the data in different formats.
Figure 4: Online data – Graph view
9
Page 17

Figure 5: Online data – Table view
Figure 6: Online data – Statistics view
3.7.2. Logger Tooltip
Close the online data window and return to Map View. Scroll over the Logger icon and you will
see a tooltip displaying the relevant logger information, including real-time data.
Figure 7: Logger tooltip
This tool-tip is updated with every newly recorded sample.
3.7.3. Sensor View
Click the Sensor View icon in the tool bar to switch to this view. Here, you can monitor the
data by viewing data display of each individual sensor, rather than of each logger.
10
Page 18

Figure 8: Sensor view
If the sensor is in alarm, the sensor box will change color from green to red (just as the
Logger icon would).
Double-clicking the individual sensor box will open the data in the online Graph view.
3.8. Downloading Data
If the logger is being used as a standalone device you will have to connect it to the computer via
USB cable in order to download the data to the software.
1. Connect logger to PC and go to Devices > Detect Device in the main menu.
2. To download data right-click the logger icon and select Download Data.
3. View the downloaded data by double-clicking the logger icon.
11
Page 19

Figure 9: OM-DAQLINK-TEMP data logger front panel
LCD screen
Displays logger status, logger data, and Min/Max values.
Menu/Enter button
Use to enter logger menu options and to execute logger commands.
Scroll button
Use to scroll though menu items and to power on unit.
Scroll button
Menu/Enter button
LCD screen
Chapter 4:
OM-DAQLINK Hardware Overview
This chapter details the hardware features of the OM-DAQLINK data loggers.
4.1. Data Logger Front Panel Layout
4.1.1. OM-DAQLINK-TEMP and OM-DAQLINK-TEMPRH
Apart from the color scheme, the OM-DAQLINK-TEMP and OM-DAQLINK-TEMPRH data
logger models have the same front panel design.
4.2. Data Logger External Connections
4.2.1. OM-DAQLINK-TEMP and OM-DAQLINK-TEMPRH
External connections of the OM-DAQLINK-TEMP and OM-DAQLINK-TEMPRH are exactly the
same.
12
Page 20

Figure 10: OM-DAQLINK-TEMPRH data logger external connections
Mini USB Port
To enable communication between logger and PC, for configuration and data
download.
12 V Power Socket
To connect logger to external power supply (negative center).
Sensor Inputs
Pluggable screw terminal blocks marked In-1 to In-4 (from left to right), to
connect wide range of sensor types for data acquisition. All four inputs can be
used simultaneously. Sensors can be connected in any order.
To connect a sensor to the OM-DAQLINK data logger, unplug the screw
terminal, connect the sensor’s wires to the terminals, and then plug the
terminal back to the corresponding socket on the input block.
Excitation socket
Output power socket used to power external sensors, power derived directly
from the external power supply adaptor.
Sensor
Measurement
Range
Accuracy
Logger Model
Digital Humidity
5% to 95%
±3% (in DataSuite
software)
±4% (on logger LCD)
OM-DAQLINKTEMPRH
Mini USB port
12 V power socket
Negative Center
Four sensor
inputs
Excitation
Mini USB port
12 V power socket
Negative Center
Four sensor
inputs
Excitation
4.3. Data Logger Sensor Overview
This section provides an overview of the hardware specifications of the OM-DAQLINK data
loggers.
4.3.1. Internal Sensor Types
The OM-DAQLINK-TEMP and OM-DAQLINK-TEMPRH loggers include internal sensors,
depending on the logger model.
13
Page 21

Sensor
Measurement
Range
Accuracy
Logger Model
Digital
Temperature
-20 ºC to 50
ºC
±0.5 ºC
OM-DAQLINKTEMPRH
Temperature
PT100
-20 ºC to 50
ºC
±0.3 ºC
OM-DAQLINKTEMP
Sensor
Measurement Range
Accuracy
Available Inputs
Current
4 to 20 mA
± 0.5 %
In-1 to In-4
Contact
Open (0) /
Close (1)
N/A
In-1 to In-4
Frequency
20 Hz to 4 KHz
N/A
In-4 only
Pulse Counter
1 to 65,536 pulses
0 to 4 KHz
N/A
In-4 only
Temperature
PT100 (2-wire)
-200 to 400 ºC
-200 to -60 ºC ±0.5 %
-60 to 60 ºC ±0.3 ˚C
60 to 400 ºC ±0.5 %
In-1 to In-4
Temperature TC-J
-200 ºC to 1,000 ºC
-200 to -60 ºC ±0.5 %
-60 to 60 ºC ±0.5 ˚C
60 to 1,000 ºC ±0.5 %
In-1 to In-4
Temperature TC-K
-200 ºC to 1,000 ºC
-200 to -60 ºC ±0.5 %
-60 to 60 ºC ±0.5 ˚C
60 to 1,000 ºC ±0.5 %
In-1 to In-4
Temperature TC-T
-200 ºC to 400 ºC
-200 to -60 ºC ±0.5 %
-60 to 60 ºC ±0.5 ˚C
60 to 400 ºC ±0.5 %
In-1 to In-4
Voltage
0 to 1 V
± 0.5 %
In-1 to In-4
Voltage
0 to 50 mV
± 0.5 %
In-1 to In-4
4.3.2. External Sensor Types
OM-DAQLINK-TEMP and OM-DAQLINK-TEMPRH
Each of the four input channels of these data logger models are multi-purpose and can be
individually configured to any of the following types and ranges.
14
Page 22

PT100, Thermocouple J, K or T
=
A
Internal Digital Temperature (on OMDAQLINK-TEMPRH)
=
B
Sensor
Combination
Maximum Sampling Rate
Example Setup
3 x A
4 x A
A + B
One sample every three seconds
In-1: PT-100
In-2: TC-J
In-3: TC-J
(2 x A) + B
(3 x A) + B
One sample every four seconds
Internal: Temp
In-1: TC-T
In-2: PT-100
(4 x A) + B
One sample every five seconds
Internal: Temp
In-1: TC-T
In-2: TC-J
In-3: PT-100
In-4: PT-100
4.3.3. Sensor Connection
Connect the sensor/s to the terminal block/s at the top of data logger:
Figure 11: OM-DAQLINK logger sensor inputs
Sensors do not have to be added successively. You may only configure In-4, or configure In-1
and In-3, for example, when setting up the logger via the software.
4.3.4. Programming Limitations for OM-DAQLINK-TEMP and OM-
DAQLINK-TEMPRH
The standard sampling rate for all sensors on all inputs is from a maximum of one sample every
second to a minimum of one sample every 18 hours. However, there are certain limitations
using a specific combination of sensors, which must be taken into account when programming
the OM-DAQLINK data loggers.
Note: The software integrates all programming limitations automatically when configuring the
loggers.
Please refer to the table below for OM-DAQLINK programming limitations, where:
Table 1: Data Logger programming limitations
15
Page 23

-
+
Relay
-
+
-
+
Alarm device
(e.g. siren)
+
-
3-4 V battery
to power relay
-
+
Relay
-
+
-
+
Alarm device
(e.g. siren)
+
-
3-4 V battery
to power relay
4.3.5. External Alarm Output
The OM-DAQLINK system supports connection of an external alarm e.g. siren, audible alarm, to
In-1 of the OM-DAQLINK-TEMP and OM-DAQLINK-TEMPRH data loggers.
When connected to the logger, the external alarm will be activated only when that logger is in
alarm status.
Once there is no alarm status, the external alarm will be deactivated.
Data Logger External Alarm
In-1 of the OM-DAQLINK-TEMP and OM-DAQLINK-TEMPRH serves either as a standard
sensor input or as an external alarm output. Ensure the logger is connected to AC power if
connected to an external alarm.
Configure In-1 as Alarm Normally Open or Alarm Normally Closed in the logger Setup
window in the DataSuite software.
Normally Open will result in the alarm being activated during alarm status (the circuit will be
closed).
Normally Closed will result in the alarm being activated when logger is not in alarm and
therefore deactivated when there is an alarm (the circuit will be opened).
Connect In-1 to your external alarm device and connect the logger to AC power.
Use the Alarm Setup tab in the Setup dialog to define the logger alarm settings. If these
settings are breached then the alarm will be activated.
External Alarm Schematic
See the schematic below explaining how to hook up an external alarm to the OM-DAQLINK unit.
Figure 12: External alarm schematic
+ from OM-DAQLINK unit goes to – of the Relay inputs
+ of Relay input goes to battery that powers the Relay
16
Page 24

Load inputs of the Relay go to the Alarm device e.g. siren, lights, etc.
- of the battery goes to – of OM-DAQLINK unit.
Note: Maximum load of the Relay is 50 mA, 3 V.
Refer to Appendix A: OM-DAQLINK Specifications for the full external alarm output
specification.
4.3.6. Polarity
Current, voltage, thermocouples and user defined sensors have distinct polarity. Be careful to
connect them in the right polarity.
4.3.7. Frequency/Pulse Counter
Connect the signal wires to In-4 terminal blocks, and select Frequency or Pulse counter for
Input 4 from the logger Setup window in the DataSuite software. Inputs 1 to 3 are still available
for other sensors.
The Frequency/Pulse counter is optically isolated from the internal circuitry and can
simultaneously measure a signal source, together with another input.
4.3.8. User Defined Sensors
OM-DAQLINK provides a simple and straightforward tool for defining a limited number of
custom sensors. Almost any sensor or transducer with 0 – 1 V or 4 – 20 mA output is accepted
by the OM-DAQLINK logger and its electrical units are automatically scaled to meaningful userdefined engineering units.
The sensor definitions are stored in the logger’s memory and are added to the sensors list. The
sensor’s readings are displayed in the user defined units only in the DataSuite software. Future
versions will also support displaying the user defined engineering units on the logger LCD.
Refer to section 5.6.1 for more details.
4.3.9. Sensor Alarms
Via the software, users can define minimum and maximum alarm levels for each input
individually. Users can define pre-low and pre-high alarm levels, for an additional level of safety
in case the logger is approaching an actual breach of alarm.
The OM-DAQLINK logger display indicates when the sensor reading is in alarm of any type. The
symbols AL-H, AL-L, AL-P-H or AL-P-L are visible next to the corresponding input readings.
Refer to section 5.16 for more details.
4.3.10. Sensor Calibration
The OM-DAQLINK data logger is shipped fully calibrated. However, further calibration can be
applied via the DataSuite software. The calibration parameters are sent to the data loggers via
USB connection and stored in the logger’s memory.
17
Page 25

Users may calibrate individual inputs as well as all inputs at once. Calibration settings may be
saved and then loaded into the logger at a later date if the calibration settings have changed.
Refer to section 5.16.4 for more details.
4.4. Unit Serial Number and Comment
Every OM-DAQLINK data logger unit is embedded with a unique serial number.
The data logger only can be loaded with a descriptive comment to identify its task and location.
You may add or edit the logger comment via the DataSuite software.
Every time data is transferred to the computer it is labeled both with the logger’s serial number
and comment and is displayed in the graph or data table view.
The unit serial number is also marked on a sticker on the back of the product.
4.5. Power Supply
4.5.1. OM-DAQLINK-TEMP and OM-DAQLINK-TEMPRH Data
Loggers
The OM-DAQLINK-TEMP and OM-DAQLINK-TEMPRH data loggers run from an internal NiMh
rechargeable battery as well as from external AC power supply. Depending on the logger
configuration, from a fully charged battery, the data logger can run for up to several months.
Refer to section 4.5.3 for more details on battery life.
Note: Charge the data logger units for 16 hours before using them for the first time.
When connected to external power supply, the data logger battery will not be charged when the
unit is turned off. This will allow the system to protect the battery from overheating.
First Time Charging
From a fully drained battery, you must charge the battery for 16 hours to bring it to a full charge.
Once the charge cycle is complete, the logger will run from the external power supply, without
draining (or charging) the internal battery. In order to maintain a fully charged battery and
ensure the battery doesn’t self-discharge, the battery charger will daily charge the unit for one
minute to maintain the battery capacity.
Note: Before storing the OM-DAQLINK units make sure you have unplugged all the sensors
and turned the units off via the keypad.
Standard Charging
Whenever a logger is reconnected to the charger it will begin the 16-hour charge cycle, no
matter what the status of the battery. Once the charging cycle is complete the logger will run
from external power supply.
Effect of Charging Battery on Temperature Sensor
For loggers measuring data with the internal temperature sensor, it is critical to note that during
the charge cycle the logger will heat up thereby causing the internal temperature sensor reading
to rise by up to 10 ˚C above ambient temperature. Once the charging process is complete, the
logger will cool down and the internal temperature sensor readings will return to normal.
For loggers remaining connected to AC power, to prevent the logger from heating up again
following the initial charge cycle, the logger will receive a one minute trickle charge each day
18
Page 26

Figure 13: USB communication cable
Type A plug
Connect to logger USB port
Type B plug
Connect to PC USB port
rather than stay continually charged. This is sufficient to ensure the logger doesn’t selfdischarge and will maintain the logger’s full charge status.
4.5.2. Power Adapter
The OM-DAQLINK power adapter is used to power the OM-DAQLINK-TEMP and OMDAQLINK-TEMPRH units. The mains adaptor (AC/DC adaptor) converts mains power (from a
wall outlet) to a voltage suitable to the OM-DAQLINK hardware unit.
Output: Capacitor filtered 9 to 12 VDC, 300 mA
Female plug, center negative
Note: Only use Omega-supplied power adapters to avoid damaging the units with incorrect
power supply.
4.5.3. Data Logger Battery Life
Battery life depends on the logger sampling rate, type of sensor, and number of measured
sensors.
OM-DAQLINK-TEMP and OM-DAQLINK-TEMPRH can last up to six months on a charged
battery depending on logger configuration.
4.6. USB Communication Cable
A mini USB communication cable is supplied as part of the DataSuite software kit. This cable
connects the OM-DAQLINK data logger to the OM-DAQLINK PC workstation. When connected
to the PC the logger can communicate with the software for configuration and data download
purposes, for example.
The USB cable also powers the logger when connected to the PC but it does not charge the
internal battery.
Note: The USB driver is installed as part of the software installation process. Without this driver
the PC won’t detect the logger. To avoid compatibility problems do not connect the logger to the
PC before installing the USB driver.
19
Page 27

The Menu button has
two functionalities:
Navigate to the main menu.
When pressed from within a
submenu, the display will take you
back to the main menu.
Selecting an option from one of
the menus. When pressed on one
of the main menu items, it will take
you to the sub menu options.
The Scroll button has two
functionalities:
When the unit is off, pressing this
button will power the unit on.
Scrolls through the menu options.
Omega DAQLINK
Ready
4.7. OM-DAQLINK Keypad Overview
4.7.1. OM-DAQLINK-TEMP and OM-DAQLINK-TEMPRH Keypad
The OM-DAQLINK-TEMP and OM-DAQLINK-TEMPRH units each have two buttons on the
keypad, which are used to navigate through the LCD menu options, as well as turn on the units.
Refer to section 4.8 to learn how to operate the data loggers.
4.8. Operating the OM-DAQLINK-TEMP and OM-
DAQLINK-TEMPRH
This section explains how to operate the OM-DAQLINK-TEMP and OM-DAQLINK-TEMPRH
loggers and provides an overview of the menu options on the units’ LCD screen.
4.8.1. Turning on the Unit
In order to view the logger menu options, the unit must be powered on by pressing the Scroll
button on the keypad. Ensure the logger is charged or connected to the AC adapter.
Once the unit is switched on it will emit a short beep and the screen will display a welcome
message:
20
Page 28

In-TMP
24˚C AL-Lo
View Data
4.8.2. Display Shutdown
If the logger screen is inactive for thirty seconds it will turn off. However the logger will continue
to operate in the background. Press the Scroll button to enable the LCD screen again. The
screen will not turn off during firmware upgrade.
4.8.3. Main Menu Options
There are three menu categories on the data logger:
View Data
Status
Min/Max Values
Note: If the unit is not in Run mode only the Status menu options will be available.
Press the Menu button to reach the main menu display. Scroll through the main menu
options (View Data, Status and Min/Max Values) using the Scroll button. Once you reach the
main menu option you need, press Enter to select that option and enter the sub menus.
View Data Menu
Note: View Data is the default page when the unit is running.
If there is more than one sensor running, the screen will auto scroll between the sensors
showing the sensor name and senor value. These are real-time displays.
The display will switch back to the View Data screen after five minutes if none of logger buttons
have been pressed.
If the sensor breached any of the predefined alarm levels, then the alarm symbol will be
displayed alongside the data reading.
For example:
The logger display alarm symbols are:
AL-HI : Alarm High
AL-Lo : Alarm Low
AL-P-H : Pre Alarm High
AL-P-L : Pre Alarm Low
21
Page 29

S/N 12345678
Logger version:
2.03.00.02.38.00
Batt Level:
External power
Batt Level: 67%
Omega DAQLINK
Logger running
Status
Status Menu
The Status menu contains the following sub menus, all reachable by using the Scroll button.
The sub menus are outlined below in the order in which they appear on the logger display.
Name and Status
As explained previously, the unit name (or Comment) is displayed on the first row and the
second row indicates the logger status.
If the logger is running, then the following screen is displayed.
Batt Level (battery level)
If the power adapter is not connected the battery percentage will be displayed.
If the power adapter is connected External power will be displayed.
Logger Version
This menu informs the user of the logger firmware version. This is helpful when you need to
upgrade the system firmware, to check the current version. Or when contacting Omega
technical support, with any technical issues.
The firmware version is commonly referred to by the numbers in bold in the screen above.
S/N
This menu displays the unit’s eight digit SN.
Memory Mode
There are two possible device modes:
Stop when full – when the logger memory is full the logger will stop logging.
22
Page 30

In-TMP ˚C
26.06H 25.61L
Cyclic mode – for continuous logging. The logger will continue to log once the memory is full
by writing over the first recorded samples.
The memory mode is toggled in the Setup dialog, using the Cyclic Mode checkbox.
When the logger memory is full, the LCD will display Memory Full.
Press Menu to pause logger (when logger is in Run mode)
By pressing the Menu button, the logger will cease to log data until the Menu button is pressed
again from the same screen.
When in Paused mode, the user can still scroll through the logger menu screens and use other
features. The user must scroll back to the Pause Logger menu in order to resume the logger
operation.
Reset Unit
When the unit is reset, upon start up it will automatically reconnect to the DataSuite software if a
USB connection is established. In addition, if the logger will continue to operate according to its
last set up instruction. For example, if the logger was in Run mode, then after reset it will
continue to run and record data.
Turn Off Unit / Stop and turn off
Selecting this option will shut the unit down. You can turn the unit on again by pressing the
Scroll button.
If the logger is in Run mode, selecting this option will first stop the logger, and then turn it off.
It is recommended to turn off the unit when it is not in use.
Min/Max Values Menu
Each sensor’s minimum/maximum readings (taken from the current logging session) will be
displayed on two rows.
The first row indicates the sensor type, along with the measurement units e.g. V, and the alarm
indication if there is an active alarm on this sensor.
The second row indicates the minimum and maximum measured value and the units. H and L
represent High and Low values, respectively.
4.8.4. Additional Logger Screens
Loading Firmware
When updating the firmware of the data logger via the software’s Firmware Update Center, the
logger screen will display the update progress. When complete the main logger status screen
will be displayed.
Also refer to Chapter 6: Updating DataSuite Software and Firmware.
23
Page 31

Loading firmware
Progress: 55%
Note: Logger must be in Stop mode before firmware can be updated.
24
Page 32
Chapter 5:
Using the DataSuite Software
This chapter provides a detailed description of the DataSuite software features, allowing you to
configure and monitor your Omega data loggers in a unified application. DataSuite supports a
range of Omega loggers, utilizing core functionality of the DataSuite platform, such as setup,
calibration, defining new sensors, managing Email and SMS notifications, configuring reports,
firmware updates and so on. This chapter deals specifically with DataSuite support for the OMDAQLINK Series data loggers.
5.1. Installing DataSuite Software
Part of your product package includes a DataSuite software CD. Follow the software installation
instructions provided below.
5.1.1. System Requirements
To work with DataSuite your system should be configured according to the following
specifications:
Software
Windows XP SP3, Windows Server 2003 SP2, Windows Vista or Windows 7 (32-bit or 64-
bit)
Minimum screen resolution: 1024 x 768 (800 x 600 not supported)
Hardware
Pentium 4, 2.0 GHz or better
512 MB RAM
250 MB available disk space for the DataSuite application
5.1.2. Language Support
DataSuite currently supports English interface only with additional languages to be added in
future DataSuite versions.
To toggle the software language, go to Help > Language. You must then exit DataSuite for the
changes to take effect.
5.1.3. Installation Procedure
Note: If you are planning to use more than one Omega system e.g. OM-DAQLINK and OM-
DATANET, only one DataSuite software installation is required. Each product is managed by a
specific product module within the DataSuite modular application.
Please read these instructions before proceeding with the installation process.
25
Page 33
1. Insert the DataSuite software CD into your computer’s CD drive. The DataSuite Installation
Wizard automatically starts running.
2. The Wizard first downloads and installs Microsoft .NET Framework 2.0, if not already
detected on the computer. The DataSuite software requires this platform in order to run.
Follow the installation instructions to install the .NET Framework on your PC. This step can
take up to two minutes to complete. Click Finish once installation is complete.
Note: If .NET Framework is already installed on your computer this step is skipped.
3. The main DataSuite Installation Wizard now resumes. Follow the installation instructions to
install DataSuite on your computer.
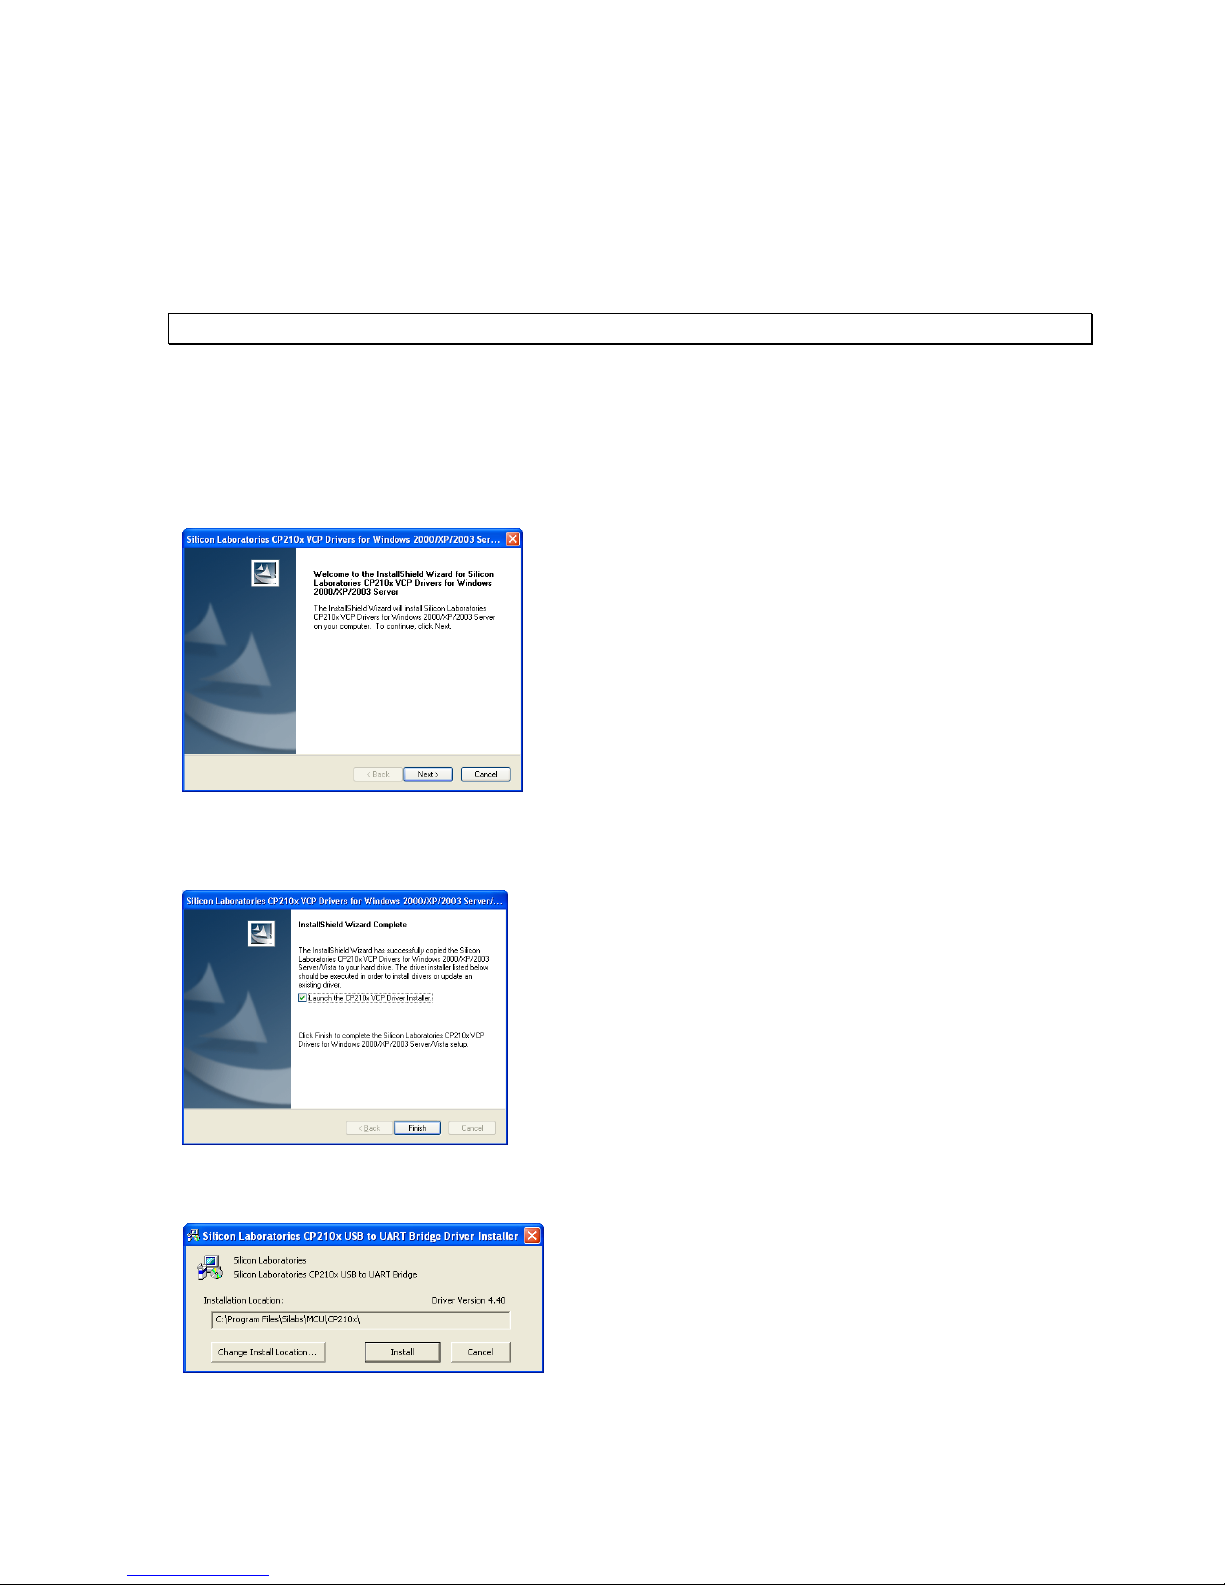
4. Following DataSuite software installation is the Silicon Laboratories USB driver installation.
The driver is necessary for the computer to detect the OM-DAQLINK hardware.
5. Follow the on-screen instructions to continue the installation process. The default installation
location is C:\SiLabs.
Figure 14: Installing Silicon Labs USB driver – Step 1
6. During the driver installation, the following window will pop up. Make sure to select the
checkbox to launch the driver installer, and click Finish.
Figure 15: Installing Silicon Labs USB driver – Step 2
7. In the subsequent window, click Install to install the driver.
Figure 16: Installing Silicon Labs USB driver – Step 3
26
Page 34
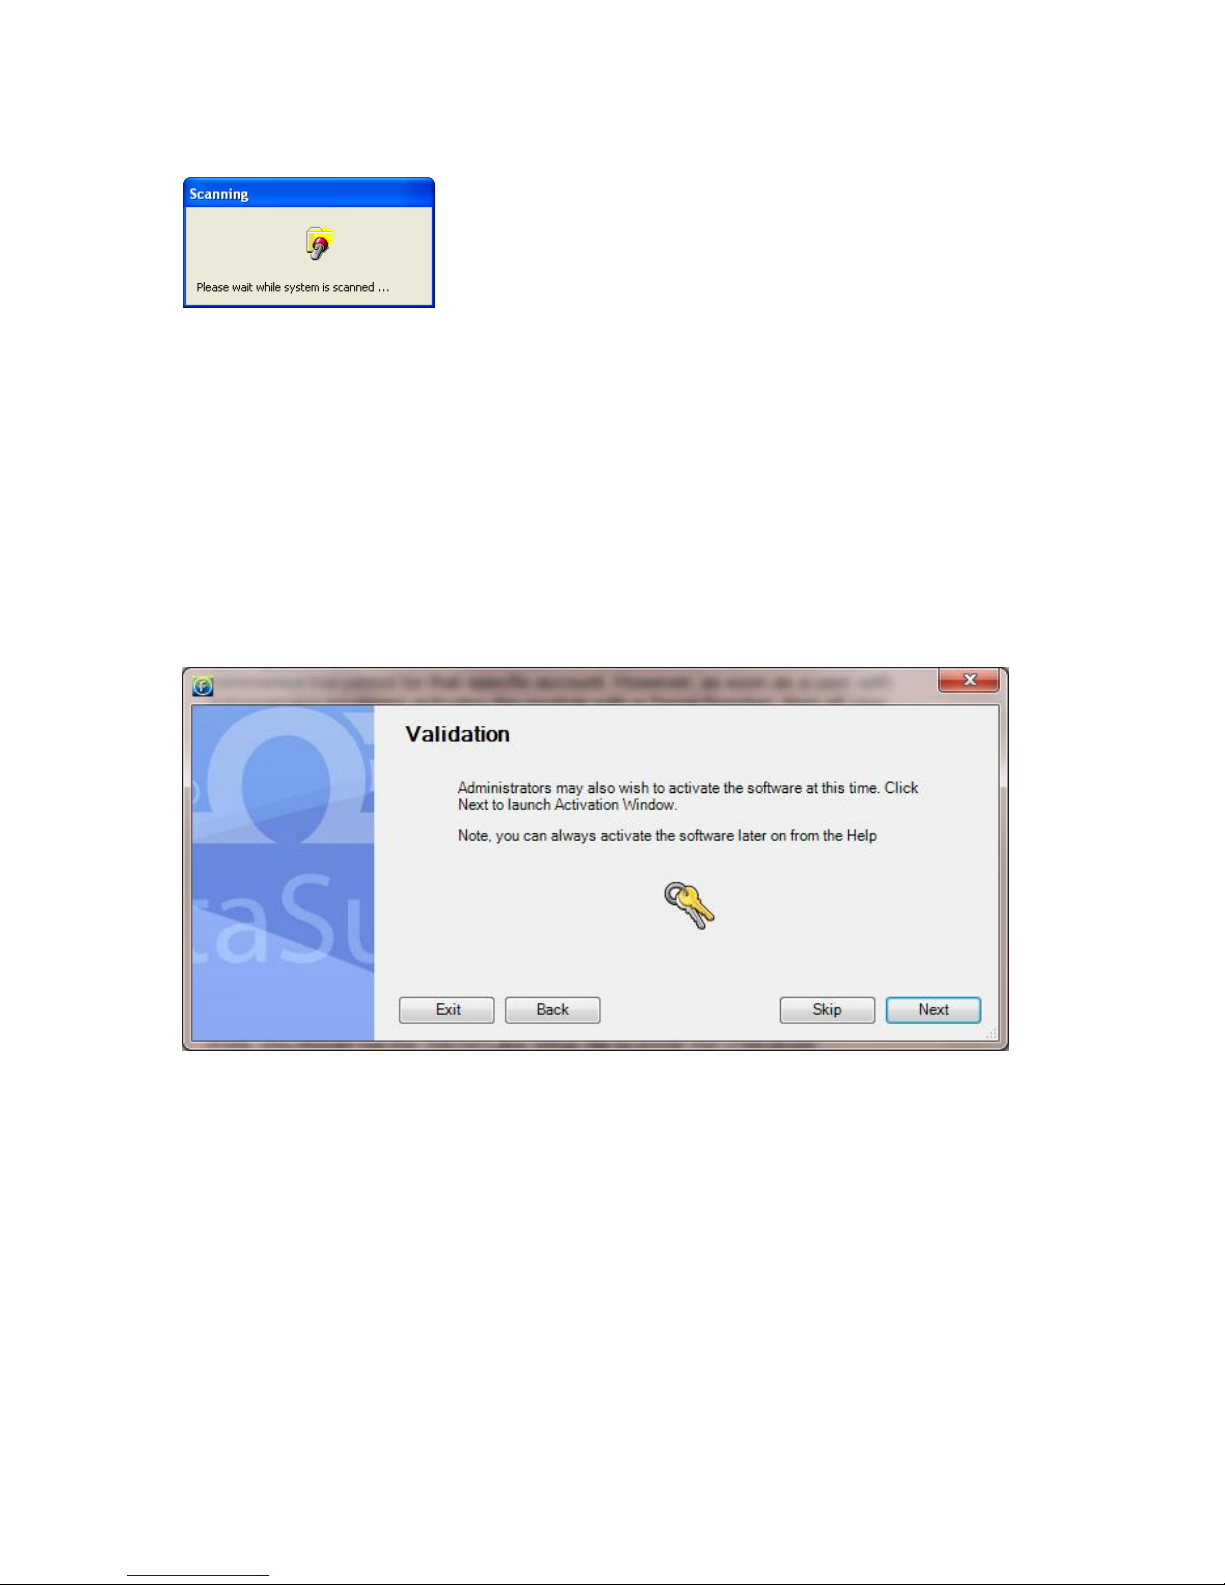
The installation of the driver could take up to one minute or more, depending on the system.
Figure 17: Installing Silicon Labs USB driver – Step 4
8. Once installed click Finish to close the USB driver Install Wizard dialog.
9. The DataSuite software and components have now been installed. Double click the
DataSuite shortcut on your desktop to launch the software.
10. The DataSuite Welcome window will open, prompting the user to configure the application
before use. This must be done only once when first running the software. Click Next to
continue.
11. You are then given the choice to activate the DataSuite software now or to do so later. To
activate now click Next, to activate later click Skip. Even if the software is not activated
using the license Serial Number, you still need to commence the Trial period in order to use
the hardware.
12. When choosing to activate the software, the DataSuite software registration window will
open. Select the relevant module button e.g. OM-DAQLINK.
27
Page 35
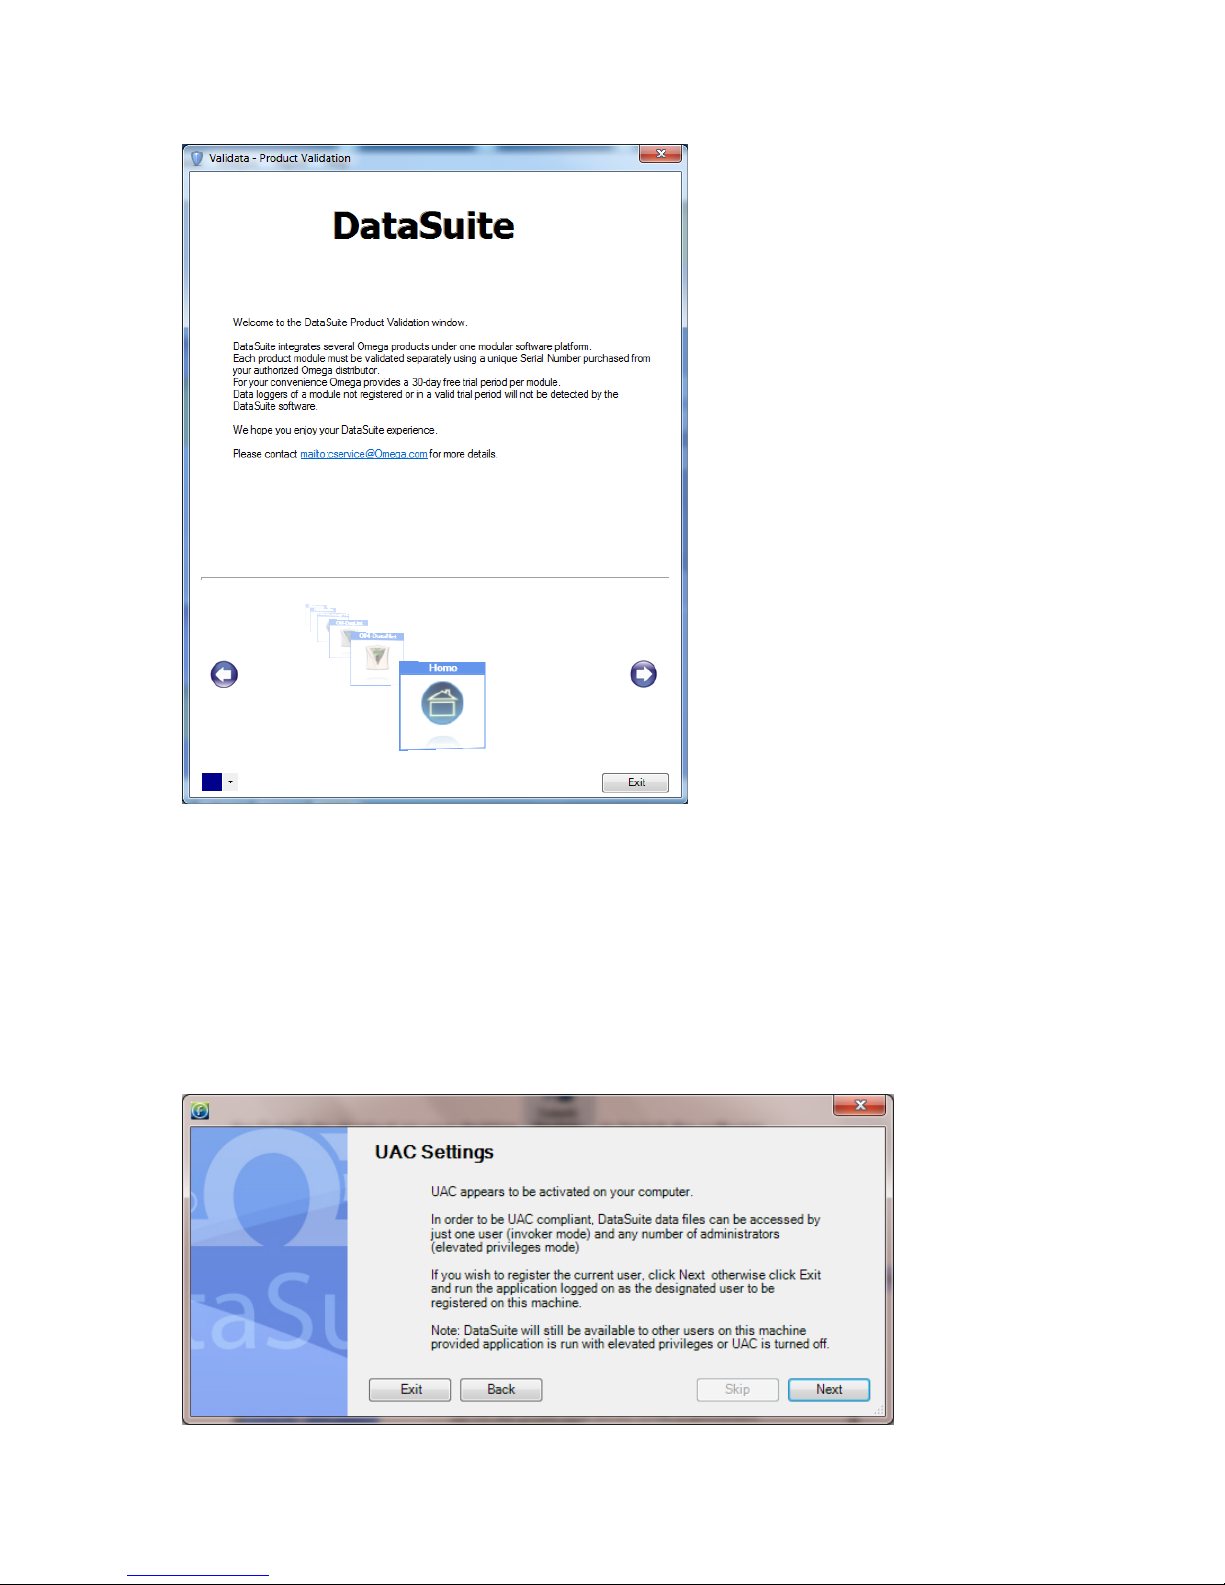
13. Select Start trial to commence the free 30-day trial and click Next. The module registration
can be completed at a later stage. For more details refer to section 5.2.
14. Once the Trial period has started, DataSuite will detect the connected loggers. To detect
more than one product module at the same time, you must ensure that each module is
either in Trial mode or activated using the unique software Serial Number.
15. When completing the necessary tasks in the Validation window, click Exit. You will return to
the window from step 11. Click Skip.
16. In specific versions of Windows, the user may have User Account Control (UAC) settings
activated. If so, the user will be prompted the following instructions. Select the relevant
option.
28
Page 36
17. You have reached the end of the configuration process. Click Finish to launch the
application.
18. Once the module is launched, connect the device to a USB port on your computer. It will
automatically detect the logger as new hardware and the device will appear as a new icon in
the DataSuite Map View.
5.1.4. Working with Multiple User Accounts
Each specific user account that accesses the DataSuite software module can commence trial
period for that specific account. However, as soon as a user with Administrator privileges
activates the module with a Serial Number, then all user accounts which had previously been in
Trial mode, will now be fully activated.
All users will have full access to the DataSuite module’s settings and data files.
5.1.5. Installation Troubleshooting
When connected to the PC USB port the device was not detected by the software.
Ensure that the USB driver was installed properly.
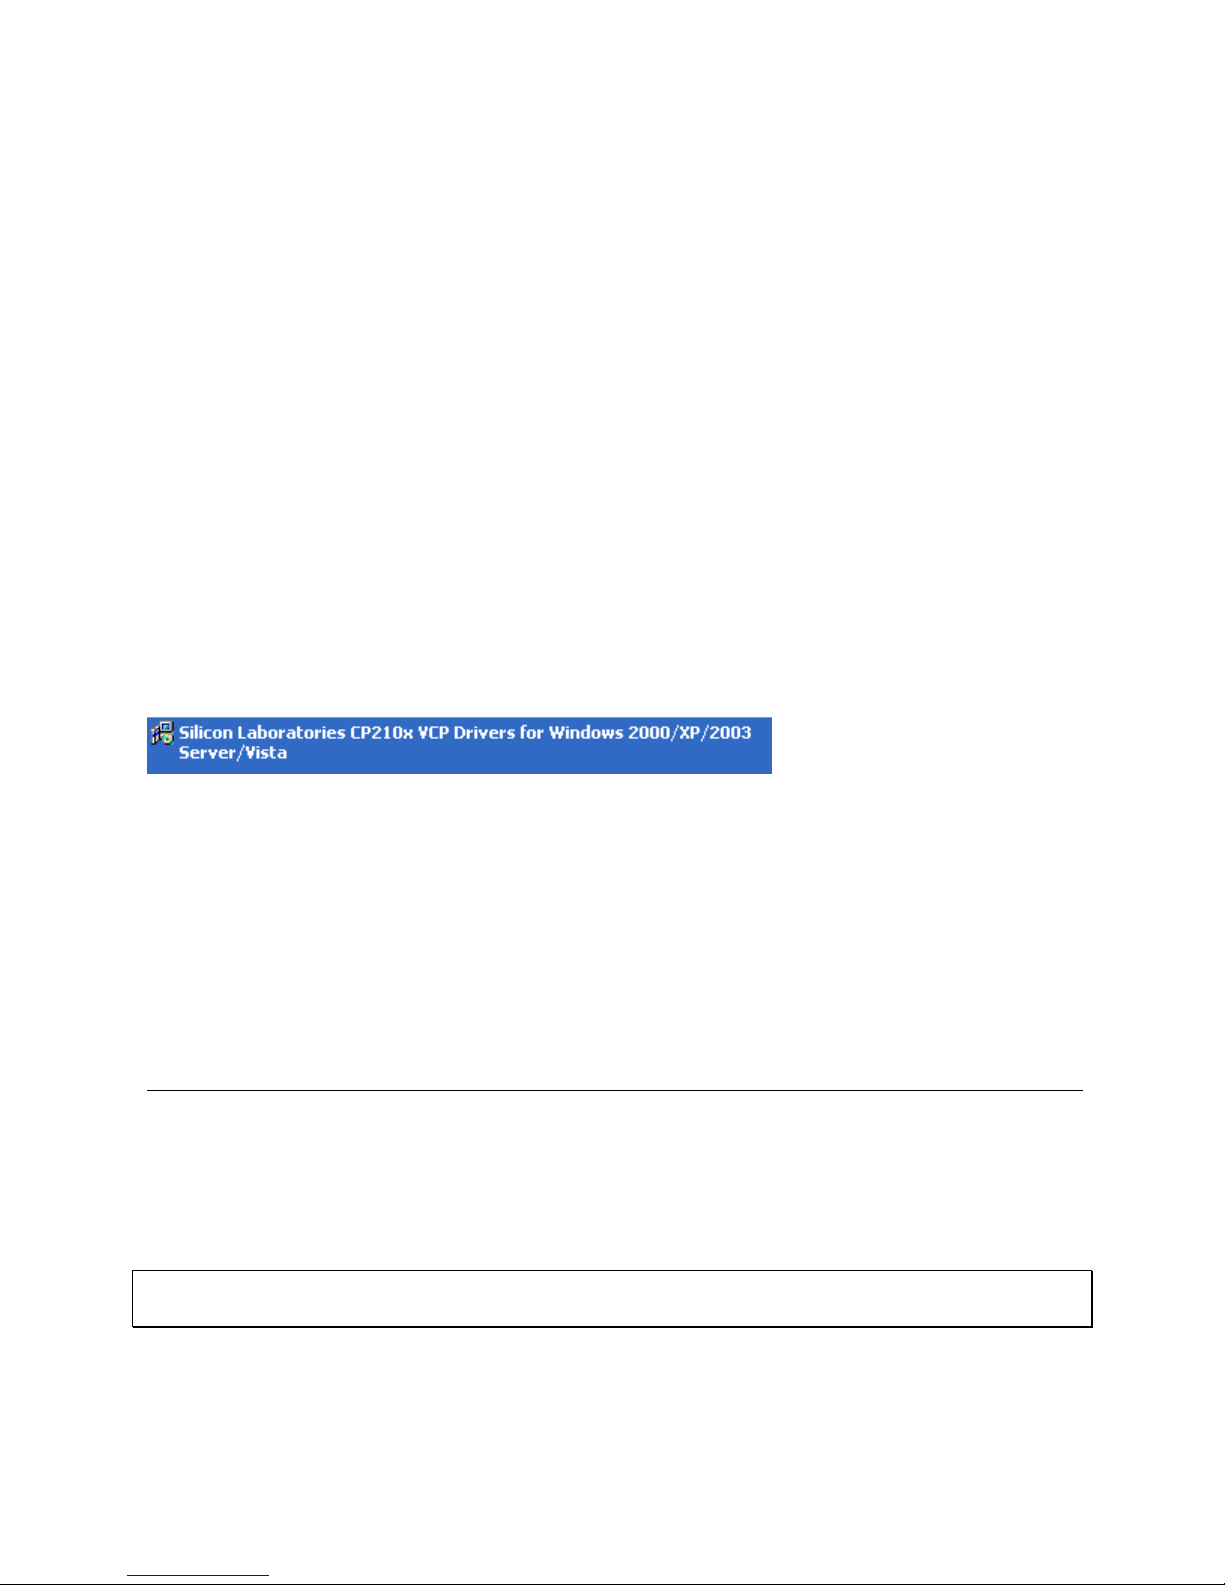
Go to Control Panel > Add/Remove Programs (in WinXP), and check that the driver is
installed:
If not, you should run the Silicon Labs setup file to install the USB driver:
CP210x_VCP_Win2K_XP_S2K3.exe setup.exe to install the driver.
If the driver is installed, ensure that there is no other device sharing the USB com port with the
device.
If you didn’t select the Launch CP210x VCP Driver Installer checkbox during step 2 of the
driver installation wizard (see section 5.1.2), then the driver wasn’t installed. Run the wizard
again and be sure to select the checkbox.
5.2. DataSuite Software Registration
DataSuite requires the OM-DAQLINK modules to be registered within 30 days of installation,
using a serial number provided with purchase of the DataSuite OM-DAQLINK module (OMDAQLINK-SOFT).
When the initial 30 day Trial period is over, the user will not be able to operate the OMDAQLINK via the software until a valid serial number is registered.
Note: The software activation feature protects Omega’s intellectual property for both its
software and hardware.
Please note that:
Each serial number is good for unlimited installations on a single computer. You cannot
install the software using the same serial number on another computer.
29
Page 37
If you have replaced your computer and must reinstall DataSuite using the same serial
number, contact Omega Customer Support for assistance.
Registration can be performed from the computer with DataSuite installed, or if there is no
Internet connection from that computer, then via another computer with Internet connectivity.
5.2.1. Software Registration Process
Note: The software registration forms are all case sensitive. Incorrect entry will result in invalid
registration.
To register any one of the DataSuite modules, follow the instructions below:
1. Locate the DataSuite module serial number (SN). The SN label is found on the DataSuite
box as well as on the software CD case.
Note: If you cannot locate your serial number, contact Omega Customer Support directly.
2. Launch DataSuite. The registration wizard will open.
3. To open the registration wizard from within DataSuite go to Help > Register.
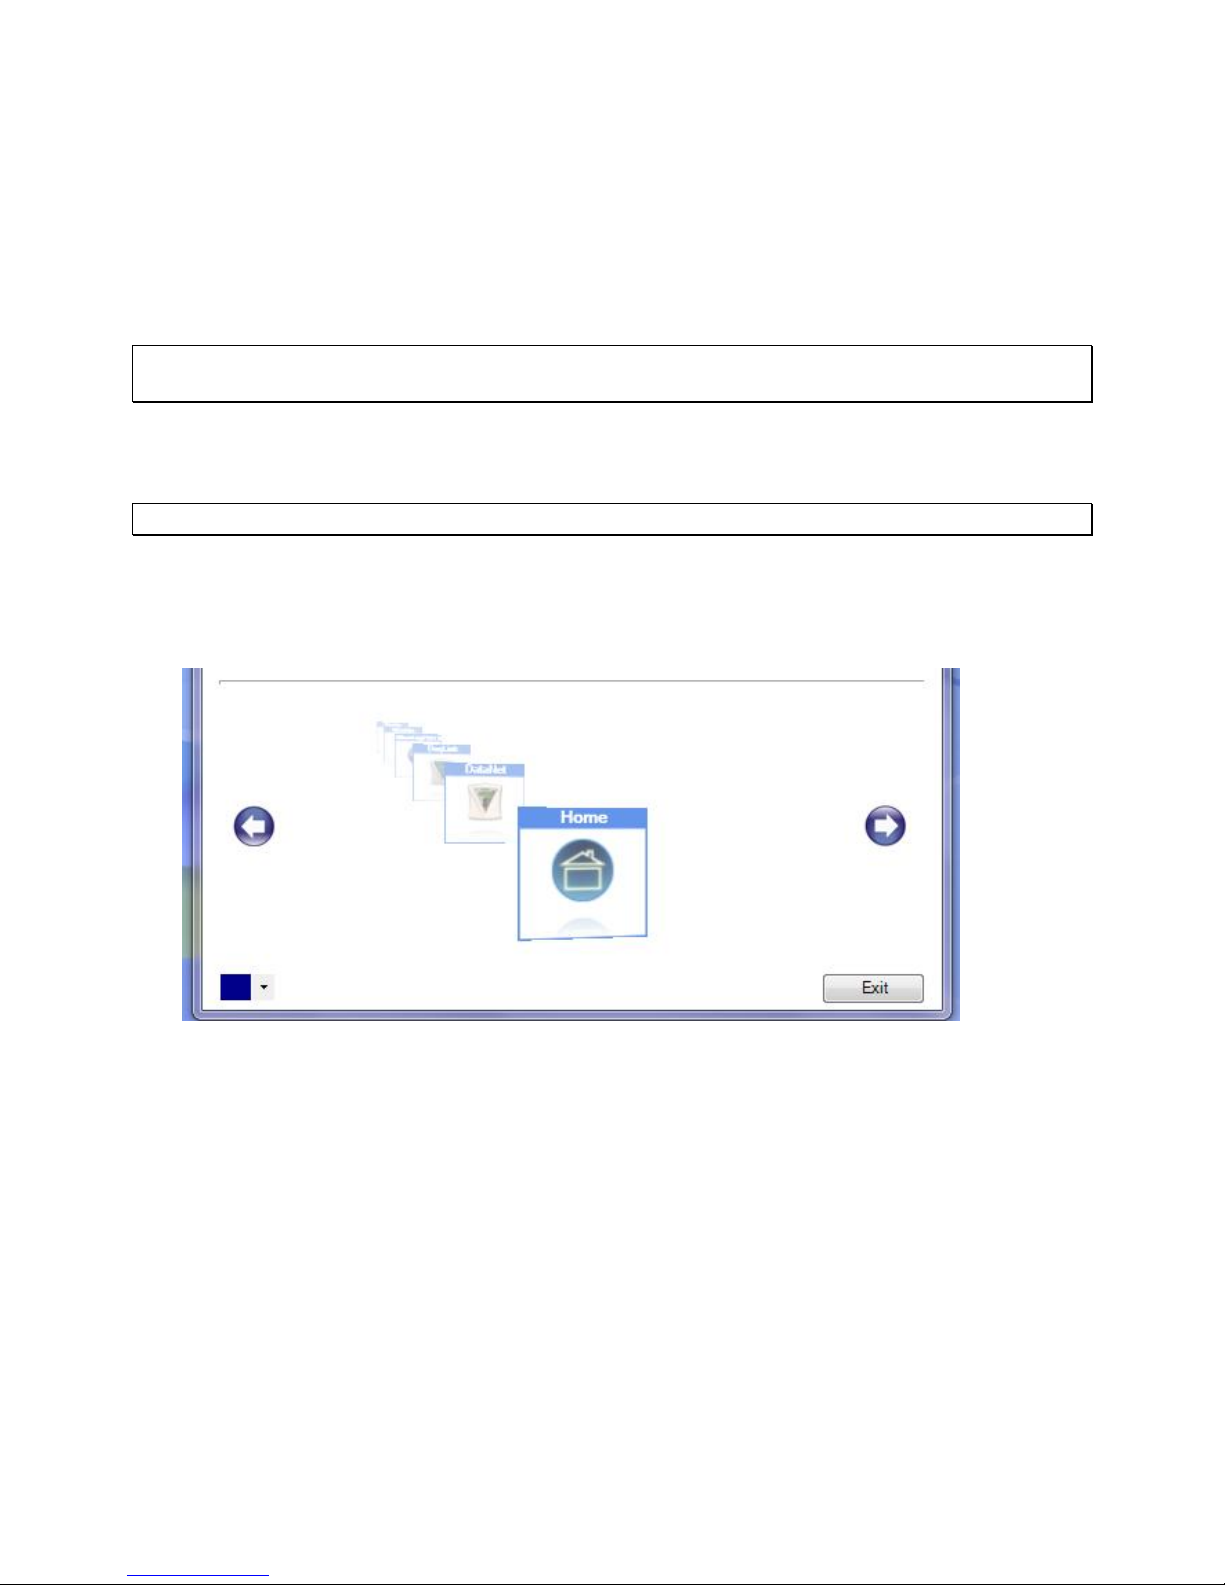
4. From the bottom of the wizard Home screen, select one of the module buttons to proceed to
the registration screen for that module.
5. Three choices are presented. Select the relevant option and click Next to proceed:
30
Page 38
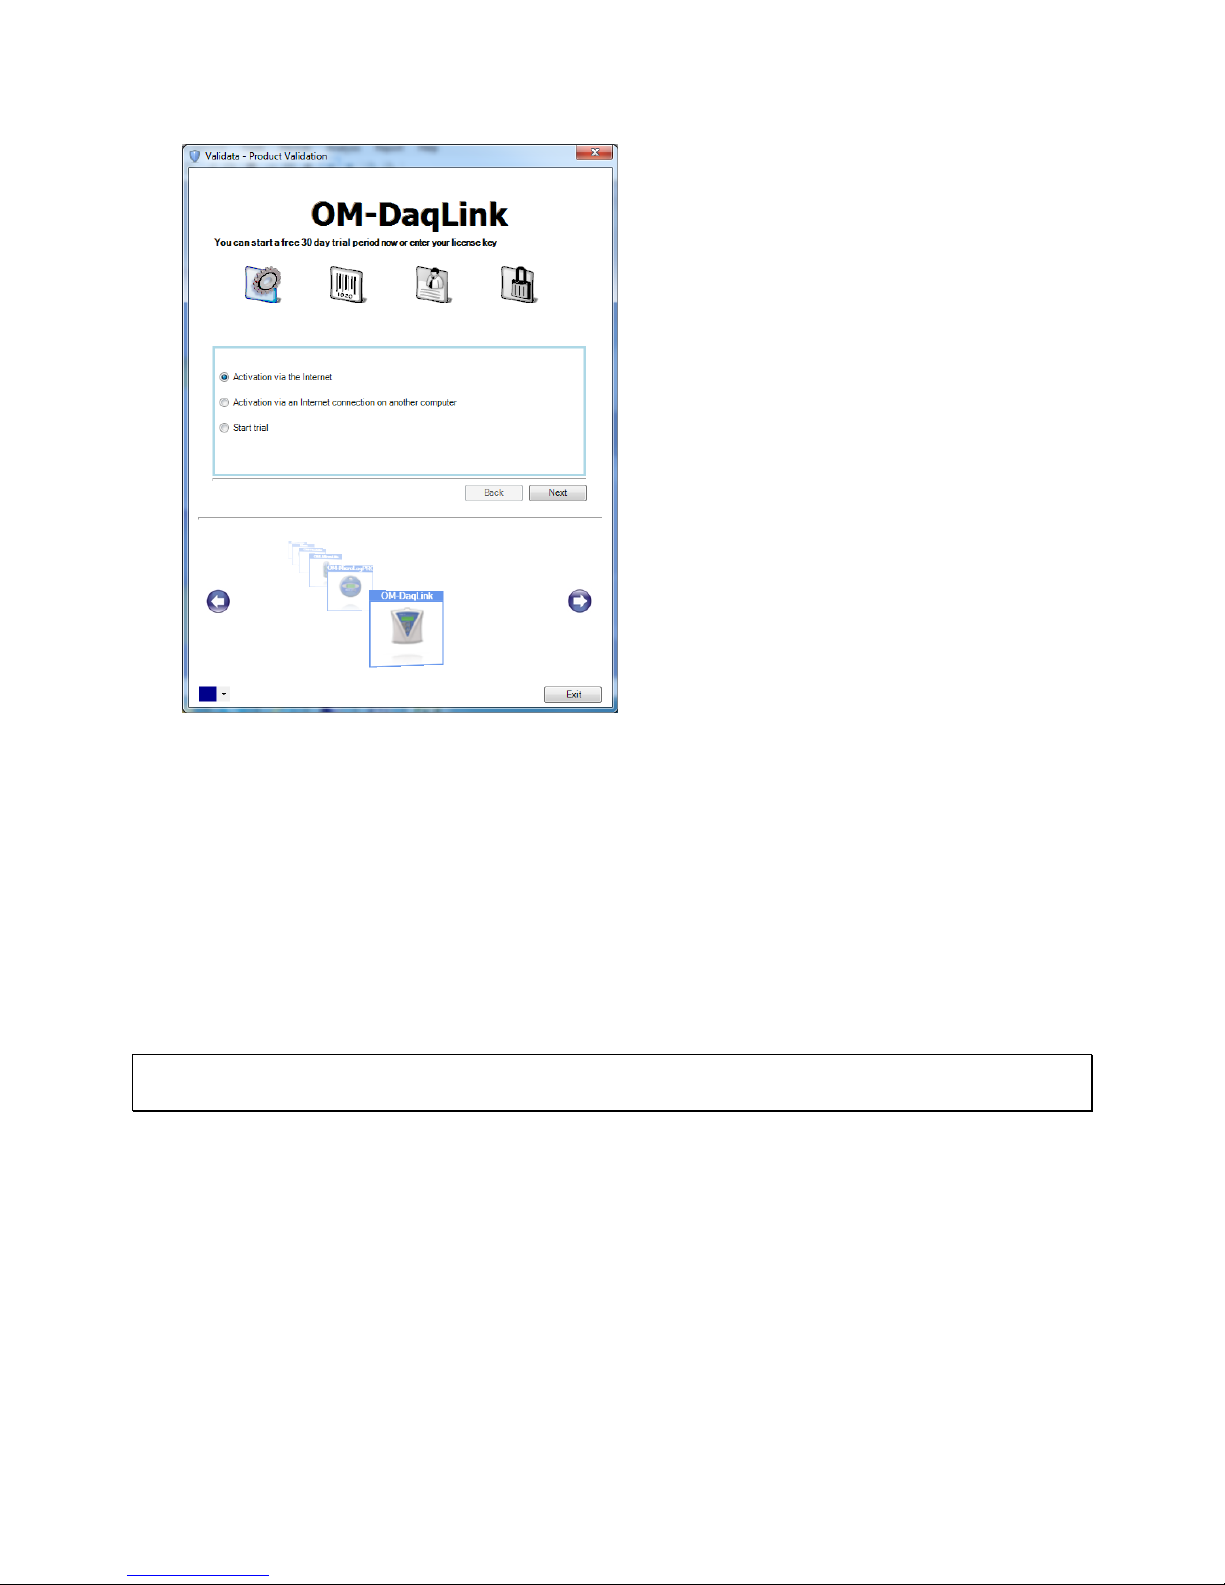
Activation via the Internet
Select to proceed with registration on the same computer on which DataSuite is running,
ensuring it has a live Internet connection.
Activation via an Internet connection on another computer
Select if the computer on which DataSuite is running does not currently have Internet
connectivity.
Start trial
Select to commence the 30 day free trial period and continue working in DataSuite.
6. After selecting one of the two available options for continuing with the registration process,
and after clicking Next in step 4 above, you will be prompted to enter the software SN. Enter
the SN and click Next.
Note: Each serial number provides a single user license for the specific module. You cannot
use a serial number already registered on another computer.
7. The registration process now differs, depending on which option was selected in step 4
above. Read the relevant section below for further registration instructions.
Activation via the Internet
1. After entering the software serial number, click Next.
2. DataSuite will now establish communication with the Omega server to complete the
registration process. If successful, a confirmation message will appear. In the event of any
problem in the registration process, please contact your Omega Customer Support.
3. Click Close to return to the DataSuite software.
31
Page 39
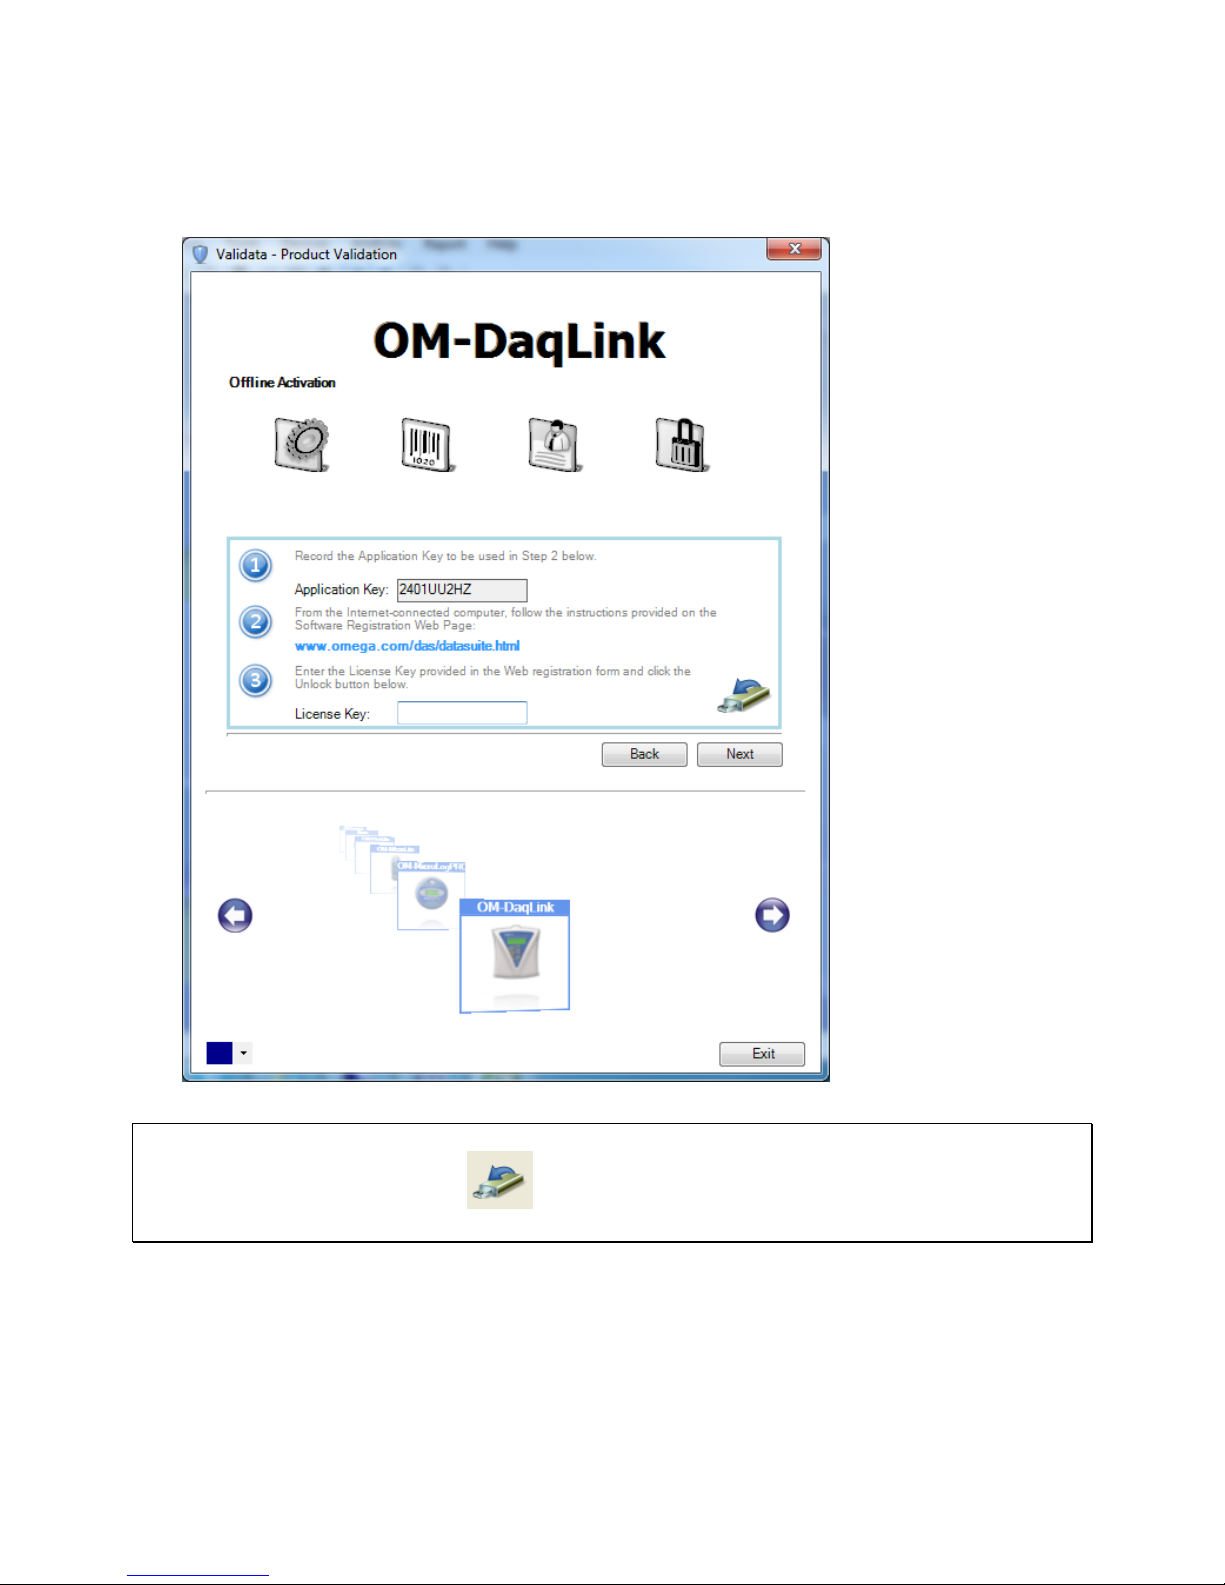
Activation via Internet Connection on another Computer
1. After entering the software serial number, a window providing additional registration
instructions will open.
2. Follow the steps as outlined in the window.
Note: It is recommended to generate a text file containing both the Application Key and the Web
registration form URL. Press the icon. Transfer this file to the computer with Internet
connection, as the registration process must be continued from there.
3. Record the License Key obtained from the Web registration form. Enter it into the License
Key field in Step 3 and click Unlock.
4. DataSuite will now establish communication with the Omega server to complete the
registration process. If successful, a confirmation message will appear. In the event of any
problem in the registration process, please contact Omega Customer Support.
5. Click Close to return to the DataSuite software.
32
Page 40
5.3. System Password
Throughout the software you will be required to enter a password to perform certain functions
such as calibration or firmware update.
Note: The default password is 1234.
To change the password:
1. In the Password dialog box, click Change Password to open the Change Password
dialog box.
2. Enter the current password in the Current Password text box.
3. Enter the new password in the New Password text box.
4. Enter the new password a second time in the Confirm New Password text box to confirm
your new password.
5. Click OK.
Note: The password must include at least 4 characters and is case sensitive.
5.4. DataSuite Software Layout
This section provides an overview of the default DataSuite window view as well as a guide to all
of the icons available throughout the software.
The most commonly used tools and commands are displayed on two toolbars. Tools that relate
to all aspects of the program are located in the main (upper) toolbar. Tools specific to the
graphs are located on the graph (lower) toolbar.
Refer to section 5.4.5 for a description of these toolbars.
As the DataSuite platform supports several Omega products, the interface is common for most
of their functionality. There are several areas such as logger configuration, where the interface
differs. These differences will be detailed throughout the chapter.
5.4.1. Map View
When DataSuite is first launched and the device detection window closes, the default window
that is opened is the Map View (see screenshot below).
This view is used to monitor the status and data of all OM-DAQLINK devices currently detected
by the software.
You can also switch to Map View at any time by clicking the Map View button in the main
toolbar. In addition, the Map View can be printed.
Icons are used to represent each of the Omega devices, and using the mouse the user can
select specific actions to be performed on the unit.
Name tags can also be displayed for each OM-DAQLINK icon on the Map View.
33
Page 41
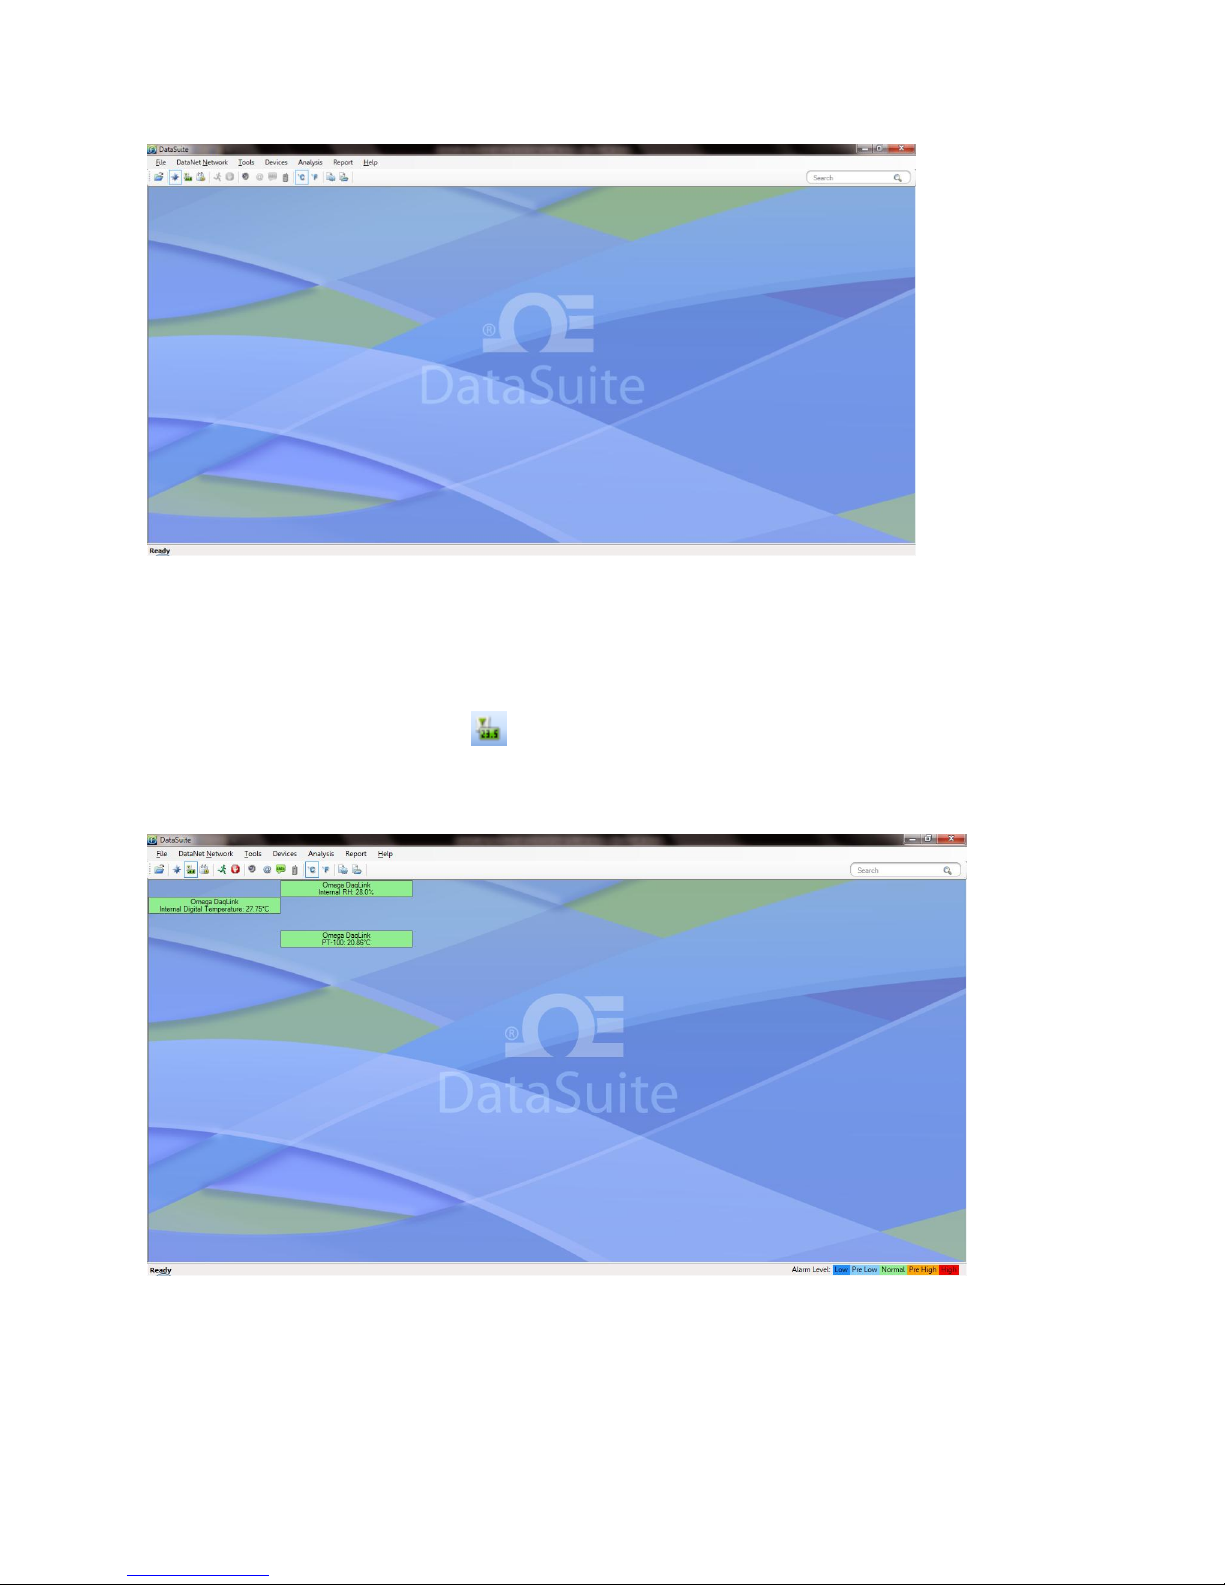
Figure 18: Main window - Map View desktop
Refer to section 5.14 for more details on working in Map View.
5.4.2. Sensor View
Clicking the Sensor View button in the main toolbar switches the main DataSuite window
to a display where sensor data is represented in individual windows. All sensors which are
currently online will be displayed in this view. If a logger is currently offline then its data will not
be visible.
Figure 19: Main window – Sensor View
34
Page 42
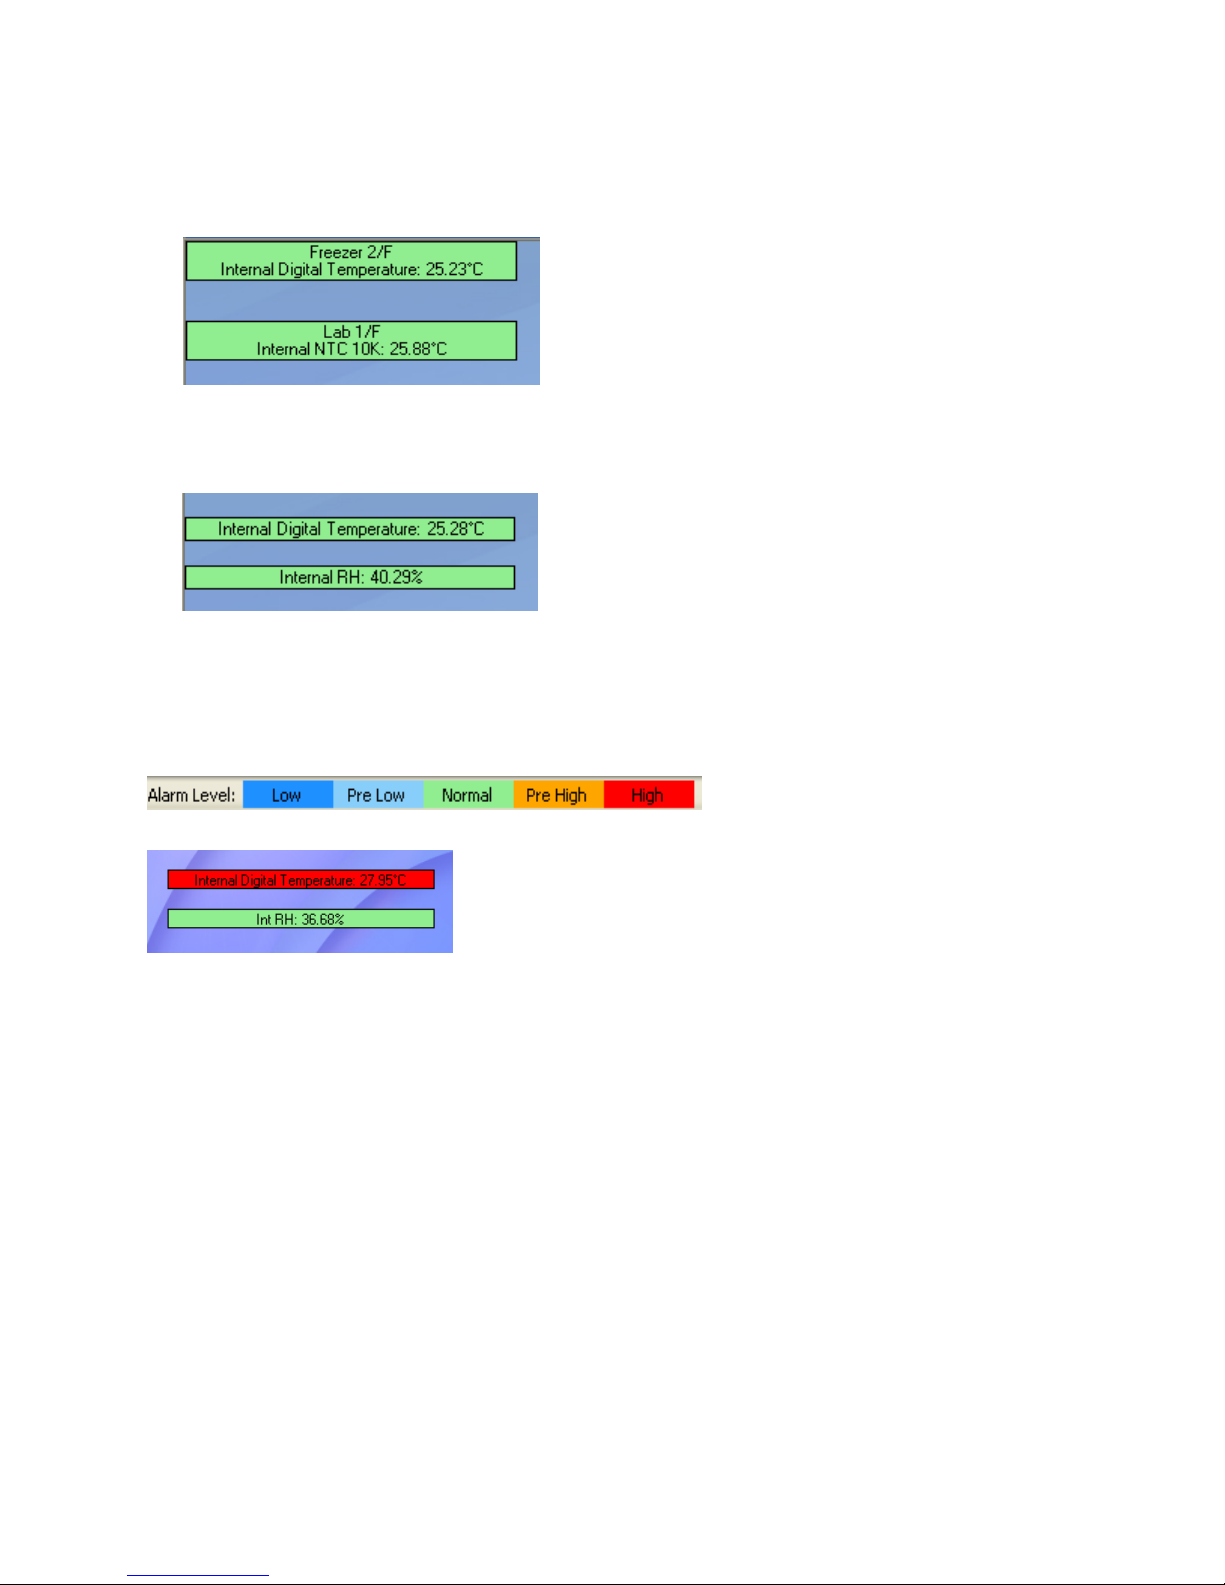
There are two modes for viewing the sensor data, which may be toggled by going to Tools >
Switch Sensor View Mode in the main menu.
Expanded view
In this view, the logger comment, sensor type and sensor data is displayed.
Slim view
In this view, only the sensor type and sensor data is displayed.
Sensor in Alarm
When the sensor data is in alarm, the color of the sensor window will change according to the
alarm type. There is a legend in the lower right corner of the main window:
For example:
This screenshot indicates that the Internal Digital Temperature reading is in High alarm, while
the Internal Relative Humidity reading is at normal levels.
Additional Features
The sensor windows may be dragged and placed anywhere on the screen.
Double clicking the sensor window will open the Data Display window, where the real-time
sensor data is displayed in graph or table view.
When the logger is downloading data, a message in the sensor window will be displayed.
35
Page 43
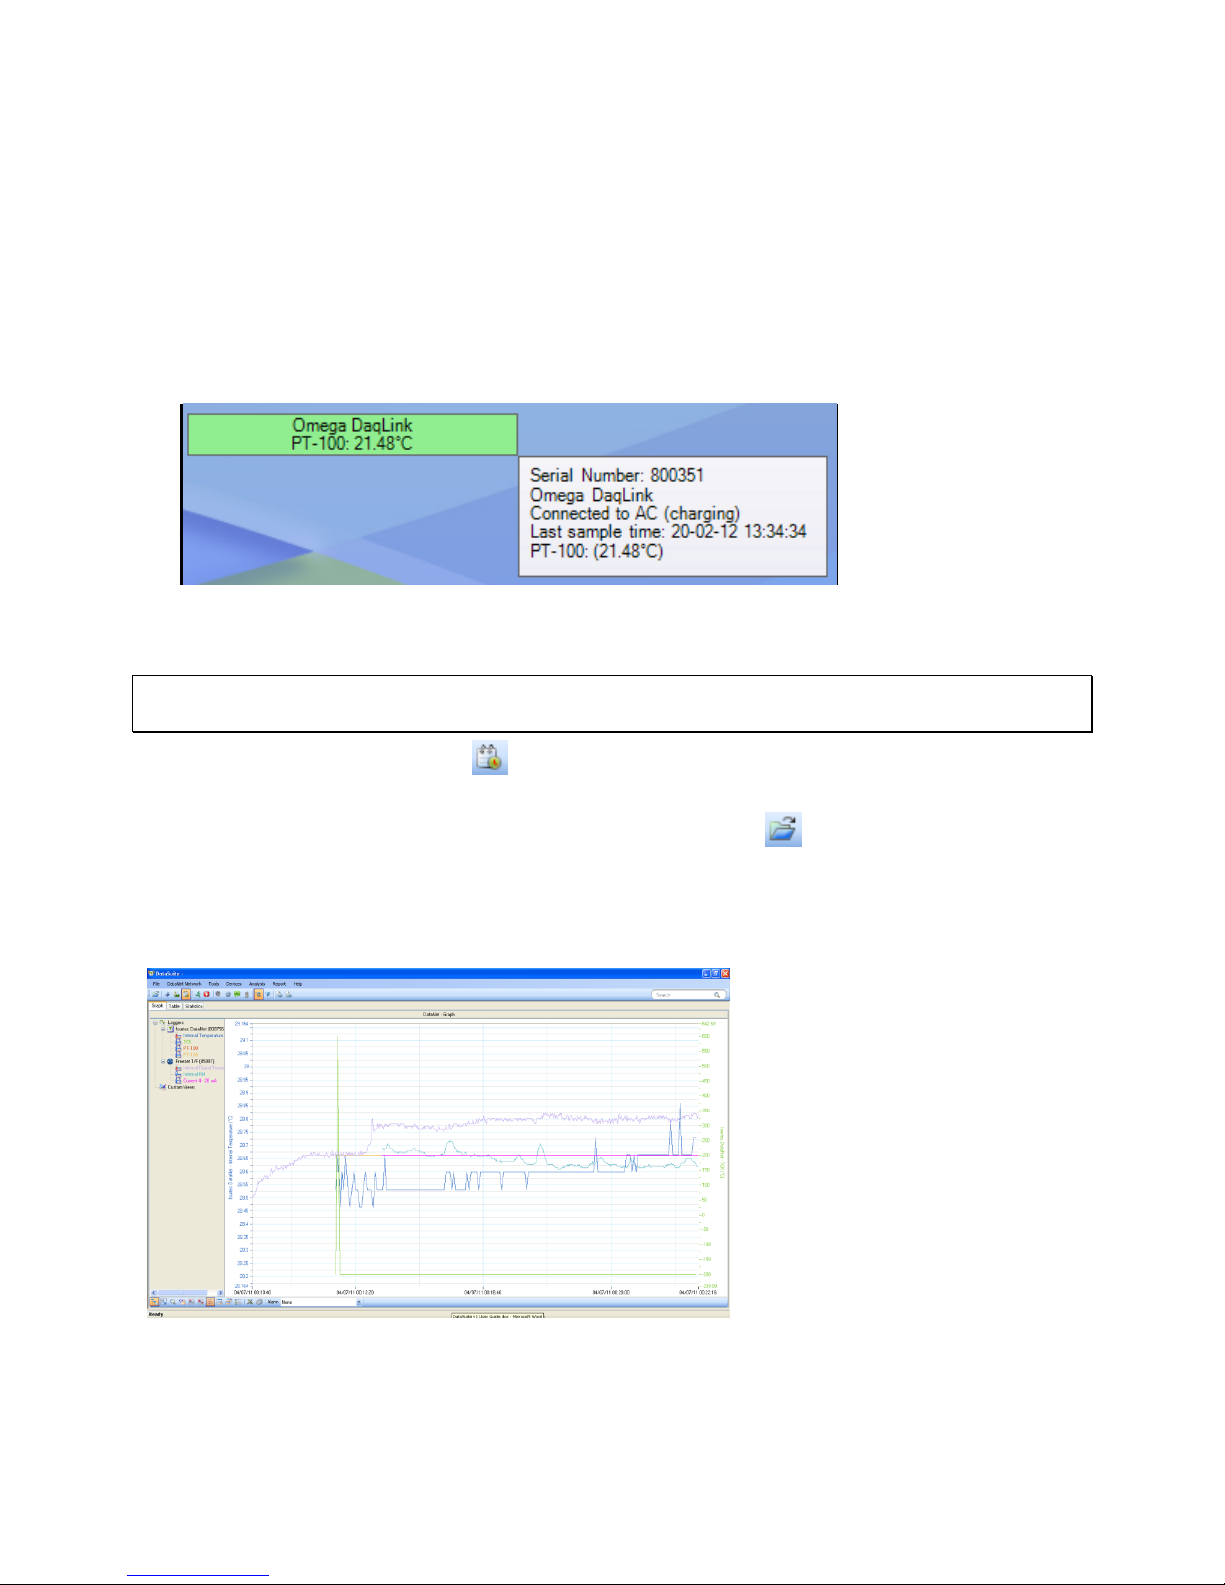
Scrolling over the sensor window with the mouse cursor will bring up a tooltip displaying the
following data:
Serial number
Logger comment
Battery level
Last sample time
Sensor type and reading
Downloading data indication (when relevant)
5.4.3. History View
Note: In History View you can view data from multiple Omega products in the same view. For
example, compare data from OM-DATANET loggers side-by-side with OM-DAQLINK loggers.
Clicking the History View button in the main toolbar will switch the main window to view
archived, offline data stored in the DataSuite directory on the workstation.
You must first open the archived data file by clicking Open File on the main toolbar. When
you open the data file it will be displayed in the History View, otherwise, the History View
window will be blank.
Refer to section 5.12: Viewing Archived (Offline) Data on page 55 for more details on opening
files in History View.
Figure 20: Main window – History View
36
Page 44
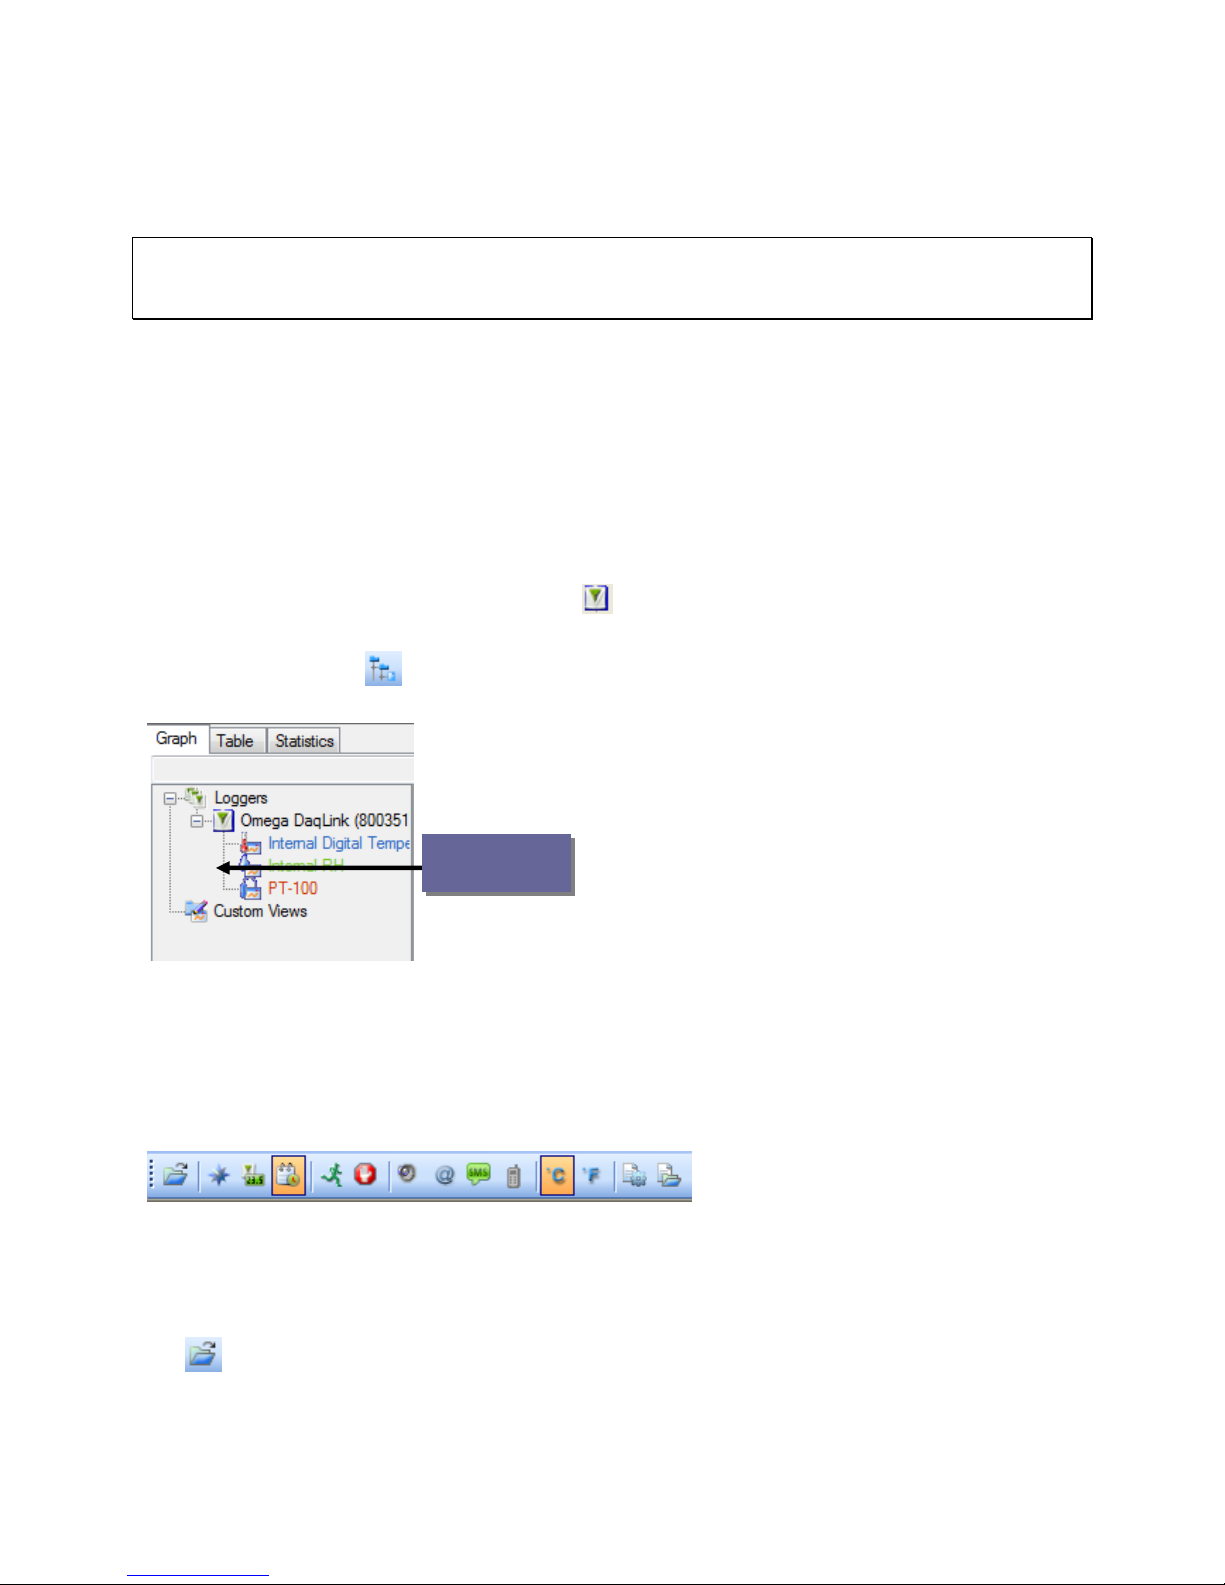
Open file - Opens archived logger data file
stored on the PC
Data Map
In History View, the user may view the data in graph or table format by clicking the relevant
tabs, as well as view a number of Statistics taken from the data set.
To learn the functionality of the lower graph toolbar, refer to section 5.4.5 below.
Note: Users of Windows 7 using right to left language settings e.g. Hebrew, may have problems
viewing the Date/Time in the DataSuite graph. This is a known Microsoft ® bug. Until a bug fix is
released, change the Regional Settings to English.
5.4.4. Data Map
The History View window also includes the Data Map pane, on the left of the window.
The Data Map displays all data sets opened in History View, saved in the current project file,
and includes nodes for each sensor in the data set.
Clicking the sensor label removes the data from the graph. When the label is black, the data is
not displayed on the graph. The sensor data plot color is matched to the color of the sensor
label in the Data Map.
Each data set is preceded by a Logger icon , which can be expanded or collapsed to display
the associated sensor data.
Clicking the Tree icon in the lower graph toolbar removes the Data Map pane altogether
allowing a full screen graph view.
Figure 21: Data Map
5.4.5. DataSuite Toolbar Icons
This section outlines all of the toolbar icons available in the software.
Main (Upper) Toolbar Icons
Figure 22: Main toolbar icons
The main toolbar is always available at the top of the DataSuite application, no matter what
window view the user is in.
This toolbar cannot be moved or hidden.
37
Page 45
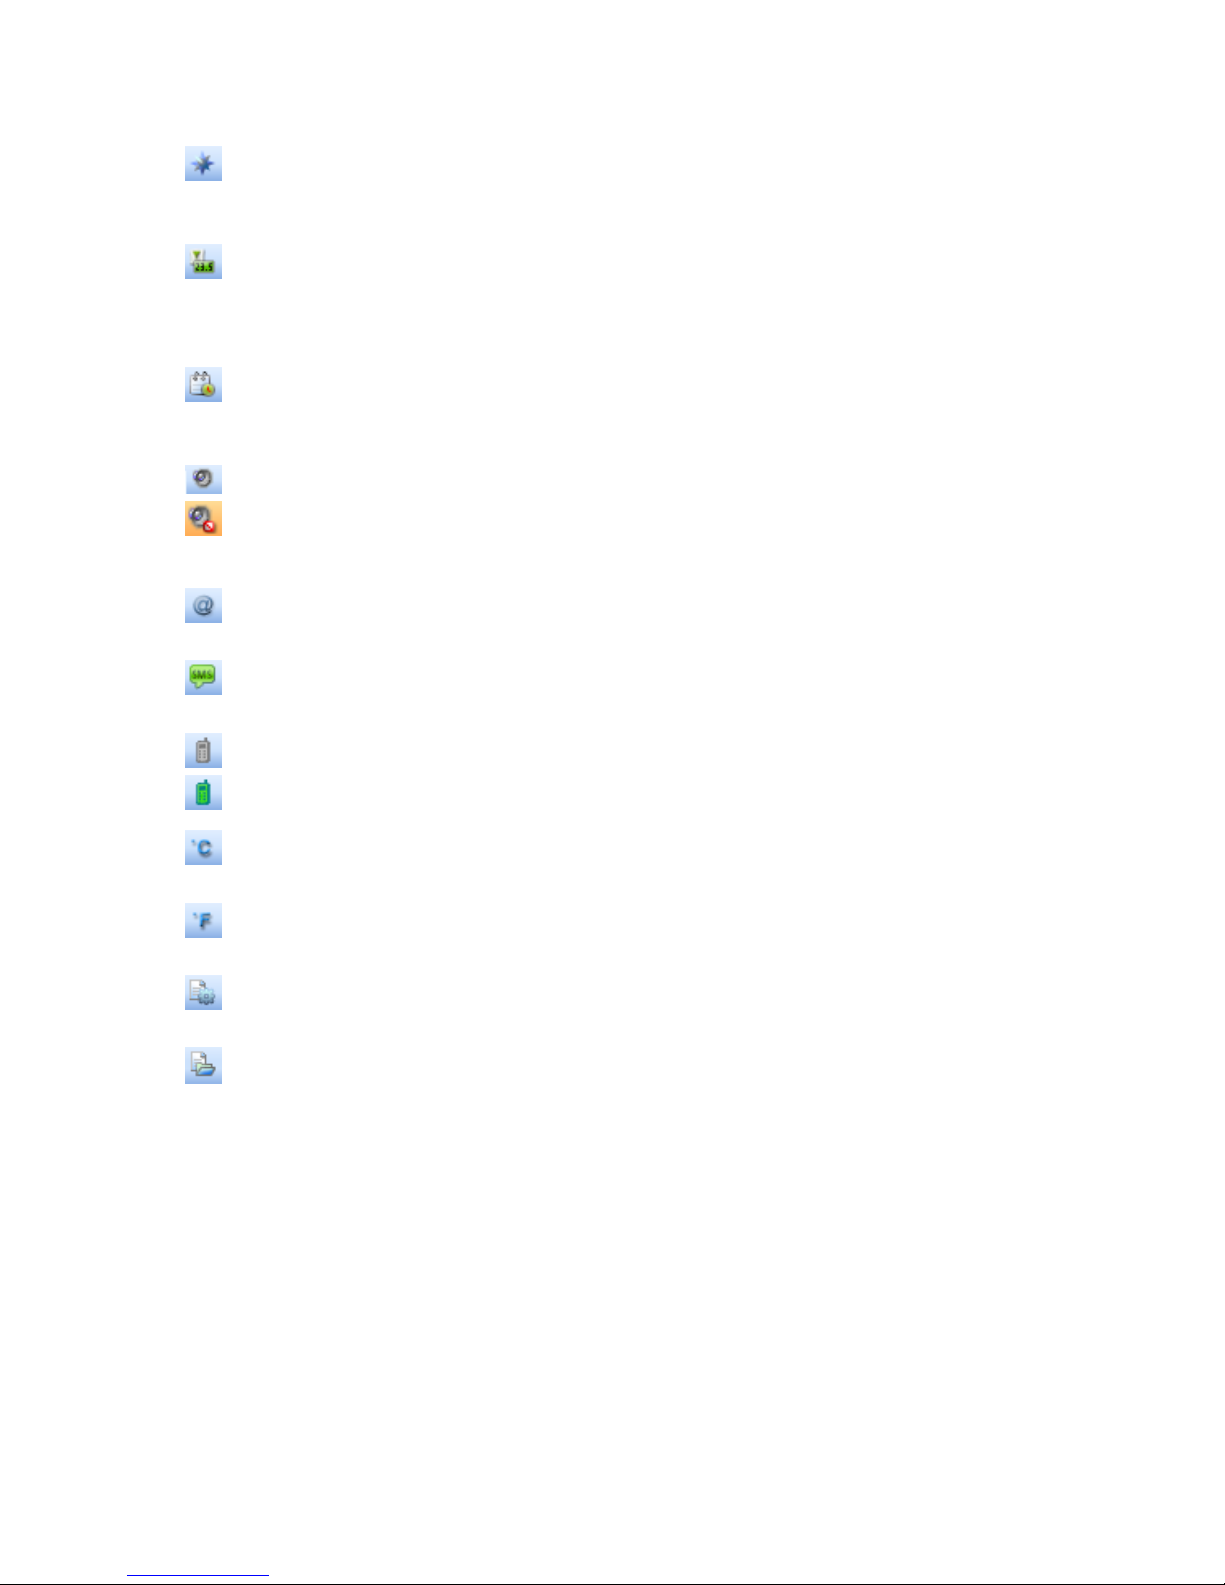
Map view - Switches main window to Map
view, where the units connected to the
computer are represented
Sensor view - Switches main window to
Sensor view, where data from each
running sensor is displayed in a simple
view
History view - Switches main window to
History view, where archived logger data
can be viewed and analyzed
Alarm mute/unmute - Mutes or unmutes
an audible alarm in the system when a
sensor reading has breached the userdefined alarm level
Email Alarm Notifications - Configuration
window for Email alarm notifications
SMS Alarm Notifications - Configuration
window for SMS alarm notifications
GSM Modem - Indicates if GSM modem is
connected (green icon) or disconnected
(grey icon)
Temperature unit toggle - Display all
data in Celsius
Temperature unit toggle - Display all
data in Fahrenheit
Reports Profile Manager – Opens
Reports module
Report Browser – Opens window for
browsing saved Reports
Table 2: Main toolbar icon list
5.4.6. Map View Icons
The following icons representing the various statuses of the devices are viewed in Map View.
Using these icons the user is aware of the status of each unit e.g. offline/online, alarm, power,
etc.
Alarm status is also indicated: Green = Normal ; Red = Alarm
38
Page 46
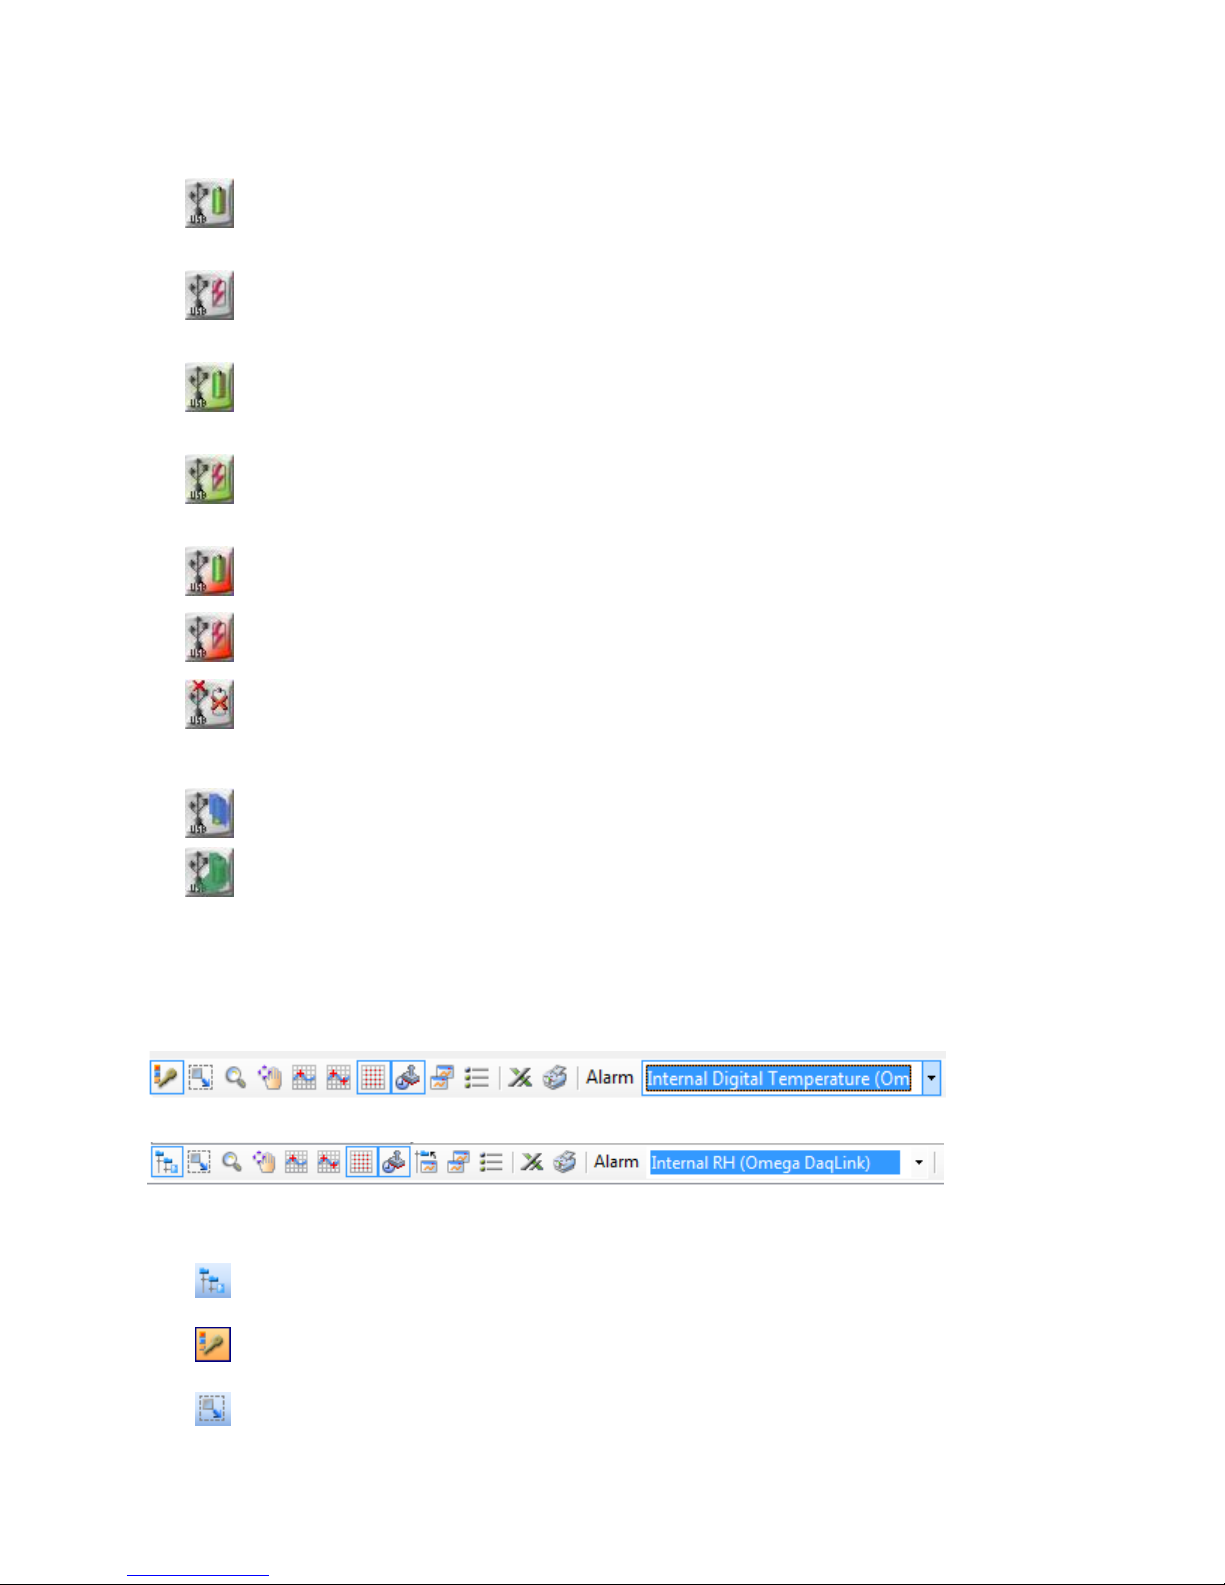
OM-DAQLINK Icons
Logger which has received its Setup but is
in Stop mode.
Running from internal battery supply.
Logger which has received its Setup but is
in Stop mode.
Running from external power supply.
Logger in Run mode and running on
battery supply.
Green indicates there are no alarms.
Logger in Run mode and running on
external power supply.
Green indicates there are no alarms.
Logger in Run mode with an alarm alert.
Running from internal battery supply.
Logger in Run mode with an alarm alert.
Running from external power supply.
Logger is offline and is no longer detected
by the computer. Its power supply may
have failed or the USB cable was
disconnected.
Logger is processing a command sent
from the software.
Logger is downloading data.
Data Map (in History View only) – Hides or shows the Data
Map pane in the History View window.
Plot Legend (in Display Data View only) – Hides or shows
the sensor labels from the bottom of the graph.
Autoscale - Returns the data to its default scale.
5.4.7. Graph (Lower) Toolbar Icons
The graph toolbar is located at the bottom of the open graph view, when the user is either in
Online Data Display:
Or History View:
The toolbar cannot be moved or hidden.
39
Page 47
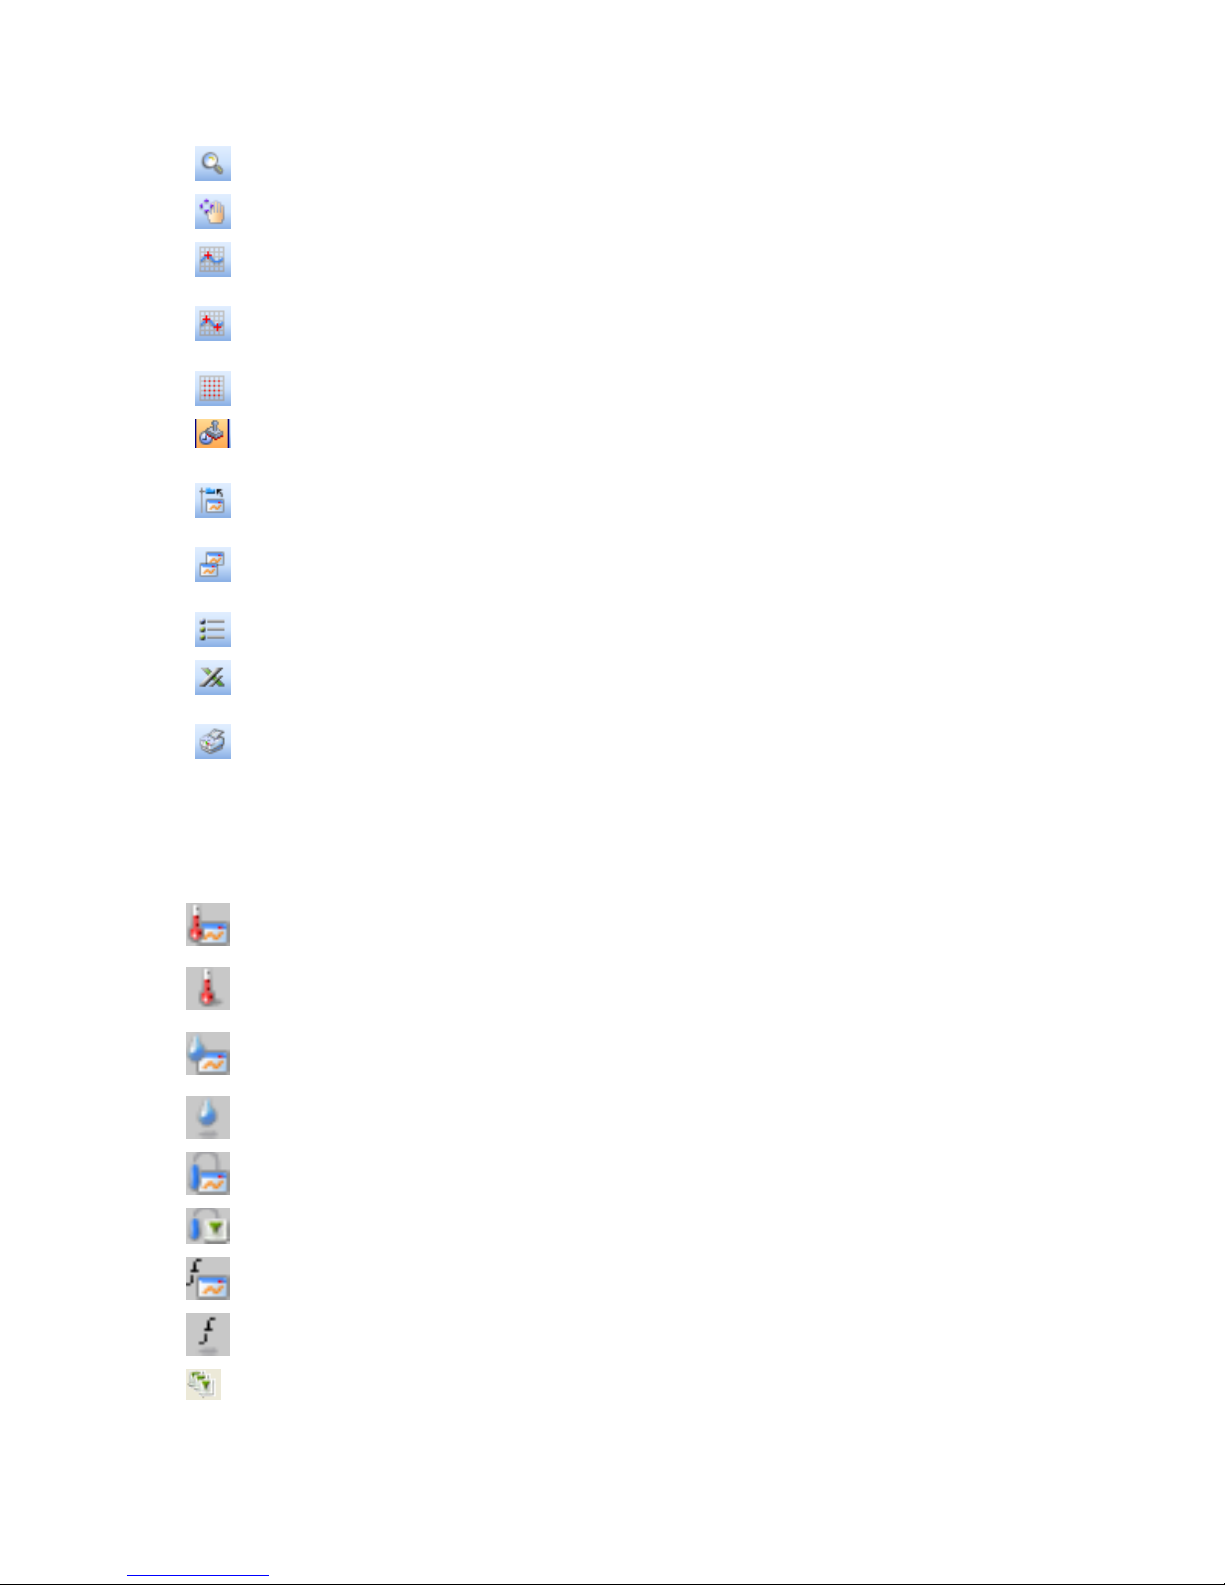
Zoom in – Zooms in on the graph data.
Pan graph – Pans the graph along the x or y axis.
Select first cursor – Adds a cursor to the designated plot
on the graph
Select second cursor – Adds a second cursor to the
designated plot on the graph.
Grid – Adds a grid to the graph background
Show/Hide Time Stamp – Shows or hides the time stamp
markers on the graph
Add Custom View (in History View only) – adds the open,
customized graph view to the Data Map
Copy graph – Copies the graph to your clipboard, to be
copied to a document or spreadsheet, for example.
Graph properties – Opens the Graph Properties window.
Export to Excel – Export the open data sets to Excel
format.
Print – Opens the Print dialog. Available for graph, table
and statistics views.
Displayed internal Temperature sensor
data set
Hidden internal Temperature sensor data
set
Displayed internal Humidity sensor data
set
Hidden internal Humidity sensor data set
Displayed external sensor data set
Hidden internal sensor data set
Displayed graph function
Hidden graph function
Parent node for all logger data sets. Click
to expand or collapse all child nodes.
Table 3: Lower graph toolbar icon list
5.4.8. Data Map Icons
40
Page 48
Logger data set. Click to expand or
collapse the data set containing all
measured inputs of the specific logger.
Parent node for all custom graph views.
Click to expand or collapse all child nodes.
Displayed custom graph view. When
hidden the icon is grayed out.
Table 4: Data Map icons
5.5. File Menu Items
5.5.1. Open
Select Open to access archived data files for each logger in your network.
Shortcuts: You can also click the Open icon or press Ctrl+O to open archived files.
5.5.2. Open Project File
Opens project files of offline data, containing data from one or more loggers, as opposed to
standard data files containing data from only one logger.
5.5.3. Save Project
Saves multiple data sets and custom graph views into a single Project File. Only available in
History View.
5.5.4. Save Project As
Saves an existing Project file under a different name.
5.5.5. Backup System Files
This feature allows the user to backup system data and configuration files for all DataSuite
modules to a defined path on the local computer, network or USB memory stick.
Backing up these files to a secure location will ensure that in the event of damage to the
computer hard disk, for example, you will be able to restore the critical files containing all the
device data and configurations of the DataSuite itself. It will also enable you to setup mirror
installations using the same devices.
5.5.6. Restore System Files
Once the system files have been backed up, use this feature to restore them to the DataSuite
workstation or to another computer.
41
Page 49
5.5.7. Print Map View
Prints the current Map View with all unit icons, including their network paths and name tags.
5.5.8. Exit
Exits the DataSuite application.
5.6. Tools Menu Items
5.6.1. Define Sensor
DataSuite enables the user to define custom sensors. This is a useful tool for when the data
logger is communicating with many sensor types from different vendors.
Any additional sensor that you would like to connect to the logger must comply with the
following restrictions:
The sensor’s output must be either voltage in the range of 0 to 1 V, 0 to 50 mV, current in the
range of 4 to 20 mA or Pulse in the range of 0 to 65535 pulses.
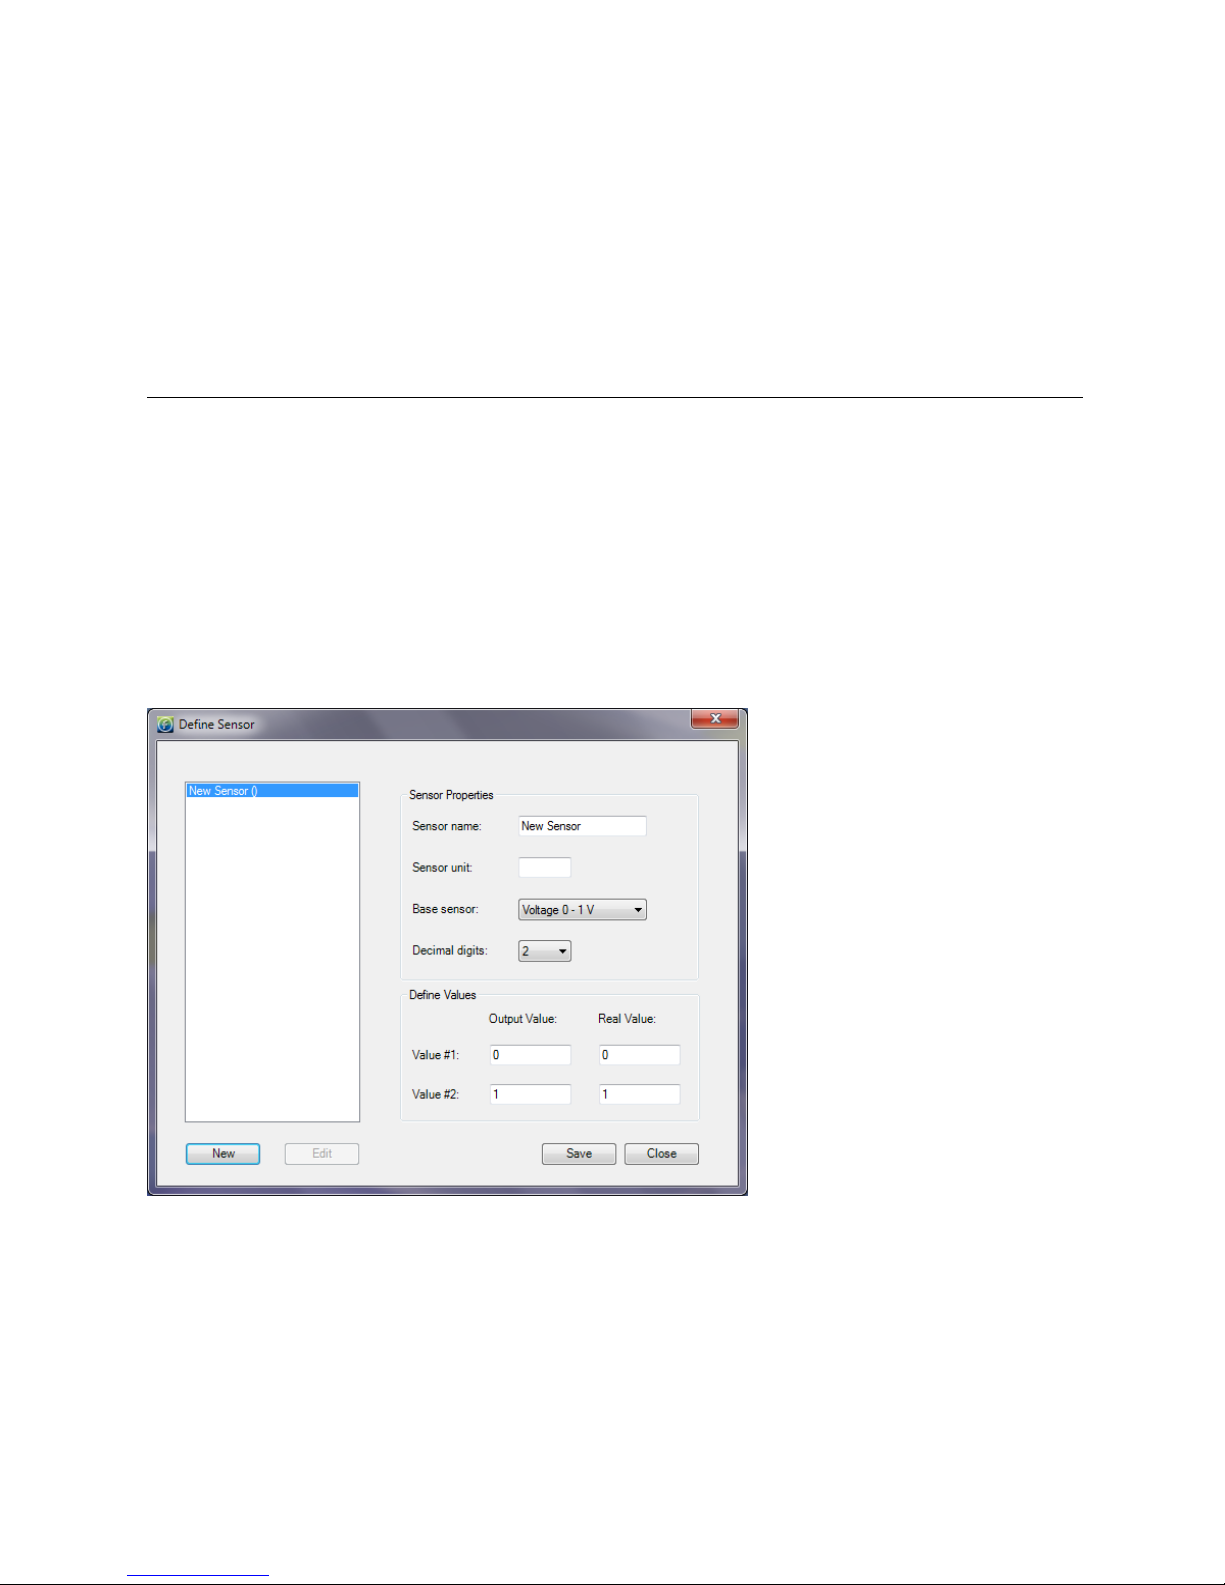
1. Click Tools > Define New Sensor and the Define New Sensor dialog will open.
Figure 23: Define New Sensor dialog
2. Click New to enable the fields.
3. Select the Base sensor from the drop-down menu (depending on whether your sensor’s
output is 0 to 1 V, 0 to 50 mV, 4 to 20mA, or measuring pulses).
4. Enter the sensor name and sensor unit.
42
Page 50

5. Enter two calibration values (two real values and the corresponding output values of the
sensor).
6. Click Save.
7. To make any changes to the existing sensor definitions, stand on the sensor name and click
Edit. Otherwise, click New to define additional sensors or click Close to exit the dialog.
To use the custom defined sensor:
1. Enter the Setup dialog for the data logger you want to configure.
2. Select the Input you wish to use and from the Sensor Type drop-down menu, select the
custom sensor, which now appears in this list.
3. Proceed with the setup as you would normally do.
5.6.2. Switch Sensor View Mode
While in Sensor View, selecting this option will switch the sensor view between large and small
window sizes. By reducing the size of the sensor window you display only the sensor type and
sensor data. Enlarging the size of the sensor window will display sensor type, sensor data and
logger name.
5.6.3. Lock Map View
While in Map View, with Lock Map View selected the Map View icons are in a fixed position and
can’t be moved. You must unselect this option in order to freely move the icons anywhere on
the screen. This is essential if working with a custom background image.
5.6.4. Options Menu
Refer to section 5.7 for more details.
5.6.5. Manage Contacts
The Manage Contacts dialog is where the user can add, edit and remove all contacts and
groups to which DataSuite Reports and Email/SMS notifications are sent.
Refer to section 5.16.1 for more details regarding managing Contacts, and to section 5.16.2 for
more details regarding managing Groups.
5.6.6. Email Alarm Notifications
The Email Alarm Notifications dialog is where the user can configure all notifications to be sent
via Email to a predefined contact list. Refer to section 5.16 for details.
5.6.7. SMS Alarm Notifications
The SMS Alarm Notifications dialog is where the user can configure all notifications to be sent
via SMS to a predefined contact list. Refer to section 5.16 for details.
43
Page 51
5.6.8. Firmware Update Center
The Firmware Update Center is where the logger firmware updates are managed. Please refer
to section 6.2 for more details.
5.7. Tools > Options Menu Items
The Options dialog is divided into four main tabs:
Preferences
Device Settings
Email Settings
SMS Settings
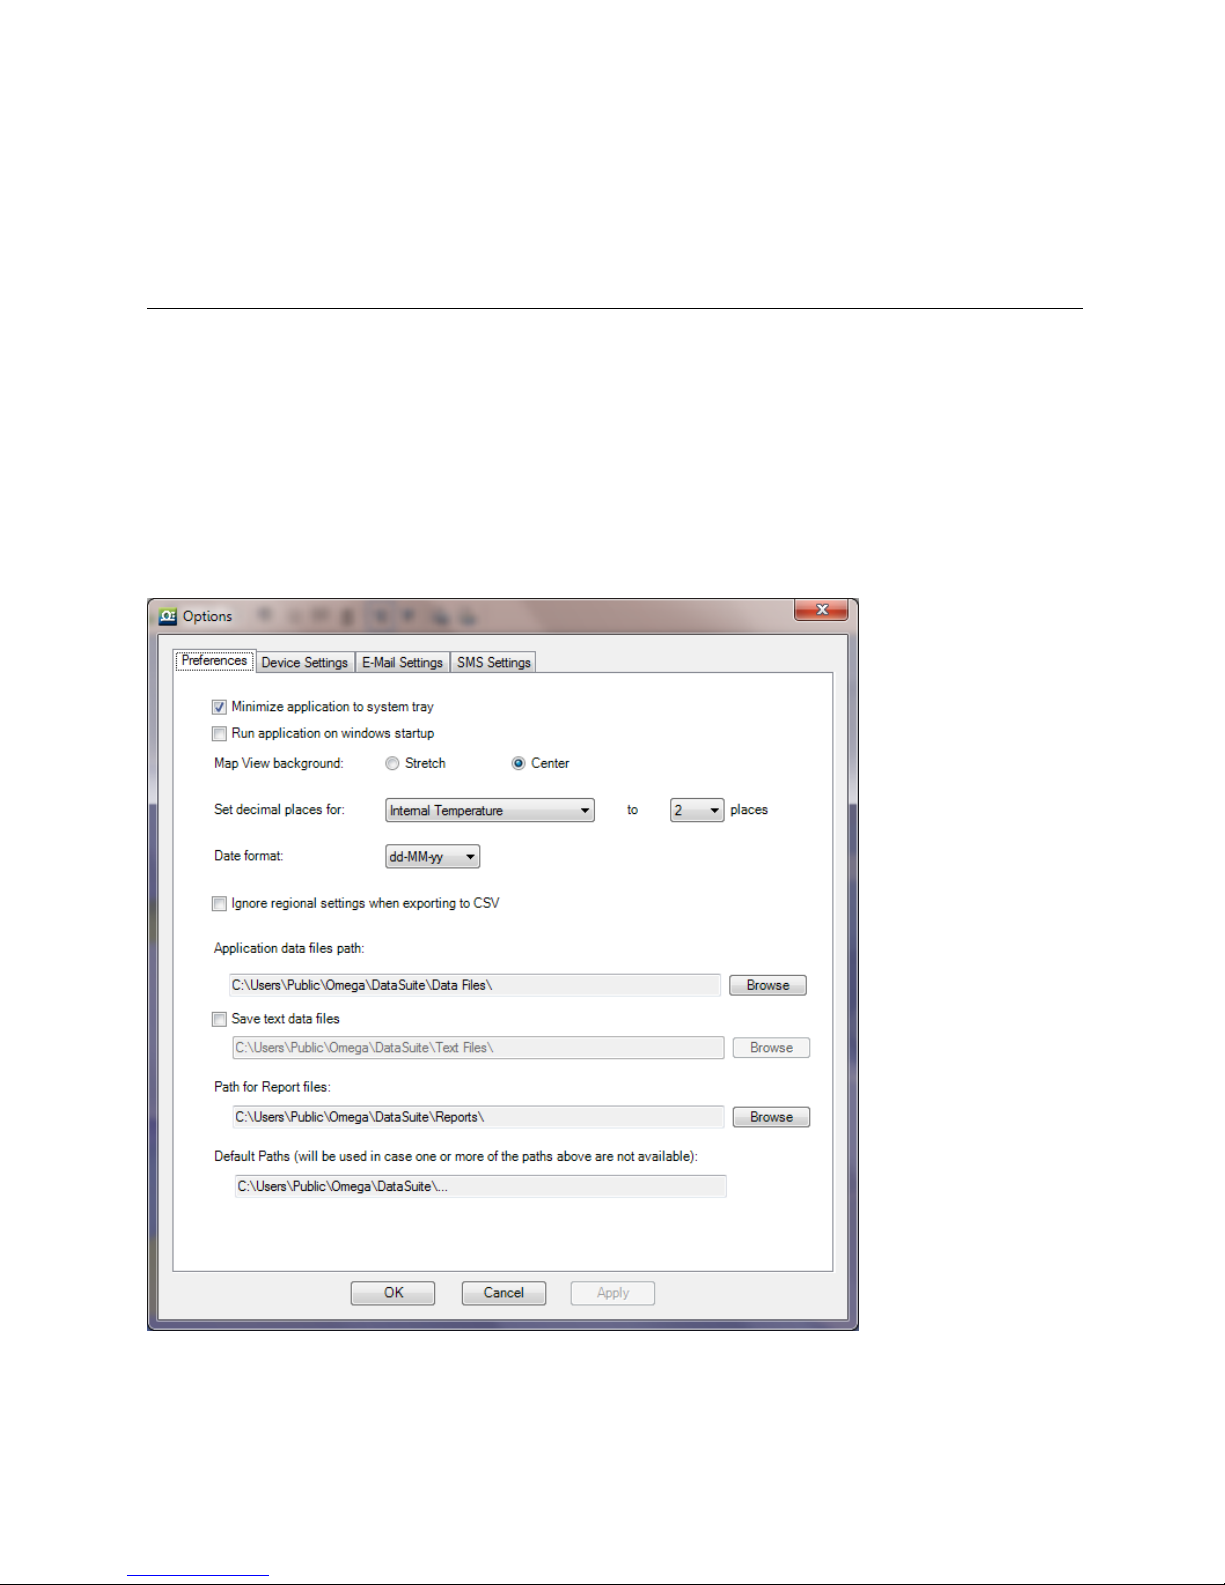
5.7.1. Preferences Tab
Figure 24: Options > Preferences tab
The Preferences tab includes the following options:
44
Page 52
Minimize application to system tray
When this checkbox is selected, the DataSuite icon will appear in the computer’s system
tray in the lower right of the screen when the application is minimized. Simply double-click the
icon to maximize the application to full screen.
Run Application on Windows Startup
When this option is selected DataSuite will automatically launch upon Windows startup. This
feature is useful in the event where the computer unexpectedly resets and when it restarts,
DataSuite will launch and online monitoring of the connected devices will be able to continue.
Note: If running Windows Vista, User Account Control (UAC) must be turned off for this feature
to work. If UAC is off then DataSuite will not launch on Windows startup.
Map View background
Use this option to toggle between Stretch and Center views for the background image used in
Map View.
Set decimal places for…
For each logger sensor, internal or external, you may select between 0 and 6 decimal places to
be used when displaying the data in the software.
Date format
Choose between four date formats to be used throughout the software when displaying data
e.g. in the Graph display.
Ignore regional settings when exporting to CSV
Selecting this option will ensure that data will be corrected exported to a CSV file and will not
use any custom regional settings in the Windows OS which might adversely affect the layout of
the data in the CSV file.
Application data files path
The default path for saving all data recorded by the data loggers is:
Default path on WinXP: C:\Documents and Settings\All Users\Application
Data\Omega\DataSuite\Data Files\
Default path on Windows 7: C:\Users\Public\Omega\DataSuite\Data Files\
Click Browse to change this path e.g. to a network path.
Save text data files
Select this checkbox if you would like DataSuite to also save the logger data to a text file. This
will allow you to export the data, in csv format, to another application that can display the logger
data.
45
Page 53
Default path on WinXP: C:\Documents and Settings\All Users\Application
Data\Omega\DataSuite\Text Files.
Default path on Windows 7: C:\Users\Public\Omega\DataSuite\Text Files
Click Browse to change this path e.g. to a network path.
Note: The text file cannot be updated with logger data as long as it is open. Make sure to close
the file when you finish inspecting the data, or copy the file to another location and view it from
there. Alternatively, open the file in Read-only mode.
Path for Report files
The default path where Report files are stored is:
Default path on WinXP: C:\Documents and Settings\All Users\Application
Data\Omega\DataSuite\Reports.
Default Path on Windows 7: C:\Users\Public\Omega\DataSuite\Reports\
Click Browse to change this path e.g. to a network path.
Default Paths
If the user has modified any of the default data file or report paths e.g. to a network path, and
should this path become available for any reason, then the DataSuite application will
automatically refer to the default path as shown under the Default Paths heading.
This precaution is necessary as otherwise DataSuite cannot download any data from the data
loggers if the data file path is not available. Data can therefore be lost.
Default path on WinXP: C:\Documents and Settings\All Users\Application
Data\Omega\DataSuite\...
Default path on Windows 7: C:\Users\Public\Omega\DataSuite\…
46
Page 54
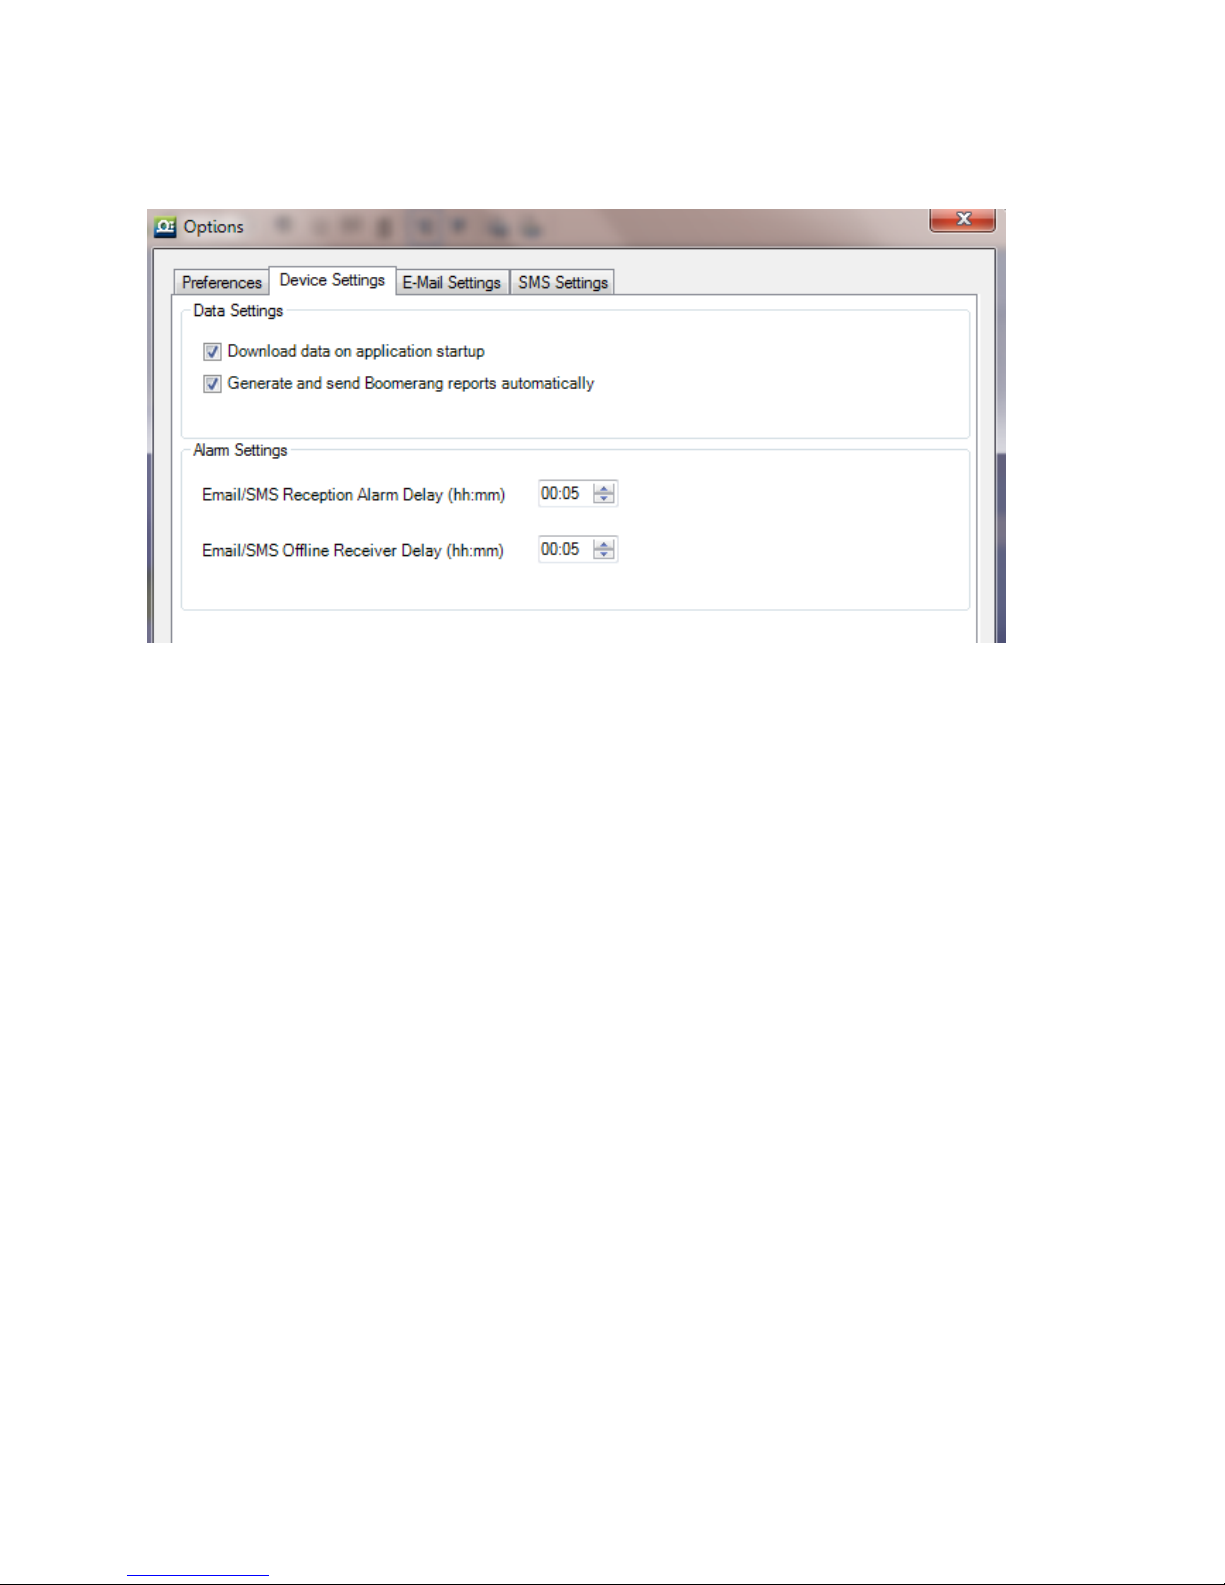
5.7.2. Device Settings Tab
Download data on application startup
Select this checkbox if you want to have automatic download of data when the DataSuite
software is launched. If there are many loggers in the system with fast sampling rates, then the
download could burden the network. Therefore in some cases disabled this feature is advised.
Generate and send Boomerang reports automatically
Select this checkbox to enable the Boomerang feature to run automatically when a Boomerangenabled logger is connected to the computer. By default, this option is enabled, so that the PDF
data report is generated and Emailed as soon as the logger is detected by the DataSuite
software.
Alarm Settings
Not relevant for OM-DAQLINK system.
5.7.3. Email Settings Tab
DataSuite’s alarm notification feature enables sending of Emails to notify the user of any alarm
in the system.
Clicking the Emails Settings tab will show the following window:
47
Page 55
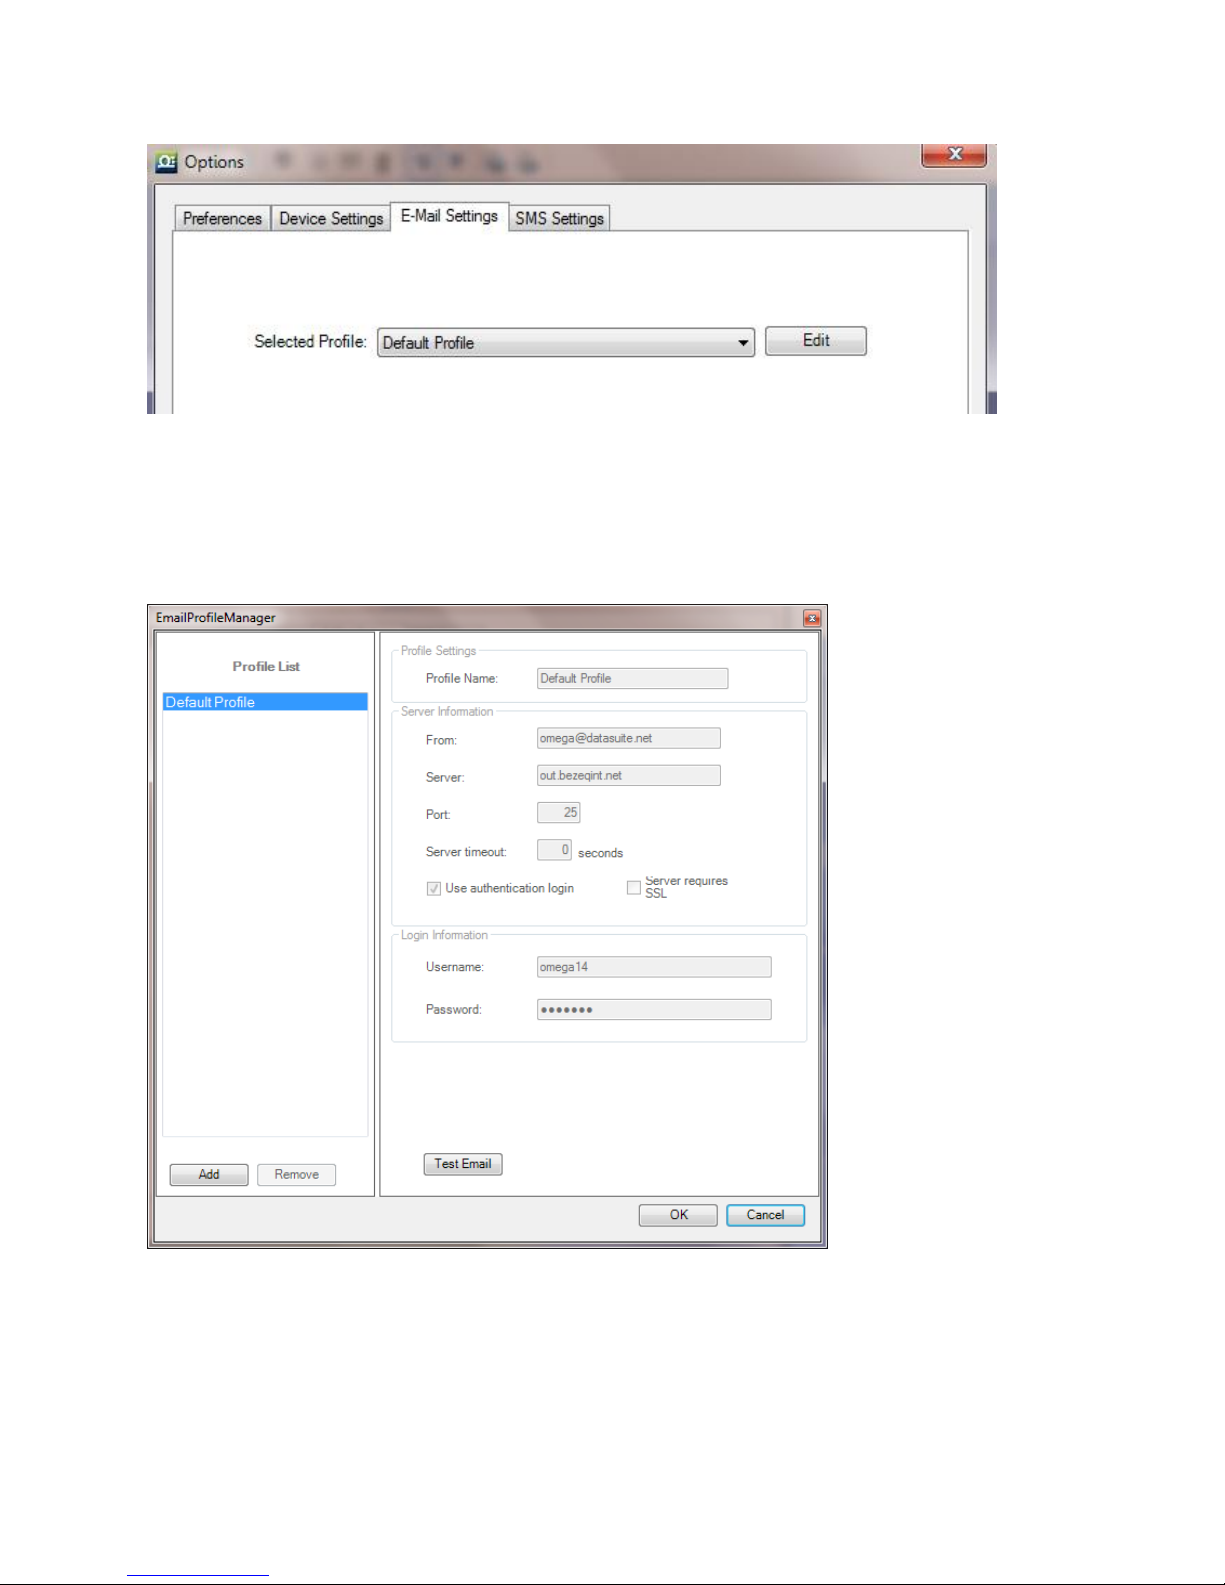
DataSuite includes a Default Profile – this is a Omega-configured email account, embedded into
the software. This means that even if you don’t configure any email account, you are still able to
send Email alarm notifications and Boomerang data reports using Omega’s own email account.
1. To edit existing Email profiles or add a new one, click Edit.
The following window is opened:
Figure 25: Options > Email Settings tab
You can view the Profile settings here. Note that the Default profile is un-editable.
2. To add a new custom profile, click Add. A new entry named New Profile is created. Click on
this entry to edit the settings, server information, etc. Make sure to enter the fields correctly
e.g. with no extra spaces or typos.
48
Page 56
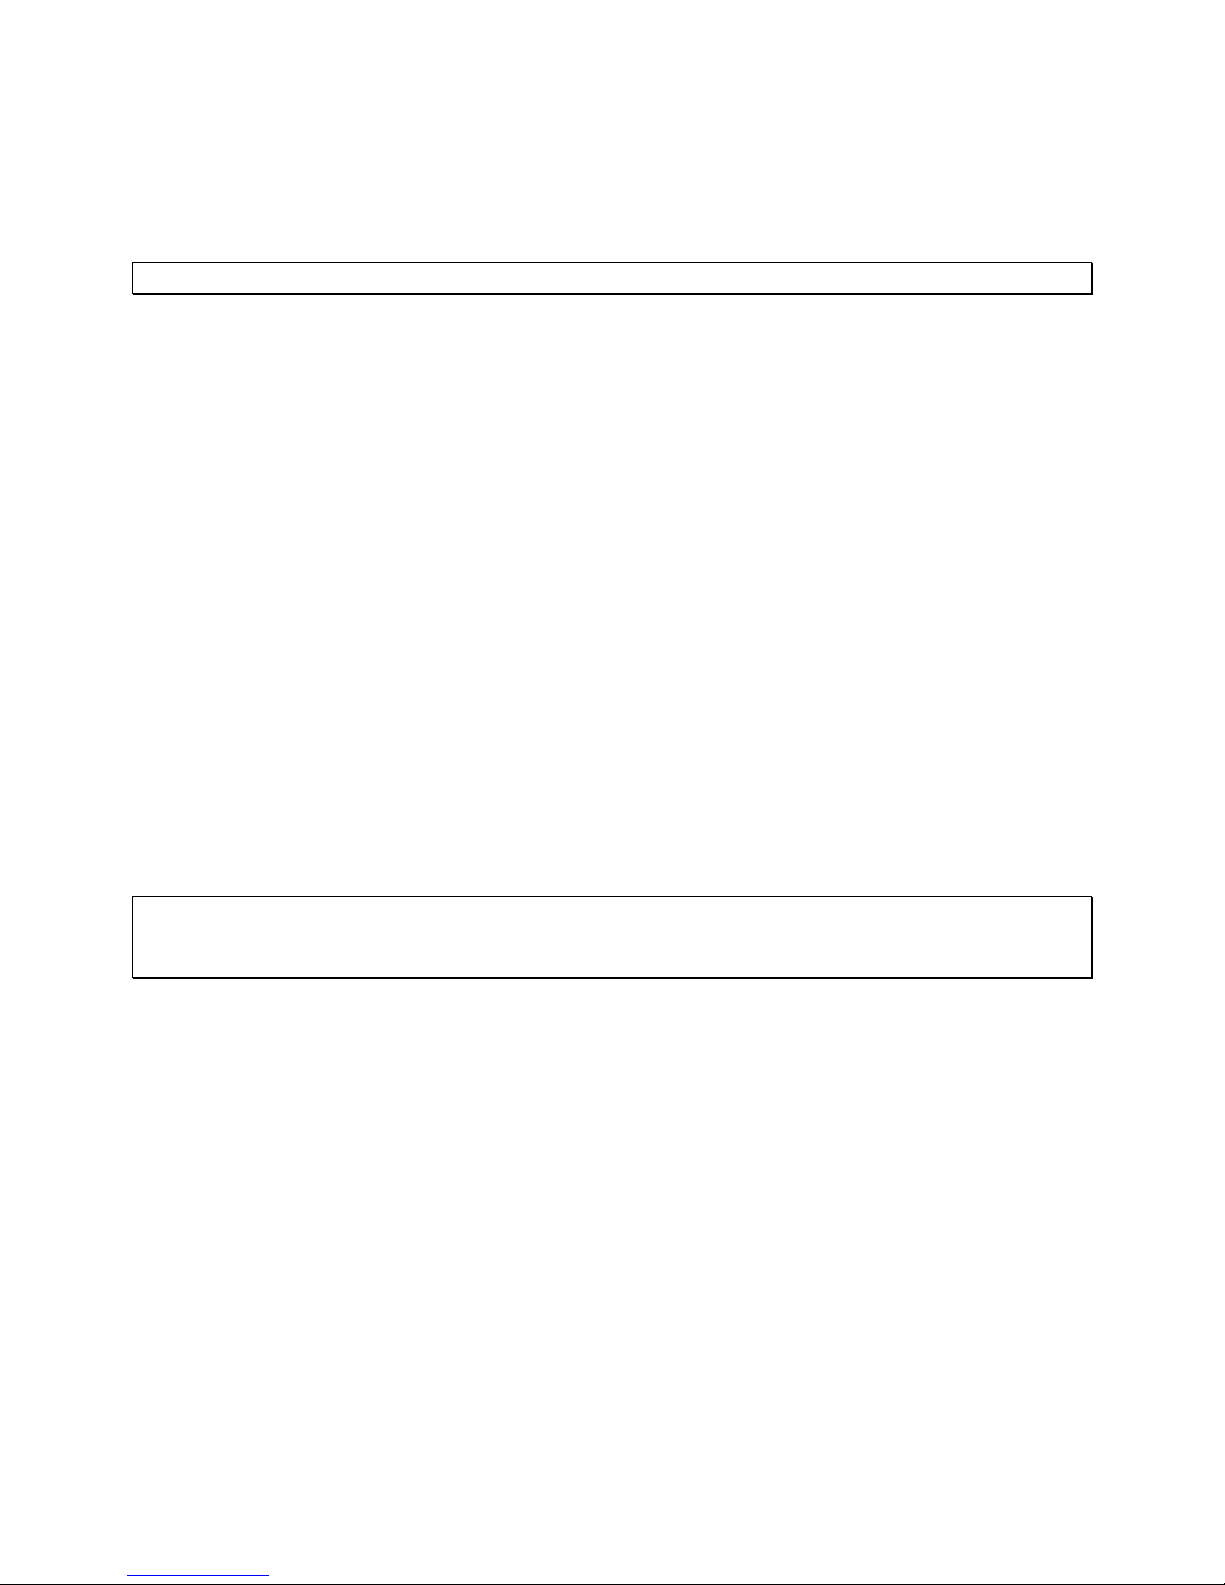
3. When finished, click OK to return to the main Email Settings window, displaying the list of
profiles.
4. To remove a profile from the Profile List, click Remove from the Email Profile Manager
window. Note that the default profile cannot be removed.
Note: DataSuite supports SMTP and MIME encoding, and POP3 mail protocols.
Sending a Test Email
To send a test Email to verify the Email configuration is correct:
1. Once the Email profile configuration is complete click Test Email to open the Contact
Information dialog.
2. Select a contact from the DataSuite contact list or enter an Email address. Click OK to send
the test Email.
3. The test Email will contain the following content:
Subject: Test message sent from the DataSuite software
Body: This is a test message sent from the DataSuite software. Sent on the dd/mm/yy
mm:hh
5.7.4. SMS Settings Tab
DataSuite’s alarm notification feature enables sending of SMS’s to notify the user of any alarm
in the system. First select the Send SMS notifications check box. Using the SMS feature
requires connection of a GSM modem and SIM card to the DataSuite PC, or even just a cellular
phone with an active SIM card.
You must select the COM port which the GSM modem/cellular phone is connected to in order
for the software to detect it.
Note: When using a cellular phone as a modem, ensure that the PC software suite is disabled
before connecting the phone to the PC com port. Otherwise the com port will not be available
for the DataSuite software.
Once the configuration is complete, DataSuite will be able to send SMS’s to predefined SMS
contacts when your loggers have breached certain alarm levels.
Refer to section 5.15.1 for setting Alarm levels on the logger and to section 5.16 for managing
the SMS alarm notifications.
49
Page 57
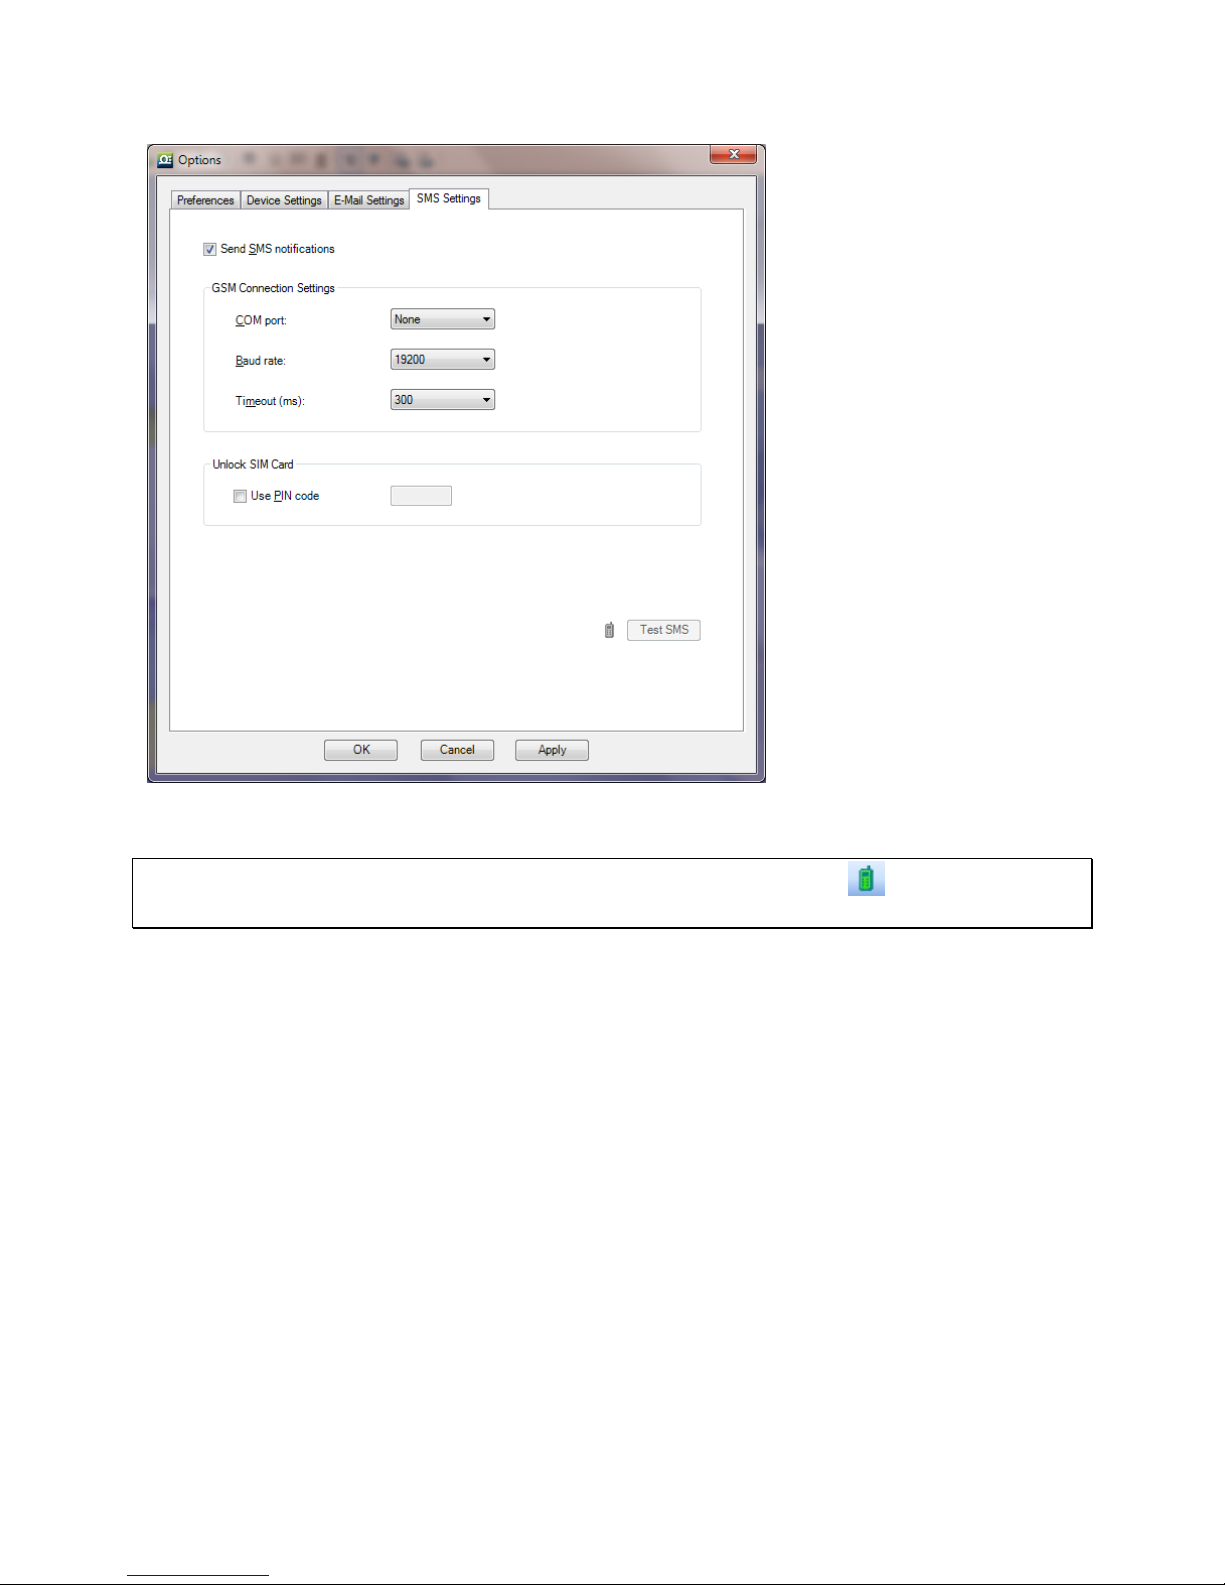
Figure 26: Options > SMS Settings tab
Note: Once the GSM modem is online you will see the green GSM icon appear in the
DataSuite upper toolbar.
Sending a Test SMS
To send a test SMS to verify the SMS configuration is correct:
1. Once the SMS configuration is complete and the GSM modem has been detected by the
software, the Test SMS button will be enabled.
2. Click Test SMS to open the Contact Information dialog.
3. Select a contact from the DataSuite contact list or enter a telephone number. Click OK to
send the test SMS.
4. The test Email will contain the following content:
Subject: Test message sent from the DataSuite software
Body: This is a test message sent from the DataSuite software. Sent on the dd/mm/yy
mm:hh
5.7.5. Analysis Menu Items
The Analysis menu items are enabled when viewing offline data in History View.
50
Page 58
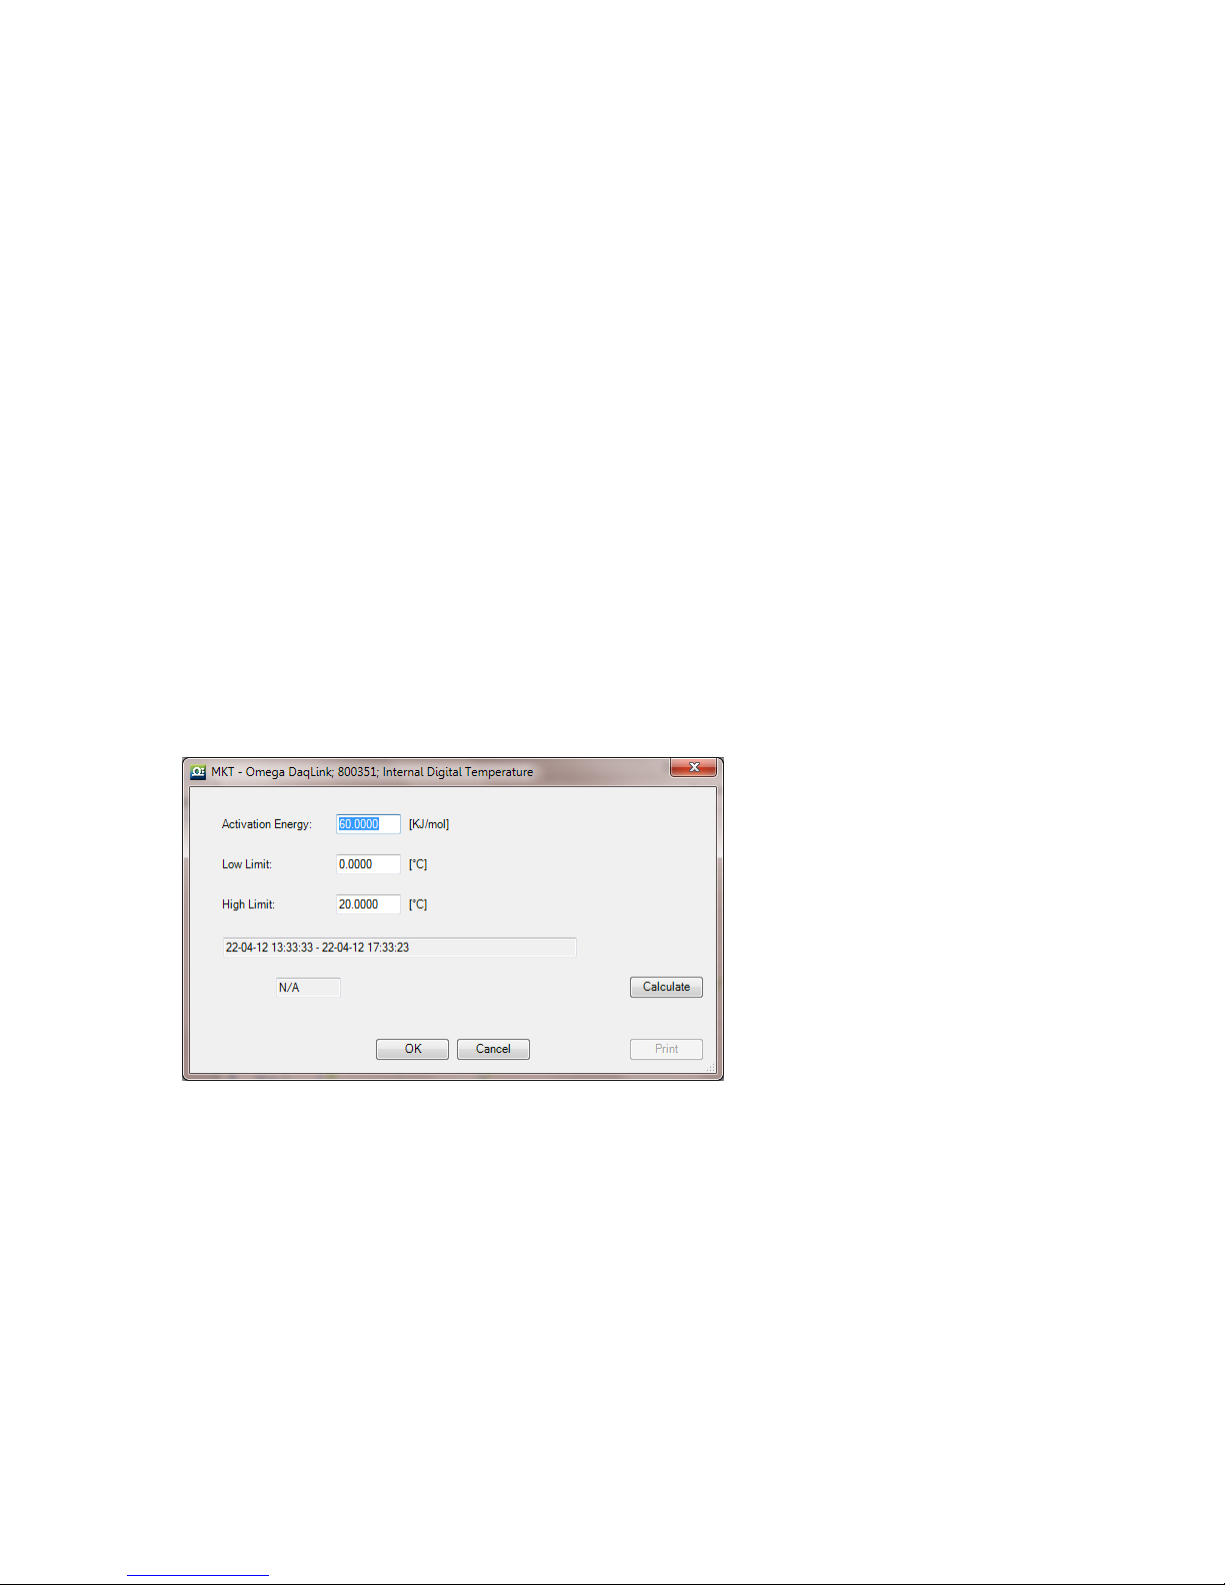
The Analysis options available are:
Functions Parameters
Dew Point
FO Pasteurization
Histogram
MKT
Export to Excel
Export to CSV
MKT (Mean Kinetic Temperature)
Mean Kinetic Temperature or MKT is used for calculating temperature stress of perishable stock
goods such as medicines or food, during storage and distribution cycles. The MKT is calculated
on a temperature graph opened from an offline DataSuite data file, in History View.
To use the MKT feature:
1. Go to File > Open and open the data file containing the relevant temperature
measurements.
2. In History View, with the graph tab in view, go to Analysis > MKT in the main menu. The
MKT dialog is opened.
Figure 27: MKT dialog
3. Use the cursors to select the data set, or leave the graph as is to perform the MKT
calculation on the entire data set.
4. Enter the relevant Activation Energy, and the Low and High Limits of the data set to be
calculated (in °C), into the MKT dialog.
5. Click Calculate. A Pass or Fail indication will be displayed and in the event of a Pass, the
MKT value will also be displayed.
6. Click Print to print the MKT dialog with the results.
51
Page 59
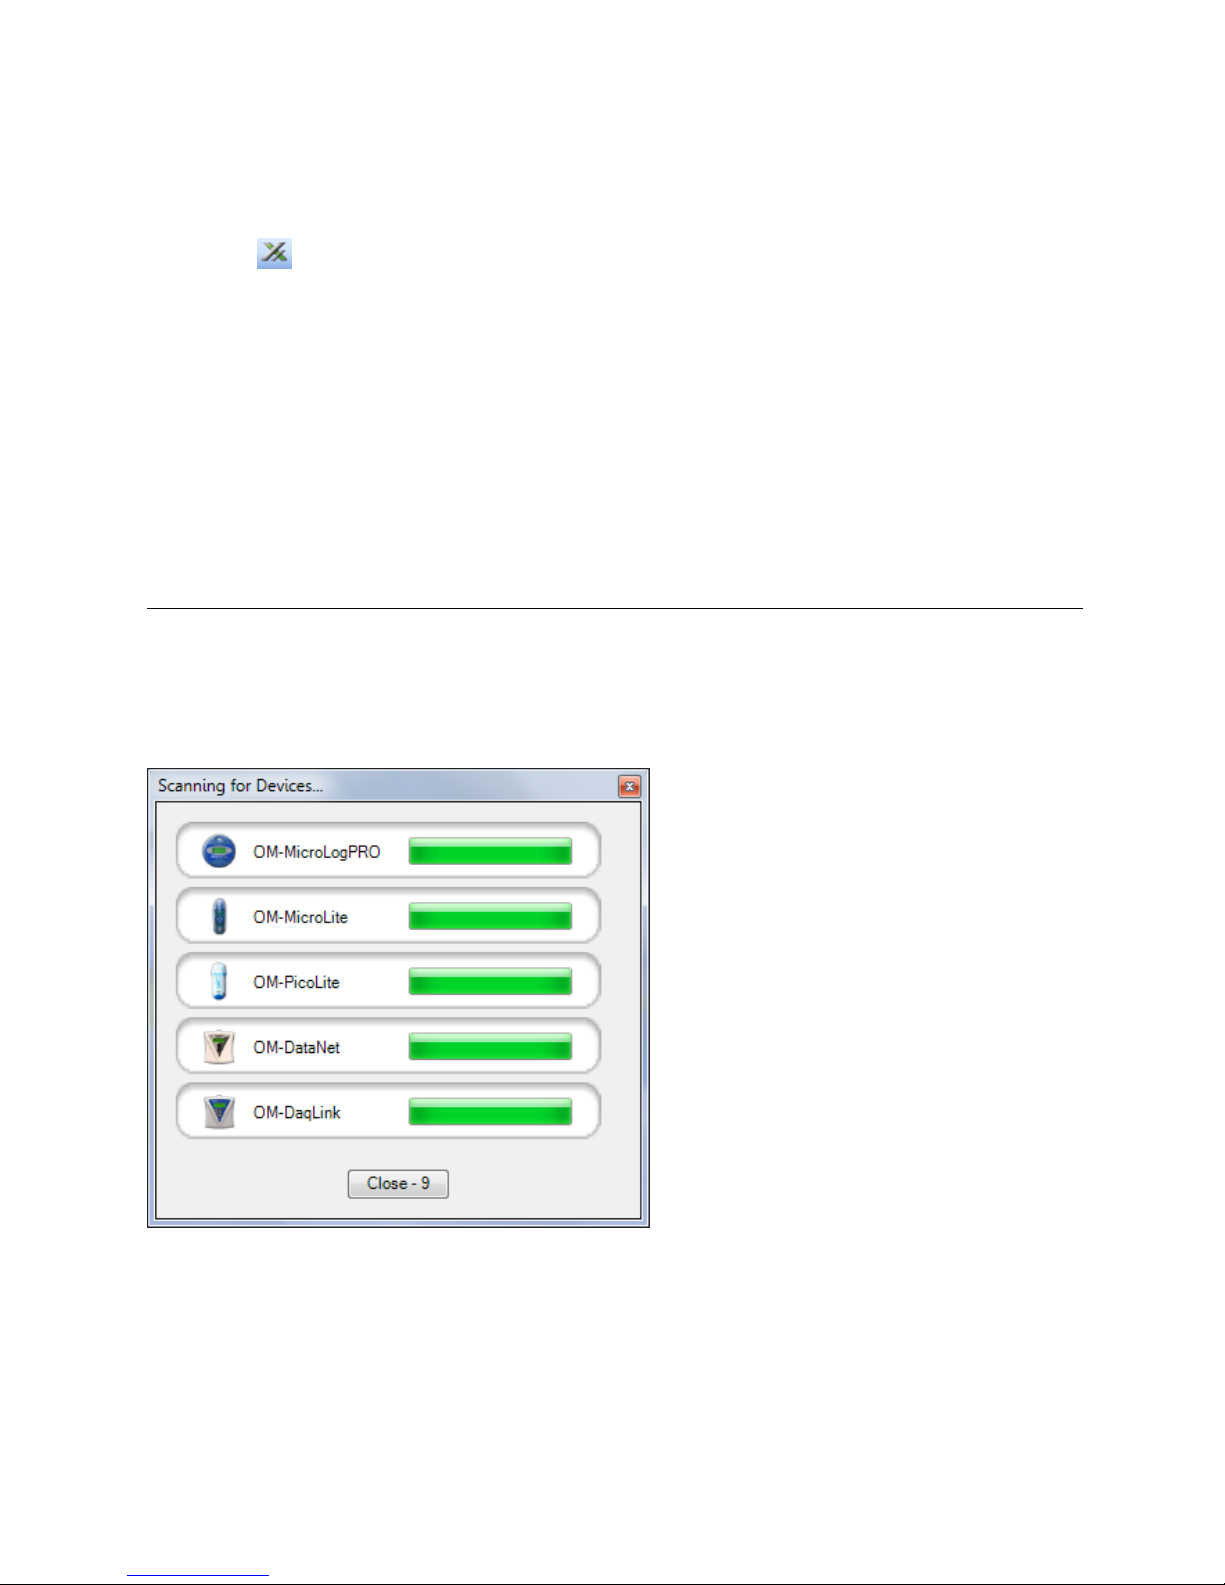
Export to Excel
You may export offline data to Excel by selecting this menu item or by clicking the Export to
Excel icon in the lower graph toolbar in History View. The data is opened in an Excel
worksheet and includes pertinent information such as logger name, SN, sensor names, alarm
levels as well as the actual data readings.
Refer to section 5.19 for more information.
Export to CSV
You may export offline data to CSV file format by selecting this menu item. Upon selecting this
option, you will be prompted to save the file either in the default DataSuite directory or in
directory of your choosing. The data is opened in CSV file format and includes pertinent
information such as logger name, SN, sensor names, alarm levels as well as the actual data
readings.
Refer to section 5.19 for more information.
5.8. Devices Menu Items
5.8.1. Detect Device
When DataSuite is launched it automatically scans all ports for DataSuite supported devices.
Select this menu item to manually detect devices.
All devices are automatically detected by the software when connected to the computer. If you
connect a device when it is switched off, and then switch the device on, the software won’t
detect the unit. You will have to use the Detect Devices feature.
The device may also lose power and go offline while connected to the USB, in which case you
will also need to detect it manually.
The Devices menu also supports Stop All and Run All commands for all connected devices.
52
Page 60
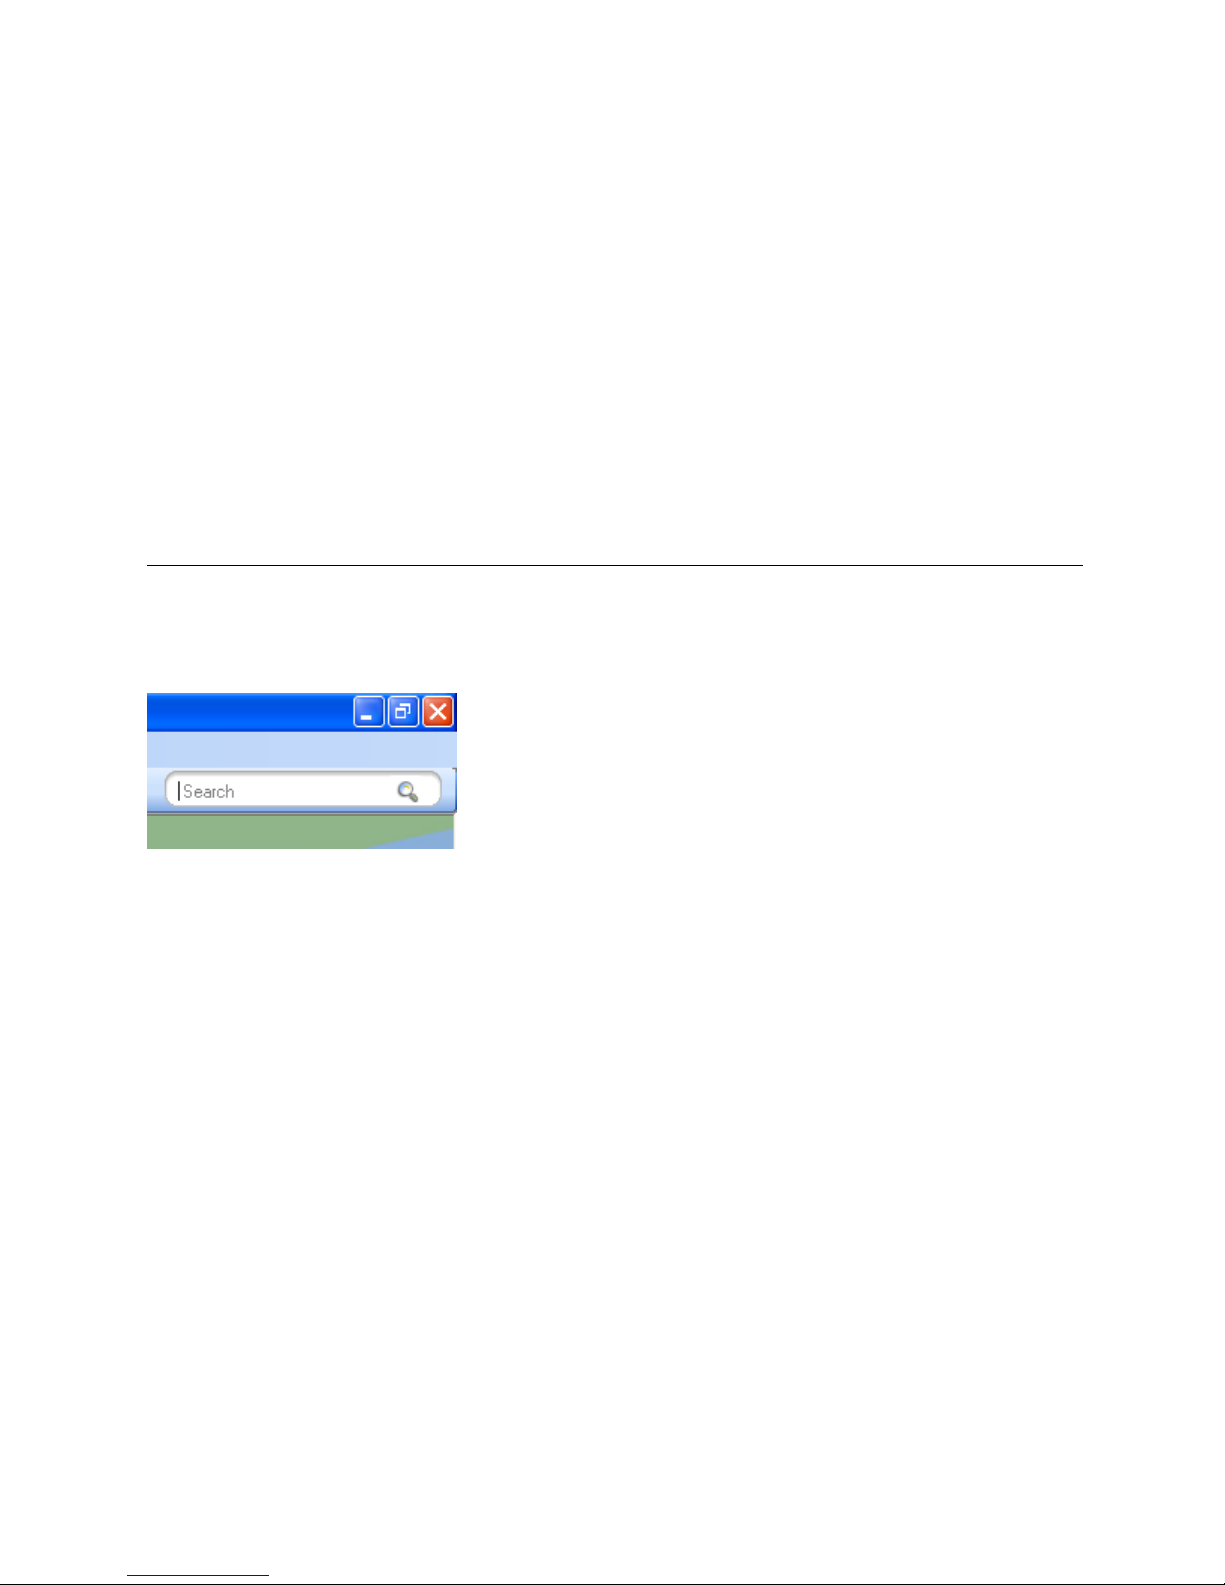
5.8.2. Stop All
To stop all the online loggers in the Map View simultaneously, go to the Devices > Stop All
menu item. Prior to stopping the loggers, DataSuite will first download and data not already
transmitted to the computer.
This feature is password-enabled.
5.8.3. Run All
To run all the online loggers in the Map View simultaneously, go to the Devices > Run All
menu item. Prior to running the loggers, DataSuite will first clear the logger menu. This
command will not apply to any devices currently in Timer Run or Push to Run modes.
This feature is password-enabled.
5.9. Search Devices
If you have many device icons situated in the Map View and have trouble locating the specific
device to configure, the Search feature can be very helpful.
In the top right corner of the main window you will find the Search window:
The search criteria are:
Device Serial Number e.g. 7002354
Device Comment e.g. Lab 1/F
Device Type e.g. OM-DAQLINK-TEMP
Enter the relevant search criteria in the text window and all relevant matching devices will
appear in the Search Results box.
53
Page 61
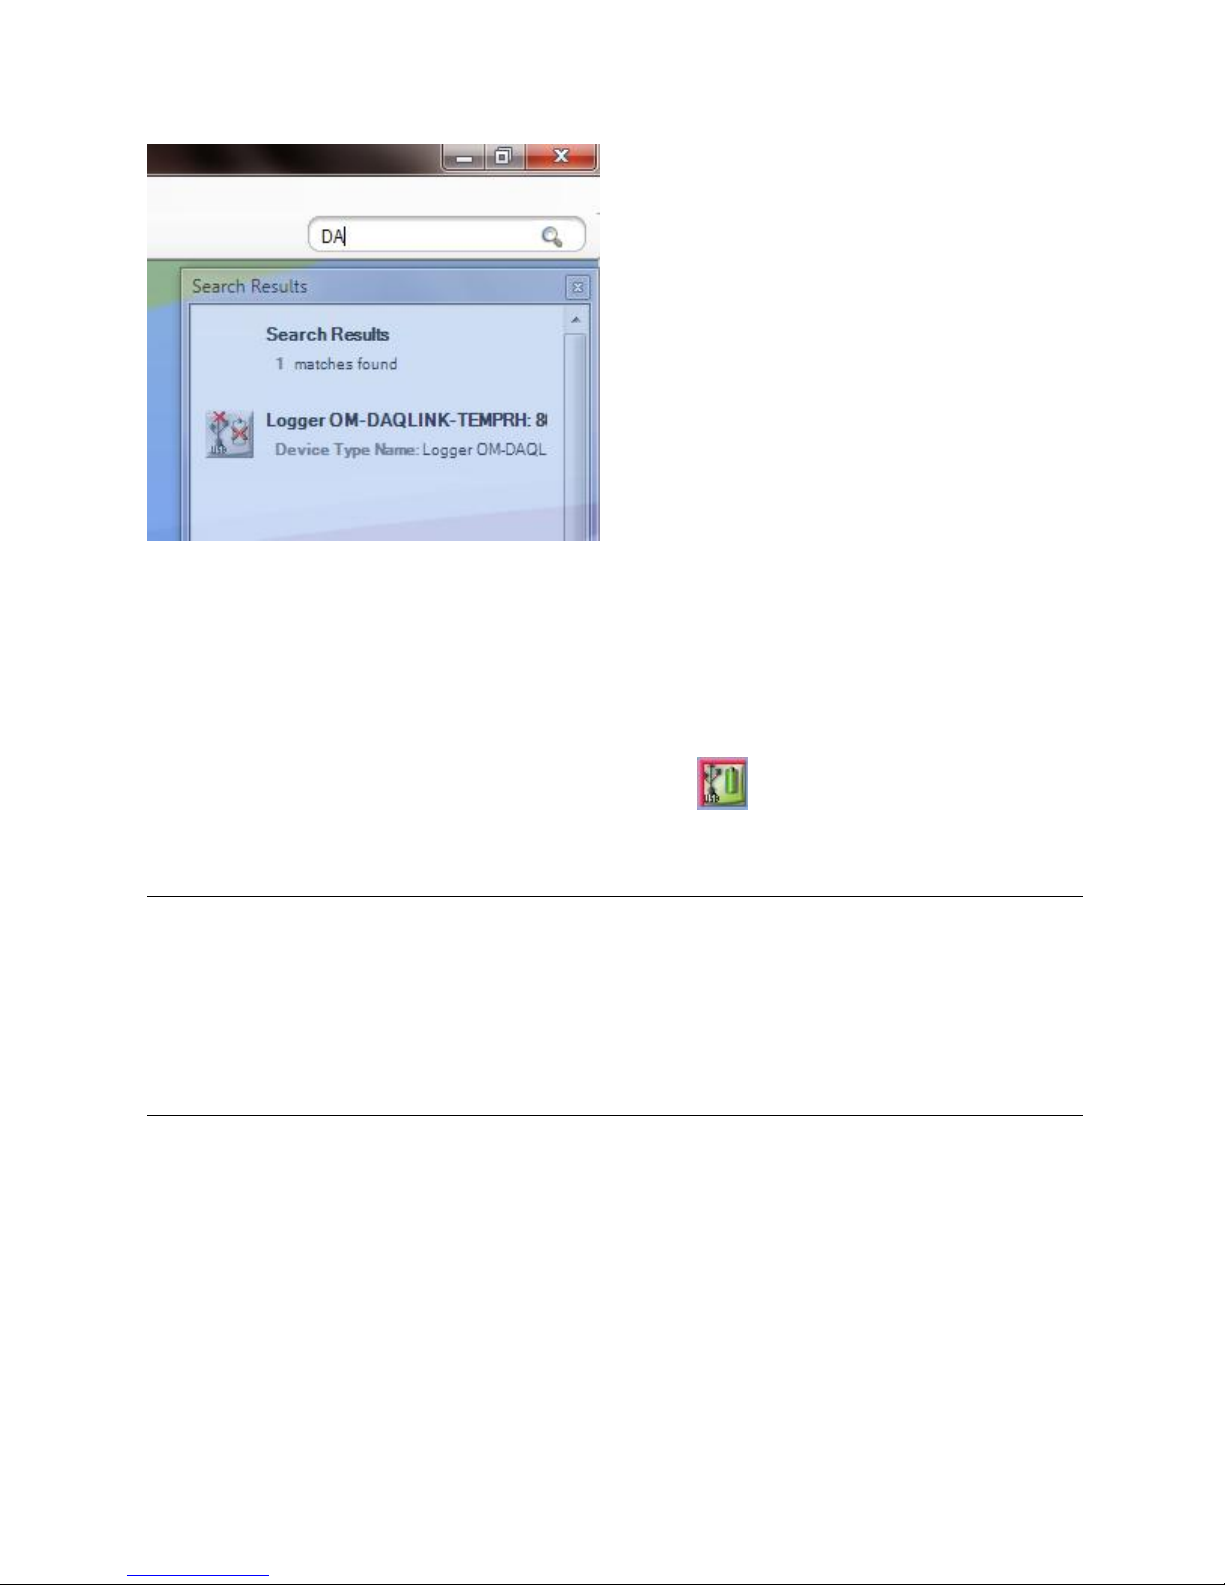
The Search Results box will filter the results as the search criteria more closely match the
devices in the Map View.
Once you have located the relevant device you may configure it directly from the Search
Results box by right-clicking on the device icon to open the context menu.
To locate the device on the Map View itself, simply click on the device row in the Search Results
box and the icon will flash three times with a red outline: .
5.10. Data Recovery
When OM-DAQLINK units are connected to the computer and detected by the DataSuite
software, they will automatically begin downloading data.
If they were already connected and streaming online data, and the DataSuite software or
computer was shutdown, the units will continue to collect data. Upon re-detection by DataSuite,
data will again be downloaded ensuring full data recovery to the DataSuite database.
5.11. Saving Data
As soon as a logger starts to record data the software creates a data file to which it writes the
logger data.
In Windows XP, for example, logger data files are stored in the following default location:
C:\Documents and Settings\All Users\Application Data\Omega\DataSuite\Data Files
In Windows 7, the data files are stored here:
C:\Users\Public\Omega\DataSuite
54
Page 62

A folder is created for each data logger and is named according to the logger Serial Number. In
this folder is stored the data files. A file is created for each day that the logger is recording data.
The file name format is the date followed by the file extension e.g. 2007-12-30.dat.
The data is saved automatically by the software. There is no need for the user to save the data
manually.
For applications where the data is being streamed online, directly to the software the data file is
saved as follows:
Every 15 minutes
When the software is closed
When the user opens an archived data file, the file is updated with all data not saved to that
point
You can also save the data in a text file format. Refer to section 5.7.1 for more details.
5.12. Viewing Archived (Offline) Data
The user can view the logger data online or can choose to open archived data of one or more
loggers, including loggers of different models. Archived data is all data that was logged by a
specific logger and recorded by the software into the DataSuite directory on the PC.
Follow the instructions below to open archived data.
1. Click the Open icon to launch the Open Data Files dialog.
2. Select the logger from the list of loggers in the dialog. The loggers can be listed in ascending
or descending order according to logger serial number or comment by clicking the relevant
header.
3. Using the calendar define the date and time period for which you wish to view your data and
click OK.
Note: The DataSuite data file path is displayed at the top of the Open Data Files dialog.
55
Page 63
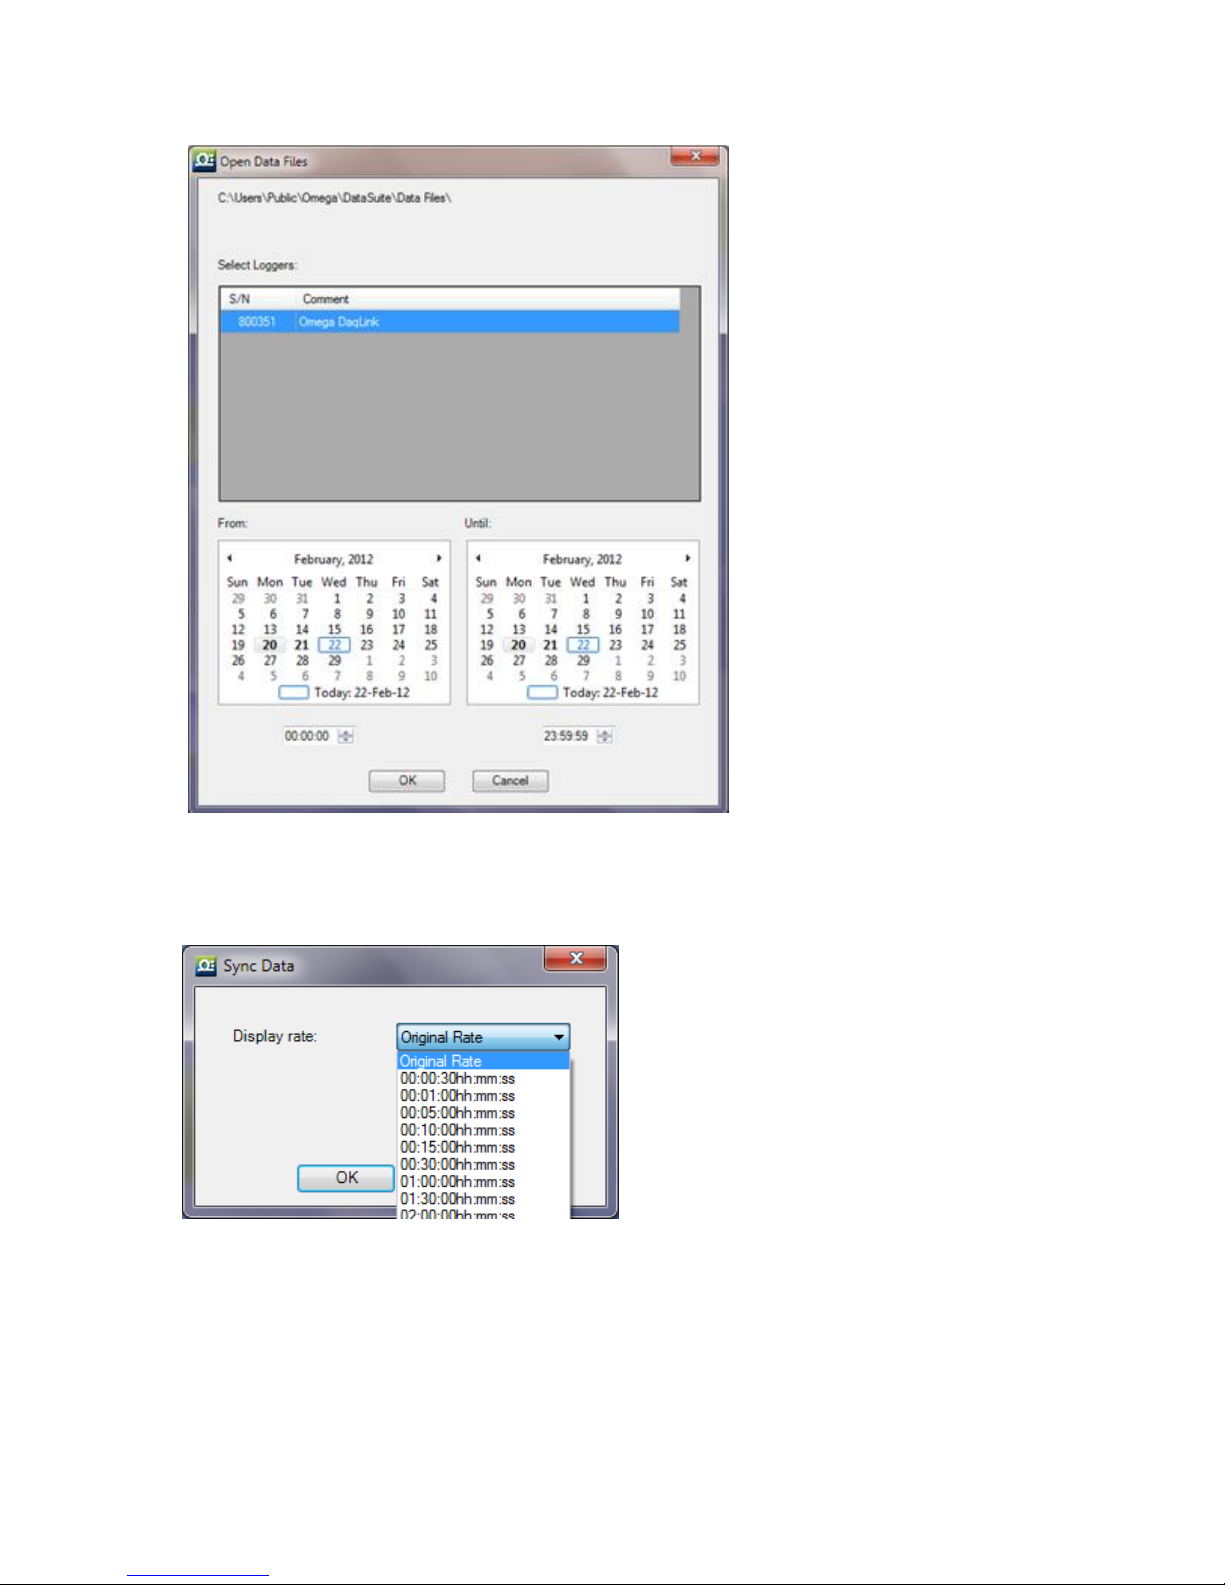
Figure 28: Open Data Files dialog
4. In the Sync Data dialog, you can select the sampling rate at which you wish to display the
data. The default option is the original rate. Click OK.
Figure 29: Sync Data dialog
The data is opened in History View. Refer to section 5.4.3 for an explanation of the History
View.
You may display data sets from more than one logger and display them all in History View,
using the Data Map to navigate through the data. Refer to section 5.4.4 for more details
regarding the Data Map.
56
Page 64
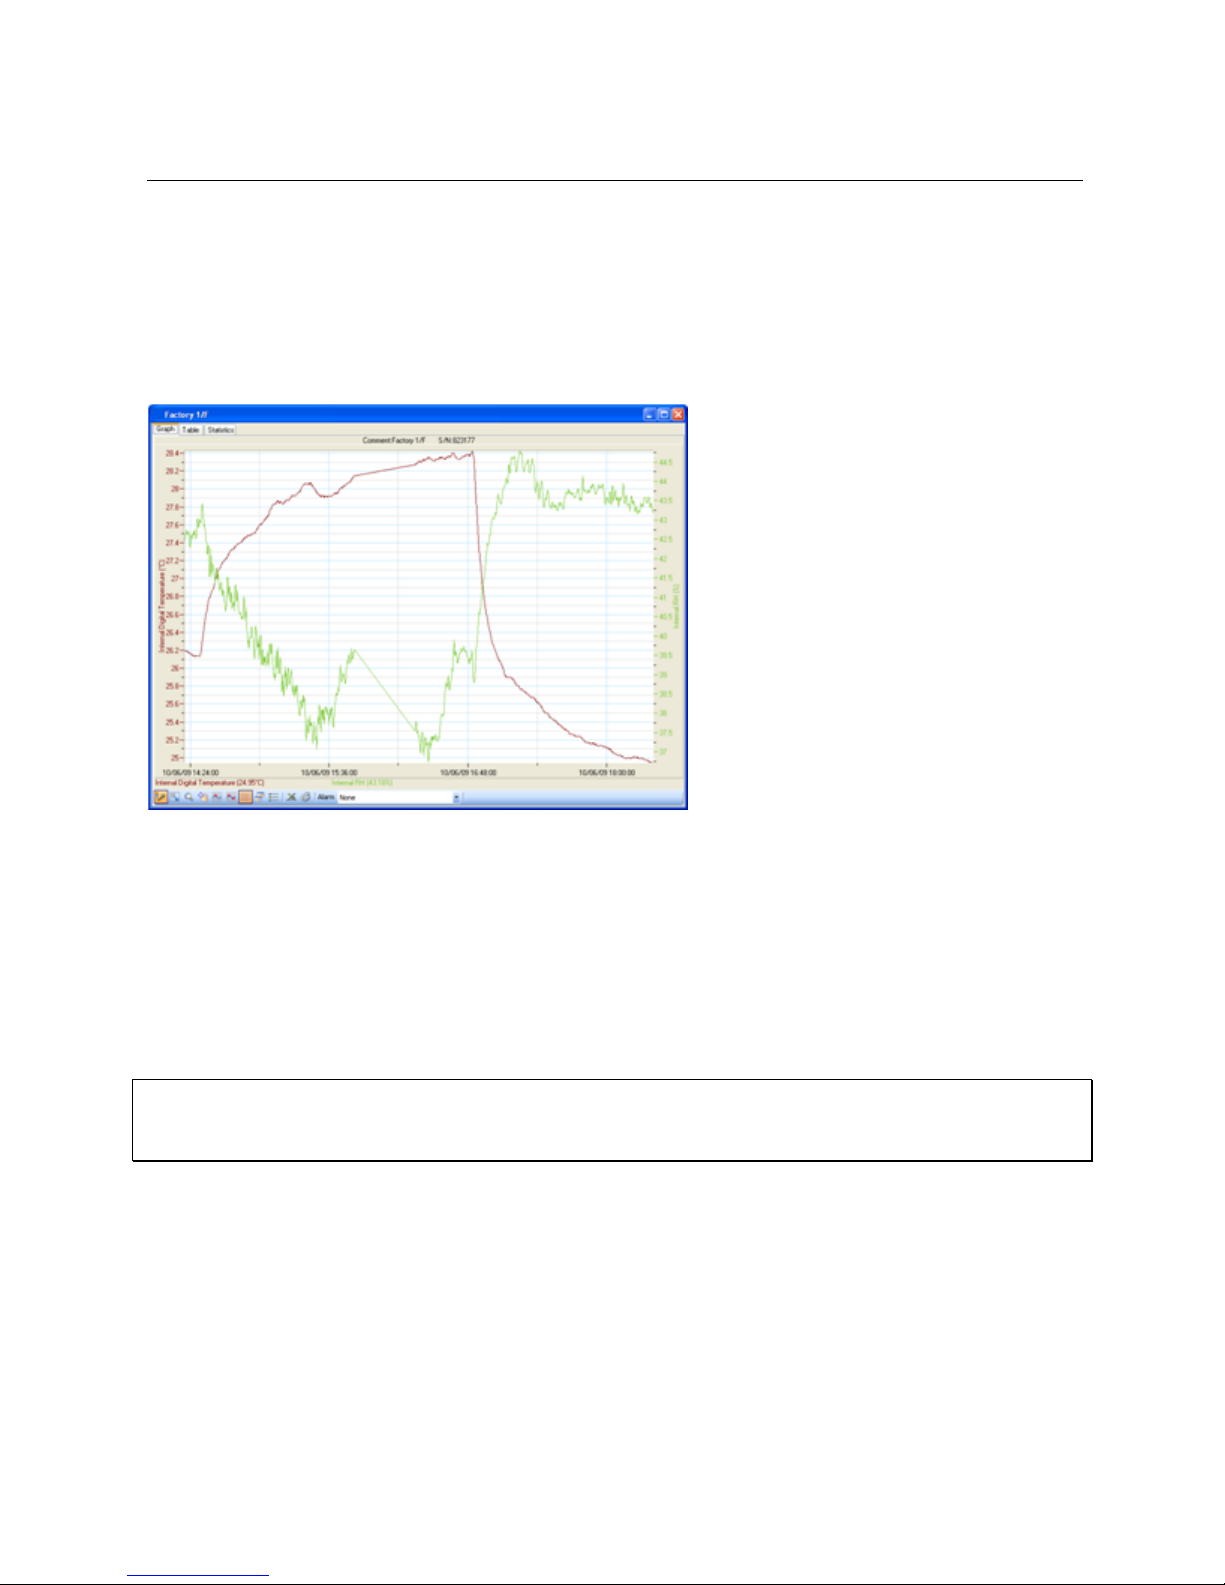
5.13. Viewing Online Data
You can view the data from any of your loggers in real-time, as the data is being recorded and
transmitted to the PC. OM-DAQLINK loggers must be connected via USB cable to the
DataSuite software to enable online data view.
While the logger is running double click the Logger icon in the Map View.
While the logger is running open the logger context menu and select Display Data.
Figure 30: Online data window
The data displayed in this window is the data that was transmitted by the logger in the current
software session. Data transmitted during a previous session of the software being open will not
be displayed. For example, when you setup the logger it creates a new online session. This
data can be viewed by opening archived data. Refer to section 5.12.
You may view the data in a graph or table by clicking the relevant tabs in the online data
window. While in either or these views, the data is constantly being updated in real-time in the
respective view according to the transmission rate of the logger.
Note: Users of Windows 7 using right to left language settings e.g. Hebrew, may have problems
viewing the Date/Time in the DataSuite graph. This is a know Microsoft ® bug. Until a bug fix is
released, change the Regional Settings to English.
5.13.1. Showing/Hiding the Data Sets
In the online graph display, where you have data from only one logger displayed, you can show
or hide the individual sensor data by using the sensor labels at the bottom of the graph.
57
Page 65
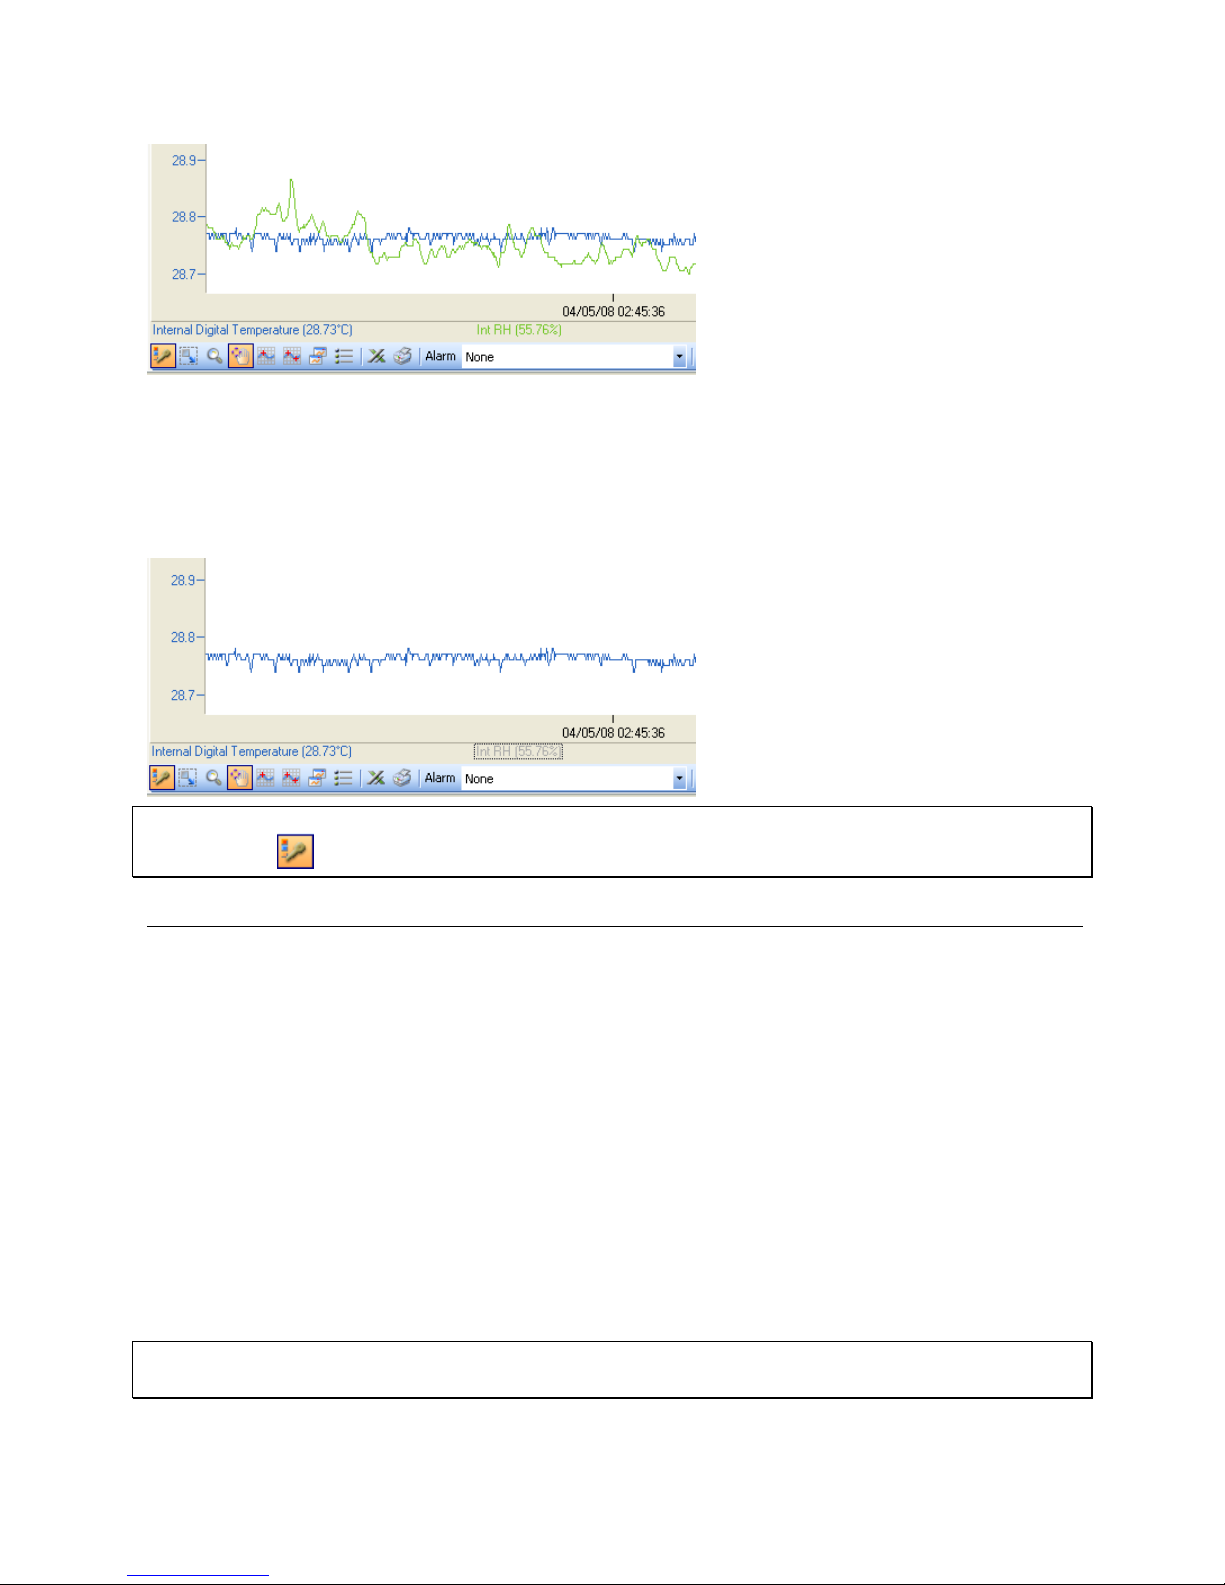
In the screenshot above you can see two labels, Internal Digital Temperature and Int RH. At
present, each label is active meaning the sensor data corresponding to the label is shown on
the graph.
By clicking any of the sensor labels, you can hide the data from the graph. The label will then be
grayed out. See the screenshot below:
Note: You can hide all of the sensor labels (not plots) from the graph by clicking the Plot
Legend icon .
5.14. Working in Map View
The Map View is the main view from which you monitor your connected devices. It is in this view
that you can see all the icons representing the units in your system.
Refer to section 5.4.1 for a quick overview of the Map View and section 5.4.5 for a list of all the
Map View icons.
5.14.1. Loading Map View Wallpaper
You can load an image file representing a map of your facility in which the network is operating.
You can then move the unit icons into their actual positions on the map.
Double-click on the Map View background to go straight into the Open dialog and locate the
image file.
Right-click on the Map View background to open the context menu and select the option to
either Load or Reset the wallpaper.
Note: When deploying the system for the first time it is highly recommended to use a map of the
facility to make the deployment work efficiently.
58
Page 66
5.14.2. Printing the Map View
To print the Map View go to File > Print Map View. This will also print the icon name tags and
network paths, if enabled.
The Map View maintains its aspect ratio when printed.
5.14.3. Displaying Icon Name Tags
You can display a name tag for each device on the Map View. The name tag consists of the unit
Comment, as defined in the unit Setup:
To toggle this feature, right-click on the Map View background and select Display All Units'
Name.
When this feature is enabled, clicking the unit icon will also highlight the name tag in red.
5.14.4. Moving Icons around the Screen
Go to Tools > Lock Map View and ensure this menu item is not selected in order to freely
move the unit icons around the screen. When you have finished placing the icons into position
you may then lock the Map View so as not to mistakenly place an icon out of position.
5.14.5. OM-DAQLINK Logger Icon Connection Options
Right-clicking the OM-DAQLINK logger icon will give the following options:
Display Data
Displays the logger’s data in Graph view. The graph displays the data in real-time. There is also
the option to display the data in Table view or to view the data statistics.
Download Data
Downloads all data in the logger memory to the DataSuite software. When logger is
downloading the data, the Logger icon in Map View will appear as follows:
Cancel Download
When logger is downloading data you may cancel the download per logger by selecting this
menu item.
59
Page 67
Note: This feature works only if there are no other commands in the queue following the
Download process.
Reset Alarm
When the logger is in a state of alarm, this option will reset the alarm state to normal on both the
logger and the software. The visual and audible alarms will return to normal. If after reset the
logger is still in alarm conditions, then the visible and audible alarms will return.
Calibration
Refer to section 5.17 for an overview of the Calibration feature.
Note: A logger can’t be calibrated while it is in Run mode. The option will be grayed out. You
must Stop the logger first.
Cancel Firmware Update
When a firmware update is in progress, select this option to cancel the update and continue
using the previous firmware version.
Setup
Refer to section 5.15 for an overview of how to setup the logger.
Stop
Sends a command to the logger to stop logging data.
Run
Sends a command to the logger to start logging data. This command will also clear the existing
logger memory.
Turn Off
This option will turn the unit off and is password enabled. As a precaution to avoid any data loss
all data not yet transmitted will first be downloaded to the computer prior to turning the unit off.
5.15. Configuring the Logger
DataSuite software allows you to configure each OM-DAQLINK logger, via direct USB
connection.
To configure the logger once it’s detected by the DataSuite software, right-click the Logger icon
in the Map View and select Setup. The Setup window is described below.
5.15.1. OM-DAQLINK Setup Window – Device Setup Tab
The OM-DAQLINK Setup window has two tabs, Device Setup and Alarm Setup.
60
Page 68
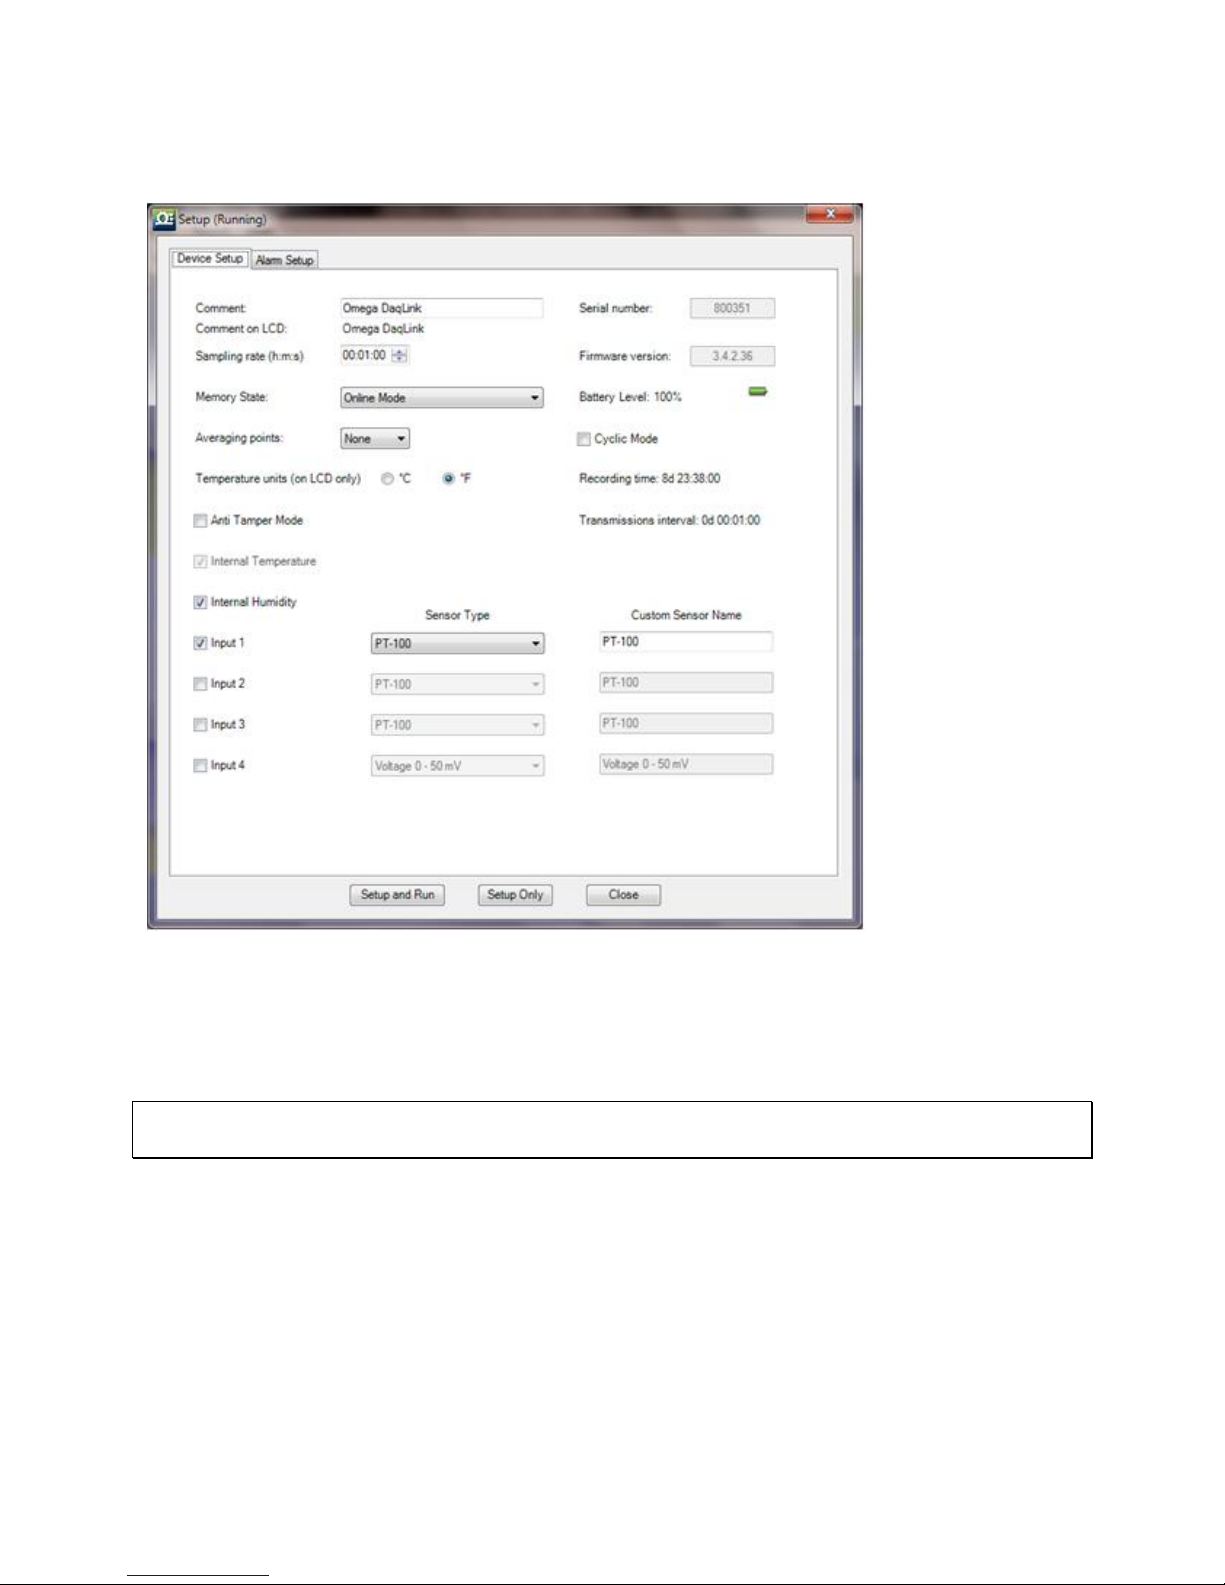
The main logger configuration is performed on the Device Setup tab. Any alarm levels you wish
to configure is performed on the Alarm Setup tab.
Figure 31: OM-DAQLINK Device Setup tab
Comment
This is the name of the logger. It is advisable to name the logger according to the location in the
facility.
Note: The Comment field in the software and on the logger display supports all standard
alphanumeric characters except for the following: ', ", ~, &, \
Sampling Rate
Sampling rate is one sample per second to one sample per 18 hours. However, there are
programming limitations you must be aware of when configuring the loggers. The sampling rate
will vary depending on the number and type of sensors you setup. Refer to section 4.3.4 on
page 15.
Memory State
From the drop-down menu you have the following options:
61
Page 69
Online Mode: For working with logger connected to PC. Data will be transmitted in real-
time i.e. at the same time as the sampling rate.
Optimized Memory Mode: For working with the logger as a standalone device, not
connected to the PC. In this mode, the memory is more efficiently managed as the data
does not need to be transmitted together with the sampling rate. Use the Transmissions
interval parameter in the Setup window to see the rate at which the data will be displayed
on the logger or in the software.
Note: If used when connected to the PC, the data will not be transmitted in real-time.
Cyclic Mode
If this checkbox is not selected, the logger will stop recording data when the memory capacity is
filled.
Enabling Cyclic mode will result in the oldest samples in the memory being overwritten by new
samples once the memory is full. This allows continuous data logging.
Averaging Points
You can choose to have online averaging of up to 10 points around the real value in order to
smooth the data readings, if they are exhibiting interefence. The recommended averaging is 4
samples.
Note: If configuring Alarm duration with averaging points selected, the alarm will be counted
from the time of the last sampling point used to calculate the average.
Temperature Units
Toggle between °C and °F. This applies to the readings displayed on the logger LCD as well as
in the software.
Anti Tamper Mode
To prevent tampering with the OM-DAQLINK logger, selecting this option will disable the
following features on the logger menu:
Pause
Reset
Stop and turn off unit
Active Sensors
Depending on the logger model, you can activate up to two internal sensors and four external
sensors. Simply select the inputs you want to use and then select the sensor types from the
adjacent drop-down menu. You don’t have to select the external sensor input in any order. You
may select only Input 4 if you desire.
62
Page 70
Note: On the OM-DAQLINK-TEMPRH you cannot run the humidity sensor without running the
temperature sensor in parallel.
This is because when using the OM-DAQLINK-TEMPRH data logger and selecting the internal
humidity sensor in the Device Setup dialog, the internal digital temperature sensor will
automatically be selected as well. This sensor provides the temperature compensation
necessary for the humidity sensor to reach the 3% accuracy as stated in the sensor
specifications. It is not used for recording temperature. The internal digital sensor is used to
record temperature on the OM-DAQLINK-TEMPRH.
Custom Sensor Names
You can also give the sensor a custom name, which will appear in the software when viewing
the data. This is convenient when using several of the same type of sensors and you wish to
differentiate between them in terms of their environment or material it is measuring.
Recording Time
This field displays the length of time the logger memory will be able to record for depending
upon the number of sensors used and sampling rate.
Setup and Run
Clicking Setup and Run will send the setup to the logger and immediately start logging data.
Setup Only
Clicking Setup Only will send the setup to the logger but it will not actually start logging data.
You will need to select Run from the Logger context menu or go back into the Setup dialog.
Close
Clicking Close will close the Setup dialog without saving any of your configurations.
Note: Running the logger clears the logger memory. All previously recorded data will be erased
when you begin a new logging session
5.15.2. OM-DAQLINK Alarm Setup Tab
A major feature of the OM-DAQLINK system is the ability to configure alarm levels into the
loggers so any breach of these levels as recorded on the data logger is monitored by the
software, and the user is notified via Email/SMS/audible and visual indicators.
The Alarm Setup tab lets you configure each sensor for the following alarms:
Low
Pre-Low
Pre-High
High
Contact Open / Contact Close (when the Contact sensor is selected)
63
Page 71
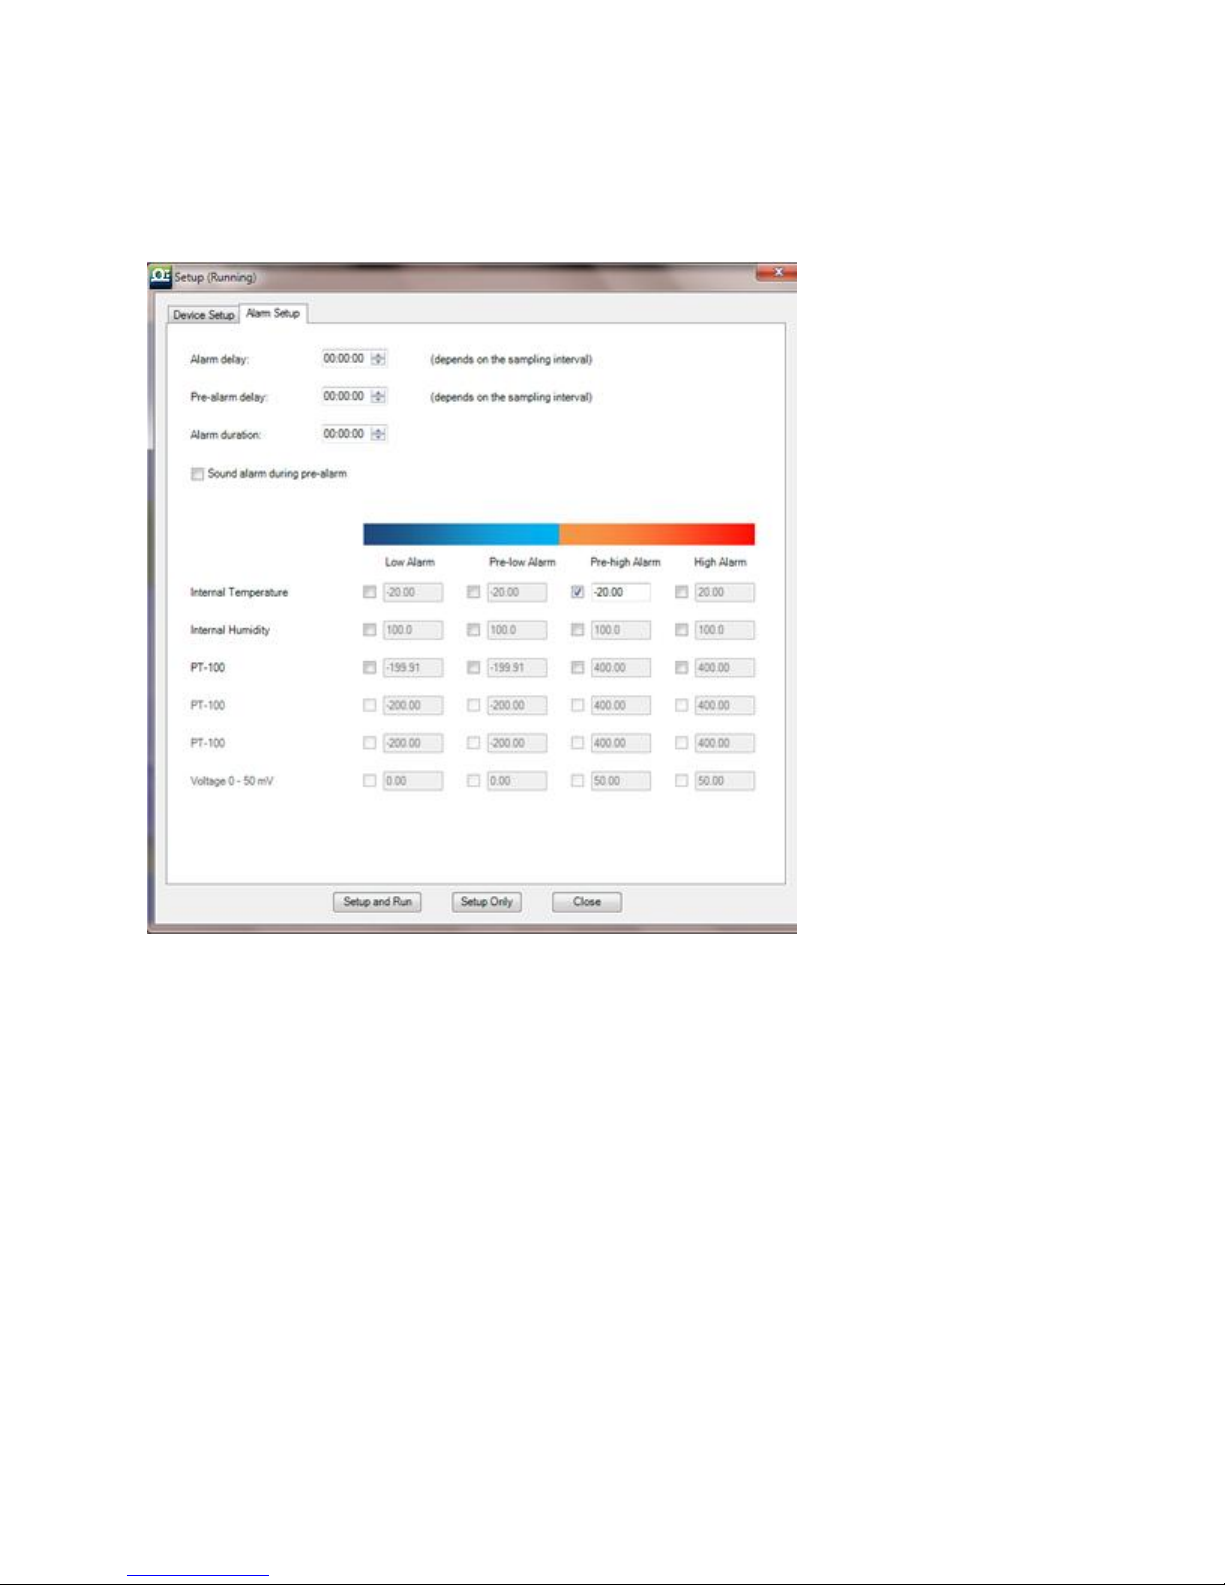
Using the Pre Alarms gives the user ample warning of a possible breach of real alarm levels, so
necessary measures can be taken to prevent such a breach.
Simply select the check box for the type of alarm you wish to be notified. You can select all
alarms too. Enter the alarm value in the text box.
Figure 32: OM-DAQLINK Alarm Setup tab
Alarm Delay and Pre-alarm Delay
The time until the alarm (or pre-alarm) is activated. You may not want to have the alarm sound
immediately after the alarm level is breached as you are only interested in a condition where the
alarm level lasted a certain amount of time.
For example, if monitoring change of temperature in a freezer, you would only be interested in a
High alarm which lasted more than one minute as anything else could just be caused by the
freezer door opening for a few seconds, as opposed to a power failure leading to rise in
temperature.
Alarm Duration
The duration of the alarm that is set off by one or more sensors breaching the alarm level.
64
Page 72
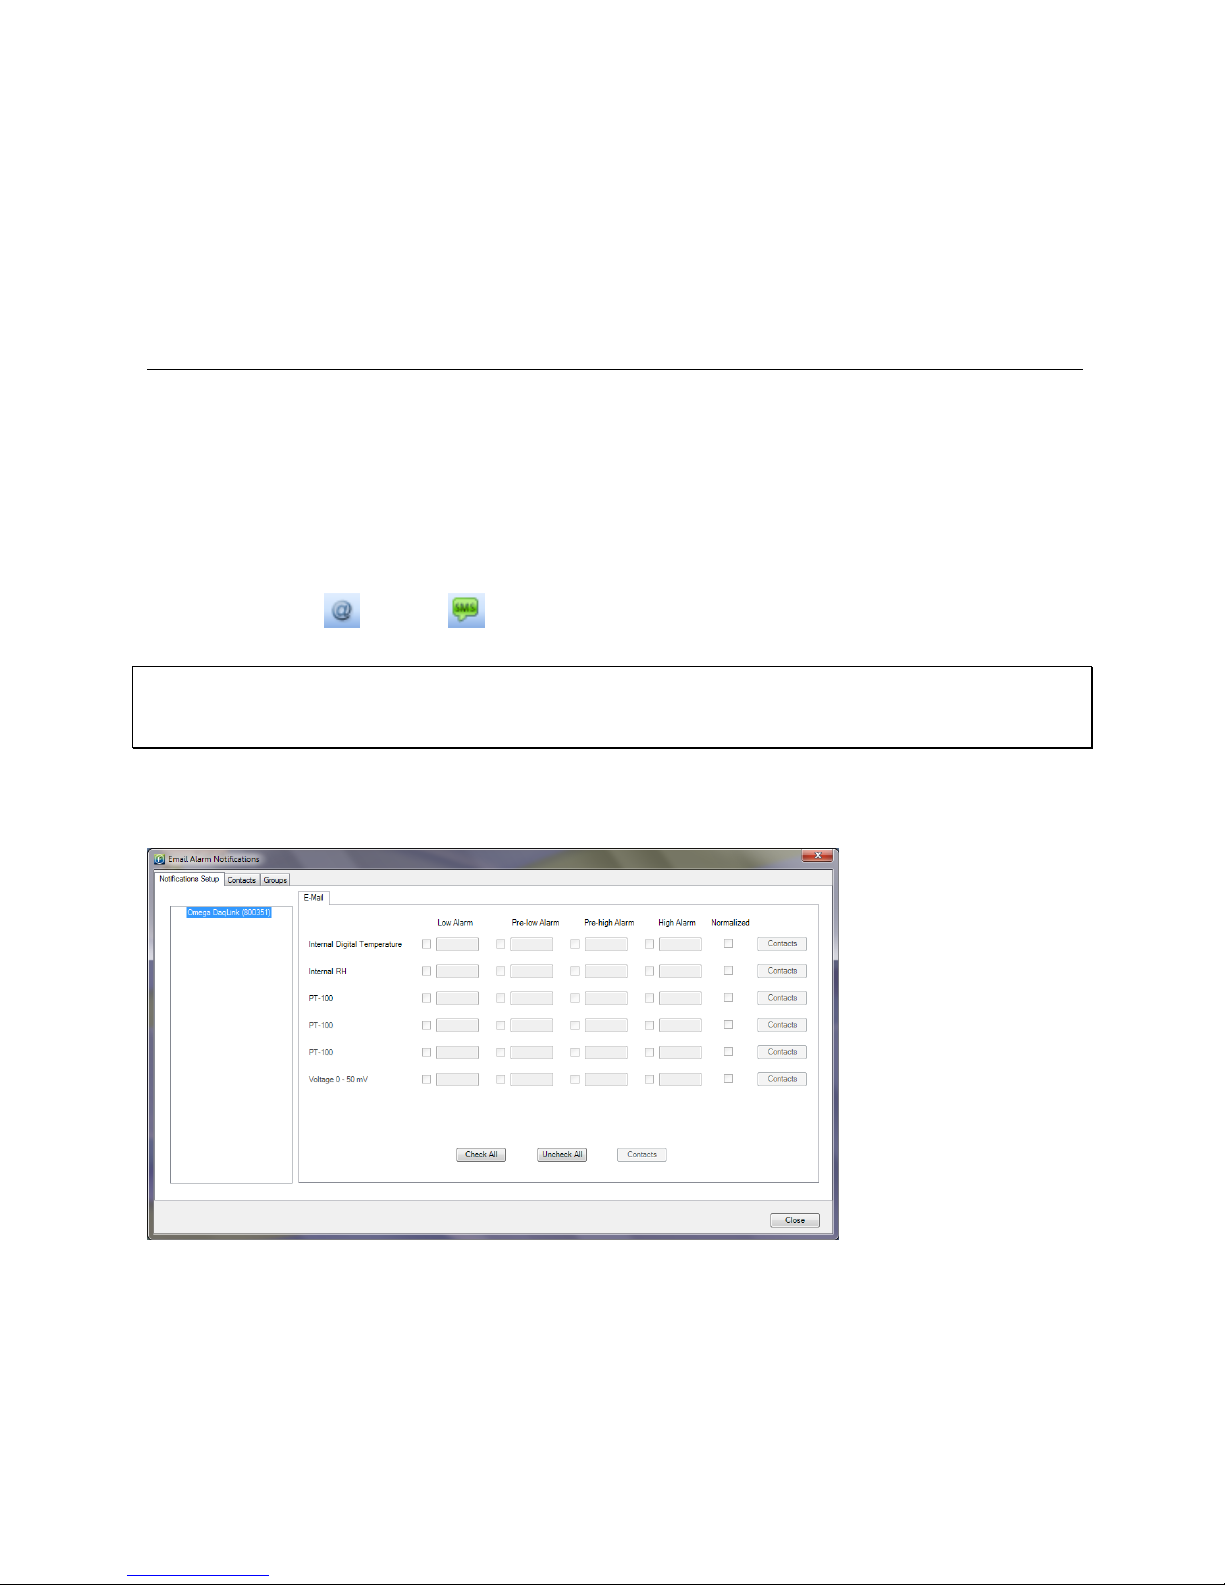
Sound Alarm during Pre-alarm
You also have the option to sound the alarm in the software during a pre-alarm scenario, not
just for a standard alarm.
Once you have configured your alarms, you may return to the Device Setup tab or click one of
the Setup buttons at the bottom of the tab.
5.16. Alarm Notifications Setup
Once you have completed the logger alarm setup, you can configure DataSuite to send alarm
notifications via Email or SMS.
From the Tools menu select one of the following options, depending on the type of notifications
required:
Email Alarm Notification
SMS Alarm Notification
Or click the Email or SMS icons located in the upper toolbar in order to launch the
notification dialog.
Note: To enable sending of Email or SMS first define the Email and SMS settings in the Tools
> Options dialog. Connect a GSM modem to the PC if sending SMS’s. Refer to section 5.7 on
page 44 for more details.
You may manage your contact list of alarm notification recipients from either the Manage
Contacts menu item in the Tools menu, or from within the Alarm Notification dialog itself.
Figure 33: Alarm Notifications Setup dialog
As the Email and SMS Alarm Notifications must be defined separately, they each have separate
dialogs. However the interface is identical and the contacts are stored in the same database.
65
Page 73
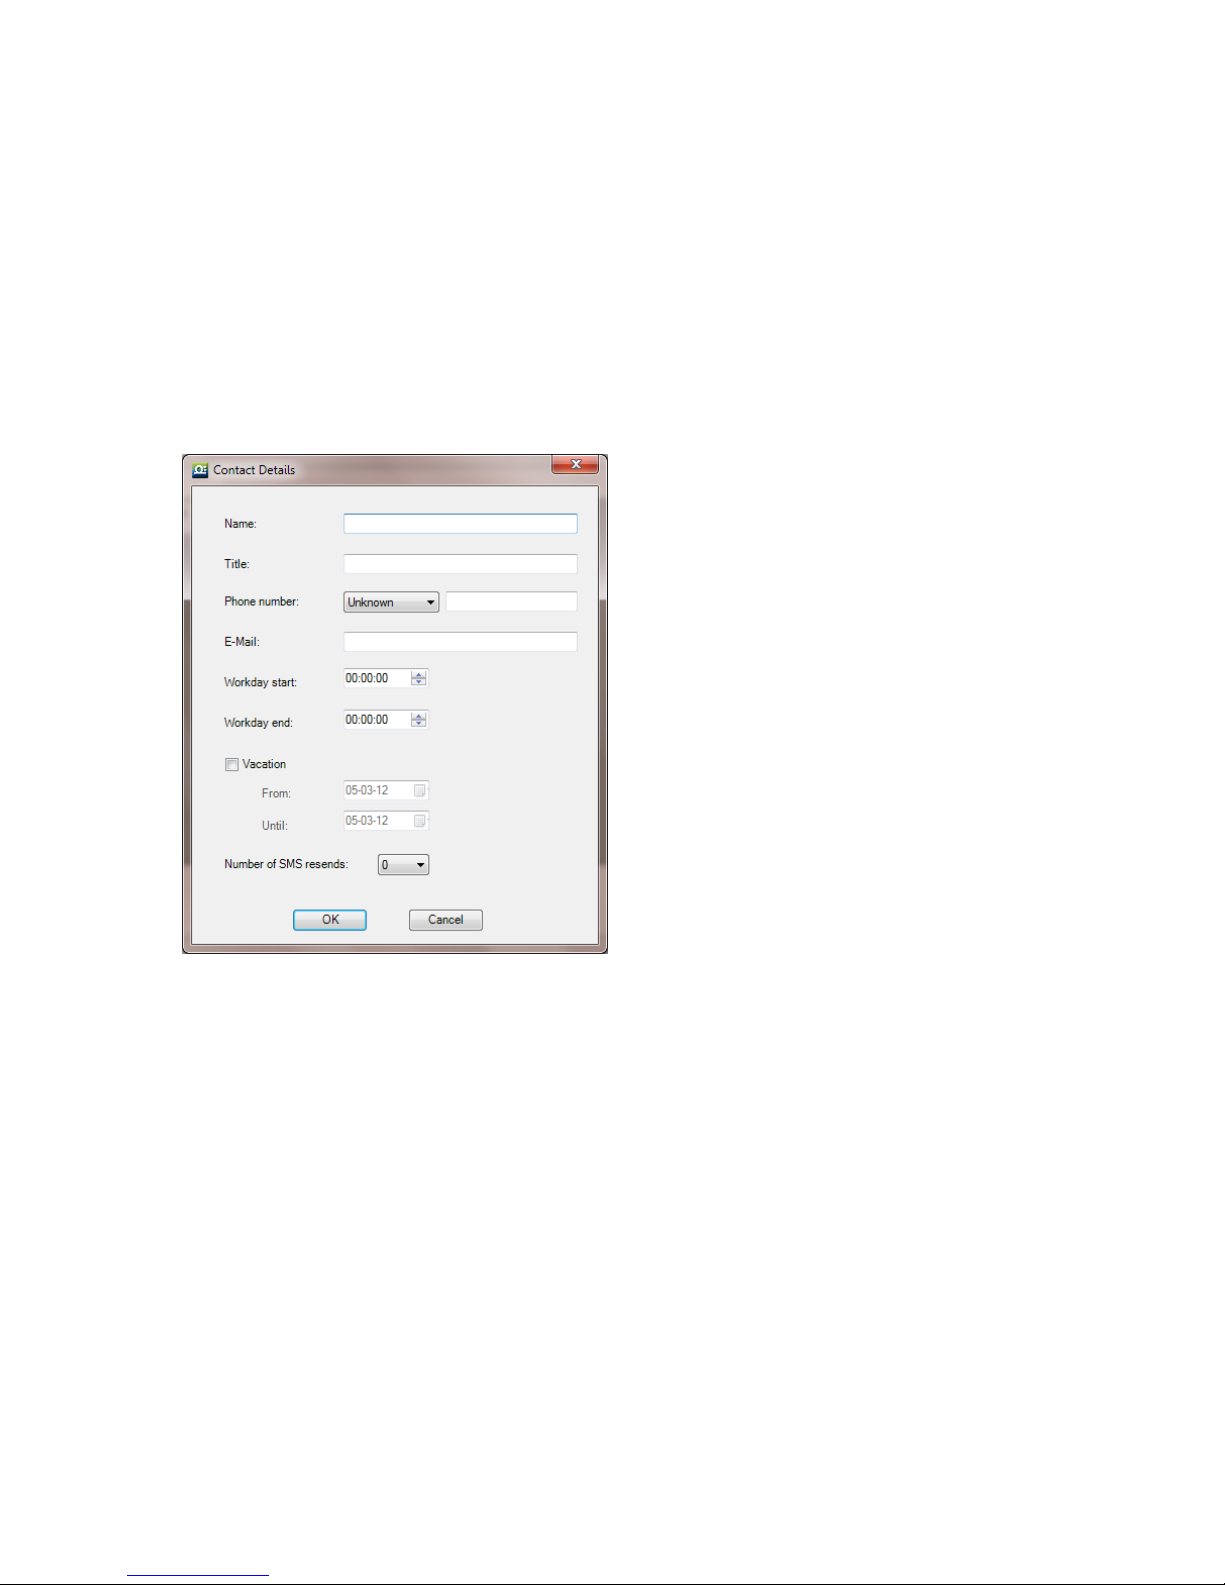
The Email/SMS Notifications dialog is divided into the following tabs:
Notifications Setup
Contacts tab
Groups tab
5.16.1. Contacts Tab
The first step is to create the contacts who shall be receiving the notifications. The ability to
manage contacts is possible from both the Email and SMS Notifications dialogs.
1. Click the Contacts tab and then click Add Contact.
Figure 34: Adding a contact
2. In this dialog you must first enter the contact name in the Name field. That is the only
mandatory field but if you don’t enter at least the phone number or Email then they won’t
receive any alarm notifications.
The other fields in the dialog are as follows:
66
Page 74
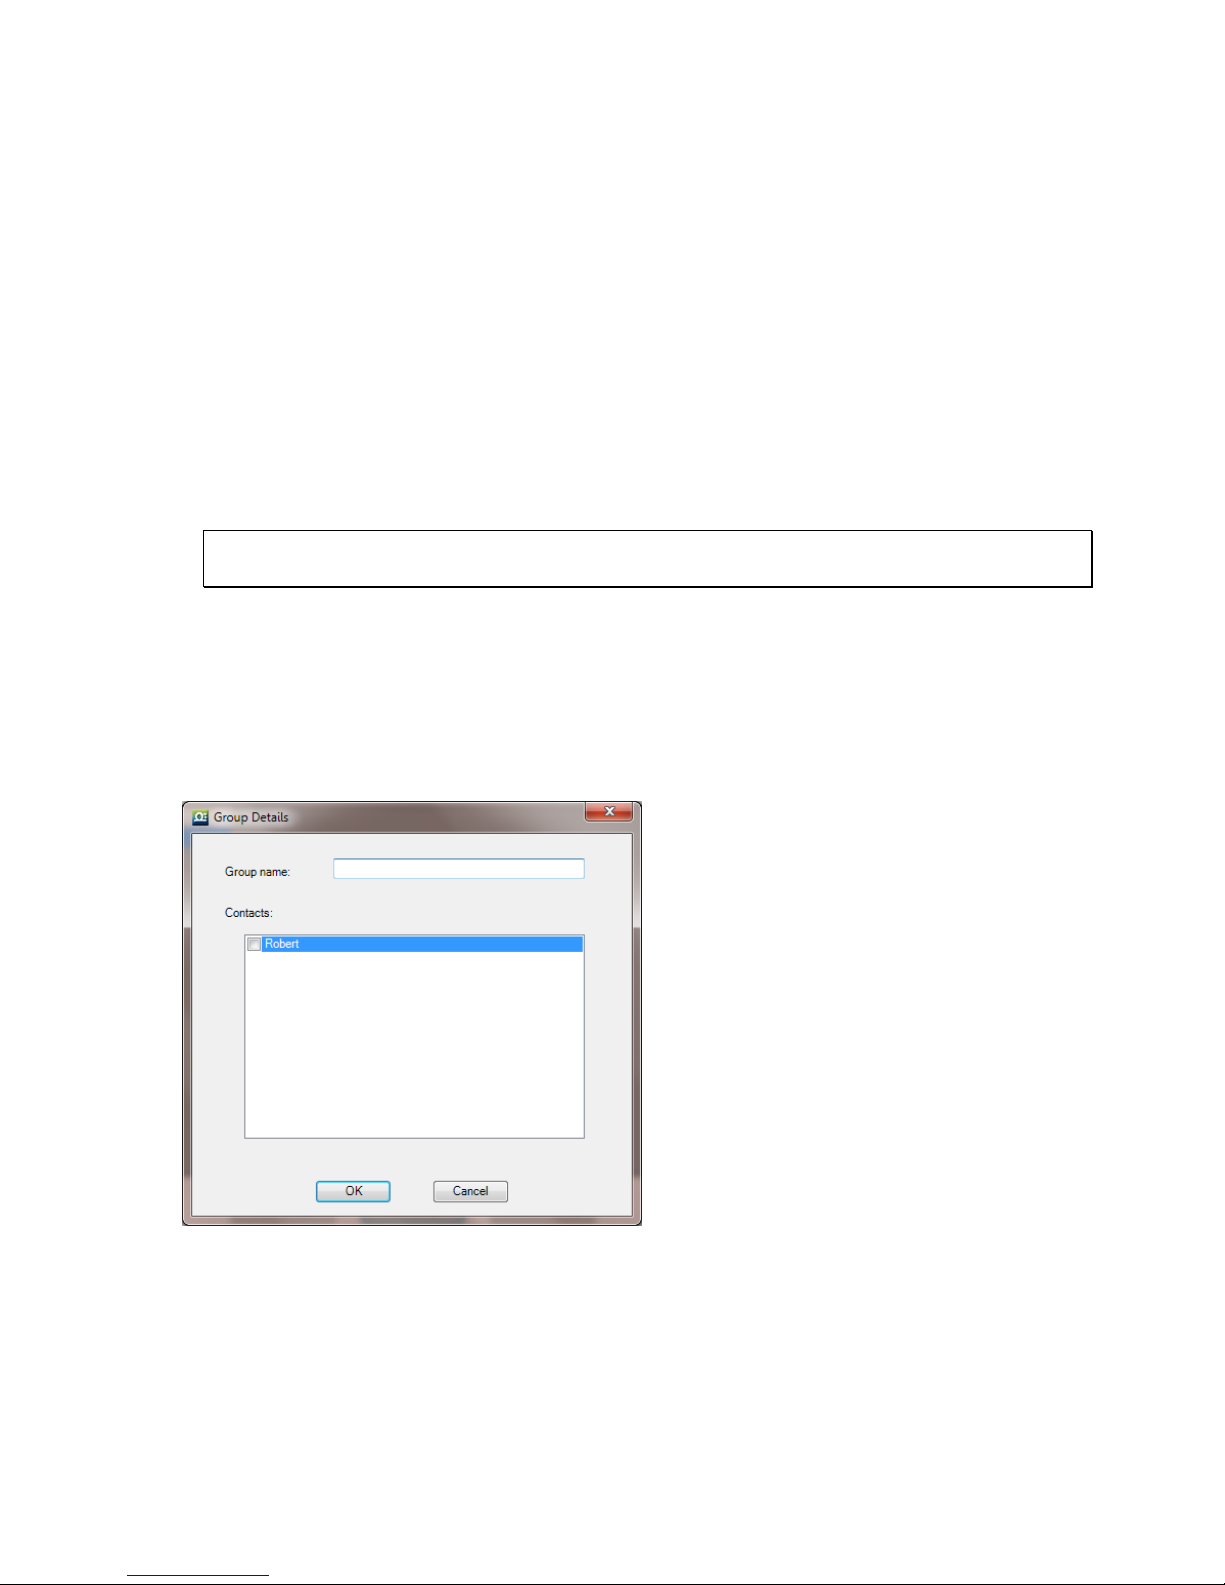
Title: Corporate position
Phone number: The number the DataSuite software will use to send the SMS
notification.
Note: The phone number field supports the following characters: 0-9, # , *, -, ( ), +
Email: The address the DataSuite software will use to send the Email notification.
Workday Start and End: You can define the hours in which the contact will be eligible to
receive the notifications i.e. so they don’t receive SMS or Email while in the office, or vice
versa.
Vacation: You can define when the contact is on vacation so they won’t receive any
notifications over this period.
Number of SMS resends: The number of times DataSuite will send follow-up SMS’s
with the alarm notification. The maximum is nine resends per alarm. The gap between
each resend is five minutes.
Note: In order to stop receiving SMS resends, you can simply send an SMS with ‘OK’ in
the message body to the GSM SIM card’s phone number.
3. When the contact details have been entered, click OK.
4. The contact will be added to the Contacts tab. You may choose to add another contact, edit
an existing contact or remove a contact from the list.
5.16.2. Groups Tab
1. Click the Groups tab and then click Add Group. The Group Details dialog will open.
Figure 35: Adding a group
2. Enter a Group name and add your existing contacts to the group by selecting the checkbox
next to the Contact name.
3. Click OK to create the Group. In the Groups tab you may choose to add a group, edit an
existing group or remove a group from the list.
67
Page 75
5.16.3. Notifications Setup Tab
1. Once the contacts have been created you may start defining which contacts should receive
the alarm notifications.
2. The pane on the left-hand side of the Notifications Setup tab displays all of the units and
their serial numbers. You must define the alarm notifications for each unit in turn. Select the
first unit you wish to define.
3. The Email or SMS tab is now active for the unit selected in step 1 above. In this tab, select
the type of alarm for which the notification should be sent in the event that the predefined
alarm level is breached.
4. Only the sensors which were configured in the logger Setup, with alarms levels, are enabled
in this tab.
5. Select the checkboxes according to the type of sensor alarm for which notifications should
be sent.
You may also select the following alarms:
a. Battery alarm: Notification will be sent for low battery alarm when battery level is at or
drops below 10%. When the battery level goes above 10% again, when unit is
connected to AC power, another email notification is sent stating the battery is charging.
b. Normalized: Notification will be sent when the logger return to normal levels having
been in alarm.
6. Click the Contact button adjacent to each of the sensors which have defined alarms. In the
Select Contact dialog, select the contact and/or group that will receive the notification.
7. You can also click Check All to select all the sensor alarms for notification.
5.16.4. Email and SMS Notification Formats
Email Notification Format
When the Email notification is sent the recipient receives the Email in the following format:
Email Header:
OM-DAQLINK Alarm: Internal Temperature High Alarm, Value Detected: 25.47C
Email Body:
OM-DAQLINK Alarm
Comment: Factory 1/F
S/N: 808932
08-07-09 13:53:41
Internal Temperature Low Alarm,
Value Detected: 25.47 C
The Email header contains the sensor type, last recorded sample, and alarm type.
In addition the Email body contains the logger comment, serial number, time stamp of last
sample and value of last sample.
68
Page 76
SMS Notification Format
When the SMS notification is sent the recipient receives the SMS in the following format. (The
logger comment is displayed in the first row).
S/N 515244, Test 810#2, Int. Temperature 15/1/10 17:25 – High Alarm, Value Detected: 24.24C
5.17. Calibration
All Omega data loggers are shipped fully calibrated either with a calibration certificate or a
Declaration of Accuracy certificate. However, DataSuite does provide a simple and efficient
process for users wishing to calibrate their data loggers themselves. The process itself is
performed with the OM-DAQLINK unit connected via USB cable. As with any data logger
calibration a calibrator or other type of calibration instrument is necessary.
The Calibration options are accessible via the Logger context menu in the Map View (rightclicking the Logger icon).
Before performing logger calibration, the logger must be in Stop mode. In addition, all of the
calibration options are accessible with a password to prevent non-authorized users of the
system tampering with the loggers’ calibration settings.
Note: The default password is 1234. The password can be changed in the password dialog box.
The Calibration option menu options are:
Calibration: Opens the main Calibration dialog
Save Calibration: Saves the logger’s current calibration settings
Load Calibration: Loads a logger’s previously saved calibration settings.
Reset Calibration: Resets the logger’s calibration settings so that the raw hardware data is
obtained, without any software calibration applied to these values.
Restore Factory Calibration Default: Restores the logger’s calibration settings to the
factory calibration i.e. the calibration settings it received prior to shipment from Omega.
5.17.1. Introduction to Calibration
Although the data loggers come fully calibrated, the software enables you to calibrate any of the
logger sensors, on any input. The calibration parameters are sent to the data logger and stored
in its memory.
DataSuite employs two different calibration methods: Two-point calibration and Offset
calibration.
Each sensor can be calibrated using the Two-point calibration method, and then tweaked using
offset calibration, except for the Thermocouples. These sensors require offset calibration only.
69
Page 77
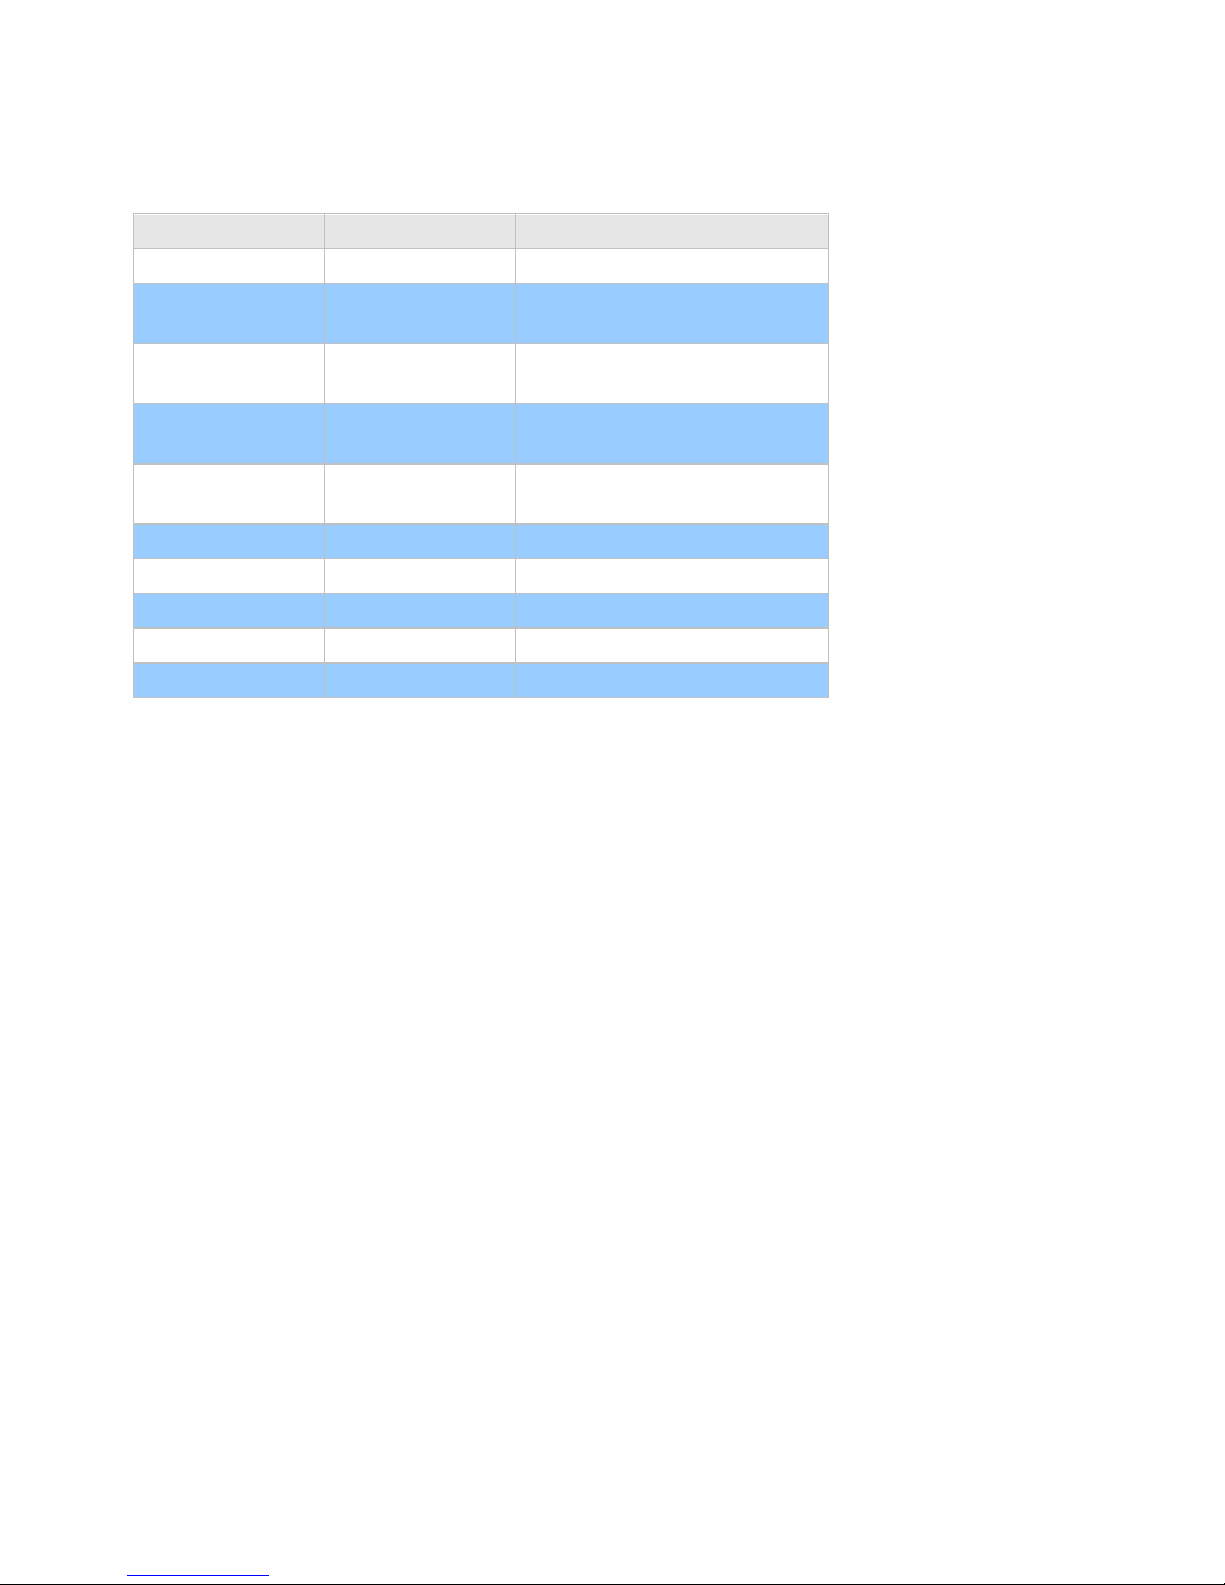
OM-DAQLINK Sensor Inputs
Sensor
Type
Calibration Method
Current
4 – 20 mA
Two-point calibration
Humidity
(Internal)
Digital
Two-point calibration
Temperature
(Internal)
Digital
Two-point calibration
Temperature
(Internal)
PT-100
Two-point calibration and
offset
Temperature
PT-100 2-wire
Two-point calibration and
offset
Temperature
Thermocouple J
Offset calibration
Temperature
Thermocouple K
Offset calibration
Temperature
Thermocouple T
Offset calibration
Voltage
0 to 1 V
Two-point calibration
Voltage
0 to 50 mV
Two-point calibration
Calibration Tips
Prior to any two-point calibration it is recommended to restore factory calibration defaults.
Prior to calibrating any of the thermocouple sensor types, calibrate the Voltage 50 mV sensor as
this will set the gain (slope) of all thermocouple sensor types.
After calibrating 50 mV, TC-J, TC-K or TC-T sensor types for all inputs you can refine the offset
calibration for each input individually.
You may calibrate all thermocouple sensor types at once, or individually.
Prior to calibrating the PT-100 input, you must first perform Reset Calibration in the Calibration
dialog.
Two-point Calibration
The two-point calibration sets the gain (slope) and offset (intercept) of the sensor's conversion
function.
Use the two-point calibration to calibrate all OM-DAQLINK sensors except for the
Thermocouples. In some cases you may need to refine your calibration using the fine offset
tuning tool.
Offset Calibration
To calibrate the Thermocouple temperature sensors: TC-J, TC-K and TC-T, first calibrate the 50
mV sensor type. That will set the slope for all Thermocouple temperature sensors. Then
proceed to adjust the offset using the Offset calibration technique.
70
Page 78
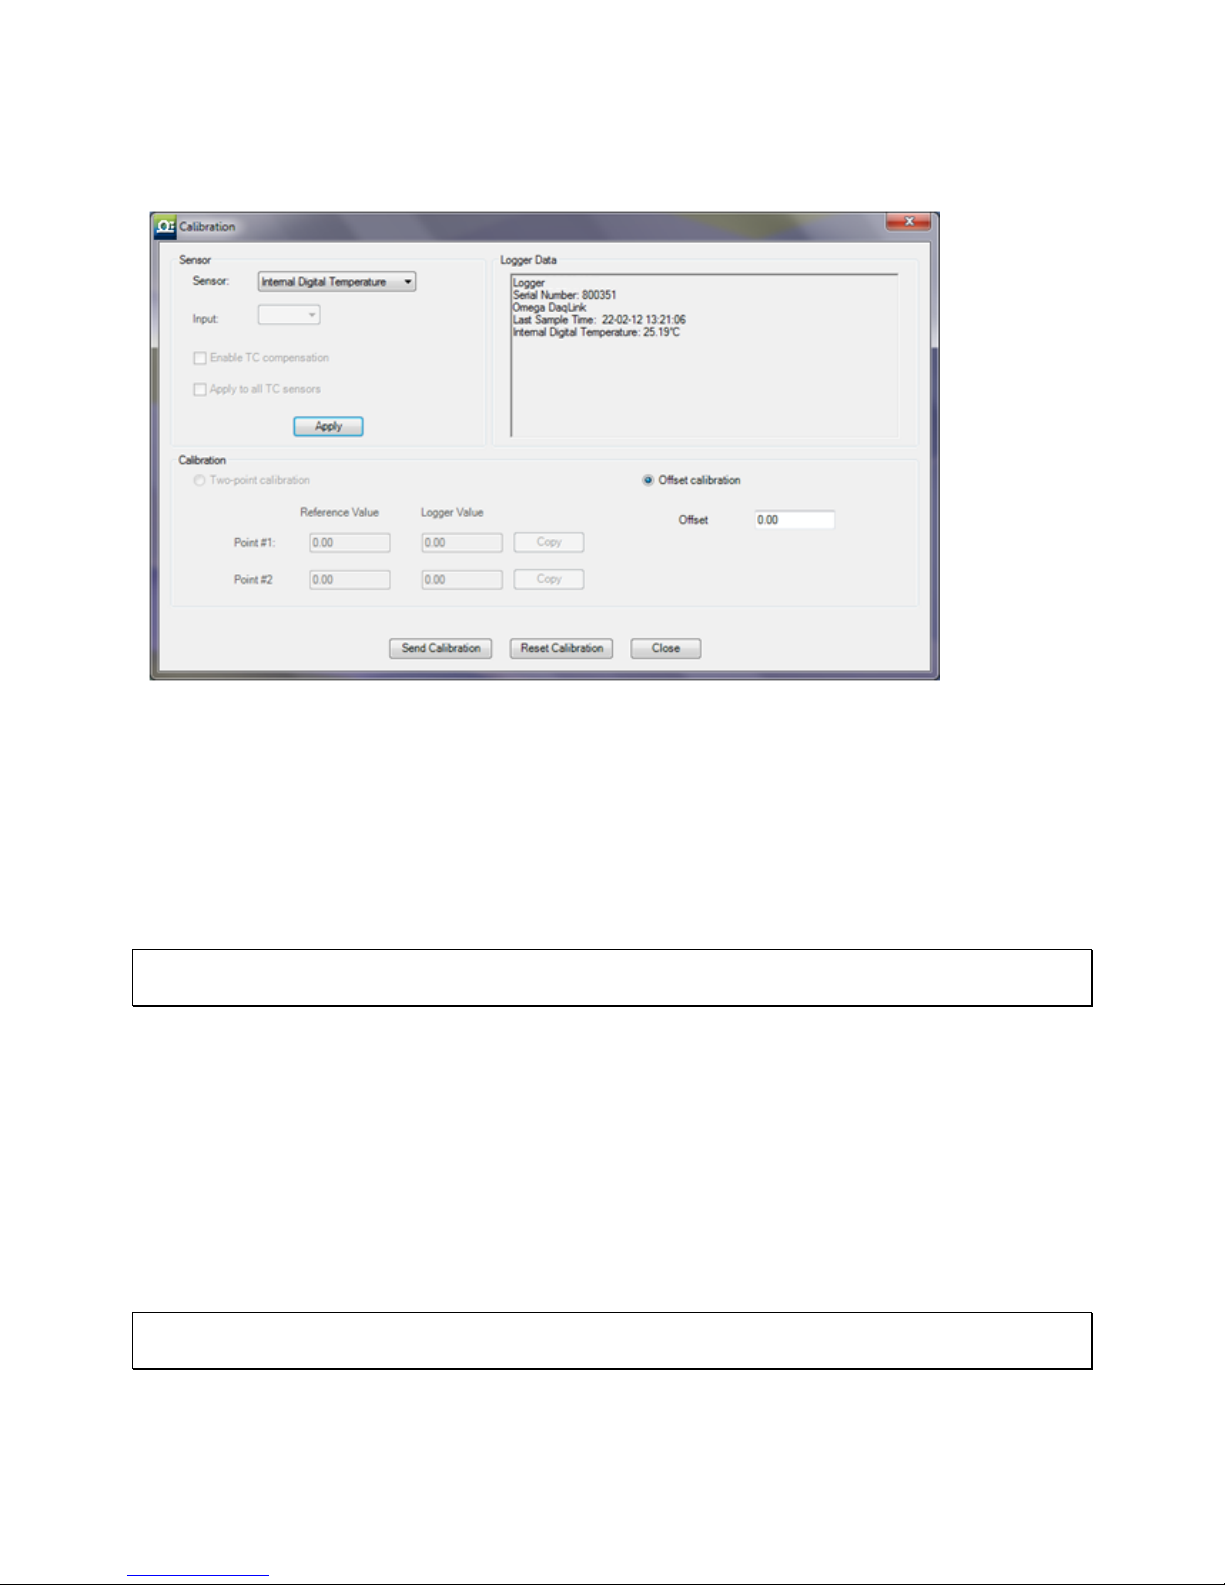
5.17.2. Calibrating the Data Logger
Figure 36: Calibration dialog
1. From the Map View, open the Logger context menu and select Stop.
2. Select Calibration > Calibrate and enter the password in the Password dialog.
3. Select the sensor you wish to calibrate from the Sensor drop-down menu.
4. If calibrating an external sensor, select the inputs to calibrate. Select All or an individual
input, 1 to 4.
5. Click Apply to send the sensor setup to the logger.
Note: The calibration process does not delete the logger’s setup prior to calibration. Once
Calibration is complete the original logger setup will be restored.
6. If you selected All inputs, then by default the logger will be setup to log data on Input 1
during the calibration process. Otherwise, if you selected a specific input, it will setup the
logger to calibrate on that input.
Logger Data Pane
The Logger Data pane displays real-time readings on the logger, at a default sampling rate of
one per second. You can also view the logger’s general status. Use the Logger Data pane to
verify your logger is properly calibrated.
The Calibration dialog will enable either Two-point or Offset calibration, or both, depending on
the sensor selected.
Note: The calibrated sensor parameters will be saved both in the logger and in the software
memory, so there is no need to calibrate the logger every time you run the software.
71
Page 79
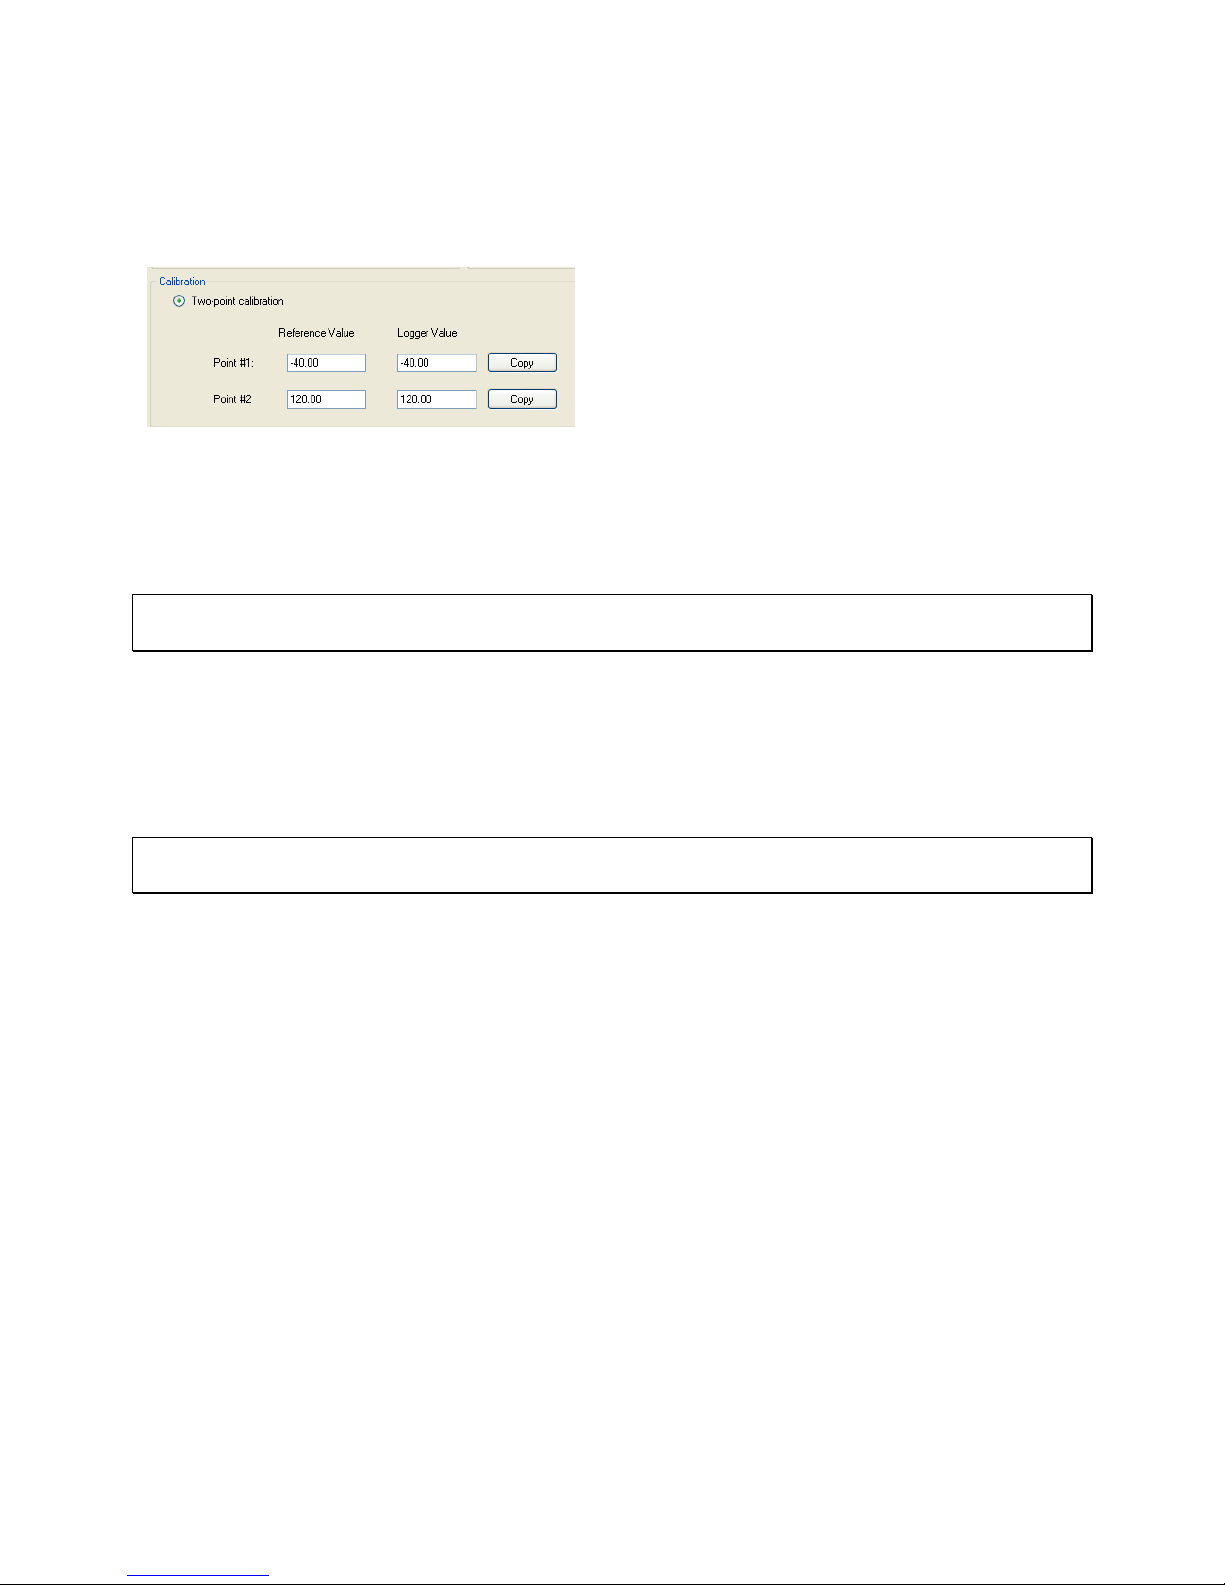
5.17.3. Performing a Two-point Calibration
To perform a two-point calibration, you must have two reference points to input against the real
logger sensor values.
Figure 37: Two-point calibration window
1. In the Point #1 field, enter the first Reference Value and the corresponding Logger Value.
2. In the Point #2 field, enter the second Reference Value and the corresponding Logger
Value.
Note: If you are using a calibrator and the logger is currently displaying the real value to be
calibrated, press the Copy button to copy the real value to the Logger Value text box.
3. Press Send Calibration to send these values to the logger memory.
4. Compare the real value in the Logger Data pane to the reference value. If the values are
within an acceptable margin of error you may close the Calibration window, or move on to
the next sensor or input.
5. If the values are still not accurate enough, you can perform Offset calibration to tweak with
values further.
Note: Omega strongly recommends calibrating using the default Reference values that appear
in the two Reference value text boxes for each sensor.
5.17.4. Performing an Offset Calibration
If, after the Two-point calibration procedure, the logger still exhibits some offset value use the
Offset calibration tool to correct it.
The offset value is the difference between the value displayed by the logger and the reference
value. For example if the calibrator is set to 0 °C and the logger reads 1 °C the offset value is
1, but if the logger reads 1 °C then the offset value is 1.
To perform an Offset calibration, simply select the Offset calibration radio button to enable the
Offset text box. For Thermocouples you will only have the option to perform an Offset
calibration.
Enter the offset value in the text box and click Send Calibration. Continue to adjust the offset
accordingly until satisfied with the readings.
5.17.5. Setting the Offset to a Specific Input
After setting the offset to all inputs simultaneously, you can set the offset of each input
separately for even better accuracy.
72
Page 80

To set the offset of a specific input:
1. Measure two known reference values making sure to use the input you need to calibrate.
2. Enter the offset value as described in section 5.17.4 above, making sure to select the correct
input number instead of All.
3. You can repeat the procedure for every input.
5.17.6. Calibrating the Internal Temperature Sensor on the OM-
DAQLINK-TEMP
The OM-DAQLINK-TEMP internal temperature sensor is a PT-100 sensor. Calibration of this
sensor is performed by calibrating the external PT-100 input i.e. two-point calibration followed
by offset calibration.
1. In the Calibration dialog, select PT-100 in the Sensor drop-down menu and select All inputs.
2. Press Setup to proceed.
3. Connect a calibrator or an actual PT-100 sensor to Input-1. Calibrate the input using the
reference values.
Once this calibration procedure is complete both the logger’s internal temperature sensor (PT-
100) and external PT-100 inputs will be calibrated.
5.17.7. Calibrating the External PT-100 Sensor Input
OM-DAQLINK PT-100 calibration is a standard 2-point calibration followed by offset calibration.
Once the PT-100 sensor has been selected in the Sensor drop-down menu, click the Reset
Calibration button. Then proceed with the 2-point calibration procedure.
Before each calibration this step must be performed otherwise the calibration will not be
accurate.
5.17.8. Saving Calibration Settings
At any time you may manually save the logger’s calibration settings locally to your PC.
1. Open the logger context menu, select Calibration > Save Calibration and enter the
password to access this feature.
2. The Save As dialog will open. Name the calibration file (with extension .dcf) and save it
either in the default Calibration folder in the DataSuite directory or in a folder of your choice.
5.17.9. Loading Calibration Settings
You can load a previously saved DataSuite .dcf calibration file at any time to restore a logger’s
restore specific calibration settings.
1. Open the logger context menu, select Calibration > Load Calibration and enter the
password to access this feature.
2. In the Open dialog, browse to the calibration file you need and click Open. The logger will
be updated with the new calibration settings.
73
Page 81
5.18. Analyzing the Data
When in offline (History View) or online data displays, you have a number of features for
analyzing the on-screen data. The features for analyzing data while in the graph display are
practically the same when in offline or online mode.
5.18.1. Using the Graph Features
The following section explains how to use the numerous graph analysis features, including an
overview of the graph toolbar options.
Please first refer to section 5.4.5: DataSuite Toolbar Icons for a full overview of the graph
toolbar.
Autoscaling
Click Autoscale on the graph toolbar to view the full data display, thereby restoring the axis
range to its default settings.
Zooming
To zoom in to a specific area of the graph:
1. Click Zoom in on the graph toolbar.
2. Drag the cursor diagonally to select the area you want to magnify. Release the mouse
button to zoom in to the selected area.
3. Click Zoom in a second time to disable the zoom tool.
4. Click Autoscale to restore the default display.
Panning
Use the Pan tool to pan along the x or y axis or after zooming in, to see any part of the
graph that is outside the zoomed area.
1. Click Pan on the graph toolbar, then click anywhere on the graph and drag the mouse
to view another area.
2. Click the Pan icon a second time to disable the Pan tool.
The Cursor
You can display up to two cursors on the graph simultaneously.
Use the first cursor to display individual data recording values.
Use two cursors to display the difference between two coordinate values, to display the
frequency of periodic data or to select a range of data points.
74
Page 82
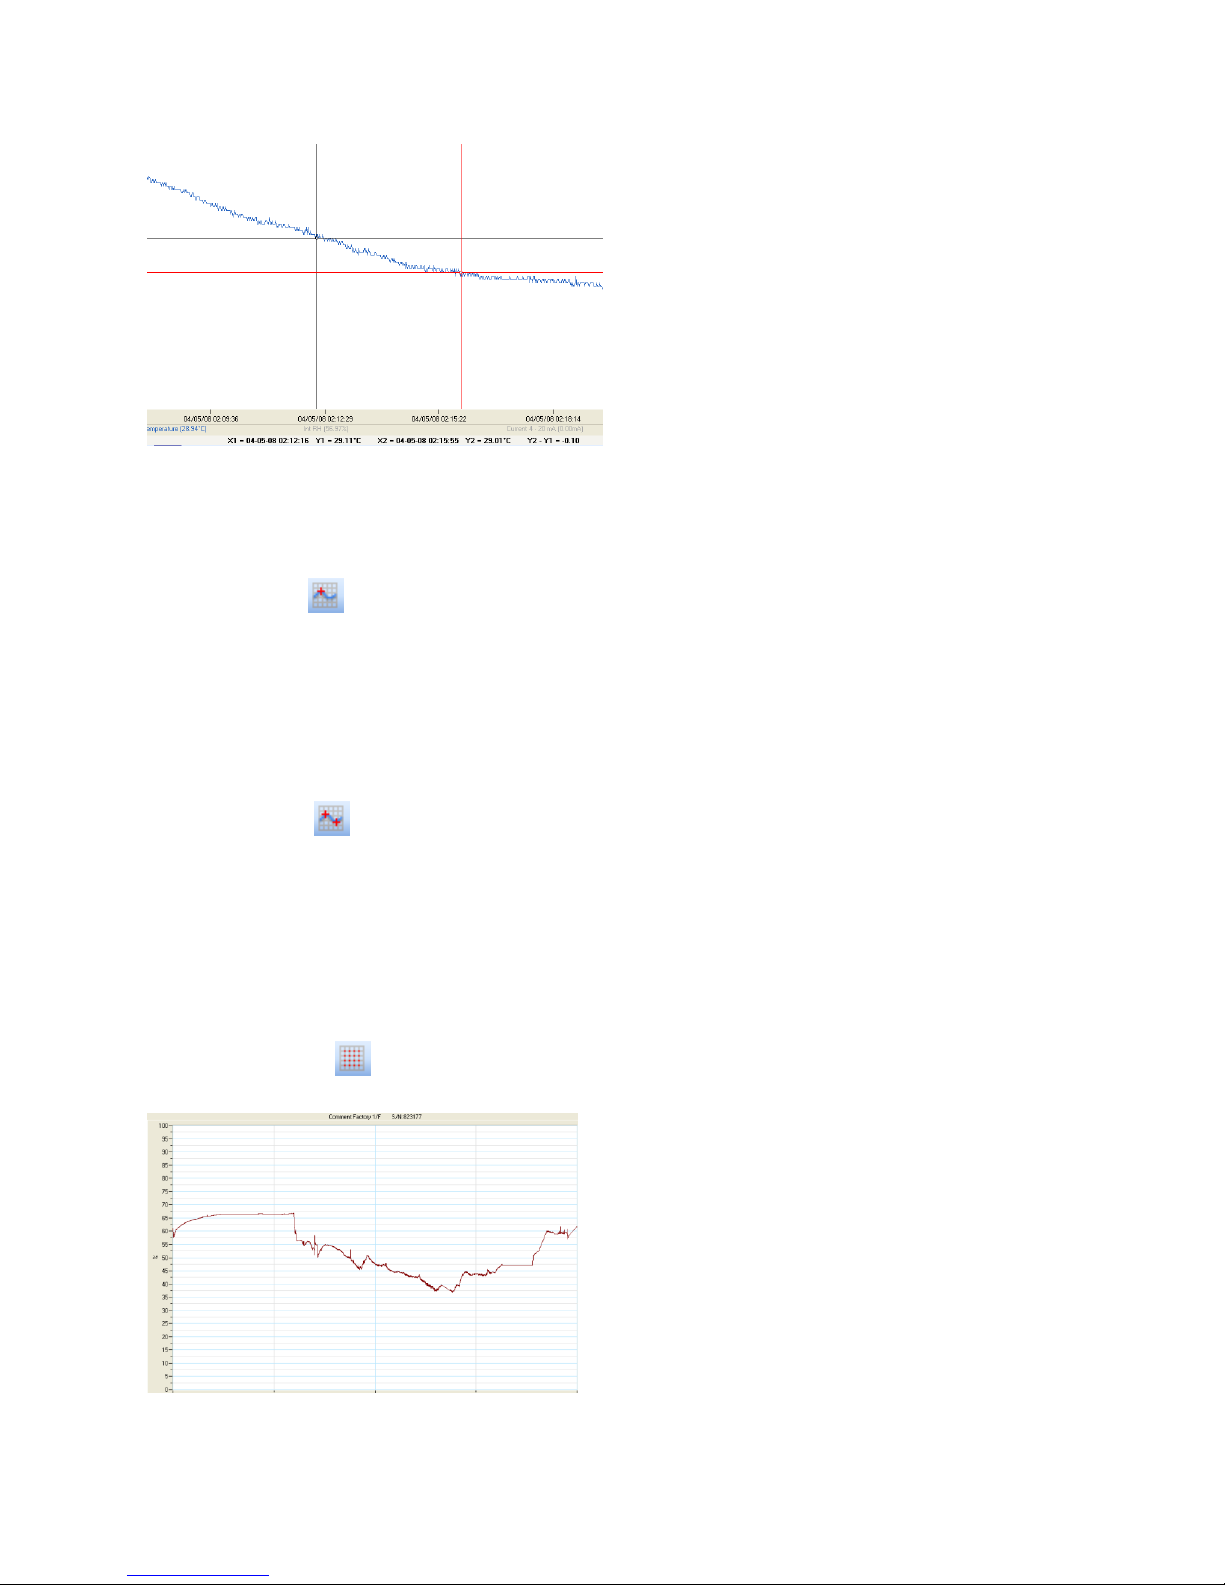
Figure 38: Example of using two cursors
When using two cursors, the Statistics feature will calculate statistics according to the data set
between the two cursors.
To display the first cursor:
Click 1st Cursor on the graph toolbar. You can drag the cursor with the mouse onto any
other point on the plot, or onto a different plot. For finer cursor movements use the forward and
backward keys on the keyboard.
The coordinate values of the selected point will appear in the information bar at the bottom of
the graph window.
To display the second cursor:
Click 2nd Cursor and drag the cursor with the mouse onto any other point on the plot. The
information bar will now display the difference between the two coordinate values.
To remove the cursors:
Click the cursor icons a second time.
Grid
Click the Grid icon to add a grid to the background of the graph view. To remove the grid,
click the icon again.
Figure 39: Graph with grid in background
75
Page 83
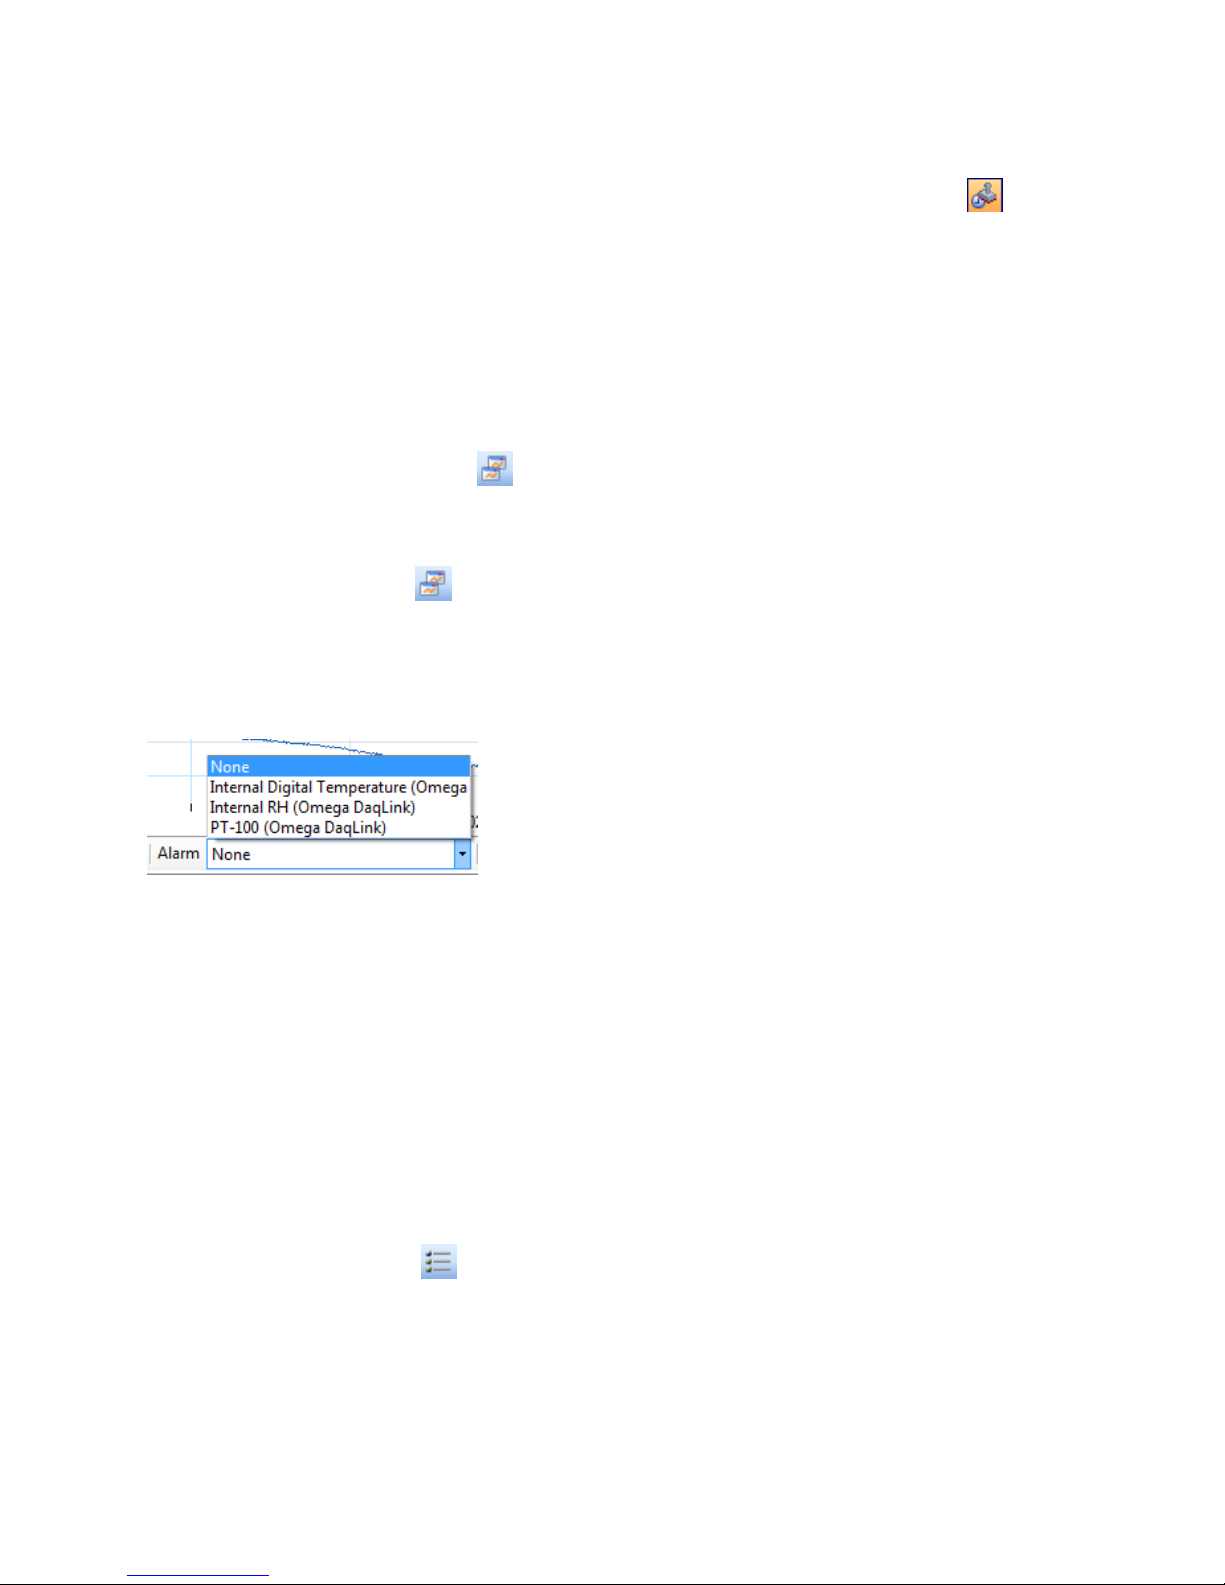
Show/Hide Time Stamps
This feature is not supported by the OM-DAQLINK. By default, the Time Stamp icon is
enabled to display in the online or offline graph, any time stamp marked using the OMMICROLITE or OM-MICROLOGPRO data loggers.
Add Custom View
Whenever the graph in History View is modified, either by using the Zoom tool, changing the
scale, panning the graph, etc. you have the option to add this customer graph view to the Data
Map, under the Custom Views node. This will enable you to save projects which include the
custom graph view for future reference.
Click the Add Custom View icon to perform this function.
Copying the Graph
Click the Copy Graph icon to copy the graph to the clipboard, and paste it into another
application, such as a word processing or spreadsheet application.
Displaying Alarm Levels
Open the Alarm drop-down menu and select the relevant sensor to display its alarm levels.
The Stretch/Compress Axis Tool
Move the cursor onto one of the graph axes. The cursor icon changes to the double arrow
symbol (↔), indicating that you can stretch or compress the axis scale. Drag the cursor to the
desired location. Repeat the procedure for the other axis if necessary.
To select a data set to display on the Y-axis, click on the data set’s name in the Y-axis list. To
display more than one curve, click on the data sets you want.
Formatting the Graph
You can change the plot line’s color and width. The color of the Y-axis matches the
corresponding plot’s color and will automatically change with any change made to the color of
the corresponding plot.
1. Click Graph properties on the graph toolbar.
2. Click the Style tab, and unselect the Use system line properties checkbox.
3. Select the axis you want to format in the Axis drop-down menu.
4. Select the color and line width.
5. Click OK.
76
Page 84
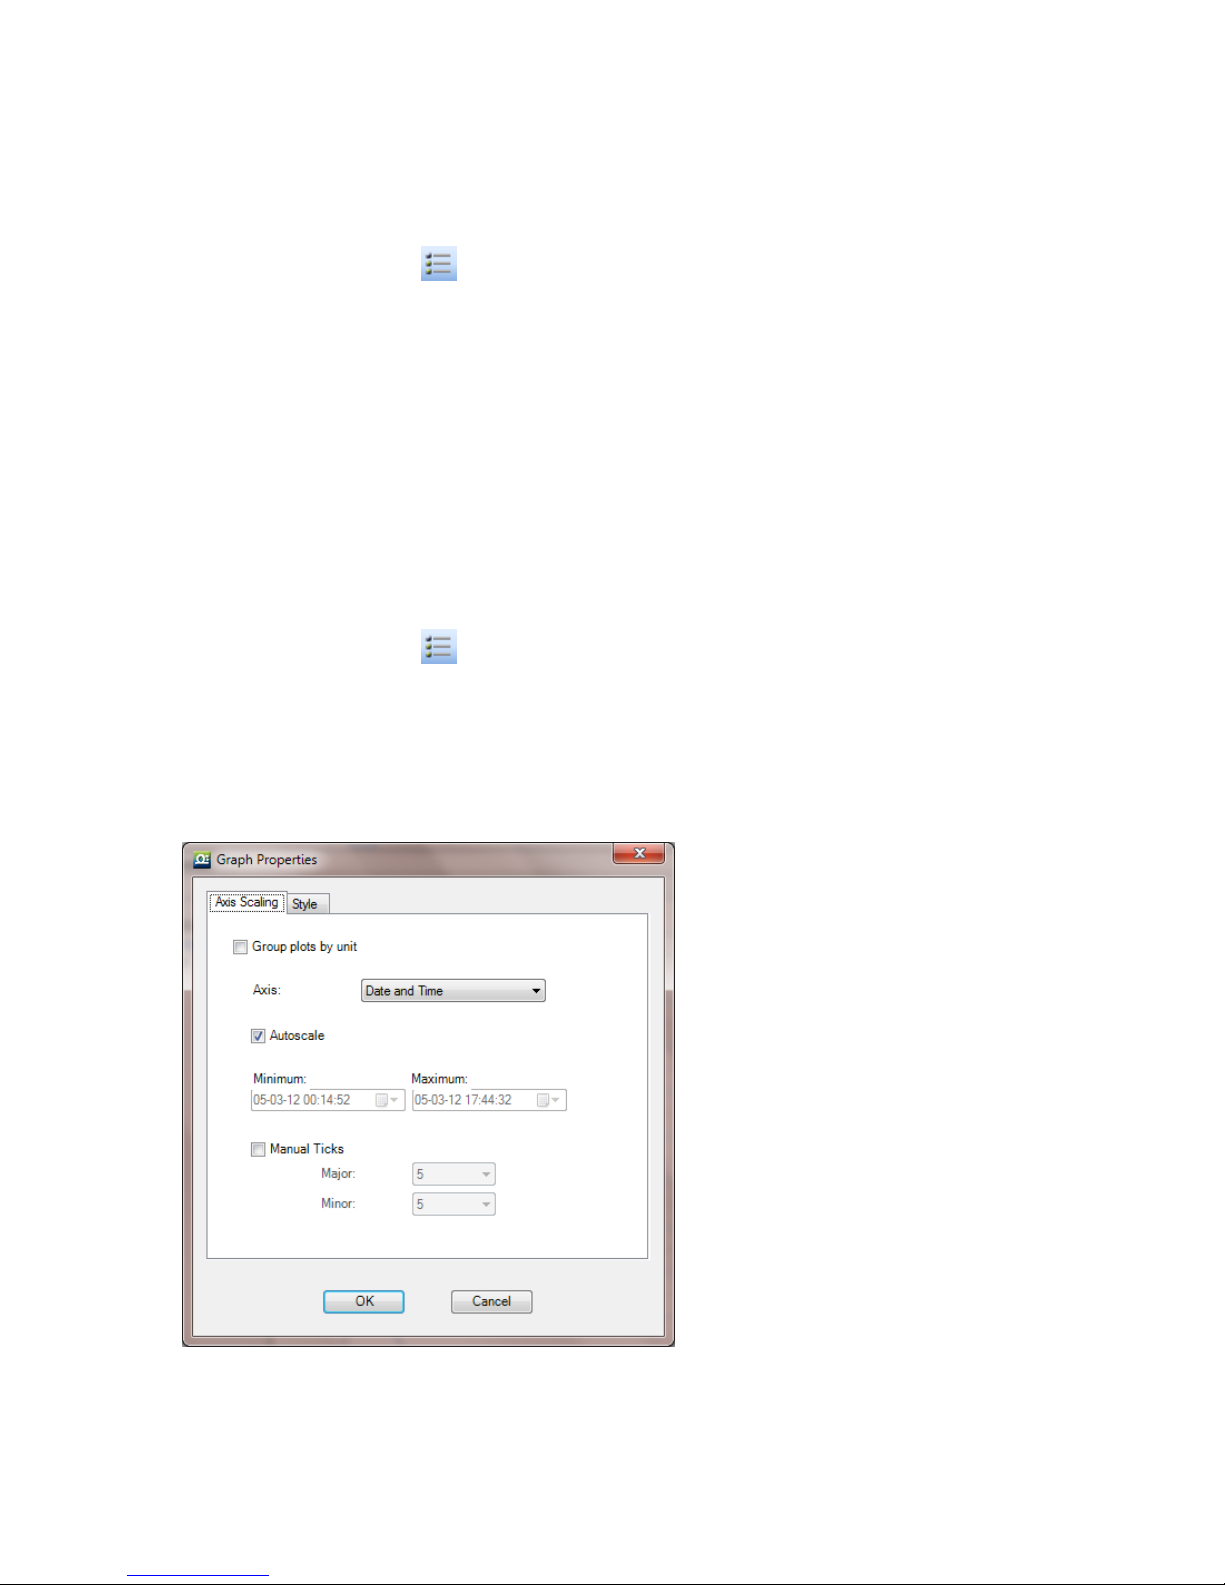
6. To restore the default formatting, select the Use system line properties checkbox again.
Manual Scaling
1. Click Graph properties on the graph toolbar.
2. Select the Axis Scaling tab and with the Group plots by units checkbox unselected, select
the axis to manually scale from the drop-down menu e.g. Date & Time axis.
3. Uncheck the Autoscale check box and enter the custom values in the text box i.e. a time
range, in the case of the Time & Date axis, or a set of values.
4. Click OK.
5. To restore auto scaling select the Autoscale checkbox.
Manual Scaling - Grouping Plots by Unit
You may choose to group all of the sensors measuring the same unit, to the same scale. For
example, if you have several temperature sensors in your data set, all measuring Celsius, you
can apply a common scale when displaying the data from these sensors.
1. Click Graph properties on the graph toolbar.
2. Select the Axis Scaling tab and select the Group plots by units checkbox.
3. In the Axis drop-down menu select the unit by which you wish to group the plots.
4. Uncheck the Autoscale check box and enter the custom values in the text box.
5. Click OK.
6. To restore auto scaling select the Autoscale checkbox.
Figure 40: Grouping plots by units
77
Page 85
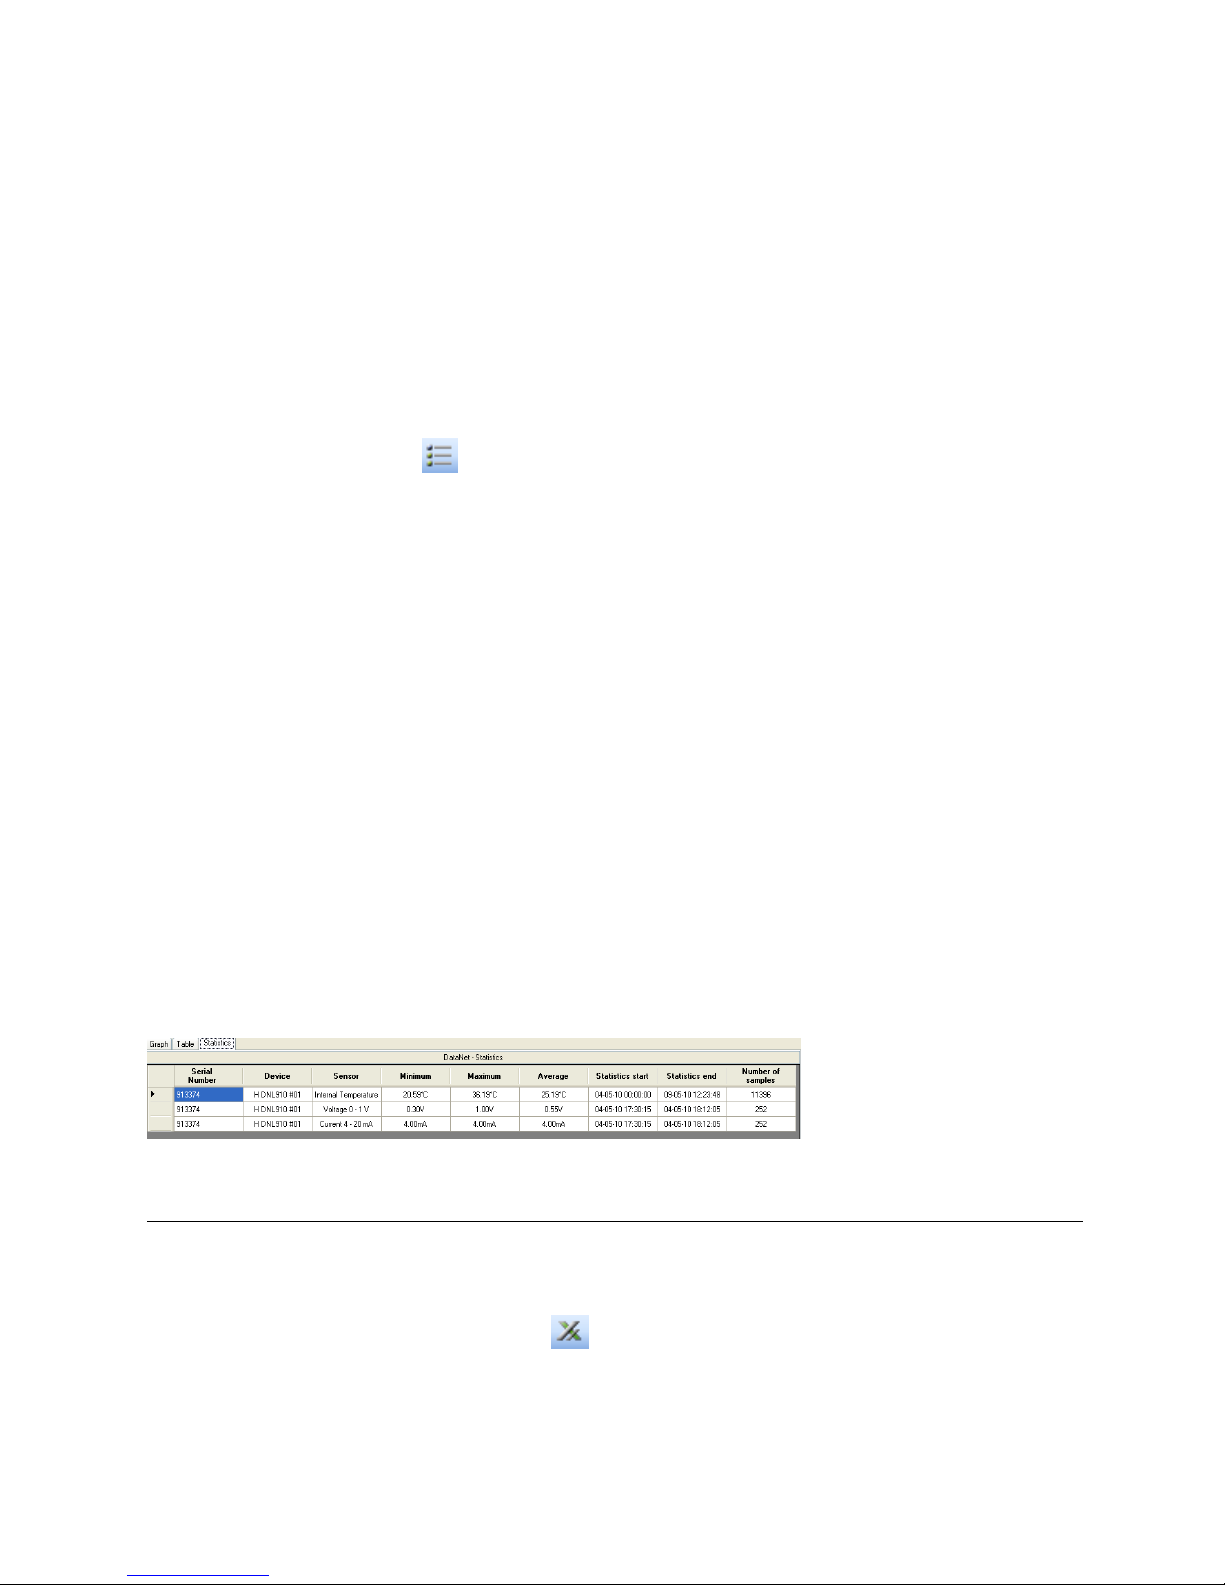
5.18.2. Changing the Graph, Table or Statistics View Header
Each Graph, Table or Statistics tab has a header located above the specific view. The default
headers are:
DataSuite - Graph
DataSuite - Table
DataSuite - Statistics
The header will also be included when printing the graph.
To change the header:
1. Click Graph Properties on the graph toolbar.
2. Click the Style tab and enter the graph header in the Header field.
5.18.3. Statistical Analysis
DataSuite also provides some basis statistics regarding the open data sets. While in History
View or online Data Display view, click the Statistics tab.
For each of the sensors in the data set, you will have the following statistics displayed:
Minimum / Maximum values
Average value
Number of samples
You will also see the Logger name and SN, as well as the start and end time of the statistics
data range.
While in online mode these statistics are updated in real-time.
If you zoom onto a section of the graph, the statistics are dynamic and will therefore display
statistics of the zoomed graph, not of the whole graph.
If using the cursors, the statistics will be calculated according to the data set between the two
cursors.
Figure 41: Statistics View
5.19. Exporting Data to Excel or CSV Formats
DataSuite supports exporting data to Excel or CSV file formats (CSV stands for comma
separated values).
To export to Excel, click Export to Excel in the online or offline lower graph toolbar, or go
to Analysis > Export to Excel (while viewing data in History View). The data currently
displayed on the graph is exported. Data from more than one data logger may be exported
simultaneously.
78
Page 86
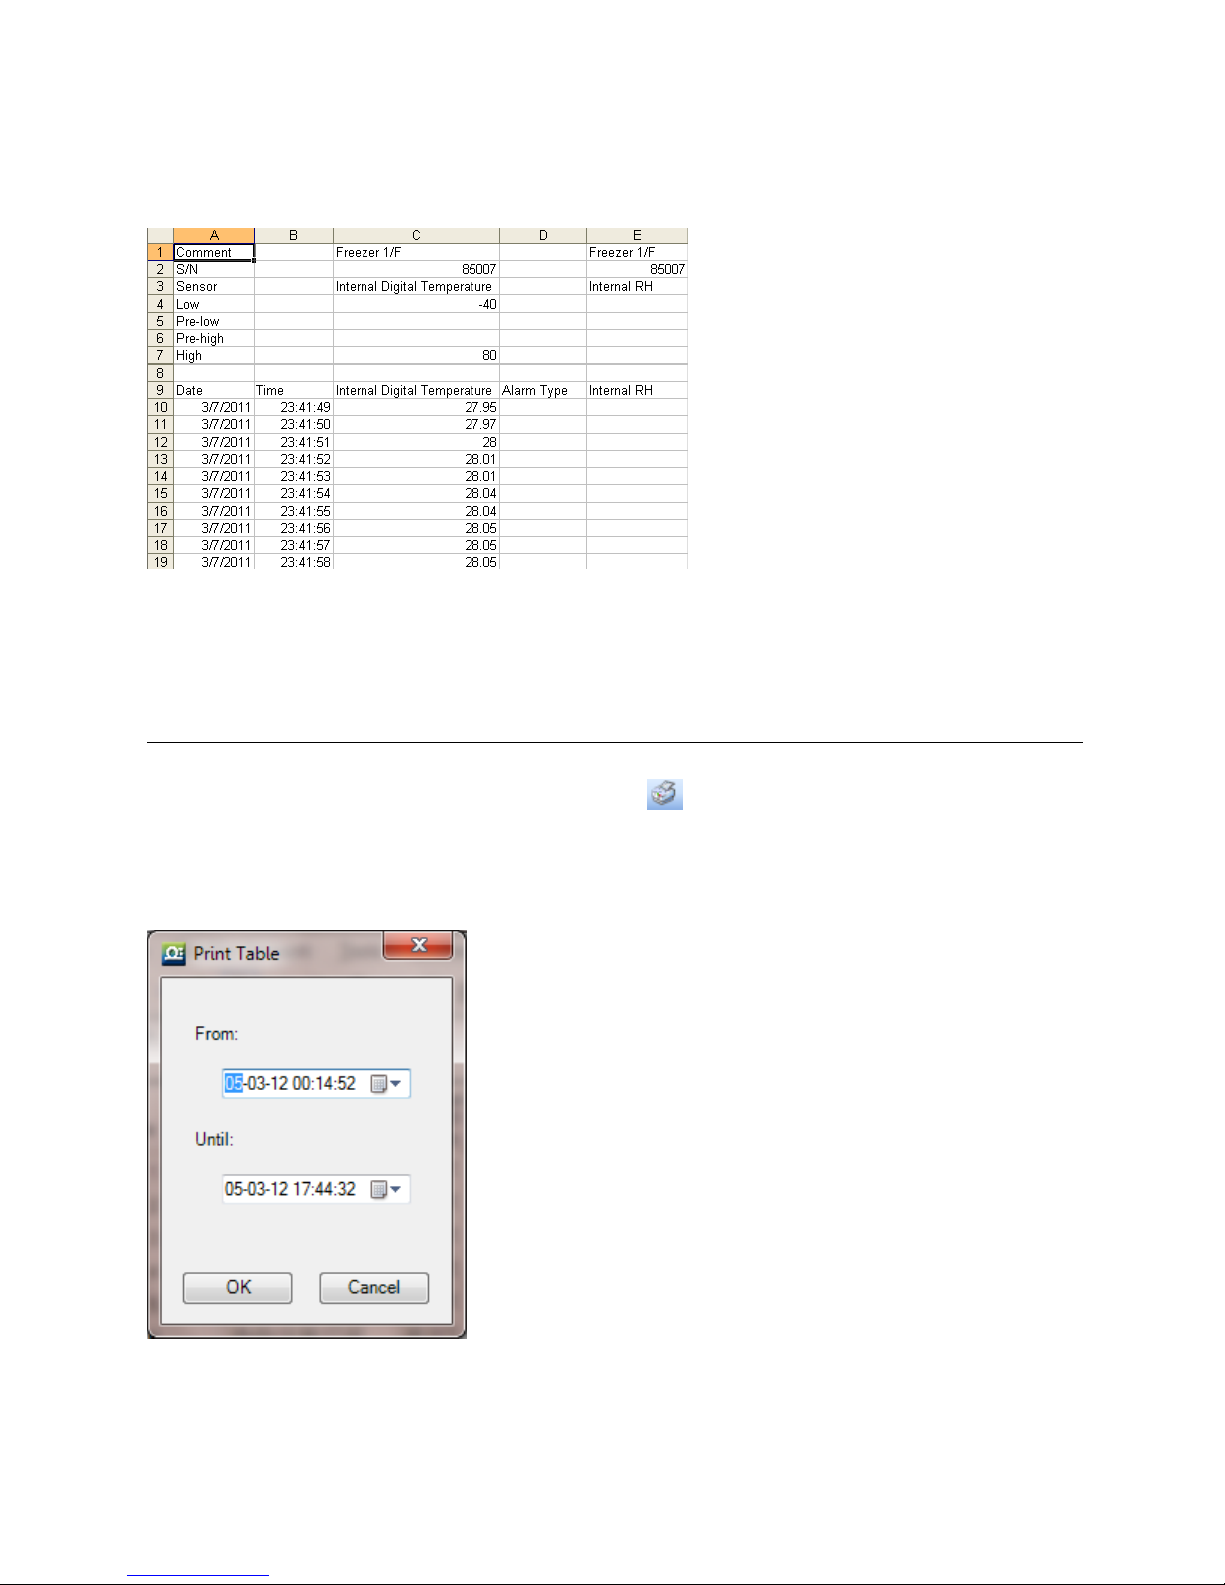
DataSuite will then open a new Excel workbook displaying the data as well as other pertinent
information such as logger comment, serial number and the alarm level setup. Data that
exceeds any of the alarm levels will be indicated.
Figure 42: Example of data exported to Excel
Only offline data opened in History View can be exported to CSV and is available under the
Analysis menu.
5.20. Printing the Data
You are able to print data by clicking the Print icon from the lower toolbar in Graph, Table
or Statistics tabs of the offline or online data displays. Clicking the Print icon will open the Print
Setup dialog where you will need to select the printer to print to.
When printing a table, you can select the specific data range you wish to print. You are able to
adjust the date and time in order to narrow the data range.
Figure 43: Printing a table
79
Page 87
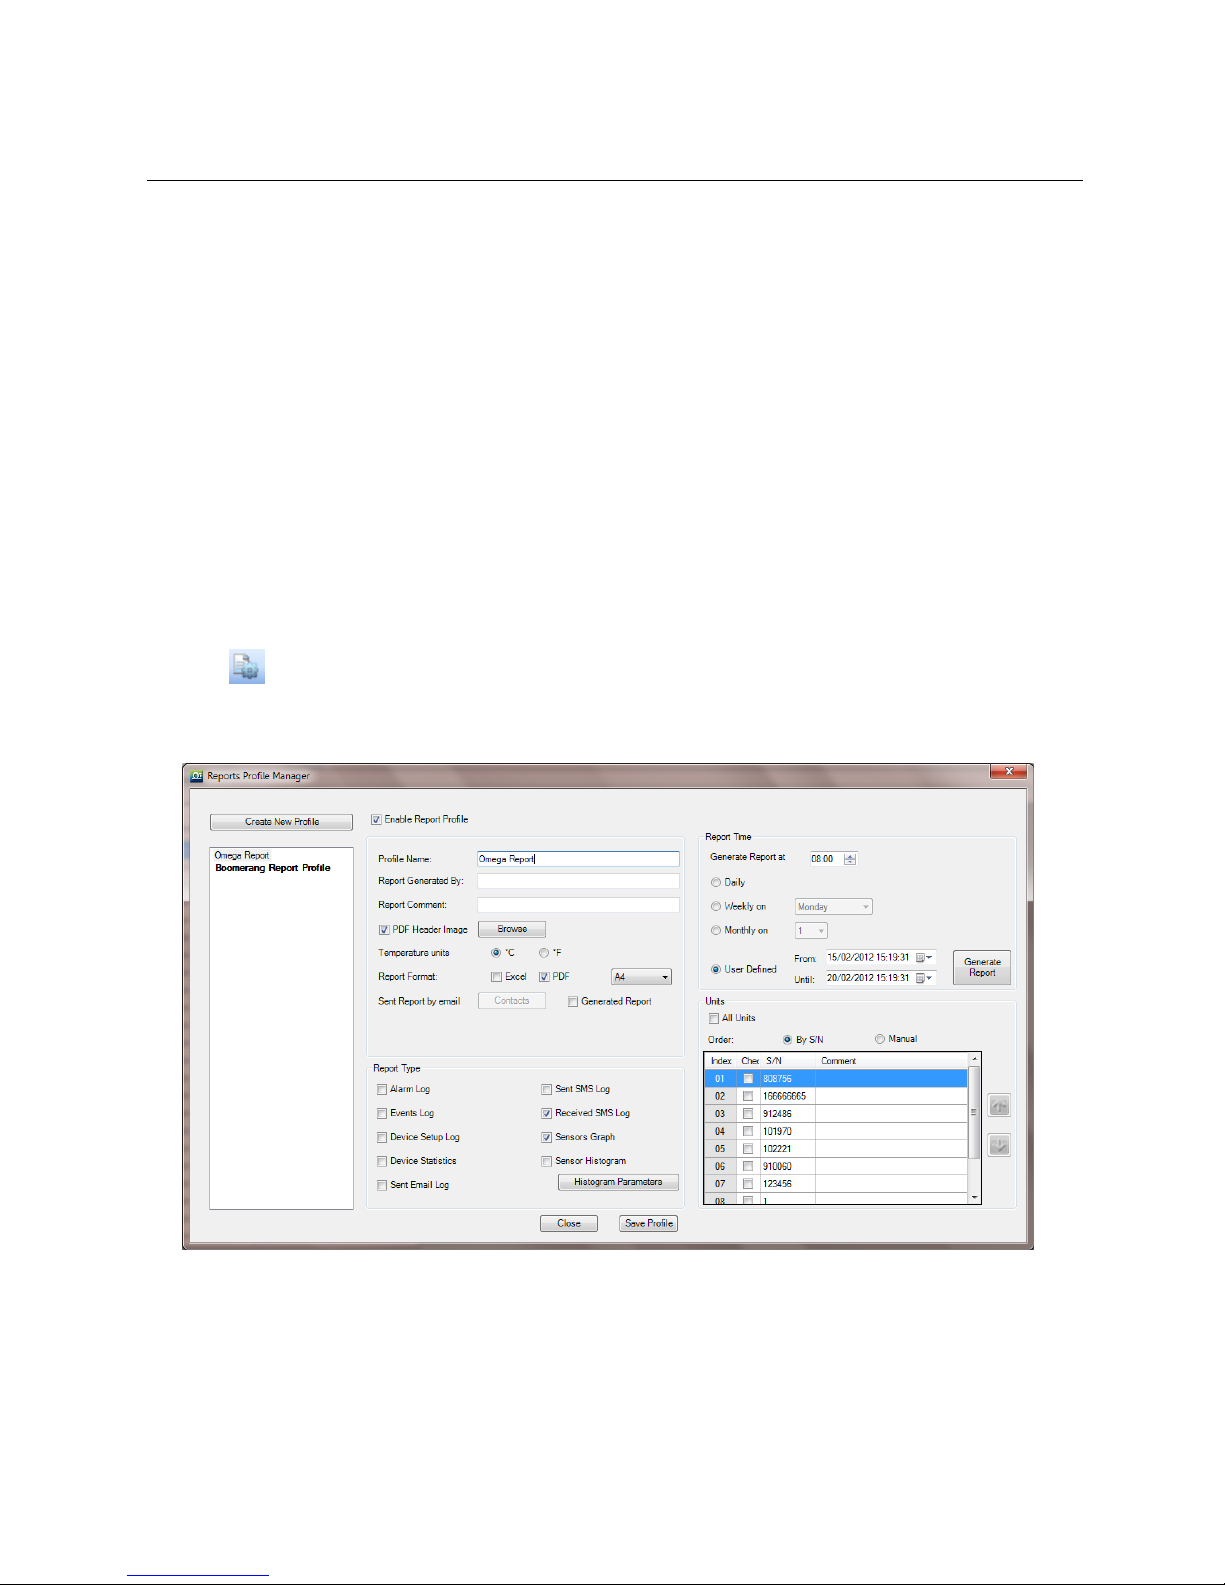
5.21. Reports Module
The Reports module provides an intuitive interface for creating and generating DataSuite
reports. Each report contains a wide range of parameters garnered from all units supported by
the software. Each report can be sent via e-mail to a selected distribution list, at pre-defined
time intervals, in PDF and Excel format.
All reports are saved in the default directory:
C:\Program Files\Omega\DataSuite\Reports
To change this path go to the Preferences tab in Tools > Options.
5.21.1. Creating a Report Profile
The first step when creating a report is to create a new Report Profile. The user can create
multiple profiles, each configured with different parameters. To generate a report, at least one
profile must be enabled.
1. Go to Reports > Reports Profile Manager in the main menu, or click the corresponding
icon in the upper toolbar.
2. Enter the system password. The Reports Profile Manager window will open.
3. Click Create New Profile.
Figure 44: Reports Profile Manager window
4. Select the Enable Report Profile checkbox to enable all fields in the window. Each profile
that is enabled will have a report generated. If no profiles are enabled, DataSuite will not
generate any reports.
5. Enter a suitable profile name in the Profile Name field.
6. Enter your name in the Report Generated By field.
80
Page 88
7. Enter a description of the report in the Report Comment field.
8. Each report created in PDF format contains a header. To change the report’s header, select
the PDF Header Image checkbox and click Browse to locate the relevant image. The
default Omega header is:
Note: The recommended header dimensions are 525 x 50 pixels, 72 dpi. If a header with
different dimensions is loaded, then the software will automatically resize the header
dimensions.
9. Toggle the temperature unit to appear on the report, if any of the logger’s are configured to
measure temperature.
10. Next to Report Format, select the checkbox next to the required format in which to generate
the report. Excel, PDF or both formats. For PDF format, select the page size, A4 or Letter,
from the drop-down menu.
11. Click the Generated Report checkbox to send the report via email to a selected distribution
list. Click Contacts to open your contact list and select the relevant contacts to receive the
report via e-mail. If your contact list is empty then the Select Contacts window will
automatically open when first clicking Generated Report.
Note: To send reports via e-mail, ensure the DataSuite e-mail settings are correctly
configured in Tools > Options > e-mail Settings.
12. In the Report Type pane, select at least one of the report type checkboxes. You will not be
able to save the profile unless a report type has been selected.
13. The available types are below. For more details regarding each type, refer to section 5.21.2:
Alarm Log
Events Log
Unit Setup Log
Unit Statistics
Sent Email Log
Sent SMS Log
Received SMS Log
Sensors Graph
Sensor Histogram
14. Once a Report Type has been selected, immediately click Save Profile to avoid losing your
unsaved profile.
15. Use the Report Time pane to select the interval when the report will be generated and
emailed to the contact list (if desired):
a. Next to Generate Report at select the time when the report should be generated.
Note: To allow for data samples recorded in the last minute prior to the defined time, the
report will actually be generated 10 minutes after the defined time.
b. Select the date when the report should be generated. The options are daily, weekly or
monthly. Select the specific day for the latter two options.
81
Page 89

c. The user can also select a report according to a specific time period. Select the User
Defined option, choose the period and click Generate to manually generate the report
according to the defined parameters.
16. Use the Units pane to select which loggers should be included on the report itself.
a. Select the All Units checkbox to include all network units.
b. To include a specific selection of units, unselect the All Units checkbox and manually
select the checkbox for each unit.
c. The order in which the units will appear on the report can be defined according to Serial
Number by selecting By S/N and clicking the S/N header or manually, by selecting
Manual and clicking the Up and Down arrows.
d. The definition of the report is now complete. Click Save Profile and then Close to exit
the Reports Profiles Manager. A report will be generated at the defined time.
5.21.2. Report Types
Each report contains at least one Report Type, with the data displayed in table format. A
description of each Report Type parameter in the Reports Profile Manager is provided below.
Alarm Log
Parameters include sensor name, setup, alarm parameters, and setup time. In addition,
each sensor alarm value is listed according to the relevant setup. If there are other setups in
the report time frame then additional setup tables and alarm tables will be displayed.
Battery alarms will be listed after the sensor alarms.
If no alarms were recorded during the report time frame, a No Alarm Events message will be
displayed.
Events Log
Logs all events of each logger in the Report, as well as the time of the event. The relevant OMDAQLINK events are:
Setup
Run
Stop
Firmware updated, including indication of previous and updated firmware version
Unit Setup Log
Logs all the setups of the logger during the logging period
If no setups were performed during the report time frame the a No New Setup message will
be displayed
Unit Statistics
Displays statistics for each sensor in the report. The calculated parameters are:
Min
82
Page 90

Max
Average
Number of samples
Sent Email Log
Logs all emails that were sent during the report time frame.
The details in the Sent Emails Log are:
Message that was sent
Date
Time
To whom the message was sent (groups will be displayed as groups)
Sent SMS Log
Logs all SMS’s that were sent during the report time frame.
The details in the Sent SMS Log are:
Message that was sent
Date
Time
To whom the message was sent (groups will be displayed as groups)
Received SMS Log
Logs all SMS’s that were sent to the DataSuite software during the report time frame.
The details in the Received SMS Log are:
Message that was received
Date
Time
From whom the message was sent
Sensor Graph
The Sensor Graph log includes the following parameters:
Unit comment and S/N indicated as the graph header
Indication of sensor name, sensor type, start time & date and end time & date under each
graph
A small graph of each sensor that is defined in the logger with its alarm levels displayed
according to the alarm colors. The graph will be created according to the last logger setup.
The graph scaling will be set to autoscale
The graph will include grid lines
83
Page 91
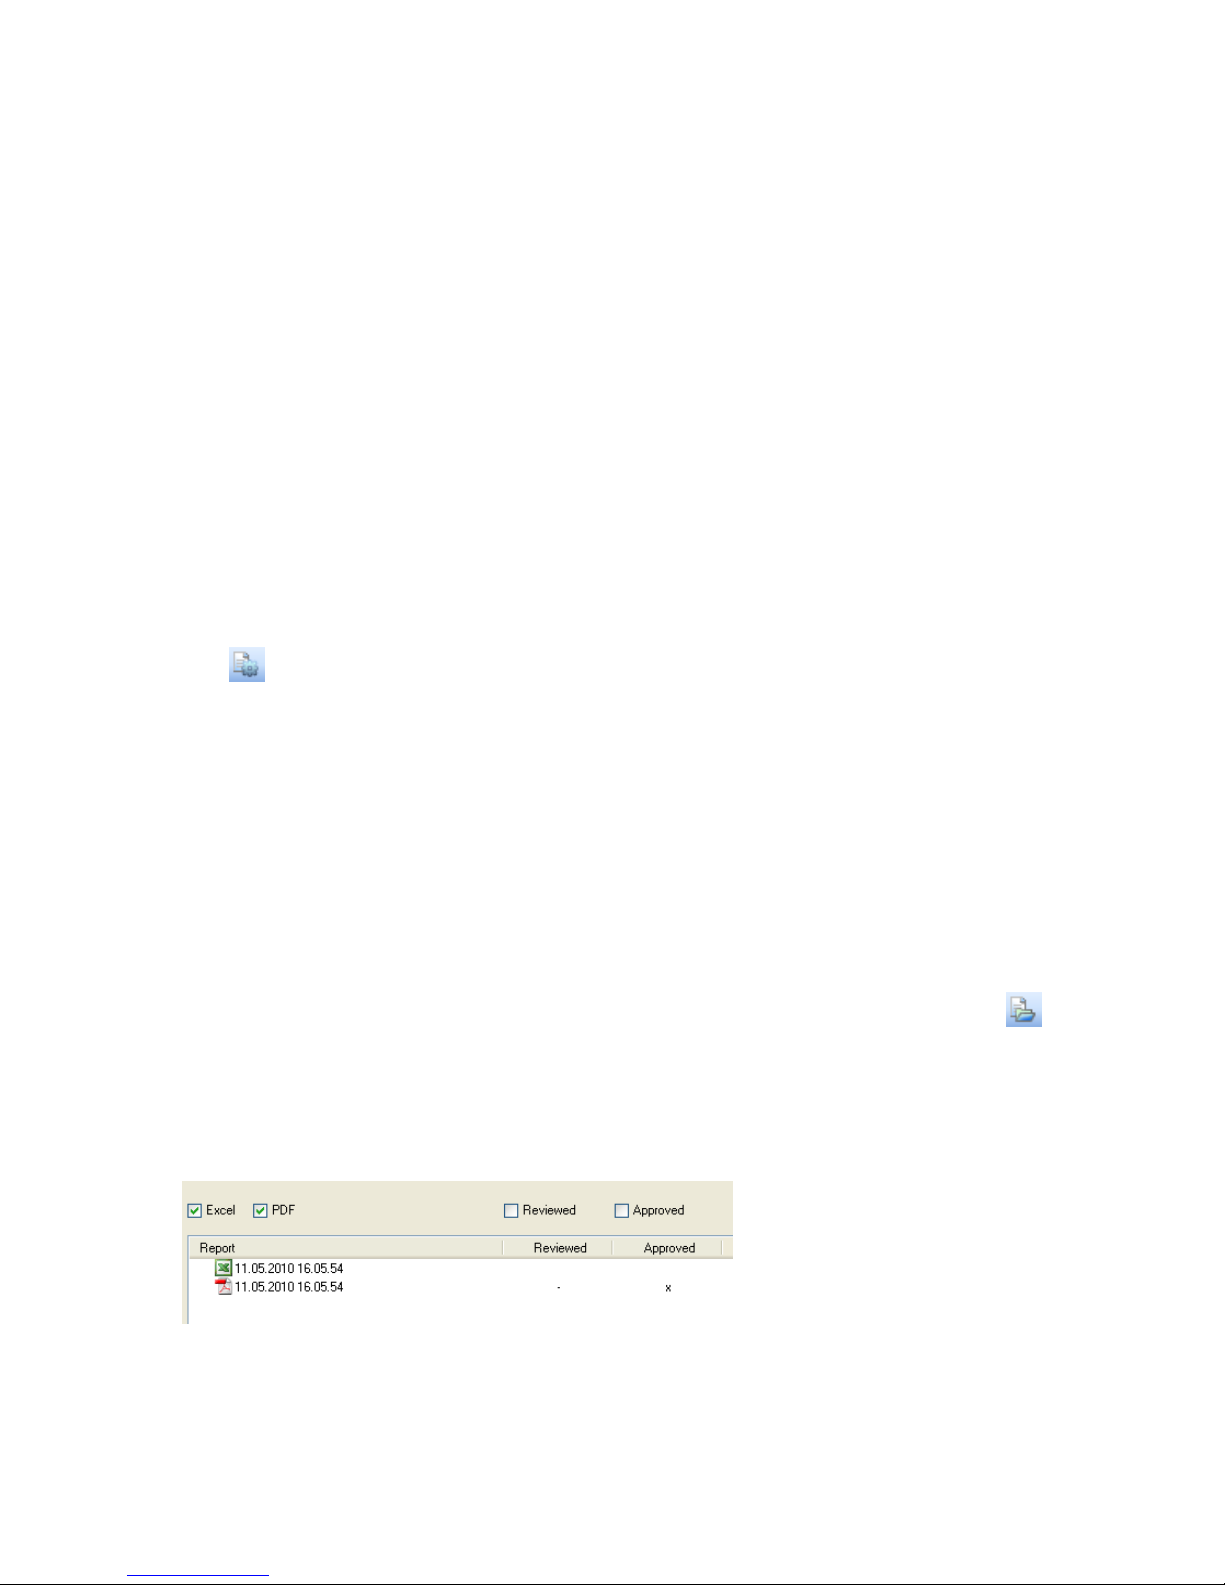
The alarm levels will be marked according to the alarm color and the alarm limit value will be
indicated on the Y- axis
The graph dimensions will be 7.5 cm x 10.5 cm
Sensor Histogram
Unit comment and S/N indicated as the graph header
Under each Histogram there will be indication of the sensor name, sensor type, start time &
date and end time & date
A small histogram of each sensor defined in the logger will be displayed
The histogram will include an indication of the value of each bin on top of the bin
The graph dimensions will be 7.5 cm x 10.5 cm
5.21.3. Removing a Report Profile
To remove an existing report profile:
1. Go to Reports > Reports Profile Manager in the main menu, or click the corresponding
icon in the upper toolbar.
2. In the Profile list on the left side of the window, right-click the Report name to be removed
and select Remove from the context menu.
3. Enter the system password and when prompted, confirm the action.
5.21.4. The Report Browser
Use the Report Browser to open or delete generated reports saved in the Reports folder in the
default DataSuite directory.
Reports are displayed per Profile.
1. Go to Reports > Report Browser in the main menu, or click the corresponding icon in
the upper toolbar. The Report Browser window will open.
1. Select one of the profiles in the Profiles pane on the left side of the window. All reports
generated under that profile will appear in the main Report pane.
2. Use the Excel, PDF, Reviewed and Approved checkboxes to filter the reports to be
displayed in the Report pane.
3. To open a report click one of the reports in the list and click Open.
4. To delete a report click one of the reports in the list and click Delete.
5. Click Close to close the Reports Browser window.
84
Page 92
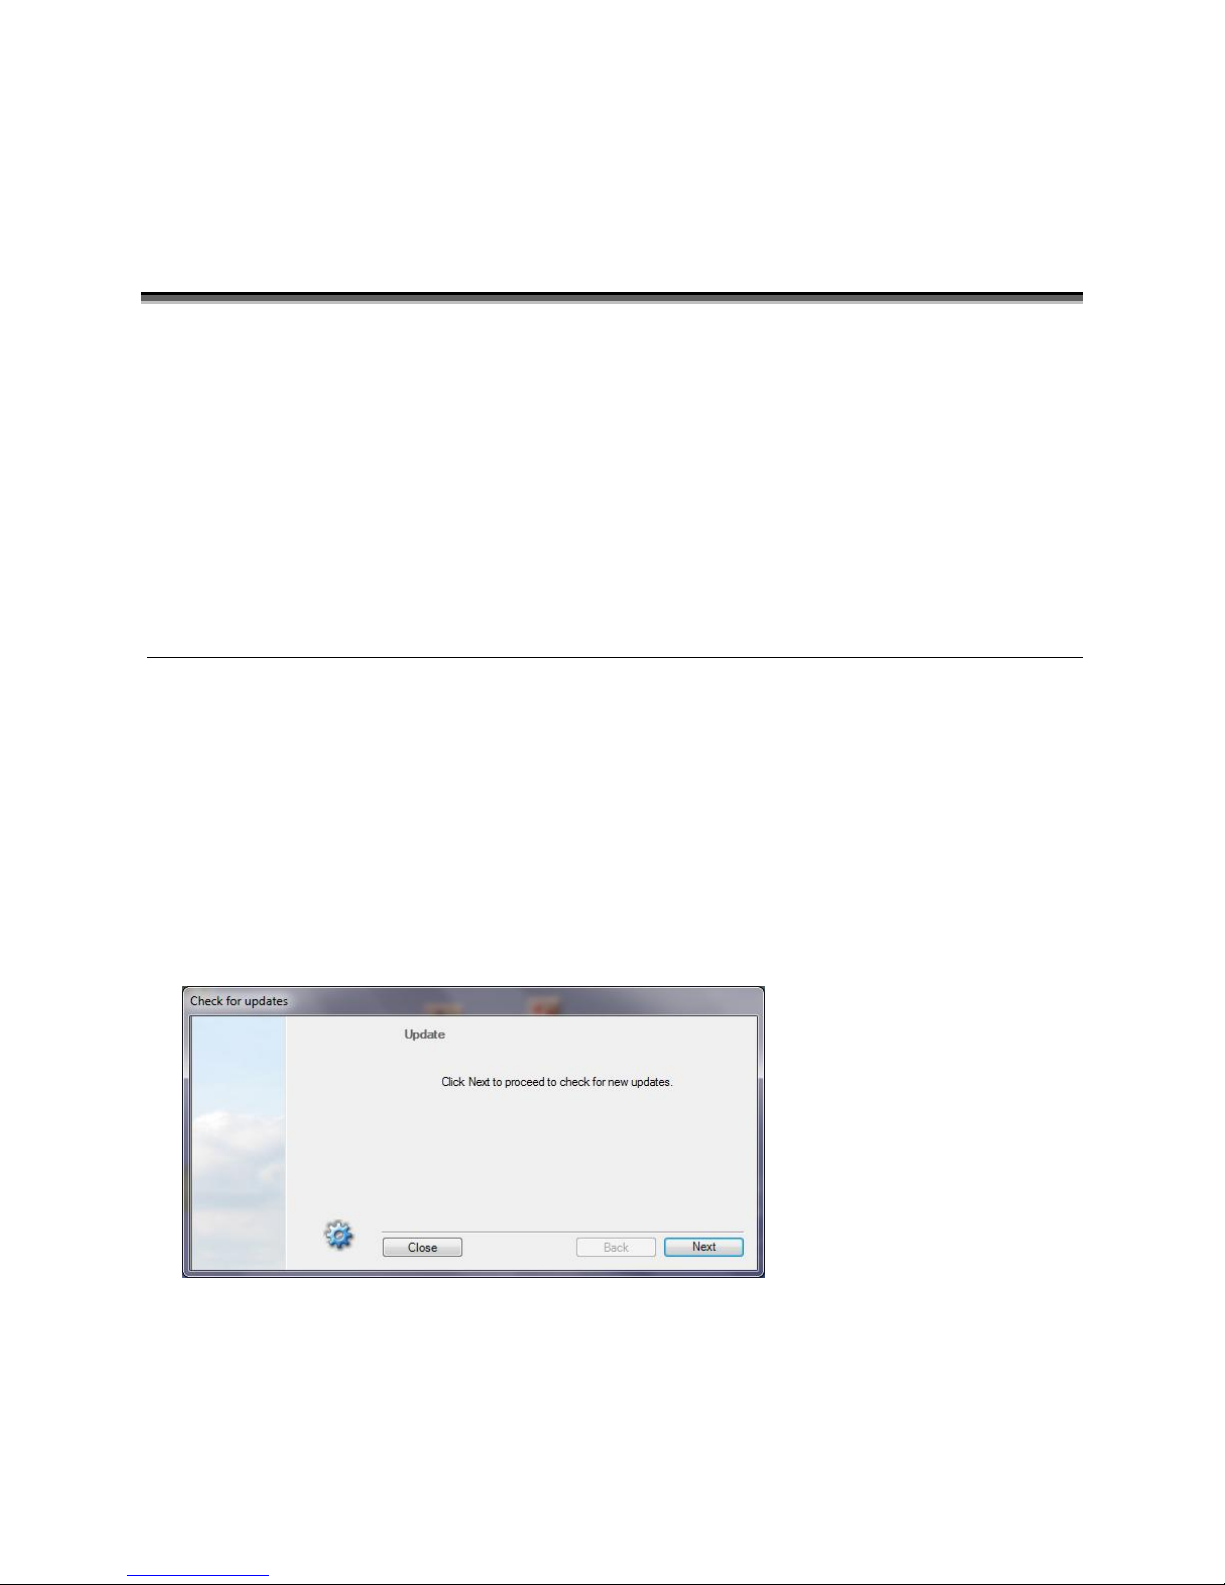
Chapter 6:
Updating DataSuite Software and
Firmware
DataSuite supports automatic software and firmware update whenever DataSuite is launched,
as long as the computer is connected to the Internet. The update process is managed by
Omega’s Uptodata client. This client checks for updated software and firmware files located on
the Omega server, and if any have been detected they are downloaded and updated on the
user’s computer. The user can also have DataSuite automatically update the network units’
firmware or can choose to do so manually.
OM-DAQLINK is also supported by an easy USB firmware update process.
In addition to automatic firmware update, the DataSuite user can also manually update the
firmware via the Firmware Update Center or from the Logger icon in Map View. Refer to the
relevant sections in this chapter for more details.
6.1. Using the Uptodata Client
Use the Uptodata client to perform automatic checks for updated DataSuite software module
and firmware versions, including updated versions of this OM-DAQLINK and DataSuite user
guide. Once downloaded, DataSuite software and logger firmware is automatically updated.
However, you also have the option to manually update firmware rather than automatically.
To use the Uptodata client follow the instructions below.
1. Ensure the computer is connected to the Internet and launch DataSuite.
2. Launch the Uptodata update client from the DataSuite main menu: Help > Check for
Updates.
3. You will be prompted to proceed to check for new updates. Click Next. The client will then
check for updates on the server, including updates to the Uptodata client itself.
Figure 45: Uptodata dialog
4. Once the check is complete, any new updates will be displayed in the Uptodata dialog.
Select the checkbox next to the file you wish to update and click Next.
85
Page 93
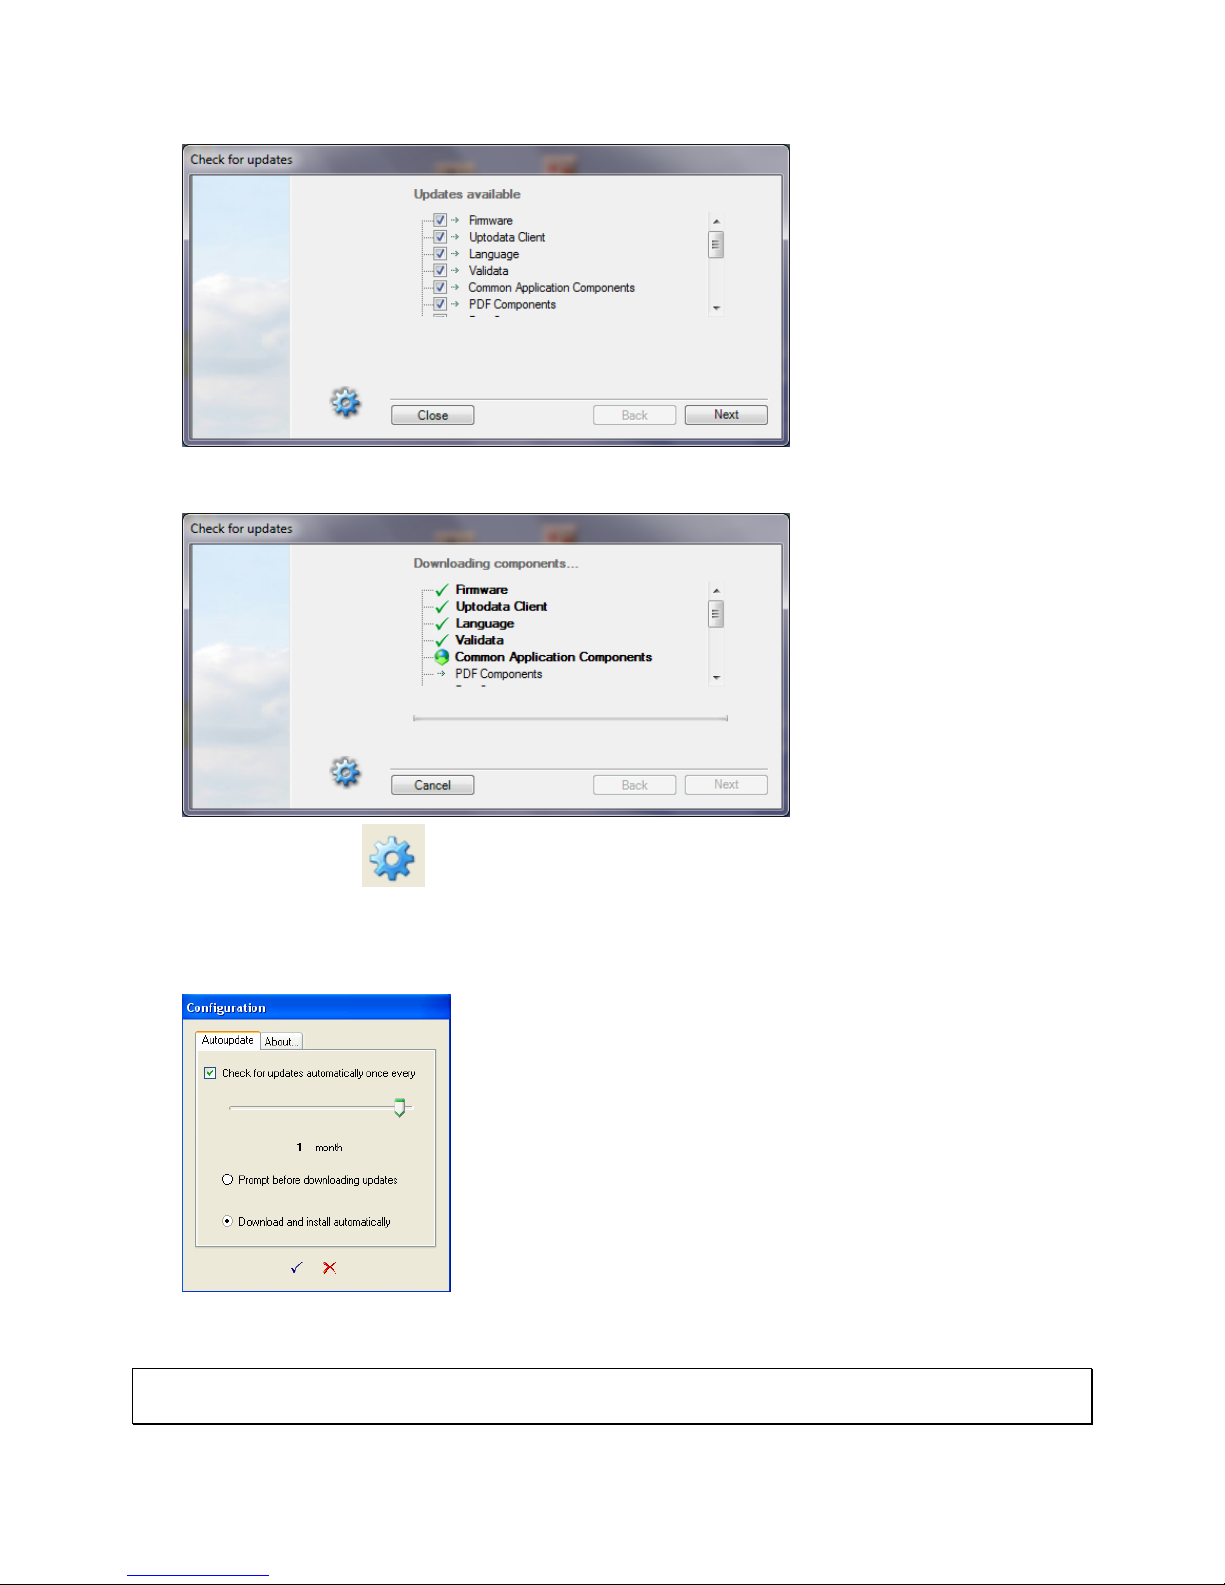
5. The files will be downloaded to your default application directory. Click Finish to close the
dialog once the download is complete.
6. Click the Options icon in the main Uptodata dialog for further options such as:
Checking for updates on startup (select Further Configurations menu item to modify
frequency of update checking)
Automatic firmware update on startup
Figure 46: Uptodata configuration dialog
Note: If the update was canceled for any reason and was not completed, none of the previous
installation files will be affected.
86
Page 94
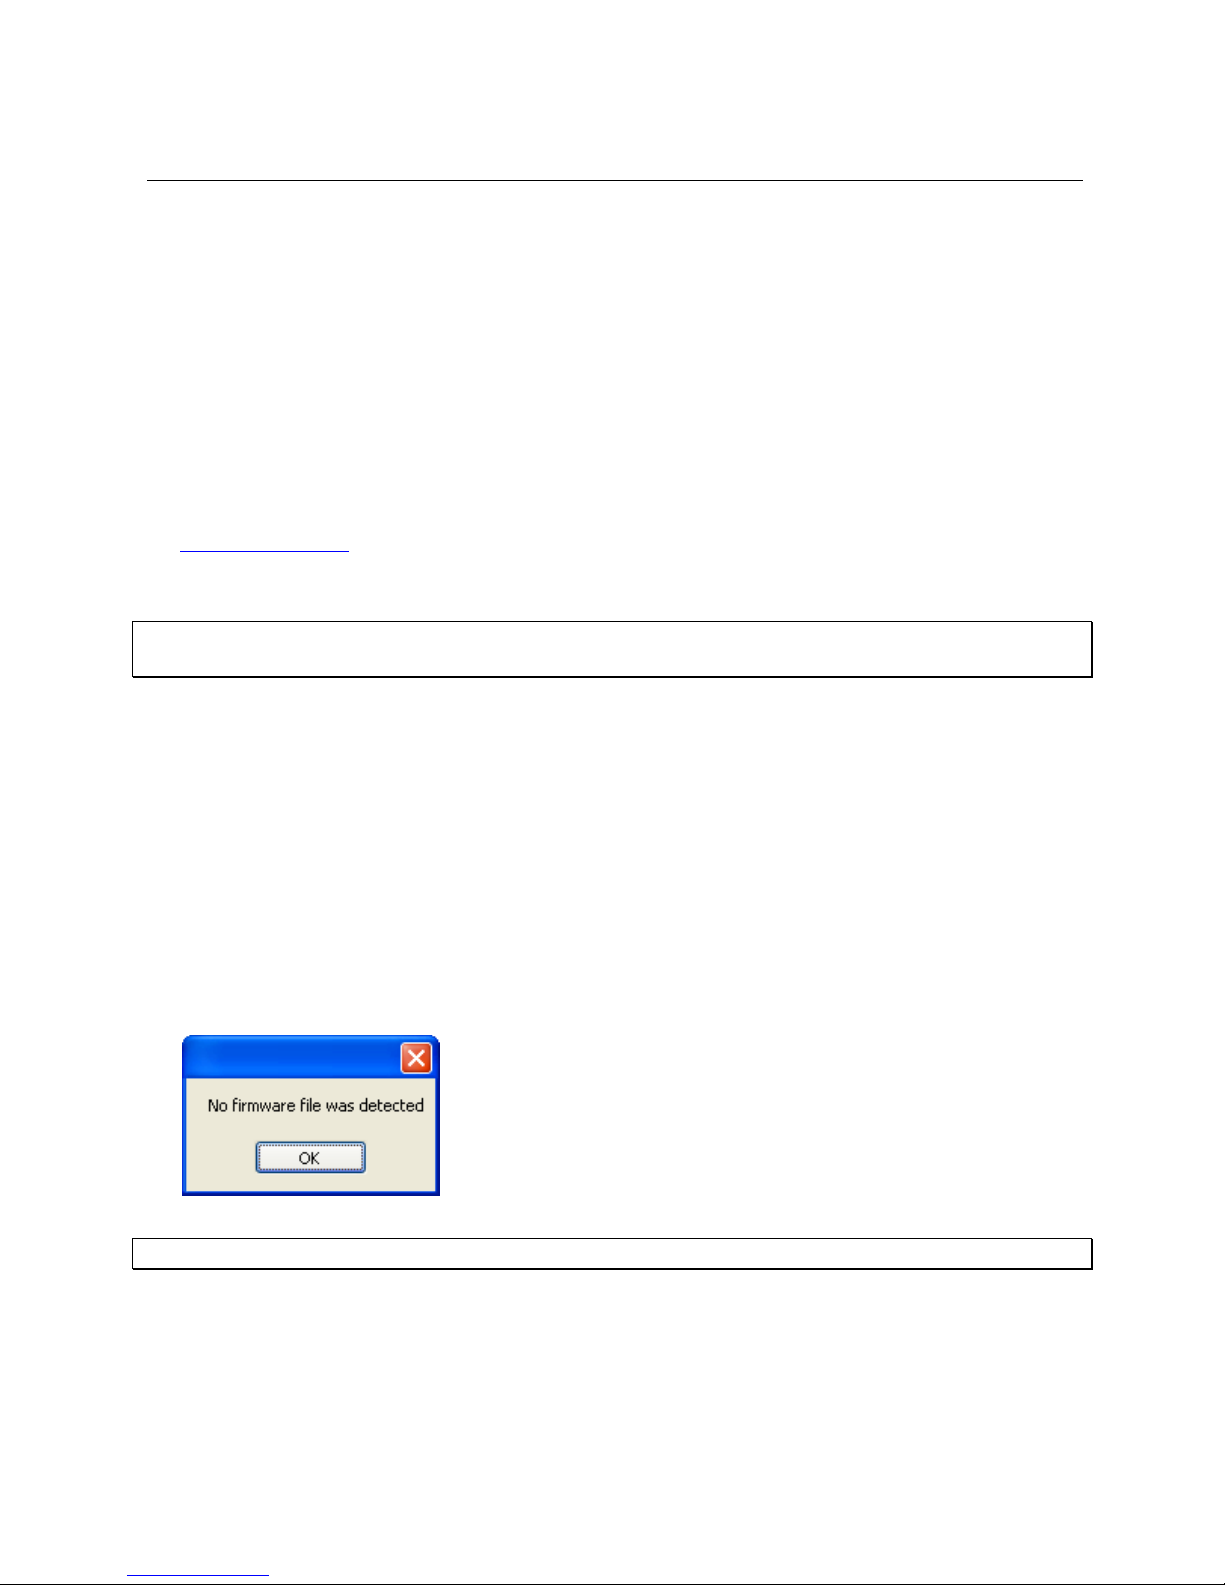
6.2. Updating Device Firmware
There are several ways to update firmware for your DataSuite supported hardware units.
Automatically, using the Uptodata client. Refer to section 6.1.
Manually using the Firmware Update Center. Refer to section 6.2.2.
Manually, using the context menu on the device icons in Map View.
6.2.1. Downloading the Firmware File
There are two ways to obtain the OM-DAQLINK firmware file.
1. Using the Uptodata client to download from the Omega server. Refer to section 6.1.
2. Downloading the latest firmware version directly from the Omega Download Center at
www.omega.com
3. Uptodata downloads the firmware file, named Firmware.dfw, to the DataSuite directory on
the computer. The default path is: C:\Program Files\Omega\DataSuite.
Note: The firmware file combines firmware for all DataSuite supported hardware units into one
file. There is no need to download separate files for each type of unit.
4. If you download the firmware file from the Omega Download Center make sure to copy the
file to the same path listed above.
Once the file is downloaded the next step is to update the units.
6.2.2. Using the Firmware Update Center
To launch the Firmware Update Center:
1. Once the downloaded firmware file is in the DataSuite directory, go to Tools > Firmware
Update Center from the main menu. Enter the password in the Password dialog to access
the Update Center.
2. If no firmware file is detected in the DataSuite directory, then an error message is displayed
and the Firmware Update Center opens with a blank screen.
3. Copy the firmware file to the directory and reopen the Firmware Update Center.
Note: The default password is 1234.
4. The Firmware Update Center dialog lists all units which were detected by the software and
displays pertinent information such as available firmware versions, firmware update status,
online/offline status and unit info.
87
Page 95
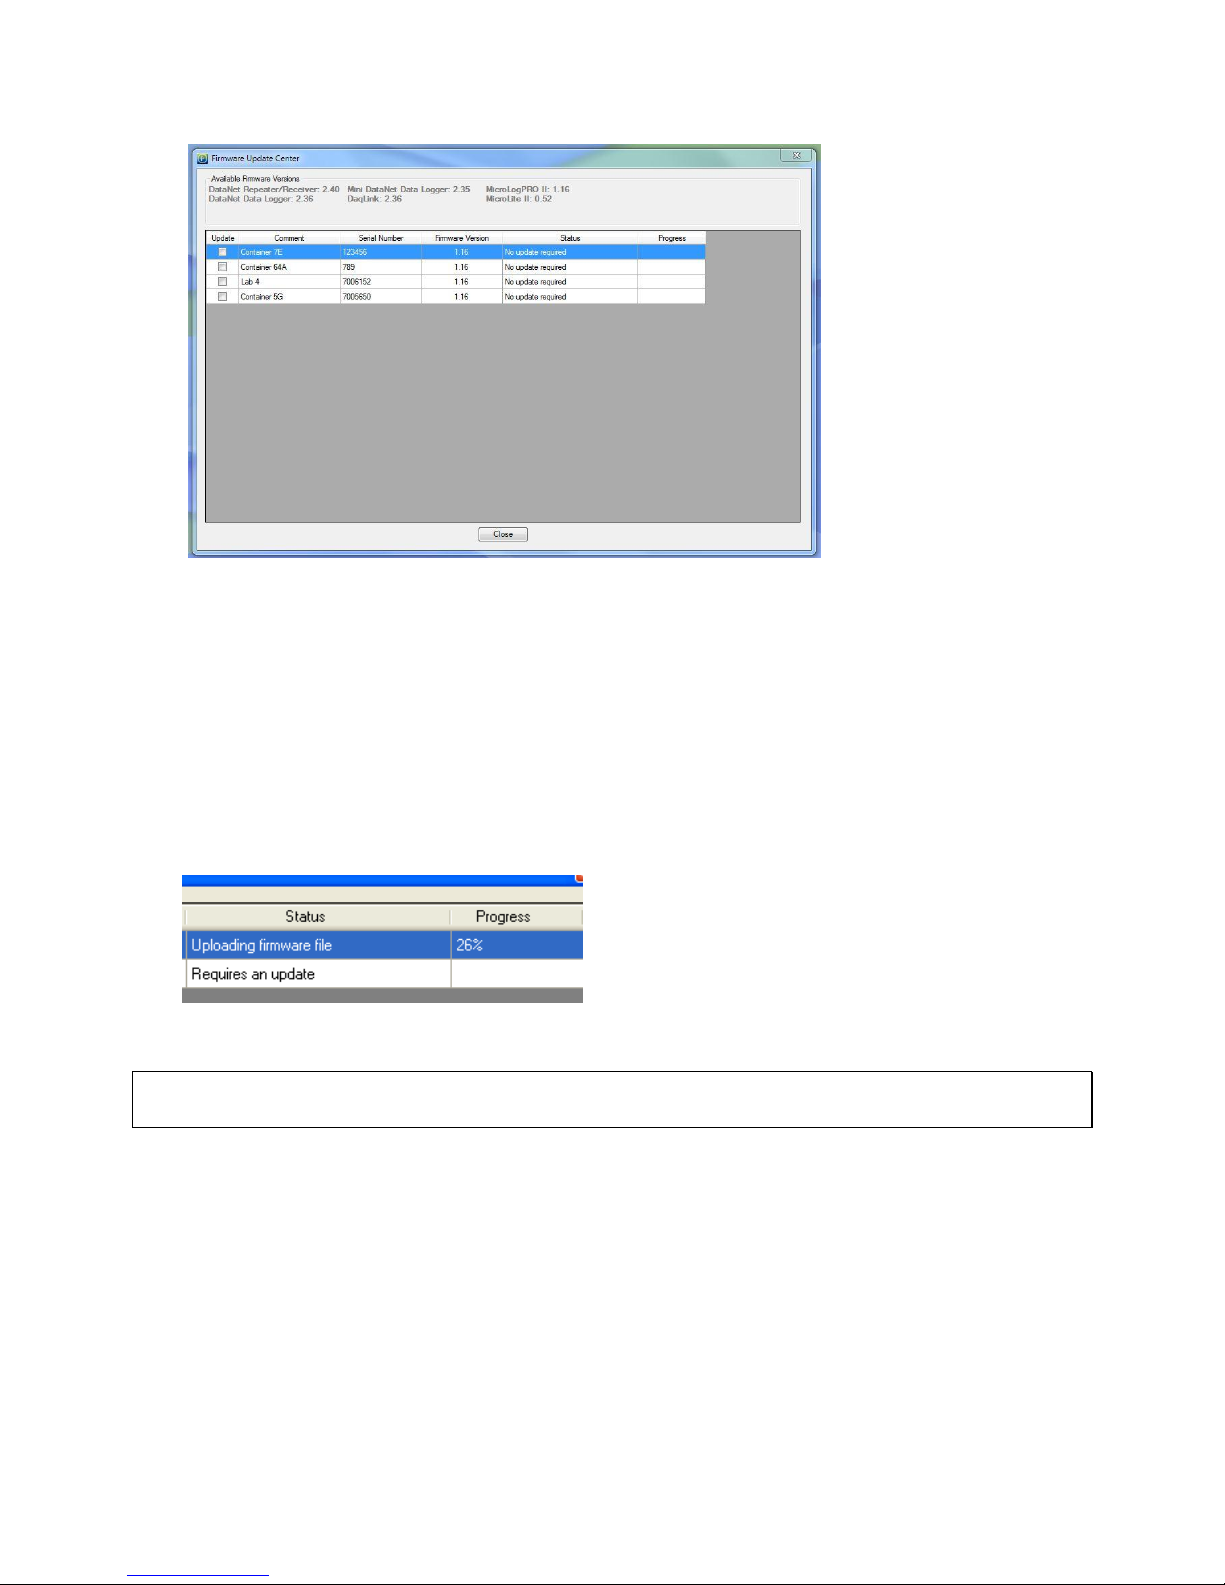
Figure 47: Firmware Update Center dialog
5. If the unit status is Requires an update, then select the checkbox in the Update column
adjacent to the unit you wish to update. You may select as many units as you like to update,
but only two units can be updated at a time.
6. As soon as you select the Update checkbox, the command will be sent to the unit to begin
uploading the firmware. The firmware is first uploaded to the unit’s memory and then
installed. Even if the update is stalled halfway due to the unit shutting down, for example, the
unit will not lose its current firmware and so will continue to be operable.
7. When the upload begins the Firmware Update Center status will change to Uploading
firmware file and the unit display will read Loading firmware. The progress will also be
displayed on both hardware and software.
8. When the upload is complete the unit will reset and the Firmware Update Center will display
the status No update required. The firmware version will be updated as well.
Note: You can quit the firmware update at any time by unselecting the Update checkbox in the
Update Center.
9. When the unit resets it will automatically reconnect via USB and will be in Stop mode.
However the unit configuration will still be saved. For loggers which have completed
firmware update, run the logger to start recording data again.
Checking Available Firmware Versions
1. Available firmware versions are displayed at the top of the Firmware Update Center dialog.
The information is taken from the firmware file Firmware.dfw stored in the DataSuite
directory. The same firmware file is used for all units.
88
Page 96
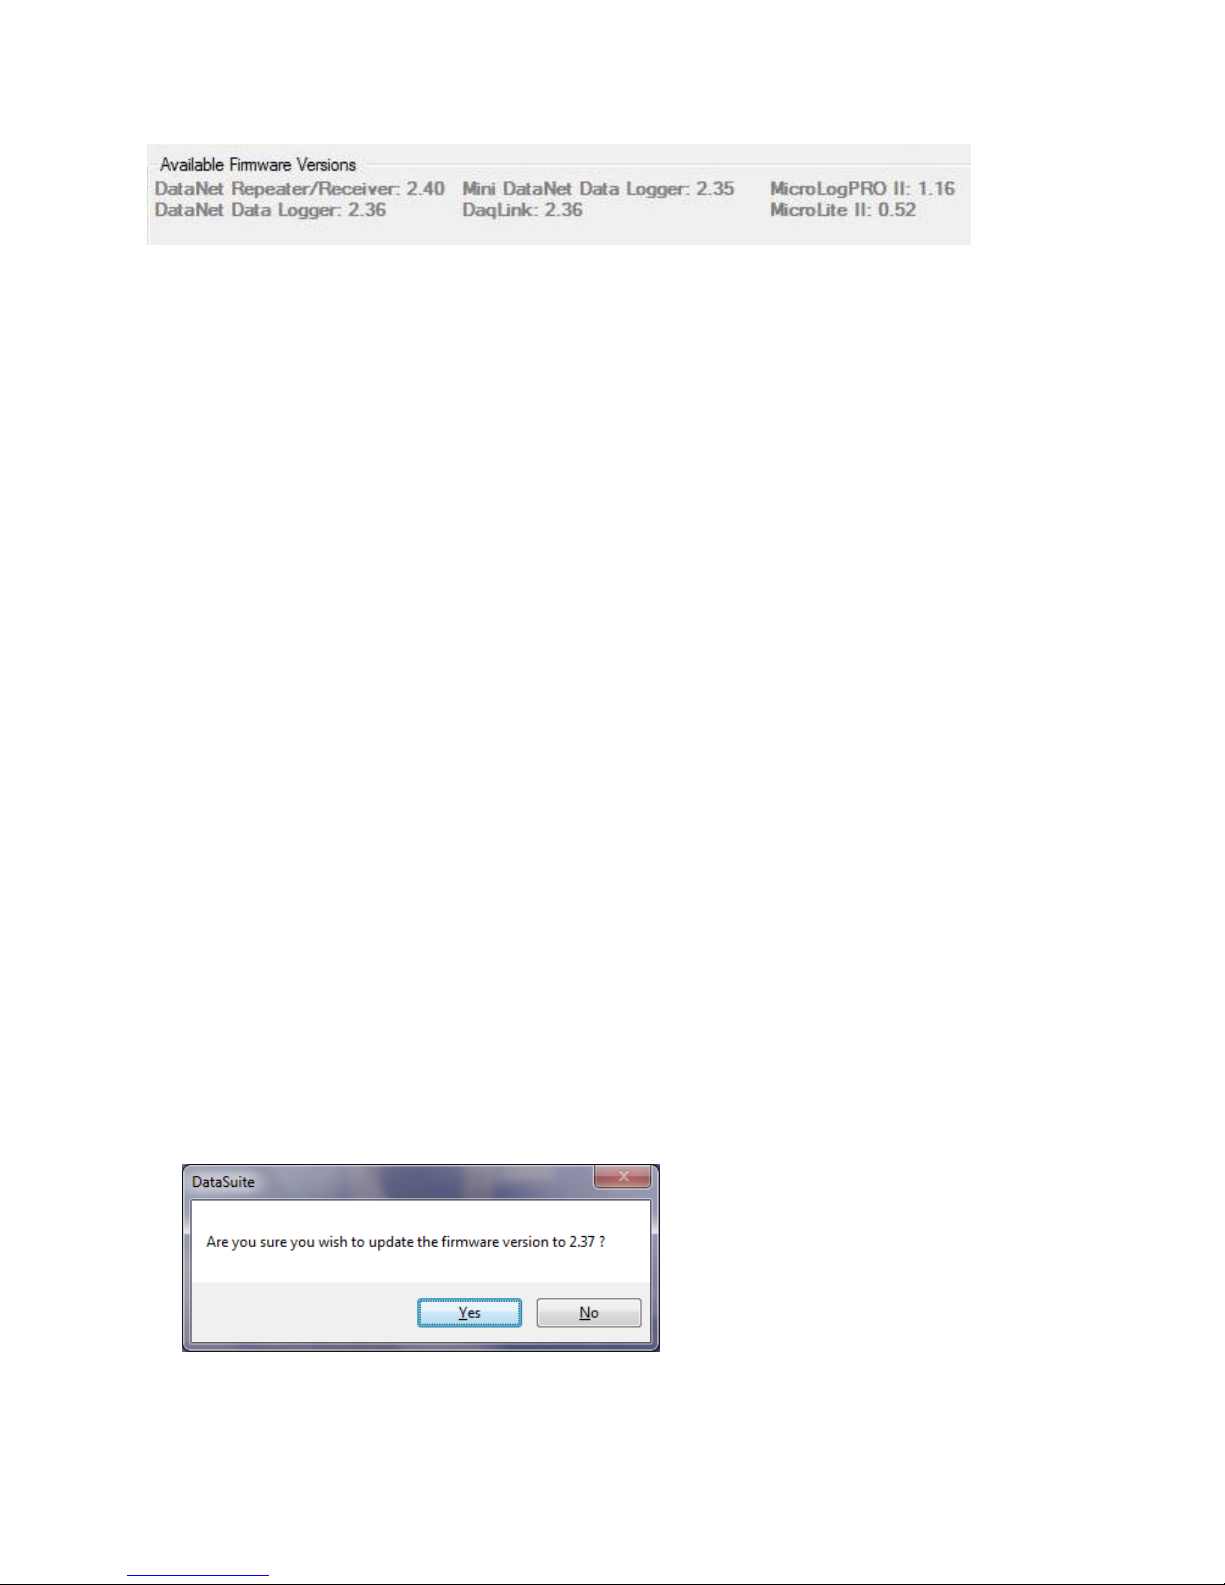
Unit Status Options
Offline – unit is offline and firmware status can’t be determined.
No update required – Unit has latest firmware installed.
Uploading firmware file – Firmware file is being uploaded to the unit. Progress is displayed
in percentages.
Updating firmware – Once firmware file is uploaded then the actual firmware update
begins, overwriting the existing firmware on the unit.
Downloading – Logger unit is first downloading all data before beginning the firmware
update.
Waiting to upload firmware – Unit is in a queue to upload the firmware, as the network can
update two units at a time.
Unit Information
Additional information provided in the Firmware Update Center includes:
The unit comment/name
Serial number
Current firmware version
Unit status
Update progress
6.2.3. Manual Firmware Update via Map View Icon
Each DataSuite supported device has the Update Firmware option in its Map View icon context
menu.
1. To perform a direct update from a specific unit, open the context menu and select Update
Firmware.
2. Enter the password in the Password dialog box.
3. Depending on the product model, a DataSuite system message may prompt you to confirm
the update. Click Yes.
4. The firmware will begin updating and you can monitor its progress in the unit’s tooltip.
89
Page 97
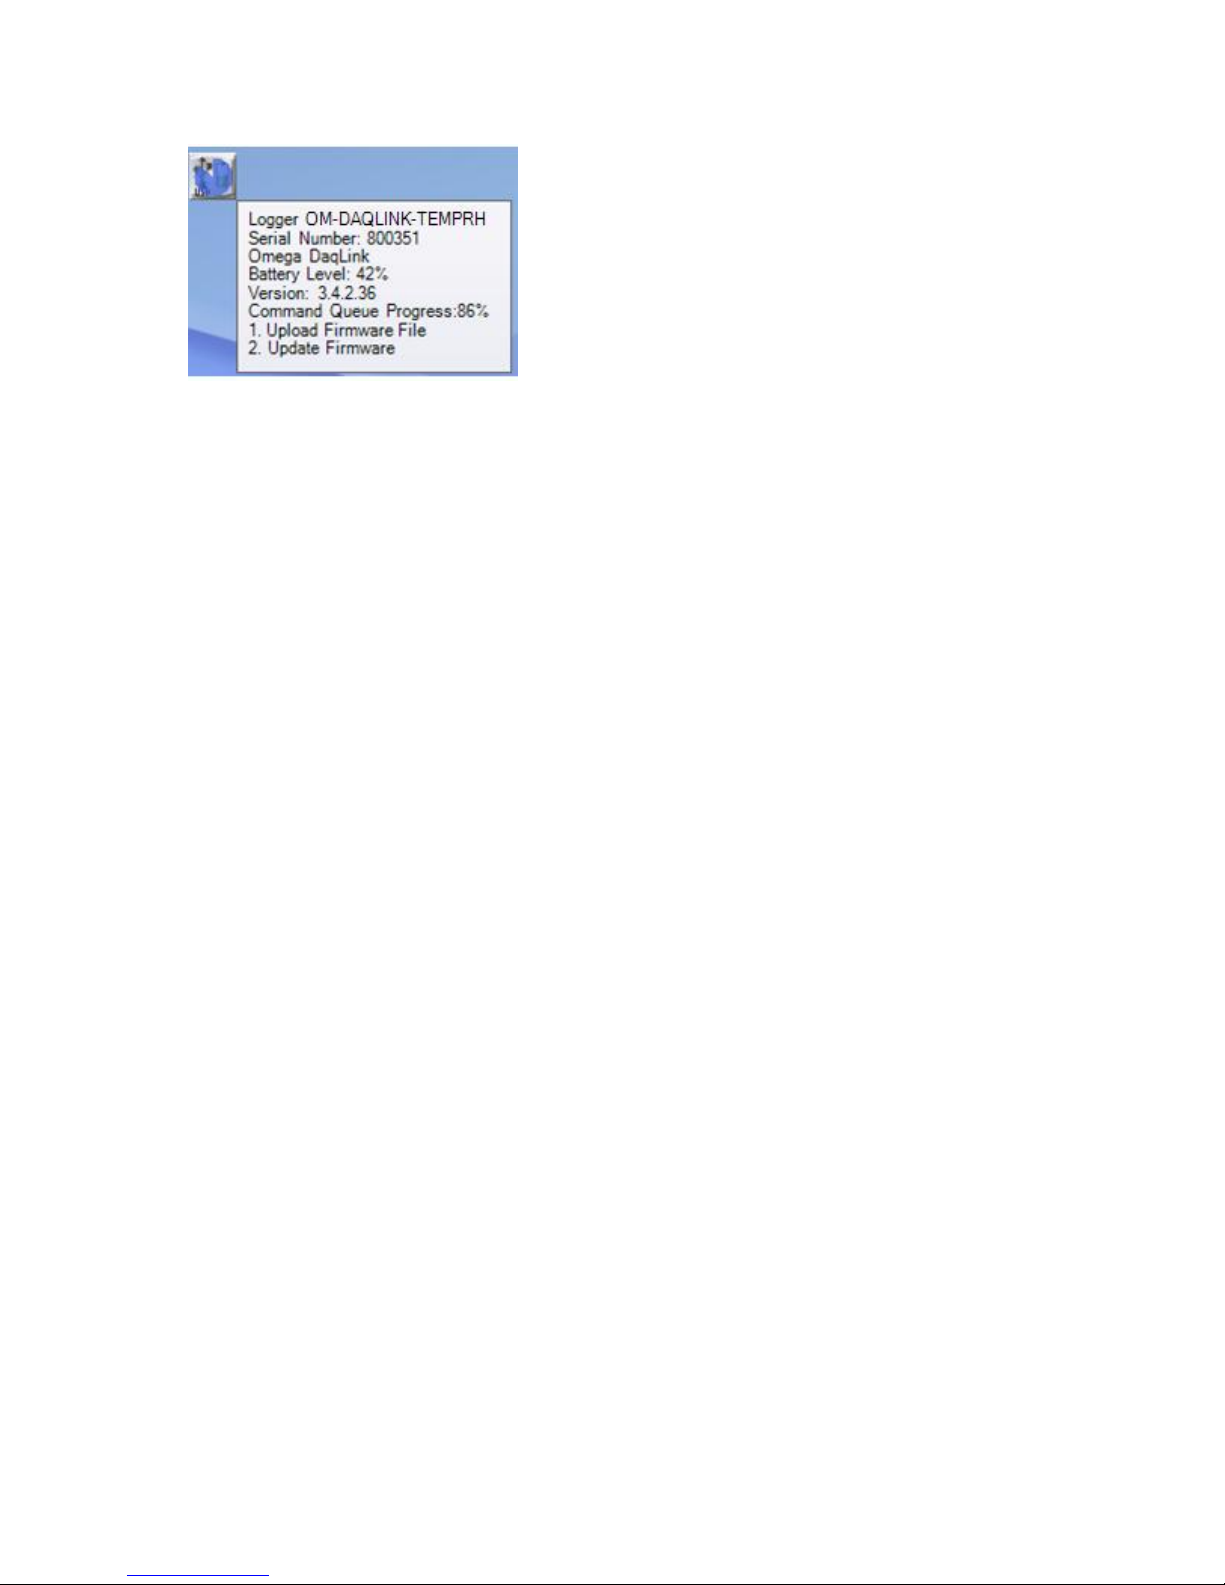
6.2.4. Cancelling Firmware Update
To cancel a firmware update, right-click the unit’s icon in the Map View and select the Cancel
Firmware Update option.
If a data logger was in Run mode prior to the firmware update, when cancelling it the logger will
resume operation in Stop mode.
6.2.5. Interrupted Firmware Update
There are several ways an in-progress firmware update may be interrupted:
Unselecting the checkbox next to the unit name in the Firmware Update Center
Disconnecting the USB from the device during USB firmware update
Exiting the DataSuite software
In each case, when the unit is back online the firmware update will automatically resume (from
the beginning of the update).
If a data logger’s firmware update was interrupted, and it was in Run mode prior to the update,
the logger will continue to run even after the interruption.
90
Page 98

OM-DAQLINK-TEMP and OM-DAQLINK-TEMPRH
External Inputs
Four external inputs with selectable sensor
type for each input:
4 to 20 mA
0 to 1 V
0 to 50 mV
PT-100 (2-wire)
Contact (Open/Closed)
Thermocouple J, K or T
Pulse counter (Input 4 only)
Frequency (Input 4 only)
User-defined sensors
Internal Inputs
OM-DAQLINK-TEMP
PT-100 Temperature
OM-DAQLINK-TEMPRH
Digital Temperature
Digital Relative Humidity
Appendix A:
OM-DAQLINK Specifications
A.1. Data Logger Input Types
91
Page 99
Alarm Output (Output 1)
External Power Excitation
(transducers usage)
Open collector
Close position resistance: 50 Ù
Max. Load: 50 mA, 3 V DC
12 VDC @ 2 A
Reset fuse overload protection
Internal PT-100
Temperature
(OM-DAQLINK-TEMP)
Internal Digital
Temperature
(OM-DAQLINK-TEMPRH)
Internal Digital
Relative Humidity
(OM-DAQLINK-TEMPRH)
Type: PT-100
Range: -20 to 50 ˚C
Resolution: 0.1 ˚C
Accuracy: ±0.3 ˚C
Type: Digital sensor
Range: -20 to 50 ˚C
Resolution: 0.1 ˚C
Accuracy: ±0.5 ˚C
Range: 5 to 95 %
Resolution: 0.5%
Accuracy:
3% (DataSuite software)
4% (Logger LCD)
Temperature
Thermocouple J
Temperature
Thermocouple K
Temperature
Thermocouple T
Range: -200 to 1,000 ˚C
Resolution: 0.1 ˚C
Accuracy:
-200 to – 60 ˚C ±0.5 %
-60 to 60 ˚C ±0.5 ˚C
60 to 1,000 ˚C ±0.5 %
Cold junction
compensation: ±0.3 ˚C
Range: -200 to 1,000 ˚C
Resolution: 0.1 ˚C
Accuracy:
-200 to – 60 ˚C ±0.5 %
-60 to 60 ˚C ±0.5 ˚C
60 to 1,000 ˚C ±0.5 %
Cold junction
compensation: ±0.3 ˚C
Range: -200 to 400 ˚C
Resolution: 0.1 ˚C
Accuracy:
-200 to – 60 ˚C ±0.5 %
-60 to 60 ˚C ±0.5 ˚C
60 to 400 ˚C ±0.5 %
Cold junction
compensation: ±0.3 ˚C
A.2. OM-DAQLINK-TEMP and OM-DAQLINK-TEMPRH
Outputs
A.3. Logger Input Specifications OM-DAQLINK-TEMP
and OM-DAQLINK-TEMPRH
92
Page 100
Temperature PT-100
(2-wire)
Pulse Counter
(Input 4 only)
Frequency
(Input 4 only)
Range: -200 to 400 ˚C
Resolution: 0.1 ˚C)
Accuracy:
-200 to - 60 ˚C ±0.5 %
-60 to 60 ˚C ±0.3 ˚C 60 to
400 ˚C ±0.5 %
Zero crossing detector
Range: 1 to 65,536 counts
Resolution: 1 count
Frequency range: 0 to 4
KHz
Input signal: 0 to 5 V
Input impedance: 470 Ù
Zero crossing detector
Range: 20 Hz to 4 KHz
Input signal: 0 to 5 V
Input impedance: 470 Ù
4 to 20 mA
0 to 1 V
0 to 50 mV
Range: 4 to 20 mA
Resolution: 4.76 ìA
Accuracy: ±0.5 %
Loop impedance: 21 Ù
Range: 0 to 1 V
Resolution: 200 ìV
Accuracy: ±0.5 %
Input impedance: 25 MÙ
Maximum voltage: 5.2 V
Range: 0 to 50 mV
Resolution: 3 ìV
Accuracy: ±0.5 %
Input impedance: 25 MÙ
Maximum voltage: 5.2 V
Contact
Range: Open/Close
A.4. General Specifications
OM-DAQLINK Logger Sampling Features
Memory capacity: ~38,000 samples in Online Mode
~59,000 samples in Optimized Memory Mode
Sampling rate: Once per sec to once every 18 hours
Sampling resolution: 16-bit
Channel separation: 80 dB
OM-DAQLINK-TEMP and OM-DAQLINK-TEMPRH Hardware Specifications
Display
2-row LCD
16 character display
Power Supply
Battery:
Internal rechargeable 4.8 V, 800 mAh NiMH battery (2 batteries in series)
Built-in battery charger
Battery Life: Up to six months depending on logger configuration
93
 Loading...