

Page 1

August 2002
OMB-CHARTSCAN-1400
Portable Data Recorder
OMB-483-0901
p/n
3.1
Rev
Page 2

OMEGAnetSM On-Line Service
http://www.omega.com
Servicing North America:
Internet e-mail
info@omega.com
USA:
Canada:
One Omega Drive, Box 4047
Stamford, CT 06907-0047
Tel: (203) 359-1660
e-mail: info@omega.com
976 Berger
Laval (Quebec) H7L 5A1
Tel: (514) 856-6928
e-mail: canada@omega.com
FAX: (203) 359-7700
FAX: (514) 856-6886
For immediate technical or application assistance:
USA and Canada:
Mexico and
Latin America:
Sales Service: 1-800-826-6342 / 1-800-TC-OMEGA
Customer Service: 1-800-622-2378 / 1-800-622-BEST
Engineering Service: 1-800-872-9436 / 1-800-USA-WHEN
TELEX: 996404 EASYLINK: 62968934 CABLE: OMEGA
Tel: (95) 800-TC-OMEGA
En Espanol: (95) 203-359-7803
SM
FAX: (95) 203-359-7807
e-mail: espanol@omega.com
SM
SM
SM
Servicing Europe:
Benelux:
Czech Republic:
France:
Germany/Austria:
United Kingdom:
It is the policy of OMEGA to comply with all worldwide safety and EMC/EMI regulations that
apply. OMEGA is constantly pursuing certification of its products to the European New Approach
Directives. OMEGA will add the CE mark to every appropriate device upon certification.
The information contained in this document is believed to be correct but OMEGA Engineering, Inc. accepts
no liability for any errors it contains, and reserves the right to alter specifications without notice.
WARNING:
These products are not designed for use in, and should not be used for, patient-connected applications.
Postbus 8034, 1180 LA Amstelveen, The Netherlands
Tel: (31) 20 6418405
Toll Free in Benelux: 06 0993344
e-mail: nl@omega.com
ul. Rude armady 1868
733 01 Karvina-Hranice
Tel: 420 (69) 6311899
e-mail:czech@omega.com
9, rue Denis Papin, 78190 Trappes
Tel: (33) 130-621-400
Toll Free in France: 0800-4-06342
e-mail: france@omega.com
Daimlerstrasse 26, D-75392 Deckenpfronn, Germany
Tel: 49 (07056) 3017
Toll Free in Germany: 0130 11 21 66
e-mail: germany@omega.com
25 Swannington Road,
Broughton Astley, Leicestershire,
LE9 6TU, England
Tel: 44 (1455) 285520
FAX: 44 (1455) 283912
Toll Free in England: 0800-488-488
e-mail: uk@omega.com
FAX: (31) 20 6434643
FAX: 420 (69) 6311114
FAX: (33) 130-699-120
FAX: 49 (07056) 8540
P.O. Box 7, Omega Drive,
Irlam, Manchester,
M44 5EX, England
Tel: 44 (161) 777-6611
FAX: 44 (161) 777-6622
Page 3

How To Use This Manual
Chapter 1: ChartScan
up and running. The chapter includes installation steps, basic concepts regarding the ChartView software
program, and a ChartView tutorial to quickly familiarize you with the software.
Chapter 2: General Information gives a general description of ChartScan and related hardware including
ChartScan’s expansion module and available signal conditioning cards.
Chapter 3: Hardware provides detailed information pertaining to ChartScan’s front and rear panels, voltage selector
switch, memory expansion, communication interfaces, digital I/O lines, external TTL connectors, signal
conditioning modules, CSN/Exp expansion chassis (option), and high current CSN/relay card (option).
Chapter 4: ChartView Software Reference explains the ready-to-use ChartView software that comes with every
ChartScan unit. Topics include detailed explanations of the program’s pull-down menus, toolbar icons, and
keypad control options. Additional features available through ChartView Plus are included.
Chapter 5: eZ-PostView and ViewXL - eZ-PostView is a time-domain post-acquisition data viewing application.
ViewXL is a Microsoft Excel Add-In. This chapter provides a brief overview of both applications and
references the actual user documentation that is included on your installation CD.
Chapter 6: Calibration explains how to use ScanCal, a software-automated method of calibration, as well as how to
manually calibrate the master chassis and option cards.
Unit Startup and ChartView Tutorial provides information to get your ChartScan system
Appendices
The Appendices provide programming-related information that is not necessary for ChartView users. Appendices
are as follows:
Appendix A: API Commands describes the entire command set for ChartScan. Syntax, parameters, interpretation,
and error codes are explained. Sections on the individual commands include their parameters, types, typical use,
related information, and a sample program excerpt.
Appendix B: Configuration Aspects for Programmers provides information on memory allocation, channel and
scan configuration, triggers, alarms, and digital I/O operation.
Appendix C: Registers, Data Formats, & Queries provides information regarding registers, data formats, status and
event reporting, and other operation-related factors.
Appendix D: ChartScan Program Examples explains the program examples which are supplied on the release disk.
Typical tasks are covered including various kinds of data acquisition and alarm control.
Appendix E: Bus States, Bus Lines, and Data Transfer Aspects provides reference material regarding bus states,
bus lines and data transfer (DIO) lines in relation to IEEE 488 and Serial Interfaces.
Appendix F: ASCII Code Summary summarizes ASCCII control codes and character codes.
Appendix G: ChartScan Error Messages lists and describes error codes pertaining to ChartScan.
Appendix H: Abbreviations
CAUTION
CAUTION
CAUTIONCAUTION
If equipment is used in any manner not specified in this manual, or if specification limits are
exceeded, the function of the equipment, as well as the protection provided by it, may be
impaired.
ChartScan User’s Manual
Page 4

Table of Contents
1 ChartScan-
Unit Startup & ChartView Tutorial
Overview…… 1-1
Unit Startup……1-2
Inspect Your System……1-2
Install Software……1-2
Check and Install Hardware……1-3
Verify Voltage Setting……1-3
Verify DIP Switch Setting……1-3
Install Signal Conditioning Card(s)……1-3
Install Interface Communications Card (option)… 1-4
Connect Expansion Chassis (option)……1-4
Connect ChartScan to your computer……1-4
Apply power to ChartScan…… 1-5
Connect Channel Signal Inputs……1-5
Start ChartView, Configure System, and Collect
Data……1-7
ChartView, Basic Concepts……1-10
Configuration Files……1-10
Understanding Groups, Charts, and
Channels……1-10
Three Ways of Using ChartView……1-11
ChartView Tutorial……1-11
2 General Information
General Description……2-1
Operational Aspects……2-2
Data Handling and Triggering……2-2
Software and Hardware……2-3
ChartScan Specifications……2-3
3 Hardware
Overview ……3-1
Front Panel ……3-1
Rear Panel ……3-2
Power Aspects ……3-3
Changing the Voltage Setting ……3-3
Replacing the AC Power Supply Fuse ……3-4
Memory Configuration ……3-4
Expanded Memory Options ……3-4
Calibration Memory Write Enable/Disable ……3-6
RS-232/422 Interface Configuration ……3-6
Configuring RS-322/422 Parameters …… 3-6
Serial Port Pin Connectors ……3-8
Ethernet Interface Configuration ……3-9
IEEE 488 Configuration (Option) ……3-11
Digital I/O Lines ……3-13
Logic Levels ……3-13
Digital I/O Port Pinout ……3-13
External TTL BNC Connectors ……3-14
Signal Conditioning Cards ……3-14
CSN14/TC/P Thermocouple and Low Volts Card
with Subminiature Plugs ……3-15
CSN14/LV/ (T, B, & S) Low Voltage Cards …3-17
CSN14/HV/S High Voltage Card with Safety Jack
Connectors ……3-18
CSN/Relay Card
(for High-Current Digital-Output) ……3-19
CSN/Relay Card Specifications……3-20
Expansion Chassis, CSN/Exp (Option) ……3-20
Connecting the Expansion Chassis ……3-20
Automatic Channel Assignment ……3-22
4 ChartView Software Reference
Overview ……4-1
Groups, Charts, & Channels ……4-2
Three Ways of Using ChartView ……4-2
What ChartView and ChartView Plus Provide …4-3
Main Window ……4-4
Channel Information Region ……4-6
Status Indicator Region ……4-7
Main Window Toolbar ……4-8
Group Select ……4-8
Start, Pause, and Stop Charts ……4-8
Scroll Faster & Scroll Slower ……4-8
Display Configuration ……4-9
Channel Configuration ……4-15
PostView post-acq data viewer ……4-15
Arm Acquisition ……4-15
Disarm ……4-15
Print Charts ……4-16
Main Window Pull-Down Menus ……4-16
Bar Graph, Analog, and Digital Meters ……4-27
Overview ……4-27
Bar Graph Meters ……4-28
Analog Meters ……4-29
Digital Meters ……4-30
Meter Toolbars ……4-31
Meter Pull-Down Menus ……4-31
Meters Configuration Menu ……4-32
Setup Window ……4-33
Channel & Alarm Setup Dialog Box ……4-33
Channel Configuration Columns ……4-35
Alarm Configuration Columns ……4-36
Acquisition Setup Dialog Box ……4-36
Burst Mode, Operational Issues ……4-39
Measuring AC Voltage, or AC RMS Voltage……4-40
Data Destination Dialog Box ……4-42
Data Destination ……4-42
Auto Re-arm (ChartView Plus only) ……4-42
Why use Auto Re-arm? ……4-43
Disabling Auto Re-arm ……4-43
Chart Setup Wizard ……4-44
Introduction ……4-44
Automatic Chart Setup with Wizard ……4-45
Bypassing Automatic Chart Setup ……4-46
ii ChartScan User’s Manual
Page 5

5 eZ-PostView and ViewXL
6 Calibration
Introduction ……6-1
Calibration Setup ……6-1
Non-Volatile Storage of
Calibration Constants ……6-1
Hardware Protected RAM ……6-2
ScanCal Software Application ……6-3
ScanCal’s Main Window ……6-3
Using ScanCal ……6-3
Interface Parameters
System Inventory
Calibration
Calibration Without ScanCal ……6-5
Password ……6-5
Calibration Mode Indicator ……6-5
Command Active Indicators ……6-5
Manual Calibration of Main Unit ……6-6
Offset Calibration of Main Unit ……6-6
Gain Calibration of Main Unit ……6-8
Manual Calibration of
Signal Conditioning Cards ……6-10
Offset Calibration of Cards ……6-10
Gain Calibration of Low Volts Cards ……6-12
Gain Calibration of High Volts Card ……6-15
Cold Junction Calibration ……6-17
Appendices
Appendix A
Appendix B
Appendix C
Appendix D
Appendix E
Appendix F
Appendix G
Appendix H
API Commands
Configuration Aspects for
Programmers
Registers, Data Formats, & Queries
ChartScan Program Examples
Bus States, Bus Lines, and Data
Transfer Aspects
ASCII Code Summary
ChartScan Error Messages
Abbreviations
ChartScan User’s Manual
08-09-02
iii
Page 6

iv ChartScan User’s Manual
Page 7
ChartScan Unit Startup and ChartView Tutorial 1
Overview…… 1-1
Unit Startup……1-2
Inspect Your System……1-2
Install Software……1-2
Check and Install Hardware……1-3
Verify Voltage Setting……1-3
Verify DIP Switch Setting……1-3
Install Signal Conditioning Card(s)……1-3
Install Interface Communications Card (option)…… 1-4
Connect Expansion Chassis (option)……1-4
!
Connect ChartScan to your computer……1-4
Apply power to ChartScan…… 1-5
Connect Channel Signal Inputs……1-5
Start ChartView, Configure System, and Collect Data……1-7
ChartView, Basic Concepts……1-10
Configuration Files……1-10
Understanding Groups, Charts, and Channels……1-10
Three Ways of Using ChartView……1-11
ChartView Tutorial……1-11
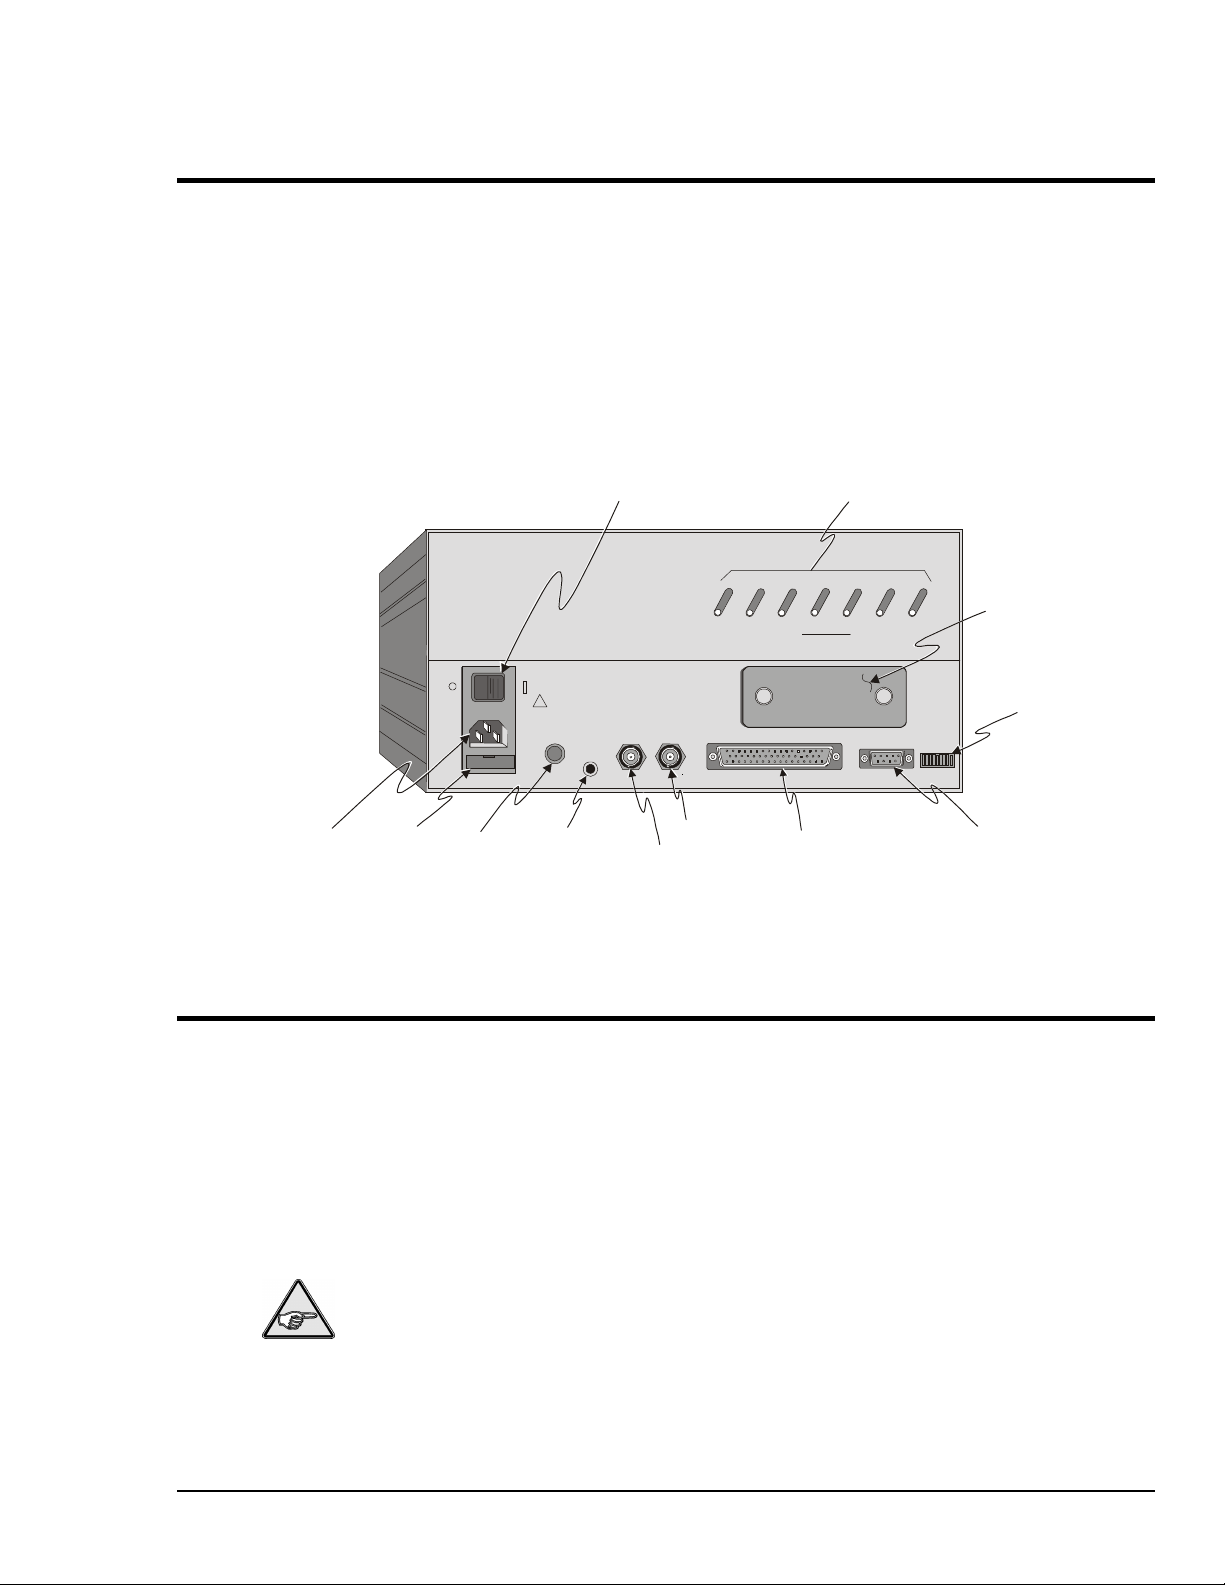
Power Switch
TRIGGER
OUTPUT
IN
TRIGGER SCAN
ALARM
TTL
ALARMS AND DIG ITAL I/O
LED Indicators
SERIAL
Interface
ERROR POWERSEND RECEIVE
RS-232
Card Slot
DIP Switch
Overview
Note: If you used the ChartScan Quick Start document (483-0940) to startup your unit, you may choose to
Note: Chapter 3, Hardware Setup, contains detailed information pertaining to hardware issues.
This chapter provides the steps to connect, power up, and run ChartScan. Although there are many ways to
configure ChartScan, this Startup is intended for a simple setup. In addition to the following steps, this chapter
includes a section on basic concepts and a ChartView tutorial. These are provided to help you gain a better
understanding of the ChartView program.
Power
Connector
Fuse
Holder
Chassis
Ground
Calibration
Enable/Disable*
TTL Output
Trigger In
Alarms & Digital I/O
(DB50) Connector
RS-232 (DB9)
Connector
ChartScan Rear Panel
*Note: Early production ChartScan units do not have a Calibration Enable/Disable Pushbutton; but
make use of a micro switch as discussed elsewhere in this manual.
skip this chapter; or you may wish to run through the ChartView tutorial which begins on page 1-11.
Reference Note: If you plan to connect your ChartScan to a network through a Net232
Ethernet/RS-232 converter, refer to the Net232 User’s Guide, part no. 1037-0901.
ChartScan User’s Manual,
1-5-99
1-1
Page 8

The basic Startup Steps are:
1. Inspect Your System
2. Install Software
3. Check and Install Hardware
a. Verify Correct Voltage Setting
b. Verify Correct DIP Switch Setting
c. Install Signal Conditioning Card(s)
d. Install Interface Communications Card (option)
e. Connect Expansion Chassis (option)
4. Connect ChartScan to Your Computer
5. Apply power to ChartScan
6. Connect Channel Inputs
7. Start ChartView, Configure System, and Collect Data
Unit Startup
1. Inspect Your System
If you have not already done so, carefully unpack your shipping carton and check all contents for
damage that may have occurred during shipment. Immediately report all damage to the shipping agent
and your sales representative. Retain all shipping materials in case the unit must be returned to the
factory.
Each ChartScan is shipped with the following:
ChartScan Portable Data Recorder
-----------------483-0940
483-0901
483-0601 Disks (or CD-ROM) in IBM format, includes ChartView Software
CN-18-50 DB50 Digital I/O Mating Connector
CA-1 Power Cable
FU-1-.5 1/2A, 250V, Slo Blo, 3AG for 105 - 125V power line or
FU-1-.25 1/4A, 250V, Slo Blo, 3AG for 210 - 250V power line
Signal Conditioning Card(s) pre-installed per customer order
ChartScan Quick Start Sheet
ChartScan User’s Manual
2. Install Software
For successful operation your computer should conform to the following, as a minimum:
•
PC system with Pentium processor is required
• Windows 3.1+, Windows 95, or Windows 98
•
8 Mbytes of RAM for Windows 3.1+ (16 Mbytes recommended)
•
16 Mbytes of Ram for Win95/98 (32 Mbytes recommended)
• For Net232 users, the PC requires a 10BASE-T ethernet card.
Use Microsoft Windows Run dialog box to install ChartView. Direct Windows to run the
SETUP.EXE file found on Installation Diskette 1,or Installation CD, as applicable. Follow the onscreen dialog boxes to complete a successful installation.
If you ordered ChartViewNET or ChartViewPlus, have your registration ID sheets at
hand so you can enter your registration numbers when prompted by the installation
utility.
The ChartView program group includes the following:
PostView Readme ChartView
PostView Help ScanCal Uninstall ChartView Version x.x
Note: Once the software has been installed, you can run through the ChartView tutorial. The tutorial
makes use of a Simulated Instrument Mode and does not require any hardware hook-up.
1-2 ChartScan – Unit Startup and ChartView Tutorial ChartScan User’s Manual
Page 9
3. Check and Install Hardware
Depending on your order, your ChartScan unit may not require all the steps under this heading. If a
step does not apply to your unit, simply go on to the next one.
a) Verify Voltage Setting
Based on your order, your ChartScan system was set at the voltage indicated on the sticker (located on
the rear of the unit, near the power switch). Verify that the voltage value indicated on the sticker
matches the voltage of your intended AC power supply. If you need to change the voltage selection for
any reason, refer to Chapter 3, Power Aspects, Changing the Voltage Setting.
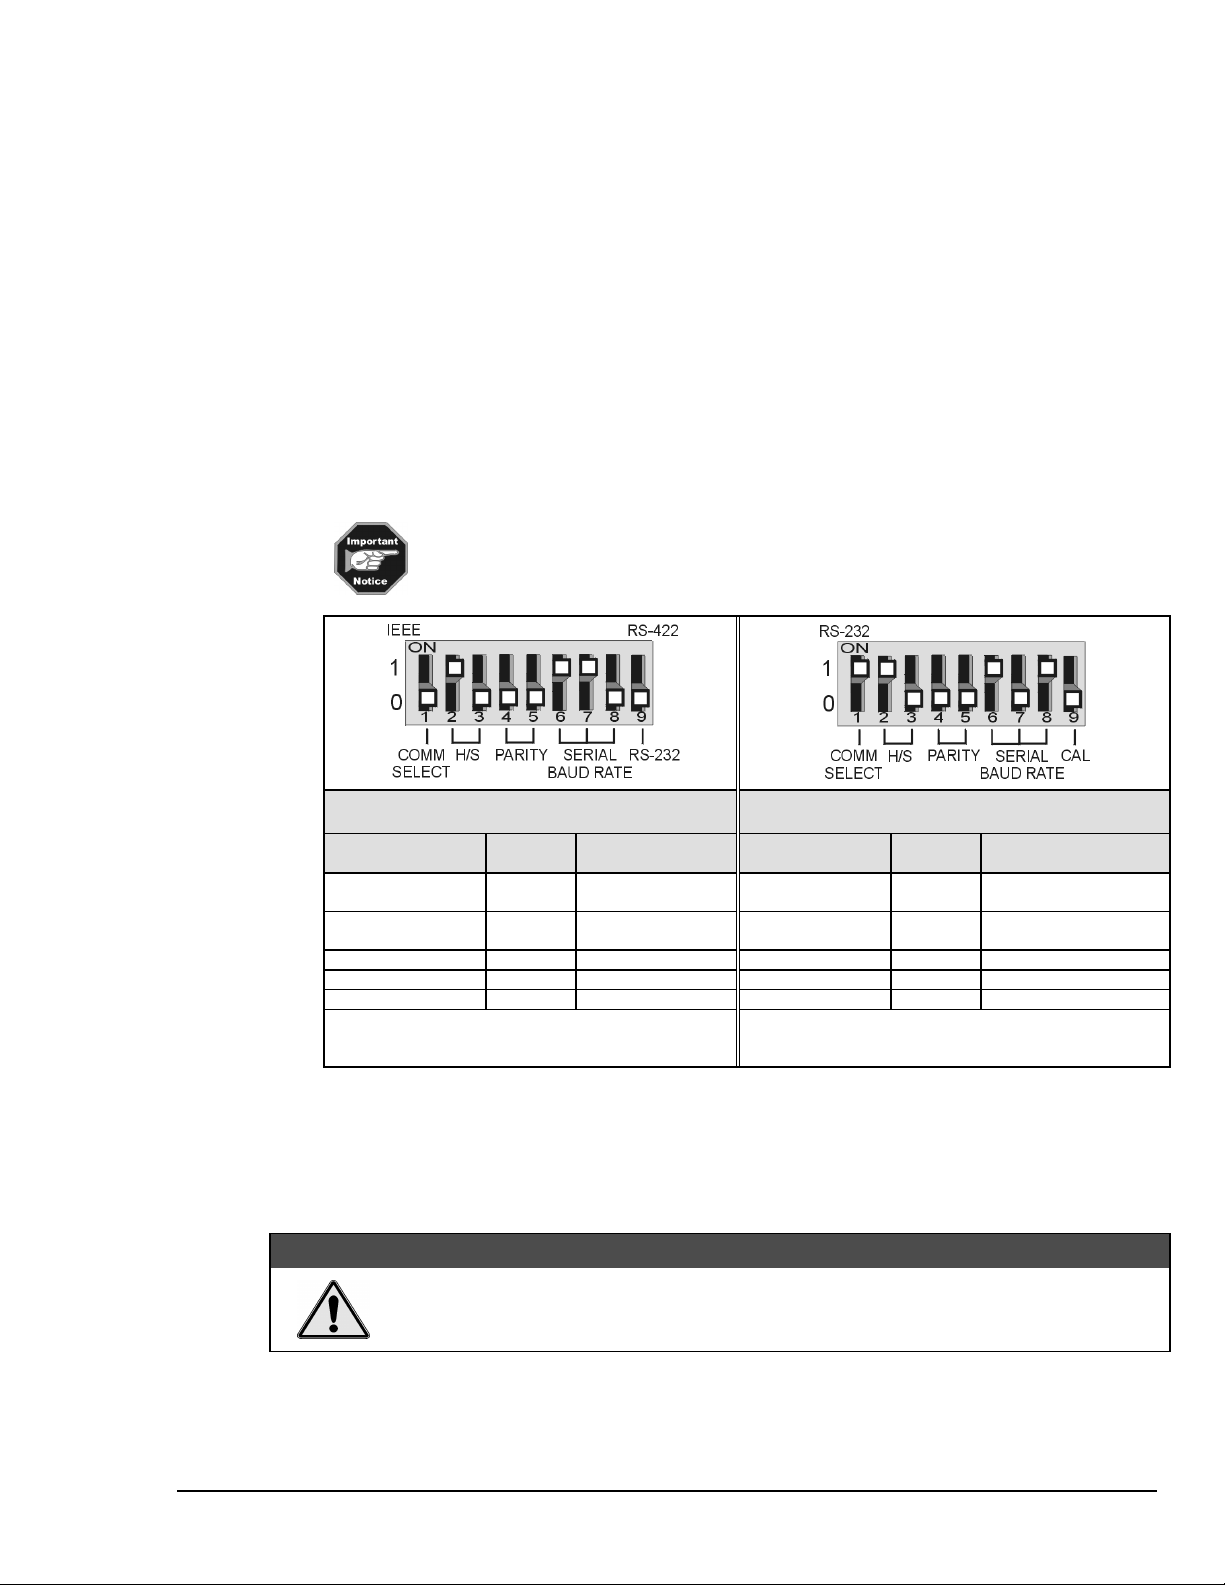
b) Verify DIP Switch Setting
The DIP switch is located on the lower right corner of ChartScan’s rear panel. Default settings are
indicated in the following figures and table. Refer to Chapter 3 if you desire to change the RS-232
parameters from their default values, or if you wish to use the IEEE 488 interface option. For ethernet
use of ChartScan, make sure the unit is configured for RS-232 serial communications, then refer to the
Net232 User’s Guide (p/n 1037-0901).
Early production ChartScan units do not have a Calibration Enable/Disable
Pushbutton. If you have an early production unit, refer to the right-hand DIP switch
illustration.
DIP Switch Default Settings
Selection Micro-
COMM SELECT 1 0 – Serial
HANDSHAKE
(H/S)
PARITY 4,5 0,0 - No Parity PARITY 4,5 0,0 - No Parity
BAUD RATE 6,7,8 1,1,0 – 19200 Baud BAUD RATE
RS-232 or RS-422 9 0 – RS-232 CALIBRATION 9 0 - Disabled
Switch #
2,3 1,0 - Hardware
c) Install Signal Conditioning Card(s)
Signal conditioning cards are pre-installed per customer order. However, if you need to install a signal
conditioning card, or CSN/Relay card, perform the following steps. Repeat the steps for additional
cards, and for placing cards into the optional CSN/Exp expansion chassis, if applicable.
Ensure ChartScan is powered down and not connected to any power source prior to
installing or removing a card. Failure to do so could cause equipment damage.
Dip Switch Default Settings
(Early Production Units Only)
Setting Selection Micro-
Communication
Handshake
CAUTION
CAUTION
CAUTIONCAUTION
COMM SELECT 1 1- RS-232
HANDSHAKE
(H/S)
1
1
It is recommended that you do not exceed 9600 Baud
unless you have firmware version 1.3 or greater. The
firmware version can be read in ChartView’s title bar.
Switch #
2,3 1,0 - Hardware
6,7,8 1,0,1 - 9600 Baud
Setting
Handshake
ChartScan User’s Manual ChartScan - Unit Startup and ChartView Tutorial 1-3
Page 10
CAUTION
CAUTION
CAUTIONCAUTION
Use approved ESD precautions, including static-free work area and grounded wrist strap,
when handling circuit boards and electronic components. Failure to do so could cause
equipment damage due to electrostatic discharge.
CAUTION
CAUTION
CAUTIONCAUTION
Only one CSN/Relay card can be used in a ChartScan system. Attempts to install the
CSN/Relay card in a slot other than slot #1 of ChartScan’s main unit can cause equipment
damage.
The CSN/Relay card, if used, must be installed in the bottom slot of the main unit. Aside
from this requirement, cards may be installed in any slot.
1. Ensure ChartScan is powered down and not connected to any power source.
2. With channel labels oriented upright, carefully slide the card into the unit, and along the card
support grooves. Gently force the card to engage its edge connector with ChartScan’s internal
mating connector.
3. Tighten the external screws snug, at each end of the card.
d) Install IEEE 488 Interface Communications Card (option)
If you ordered an optional IEEE 488 Interface Card (CSN14/488), please refer to the
IEEE 488 Configuration (Option) section of Chapter 3 for installation instructions.
e) Connect Expansion Chassis (option)
If you ordered a expansion chassis (CSN/Exp), please refer to the Expansion Chassis, CSN/Exp
(Option) section of Chapter 3 for installation instructions.
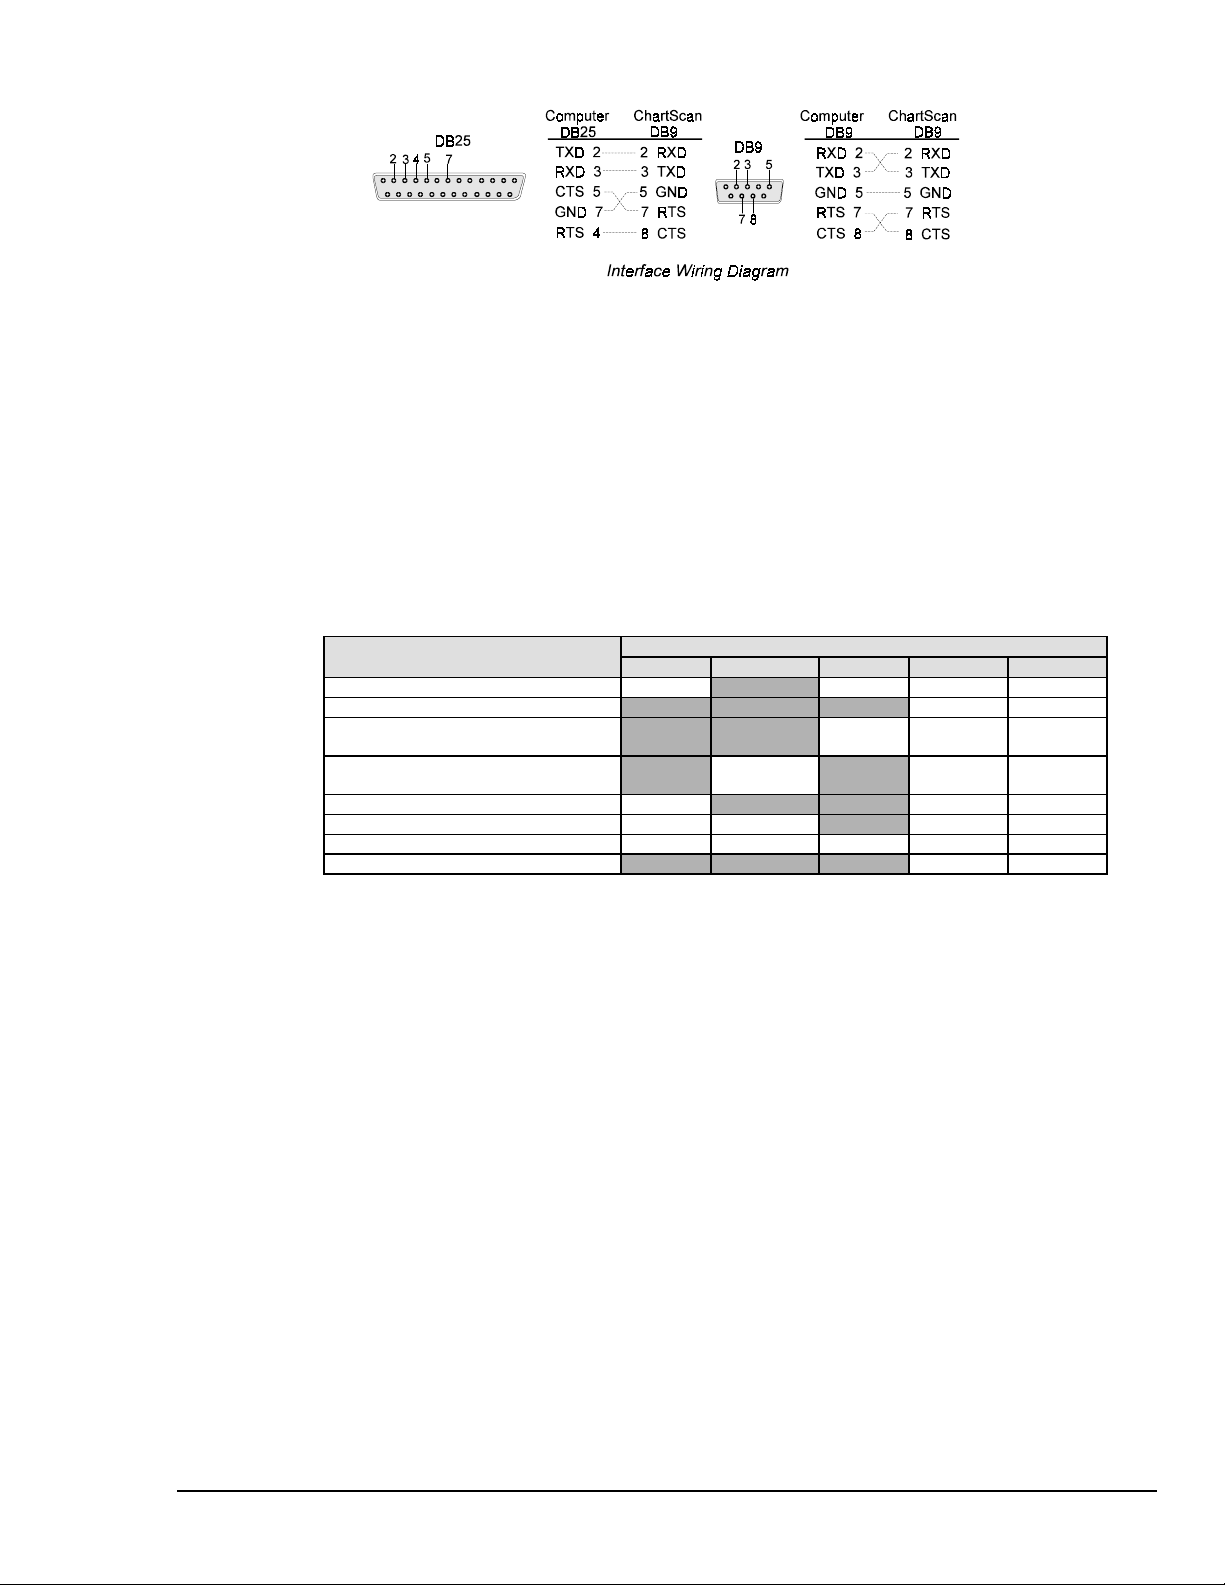
4. Connect ChartScan to Your Computer
Reference Note: ChartScan is default configured for serial port connection to a PC. For
IEEE 488 connection, please refer to the Chapter 3 section, IEEE 488 Configuration (Option).
Reference Note: For ethernet operation refer to the Net232 User’s Guide, p/n 1037-0901.
Use a CA-47 cable (or equivalent) to connect the ChartScan to your computer. The ChartScan end of
the CA-47 cable has a DB-9P connector, while the computer end has 2 connectors (DB9 and DB25).
Other crossover-type cables can be used if wired as shown in the following figure.
1-4 ChartScan – Unit Startup and ChartView Tutorial ChartScan User’s Manual
Page 11
5. Apply Power to ChartScan
ChartScan can be powered from a standard AC outlet. Use the following steps to connect power to
your unit.
1. Make sure ChartScan’s power switch is in the “0” (OFF) position.
2. Plug power cord CA-1 into ChartScan’s power connector, located on the rear panel. Plug the other
end of the cord into an appropriate receptacle.
3. Turn ChartScan’s power switch to the “1” (ON) position. The Power LED should light up.
At initial power-up ChartScan performs automatic self-tests to ensure that it is fully functional. The
rear panel LEDs indicate errors, if they occur. Possible error conditions and their corresponding
indicator light patterns are shown in the following table. Any pattern not shown is an internal error that
is not field-serviceable; in this case, contact the factory. When only the POWER and ERROR LEDs
are on, a configuration error exists as a result of the setup information in NV-RAM.
Error Condition LED Indicators
General Hardware Failure ON ON -Flash- ON
ROM Invalid for U22, COMM2 -Flash- ON
ROM Checksum Error for
U21 Comm1
ROM Checksum Error for
U22 COMM2
Non-Volatile RAM Error ON -Flash- ON
Dynamic RAM Error ON ON -Flash- ON
Interprocessor COM Error ON ON ON -Flash- ON
Configuration Error ON ON
If you observe a configuration error, perform an error status query (see E? in Appendix A). If you
observe any other type of error condition, make note of the error and contact your service
representative.
If no problems are found ChartScan will begin its power-up initialization. This self-test is performed
each time the unit is powered up regardless of whether power-on was caused by the power switch or the
Power-On Reset (
During initialization, ChartScan self test performs the following steps:
• Checks for errors at power-up.
• Checks the flag in the NV-RAM to determine if it should power-up with factory default
• Loads appropriate registers with corresponding values in NV-RAM.
• Checks a flag to see if alarms should be enabled at power-up, and if so, enables them.
• Loads channel configuration registers.
• Loads program sequencer with appropriate channel configurations.
•
*R
settings or a user-defined configuration.
Resets computations processor to begin acquiring scans.
ALARM TRIGGER SCAN ERROR POWER
ON -Flash- ON
ON -Flash- ON
) command.
The self-test takes approximately 5 seconds to complete; after which, ChartScan is ready for normal
operation.
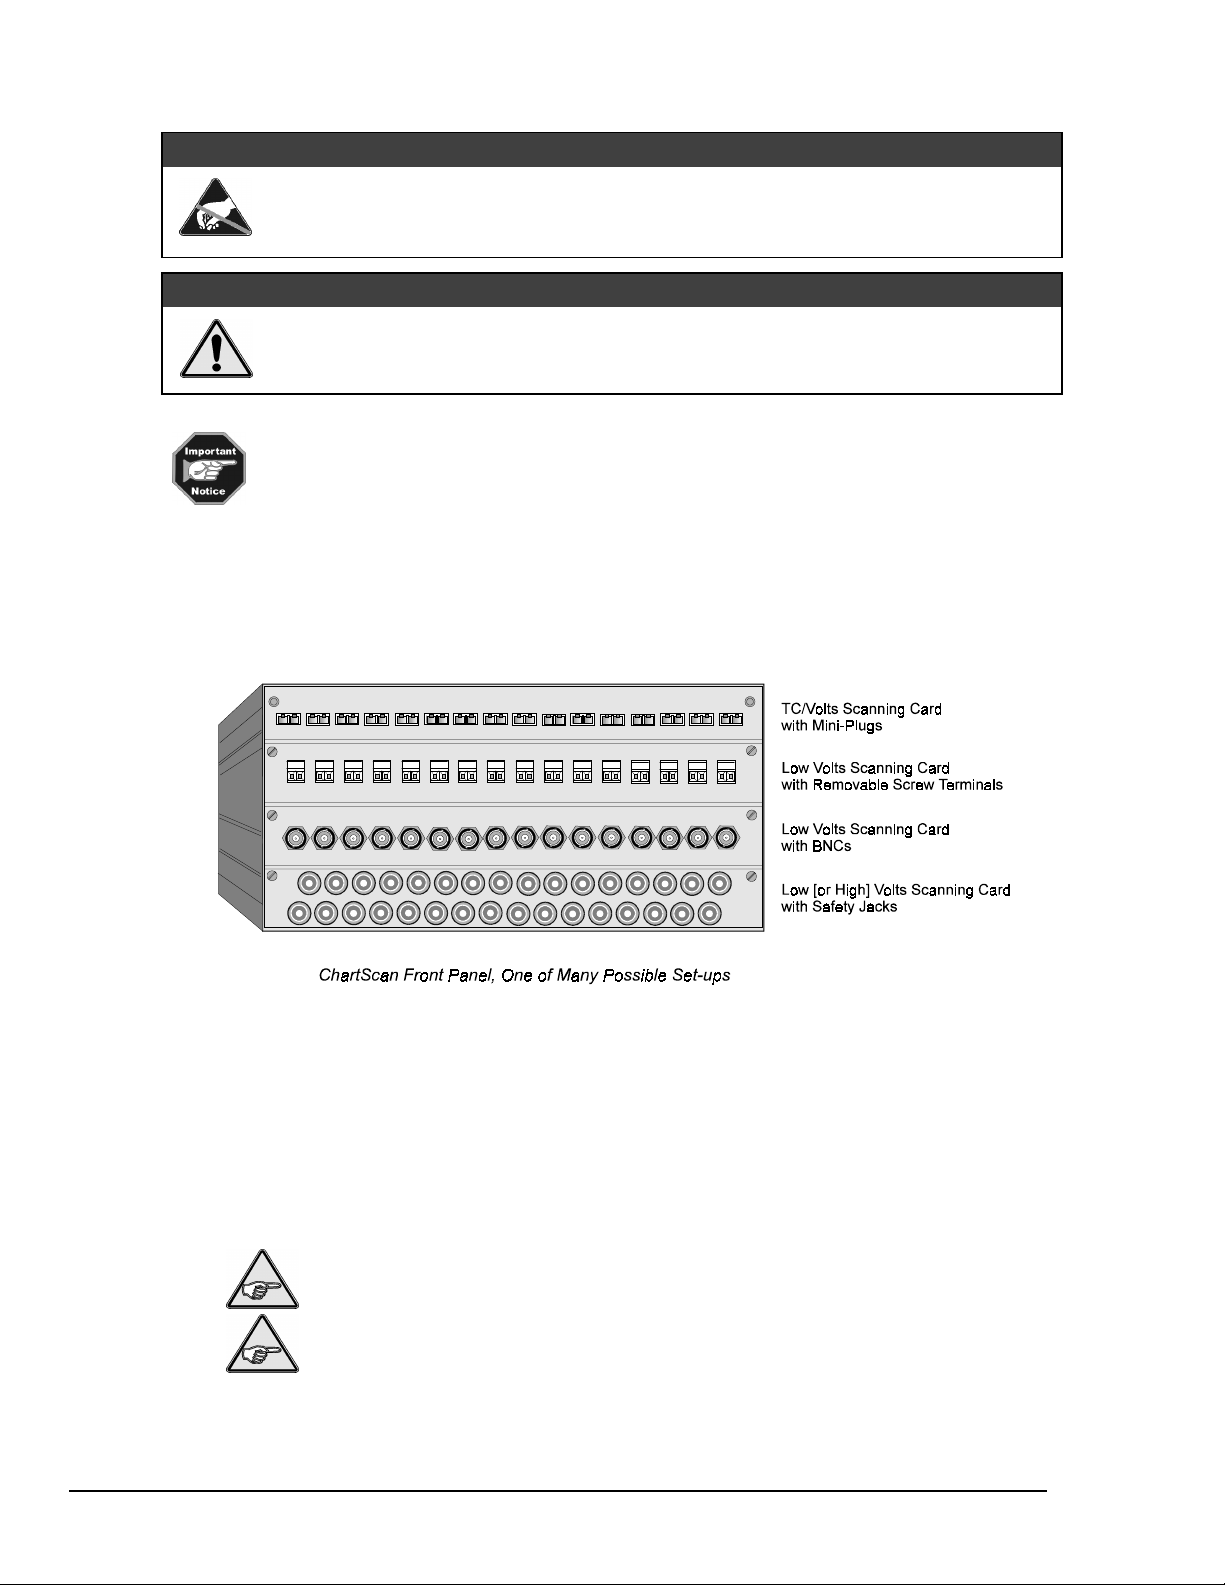
6. Connect Channel Signal Inputs
Connect channel inputs to your signal conditioning cards. Each signal conditioning card can support
up to 16 Channels. With use of the expansion chassis, you can have up to 8 signal conditioning cards.
Depending on the type(s) of cards used, your connections will be made via one or more of the
following: screw terminal, mini-plug, BNC, or safety jack type input connector.
ChartScan User’s Manual ChartScan - Unit Startup and ChartView Tutorial 1-5
Page 12
ChartScan has eight digital input lines and thirty-two digital output lines available on the rear panel
DB-50 connector.
CAUTION
CAUTION
CAUTIONCAUTION
Do not exceed the 0.0 to 5.3 volts levels described above. Exceeding these levels
may damage the ChartScan unit in a way not covered by the warranty.
Each digital output line will drive five (5) standard TTL loads. All digital input lines are one-eighth
(0.125) TTL loads. All inputs are protected against damage from high static voltage. Normal
precautions should be taken to limit the input voltages to the range of 0.0 to 5.3 volts. All digital I/O
lines are referenced to the connector’s ground pins.
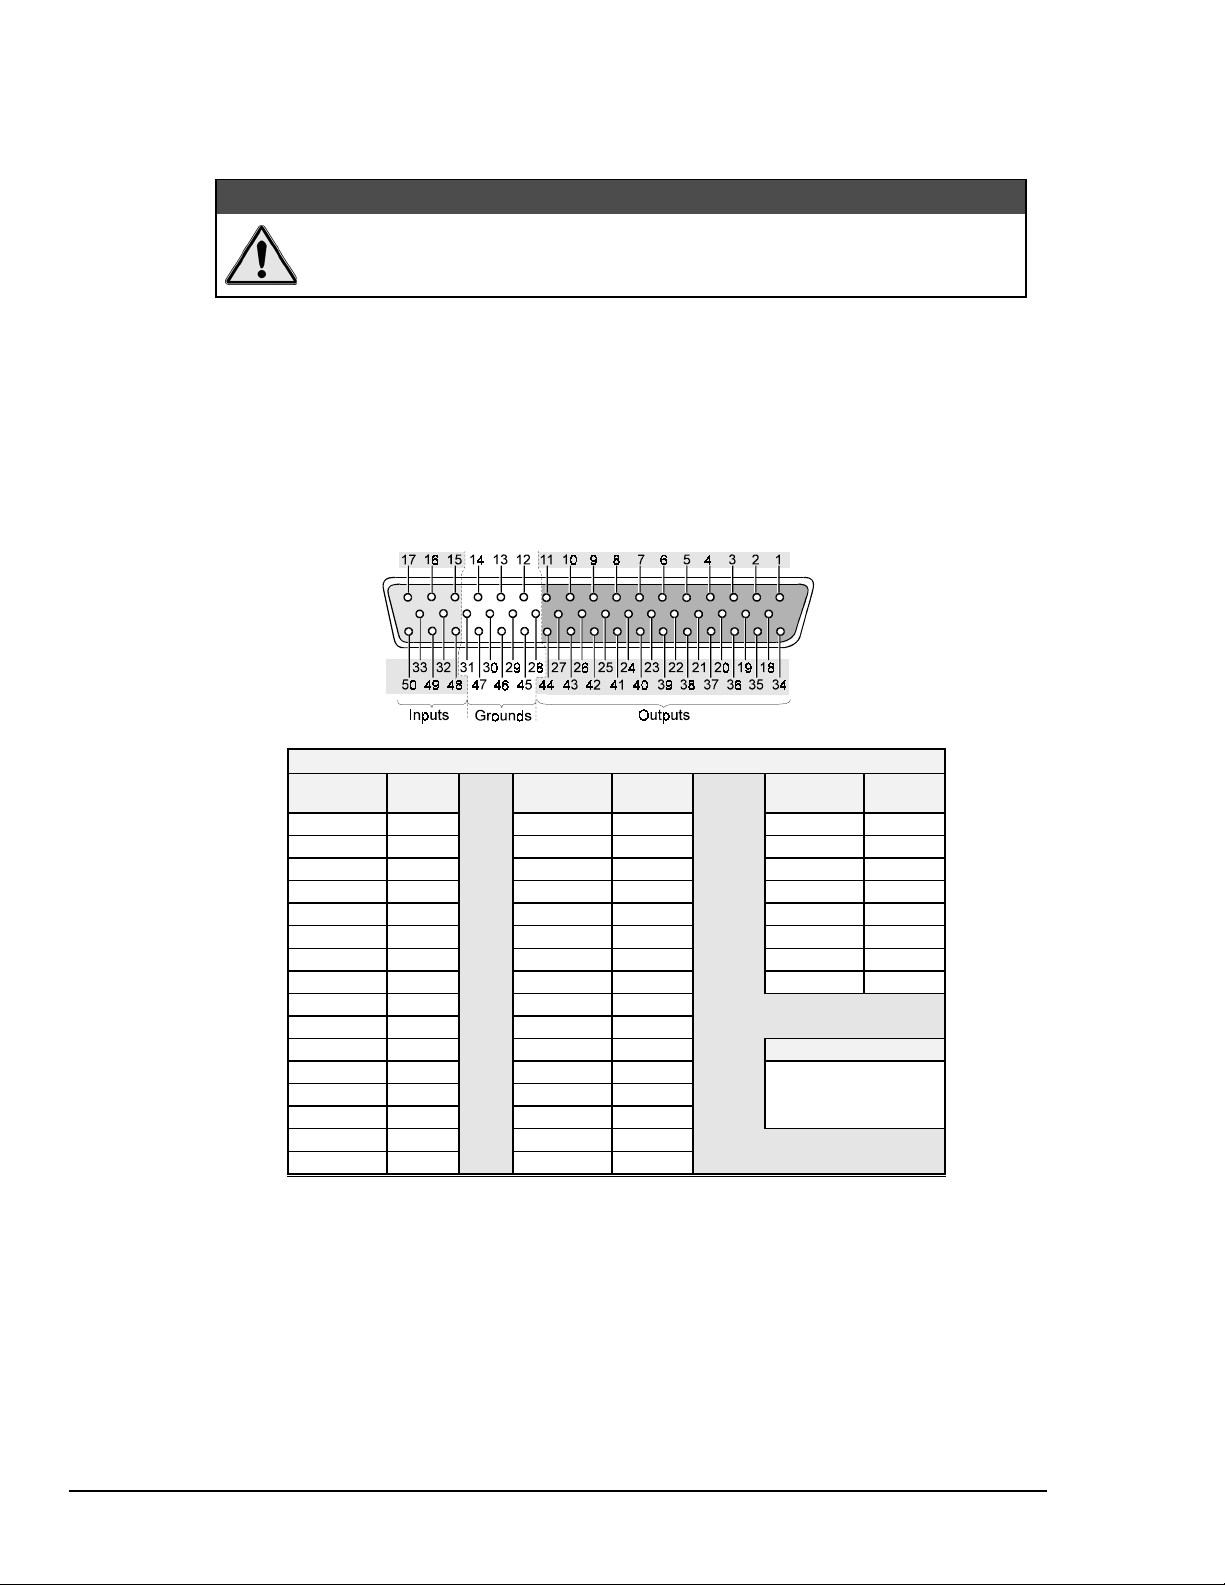
The following figure and table identify pin locations for outputs, inputs, and grounds associated with
the DB50 connector. Outputs 1 through 32 are typically used for alarms 1 through 32, respectively.
As mentioned above, outputs 1 through 16 can be used with a relay card option (see note 1).
DB50 Pin Descriptions
Output
Signal
1
2
3
4
5
6
7
8
9
10
11
12
13
14
15
16
Pin
No.
34
18
35
19
36
20
37
21
38
22
Output
Signal
1
2
3
17
18
19
20
21
22
23
24
25
4
26
27
28
5
29
30
31
6
32
Pin No.
39
23
7
40
24
8
41
25
9
42
26
10
43
27
11
44
Input
Signal
Pin No.
1
2
3
4
5
6
7
8
Ground Pins
12, 13, 14,
28, 29, 30, 31,
45, 46, 47
15
48
32
16
49
33
17
50
Note 1: A CSN/Relay is available for high current alarm output applications. If used, this card must
be installed in the bottom slot of ChartScan’s main chassis. See page 1-3 for installation
instructions. For more detailed information regarding the card, refer to CSN/Relay Card (for
High-Current Digital Output), in Chapter 3.
1-6 ChartScan – Unit Startup and ChartView Tutorial ChartScan User’s Manual
Page 13

7. Start ChartView, Configure System, and Collect Data
Note: First time users should skip this step and return to it after reviewing ChartView, Basic
Concepts and completing the ChartView Tutorial.
Note: The configuration file, discussed in this section, will not be present during your first start of
the program.
Use the ChartView icon in Windows to start the ChartView program. ChartView will run using the
latest configuration file. This is a file which is automatically saved upon exiting the program. The
configuration file contains all setup information, including that pertaining to channels, alarms, and
acquisition configuration.
When ChartView opens using a configuration file, the program’s main window appears on the screen,
as indicated in the following figure.
Note: Item 24, Status LEDs and labels, does not appear when using Windows 3.1. However, when
using Windows 3.1, text will appear in region 24 to inform you of the status. This is in
addition to the text in the Status Message Box (Item 22).
ChartScan User’s Manual ChartScan - Unit Startup and ChartView Tutorial 1-7
Page 14
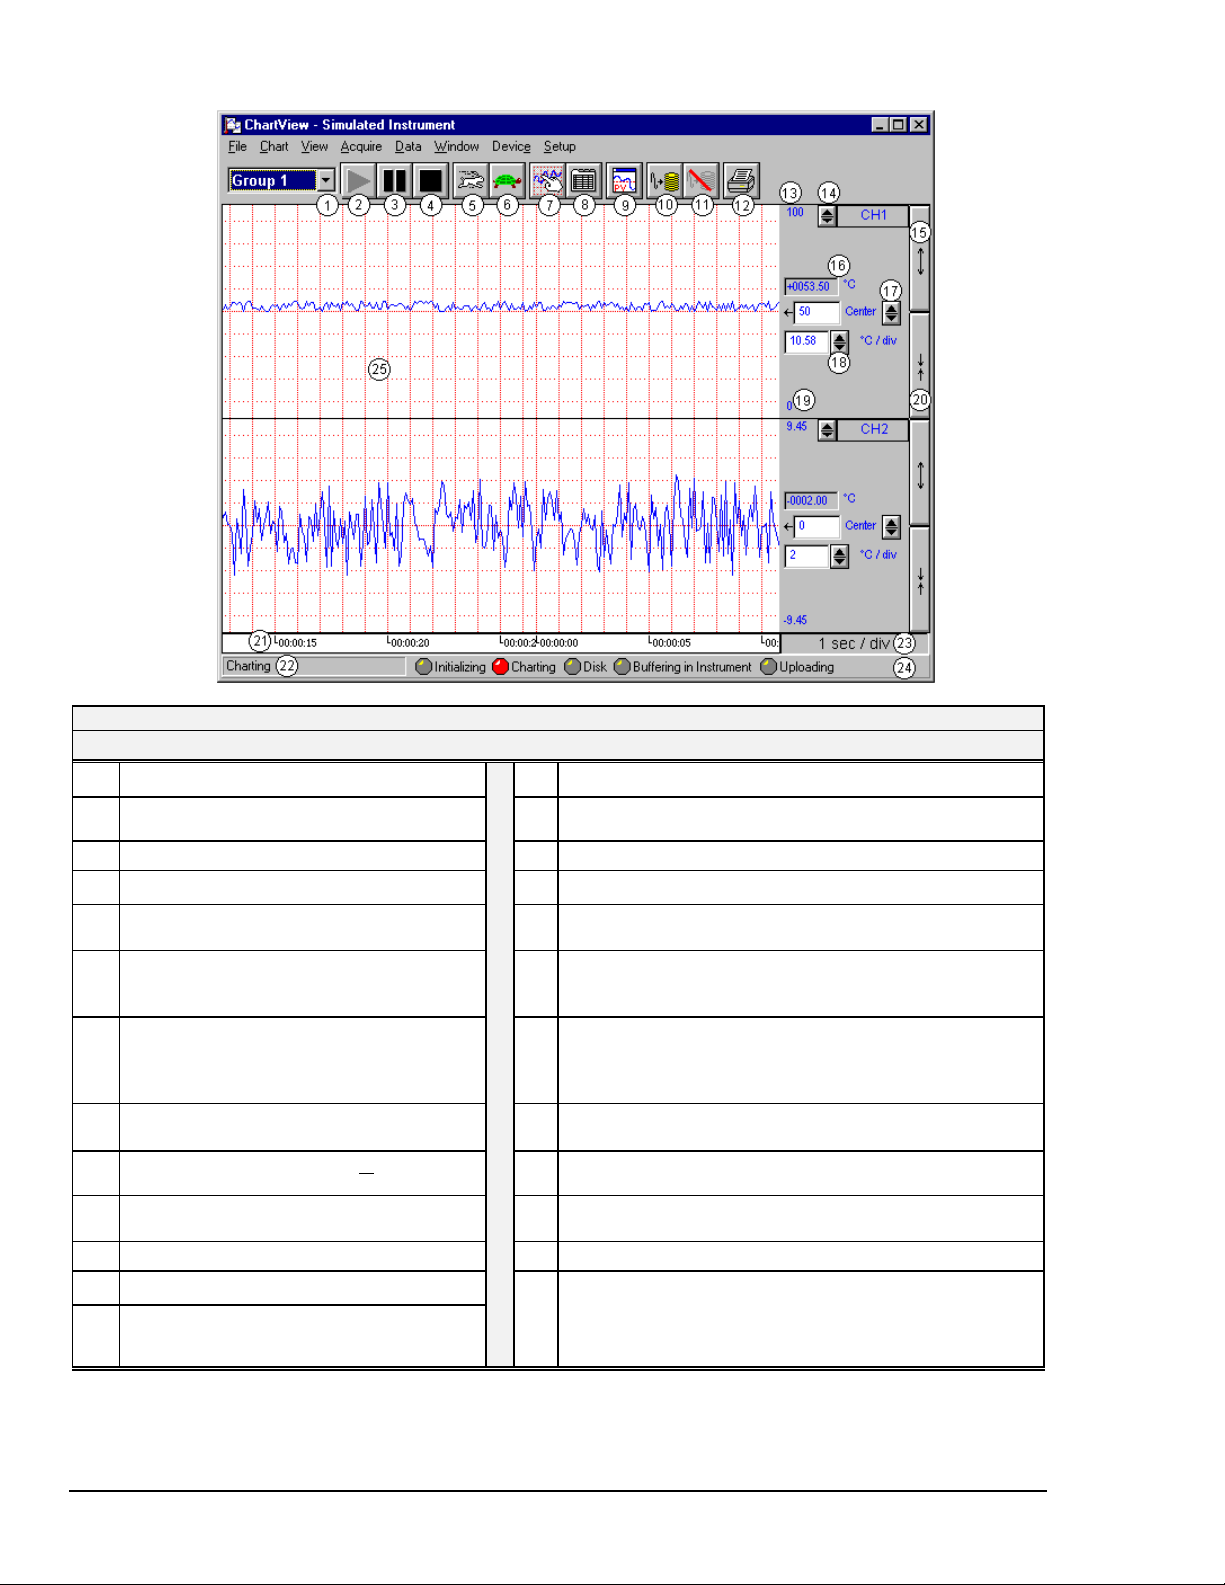
ChartView Main Window
ChartView Main Window Control Options
= Mouse, Ú= Arrow Keypads , = PageUp/PageDown Keypads
1 Group Select
2 Start Charts &
Indicators
3 Pause Charts
4 Stop Charts
5 Scroll Faster
6 Scroll Slower
7 Display Configuration
8 Channel Configuration
9 PostView post-acq
data viewer
10 Arm Acquisition
11 Disarm …
12 Print Charts
13 Chart Max. Scale
Value (Grid Limit Line)
Ctrl+G, or
and “right-click”
Current group will be
selected.
down menu
From Chart Pull-down
menu or Chart Setup
Dialog Box
Ú,
or
or, F5
or, F7
or, F6
or, Ctrl+Z
or, Ctrl+X
or, Pointer over chart
or, Windows Pull-
or, Ctrl+T
or, Ctrl+Y
or, Ctrl+P
14
Channel Selection
15
Multiply (x2)
16
Present Value of Selected Channel
17
Center (Value at Chart Mid-Line)
18
Units/Division
(Vertical increment per one grid box)
19
Chart Min. Scale Value (Grid Limit
Line)
20
Divide (÷2)
21
Time Scroll (hr:min:sec)
22
Status Message Box
23
Time/Division (Chart Speed),
the Horizontal increment per grid box
24
Status LEDs
25
Chart Display
Double-click left mouse button in selected chart to zoom in or zoom
back out. Right-click to bring up Chart Setup Dialog Box with the
current group and target chart selected.
Ú
or,
or,[Tab to and hit
Spacebar]
N/A
or, Ú, or type-in
or, Ú, or type-in
From Chart Pull-down
menu or Chart Setup
Dialog Box
or, [Tab to and hit
Spacebar]
Thru Pull-Down Menus
only
N/A
Ctrl+Z (Faster)
Ctrl+X (Slower)
N/A
1-8 ChartScan – Unit Startup and ChartView Tutorial ChartScan User’s Manual
Page 15
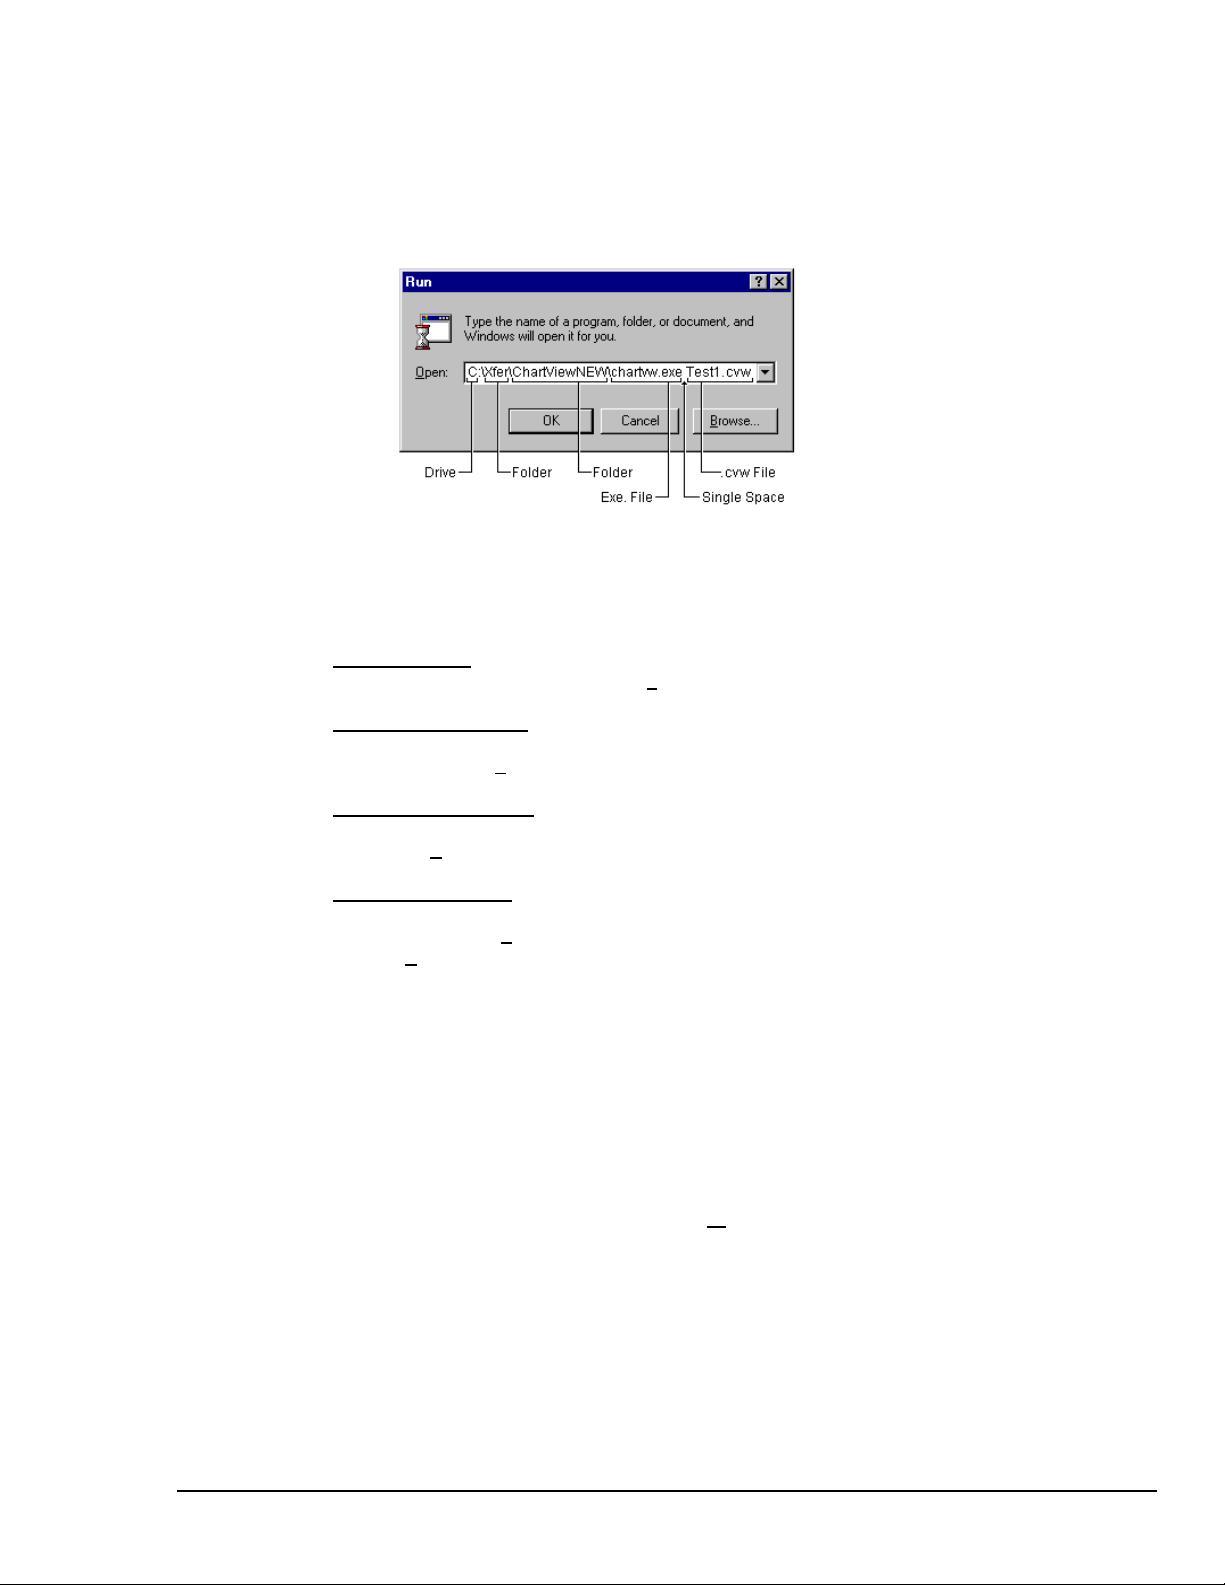
Once ChartView has a configuration file, you can start the program quickly using the Windows Run
dialog box. Before executing this command [by clicking on the OK box] specify a configuration file as
a command line parameter. In the following example, the user has specified a configuration file which
he had previously saved as Test1.cvw.
Note: The file name can be manually entered, or can be accessed using the pull-down arrow and
scrolling the list of available file names.
Example of Using Windows’ Run Dialog Box to Open a File
After executing the command, ChartView’s Main Window opens. At this point review the following
configurable items prior to Data Acquisition. Make changes, or load a different configuration file if
desired.
;;;;
Device Interface
Check the Interface and Status via the Device pull-down menu.
;;;;
Channel Configuration
Check channel and alarm configuration settings via the Channel Configuration Window. Access this
window through the Setup pull-down menu.
;;;;
Acquisition Parameters
Check the acquisition parameters via the Acquisition Configuration window. This window can be accessed
through the Setup pull-down menu.
;;;;
Data File Parameters
Check Data File Parameters. These parameters can be set from the Data Destination window
(accessible from the Setup pull-down menu), and from the Data File Parameters selection accessible
from the Data pull-down menu.
Using the Run Dialog box to specify a configuration file is very efficient. By using this method and
various configuration files, you should find that managing systems with more than one acquisition
device is relatively simple. With the use of a portable PC, you can quickly interface with a specific
acquisition system.
The pull-down menus and numbered areas represented in the previous figure and table are detailed in
the Chapter 4, ChartView and ChartView Plus.
To start the charts scrolling, push the “Start Charts and Indicators” button (item 2). More detailed
information pertaining to the charts and the ChartView Main Window appear in Chapter 4. In addition
to viewing the data as charts, you can select the Windows pull-down menu to select one or all of the
following:
•
ChartView Analog Meters
• ChartView Digital Meters
•
ChartView Bar Graph Meters
The meter-type data displays, along with the charts, can be on your computer screen at the same time.
They can be re-sized and repositioned as desired. Analog, Digital, and Bar Graph meters are detailed
in Chapter 4.
ChartScan User’s Manual ChartScan - Unit Startup and ChartView Tutorial 1-9
Page 16
ChartView, Basic Concepts
An understanding of the following basic concepts will help you master ChartView more quickly, and
should be understood before proceeding with the tutorial.
Configuration Files
ChartView makes use of one or more “user transparent” configuration files. Configuration files
maintain information regarding various aspects of your setup, serving as an initialization file for
subsequent ChartView startups. These files can be recognized by their
When you run ChartView for the very first time there will be no configuration file.
However, a configuration file will be generated and be saved, automatically, after
ChartView uses
each use of the program.
Chartvw.cvw
ChartView configuration information including:
Device Interface Mode
•
• Hardware Configuration
• Channel Settings:
⇒ Channel Enable/Disable (On/Off)
⇒ Type
⇒ Label
⇒ Units
⇒ Alarm Settings (Limits)
⇒ Hysteresis Setting
• Acquisition Configuration
• Data Storage Settings
.cvw
extensions.
as a default configuration file. This file maintains a location for
The configuration file ensures that when you restart ChartView, it will be in the same state upon your
last exit. This means that the
Chartvw.cvw
are using at the time you exit ChartView.
It is not catastrophic if a configuration file is deleted, since it is a simple task to start ChartView when
no configuration file exists. This is described in the tutorial.
Understanding Groups, Charts, & Channels
When starting the program with no configuration file present, a feature called Chart Setup Wizard is
automatically activated to assist you with your setup. To make the best use of Chart Setup Wizard you
need to understand the relationship of Groups, Charts, and Channels.
Note: ChartView, ChartView Plus, and Chart Setup Wizard are detailed in Chapter 4 of this manual.
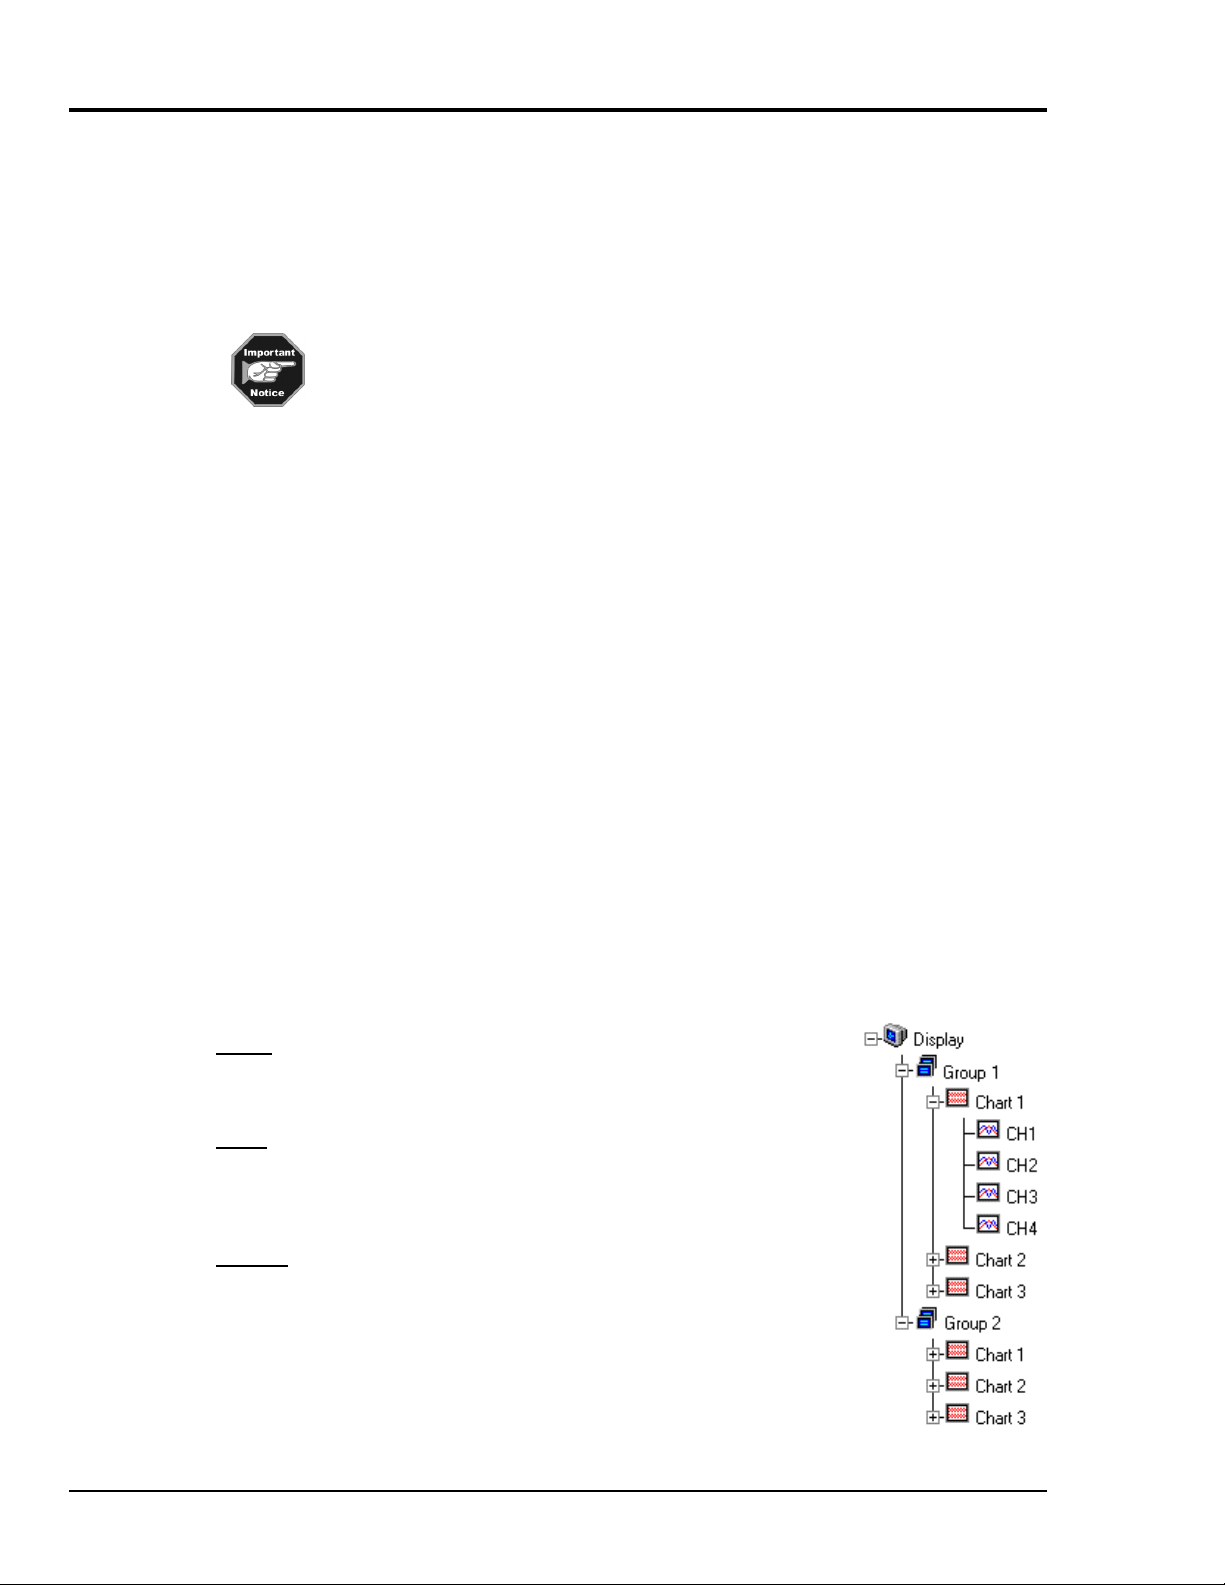
Group. “Group” refers to a group of charts. ChartView makes use of one
chart group. ChartView Plus allows up to 64 groups, depending on the
capabilities of your PC, but only displays data from one chart group at a
time.
Chart. “Chart” refers to display area which reflects real-time channel data
values and can be scrolled at various rates. One chart can display data from
up to four channels. In addition, each chart will display real-time
information for a selected channel. You can assign up to 16 charts per
group.
Channel. “Channel” refers to a signal channel. You can have up to 4
channels assigned to one chart. Channels will be displayed in units of °C,
°F, °K, °R, mV, V, or in user-defined units, depending on the configuration
and type of signal conditioning card used. ChartScan’s signal conditioning
card options are detailed in Chapter 3.
file will be an updated copy of the configuration file you
1-10 ChartScan – Unit Startup and ChartView Tutorial ChartScan User’s Manual
Page 17

Three Ways of Using ChartView
You can use ChartView to:
• chart and monitor specific channels with no acquisition of data to disk
• acquire data with no charting or meter use
• use charting and/or meters while acquiring data to disk
Chart channels (and/or monitor with meters) with no acquisition of data to disk
Prior to charting channels on ChartView’s Main Window, you need to configure a display in regard to
groups, charts, and channels. This aspect of configuration is performed through Chart Setup Wizard
(discussed in the following text), or through a Display Setup dialog box which is accessed through the
Display Configuration Setup button (item 7, page 1-8) on ChartView’s Main Window.
In addition to charting channels, you can monitor selected channels via digital, analog, and/or bar graph
meters. Meters are discussed in Chapter 4.
Note: For ChartView Plus users, up to four channels will overlap on their assigned Chart, and will
be visible when the applicable Group is selected.
Acquiring Data with no charting or meter use
Prior to acquiring data (for saving to disk) you need to configure the acquisition using the Acquisition
dialog box (accessed through the Setup pull-down menu of ChartView’s Main Window, or through use
of the related icon button). You can enable the desired channels, assign high and low alarm values
from the channel configuration dialog box.
Chart channels and/or use meters while acquiring data to disk
Prior to using ChartView for charting (and/or meter use) while simultaneously acquiring data to disk,
you need to configure a display and/or meter; as well as configure the acquisition. Note that the
channels from the display setup are automatically enabled. You can enable additional channels from
the channel configuration dialog box (for the data acquisition) to acquire more data; however, these
additional channels will not change your display setup, or the channels being monitored. In other
words, you can acquire data from channels which you do not monitor.
ChartView Tutorial
This tutorial is intended to help you gain a good understanding of ChartView. The tutorial is based on
an initial startup with no configuration file present
ChartView allows you to operate in one of four Device Interface modes (IEEE 488, RS-232/422,
NetWork or Simulated Instrument). The tutorial makes use of the Simulated Instrument mode. This
mode provides a means of running ChartView and inspecting its features without hardware concern.
Note that you can change the interface mode at anytime during a configuration setup.
The tutorial makes use of the Simulated Instrument mode. Note that both the
IEEE 488 and Network modes require the use of additional hardware, as discussed
The arrow symbol
are to complete. Text without the arrow is for information content, and does not require you to take
any action.
ChartScan User’s Manual ChartScan - Unit Startup and ChartView Tutorial 1-11
elsewhere in this manual.
, followed by a number, is used throughout the tutorial to indicate an action you
◊
.
Page 18
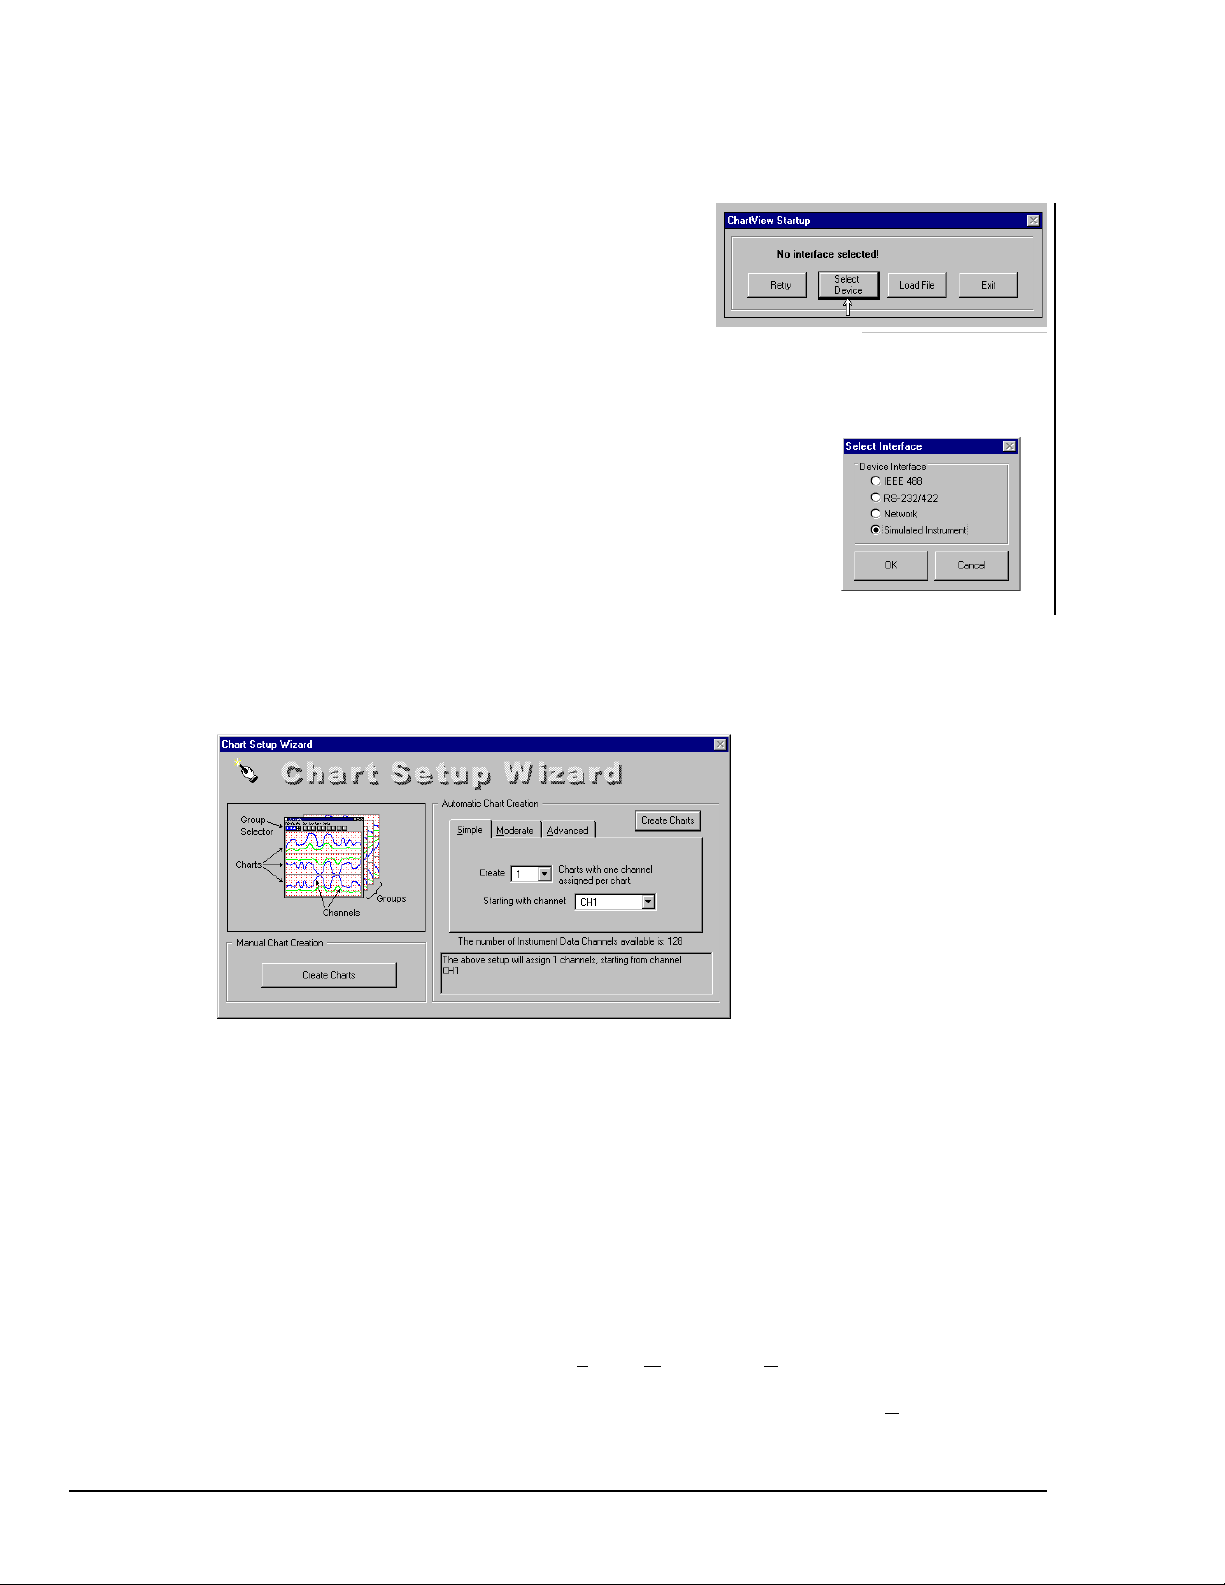
1. Select Interface Device
(1) From Windows, start ChartView by double-clicking on the
◊
ChartView icon. The ChartView Startup dialog box
appears.
(2) Choose the Select Device button. The Select Interface Dialog Box appears, as indicated in the following
◊
figure.
Note: The Load File button is for loading a previously saved configuration file.
(3) Select Simulated Instrument. In an actual application you would select
◊
IEEE 488, RS-232/422, or Network, whichever you configured your
acquisition system for. Network users should refer to the Net232 User’s
Guide, p/n 1037-0901.
2. Configure Chart Setup
(4) On the Select Interface box, shown in step 1, click “OK.” A Chart Setup Wizard window appears.
◊
ChartView Setup Dialog Box
Select Interface
Note: ChartView Plus has Chart Setup Wizard options including Moderate and Advanced Automatic
The chart setup determines how your ChartView Main Window will appear in regard to the number of
groups available for viewing, the number of charts shown for each selected group, and the number of
overlapping channels in each chart (not to exceed 4). As stated in the previous note, only
ChartView Plus allows the use of multiple groups and overlapping channels.
You can choose to manually create a configuration, or have one created automatically. In addition, you
can use Chart Setup Wizard to make a rough display configuration, and then manually fine tune it. The
automatic setup method offers three choices: Simple, M
The “Manual Chart Creation” option provides you with the same capabilities as the Advanced
Automatic Setup selection, but allows you to vary the number of assigned channels per chart, as well as
vary the number of charts per group.
1-12 ChartScan – Unit Startup and ChartView Tutorial ChartScan User’s Manual
Chart Setup Wizard Window
Chart Creation, as well as the ability to create multiple groups. ChartView Plus features can
be unlocked by use of an authorized registration ID number as an unlock code. Contact your
service representative for more detailed information.
oderate, and Advanced.
Page 19
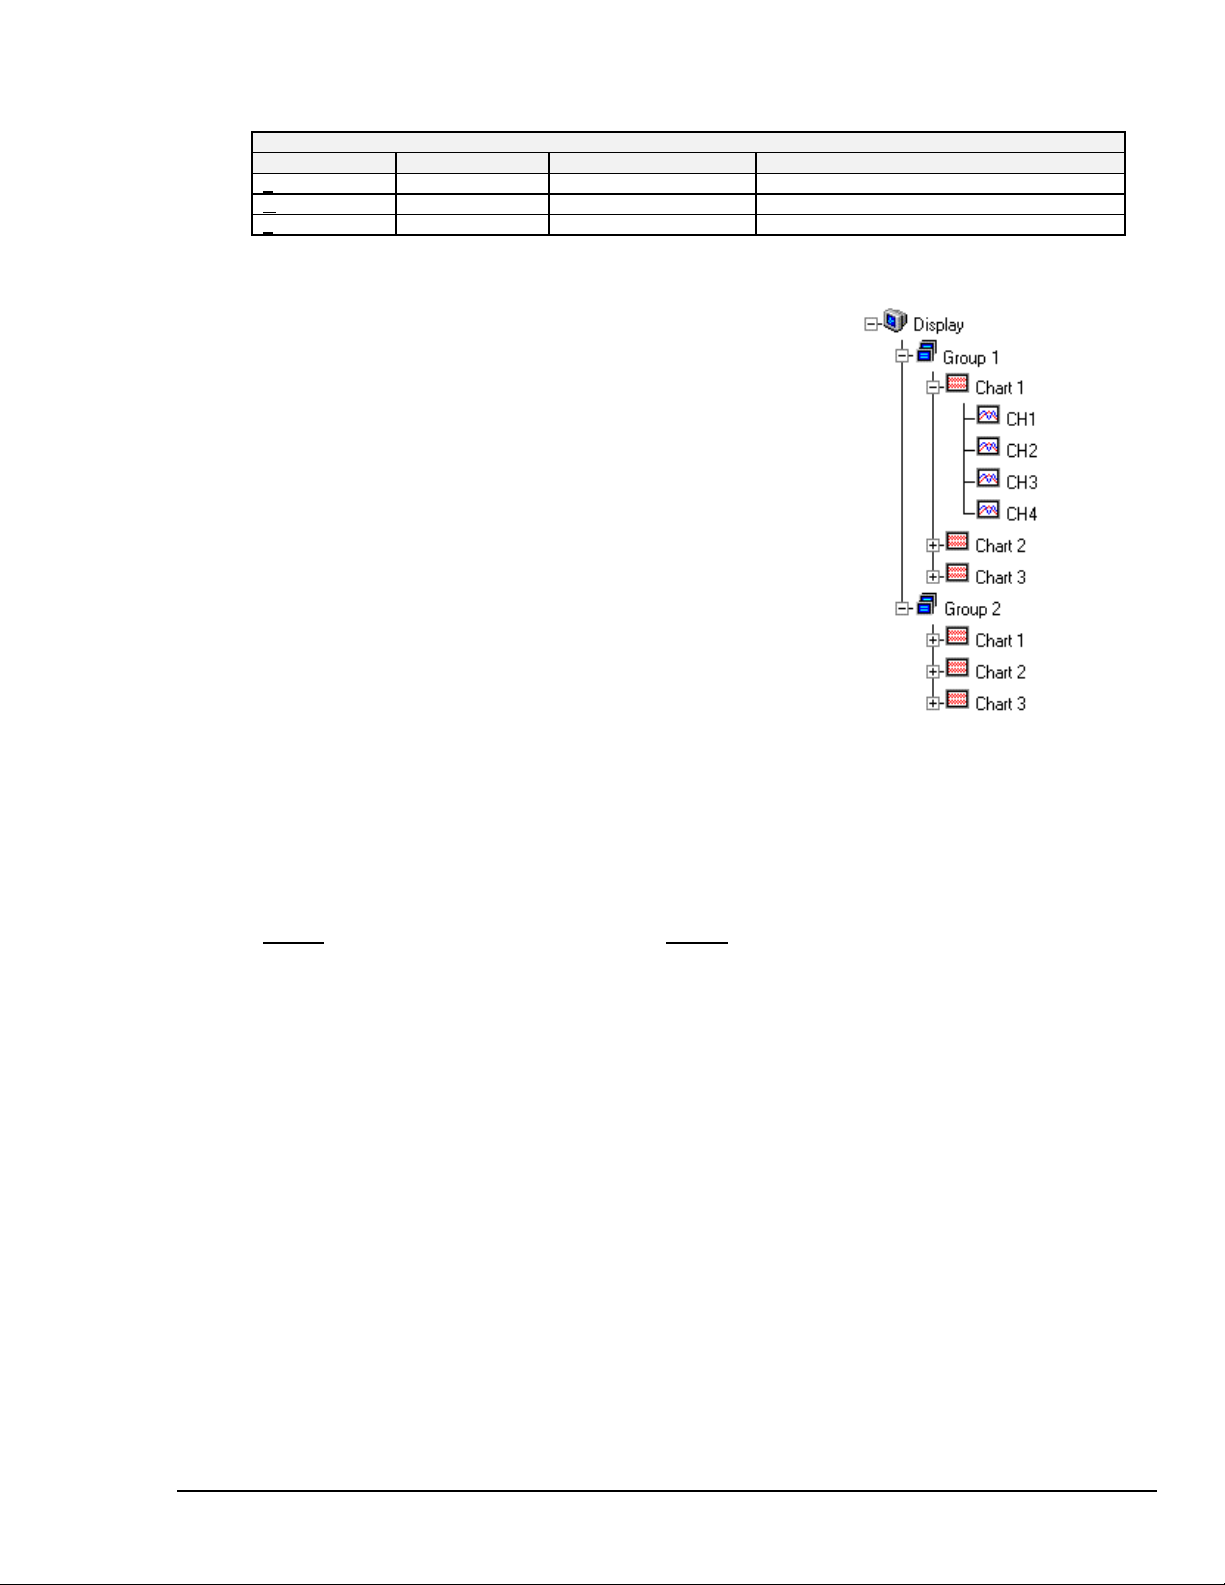
Chart Setup Wizard, Automatic Options
Setup Type
Simple
Moderate*
Advanced*
*Moderate and Advanced modes are only available with activation of ChartView Plus.
Group Setup
1 group only
1 group only
Up to 64 groups Up to 16 charts per group Up to 4 overlapping channels per chart
Chart Setup
Up to 16 charts
Up to 16 charts
Channel Setup
1 channel per chart
Up to 4 overlapping channels per chart
Note: Once your chart setup is complete you can always go
back and edit the setup.
For the purpose of our tutorial, complete the following steps. Note that
these steps are catered to ChartView Plus. Comments regarding
standard ChartView are presented in brackets [ ].
(5) Verify that the Advanced tab (under Automatic Chart Creation) is
◊
selected. [Simple must be used for standard program].
(6) Choose “2” for the number of groups. [Standard program is
◊
limited to 1 group].
(7) Choose “3” for the number of charts.
◊
(8) Choose “4” for the number of channels.
◊
(9) Click Automatic Chart Creations/Create Charts. At this point
◊
your chart appears on the Main Window.
(10) Click on the Display Configuration button (item 7, see figure on
◊
page 1-8). Though you usually won’t do this at this point, this
act permits you to see a representation of your configuration,
and permits you to make changes.
You should end up with a configuration display of two groups, each with 3 charts, and each chart with 4
channels [for standard ChartView users the display will be for 1 group only].
Because Automatic Chart Creation was chosen (starting with Channel 1) for ChartView Plus users, the Channel
arrangement was automatically assigned as follows:
Group 1
Chart 1
Chart 2
Chart 3
By using the mouse arrow and clicking on a Group, Chart, or Channel you will alter the appearance of the
CH1, CH2, CH3, CH4
CH5, CH6, CH7, CH8
CH9, CH10, CH11, CH12
Group 2
Chart 1
Chart 2
Chart 3
CH13, CH14, CH15, CH16
CH17, CH18, CH19, CH20
CH21, CH22, CH23, CH24
display, but not alter its actual configuration. For example, in the previous Display tree figure we see channels 1
through 4 assigned to Chart 1 of the first Group.
(11) ChartView Plus users: click on the word/number “Group 2.”
◊
(12) ChartView Plus users: click on the word/number “Chart 3” (of Group 2). You should now see channels
◊
21 through 24 listed at that location.
The channels in the setup you just created will be automatically enabled and will appear in chart form on
ChartView’s Main Window. The Channels will overlap on their assigned Chart, and will be visible when the
applicable Group is selected. Note that only one group of charts can be viewed at a time, even if you are using
ChartView Plus.
You can enable additional channels from the Channel Configuration window. This allows you to acquire more
data; however, it will not change your display on ChartView’s Main Window. In other words, you can acquire
data from channels which you do not monitor.
(13) Click “Okay” to exit the dialog box.
◊
ChartScan User’s Manual ChartScan - Unit Startup and ChartView Tutorial 1-13
Page 20
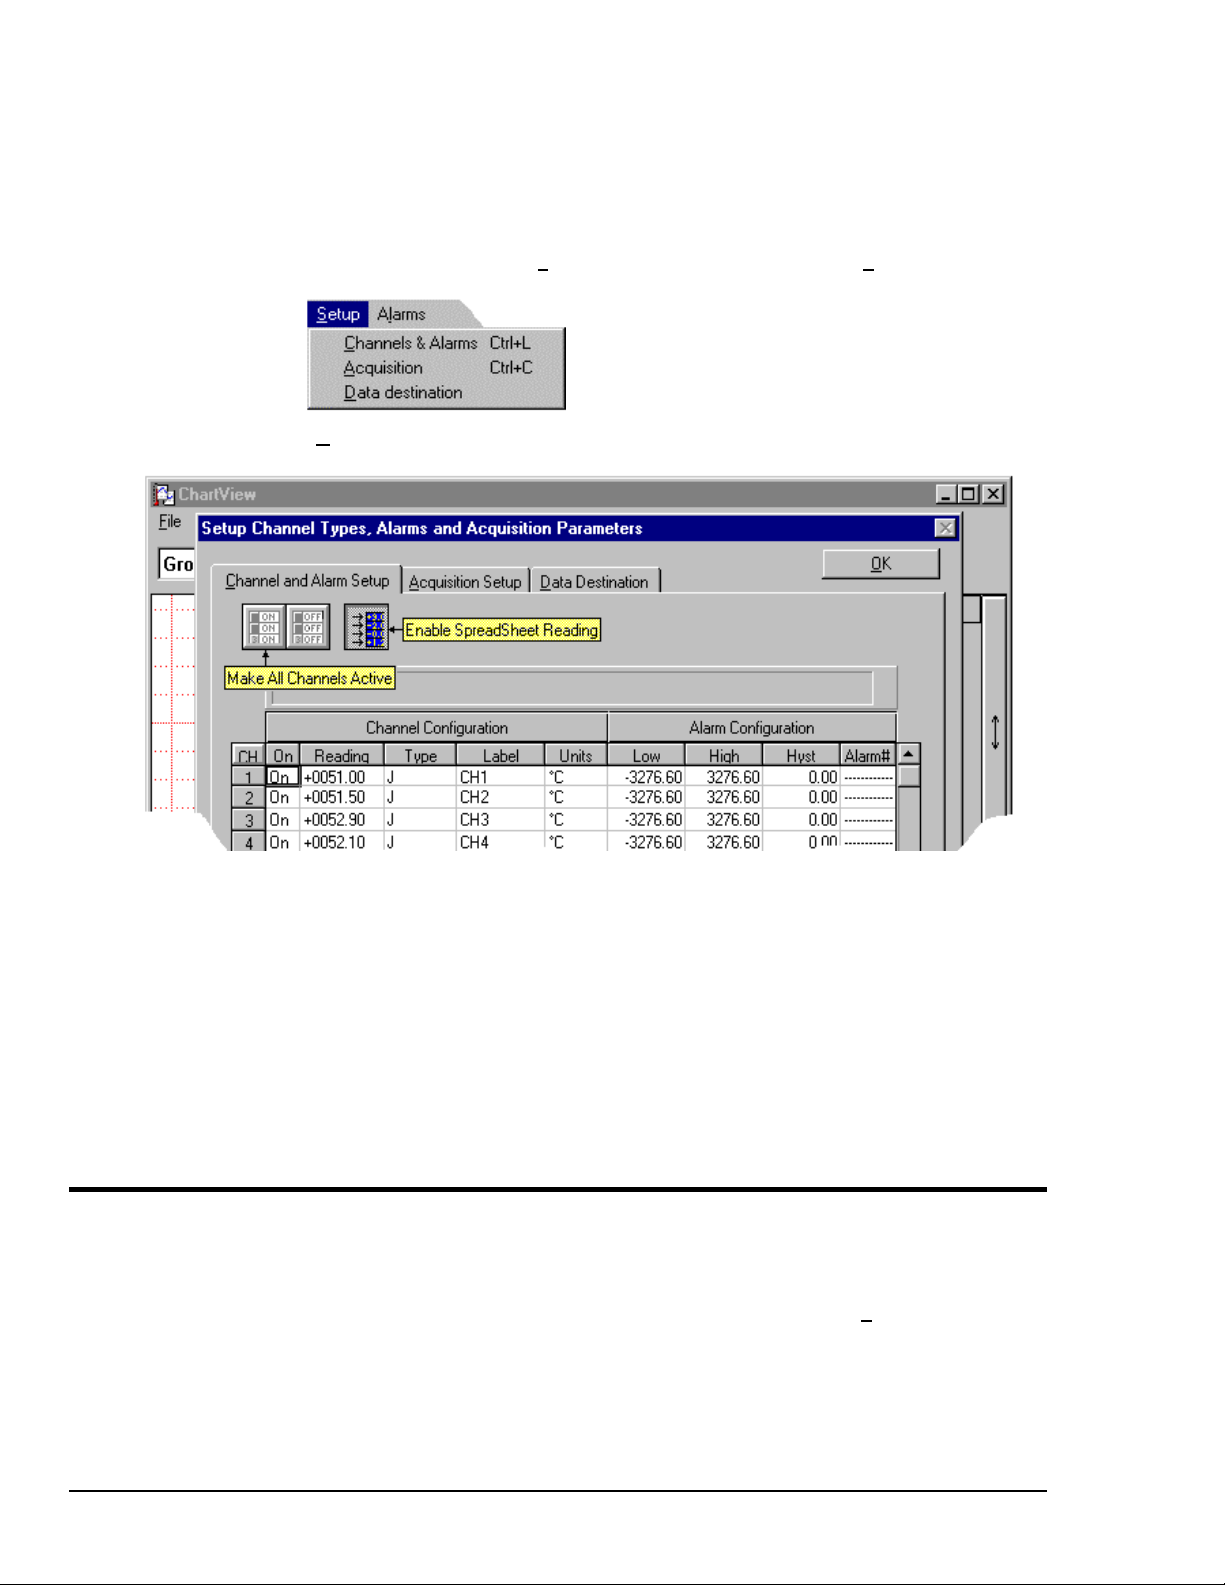
3. Configure Channels & Alarms
Configure channels and alarms as follows.
(14) On ChartView’s Main Window, click on Setup in the pull-down menu row. The S
◊
menu appears, allowing you to make more specific selections.
(15) Click on the Channels & Alarms selection. The Channel and Alarm Setup dialog box appears, similar
◊
to that shown in the following figure.
etup pull-down
(16) Enable the desired channels. You can enable channels by double-clicking on the applicable channel’s
◊
“On” column, obtaining “On” indicating enabled or “Off” indicating disabled. You can also use a
pull-down list which appears for enable/disable. See Chapter 4 if more detail is needed.
Note: Channels set up for your display will be automatically enabled. You can enable additional channels
for data acquisition. These additional channels will not appear on ChartView’s Main Window, but
data from them will still be acquired.
(17) Click on the “Enable SpreadSheet Reading” button (see previous figure). This activates the display
◊
scanned data in the reading column. Since we are in the Simulated Instrument mode, the Reading
column of the Analog Input SpreadSheet will now display simulated data. Selecting the Enable
SpreadSheet Reading button again will freeze the Reading column’s display.
4. Configure Acquisition.
(18) Click on the Acquisition Setup tab (see previous figure). An Acquisition Configuration dialog box
◊
appears. The box can be in either of two modes – (1) Normal, or (2) High-speed, single channel.
Note that you can also access the Acquisition Configuration dialog box from the Setup pull-down
menu or the Channel Configuration button (item 8, page 1-8).
The information entered in the Acquisition window is used by the Arm Acquisition command to set up
the acquisition of data to disk. When the trigger is satisfied, the scans are collected at the selected scan
frequency and stored to disk in the designated file.
1-14 ChartScan – Unit Startup and ChartView Tutorial ChartScan User’s Manual
Page 21
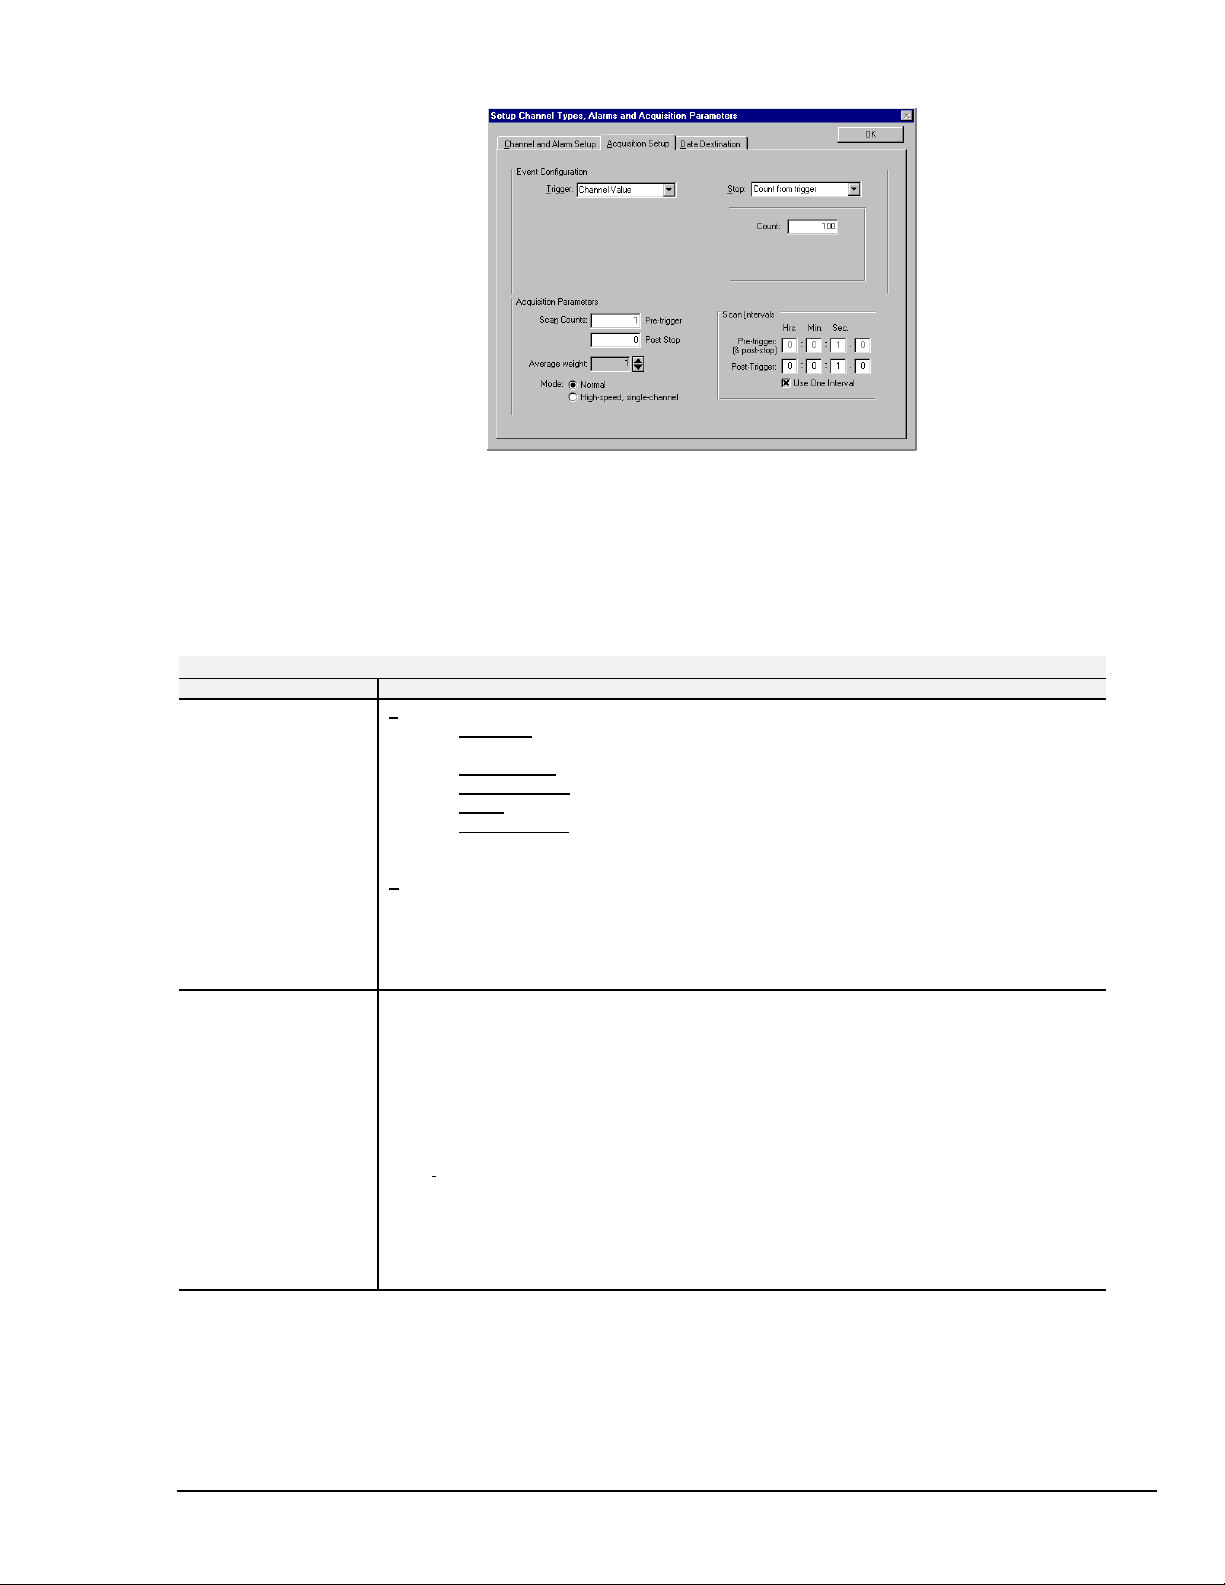
Acquisition Dialog Box, Normal Mode
(19) Click “Okay” to exit the Acquisition dialog box. Note that we are using the Acquisition default settings,
◊
and the Data Destination default settings in this tutorial (as shown in the above figure).
Note: The following table provides a brief description of various acquisition setup parameters.
Acquisition Setup
Parameter
Event Configuration
Trigger: Set a trigger scan in the Acquisition by using one of the following:
Keyboard - Use Console Trigger dialog box to start trigger scan.
Note: If the Keyboard Trigger is selected the use of Pre-trigger is disabled.
External TTL - Use an external signal to start the trigger scan.
Channel Value - Use specified value of a given channel.
Alarm - Use an Alarm value to start the trigger scan.
Absolut e Time - Use a time of day to start the trigger scan.
Note: If Absolute Time is selected, the use of Auto Re-arm is disabled.
Options
Stop: Set a stop scan in the Acquisition by using one of the above selections or Count (as
specified below). Keyboard isn’t applicable. If a MultiScan or ChartScan is connected
and High-Speed Single-Channel (Burst Mode) is selected, then “Count from trigger” is
the only Stop available for the event configuration.
Count: Specify a number of scans to be read before a stop scan is set.
Acquisition Parameters
Scan Counts: Specify the number of scans in an acquisition
Average weight: Average weight can be specified only when in the Normal Mode. The value for
Scan Intervals: Time between scans (frequency of scans)
High Speed Setup:
Pre-trigger
Post Stop
the average weight determines the number of samples to be averaged when in
Normal Mode. Values of 1, 2, 4, and 8 are for high-speed multiple channel
applications for thermocouples and DC voltages where noise filtering is not an
issue.
Values of 16, 32, 64, 128, and 256 are recommended for AC noise rejection.
Pre-trigger and Post Stop
Post-trigger
Use one Interval
Allows for channel and scan rate entries for high-speed, single channel mode.
Note: These parameters cannot be altered while an acquisition is in progress.
ChartScan User’s Manual ChartScan - Unit Startup and ChartView Tutorial 1-15
Page 22

5. Review Configuration.
Reviewing the configuration prior to data acquisition is optional; however, you should complete a
review at this time (in the tutorial) to help with your familiarization of ChartView. In an actual
application, a review such as this provides you with a chance to correct configuration errors.
Device Interface
(20)
◊
Check the Interface and Status via the Device pull-down menu.
Channel Configuration
(21)
◊
Check channel and alarm configuration settings via the Channel Configuration Dialog Box. Access this box
through the Setup pull-down menu.
Acquisition Parameters
(22)
◊
Check the acquisition parameters via the Acquisition Configuration Dialog Box. This box can be accessed
through the Setup pull-down menu.
Data File Parameters
(23)
◊
Check Data File Parameters. These parameters can be set from the Data Destination Dialog Box (accessible from
the Setup pull-down menu), and from the Data File Parameters selection accessible from the D
menu.
6. [Optional]. Save Configuration File.
Although the updated
you want to manually initiate a save. This will help you save time if an error occurs that may corrupt
your configuration. You may create a new configuration file by using an existing one and making the
necessary changes. In actual applications, use the File pull-down menu to manually save configuration
files, if this option is desired.
Note: The
.cvw
file contains all setup information. Setup information includes channel information, alarm
configurations, and acquisition configuration information.
Chartvw.cvw
ata pull-down
file will automatically save upon Exit, there may be times when
7. [Optional]. Check the System Inventory and Device System Time.
Check the System Inventory and Device System Time via the Status selection from the
down menu.
In an actual application, if the System Inventory and Device System Time configurations were
acceptable, you would proceed to Arm an Acquisition by clicking the Arm Acquisition button (item 10,
page 1-8), or by using the Arm Acquisition selection in the Acquire pull-down menu.
8. Start Charts.
(24) Push the Start Charts and Indicators button (item 2, page 1-8). Charts will begin scrolling. More
◊
detailed information pertaining to the charts and the ChartView Main Window appear in Chapter 4’s
ChartView Main Window section. In addition to viewing the data as charts, you can select the
Windows pull-down menu to select one or all of the following:
•
ChartView Analog Meters
• ChartView Digital Meters
•
ChartView Bar Graph Meters
(25) Select the Windows pull-down menu and try each meter option. Push the triangular play button of each
◊
meter’s specific toolbar to activate that meter.
Meters and charts can be on your computer screen at the same time. They can be re-sized and
repositioned as desired. Analog, Digital, and Bar Graph meters are detailed in Chapter 4.
Note that a PostView Post Acquisition viewing program is also selectable from the Windows menu.
PostView is discussed in Chapter 5.
Device
pull-
1-16 ChartScan – Unit Startup and ChartView Tutorial ChartScan User’s Manual
Page 23

A Note In Closing.
This completes the tutorial. You may continue running ChartView in the simulated instrument mode
and try various options to get a better feel for the program. Remember, while in the simulated
instrument mode there are no ChartScan hardware concerns.
ChartScan User’s Manual ChartScan - Unit Startup and ChartView Tutorial 1-17
Page 24

ChartScan User’s Manual
Page 25

General Information 2
CAUTION
CAUTION
CAUTIONCAUTION
If equipment is used in any manner not specified in this manual, or if specification limits
are exceeded, the function of the equipment, as well as the protection provided by it, may
be impaired.
General Description……2-1
Operational Aspects……2-2
Data Handling and Triggering……2-2
Software and Hardware……2-2
ChartScan Specifications……2-3
General Description
ChartScan is an easy to use, advanced hybrid data recorder that combines the desirable features of common
paper-based strip-chart recorders with the latest PC-based data acquisition technology. In addition to chart
displays, ChartScan allows you to display digital, analog, and bar graph meters.
ChartScan requires no external signal conditioning or use of multiplexers. The unit can measure up to 64
differential input channels; and can easily be expanded up to 128 channels with the use of an expansion module.
ChartScan is well suited for temperature and voltage measurements requiring channel-to-channel isolation. This
isolation is made possible by the use of individual relays on each of the 64 channels. The unit provides 500 V
isolation for voltage inputs and 200 V isolation for thermocouples. The instrument scans at a rate of up to 147
channels per second and includes a single-channel burst mode for digitizing waveforms at rates up to 20 kHz.
Measurements include:
•
isolated temperature from thermocouples
DC volts
•
AC volts
•
waveforms
•
ChartScan includes ChartView, a software program which provides a Windows-based graphical-user-interface
approach to obtaining data collection and display; PostView, a post-acquisition data review program; and
ScanCal, a software application that automates instrument calibration.
Although ChartScan can acquire temperature readings at a rate of 147 channels/sec, you may also program the
unit to acquire data at specified time intervals using the
hh:mm:ss.t format. For the ultimate in flexibility, you
may also program separate pre-trigger and post-trigger sample rates. As an example, ChartScan can be
programmed to sample data once per hour and then sample once per second when channel 2 reaches 70°C.
An interface card can be plugged into ChartScan unit through a slot on the unit’s rear panel. When the only
interface desired is RS-232, no interface card is needed and the card interface port is shielded with a removable
protective cover.
Statistics such as High, Low, and Last are available for each channel for data reduction. In addition, up to
32 alarms may be programmed using the programmable high and low limits for each channel.
Optional software, shipped with separate documentation, includes the following:
CIMScan
is a HMI/SCADA application. A single screen can display data from [and control outputs of]
several acquisition devices connected through a network. With CIMScan, users can customized applications
accessing thousands of channels from network-connected devices. CIMScan does not require programming
knowledge.
ScanServer is a driver that permits access to multiple acquisition devices from popular HMI/SCADA
applications (including those from Wonderware
and Intellution.) ScanServer supports OPC/DDE-compliant
environments, such as Microsoft Excel.
ChartScan User’s Manual
12-28-98
2-1
Page 26

In addition to the features of ChartScan described thus far, the unit includes:
• Thirty-two TTL (Transistor-to-Transistor Logic) digital alarm outputs and 8 TTL-compatible
digital inputs.
• Two programmable scan rates: (1) a programmable scan rate for pre-trigger and post-trigger
sampling, and (2) a programmable scan rate for accelerated sampling on-event detection.
•
A built in real-time clock that synchronizes the acquisition to the time of day, and provides time
and date stamping for trend analysis. Time stamping may be in relative or absolute time.
• Standard RS-232 interface and optional IEEE 488 interface. Connection to computer can also be
made via a Hayes-compatible modem.
• 256 Kbytes of memory, expandable up to 8 Mbytes. If your application must gather large amounts
of data, options are available for expanding the standard 256 kB of memory to 1 MB, 4 MB, or
8 MB. Readings may then be transferred at greater than 300 Kbytes per second over the IEEE 488
bus or up to 9,600 baud using its standard RS-232 serial port. Though the RS-232 serial interface
is always available with ChartScan, an interface card must be used for IEEE 488 applications.
• Capable of channel expansion up to 128 channels with the use of a CSN/Exp expansion chassis.
Operational Aspects
Data Handling and Triggering
Note: Also see Software & Hardware table and ChartScan Specifications.
Data Handling
Built-in memory
RS-232 interface
Time & date stamping
Digital inputs
Programmable alarm
outputs
Triggering
Digital trigger input
Analog trigger input
Trigger on “time of day”
Pre-trigger scan rate
Post-trigger scan rate
256 Kbyte
3
3
8
32
3
3
3
Programmable
Programmable
Software and Hardware
Software
ChartView
PostView
ScanCal
CIMScan
ScanServer
(optional)
(optional)
2-2 General Information ChartScan User’s Manual
Page 27
16-Channel Signal Conditioning Cards (Optional)
Low-voltage
terminal block input module
Low-voltage
module
Low-voltage
input module
Isolated TC/voltage
plug type input module
Isolated high-voltage
safety jack input module
Cables
CA-7-3,
CA-47,
Computer-to-ChartScan Cable
PC/AT/XT serial port (9- & 25-pin sub D) to ChartScan (9-pin sub D)
RS-232/422 cable, 6 ft.
Note: A 10BASE-T cable and 10BASE-T crossover adapter are included
with the optional Net232 Ethernet/RS-232 converter.
with removable
with BNC input
with safety jack
with
with
Shielded IEEE 488 cable, 6 ft.
(CSN14/LV/T)
(CSN14/LV/B)
(CSN14/LV/S)
(CSN14/TC/P)
(CSN14/HV/S)
Additional Hardware Options
4-slot expansion chassis
Memory expansion options:
1 Mbyte, 4 Mbyte, or 8 Mbyte
IEEE 488 interface card (see important notice, below)
16 output CSN/Relay card
Net232, Ethernet/RS-232 Converter
An IOtech Personal488 product is required for
IEEE 488 operation with ChartView. A device
named WAVE must be configured in IOtech
Driver 488/W31, /W95, or /WNT (when available).
ChartScan Specifications
If equipment is used in any manner not specified in this manual, or if specification limits
are exceeded, the function of the equipment, as well as the protection provided by it,
may be impaired.
NOTE: Specifications for signal conditioning cards and for the ChartScan Expansion Chassis appear in their
respective sections of this manual.
Measurement Parameters
A/D resolution
Accuracy (with type J TC)
TCs supported
DCV
ACV
Ch-to-ch isolation
Ch-to-system isolation
AC line rejection
Scanning Parameters
Switching Technology
Max scan rate
Max single-ch scan rate
Min channel configuration
Max channel configuration
CAUTION
CAUTION
CAUTIONCAUTION
16 bit w/over sampling
± 0.5°C
J,K,T,E,R,S,B,N
3
3
500 V or 200 V
500 V
3
mechanical relays
147 chs. per sec.
20 Khz
16 channels
128 channels
General Information ChartScan User’s Manual 2-3
Page 28

General
Installation Category:
• CE: Category 2 for Line Voltage Input terminal.
All other terminals are Category 1.
Warm Up:
•
1 hour to rated accuracy.
Expansion Connector:
•
40-conductor connector for connecting expansion chassis via ribbon cable.
ChartScan’s expansion connector (PH401) is located on the analog backplane.
Chassis Ground Connection:
•
Screw terminal.
Dimensions:
•
330 mm wide × 241 mm deep × 152 mm high (13” × 9.5” × 6”).
Weight:
• ≈ 6.75 kg (15 lbs.) with 4 signal conditioning cards installed
Operating Environment:
• Standard: Indoor use, 0 to 50°C;
0 to 95% RH (non-condensing) to
35°C; linearly derate 3% RH/°C
from 35 to 50°C.
Control:
• Power Switch, RS-232 or IEEE 488 option, handshake, parity, baud rate,
calibration memory write enable/disable.
Rear Panel LED Indicators:
• ALARM, TRIGGER and SCAN; SEND and RECEIVE (for standard serial
interface); ERROR and POWER.
•
TALK, LISTEN and SRQ (on optional IEEE 488 interface card)
Power:
• 105-125V, or 210-250V, 50/60 Hz; 20 VA maximum. Set via internal,
two-position slide switch.
Transient Overvoltage according to Installation Categories:
•
Overvoltage Category II for mains supply. The minimum and normal
category is II.
Pollution Degree:
•
I − in accordance with IEC 664
• CE: Indoor use at altitudes below 2000 m,
5 to 40°C; 0 to 80% RH up to 31°C
decreasing linearly to 50% RH at 40°C.
Channels
Number of Option Card Slots:
• 4
Number of Channels:
•
up to 64 channels, expandable to 128 with ChartScan expansion chassis
• 16 channels per card
•
up to 4 cards installed in ChartScan
(up to 4 additional cards with use of ChartScan expansion chassis)
Channel Attributes:
• High and low set points; hysteresis values for high and low set points.
Scan Sequence:
•
Any combination of temperature and voltage channels may be scanned, but
channels are scanned in ascending numerical order.
Scan Interval:
• Absolute time between scans (
max = 99:59:59.9. Note: Specifying a value of 00:00:00.0 results in no delay
between channel scans.
2-4 General Information ChartScan User’s Manual
hh:mm:ss.t); min = 00:00:00.0,
Page 29

Triggers
Installation Category:
• CE: Category 1
Programmable Triggering:
• Temperature or Voltage level (above or below), absolute time of day, alarm
condition (on or off), IEEE GET, IEEE TALK, external TTL trigger (rising or
falling), specified number of readings.
Temperature-Level Trigger:
•
Programmable value for any one channel. Not available in Burst mode.
TTL Trigger:
• Programmable for rising or falling edges.
Pre-Trigger Count and Post-Trigger Count:
• Programmable integer (< memory size -1); and programmable integer..
Digital Filtering:
• Average 16 samples at 50/60 Hz for line cycle noise.
TC Reference:
• TC reference tables based on the IPTS-68 standard as listed with the US
Department of Commerce (NTIS). International Electrotechnical
Commission (IEC) 43 760.
Trigger Input Connector:
External BNC connector
Data Storage & Format
Trigger Output Connector:
External BNC connector
Storage:
•
128 K reading (256 Kbyte) standard; optional 500 K reading (1 Mbyte), 2 M
reading (4 Mbyte), 4 M reading (8 Mbyte).
Data Formats:
• ASCII and binary; binary format returns a 16-bit compensated and linearized
temperature value (0.1°C/bit); user-programmable for hi/low byte or low/hi
byte. Note: High speed DMA transfers are binary format only.
Statistical Parameters:
• High, Low, and Last available per channel (during acquisition only). Not
available in single channel burst mode.
Time Stamp:
• Available for each scan group and for each channel’s high, low, and last
parameters.
Time Format:
•
Relative time (
date and time (
burst mode.
Alarm Stamp:
•
Available for each scan group. Not available in single channel burst mode.
hh:mm:ss.mil), absolute time (hh:mm:ss.mil) or absolute
dd/mm/yy hh:mm:ss.mil). Not available in single channel
General Information ChartScan User’s Manual 2-5
Page 30
Digital I/O Interface & Alarms
Installation Category:
• CE: Category 1
Number of Digital Inputs:
• 8 bits, LS-TTL compatible.
Number of Digital Outputs:
•
32 bits, TTL level compatible. Can be programmed as alarms.
Note: The 32 TTL outputs can be set or cleared via program control.
Alarm Conditions:
• May be detected by
Alarm Update Rate:
• Alarms are updated whenever a channel assigned to an alarm is measured.
Connector:
• Female DB50 50-pin (32 Alarms, 8 digital inputs, 10 ground pins), mating
connector supplied.
Note: See chapter 3 for information regarding External TTL BNC Connectors.
Service must be performed by qualified personnel. All electrical connections to device,
including the AC line and analog inputs, must be disconnected prior to opening ChartScan
main unit or expansion chassis casing. Internal voltage potentials exist which could cause
bodily injury or death!
SRQ
or by software query (SPOLL or U command).
WARNING
WARNING
WARNINGWARNING
WARNING
WARNING
WARNINGWARNING
ChartScan’s ground (on the AC power connector) must be connected to an external earth
ground. Failure to make such a connection could present an electric shock hazard, causing
bodily injury or death!
Fuse:
1/2A, 250V, Slo Blo, 3AG for 100-140V power line, or
1/4A, 250V, Slo Blo, 3AG for 200-240V power line
CAUTION
CAUTION
CAUTIONCAUTION
Fuse failure indicates a possible problem within the device circuitry. If a fuse blows, contact
a qualified service representative. Replacement fuses are to be installed by qualified service
personnel with the unit disconnected from the power source and with all other terminals
disconnected. If the line voltage selector is changed, then the fuse designated for that line
voltage must be used.
2-6 General Information ChartScan User’s Manual
Page 31

Calibration
Calibration must be completed periodically to ensure equipment is accurate, and
can be performed manually, or with the use of ScanCal. Chapter 6 contains
instructions, including calibration equipment requirements, for the following:
ChartScan main unit calibration for offset and gain
Offset calibration for all card types
Gain calibration for low volts cards
Gain calibration for high volts cards
Cold junction calibration for TC cards
Note: ChartScan main unit constants are stored in NV-RAM.
Signal Conditioning Card constants stored in each card’s EEPROM.
Note: Industry standard calibration period is once every year.
General Information ChartScan User’s Manual 2-7
Page 32

−
Notes
2-8 General Information ChartScan User’s Manual
Page 33

Hardware 3
Overview ……3-1
Front Panel ……3-1
Rear Panel ……3-2
Power Aspects ……3-3
Changing the Voltage Setting ……3-3
Replacing the AC Power Supply Fuse ……3-4
Memory Configuration ……3-4
Expanded Memory Options ……3-4
Calibration Memory Write Enable/Disable ……3-6
RS-232/422 Interface Configuration ……3-6
Configuring RS-322/422 Parameters …… 3-6
Serial Port Pin Connectors ……3-8
Ethernet Interface Configuration ……3-9
IEEE 488 Configuration (Option) ……3-11
Digital I/O Lines ……3-13
Logic Levels ……3-13
Digital I/O Port Pinout ……3-13
Overview
This section provides information regarding ChartScan hardware. The chapter begins with brief discussions and
illustrations regarding the unit’s front and rear panels. The text is divided into sub-sections which include material
on voltage settings, fuse replacement, memory expansion, and serial interface configuration (RS-232/422). Ethernet
configuration is detailed in the Net232 User’s Guide, p/n 1037-0901.
External TTL BNC Connectors ……3-14
Signal Conditioning Cards ……3-14
CSN14/TC/P Thermocouple and Low Volts Card
with Subminiature Plugs ……3-15
CSN14/LV/ (T, B, & S) Low Voltage Cards ……3-17
CSN14/HV/S High Voltage Card with Safety Jack
Connectors ……3-18
CSN/Relay Card (for High-Current Digital-
Output) ……3-19
CSN/Relay Card Specifications ……3-20
Expansion Chassis, CSN/Exp (Option) ……3-20
Connecting the Expansion Chassis ……3-20
Automatic Channel Assignment ……3-22
Additional hardware-related topics are included, such as signal conditioning cards and the optional ChartScan
Expansion Chassis.
Front Panel
ChartScan’s front panel reveals up to four sets of connectors, one set for each signal-conditioning card used. The
front panel contains no switches or other types of control. Each connector row is dependent upon the type of signal
conditioning card used. With different combinations of cards, a variety of setups is possible.
ChartScan Front Panel, One of Many Possible Set-ups
ChartScan User’s Manual,
12-28-98
3-1
Page 34

Rear Panel
ChartScan’s rear panel contains several items, including a set of LEDs for status indication. The LED indicators are
described in the following table. Other rear panel items are listed in a separate table following the illustration.
LED Indicators, Chassis
ALARM ON when an alarm has occurred. The indicator remains ON until the alarm condition clears.
TRIGGER Flashes when ARMed (waiting for a trigger), is ON continuous when triggered; is OFF when
SCAN ON when ChartScan is storing a channel scan in its internal buffer.
SEND ON when transmitting data to the serial interface (for RS-232 operation only).
RECEIVE ON when receiving data from the controlling computer (for RS-232 operation only).
ERROR
POWER ON when power is applied to ChartScan and the power switch on the back panel is in the ON
OFF when no alarm condition exists.
data collection is finished. Trigger is also turned OFF by IEEE DCL or SDC.
ON when an error has occurred, OFF when no error condition exists. See the Error Query (E?)
command for more information.
position (depressed). OFF if power is not present.
Item Description
Power
Connector
Power Switch
Chassis Ground
Calibration
Enable/Disable
Trigger In
TTL Output
Alarms & Digital I/O
(DB50) Connector
RS-232/422 (DB9)
Connector
DIP Switch
Interface Card Slot
LED Indicators
Provides a means for connecting ChartScan to one of two voltage supplies:
105 - 125V, or 210 - 250V. The connected power supply must agree with that selected by
ChartScan’s internal slide switch (described later in this chapter).
Turns power ON or OFF.
A single point grounding node for, but not limited to, thermocouple shield termination.
Pushbutton used to enable/disable the hardware protected portion of NVRAM during ChartScan
main unit calibration. Note that this pushbutton does not exist on early production units.
Early production units use micro-switch #9 (on the DIP switch) instead of a calibration
pushbutton.
Refer to Chapter 6 for detailed information regarding calibration.
BNC Trigger input for initiating and/or stopping acquisition with TTL input signal
BNC TTL Scan output signal occurs for each channel scan; used for synchronizing other
equipment with ChartScan acquisition.
DB50 connector offers easy access to Alarms and Digital I/O (32 digital outputs and 8 digital
inputs)
Serial port for operation at remote distances from controlling computer. Supports various baud
rates using RTS/CTS or XON/XOFF handshaking. When ChartScan is configured for
RS-232 serial communications, this port can be used to connect ChartScan to a Net232
ethernet/RS-232 converter for ethernet operations. Refer to the Net232 User’s Guide for
ethernet-related information.
Used for selecting RS-232 or RS-422 and respective communication parameters, i.e.,
handshaking, parity and Baud Rate. Also allows for section of IEEE 488 and address
settings. An IEEE 488 interface card is required for IEEE 488 operations.
For installing the optional IEEE 488 interface card. Note that RS-232 serial interface is the
default and is possible with or without an interface card.
See previous table, LED Indicators, Chassis.
ChartScan Rear Panel
3-2 ChartScan User’s Manual
Page 35

Power Aspects
Changing the Voltage Setting
Based on your order, your ChartScan system was set at the voltage indicated by a sticker or tag (located on the rear
of the unit, near the power switch). If you need to change the voltage selection, complete the following steps.
Never disassemble ChartScan’s case while it is connected to the AC power line! Internal
voltage potentials exist which could cause bodily injury or death!
Prior to disassembly:
(1) turn off power
(2) disconnect analog lines
(3) disconnect AC power line
(4) disconnect all additional lines
Never disconnect the AC power line from ChartScan while analog connections to an
external device exist! Common mode voltage potentials exceeding 60 VDC or 30 Vrms may
exist which could cause bodily injury or death!
Use approved ESD precautions, including static-free work area and grounded wrist strap,
when handling circuit boards and electronic components. Failure to do so could cause
equipment damage due to electrostatic discharge.
WARNING
WARNING
WARNINGWARNING
WARNING
WARNING
WARNINGWARNING
CAUTION
CAUTION
CAUTIONCAUTION
1. Ensure the ChartScan is not connected to any power source.
2. Remove two upper side screws (near front of unit, and on side of unit) and slide top cover plate free of
ChartScan unit.
3. Locate the two-position slide on the power supply board. You will notice the switch above the AC
power inlet. The number visible (115 or 230) indicates the selected power setting.
4. As indicated in the figure, press down on the switch to change the setting from 115VAC to 230VAC;
or, to change the setting from 230 to 115VAC, you press up on the switch.
5. Replace ChartScan’s cover plate and secure with screws.
6. Add a new sticker, or tag, stating the newly selected voltage.
Hardware 3-3
Page 36

Replacing the AC Power Supply Fuse
Fuse: 1/2A, 250V, Slo Blo, 3AG for 105-125V power line, or
1/4A, 250V, Slo Blo, 3AG for 210-250V power line
Fuse failure indicates a possible problem within the device circuitry. If a fuse blows, contact
a qualified service representative. Replacement fuses are to be installed by qualified service
personnel with the unit disconnected from the power source and with all other terminals
disconnected. If the line voltage selector is changed, then the fuse designated for that line
voltage must be used.
Replace the AC power supply fuse as follows:
1. Turn ChartScan’s power to “OFF.”
2. Open the fuse drawer on the rear panel.
3. Remove the fuse.
4. Ensure correct rating of replacement fuse.
5. Install replacement fuse.
6. If you changed the value of the fuse due to a new voltage selection, replace the spare fuse with a fuse of
the new value.
CAUTION
CAUTION
CAUTIONCAUTION
7. Close the fuse drawer until it snaps into place.
Memory Configuration
Memory configuration of ChartScan consists of installing expanded memory boards (optional), and selecting writeenable or write-disable for calibration memory.
Expanded Memory Options
ChartScan can accommodate up to 8 MBytes of memory, which is ideal for both high-speed and long-term data
logging. Measurements can be stored in memory and read out by a controlling computer as time permits.
ChartScan provides three options for expanding the standard 256 KB of memory to 1 MB (CSN/MEM1),
4 MB (CSN/MEM4), or 8 MB (CSN/MEM8). To install a memory option into the unit, perform the following steps:
3-4 ChartScan User’s Manual
Page 37

WARNING
WARNING
WARNINGWARNING
Never disassemble ChartScan’s case while it is connected to the AC power line! Internal
voltage potentials exist which could cause bodily injury or death!
Prior to disassembly:
(1) turn off power
(2) disconnect analog lines
(3) disconnect AC power line
(4) disconnect all additional lines
WARNING
WARNING
WARNINGWARNING
Never disconnect the AC power line from ChartScan while analog connections to an
external device exist! Common mode voltage potentials exceeding 60 VDC or 30 Vrms may
exist which could cause bodily injury or death!
CAUTION
CAUTION
CAUTIONCAUTION
Use approved ESD precautions, including static-free work area and grounded wrist strap,
when handling circuit boards and electronic components. Failure to do so could cause
equipment damage due to electrostatic discharge.
1. Turn off the power, disconnect the analog cables, the power line cord, and then all other test cables from the
interface.
2. Remove two upper side screws (near front of unit) and slide top cover plate free of ChartScan unit. Remove the
expansion chassis, if applicable.
3. Locate memory SIMM sockets JP201 and JP202 on the microprocessor board. This board is mounted vertically
near the center of the ChartScan unit.
4. Remove the 256 KB module from JP201.
5. Install the applicable memory option according to the following table.
Memory Option JP201 JP202
CSN/MEM1 (1 MB) Insert a 1 MB module. Remains unoccupied.
CSN/MEM4 (4 MB) Insert a 4 MB module. Remains unoccupied.
CSN/MEM8 (8 MB) Insert a 4 MB module. Insert a 4 MB module.
Note: For re-assembly, first reconnect the AC power line, next reconnect the analog terminals, and then any
other cables, prior to reapplying power to the entire system.
6. Carefully reassemble the ChartScan unit.
Hardware 3-5
Page 38

Calibration Memory Write Enable/Disable
ChartScan’s constants for chassis calibration and the calibration password are stored by ChartScan in Non-Volatile
RAM (NV-RAM). The password is a safety feature used to prevent unauthorized personnel from entering
calibration mode and altering the calibration constants.
As a safeguard, the calibration password and chassis calibration constants are hardware protected by use of a
Calibration Enable/Disable switch (pushbutton, or micro-switch, as described in the following notices).
Calibration mode disabled is the factory default setting. This setting should not be changed, unless you want to
change the password or chassis calibration constants.
Ensure calibration mode is “disabled” during normal ChartScan operation. Otherwise, the
calibration password and calibration constants may become corrupt and normal operation may
be disrupted.
Standard ChartScan units have a Calibration Enable/Disable Pushbutton.
CAUTION
CAUTION
CAUTIONCAUTION
If it is necessary to change the calibration password (via the
chassis, the calibration mode can be enabled by indenting the pushbutton. For details on
calibration, refer to Chapter 6, ChartScan Calibration.
Early production ChartScan units do not have a Calibration Enable/Disable Pushbutton. These
units enable and disable the calibration mode using micro-switch number 9 (on the DIP switch).
If it is necessary to change the calibration password (via the *K
chassis, the calibration mode can be enabled by setting micro-switch 9 to the “up” (1 position).
For details on calibration, refer to Chapter 6, ChartScan Calibration.
RS-232/422 Interface Configurations
Configuring RS-232/422 Parameters
The RS-232/422 interface is only to be used for serial communications. Cable length should not
exceed 50 feet (15 meters).
• The DIP switch is only read when power is first applied to ChartScan, and for that reason
must be set before applying power to the unit.
CAUTION
CAUTION
CAUTIONCAUTION
command) or to calibrate the
*K
command) or to calibrate the
• RS-232 configuration is required when using a Net232 ethernet/RS-232 converter.
Note: Unless an interface option is used, ChartScan’s serial port operation will be with RS-232 electrical
characteristics. For serial port use, ChartScan’s rear panel DIP switch settings determine the baud rate, stop
bits, parity, and handshake.
Use the following steps when you desire to change RS-232/RS-422 serial port parameters. Note that there are
separate steps for early production units.
3-6 ChartScan User’s Manual
Page 39

Steps for RS-232/422 Configuration
Standard Units, Only
1. Turn the ChartScan system’s power “OFF.” 1. Turn the ChartScan system’s power “OFF.”
2. Ensure the COMM SELECT micro-switch (on the
rear-panel DIP switch) is in the “0” (down)
position.
3. Adjust micro-switches 2 through 9 (for parameter
preferences), according to the following table for
standard units.
Note: Early production ChartScan units do not have a Calibration Enable/Disable Pushbutton. If you have an
early production unit, refer to the right-hand DIP switch illustration, above.
RS-232/422 Serial Settings (Standard Units) RS-232/422 Serial Settings (Early Production Units)
Selection Micro-
COMM
SELECT
HANDSHAKE
(H/S)
PARITY 4,5 0, 0 - No Parity
Switch
#
1 0 – Serial Communication; RS-232 or
RS-422 depending on switch 9.
1- Selects IEEE 488.
2,3 0, 0- No Handshake
0, 1- Software Handshake Only
(XON/XOFF)
1, 0- Hardware Handshake Only
(RTS/CTS)
1, 1- Both Hardware and Software
Handshake
0, 1- Odd Parity
1, 0- Even Parity
1, 1- N/A
Setting Selection Micro-
Early Production Units, Only
2. Ensure the COMM SELECT micro-switch (on the
rear-panel DIP switch) is in the “1” (up) position.
3. Adjust micro-switches 2 through 8 (for parameter
preferences), according to the following table for
early production units.
Switch
#
COMM
SELECT
1
HANDSHAKE
(H/S)
PARITY 4,5 0, 0 - No Parity
1 0- selects IEEE 488 interface card.
1- Selects RS-232/422.
2,3 0, 0- No Handshake
0, 1- Software Handshake Only
(XON/XOFF)
1, 0- Hardware Handshake Only
(RTS/CTS)
1, 1- Both Hardware and Software
Handshake
0, 1- Odd Parity
1, 0- Even Parity
1, 1- N/A
Setting
1
SERIAL
BAUD RATE
RS-232 or
RS-422
1
ChartView software will not run when Handshake is set for “Software Handshake Only,” (0, 1).
2
It is recommended that you do not exceed 9600 Baud unless you have firmware version 1.3 or greater. The firmware version can be read in
ChartView’s title bar.
3
At 9600 and 19200 Baud Rates, Hardware Handshake should be set to “Hardware Handshake Only” (1, 0). We recommend that you do not
exceed 9600 Baud unless you have firmware version 1.3 or greater. The firmware version can be read in ChartView’s title bar.
Hardware 3-7
6,7,8 0,0,0- 300 Baud
2
9 0- Selects RS-232 serial*
0,0,1- 600 Baud
0,1,0- 1200 Baud
0,1,1- 2400 Baud
1,0,0- 4800 Baud
1,0,1- 9600 Baud
1,1,0- 19200 Baud
1,1,1- N/A
1- Selects RS-422 serial*
* (switch #1 must be in the “0” position)
SERIAL
BAUD RATE
3
3
CALIBRATION
MODE
6,7,8 0,0,0- 300 Baud
2
9 0- Calibration Mode Disabled
0,0,1- 600 Baud
0,1,0- 1200 Baud
0,1,1- 2400 Baud
1,0,0- 4800 Baud
1,0,1- 9600 Baud
1,1,0- 19200 Baud
1,1,1- N/A
1- Calibration Mode Enabled
(normal position is “0”)
3
2,3
Page 40

Serial Port Pin Connectors
An optional CA-47 cable (or equivalent) connects ChartScan to the computer. The ChartScan side of the cable has a
male DB9 connector for use with the RS-232/422 serial port. The cable’s computer side has 2 connectors: one for
DB9, and the other for DB25. Other crossover-type cables can be used if wired as shown in the figure. The
following table lists the RS-232 and RS-422 pin connections for a DB9.
Computer NetScan
DB25
5
2
4
73
DB25
TXD 2
RXD 3
CTS 5
GND 7
RTS 4
DB9
2 RXD
3 TXD
5 GND
7 RTS
8 CTS
Interface Wiring Diagram
Computer NetScan
DB9
2
35
8
7
DB9
RXD 2
TXD 3
GND 5
RTS 7
CTS 8
DB9
2 RXD
3 TXD
5 GND
7 RTS
8 CTS
Pin # RS-232
Pin Description
1 No connection N/A
2 Receive Data (RxD-) Input
3 Transmit Data (TxD-) Output
4 No connection N/A
5 Ground Ground
6 No connection N/A
7 Request to send (RTS-) Output
8 Clear to send (CTS-) Input
9 No connection N/A
Signal
ChartScan to PC Connection
DB9 Male
Pin & Signal
2 RxD-
3 TxD-
5 GND
7 RTS-
8 CTS-
ChartScan Connection
DB9 Male
Cable
Wiring
⇐⇐⇐⇐
⇒⇒⇒⇒
⇔⇔⇔⇔
⇒⇒⇒⇒
⇐⇐⇐⇐
(RS-422)
Cable Wiring
Pin & Signal
1 RxD+
2 RxD-
3 TxD-
4 TxD+
5 GND
6 RTS+
7 RTS-
8 CTS-
9 CTS+
(RS-232)
DB9 Female
Pin & Signal
3 TxD-
2 RxD-
5 GND
8 CTS-
7 RTS-
⇐⇐⇐⇐
⇐⇐⇐⇐
⇒⇒⇒⇒
⇒⇒⇒⇒
⇔⇔⇔⇔
⇒⇒⇒⇒
⇒⇒⇒⇒
⇐⇐⇐⇐
⇐⇐⇐⇐
3-8 ChartScan User’s Manual
Page 41

Serial Port Pin Connector Signals for RS-232/422 Applications
RxD- (Receive Data Negative) Input: This pin accepts serial data sent by an RS-232 or RS-422 device. The serial data
received is expected to match the word length, baud rate, stop bits, and parity configuration of the particular port. The signal is
low true.
RxD+ (Receive Data Positive) Input: This pin accepts serial data sent by an RS-422 device only. The signal is high true.
TxD- (Transmit Data Negative) Output: This pin transmits serial data to an RS-232 or RS-422 device. The serial data
received is sent with the word length, baud rate, stop bits, and parity configured for the particular port. The signal is low true.
TxD+ (Transmit Data Positive) Output: This pin transmits serial data to an RS-422 device only. The signal is high true.
CTS- (Clear To Send Negative) Input: CTS- input is used as a hardware handshake line to prevent ChartScan from
transmitting serial data to an RS-232 or RS-422 device when it is not able to accept it. When RTS/CTS handshaking is selected,
ChartScan will not transmit data out TxD- while this signal is un-asserted (low). If XON/XOFF or no handshaking is selected,
the CTS- line is ignored when transmitting data. The signal is low true.
CTS+ (Clear To Send Positive) Input: CTS+ input is used as a hardware handshake line to prevent ChartScan from
transmitting serial data to an RS-422 device when it is not able to accept it. The signal is high true.
RTS- (Request To Send Negative) Output: RTS- output is used as a hardware handshake line to prevent an RS-232 or RS-422
device from transmitting serial data to ChartScan when it is not able to accept it. When automatic RTS/CTS handshaking is
selected, ChartScan will assert (high) the RTS- signal when greater than 4096 memory locations are available in its internal
buffers. If available memory drops below 4096 bytes, ChartScan unasserts (low) the RTS- signal. The signal is low true.
RTS+ (Request To Send Positive) Output: RTS+ output is used as a hardware handshake line for an RS-422 device. The
signal is high true.
GND (Ground): This signal sets the ground reference point for the other RS-232/RS-422 input and output signals.
Ethernet Interface Configuration
Your ChartScan unit can be operated over the ethernet provided it is configured for RS-232 serial communications
and it is properly connected to a network via a Net232 ethernet/RS-232 converter. For detailed instructions refer to
Net232 User’s Guide, part number 1037-0901.
Hardware 3-9
Page 42

IEEE 488 Interface Configuration (Option)
The IEEE 488 interface option is intended for digital communication with IEEE 488 compliant computer platforms,
as well as IEEE 488 compliant platform-independent configurations. Data is transmitted parallel, as opposed to
serial. The IEEE 488 option allows for up to 15 devices to be connected to one bus; with a total bus length of up to
20 meters. Allowable cable distance between devices is up to 2 meters. Message transactions are hardware
handshaked.
This section describes the configuration for ChartScan that will be commanded through the IEEE 488 bus when
using ChartScan’s IEEE 488 interface option. To use this option, an IEEE 488 interface card must be installed in
ChartScan’s interface slot and the rear panel DIP switch must be properly configured for IEEE 488. Note that all
IEEE 488 bus devices, including ChartScan (when the IEEE 488 interface option is used) must have an IEEE 488
bus address. The micro-switches 4 through 8 (on the rear panel DIP switch) can be used to assign an IEEE 488
address. Switch setting are discussed in, IEEE 488 Configuration, presented shortly.
IEEE 488 Pinout
IEEE 488 Pinout
Data Lines
Handshake Lines
DAV
NDAC
NRFD
Bus Management
Lines
ATN
IFC
REN
SRQ
EOI
Ground Lines
Eight lines (D1 through D8) used to transfer data and commands between devices on the bus.
Used to handshake the transfer of information across the data lines.
DAV: Data Valid
NDAC: Not Data Accepted
NRFD: Not Ready for Data
Five bus management lines are used to control bus activities.
ATN: Attention
IFC: Interface Clear
REN: Remote Enable
SRQ: Service Request
EOI: End or Identity
Eight ground lines used as follows: one for shield, one for general signal ground, and six logic
ground lines (one for each of the following: DAV, NDAC, NRFD, ATN, IFC, and SRQ).
Specifications
Compliance Note:
• The IEEE 488 interface card is compliant with IEEE 488.2 specifications.
Installation Category:
• CE: Category 1
Implementation:
•
SH1, AH1, T6, TE4, L4, LE4, SR1, PP0, RL0, DC1, DT1, C0, E1
Programmable Parameters:
•
Alarm set points, thermocouple type, temperature units, trigger level, pre-trigger and post-trigger scan interval,
trigger mode, SRQ mask, scan count, pre-trigger count, digital input, digital output, real time settings, data
output format, and terminators.
Data Transfer Speed:
•
Up to 1Mbyte/s
Connector:
•
Standard IEEE 488 connector with metric studs
3-10 ChartScan User’s Manual
Page 43

IEEE 488 Configuration
Never remove or install an interface card while ChartScan/1400 is connected to the AC
In order to use the IEEE 488 bus address, you must first turn off the ChartScan unit and install the optional IEEE 488
Interface Card. Also note that on ChartScan’s rear panel DIP switch, the COMM SELECT micro-switch (switch 1)
must be in the down (“0” position) to select the interface card option. The IEEE 488 Bus Address settings are then
made using the DIP switch on ChartScan’s rear panel.
power line! Internal voltage potentials exist which could cause bodily injury or death!
Never disconnect the AC power line from ChartScan/1400 while its analog lines are
connected to an external device! Common mode voltage potentials exceeding 60 VDC or
30 Vrms may exist which could cause bodily injury or death!
Use approved ESD precautions, including static-free work area and grounded wrist strap,
when handling circuit boards and electronic components. Failure to do so could cause
equipment damage due to electrostatic discharge.
WARNING
WARNING
WARNINGWARNING
WARNING
WARNING
WARNINGWARNING
CAUTION
CAUTION
CAUTIONCAUTION
Note: When using ChartView with IEEE 488 applications, you must make use of an
IOtech Driver 488/W31, /W95, W98, or /WNT when made available. In addition, the device
must be configured in the Driver 488 and be named WAVE.
The bus address can be set from 0 through 30 and is read only at power on or reset. The address is selected by
simple binary weighting. The switch labeled IEEE Address “1” (micro-switch number 8) is the least significant bit;
16 (micro-switch 4) is the most significant bit. The following figure shows an example IEEE 488 bus address setting
of 7.
Note: If address 31 is selected, the address defaults to 30 because the IEEE 488 standard has reserved the IEEE
Address 31.
Note: The DIP switch is only read when power is first applied to ChartScan, and for that reason must be set before
applying power to the unit.
Hardware 3-11
Page 44

IEEE 488 Configuration Settings
Standard Units, Only
1. Ensure IEEE 488 Interface is installed. 1. Ensure IEEE 488 Interface is installed.
2. Turn the ChartScan system’s power “OFF.” 2. Turn the ChartScan system’s power “OFF.”
3. Ensure the COMM SELECT micro-switch (on the
rear-panel DIP switch) is in the “1” (up) position.
This selects IEEE 488.
4. Adjust micro-switches 4 through 8 (for address
setting), see following table for standard units.
Note: Early production ChartScan units do not have a Calibration Enable/Disable Pushbutton. If you have an
early production unit, refer to the right-hand DIP switch illustration, above.
IEEE 488 Settings (Standard Units) IEEE 488 Settings (Early Production Units)
Selection Micro-
COMM
SELECT
HANDSHAKE
(H/S)
IEEE 488
ADDRESS
Decimal Values
Switch
#
1 0 – Serial Communication; RS-232 or
2,3 No effect when switch 1 is set to “1”.
4,5 0, 0 - 0
Setting Selection Micro-
RS-422 depending on switch 9.
1- Selects IEEE 488.
0, 1- 8
1, 0- 16
1, 1- 24
Early Production Units, Only
3. Ensure the COMM SELECT micro-switch (on the
rear-panel DIP switch) is in the “0” (down) position.
This selects IEEE 488.
4. Adjust micro-switches 4 through 8 (for parameter
preferences), see following table for early production
units.
Setting
COMM
SELECT
HANDSHAKE
(H/S)
IEEE 488
ADDRESS
Decimal Values
Switch
#
1 0- selects IEEE 488 interface card.
1- Selects RS-232/422.
2,3 No effect when switch 1 is set to “0”.
4,5 0, 0 - 0
0, 1- 8
1, 0- 16
1, 1- 24
6,7,8 0,0,0- 0
RS-232 or
RS-422
3-12 ChartScan User’s Manual
9 No effect when switch 1 is set to “1”. CALIBRATION
0,0,1- 1
0,1,0- 2
0,1,1- 3
1,0,0- 4
1,0,1- 5
1,1,0- 6
1,1,1- 7
MODE
6,7,8 0,0,0- 0
0,0,1- 1
0,1,0- 2
0,1,1- 3
1,0,0- 4
1,0,1- 5
1,1,0- 6
1,1,1- 7
9 0- Calibration Mode Disabled
1- Calibration Mode Enabled (normal
position is “0” disabled)
Page 45

Digital I/O Lines
ChartScan has eight digital input lines and thirty-two digital output lines available on a rear panel DB-50 connector.
These lines can be output and/or input using ChartScan commands.
Note: The first 16 output lines are available for use with relays via the high current CSN/Relay card option. If
used, the relay card must be installed in slot 1 (bottom slot) of the ChartScan main unit. The CSN/Relay
card is discussed at the end of this chapter.
Logic Levels
Each digital output line will drive five (5) standard TTL loads. All digital input lines are one-eighth (0.125) TTL
loads. All inputs are protected against damage from high static voltage. Normal precautions should be taken to limit
the input voltages to the range of 0.0 to 5.3 volts. All digital I/O lines are referenced to digital ground pins (see
following table, DB50 Pinout).
Do not exceed the 0.0 to 5.3 volt levels described above. Exceeding these levels may
damaged the unit in a way not covered by the warranty.
Digital I/O Port Pinout
The following figure and table identify pin locations for outputs, inputs, and grounds associated with the DB50
connector. Outputs 1 through 32 are typically used for alarms 1 through 32, respectively. As mentioned above,
outputs 1 through 16 can be used with a relay card option.
CAUTION
CAUTION
CAUTIONCAUTION
DB50 Pin Descriptions
Output
Signal
11 17 39
234 18 23
318 19 7
42 20 40
535 21 24
619 22 8
73 23 41
836
920
10 4
11 37
12 21
13 5
14 38
15 22
16 6
Hardware 3-13
Pin
No.
Output
Signal
24 25 850
25 9
26 42
27 26
28 10 12, 13, 14,
29 43 28, 29, 30, 31,
30 27 45, 46, 47
31 11
32 44
Pin
No.
Input
Signal
Pin No.
115
248
332
416
549
633
717
Ground Pins
Page 46

External TTL BNC Connectors
ChartScan’s rear panel provides two external trigger BNC connectors. The BNC TTL Scan output is used for
synchronizing equipment with ChartScan. ChartScan can be programmed to trigger on a rising or falling TTL level.
Any TTL level signal (> 2.2V = Hi, < 0.8V = Lo) may be used as a trigger pulse. A trigger pulse may also be used
to generate a Service Request. Note that the TTL Out is a LS-TTL compatible output, 0.4 mA sourcing, 8 mA
sinking. When a scan is logged into the acquisition buffer (after the actual scan), the TTL output signal is pulsed for
100 ms. Refer to the following trigger timing diagram.
Signal Conditioning Cards
ChartScan and its expansion chassis can each house a quantity of 4 signal conditioning cards (8 total, for a possible
128 channels). The signal conditioning cards can be varied using any combination of the following 5 types.
•
CSN/14/TC/P Thermocouple and low volts card for units with subminiature-plugs
• CSN/14/LV/T Low volts card with removable screw terminals
•
CSN/14/LV/B Low volts card with BNCs
•
CSN/14/LV/S Low volts card with safety jacks
•
CSN/14/HV/S High volts card with safety jacks
Each scanning module fits into the metal, shielded chassis. The chassis insulates the cards from noise and maintains
a constant internal temperature.
3-14 ChartScan User’s Manual
Page 47

CSN14/TC/P
The CSN14/TC/P card contains 16 differential input channels, each of which may be configured as any
thermocouple type or as a milli-volt input. Temperature values may be returned in units of °C, °F, °K, °R, or mV.
This signal conditioning card contains “subminiature plug type” connectors. There are no user configuration switches
or jumpers on the CSN14/TC/P card.
Number of Channels:
• 16 differential; programmable by channel for specific thermocouple type or voltage.
Input Types:
• J, K, T, E, R, S, B, N; and ±10V, ±5V, ±1V, ±100mV
Input Connector:
• Subminiature-plug
Temperature Range, Accuracy, and Resolution
• Type J:
• Type K: -100° to +1372°C
• Type T:
• Type E: -100° to +1000°C
• Type R:
• Type S: 0.0° to +1780°C ± 2.0°C0.40°C
• Type B:
• Type N: -100° to +1300°C
Thermocouple and Low Volts Card with Subminiature Plugs
1
-100° to +760°C
-200° to -100°C
-200°C to -100°C
-100° to +400°C
-200° to -100°C
-200°C to -100°C
0.0° to +1780°C
+350° to +1820°C
-200° to -100°C
± 0.5°C
± 0.8°C
± 0.6°C
± 0.8°C
± 0.5°C
± 0.8°C
± 0.7°C
± 0.9°C
± 2.0°C
± 2.0°C
± 0.6°C
± 0.9°C
0.10°C
0.20°C
0.10°C
0.20°C
0.15°C
0.25°C
0.10°C
0.20°C
0.40°C
0.50°C
0.15°C
0.20°C
Temperature Units:
• °C, °F, °K, °R, mV and volts.
Fault Detection:
• Open T/C may be detected by a software query.
Cold Junction Sensors:
• One for every 4 input channels.
Input Impedance and Input Bias Current:
• 1M Ohm typical; and 20 nA maximum
Maximum Common Mode Voltage
• 200 VAC, or 200 VDC peak
Maximum Normal Mode Voltage:
• 10 VDC or 10VAC peak
Common Mode Rejection:
• 100 dB typical
Maximum Allowable Input:
• ± 25V rms
Channel-to-Power Ground
Isolation:
• ± 200V peak
Channel-to-Channel Isolation:
• ± 200V peak.
Temperature Coefficient:
• < (0.1 x rated accuracy)%/°C
Hardware 3-15
4
:
Page 48

Digital Filtering:
• Averages 32 samples at 50/60 Hz for line cycle noise rejection (VDC measurements)
2
Voltage Range
, Accuracy3 and Resolution:
• ±100 mV ± 0.02% 3.05 µV/bit
• ±1 V ± 0.02% 30.5 µV/bit
• ±5 V ± 0.02% 153 µV/bit
• ±10 V ± 0.02% 306 µV/bit
Note 1: Accuracy is based on 18 to 28°C, 1 year; includes cold junction compensation; excludes thermocouple errors;
thermocouple readings based on NIST Monograph 175. Resolution given is the typical value. Add ±5°C for common
mode voltages greater than 25 VAC.
Note 2: Voltage range is maximum peak-to-peak signal for AC volts.
Note 3: For AC voltages where the frequency of the input signal is an integer multiple of the AC line cycle ±1%; with line cycle
integration enabled.
Note 4: Specified for coupling impedance >30 MΩ and common mode frequency < 60 Hz. 300 VDC or 300 VAC peak before
equipment damage occurs.
Note 5: There is a 4700 pico-farad, polypropylene capacitor connected across the input terminals of each channel. This
capacitor filters input noise when measuring signals from thermocouples. When the circuit card is set to the ±100 mV
range, the capacitor reacts with user source impedance to form a low pass filter. The filter pole frequency is:
1/(2*pi*(RSHI + RSLO)*4700 * 10
-12
), where RSHI and RSLO are the source resistance of the input leads.
3-16 ChartScan User’s Manual
Page 49

CSN14/LV/ (T, B, & S)
There are three versions of low voltage signal conditioning cards for use with ChartScan. Each card supports 16
differential input channels and is capable of measuring analog input signals on any of four programmable ranges:
±100 mV, ±1 volt, ±5 volt and ±10 volt. The cards share the same signal conditioning characteristics, but differ in
their style of input connector, i.e., terminal strip, BNC, and safety jack (CSN14/LV/T, CSN14/LV/B and
CSN14/LV/S, respectively).
Low Voltage Cards
Number of Inputs: 16 differential; programmable by channel for input range
Input Types: ±10V, ±5V, ±1V, and ±100mV
Input Connectors: Removable screw terminal blocks, BNC, or Safety Jacks
1
Voltage Range, Accuracy
• ± 100 mV; ± 0.02%;
• ± 1 V; ± 0.02%; 30.5 µV/bit
• ± 5 V; ± 0.02%;
• ± 10 V; ± 0.02%; 306 µV/bit
Digital Filtering:
Used for AC line cycle noise rejection.
Selectable off, 1-256 samples in a binary count.
Temperature Coefficient:
< (0.1 x rated accuracy)%/°C
Input Impedance: 1MΩ typical
Input Bias Current: 20 nA maximum
Common Mode Rejection: 100 dB typical
Maximum Common Mode Voltage:
Maximum Allowable Input: ± 25V rms
Channel-to-Power Ground Isolation: 200 V peak
Channel-to-Channel Isolation: 200V peak
and Resolution:
3.05 µV/bit
153 µV/bit
2
200 VDC, or 200 VAC peak
Hardware 3-17
Page 50

CSN14/HV/S
The CSN14/HV/S card contains 16 differential input channels and is for use with “safety jack” type connectors. Each
CSN14/HV/S card is capable of measuring analog input signals on any of the following three programmable ranges:
±2.5 volt, ±25 volt and ±250 volt.
Number of Inputs:
16 differential; programmable by channel for input range
Input Connectors:
Safety Jack
Voltage Range, Accuracy and Resolution:
• ± 2.5V; ± 0.02%; 78.14 µV/bit
• ± 25 V; ± 0.02%; 781.4 µV/bit
• ± 250 V; ± 0.02%;
Digital Filtering:
Used for AC line cycle noise rejection.
Selectable off, 1-256 samples in a binary count.
Temperature Coefficient: < 0.01%/°C
Input Impedance: 10 MΩ typical
Input Bias Current: 20 pA maximum.
Maximum Common Mode Voltage:
Maximum Normal Mode Voltage: 500 VDC or 500 VAC peak
Common Mode Rejection: 100 dB typical.
Maximum Allowable Input: 500 VDC or 500 VAC peak
Channel-to-Channel Isolation:
500 VDC or 500VAC peak
Channel-to-Power Ground Isolation:
500VDC or 500 VAC peak
High Voltage Card with Safety Jack Connectors
CSN14/HV/S, High Voltage Card with Safety Jack Connectors
7.81 mV/bit
1
500 VDC or 500 VAC peak
2
Note 1: Specified for coupling impedance >30 MΩ and common mode frequency < 60 Hz. 700 VDC or 700 VAC peak ; 325 VDC
Note 2: 325 VDC or 325 VAC peak if used in the same system with a MTC/24 scanning module.
3-18 ChartScan User’s Manual
or 325 VAC peak if used in the same system with a MTC/24 scanning module, before equipment damage occurs.
Page 51

CSN/Relay Card
CSN/Relay Card
The high-current digital-output CSN/Relay Card allows you to add relay functions to the first 16 digital outputs. The
CSN/Relay card installs into ChartScan’s slot 1 (bottom card slot). Only one relay card can be used per ChartScan
unit, and a relay card can not be installed in a ChartScan expansion chassis.
The CSN/Relay Card uses 16 dual-coil latch relays and associated circuitry to minimize load on ChartScan’s
internal power supply. Note that the relays are contained in two groups, with 8 relays per group. Current is briefly
drawn following a change in digital logic output level. In event of a power failure, it is possible for a relay to remain
in a “set” state until power is restored.
(for High-Current Digital-Output)
CAUTION
CAUTION
CAUTIONCAUTION
Do not exceed specified current limits on relay group commons. Exceeding specified limits
can damage the printed circuit board.
There is a common feed to all 8 relays in each of the two groups. It is important to stay within the group total current
limitation, regardless of the current ratings of the relay contacts or the plug-in terminal blocks; otherwise the circuit
board may be damaged. Note that ratings of relay contacts exceed the current carrying capacity of the printed circuit
board.
When the Alarm/Relay Card option is used, it is not possible to install more than 7 signal conditioning cards (3 in the
main unit), since the relay card occupies one card slot. This means you can have no more than 112 channels instead
of 128, when using this option.
Note: The relay output card option, if used, must be inserted into slot 1 (the bottom slot) of the main ChartScan
unit. The channel assignments are then automatically bumped as shown in the following table.
Device Channel Assignments (when relay option is used)
ChartScan ------------- 1 - 16 13-32 33-48
Expansion Chassis
(option)
Only one CSN/Relay card can be used in a ChartScan system. Attempts to install the
CSN/Relay card in a slot other than slot #1 of ChartScan’s main unit could possibly cause
equipment damage.
Slot 1 Slot 2 Slot 3 Slot 4
48-64 65 - 80 81 - 96 93-112
CAUTION
CAUTION
CAUTIONCAUTION
Hardware 3-19
Page 52

CSN/Relay Card Specifications
Number of Channels:
• 16 (2 groups of 8 channels)
Relay Contacts (Manufacturer’s Ratings):*
• 8 Amps, 125-250 VAC Resistive
•
5 Amps, 30 VDC Resistive
Card Contact Ratings:
•
8 Amps maximum on group commons
Contact-to-System Isolation:
•
500 Volts (AC or DC)
*Manufacturer’s ratings for the relays used on the CSN/Relay Card.
Expansion Chassis, CSN/Exp (Option)
You can add up to 64 additional analog channels to ChartScan by using a CSN/Exp expansion chassis. The
expansion chassis accepts the same types of signal conditioning cards as the ChartScan unit, and is powered and
controlled by the ChartScan unit.
Expansion channels are accessed in the same way as channels in the master ChartScan unit. When the main unit
detects the presence of the expansion chassis (during its power-on sequence), the system makes the additional
channels available to the user. The
the system.
U8 command is available to query ChartScan for the total number of channels in
Note: Only one expansion chassis can be connected to a ChartScan unit.
Note: The rear panel of the expansion chassis contains no controls, indicators, input or output connections.
Connecting the Expansion Chassis
A ribbon cable electronically connects the expansion chassis to the main unit. No additional power or interface
cables are required. A set of mounting blocks and machine screws is used to physically connect the expansion
chassis to ChartScan. Perform the following steps to install an expansion chassis.
WARNING
WARNING
WARNINGWARNING
Before connecting an expansion chassis to ChartScan, power down ChartScan and
disconnect the unit from power. In addition, power down and disconnect all devices from
the system. Failure to do so could lead to personal injury or death.
CAUTION
CAUTION
CAUTIONCAUTION
Use approved ESD precautions, including static-free work area and grounded wrist strap,
when handling circuit boards and electronic components. Failure to do so could cause
equipment damage due to electrostatic discharge.
Note: Only one expansion chassis can be connected to a ChartScan unit
1. Ensure the ChartScan is not connected to any power source.
2. Remove two upper side screws (near front of unit, and on side of unit) and slide top cover plate free of ChartScan.
Note that this plate will be reused as the cover plate for the expansion chassis.
3. Using machine screws (A) provided, install two mounting blocks to the inner sides of the ChartScan unit, as
indicated by the following figure.
3-20 ChartScan User’s Manual
Page 53

(
)
g
)
Cover Plate
Cover Plate
Screw (1 of 2)
Expansion
Chassis
Mounting Block
(1 of 4)
Ribbon Cable
CA-154
Included
Connector PH401
(on back side of
Backplane Board
Analo
Cross Section of Mounting Block
ChartScan
Connecting the Expansion Chassis to ChartScan
4. Insert one end of the included 40-conductor ribbon cable (CA-154) into ChartScan’s connector PH401. PH401 is
located above the uppermost signal conditioning connector on the top edge of the analog backplane card. See the
following figure, Connecting the Backplane Cards.
Expansion Backplane Card, Partial
Located In Expansion Chassis
PH501
CA-154
Connects to
PH401 and PH501
C353
C352
C356
JP302
40
39
2
1
PH401
Analog Backplane Card, Partial
Located In ChartScan Main Chassis
Connecting the Backplane Cards
Note: Ribbon cable (CA-154) is “keyed” for proper installation.
5. Using the same front/back orientation, position the expansion chassis on top of the ChartScan unit, then insert the
remaining end (of cable CA-154) into expansion chassis connector PH501, on rear of PC board.
6. Secure the expansion chassis to the ChartScan unit with two machine screws (B) for each of the four mounting
blocks installed in step 3.
7. Install the cover plate (removed in step 2) onto the expansion chassis, and secure with two screws.
Hardware 3-21
Page 54

Automatic Channel Assignment
Unless the CSN/Relay card is used, Channels 1 through 64 are automatically assigned to ChartScan, while extended
channels 65 through 128 are assigned to the expansion chassis. Even if a card slot is left empty in the ChartScan or
the expansion chassis, the channel assignments are as shown in the table, with slot 1 being at the bottom of the unit,
and slot 4 being at the top.
Device Channel Assignments
Slot 1 Slot 2 Slot 3 Slot 4
ChartScan 1 - 16 13-32 33-48 48-64
Expansion Chassis 65 - 80 81 - 96 93-112 113-128
The relay card, if used, must go in slot 1 of the main ChartScan unit. When the relay card is used, there are only 112
channels available. The channel assignments are automatically bumped as shown in the following table.
Device Channel Assignments (when relay option is used)
Slot 1 Slot 2 Slot 3 Slot 4
ChartScan ------------- 1 - 16 13-32 33-48
Expansion Chassis 48-64 65 - 80 81 - 96 93-112
Only one CSN/Relay card can be used in a ChartScan system. Attempts to install the
CSN/Relay card in a slot other than slot #1 of ChartScan’s main unit could possibly cause
equipment damage.
CAUTION
CAUTION
CAUTIONCAUTION
3-22 ChartScan User’s Manual
Page 55

Expansion Chassis Specifications
WARNING
WARNING
WARNINGWARNING
Service must be performed by qualified personnel. All terminals, including the AC line and
analog inputs, must be disconnected prior to opening ChartScan main unit or expansion
chassis casing. Internal voltage potentials exist which could cause bodily injury or death!
CAUTION
CAUTION
CAUTIONCAUTION
The Expansion Chassis contains no fuses; However, fuse failure in ChartScan’s main chassis
indicates a possible problem with device circuitry. If a fuse blows, contact a qualified
service representative. Replacement fuses are to be installed by qualified service personnel
with the unit disconnected from the ChartScan unit and with all other terminals
disconnected. If the line voltage selector is changed, then the fuse designated for that line
voltage must be used.
Installation Category:
• CE: Category 2 for Line Voltage Input terminal.
All other terminals are Category 1.
Number of Slots: Four (4).
Channel-to-Channel Isolation: 200 V peak, with CSN14/HV/S 500 V peak
Channel-to-System Isolation: 500 V peak
Dimensions:
• 330 mm wide x 241 mm deep × 152 mm high (13” × 9.5” × 6”).
Weight:
• ≈ 1.8 kg. (4 lbs.) empty
Operating Environment:
• Standard: Indoor use, 0 to 50°C;
0 to 95% RH (non-condensing) to
35°C; linearly derate 3% RH/°C
from 35 to 50°C.
Power:
Receives power from ChartScan chassis.
• CE: Indoor use at altitudes below
2000 m, 5 to 40°C; 0 to 80% RH
up to 31°C decreasing linearly to
50% RH at 40°C.
Hardware 3-23
Page 56

−
Notes
3-24 ChartScan User’s Manual
Page 57

ChartView Software Reference 4
ChartView, ChartView Plus, ChartViewNET, and ChartViewNET Plus
Overview ……4-1
Groups, Charts, & Channels ……4-2
Three Ways of Using ChartView ……4-2
What ChartView and ChartView Plus Provide
……4-3
Main Window ……4-4
Channel Information Region ……4-6
Status Indicator Region ……4-7
Main Window Toolbar ……4-8
Group Select ……4-8
Start, Pause, and Stop Charts ……4-8
Scroll Faster & Scroll Slower ……4-8
Display Configuration ……4-9
Channel Configuration ……4-15
PostView post-acq data viewer ……4-15
Arm Acquisition ……4-15
Disarm ……4-15
Print Charts ……4-16
Main Window Pull-Down Menus ……4-16
Bar Graph, Analog, and Digital Meters …4-27
Overview ……4-27
Bar Graph Meters ……4-28
Analog Meters ……4-29
Digital Meters ……4-30
Meter Toolbars ……4-31
Meter Pull-Down Menus ……4-31
Meters Configuration Menu ……4-32
Setup Window ……4-33
Channel & Alarm Setup Dialog Box ……4-33
Channel Configuration Columns ……4-35
Alarm Configuration Columns ……4-36
Acquisition Setup Dialog Box ……4-36
Burst Mode, Operational Issues ……4-39
Measuring AC Voltage, or AC RMS Voltage……4-40
Data Destination Dialog Box ……4-42
Data Destination ……4-42
Auto Re-arm (ChartView Plus only) ……4-42
Why use Auto Re-arm? ……4-43
Disabling Auto Re-arm ……4-43
Chart Setup Wizard ……4-44
Introduction ……4-44
Automatic Chart Setup with Wizard ……4-45
Bypassing Automatic Chart Setup ……4-46
Reference Note: This chapter serves as a reference for ChartView, ChartView Plus, ChartViewNET,
ChartViewNET Plus, and Chart Setup Wizard. For very first time start-up of a ChartView application,
or to run through the program tutorial, refer to Chapter 1.
ChartScan can operate on the ethernet providing it is configured for RS-232 serial communications and
properly connected to A Net232 ethernet/RS-232 converter. If you will be connecting your ChartScan unit
to a Net232, please refer to the Net232 User’s Guide, part number 1037-0901.
ChartViewNET refers to a ChartView program that has the network feature of the program activated (for
ethernet operation), much like ChartView Plus refers to a ChartView program that has the enhanced chart
feature of the program activated. The NET and Plus features are each activated by separate registration ID
codes; thus it is possible to have ChartViewNET Plus (when both codes are used). For ease of discussion,
this chapter’s use of the term ChartView also refers to ChartViewNET; and ChartView Plus refers to
ChartViewNET Plus.
Overview
ChartView is a graphic Microsoft Windows-based program that can be used for various data acquisition applications.
The program was designed for ease-of-use with no need for programming or expertise in configuration.
ChartView Plus permits multiple groups and up to four overlapping channels (per chart). These enhanced
features are activated by use of a registration ID code. Please consult your service representative if more
information is desired.
ChartScan User’s Manual
1-12-99
ChartView Software Reference 4-1
Page 58

Groups, Charts, & Channels
When starting the program with no configuration file present (see Chapter 1 if necessary), a feature called Chart Setup
Wizard is automatically activated to assist you with your display setup. To make the best use of Chart Setup Wizard you
need to understand the relationship of Groups, Charts, and Channels.
Group. “Group” refers to a group of charts. ChartView makes use of one chart group.
ChartView Plus allows up to 64 groups, depending on the capabilities of your PC, but
can only display one group at a time.
Chart. “Chart” refers to display area that reflects real-time channel data values for a
selected channel and can be scrolled at various rates. You can assign up to 16 charts per
group. ChartView Plus enables each chart to display up to four overlapping channels.
Channel. “Channel” refers to a signal channel. Channels will be displayed in units of
°C, °F, °K, °R, mV, V, or in user-defined units, depending on the configuration and type
of signal conditioning card used. With ChartView Plus you can have up to 4
overlapping channels assigned to one chart.
Three Ways of Using ChartView
You can use ChartView to:
• chart and monitor specific channels with no acquisition of data to disk
• acquire data with no charting or meter use
•
use charting and/or meters while acquiring data to disk
Chart channels (and/or monitor with meters) with no acquisition of data to disk (Acquisition State:
Waiting for Trigger) Prior to charting channels on ChartView’s Main Window, you need to configure
a display in regard to groups, charts, and channels. This aspect of configuration is performed through
Chart Setup Wizard (discussed in the following text), or through a Chart Setup window accessed
through the “Channel Configuration” button on ChartView’s Main Window.
In addition to charting channels, you can monitor selected channels via digital, analog, and/or bar graph
meters. Meter discussion begins on page 4-27 of this manual. A detailed discussion of configuring
Meters begins on page 4-32.
Note: Only one group of charts can be viewed at a time.
Acquire data with no charting or meter use (Possible Acquisition Scenarios: Acquiring and Uploading
Acquisition, Buffering Acquisition in Instrument, and Uploading Data from Instrument Buffer). Prior
to acquiring data (for saving to disk) you need to configure the acquisition using the Acquisition
window (accessed through the Setup pull-down menu of ChartView’s Main Window, or through use of
the related icon button). You can enable the desired channels and assign high and low alarm values
from the configuration window.
Chart channels and/or use meters while acquiring data to disk (Possible Acquisition States: Acquiring
and Uploading Acquisition, Buffering Acquisition in Instrument, and Uploading Data from Instrument
Buffer). Prior to using ChartView for charting (and/or meter use) while simultaneously acquiring data
to disk, you need to configure a display and/or meter; as well as configure the acquisition. Channels
from the display setup are automatically enabled. You can enable additional channels from the
Channel Configuration window (for the data acquisition) to acquire more data; however, these
additional channels will not change your display setup, or the channels being monitored. In other
words, you can acquire data from channels you do not chart or monitor.
4-2 ChartView Software Reference ChartScan User’s Manual
Page 59

Some of the data acquisition scenarios pertaining to ChartView are as follows:
1) Waiting for Trigger
Sensor
Buffer
Acquisiton Device
Data is received by acquisition device, but not stored. Selected
channels can be viewed graphically in scrolling charts, as well
as in one or more meters (analog, digital, or bar graph).
Hard Disk
Computer System
3) Buffering Acquisition in Instrument
Sensor
Buffer
Acquisiton Device
Acquired data (from point of trigger) is received by acquisition device
and temporarily stored in device buffer. As in the previous scenarios,
selected display channels can be viewed.
Hard Disk
Computer System
Four Basic Data Acquisition Scenarios
2) Acquiring & Uploading Acquisition
Sensor
Buffer
Acquisiton Device
Device has been triggered. Data is temporarily stored in device
buffer prior to being uploaded to PC system hard disk. As in the first
scenario, selected display channels can be viewed.
Hard Disk
Computer System
4) Uploading Data from Instrument Buffer
Sensor
Buffer
Acquisiton Device
Acquired data is uploaded to the PC hard disk from the device buffer.
As in the previous scenarios, selected display channels can be
viewed.
Hard Disk
Computer System
What ChartView and ChartView Plus Provide
ChartView and ChartView Plus provide you with the capability to connect to, and control any member of the
ChartScan, NetScan, MultiScan, or TempScan family of data acquisition instruments, as well as:
Create and edit chart display setups ………………………………
Set up analog input parameters (selecting: Channels, …………
TC types, Units) to acquire data.
Configure alarms, log alarms………………………………………. See pages 4-24, 4-33, and 4-36.
Configure and arm an acquisition…………………………………..
View real-time display of channel data via the Main Window….
Save data to disk……………………………………………………..
Transmit data to Microsoft Excel via DDE (Dynamic Data ……..
Exchange).
Start PostView, an independent application that allows you to… See Chapter 5, PostView.
graphically view data channels from a file.
Use remote RS-232 communications by attaching the ………….
acquisition device to a modem configured for Auto Answer
See Display Configuration, beginning on page 4-9 and
Chart Setup Wizard, beginning on page 4-44.
See Setup Window, beginning on page 4-33.
See Acquisition Setup Dialog Box, page 4-36.
See Main Window, beginning on page 4-4.
See File, page 4-16 and Data Destination, page 4-42.
See Data, beginning on page 4-20.
See Device, page 4-23.
ChartScan User’s Manual ChartView Software Reference 4-3
Page 60

Main Window
While using this chapter, refer to the Main Window figure and its associated control option table as
needed. Because of the graphic aspect of the window, you should be able to develop a good
understanding of the program’s capabilities and associated operating techniques within a very short
time.
The following comments apply to the figure and table on the following page.
• In regard to the control option table presented on the facing page, the symbols: (mouse), Ú
• Channel Selection (14) can also be made by tabbing to the Center Control (17) or Units/Div
• The min and max scale values (13) and (19) are automatically generated, but can also be set from
• You can use the Chart pull-down menu to turn grid limit lines Off, or On. Limit lines can be solid
•
• More detailed information regarding the pull-down menus and toolbar buttons is provided
(arrow keypads), (Page Up/Page Down keypads), and [spacebar] are control options that allow
you to tab to a field and make changes with the specified control.
Control (18) and using PageUp or PageDown ().
the Chart Setup Dialog.
or dots.
In regard to the time stamp (region 21), if you stop the chart the time stamp will begin at 00:00:00
upon restarting the chart (if using relative time), or at the real clock time (if using absolute time).
throughout the chapter.
4-4 ChartView Software Reference ChartScan User’s Manual
Page 61

ChartView Main Window and Control Options
= Mouse, Ú= Arrow Keypads , = PageUp/PageDown Keypads
1
Group Select
2
Start Charts and
Indicators
3
Pause Charts
4
Stop Charts
5
Scroll Faster
6
Scroll Slower
7
Display Configuration
8
Channel
Configuration
9
PostView post-acq
data viewer
10
Arm Acquisition
11
Disarm …
12
Print Charts
13 Chart Max. Scale
Value (Grid Limit
Line)
Ctrl+G,
and “right-click” Current
group will be selected.
or Ú, or
or, F5
or, F7
or, F6
or, Ctrl+Z
or, Ctrl+X
or, Pointer over chart
or, Windows Pull-
down menu
or, Ctrl+T
or, Ctrl+Y
or, Ctrl+P
From Chart Pull-down
menu or Chart Setup
Dialog Box
14 Channel Selection
15 Multiply (x2)
16 Present Value of Selected
17 Center (Value at Chart Mid-
18
19 Chart Min. Scale Value (Grid
20 Divide (÷2)
21 Time Stamp (hr:min:sec)
22 Status Message Box
23
24 Status LEDs
25 Chart Display
Note: The bulleted list on page 4-4 relates to this table.
Ú
or,
or, Tab-to/Spacebar
N/A
Channel
Line)
Units/Division
(Vertical increment per one grid
box)
Limit Line)
Time/Division (Chart Speed),
the Horizontal increment per
grid box
or, Ú, or type-in
or, Ú, or type-in
From Chart Pull-down
menu or Chart Setup
Dialog Box
or, Tab-to/Spacebar
Thru Pull-Down Menus
only
N/A
Ctrl+Z (Faster)
Ctrl+X (Slower)
N/A; For Windows3.1
see note on page 4-7.
Double-click left mouse button in selected chart to zoom in or
zoom back out. Right-click to bring up Chart Setup Dialog Box
with the current group and target chart selected.
ChartScan User’s Manual ChartView Software Reference 4-5
Page 62

Channel Information Region
Channels can return values in units of °C, °F, °K, °R, mV, V, or user
defined units (if the mX + b option is used). With exception of mX + b
user defined-units, units depend on the configuration and type of signal
conditioning card used. Signal conditioning cards are detailed in the
user’s manual for you data acquisition device. The Channel
Information Region is located on the right-hand side of ChartView’s
main window. The values displayed in this region are the real-time
values of the selected channel.
By clicking on the up or down arrows (
σ
, or τ) by the channel selection
box (item 14), you can select one (of a maximum of 4 channels) that
were assigned to a chart. You could then observe the chart-related
information of the chosen channel.
You can also select a new channel for the information region by placing the cursor in (or tabbing over
to) the “Center” or “Units/Div” fields and then pressing PageUp or PageDown. This is particularly
useful when your main window has been re-sized such that the channel selection boxes are not visible.
The following list identifies the various areas of the region.
13 Chart Max. Scale Value
(Grid Limit Line)
14 Channel Selection
(Of chart’s available channels)
15 Multiply (x2) 19 Chart Min. Scale Value (Grid Limit Line)
16 Present Value 20 Divide (÷2)
17 Center
(Value at chart mid-line)
18 Units/Division
(Provides the vertical increment of one grid box.)
Note: The basic ChartView program does not permit overlapping channels or having more than
one chart group. Multiple group applications (ChartView Plus) can be activated by use of a
special code, allowing up to four overlapping channels per chart. Regardless of whether you
are using the basic ChartView program, or ChartView Plus, there is a maximum limit of 16
charts per group.
Multiply and Divide Buttons -
In addition to reading channel values, you can increase or decrease the
size of the selected channel’s chart. This is accomplished with the Multiply (15) and Divide (20)
push-buttons. The Multiply push-button effectively increases the size of the selected channel’s chart by
a factor of two, while automatically adjusting the chart’s high and low values (items 13 and 19). Aside
from “clicking” on the Multiply/Divide controls, you can use your keyboard spacebar to control this
feature once the button (15 or 20) is selected. Selection may be with mouse, or by tabbing over to the
control.
Making changes to a channel’s chart parameters does not affect the parameters of the other channels,
with the following exception: Holding the keyboard’s control key down while adjusting either spinner
(
σ/τ
) for center (item 17), or spinner for units/div (item 18) causes the parameter change to apply to all
channels displayed for the chart, not just the currently selected channel display. This feature applies to
the spinners and keyboard up and down arrow keys, but not to the text input.
Center Control - The Center
control (item 17) changes the value of the selected channel’s chart
centerline. Changing the value of center results in an automatic change of the chart’s high and low end
values (items 13 and 19), and possibly an automatic change of the units/div (item 18). Aside from
using the center spinner controls to change center, you can change the center value by placing the
mouse cursor in (or tabbing over to) the field and then either typing in the desired value, or using the
PC keyboard up and down arrow control keys.
4-6 ChartView Software Reference ChartScan User’s Manual
Page 63

Units/div - The units in units/div
vertical grid. In the example above for Channel 1, each vertical grid increment represents 10.58°C per
division. Changing the units/division spinner controls (
max scale and min scale values (items 13 and 19). Aside from using the units/div triangular controls to
change the value, you can change units/div by placing the mouse cursor in (or tabbing over to) the field
and then either typing in the desired value, or using the PC keyboard arrow control keys.
Status Indicator Region
The status indicator region of the Main Window, located along the bottom of the window, consists of
the following items:
(18) can be °C, °F, °K, °R, mV, or V. The division referenced is one
σ/τ
) will result in an automatic adjustment of the
21 Scrolling Time 23 Chart Speed (Time/Div)
22 Status Message Box 24 Status LEDs
Scrolling Time - Scrolling Time (21) is turned On or Off from the V
1
iew pull-down menu. Time Stamp
can be “absolute” (real time) or “relative.” Absolute time is based on your computer clock, whereas
relative time starts at 00:00:00 hours/minutes/seconds, and then continues timing in increments relative
to the Chart Speed (23). The Absolute or Relative time stamp style is selected from the Chart
pull-down file.
Status Message Box - The Status Message Box (22) informs you of the status of the data acquisition
device. Several sample messages appear below:
Sample Status Messages
Attaching to device … Trigger device. Setting acquisition parameters.
Setting channel configuration … Acquisition active. Updating active.
Setting the acquisition parameters. Acquisition active. No updating.
Charting … Waiting for trigger …
Chart Speed - Chart Speed (23) consists of a “time per division” value that can be changed using the
“faster” (rabbit) button or “slower” (turtle) button. Fourteen possible chart speeds are as follows:
0.1 sec/div 1 sec/div 10 sec/div 2 min/div 30 min/div
0.2 sec/div 2 sec/div 30 sec/div 5 min/div 1 hr/div
0.5 sec/div 5 sec/div 1 min/div 10 min/div
Status LEDs
1
- ChartView’s Main Window contains five virtual LEDs (item 24) for conveying the
state of the system. Each of the five indicators is labeled on the main window. These indicators are:
Initializing:
Charting:
Disk:
Buffering in
Instrument:
Uploading:
Note 1: The Status LEDs and their labels (listed above) do not appear when using Windows 3.1.
However, when using Windows 3.1, the labels will appear at the time the function is active,
e.g., when uploading, the text “[Uploading]” shows in region 24. This text message is in
addition to the text in the Status Message Box (Item 22).
ChartScan User’s Manual ChartView Software Reference 4-7
Indicates ChartView is configuring the data acquisition instrument.
Indicates charting is in progress. This indicator is useful when charts are scrolling at a very
slow speed.
Indicates ChartView is writing to disk.
Indicates the data acquisition instrument is storing scans that are not being saved to disk.
Indicates data in the instrument is being uploaded to the PC.
Page 64

Main Window Toolbar
Each item in the toolbar, with exception of Group Select (1), is represented by an individual button
icon. Toolbar-related functions can also be activated from pull-down menus (discussed later). Placing
the cursor on the button and clicking the mouse button enables the tool, or opens a corresponding
dialog box. Each Toolbar button has a pop-up label that appears when the mouse is placed over the
button.
Note: The toolbar represented below is for ChartView’s Main Window. Separate toolbars exist for
Bar Graph, Digital Meters, and Analog Meters options (selectable from the Windows pull-down
menu.) These other toolbars are discussed later in the chapter.
1 Group Select 7 Display Configuration
2 Start Charts and Indicators 8 Channel Configuration
3 Pause Charts 9 PostView post-acq data viewer
4 Stop Charts 10 Arm Acquisition
5 Scroll Faster 11 Disarm …
6 Scroll Slower 12 Print Charts
Group Select
This feature indicates the chart group being charted. Clicking on the down arrow (τ) reveals other chart
groups configured by the user. The standard ChartView program allows the use of only one chart
group, while ChartView Plus can be configured to display up to 64 groups (one group at a time). To
select a different chart group, simply pull down the group list and select the desired group. The group
list can be obtained by any of the control options provided in the table on page 4-5. These are: a)
clicking the down arrow (
arrow key, d) using the page up or page down key. If using a control option other than “a,” you may
need to select the group select box by repeatable pressing the keyboard’s Tab key until the group select
box is selected. The name of the currently selected group appears in white on a dark background.
τ
)), b) using Ctrl + G on the keyboard, c) using the keyboard up or down
Start, Pause, and
Stop Charts
As their names imply, these three buttons are used to start, pause, or stop the charts. Pressing “pause”
suspends chart scrolling, but does not stop the “charting” process. While “pause” is pressed, the
channel region of the main window will continue to display real time values. Pressing “pause” a
second time restarts the scrolling action. Pressing “stop” causes the charting process to stop and
instantly freezes the channel region at its present values. This does not affect the acquisition.
Scroll Faster &
Scroll Slower
These buttons provide a means of speeding up and slowing the chart’s scrolling rate, also referred to as
chart speed. These two buttons do not affect the scan rates of the acquisition device. The chart speed
(item 23) is indicated in the lower right-hand corner of the main window as time/div. There are 14
possible chart speeds, as follows:
0.1 sec/div 1 sec/div 10 sec/div 2 min/div 30 min/div
0.2 sec/div 2 sec/div 30 sec/div 5 min/div 1 hr/div
0.5 sec/div 5 sec/div 1 min/div 10 min/div
4-8 ChartView Software Reference ChartScan User’s Manual
Page 65

Display
Configuration
The Display Configuration button accesses a Display Configuration Setup dialog box. This box will
also be displayed if: a) Create Charts Manually is selected during use of the Wizard Chart Setup
program, b) you select Setup from the Chart pull-down menu, c) you right-click on the chart region in
ChartView’s Main Window.
Note: If multiple chart groups are present in the display configuration, the current group will be
selected in the display configuration tree.
When you first click on the Display Configuration button, a Display Configuration Setup box appears.
A display region shows the configured structure of the groups, charts, and channels. From this box,
you can select the number of charts to be assigned to a specific group. With the use of the mouse
cursor, you can also select a chart or channel for additional editing. In addition to the text presented in
the following sub-sections: Normal Edit and Manually Creating a Display, you can refer to the
following for related information:
• The chapter 1 tutorial walks through a display setup from beginning to end.
• In this chapter, Chart Setup Wizard provides information on the use of Chart Setup Wizard for the
set up of groups, charts, and channels.
Reference Note: For the very first display setup, or when the configuration file has been
deleted, you will need to use Chart Setup Wizard. First time use is discussed in the
ChartView tutorial of Chapter 1. Additional Chart Setup Wizard information begins on
page 4-44.
The method you use to access the Display Configuration Setup window makes a difference. When you
use the toolbar button or the pull-down menu’s Setup selection, the Display Configuration Setup
window appears with the current chart display configuration intact. With this type of access you
would simply edit your existing chart display. Channel and alarm configurations do not change, with
exception that newly displayed channels will be enabled.
When you access the Display Configuration Setup from the Chart Setup Wizard, the Display
Configuration Setup window appears with no existing display. This allows for a “clean slate” approach
to creating a chart display, as opposed to an “editing” approach. Channel and alarm configurations do
not change, with exception that newly displayed channels will be enabled.
Normal Edit
To explain editing a configuration, we make use of an example where changes are desired for Chart 1.
In the following figure, Chart 1 was highlighted by clicking on it with the mouse cursor. The Display
Configuration Setup box then changed, allowing you to see specific channel types (such as volts only)
or to “Show all Types,” as in the example. From this setup box you can add or delete charts and
channels. You can:
•
•
•
•
hold down the Shift key and use the cursor to select several consecutive channels for addition or deletion
hold down the Ctrl key and use the cursor to select several non-consecutive channels for addition or deletion
double-click on an available channel to add it to the selected channels
double-click on a selected channel to remove it from the selected channels list
ChartScan User’s Manual ChartView Software Reference 4-9
Page 66

Display Configuration Setup Dialog Box with an Existing Configuration
Note: When a chart contains overlapping channels [and the channels share values such that their traces
reside on top of each other], then the channels listed lower in the display list (the most recently added
channels) will obscure the channels higher in the list (those that were added first).
Adding Channel 2 to Chart 1
Another variation of the Display Configuration Setup box appears when you highlight a channel. In the
following figure, Channel 1 (of Chart 1, Group 1) was selected, resulting in a new screen image. From
this screen, you can edit the channel setup.
4-10 ChartView Software Reference ChartScan User’s Manual
Page 67

Adjusting Channel Setup for Channel 1
ChartView and ChartView Plus data channels can operate in one of two modes: Units Full Scale or,
Units/Div. The mode is selected by radio button.
Units Full Scale. When Units Full Scale is selected, as depicted in the above figure, you can alter
Y Max and Y Min. These are the upper and lower limits of the Channel as they will appear on the
chart when the channel is selected. When you change either parameter, Y Center and Units/Division
are automatically adjusted. You can not directly adjust Y Center or Units/Division while “Units Full
Scale” is selected. You can change Y Max and Y Min by using the up and down arrows, or by
highlighting the existing value, typing in the new value, the pressing “Enter” on your PC keyboard.
Note: If the window size is changed, a chart operating in the Units Full Scale mode will maintain its
full scale setting across the chart.
Units/Div. When Units/Div. is selected, you can alter Y Center and Units/Div. Y Center is the
centerline value of the chart when the channel is selected. Units/Div. is the vertical value of on chart
grid increment. When you change Y Center or Units/Div. Y Max and Y Min are automatically
adjusted. You can not directly adjust Y Max or Y Min while “Units/Div” is selected. You can change
Y Center and Units/Div. by using the up and down arrows, or by highlighting the existing value, typing
in the new value, the pressing “Enter” on your PC keyboard.
Note: If the window size is changed, a chart operating in the Units/Div. Mode will maintain its
units per division scale setting across the chart.
The channels (in the display) will be enabled, and will appear in ChartView’s Main Window. The
Channels will overlap on their assigned Chart (for ChartView Plus applications), and will be visible
when the applicable Group is selected. Only one group of charts can be viewed at a time.
It is important to understand that other channels (those not in the display setup) maintain their existing
configuration status. They are not affected by the edit of the configuration display.
You can enable additional channels from the Channel and Alarm Setup window. Enabling additional
channels allows you to acquire more data; however, it will not change your display on ChartView’s
Main Window. In other words, you can acquire data from channels you do not monitor.
ChartScan User’s Manual ChartView Software Reference 4-11
Page 68

Manually Creating a Display
For ChartView Plus users, if you plan to have a chart setup that is not weighted evenly, i.e., different
numbers of channels per chart and different numbers of charts per group, you may want to manually
setup your chart display from scratch, i.e., without beginning from a pre-existing display configuration.
This method is arrived at from the Chart Setup Wizard window by selecting “Manual Chart Creation.”
When this button is clicked, the program exits the Chart Setup Wizard and enters the manual method of
Display Configuration Setup. Although this method is referred to as “manual,” it still contains some
automatic elements, such as Automatically Add Groups to the Setup (available with ChartView Plus).
Note: Even if an unevenly distributed chart display is desired, you can always edit a pre-existing
chart setup, or create a new setup by one of the Chart Setup Wizard’s automatic methods, and
then edit the setup.
To manually setup your chart display, using the “clean slate” approach (as opposed to “editing an
existing display”) perform the following steps.
1. Select Wizard from the Chart pull-down menu of ChartView’s main window. The New Display
Setup dialog box appears.
2. Click OK on the New Display Setup dialog box. The Wizard setup window appears (see following
figure)
3. Click on the Manual Chart Creation button. The Display Configuration Setup box appears. Since
the previous display configuration was reset, no groups or charts are seen in the display area on the
left side of the screen.
Note: If you have ChartView Plus, you will be allowed to have more than one group, as well as
overlapping channels (up to four per chart). If you have the basic ChartView program, you
will be limited to one group, and only one channel per chart.
Display Configuration Setup, The “Clean Slate” Approach
4. As seen in the previous figure for the “Clean Slate” approach, you have two options at this point.
Perform (4a) or (4b) as appropriate. With ChartView Plus, option (4a) is typically used.
4-12 ChartView Software Reference ChartScan User’s Manual
Page 69

(4a) Automatically add groups to the setup. Enter the number of groups and charts desired by using the cursor
and typing in the value, or by using the pull-down arrows (τ) and making the appropriate selections; then click
on the Create Groups button.
(4b) Manually add groups to the setup. Type in the name of the chart group; then click on the Add Display
Group button.
The Display Configuration Setup screen changes to show chart groups, and the number of charts
for the selected (black highlighted) chart group. From this screen you can change the number of
charts in a group, as well as change the group name.
Adding a Chart to Group 1
5. Change the number of charts per group if desired.
6. Change the group name if desired.
7. Click on a group to see the chart(s) assigned to the group. In the above example there is one group
with one chart.
8. Click on a chart to assign channels to the chart. A screen similar to the following will appear.
Assigning Channels to Chart 1 of Group 1
ChartScan User’s Manual ChartView Software Reference 4-13
Page 70

9. Choose channels for the selected chart. With ChartView Plus, you can select up to four
overlapping channels per chart. With the basic ChartView program, you are limited to one channel
per chart. There are four methods of adding channels. These are as follows:
• Highlight an available channel using the cursor and left-hand mouse button; then click the Add button.
Repeat for each channel to be added.
• Double-click on the channel (in the available channels list to add; in the selected channels list to remove)
• Hold down the keyboard’s Shift Key and use the left-hand mouse button to select a block of consecutive
available channels (up to 4); then click the Add button. Example: CH3, CH4, CH5,CH6.
• Hold down the keyboard’s Ctrl button and use the left-hand mouse button to select up to 4 available
channels (these can be non-consecutive); then click the Add button.
Example: CH1, CH3, CH5, CH7, as in the previous figure.
Note: You can also remove channels in a similar manner by highlighting a channel(s) in the Select
Channels box, and then clicking on the Remove button. In the previous figure, CH7 (in the
select box) is highlighted. Clicking the Remove button would delete the channel from
Chart1.
Note: When a chart contains overlapping channels [and the channels share values such that their
traces reside on top of each other], then the channels that are listed lower in the display list
(the most recently added channels) will obscure the channels higher in the list (those that
were added first).
10. In the display area (on the left-hand side of the screen) click on a channel to check the channel’s
configuration and to re-configure the channel, if desired. The Display Configuration Setup
Window will appear similar to the following figure.
Note: Changing the display configuration does not change the existing channel and alarm
configuration. It only changes how the chart groups, charts, and channels will be displayed.
This screen contains two “radio buttons” for selecting the method of adjusting the display mode
and channel setup. It is the same screen discussed in the sub-section, Editing an Existing Display
Configuration. From this screen you need to choose Units Full Scale or Units/Div. Each method
was previously discussed (see page 4-11).
Adjusting Channel Setup for Channel 1
Remember, you can enable additional channels from the Channel and Alarm Setup window. Enabling
additional channels allows you to acquire more data; however, it will not change your display on
ChartView’s Main Window. In other words, you can acquire data from channels you do not monitor.
4-14 ChartView Software Reference ChartScan User’s Manual
Page 71

Channel Configuration
The “Channel Configuration” button brings up the Setup Window with one of three “tabbed” dialog
boxes displayed: Acquisition Setup (page 4-33), Channel & Alarm Setup (page 4-33), or Data
Destination (page 4-39). The information entered in the Acquisition Setup dialog box is used by the
Arm Acquisition command to set up the acquisition of data to disk. When the trigger is satisfied, the
scans are collected at the selected scan frequency and stored to disk in the designated file. The
Channels & Alarms dialog box is used to configure channels and alarms; the Data Destination dialog
box is used to assign a filename and folder location for data, select an Excel or binary format (
.IOT respectively), and to select optional Time/Date and/or Alarm Stamps (to be included in the data)
if desired. You can tab back and forth from each one of these dialog boxes to the other.
PostView post-acq data viewer
The “PostView post acquisition data viewer” button accesses the PostView program. This independent
program allows you to view waveforms recorded by data acquisition programs such as ChartView,
ChartView Plus, and TempView. PostView is detailed in Chapter 5 of this manual.
Arm Acquisition
You can use the Arm Acquisition button to activate an acquisition. When you click on this button the system is
“armed” to begin collecting data by a recognized trigger (as set in the acquisition setup dialog box.) Three cases
are as follows:
.TXT or
1) If there is no Pre-trigger defined, the Trigger option under the Event Configuration portion of the
2) When a Pre-trigger is defined, the Arm process is initiated as soon as the Arm Acquisition is selected.
3) If a keystroke is chosen as the trigger, the Console Trigger dialog box will appear when the Arm
Disarm...
Use the “Disarm…” button to deactivate the data acquisition process at any point during an active acquisition.
The following confirmation dialog box will appear when this item is selected.
Acquisition Setup dialog box will determine when the Arm process is initiated.
Acquisition is selected.
ChartScan User’s Manual ChartView Software Reference 4-15
Page 72

Print Charts
The Print Charts button activates a screen print of ChartView’s main window.
Main Window Pull-Down Menus
The ChartView main window features several pull-down menus. As an alternative to the menus, you
can enable several menu items by using Toolbar buttons, previously discussed. The common items (for
the pull-down menus and toolbar) are described in more detail in the Toolbar section.
File
(see File Menu Note, immediately following this text)
New
(Ctrl + N)
Open…
(Ctrl +O)
Save
(Ctrl + S)
Save As…
Print…
(Ctrl + P)
About…
Sets all channel parameters to their startup (factory default) setting.
Sets all channel parameters as directed by a specified configuration file (.cvw). The Load
ChartView Setup window prompts you to select from a list of previously saved configuration
files.
Saves the existing all-inclusive channel configuration settings for later recall. The Save
command overwrites the existing version if the versions are named the same.
Saves the existing configuration for later recall; asks whether to overwrite the original version or
save under a new filename.
The Print Charts button activates a screen print of ChartView’s main window. When a chart
contains overlapping channels [and the channels share values such that their traces reside on
top of each other], then the channels listed lower in the display list (the most recently added
channels) will obscure the channels higher in the list (those that were added first).
Clicking About will display a “ChartView” or “ChartView Plus” dialog box, as well as the software
version number. ChartView Plus can be activated from the ChartView dialog box, upon
entering a valid Registration ID Number and clicking the OK button. Your program can be
registered through your service representative.
Dialog Boxes for ChartView and ChartView Plus
Exit
4-16 ChartView Software Reference ChartScan User’s Manual
Exits the ChartView program.
Page 73

File Menu Note
When ChartView is started for the very first time there is no default channel configuration file. In this
case a ChartView Startup dialog box appears, providing you with the following four choices: Retry,
Select Device, Load File, and Exit Program. After choosing Select Device a Select Interface dialog
box appears, allowing you to choose IEEE 488, RS-232/422, Network, or Simulated Instrument.
For ethernet operation, “Network” must be selected as the device interface.
Note: NetScan devices can not make use of the IEEE 488 selection.
After the selection has been made, when ChartView is shutdown, the selected interface device and all
channel configuration settings will be automatically saved in a default configuration file. Upon the
next start of ChartView, the default configuration is automatically loaded.
If the default configuration becomes corrupt, or if you would like to bypass the default configuration
when starting ChartView, you can hold down the Shift Key when starting ChartView. This causes the
program to ignore the default channel configuration settings and causes the ChartView Startup dialog
box to appear. This allows you to select Load File to make use of a specified channel configuration
file from a previously saved configuration.
Chart
Wizard Ctrl+W
Setup
Accesses Chart Setup Wizard feature for automated chart configuration.
Accesses Chart Setup window, allowing you to edit your display configuration.
ChartScan User’s Manual ChartView Software Reference 4-17
Page 74

Display config.
Allows you to: Open a previously saved display configuration file, save the current
display configuration file, or save the current display configuration file in a different
location (or under a different file name). (See following note).
Note:
Start F5
Stop F6
Pause F7
Next Group Ctrl+G
Faster Ctrl+Z
Slower Ctrl+X
Zoom
[ Restore ]
Grid limit lines
Off Ctrl+F1
Solid Ctrl+F2
Dots Ctrl+F3
There will be no default Display Configuration file present the first time ChartView is
started. In this case, Chart Setup Wizard activates, allowing you to create a display
setup. When ChartView is shutdown, the display configuration is automatically saved in
a default configuration file that will load upon the next startup of ChartView.
If the default display configuration becomes corrupt, or if you would like to bypass this
configuration when starting ChartView, you can hold down the Control Key when
starting ChartView. This causes the program to ignore the default display configuration
and await your creation of a new display.
Starts, stops, or pauses chart scrolling.
Selects the next chart group in the display configuration.
Used to alter the chart scrolling speed. There are fourteen possible chart speeds. The
range of speeds is from 0.1 sec/div to 1.0 hr/div.
Zoom causes the Main Window to display one chart only. For example, if you were
viewing 3 charts and desired to get a better view of Chart 2, you could use Zoom to
view Chart 2 using the full chart viewing area, as compared to using one third of the
area. The zoom feature can also be invoked by double-clicking in the chart region of
the chart you want to apply the zoom to.
Once you have zoomed in on a chart, the pull-down menu Zoom option is replaced by a
Restore option. Selecting R
previous multiple chart viewing status. The restore feature can also be invoked by
again double-clicking in the chart region.
Allows you to turn the chart’s grid limit lines (items 13 & 19) on or off. If “on”, you can
have the grid lines appear as solid or dots.
estore from the menu will return the main window to its
Timestamp
Absolute Ctrl+F4
Relative Ctrl+F5
View
Toolbar
Timestamps &
Chartspeed
Statusbar
Allows you to select an Absolute or Relative style of timestamp.
A 9 by Toolbar indicates the toolbar will be visible. The absence of the 9 indicates the
visible toolbar option is not chosen, and in this case will not appear on the Main Window.
Use the mouse to select or de-select the toolbar option.
A 9 by Timestamps & Chartspeed indicates the options are selectable and visible. The
absence of the 9 indicates the timestamp/chartspeed option is not chosen, and therefor
not visible on the Main Window. Use the mouse to select or de-select this option.
A 9 by Statusbar indicates the Status Message Box and Status LEDs are visible (items
22 and 24, page 4-5). The absence of the 9 indicates the status bar will not be visible
on the Main Window. Use the mouse to select or de-select this option.
4-18 ChartView Software Reference ChartScan User’s Manual
Page 75

Options
System
Acquisition
PostView Comment
Option Settings includes three separate dialog boxes, accessible by tabs, as indicated in
the following screen captures.
Charts
Restricts Scroll Speed to Eliminate Aliasing
It is possible for chart displays to exhibit aliasing when using ChartScan, NetScan, or
MultiScan devices. The aliasing effect can be eliminated from the display by enabling the
“Restrict scroll speed to actual scan rate” feature. This reduces the scroll speed to a
range that results in non-aliased displays.
Determines Communication Timeout in Seconds
The system communications timeout determines how long the software will wait before
declaring a detected communications error. If linked to Excel, the system timeout value
(indicated in the above figure) will be overridden by the timeout value in the DDE
Configuration for Excel dialog box (accessed from the Data pull-down menu).
PostView Comment and Auto Re-arm Trigger Options
Enabling this option allows the user to enter a comment in a text box located in the
Setup/Data Destination dialog box. The following screen capture provides an example.
The message is stored in the header file (that is created when an acquisition saves data to
disk.)
The PostView Comment option should only be used for systems having PostView version
3.3 or later. The comment field in the header file is not compatible with the earlier versions
of PostView.
Example of a Data Commentary Entry for PostView
When in PostView (version 3.3 or greater), the data commentary can be read by selecting
Data Commentary from PostView’s Option pull-down menu. The commentary is displayed
in a message box.
ChartScan User’s Manual ChartView Software Reference 4-19
Page 76

Acquisition
(continued)
Acquire
Arm Acquisition
(Ctrl + T)
Disarm…
(Ctrl + Y)
Automatic Keyboard
Trigger
on Auto Re-arm
Arms the data acquisition device in preparation of receiving a trigger.
Disarms the data acquisition device and discontinues the acquisition of data.
This feature works in conjunction with Keyboard Triggering when Auto Re-arm is being
used. Auto Re-arm is discussed on page 4-42.
If the option is disabled, acquisition data is saved to disk, and the device automatically
re-arms. ChartView displays the Trigger dialog box and waits for the trigger button to be
pressed by the user before beginning the next acquisition.
If the option is enabled (3), the trigger dialog box is not displayed and the trigger is
automatically sent to the acquisition device. The automatic trigger may be delayed by up
to 2 seconds (after the previous acquisition has finished).
Acquisition Status...
Start All Indicators
Stop All Indicators
Data
DDE Configuration for Excel…
Displays the condition of a data acquisition.
Starts all selected indicators for: the spreadsheet Reading column, Charts, and Meters.
Stops all selected indicators for spreadsheet Reading column, Charts, and Meters.
Configures the DDE (Dynamic Data Exchange) operation of ChartView. This pull-
down menu allows you to dynamically load collected ChartView data into an open
Excel spreadsheet. The three field regions are: Command Characters, Data
Destination, and Timeout. These are discussed on the following page.
4-20 ChartView Software Reference ChartScan User’s Manual
Page 77

Command
Characters
This area contains two fields for entering command characters, one for row setting and one for column
setting. Enter the characters (Excel parameters) to match the applicable version of Excel; for example:
France - Row = L, Column = C
Germany - Row = Z, Column = S
United States - Row = R, Column = C.
Data Destination Assign the Data Destination. This area allows you to assign the data destination on the Excel
Timeout Region
Link to Excel…
Upload Data
During
spreadsheet. Specify the data starting point by entering a number for row, and another for column. The
two numbers designate the upper left hand corner cell of the Excel data entry.
Positioning Data in Excel. The data destination region also allows you to select one of three options in
regard to positioning data in Excel on subsequent scans. Options are as follows:
Row 1 Column 1. This selection starts the next scan at the designated row and column on the Excel
spreadsheet. Changing the values in the “Row” and “Column” boxes (above figure) will automatically enter
the new values in the corresponding fields of the “Row # Column #” placement assignment. For example,
If you entered a 3 in the row box and a 5 in the column box you would see Row 3 Column 5, instead of
Row 1 Column 1, in the above figure; and the next scan would start at row 3 column 5 in Excel.
Row after last scan. When “Row after last scan” is selected the next scan will begin at the point in Excel
where the previous acquisition left off.
Prompt each time. When “Prompt each time” is selected, after each acquisition is completed a dialog box
will ask if you want to return to origin. If you select “Yes”, you will have an overwrite on the Excel
spreadsheet, starting with the existing column and row designation. If you select “No,” the next scan will
begin on the spreadsheet’s next row (from where the previous acquisition left off).
Increment the Row on each new scan. With this selected (9), the Excel spreadsheet will use multiple
rows, one row for each new data scan. With no check-mark, the spreadsheet will make use of one row
only and will continue to display the latest scan information in that row.
Timestamp Format. This feature can only be used if Timestamps have been enabled in the
Setup/Destination dialog box. If this is the case, you can select a pre-configured format for the timestamps
sent to the Excel spreadsheet. Available formats are indicated in the previous screen capture. This
feature only affects the timestamp format in the Excel spreadsheet. It has no effect on timestamps saved
to disk.
This field allows you to enter a DDE link timeout value from 5 to 3276 seconds. The value is how long the
data import to Excel can be suspended while you perform a second Excel activity, such as displaying
graphs, or saving data to disk. A screen message informs you when the DDE link is timed out, terminating
the DDE link to Excel.
Creates DDE link to Excel spreadsheet. Excel must already be running, and Excel Format must be
selected in the Setup/Data Destination dialog box.
Enables ChartView to retrieve scans from device memory as data becomes available. The acquisition is
active.
Acquisition
(automatic control)
Stop Upload
(Ctrl + J)
(manual control)
Stops ChartView’s transfer of data from the instrument to disk.
ChartScan User’s Manual ChartView Software Reference 4-21
Page 78

Upload Available
Scans
(Ctrl + U) (manual
control)
Enables ChartView to access device memory for all scans currently available. This function only uploads
scans that are currently available.
Upload Scans
Until Done
Window
Bar Graph Meters
Analog Meters
Enables ChartView to access device memory and upload scans until scanning is complete.
Selecting Bar Graph Meters from ChartView’s Window pull-down menu brings up the Bar Graph window.
This window displays several channels in bar graph format. To activate the display, select the Start button
in the meter toolbar. At least one meter must be assigned to an active (On) channel. You can select to
view up to 32 meters at a given time. (See page 4-28).
Selecting Analog Meters from ChartView’s Window pull-down menu brings up the Analog
Meters window. This window displays several channels in a dial/gage format. To activate the
display, select the Start button in the meter toolbar. At least one meter must be assigned to an
active (On) channel. You can select to view up to 32 meters at a given time. (See page 4-29).
Digital Meters
PostView
data viewer
post-acq
Selecting Digital Meters from ChartView’s Window pull-down menu brings up the Digital
Meters window to display several channels in numeric format. To activate the display, select
the Start button from the toolbar. At least one meter must be assigned to an active (On)
channel. You can select to view up to 32 meters at a given time. (See page 4-30).
The “PostView post acquisition data viewer” selection accesses the PostView program. This
independent program allows you to view waveforms recorded by data acquisition programs
such as ChartView, ChartView Plus, and TempView. PostView is detailed in Chapter 5 of this
manual.
4-22 ChartView Software Reference ChartScan User’s Manual
Page 79

Device
… Interface ¾¾¾¾
Setup IEEE 488
Setup
RS-232/422
The IEEE 488 Setup dialog box appears. Valid addresses are 0 to 30. DIP switch settings must agree
with this setup. For ChartScan, an IEEE 488 interface card is required for use of IEEE 488 interface.
NetScan devices can not make use of the IEEE 488 interface.
When using ChartView with IEEE 488 applications, you must make use of an IOtech Driver 488/W31, /W95,
or /WNT when made available. In addition, the device must be configured in the Driver 488 and be named
WAVE.
NetScan devices can not make use of the IEEE 488 interface.
The RS-232/422 Setup dialog box appears. If “Yes” is chosen for modem, the RS-232/422 Setup window
changes, allowing you to cancel your call waiting service by entering your cancellation code and your modem
phone number. The Cancel Code pull-down list provides three common code options. Instead of using a
code from the list, you can type in the desired code. Note that the device DIP switch settings must match
those entered in the text boxes.
Comm Port
Baud Rate
Parity
Handshaking
Modem
Cancel Codes
for Call Waiting
ChartScan User’s Manual ChartView Software Reference 4-23
1-16
300, 600, 1200, 2400, 4800, 9600, 19200
None, Odd, or Even
None or RTS/CTS
No or Yes
*70, 70#, 1170, or type in other acceptable code
Page 80

Setup Network
Brings up the Network Interface Settings dialog box. A valid registration number must be entered (1st screen
below) to gain access to the ChartView’s Network Interface support feature. The second dialog box allows users
of NetScan or Net232 to configure the ethernet interface.
Simulated
Instrument
Device
… Status ¾¾¾¾
Instrument
Inventory
Alarms
Status
The program will generate data from a simulated instrument with no actual hardware concerns.
Accesses the System Inventory dialog box.
Brings up selection list for Status, Log configuration, and Log Enable
Brings up the Alarm Status box. The Alarm Status box shows the current state of each alarm. The alarm state
appears as either a “1” or “0”, the “1” being digital High, and the “0” being digital Low (0). A one-for-one
correlation between the alarm number and channel can only occur if each channel of a 32 channel [or less]
system is assigned to a dedicated alarm number.
Log configuration
Alarm logging is a feature of ChartView Plus only. Alarm Logging allows you to monitor the Alarm states of the
instrument, and save selected information to a file whenever any of the states change.
Alarm logging is implemented by periodically polling the instrument; the time interval between polls
is about one second. With this in mind, be aware any event that could trigger an alarm [lasting
one second or less], could be missed and not logged.
4-24 ChartView Software Reference ChartScan User’s Manual
Page 81

From the Alarm configuration dialog box, you can define the information that will be saved in the log file.
Options include the Time and Date when the state change occurred, the Alarm number, the Channel(s) that
tripped the alarm along with the current reading, and the state of the alarm itself or all alarms, either 1 or 0.
Additionally you can define the character that is used to separate the information in the file. This is useful if
you want to read the file into a program that presents the information in a tabular format, such as Microsoft
Excel.
By using combinations of option settings you can define how the alarm log file is filled. If you choose not to
save Alarm ID's (Alarm numbers) in combination with saving All Alarm States, your Alarm file will be saved with
one line of text each time an Alarm state change is detected during polling. The line will contain the optional
Time and Date and 32 digits, one for each alarm, set to either 0 or 1. The left most digit being Alarm one, the
rightmost Alarm 32. You can not choose to save channel information if you have selected not to save Alarm
ID's.
The following example shows what the Alarm log entries look like if this configuration is selected:
1:21:10 PM 10/29/98 00000000000000000000000000000000
1:21:11 PM 10/29/98 01000000000000000000000000000000
1:21:13 PM 10/29/98 11000000000000000000000000000000
1:21:14 PM 10/29/98 00000000000000000000000000000000
If you choose to log Alarm ID's and multiple Alarm state changes are detected during a single poll, multiple
lines of text will be saved in the log file; one for each alarm that had a state change. By examining the optional
Time and Date information you can identify which lines in the Alarm log are associated with Alarms that were
detected during a specific polling event. If you have Alarm ID's enabled, you can also choose to log Channel
information. The channel information contains the channel label and the current reading associated with the
channel. The following example shows what the alarm log entries look like if this configuration is selected:
1:39:46 PM 10/29/98 Alarm-01 (CH1-68.72) 1
1:39:46 PM 10/29/98 Alarm-02 (CH3-68.54) 1
1:40:11 PM 10/29/98 Alarm-01 (CH1-73.22) 0
1:40:12 PM 10/29/98 Alarm-01 (CH1-86.36) 1
1:40:27 PM 10/29/98 Alarm-01 (CH1-71.42) 0
1:41:10 PM 10/29/98 Alarm-01 (CH1-69.98)(CH2-71.24) 0
ChartScan User’s Manual ChartView Software Reference 4-25
Page 82

Log Enable
(Ctrl+A)
Once an alarm log file exists, log enable can be used to activate the logging process; or to disable an
active log. A check-mark (9) preceding Log Enable indicates that the log is active. No check-mark
present indicates the alarm log has not been enabled.
Instrument Error
Status
Instrument
Realtime Clock
Brings up the Device Error Status dialog box. This box lists existing error types, including invalid
command and channel configuration errors.
Brings up the Device System Time dialog box. You can adjust the time and date settings from this
box.
Device … Configuration ¾
You can expand the Device pull-down menu by pressing the F12 function key (on your computer keyboard) prior to
pulling down the menu. After pressing F12, the pull-down menu will show a listing entitled “Configuration.” The
expanded-menu setting is not saved in the configuration file when exiting ChartView. If the expanded menu is
desired, you must press F12 each time you start ChartView.
operator. The Raw Thermocouple Input and Raw Temperature Sensor Input selections primarily exist as an aid in
troubleshooting by experienced technicians.
Device Status Dialog Boxes
¾ A Device Expanded Menu
¾¾
(obtained with use of the F12 Key)
This expanded menu is typically not used by the
4-26 ChartView Software Reference ChartScan User’s Manual
Page 83

Setup
Channels & Alarms Ctrl+L
Acquisition
Ctrl+C
Data Destination
Accesses the Setup Window for configuring channels and alarms. From the
channels & alarms dialog box, you can select the Acquisition Setup and Data
Destination dialog boxes.
Accesses the Acquisition Setup dialog box. From the Acquisition Setup box,
you can select the Channels & Alarms dialog box, as well as the Data
Destination dialog box.
Accesses the Setup Window for assigning the Data Destination and provides a
means of configuring the Auto Re-arm feature for ChartView Plus (see page
4-42). From the Data Destination dialog box you can directly access the
Acquisition Setup and the Channels & Alarms dialog boxes.
Bar Graph, Analog, and Digital Meters
Overview
This section pertains to channel data display screens (windows, or dialog boxes) other than the main
chart screen (ChartView’s main window).
After a brief discussion and illustration of each meter type, commonalties to these three types of meters
is presented. These common areas include: Toolbars, Pull-Down Menus, and two special Pop-Up
Menus, one for configuring the meters, and the other for replacing a represented channel with another.
Note: The acquisition-to-disk has a higher priority then the updating of Charts, Meters, and the Reading
column. Therefore, data is displayed as soon as the acquisition task is satisfied. As the scan rate is
increased, the acquisition-to-disk task will take up more processor (CPU) time and the displaying of
data will be updated as time allows. If you select linear conversion (
configuration you should expect a further impact on real time display performance. The
conversion is discussed in the section, Channel and Alarm Setup Dialog Box.
) as the units for channel
mX + b
mX + b
Note: The meter channels selected are independent of the group chart assignments.
ChartScan User’s Manual ChartView Software Reference 4-27
Page 84

Bar Graph Meters
Selecting Bar Graph Meters from ChartView’s Window pull-down menu brings up the Bar Graph
window. This window displays several channels in bar graph format. To activate the display, select
the Start button from the toolbar. At least one meter must be assigned to an active (On) channel. You
can select to view up to 32 meters at a given time.
Bargraph Meters, Shown with 3 Meters Selected for Viewing
Note 1: Double-clicking the left mouse button in a meters scale area brings up a channel selection pop-up
menu. A single click with the right mouse button in this same area brings up a configuration pop-up
menu (item H). Both of these pop-up menus are discussed in the section, Meters Configuration Menu.
The items in this window are as follows:
A - Start C - Reset Peak Hold E - Print G - Number of Meters
B - Stop D - Stay On Top F - Rows x Columns H - Configuration Pop-Up Menu
These items are discussed in more detail, following the description of Digital Meters.
Configuration Note: …. for Bar Graph Meters
For Bar Graph Meters, configure the meter settings by first clicking the right mouse button
anywhere within the meter display area. A pop-up menu will appear allowing you to reconfigure
the meter in regard to scale, limits, channel selection, adding peak hold indicators, etc. Refer to the
section entitled Meters Configuration Menu for more detail.
4-28 ChartView Software Reference ChartScan User’s Manual
Page 85

Analog Meters
Selecting Analog Meters from ChartView’s Window pull-down menu brings up the Analog Meters
window. This window displays several channels in a dial/gage format. To activate the display, select
the Start button from the toolbar. At least one meter must be assigned to an active (On) channel. You
can select to view up to 32 meters at a given time.
Analog Meters, Shown with 4 Meters Selected for Viewing
Double-clicking the left mouse button in a meters scale area brings up a channel selection pop-up menu
(not shown). A single-click with the right mouse button in this same area brings up a configuration
pop-up menu (see Bar Graph Meters figure, item H). Both of these pop-up menus are discussed in the
section, Meters Configuration Menu.
Note that Meter #3 (CH3) in the above figure shows Peak Indicators near the pointer, as well as a
trend indicator in the upper right hand corner of the meter.
The items in this window are as follows:
A- Start C - Reset Peak Hold E - Print G - Number of Meters
B- Stop D - Stay On Top F - Rows x Columns H - Configuration Pop-Up Menu
These items are discussed in more detail, following the description of the Digital Meters.
Configuration Note: …. for Analog Meters
For Analog Meters, configure the meter settings by first clicking the right mouse button anywhere
within the meter display area. A pop-up menu will appear allowing you to reconfigure the meter
in regard to scale, limits, channel selection, adding peak hold indicators, etc. Refer to the section
entitled Meters Configuration Menu for more detail.
ChartScan User’s Manual ChartView Software Reference 4-29
Page 86

Digital Meters
Selecting Digital Meters from ChartView’s Window pull-down menu brings up the Digital Meters
window to display several channels in numeric format. To activate the display, select the Start button
from the toolbar. At least one meter must be assigned to an active (On) channel. You can select to
view up to 32 meters at a given time.
Digital Meters, Shown with 6 Meters Selected for Viewing
Note: Although the Digital Meters instrument is capable of displaying 6 decimal places, there is not 6
place accuracy in the readings. Due to transducer and transient noises, the accuracy of voltage
readings is ± 0.02%. Temperature accuracy varies, depending on thermocouple type; with type J
having ± 0.5°C for a range of -100°C to +760°C. For your application, please refer to
specifications of the signal conditioning card(s) used, as well as the thermocouple type, and the
data acquisition instrument used (TempScan, MultiScan, ChartScan, or NetScan).
Double-clicking the left mouse button in a meters scale area brings up a channel selection pop-up menu
(not shown). A single-click with the right mouse button in this same area brings up a configuration
pop-up menu (see Bar Graph Meters figure, item H). Both of these pop-up menus are discussed in the
section, Meters Configuration Menu. Note that each of the above channels shows a trend indicator on
the left side of the meter.
The items in this window are as follows:
A - Start C - N/A E - Print G - Number of Meters
B - Stop D - Stay On Top F - Rows x Columns H - Configuration Pop-Up Menu
Toolbar items A through G are discussed in more detail in the following section, Meter Toolbars.
Item H is discussed in the subsequent section, Meters Configuration Menu.
Configuration Note: …. For Digital Meters
Configure the Digital Meters settings by first clicking the right mouse button anywhere within the
digital meter display area. A pop-up menu will appear allowing you to reconfigure the meter in
regard to scale, limits, channel selection, etc. Refer to the section entitled Configure Meter
Settings for more detail.
4-30 ChartView Software Reference ChartScan User’s Manual
Page 87

Meter Toolbars
The toolbars for the three meter types are identical, with exception that the Digital Meters toolbar does
not have a Reset Peak Hold button (item C in the following figure).
Item Name Function
A Start Starts meters.
B Stop Stops meters.
Meters Toolbar Buttons
C Reset Peak Hold
Indicator
DStay On Top
(Push pin)
EPrint
FRows x Columns
G Number of Meters
Meter Pull-Down Menus
The meters windows each have a Control and View pull-down menu, as indicated by the following
figure. The functions of these menus can also be implemented by using the toolbar buttons.
Resets the floating markers. Upon reset, the markers will instantly
adjust to indicate the highest and lowest values reached since the time
of the reset. This feature does not apply to the Digital Meters.
Locks or unlocks the meter window on top of other windows.
Sends the meter(s) display image to connected printer.
Opens a small menu with “row x column” arrangement options. Example:
When the number of meters is 6 the grid options will be: 6x1, 3
2x4 with the first number being the number of rows. If you then select 3x2,
you will have 3 rows of meters with 2 meters per row.
Specifies the number of meters to appear on the screen.
A maximum number of 32 meters can be selected.
x2, 2x3, and
ChartScan User’s Manual ChartView Software Reference 4-31
Page 88

Meters Configuration Menu
A meters configuration menu (lower left corner of figure) will appear when you place the mouse
pointer over a meter and click the right-hand mouse button. The menu allows you to access various
dialog boxes for changing parameters for an individual meter, or simultaneously for a group of meters.
The steps for configuring a meter are detailed below.
Note: The Show Peak Hold Indicator / Reset Peak Hold Indicator selections are not an option for
Digital Meters and do not appear on the configuration window for digital meters.
Meter Configuration Menu and Related Dialog Boxes
Configuring a Meter
1. Bring up the desired meter group (Bar Graph, Analog, or Digital).
2. Place the mouse cursor over the meter you desire to reconfigure.
3. Click on the right mouse button. A Meters Configuration Menu, similar to that in the above figure, will
appear.
Note: The Show Peak Hold Indicator / Reset Peak Hold Indicator selections are not an option for
Digital Meters and do not appear on the configuration window for digital meters.
4. Select the desired option from the meter configuration menu.
5. If a dialog box is required, for example, to change a limit, simply enter in the new value in the
appropriate parameter box and press “Apply” or “OK.” Pressing “Apply” implements your changes,
but keeps the dialog box open, allowing you to make additional changes. Pressing “OK” implements
your changes and closes the dialog box.
The following table, as well as the preceding figure, serve as a quick reference to meters configuration.
4-32 ChartView Software Reference ChartScan User’s Manual
Page 89

Configure Meter Settings, Function Descriptions
Function Description
1 Select Channel
2Set Scale
3 Show Peak Hold
Indicator
Reset Peak Hold
Indicator
4 Show Trend
Indicator
5Set Limits
Show Limits
6 Properties
Select a new channel for display. The selected channel will replace the one currently seen in
the meter. Note, double-clicking the left mouse button in the meter region will also bring up
a dialog box that allows you to select a new channel.
Set the high and low points of the scale, as well as define the decimal place format.
Places high and low uni-directional floating markers on the scale to indicate the highest and
lowest values reached up to the present time.
Meters selection.
Resets the floating markers. Upon reset, the markers will instantly adjust to indicate the
highest and lowest values reached since the time of the reset.
to the Digital Meters selection.
Displays a pointer to indicate the direction of the trend. Note, during rapid meter
fluctuations the increase and decrease pointers will appear to blink simultaneously.
Provides a way of establishing high and low limit set-points.
Displays limits in color (red for high, blue for low). The color is applied to scale regions >
the set limit values. For Digital Meters, the limits are indicated by red numbers and an
upper red bar for hitting or exceeding the high limit; and blue numbers and a lower blue bar
when reaching or exceeding the low limit.
Allows setting and showing limits, as well as opening the Scale dialog box.
This feature does not apply to the Digital
This feature does not apply
You can access a different dialog box from the one initially selected. For example, from the Set Scale
dialog box you can select Limits to access the Set Limits/Show Limits display, as well as select “Misc.”
to “Show Trend Indicator” and “Show P
eak Hold Indicators.” You can use the Simulated Instrument
mode to familiarize yourself with various meter configuration options.
Setup Window
The Setup Window is used to configure channels, setup acquisition parameters, and assign data
destinations, and configure the auto re-arm feature. The Setup Window contains three tabs: Channel
and Alarm Setup, Acquisition Setup, and Data Destination. Once in the Setup window you can access
an inactive dialog box by clicking on its related tab. The three tabs remain visible; regardless of which
dialog box is active.
Access the Setup window using one of the following methods:
•
Use the Setup pull-down menu (on ChartView’s main window) and select the desired
dialog box (Channel and Alarm Setup, Acquisition Setup, or Data Destination)
• Double-click the Channel Configuration button (item 8, main window figure), then click
on the appropriate dialog box tab
Channel & Alarm Setup Dialog Box
The Channel and Alarm Setup dialog box consists primarily of a configuration spread-sheet. The
dialog box allows you to configure the input channels, and displays them. Each row shows a single
channel and its configuration. The number of rows may vary (depending on the number of channels
present in your acquisition system). Four of the columns (On, Type, Label, and Units) allow blocks of
cells to be selected and altered at the same time. Clicking on one of these column headers selects the
entire column.
When a cell is selected, the message box reveals a note, and often a related pull-down list. In the
following figure, the cell for channel “Type” has been selected. This caused the “CHOOSE TYPE->”
message to appear, along with the type pull-down menu. Depending on the column, you can make
changes to the information contained in the cell by either of the following methods:
• double clicking the cell with the mouse
•
highlighting the cell and typing in the new value or label
•
selecting from a list
•
using copy (Ctrl+C) and paste (Ctrl+V) functions
ChartScan User’s Manual ChartView Software Reference 4-33
Page 90

Channel and Alarm Setup Dialog Box
Channel and Alarm Setup, Button Descriptions
1 – Turn On All Channels (Alt + N)
2 – Turn Off All Channels Not Assigned to Charts (Alt + F)
3 – Turn On/Off Channel Readings (Alt + R)
4 – Print Entire Channel and Alarm Setup (Alt + P)
The following table indicates message and pull-down menu aspects of the Channel and Alarm Setup
Dialog Box.
Channel and Alarm Setup Dialog Box
Message and Pull-Down List Aspects
Column Message
1 CH N/A --2 On ENABLE or DISABLE
3 Reading N/A --4 Type CHOOSE TYPE->
5 Label ENTER LABEL (MAX = 8 LETTER) --6 Units CHOOSE UNITS->
7 Low ENTER DESIRED LOW LIMIT --8 High ENTER DESIRED HIGH LIMIT --9 Hyst ENTER DESIRED HYSTERESIS --10 Alarm# SELECT AN ALARM#
“3” indicates the associated item has a pull-down list from
*A
which a selection can be made.
List
3
3
3
3
*
The pull-down list selection or copy/paste process are useful for making multiple channel configuration
changes within a column. You may double-click within a cell to make your way through all the
possible selections. The selections are repetitive; in other words, you will eventually advance to the
same selection with which you started.
The following text provides more detail regarding the channel and alarm configuration parameters.
The number preceding the text refers to the column number with “1” being the left-hand column and
“10” being the right-hand column of the Channel and Alarm Setup Dialog Box.
4-34 ChartView Software Reference ChartScan User’s Manual
Page 91

Channel Configuration Columns
Channel (CH)
1)
This column serves only as a channel number indicator. The channel number cannot be
changed from this column.
On
2)
The On column allows you to enable a channel for data collection. When a cell or block of cells in
this column is selected, a selection box will appear that allows “On” to enable or “Off” to disable the
channel. Double-clicking a cell in this column toggles the channel’s enable status. Clicking the Make All
Channels Active button enables (turns all channels “on”). Clicking on the Make All Channels Inactive
button disables all channels (turns them “off”), with the exception that channels assigned to charts can only
be turned off from the display configuration setup.
3)
Readings
The reading column displays the scanning device input readings. The column is activated
when you select the Enable SpreadSheet Reading button. The column’s values are real-time channel values
from the instrument and cannot be altered by the user. This column will update the readings as fast as the
computer will allow.
Note: Other areas of the SpreadSheet cannot be altered while the channel Readings column is enabled.
4)
Type
A block of cells in this column can be selected for convenience of single type selection.
Double-clicking a cell will select the next available type.
Label
5)
The Label column identifies the input channel by descriptive name. The label is used when
selecting a channel in the trigger and chart selection lists. The label column automatically uses the channel
number as a default. You can change the label to any alpha-numeric designation not exceeding eight
characters. Each label used must be unique (specific) to its designated channel.
6)
Units
Cells in the Units column are dependent on the Type selected and automatically change when the
type is changed, for example temperature units will be replaced by volts units when changing from a
thermocouple type to a volts type.
If the channel is configured for Temperature, the units automatically change to °C (default); at this point,
you have the option of selecting a different engineering temperature unit (°F, °K, °and R). Note that the
mX+b equation, discussed in the following text, is typically not used for temperature readings, since
temperature data will be linear. However, you can use the equation in temperature applications, for
example: setting b to -32 in order to watch deviations from freezing point when temperature is in °F.
In addition, with ChartView Plus you can subtract a reference channel from the mX+b equation to obtain a
temperature differential, as indicated in the following example.
Example:
A heated room has 2 thermocouples (T1 for CH1 and T2 for CH2); with T1 being in the center of the room
and T2 positioned at an outer wall. If the outer wall is monitored to ensure a temperature within ±2°F (of
the temperature indicated by thermocouple T1), then CH1 can be used as a reference channel such that its
value will be subtracted from the actual value for channel 2. Assume the central thermocouple is reading
90.5°F and the outer thermocouple (for CH2) is reading 89.0°F. In this case, we can use the equation so
channel 2’s charted reading will not be of the actual temperature, but will be the differential between CH1
and CH2, e.g.:
y = (mX + b) - ref. chan
y
= Channel 2’s charted value (a temperature
differential)
m
= 1
b
= 0
X
= CH2
ref. Chan.
Channel 2’s charted value = (1 x CH2 + 0) - CH1
Channel 2’s charted value = (1 x 89.0°F + 0) - 90.5°F
Channel 2’s charted value = -1.5°F
= CH1
; where:
Note: The reference channel feature is only available with ChartView Plus.
ChartScan User’s Manual ChartView Software Reference 4-35
Page 92

Note: When using a channel as a reference channel, remember that lower numbered channels are calculated
ahead of higher numbered channels, e.g., CH1 is calculated ahead of CH2. This makes a difference
when subtracting a reference channel in regard to the time aspect of the reference value.
If the channel is configured for Volts, the units automatically change to V; at this point, you have the
option of selecting the millivolt unit (mV). The user can also change each channel to apply a linear
equation (mX+b) to the data. When the mX+b option is selected the Configure Engineering Units dialog
box is displayed. You are prompted to define “m” and “b” and the engineering units label; as well as which
standard units the mX+b equation should be applied to. The engineering units chosen will be displayed in
the “Units” column, and the “mX+b” equation will be applied to the reading from the device before the
reading is displayed or written to disk.
The mX+b option is convenient for obtaining a value that has a linear relation to a channel reading.
X is the scanned voltage value read back from the acquisition device
m is [but not limited to] a proportionality constant or gain factor, but not zero.
b is the offset value (the value of the calculated reading when the scanned value is “zero”).
Alarm Configuration Columns
Low Limit
1)
High Limit
2)
Hysteresis
3)
See Appendix C, Set Point Hysteresis, page C-27.
Alarm #
4)
assigned to the same alarm number. A given digital output will be set “true” (1) if at least one of the
common channels (assigned to a single alarm) enters an alarm state.
Set alarm low limit.
Set alarm high limit.
A hysteresis value can be set for each channel to avoid a “chatter” problem.
You can assign one alarm number (1 to 32) to a channel. Any number of channels can be
Acquisition Setup Dialog Box
The information entered in the Acquisition Setup dialog box is used by the Arm Acquisition command
to set up the acquisition of data to disk. When the trigger is satisfied, the scans are collected at the
selected scan frequency and stored to disk in the designated file.
The Acquisition Setup dialog box can be accessed in one of three ways: a) clicking on the Channel
Configuration button (item 8 in Main Window figure), b) clicking on the Acquisition Setup tab from
the Channels or Data Destination dialog boxes, c) using the Setup pull-down menu and selecting
Acquisition.
ChartScan, NetScan, and MultiScan have two modes of data acquisition, these are:
•
Normal mode
•
High-speed, single-channel mode (burst mode)
4-36 ChartView Software Reference ChartScan User’s Manual
Page 93

The mode is selected from the lower left-hand portion of the dialog box. The following figure
represents a screen capture with normal mode selected.
Acquisition Setup Dialog Box, Normal Mode
The following figure depicts components of an acquisition. The Trigger and Stop Points represent the
entries described under the Event Configuration selection in the table on the following page.
In the “High-speed, single-channel” mode the Scan Intervals parameters section is replaced with a
High-Speed Setup parameters section with boxes for selection of Channel and Scan Rate, as indicated
in the following figure.
In the High-speed, single-channel (burst mode), all ChartView display functions are
intentionally disabled. Data acquisition and storage to disk are the only services that
remain functional. When you select the High-speed, single channel mode, a Warning
dialog box appears with this information, providing you with the opportunity to cancel if
desired.
Reference Note: Burst mode operational constraints are discussed in greater detail on
page 4-39.
ChartScan User’s Manual ChartView Software Reference 4-37
Page 94

Parameter Options
Acquisition Setup
Event Configuration
Trigger: Set a trigger scan in the Acquisition by using one of the following:
Keyboard - Use Console Trigger dialog box to start trigger scan.
Note: If the Keyboard Trigger is selected the use of Pre-trigger is disabled.
External TTL - Use an external signal to start the trigger scan.
Channel Value - Use specified value of a given channel.
Alarm - Use an Alarm value to start the trigger scan.
Absolute Time - Use a time of day to start the trigger scan.
Note: If Absolute Time is selected, the use of Auto Re-arm is disabled.
Stop: Set a stop scan in the Acquisition by using one of the above selections or Count (as
Count: Specify a number of scans to be read before a stop scan is set.
Acquisition Parameters
Note: These parameters cannot be altered while an acquisition is in progress.
Scan Counts: Specify the number of scans in an acquisition
Average weight: Average weight can be specified only when in the Normal Mode. The value for
Scan Intervals: Time between scans (frequency of scans)
High Speed Setup:
specified below). Keyboard isn’t applicable. If a MultiScan, ChartScan, or NetScan is
connected and High-Speed Single-Channel (Burst Mode) is selected, then “Count from
trigger” is the only Stop available for the event configuration.
Pre-trigger
Post Stop
the average weight determines the number of samples to be averaged when in
Normal Mode. Values of 1, 2, 4, and 8 are for high-speed multiple channel
applications for thermocouples and DC voltages where noise filtering is not an
issue.
Values of 16, 32, 64, 128, and 256 are recommended for AC noise rejection.
Pre-trigger and Post Stop
Post-trigger
Use one Interval
Allows for channel and scan rate entries for high-speed, single channel mode.
Note: If Normal Mode is selected, channels assigned to a chart must be (and will be) enabled in the Acquisition.
The assigned channels will be “ON” in the
Channel Configuration portion of the
Channel and Alarm Setup spreadsheet and
can not be turned off while assigned to a
chart. However; additional channels (not
assigned to charts) can still be enabled and
disabled from the Channel and Alarm Setup
sheet.
Example. In the figure to the left:
(a) Channel 1 and Channel 2 can not be
turned “OFF.” Each is assigned to a chart.
(b) Both Channel 3 and Channel 4 can be
turned “OFF.” Neither is assigned to a chart.
(c) An attempt to remove a chart-assigned
channel will result in a message box similar to
that in the figure.
Normal Mode, CH1 and CH2 Assigned to a Chart
4-38 ChartView Software Reference ChartScan User’s Manual
Page 95

Burst Mode, Operational Issues
Acquisition Setup Dialog Box, High-Speed, Single-Channel Mode
The Burst Mode, also referred to as High-speed, single-channel mode, is selected with a radio-button located on
the lower left of the Acquisition Setup Dialog Box. The following bulleted issues apply to Burst Mode operations.
• When in the High-speed, single-channel (burst mode), all ChartView display functions are intentionally
disabled. Data acquisition and storage to disk are the only services that remain functional. When you
select the High-speed, single channel mode, a Warning message box appears, as indicated in the
following figure.
This Warning Appears Prior to Enabling the Burst Mode
•
The Burst Mode channel will be the only channel enabled in the instrument. This is regardless of the
ON/OFF status indicated on the Channel and Alarm Setup spreadsheet (located on the Setup Channel
Types, Alarms and Acquisition Parameters Window).
ChartScan User’s Manual ChartView Software Reference 4-39
Page 96

• When using Burst Mode, data saved to disk can still be viewed in PostView. However, the PostView
chart setup will only allow you to select the single channel (previously selected in ChartView as the
high-speed Burst Mode channel).
Example: If Channel 4 is selected as the High-Speed Setup Channel (in ChartView’s Acquisition Setup),
and data is acquired and saved to disk, then the only channel that can be selected for PostView’s
chart display is Channel 4.
• When you switch operation from Burst Mode, back to Normal Mode…
a) channels that were assigned to Charts will automatically re-enable, i.e., returned to an ON state.
b) channels that were not assigned to Charts, but were set to ON prior to selecting Burst Mode, will not
return to the ON state automatically.
c) the channel that was selected for Burst Mode will remain in the ON state, unless turned off by the user.
Measuring AC Voltage, or AC RMS Voltage
Introduction
When someone talks about measuring AC voltage, they are usually talking about measuring
“AC RMS,” which is the effective periodic value of the voltage for one full cycle. RMS (Root Mean
Square) is the square root of the average of the squares of the signal being measured.
ChartScan, MultiScan and NetScan can use multiple channels to measure AC RMS voltages; but are
restricted to the use of one channel when measure actual AC voltage at 60 cycles. The following
questions and answers should help to clarify this point.
Question 1: Can I measure multiple channels of 60 cycle waveforms with ChartScan, MultiScan, or
NetScan?
Answer: No. Measuring a 60 cycle (or 50 cycle) waveform with ChartScan, MultiScan, or
NetScan requires the use of High-speed, single-channel Burst Mode. While in this mode,
only one channel can be measured. See related questions 2 and 3.
Question 2: How do I measure a 60 cycle waveform using just one channel?
Answer: To measure AC, you must sample at a rate fast enough to see every cycle line.
Multiplying the number of cycles by 10 will provide an adequate sampling rate. For
example: for 60 Hz you should sample at 600 samples/sec; and for 50 Hz you should
sample at 500 samples/sec.
To obtain these sample rates [with ChartScan, MultiScan, or NetScan], use the
High-speed, single-channel (Burst Mode).
Question 3: Can I measure multiple channels of 60 cycle “AC RMS” voltage with ChartScan,
MultiScan, or NetScan?
Answer: Yes, providing the amplitude of the signals falls within the range of the card. For
example, if your amplitude was 120V you would need to use a high voltage signalconditioning card. Note that the CSN14/HV/S card has a high range of ±250V. To
measure multiple channels of 60 cycle AC RMS (or 50 Hz, AC RMS in Europe), perform
the steps in the following section, Measuring AC RMS.
4-40 ChartView Software Reference ChartScan User’s Manual
Page 97

Measuring AC RMS
The following steps pertain to measuring AC RMS voltage.
1. Determine the peak voltage of the input signal.
2. Based on the value from step 1, select the appropriate VAC option. This is done in ChartView’s
Channel and Alarm Setup window (see following figure).
3. In the Acquisition Setup Dialog Box, set the Average Weight to “32.”
Choosing A Voltage Type
Setting Average Weight to 32 (in the Acquisition Setup Dialog Box)
4. Run the acquisition as normal.
ChartScan User’s Manual ChartView Software Reference 4-41
Page 98

Data Destination Dialog Box
Data Destination
The Data Destination portion of the box is used to assign a filename and folder location for data, select an
Excel or binary format (
(to be included in the data) if desired. The dialog box can be accessed from the Channel and Alarm Setup
and Acquisition Setup dialog boxes by selecting the Data Destination tab, or by selecting Data Destination
from the Setup pull-down menu. You can quickly access the Channel and Alarm Setup and Acquisition
Setup dialog boxes by selecting the appropriate folder tab image located near the top of the Data
Destination dialog box.
.TXT or .IOT respectively), and to select optional Time/Date and/or Alarm Stamps
The following items describe key areas of the Data Destination Dialog box. If you have
ChartView Plus, you can use the lower section of the Data Destination box to configure Auto Re-arm
as described in the sub-section below, entitled Auto Re-arm (for ChartView Plus Only).
Folder: The drive and directory where data will be written.
Filename: Name of data file.
Format: File saved as an Excel (.TXT) or Binary (.IOT) format.
Scan Format: Data marked with Time/Date Stamp and/or Alarm Stamp.
Note: These parameters cannot be altered while the acquisition is in progress.
Auto Re-arm (for ChartView Plus only)
Auto Re-arm is a feature available with ChartView Plus. As seen in the previous figure, Auto Re-arm
is accessed from the Data Destination box. The Auto Re-arm feature allows for a large number of
acquisitions to take place automatically, with each acquisition using the same configuration settings.
With Auto Re-arm, the system immediately re-arms itself, waiting for the trigger to be satisfied, as soon
as the previous trigger block is terminated.
Auto Re-arm allows you to choose one of the following three options:
• capture one trigger block (default, Auto Re-arm disabled)
•
capture multiple trigger blocks in one file
• capture multiple trigger blocks in indexed files
Destination Dialog Box
4-42 ChartView Software Reference ChartScan User’s Manual
Page 99

Why use Auto Re-arm?
You can use Auto Re-arm as a convenient way to monitor and analyze specific types of trigger events.
For example, if you set Channel 1 going above 30°C as a trigger, you can choose to repeat 100 (or
more) acquisitions with this same trigger criteria (Channel 1 > 30°C). Whether you select to capture
the trigger blocks in one file, or each in a separate file, each of the data acquisitions will occur
automatically; and each will make use of your set configuration.
Disabling Auto Re-arm
To disable Auto Re-arm, simply use Auto Re-arm’s default setting of “Capture one trigger block.”
When you capture only one trigger block you are, in essence, not making use of the automatic re-arm
feature.
Note: The trigger event, trigger by absolute time, is not suitable for automatic re-arming. In this instance, the
default of “Capture one trigger block” is automatically forced.
ChartScan User’s Manual ChartView Software Reference 4-43
Page 100

Chart Setup Wizard
Reference Note: For very first time start-up of ChartView and a program tutorial (that includes a first
time use of the Chart Setup Wizard) refer to Chapter 1.
Introduction
Chart Setup Wizard is a feature of ChartView, ChartView Plus and PostView. The feature allows you
to set up your initial chart display configuration using an automated method, or manually create a new
display configuration. The following points are important in regard to the Chart Setup Wizard.
•
•
• Chart Setup Wizard, as described in this text, covers the expanded setup applications available
•
Activating the Chart Setup Wizard from the Chart pull-down menu will result in the following dialog
box and warning.
The Chart Setup Wizard window appears when you attempt to run ChartView for the very first time, as
well as when a configuration file does not exist. When a configuration file already exists, you can
easily access the Chart Setup Wizard by selecting Wizard in the Chart pull-down menu. It is important
to realize running the Chart Setup Wizard will result in a reset of your display setup; it will not,
however, change your channel and alarm configuration (with the exception of new display channels
now enabled).
You can edit the chart display by accessing the Display Configuration Setup dialog box from
the Chart pull-down menu; or by clicking of the Chart Setup button in the main window
toolbar. This method does not use the Chart Setup Wizard and does not reset your chart
display configuration setup.
Activating the Chart Setup Wizard will reset your chart Display Configuration Setup. It
will not reset your Channel and Alarm configuration.
with ChartView Plus. The basic ChartView program does not permit overlapping channels or
having more than 1 chart group.
Expanded applications (ChartView Plus) can be activated by use of a special code available
from the factory. Please consult your service representative for more detailed information.
The chart setup determines how your ChartView Main Window will appear in regard to the following:
•
number of chart groups available for viewing
•
number of charts shown for each selected group
•
the number of overlapping channels in each chart (not to exceed 4)
You can choose to manually create a configuration, or have one created automatically. The automatic
setup method offers three choices: Simple, M
available with ChartView Plus.
Note: You can use Chart Setup Wizard to quickly set up a large number of charts. You can then
fine-tune the layout manually via the Manual Chart Creation feature.
4-44 ChartView Software Reference ChartScan User’s Manual
oderate, and Advanced. Moderate and advanced are only
 Loading...