

Page 1

Temperature/Humidity/Dew Point Sensor
OM-60-TH SERVICE LOGGER
TEMPERATURE/HUMIDITY/DEW POINT SENSOR
WITH
The OM-60-TH is a Service Logger with a temperature/humidity/dew point sensor. The OM-60-TH is specified for air use only. The sensor is field interchangeable and is available as part # OM-60-MOD-TH.
Immersion of the sensor in any kind of liquid, or exposure to corrosive chemical env ironme nts and/or cutting or splicing of the
OM-60-MOD-TH cables by the user is not recommended and will
void the sensor warra nt y .
GETTING STARTED
Plug the OM-60-MOD-TH sensor into the Service Logger. If portable use or battery backup is desired, place a fresh 9V alkaline battery into the unit. Any other
type of battery will result in unsatisfactory performance and may cause damage
to the instrument. Plug in the pow er ad a p ter i f a 110 (220) Vo lt o u tlet i s
accessible.
Press the "ON" button on the front panel. The
display will show the instrument name. If no
display is visible, or if the display is all black,
adjust the display control until the lettering is
visible.
If no sensor is connected, or if the sensor has
become defective, the display will show this
message. The Service Logger will recognize
when a sensor is plugged in and will automatically set up the correct menus and displays
for that sensor.
This is the Operating Mode display for the
OM-60-MOD-TH sensor. Temperature, relative
humidity in percentages, and dew point are
continuously measured and displayed. This is
the mode the Service Logger will go to after it is
turned on.
1
SERVICE LOGGER
VER 2.0
PLEASE
CONNECT SENSORS
TEMP RH DEW
74F 42% 49F
Page 2

Temperature/Humidity/Dew Point Sensor
CHANGING SETTINGS
Every function of the Service Logger can be set through a series of menus. Settings are stored in memory and remain there even without main and backup
power sources until altered by the user. Each sensor will have settings unique to
its function and the Service Logger will select and display the correct menus for
each sensor that is plugged in.
Changing Recording Time and Sampling Rate
MENU
Press and hold the
ENTER
button until the
display changes to the to the Recordin g Rate
menu. The user may select the sampling rate
and recording time for the Service Logger.
RECORDING RATE
15HR EVERY 15SEC
Use the
STATU S
RECORD
or
buttons to
change the recording time and sampling rate
according to the table listed below .
Recording Time Sampling Rate
40 Days 15 Minutes
2 Weeks 5 Minutes
60 Hours 1 Minute
30 Hours 30 Seconds
15 Hours 15 Seconds
5 Hours 5 Seconds
MENU
When the
ENTER
button is pressed 3 more times (to cycle thro u g h th e remaining functions), the recording time and the sampling rate will be saved into
memory and the Service Logger will return to the operating mode. Otherwise
the unit will return to the operating mode after approximately 1 minute and
changes will be saved in to memory.
Changing Scale to °F or °C
MENU
Press the
reads:
ENTER
button until the display
TEMPERATURE SET
TO FAHRENHEIT
or
2
Page 3

Temperature/Humidity/Dew Point Sensor
TEMPERATURE SET
TO CELSIUS
Use the
STATUS
or
RECORD
buttons to
change the setting to the desired scale.
MENU
When the
ENTER
button is pressed twice more (to cycle through the remaining functions), the temperature scale setting will be saved into memory,
and the Service Logger will return to the operating mode. Otherwise the unit will
return to the operating mode after approximately 1 minute and changes will be
saved into memory.
RECORDING DATA
One of the most important functions of the Service Logger is to record information over a period of time. This function is like a chart recorder except that the
information is stored in memory rather than being printed on paper. The user
can choose to print the informati o n, transfer the information to a computer fo r
advanced analysis or long term storage, or review the information on the Service Logger’s display.
In the case of the OM-60-MOD-TH sensor, the temperature, relative humidity,
and dew point will be recorded. Different sensors will, of course, record different
information depending on the function of that sensor. The Service Logger has a
memory capacity to record up to 4000 sa mp les o f d a ta . It i s th e o ption of the
user to record data to the maximum capacity of the Service Logger or to terminate a recording when sufficient information has been gathered.
IMPORTANT !
Each new recording will erase any previously recorded information. It is th e
responsibility of the user to either print or store a previ ous recording prior
to starting a new one.
The first step in making a recording is to select the proper recording time and
sample rate. If, for example, a sampling rate of 15 seconds is being used, then
every 15 seconds the temperature, relative humidity and dew point will be
measured and stored into digital memory. No record of information is made
between each sample even though the display will continuously show the environment the OM-60-MOD-TH sensor is exposed to.
For a recording to accurately reflect a series of events, it is u p to the u ser to select a recording interval that best suits the particular application. In some situations maximum record i n g time may be sacrificed so tha t more frequent sampling may be accomplished. Long term monitoring will require less frequent
sampling in favor of longer recording times.
3
Page 4
Temperature/Humidity/Dew Point Sensor
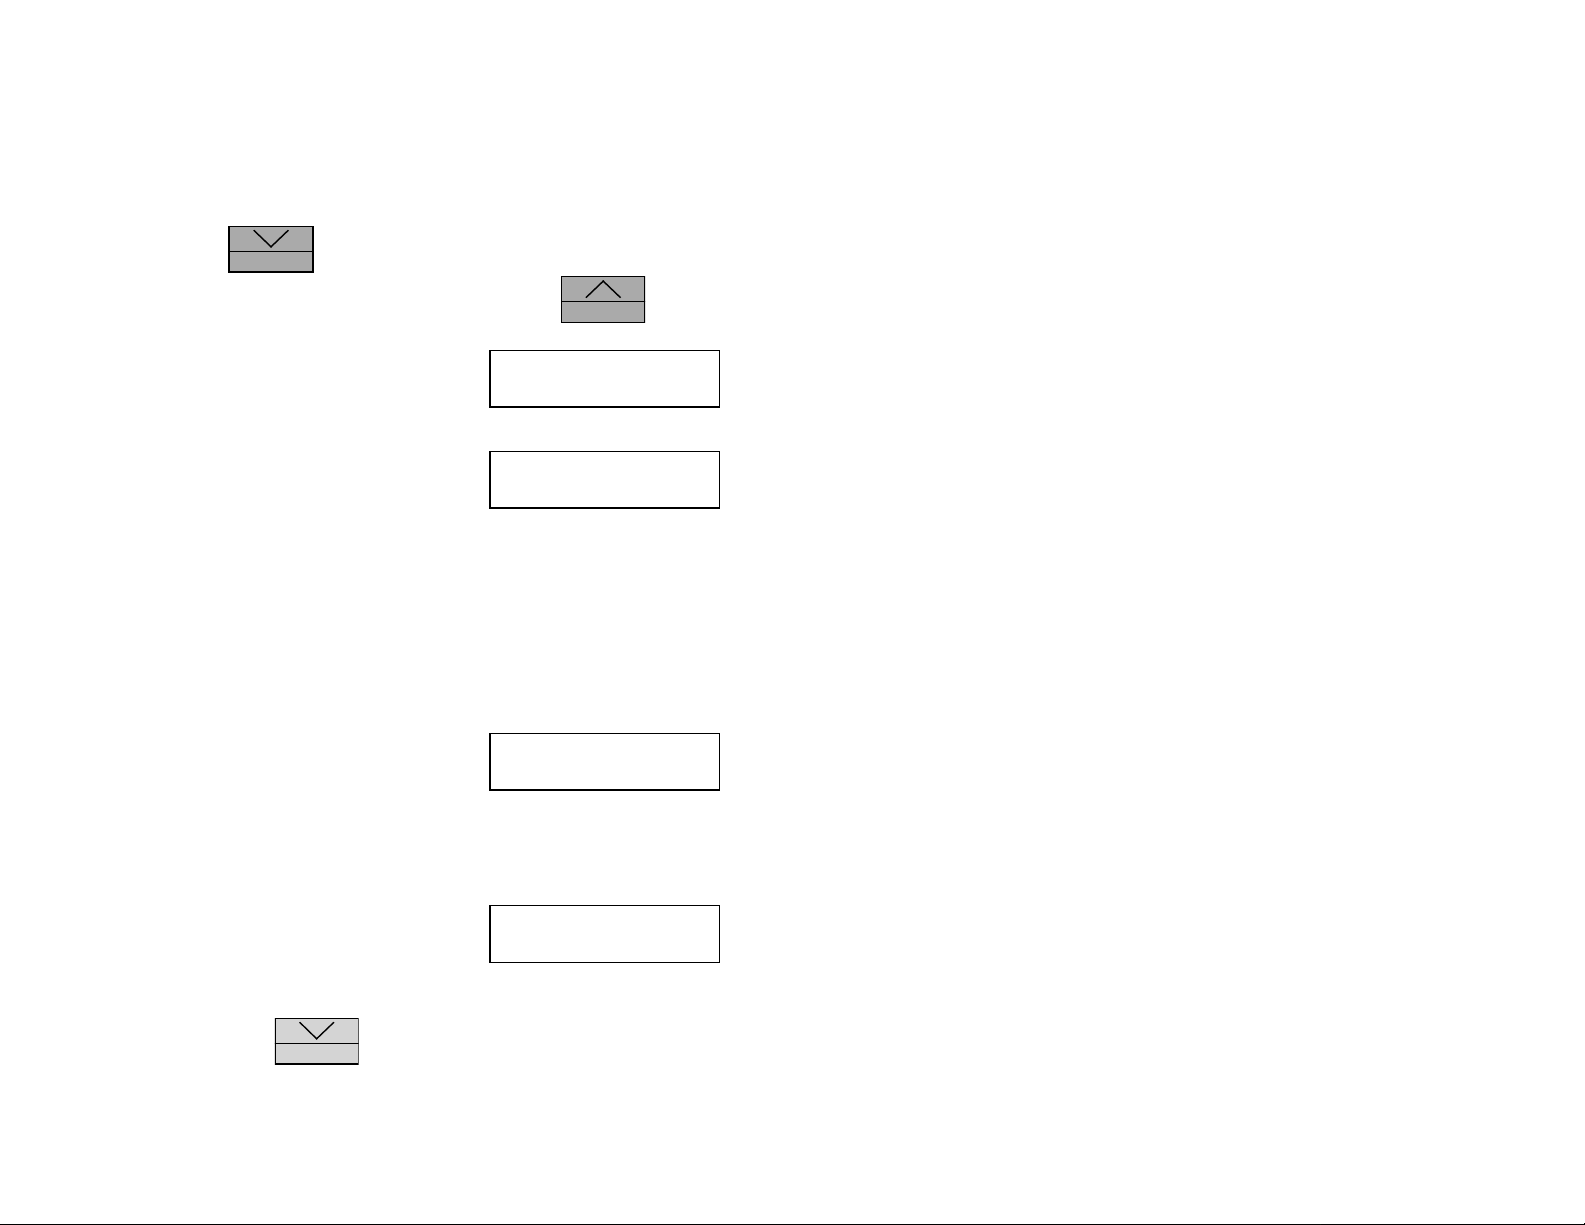
The next step is to select how the Service Logger will record the information
from the OM-60-MOD-TH sensor. There are 3 possible ways to record information.
Press and hold the
RECORD
button until the record display appears. The four
recording modes can be scrolled and changed by using the
1. Record information to memory only. This
option stores information into the Service
RECORD ON, REAL
TIME PRINT OFF
Logger’s memory. No printer or computer
connection is required for this function.
2. Record information to a printer. This
option does not store information into mem-
RECORD OFF, REAL
TIME PRINT ON
ory, but does print each sample as it is
recorded to a printer. This is referred to as
REAL TIME PRINTING. A printer must be
connected for this function! If no printer is
connected, or if the printer is off-line, or if the
printer is out of paper an error message will
be displayed to alert the user to a problem.
Switching to this option will terminate record-
ing if the Service Logger was set to record
previously.
3. Record information to memory and to a
printer. This is a combination of options 1
RECORD ON, REAL
TIME PRINT ON
and 2. Information is stored in memory and
at the same time each sample is recorded to
a printer. As in option 2., a printer must be
connected and functioning or an error mess age will be displayed.
STATU S
button:
4. If a recording is in progress, this option will
terminate all recording functions. This
option may also be used if the user decides
to cancel a recording session and return to
the operating mode. In order to terminate a
recording, press the
RECORD
button again
at this time.
4
RECORD OFF, REAL
TIME PRINT OFF
Page 5
Temperature/Humidity/Dew Point Sensor
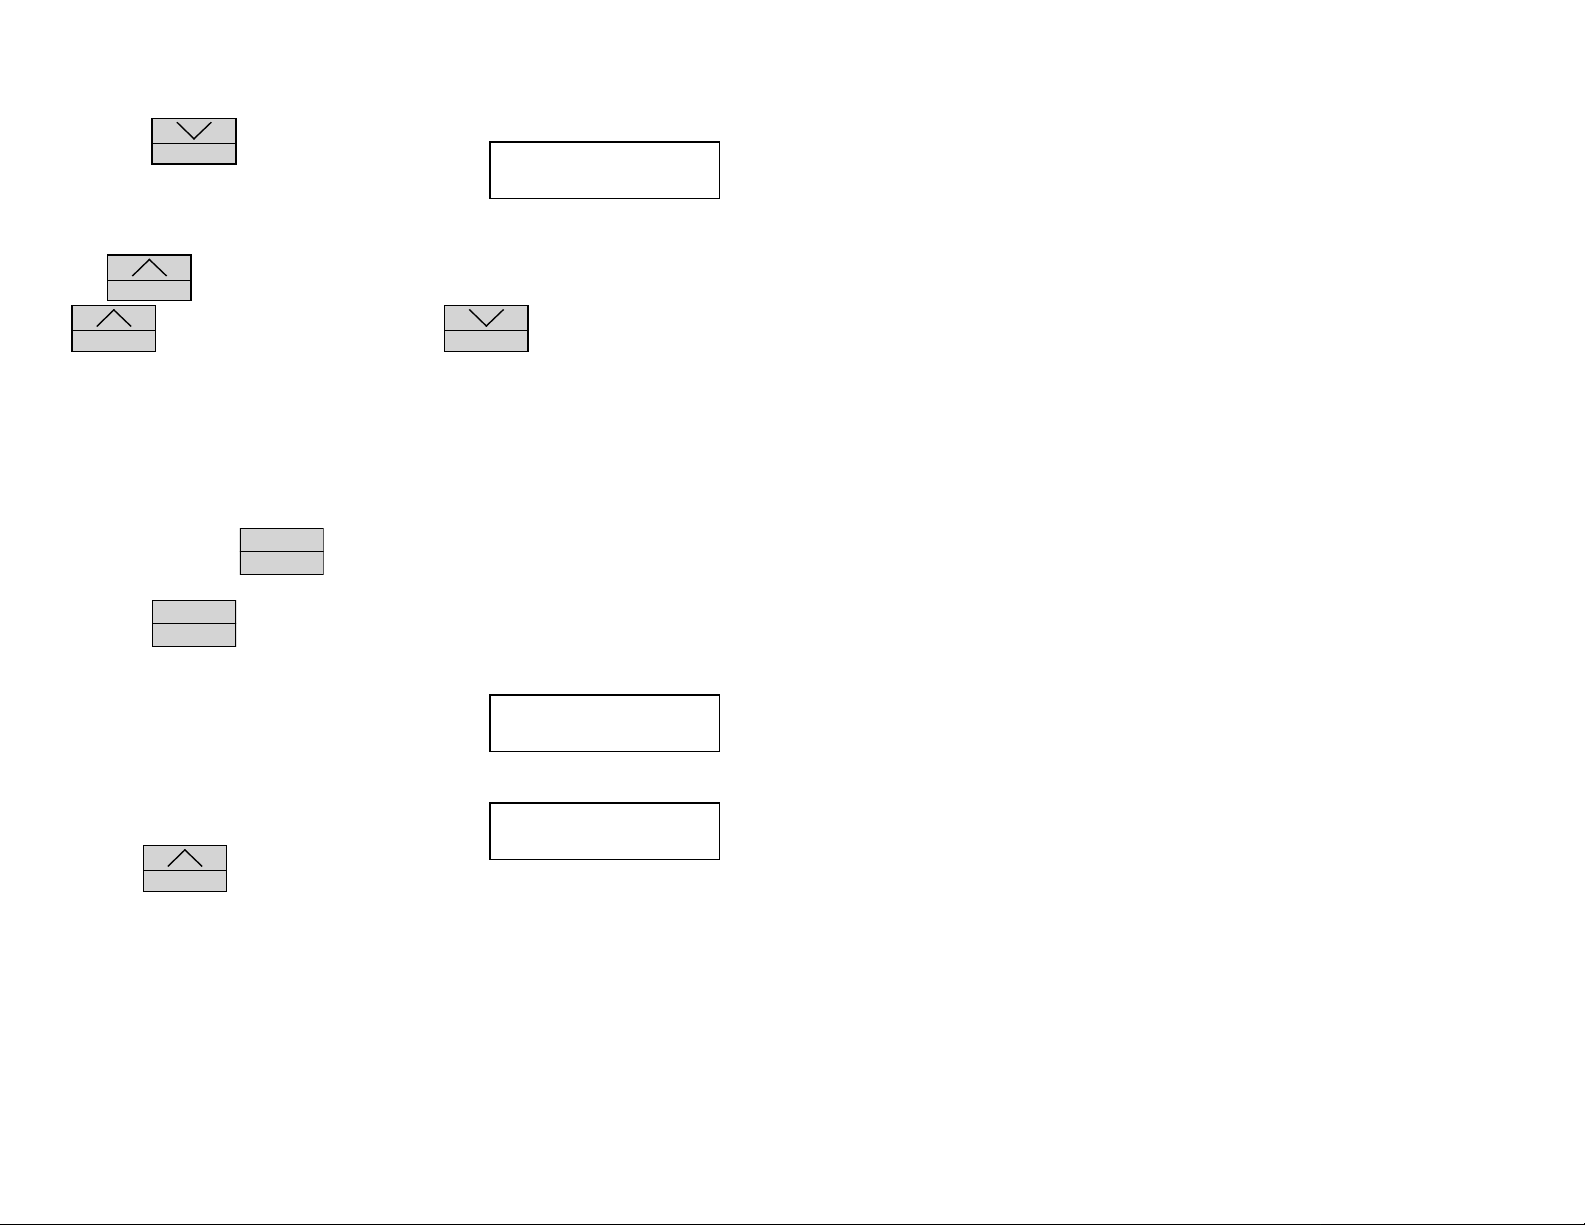
Press the
RECORD
button after selecting the
recording mode. This will display the starting
DAY HOUR MIN
FRI 15 16
time of the recording. The display will show the
starting time of the last recording and allow the user to enter a new starting
time.
STATUS
The
button will advance the item that is flashing. Press and hold the
STATUS
button to scroll this item. Press the
RECORD
button to change to
the next item which will then start to flash. This will set the starting time of the
recording which will appear on the display or printout after a recording has
been
made. Note that the previous starting time is always displayed when a new recording is started.
When the Service Logger is in the recording mode, it will prevent the user from
changing the settings. The user will only be allowed to check the recording rate
MENU
when they press the
MENU
Press the
ENTER
ENTER
button.
button to return to the operating mo d e an d b egi n th e re-
cording.
If option 1 or 3 is selected, an "R" will be dis-
played in the upper right hand corner of the
TEMP RH DEW R
76°F 41% 50°F
display. An "R" indicates that a recording is in
progress.
While you are recording it is possible to check
how much memory has been used. Press and
hold the
STATUS
button until the display
WED:14:22:20
78% MEM. LEFT
shows the starting time of the recordi n g an d the
percent of available remaining memory. As the recording continues this number
will decrease. The Service Logger will continue to record until the recording is
terminated manually or when all of the available memory has been used. When
0% Memory Left is displayed, this will indicate that almost all of the available
memory has been used and the Service Logger will shortly terminate the recording automatically.
Sample of a typical printout at the beginning of recording:
The time is specified using the format D(ays):H(ours):M(inutes):S(econds) in the
24 hour system. This convention is used in the printout and the display.
5
Page 6

Temperature/Humidity/Dew Point Sensor
Service Logger
Temp (F) Humi (%) Dew (F) Time (D:H:M:S)
75 40 49 WED:14:03:00
75 40 49 WED:14:03:05
75 40 49 WED 14:03:10
75 40 49 WED:14:03:15
PRINTING RECORDED DATA
After a recording has been made the user will probably want some way to view
and analyze the recorded information. This is most easily accomplished by
printing out the data samples. The printed data can be analyzed or stored fo r
future reference. Several print options are available.
Filtering Printed Recordings
If the user were to print out a recording which used all of the memory capacity
of the Service Logger, this woul d b e a very lo n g reco rd o f 4000 d a ta sa mp les.
To print this out line by line on a standard computer printer would use over 60
sheets of paper! Obviously this would be a cumbersome and time consuming
process. The Service Logger allows the user to print out information based on a
change in temperature or a change in relative humidity. Note that only ONE
CHANNEL of data can be filtered. In most cases the information required from
the record is only when the temperature or relative humidity changes. If the
temperature or relative humidity remains constant, it is not necessary to print
line after line of the same information.
The Service Logger allows the user to select from 1° to 10° of temperature
change or 1 to 10% of relative humidity change to print out. What this means is
that data samples that are less than the selected temperature or relative h u mid ity change are ignored during the printing process and only when the temperature or relative humidity has changed by the selected amount is a sample
printed out. That temperature or relative humidity becomes the new value to
compare to and the temperature or relative humidity will have to change again
by the selected amount before another sample is printed.
One important point to remember is that even if a data sample is not printed,
the Service Logger still has to recall it from memory and compare it to the filter
selection. Therefore, a printout may take up to 10 minutes for a scan of all 4000
data samples. This may sound complicated, but is easy to understand by using
an example recording.
Example:
A recording has been made of an office over a 30 hour period to monitor air
quality. This means that a data sample is recorded every 30 seconds. For the
printout, the user has selected a change of 2° of temperature. Shown below
6
Page 7

Temperature/Humidity/Dew Point Sensor
would be a typical printout of the data using the above selections. (In a real
printout there will be no spaces between the lines of printing, but in our example
these were added to allow room for comments to be inserted.)
Service Logger
Temp(F) Humi(%) Dew(F) Time(D:H:M:S)
------------------------------------------------------------------- 74 40 49 MON:08:25:00 This is the first data record
and starting time of the re
cording on Monday
at 8:25 a.m.
76 38 48 MON:10:25:00 The room has warmed up
by 2° at 10:25 a.m. on the
same day.
78 42 53 MON:13:42:30 The room has continued
to warm by 2° at 13:42
(1:42 p.m.) on the same
Monday.
76 42 51 MON:18:58:30 The room has cooled by
2° at 18:58 (6:58 p.m.) on
the same Monday.
74 38 47 TUE:06:03:00 The room has continued
to cool by another 2° at
6:03 a.m. on the Tuesday
of the same week.
72 36 43 TUE:09:14:30 The room has cooled by
2° at 9:14 a.m. on the
Tuesday of the same
week.
End of Data This indicates the end of
the recording and shows
that the temperature remained within 2° of 72°F
for the remainder of the
recording period.
7
Page 8
Temperature/Humidity/Dew Point Sensor
The above example shows that by using the filtering function the user can take
a printout that would consume over 60 pages of paper and condense it into a
single page.
How to Send Recorded Data to a Printer
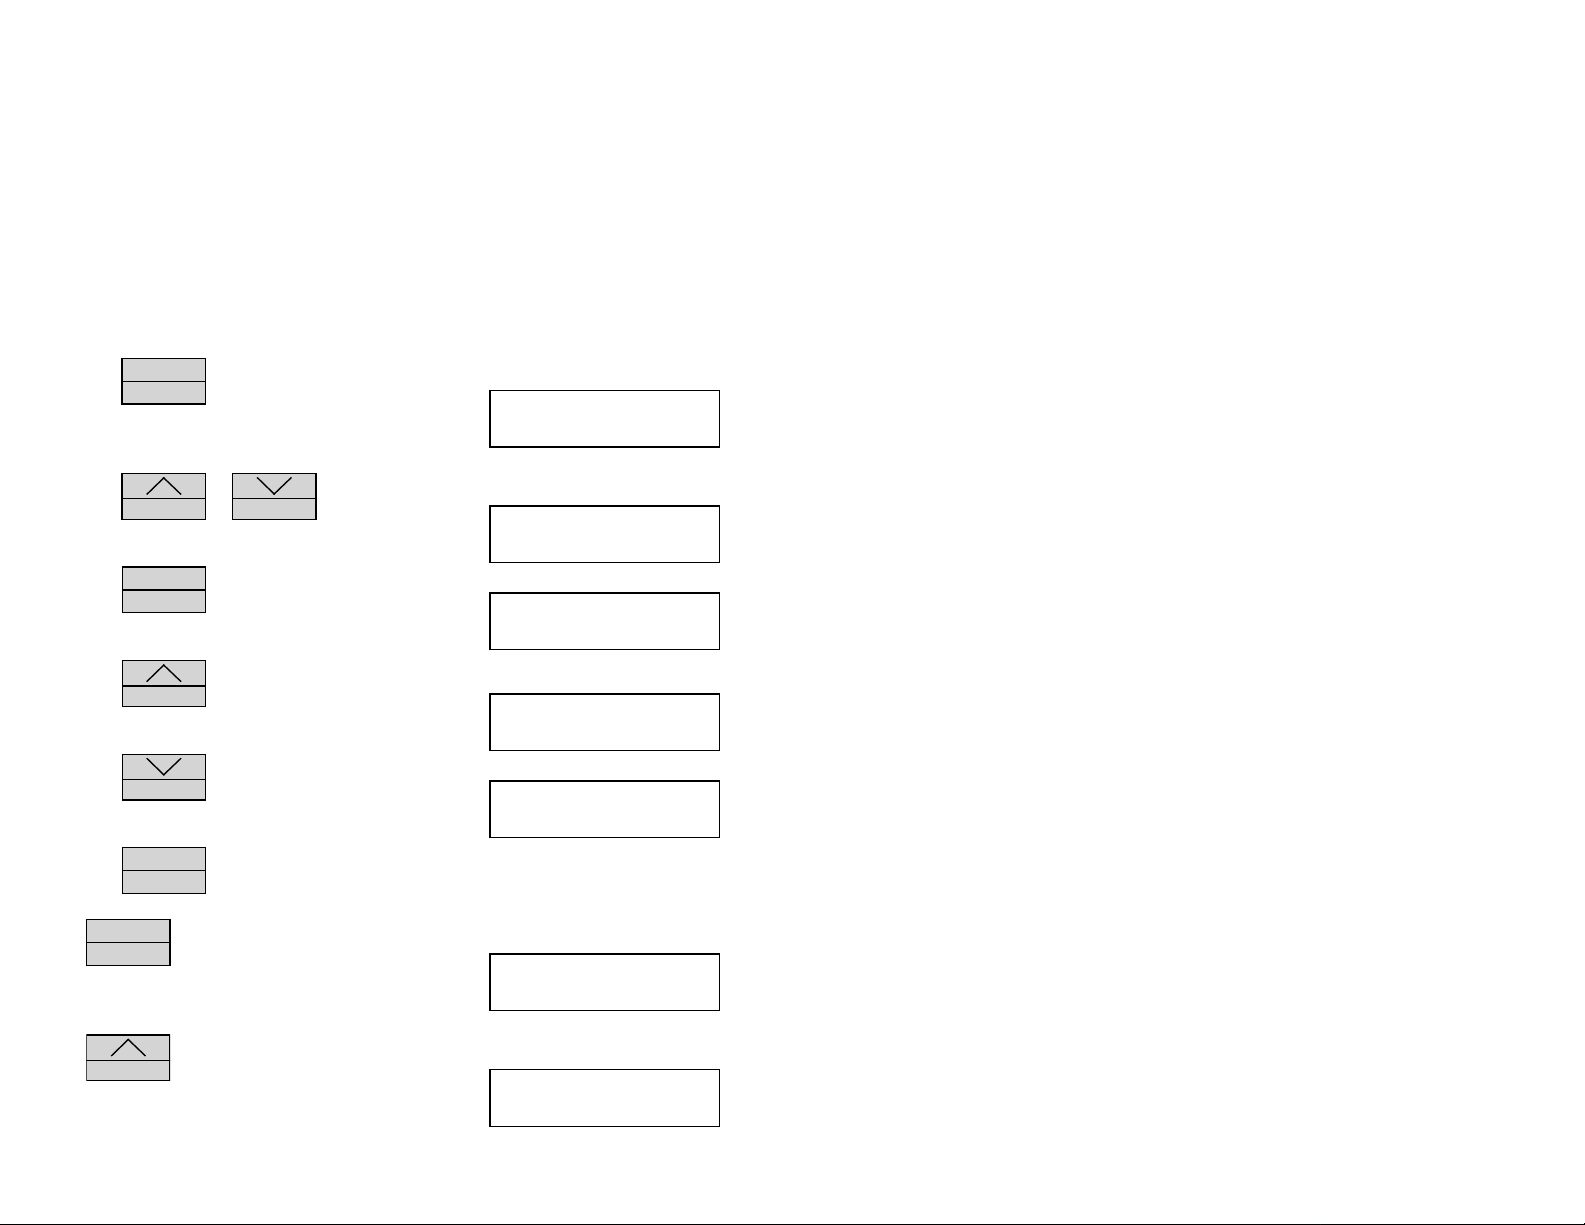
MENU
Press
appears. This is where the print function is
accessed.
ENTER
several times until this display
PUSH MENU TO RUN
OTHERS TO PRINT
Press
STATUS
or
RECORD
to scroll through
the print options until this display appears.
MENU
Press
ENTER
to advance to the next print
selection.
Press
STATUS
to select a temperature filter
function,
or
Press
RECORD
to select a relative humidity
filtering function.
MENU
ENTER
MENU
ENTER
to continue.
is pushed, the Service logger will
Press
If
return to the operating mode.
STATUS
If
is pushed, the printing will begin
and the flashing dots indicate printing functions.
When the Service Logger is finished printing, it
will return to the Operating Mode.
8
SEND RECORDED
DATA TO PRINTER
SEND OUT ALL OF
THE TEMP DATA
SEND TEMP ON
X DEGREE CHANGE
SEND HUMIDITY
ON X % CHANGE
PUSH ^ START PRT
PUSH MENU TO QUIT
PRINTING
PLEASE WAIT…
Page 9
Temperature/Humidity/Dew Point Sensor
Printer Error Messages
If a printer is not connected and set to operate, an error messa ge will be
displayed to alert the user to a printer problem.
There are several possible problems that may occur if the printer is not ready.
The Service Logger will alert the user to a problem with the printer. As each
printer has its own set of controls and settings, the user is recommend to consult the owners manual supplied with the printer.
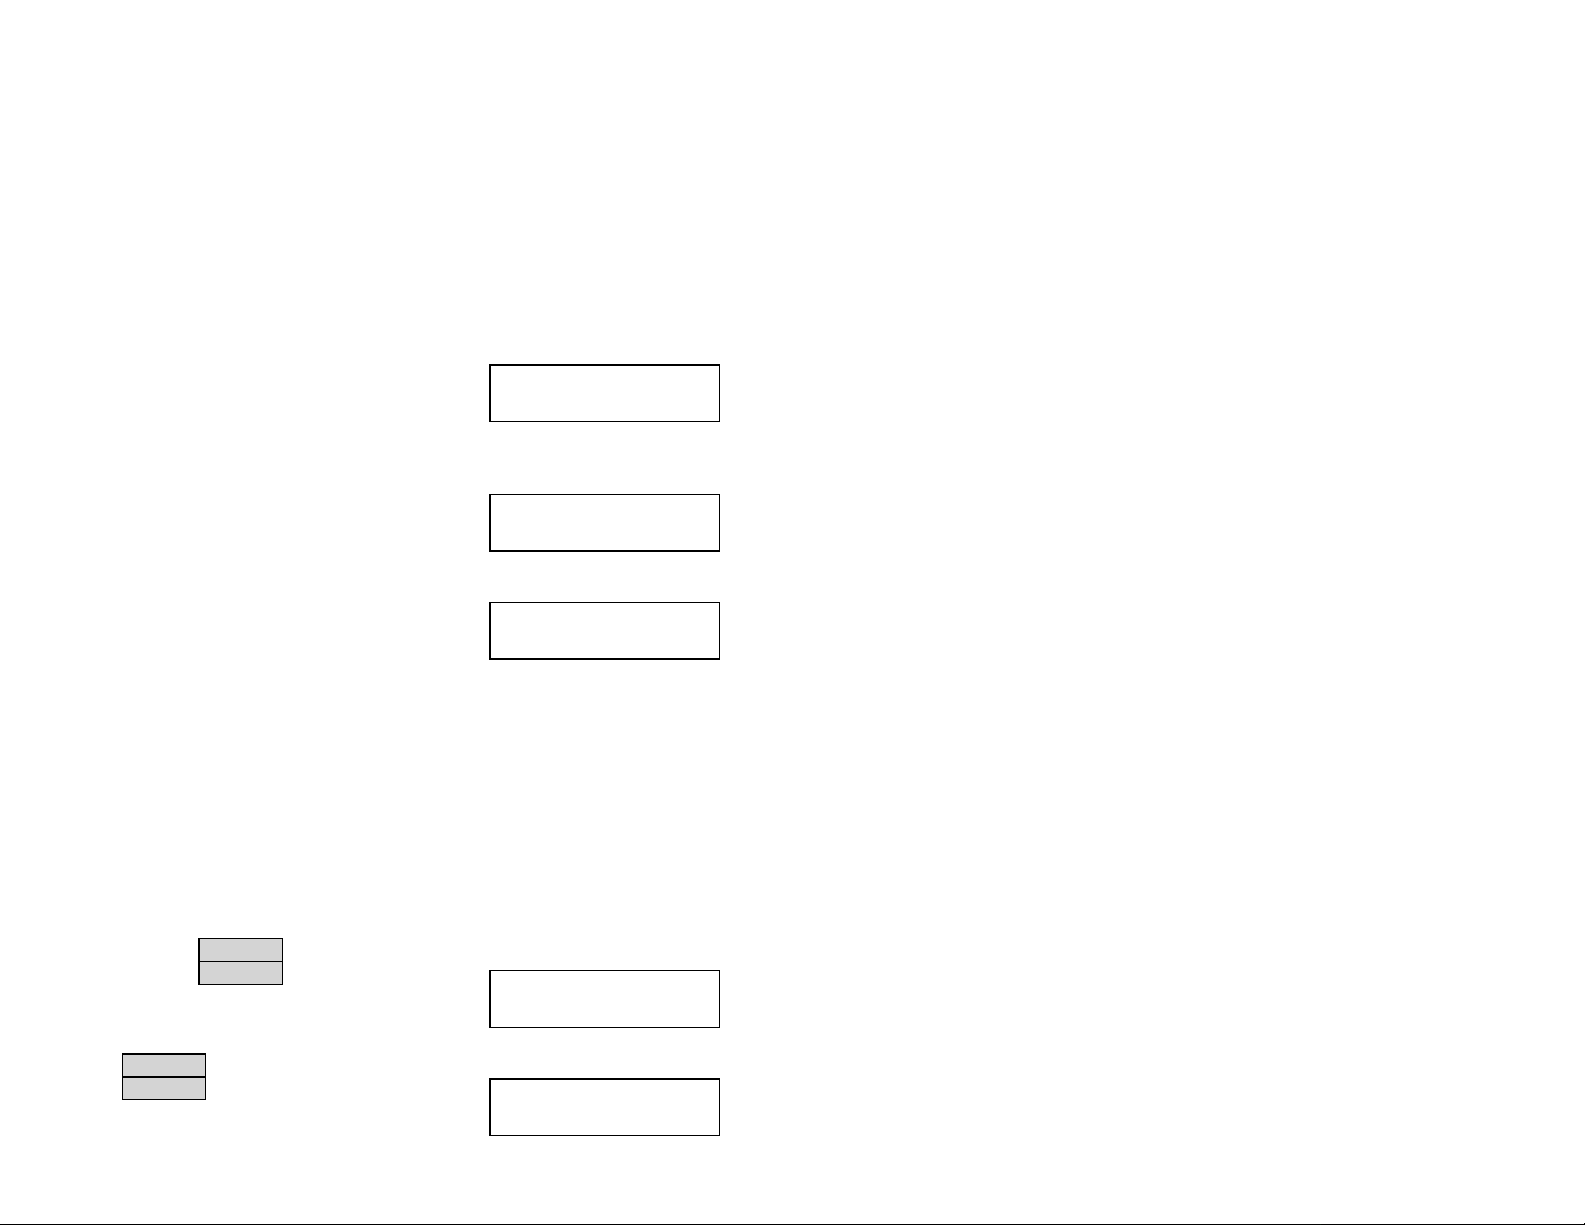
This is an error message that appears when the
printer is not connected or turned off. Make
PLEASE CONNECT
THE PRINTER
sure the printer cable is attached to both the
printer and the Service Logger and that power
is supplied to the printer.
This is an error message to alert the user that
the printer has run out of paper. Refer to the
PRINTER IS OUT
OF PAPER
owners manual of the printer for instructions on
paper replacement.
This is an error message to indicate that the
printer has not been set to ON LINE. Refer to the
PRINTER IS NOT
ON LINE
owners manual for specific instructions on
setting the printer controls.
VIEWING RECORDED DATA
One of the features of the Service Logger is that recorded information may be
read directly on the display. The same filter functions that are available for
printing data are also available for reading data on the display. This allows the
user to let the Service Logger scan the recorded data and display only the information that is of interest to the user. Without this function the user would
have to manually scan a poten ti a l 4000 d a ta sa mp les to fi n d th e i n f o r mati on of
interest.
MENU
Press and hold
appears. The actual recording rate is
unimportant.
ENTER
until this display
RECORDING RATE
XXHR EVERY XXSEC
MENU
Press
ENTER
again to cycle to the next
screen. As before, the scale does not pertain
to the viewing function.
9
TEMPERATURE SET
TO FAHRENHEIT
Page 10
Temperature/Humidity/Dew Point Sensor
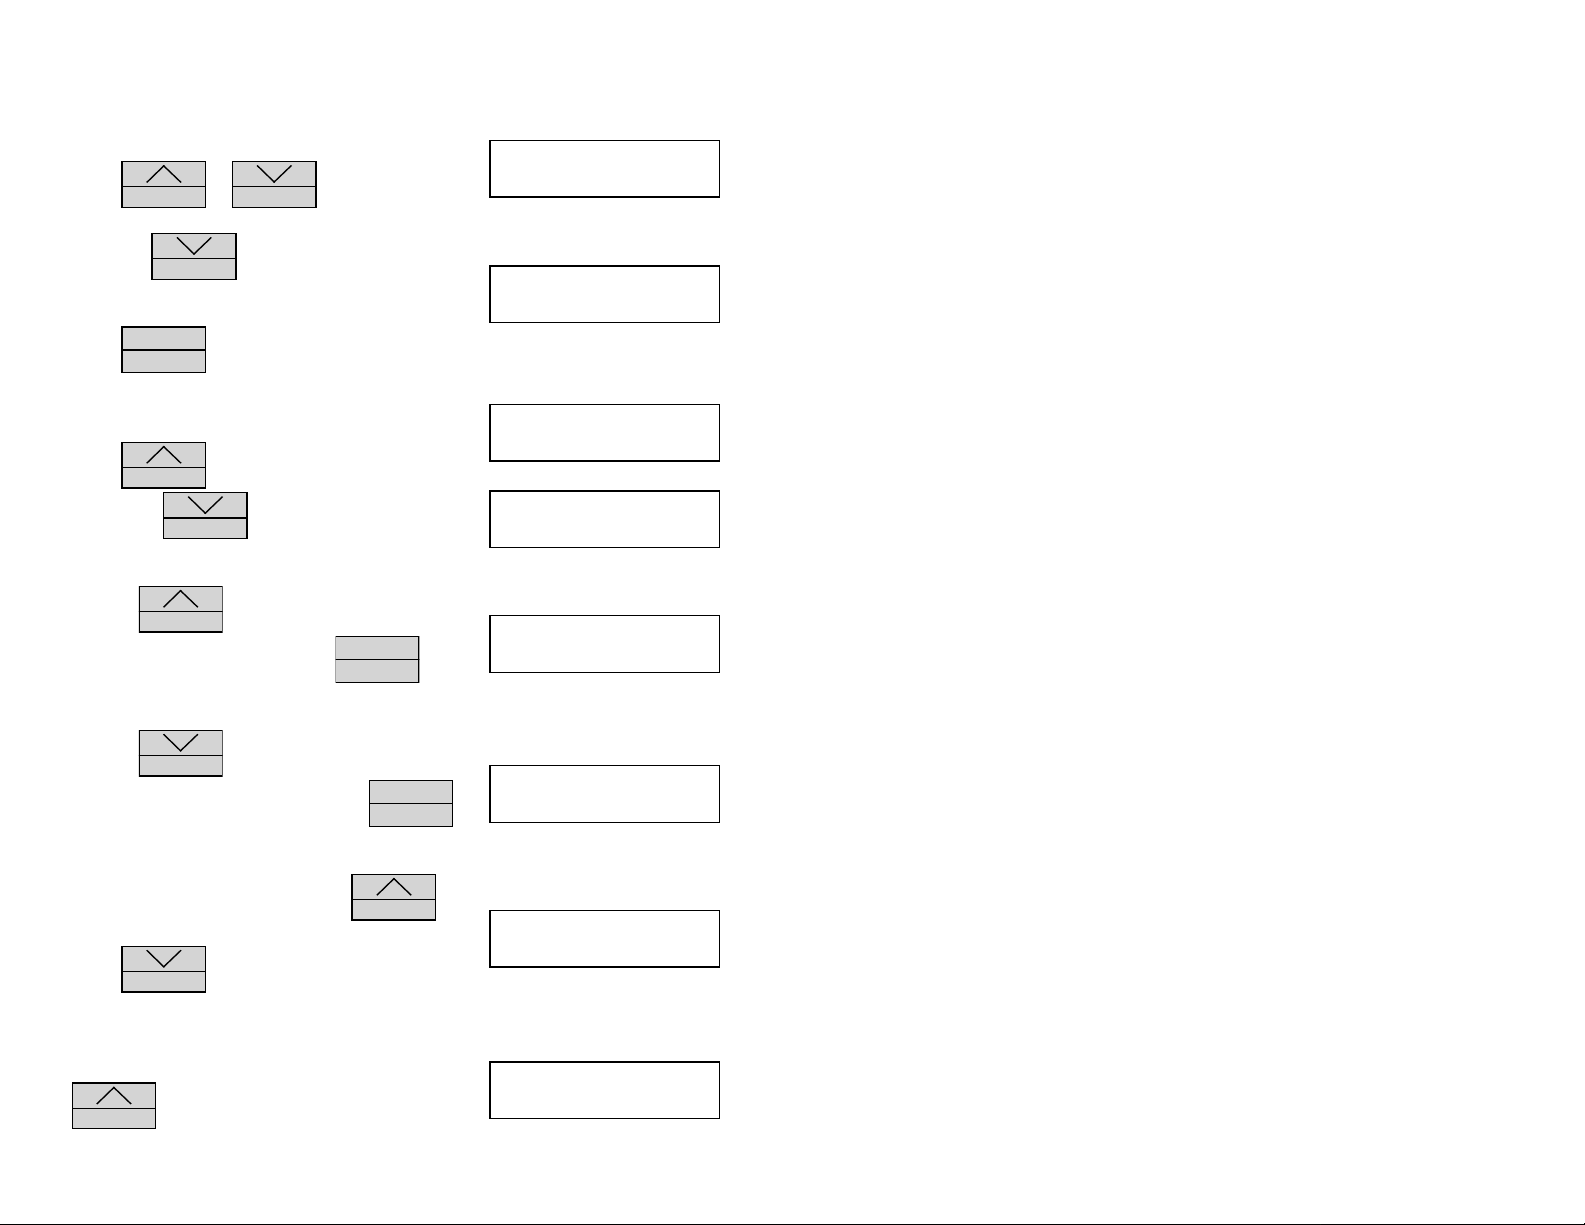
This is where the viewing function is accessed.
Press
STATUS
or
RECORD
to access this
menu.
Press the
RECORD
button once to scroll to this
function.
MENU
Press
ENTER
to advance to the next display selection.
This is the first filter option. Selecting this will
print every data sample that has been recorded.
Press
function or
STATUS
to select a temperature filtering
RECORD
to select a relative
humidity filtering function.
Use the
temperature change, then press
STATUS
button to select 1° to 10° of
MENU
ENTER
to
continue.
PUSH MENU TO RUN
OTHERS TO PRINT
READ RECORDED
DATA FROM SCREEN
SEND OUT ALL OF
TEMP DATA
SEND OUT ALL OF
HUMIDITY DATA
SEND TEMP ON
X DEGREE CHANGE
Use the
relative humidity change, then press
RECORD
button to select 1 to 10%
MENU
ENTER
to continue.
This is the first data sample. Press
STATUS
to
advance forward through the data samples.
Press
RECORD
to go backwards through th e
data samples. Note that the top line of th e d i sp lay
will show the time the sample was record ed .
This indicates the end of a data recording. Press
STATUS
10
to return to the beginning of the data
SEND HUMIDITY
ON X % CHANGE
WED:14:22:15
73°F 42% 48°F
REACHED THE END
OF RECORDED DATA
Page 11

Temperature/Humidity/Dew Point Sensor
recording or
RECORD
to go to the last previous
data sample.
MENU
Press
ENTER
at any time to return to the Operating Mode.
TRANSFERRING DATA TO A COMPUTER
After a recording has been made, the user may download the data to any PC
compatible computer. The advantage of doing this is that it allows the use of
more sophisticated analysis tools as well as long term storage. Unlike the Print
and View functions no filtering options are available in this mode. The entire recording is sent to the computer. The supplied software will convert the data recording to an ASCII file which can then be imported into a variety of data analysis software, word pro cessin g , a n d d a ta b a se p r o g ra ms. It i s su g g ested th a t i f
the user plans to download recorded da ta o n a reg ular b a si s to co p y the tran sfer program to the users hard disk.
To start the transfer program, insert the supplied d i skette i n dr ive A. Typ e
“A:SUPCO” and follow the instructions on the computer screen. A README file
is also included on the floppy diskette which has detailed instructions on the
use of the transfer program and reflects the latest informatio n th at i s no t i ncluded in this manual.
IMPORTANT!
To use this function the 25 pin cable (DB25 Male-M ale) must be c onnected
to the Service Logger and the PC compatible computer printer port. If you
are unsure of which connector is the printer port consult the owners manual which was supplied with the computer.
The computer transfer cable can be purchased from OMEGA or authorized
dealer as part # OM-CC6.
The printer cable can be purchased from OMEGA or authorized dealer as part
# OM-PC6.
11
 Loading...