

Page 1
User’s Guide
1
Shop online at
omega.com
e-mail: [email protected]
®
For latest product manuals:
omegamanual.info
MADE IN CHINA
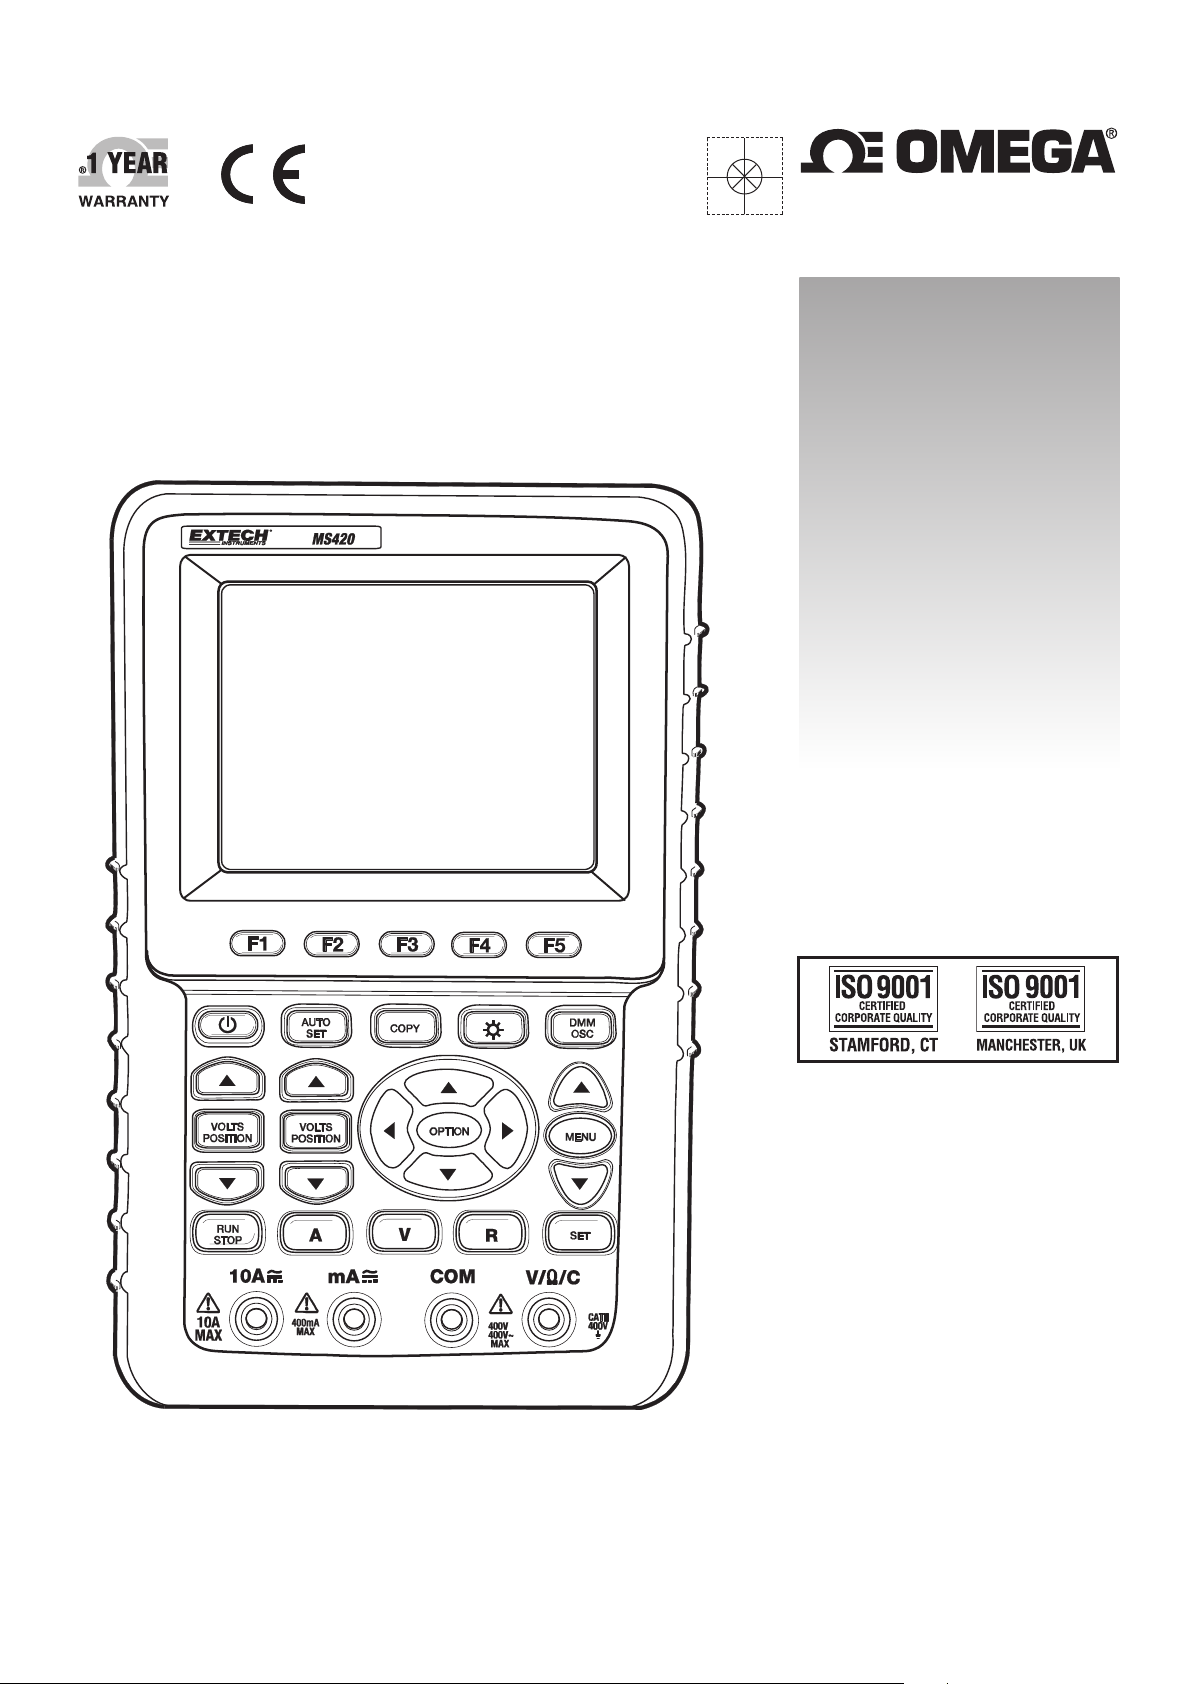
HOS-MS420
20mhz Oscilloscope
Page 2

OMEGAnet®Online Service Internet e-mail
omega.com [email protected]
Servicing North America:
U.S.A.: Omega Engineering, Inc., One Omega Drive, P.O. Box 4047
ISO 9001 Certified Stamford, CT 06907-0047 USA
Canada: 976 Bergar
Laval (Quebec), H7L 5A1 Canada
Toll-Free: 1-800-826-6342 TEL: (514) 856-6928
FAX: (514) 856-6886 e-mail: [email protected]
For immediate technical or application assistance:
U.S.A. and Canada: Sales Service: 1-800-826-6342/1-800-TC-OMEGA
Customer Service: 1-800-622-2378/1-800-622-BEST
Engineering Service: 1-800-872-9436/1-800-USA-WHEN
Mexico/ En Español: 001 (203) 359-7803 FAX: 001 (203) 359-7807
Latin America [email protected] e-mail: [email protected]
®
®
®
Servicing Europe:
Benelux: Managed by the United Kingdom Office
Czech Republic: Frystatska 184
733 01 Karviná, Czech Republic
Toll-Free: 0800-1-66342 TEL: +420-59-6311899
FAX: +420-59-6311114 e-mail: [email protected]
France: Managed by the United Kingdom Office
Toll-Free: 0800 466 342 TEL: +33 (0) 161 37 29 00
FAX: +33 (0) 130 57 54 27 e-mail: [email protected]
Germany/ Austria: Daimlerstrasse 26
D-75392 Deckenpfronn, Germany
Toll-Free: 0800 6397678 TEL: +49 (0) 7056 9398-0
FAX: +49 (0) 7056 9398-29 e-mail: [email protected]
United Kingdom: OMEGA Engineering Ltd.
ISO 9001 Certified One Omega Drive, River Bend Technology Centre, Northbank
Irlam, Manchester M44 5BD United Kingdom
Toll-Free: 0800-488-488 TEL: +44 (0) 161 777-6611
FAX: +44 (0) 161 777-6622 e-mail: [email protected]
It is the policy of OMEGA Engineering, Inc. to comply with all worldwide safety and EMC/EMI
regulations that apply. OMEGA is constantly pursuing certification of its products to the European New
Approach Directives. OMEGA will add the CE mark to every appropriate device upon certification.
The information contained in this document is believed to be correct, but OMEGA accepts no liability for any
errors it contains, and reserves the right to alter specifications without notice.
WARNING: These products are not designed for use in, and should not be used for, human applications.
Page 3

INTRODUCTION
Congratulations on your purchase of the Extech Digital Oscilloscope. This
manual is divided into two sections: Section One for the Oscilloscope
functions and Section Two for the MultiMeter functions. This meter is shipped
fully tested and calibrated and, with proper use, will provide years of reliable
service.
2
V5.1‐March2010
Page 4

TABLE OF CONTENTS
GENERAL INFORMATION
WARRANTY 5
RODUCT CONTENTS 6
P
AFETY INFORMATION 7
S
NPUT CONNECTIONS 10
I
RONT PANEL AND CONTROL KEYS OVERVIEW 11
F
ECALL FACTORY DEFAULT SETTINGS 19
R
DATA TRANSMISSION 63
PC
FAQ. 76
PPENDIX A: SPECIFICATIONS 77
A
PPENDIX B: MAINTENANCE AND CLEANING 82
A
PPENDIX C: BATTERY CHARGING AND REPLACEMENT 83
A
PPENDIX D: SETTING THE REAL TIME CLOCK 84
A
SECTION ONE - OSCILLOSCOPE
BASIC INSTRUCTIONS ON USING THE OSCILLOSCOPE 13
OWERING THE OSCILLOSCOPE. 13
P
AIN OSCILLOSCOPE DISPLAY SCREEN 13
M
ENU DESCRIPTION 15
M
ETTING THE TRIGGER POSITION AND TIME BASE 15
S
SCILLOSCOPE INPUT CONNECTIONS 19
O
EASURE UNKNOWN SIGNALS / AUTO SET FEATURE 20
M
UTO ZERO THE HORIZONTAL TRIGGER. 20
A
UTOMATIC RANGING MEASUREMENTS 20
A
ATA HOLD 21
D
VERAGE MODE TO SMOOTH WAVEFORMS 22
A
ERSISTENCE MODE (SUPERIMPOSE WAVEFORMS) 22
P
EAK DETECT (GLITCH CAPTURE) 23
P
COUPLING MODE 24
AC
EVERSE WAVEFORM POLARITY 25
R
ATHEMATICAL FUNCTIONS 26
M
MASS STORAGE . 27
USB
DVANCED OSCILLOSCOPE FUNCTIONS 28
A
ERTICAL SETTINGS FOR CH1 AND CH2 28
V
HANNEL COUPLING 29
C
PEN AND CLOSE MEASUREMENT CHANNELS 30
O
ETTING THE PROBE ATTENUATION 30
S
NVERT A WAVEFORM DISPLAY. 30
I
ATHEMATICAL FUNCTION MENU SETTINGS 31
M
ETTING UP THE TRIGGER SYSTEM 32
S
RIGGER CONTROL 33
T
CQUISITION MODE 40
A
3
V5.1‐March2010
Page 5

D
ISPLAY SETTINGS 40
TORING WAVEFORMS IN THE METER 42
S
UNCTION SETTINGS MENU 43
F
UTO CALIBRATION. 44
A
UTO RANGE MEASUREMENTS 44
A
UTOSCALE MODE . 45
A
URSOR MEASUREMENTS 49
C
REQUENCY COUNTER (MS460) 52
F
QUARE WAVE OUTPUT. 53
S
MODE.(MS420) 54
FFT
YSTEM STATUS MENU. 61
S
IME BASE MODE . 62
T
SECTION TWO – MULTIMETER FUNCTIONS 64
CONNECTING THE METER. 65
D
ISPLAY WINDOW. 65
ESISTANCE MEASUREMENTS 67
R
EASURING DIODE VOLTAGE 67
M
ONTINUITY TEST. 68
C
EASURING CAPACITANCE 69
M
EASURING DC VOLTAGE 69
M
EASURING AC VOLTAGE 70
M
EASURING DC CURRENT 71
M
EASURING AC CURRENT 72
M
ATA HOLD (FREEZE READINGS) 73
D
ELATIVE MEASUREMENTS 74
R
UTOMATIC / MANUAL RANGE 75
A
Copyright © 2010 Extech Instruments Corporation (a FLIR company)
All rights reserved including the right of reproduction in whole or in part in any form.
4
V5.1‐March2010
Page 6

PRODUCT CONTENTS (REFER TO THE FIG. 1 BELOW)
1. MS420 / MS460 Instrument
2. AC Adaptor
3. Oscilloscope Probes (2); Grey in color
4. Multimeter test leads (2); One black, one red
5. USB mass storage connection cable
6. Extension module for low capacitance measurements
7. Probe adjustment tools
8. USB or Serial PC Communication cable
9. User manual
10. CD-ROM Software Program
11. Carrying Case
Figure 1: Supplied Equipment
5
V5.1‐March2010
Page 7
SAFETY INFORMATION
Please read the user manual before use to ensure safety and precision
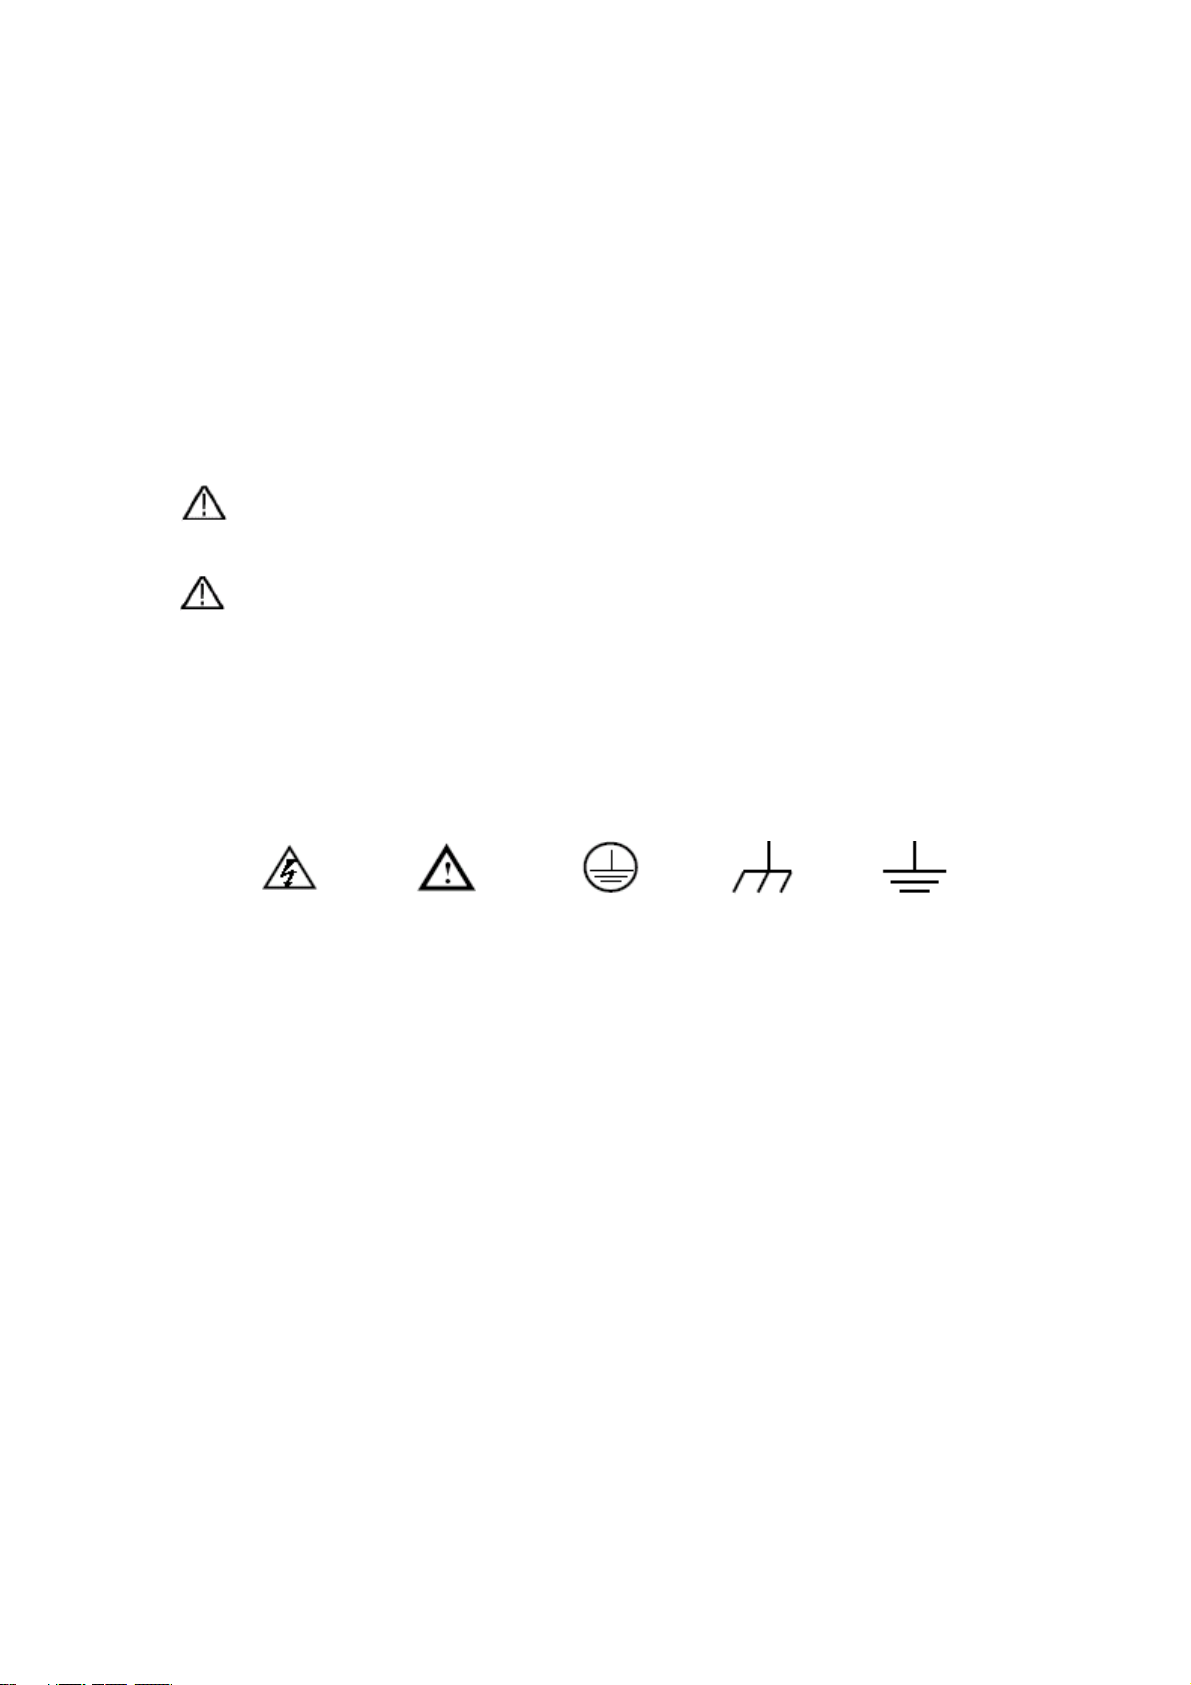
SAFETYSYMBOLSANDTERMS
SAFETY SYMBOLS
THESE SYMBOLS MAY APPEAR IN THIS MANUAL OR ON THE INSTRUMENT:
WARNING: “WARNING” IDENTIFIES CONDITIONS & ACTIONS THAT POSE A HAZARD
TO THE USER
Caution: “Caution” identifies conditions and actions that may damage the
DANGER:
High
product or external equipment
Refer to the
Manual
Protective
Conductor
Terminal
Chassis
Ground
(ground)
Terminal
SAFETY TERMS
The following terms may appear on the instrument:
Danger: The term “Danger” is used in this manual to indicate that
immediate personal injury can result
Earth
Warning: The term “Warning” is used in this manual to indicate that,
although immediate personal injury is not likely, caution should be
taken
Notice: The term “Notice” is used in this manual to indicate that damage to
the meter or to other equipment can occur
6
V5.1‐March2010
Page 8

GENERALSAFETYINFORMATION
Carefully read the following safety information in order to avoid personal injury and
damage to this product or to products connected to it. This product must only be
used in the specified manner to prevent danger and hazard to products and persons.
Warning:
To avoid fire or electrical shock please use the proper power adapter. Use only
the power adapter recommended by the manufacturer.
Warning:
To avoid fire or electrical shock do not connect meter to more than 42V peak
(30Vrms) or on circuits of more than 4800VA:
● Use only the insulated voltage probes, test leads and adapter supplied with
the test tool, or as indicated by Extech as suitable for the Oscilloscope &
Multimeter.
● Before use, inspect voltage probes, test leads and accessories for
mechanical damage. Replace the equipment when it appears damaged.
● Remove all probes, test leads and accessories when not in use.
● Always connect the power adapter first to the AC outlet before connecting
it to the Oscilloscope & Multimeter.
● Do not apply voltages that exceed 400 V from earth ground to any input
when measuring in a CAT II environment.
● Do not apply voltages that exceed 400 V to the isolated inputs when
measuring in a CAT II environment.
● Use caution when using 1:1 test leads since the probe tip voltage will be
directly transmitted to the Oscilloscope & Multimeter.
● Do not use exposed metal BNC or banana plug connectors.
● Do not insert metal objects into the connectors.
● Always use the Oscilloscope & Multimeter in the manner specified.
● Voltage ratings, mentioned in the warnings, are provided as “working
voltage” limits. They represent V ac rms (50-60Hz) for AC sine wave
7
V5.1‐March2010
Page 9

applications and as V dc for DC applications. Overvoltage Category II refers
to local level applicable for appliances and portable equipment.
Only qualified technical personnel should perform maintenance on these
devices.
Observe the nominal value limits for all terminals: To avoid fire or electric shock,
observe all nominal value limits, markings, and specifications for this product. Before
connecting to this product, carefully read the user’s manual.
Do no operate this instrument without the cover plate secured: If the cover plate
or panel has been removed, do not use this product.
Do not touch bare conductors
Do not use this meter in case of any undetermined failure: When in doubt
consult qualified repair personnel
Do not hinder the meter’s ventilation: Refer to the user manual for detailed
installation instructions and proper setup for adequate ventilation
Do not operate this meter in overly humid environments.
Do not operate this meter in potentially explosive environments.
Keep the meter’s surface clean and dry.
Use of this device in any manner inconsistent with the uses specified in this manual
can possibly compromise the safety protection provided by the meter.
8
V5.1‐March2010
Page 10

INPUT CONNECTIONS
INPUTCONNECTIONS
See Figure 2 below
6
Figure 2
Description
1. The power adapter is use to supply AC power and for battery recharging
2. Multimeter test leads
3. Multimeter input jacks (L to R: Current 2A-10A input, mA Current input, COM
ground input, Voltage/Resistance/Capacitance input)
4. Oscilloscope probes
5. Oscilloscope channel inputs
6. Square wave output jack
9
V5.1‐March2010
Page 11
FRONTPANELANDKEYPADOVERVIEW
Figure 3
10
V5.1‐March2010
Page 12

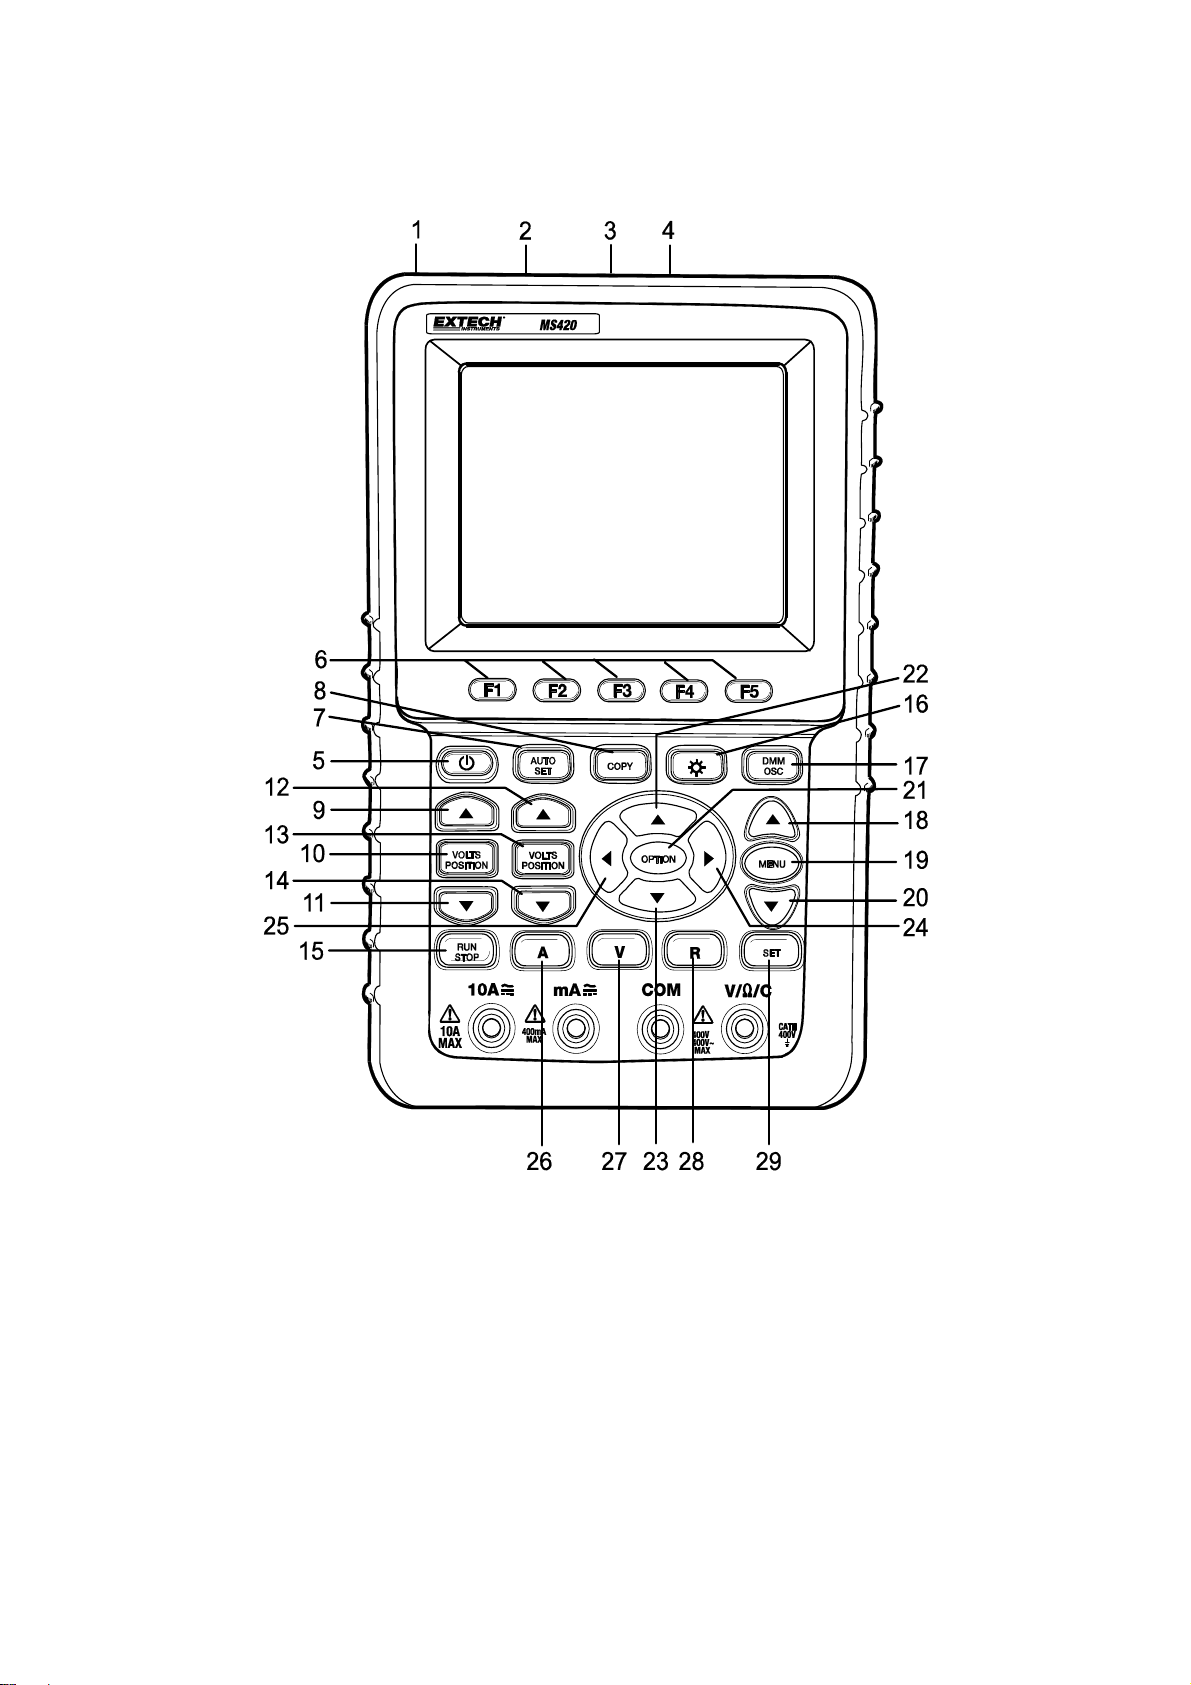
Description of Meter Front Panel and Keypad (Figure 3)
1. AC adapter Port
2. RS-232C Port
3. USB Port
4. USB Mass Storage Port
5. Power switch
6. F1 – F5 Soft-key options
7. AUTO SET: In the Scope mode, the meter automatically selects the
horizontal/vertical scale and trigger level
8. COPY: Press to store the waveform data into a USB storage device
9. ▲ (Red): Adjust the horizontal scale for Channel 1
10. VOLTS POSITION (Red): Switch between voltage and horizontal scales for
Channel 1
11. ▼ (Red): Adjust the horizontal scale for Channel 1
12. ▲ (Blue): Adjust the horizontal scale for Channel 2
13. VOLTS POSITION (Blue): Switch between the voltage and horizontal scales
for Channel 2
14. ▼ (Blue): Adjust the horizontal scale for Channel 2
15. RUN/STOP: Start/Stop the waveform capture process
16. BACKLIGHT: Turn the display backlight ON and OFF
17. DMM/OSC: Operation mode (switch between oscilloscope and multimeter)
18. MENU ▲: Choose a higher item on a menu list
19. MENU: Show / Hide menu
20. MENU ▼: Choose a lower item on a menu list
21. OPTION: Used in combination with the four (4) yellow arrow keys. This
button is used to set the main time base, trigger horizontal position and
trigger vertical position. Also used to adjust the display multiplier factors and
display vertical position during waveform calculation. Further, it is used to
adjust cursor 1 (V1 or T1) and cursor 2 (V2 or T2) position during cursor
measurements
22. ▲ (yellow): Oscilloscope UP arrow adjustment key
23. ▼ (yellow): Oscilloscope DOWN arrow adjustment key
24. ► (yellow): Oscilloscope FORWARD adjustment key
25. ◄ (yellow): Oscilloscope BACKWARD adjustment key
26. A: Selects DMM Current measurement mode
27. V: Selects DMM Voltage measurement mode
28. R: Selects DMM impedance, diode, continuity, capacitance measurement
mode
29. SET: Toggle AC/DC in the current or voltage multimeter measurement
modes; also switches between resistance, diode and capacitance modes
while in the resistance mode.
11
V5.1‐March2010
Page 13
BASIC OSCILLOSCOPE FUNCTIONS
ABOUTTHISCHAPTER
This chapter provides introductory Oscilloscope instructions. This introduction does
not cover all of the oscilloscope capabilities but provides basic examples of menu
navigation and operations. Detailed instructions are provided in the Advanced
Oscilloscope functions section.
POWERINGTHEOSCILLOSCOPE
Connect the oscilloscope to an AC power source using the supplied AC adaptor.
If the battery is charged, the oscilloscope may be powered by the supplied and
installed Li-ion battery. The meter will run for up to four (4) hours on a full charge.
Turn the oscilloscope on by pressing the power key.
Upon power up, the instrument performs a ‘self check’. The display will show the
“press any key to continue……” screen.
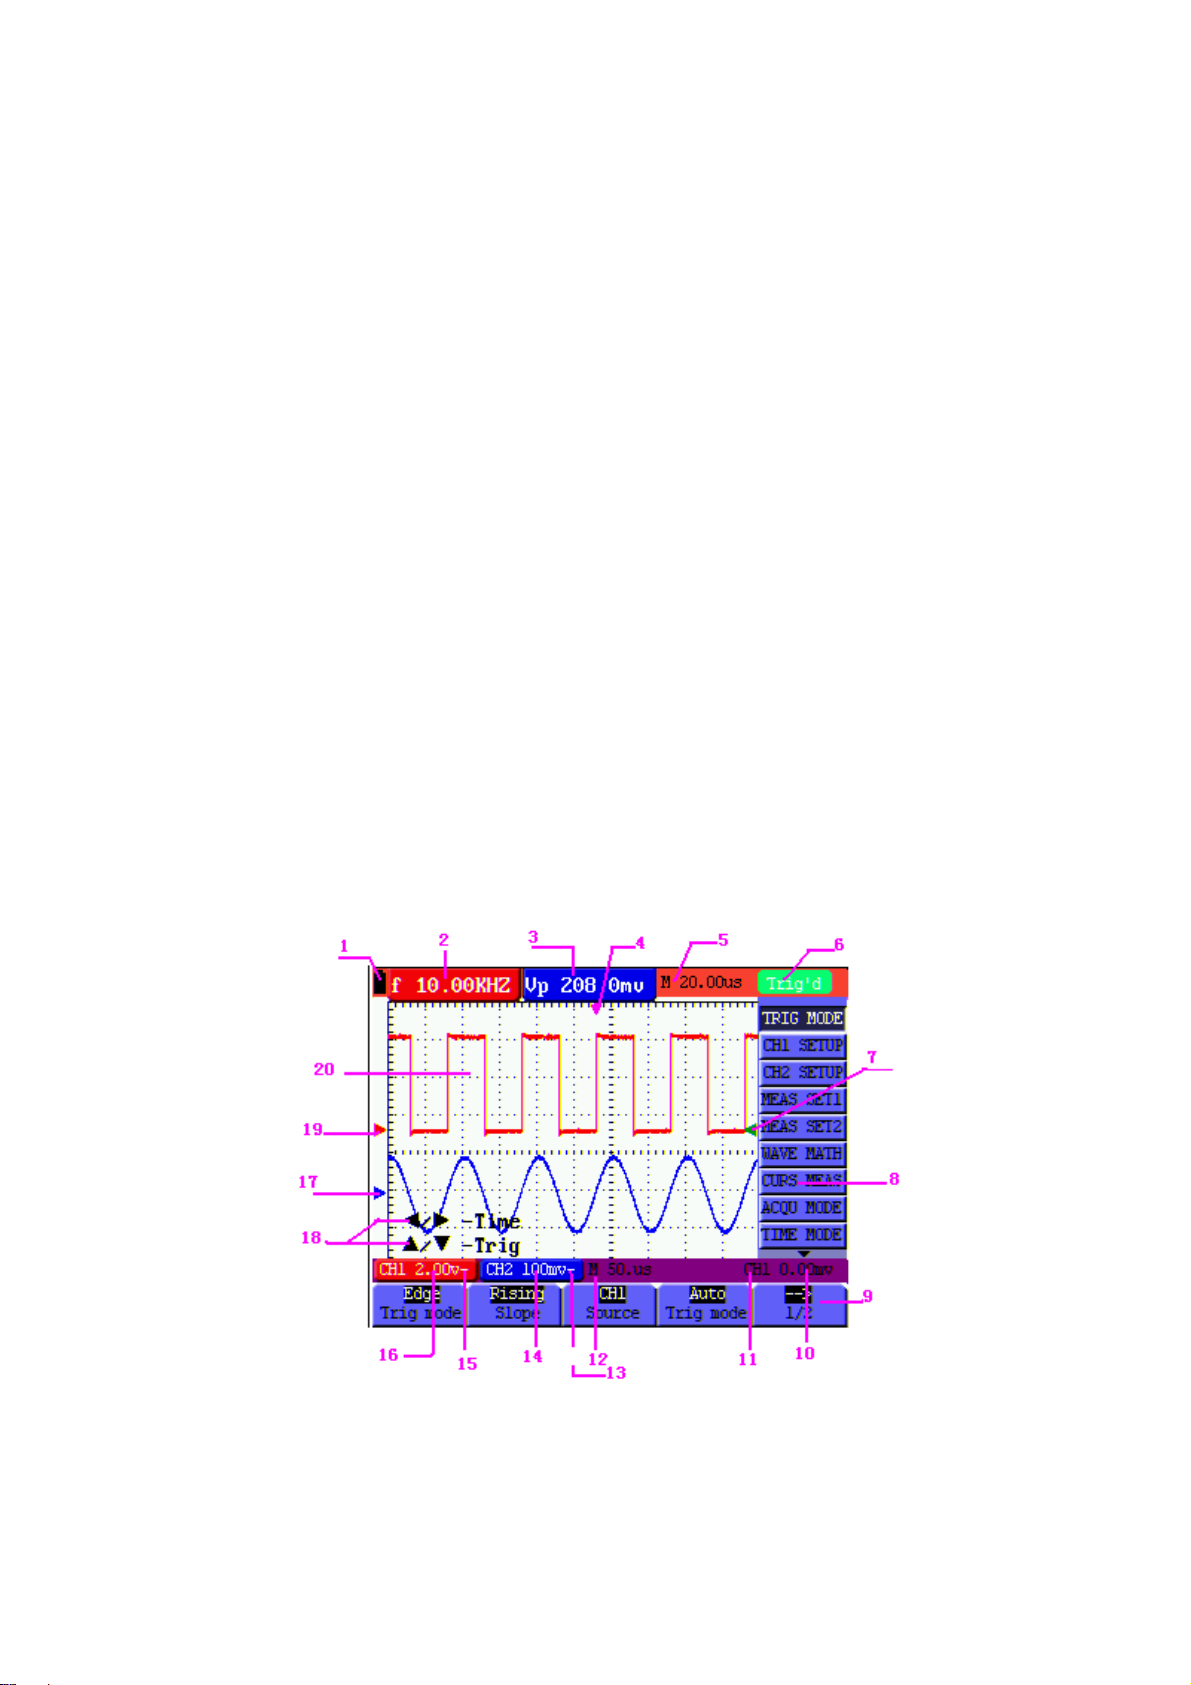
MAINOSCILLOSCOPEDISPLAYSCREEN
Figure 4: Oscilloscope Display Screen
12
V5.1‐March2010
Page 14

Description of Oscilloscope Display Screen (Figure 4)
1. Battery power status icon (
, , and )
2. Auto measurement screen No. 1 (“f” for frequency, “T” for cycle, “V” for
average value, “Vp” is the peak-peak value and “Vk” is the root-mean-
square value
3. Auto measurement screen No. 2
4. Horizontal triggering position
5. The difference in time between the horizontal triggering position and the
screen’s centerline (zero when the pointer is in the center of the screen)
6. The trigger modes:
Auto: The oscilloscope is in the automatic mode and displaying the
waveform in the non-trigger mode
Trig’d: The oscilloscope has detected a trigger and is displaying the
information generated after the trigger
Ready: All pre-triggered data has been captured and the oscilloscope is
ready to receive trigger signals
Scan: The oscilloscope records and displays waveform data continuously
Stop: The oscilloscope has stopped collecting waveform data
7. Red and blue trigger pointer shows vertical position of alternate triggers.
The trigger pointer turns green when it reaches an edge trigger or a video
trigger
8. Hide or View the menu using the MENU key;
9. Menu setting options (vary with each function)
10. Trigger Voltage Level
11. Trigger signal source
12. Primary Time Base
13
V5.1‐March2010
Page 15

13. The coupling mode for CH2; “~” AC, “-” DC, and ground
14. The vertical Voltage units scale for CH2
15. The coupling mode for CH1; “~” AC, “-” DC, and ground
16. Vertical Unit Scale for CH1
17. The blue pointer shows the ground point of the waveform for CH2 (zero
position). If this pointer is not shown, the channel has not been opened.
18. OPTION (options vary with each function)
19. The red pointer shows the ground point of the waveform for CH1 (zero
position). If this pointer is not shown, the channel has not been opened
20. Waveform display area. Red waveform represents CH1, blue represents
CH2
14
V5.1‐March2010
Page 16
MENUDESCRIPTION
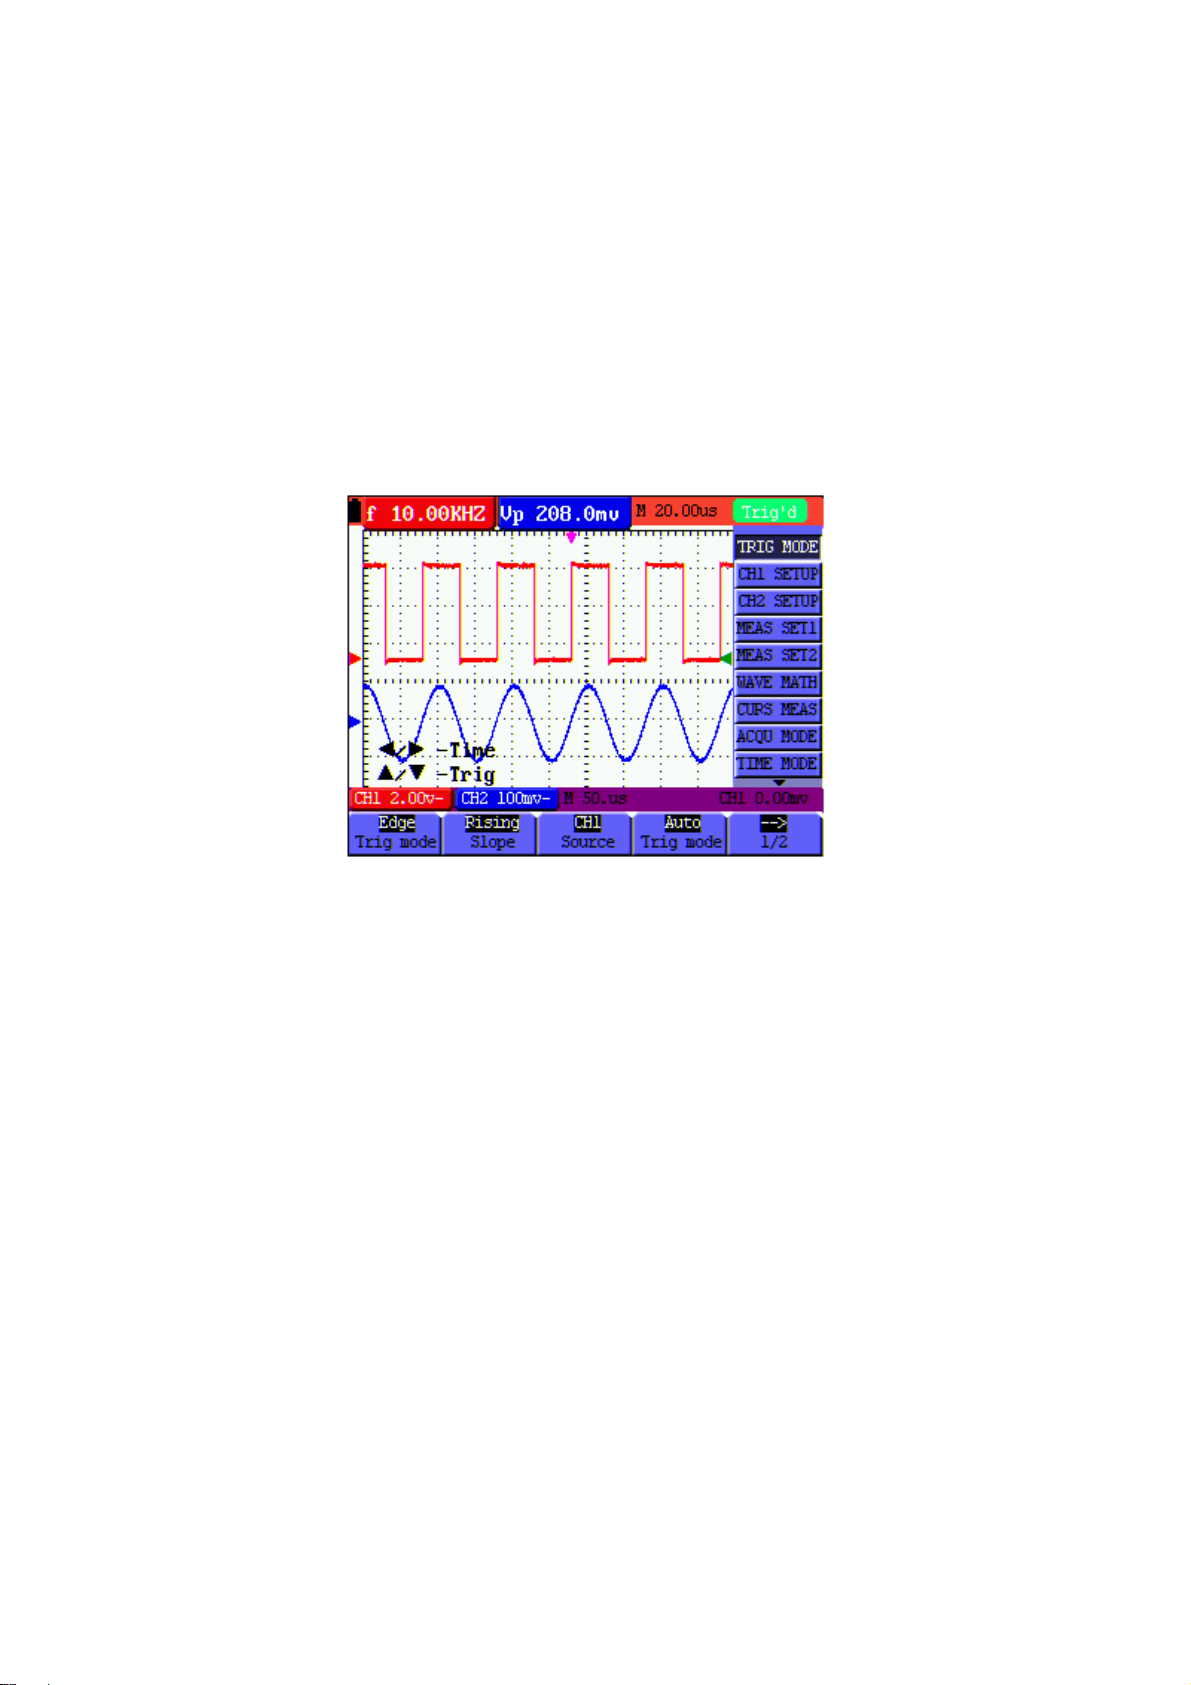
The following explains how to navigate the menus to select a function.
1. Press the MENU key to open the Function Menu. The Menu appears on the right
of the screen with the corresponding options available on the bottom of the
screen. Press MENU again to hide the Function Menu.
2. Use the MENU ▲ or MENU ▼ keys to navigate and select menu functions.
3. Use the soft-keys (F1…F5) to select an available option
Figure 5: Menu
MANUALLYSETTINGTHETRIGGERPOSITIONANDTIMEBASE
Use the OPTION key to set the vertical trigger position, the main time base and
the horizontal trigger position during Edge triggering and Video Triggering or vertical
trigger position for Horizontal time base and vertical trigger position and horizontal
level position during an Alternate trigger.
The following example shows how to use the OPTION key to change a setting.
For triggering in edge and video trigger mode:
1. Press the OPTION key once; the following will appear at the screen’s bottom left:
◄/► – Time Base
▲/▼ – Trig
15
V5.1‐March2010
Page 17
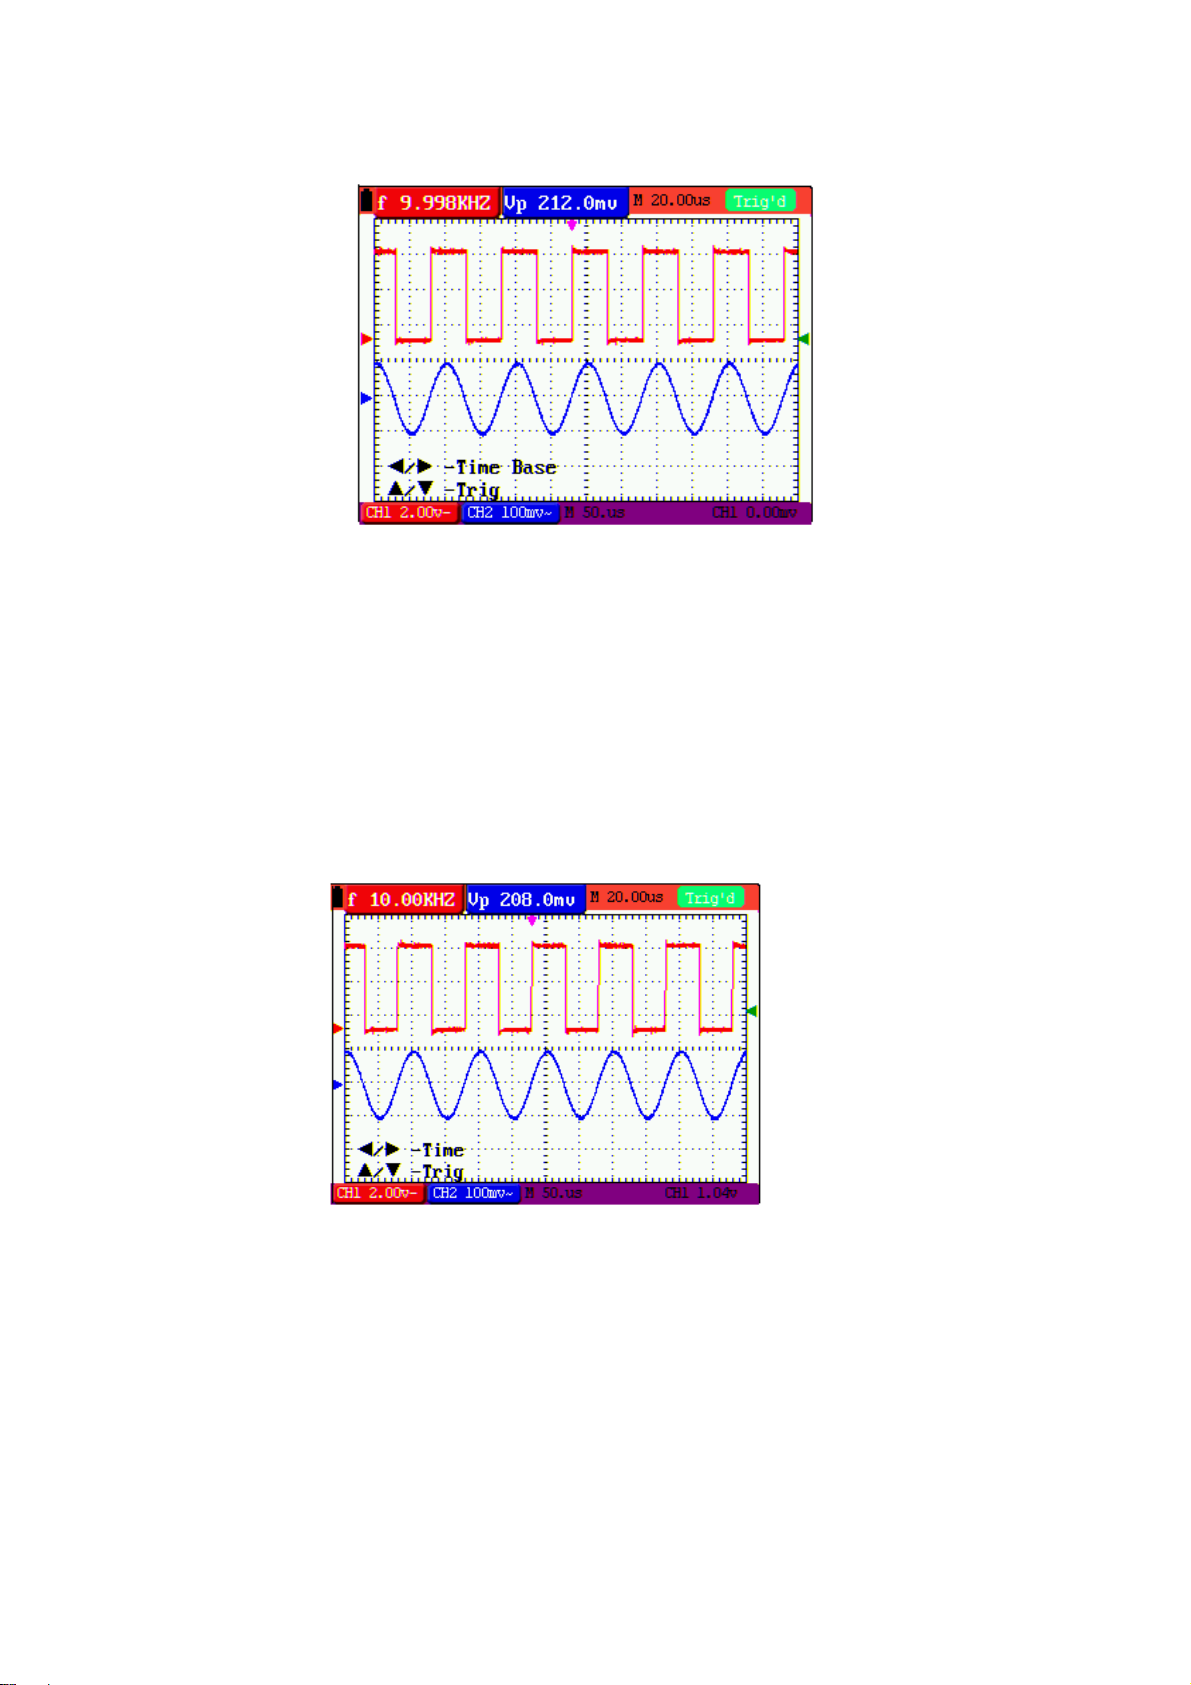
Figure 6
2. Press ◄ (yellow) or ► (yellow) to adjust the main time base. Press ▲ (yellow)
or▼ (yellow) to adjust the trigger horizontal position.
3.
Press OPTION again and the following will appear:
◄/► – Time
▲/▼– Trig
See Figure 7:
Figure 7
4. Press ◄ (yellow) or ► (yellow) to adjust time base horizontal position, press▲
(yellow) or ▼ (yellow) to adjust trigger position.
5. Use the OPTION key to toggle between the two modes described above.
16
V5.1‐March2010
Page 18
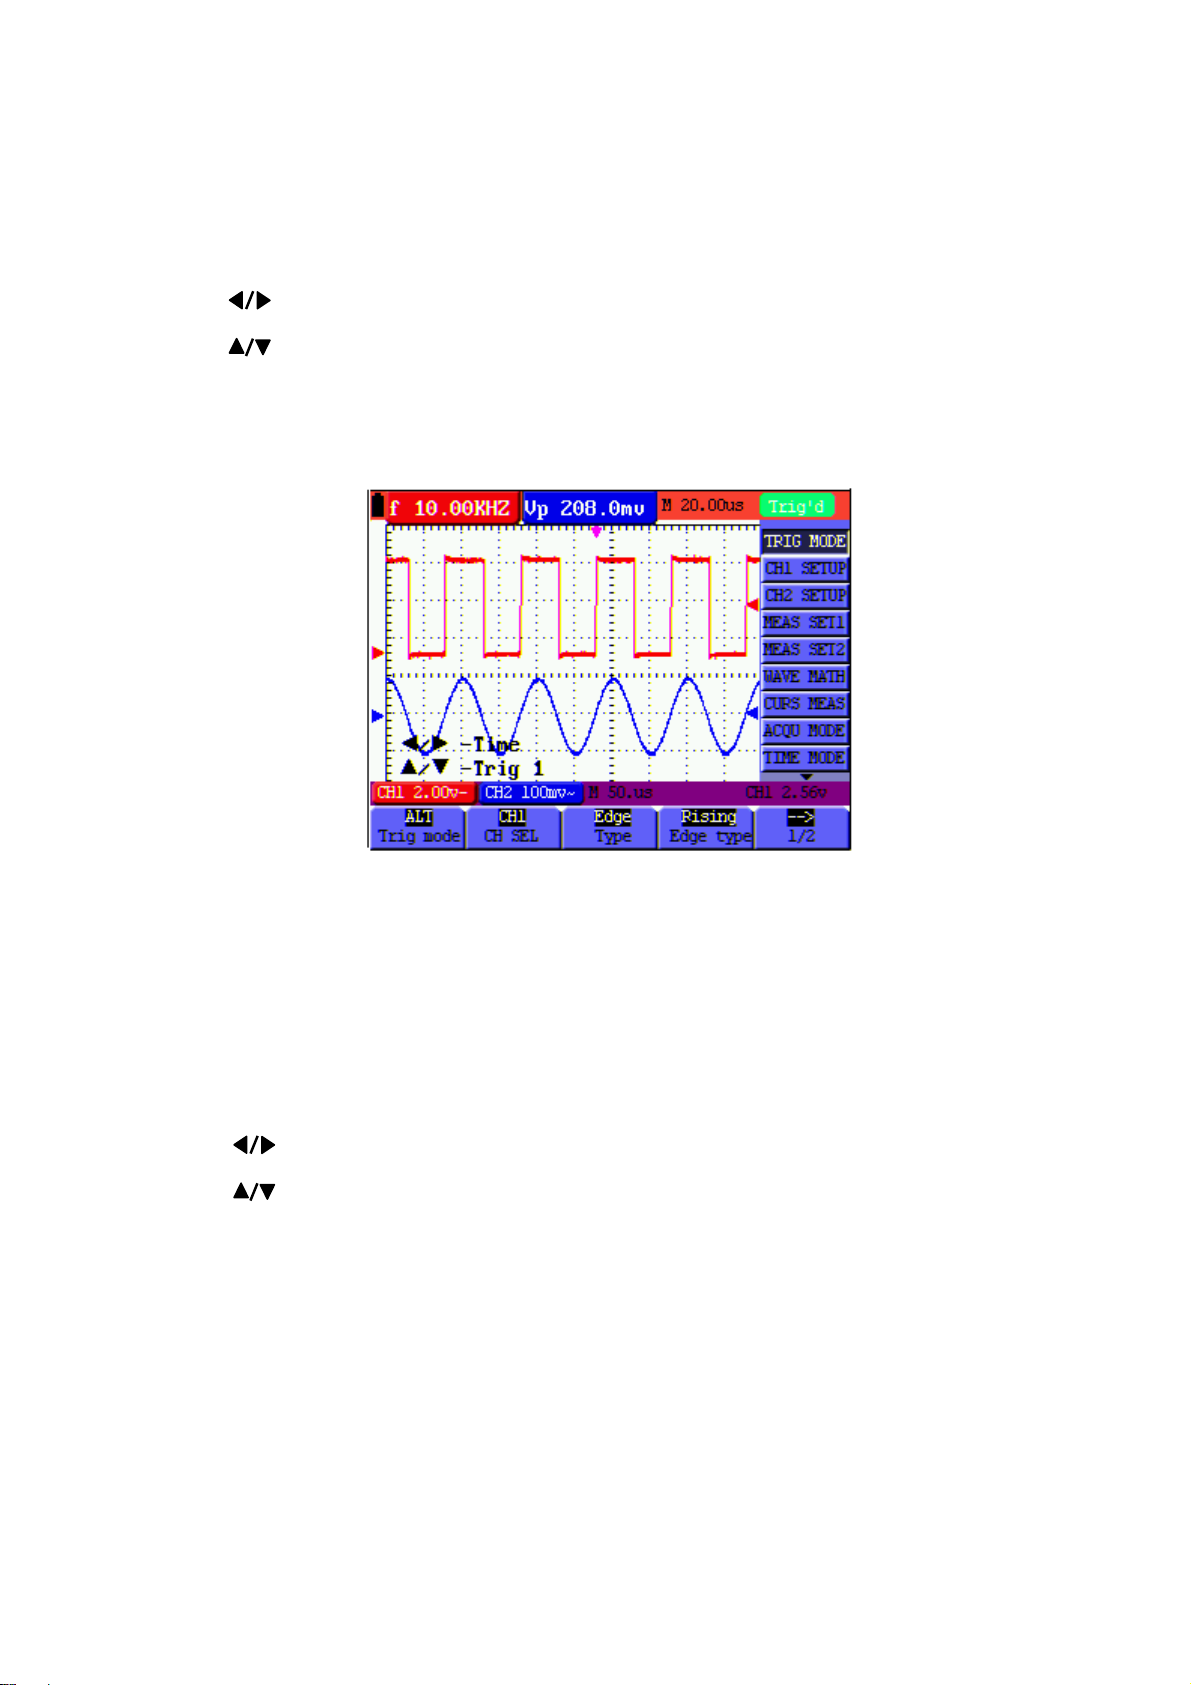
When triggering in the Alternate trigger mode:
7. Press OPTION and the following will appear:
—Time
—Trig 2
See Figure 8:
Figure 8:
7. Press ◄ (yellow) or ► (yellow) to adjust the time base horizontal position and
press ▲ (yellow) or ▼ (yellow) to adjust the trigger horizontal position for Channel 2.
8. Press OPTION again to display the following:
— Time Base
— Trig 1
See Figure 9:
17
V5.1‐March2010
Page 19
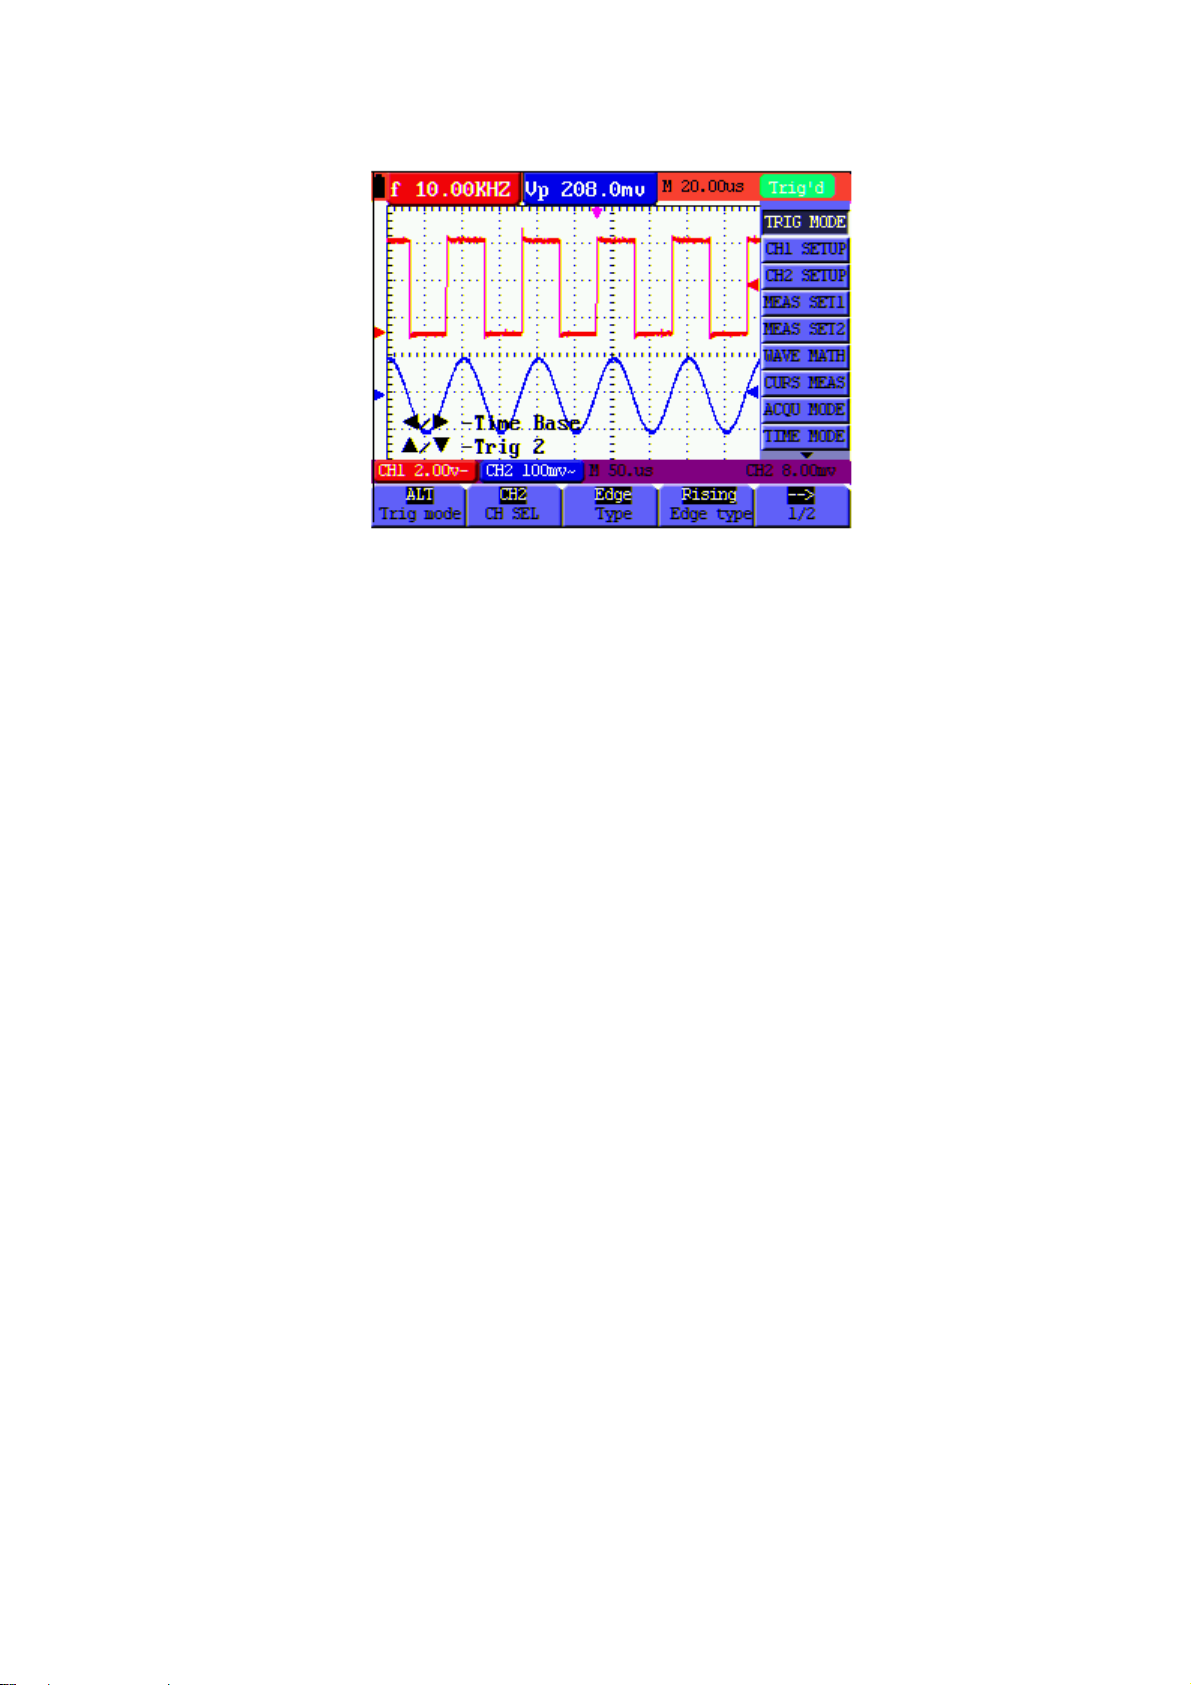
Figure 9:
9. Press ◄ (yellow) or ► (yellow) to adjust the main time base and press ▲
(yellow) or▼ (yellow) to adjust the trigger horizontal position for Channel 1.
10. Press OPTION again to return to step 6 above.
Glossary of Terms
z Vertical scale factor: The voltage amplitude represented by a division in the
vertical direction of the display area, through the adjustment of which the user can
amplify or attenuate the signal and thus regulate the signal amplitude so that it is
placed in the expected measurement range.
z Vertical zero position: Ground point, through the adjustment of which the user
can regulate the display position of the waveform on the screen.
z Main time base: The time value represented by a division in the horizontal
direction of the display area.
z Trigger horizontal position: The time difference between the actual trigger point
and the screen central line, which will be displayed as 0 at the center point of the
screen.
z Trigger level position: The voltage difference between the actual trigger level
and the zero position of the triggering signal source channel.
18
V5.1‐March2010
Page 20
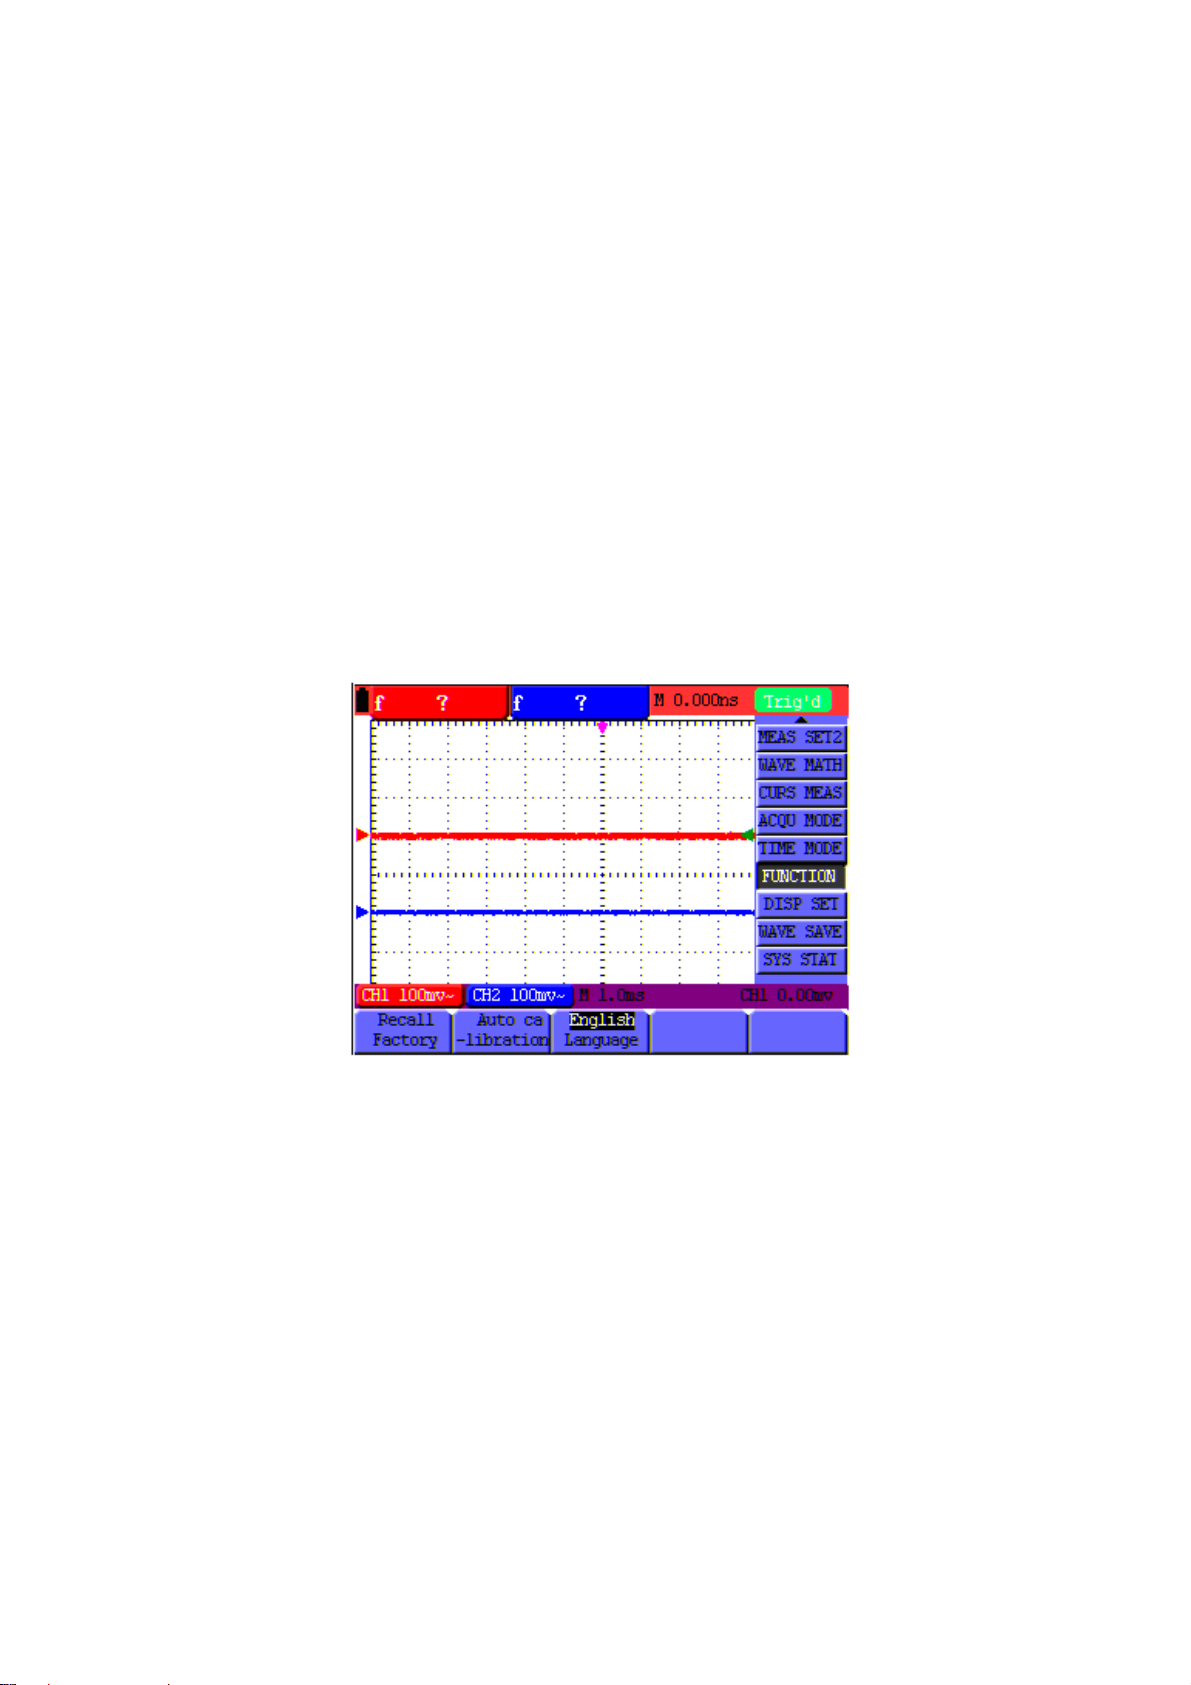
RECALLTHEFACTORYDEFAULTSETTINGS
To reset the Oscilloscope to the factory default settings, refer to the following:
1. Press the MENU key; the function menu will appear on the right side of the
screen
2. Press the MENU ▲ or MENU ▼ key to select a FUNCTION; three options will be
visible at the bottom of the screen.
3. Press F1 (Recall Factory) to recall the factory settings.
4. Press F2 to select “Auto calibration”.
If the ambient temperature varies from the
specified operating temperature by more than 5 degrees Celsius, an Auto
Calibration should be performed.
Refer to Figure 10:
Figure 10: Resetting the Oscilloscope
OSCILLOSCOPEINPUTCONNECTIONS
The Oscilloscope has two (2) signal inputs (located on the lower right side) for CH1
and CH2 measurements.
Isolated inputs allow for independent floating measurements between Multimeter and
Scope functions.
19
V5.1‐March2010
Page 21

MEASUREUNKNOWNSIGNALSUSINGTHEAUTO‐SETFEATURE
The Auto-Set feature allows the Oscilloscope to measure and display unknown
signals automatically. This function optimizes position, range, time-base, and
triggering. It also assures a stable display of virtually any waveform. Auto Range is
especially useful for quickly checking several signals.
To enable the Auto-Set feature, perform the following steps:
1. Connect the test probe to the circuit or device under test.
2. Press the AUTO SET key; the test signals will appear on the screen.
AUTOZEROTHEHORIZONTALTRIGGERANDTRIGGERLEVELPOSITION
To configure the instrument so that the horizontal trigger and the trigger level position
automatically return to zero.
1. Press the V key; the horizontal trigger position will automatically return to zero
2. Press the R key; the trigger level position will automatically return to zero
AUTOMATICMEASUREMENTRANGING
The Oscilloscope offers five (5) ranges that adjust automatically as measurements
are taken. Two numeric readings can be displayed: MEAS SET1 and MEAS SET2
(selectable independently); the measurements can be performed on the CH1 or CH2
waveform inputs.
To choose a frequency for CH1, perform the following procedure:
1. Press the MENU key; the function menu will appear on the right side of the
screen.
2. Press MENU ▲ or MENU ▼ to select MEAS SET 1. Five selectable options
will then be visible at the bottom of the screen.
3. Press the F1 key and select Freq CH1 from the root mean square (RMS)
option. The MEAS SET 1 window color will change to red and display CH1
frequency.
To choose Peak-Peak measurements for the CH2 input, refer to the following:
1. Press the MENU key; the function menu will appear at the right side of the
screen.
2. Press MENU ▲ or MENU ▼ key to select MEAS SET 2. Five (5) selectable
options will appear at the bottom of the screen.
3. Press the F4 key to select PK-PK CH2 from the Peak-Peak option. The MEAS
SET2 window color turns to blue and displays the peak-peak value for the CH2
input.
20
V5.1‐March2010
Page 22
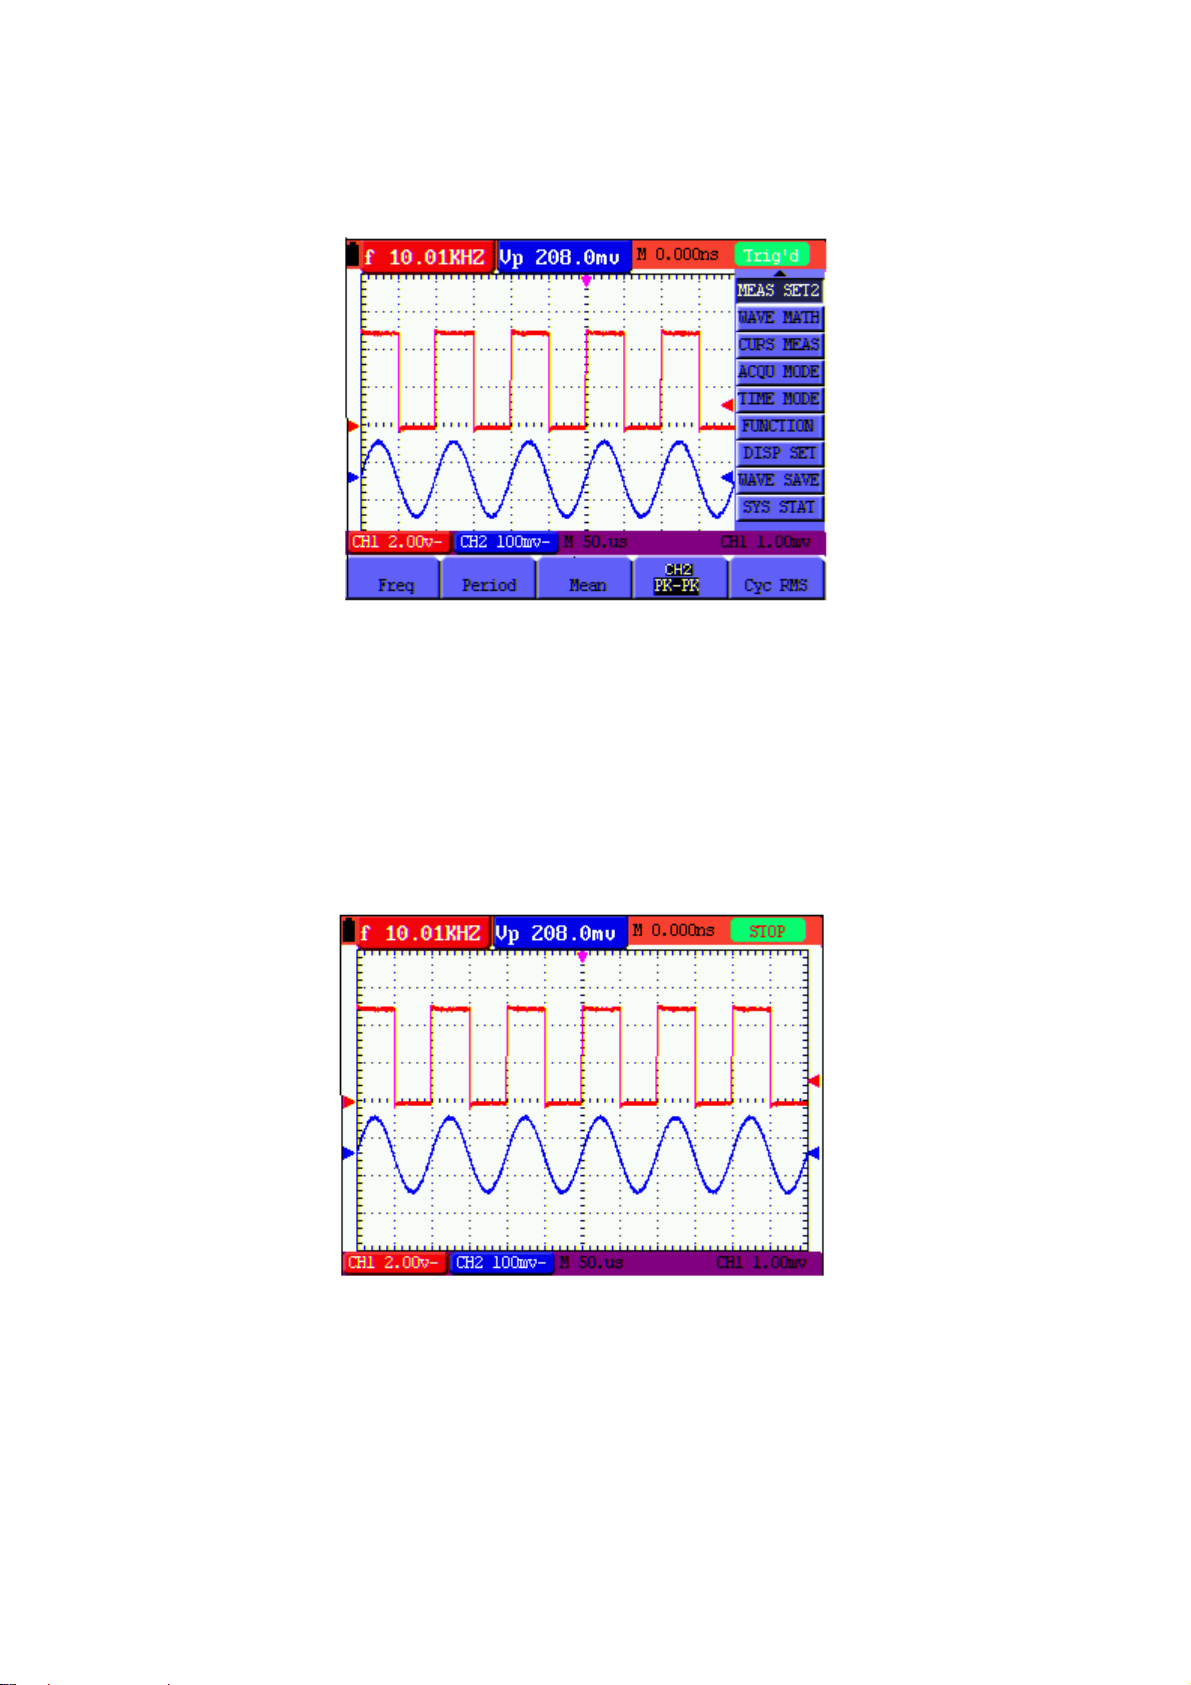
Refer to Figure 11:
Figure 11: Automatic Scope Measurements
DATAHOLD(FREEZINGTHEDISPLAYEDREADING)
To freeze any displayed reading or waveform, follow these steps:
1. Press the RUN/STOP key to freeze the screen: STOP appears at the top (right)
of the screen.
2. Press the RUN/STOP key again to resume normal mode. Refer to Fig. 12:
Figure 12: Freezing the Screen
21
V5.1‐March2010
Page 23
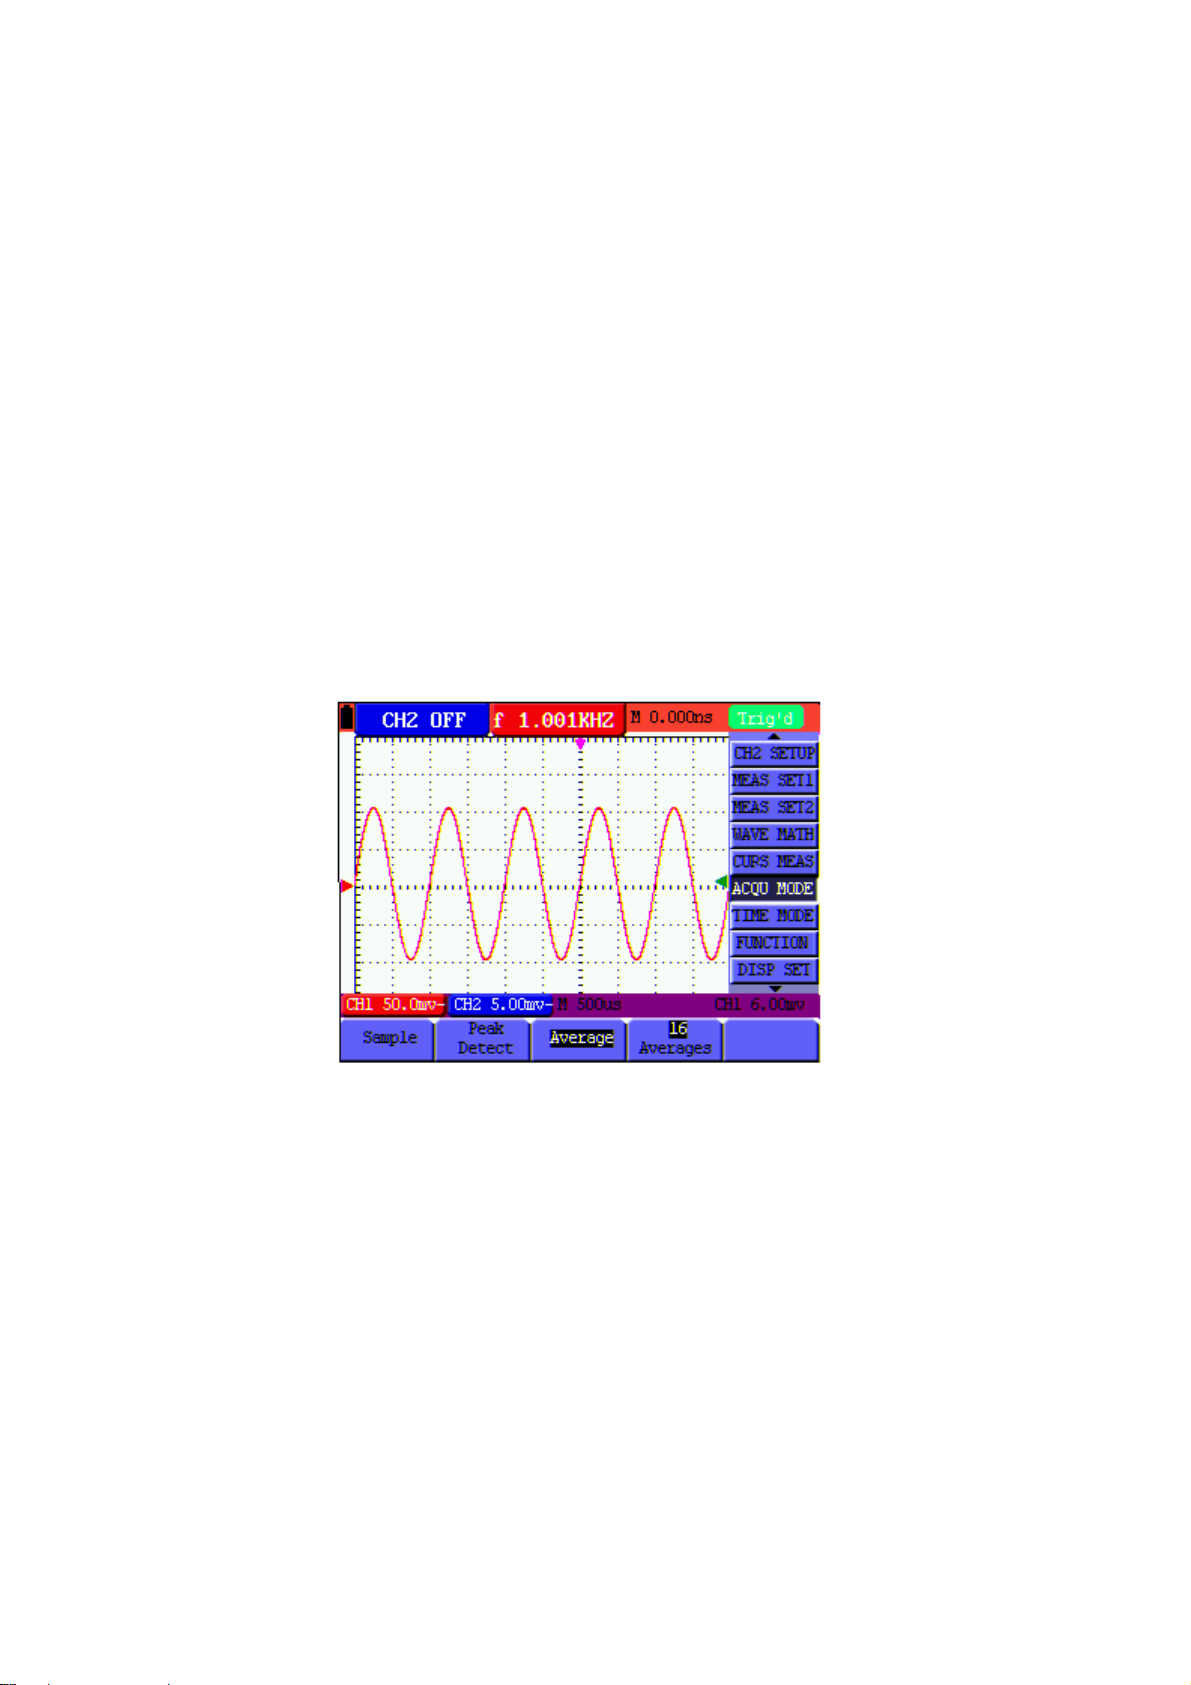
USINGTHEAVERAGEMODETOSMOOTHWAVEFORMS
Use the Average mode to smooth the displayed waveform; multiple data samples will
be averaged. The number of samples to average is selectable from 4, 16, 64, up to
128.
Note: For best results, the waveform must be repetitive. As the number of average
samples increases the waveform updating time increases. Refer to the following:
1. Press the MENU key; the function menu will appear on the right side of the
screen.
2. Press MENU ▲ or MENU ▼ to select the ACQU (acquisition) mode; Four (4)
selectable options will display at the bottom of the screen.
3. Press the F3 key to select Average Factors and then press the F4 key to jump
to Averages 16. The meter then averages 16 samples (or acquisitions) and
displays the final result. Refer to Figure 13:
Figure 13: Average Factor Sampling Mode
PERSISTENCEMODE(SUPERIMPOSINGWAVEFORMS)
Persistence Mode allows the user to hold a displayed waveform on the display while,
at the same time, superimposing the current waveform. The user can select the
amount of time (number of seconds or infinite) to retain the displayed waveform
or set the feature OFF. Refer to the following:
22
V5.1‐March2010
Page 24

1. Press the MENU key; the function menu will appear on the right side of the
screen.
2. Press MENU ▲ or MENU ▼ to select DISP SET. Four (4) selectable options
will appear at the bottom of the screen.
23
V5.1‐March2010
Page 25
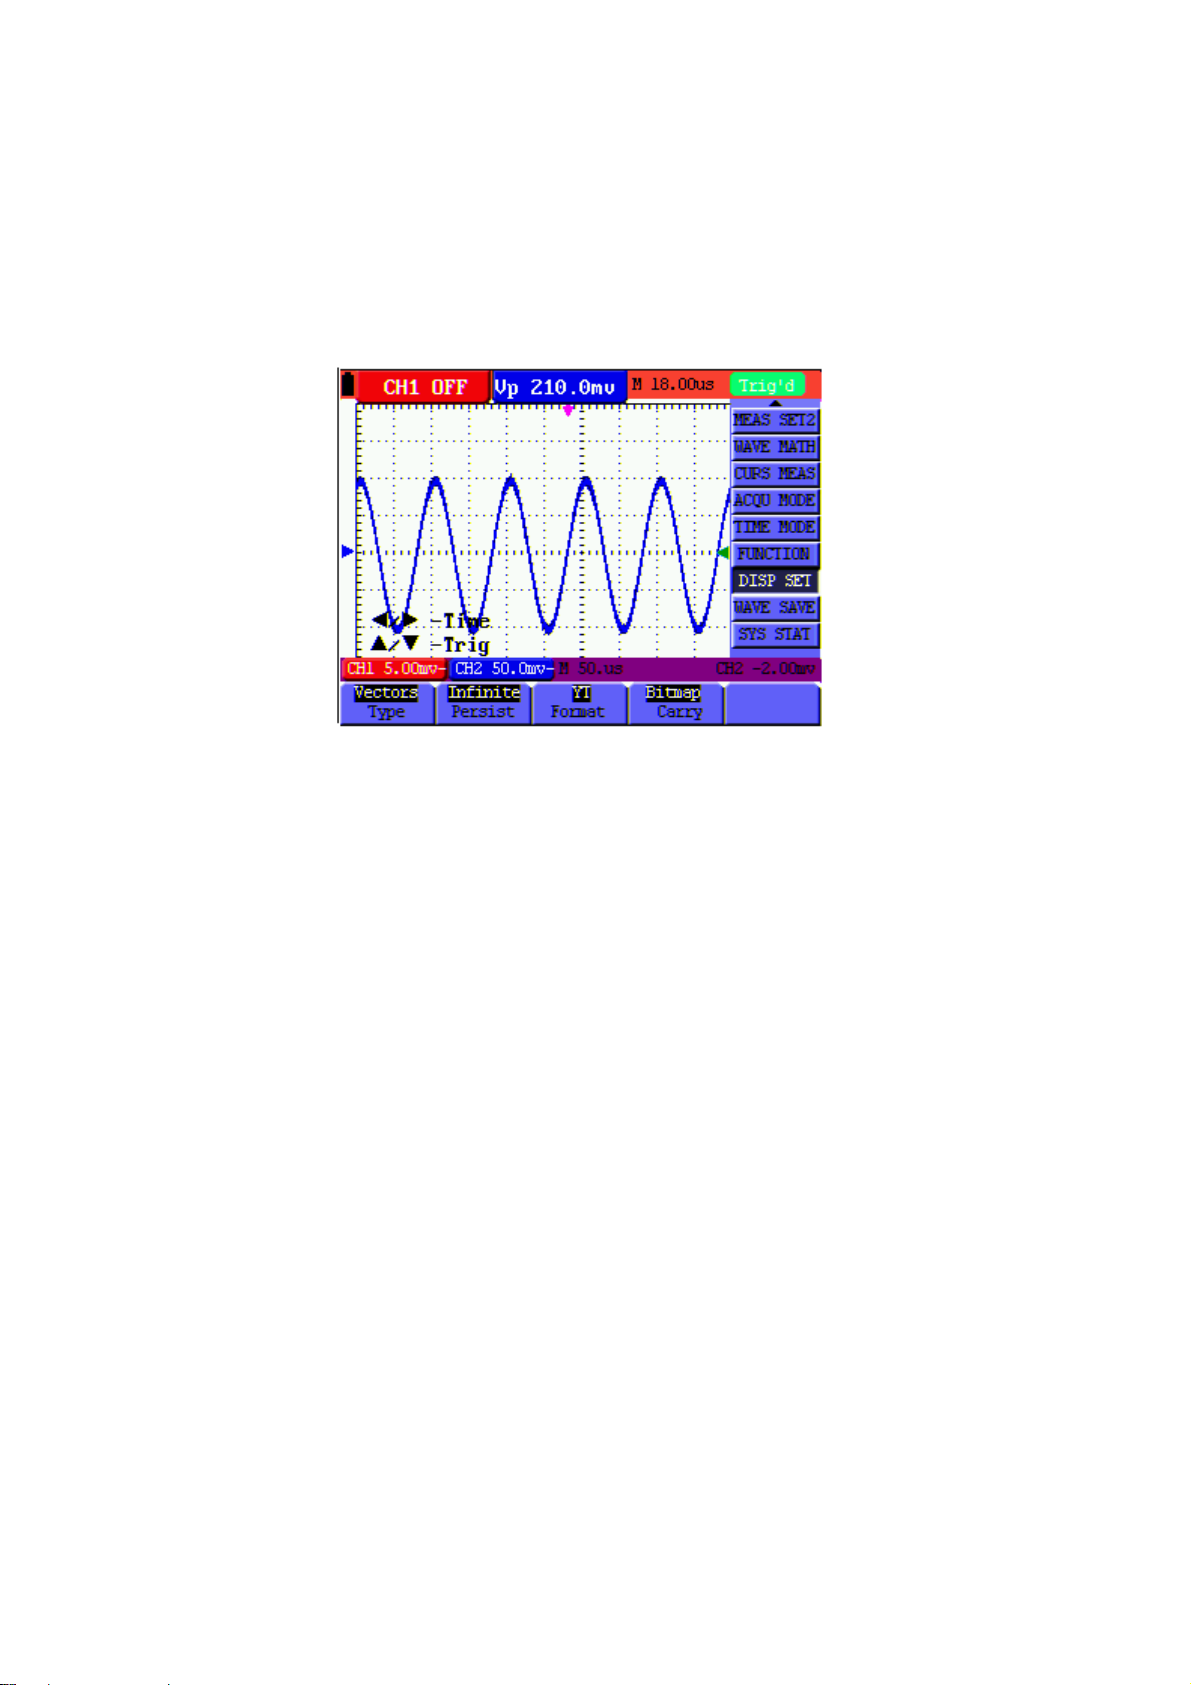
3. Press the F2 key to select 1 sec, 2 sec, 5 sec, infinite or OFF. Select a 1, 2,
or 5 second waveform display duration as desired. When Infinite is selected
the waveform will remain on the screen indefinitely. When OFF is selected, the
Persistence function has no effect on displayed waveforms.
Refer to Figure 14.
Figure 14: Persistence Mode to Observe Dynamic Signals
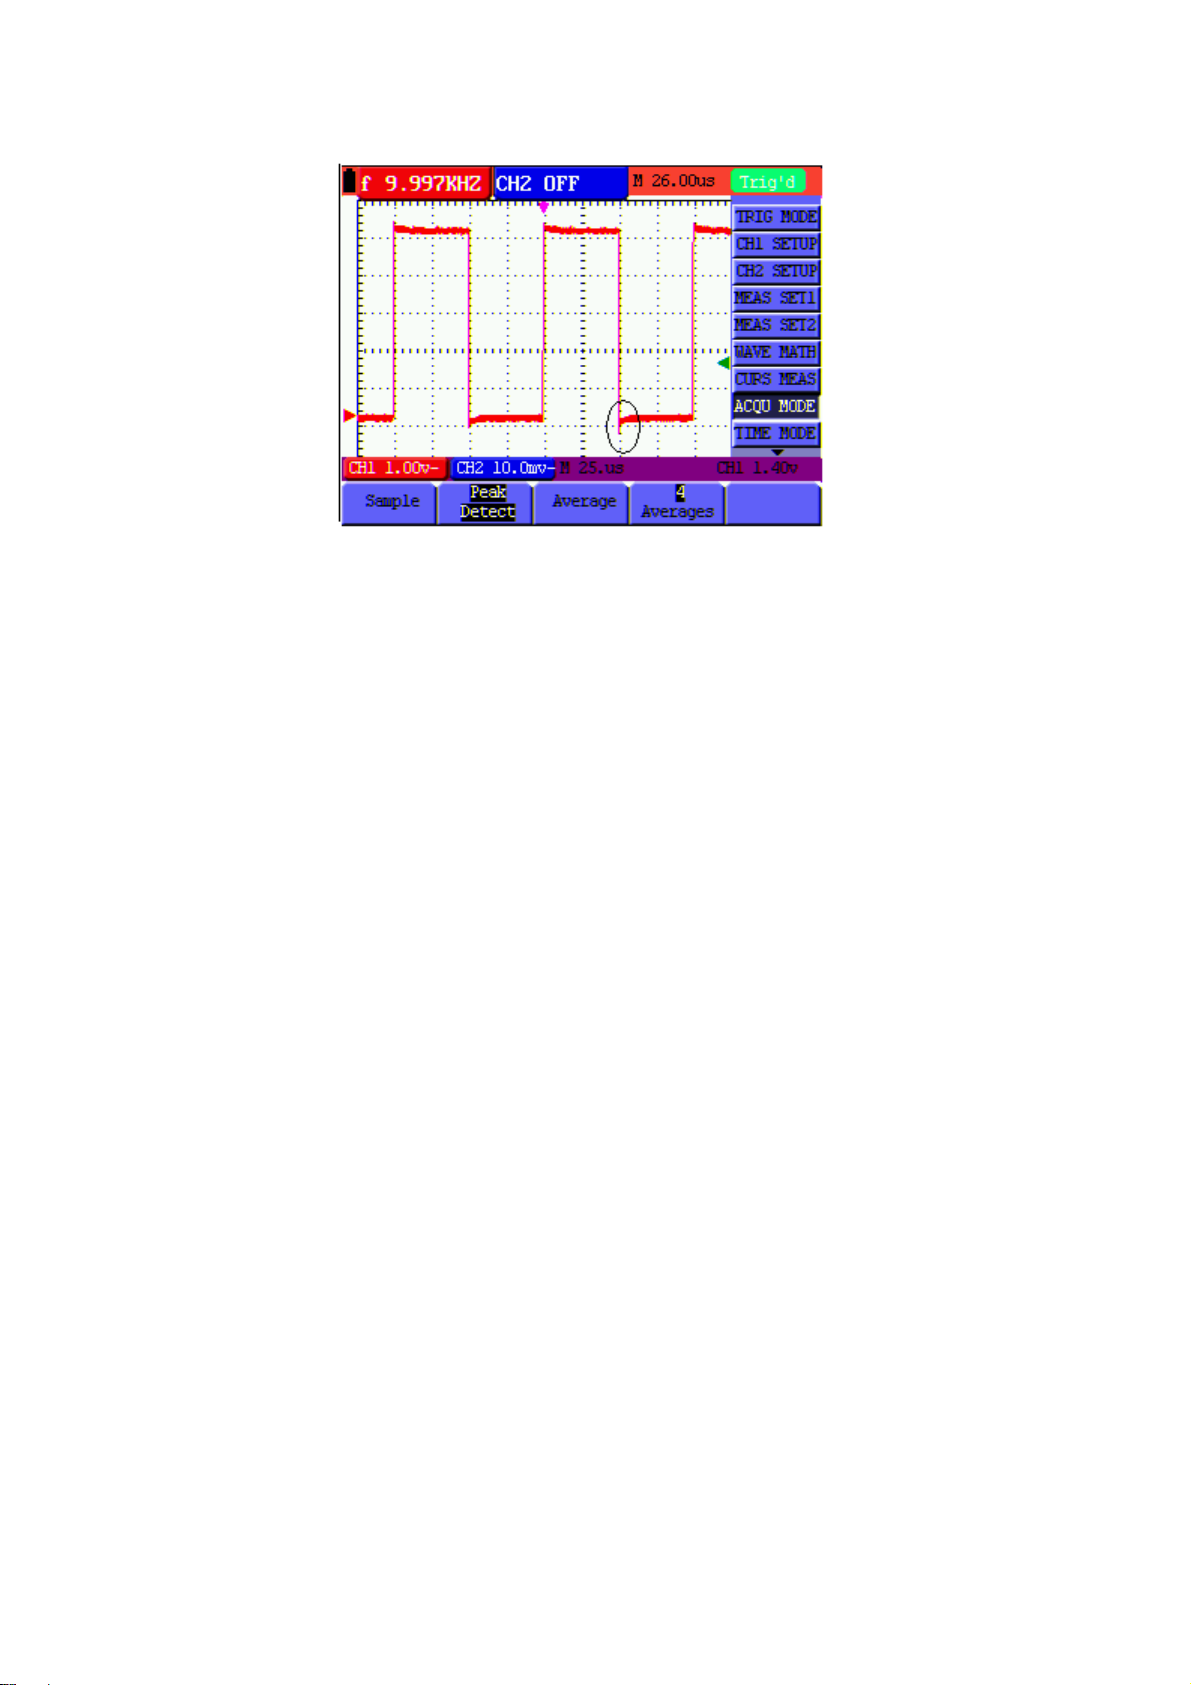
USINGPEAKDETECTIONTOCAPTUREGLITCHES
Use Peak Detect to display events (glitches or other asynchronous waveforms) down
to 50 ns (nanoseconds).
1. Press the MENU key; the function menu will appear at the right side of the
screen.
2. Press MENU ▲ or MENU ▼ to select the ACQU MODE. Four (4) selectable
options will appear at the bottom of the screen.
3. Press the F2 key to select Glitch Detect.
Refer to Figure 15.
24
V5.1‐March2010
Page 26
Glossary of Terms
Figure 15: Peak Detection
• Collecting mode: The oscilloscope converts the collected analog data into
digital data for each of the following three modes: Sampling, Peak Detect, and
Averaging.
• Sampling: The waveform sampling resolution in seconds. Waveforms that change
faster than the sample duration will not be accurately captured.
• Peak value detection: In peak detect mode the meter can capture very narrow
pulses down to 50ns
• Averaging values: The oscilloscope averages a selectable number of
measurements. Random noise can be minimized in this mode.
• Duration time: A waveform can be held as a new waveform is displayed. The
amount of time the previous waveform is displayed is the ‘duration time’.
• Roll scan: The oscilloscope updates the waveform sampling points by scrolling
the screen from left to right (applicable only to primary time base settings above
50ms).
SELECTINGAC‐COUPLING
25
V5.1‐March2010
Page 27
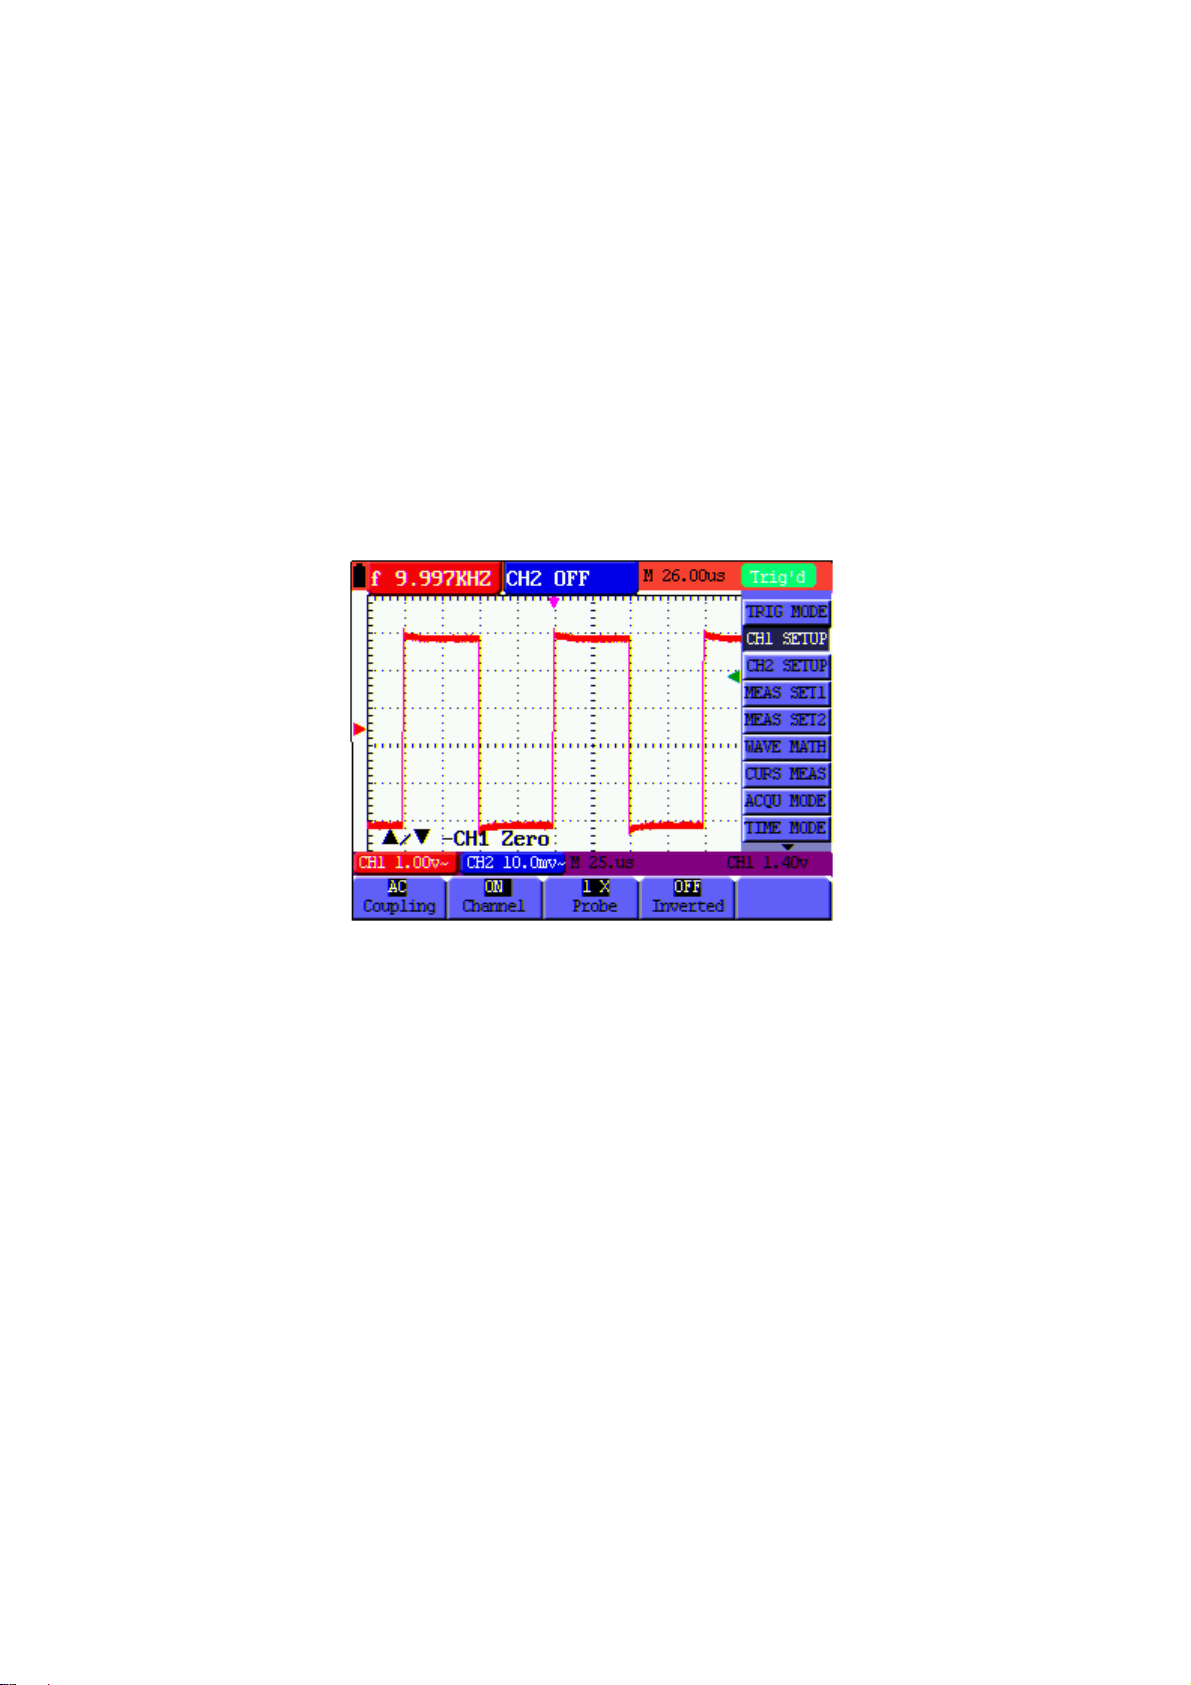
After a reset, the Oscilloscope is dc-coupled so that ac and dc voltages appear on the
screen. Use ac-coupling to observe a small ac signal that rides on a dc signal. To select
ac-coupling, perform the following steps:
1. Press the MENU key; the function menu will appear at the right side of the
screen.
2. Press MENU ▲ or MENU ▼ to select the CH1 Setting. Four (4) selectable
options appear at the bottom of the screen.
3. Press the F1 key and select AC. The AC coupling icon will appear on the
screen.
Refer to Figure 16.
Figure 16: AC-Coupling
REVERSINGTHEPOLARITYOFTHEDISPLAYEDWAVEFORM
To invert the input CH1 waveform, perform the following steps:
1. Press the MENU key; the function menu will appear at the right side of the
screen.
2. Press MENU ▲ or MENU ▼ to select CH1 setting. Four (4) selectable options
will appear at the bottom of the screen.
3. Press the F4 key to select Inverted. The CH1 inverted waveform will then be
displayed on the screen.
Refer to Figure 17.
26
V5.1‐March2010
Page 28
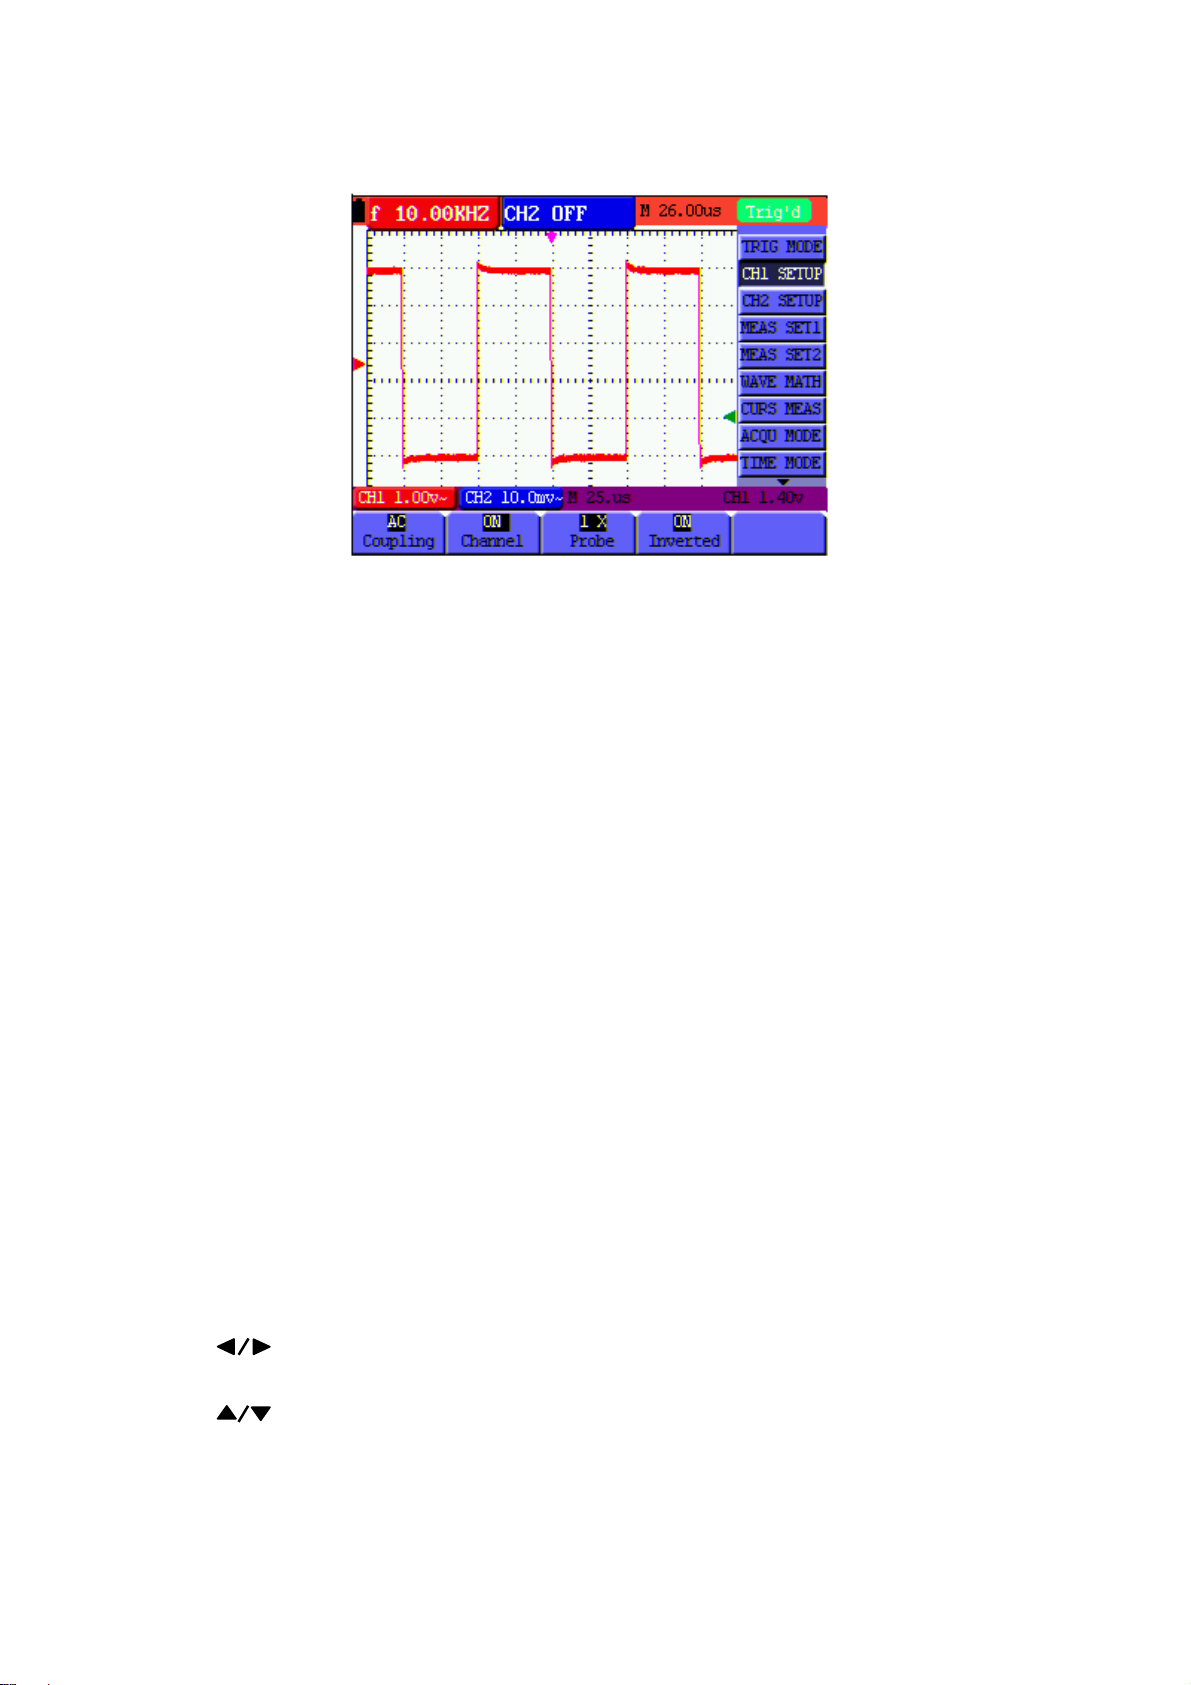
Figure 17: Inverted Waveform
USINGMATHEMATICALFUNCTIONSONWAVEFORMS
When adding (CH1 + CH2), subtracting (CH1 – CH2, CH2 – CH1), multiplying (CH1 *
CH2) or dividing (CH1/CH2) the input waveforms of CH1 and CH2, the oscilloscope
will display the mathematical result waveform M and the input waveforms of CH1 and
CH2 on the screen. The Mathematical functions perform a point-to-point calculation
on the waveforms (CH1 and CH2).
To use a Math function, perform the following steps:
1. Press the MENU key; the function menu will appear at the right side of the
screen.
2. Press MENU ▲ or MENU ▼ to select WAVE MATH. Five (5) selectable
options will appear at the bottom of the screen.
3. Press the F3 key to select CH1+CH2; the calculation resulting waveform M
(green) will then appear on the screen. Press the F3 key again to exit the
Waveform Calculation mode.
4. Press OPTION and the screen will show the following on the bottom left:
—CH Math Volts/Div
—CH M Zero
27
V5.1‐March2010
Page 29
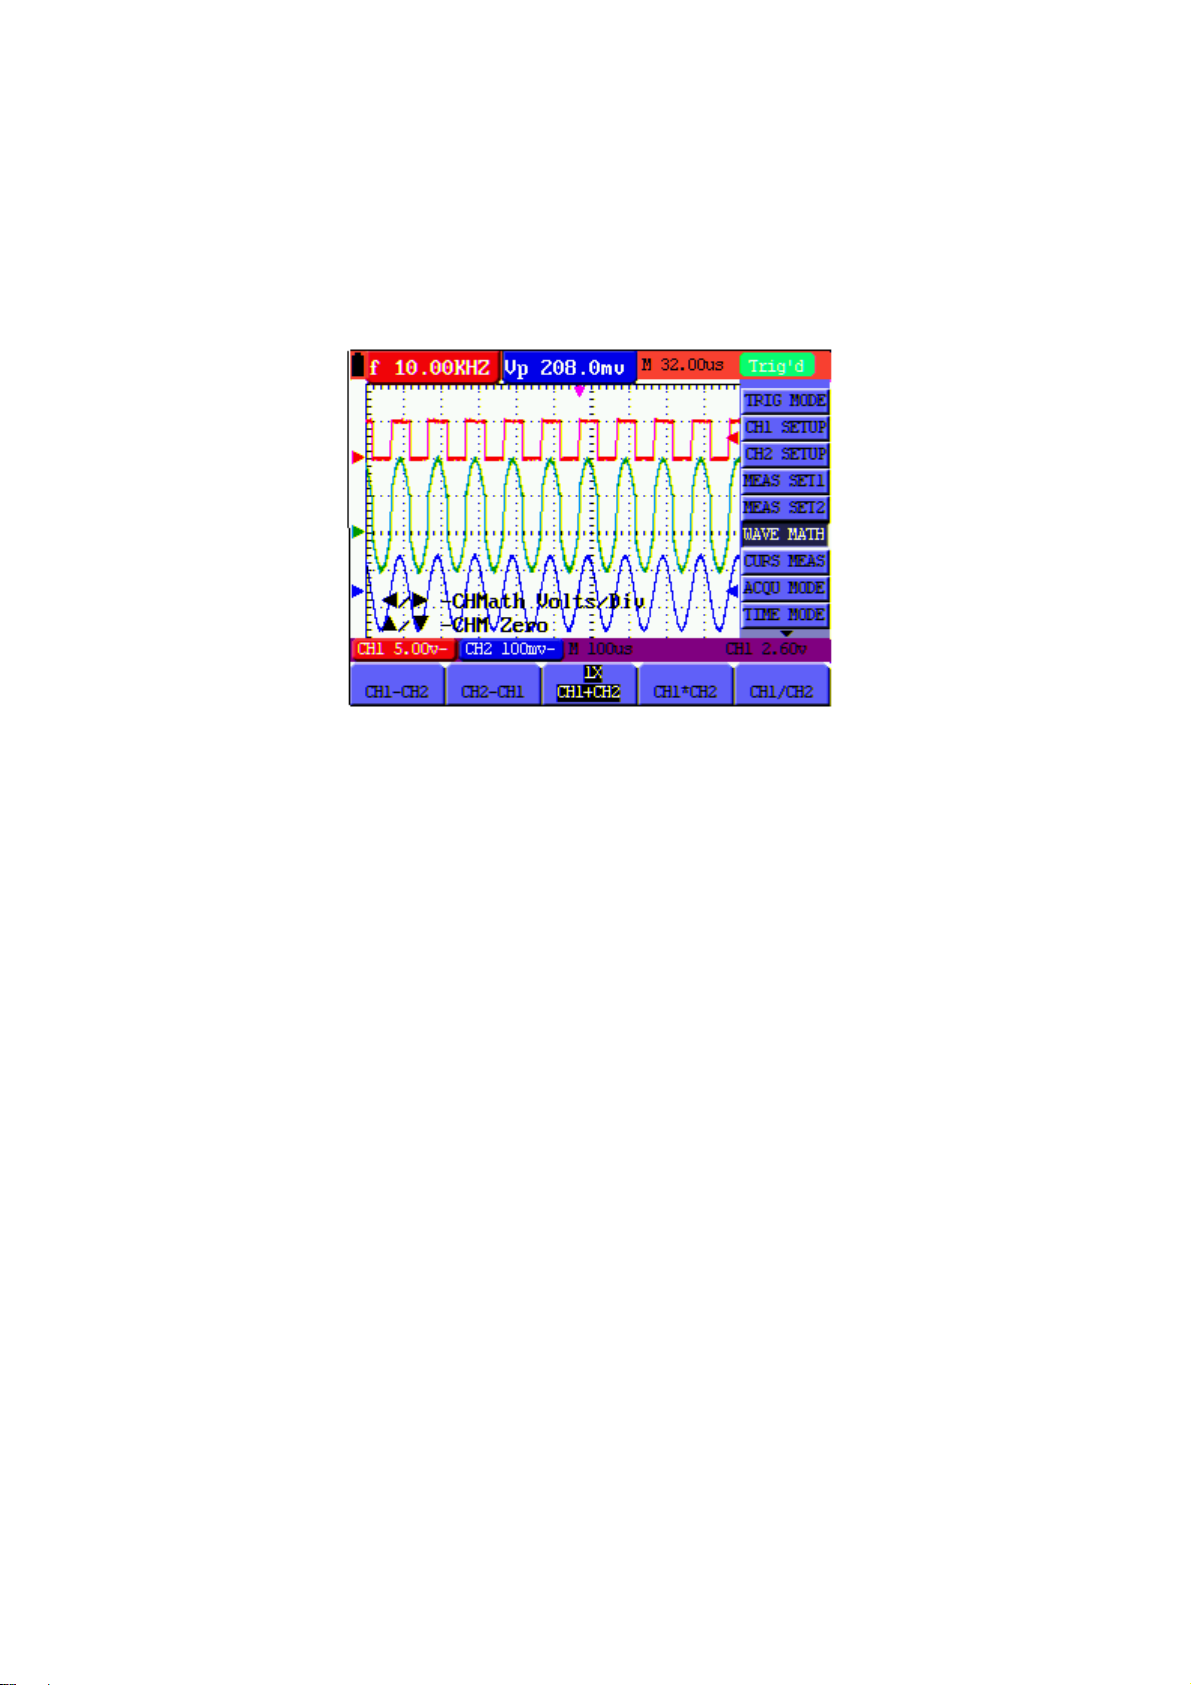
5. Press▲(yellow) or ▼(yellow) to adjust the vertical display position of waveform M.
Press ◄
Refer to Figure 18.
(yellow) or ►(yellow) to adjust the display time factor for waveform M.
Figure 18: Waveform Mathematical Calculations
USBMASSSTORAGEDEVICE/SAVEWAVEFORMDATA
Connect a USB mass storage device to the USB port on the meter using the supplied
cable. Press the COPY key. The current waveform data will then be saved (the file
names are automatically sequenced (WAVE1.bin, WAVE2.bin, etc.). Now connect
the USB Mass Storage device to a Personal Computer and use the supplied software
to transfer and manipulate the stored data.
Note: Refer to the HELP utility in the supplied software for further instructions.
28
V5.1‐March2010
Page 30
ADVANCED OSCILLOSCOPE FUNCTIONS
ABOUTTHISCHAPTER
Advanced Oscilloscope functions are covered in this chapter.
VERTICALSETTINGSFORCH1ANDCH2
Each channel has its own independent vertical menu and each item can be set
respectively based on the specific channel.
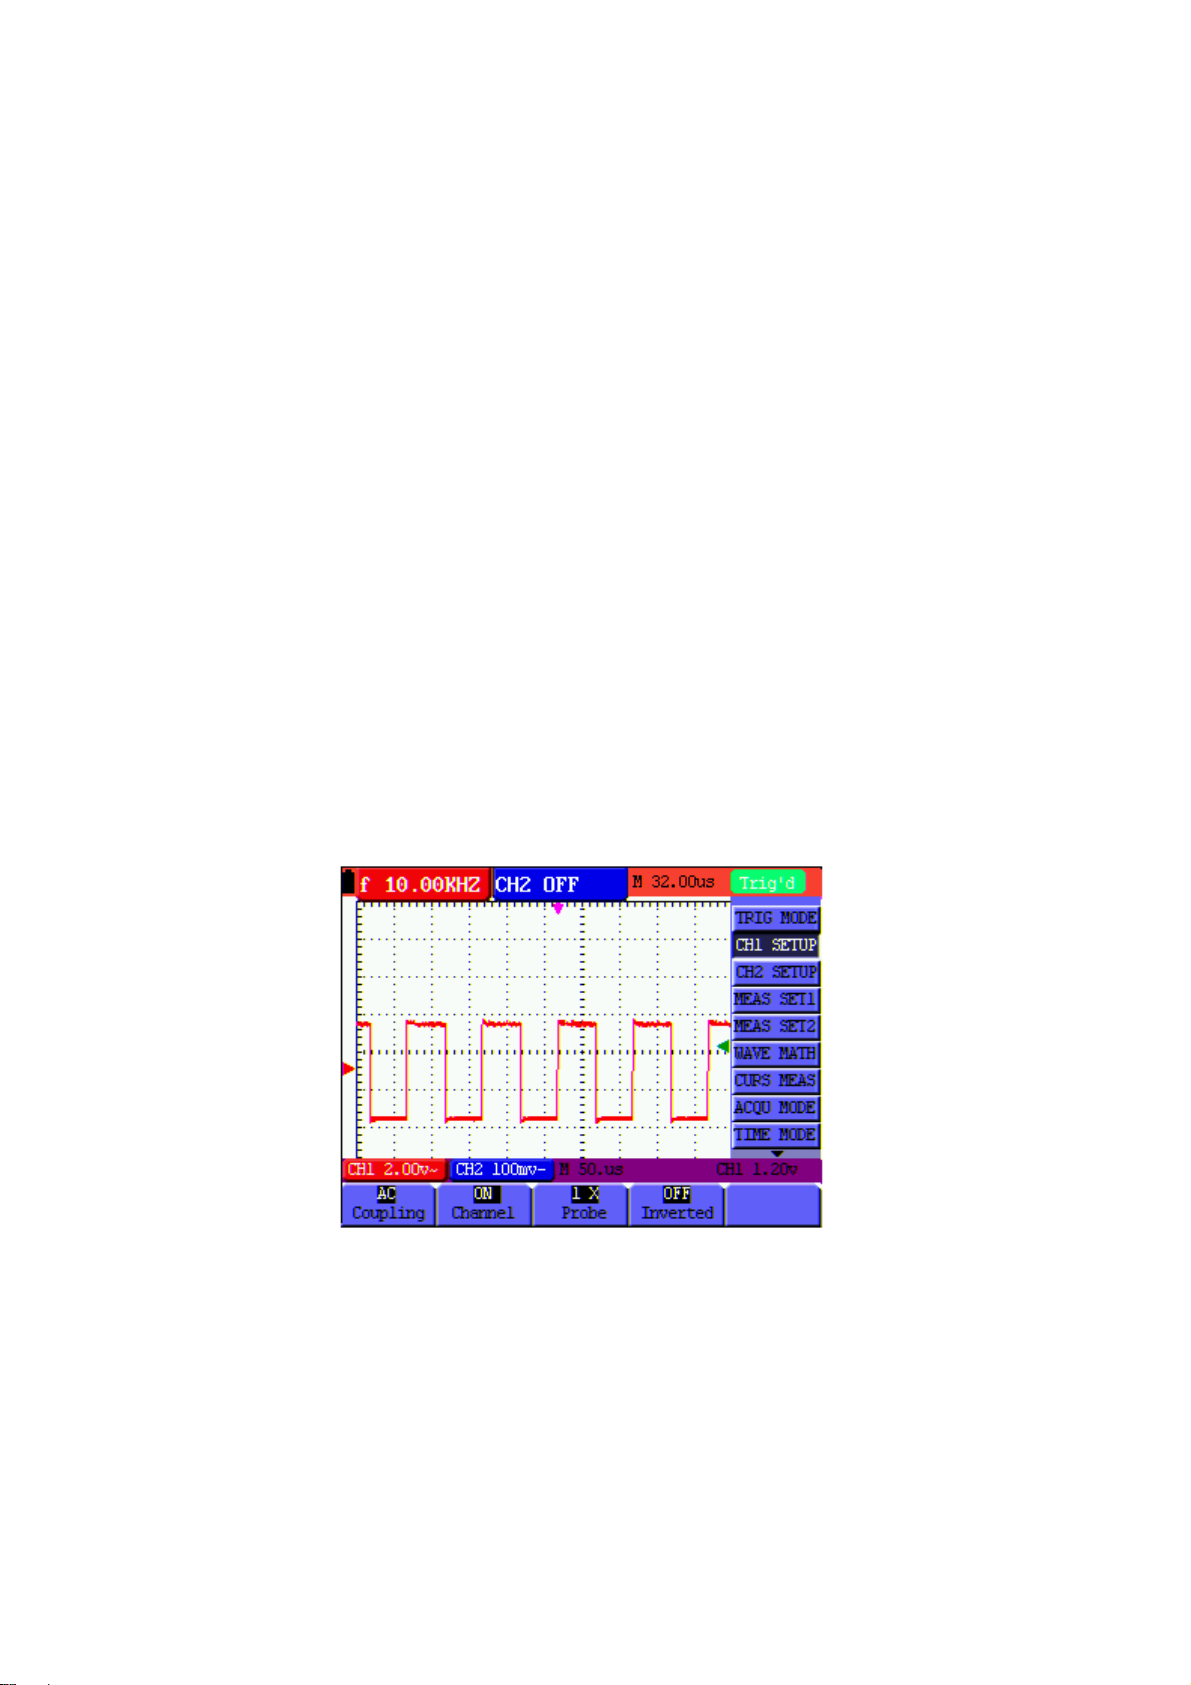
To make vertical CH1 and CH2 settings, perform the following steps:
1. Press the MENU key; the function menu will appear at the right of the screen.
2. Press MENU ▲ or MENU ▼ to select CH1 SETUP. Four (4) selectable options will
appear at the bottom of the screen.
3. Use the soft function keys (F1 through F4) to adjust settings as desired.
Refer to Figure 19.
Figure 19: Vertical Settings
29
Page 31
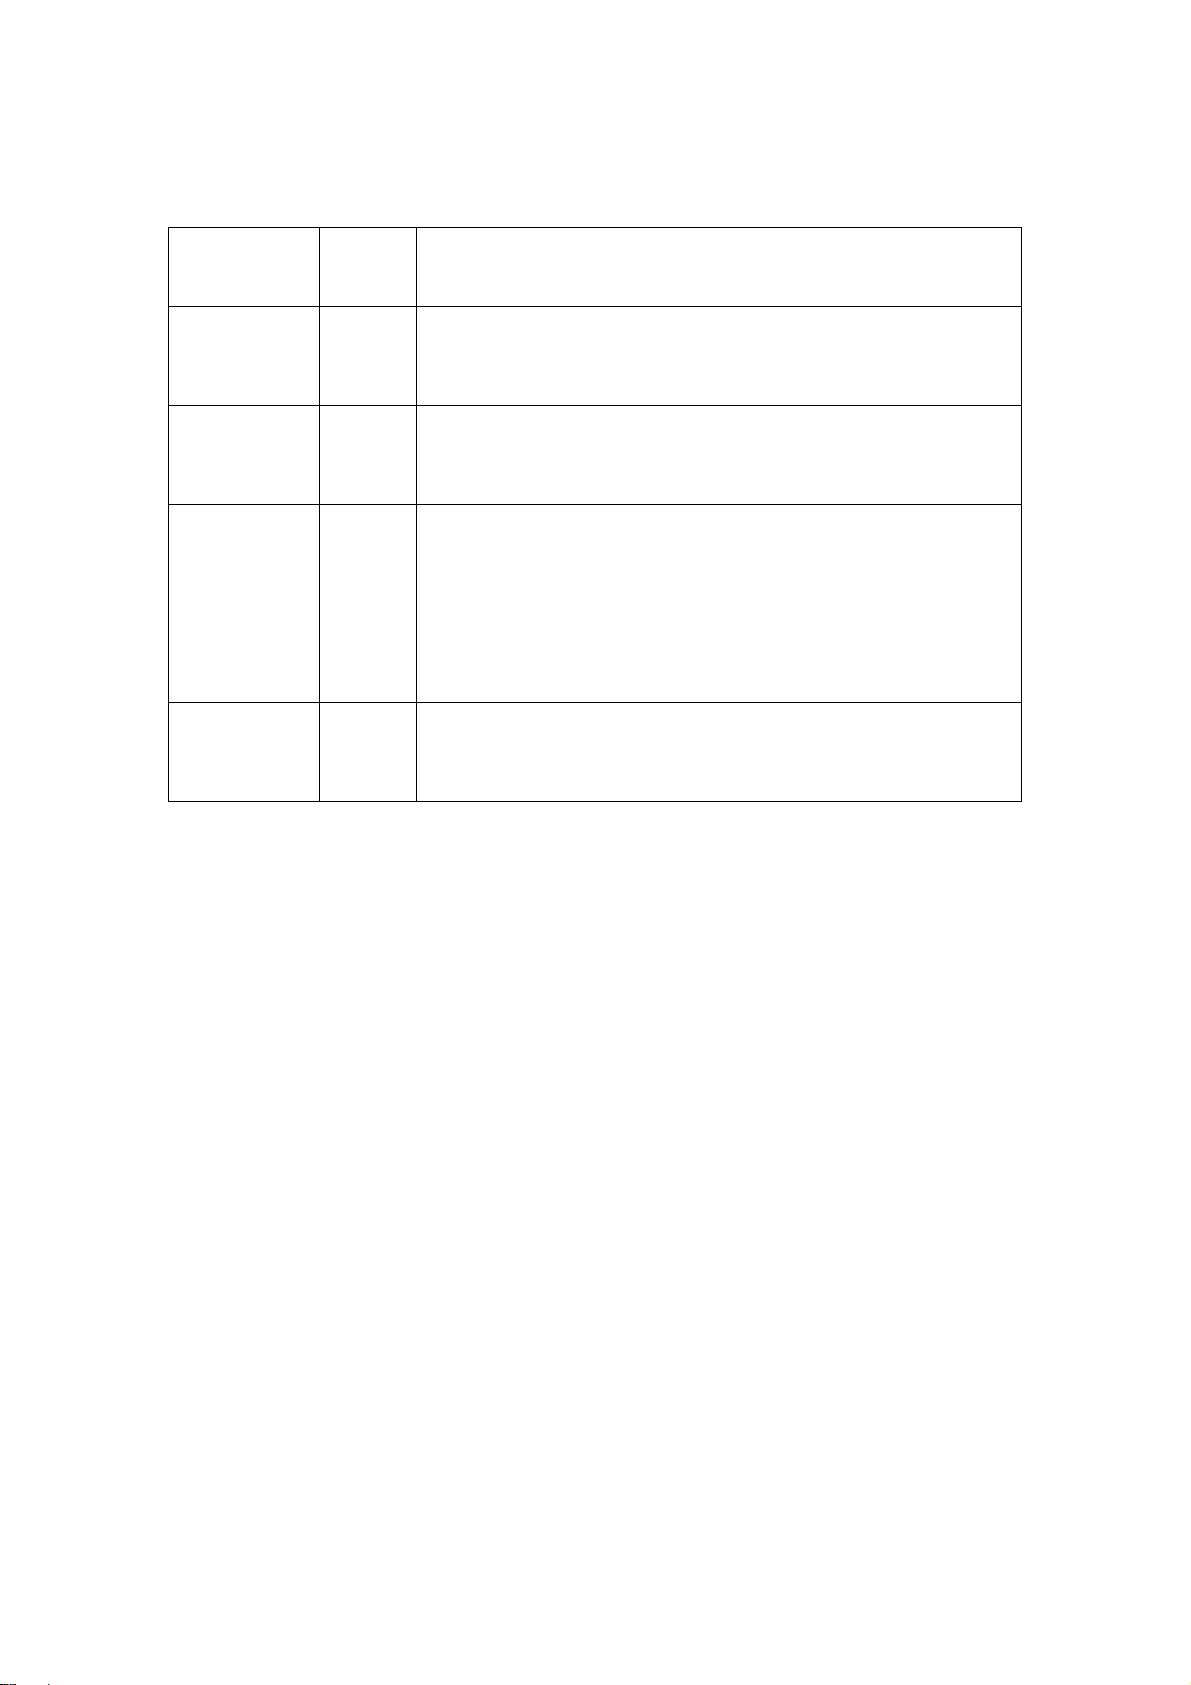
The following Table describes the Vertical Channel menu:
Function
menu
Setting
Description
AC
The dc component in the input signal is blocked
Coupling
DC
OFF
The ac and dc components of the input signal are available
Close the channel
Channel
ON
1X
10X
Open the channel
Select the desired probe attenuation
Probe
100X
1000X
OFF
Waveform is displayed normally
Inverted
ON
Open the Invert function for the waveform setting
SETTING THE CHANNEL COUPLING
CH1 will be used in this example.
Press F1 Coupling and then AC to set AC coupling. The DC component contained
in the tested signal is blocked.
Press F1 Coupling and then DC to set DC coupling. Both DC and AC components
contained in the tested signal are permitted.
Refer to Figures 20 and 21.
30
V5.1‐March2010
Page 32
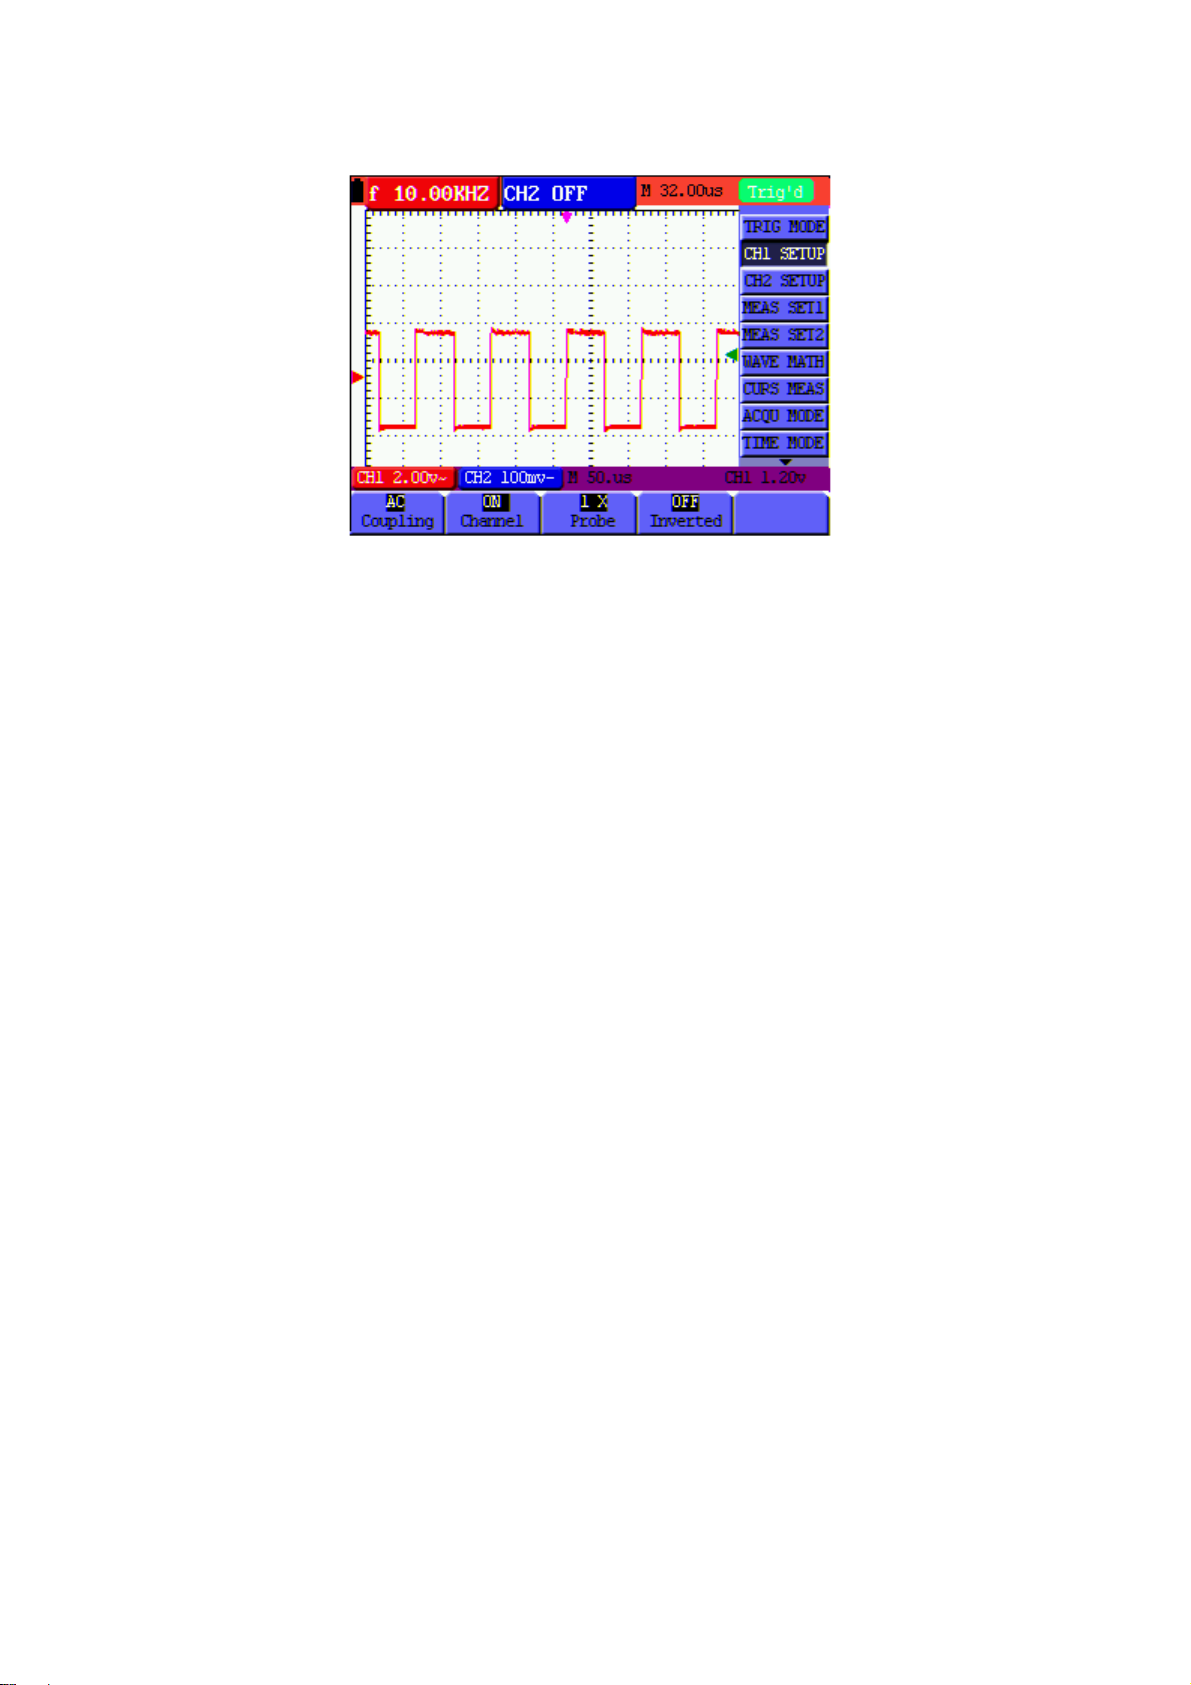
Figure 20: AC Coupling
31
V5.1‐March2010
Page 33
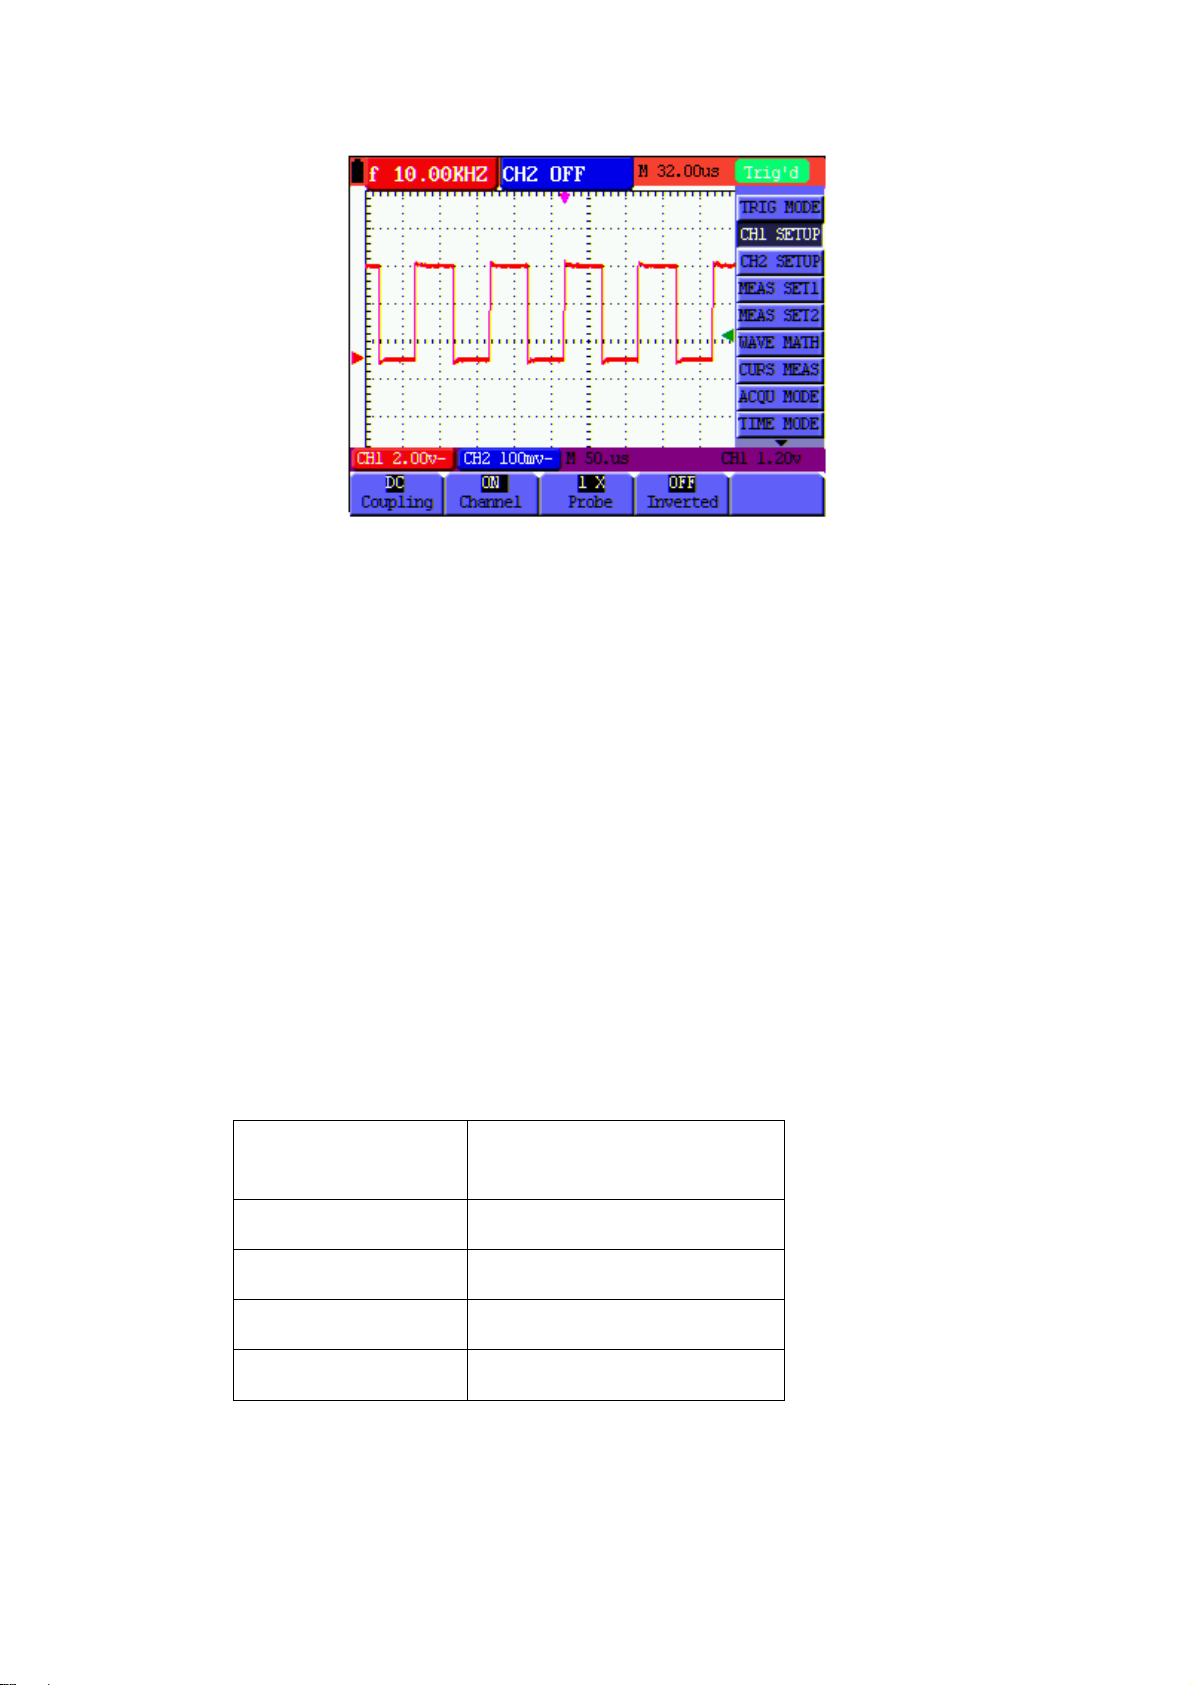
Figure 21: DC Coupling
OPEN AND CLOSE MEASUREMENT CHANNELS
CH1 will be used in this example.
Press the F2 Channel key and then OFF to Close CH1.
Press the F2 Channel key and then ON to Open CH1.
SETTING THE PROBE ATTENUATION
To prevent excessive input voltage, set the probe attenuation level to the 10X
position.
Next, magnify the display by 10X to match the displayed amplitude to the actual
amplitude.
Press F3 Probe to adjust the probe attenuation level.
Table: Probe attenuation level and the corresponding menu setting
Probe attenuation
level
1:1 1X
10:1 10X
Corresponding Menu Setting
100:1 100X
1000:1 1000X
32
V5.1‐March2010
Page 34

INVERT A WAVEFORM
Inverted waveform: The displayed signal reverses 180 degrees relative to ground.
Press F4 Invert to invert the waveform; press F4 Invert again to exit the inversion
mode.
33
V5.1‐March2010
Page 35
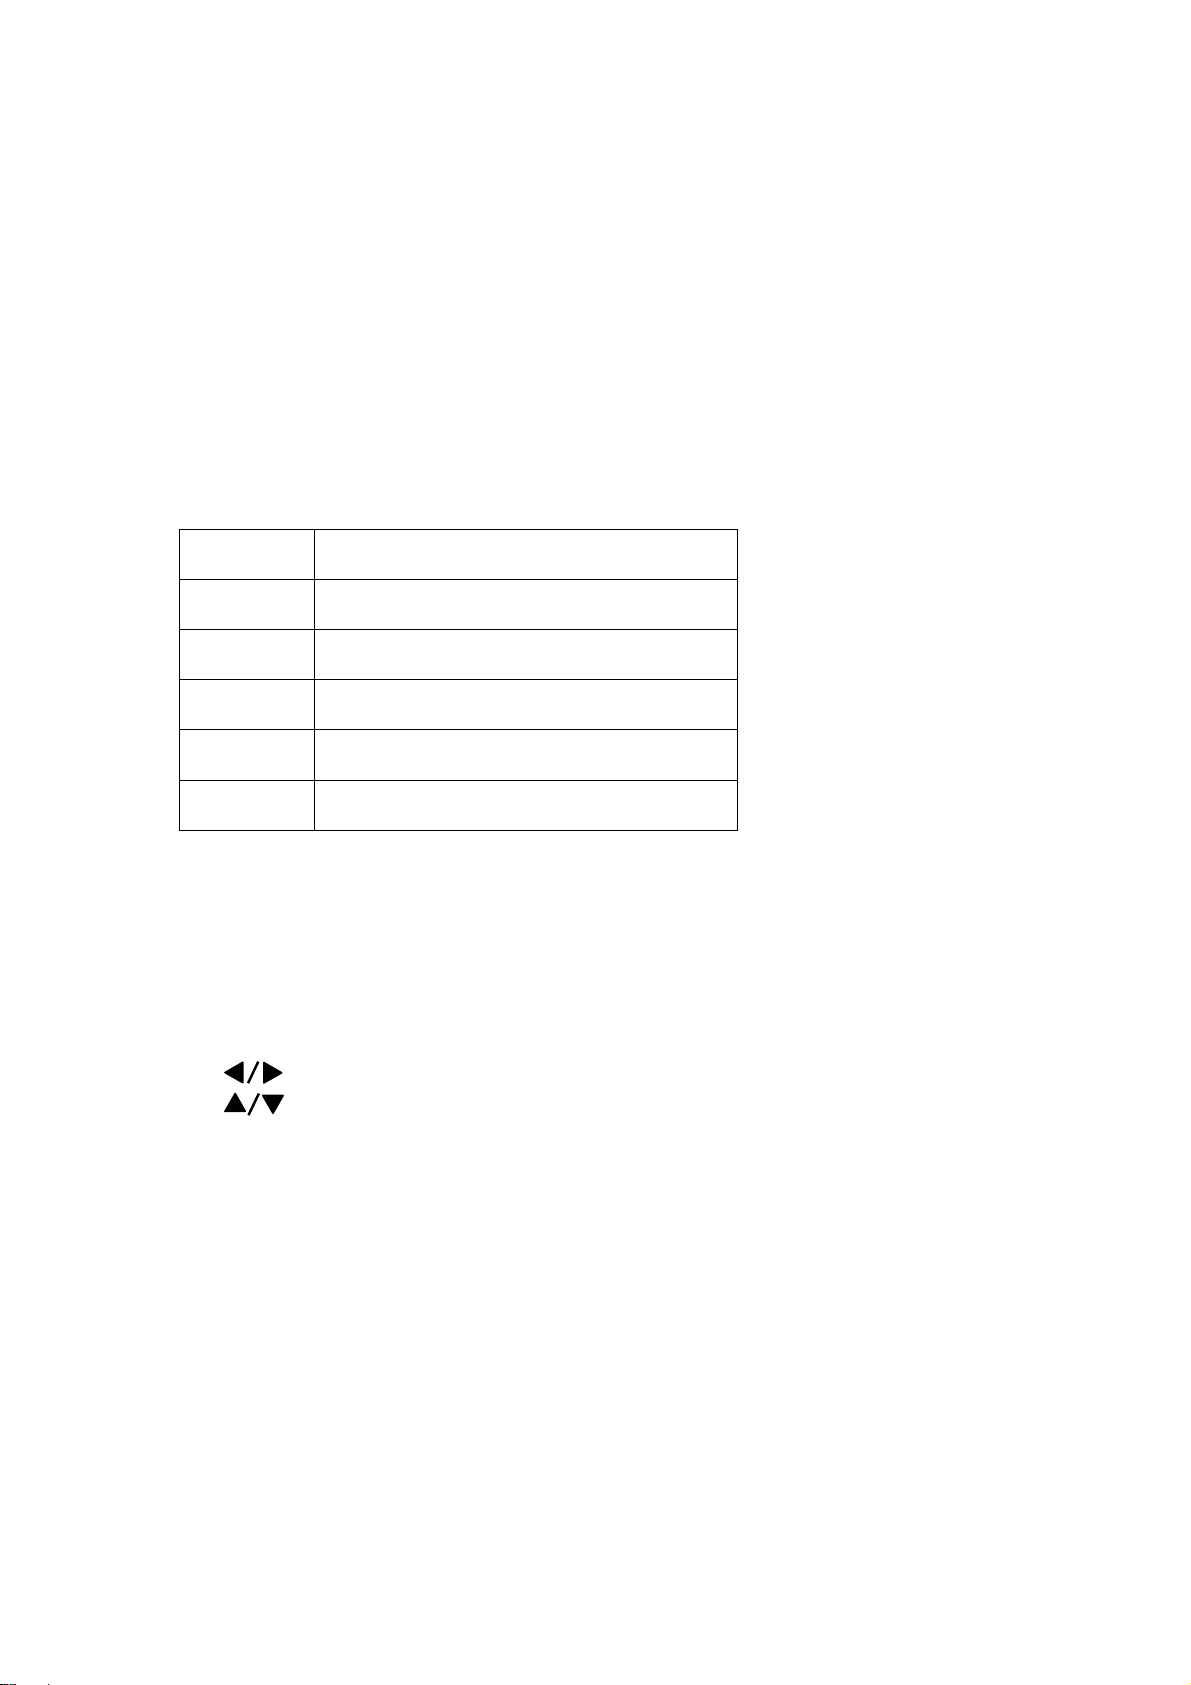
WAVEMATHFUNCTIONMENUSETTINGS
The WAVE MATH functions show the calculation results (adding, subtracting,
multiplying or dividing CH1 and CH2 channel waveforms). Arithmetic operation
results can be displayed using a grid or a cursor. The amplitude of the calculated
waveform can be adjusted with CHM VOL, which is displayed in the scale factor
form. The amplitude ranges from 0.001 through 10 (in 1, 2, and 5 step increments)
that is, it can be expressed as 0.001X, 0.002X, 0.005X…10X. The position of the
calculated waveform can be adjusted up and down using the CHM ZERO key.
The corresponding operation function table
Setting Description
CH1-CH2 CH1 waveform minus CH2 waveform
CH2-CH1 CH2 waveform minus CH1 waveform
CH1+CH2 Add CH1 waveform to CH2 waveform
CH1*CH2 Multiply CH1 and CH2 waveforms
CH1/CH2 Divide CH1 by CH2
To perform a CH1+CH2 waveform calculation, perform the following:
1. Press the MENU key; the function menu will appear at the right of the screen.
2. Press MENU ▲ or MENU ▼ to select WAVE MATH. Five (5) selectable options will
then be displayed at the bottom of the screen.
3. Press the F3 CH1+CH2 key and waveform M appears on the screen. Press the F3
key again to close waveform M.
4. Press OPTION and the display will show the following:
— CH Math Volts/Div
— CH M Zero
Press ◄
Press ▲
Refer to Figure 22.
(yellow) or ► (yellow) to adjust the range of the M waveform
(yellow) or ▼ (yellow) to adjust the position of the M waveform
34
V5.1‐March2010
Page 36
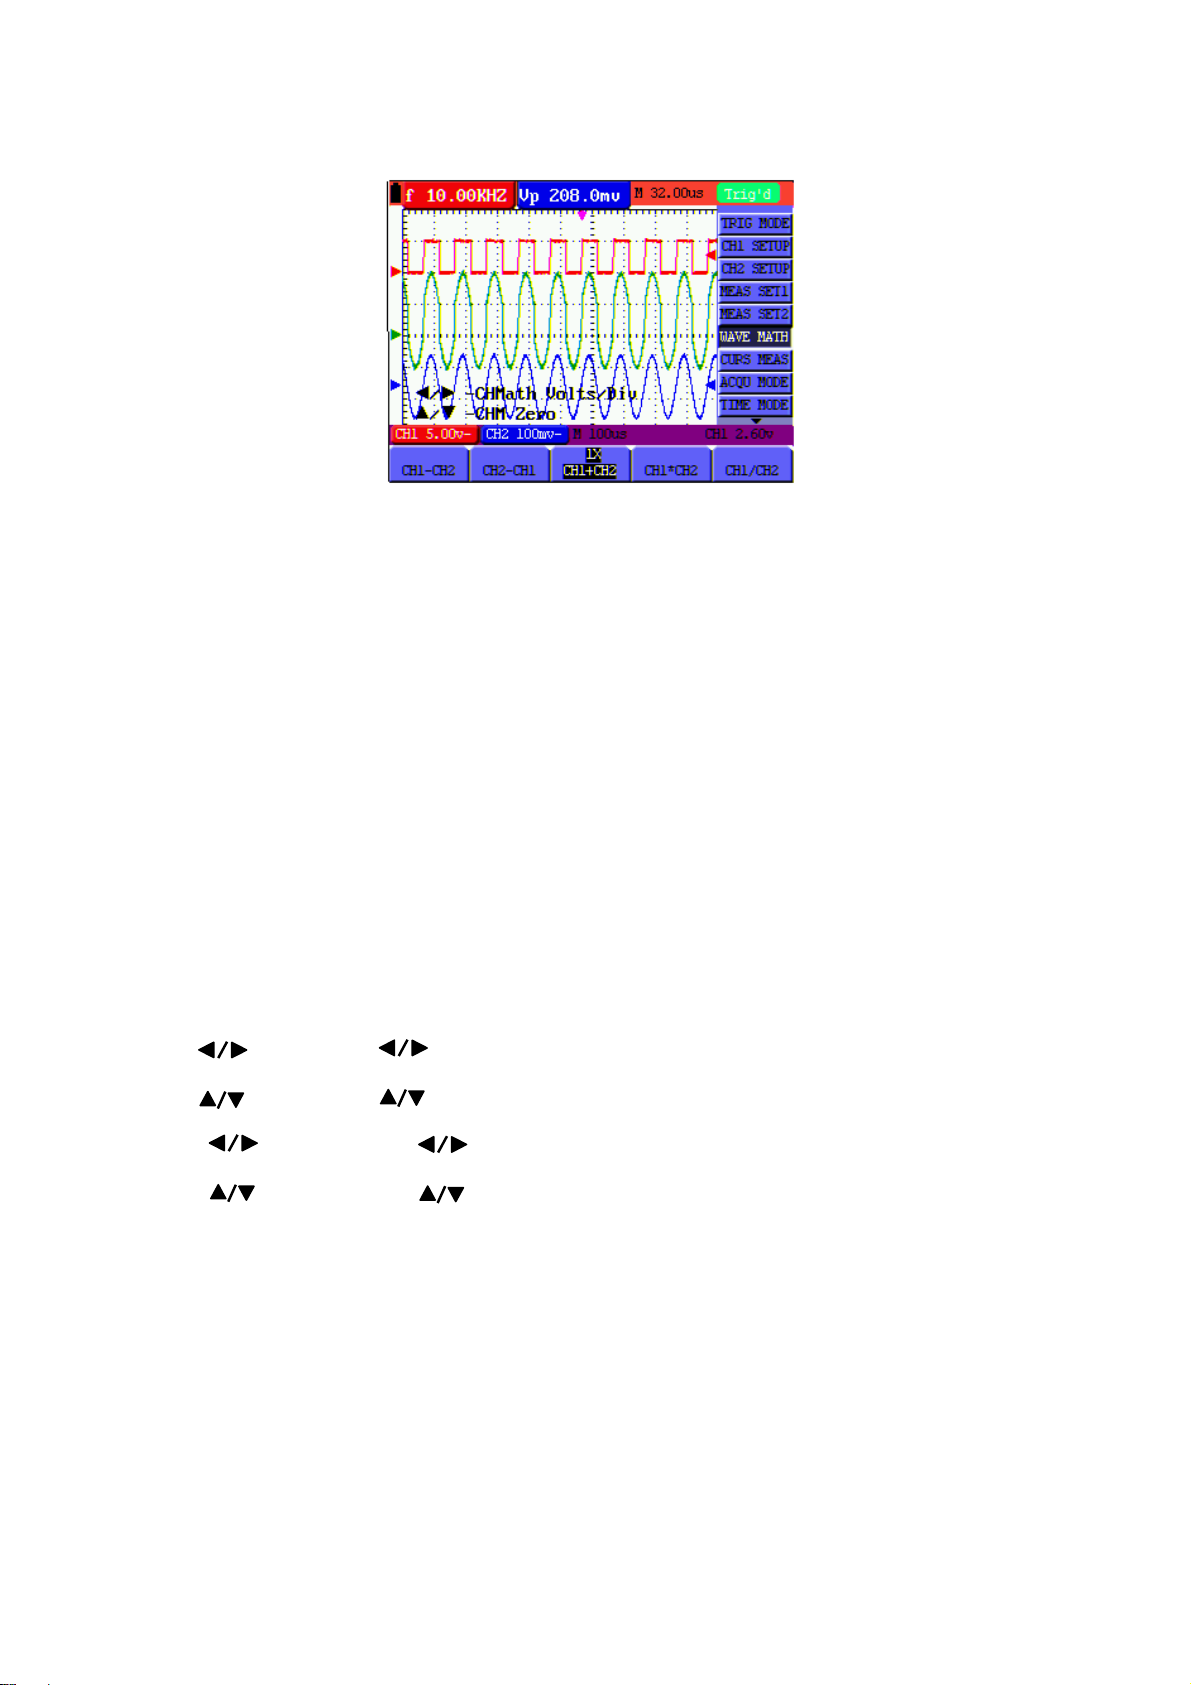
Figure 22: Waveform Mathematics
SETTINGTHETRIGGERSYSTEM
The trigger determines when the acquisition and display of waveform data occurs. When
starting to acquire data, the oscilloscope collects sufficient information to draw the
waveform at the left side of the triggering point. While waiting for a triggering condition,
the oscilloscope gathers data continuously. After a trigger is detected, the oscilloscope
gathers data continuously to draw the waveform at the right side of the triggering point.
To set a trigger mode, perform the following steps:
1. Press the MENU key; the function menu will appear at the right of the screen.
2. Press MENU ▲ or MENU ▼ to select TRIG MODE. Five (5) selectable options will
then be available at the bottom of the screen.
3. Use the soft-keys (F1 to F5) to select and configure the desired options.
4. Press OPTION; the following will appear on the display during edge triggering and
video triggering modes:
— Time — Time Base
— Trig — Trig
During alternate triggering the following will be displayed:
—Time Base — Time
—Trig1 — Trig2
5. Press ▲
(yellow) or ► (yellow) to adjust the time base horizontal position or adjust the
horizontal position.
(yellow) or ▼ (yellow) to adjust the vertical trigger position, Press ◄
35
V5.1‐March2010
Page 37
TRIGGERINGCONTROL
There are three triggering modes: Edge triggering, Video triggering, and Alternating
triggering. Each trigger mode has its own function menu.
Edge triggering: The edge trigger triggers on the incoming signal edge. Use the
edge trigger for all signals except for video.
Video triggering: Perform video field trigger or line trigger on standard video signals.
Alternate trigger: Use this mode when the CH1 and CH2 signal frequency differs.
The following describes the Edge triggering, Video triggering and Alternating
triggering menus respectively.
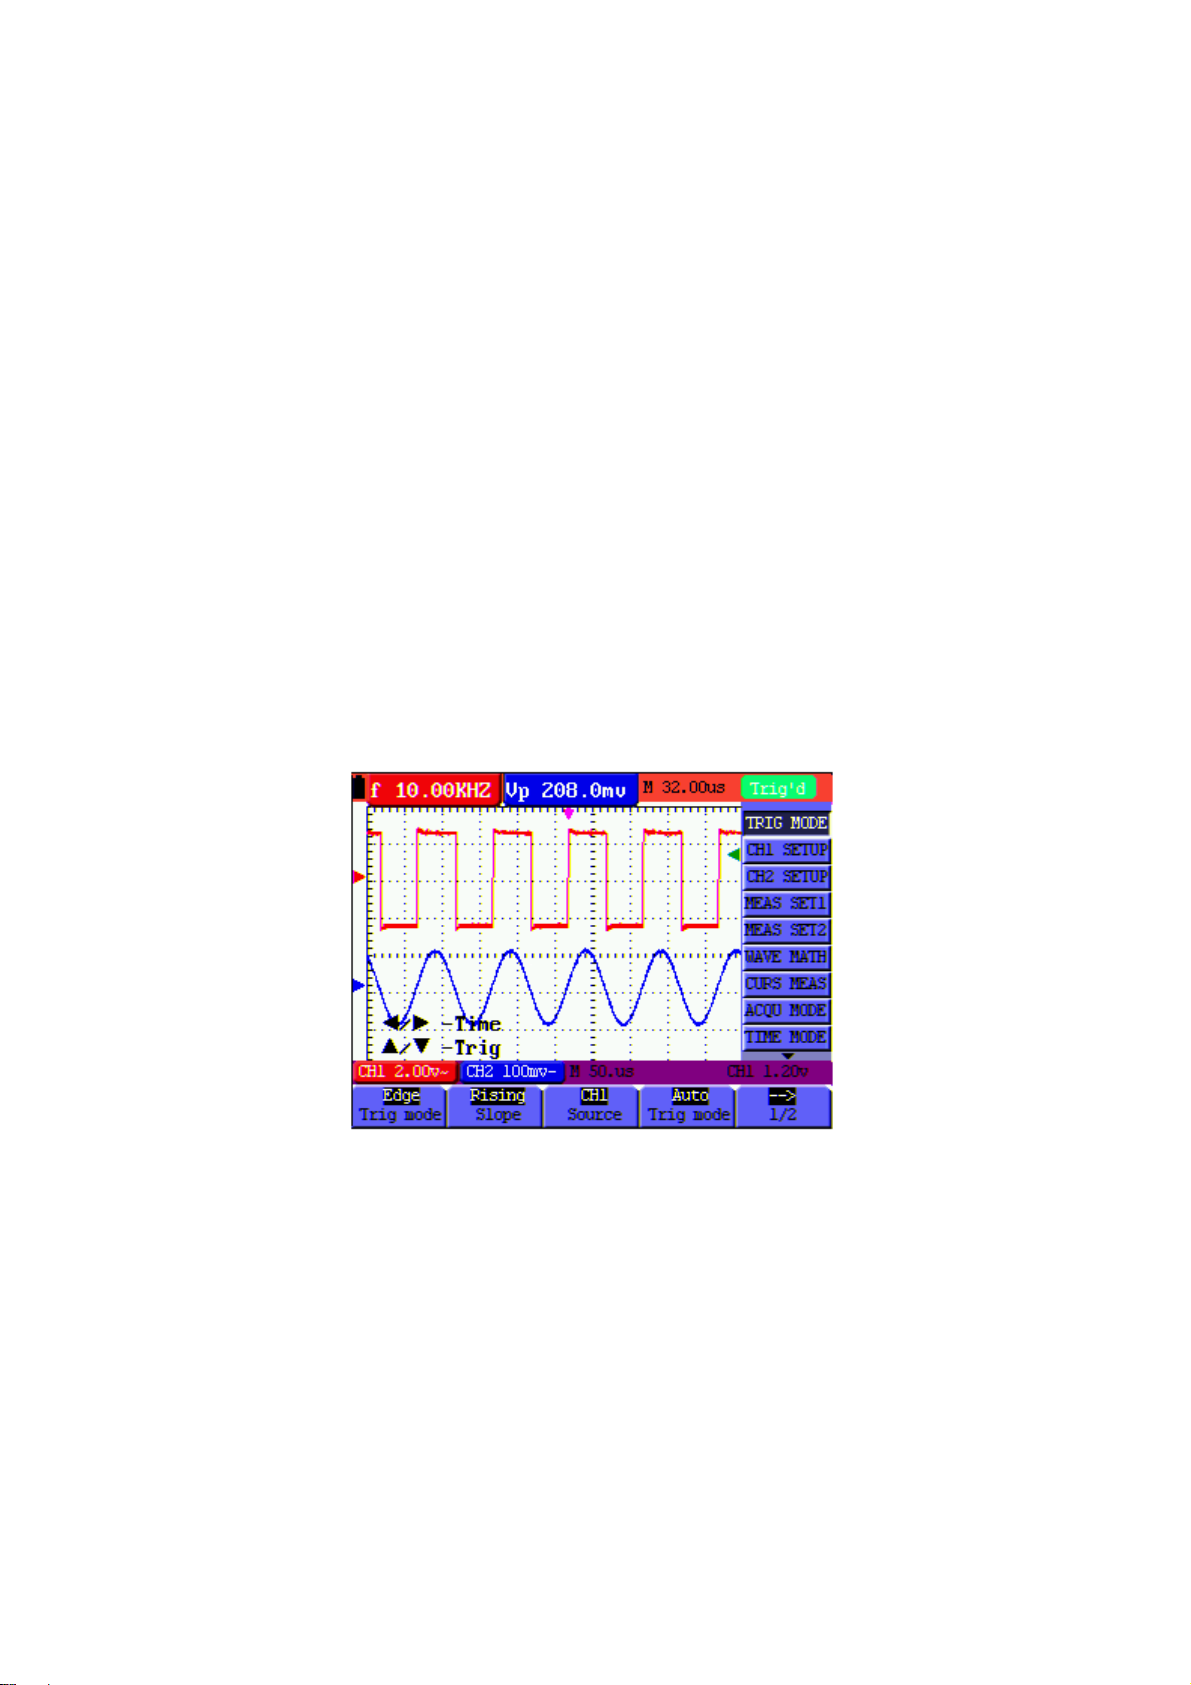
EDGE TRIGGERING
Edge triggering is a mode by which triggering occurs at the threshold of the input signal’s
edge. With Edge triggering selected, the trigger occurs on the rising or falling edge of
the input signal (Figure 23).
Figure 23: Edge Trigger
36
V5.1‐March2010
Page 38
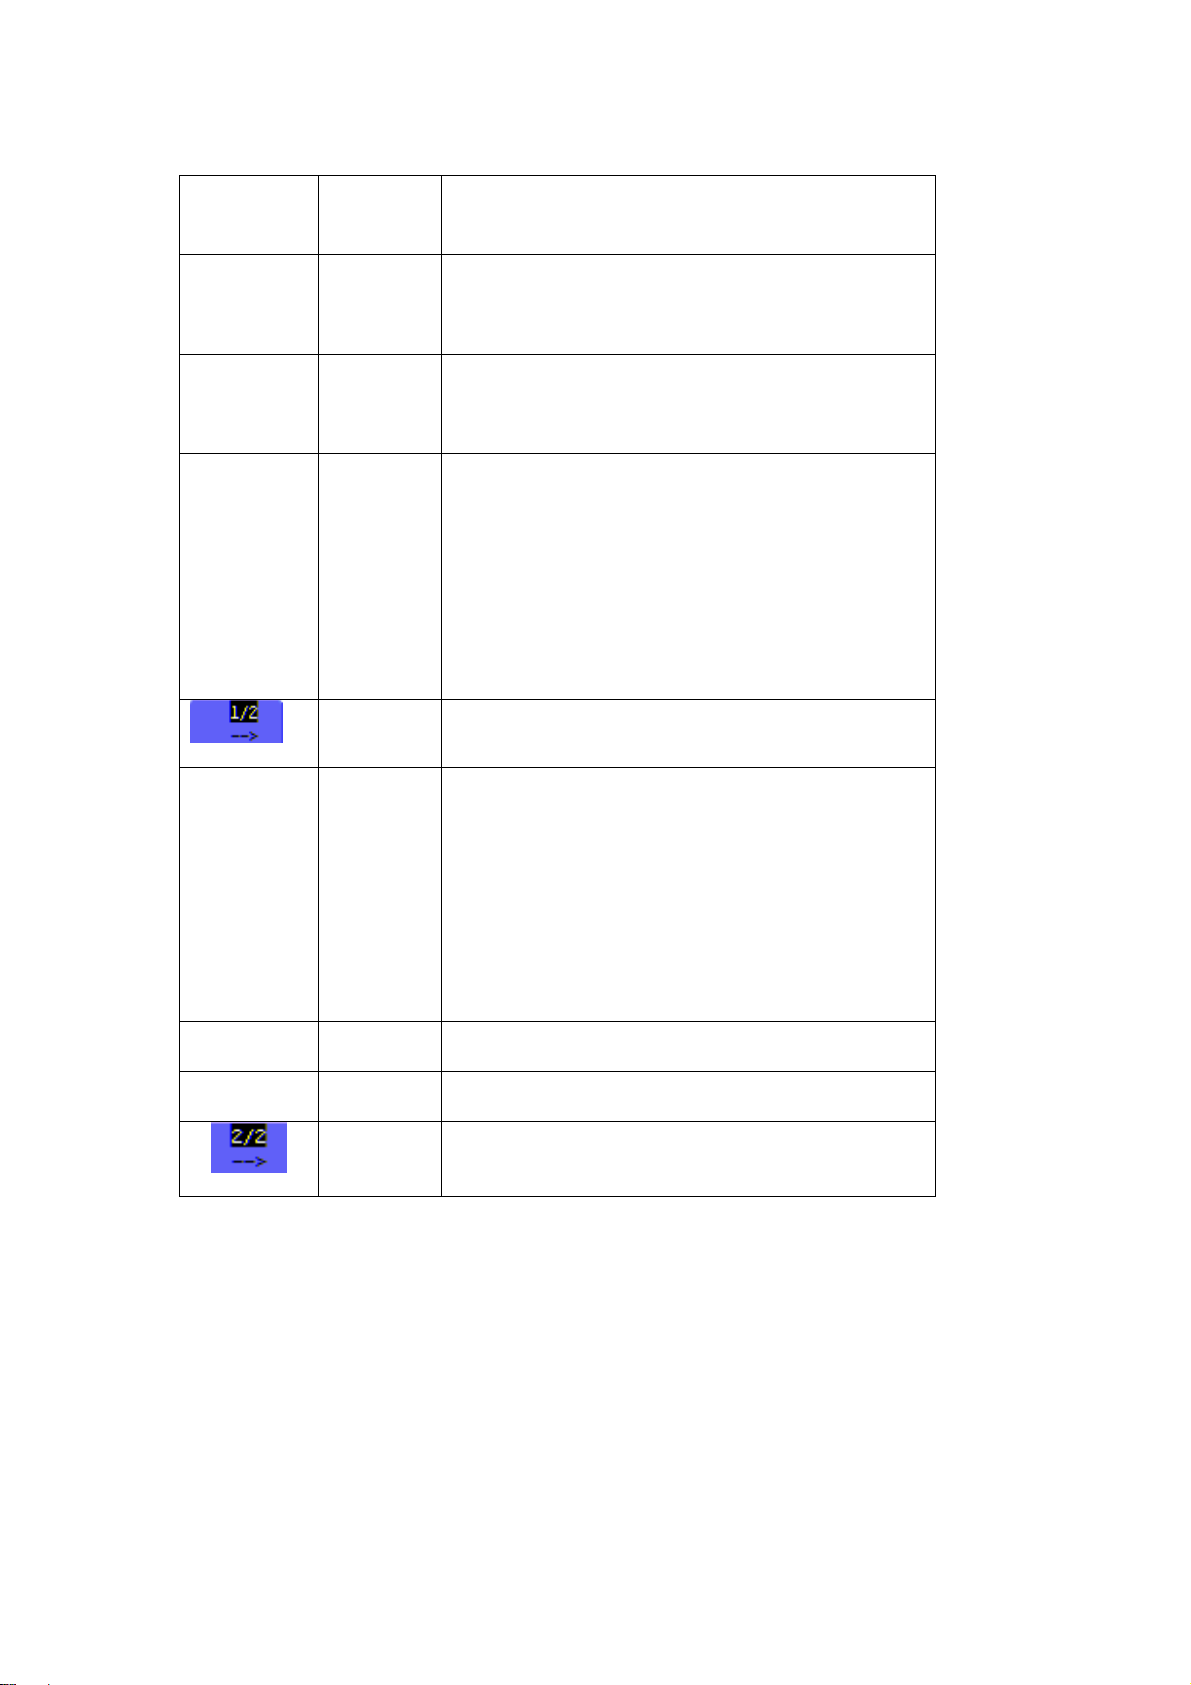
The Edge triggering menu is described in the following table
Function
Settings
Description
menu
Slope Rising
Falling
Source CH1
CH2
Trig mode Auto
Triggering on the rising edge of the signal
Triggering on the falling edge of the signal.
CH1 is used as the trigger source
CH2 is used as the trigger source
Acquisition of waveforms is possible even if
there is no triggering condition detected
Acquisition of waveforms can only be performed
Normal
Single
when the triggering condition is satisfied
Sampling is performed on a waveform when one
trigger is detected (sampling then stops).
Move to the next menu
Coupling AC
DC
The DC component is blocked
All components are allowed
HF Rjc
HF part of the signal is blocked; only the LF
component is allowed
The LF part of the signal is blocked; only the HF
LF Rjc
component is allowed
SENS Trigger sensitivity*
Hold-off Move to the Hold-off menu
Return to previous menu
*Sensitivity: Sensitivity is an adjustment that allows the meter to obtain a stable
trigger by excluding the influences of signal noise. The sensitivity is adjustable from
0.2div~1.0div.
VIDEO TRIGGERING
The video trigger is designed to capture a video signal format, NTSC, PAL or SECAM.
For any other signal type, use the Edge trigger mode. Refer to Figure 24a & b, Figure 25
and Figure 26.
37
V5.1‐March2010
Page 39
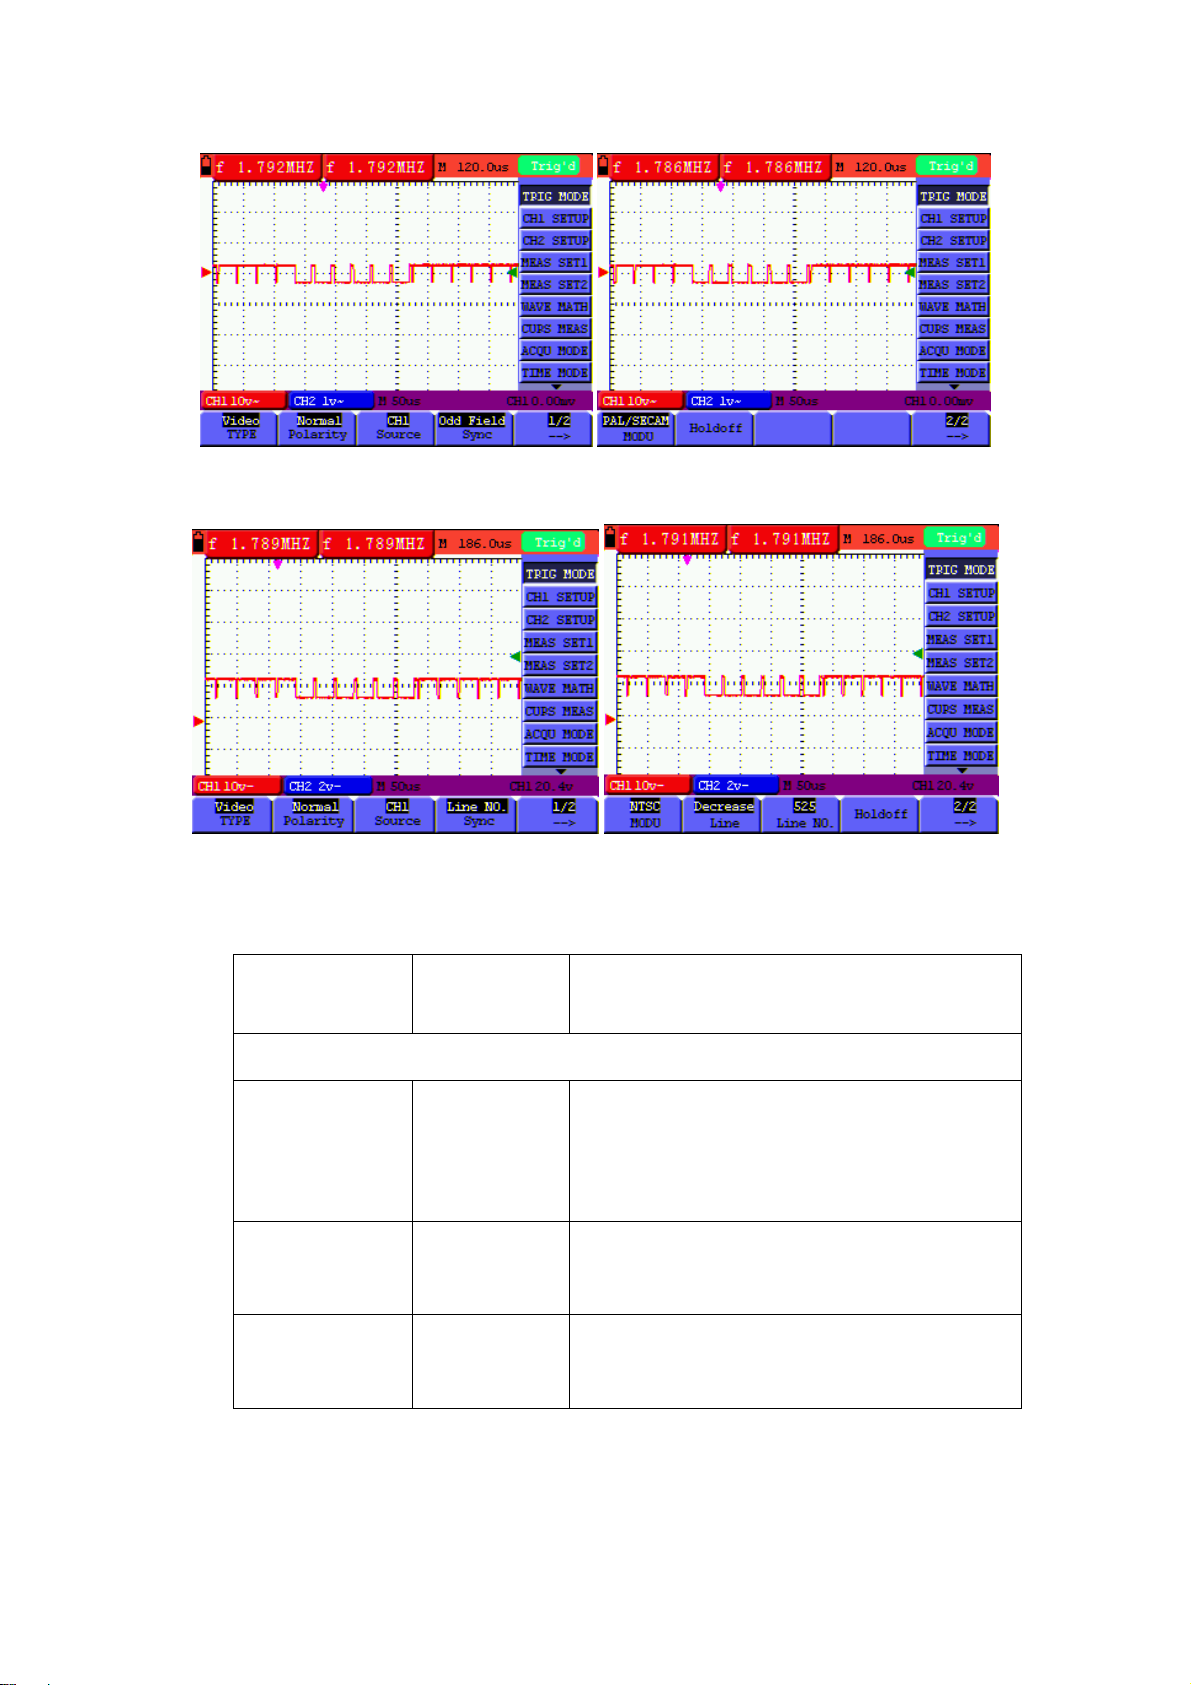
Figure 24a (screen 1) and 24b (screen 2): Odd Field Video Trigger
Fig. 25: Video Line trigger (screen 1) Fig. 26: Video Line Trigger (screen 2)
The Video triggering menu is described in the following table.
Function
menu
First screen
Polarity
Source
Sync
(Synchronization)
Settings Description
Normal
For video signals with low black levels
For video signals with high black levels
Inverted
CH1
CH2
Line
Field
Select CH1 as the trigger source
Select CH2 as the trigger source
Set synchronous trigger in video line
Set synchronous trigger in video field
38
V5.1‐March2010
Page 40
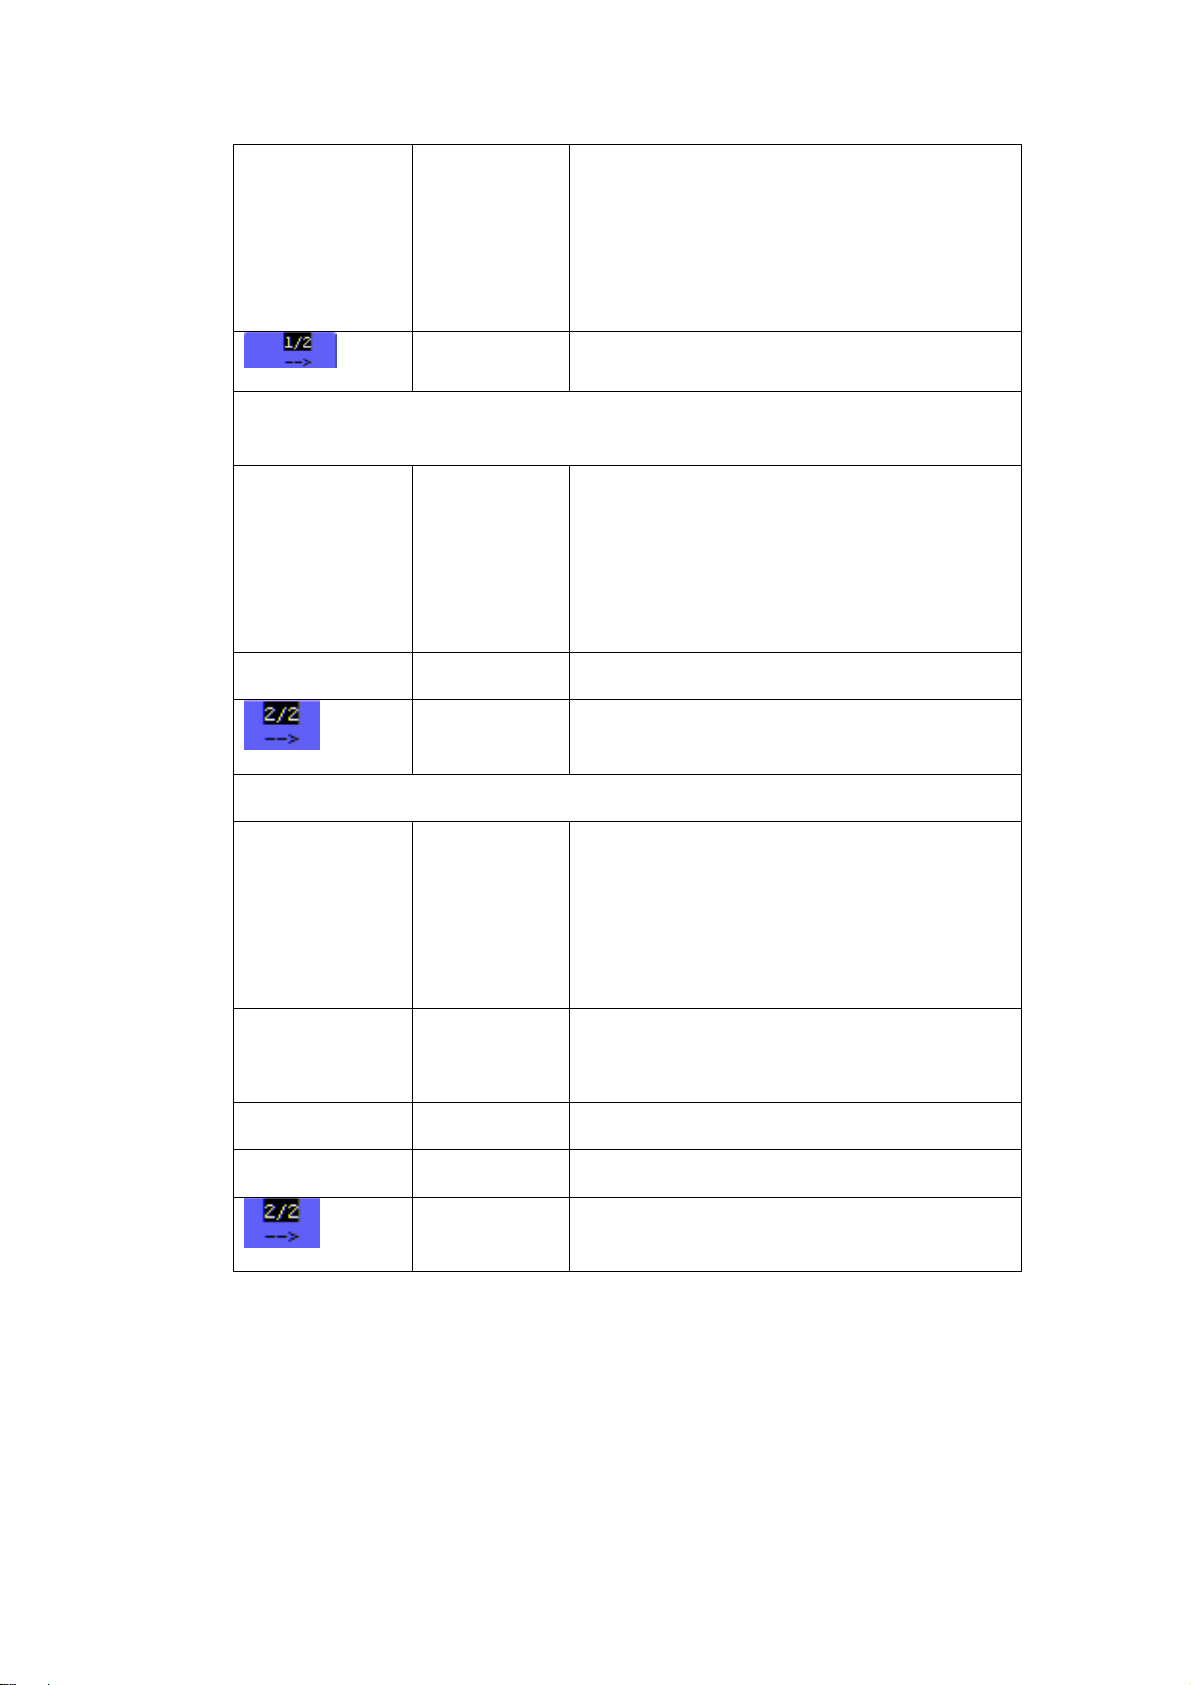
Odd field
Even field
Line NUM
Set synchronous trigger in video odd line
Set synchronous trigger in video even line
Set synchronous trigger in video Line NUM
Move to next menu
When the sync is Line, Field, Odd Field, Even Field, the second page is as
follows:
NTSC
MODU
(Modulation)
PAL/SECAM
National Television System Committee standard
(most common)
Less common video standard (used in Europe)
Hold-off Move to the Hold-off menu
Return to previous menu
When the sync is Designed Line, the second page is as follows:
MODU
(Modulation)
Line
NTSC
PAL/SECAM
Increase
Decrease
National Television System Committee standard
(most common)
Less common video standard (used in Europe)
The Line value will increase
The Line value will decrease
Line No. Set and show the Line value
Hold-off Move to the Hold-off menu
Return to previous menu
39
V5.1‐March2010
Page 41
ALTERNATE TRIGGER
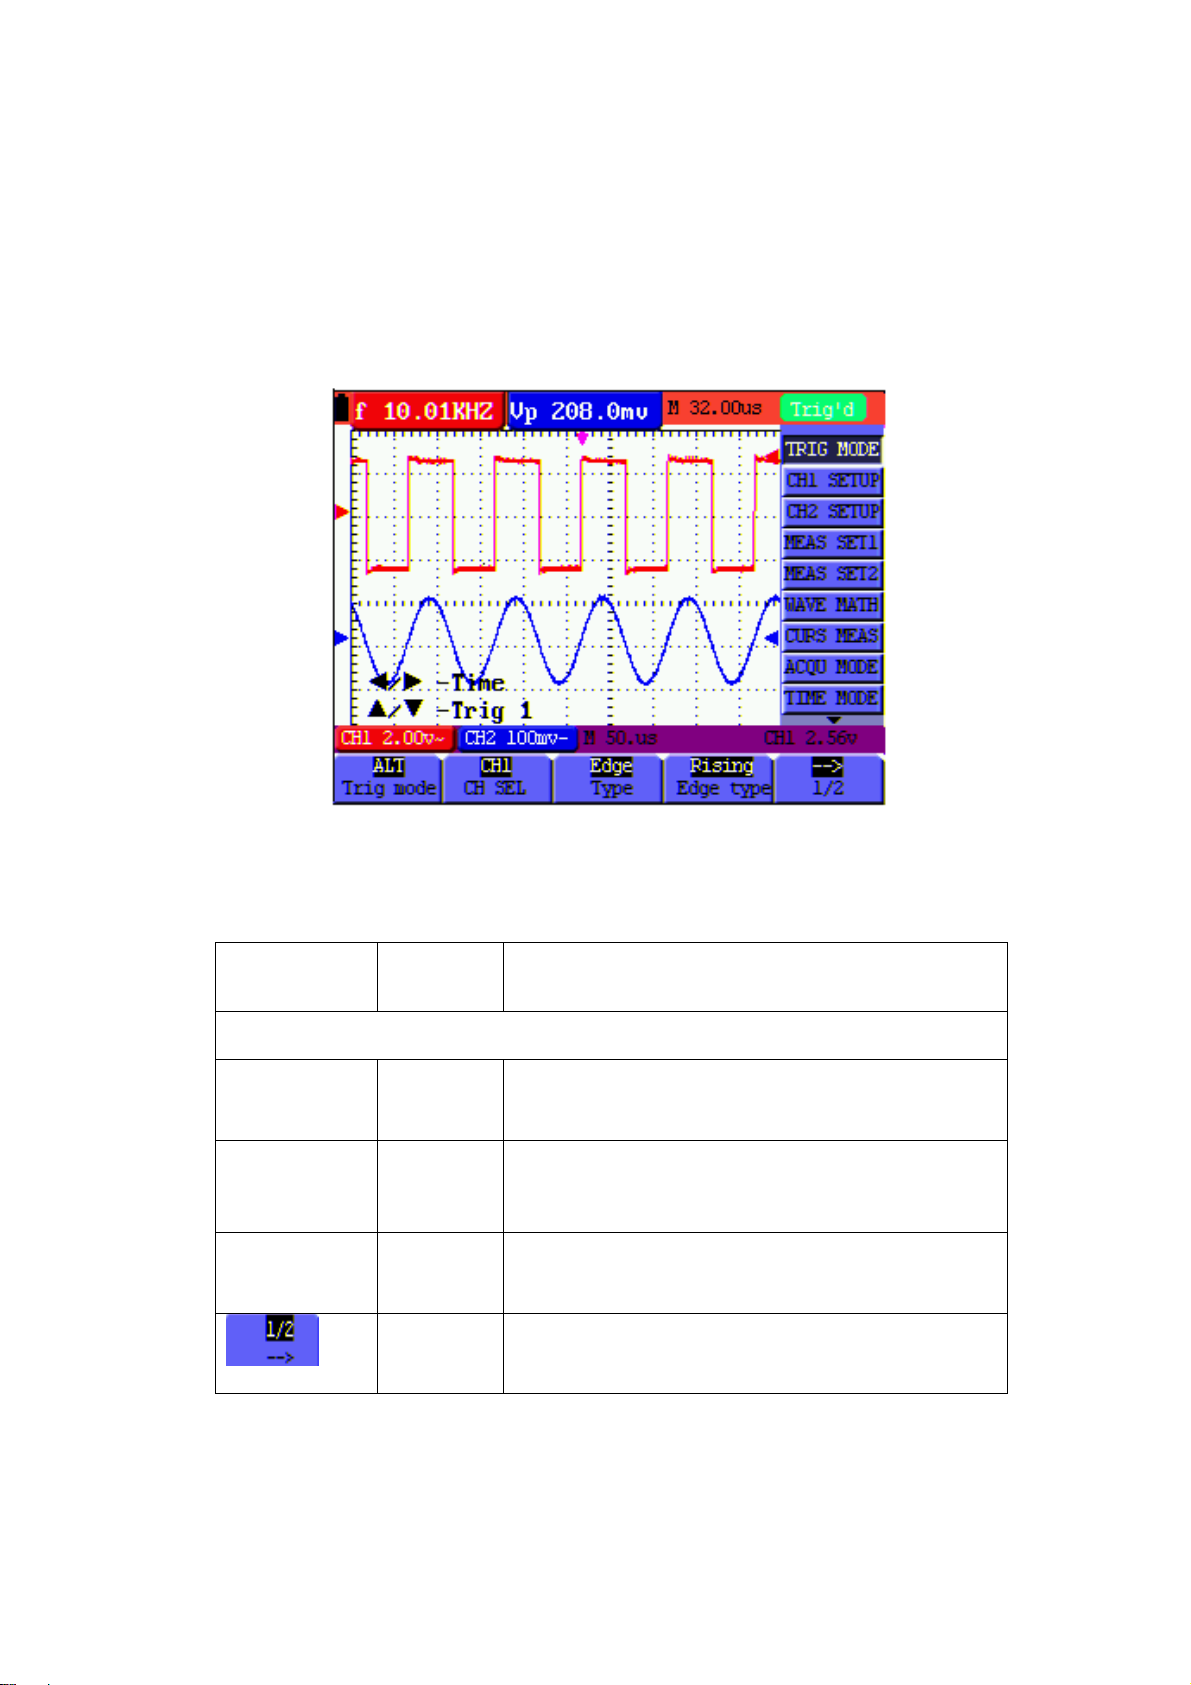
In Alternate trigger mode, the trigger signal is taken from two vertical channels. Alternate
trigger mode can be used to observe two signals of differing frequencies. From this menu
the user can set a different trigger type for two separate vertical channels.
Refer to Figure 27a.
Figure 27a: Alternate Trigger
The Alternate triggering menu is described in the following tables.
Function
Settings Description
menu
When EDGE TRIGGERING is selected:
CH SEL CH1
CH2
Type Edge
Video
Edge type Rising
Falling
Set trigger type and other parameters for Channel 1
Set trigger type and other parameters for Channel 2
Set vertical channel trigger as edge trigger
Set vertical channel trigger as video trigger
Triggering on the rising (leading) edge of the signal
Triggering on the falling (trailing) edge of the signal
Move to the next menu
40
V5.1‐March2010
Page 42
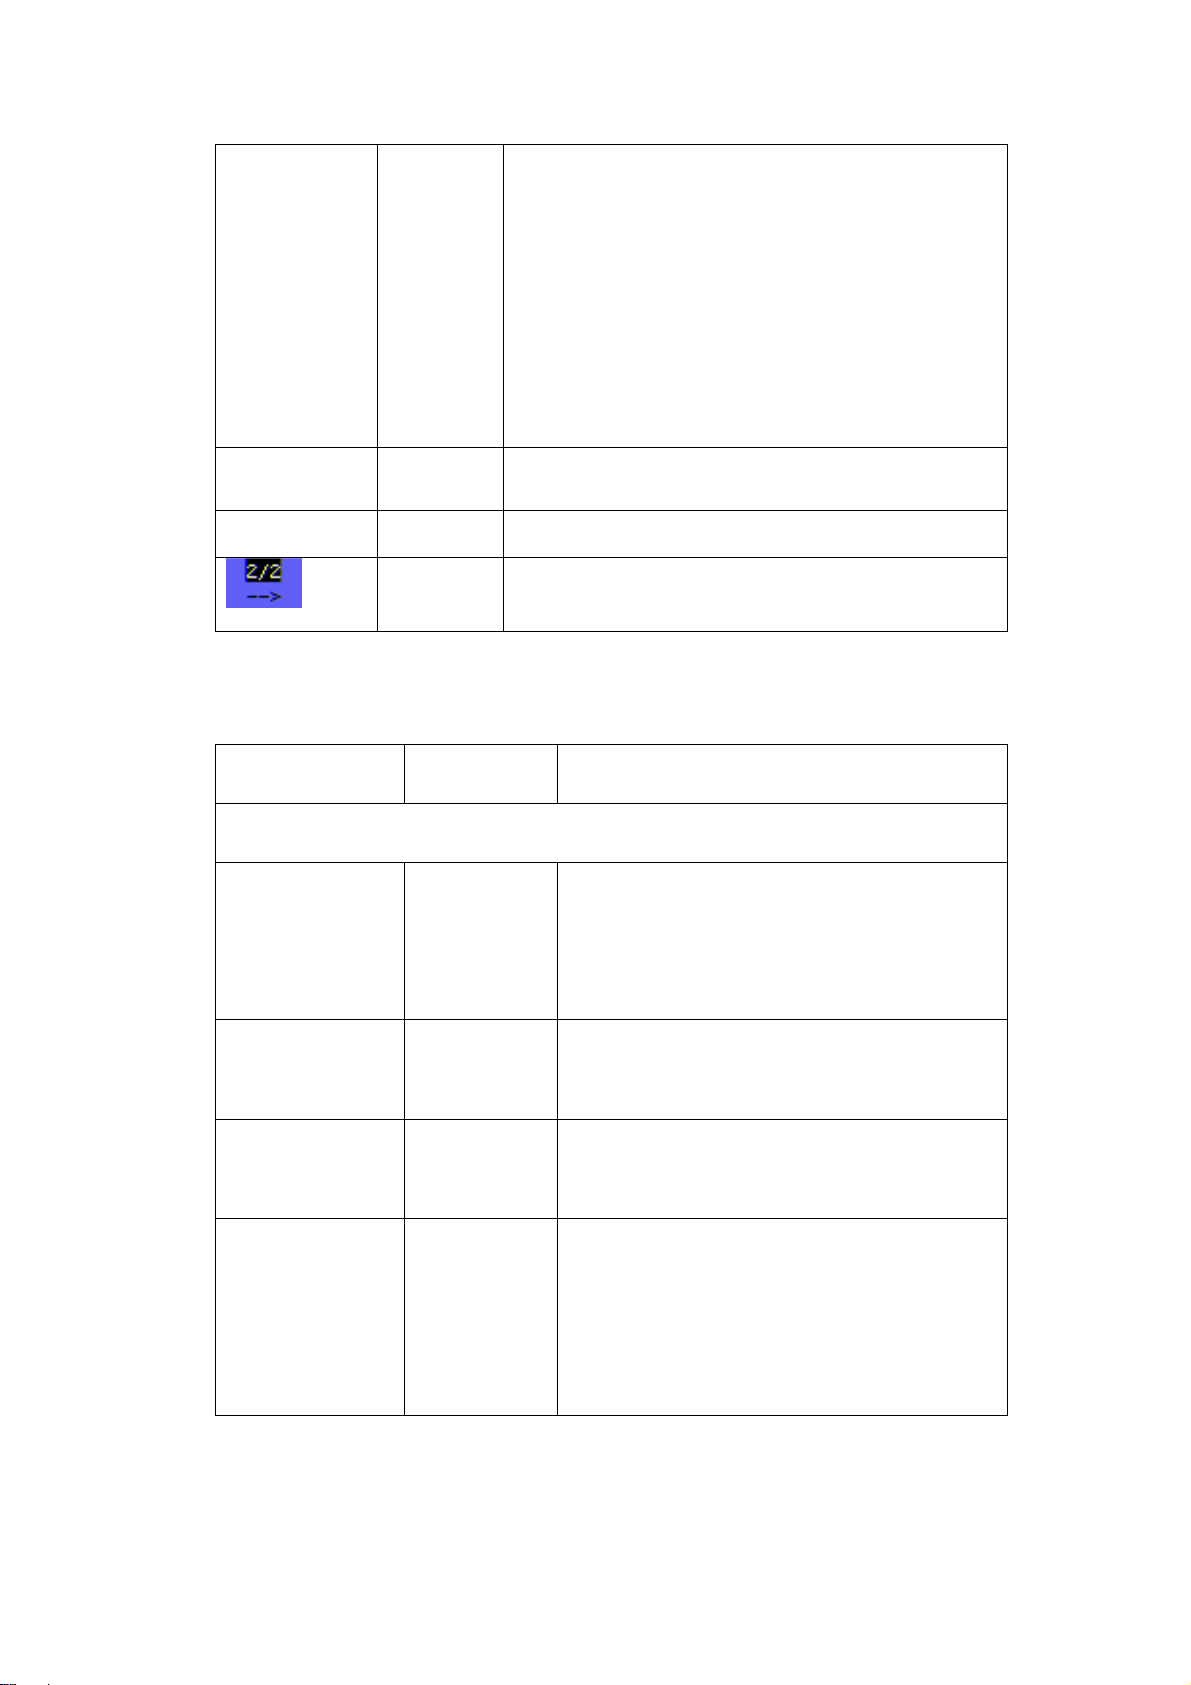
Coupling
AC
DC
HF Rjc
The DC component is blocked
All components are allowed to pass
The HF part of the signal is blocked and only the
LF component is allowed
The LF part of the signal is blocked and only the
LF Rjc
SENS
Hold-off Move to the Hold-off menu
Set trigger sensitivity
Return to previous menu
HF component is allowed
Function menu Settings Description
When VIDEO TRIGGERING is selected:
CH SEL CH1
Set trigger type and other parameters for
CH1
CH2
Set trigger type and other parameters for
CH2
Type Edge
Video
Video type
Polarity
Sync
(Synchronization
Normal
Inverted
Line
Field
Set vertical channel trigger as edge trigger
Set vertical channel trigger as video trigger
For video signals with low black level
For video signals with high black level
Set synchronous trigger in video line
Set synchronous trigger in video field
)
Odd field
Set synchronous trigger in video odd line
Even field
Set synchronous trigger in video even line
41
V5.1‐March2010
Page 43
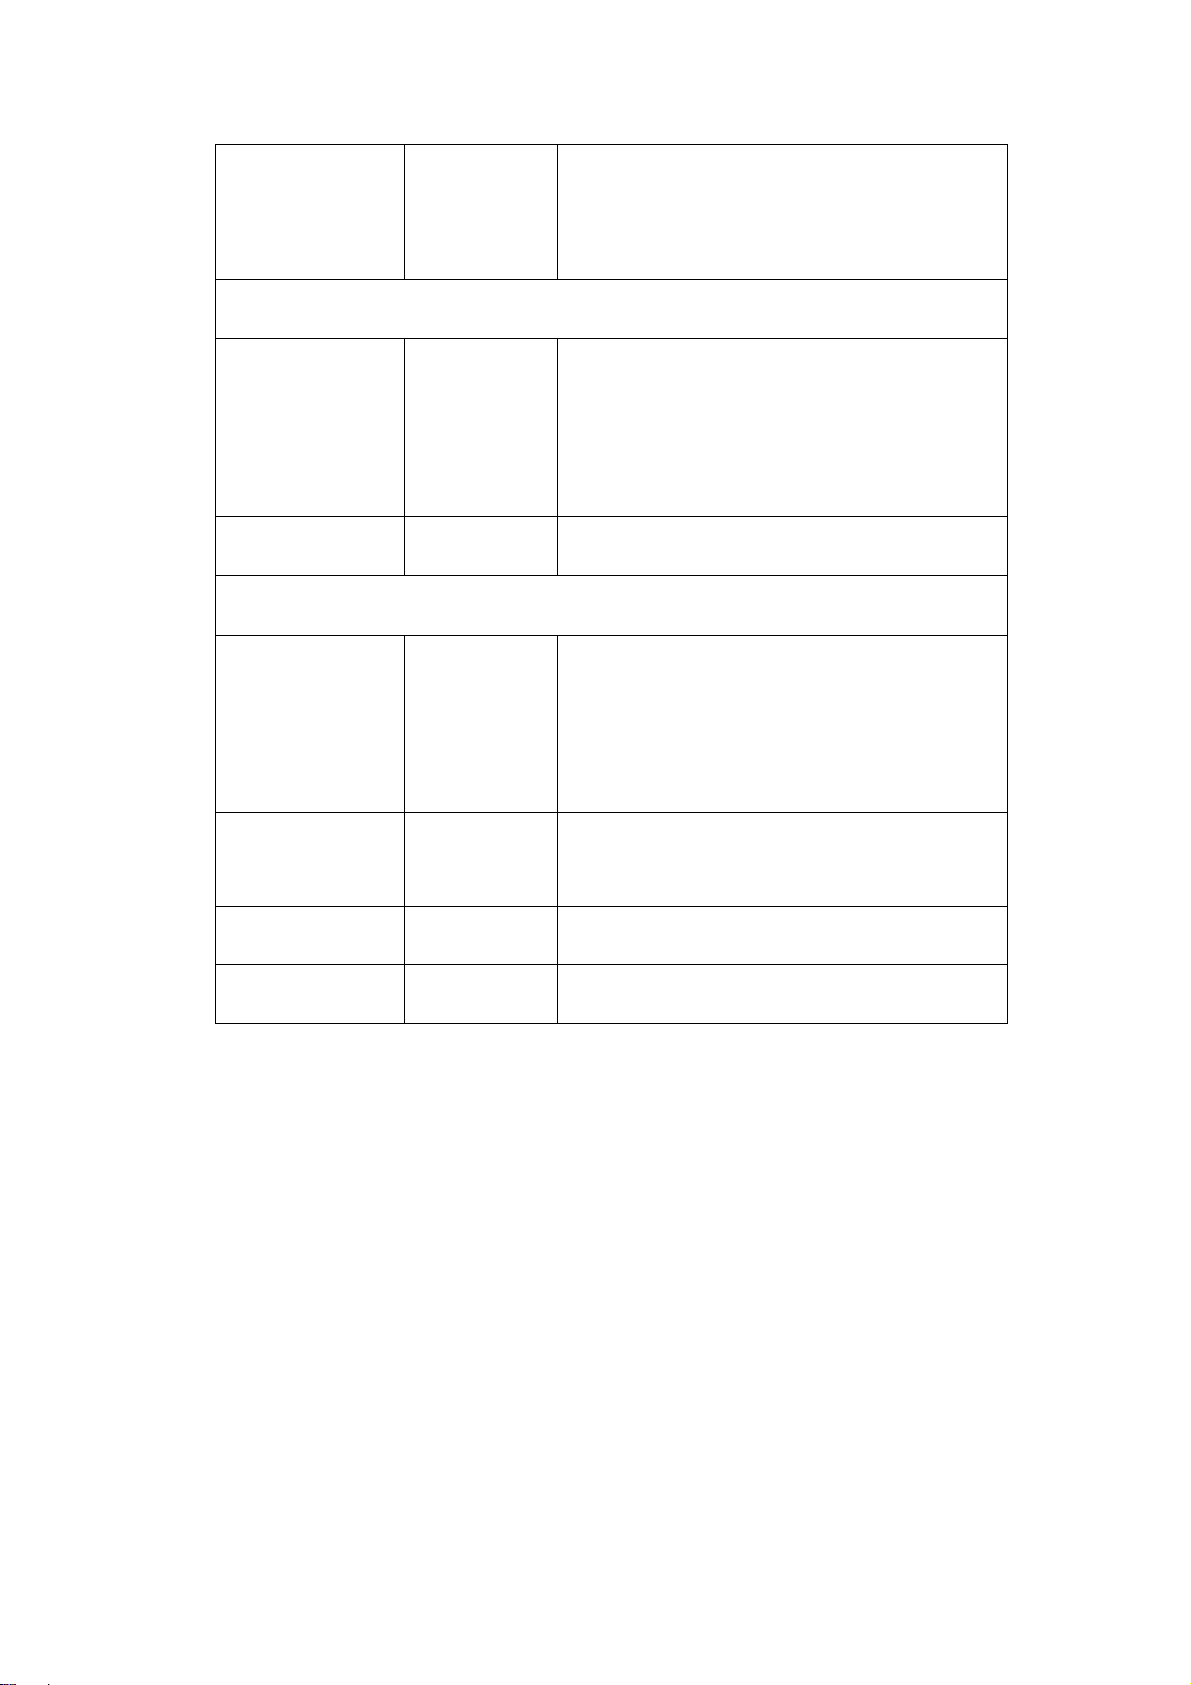
Line NUM
Set synchronous trigger in video Line NUM
When the sync is Line, Field, Odd Field, Even Field, the menu is as follows:
MODU
(Modulation)
NTSC
PAL/SECAM
Common video standard (used in the U.S.)
Least common standard (common in
Europe)
Hold-off Move to the Hold-off menu
When the sync is Designed Line, the menu is as follows:
MODU
(Modulation)
NTSC
PAL/SECAM
Common video standard (used in the U.S.)
Least common standard (common in
Europe)
Line
Line No. Set and show the Line value
Hold-off Move to the Hold-off menu
Increase
Decrease
The Line value will increase
The Line value will decrease
42
V5.1‐March2010
Page 44
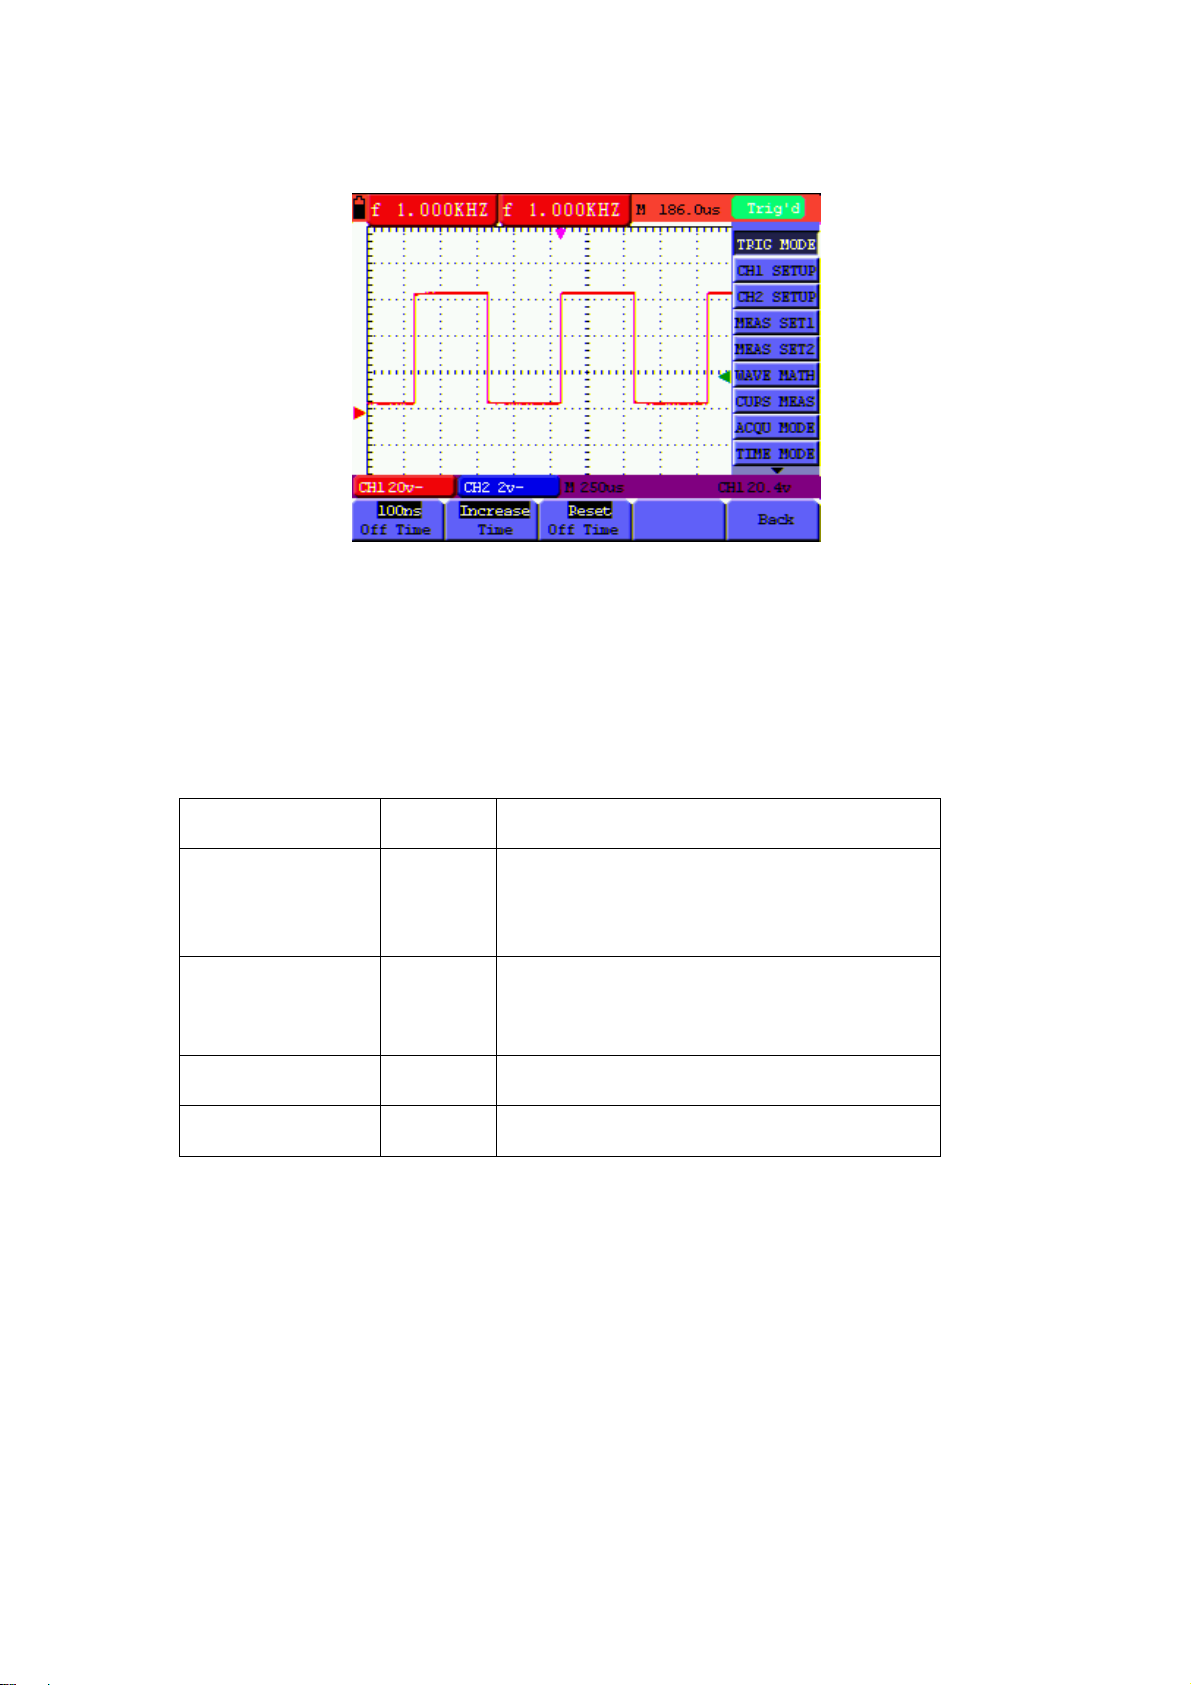
When the ‘Hold-off’ menu is accessed the screen will appear as below:
Figure 27b: ‘Hold-off’ menu screen (MS420)
Refer to the Table below for details on the ‘Hold-off’ mode: (MS420 only)
Function menu Settings
Description
OFF Time Select a time duration (hold-off time) that
will act as a delay before each trigger
event
Time Increase
Decrease
Increase the time
Decrease the time
Reset the Time Reset the hold-off time to 100ns
Back Return to the previous menu
Note:
Trigger Hold-off can stabilize complex waveforms. Hold-off time is the
oscilloscope’s waiting period before starting a new trigger. During Hold-off,
oscilloscope will not trigger.
43
V5.1‐March2010
Page 45

Glossary of Terms
• Hold-off time: Programmable time period between trigger events (100ns default).
• Trigger modes: There are three trigger modes: Auto (acquires signal continuously),
Normal (acquires signal when trigger conditions are met) and Single (manually
triggers the signal).
• Automatic trigger mode: In this mode, the oscilloscope can acquire a waveform
without a triggering condition
• Normal trigger mode: In this mode, the oscilloscope cannot acquire the waveform
until it is triggered. When no trigger is present, the oscilloscope will display only the
original waveform; no new waveforms can be captured until a trigger is detected.
• Single mode: In this mode, the oscilloscope will detect a trigger and capture a
waveform each time the user presses the RUN/STOP key.
44
V5.1‐March2010
Page 46
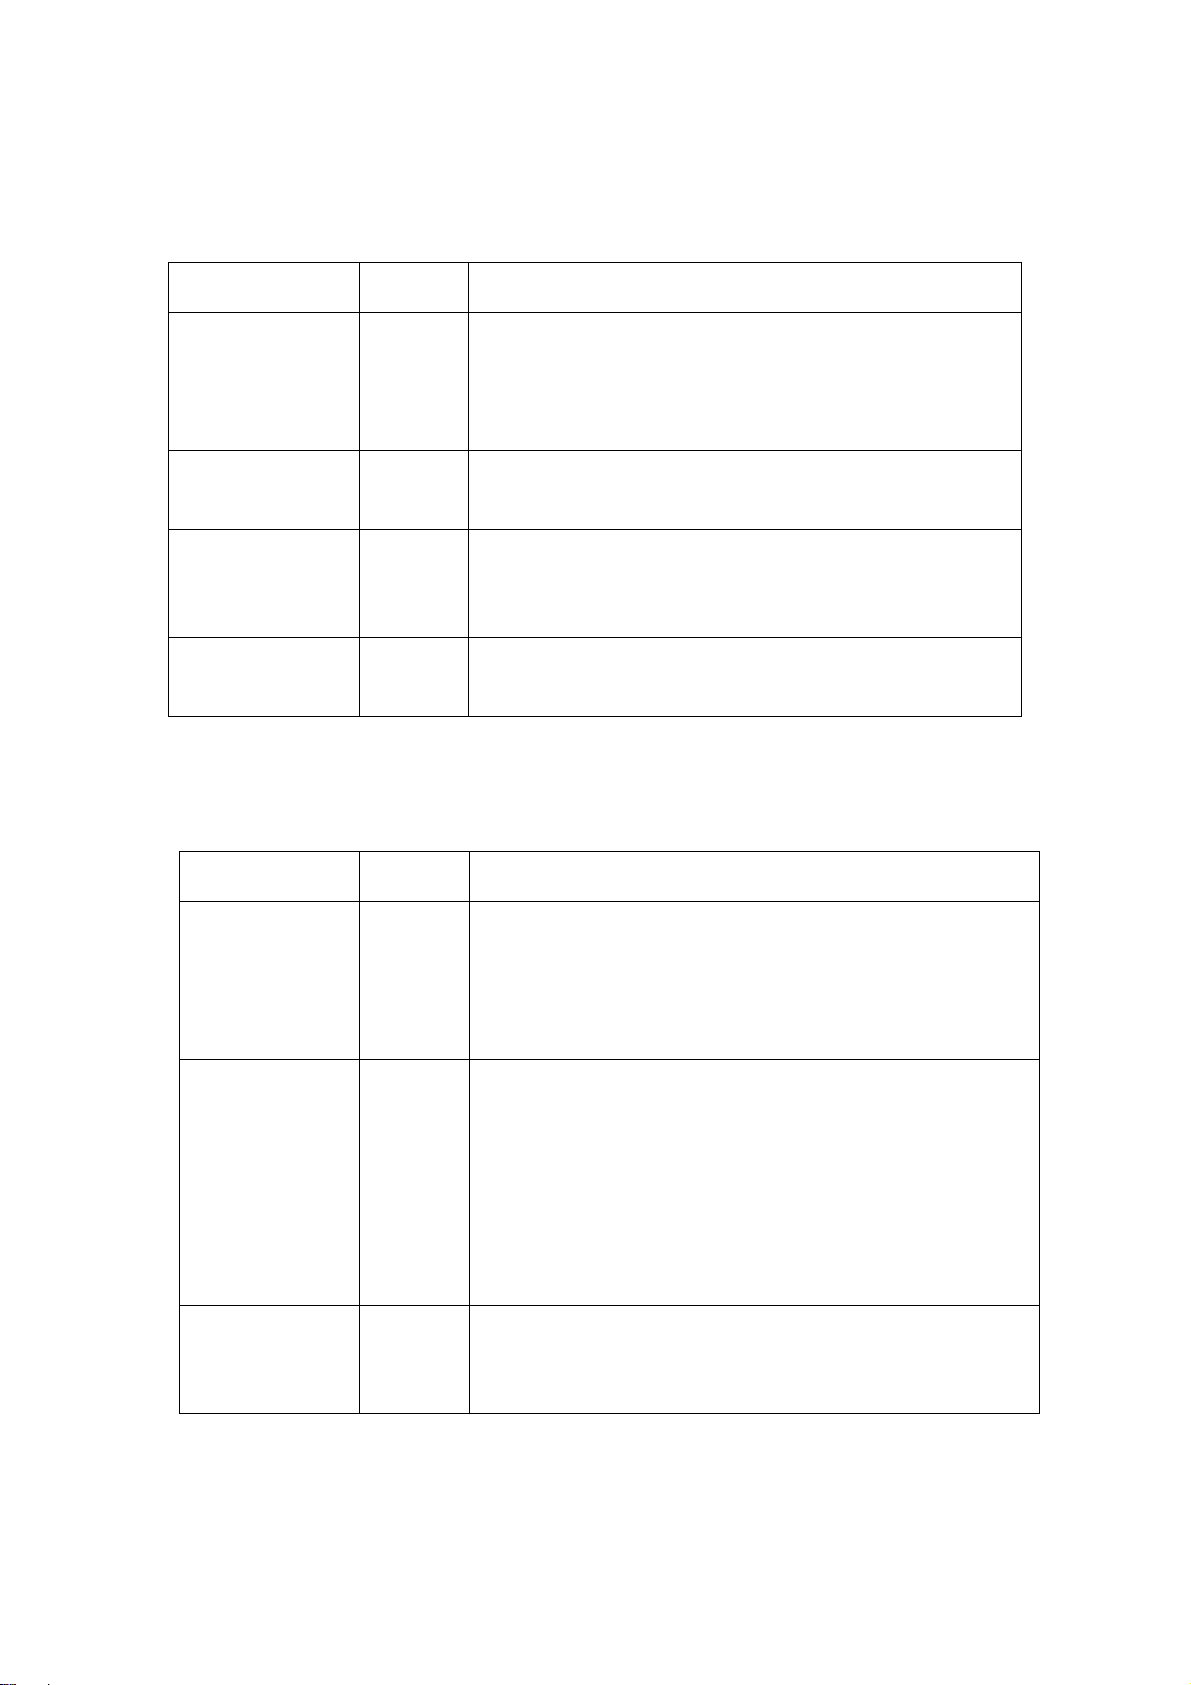
ACQUISITIONMODE
The Acquiring Mode menu is described in the Table shown below.
Function menu Settings
Description
Sample The waveform data sampling time interval. The
sample mode accurately reconstructs the waveform,
but cannot respond to rapid changes and sudden
peaks.
Peak Detect 50ns
max.
The peak detect mode captures rapid changes and
sudden peaks.
Average Multiple samples are averaged. The average mode
reduces the noise level (for best results, the waveform
must be repetitive)
Averages 4, 16, 64
Select the number of samples to average
or 128
DISPLAYSETTING
The Display Setting menu is described in the following table.
Function menu
Settings
Type Vectors
Description
Shows the waveform as a smooth line, connecting each
data point
Shows the waveform as a collection of independent
Dots
Persist OFF
1s
data points
Sets the duration of time that previous waveforms
remain on the display (useful for observing waveform
2s
variations)
5s
Infinite
Format YT Displays the relative relationship between vertical
voltage and horizontal time.
Displays CH1 on the horizontal axis and CH2 on the
45
V5.1‐March2010
Page 47

XY vertical axis
Carry Bitmap
Vectors
Data transmitted in bitmap format (dots)
Data transmitted in vector format (line)
DISPLAY STYLE
The display style includes Vector and Dot display types, as shown in Figure 28 and 29.
46
V5.1‐March2010
Page 48
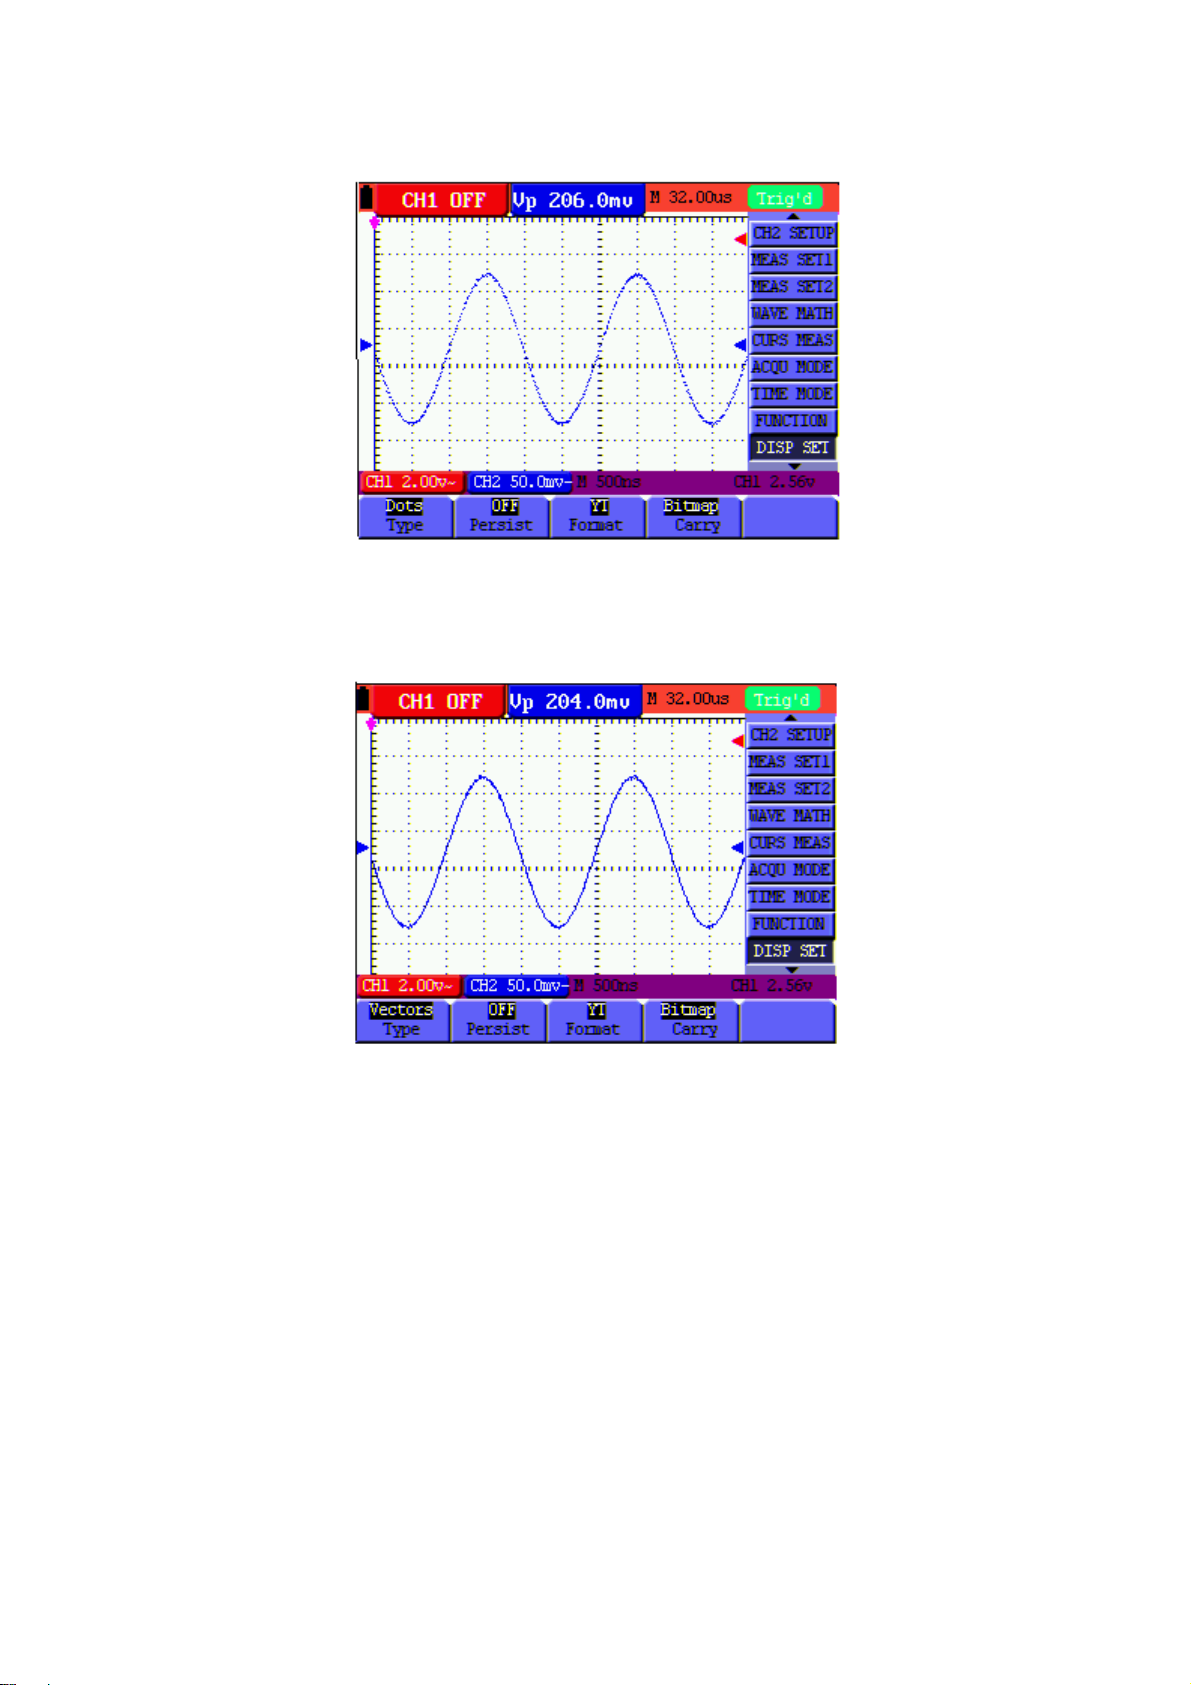
Figure 28: Dot Style
Figure 29: Vector Style
PERSISTENCE
The user can select the duration of time that past traces remain on the display. The
selections are 1, 2, 5 seconds, Infinite, and OFF.
XY MODE
This mode is only applicable to simultaneous CH1 and CH2 measurements. The X-Y
format plots the CH1 input as X-axis and CH2 input as Y-axis. This display mode is
47
V5.1‐March2010
Page 49

convenient for viewing the phase relationship between CH1 and CH2; if the
oscilloscope does not detect triggering the data appear in light spots.
48
V5.1‐March2010
Page 50

Description of Control Keys:
■ The CH1 VOL and CH1 ZERO keys for CH1 are used to set the horizontal
scale and position.
■ The CH2 VOL and CH2 ZERO keys for CH2 are used to set the vertical scale
and position continuously.
The following functions are not available in the XY display mode:
■ Reference or digital value waveform
■ Cursor
■ Time base control
■ Trigger control
STORINGWAVEFORMS
The oscilloscope can save four (4) waveforms that can be displayed on the screen along
with the present waveform. The recalled waveforms cannot be adjusted.
The waveform Store / Recall menu is described in the following Table.
Function
Setups Description
menu
Source CH1
Select the signal source of the waveform to save
(the waveform to save must be on the display)
CH2
MATH
WAVE A, B, C and D Select the memory address for saving or recalling
data
Save Store the waveform of the selected signal source
into the selected address
Show ON
Set ON to display the waveforms stored in address
A, B, C or D. Choose OFF to exit this feature.
OFF
To save a CH 1 waveform in address A, perform the following steps:
1. Press the MENU key; the function menu will appear at the right of the screen.
49
V5.1‐March2010
Page 51

2. Use the MENU ▲ or MENU ▼ key to select Wave Save. Four (4) selectable
options will then appear at the bottom of the screen.
3. Press the F1 key to select CH1 as the signal source.
4. Press the F2 key to select Address A.
5. Press the F3 key to save the waveform on CH1 in address A.
To display the saved waveform on the screen, perform the following steps:
6. Press F4 to select Start for Address A. The waveform saved in Address A will be
displayed in green. The zero point, voltage the time will display in purple
50
V5.1‐March2010
Page 52
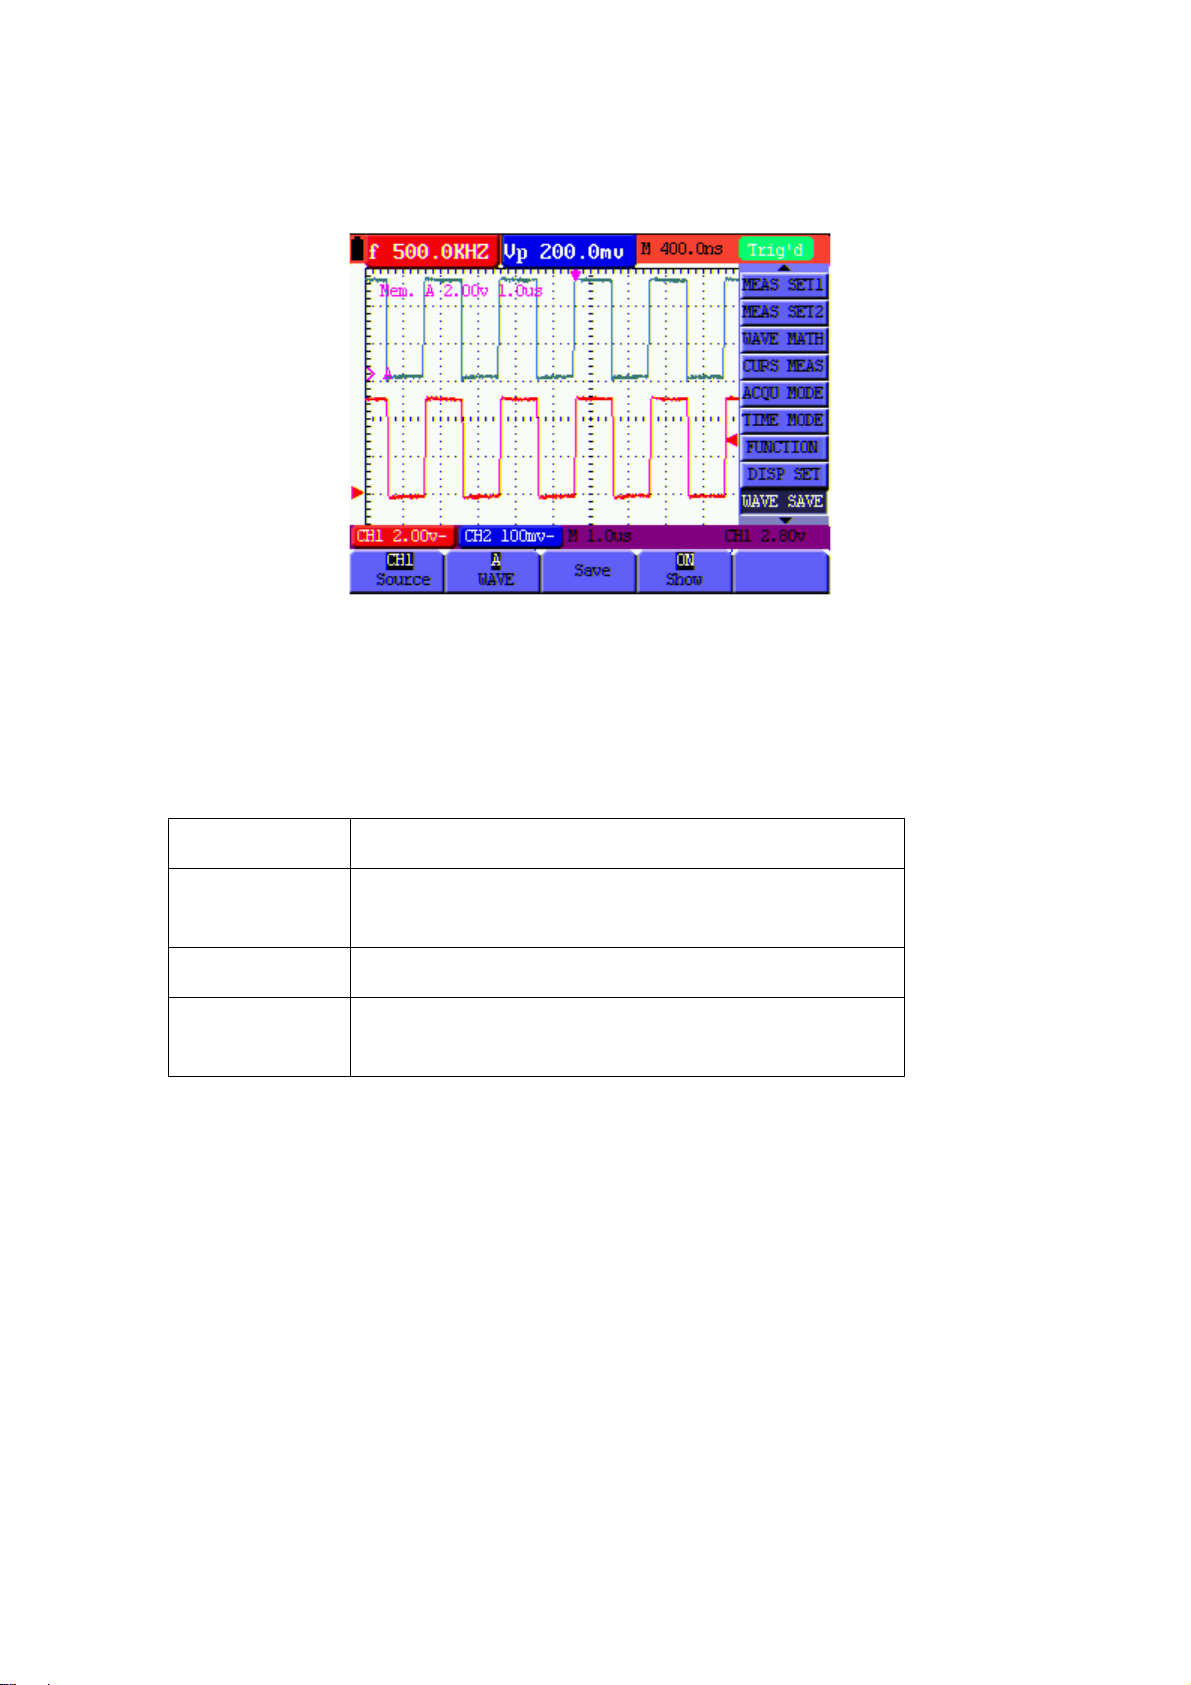
Refer to Figure 30:
Figure 30: Save and Recall Waveforms
FUNCTIONSETTINGMENU(REFERTOTABLEBELOW)
Press the MENU button and use the up/down arrow keys to scroll to FUNCTION
Function menu
Description
Recall Factory Set the meter’s settings to their factory default
conditions
Auto Calibration Perform an Auto-calibration procedure
Language Select the desired display language (English, Chinese,
Deutsch, or Greek)
Auto-calibration
The Auto-calibration function automatically configures internal parameters to maintain the
sensitivity and accuracy of the meter. Use the Auto-calibration in the following cases:
• When the temperature changes by more than 5 degrees Celsius during operation
• When operating the oscilloscope in a new bench top or field environment
1. Press MENU and select the FUNCTION menu using the MENU ▲ or MENU ▼ key
2. Press F2 (Auto calibration). A message appears asking the user to remove all cables
51
V5.1‐March2010
Page 53

and probes from the oscilloscope
3. After removing all cables, press F2 (Auto calibration) again. The Auto-calibration
automatically starts and a status message appears.
To interrupt calibration, press any key during the calibration.
52
V5.1‐March2010
Page 54
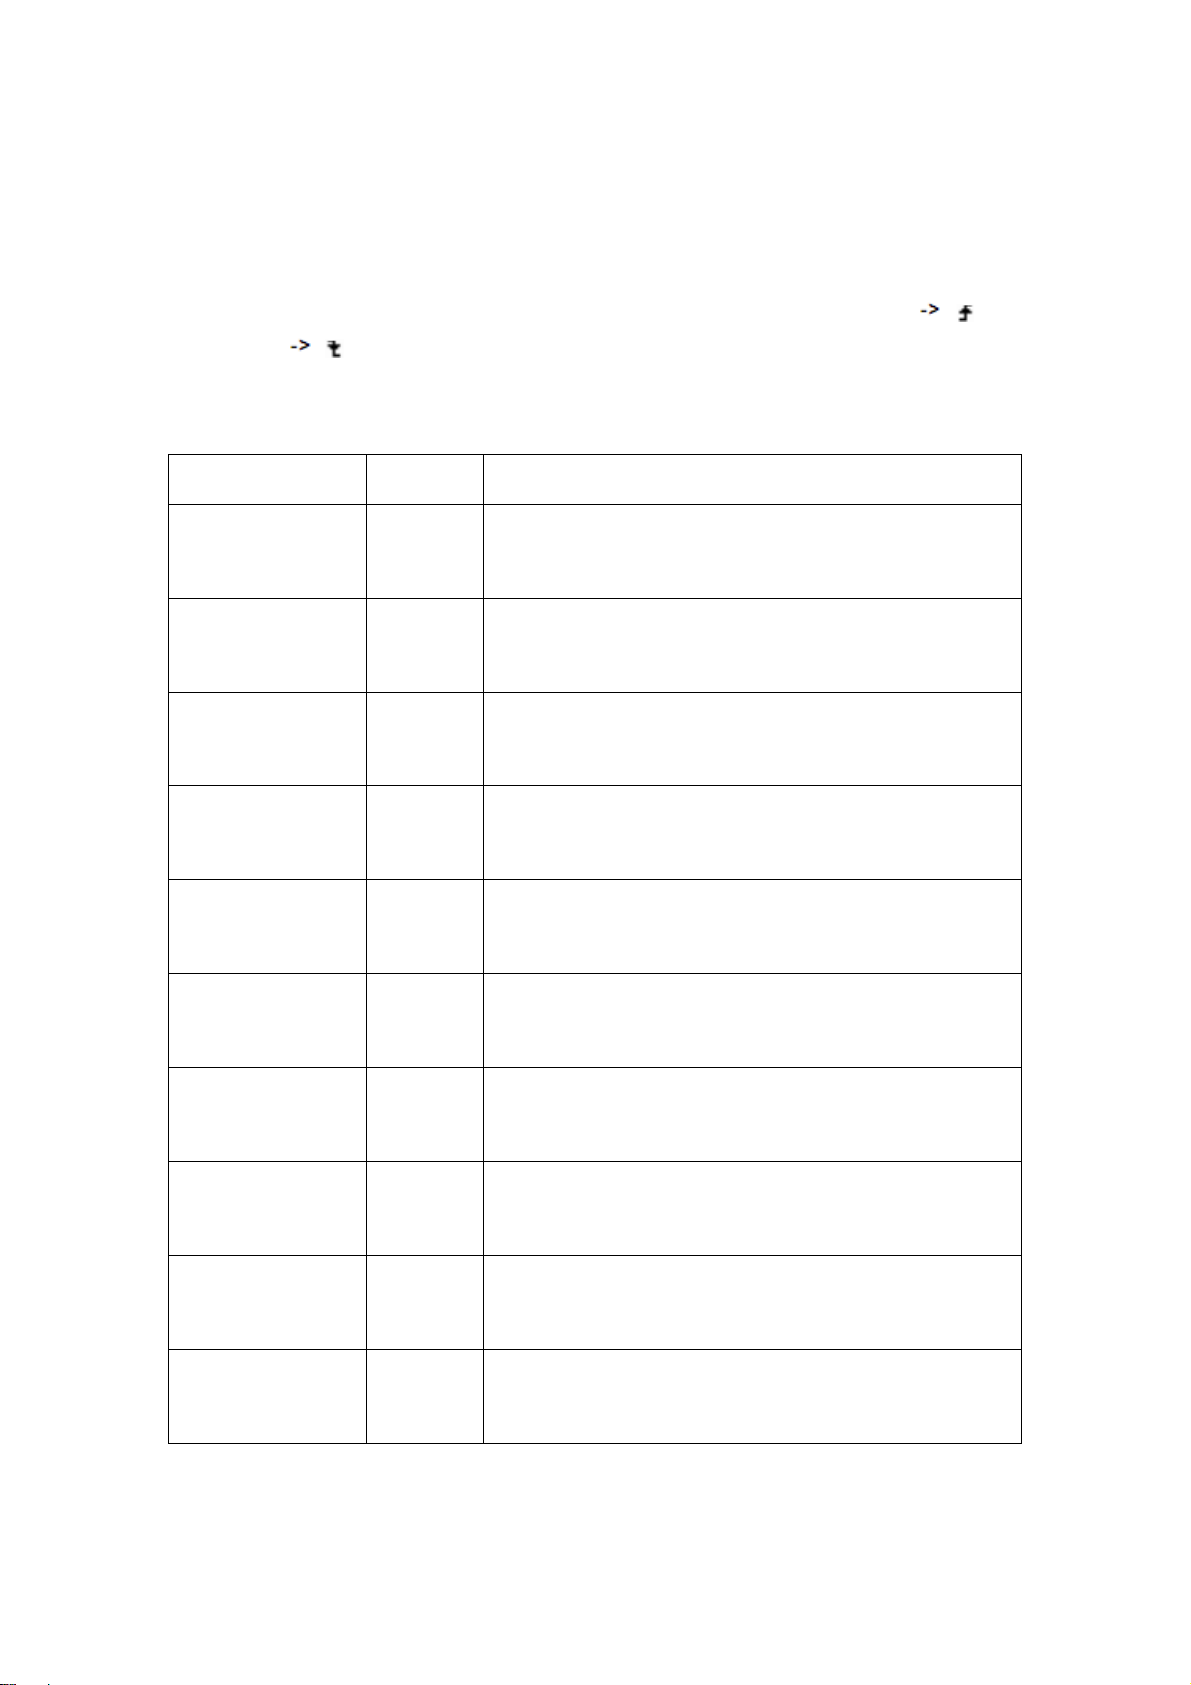
AUTOMATICRANGINGMEASUREMENTS
The oscilloscope can perform twenty (20) automatic measurements: Frequency,
cycle, average, peak-to-peak, root mean square, Vmax, Vmin, Vtop, Vbase, Vamp,
overshoot, pre-shoot, rise time, fall time, +width, -width, +duty, -duty, delayA
and delayA
B . Two measurement results can be displayed simultaneously on the
B
screen. The function menu for automatic measurements is described in the following
Table.
Function menu Settings
CH1
Freq
CH2
CH1
Period
CH2
CH1
Mean
CH2
CH1
Peak-Peak
CH2
CH1
Cyc RMS
CH2
Description
Measure the frequency of CH1
Measure the frequency of CH2
Measure the period of CH1
Measure the period of CH2
Measure the average value of CH1
Measure the average value of CH2
Measure the peak-to-peak value of CH1
Measure the peak-to-peak value of CH2
Measure Root Mean Square (RMS) value of CH1
Measure Root Mean Square (RMS) value of CH2
CH1
Vmax
CH2
CH1
Vmin
CH2
CH1
Vtop
CH2
CH1
Vbase
CH2
CH1
Vamp
CH2
Measure the Vmax of CH1
Measure the Vmax of CH2
Measure the Vmin of CH1
Measure the Vmin of CH2
Measure the Vtop of CH1
Measure the Vtop of CH2
Measure the Vbase of CH1
Measure the Vbase of CH2
Measure the Vamp of CH1
Measure the Vamp of CH2
53
V5.1‐March2010
Page 55
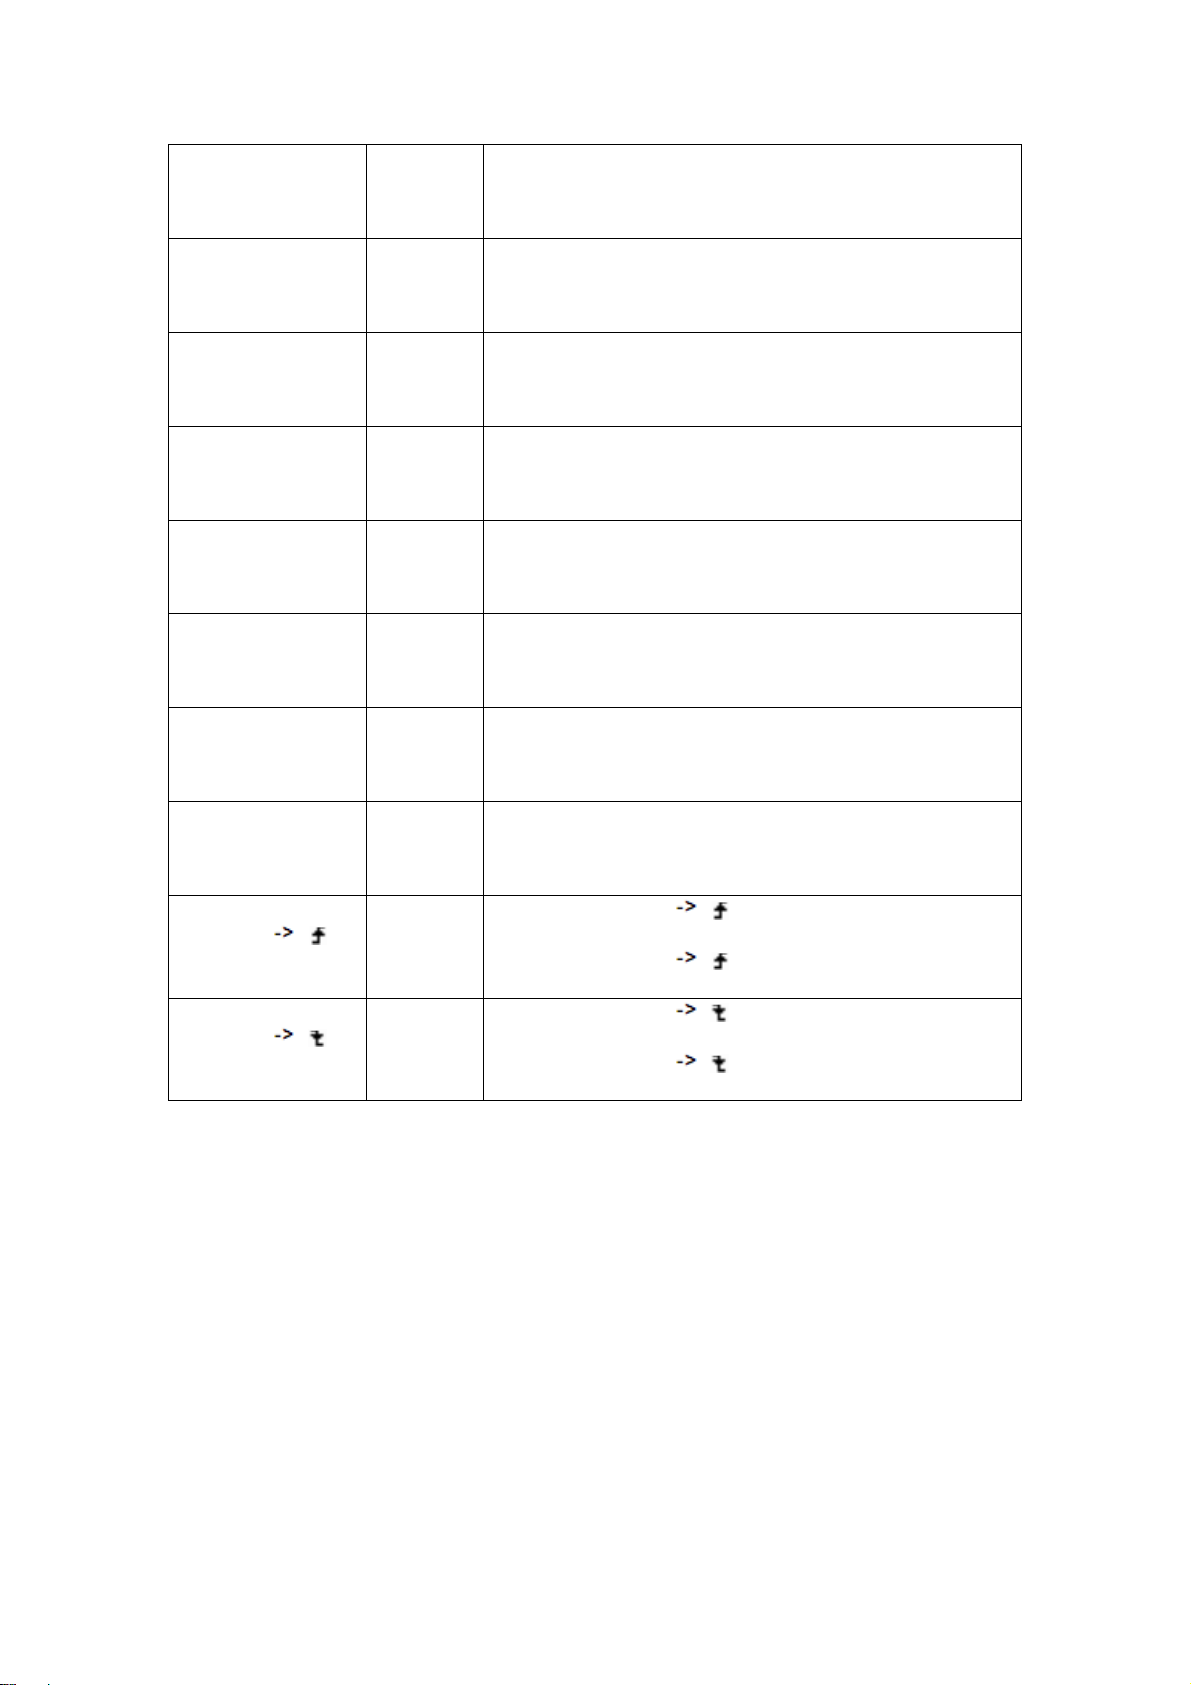
Overshoot
Preshoot
RiseTime
Fall Time
+Width
-Width
+Duty
CH1
CH2
CH1
CH2
CH1
CH2
CH1
CH2
CH1
CH2
CH1
CH2
CH1
CH2
Measure the Overshoot of CH1
Measure the Overshoot of CH2
Measure the Preshoot of CH1
Measure the Preshoot of CH2
Measure the RiseTime of CH1
Measure the RiseTime of CH2
Measure the Fall Time of CH1
Measure the Fall Time of CH2
Measure the +Width of CH1
Measure the +Width of CH2
Measure the -Width of CH1
Measure the -Width of CH2
Measure the +Duty of CH1
Measure the +Duty of CH2
CH1
-Duty
CH2
CH1
DelayA B
CH2
CH1
DelayA B
CH2
Measure the -Duty of CH1
Measure the -Duty of CH2
Measure the DelayA
Measure the DelayA
Measure the DelayA
Measure the DelayA
B of CH1
B of CH2
B of CH1
B of CH2
To measure the frequency of CH1 with MEAS SET 1 and the frequency of CH2 with
MEAS SET 2, perform the following steps:
1. Press the MENU key; the function menu will appear on the right side of the screen
2. Press the MENU ▲ or MENU ▼ key to select MEAS SET 1. Five (5) selectable
54
V5.1‐March2010
Page 56
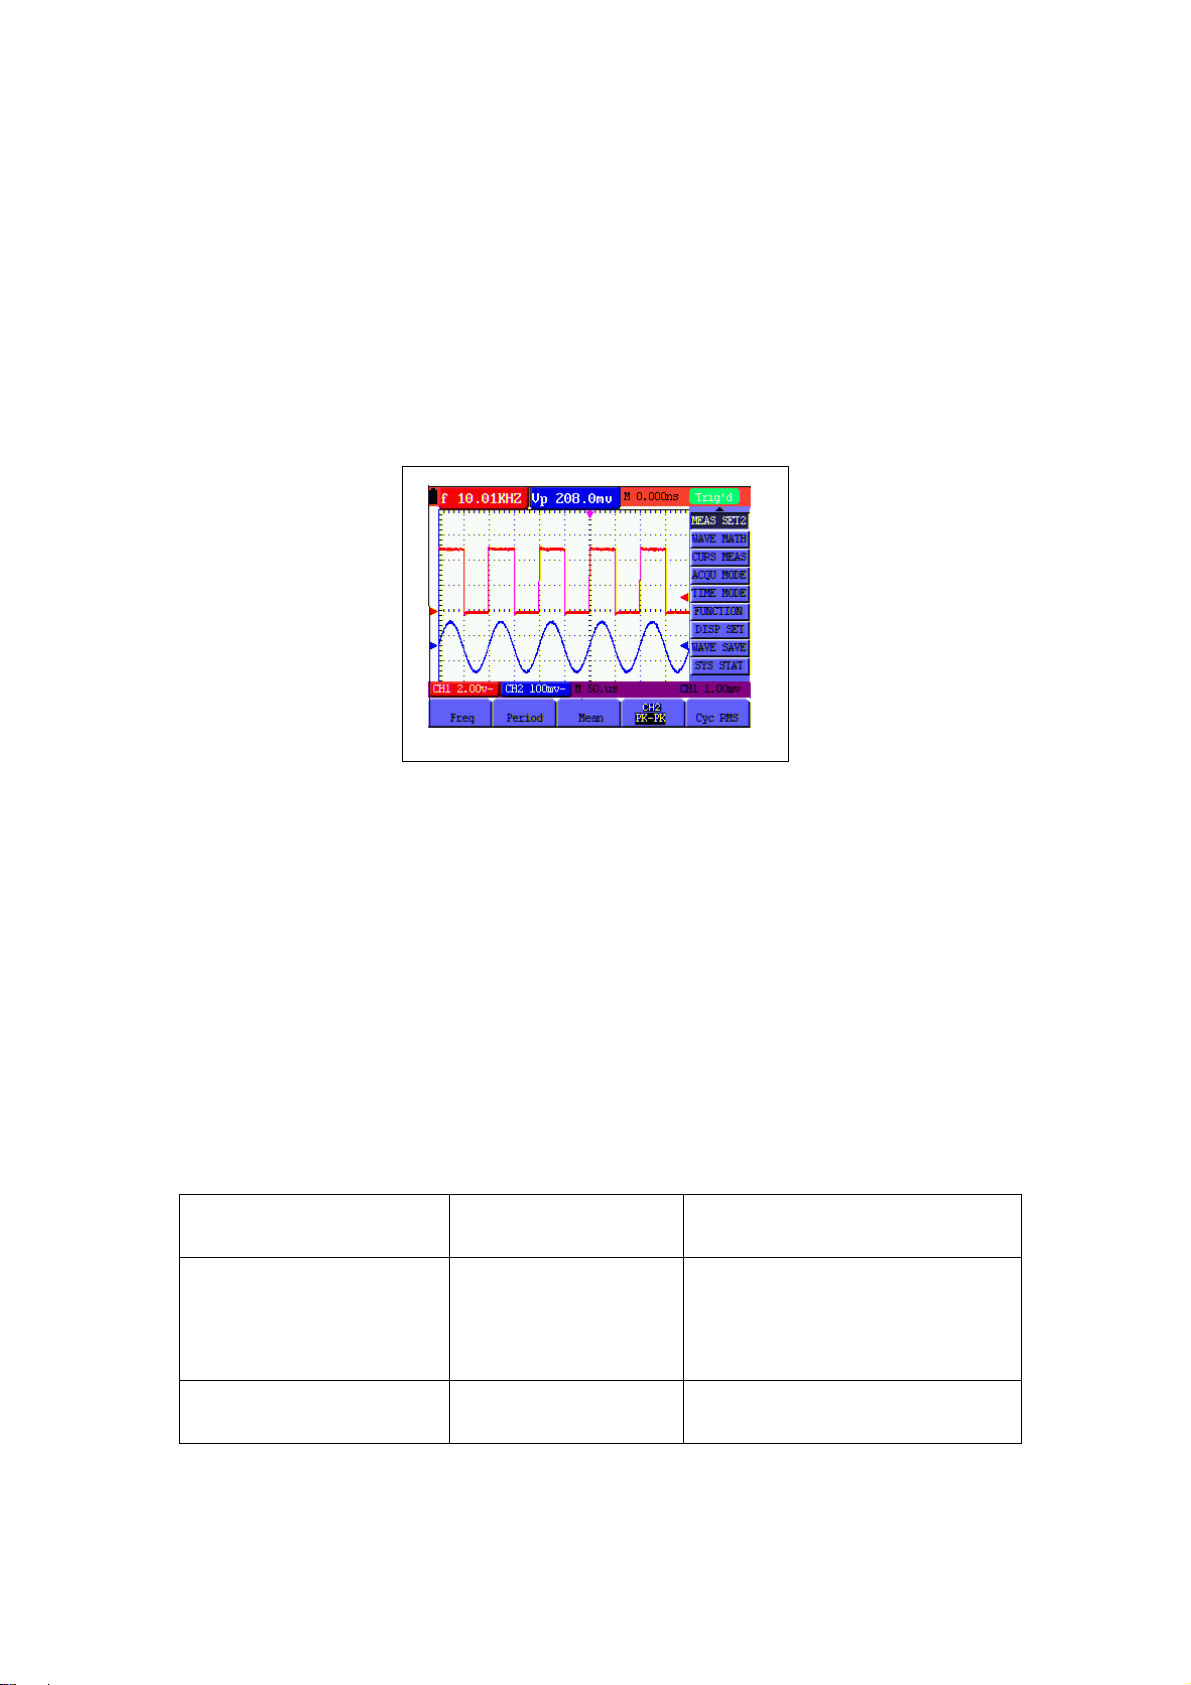
options will then appear at the bottom of the screen
3. Press the F1 key to select the frequency measurement of CH1. The measurement
window will appear red in color and show the frequency of CH1
4. Press the MENU ▲ or MENU ▼ key to select MEAS SET 2. Five (5) selectable
options will then appear at the bottom of the screen
5. Press the F4 key to select the peak-to-peak value of CH2. The measurement
window will appear blue in color and show the peak-to-peak value of CH2
Figure 31: Automatic Measurements
Autoscale
Autoscale enables the instrument to automatically configure the trigger
mode, voltage division and time scale according to the type, amplitude and
frequency of a signal.
The menu is as follows:
Function Menu Setting Instruction
Autoscale
OFF
Turn OFF Autoscale
ON
Turn ON Autoscale
Mode Vertical Adjust vertical scale without
55
V5.1‐March2010
Page 57
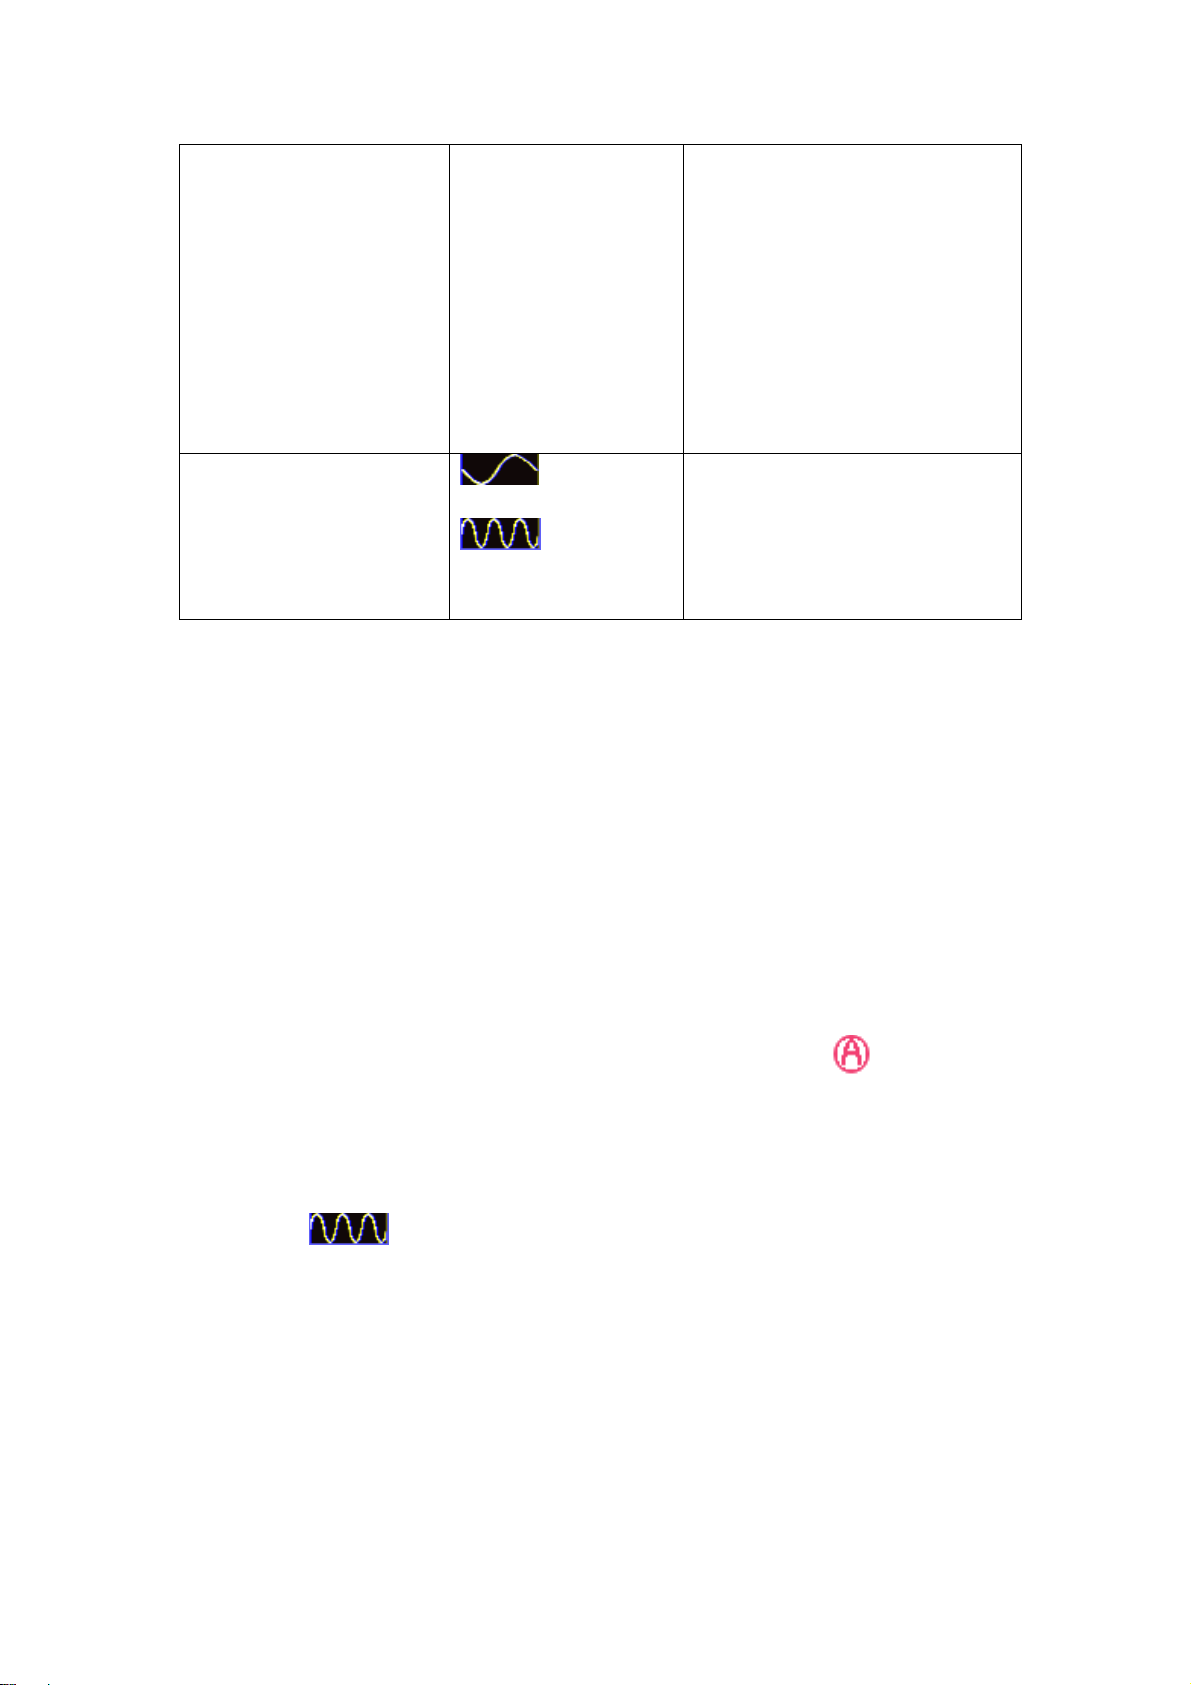
To measure CH1 voltage:
Horizontal
HORI—VERT
changing horizontal setting
Adjust horizontal scale
without changing vertical
setting
Adjust the vertical and
horizontal settings
Display one or two periods
Display multi-period
waveforms
1. Press MENU, the function menu will appear on the right side of the
screen.
2. Press MENU ▲ or MENU ▼ and choose AUTOSCALE; three (3) options
will appear at the bottom of the screen
3. Press F1 to select ON
4. Press AUTOSET to enter the Autoscale mode; the symbol
flickers
every half second at the top left of the display
5. Press F2 to select the Horizontal/Vertical mode
6. Press F3 and refer to the display examples below:
56
V5.1‐March2010
Page 58
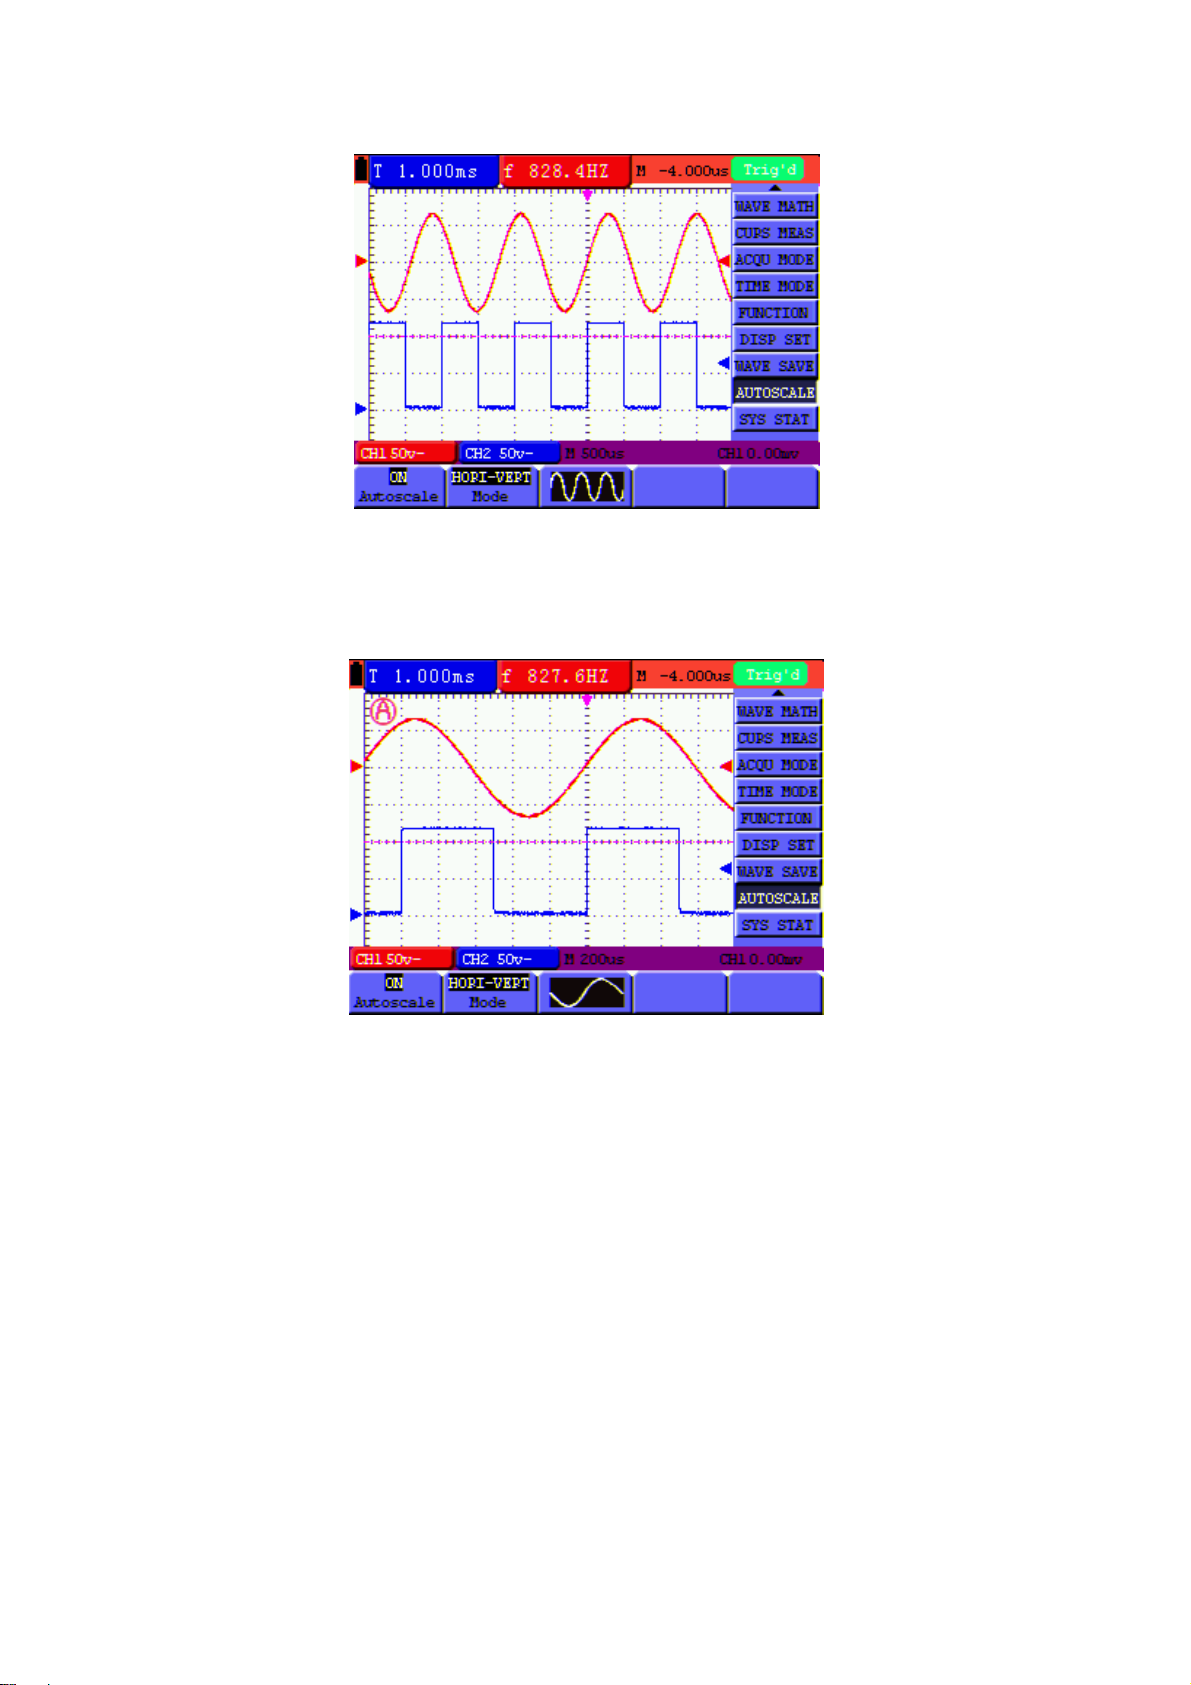
Fig 32: Autoscale Horizontal - Vertical multi-period waveforms
Fig 33: Autoscale Horizontal - Vertical mono-period waveform
57
V5.1‐March2010
Page 59
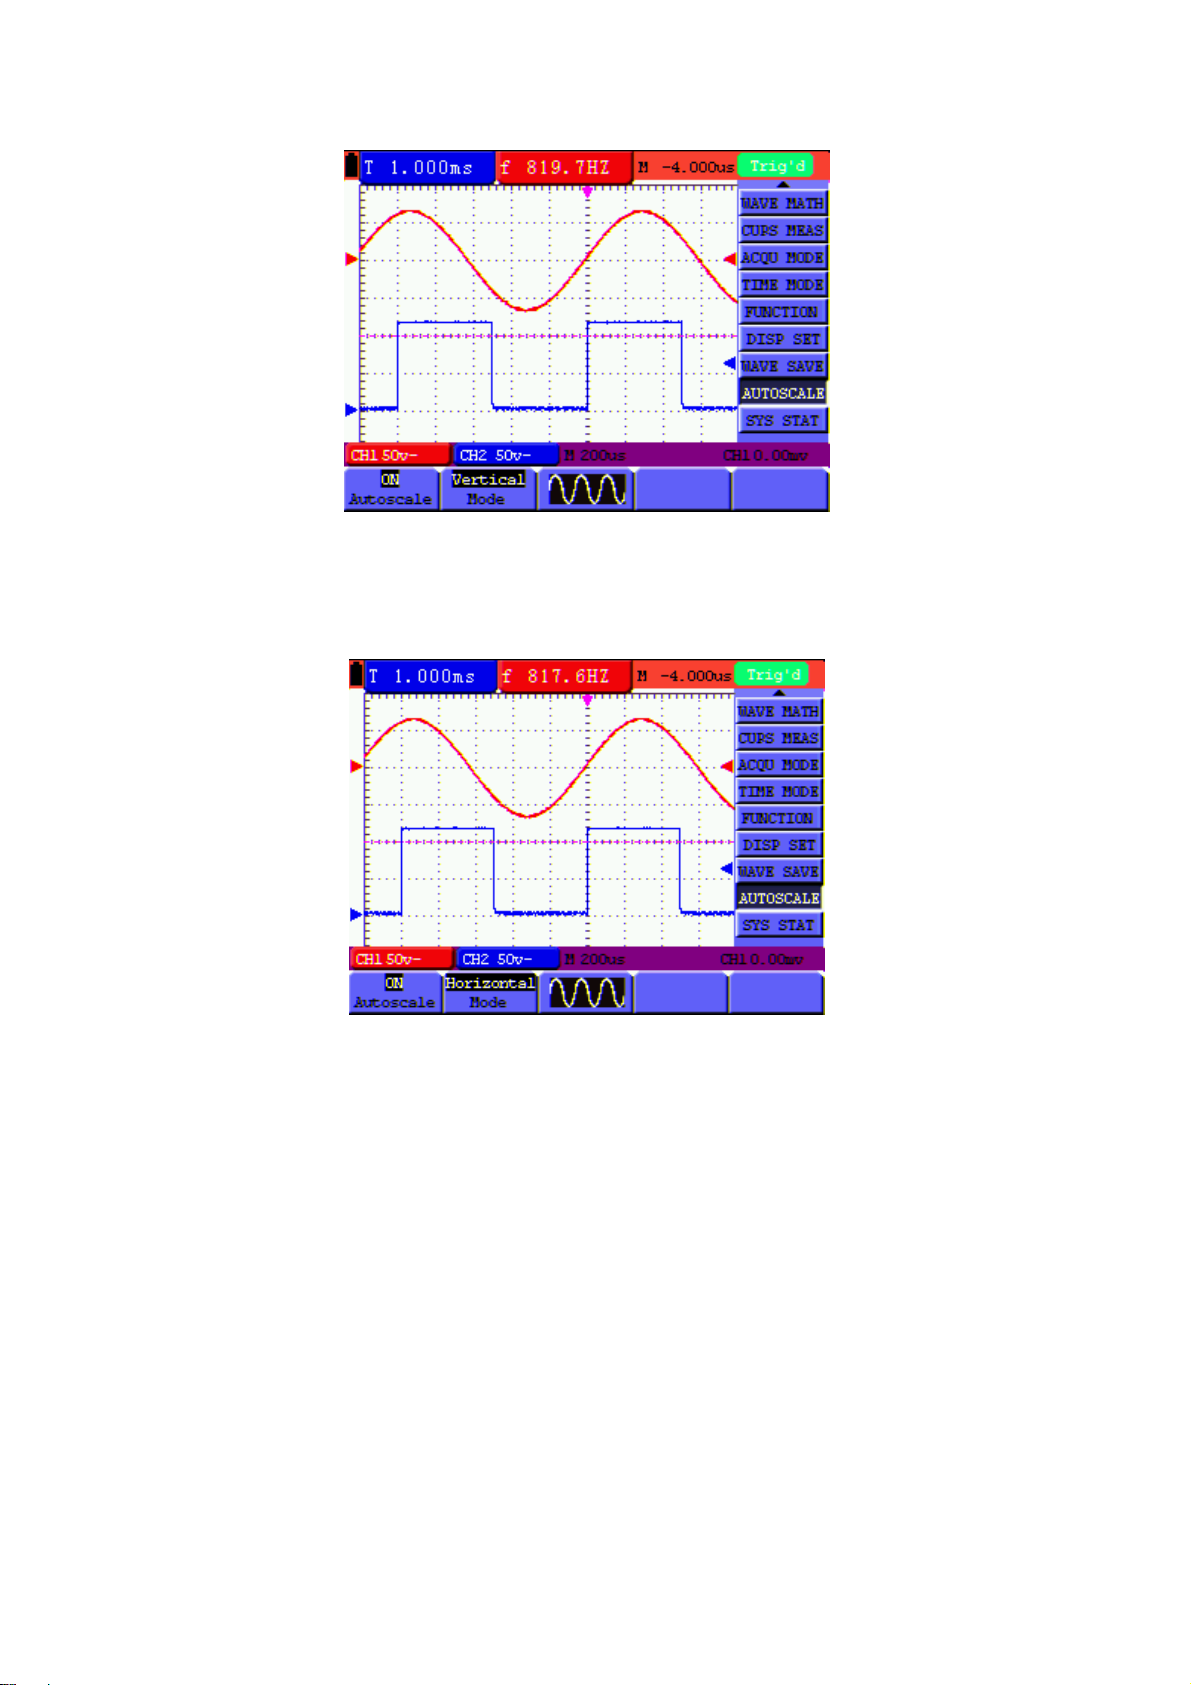
Fig 34: Vertical mode multi-period waveform
Fig 35: Horizontal mode multi-period waveform
58
V5.1‐March2010
Page 60

Notes:
1. In Autoscale mode the meter can automatically set the Trigger mode
(Edge, Video, and Alternate) and Type (Edge, Video)
2. In Autoscale mode the meter switches to YT Mode (Auto) from XY mode
(STOP)
3. In Autoscale, the meter defaults to DC coupling and AUTO triggering
mode
4. If the user attempts to manually adjust the vertical position, voltage
division, trigger level or time scale while in the Autoscale mode the meter
will automatically exit the Autoscale mode
5. When video triggering, the horizontal time scale is 50us
59
V5.1‐March2010
Page 61
CURSORMEASUREMENTS
Two cursors can be used to make instantaneous Time and Voltage measurements
for CH1 and CH2 signals. Refer to the following table for more information.
Function menu Settings Description
Type OFF
Voltage
Time
Source CH1,
CH2
Exit the cursor measurement mode
Display voltage measurement cursor and menu
Display time measurement cursor and menu
Select the waveform channel on which the cursor
measurement will be performed
Delta (MS460) Display the difference between CH1 and CH2 values
Cursor 1
Data for cursor 1
(MS460)
Cursor 2
Data for cursor 2
(MS460)
To use the cursor for a Voltage measurement on CH1, perform the following steps:
1. Press the MENU key; the function menu will then display at the right of the
screen.
2. Press the MENU ▲ or MENU ▼ key to select Curs Meas. Five (5) selectable
options (MS46) or two (2) selectable options (MS420) appear at the bottom of
the screen.
3. Press the F1 key to select the measurement type Voltage. Two dashed lines
V1 and V2 will appear on the screen.
4. Press the F2 key to select CH 1.
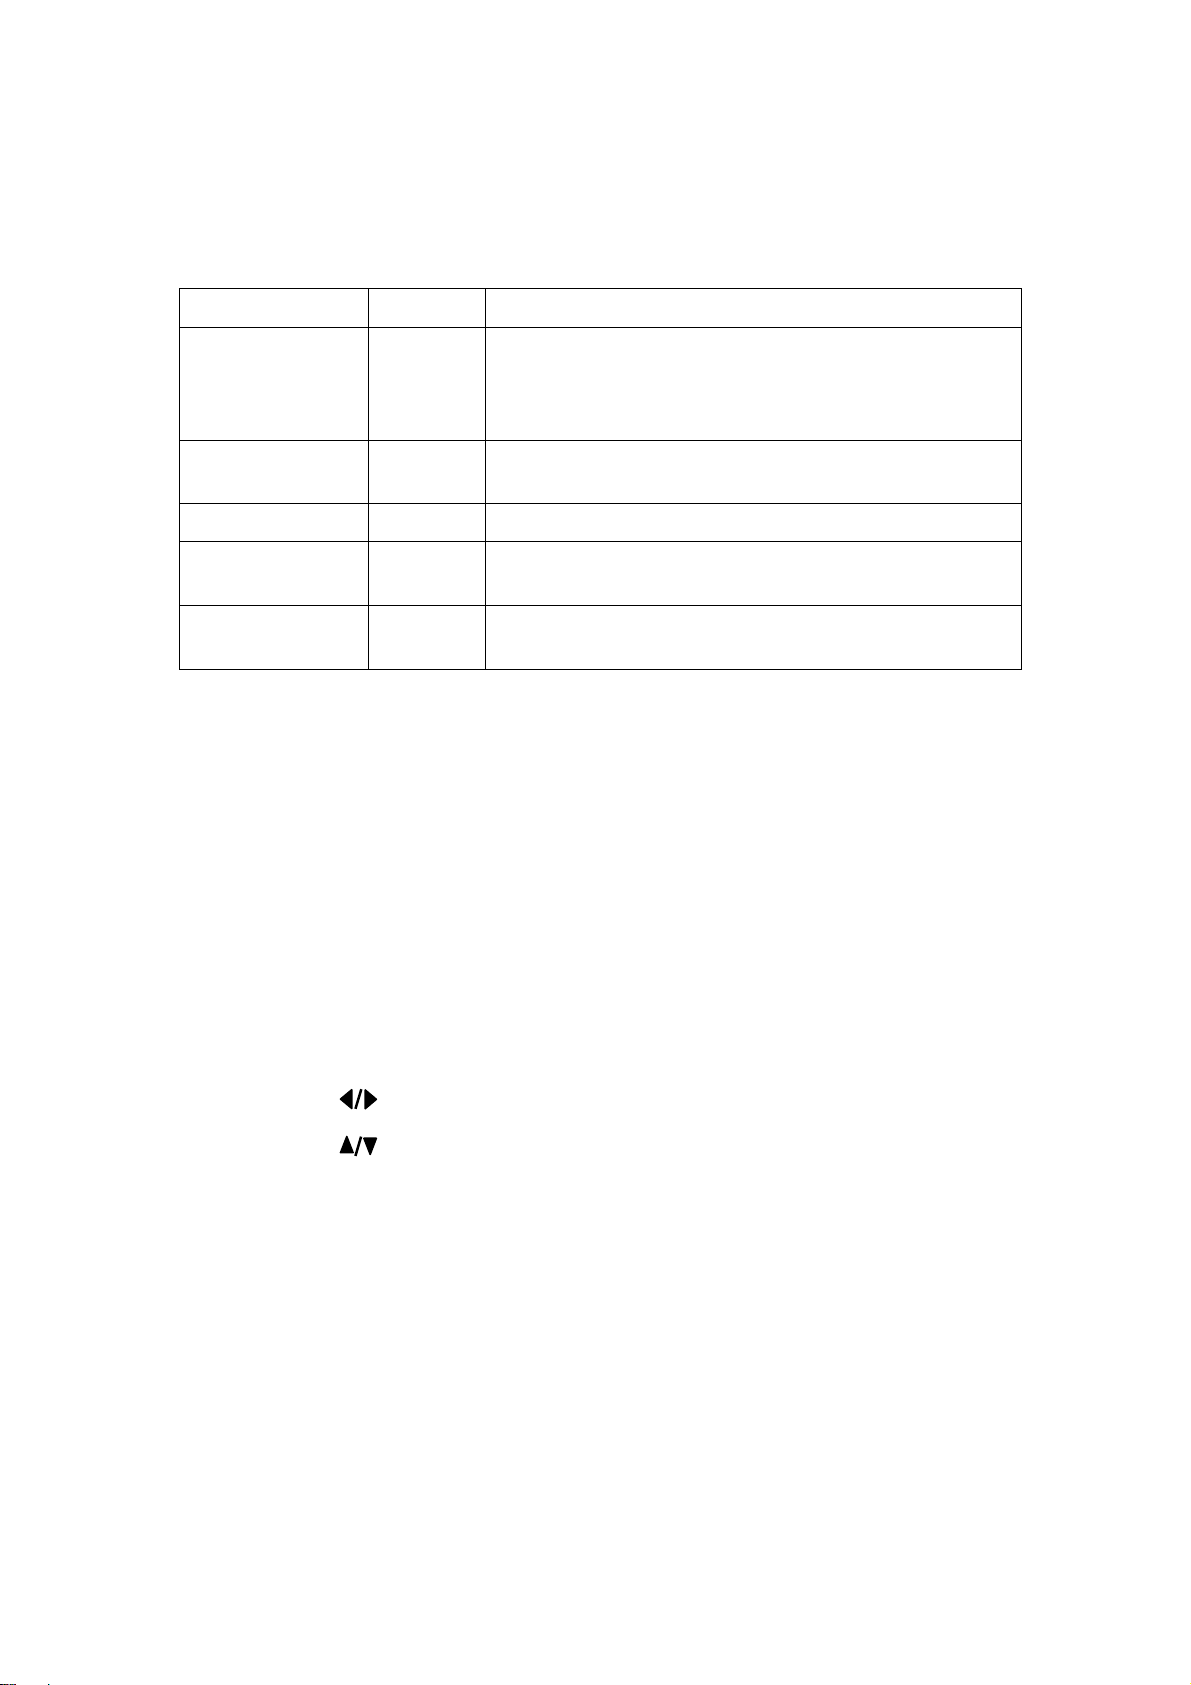
5. Press OPTION and the display will show the following:
Cursor 2
Cursor 1
Use ▲ (yellow) and ▼ (yellow) to move V1 up and down; the voltage value
(relative to the zero position) will display at the bottom of the screen. Use ◄
(yellow) and ► (yellow) to move V2 up and down; the voltage value (relative
to the zero position) will display at the bottom of the screen. The display will
also show the result of V1 - V2. Refer to Figure 36-a.
60
V5.1‐March2010
Page 62
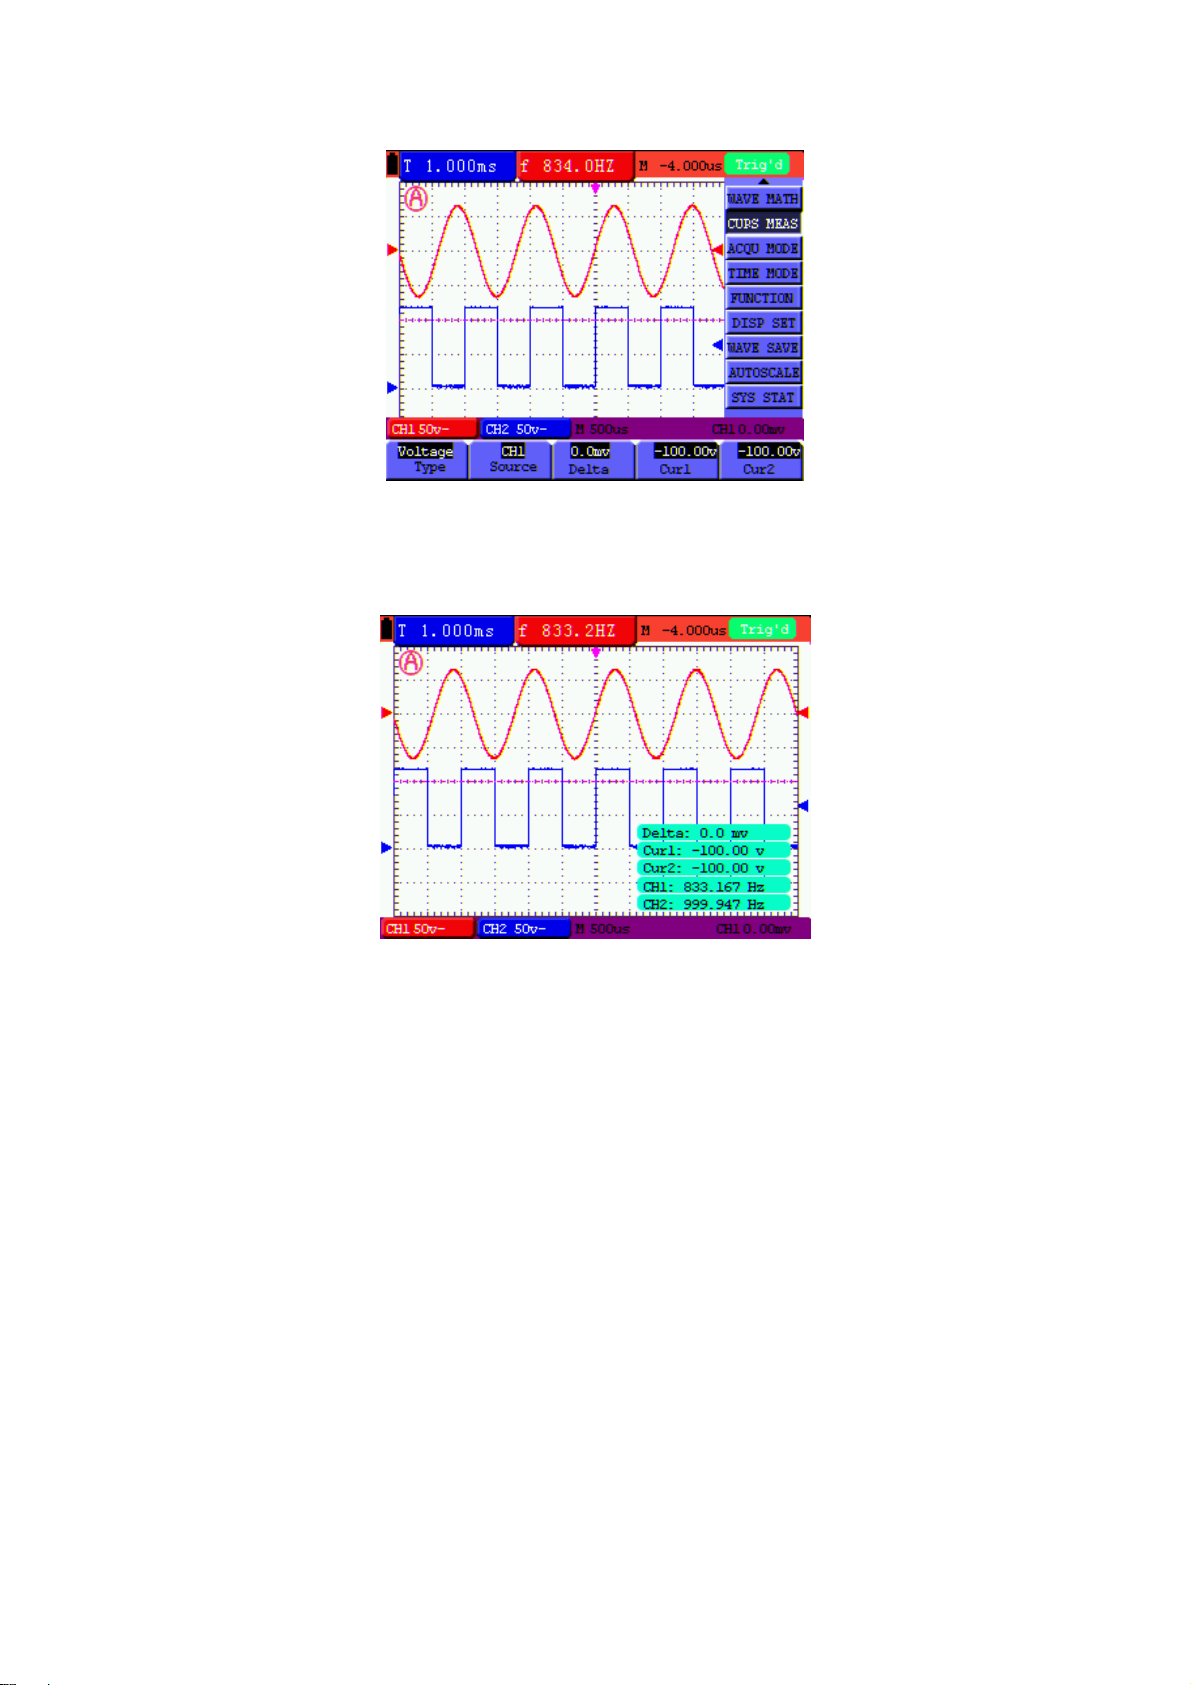
Figure 36-a: Use the Cursor for a Voltage Measurement
When the MENU button is pressed, the data table appears as shown in Figure 36-b:
Figure 36-b: Data Table
To use the cursor for a Time measurement on CH1, perform the following steps:
1. Press the MENU key; the function menus will appear at the right of the
screen.
2. Press the MENU ▲ or MENU ▼ key to select Cursor measurement. Two (2)
selectable options will then appear at the bottom of the screen.
3. Press the F1 key to select the measurement type Time. Two vertical dashed
lines T1 and T2 will appear on the screen.
4. Press the F2 key and select the channel CH1.
61
V5.1‐March2010
Page 63
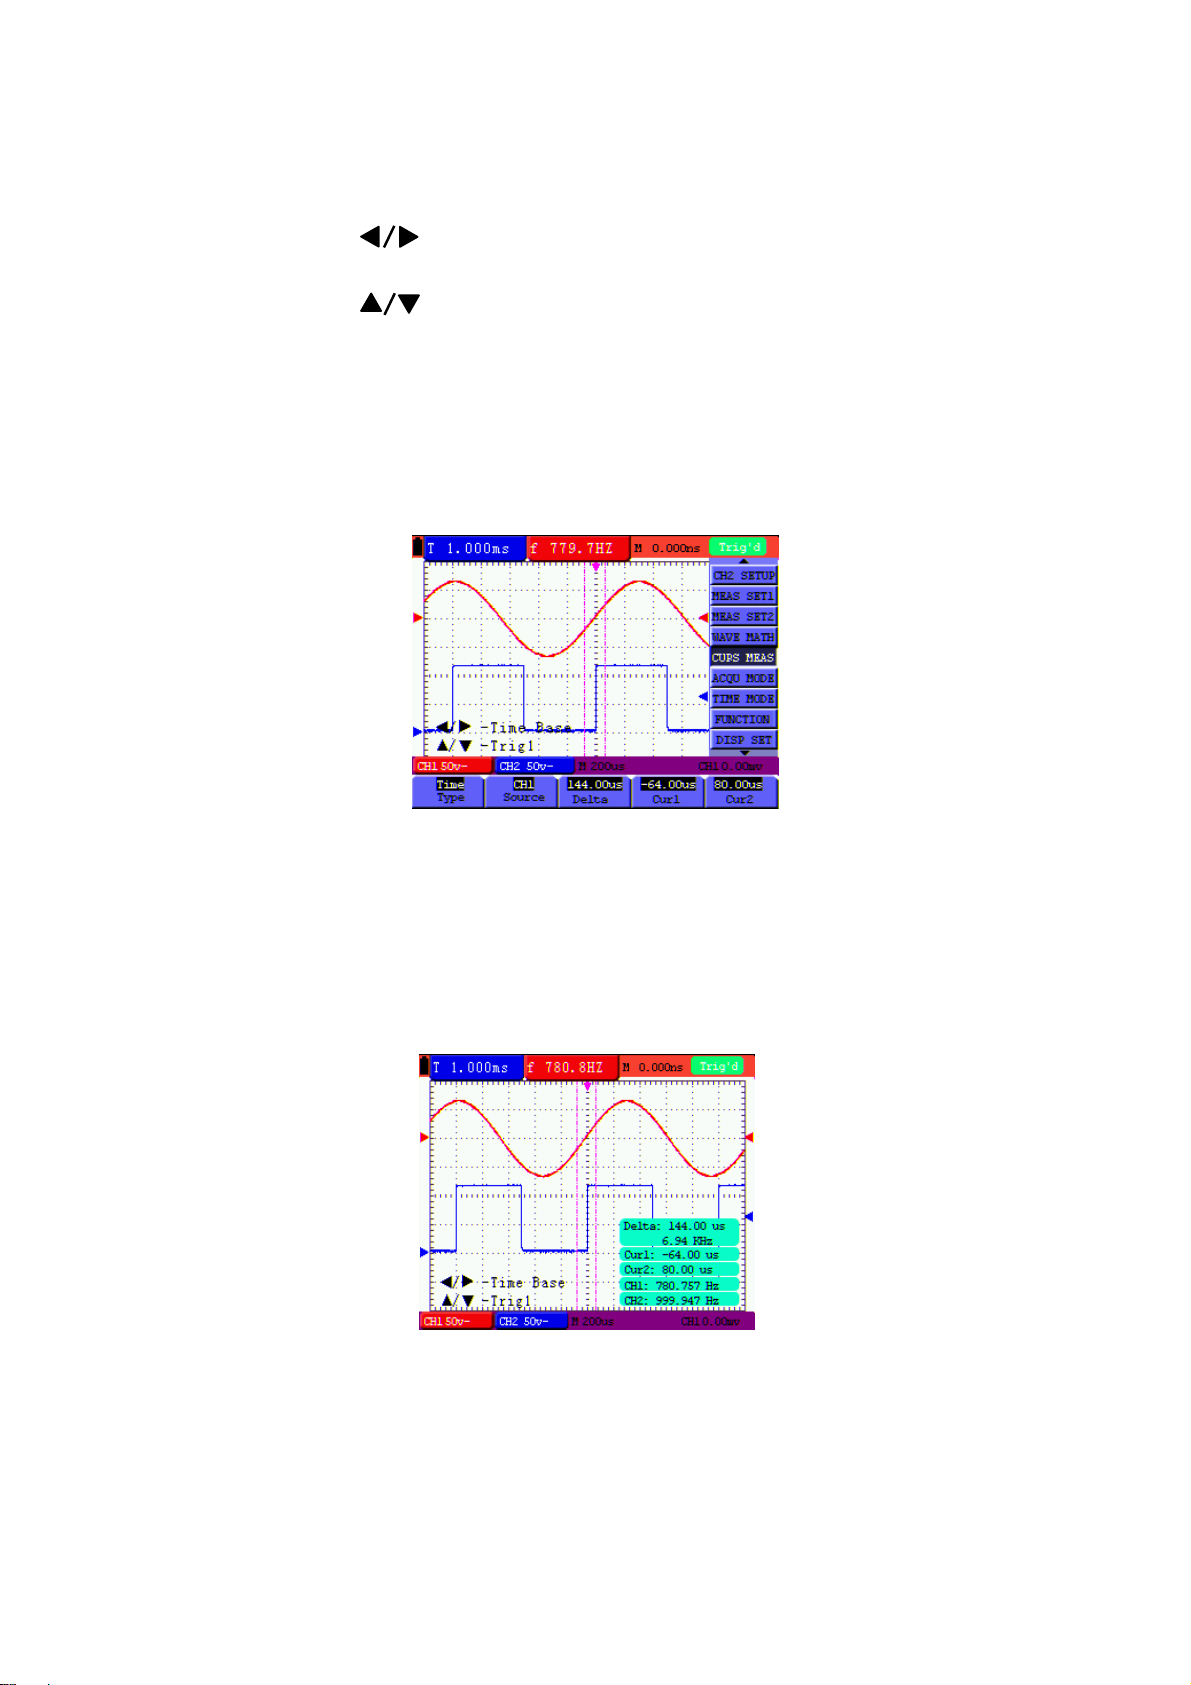
5. Press OPTION and the display will show:
—Cursor 2
—Cursor 1
Press ▲ (yellow) or ▼ (yellow) to move T1 left and right; the value of T1 (relative to
the middle of the screen) will display. Press ◄(yellow) or ►(yellow) to move T2
left and right; the value of T2(relative to the middle of the screen) will display as
shown in Figure 37-a:
Figure 37-a: Time Measurement using cursor
When the MENU button is pressed, the data table appears as shown in Fig. 37-b.
Figure 37-b: Data Table
62
V5.1‐March2010
Page 64
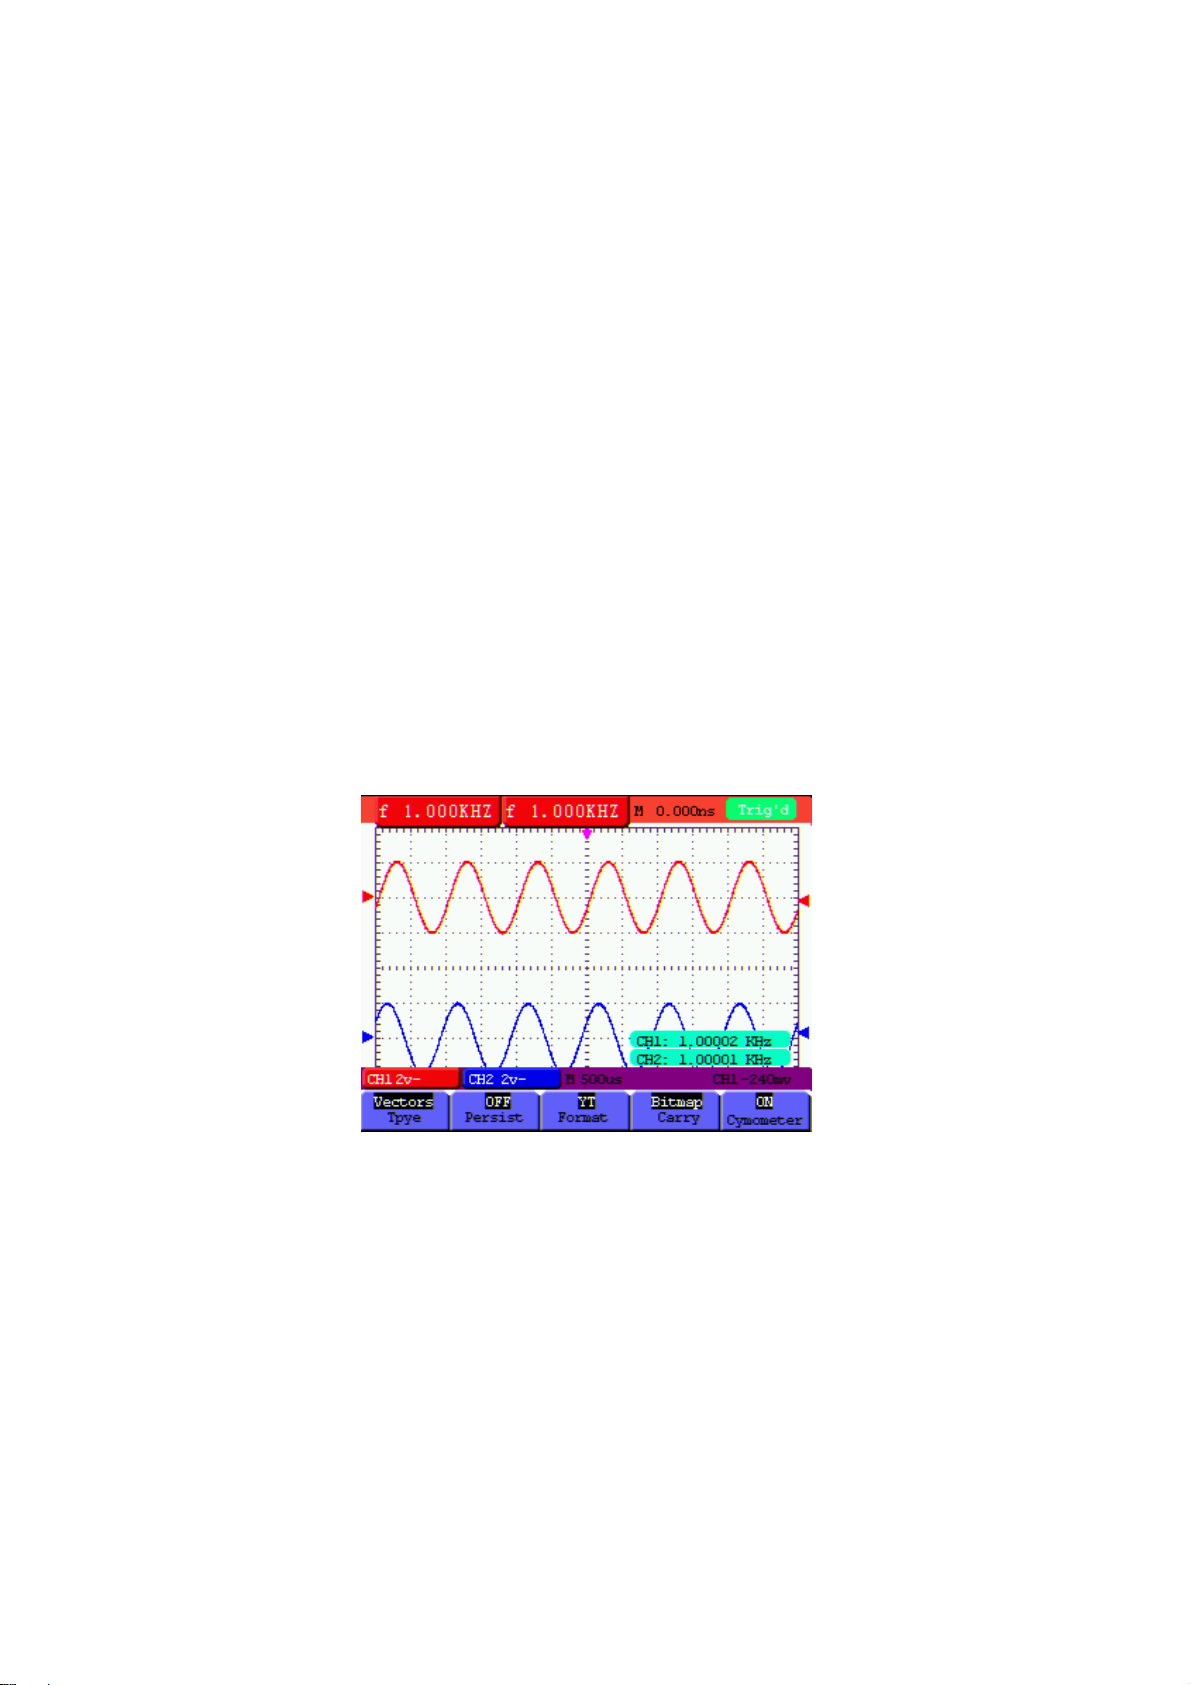
SIX(6)DIGITFREQUENCYCOUNTER(CYMOMETER)MS460ONLY
The frequency counter measurement range is 2Hz~60MHz.
When the meter is configured for edge triggering, it can only measure one channel
(the channel that is triggering). When the triggering mode is set to Alternating trigger
the instrument can measure both channels (CH1 and CH2).
To configure the Frequency Counter for two channel operation:
1. Press MENU and the function menu will appear on the right side of the
screen.
2. Use the MENU ▲ or MENU ▼ key to select DISP SET (Display Setting),
five (5) options will appear at the bottom of the screen.
3. Use the F5 key to select ON; refer to figure 38:
Fig 38: Frequency Counter Display
63
V5.1‐March2010
Page 65
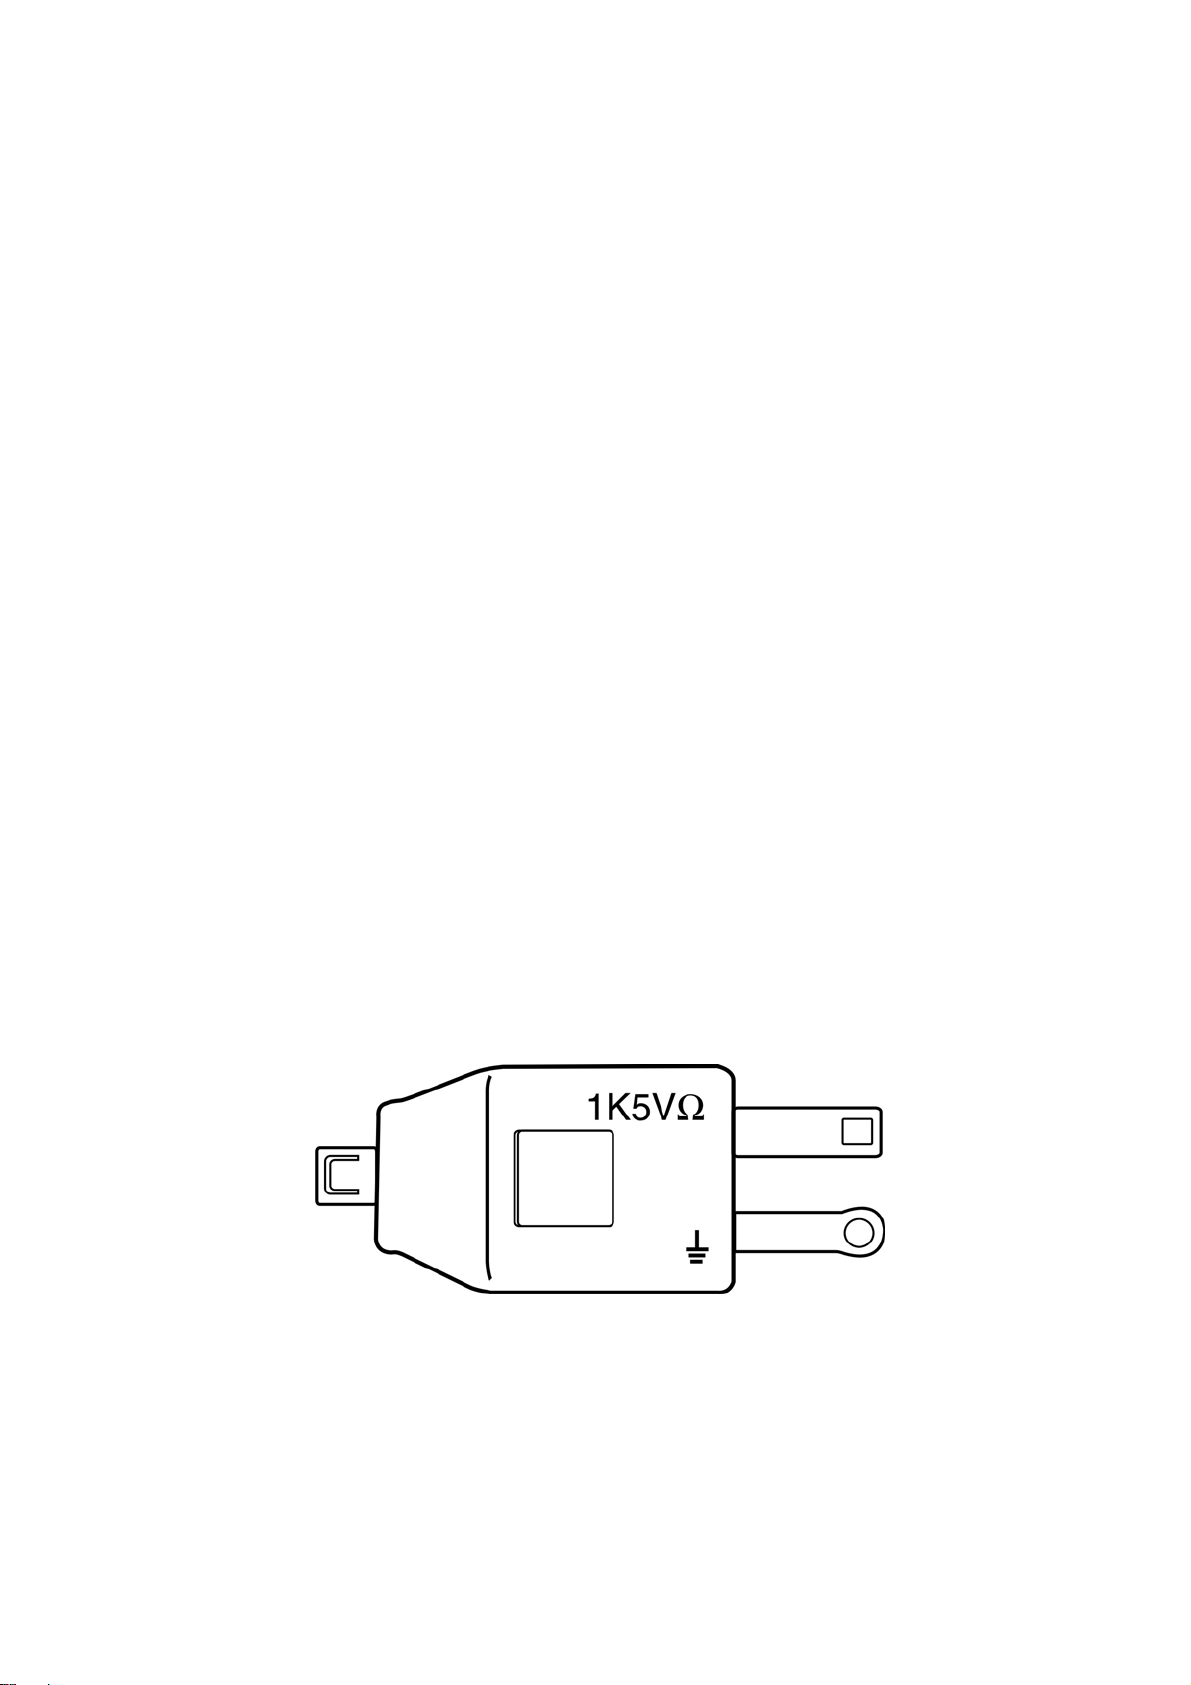
SQUAREWAVEOUTPUTTESTSIGNAL(5V,1KHZ)
The 5V Square Output is available on the jack at the left side of the meter.
The 5V digital output has a frequency of 1 KHz and can be used to adjust
the probe, as shown as Fig.39
Fig 39: Square-wave test signal
Fig 40: 5V square wave output adaptor
64
V5.1‐March2010
Page 66

USINGFFT(FASTFOURIERTRANSFORM)(MS420ONLY)
FFT breaks down signals into component frequencies, which the oscilloscope uses
to display a graph of the frequency domain of a signal (as opposed to the
oscilloscope’s standard time domain graph). These frequencies can then be
matched with known system frequencies, such as system clocks, oscillators, or
power supplies.
The FFT in this oscilloscope can transform 2048 points of a time-domain signal into
its frequency components with the final frequency containing 1024 points ranging
from 0Hz to the Nyquist frequency.
The following table describes the FFT menu:
Function Menu Setting Instruction
ON
Turn on FFT function
FFT
OFF
CH1
Turn off FFT function
Select CH1 as FFT source
Source
CH2
Select CH2 as FFT source
Rectangle
Blackman
Select window for FFT (details below)
Window
Hanning
Hamming
dB
Set Vrms as the vertical scale unit of measure
Format
Vrms
Set dBVrms as the vertical scale unit of measure
65
V5.1‐March2010
Page 67

*1
*2
Set multiple *1
Set multiple *2
Zoom
*5
*10
Set multiple *5
Set multiple *10
The steps below instruct on the operation of the FFT feature:
1. Press the MENU key; the function menu will appear on the right side of the
screen.
2. Press MENU ▲ or MENU ▼ to select FFT MODE. Five options will then be
available at the bottom of the screen.
3. Press F1 to turn FFT ON/OFF (the green waveform F will be shown
on the screen after the FFT calculation is completed).
4. Press F2 to switch between channel CH1 and CH2; the currently selected
channel is indicated at the top left of the screen.
5. Press F3 to switch to WINDOW with the following available options:
HAMMING、RECTANGLE、BLACKMAN, and HANNING.
6. Press F4 to switch to Format with the options: dB and Vrms.
7. Press F5 to zoom in/out; the magnification selections are: *1, *2, *5, *10.
8. If the FFT source is CH1, press the red button VOLTS POSITION ,
z One of the following three prompts will appear at the bottom-left of the screen
when the Format selection is set to dB.
— FFT dB level
— CH1 voltage level
— FFT vertical position
66
V5.1‐March2010
Page 68
z One of the following two prompts will display at the bottom-left of the screen
when the Format is set to Vrms.
— CH1 voltage level
— FFT vertical position
Press the blue button VOLTS POSITION; the following will appear:
— CH2 OFF
9. If the FFT source is CH2, press the blue button VOLTS POSITION ,
z One of the following three prompts will display at the bottom-left of the screen
when the Format is set to dB.
— FFT dB level
— CH2 voltage level
— FFT vertical position
z One of the following two prompts will display at the bottom-left of the
screen when the Format is set to Vrms.
Press the red button VOLTS POSITION; the following screen will appear:
—CH1 OFF
10. When the FFT source is CH1:
z If the display at the bottom left side of the screen is "
the red buttons VOLTS POSITION▲ and ▼ to adjust the dB value
-FFT dB level ", use
(the DIV selections include 1dB 2dB 5dB 10dB and 20dB).
z If the display at the bottom left side of the screen is "
-CH1 voltage
level", use the red buttons VOLTS POSITION▲ and ▼ to adjust the voltage
67
V5.1‐March2010
Page 69

of CH1 ("CH1 2v~ " appears at bottom side of the screen);
z If the display at the bottom left side of the screen is "
—FFT vertical
position", use the red buttons VOLTS POSITION▲ and ▼ to adjust the
position of the waveform along the vertical position. For example, "FFT 1.20
DIV (24.0dB)" indicates that the cursor departs from the center line for 1.20
DIV and "CH1 20dB" is shown on the bottom left side of the screen; the
arithmetic product is 24.0dB.
The operational steps are the same as above for the FFT source CH2:
11. Press the yellow OPTION key, the following prompts appear at the bottom left
side of the screen.
— CH1 horizontal base
— CH1 trigger level
Or
— CH1 horizontal position
— CH1 trigger level
Use the OPTION ◄ and OPTION ► menu buttons to adjust the position of the
waveform along the horizontal position. "FFT -2.00DIV (500.0Hz) " shown on the
bottom left indicates that the starting section of the waveform departs from the
beginning for 2.00DIV (250Hz/DIV). The displayed frequency M is the exact
frequency of the cursor point in the middle of spectrum (shown in Figure 41 below).
Use the OPTION ◄ and OPTION ► buttons to adjust the horizontal base; for
example, "250Hz/DIV (5KS/s".
68
V5.1‐March2010
Page 70
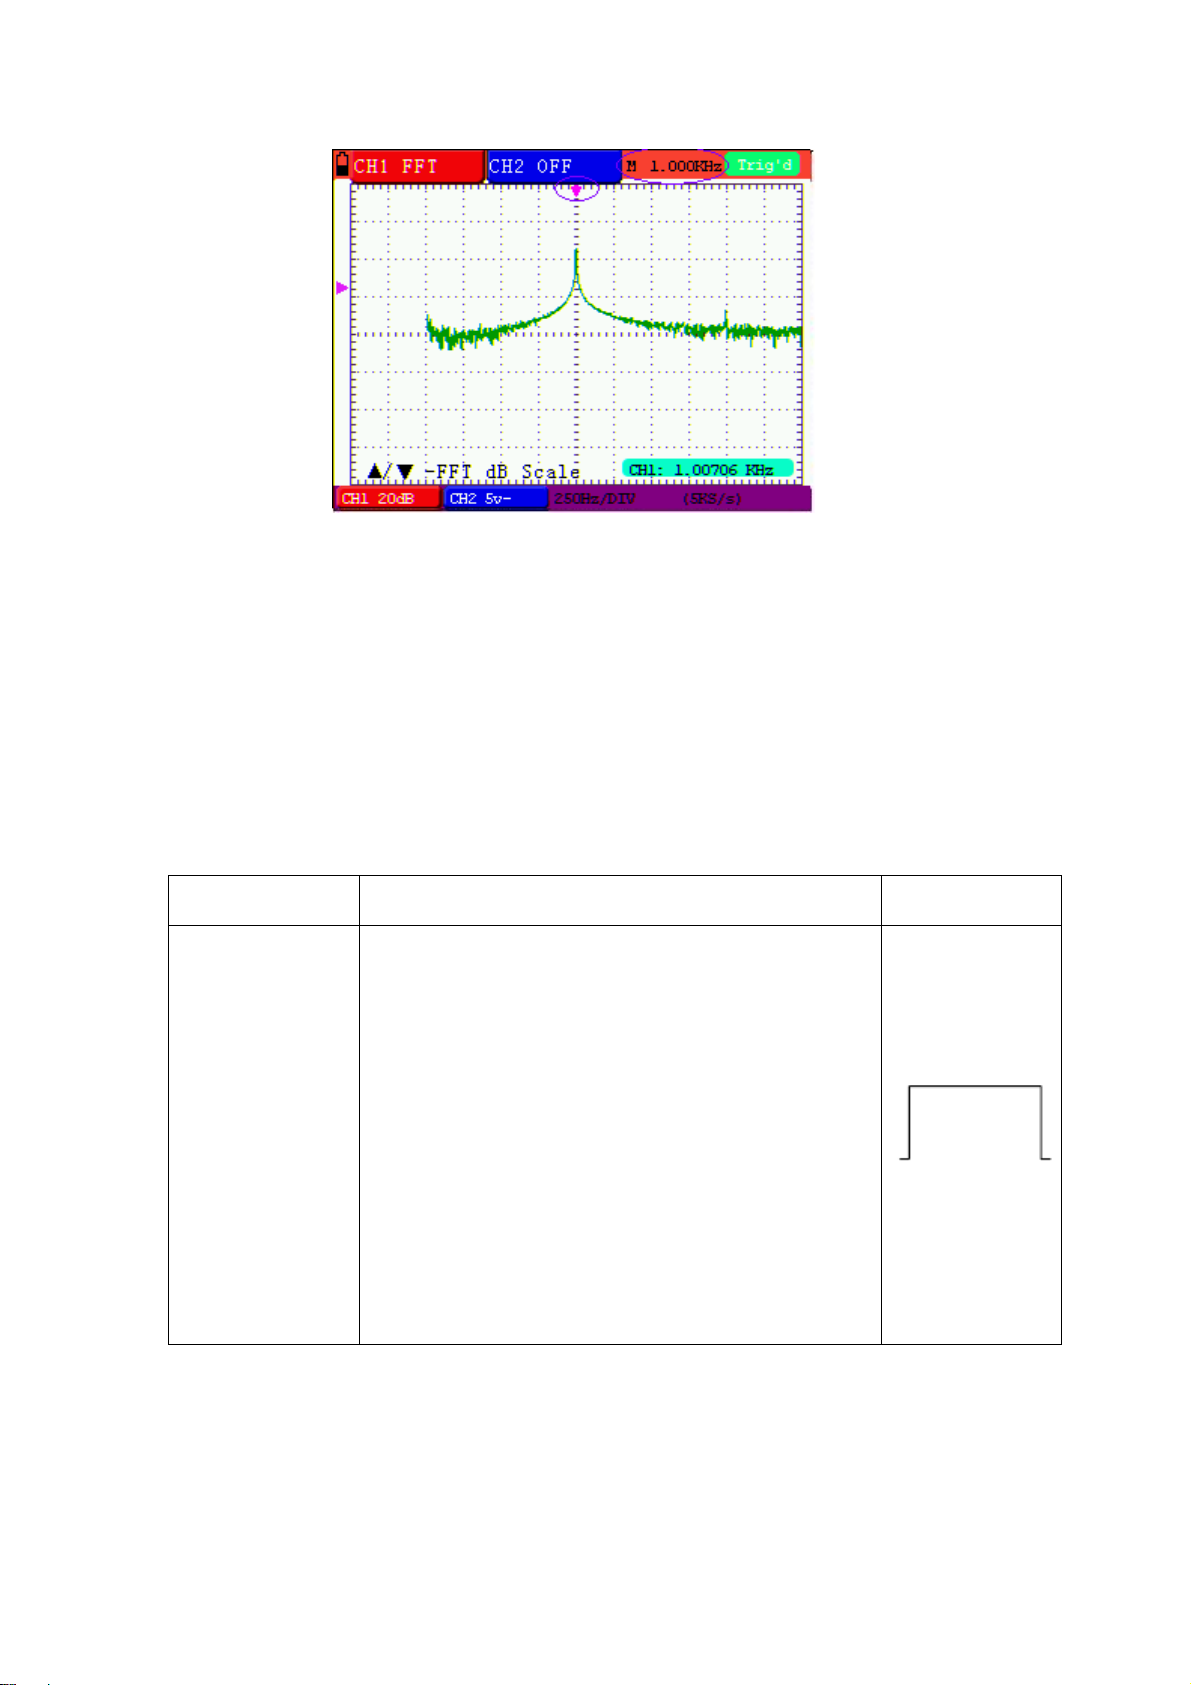
Selecting an FFT Window
Figure 41
■ The FFT feature provides four (4) windows. Each is a trade-off between frequency
resolution and magnitude accuracy. What is measured and what the source signal
characteristics are help determine which window to use. Use the following guidelines
to select the best window.
Type Description Window
Rectangle is the ideal window type for resolving
frequencies that are very close to the same value
but least desirable for accurately measuring the
amplitude of those frequencies. It is the ideal type
for measuring the frequency spectrum of aperiodic
signals and measuring frequency components near
Rectangle
DC.
Use rectangle for measuring transients or surges
where the signal level before and after the event
are nearly equal. Also, use this window for equalamplitude sine waves with frequencies that are
very close and for broadband random noise with a
relatively slow varying spectrum.
69
V5.1‐March2010
Page 71
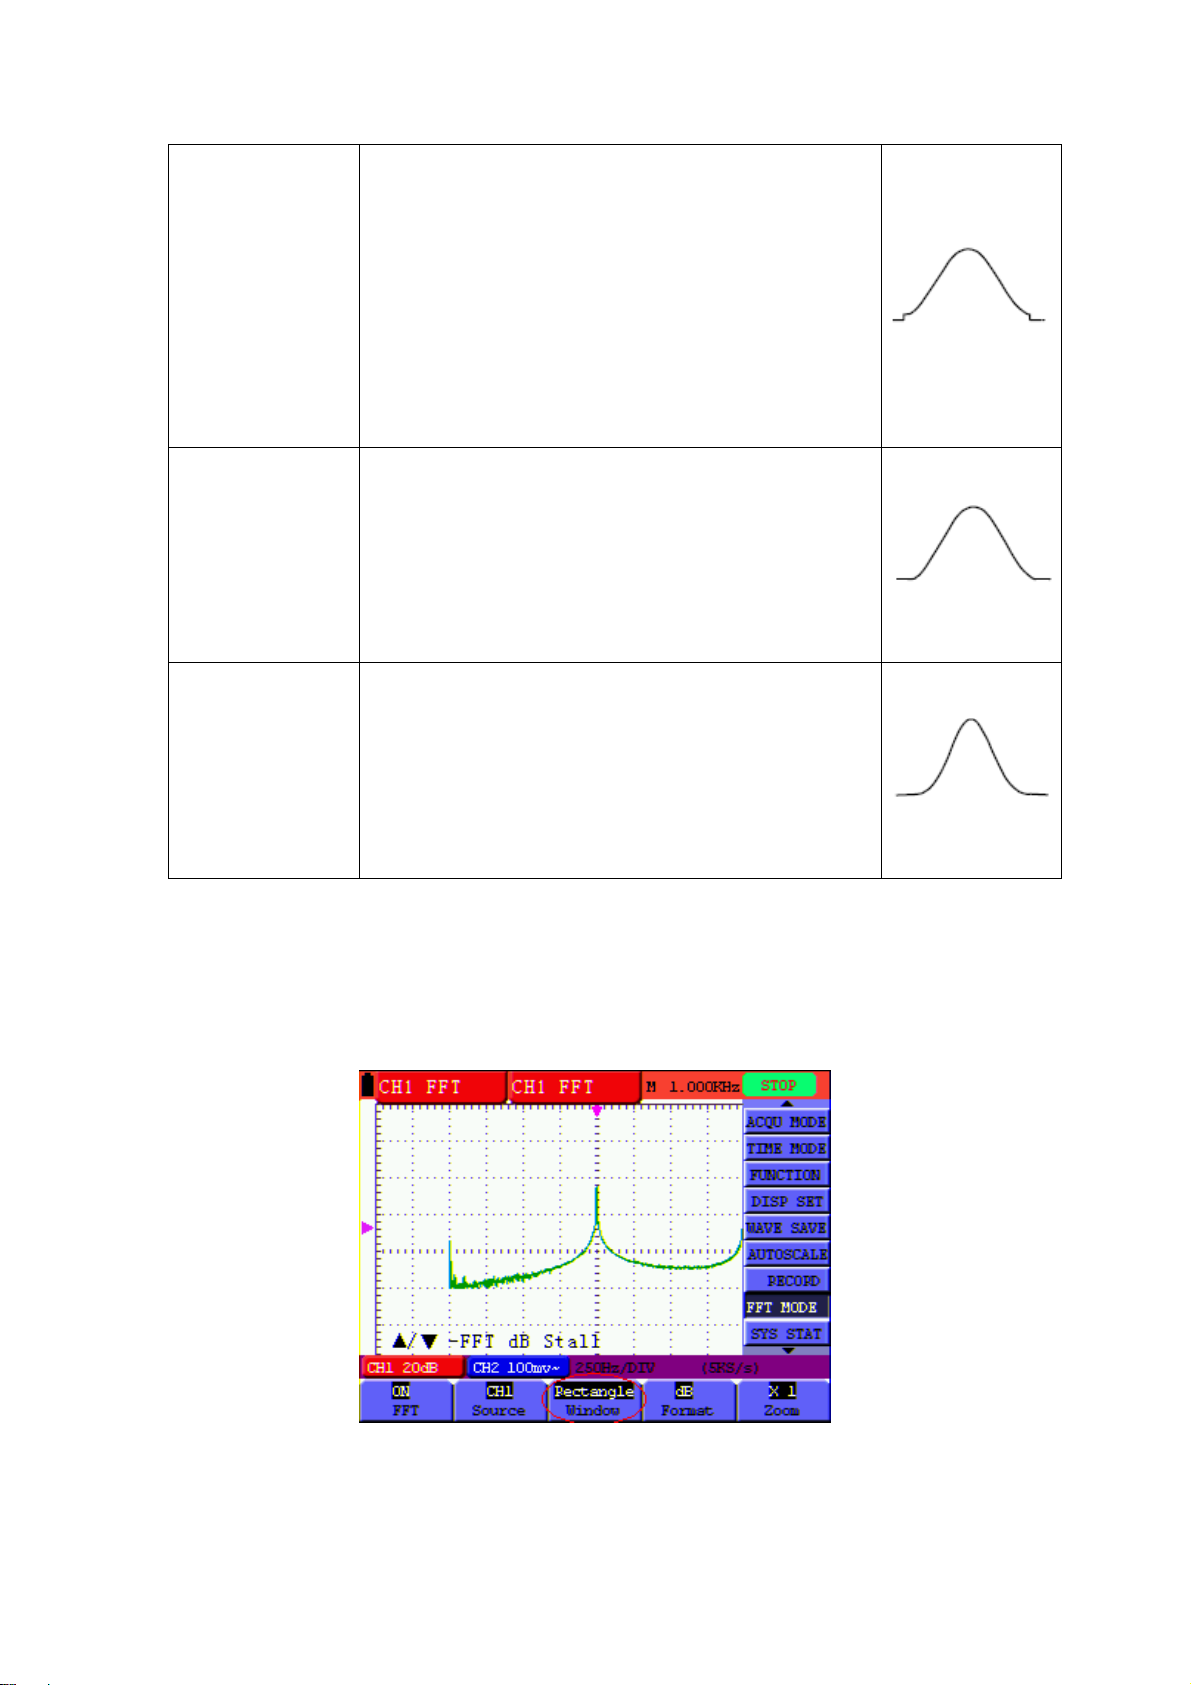
Hamming
This is a good window for resolving frequencies
that are very close to the same value with
somewhat improved amplitude accuracy over the
rectangle window. It has a slightly better frequency
resolution than the Hanning selection.
Use Hamming for measuring sine, periodic, and
narrow band random noise. This window works on
transients or surges where the signal levels before
and after the event are significantly different.
This is a good window for amplitude accuracy but
less so for resolving frequencies.
Hanning
Use Hanning for measuring sine, periodic, and
narrow band random noise. This window works on
transients or surges where the signal levels before
and after the event are significantly different.
This is the best window for measuring the
amplitude of frequencies but least useful for
resolving frequencies.
Blackman
Use Blackman-Harris for measuring predominantly
single frequency waveforms to examine higher
order harmonics.
Fig 42, 43, 44, 45 show four types of window functions referring to a sine wave of
1KHz.
70
V5.1‐March2010
Page 72
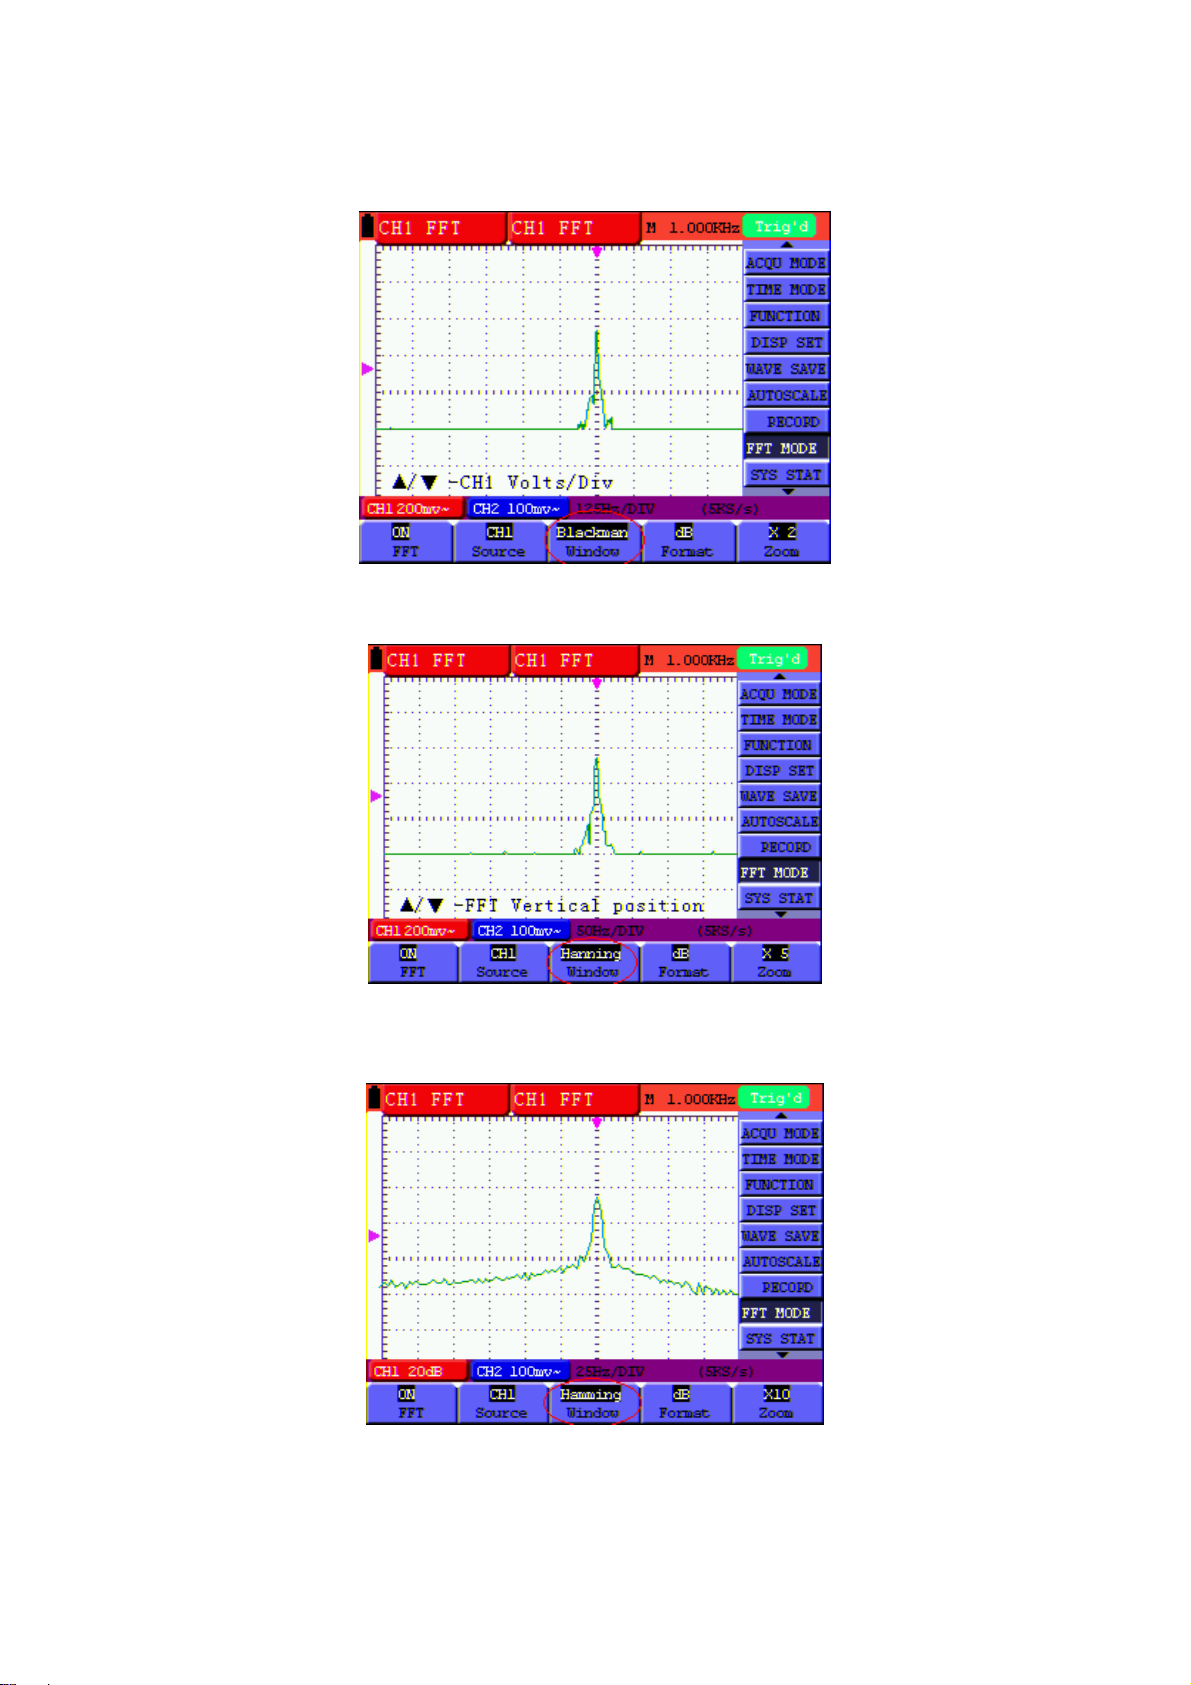
Fig 42 - Rectangle window
Fig 43 - Blackman window
Fig.44 - Hanning window
71
V5.1‐March2010
Page 73

Fig.45 - Hamming window
Quick Tips
If desired, use the zoom feature to magnify the FFT waveform.
Use the default dBV RMS scale to see a detailed view of multiple frequencies,
even if their amplitudes vary greatly. Use the linear RMS scale to see an overall
view of how frequencies compare.
Signals that have a DC component or an offset can cause incorrect FFT
waveform component magnitude values. To minimize the DC component, choose
AC Coupling on the source signal.
To reduce random noise and aliased components in repetitive or single-shot
events, set the oscilloscope acquisition mode to ‘average’.
NOTE 1:
Nyquist frequency: The highest frequency that a Real Time Digital Oscilloscope
can measure at exactly half the sampling rate is called the Nyquist frequency. If
under-sampling occurs when the frequency sampled is higher than the Nyquist
frequency, “False Wave” phenomenon will occur. The relationship between the
frequency being sampled and measured is of great importance in this context.
NOTE 2:
In FFT mode, the following settings are prohibited:
1) Window set
2) Changing the source channel (in CH1 Setup or CH2 Setup menu)
72
V5.1‐March2010
Page 74

3) XY Formatting in the DISPLAY SET mode
4) “SET 50%” (trigger level at the vertical point of the signal amplitude) in the
Trigger setting mode
5) Autoscale
6) Wave recording
7) Measure 1 and Measure 2
73
V5.1‐March2010
Page 75
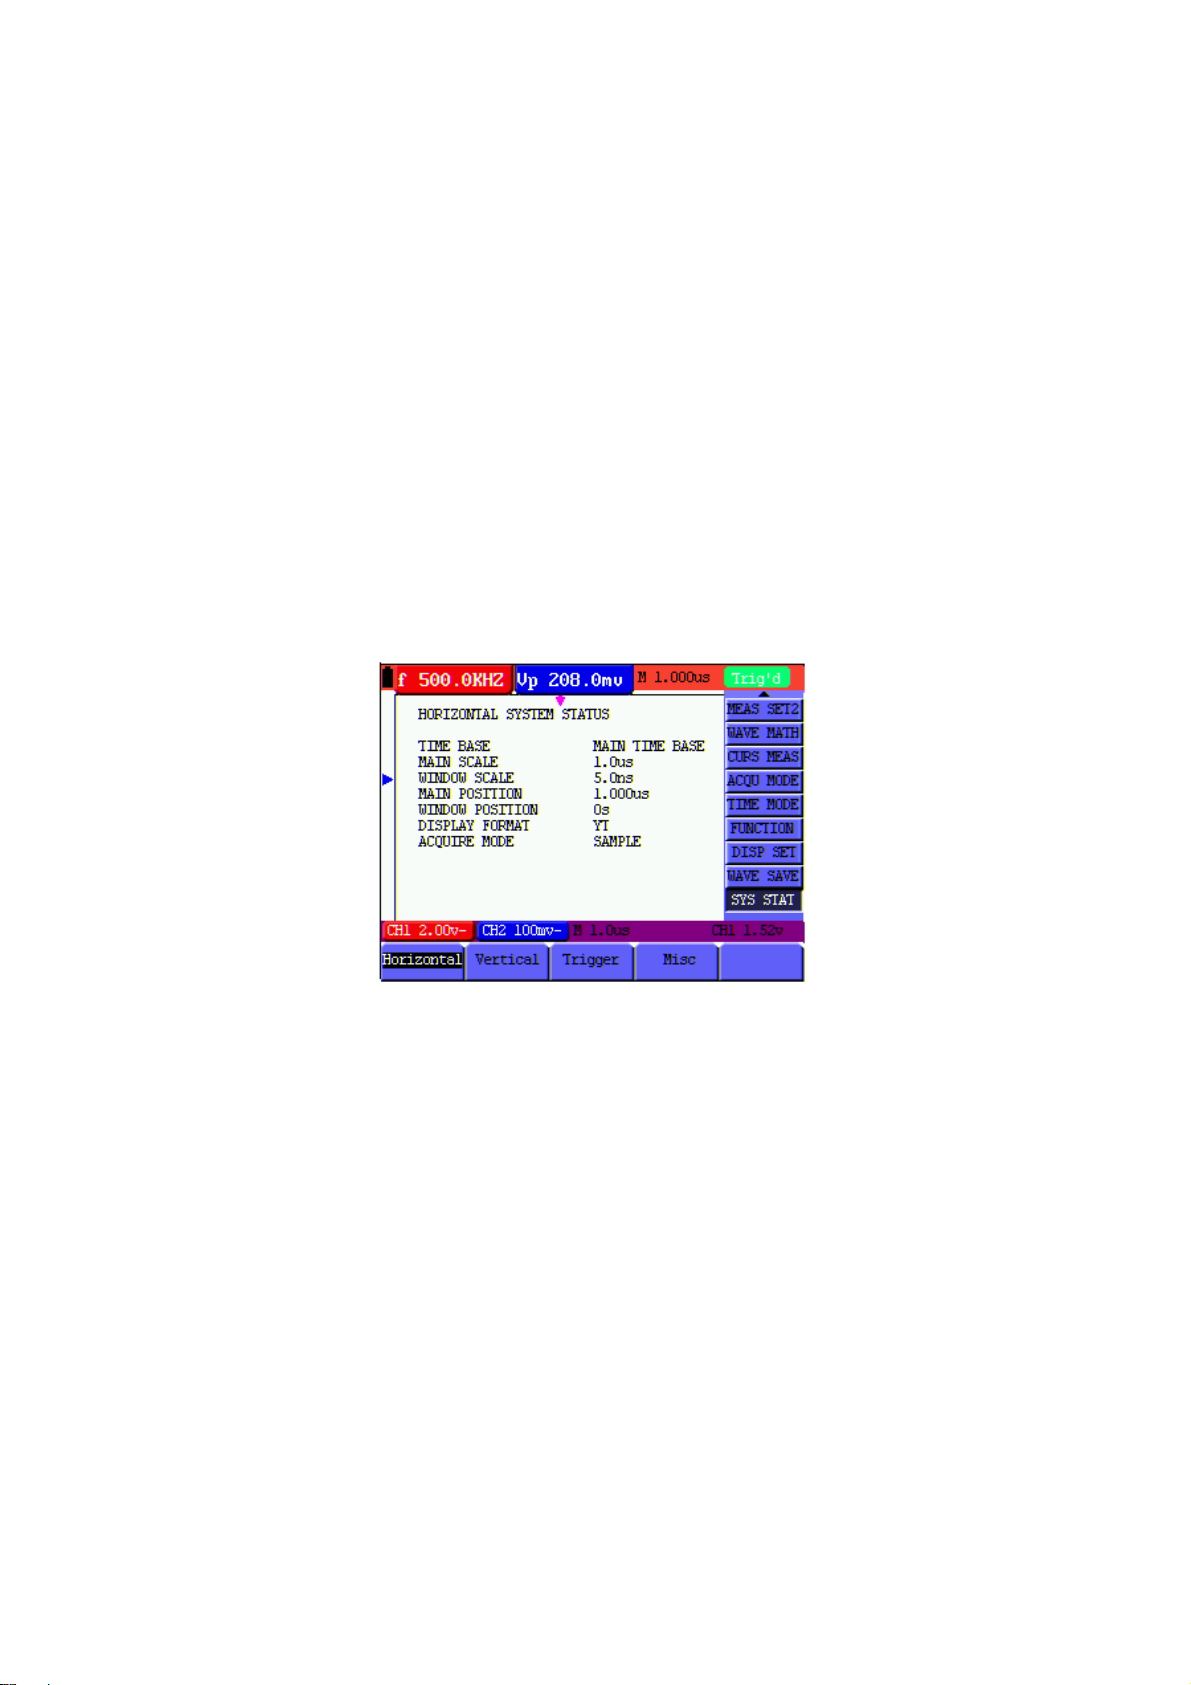
SYSTEMSTATUSMENU
The system status menu is used to display configuration information concerning
horizontal, vertical, trigger, and other systems. Follow the steps below to check status:
1. Press the MENU key; the function menu will then appear at the right side of the
screen.
2. Press the MENU ▲ or MENU ▼ key to select SYSTEM STAT. Four (4) selectable
options will then appear at the bottom of the screen.
3. Sequentially press F1 through F4 to view the corresponding status information.
Refer to Figure 46.
Figure 46:
System Status
74
V5.1‐March2010
Page 76
MAINTIMEBASEMODE
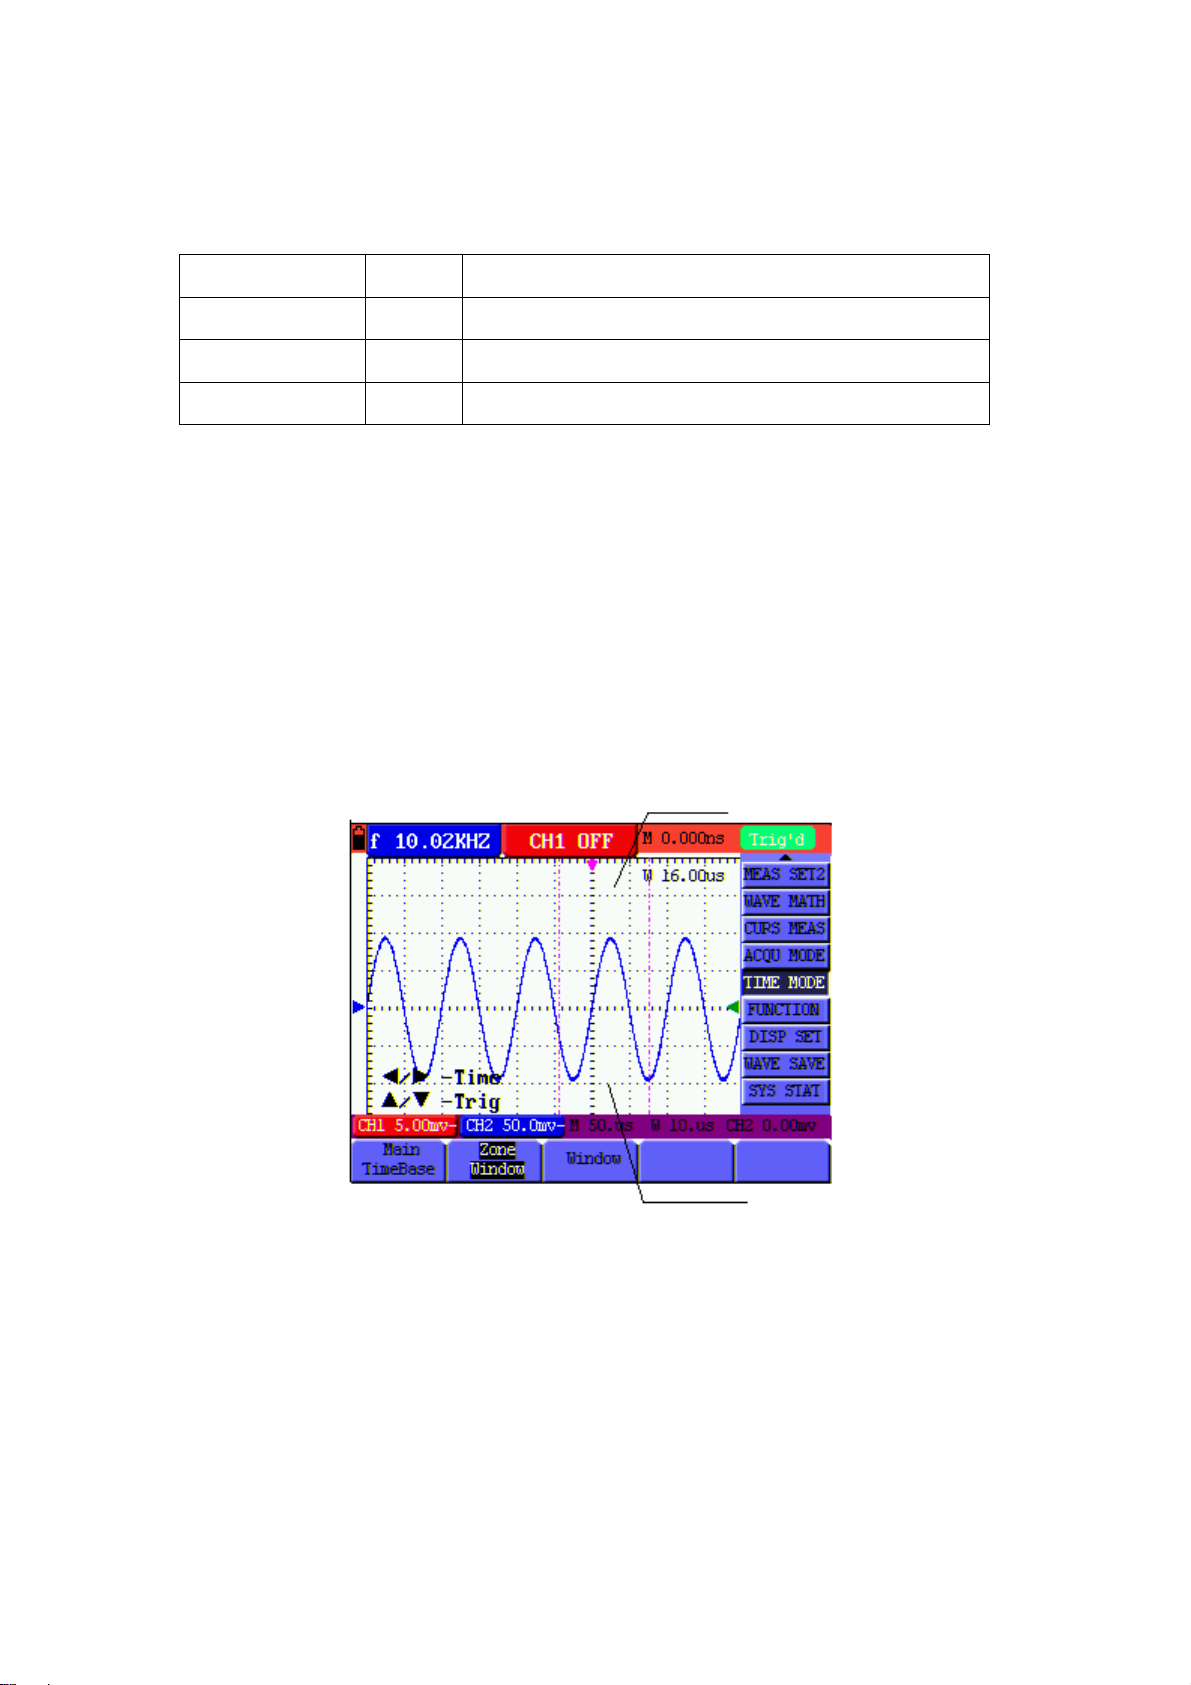
The time base mode menu is explained as the following table.
Function menu Setting Explanation
Main Time Base Horizontal main time base
Zone Window Use the two cursors to define a zoom window area
Window Full-screen display
To zoom in on a small area of the display, perform the following steps:
1. Press MENU to view the function menu on the right side of the screen.
2. Press MENU ▲ or MENU ▼ to select the TIME MODE. Three (3) selectable options
will then appear at the bottom of the display.
3. Use the Soft-keys F1, F2, and F3 to select the Main Time Base, Zone Window, or
Window functions as described in the Table above.
4. Use the OPTION key and the◄
the Time Base and size of the window zoom.
Refer to Figures 47 and 48.
Figure 47: Original Window Setting
(yellow) and ► (yellow) keys to adjust and vary
75
V5.1‐March2010
Page 77
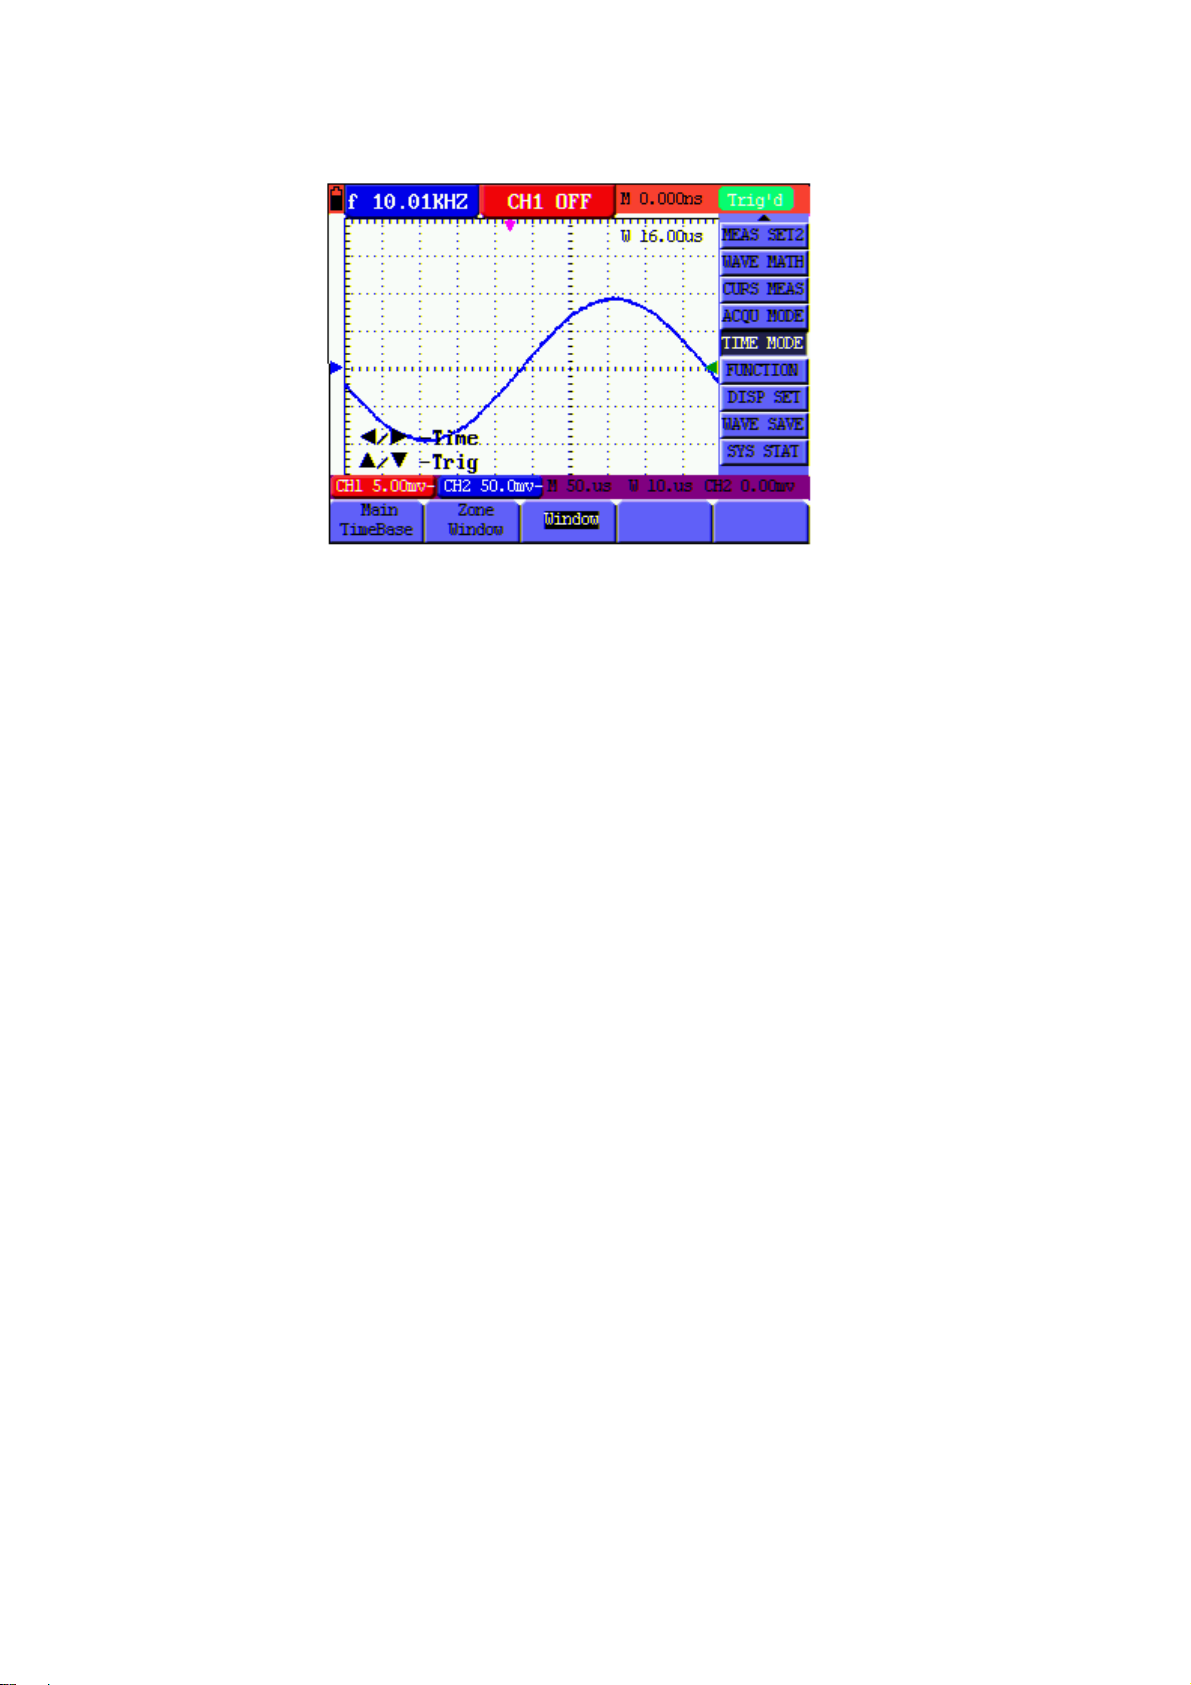
Figure 48: Window Zoom
PCDATATRANSMISSION
For PC data transmission, perform the following steps:
1. Press MENU; the function menu will then appear on the right side of the screen
2. Press MENU ▲ or MENU ▼ to select the display setting mode DISP SET; the
display will show four (4) selectable options at the bottom of the screen
3. Press the F4 key; select Bitmap or Vectors
4. Connect the oscilloscope to the PC using the supplied data transmission cable
5. Install and open the supplied software
6. Use the software as described in the software’s HELP utility
76
V5.1‐March2010
Page 78
User'sGuide
ModelMS46060MHzDigitalOscilloscope
ModelMS42020MHzDigitalOscilloscope
SECTIONTWO:MultimeterOperation
77
V5.1‐March2010
Page 79

78
V5.1‐March2010
Page 80

USING THE MULTIMETER
ABOUTTHISCHAPTER
This chapter provides step-by-step instructions for using the Multimeter functions.
These instructions also provide basic examples of menus and other basic operations.
MAKINGMETERCONNECTIONS
Use the four 4-mm safety banana jack inputs for the Meter functions: COM, V/Ω/C,
10A, mA.
The four (4) banana jack inputs on the face of the meter are, L to R, 10A current, mA
current, COM (ground/negative), and Volts/Resistance/Capacitance
MULTIMETERDISPLAYWINDOW
Figure 1: Multimeter Display Window
79
V5.1‐March2010
Page 81

Description
1. Battery status indicator
2. Manual range indicator. In MANUAL mode the user selects the measurement
range
3. Measurement mode indicators:
DCV: DC Voltage measurement
ACV: AC voltage measurement
DCA: Direct current (DC) measurement
ACA: AC current measurement
R: Resistance measurement
: Diode measurement
: Continuity measurement
C: Capacitance measurement
4. Relative measurement mode indicator
5. RUN: Continuous update mode. STOP: Display data hold mode
6. The reference value in the relative measurement mode
7. (X10) reading multiplier
8. Unit of measure indicator and measurement reading
9. Automatic range mode (AUTO). Meter automatically selects measurement range
10. Absolute / Relative measurement modes: The “||” symbols represents absolute
measurement (normal) mode. The “ ” symbol represents the relative mode
11. Manual measurement control (user selects measurement range)
12. Color coded scale indicator; Each test mode has a unique color scheme
80
V5.1‐March2010
Page 82

MAKINGMULTIMETERMEASUREMENTS
Press the DMM/OSC key; the oscilloscope will switch to the multimeter mode. The
meter will prompt the user to correctly insert the test leads. Use the A, V, and R keys
to select the desired multimeter function.
MEASURING RESISTANCE
To measure resistance, first remove power from the component or circuit under test
and then follow these steps:
1. Insert the black lead into the COM banana jack input and the red lead into
the V/Ω/C banana jack input
2. Press the R key. An ‘R’ appears at the top of the screen
3. Connect the red and black test leads to the resistor or circuit under test. The
resistance value will appear on the screen (unit of measure: Ohms)
Refer to the example diagram below in Figure 2.
Figure 2: Resistance Measurement
MEASURING DIODE VOLTAGE
To make a measurement on the diode, do the following:
1. Insert the black lead into the COM banana jack input and the red lead into
the V/Ω/C banana jack input
2. Press the R key. An ‘R’ appears at the top of the screen
3. Press the SET key repeatedly until the diode symbol is displayed
4. Connect the red and black leads to the diode and read the displayed voltage
(V)
81
V5.1‐March2010
Page 83

5. Reverse the test lead polarity and perform the test again Refer to the
example display screen in Figure 3.
82
V5.1‐March2010
Page 84

Figure 3: Diode Measurement
CONTINUITY TEST
To perform a resistance continuity test, refer to the following:
1. Insert the black lead into the COM banana jack input and the red lead into
the V/Ω/C banana jack input
2. Press the R key. An ‘R’ appears at the top of the screen
3. Press the SET key repeatedly until the following is shown on the screen:
4. Connect the red and black leads to the test points. If the resistance value is
lower than 50Ω the meter will emit an audible tone
The meter display will also show the resistance as shown in example Figure 4.
83
V5.1‐March2010
Page 85

Figure 4: Continuity Test
84
V5.1‐March2010
Page 86

MEASURING CAPACITANCE
To measure Capacitance, refer to the following:
1. Insert the black lead into the COM jack, and the red lead into the V/Ω/C jack
2. Press the R key. An ‘R’ appears at the top of the screen
3. Press the SET key until the C appears at the top of the screen
4. Connect the black and red leads to the capacitor or circuit under test; the
meter will display the reading (Unit of measure: Farad)
Notes: To improve accuracy when the measured value is lower than 5 nF, select the
lowest capacitance range and use the Relative mode.
Please allow approx. 30 seconds for capacitance measurements larger than 40uF.
Refer to the example diagram in Figure 5.
Figure 5: Capacitance Measurement
MEASURING DC VOLTAGE
To measure DC voltage, refer to the following:
1. Insert the black lead into the COM banana jack input and the red lead into
the V/Ω/C banana jack input
2. Press the V key and the DCV symbol will appear at the top of the screen
3. Connect the red and black test leads to the measurement points on the
circuit under test; the voltage value will be displayed on the screen
Refer to the example diagram, Figure 6.
85
V5.1‐March2010
Page 87

Figure 6: DC Voltage Measurement
MEASURING AC VOLTAGE
To measure AC voltage, refer to the following:
1. Insert the black lead into the COM banana jack input and the red lead into
the V/Ω/C banana jack input.
2. Press the V key and then press SET so that the ACV symbol appears at the
top of the screen
3. Connect the red and black leads to the measured points and the AC voltage
values of measured points will be displayed on the screen.
Refer to the example diagram in Figure 7.
Figure 7: AC Voltage Measurement
86
V5.1‐March2010
Page 88
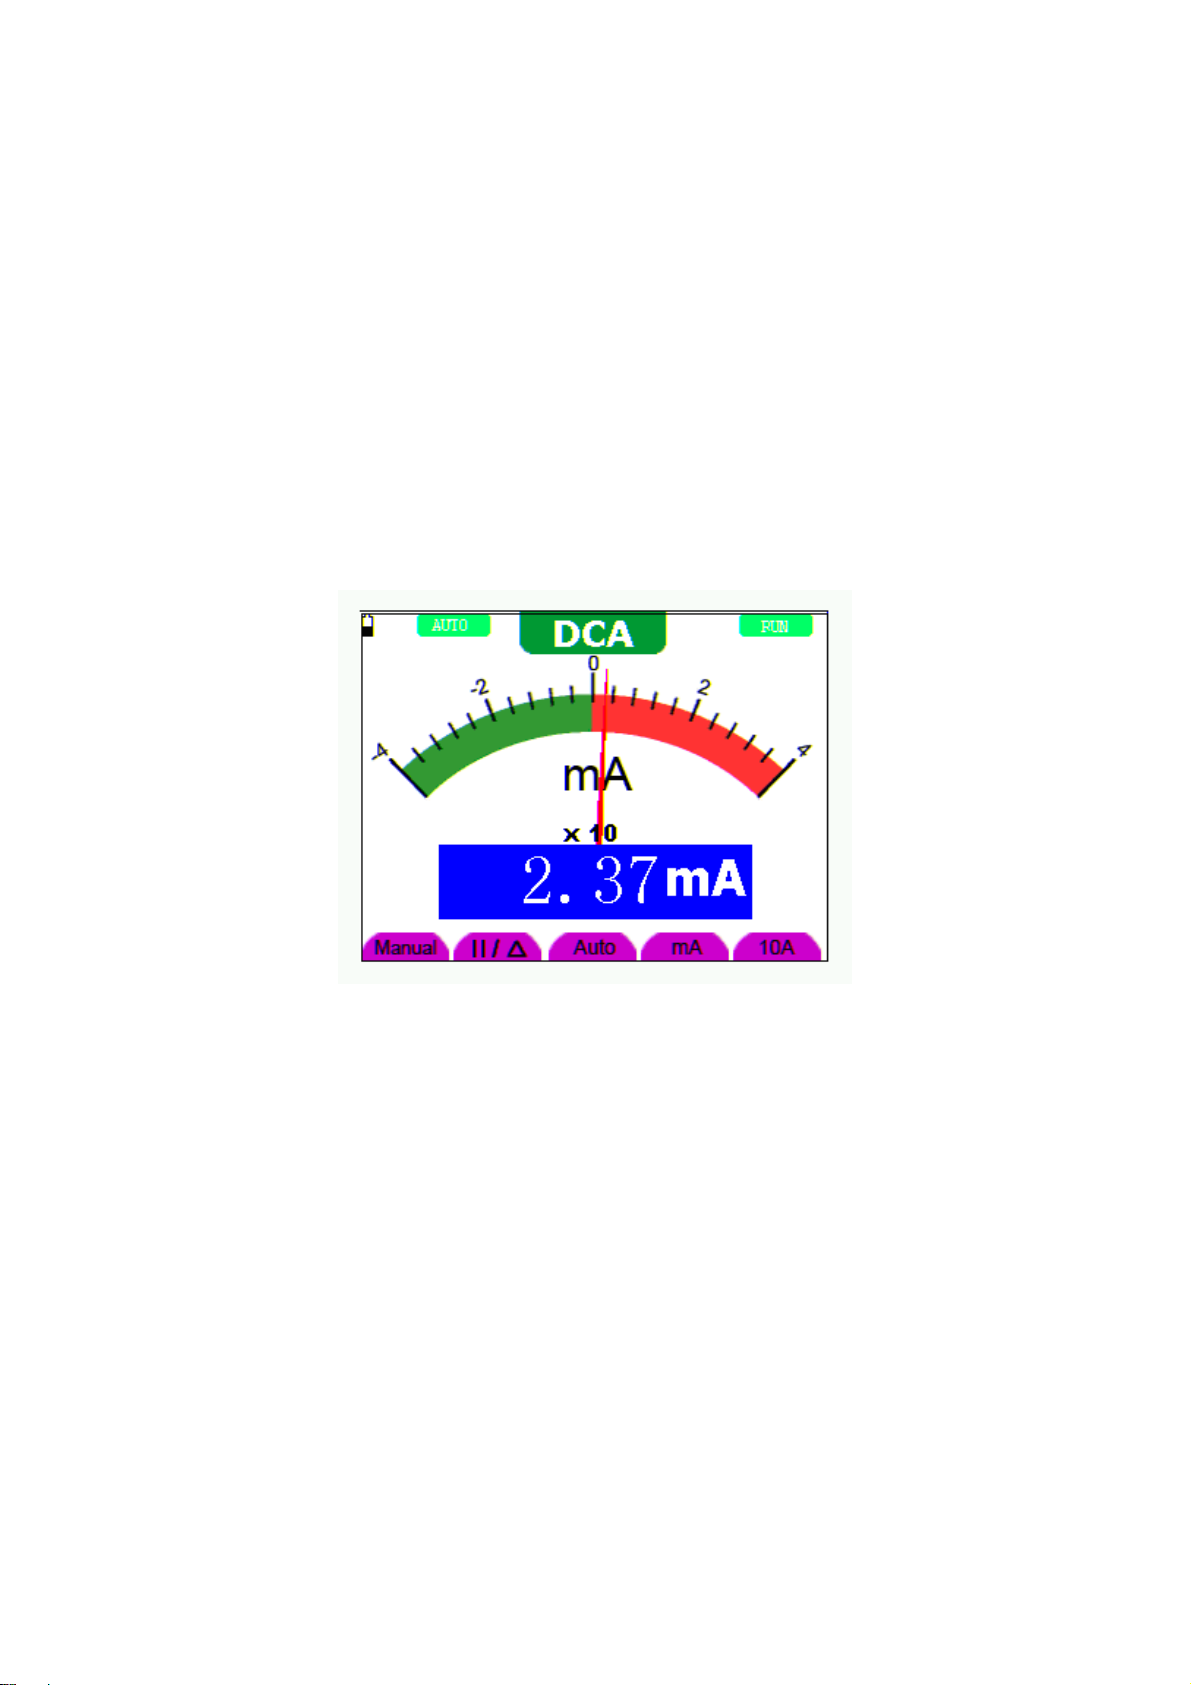
MEASURING DC CURRENT
To measure a DC current lower than 400 mA, do the following:
1. Insert the black lead into the COM banana jack input and the red lead into the
mA banana jack input
2. Use the A key and the SET key as needed to select the DCA mode (the DCA
symbol will appear at the top of the screen
3. Ensure that the displayed unit of measure on the main reading screen is mA.
Use the F4 soft-key to select mA if necessary.
4. Connect the red and black leads to the measured points on the circuit under test;
the DC current value will be displayed on the screen.
Refer to the example diagram in Figure 8.
Figure 8: 400mA DC Current Measurement
To measure a DC current larger than 400 mA, perform the following:
1. Press the A key and the DCA symbol should appear at the top of the screen.
Use the SET key to select DCA if necessary.
2. Press the F5 soft-key to select the 10A measurement mode, the unit of measure
on the main reading screen should be A.
3. Connect the red and black test leads to the measured points on the circuit under
test; The DC current value will be displayed on the screen.
4. Press the F4 soft-key to return to the mA measurement mode
Refer to the example in Figure 9.
87
V5.1‐March2010
Page 89

88
V5.1‐March2010
Page 90
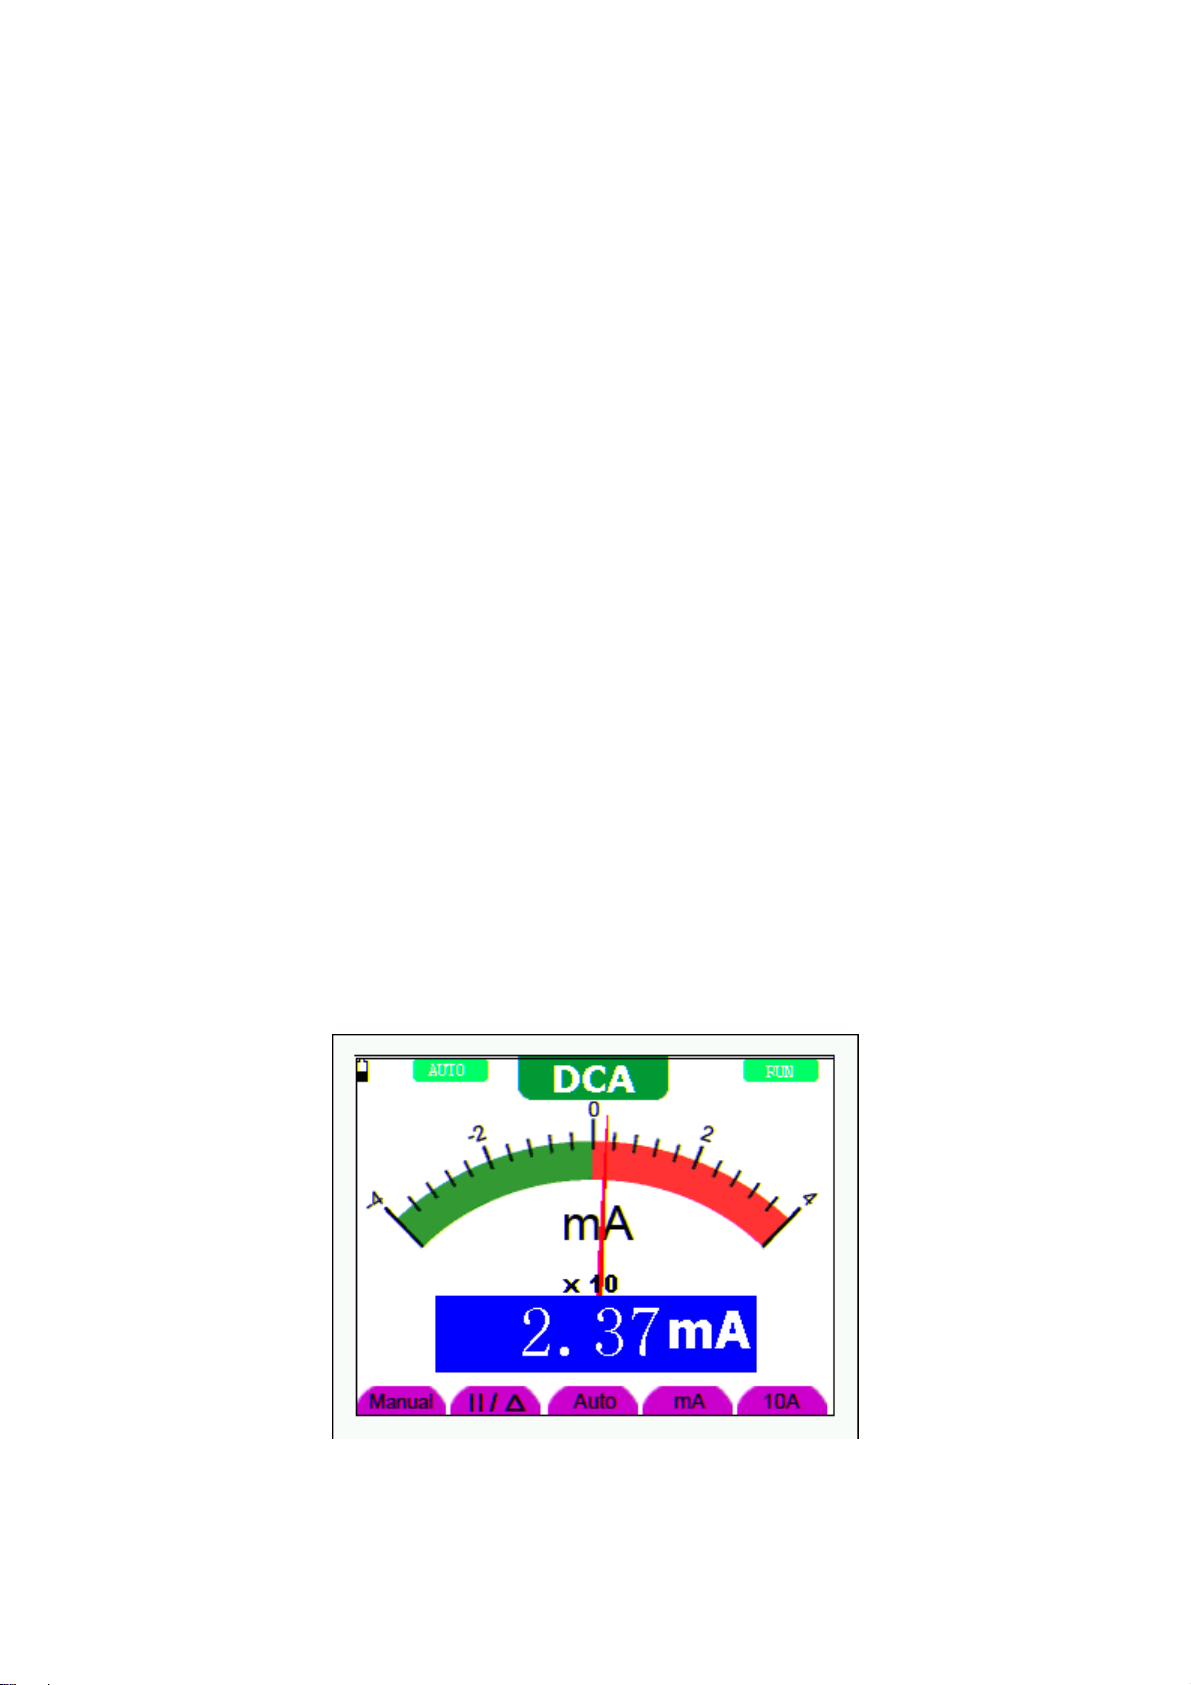
Figure 9: 10A DC Current Measurement
MEASURING AC CURRENT
To measure AC current lower than 400 mA, perform the following:
1. Insert the black lead into the COM banana jack input and the red lead into the mA
banana jack input
2. Press the A key and then the use the SET key to select the ACA mode. The ACA
symbol will appear at the top of the screen when selected
3. Use the F4 soft-key to select the mA mode
4. Connect the red and black leads to the measured points on the circuit under test;
The AC current value will be displayed on the screen.
Refer to the example in Figure 10.
89
V5.1‐March2010
Page 91

Figure 10: 400mA AC Current Measurement
90
V5.1‐March2010
Page 92

To measure AC current larger than 400 mA, perform the following:
5. Press the A key and use the SET key to select the ACA mode (ACA symbol will
appear at the top of the screen when selected)
6. Press the F5 soft-key to select the 10A measurement mode, the unit of measure
on the main reading screen should be A
7. Connect the red and black test leads to the measured points on the circuit under
test; The AC current value will be displayed on the screen.
8. Press the F4 soft-key to return to the mA measurement mode
Refer to the example in Figure 11.
Figure 11: AC Current Measurement for 10A
FREEZING THE READINGS (DATA HOLD)
You can hold the displayed readings at any time.
1. Press the RUN /STOP key to freeze the screen. STOP will be displayed at the
top right of the screen
2. Press the RUN /STOP key again to resume normal measurement operation
Refer to the example in Figure 12.
91
V5.1‐March2010
Page 93

Figure 12: Freezing the Readings
TAKING A RELATIVE MEASUREMENT
The meter can display a reading ‘relative’ to a user-selectable reference value. Refer
to the following discussion on how to make a relative measurement.
First program a reference value. To do so, take a measurement and when the
desired reading is displayed press the “||/ ” soft-key until the ‘ ’ symbol is displayed
at the top of the screen; this indicates that the unit is in the Relative mode. The
reference value is shown on the display screen just below the relative mode symbol.
Now all subsequent readings in the main display area will be displayed relative to the
reference value.
92
V5.1‐March2010
Page 94

SELECTING THE AUTOMATIC / MANUAL RANGE MODES
The default mode of the instrument is the automatic range. To switch to the manual
range, perform the following steps:
1. Repeatedly press the F1 MANUAL soft-key until the desired range is selected on the
meter’s display. MANUAL will be displayed on the upper left hand corner of the
meter’s display when in the manual mode
2. In the manual range mode, the measuring range is increased by one stage with each
press of the F1 key. When the highest range is reached, the meter jumps to the
lowest range
3. Press the F3 soft-key to select the AUTO range mode. AUTO will display on the
upper left side of the screen.
Refer to the display example in Figure 13.
Figure 13: Automatic/Manual Range Adjustment
93
V5.1‐March2010
Page 95

94
V5.1‐March2010
Page 96

FAQ
The oscilloscope does not power up
Check that the battery is charged. If the battery is not charged, plug the AC Adaptor charger
into an AC source and then into the meter. Charge the battery for at least 15 minutes before
using the Oscilloscope. Please contact Extech for service if the instrument fails to power on
after a charge
The oscilloscope shuts down after operating for only several seconds
The battery is most likely very weak or completely drained; Check the displayed battery status
symbol. The
symbol indicates that the battery is exhausted and must be charged.
The meter displays ERR when in the Multimeter mode
The measurement mode is likely not selected. In this case, press any of the three mode keys
V, A or R
The measured voltage value is 10 times larger or smaller than the actual
value indicated in the oscilloscope mode
Check that the channel attenuation level matches the actual probe attenuation ratio
A waveform is displayed on the oscilloscope screen but is not stable
Check whether the signal item in the trigger mode menu matches the actual signal channel.
Check the trigger mode: The edge trigger mode is typically used for most applications; the
video trigger mode is applicable for video signals. Only when the proper trigger mode is
applied can the waveform be stable.
Change the trigger coupling into the HF rejection and LF rejection to filter the HF or LF noise
trigger by the interference.
No display when the RUN/STOP key is pressed in oscilloscope mode
Check whether the trigger mode in the trigger mode menu is in Normal or Single Shot and
whether the trigger level is outside of the waveform’s range.
In such conditions, adjust the trigger level to be in the middle of the range or select the non-
auto trigger mode. Additionally, press the AUTO SET key and re-try the previous suggestions.
95
V5.1‐March2010
Page 97

When using average sampling in the sampling mode or when selecting a long display time in
the oscilloscope display mode, the display speed is slow; this is normal
96
V5.1‐March2010
Page 98
APPENDICES
APPENDIXA:SPECIFICATIONS
OSCILLOSCOPE
Unless otherwise indicated, all technical specifications are applicable to the 10X probe
attenuation switch setting. The oscilloscope should meet the following requirements in
order to meet the published specifications.
■ The instrument should be allowed to run continuously for more than 30 minutes under
the specified operating temperature
■ If the operating temperature is exceeded by more than 5 degrees Celsius, an “Auto-
calibration” must be performed (system function menu)
Sampling
Sampling modes Normal sampling, Peak detection, Average value
Sampling rate 100MS/s (MS420), 250MS/s (MS460)
Input
Input coupling DC, AC
Input impedance 1MΩ ±2% connected in parallel with 20pF ±5pF
Probe attenuation coefficients 1X, 10X, 100X, 1000X
Max. Input voltage 400V (peak)
Channel delay time(typical)
150ps
Horizontal
Sampling rate range
Waveform interpolation
Data record length 6K points for each channel
10S/s~100MS/s
(sin x)/x
Scanning speed range(S/div) 5ns/div~5s/div, steps in “1-2.5-5” mode
Sampling rate relay time
accuracy
Time interval Single: ± (1 sampling interval time + 100ppm × rdg +
±100ppm (time interval equal to or larger than 1ms)
0.6ns)
97
V4.0‐March2010
Page 99

( T) measurement
accuracy(full bandwidth)
Average 16 : ± (1 sampling interval time
+100ppm×reading+0.4ns)
98
V4.0‐March2010
Page 100
Vertical
Analog digital converterA/D 8 bits resolution (both channels synchronously)
Sensitivity range V/div 5mV/div5V/div(for the BNC connector input
Displacement range
± 10 div (MS420),
±2V(5mV/div~200mV/div),
±50V(500mV/div~5V/div)(MS460)
Analog bandwidth 60MHz (MS460); 20MHz (MS420)
Single bandwidth Full bandwidth
Low frequency response
(A/D coupling, -3dB)
Rise time ≤17.5ns (MS420) , ≤5.8ns (MS460)
DC gain accuracy ±5%
DC measurement (accuracy
average value sampling
mode
Trigger
≥ 5Hz (BNC connector
The voltage difference between any two points on
the waveform after averaging the captured
waveforms is greater than 16: ± (5% reading + 0.05
divisions)
DC
CH1 and CH2: 1div (DCfull bandwidth) Trigger sensitivity
coupling
Edge trigger
AC
coupling
Same as the DC coupling when it is equal
to or larger than 50Hz.
Triggering level range ±6 divisions from the screen center
Triggering level accuracy
±0.3 divisions
(typical) which is applicable
to the signal with rise and
fall time equal to or longer
than 20ns
Trigger displacement 655 divisions for pre-triggering and 4 divisions for post-
triggering
50% level setting (Typical). Operation with the input signal frequency equal to or
larger than 50Hz.
99
V4.0‐March2010
 Loading...