

OfiTE 150-80, 150-80-1 Instruction Manual
Dynamic Linear Swell Meter
with Compactor
#150-80 - 115V
#150-80-1 - 230V
Software Version 3.09.0
Instruction Manual
Updated 6/28/2018
Ver. 6.0
OFI Testing Equipment, Inc.
11302 Steeplecrest Dr. · Houston, Texas · 77065 · U.S.A.
Tele: 832.320.7300 · Fax: 713.880.9886 · www.ote.com
©
Copyright OFITE 2015

Table of
Intro..................................................................................................2
Safety ............................................................................................... 2
Contents
Components ...................................................................................3
Installation.......................................................................................4
Software ..........................................................................................6
Zeroing the Channels ..................................................................8
Calibration ................................................................................... 9
Starting a Test ........................................................................... 10
Setup ......................................................................................... 12
Analog Input .............................................................................. 13
Operation.......................................................................................14
Sample Data .................................................................................. 15
Graph 1 .....................................................................................16
Graph 2 .....................................................................................17
Graph 3 .....................................................................................18
Graph 4 .....................................................................................19
Compactor ....................................................................................20
Assembly ..................................................................................20
Making Wafers ..........................................................................22
Disassembly .............................................................................. 23
Drawings .......................................................................................24
Cup Assembly ...........................................................................24
Head Assembly .........................................................................25
Main Assembly ..........................................................................26
Wafer Die ..................................................................................27
Warranty and Return Policy ........................................................28
OFITE, 11302 Steeplecrest Dr., Houston, TX 77065 USA / Tel: 832-320-7300 / Fax: 713-880-9886 / www.ote.com
1
Intro
The OFITE Dynamic Linear Swell Meter is a highly effective method of
examining the interaction between water based uids and mineral samples
containing reactive clays under simulated conditions while uid is in motion.
The observed swelling characteristics are utilized to anticipate and/or correct
the oftentimes unpredictable problems that are frequently encountered while
drilling in shale formations. It is a very useful tool when designing drilling
uids or when testing the behavior of existing muds because it shows the
changes in the clay/uid interaction for short periods of time (0 - 5 minutes) as
well as longer periods (>350 minutes). Bit balling, pipe drag, hole sloughing
and other “Gumbo” related shale problems may be predicted in advance,
enabling the operator to select the proper drilling uid and therefore achieve a
stable wellbore environment.
The OFITE multiple channel Dynamic Linear Swell Meter features multiple
measuring heads for simultaneously testing up to eight (8) cores or drilling
uids. A mineral (shale, core sample, cuttings, crude bentonite, etc.) wafer
is exposed to a drilling uid which is circulated around the wafer. A Linear
Variable Differential Transducer (LVDT) measures the expansion of the wafer
in the vertical direction (accuracy to 0.1%) and this information is then stored
as a function of time via the data acquisition system. A hydraulic compactor
unit prepares the mineral wafers for placement inside the transfer stand and
subsequent testing.
Safety
1. All electrical power cables should be three wire grounding cables and
should be plugged only into a grounded receptacle. The power switch on
the instrument should be in the OFF position when connecting the power
cable.
2. Always unplug the instrument from the electrical power source before
performing any disassembly or repair. With the cover off, it is possible to
touch exposed electrical terminals resulting in electrical shock if the power
cable is plugged in.
3. Ensure that all pressure has been released on the compactor before
removing core chambers. Both pressure gauges should read zero before
any work or maintenance is performed on the compactor.
4. Clean up any spilled hydraulic oil to prevent injury or re hazards.
5. The maximum temperature of the hot plate is 1,022°F (550°C), which
is well above the boiling point of water. Because the sample cup is
not pressurized, we recommend a maximum test temperature of
200°F (93.3°C). Testing above the boiling point could result in the uid
boiling out of the cup and splattering people and equipment. If this
happens, immediately decrease the temperature to a safe level.
OFITE, 11302 Steeplecrest Dr., Houston, TX 77065 USA / Tel: 832-320-7300 / Fax: 713-880-9886 / www.ote.com
2

Components
Computer:
#130-75-71 Monitor
#500-300-015 Micro Computer
Swell Meter:
#130-76-03 Thermocouple
#150-80-101 Calibration Block, Multi Point
#150-80-03 Flat Screen; 1 " Diameter
#150-80-031 Teon Washer
#150-80-032 Transfer Stand
#150-80-033 Wafer Tube
#150-80-034 Bottom Plate
#150-80-035 Cup
#150-80-036 Cap for Wafer Tube
#150-80-064 LVDT
#150-80-094 Cable, LVDT to Swell Meter
#150-83 Stirring Hot Plate; 120 Volt Only
#150-84 Stirring Hot Plate; 230 Volt Only
#152-37 AC Power Cord; 3-Conductor
#153-53-1 Magnetic Stir Bar, 1"
#153-67 60 cc Disposable Syringe
Compactor (#150-82):
#150-80-072 Pump
#150-80-085 ½" Spacer
#150-80-086 ¾" Spacer
#150-80-087 Body for Wafer Mold
#150-80-088 Plunger for Wafer Mold
#150-80-089 Drop Tube for Wafer Mold
#150-85 Relief Valve; 2,900 PSI (20 MPa)
Optional:
#150-80-009 Brass Weight
#150-81-1 Swell Meter Control Assembly (115 V)
#150-81-2 Swell Meter Control Assembly (230 V)
OFITE, 11302 Steeplecrest Dr., Houston, TX 77065 USA / Tel: 832-320-7300 / Fax: 713-880-9886 / www.ote.com
3
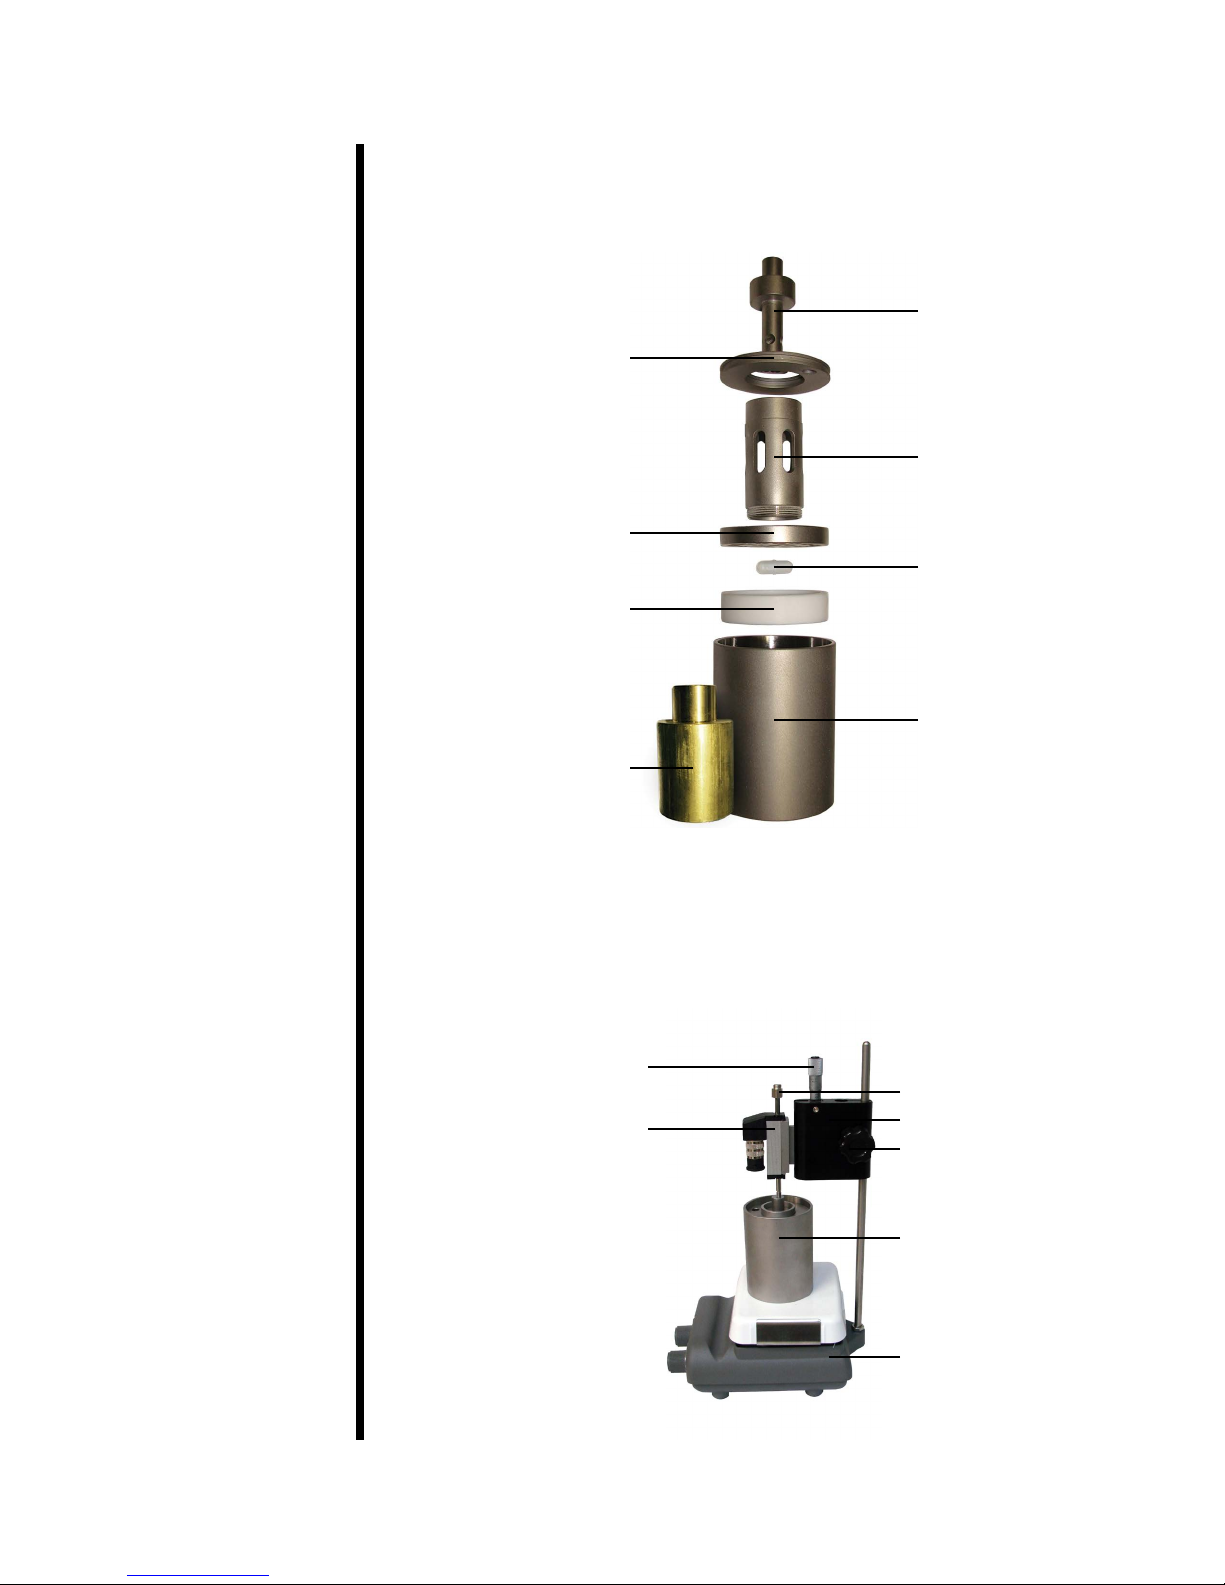
Installation
1. Assemble the Cup Assemblies as illustrated below and in the drawing
on page 24. The brass weight is an optional piece for simulating an
overburden pressure applied to the swelling core sample.
Transfer Stand
(#150-80-032)
Cap for Wafer Tube
(#150-80-036)
Wafer Tube
(#150-80-033)
Bottom (Main) Plate
(#150-80-034)
Teon Washer
(#150-80-031)
Brass Weight (Optional)
(#150-80-009)
Magnetic Stir Bar
(Comes w/Hot Plate)
(#153-53-1)
Cup
(#150-80-035)
2. Assemble the Main Assemblies as depicted below and in the drawing on
page 26. Adjust the height of the head assembly such that there is a
small gap (approximately 5 mm) between the bottom of the nut on the
spindle and the body of the LVDT without a wafer inserted into the cup
assembly.
Micrometer (#150-80-067)
Nut (#150-80-093)
LVDT (#150-80-064)
Head (#150-80-013)
Locking Nut (#150-80-001)
Cup Assembly (see above)
Stirring Hot Plate
(#150-83)
OFITE, 11302 Steeplecrest Dr., Houston, TX 77065 USA / Tel: 832-320-7300 / Fax: 713-880-9886 / www.ote.com
4
3. Connect the transducer cables to the LVDTs and then plug them into the
Swell Meter box.
4. Plug the magnetic stirrers into the electrical receptacles located on the
back of the unit.
These cables can be run under the Swell Meter box for a neater
appearance.
5. Insert the thermocouples into the cup assemblies and plug them into the
front of the Swell Meter box.
6. Ensure that the “POWER” switches (located on the back of the Swell
Meter) are in the “OFF” position and make the necessary electrical
connections in accordance to local codes. Ensure that the unit is
grounded.
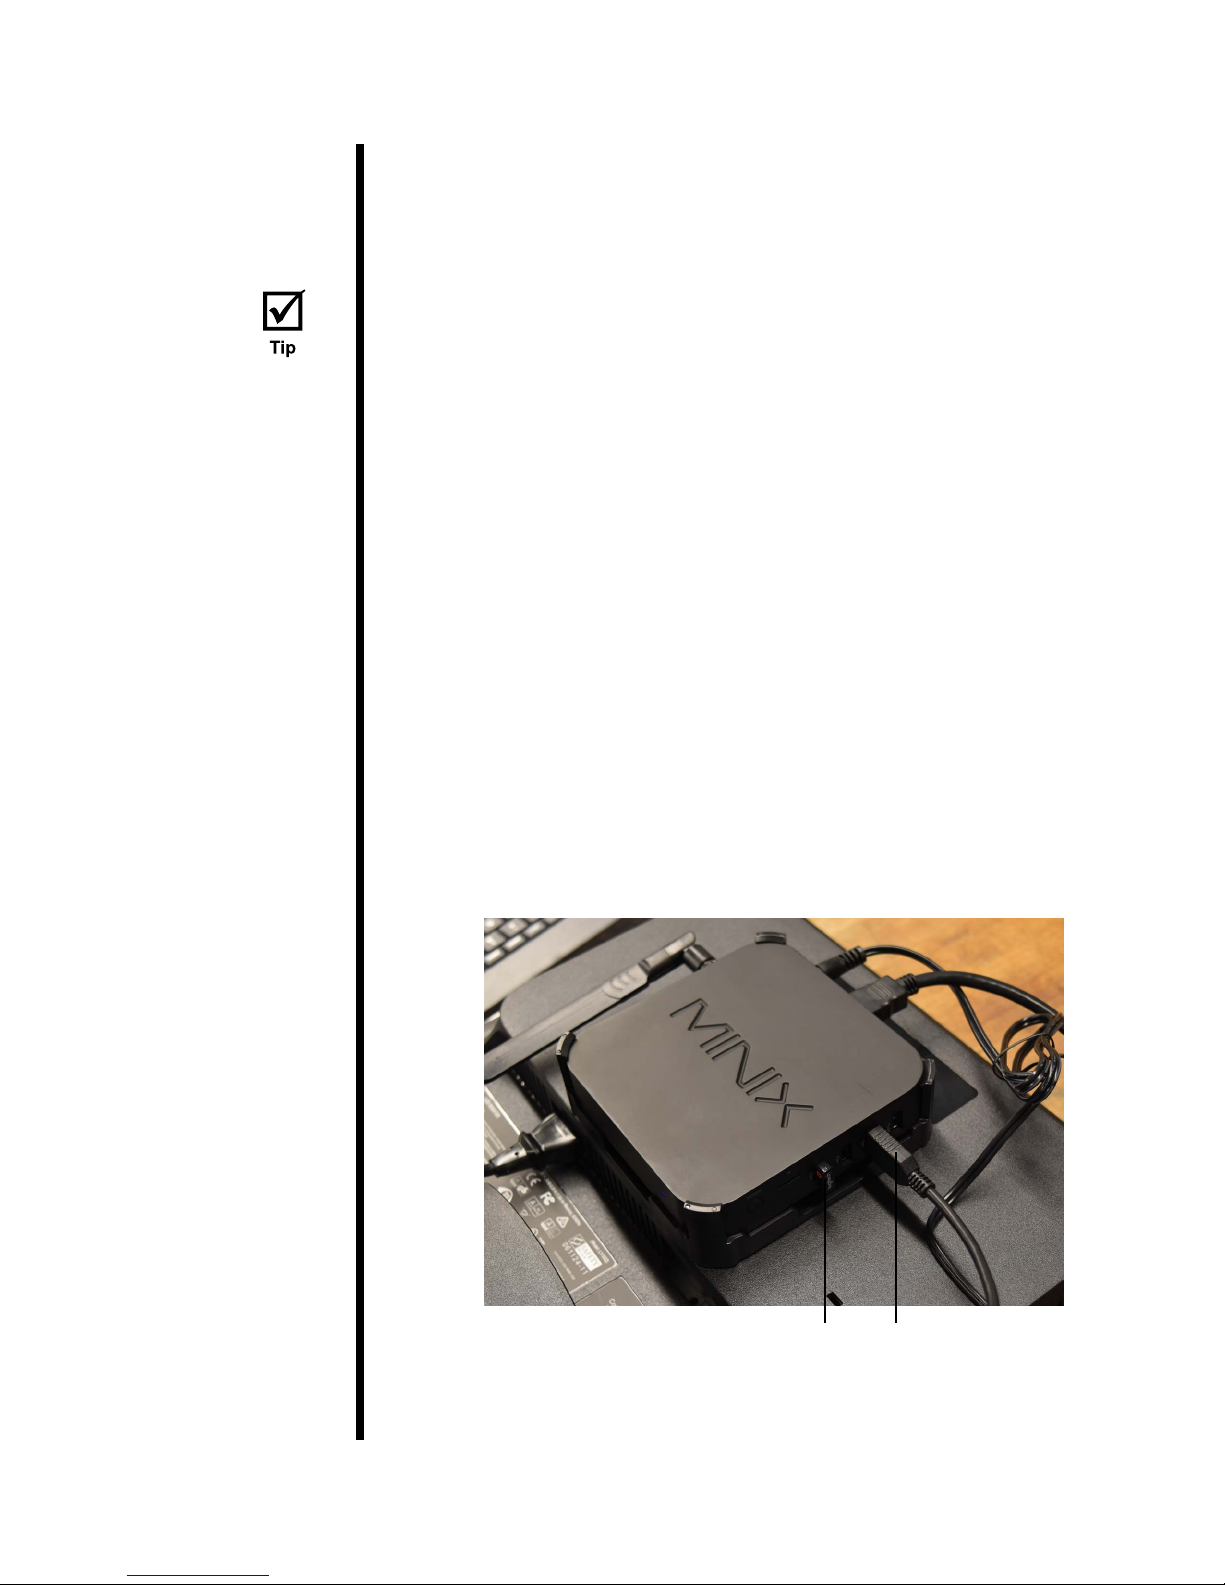
7. Make sure the computer is securely mounted to the back of the monitor.
8. Connect all the necessary cables to the appropriate ports.
The computer connects to the Swell Meter via the supplied USB cable.
Make sure the Bluetooth receiver is plugged in so that the keyboard and
mouse can connect.
If the computer runs out of disk space, it will no longer be able to store
more test data. If this happens, move older test data to a network or ash
drive to free up additional space.
USB Cable (To Swell Meter)Bluetooth Receiver
OFITE, 11302 Steeplecrest Dr., Houston, TX 77065 USA / Tel: 832-320-7300 / Fax: 713-880-9886 / www.ote.com
5
Software
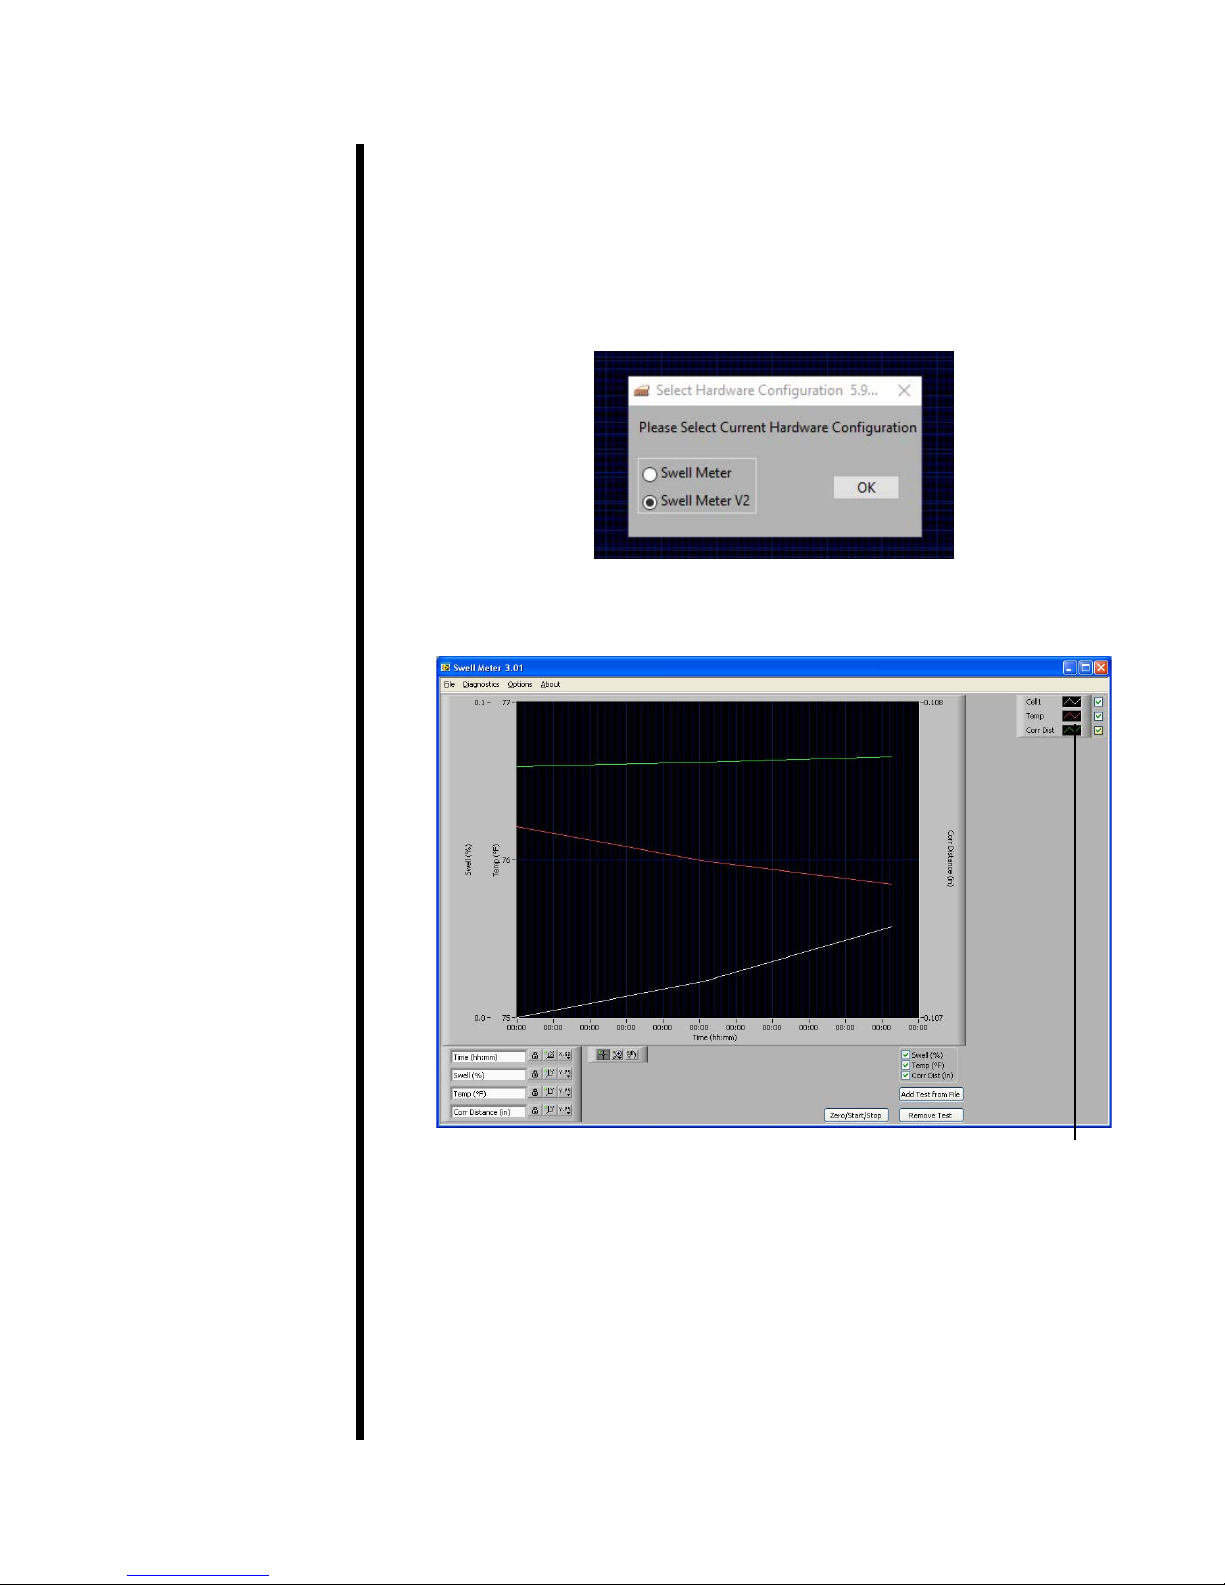
Turn the PC on and start the software by clicking the Swell Meter icon on the
desktop. The rst time you start the software, you will be asked to select a
hardware conguation. If your Swell Meter was manufactured before June
2018, choose “Swell Meter”. If it was manufactured in June 2018 or later,
choose “Swell Meter V2”. If you are not sure, look at the cable connecting
the computer to the Swell Meter. If it is a at, wide ribbon cable, select “Swell
Meter”. If it is a standard USB cable, select “Swell Meter V2”.
The Main Screen will appear:
The checkboxes at the bottom, right-hand corner of the graph control which
information (for all cells) is available to display on the graph. Once a test is
started, you can show or hide the swell percentage, temperature, or corrected
distance for all cells. For example, unchecking the “Temp” checkbox will
remove all temperature lines from the graph.
OFITE, 11302 Steeplecrest Dr., Houston, TX 77065 USA / Tel: 832-320-7300 / Fax: 713-880-9886 / www.ote.com
Legend
6
The legend on the right-hand side of the screen controls which information
(for each individual cell) displays on the graph. Once a test is started, you can
show or hide the swell percentage, temperature, or corrected distance for a
give cell. For example, unchecking the “Temp” checkbox under “Cell1” will
remove only the temperature line for Cell1 from the graph. By right-clicking on
the checkboxes, you can view test details for the cell you clicked, export test
data, remove a test from the chart, or print a chart. If you choose “Print”, the
chart will print all the data point currently being displayed.
At times the graph may appear unexpectedly erratic, especially at the
beginning of a test. This is likely caused by the scale on the Y-axis being set
too low. To correct the issue, right-click on the Y-axis and deselect “AutoScale
Y”. Then click the top value on the Y-axis and change it to a higher number. It
may take some experimentation to get the right scale.
By default, the software is congured to run four cells at a time. If your Swell
Meter has been congured to run eight cells instead of just four, you will need
to change the “Number of Cells Available” option on the “Setup” screen to
8. This will enable to software to run all eight cells. Refer to page 12 for
instructions.
Export: There are two export procedures in the software. You can export
a test that is currently in process, or you can export a completed and
saved test. Both procedures create a le that can then be opened in
Microsoft Excel.
To export a test that is running, right-click the checkboxes on the legend
and select “Export” to save your test data to a le. This procedure exports
whatever data points are currently displayed on the graph.
To export a saved test, click “Export from File” on the “File” menu. Choose
the le corresponding to the test you want to export. Then choose a
destination for the exported le. This procedure will import the saved test
data and then export it into an Excel spreadsheet.
Zero/Start/Stop: Click this button to start or stop a test.
Add Test From File: Click this button to add data from a saved test to
the graph. This is useful for comparing the results of multiple tests on one
graph.
After adding a test to the graph, use the checkboxes below the graph and
on the legend to display the information you need to see.
Remove Test: Click this button to remove a test from the graph.
OFITE, 11302 Steeplecrest Dr., Houston, TX 77065 USA / Tel: 832-320-7300 / Fax: 713-880-9886 / www.ote.com
7
Software
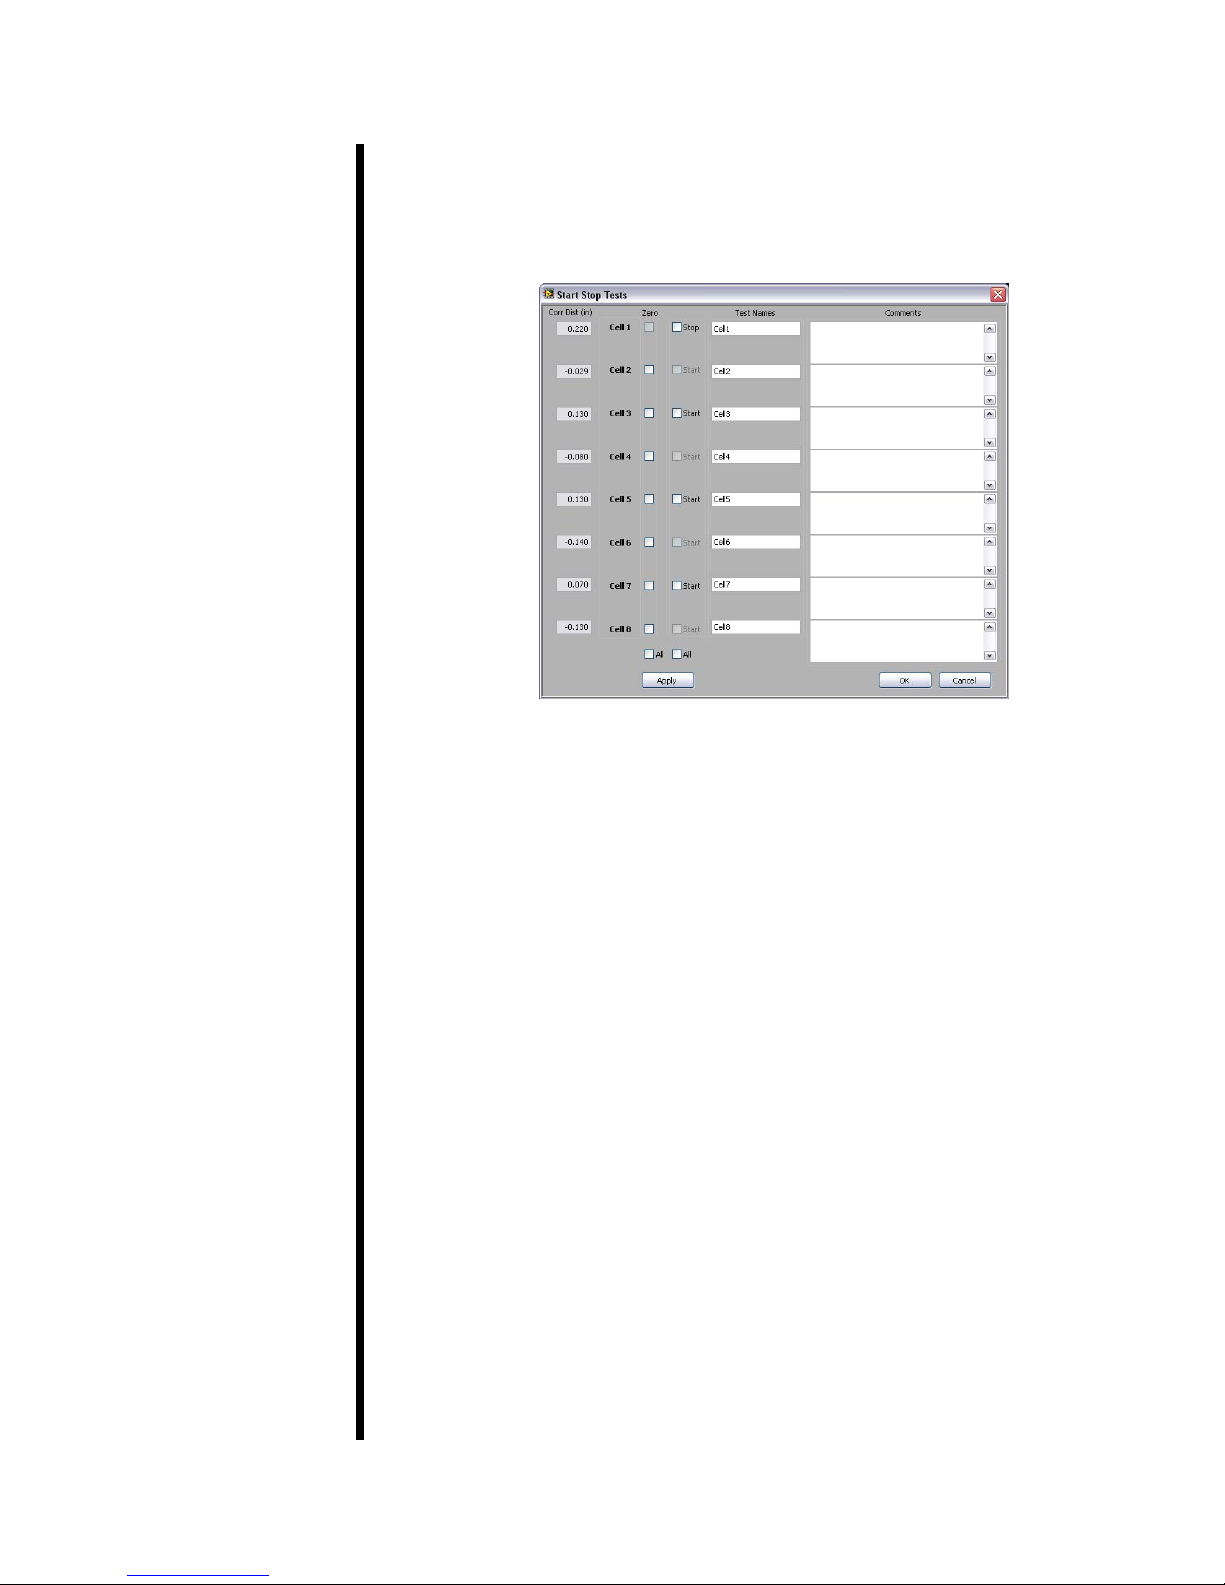
Zeroing the Channels
Each channel must be zeroed before every test. This gives the software a
starting point with which to calculate the percentage of swell during the test.
1. Click the “Zero/Start/Stop” button.
2. Repeat the following steps for each channel to be tested:
a. Enter a test name and any comments.
b. Place two screens into a fully-assembled cup. Place the cup on the
magnetic stirrer so that the LVDT spindle is resting on top of the
transfer stand. Check the box in the “Zero” column next to each cell to
be tested.
c. Click the “Apply” button to zero the channel. Make sure the “Corr Dist
(in)” eld reads 0.000.
OFITE, 11302 Steeplecrest Dr., Houston, TX 77065 USA / Tel: 832-320-7300 / Fax: 713-880-9886 / www.ote.com
8
 Loading...