

Page 1

AN13234
How to Enable SWO Trace for i.MX RT10xx Series
Rev. 0 — 04/2021
Contents
1 Introduction
The i.MX RT10xx series are processors featuring NXP’s advanced
implementation of the Arm® Cortex®-M7 core, which can provide good CPU
performance and real-time response. One of the advantage of the Cortex-M7
core is that it contains Instrumentation Trace Macrocell (ITM) in the CoreSight
architecture. ITM is a novel trace method for MCU debugging and it supports
the Serial Wire Output (SWO) trace.
This application note introduces the principle and advantages of SWO trace. It
provides guidance on how to enable the SWO trace with i.MX RT10xx Series,
including the hardware and software configurations. Also this document
describes the steps for using the basic SWO trace feature (ITM debug output)
based on different IDEs.
2 SWO trace overview
2.1 CoreSight components
1 Introduction......................................1
2 SWO trace overview........................1
2.1 CoreSight components................ 1
2.2 Serial Wire Output (SWO)............2
2.3 Instrumentation Trace Macrocell
2.4 Debug probes.............................. 4
3 Project and hardware modifications
3.1 MIMXRT1010-EVK...................... 5
3.2 MIMXRT1020-EVK...................... 6
3.3 MIMXRT1050-EVK...................... 7
3.4 MIMXRT1060-EVK...................... 7
3.5 MIMXRT1060-EVKB....................7
4 Using SWO with IAR....................... 8
5 Using SWO with Keil..................... 12
6 Conclusion.....................................16
7 References....................................17
8 Revision history.............................17
Application Note
(ITM)............................................ 4
required to enable SWO Trace....... 5
CoreSight is an architecture used to debug and trace by Arm. The architecture consists of several useful components. Figure 1
shows a typical CoreSight architecture, which includes two Arm processors, one DSP module and a number of other components.
There are three paths in the below environment: trace path, debug path and trigger path. This document focuses on the debug
path, which includes ITM module and SWO module.
Page 2

NXP Semiconductors
SWO trace overview
Figure 1. A typical CoreSight architecture
2.2 Serial Wire Output (SWO)
Serial Wire Output (SWO) is a single pin trace interface that is part of the Cortex-M CoreSight architecture. It acts as a bridge
between the on-chip trace data to Trace Port Analyzer (TPA).
The SWO trace provides access to the memory of a running target without interrupting the target. It is available on CortexM3/M4/M7 based MCUs. Figure 2 shows the block diagram of SWO. In addition to the standard Serial Wire Debug (SWD)
connection, SWO trace requires just one extra pin.
How to Enable SWO Trace for i.MX RT10xx Series, Rev. 0, 04/2021
Application Note 2 / 18
Page 3

NXP Semiconductors
Figure 2. SWO block diagram
SWO trace overview
The SWO trace interface is a TPIU-like device that supports a limited subset of the full TPIU functionality. SWO trace features are
described as below:
• Sending debug messages as strings
• Recording interrupt entry/exit
• Recording function entry/exit
• Periodic PC (Program Counter) value sampling
• Event notification
• Variable or memory cell change over time
One of the most common usage of SWO trace is using SWO to print debug messages from the target, as described in Using SWO
with IAR and Using SWO with Keil.
How to Enable SWO Trace for i.MX RT10xx Series, Rev. 0, 04/2021
Application Note 3 / 18
Page 4
NXP Semiconductors
SWO trace overview
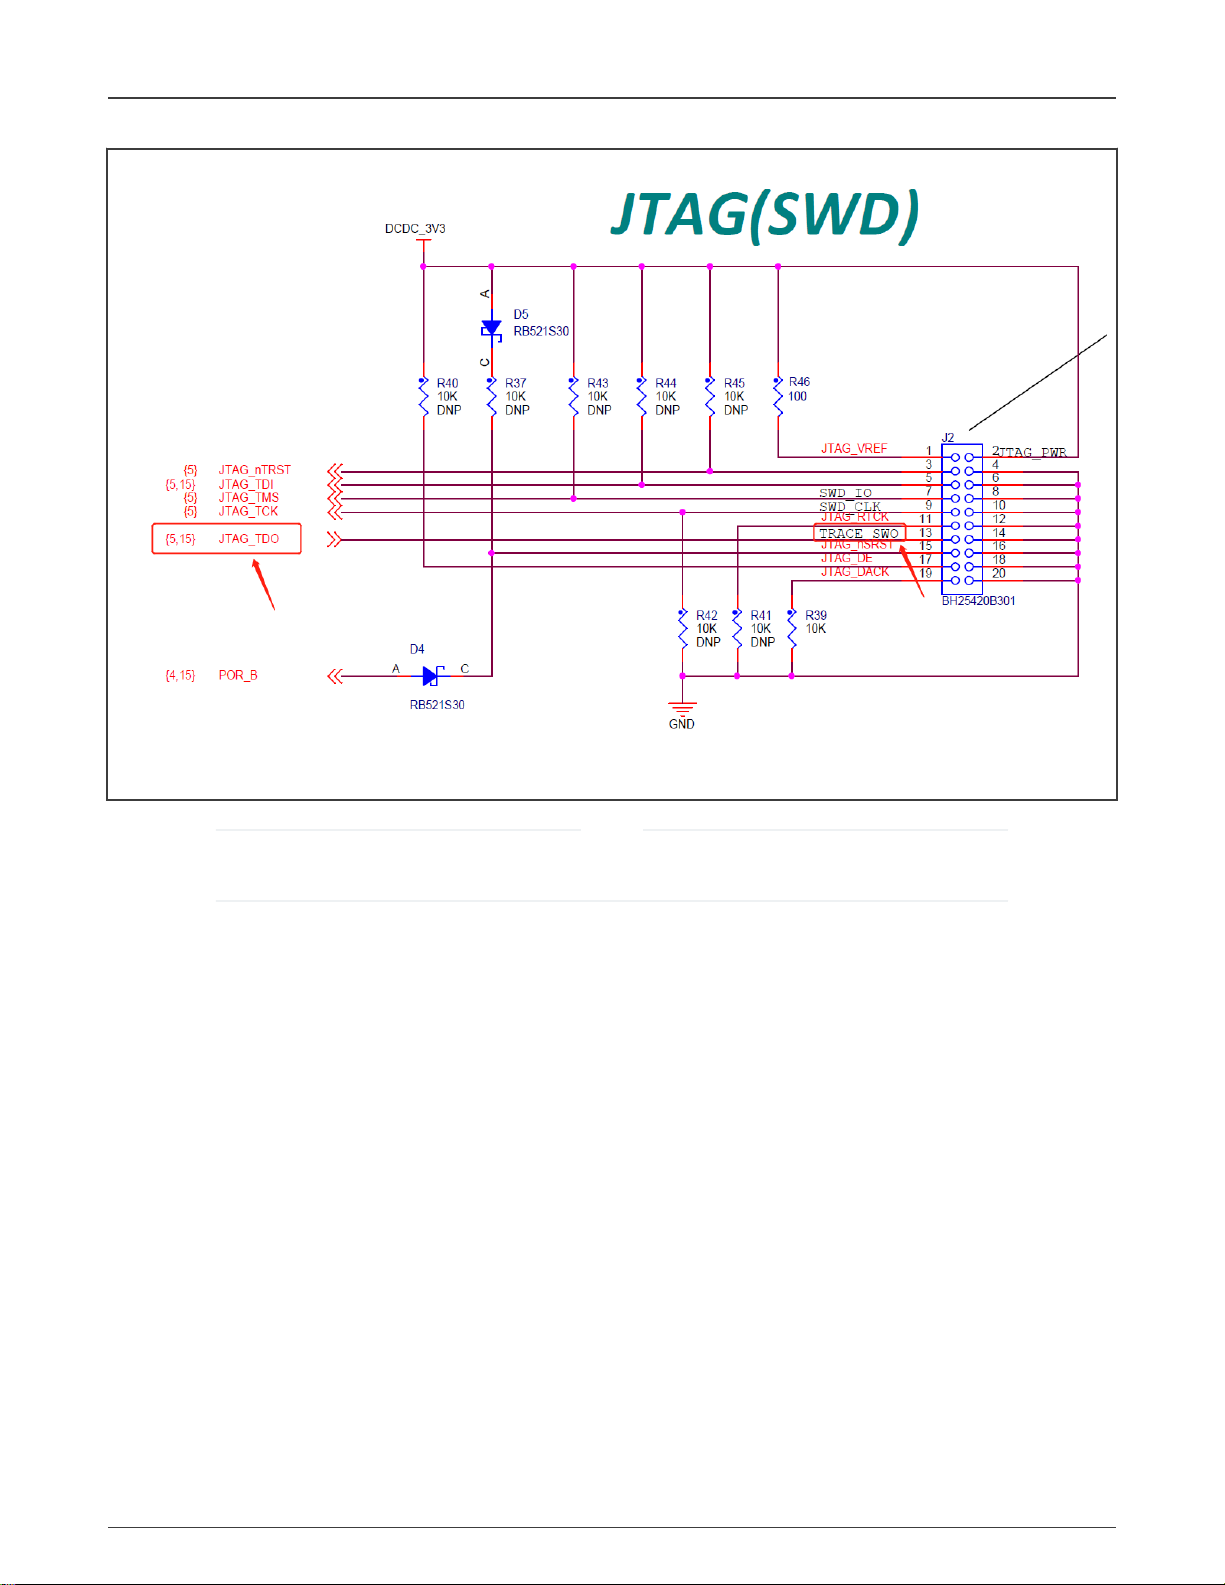
Figure 3. SWO pin
NOTE
SWO pin is multiplexed with JTAG_TDO pin, as shown in Figure 3. This means the Serial Wire Debug (SWD) mode
must be used, not the JTAG mode.
2.3 Instrumentation Trace Macrocell (ITM)
ITM generates trace information as packets and it provides a mechanism for sending data from the target to debugger via the
SWO stream. Trace data from ITM is forwarded to the SWO interface and then SWO transports the data streams to the Trace
Port Analyzer.
ITM supports 32 stimulus channels which allow different software to output data to different ports, so that the debugging target is
able to separate different packets. Among the 32 ports, Port0 is designated for outputting debug information. Different from the
UART-based output, ITM output does not cause significant latency to the application, because there is a FIFO that buffers the
output data inside ITM block.
ITM is used to:
• support printf style debugging
• trace OS and application events
• emit diagnostic system information
2.4 Debug probes
There are a number of debug solutions for i.MX RT10xx series MCUs, such as CMSIS DAP, J-Link and PE micro. However, not
every debug solution supports SWO trace. The SWO trace function can be used with several common compatible debug probe
such as:
• LinkServer LPC-Link2
How to Enable SWO Trace for i.MX RT10xx Series, Rev. 0, 04/2021
Application Note 4 / 18
Page 5

NXP Semiconductors
Project and hardware modifications required to enable SWO Trace
LPC-Link2 is an extensible, stand-alone debug probe that can be configured to support various development tools and IDEs
using a variety of different downloadable firmware images. It has also been built into many LPCXpresso development boards
and some MIMXRT-EVK boards.
LinkServer debug connections allow SWO trace to be started and stopped while the target is running. That means the SWO
trace using LPC-Link2 debug solution has no effect on the MCU performance. The powerful features of SWO trace have been
tested with LPC-Link2 firmware based on MCUXpresso IDE. For more information, see
MCUXpresso IDE SWO Trace Guide
• SEGGER J-Link
J-Link is a debug probe supporting a large number of MCU cores. Regarding to the SWO trace with J-Link debug solution,
the target must be halted when starting or stopping the SWO trace.
The correct target clock speed must be sampled to allow the internal sampling rates to be calculated correctly. The steps for
using SWO trace with J-Link debug probe based on different toolchains will be clarified explicitly in Using SWO with IAR and
Using SWO with Keil.
3 Project and hardware modifications required to enable SWO Trace
The default project examples in SDK and some original EVK boards do not enable SWO trace features. To enable the SWO trace,
several project changes and hardware modifications are required. This chapter lists the modifications for enabling SWO trace
based on the following i.MX RT platforms:
• MIMXRT1010-EVK
.
• MIMXRT1020-EVK
• MIMXRT1050-EVK
• MIMXRT1060-EVK
• MIMXRT1060-EVKB
NOTE
The source code changes are performed based on the latest SDK (version 2.9.1).
3.1 MIMXRT1010-EVK
1. Modifying pin_mux.c
Within a project, select the board subfolder, locate the pin_mux.c file and add the below lines in the
BOARD_InitPins function:
IOMUXC_SetPinMux( /* Add these lines*/
IOMUXC_GPIO_AD_09_ARM_TRACE_SWO,
0U);
IOMUXC_SetPinConfig( /* Add these lines*/
IOMUXC_GPIO_AD_09_ARM_TRACE_SWO,
0x00F9U);
2. Modifying
Within a project, select the board subfolder, locate the clock_config.c file and modify the lines in the
BOARD_BootClockRUN function as below:
clock_config.c
/* Disable TRACE clock gate. */ /* Locate these entries*/
CLOCK_DisableClock(kCLOCK_Trace);
/* Set TRACE_PODF. */
CLOCK_SetDiv(kCLOCK_TraceDiv, 3);
/* Set Trace clock source. */
CLOCK_SetMux(kCLOCK_TraceMux, 0);
How to Enable SWO Trace for i.MX RT10xx Series, Rev. 0, 04/2021
Application Note 5 / 18
Page 6
NXP Semiconductors
Project and hardware modifications required to enable SWO Trace
CLOCK_EnableClock(kCLOCK_Trace); /* Make these edits*/
/* Set TRACE_PODF. */
CLOCK_SetDiv(kCLOCK_TraceDiv, 0); /* Make these edits*/
/* Set Trace clock source. */
CLOCK_SetMux(kCLOCK_TraceMux, 0); /* Make these edits*/
3.2 MIMXRT1020-EVK
1. Connect SWO pin and JTAG-TDO pin
Connect SWO (J19-3) and JTAG-TDO (J16-13).
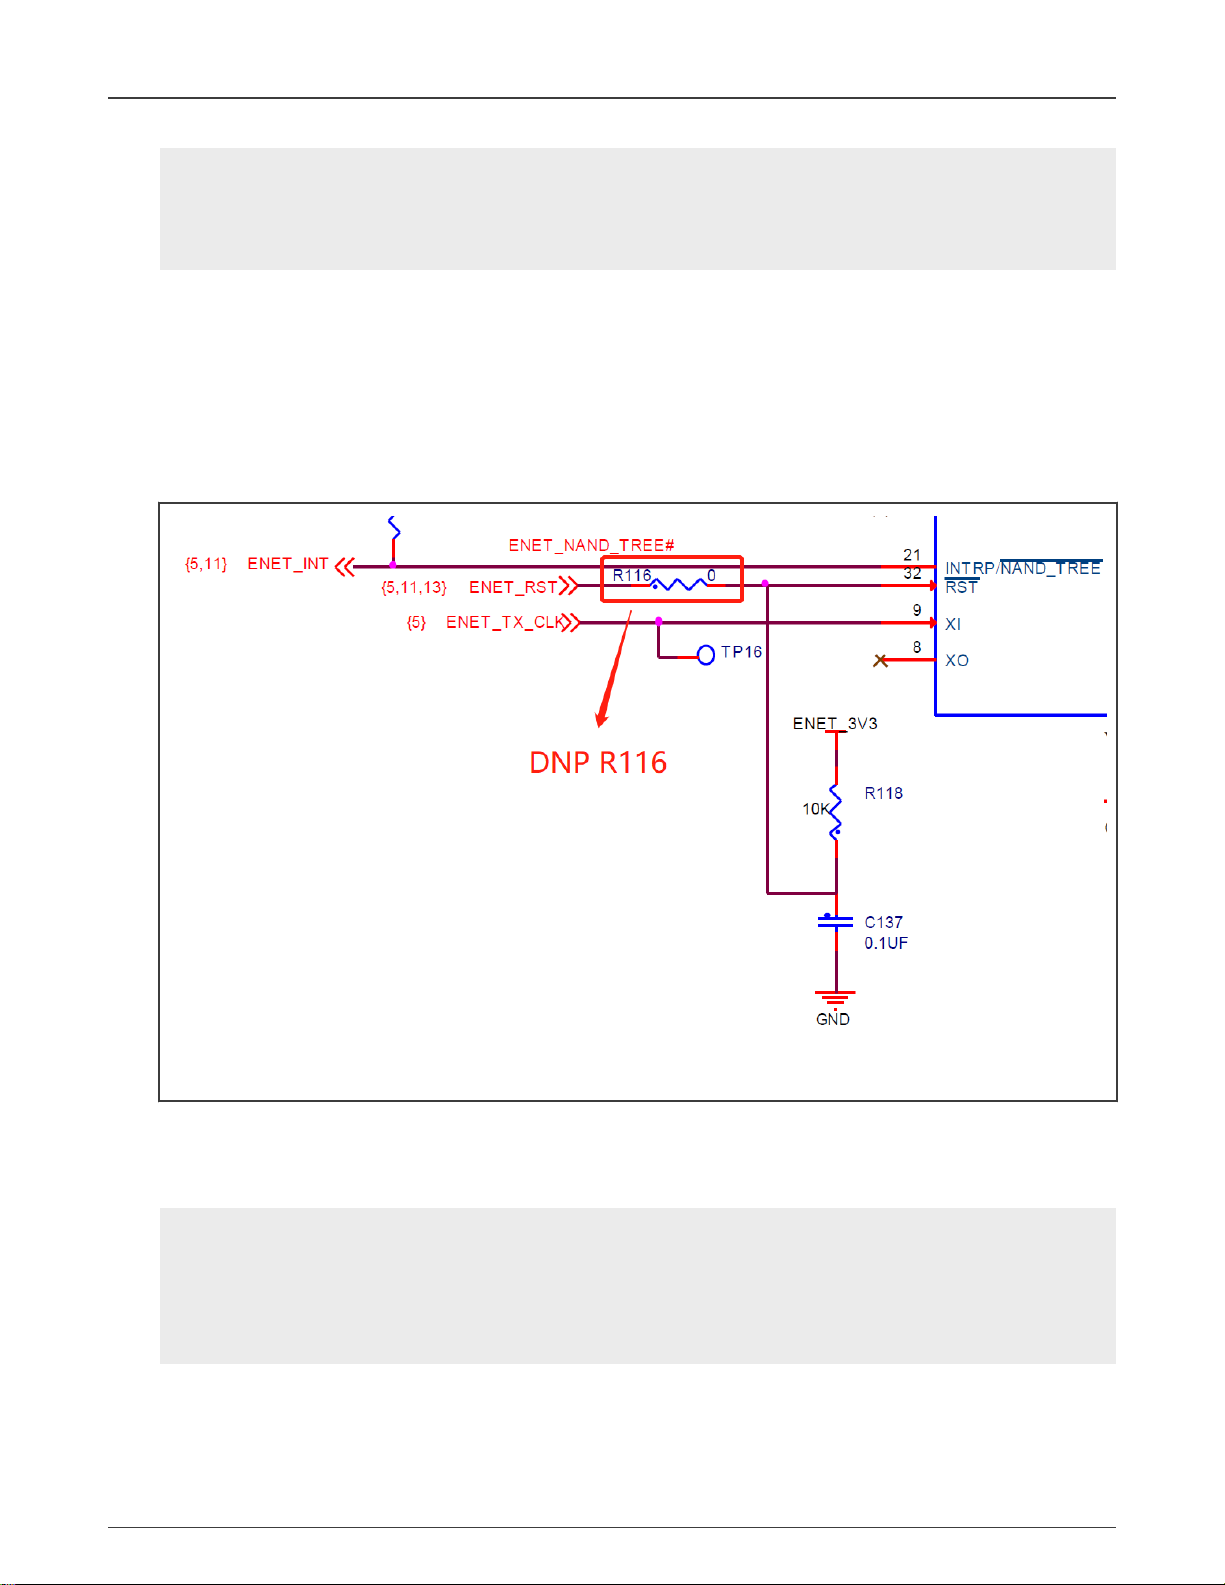
2. DNP R116
JTAG-TDO pin is reused as a ENET-RESET signal. There is a capacitor (C137) that affects the signal, so remove R116,
as shown in Figure 4.
Figure 4. Hardware modification on MIMXRT1020-EVK
3. Modifying pin_mux.c
Within a project, select the board subfolder, locate the pin_mux.c file and add the below lines in the
BOARD_InitPins function:
IOMUXC_SetPinMux( /* Add these lines*/
IOMUXC_GPIO_AD_B0_11_ARM_CM7_TRACE_SWO,
0U);
IOMUXC_SetPinConfig( /* Add these lines*/
IOMUXC_GPIO_AD_B0_11_ARM_CM7_TRACE_SWO,
0x00F9U);
4. Modifying clock_config.c
Same as the clock modifications of MIMXRT1010-EVK in MIMXRT1010-EVK.
How to Enable SWO Trace for i.MX RT10xx Series, Rev. 0, 04/2021
Application Note 6 / 18
Page 7

NXP Semiconductors
Project and hardware modifications required to enable SWO Trace
3.3 MIMXRT1050-EVK
1. Patch wire between R256 and pin 13 of J21.
2. Modifying pin_mux.c
Within a project, select the board subfolder, locate the pin_mux.c file and add the below lines in the
BOARD_InitPins function:
IOMUXC_SetPinMux( /* Add these lines*/
IOMUXC_GPIO_B0_13_ARM_CM7_TRACE_SWO,
0U);
IOMUXC_SetPinConfig( /* Add these lines*/
IOMUXC_GPIO_B0_13_ARM_CM7_TRACE_SWO,
0x00F9U);
3. Modifying clock_config.c
Within a project, select the board subfolder, locate the clock_config.c file and modify the lines in BOARD_BootClockRUN
function as below:
/* Disable TRACE clock gate. */ /* Locate these entries*/
CLOCK_DisableClock(kCLOCK_Trace);
/* Set TRACE_PODF. */
CLOCK_SetDiv(kCLOCK_TraceDiv, 3);
/* Set Trace clock source. */
CLOCK_SetMux(kCLOCK_TraceMux, 0);
CLOCK_EnableClock(kCLOCK_Trace); /* Make these edits*/
/* Set TRACE_PODF. */
CLOCK_SetDiv(kCLOCK_TraceDiv, 0); /* Make these edits*/
/* Set Trace clock source. */
CLOCK_SetMux(kCLOCK_TraceMux, 3); /* Make these edits*/
3.4 MIMXRT1060-EVK
1. Modifying pin_mux.c
Within a project, select the board subfolder, locate the pin_mux.c file and add the below lines in the
BOARD_InitPins function:
IOMUXC_SetPinMux( /* Add these lines*/
IOMUXC_GPIO_B0_10_ARM_CM7_TRACE_SWO,
0U);
IOMUXC_SetPinConfig( /* Add these lines*/
IOMUXC_GPIO_B0_10_ARM_CM7_TRACE_SWO,
0x00F9U);
2. Modifying clock_config.c
Same as the clock modifications of MIMXRT1050-EVK in MIMXRT1050-EVK.
3.5 MIMXRT1060-EVKB
1. DNP R173
2. Modifying pin_mux.c
Same as the pin modifications of MIMXRT1060-EVK in MIMXRT1060-EVK.
3. Modifying clock_config.c
How to Enable SWO Trace for i.MX RT10xx Series, Rev. 0, 04/2021
Application Note 7 / 18
Page 8

NXP Semiconductors
Using SWO with IAR
Same as the clock modifications of MIMXRT1060-EVK in MIMXRT1060-EVK.
NOTE
The frequency of
configuration between different MCUs.
TRACE_ROOT_CLK
should be close to CORE_CLK. Pay attention to the differences of clock
4 Using SWO with IAR
After making the hardware and project changes as described in Project and hardware modifications required to enable SWO
Trace, the SWO trace can be captured. However, to support the SWO trace function in different development environment, the
IDE configurations are different. This chapter focuses on performing the basic SWO trace feature (ITM debug output) in IAR with
J-Link debug probe. The configurations steps are as follows:
1. Preparations:
• Software: MIMXRT1060-EVK SDK release (version: 2.9.1)
• Hardware: MIMXRT1060-EVK board
• Debug probe: J-Link Plus
• IDE: IAR Embedded Workbench for Arm 8.50.9
• ITM debug output code:
while (1)
{
ITM_SendChar('A');/* Send character A via ITM to designate port*/
ITM_SendChar('B');
ITM_SendChar('C');
}
The default output port is port0. For more information, see the ITM_SendChar() function in core_cm7.h.
2. Click Project -> Options -> General Options -> Library Configuration. Set the library to Full and in stdout/stderr, choose Via
SWO, as shown in Figure 5.
How to Enable SWO Trace for i.MX RT10xx Series, Rev. 0, 04/2021
Application Note 8 / 18
Page 9

NXP Semiconductors
Using SWO with IAR
Figure 5. Library configurations in IAR
3. Click Project -> Options -> Debugger. Set the driver to J-Link/J-Trace, as shown in Figure 6.
Figure 6. Set debugger as J-Link
4. Click Project -> Options -> Debugger -> J-Link/J-Trace. In the Setup submenu, set the reset method to Normal and CPU
clock to 600 MHz. In the Connection submenu, set the interface to SWD, as shown in Figure 7.
How to Enable SWO Trace for i.MX RT10xx Series, Rev. 0, 04/2021
Application Note 9 / 18
Page 10

NXP Semiconductors
Using SWO with IAR
Figure 7. J-Link setup and connection settings
5. Download and debug the project. Click File Menu -> J-Link -> SWO Configuration. Make configurations on the SWO
Trace Window Settings window, as shown in Figure 8 and Figure 9.
Figure 8. Set the ITM stimulus port to port0
How to Enable SWO Trace for i.MX RT10xx Series, Rev. 0, 04/2021
Application Note 10 / 18
Page 11

NXP Semiconductors
Using SWO with IAR
Figure 9. Set SWO trace mode to PC samples
6. Click File Menu -> J-Link -> SWO trace to open the SWO Trace panel. Click the
button to enable the trace.
7. Click View -> Terminal I/O to open the Terminal I/O window. Press F5 to run the project. The output message is as shown
in Figure 10.
Figure 10. Terminal I/O output in IAR
How to Enable SWO Trace for i.MX RT10xx Series, Rev. 0, 04/2021
Application Note 11 / 18
Page 12

NXP Semiconductors
Using SWO with Keil
5 Using SWO with Keil
This chapter describes the steps for implementing SWO trace feature on Keil with J-Link debug probe. The configuration steps
are as follows:
1. Preparations:
• Software: MIMXRT1060-EVK SDK release (version: 2.9.1)
• Hardware: MIMXRT1060-EVK board
• Debug probe: J-Link Plus
• IDE: Keil uVision 5
• ITM debug output code:
while (1)
{
ITM_SendChar('A');/* Send character A via ITM to designate port*/
ITM_SendChar('B');
ITM_SendChar('C');
}
The default output port is port0. For more information, see the ITM_SendChar() function in core_cm7.h.
2. Click the Options for Target button,
Then click the Target submenu and set Use MicroLIB, as shown in Figure 11.
.
How to Enable SWO Trace for i.MX RT10xx Series, Rev. 0, 04/2021
Application Note 12 / 18
Page 13

NXP Semiconductors
Using SWO with Keil
Figure 11. Choose to use MicroLIB in Keil
3. In the Debug submenu, set the debugger to J-Link/J-TRACE Cortex, as shown in Figure 12.
How to Enable SWO Trace for i.MX RT10xx Series, Rev. 0, 04/2021
Application Note 13 / 18
Page 14

NXP Semiconductors
Using SWO with Keil
Figure 12. Set the debugger as J-Link
4. Click the Settings button. On the J-Link setup menu, set the port to SW and the reset method to Normal, as shown in
Figure 13.
How to Enable SWO Trace for i.MX RT10xx Series, Rev. 0, 04/2021
Application Note 14 / 18
Page 15

NXP Semiconductors
Using SWO with Keil
Figure 13. Set the J-Link port to SW and reset to normal
5. Click the trace submenu and make the configurations as shown in Figure 14.
How to Enable SWO Trace for i.MX RT10xx Series, Rev. 0, 04/2021
Application Note 15 / 18
Page 16

NXP Semiconductors
Conclusion
Figure 14. J-Link trace configurations
6. Start debug session and click View -> Serial Window -> Debug(printf) Viewer. Run the project and the output message is
as shown in Figure 15.
Figure 15. Debug(printf) Viewer in Keil
6 Conclusion
One of the basic requirements of embedded development is to output debugging information through the terminal, which can be
achieved in either the following ways:
• Use the serial line to connect the UART on the board with the COM port on the PC
How to Enable SWO Trace for i.MX RT10xx Series, Rev. 0, 04/2021
Application Note 16 / 18
Page 17

NXP Semiconductors
References
• Use the semi-host mechanism.
The CoreSight architecture in Cortex-M7 core breaks this situation. The Cortex-M7 core provides the ITM interface that supports
output debug information via SWO pin. With this implementation, the debug information can be output without configuring serial
ports and using terminal debugging software. Compared with the common serial port print, the advantages of SWO are as follows.
• The serial port is the on-chip peripheral of the MCU and occupies a peripheral resource, while the SWO does not occupy
a peripheral.
• It requires to rewrite the driver for the serial port when using different MCUs, whereas the driver for SWO can be used with
all MCUs with supported Cortex-M core.
• Serial port output is typically sent in an interrupt mode, and there may be some problems for observing some information
in the interrupt while debugging, whereas SWO trace does not have interrupt problems.
• SWO is much faster than the serial port and has less impact on the code because the latency of SWO trace is low.
In addition to the debug information output feature that is most commonly used, there are other powerful features of SWO trace,
such as, to display real-time variable changes, to measure code execution time, to monitor the interrupt activity, and so on.
7 References
•
i.MX RT1010 Processor Reference Manual
•
i.MX RT1020 Processor Reference Manual
(document IMXRT010RM)
(document IMXRT1020RM)
•
i.MX RT1050 Processor Reference Manual
•
i.MX RT1060 Processor Reference Manual
•
Using the MIMXRT1060/4-EVK with MCUXpresso IDE
•
MCUXpresso IDE SWO Trace Guide
• CoreSight Components Technical Reference Manual
(document IMXRT1050RM)
(document IMXRT1060RM)
(document MCUXPRESSO-SWO-TRACE)
8 Revision history
Rev. Date Substantive changes
0 04/2021 Initial release
How to Enable SWO Trace for i.MX RT10xx Series, Rev. 0, 04/2021
Application Note 17 / 18
Page 18

How To Reach Us
Home Page:
nxp.com
Web Support:
nxp.com/support
Information in this document is provided solely to enable system and software implementers to use NXP products. There
are no express or implied copyright licenses granted hereunder to design or fabricate any integrated circuits based on the
information in this document. NXP reserves the right to make changes without further notice to any products herein.
NXP makes no warranty, representation, or guarantee regarding the suitability of its products for any particular purpose, nor
does NXP assume any liability arising out of the application or use of any product or circuit, and specifically disclaims any
and all liability, including without limitation consequential or incidental damages. “Typical” parameters that may be provided
in NXP data sheets and/or specifications can and do vary in different applications, and actual performance may vary over
time. All operating parameters, including “typicals,” must be validated for each customer application by customer's technical
experts. NXP does not convey any license under its patent rights nor the rights of others. NXP sells products pursuant to
standard terms and conditions of sale, which can be found at the following address: nxp.com/SalesTermsandConditions.
Right to make changes - NXP Semiconductors reserves the right to make changes to information published in this
document, including without limitation specifications and product descriptions, at any time and without notice. This
document supersedes and replaces all information supplied prior to the publication hereof.
Security — Customer understands that all NXP products may be subject to unidentified or documented vulnerabilities.
Customer is responsible for the design and operation of its applications and products throughout their lifecycles to reduce
the effect of these vulnerabilities on customer’s applications and products. Customer’s responsibility also extends to other
open and/or proprietary technologies supported by NXP products for use in customer’s applications. NXP accepts no
liability for any vulnerability. Customer should regularly check security updates from NXP and follow up appropriately.
Customer shall select products with security features that best meet rules, regulations, and standards of the intended
application and make the ultimate design decisions regarding its products and is solely responsible for compliance with all
legal, regulatory, and security related requirements concerning its products, regardless of any information or support that
may be provided by NXP. NXP has a Product Security Incident Response Team (PSIRT) (reachable at PSIRT@nxp.com)
that manages the investigation, reporting, and solution release to security vulnerabilities of NXP products.
NXP, the NXP logo, NXP SECURE CONNECTIONS FOR A SMARTER WORLD, COOLFLUX,EMBRACE, GREENCHIP,
HITAG, ICODE, JCOP, LIFE, VIBES, MIFARE, MIFARE CLASSIC, MIFARE DESFire, MIFARE PLUS, MIFARE FLEX,
MANTIS, MIFARE ULTRALIGHT, MIFARE4MOBILE, MIGLO, NTAG, ROADLINK, SMARTLX, SMARTMX, STARPLUG,
TOPFET, TRENCHMOS, UCODE, Freescale, the Freescale logo, AltiVec, CodeWarrior, ColdFire, ColdFire+, the Energy
Efficient Solutions logo, Kinetis, Layerscape, MagniV, mobileGT, PEG, PowerQUICC, Processor Expert, QorIQ, QorIQ
Qonverge, SafeAssure, the SafeAssure logo, StarCore, Symphony, VortiQa, Vybrid, Airfast, BeeKit, BeeStack, CoreNet,
Flexis, MXC, Platform in a Package, QUICC Engine, Tower, TurboLink, EdgeScale, EdgeLock, eIQ, and Immersive3D are
trademarks of NXP B.V. All other product or service names are the property of their respective owners. AMBA, Arm, Arm7,
Arm7TDMI, Arm9, Arm11, Artisan, big.LITTLE, Cordio, CoreLink, CoreSight, Cortex, DesignStart, DynamIQ, Jazelle,
Keil, Mali, Mbed, Mbed Enabled, NEON, POP, RealView, SecurCore, Socrates, Thumb, TrustZone, ULINK, ULINK2,
ULINK-ME, ULINK-PLUS, ULINKpro, μVision, Versatile are trademarks or registered trademarks of Arm Limited (or its
subsidiaries) in the US and/or elsewhere. The related technology may be protected by any or all of patents, copyrights,
designs and trade secrets. All rights reserved. Oracle and Java are registered trademarks of Oracle and/or its affiliates. The
Power Architecture and Power.org word marks and the Power and Power.org logos and related marks are trademarks and
service marks licensed by Power.org.
©
NXP B.V. 2021. All rights reserved.
For more information, please visit: http://www.nxp.com
For sales office addresses, please send an email to: salesaddresses@nxp.com
Date of release: 04/2021
Document identifier: AN13234
 Loading...