

Page 1

VisLM Operation Manual
OPERATION MANUAL
VisLM
Standardised Loudness Metering Solution
1
© 2019 NUGEN Audio
© 2019 NUGEN Audio
1
www.nugenaudio.com
Contents
Page 2

VisLM Operation Manual
Contents
Introduction
Interface
General Layout
Loudness Meter
Loudness History & Distribution
True Peak Meter
Options Panels
Preset Recall
Meters
Display
Alerts
Export (Text and Automation logs)
Global
3
4
4
6
9
12
15
16
17
19
20
21
22
Loudness History Mode
System
Elapsed
Time-code (Loudness Overdub mode)
Navigating Flags
Stand Alone Application
Loudness Metering in Practice
Reporting a Problem
Version History
23
24
26
28
31
32
34
38
39
© 2019 NUGEN Audio
© 2019 NUGEN Audio
2
2
www.nugenaudio.com
Contents
Page 3

VisLM Operation Manual
Introduction
The NUGEN Audio VisLM is a loudness metering system fully compliant with the
ITU-R BS.1770/1771 metering standard, EBU R128, ATSC A/85 and several other
region specic loudness standards.
VisLM is available in two versions, VisLM-C (compact) and VisLM-H (history). The
operation of both versions is broadly the same, although VisLM-H has a number of
additional features.
Both versions of VisLM are available in stereo, 5.1, 7.1 and 7.1.2 formats. Many plug-in
hosts will now accept the surround version on any audio channel, however some
require channel specic implementation, so the 2.0 version is supplied for standard
stereo operation in these situations. The surround version will work correctly with track
counts from 1.0 up to 7.1.2 in hosts that provide this exibility.
© 2019 NUGEN Audio
3
Contents
Page 4

VisLM Operation Manual
Interface - General Layout
The interface is designed to facilitate intuitive operation by grouping similar aspects
of operation into distinct zones as shown below. VisLM is highly congurable, with
the ability to show/hide many functions and parameters. This manual is illustrated
using VisLM-H, and in general will show an expanded interface to allow explanation
of all parameters.
5
34
2
1 Main display. The main display area shows the information relevant to the
current view setting; the Loudness Meter, True-Peak meter or Options page.
2 Main display control. These controls determine what is shown in the main
display.
i) Loudness - Loudness Meter
ii) True-Peak - True-Peak Meter
iii) Options - Options panel
1
7 6
3 Loudness history (VisLM-H only). The history view presents the historical
loudness and true-peak clip values over time.
© 2019 NUGEN Audio
4
Contents
Page 5

VisLM Operation Manual
4 Loudness distribution (VisLM-H only). This optional view represents the
distribution of loudness measurement within the Integrated loudness
measurement.
5 Loudness history macro View (VisLM-H only). This optional view shows the
overall loudness history stored by the plug-in. This view can be used to rapidly
locate areas of specic interest in the main loudness history view.
6 Resize control (VisLM-H only). This control is used to resize the interface to a
suitable proportion and scale to suit the available screen space and best t with
your workow.
7 Plug-in title. Click to open licensing/credits panel and a direct link to open the
plug-in manual (if installed).
© 2019 NUGEN Audio
5
Contents
Page 6
VisLM Operation Manual
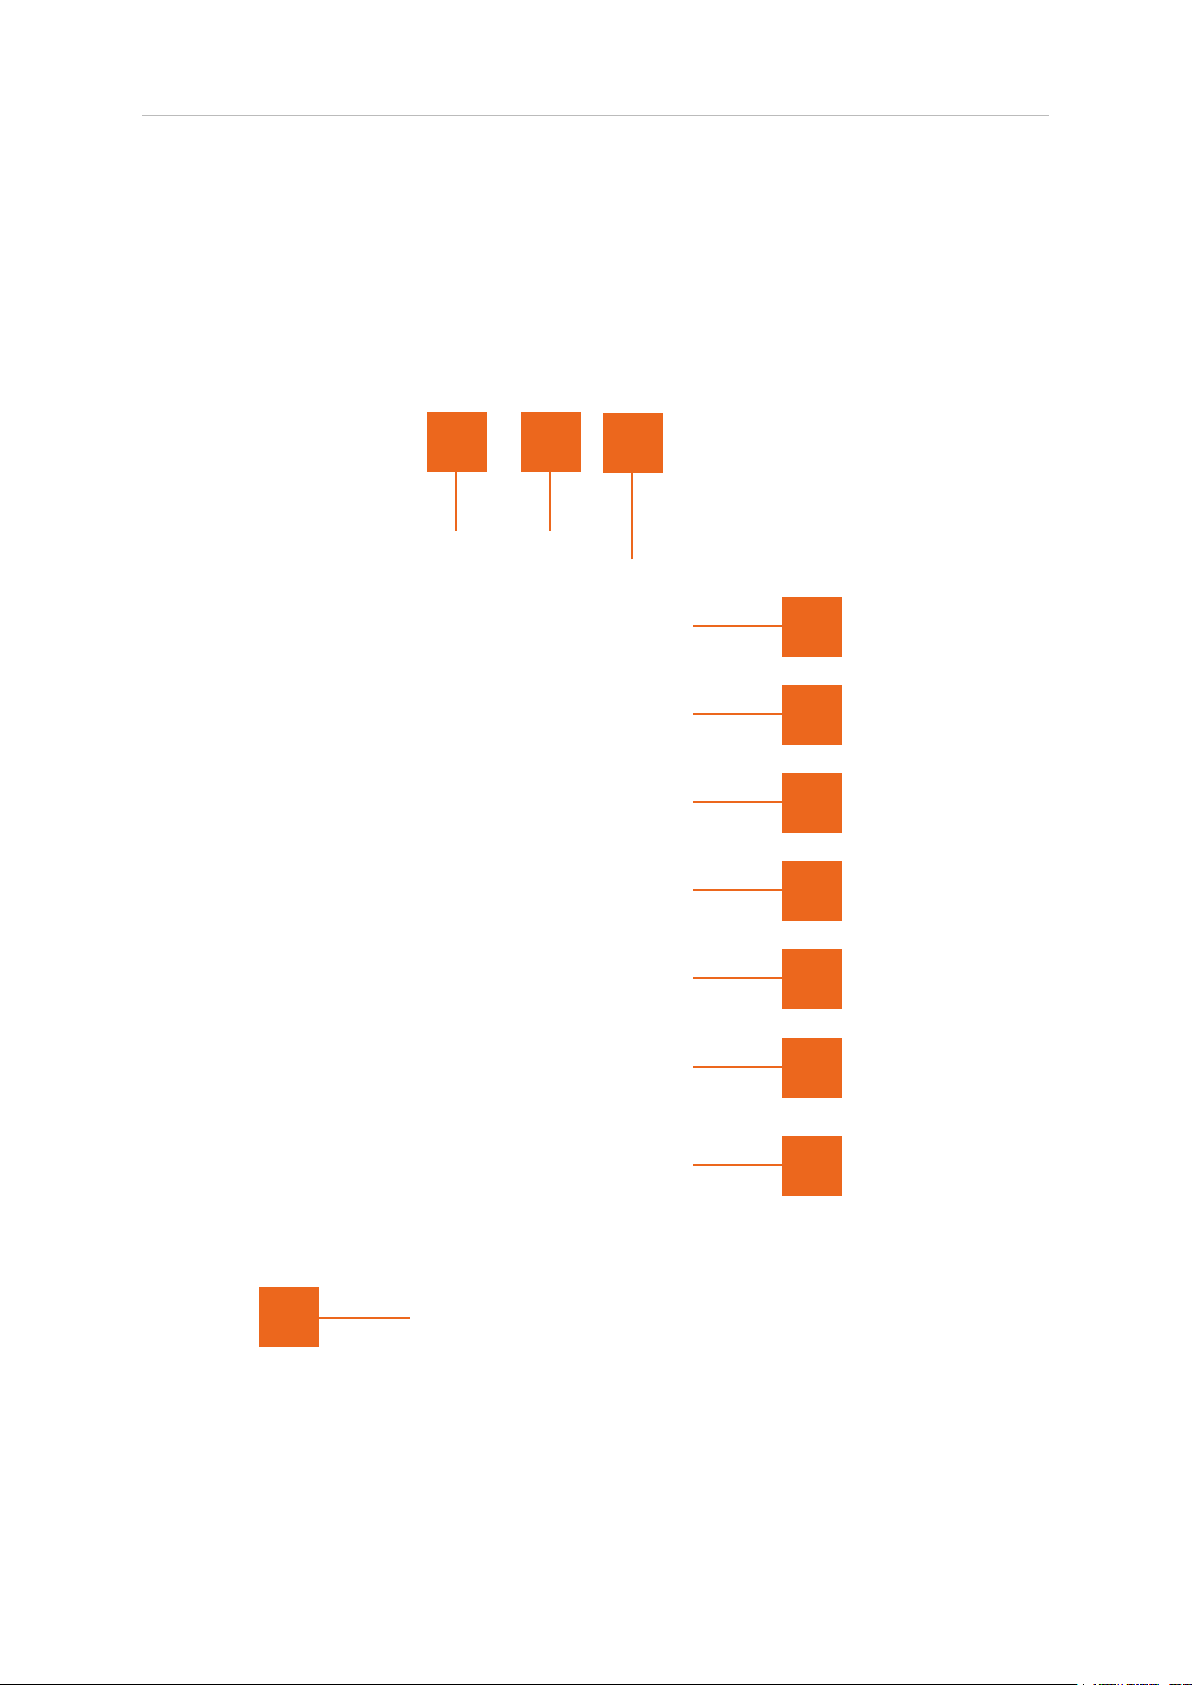
Interface - Loudness Meter
This section displays the primary Loudness Meter values and controls. The
performance and values given in this section of the meter are in accordance with and
as dened by ITU-R BS.1770 and/or EBU R128.
2
3
11
4
5
6
7
8
9
10
1
1 Loudness meter select. This control switches the main display to show the
Loudness Meter and is mutually exclusive to the True-Peak and Options select
controls. The ‘+’ button can be used to open a combined True-Peak and
Loudness Meter summary view.
© 2019 NUGEN Audio
6
Contents
Page 7

VisLM Operation Manual
2 Loudness bar meter. Shows the level of the current audio input in Loudness
Units (LU/LUFS) as dened by EBU R128 or ATSC A/85 (LK/LKFS). The meter
can show either Momentary (M) or Short-term (S) loudness as a bar meter,
with the remaining value indicated by a white arrow marker. It is also possible
to congure a split meter, with M/S or S/M meters side-by-side. Clicking the
LUFS/LKFS unit marker cycles through the options, or the meters required can
be specied directly via the options panel (see below). Various colour splits can
also be established using the parameters available in the Loudness Meter
options panel.
3 Momentary (M)/Short-term Loudness (S) Meter Max Value. This value shows
Maximum value of the momentary or short-term loudness meter (click the M
or S
indicator to toggle between the two). Click the numeric value to reset.
max
max
This value is also reset when the integrated loudness measurement is reset.
4 Momentary (M) loudness. Optional display (see Options panel below). Displays
the short-term loudness value as dened by ITU-R BS. 1770. This value may also
be indicated by the momentary loudness bar meter or using the white arrow
marker next to it depending upon user conguration.
5 Short-term (S) loudness. Displays the short-term loudness value as dened by
ITU-R BS. 1770. This value may also be indicated by the momentary loudness
bar meter or using the white arrow marker next to it depending upon user
conguration.
6 Integrated program loudness (I). This value displays integrated loudness as
described in ITU-R BS.1770 (or as specied by the dialog measurement if this is
active) and is controlled using the Integrated loudness functions [8].
7 Integrated program loudness with Dialog gating (ID). This value displays the
integrated loudness as described in ITU-R BS.1770 with dialog gating using the
Dialog Detection algorithm from Dolby Laboratories.
8 Loudness range descriptor (LRA). This value quanties the variation in a
time-varying loudness measurement and is supplementary to the measure of
overall loudness, that is, ‘integrated program loudness’.
9 Dialog Loudness Range descriptor (LRAD). This value quanties the variation
in loudness, much like the LRA reading, but is applied only to sections where
dialog is detected.
10 Integrated loudness functions. This group of controls provides access to the
Integrated Loudness section of the meter. In some history modes these controls
may alter slightly in functionality (see Loudness History modes below).
• Auto. Select to activate/de-activate transport activation of controls. This
control is not available in the stand alone version of VisLM.
• Play control. Start/continue the measurement of integrated loudness and
LRA simultaneously.
• Pause control. Pause the measurement of integrated loudness and LRA
simultaneously.
© 2019 NUGEN Audio
7
Contents
Page 8

VisLM Operation Manual
• X control. Resets all measures. May be operated whether the meter is
running or paused.
• Gate (where relevant). Displays when the gate is active. This is only valid
when audio is playing.
11 Mode indicator. This indicator lights to indicate which mode the meter is
operating in. It is possible to set VisLM to work specically to ‘EBU Mode’, ITU-R
BS. 1770, ATSC A/85 and others. It may also be useful to dene ‘transitional’
settings moving toward loudness recommendations. In these situations, where
the full denition of a particular standard is not adhered to, the mode indicator
will show ‘custom’.
© 2019 NUGEN Audio
8
Contents
Page 9
VisLM Operation Manual
Interface - Loudness History & Distribution
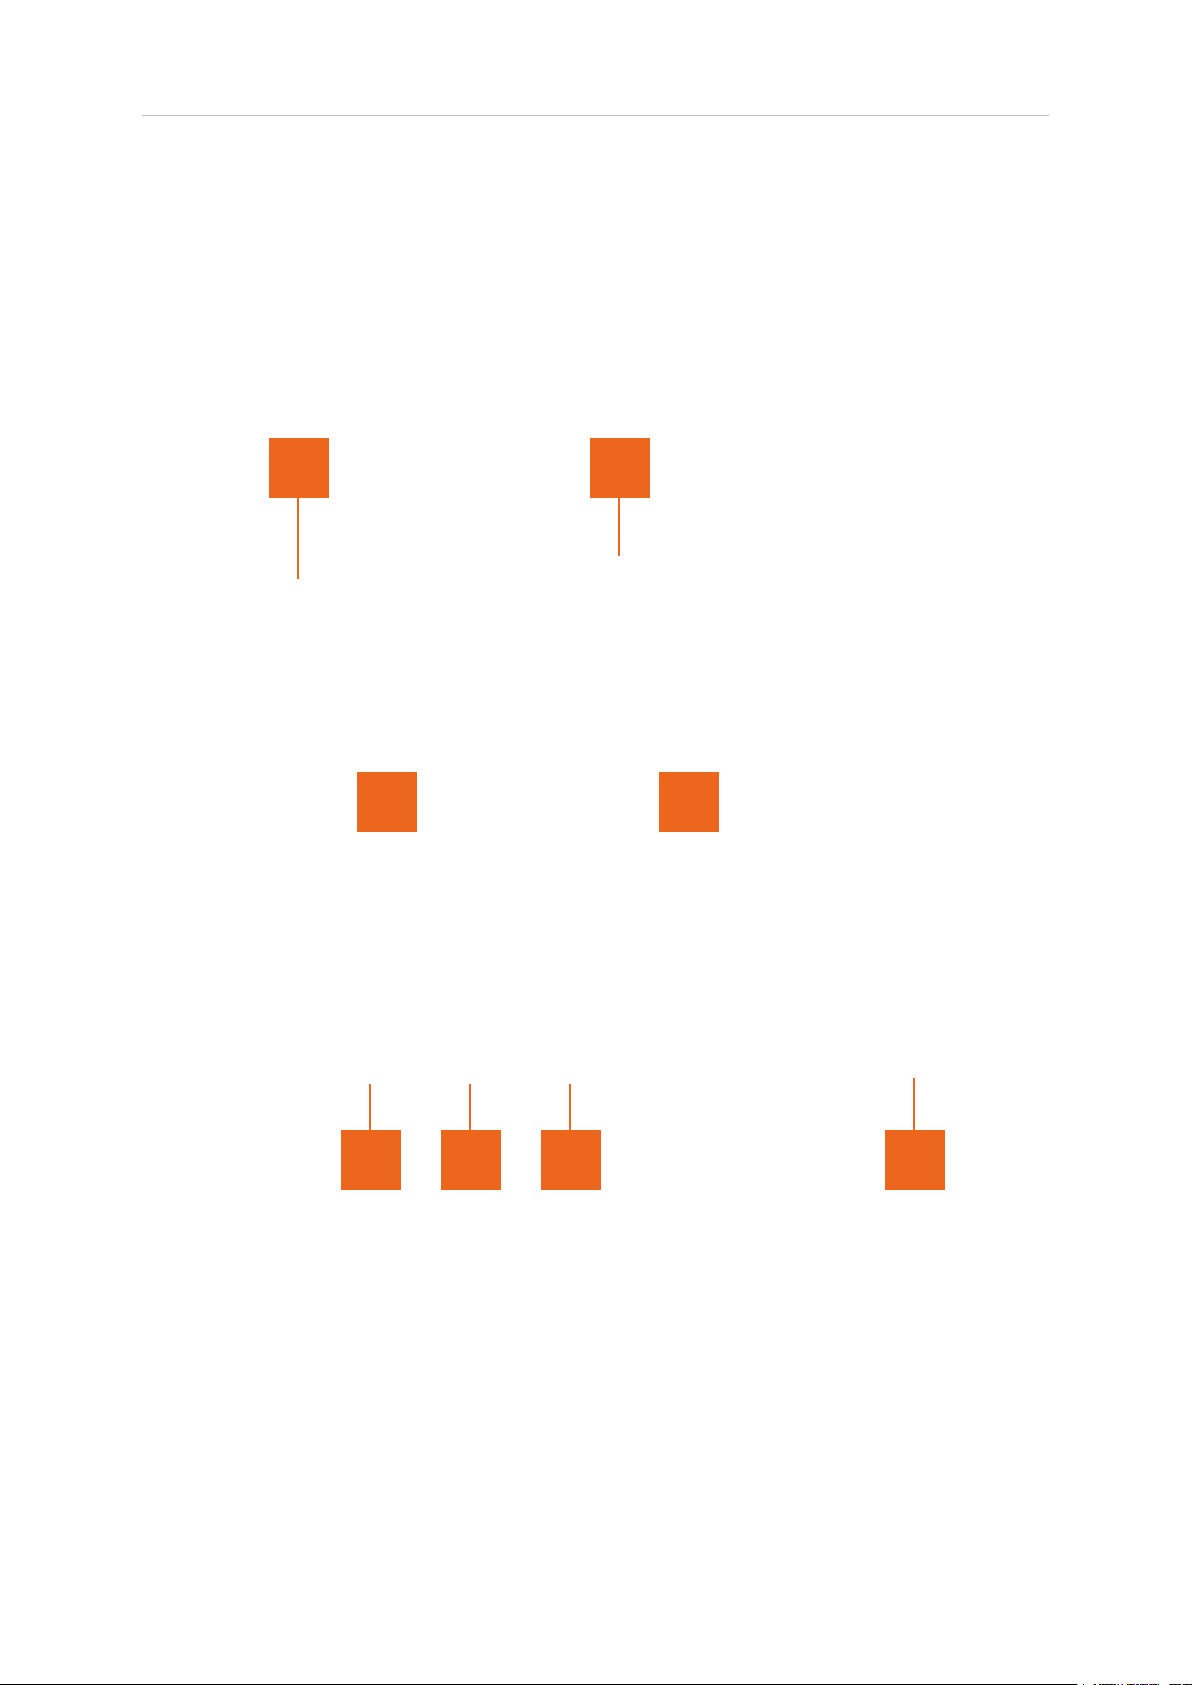
This section of the meter is only available in VisLM-H. The loudness history section
displays the historical data of the short-term loudness reading (compensated for
screen resolution where required). This view is active at all times, irrespective of the
main display control settings.
1 7
8 2
4 6 5 3
1 Loudness history view selector tabs. These controls determine which data is
shown in the loudness history.
• Arrow control. The arrow control found at the bottom of the selector tabs
is used to expand the tab selectors to reveal further options. Once the
desired options have been chosen, the control can be used to minimise
the tabs, leaving maximum space available for data presentation.
• Macro/M control. Start/continue the measurement of integrated
loudness and LRA simultaneously.
© 2019 NUGEN Audio
9
Contents
Page 10

VisLM Operation Manual
• History/H control. Used to toggle the history display on/off (see below).
This causes the plug-in interface to resize. Depending upon your
NLE/DAW, the plug-in interface may need to be closed and re-opened in
order to resize the plug-in container.
When the tabs are in expanded view (see Arrow Control above),
additional options are available.
• Int. Toggles the Integrated Program loudness indicator on/off in the
history display.
• Int (D). Toggles the dialog-gated integrated loudness indicator on/off in
the history display.
• TP. Toggles True-peak clip notications on/off on the history display and
history macro view. These are shown on both displays as red dots,
indicating the point at which a True-peak clip was detected.
• M. Toggles the Momentary loudness trace on/off in the history display.
• S. Toggles the Short-term loudness trace on/off in the history display.
• Variance. Toggles the Variance envelope on/off in the history display. The
variance measure is a sub-value of the loudness range descriptor, and
shows the measure of variation in the level over time.
• Dist/D control. Used to toggle the loudness distribution display on/off.
• Flags. Toggles display of both alert and manual ags.
• Alert. Toggles display of alert ags. These are automatically dropped
ags that are triggered by the alerts set up in the preferences. See
Options - Alerts for more details.
• Manual. Toggles display of manually dropped ags. These can be
created by clicking on the Flag button and removed by clicking on the
Clear button. See Navigating Flags for more details.
2 Loudness history inspector view. This area displays the loudness history
traces as determined by the history view selector tabs (see above), compensated
for screen resolution where required. The data scrolls building up the view over
time. The data for all traces within the loudness history view is continuously
calculated and stored irrespective of whether the trace is active or not.
The loudness history inspector view can be scrolled in time by click-dragging
left/right.
3 Loudness history follow control. This control determines whether the loudness
history automatically scrolls, following real-time input, or shows a static view to
allow historical inspection. Click to toggle the control on/off.
© 2019 NUGEN Audio
10
Contents
Page 11

VisLM Operation Manual
4 Loudness history zoom. Determines the zoom level of the history view, from
10 secs to 24 hours. All data is available until the plug-in is re-set, so it is
possible to choose different zoom levels at differing times without loosing data
from the view.
5 Pre-roll. In order for adjusted sections to be included in the overall loudness
reading, the audio must be in-sync. When you make an adjustment, you must
begin playing a few seconds before the edit. This value tells VisLM how far back
you intend to go. Under normal circumstances, you should set this to 3 seconds,
but if you have effects with a long tail, you may need to increase this value and
play back from a correspondingly earlier time.
6 Time reference. VisLM-H has three modes of time referencing, each with
different capabilities and applications.
• System. Chose this option to select a system clock (HH:MM:SS)
reference. When system time is selected, the time scale will scroll along
with the history inspector view to allow events to correlated with the
system clock.
• Elapsed. Elapsed time records the loudness at the audio input, scrolling
the input to the left as it is received. If the loudness history inspector view
is scrolled to view a specic set of data, this will cause the loudness data
trace to remain static, and (counter intuitively) the time reference scale will
begin to scroll ‘backwards’ as the data on view is effectively becoming
constantly older in the static display.
• Time code. Time code* referencing is only available in the plug-in version
of VisLM-H. When the time code reference is selected, loudness data is
stored against time-code position. This mode enables the loudness
overdub mode (a part of the proprietary NUGEN Audio ReMEM
TM
technology), the functionality of which is described in detail below.
7 Loudness macro overview. This view shows a macro overview of the loudness
history stored within the plug-in. The rectangular window shows the data
currently represented in the history inspector and can be dragged left/right to
rapidly locate a specic region in the loudness inspector.
8 Loudness distribution view. The loudness distribution shows the distribution
of short-term loudness measurements within the integrated loudness
calculation. As a result, the graph will only show data if the integrated loudness
calculation is active (or paused). The unshaded regions at the extremes of the
distribution represent the data that is not incorporated into the LRA calculation.
*Time Code referencing of audio data is dependent upon the support provided to the
plug-in via the NLE or DAW host. In some hosts this support is not available or only
restricted functionality is available.
© 2019 NUGEN Audio
11
Contents
Page 12
VisLM Operation Manual
Interface - True-peak Meter
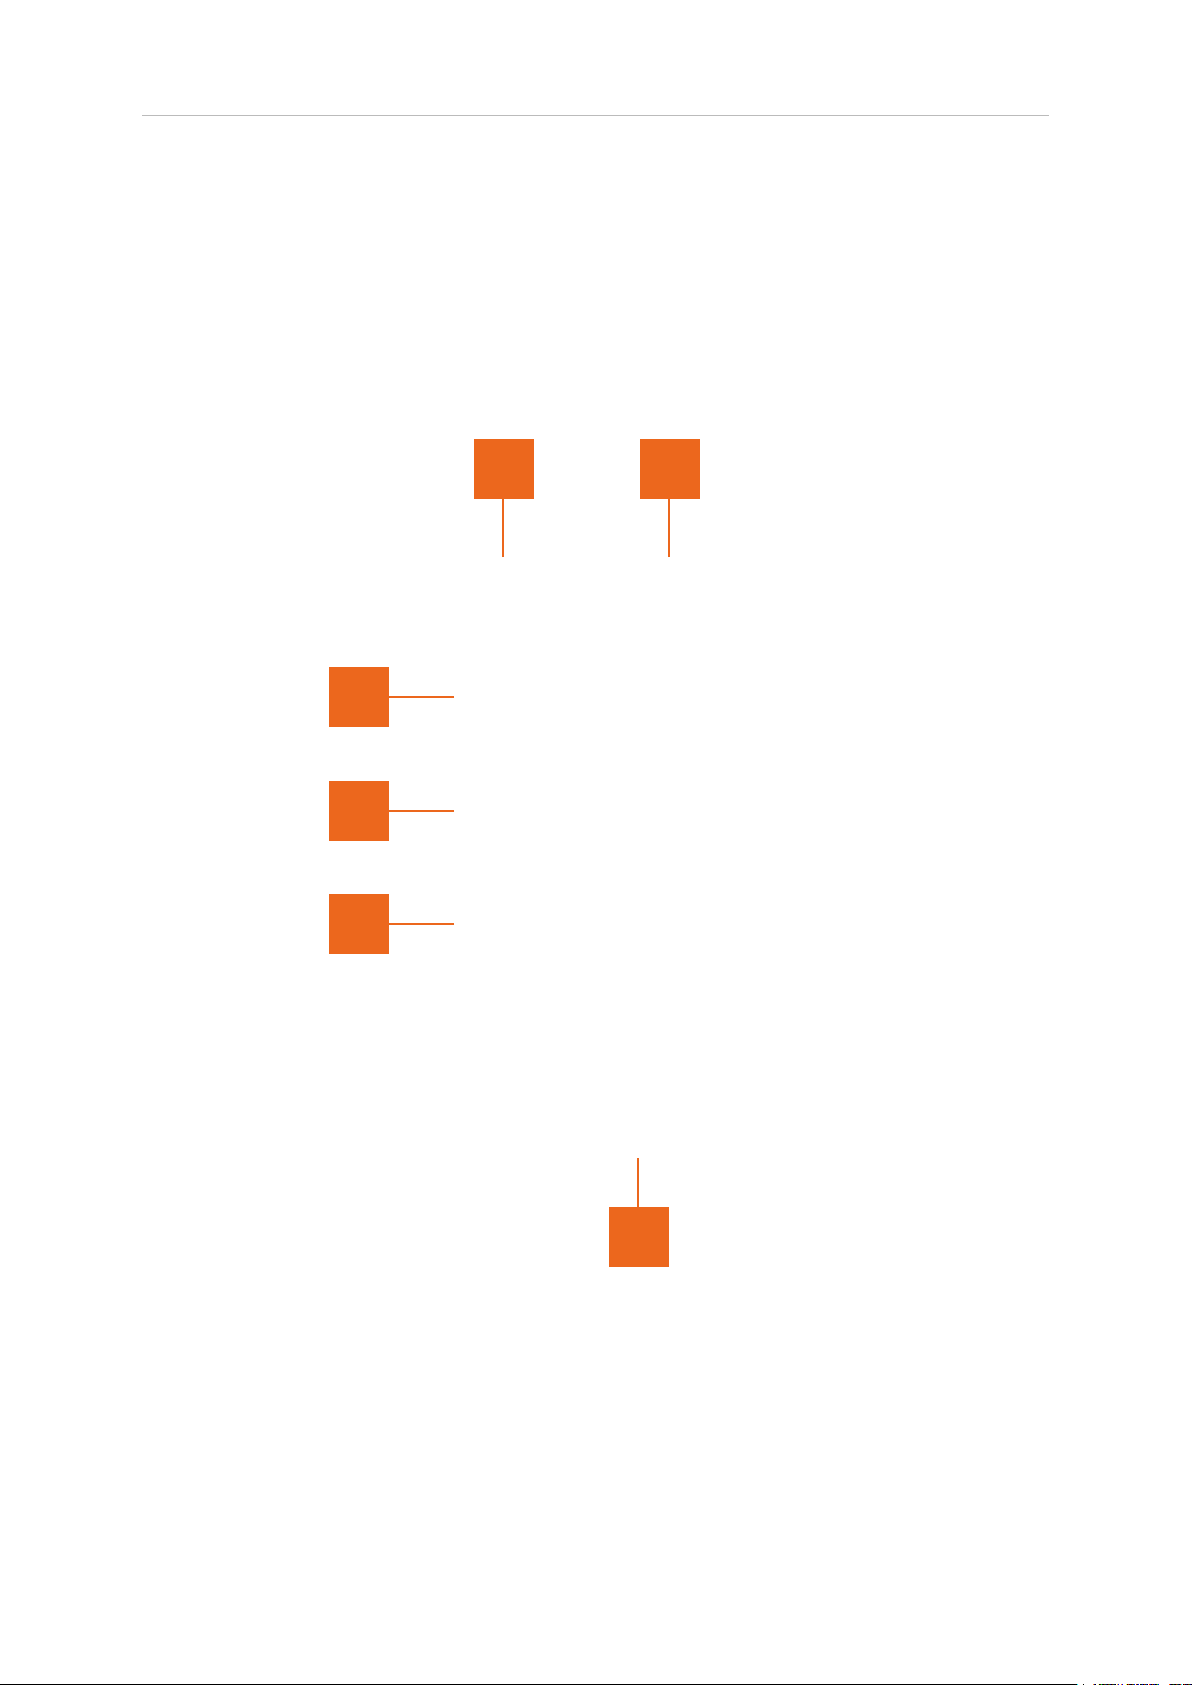
The true-peak meter displays true-peak values as dened in ITU-R BS.1770. VisLM is
available in stereo, 5.1, 7.1 and 7.1.2 formats, with the 5.1, 7.1 & 7.1.2 formats being able to
handle input from mono through to 7.1.2 surround automatically where the plug-in host
facilitates this.
3 2
4
5
6
1
1 True-peak meter select. This control opens the true-peak meter in the main
display, and is mutually exclusive with the Loudness Meter control (Loudness).
To return to using the Loudness Meter in the main display, use the Loudness
control. The ‘+’ button can be used to open a combined True-Peak and Loudness
Meter summary view.
© 2019 NUGEN Audio
12
Contents
Page 13

VisLM Operation Manual
2 True-peak level meter. Shows true-peak audio levels on available input channels
from single (mono) input, through to 7.1.2 surround. A permanent peak hold bar
marks the highest level achieved. Click the meter to reset.
3 True-peak overload indicator. True-peak overload indicator. This indicator will
activate if the true-peak level reaches the level set on the options page, and hold
momentarily after the signal has fallen below this threshold so as to be clearly
visible when activated.
4 Momentary (M)/Short-term Loudness (S) Meter Max Value. This value shows
Maximum value of the momentary or short-term loudness meter (click the M
or S
indicator to toggle between the two.) Click the numeric value to reset.
max
max
This value is also reset when the integrated loudness measurement is reset.
5 TPmax. This value gives the maximum reading for the True-peak meter. Click
the value to reset.
6 Surround routing. This control determines the routing for multi-channel audio
up-to 5.1, 7.1 or 7.1.2.
It is important to choose the correct routing, as the Loudness Meter
measurement weights individual channels differently.
5.1 routings available:
• DTS: L R Ls Rs C LFE
• ITU: L R C LFE Ls Rs
• Film: L C R Ls Rs LFE
7.1 routings available:
• DTS1: L C R Ls Rs Lr Rr LFE
• DTS2: L R C LFE Ls Rs Lr Rr
• Dolby1: L C R Ls Rs Lb Rb LFE
• Dolby2: L R C LFE Ls Rs Lb Rb
• SDDS1: L Lc C Rc R Ls Rs LFE
• SDDS2: L R C LFE Ls Rs Lc Rc
• NM: L R C LFE Lsr Rsr Ls Rs
© 2019 NUGEN Audio
13
Contents
Page 14

VisLM Operation Manual
7.1.2 routings available:
• ProTools 7.1.2: L C R Ls Rs Lsr Rsr LFE Lts Rts
• LR 7.1.2: L R C LFE Ls Rs Lsr Rsr Lts Rts
• ProTools 5.1.4: L C R Ls Rs LFE T Tfr Trl Trr
• LR 5.1.4: L R C LFE Ls Rs T Tfr Trl Trr
• NM 7.1.2: L R C LFE Lsr Rsr Ls Rs Lts Rts
© 2019 NUGEN Audio
14
Contents
Page 15
VisLM Operation Manual
Interface - Options Panels
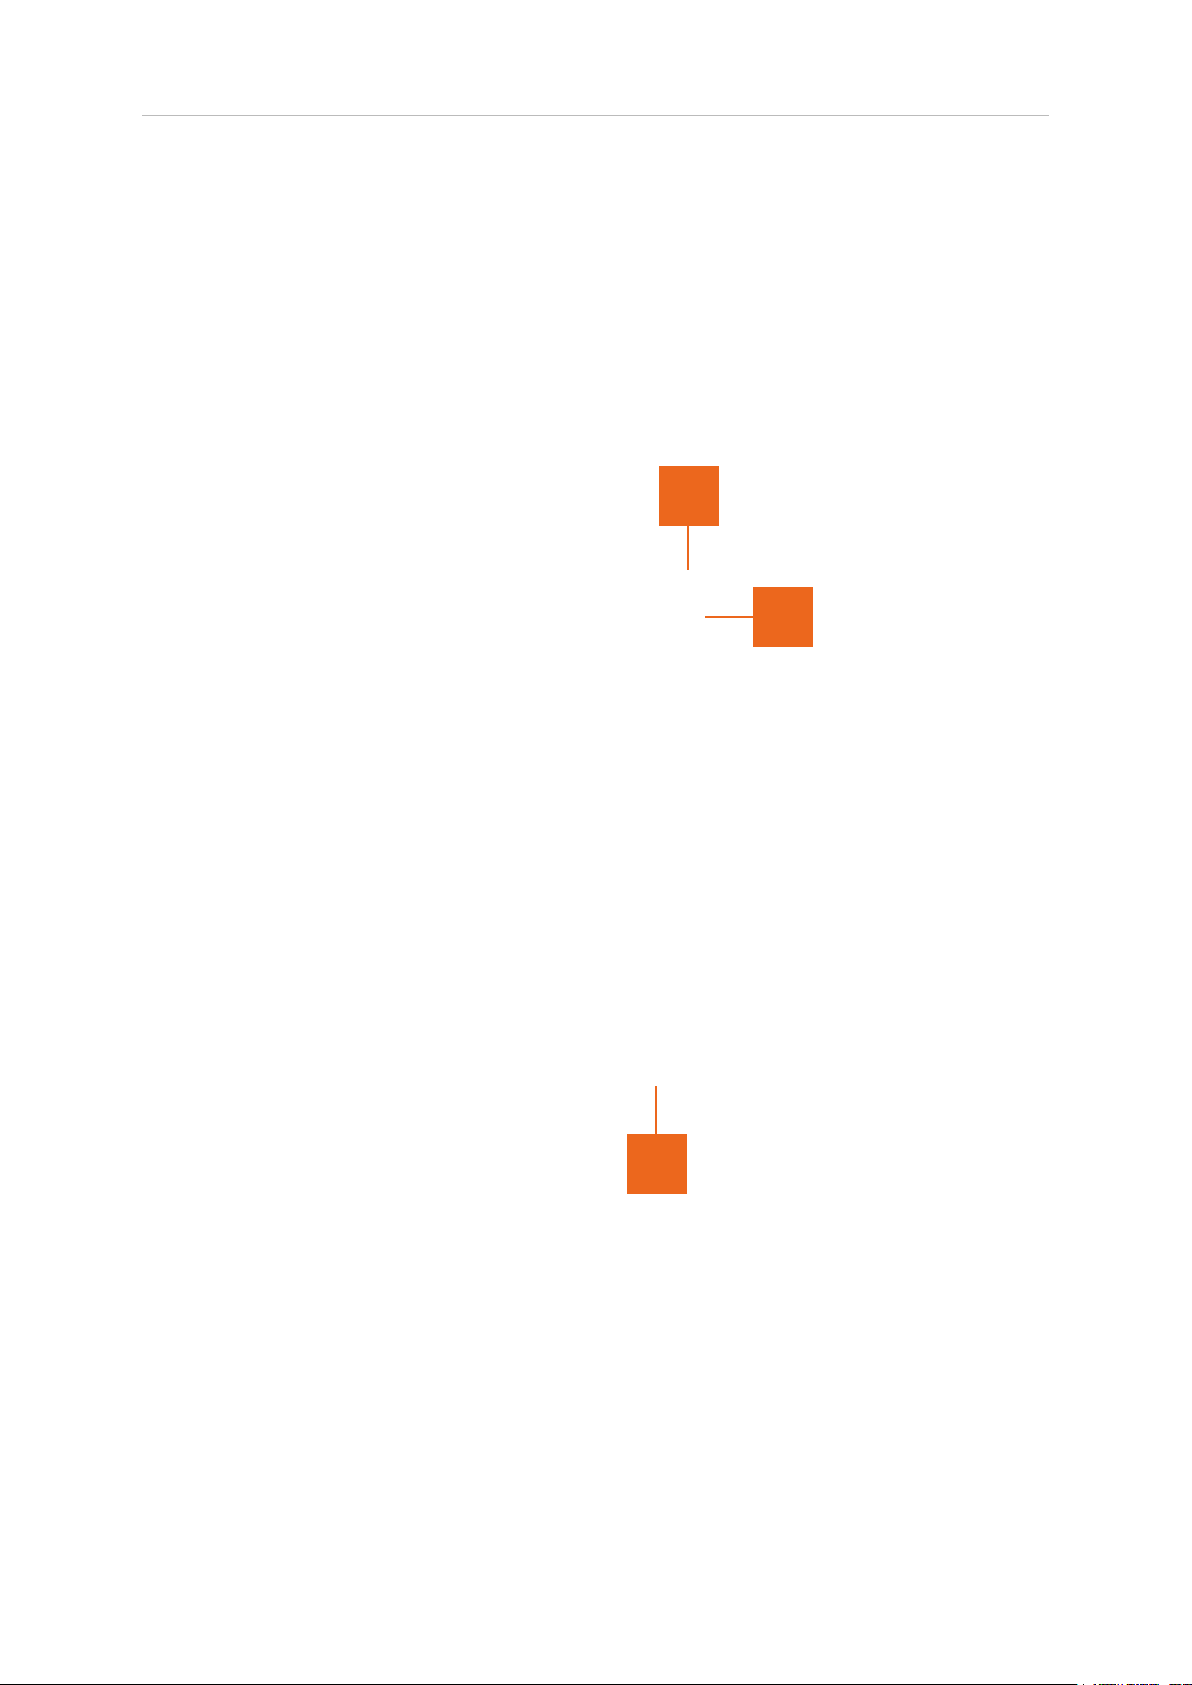
The options panels allow for in-depth conguration of the various meter parameters.
It is possible to congure the meter in a number of different ways to suit the intended
application.
To facilitate detailed conguration, the options available have been grouped into logical
tabs as detailed below.
2
3
1
1 Options select. This control opens the Options window in the main display, and
is mutually exclusive with the Loudness Meter control (Loudness) and True-peak
meter control (True-peak). To return to using the meters in the main display,
select the appropriate control or click the Options button again.
2 Presets recall. This control opens the preset browser window. The name of the
current preset is shown in the window along side. If the options are later changed
from the default preset parameters a ‘*’ character will show next to the preset
name.
3 Options tabs. The options tabs allow access to similarly groups functions to
enable rapid navigation to the desired parameter. Click a tab to switch to the
associated functions.
© 2019 NUGEN Audio
15
Contents
Page 16
VisLM Operation Manual
Options - Preset Recall
The preset recall button (see above) is available at the top of the options page,
irrespective of the chosen options tab and allows for rapid re-conguration of the
entire plug-in in keeping with the guidelines set out in many international and regional
standards. It is also possible to set the default opening parameters for the plug-in
after detailed user conguration settings have been applied.
2
1
3
1 Preset list. The preset browser opens a list containing many of the international
loudness standards which allow immediate conguration of all VisLM settings.
There are also illustrative presets which demonstrate some of the more
advanced settings available. To select a preset simply mouse-over the preset
title in the list, which which will then be highlighted, and click to load the
parameters. The preset will be loaded and the preset browser will close.
2 Next (previous). Click next (or previous) to move between pages of presets.
These controls only show if the window size of the plug-in is such that the entire
list cannot be shown in one screen.
3 Set current as default. This option will set the current settings as the default
opening settings for all new instances of VisLM.
4 Close. Closes the preset browser if no further functions are required.
4
© 2019 NUGEN Audio
16
Contents
Page 17

VisLM Operation Manual
Options - Meters
The meters tab contains detailed set-up options for both the loudness and True-peak
meters.
1 2 3 4 2 3
1 LM/ T P. These controls toggle the settings between the Loudness Meter (LM)
and the True-peak meter (TP). The conguration parameters are broadly similar,
with related parameters shown in the same position on both pages.
Mode. This setting denes the underlying mode of operation for the Loudness
Meter. Different standards and recommendations dene slightly differing
algorithms. The mode selector can be used to determine which the Loudness
Meter uses to calculate the loudness value.
S-Window. This value is usually set to 3 seconds, as dened by most standards,
however there are recommendations which choose a different value, which can
be set here if required.
Peak. Turns on the peak hold bars in the loudness bar meters.
Segments. Determines the number of loudness units represented by each
segment on the momentary/short-term loudness meter/s.
© 2019 NUGEN Audio
17
Contents
Page 18

VisLM Operation Manual
2 Splits. This section allows the Loudness Meter and True-peak Meter (and meter
history – VisLM-H only) to be split into colour banding to facilitate the rapid
assessment of whether loudness readings are falling within specication.
The split values (1 to 4) determine the position of the colour boundaries.
Click-drag up and down to change the value, or double-click to enter a value
directly. To change the colours of the sections, click the swatch to open up the
colour picker window. Select LM to dene settings for the Loudness Meter, TP
for the True-peak Meter.
3 LM (TP) scale upper/lower. Denes the upper and lower boundaries of the
loudness meter scales. Depending upon the precise aspect ratio of the meter in
practice, the scale may show slightly more than dened there, these are the
minimum specications required.
Offset. This value allows for absolute scale mapping (Full Scale) or mapping
of the zero point to some other value, such as target loudness (as in BS. 1771).
The EBU target loudness is dened as –23 LUFS = 0 LU, ATSC gives - 24 LKFS =
0 LK, although other values can be dened.
Display. Allows you to edit various elements of the display (see below).
Bar Meter. Determines what is shown by the loudness bar meter.
• M: Bar meter shows Momentary loudness
• S: Bar meter shows Short-term loudness
• M|S: Bar meter shows Momentary then Short-term loudness
• S|M: Bar meters shows Short-term then Momentary loudness
These options can also be cycled through by clicking the units display (LUFS/
LKFS) at the bottom of the bar meters in the loudness display.
4 LM/ T P. See above.
Ballistics. Sets meter ballistics to recognised standards. The update rate and
time window is as dened in EBU R128, this parameter determines the decay
time only.
TP clip. Sets the value at which the true-peak overload indicator lights.
Peak. Turns on the permanent peak hold bars in the loudness bar meters.
Temp peak. Determines the temporary peak-hold time (enter ‘0’ for Off).
© 2019 NUGEN Audio
18
Contents
Page 19
VisLM Operation Manual
Options - Display
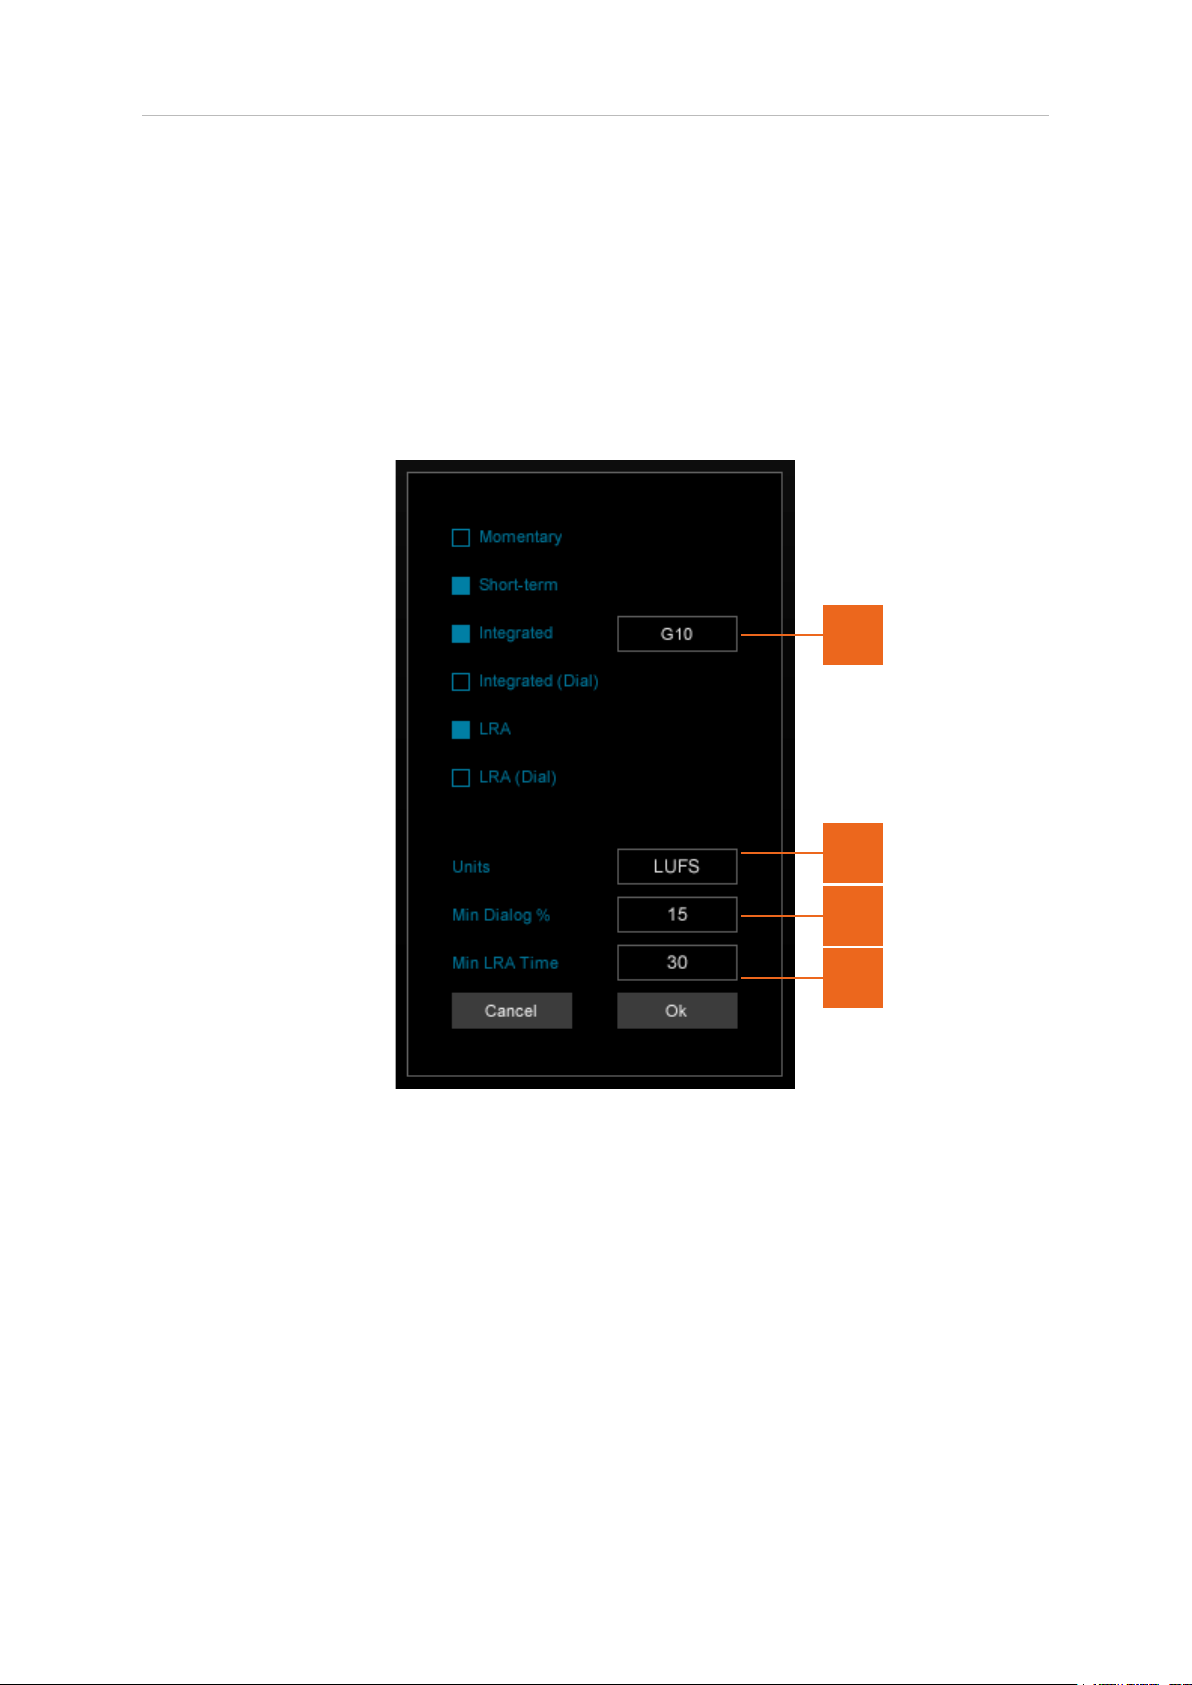
These settings allow you to change what is displayed. The check boxes will turn the
various readings on and off. Note that readings will only display when there is enough
room. When at its smallest size, VisLM has enough room to show three readings. If you
wish to display more, you will need to make the window larger in order for them to be
shown.
1
2
3
4
1 Gating. This is the gating that should be used for the integrated lozenge. You can
select one of three options: Ungated, G8 and G10.
2 Units. This has no effect on the reading, but changes the units displayed to be
LUFS, LKFS or dB.
3 Min Dialog %. If you are displaying the Integrated Dialog reading, then it will be
greyed out if the percentage of the program currently containing dialog is less
than this percentage.
4 Min LRA time. If the amount of audio received is less than this amount, the
reading may be considered unstable and will be greyed out.
© 2019 NUGEN Audio
19
Contents
Page 20

VisLM Operation Manual
Options - Alerts
Alerts can be set to give a visual warning if loudness parameters deviate from desired
values for a given amount of time. This can be instantaneous if these are pass/fail
criteria, or set to alert after a specic time period if the warning is for guidance only.
Minimum and Maximum alert levels are set and activated independently for each
parameter.
Each alert option can be set to On, Off or Auto. If an alert is off, it will not be triggered.
If it is on, it will be triggered when the level specied in the corresponding ‘Alert’ box is
reached, but only if the level has passed the limit for longer than the duration specied
in the ‘Period’ box. The alert will remain active until the corresponding read-out is
clicked, even if the level returns to an acceptable level. If the alert is set to auto, it
behaves in a similar manner to when it is on, but it will be cleared as soon as the level is
no longer past the limit.
An alert warning is indicated on the loudness meter interface numerical read-out. If a
parameter exceeds the alert level, the read-out will change colour to orange text, to
indicate an alert has been triggered. Click the loudness value to re-set the alert.
Note that only the enabled parameters will be available for adjustment. You can change
which parameters are visible by clicking on the ‘Display’ button from the Meters tab.
© 2019 NUGEN Audio
20
Contents
Page 21

VisLM Operation Manual
Options - Export
The export tab is used to determine what data (if any) is exported by the plug-in during
operation. VisLM can export loudness data to both a text le and as automation data
for display of loudness data in the timeline.
The Tex t l og control determines whether text logging is activated. The frequency of
data logging is specied as number of seconds between each entry using the Log Freq
parameter. The le name and path are determined using the text log box. The radio
buttons can be used to activate/de-activate data export, and select the values to be
included in the le.
Multiple instances of VisLM will export to unique data les. The data is exported as a
csv (Comma Separated Value) le, and as such can be readily imported in to common
spreadsheet programs for graphing and further analysis.
The Auto Log controls toggles on/off the automation logging feature. When active, a
series of automation parameters will be generated at the set interval Log Freq.
© 2019 NUGEN Audio
21
Contents
Page 22

VisLM Operation Manual
Options - Global
The global tab contains parameters affecting the entire plug-in globally.
Zoom Level. When the plug-in is resized (VisLM-H only), it is possible to resize the
text. Depending upon the reason for resizing this may or may not be desirable. Auto,
automatically scales the text depending upon the size and aspect ratio. Regular
chooses the standard font size and Large forces the interface to large text view.
TC Offset. If the NLE time-line is offset from zero, this parameter can be used to offset
VisLM-H so that time-code positions match the NLE.
Frame Rate. If frame-rate notication is not passed to the plug-in via the NLE, this
parameter can be used to ensure sync is properly locked.
Save History. If you are editing a large program, the history data can take a
considerable amount of space and may cause issues if your DAW/NLE attempts to
auto-save whilst playing audio. You can use this option to disable the saving of the
history data (all other settings and options will still be saved), then when you have
nished editing you can turn this option back on to save your work.
© 2019 NUGEN Audio
22
Contents
Page 23

VisLM Operation Manual
Loudness History Mode (VisLM-H Only)
VisLM-H is capable of recording and displaying the loudness history over time
Depending upon the mode selected, this can be used to investigate the evolution of
loudness parameters, exclude time periods from the Integrated Program calculation
and even overdub discreet audio sections, allowing re-calculation of loudness values
without the need to re-play the entire program through the meter.
This section discusses the different history modes and the differing functionality
available within each mode.
VisLM-H offers three history modes:
• System - Loudness data is logged against real-time system clock information
• Elapsed - Loudness data is logged relative to the ‘start’ of data input
• Time Code - Loudness data is logged against Sample/time code reference
In all three modes, the loudness data for each reading is stored irrespective of whether
the particular graph view is active, and can be toggled on/off at any time for inspection.
The loudness data is saved with the session and will be recalled when the session is
re-opened.
In general the operation for each mode is the same. The data is stored over time from
left to right, with the screen automatically scrolling as new data is acquired when the
loudness history follow control is active (see Interface - Loudness History for detail
about the individual controls).
The time span the history view shows can be increased or decreased using the
History Zoom control and the data can be scrolled in the time-line by clicking and
dragging left and right.
The History Macro view gives an overview of all the data stored, with the rectangular
white box indicating the data currently under inspection in the main window. The
rectangular box can be dragged left and right to rapidly locate a specic time window
in the main history view.
© 2019 NUGEN Audio
23
Contents
Page 24
VisLM Operation Manual
Loudness History Mode - System
The System Time reference logs loudness data against the time as measured by the
System Clock of the host machine for up to 24 hours. System time is useful for realtime
monitoring of live audio feeds.
4 4
3
1 2 5
1 System Time Indicator. Click to select ‘System’ from the pop-up box to activate
System time mode.
2 System Time Scale. In System mode, the loudness history shows the loudness
values against a scale indicating the hh:mm:ss that the data was received.
As the system time is an absolute, not a relative value, it is not possible to
overdub loudness values in this mode, new data is always recorded and logged
at the relevant system time value in the time line.
3 Transport controls. In system time, the transport controls can be used to
determine how the data is stored and which data is included in the Integrated
Program Loudness and LRA calculation.
The ‘X’ button clears all data, ushing the memory and resetting all loudness
parameters.
© 2019 NUGEN Audio
24
Contents
Page 25

VisLM Operation Manual
The ‘Auto’ button automatically activates the ‘X’ button, resetting all loudness
parameters with the transport control. This can be useful when recording and
measuring loudness of discreet audio sections one after the other.
The ‘Play’ arrow control begins Integrated Program measurement.
The ‘Pause’ control temporarily pauses the Integrated Program measurement
and LRA, whilst retaining all data up until that point. Measurement can be
restarted by clicking the control again. This feature is useful if for instance, a
commercial break inserted into a program is to be excluded from the loudness
calculation.
4 When the Integrated Program Loudness and LRA calculation is paused, the
data that is exuded from the measurement is shown ‘grey’ in the loudness
history and macro view. The individual Short-term and Momentary loudness
traces are still shown, but this data is excluded from the overall Integrated
Program Loudness calculation.
5 History Follow control. When the history has been scrolled in the main window,
the follow control is automatically de-activated. This allows the history window to
show the data without scrolling to update to the more recent input. This data is
continuously generated whether the view is following the current input or not. To
automatically scroll and follow the input, re-activate the control.
© 2019 NUGEN Audio
25
Contents
Page 26
VisLM Operation Manual
Loudness History Mode - Elapsed
The Elapsed time reference operates in a similar manner to the System mode except
that the incoming loudness data is logged only when it is received, thus the audio
loudness as measured over the last hh:mm:ss is shown. This mode is useful when
moving around the time-line, playing in numerous sections to measure an over-all
Integrated Program Loudness value. It can also be used as a simple alternative to
other modes, when measuring sections of audio, using the Auto control to reset the
measurement automatically.
4
3
1 2 5
1 Elapsed Time Indicator. Click to select ‘Elapsed’ from the pop-up box to
activate Elapsed time mode.
2 Elapsed Time Scale. In Elapsed mode, the loudness history shows the loudness
values against a scale indicating the hh:mm:ss since the data was received.
It is not possible to overdub loudness values in this mode, new data is always
appended and logged subsequent to measurements previously taken.
3 Transport controls. In elapsed time, the transport controls can be used to
determine how the data is stored and which data is included in the Integrated
Program Loudness and LRA calculation.
© 2019 NUGEN Audio
26
Contents
Page 27

VisLM Operation Manual
The ‘X’ button clears all data, ushing the memory and resetting all loudness
parameters, beginning a fresh set of data.
The ‘Auto’ button automatically activates the ‘X’ button, resetting all loudness
parameters with the transport control. This can be useful when recording and
measuring loudness of discreet audio sections one after the other.
The ‘Play’ arrow control begins Integrated Program measurement.
The ‘Pause’ control temporarily pauses the Integrated Program measurement
and LRA, whilst retaining all data up until that point. Measurement can be
restarted by clicking the control again. This feature is useful if for instance, a
commercial break inserted into a program is to be excluded from the loudness
calculation.
4 When the Integrated Program Loudness and LRA calculation is paused, the
data that is excluded from the measurement is shown ‘grey’ in the loudness
history and macro view. The individual Short-term and Momentary loudness
traces are still shown, but this data is excluded from the overall Integrated
Program Loudness calculation.
5 History Follow control. When the history has been scrolled in the main window,
the follow control is automatically de-activated. This allows the history window to
show the data without scrolling to update to the more recent input. This data is
continuously generated whenever input is received, whether the view is following
the current input or not. To automatically scroll and follow the input, re-activate
the control.
Note. If the history view has been scrolled to show data recorded in the past, and
new data is still being received, the time-scale will appear to scroll ‘backwards’.
Because new data is still being added to the time-line, this is in fact correctly
representing the data, even if it may seem counter intuitive at rst. The data in
view, is now falling further and further into the past as new data is added and the
time elapsed since it’s recording is increasing.
© 2019 NUGEN Audio
27
Contents
Page 28
VisLM Operation Manual
Loudness History Mode - Time Code
The Time Code reference is only available in the Plug-in version of VisLM-H and then
only when the DAW/NLE supports time-code referenced audio data in it’s plug-in
architecture.
In Time-code mode, loudness measurements are logged by the plug-in with Time Code
referencing. This means that the plug-in knows precisely where the data belongs in the
time-line and enables the ability to overdub small sections of audio that have changed
in the loudness history to immediately re-calculate the overall Integrated Program
Loudness without having to re-measure all of the audio again.
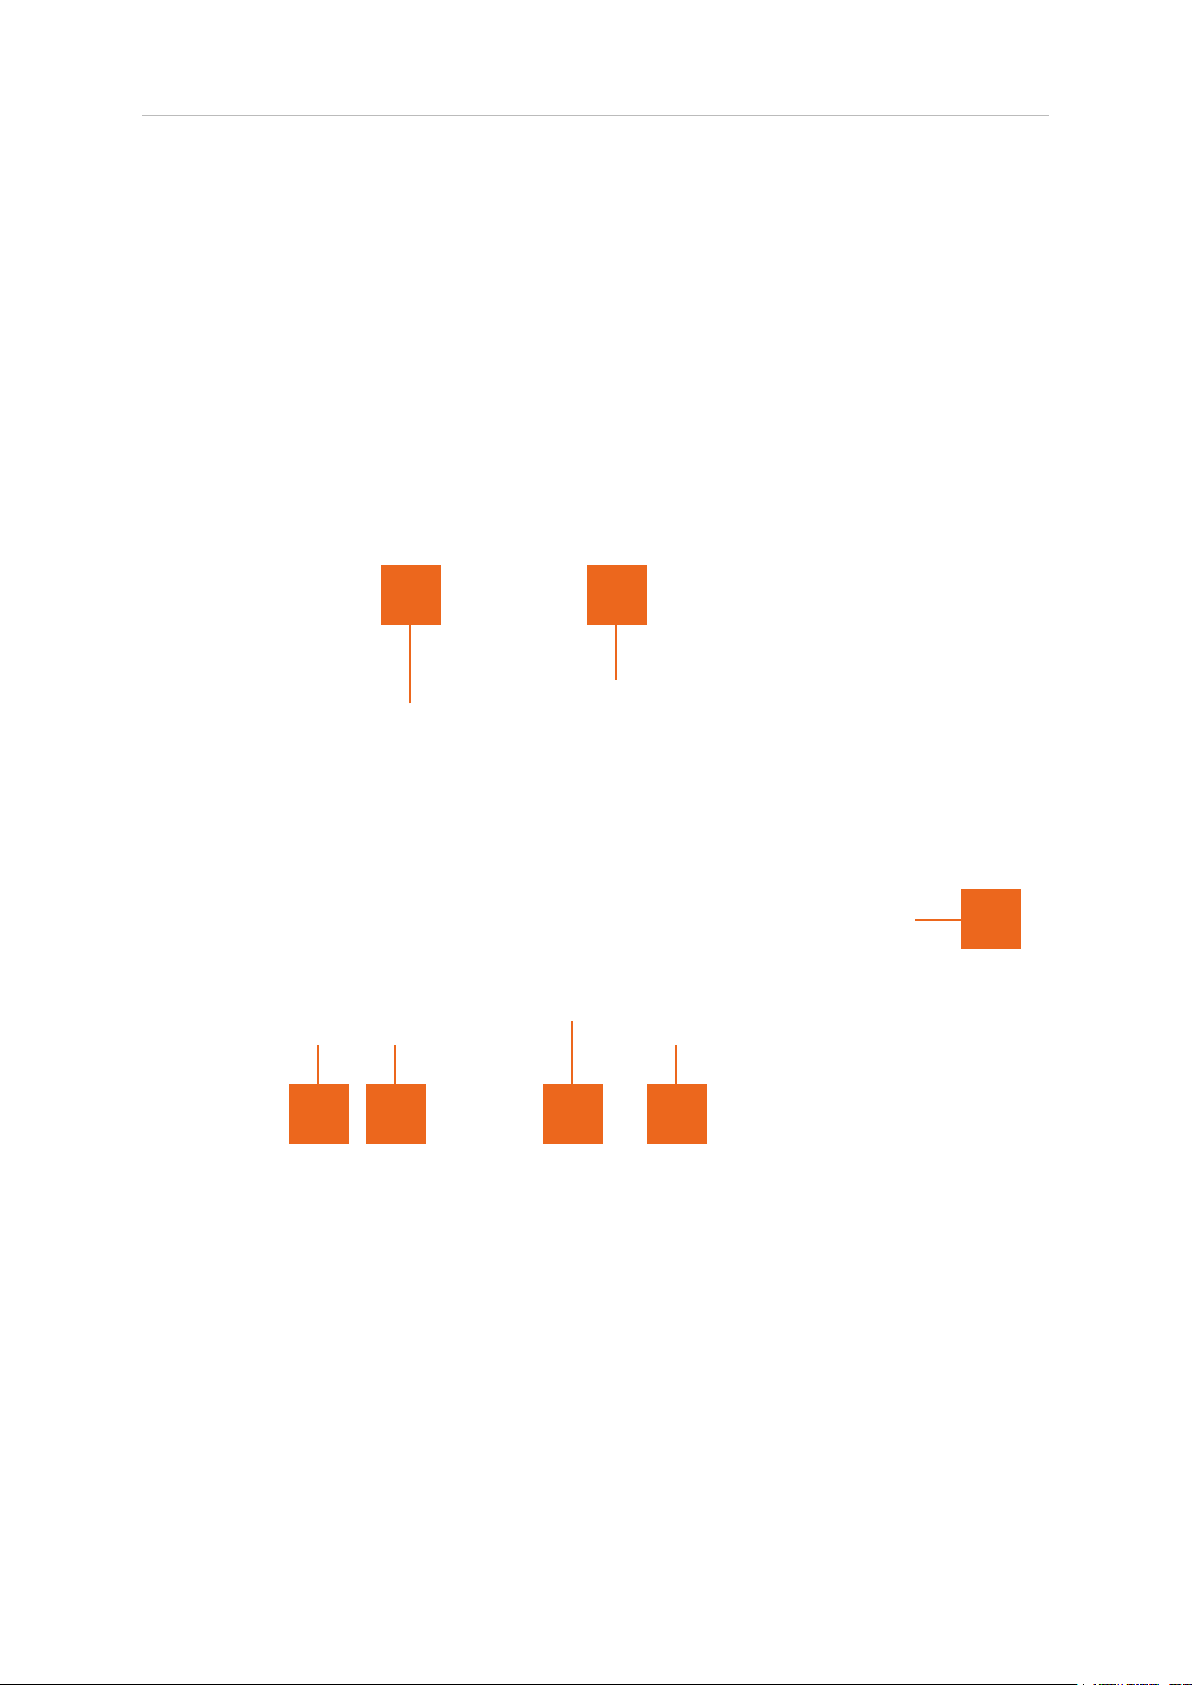
4 5
3
1 5 2 6
1 Time Code Indicator. Click to select ‘Time Code’ from the pop-up box to
activate Time Code mode.
2 Time Code Scale. In Time Code mode, the loudness history shows the loudness
values against a scale indicating the time code hh:mm:ss that the data was
received.
As all time-code position data refers to a unique point in the time line, it is
possible to overdub loudness values in this mode. If new data is received for a
time-code position it will be written to that position, allowing overdubs of new
audio data to be made after an edit. All remaining data is retained, and so a new
Integrated Loudness and LRA calculation will be produced after the overdub.
© 2019 NUGEN Audio
28
Contents
Page 29

VisLM Operation Manual
3 Transport controls. In Time Code mode, the transport control behaviour is
slightly different to other modes.
The ‘X’ button clears all data, ushing the memory and resetting all loudness
parameters.
The ‘Auto’ button automatically activates the ‘X’ button, resetting all loudness
parameters with the transport control. This can be useful when recording and
measuring loudness of discreet audio sections one after the other.
The ‘Play’ arrow control begins Integrated Program measurement. In Time Code
mode this control is always active, as all the data received forms part of the
measurement.
The ‘Pause’ is not available in Time-code mode. All loudness data generated is
included in the Integrated Program Loudness and LRA calculation. If a specic
set of data is not to be included, then simply avoid playing this section of audio
into the plug-in.
4 As loudness is measured, the loudness prole is built up in the history view. In
Time code mode it is possible to move the transport in the time line and play
audio from any position. The audio is measured in the correct Time Code
position in the history view.
Any sections of the time-line where audio has not been received are highlighted
in grey, showing that the plug-in has yet to receive data for this region.
5 Overdub Pre-roll. If audio has previously been received for a section of Time
Code, VisLM-H will perform a loudness overdub when new audio is played ie.
after an edit.
In order to correctly update all the loudness information during an overdub,
VisLM-H needs to ‘tie-in’ the audio either side of the over-dub for a default of 3
seconds (the Short-term loudness calculation uses a short-term sliding window
of 3 seconds in order to determine a value). The simplest way to automate this is
to set the pre-roll functionality of the NLE/DAW to 3 seconds, so that any edit
position automatically plays in this ‘tie-in’ section.
If an audio overdub begins without the initial tie-in, this will be highlighted by a
pink region as shown and an earlier play position will need to be chosen to
generate the tie-in data.
Once the audio is locked to a recognised set of loudness measurements, the
overdub data will be written, overwriting previous loudness measurements.
When the end of the overdub is reached, VisLM-H will then seek to tie-in the end
of the section with 3 seconds of recognised readings. Once this has nished,
the overall Integrated Program Loudness will be shown for the entire data-set.
© 2019 NUGEN Audio
29
Contents
Page 30

VisLM Operation Manual
Note: Some NLE/DAW hosts also rapidly fade in audio at play re-start. This
functionality should either be disabled or set to a minimum. It is also worth
noting that many FX plug-ins require a ‘lead time’ to reach a stable reference
position eg. Delay and reverbs are echoing audio previously received. In this case
a longer pre-roll may be required. It is also possible that a plug-in will not in fact
reproduce audio in the same way each time ie. There is a random element
involved. In this case, an over-dub would not be possible without rst rendering
the plug-in in order to give the same loudness reference for each pass.
6 History Follow control. When the history has been scrolled in the main window,
the follow control is automatically de-activated. This allows the history window to
show the data without scrolling to update to the more recent input. This data is
continuously generated whether the view is following the current input or not. To
automatically scroll and follow the input, re-activate the control.
© 2019 NUGEN Audio
30
Contents
Page 31

VisLM Operation Manual
Navigating Flags
Whilst processing audio, VisLM can be congured to mark periods where the loudness
readings stray outside of expected boundaries. These can be displayed on the history
interface, along with manually dropped ‘ags’ and appear in either red or orange.
1 2 3 4 5 6
Orange ags are those that have been dropped manually. Red ags are positions where
an alert has been triggered. Note that alert ags appear where the alert is rst activated.
The navigation buttons at the bottom allow you to quickly move between ags.
1 Move to the rst visible ag
2 Move to the previous ag
3 Mark the current playback position with a manual ag
4 Clear all manual ags
5 Move to the next ag
6 Move to the last ag
If the current ag is an alert, an extra window appears in the bottom-right corner of the
history showing you the time at which the alert occurred and the readings at that point.
Readings that are in the alert state will be highlighted in red.
© 2019 NUGEN Audio
31
Contents
Page 32

VisLM Operation Manual
Stand Alone Application
VisLM is also available as a stand-alone application for Win/OSX in addition to the
plug-in versions.
The stand-alone application is designed to monitor the ASIO Audio Input/s of the
machine it is installed on, turning it into a free-standing, independent loudness meter.
Note: Within Windows and OSX, there is no option to route the Audio Output
directly into a secondary application, the VisLM application can only monitor the
Audio Input. 3rd Party products are available to add this functionality if required.
The functionality of the VisLM application is exactly as that of the plug-in with the
addition of a number of menu items.
File: Load settings…
Save Settings
Save Settings as…
Quit
Settings: Change audio device settings Select the device for audio input
Show channel routing matrix Allows for detailed input cong
Open on system start-up Opens VisLM-H on start
About: Opens credits, licensing and de-authorisation window.
Calibration and test tones
Whilst VisLM needs no specic calibration or set-up when used with-in a DAW, in
situations where external audio paths are used to transfer audio to the host machine,
it can be useful to check that the signal path is transmitting the data without accidental
ltering or attenuation (using a digital connection is recommended to reduce/eliminate
these potential complications).
Both the ITU and EBU provide test tone specications for checking meter compliance,
calibration and set-up and these are listed below.
ITU-R BS. 1770/1 Test Tone
If a 0 dB FS 1 kHz sine wave is input to the left, centre, or right channel input, the indicated loudness will equal –3.01 LKFS
© 2019 NUGEN Audio
32
Contents
Page 33
VisLM Operation Manual
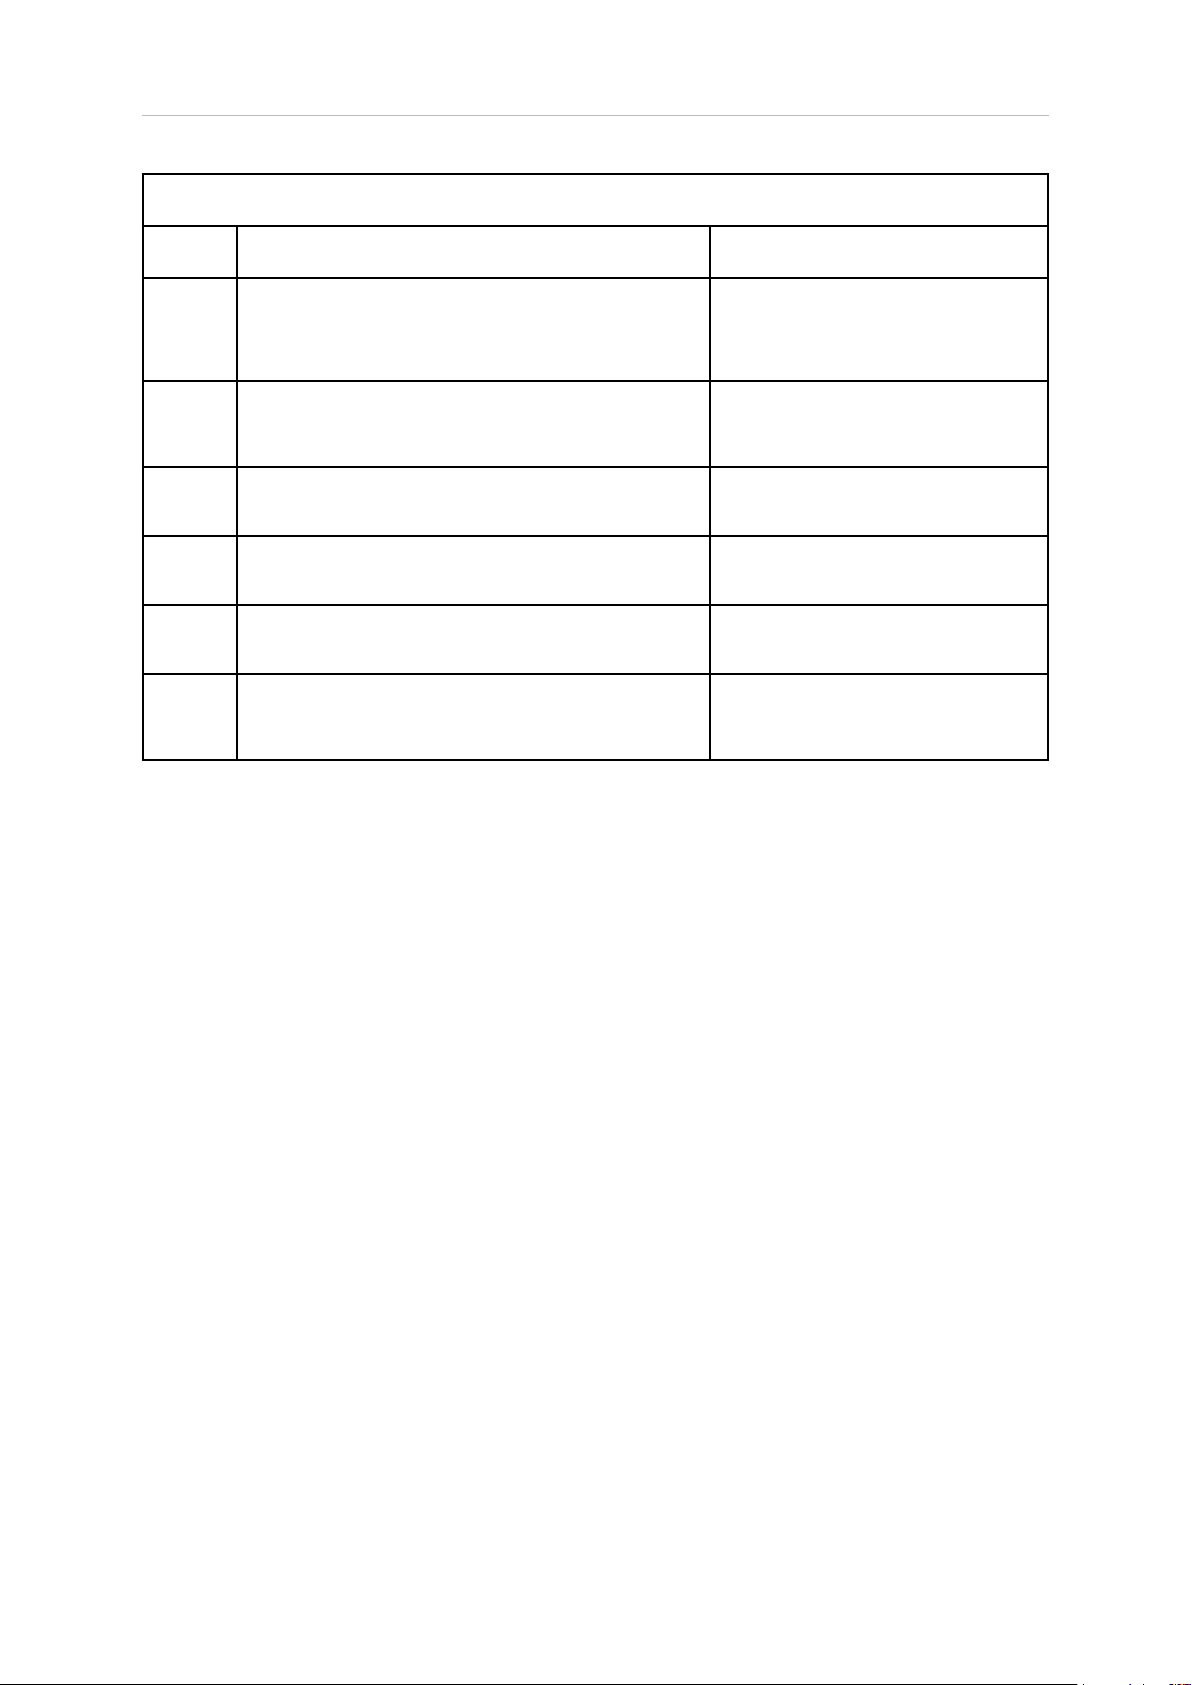
ITU-R BS. 1770/1 Test Tone
Test Signal Expected response (and tolerance)
1 Stereo sine wave, 1000 Hz, -23.0 dBFS (per-channel peak
level); signal applied
in phase to both channels simultaneous;
20s duration
2 As #1 at -33.0 dBFS M, S, I = -33.0 ±0.1
3 As #1, preceded by 20 s of -40 dBFS stereo sine wave, and
followed by 20s of - 40 dBFS stereo sine wave
4 As #3, preceded by 20 s of -75 dBFS stereo sine wave, and
followed by 20 s of - 75 dBFS stereo sine wave
5 As #3, but with the levels of the 3 tones at -26 dBFS, -20
dBFS and -26 dBFS, respectively
6 5.0 channel sine wave, 1000 Hz, 20s duration, with per-chan-
nel peak levels as follows: -28.0 dBFS in L and R -24.0 dBFS
in C -30.0 dBFS in Ls and Rs
M, S, I = -23.0 ±0.1
LUFS M, S, I = 0.0
±0.1 LU
LUFS M, S, I = -10.0
±0.1 LU
I = -23.0 ±0.1 LUFS I
= 0.0 ±0.1 LU
I = -23.0 ±0.1 LUFS I
= 0.0 ±0.1 LU
I = -23.0 ±0.1 LUFS I
= 0.0 ±0.1 LU
I = -23.0 ±0.1 LUFS I
= 0.0 ±0.1 LU
© 2019 NUGEN Audio
33
Contents
Page 34

VisLM Operation Manual
Loudness Metering in Practice
VisLM provides Loudness Metering to several dened standards, and can be tailored
to suit many specic situations using the many options available.
A good starting point is to select a Preset using the preset selections available via the
options page. The preset will select an algorithm that meets the specication of the
recommendations of the standard referred to in the title. This will set up VisLM to
give readings that can be used to meet the production requirements of the standard
selected. A description of some of these settings is given below.
Preset Description
ATSC A/85 LKFS Full scale loudness meter to 0 LKFS
ATSC A/85 LK Relative scale loudness meter off-set to 0 = -24 LKFS
EBU R128 LUFS +9 Full scale loudness ‘EBU Mode’ meter to 0 LUFS
EBU R128 LUFS +18 Full scale loudness ‘EBU Mode’ meter to 0 LUFS
EBU R128 LU +9 Relative scale loudness meter off-set to 0 = -23 LUFS
EBU R128 LU +18 Relative scale loudness meter off-set to 0 = -23 LUFS
AGCOM 219/9/CSP LUFS Full scale loudness meter to 0 LUFS
AGCOM 219/9/CSP LU Relative scale loudness meter off-set to 0 = -24 LUFS
ITU-R B.S. 1770/1 LKFS Full scale loudness meter to 0 LKFS
ITU-R B.S. 1770-2 LKFS Full scale loudness
ITU-R B.S. 1864 LK Relative scale loudness meter off-set to 0 = -24 LK
ARIB TR-B32 Full scale loudness
Gated algorithm (G10)
ITU-R B.S.
True Peak Metering Over at –2dBTP
Gated algorithm (G10)
ITU-R B.S.
True Peak Metering Over at –2dBTP
Gated algorithm (G10)
EBU +9 Scale
True Peak Metering Over at –1dBTP
Gated algorithm (G10)
EBU +18 Scale
True Peak Metering Over at –1dBTP
Gated algorithm (G10)
EBU +9 Scale
True Peak Metering Over at –1dBTP
Gated algorithm (G10)
EBU +18 Scale
True Peak Metering Over at –1dBTP
Gated algorithm (G8)
ITU-R B.S.
True Peak Metering Over at –2dBTP
Gated algorithm (G8)
True Peak Metering Over at –2dBTP
Un-gated algorithm
ITU-R B.S. 1771 Scale
True Peak Metering Over at –2dBTP
Gated algorithm (G10)
ITU-R B.S. 1771 Scale
True Peak Metering Over at –2dBTP
Un-gated algorithm
ITU-R B.S. 1771 Scale
True Peak Metering Over at –2dBTP
Gated algorithm (G10)
ITU-R B.S. 1771 Scale
True Peak Metering Over at –1dBTP
© 2019 NUGEN Audio
34
Contents
Page 35

VisLM Operation Manual
Taking Measurements and meeting loudness requirements.
The loudness requirements for different companies and institutions vary, so the
guidelines below are supplied as background reading and to introduce the principles
involved.
Choosing the underlying loudness standard.
VisLM is capable of meeting several loudness standards. All these standards are based
on the denition of loudness measurement as dened in ITU-R B.S. 1770. Using this
standard measurement of other recommendations such as EBU-R 128 and ATSC A/85
have been produced. Before making loudness measurements with the intention of
meeting loudness delivery specications it is important to choose the correct standard.
Many of these are included as presets, others can be established using the parameters
on the options page.
For more general loudness investigations, where no specic mode of operation is
dened, any of the standard presets will give useful results.
Momentary Loudness.
This value is a rapid changing measure of the loudness at a point in time. It is generally
used to aid mixing by ear and for spotting brief peaks and troughs that might otherwise
go undetected. As the value changes rapidly, it is represented using the bar meter to
facilitate easy reading. The maximum value reached Mmax is also indicated. This can
be reset by clicking the readout.
Momentary Loudness can be specied for short-form loudness measurements, where
the LRA reading is not appropriate. It is not usual for Momentary and Short-term
loudness maxima to be specied simultaneously.
Short-term Loudness.
Short-term loudness is a measure of the loudness over a longer time period than the
momentary value and is a good measure of how the loudness of the audio is perceived
over time. By default, the loudness history display (VisLM-H) displays the historical value
of short-term loudness.
Preferred Short-term Loudness ranges are often (although not always) detailed within in
loudness requirement delivery specications. Eg. Short-term Loudness values within -32
and -22 LKFS are preferred, or Short-term Loudness values are not to exceed -20 LKFS.
Using the colour splits and/or the alerts settings, VisLM can be congured to show
these ranges clearly so that any deviation beyond is easily picked up (see Fig. 1 & 2)
Momentary Loudness may also be specied for short-form loudness measurements,
where the LRA reading is not appropriate. It is not usual for Momentary and Shortterm
loudness maxima to be specied simultaneously.
Integrated Loudness.
Integrated Loudness is a single value of loudness that denes the ‘average loudness’
of an entire section of audio. This value is used for the purposes of loudness
normalisation, allowing sequential sections of audio to be matched, ensuring
loudness consistency throughout station programming.
© 2019 NUGEN Audio
35
Contents
Page 36

VisLM Operation Manual
The Integrated Loudness for a program or section is measured either by measuring
the entire section of audio, or in some specications, by measuring a carefully
selected ‘anchor’ section.
The integrated loudness value is usually given in loudness requirement delivery
specications. A single value is given eg. The programme material shall have an
integrated loudness value of –23.0 LUFS.
Again, using the colour splits, VisLM can be congured to show the target loudness
clearly so that the audio spread around this value can be seen easily (see Fig. 1 & 2)
A note on Leq
measurement and TASA submission.
m
VisLM measures Leqm to one decimal place. However, when making a submission
to TASA specications the rounded up whole number value is required.
eg. If VisLM shows a value of Leq
submission would be Leq
m
85.
84.3, the TASA specication value noted at
m
Loudness Range (LRA).
Loudness Range is a measure of the variation of loudness measurement of a section
of audio, and is measured along side the Integrated Loudness value. The LRA value
can be used in helping to determine whether dynamic treatment of the audio is required.
Note:
The LRA measurement is very sensitive when used to measure very short sections of
audio.
“It is noted that measurement of very short programmes, where leading or trailing
silence is included, or of programmes consisting, for example, of isolated utterances,
could result in misleadingly high values of LRA.” EBU tech doc 3342, section 3.1
To measure LRA consistently, the following should be taken into consideration:
1 Begin measurement away from the ‘start’ point of the DAW sequence. This is
because some DAW’s rapidly ramp up the level of the audio in order to avoid
clicks when starting audio in the middle of a le.
2 The measurement should be paused immediately after the audio clip has ended
to avoid the following silence being taken into account.
Variance.
The Variance envelope shown in the loudness history section of VisLM-H is a subvalue
of the loudness range descriptor, and shows the measure of variation in the Short-term
loudness over time.
© 2019 NUGEN Audio
36
Contents
Page 37

VisLM Operation Manual
Fig 1. VisLM-H showing a preferred ‘green zone’ Short-term Loudness range,
with a target loudness of –24 LKFS dened by a change in shading.
Fig 2. VisLM-H showing a ‘green zone’ Short-term Loudness range,
© 2019 NUGEN Audio
with a no-go zone highlighted in red.
37
Contents
Page 38

VisLM Operation Manual
Reporting a Problem
If you encounter a problem with any of NUGEN Audio’s products, please let us know,
to help us improve them.
Please email NUGEN Audio at [email protected] giving a clear
explanation of the problem. Please state how frequently you’ve experienced the
problem. If there are any particular steps you need to go through to see the problem,
please detail these.
Please also state your operating system, and the rough specs for your machine
(e.g.- CPU speed, RAM) - in Windows XP you can get this information by rightclicking
“My Computer” and selecting properties.
Please be patient with any problems you may experience, particularly with products
at a beta stage of release. At NUGEN Audio we take problems with our software
seriously, and will endeavour to correct them as quickly as possible.
© 2019 NUGEN Audio
38
Contents
Page 39

VisLM Operation Manual
Version History
2.0.1 Initial release
2.1.0 Added Leq(m) support
Added support for HDX kits
2.5.0 Added Leq(a) support
Added ITU-R B.S. 1770-4 support
2.5.2 Improved performance
Improved HDX support (reduced processor power required)
2.7.0 Added dialog presets for 7.1
Added support for new EBU LRA specication
Updated TP splits in various presets
2.8.0 Added support for Dialog LRA
Improved readout congurability
Added 7.1.2 support
Added SAWA support
Included Netix preset
Improved performance
Improved Dialog measurement for surround congurations
2.8.1 Added support for channel counts other than 2, 6, 8 and 10
2.8.2 Sped up Audiosuite processing
Fixed Automation logging
Fixed TP Clip level alerts
Fixed history saving/loading
2.8.3 Updated Netix preset
Added ag navigation
Fixed sync issues in Ableton
© 2019 NUGEN Audio
39
Contents
Page 40

VisLM Operation Manual
© 2019 NUGEN Audio
www.nugenaudio.com
40
Contents
 Loading...