

Page 1

Vibration Meter
7. Vibration Meter
The Vibration Option turns the XL2 Audio and Acoustic Analyzer
into a professional vibration meter with broadband measurements and spectral analysis in 1/3 or octave resolution. The
XL2 Vibration Meter determines vibration acceleration, velocity
and deflection with standard-compliant weighting filters in the
frequency range from 0.8 Hz to 2.5 kHz. Detailed recording
of measurement data and audio files allow for comprehensive
evaluation and reporting. In addition, the XL2 Vibration Meter
comes standard with an FFT analysis and an oscilloscope function. Selectable FFT frequency ranges from 1 Hz to 1.69 kHz
allow a detailed examination of the measured vibrations.
The Spectral Limits Option adds functions to the Vibration Meter including a zoom FFT up to 20 kHz and a 1/12 octave band
analysis from 0.73 Hz to 1.36 kHz. Also, it adds the ability to
record reference spectra and set tolerances for pass / fail quality control measurements. The Remote Measurement Option
allows the real-time acquisition of measurement data directly
into a computer application via the USB interface. A documented command set is available.
VibMeter / Spectrum
The vibration meter offers different pages:
Page Selection using the Page Button
Press page • to toggle between the 123 VibMeter page
and the CPB page.
Page Selection using the Rotary Wheel
Select the page • 123 VibMeter with the rotary wheel .
Confirm with enter •
.
Page Selection
139
Page 2

140
Vibration Meter
123 Values: Vibration Meter
Displays the selected broadband vibration level results. You can
change the font size of the result. Depending on the font size
chosen, the XL2 shows 2 up to 4 results simultaneously. The
display of the actual or maximum level can be selected with
the applicable frequency weighting. The peak levels PK or P-P
are real peak levels.
Spectrum: Constant Percentage Bandwidth CPB
Displays the 1/3 or 1/1 octave spectrum of the selected RMS,
peak or peak-peak vibration level. Additionally, the wide band
result B is shown graphically by a bar.
Reporting: Report Setting
Here you set which vibration levels shall be stored in a .txt file
after the completed measurement. Choose between:
ALL Stores all vibration levels.
Selected Stores up to 10 different individually-defined vi-
bration levels.
For details refer to the chapter Reporting.
Logging: Setup of Data Logging
The XL2 features a powerful vibration level meter data logger,
which allows you to record all required vibration level values
during the measurement. In the logging page you set which
vibration levels shall be logged over time. For details refer to
the chapter Logging. Choose between:
ALL Logs all vibration levels.
Selected Logs up to 10 different individually-defined vibra-
tion levels.
Limit LED: Limit Setting
H
ere you set the function
ing any vibration level that exceeds the pre-set limits in orange
or red color. Further, external peripherals are controlled by the
optional Serial I/O Interface based on the vibration level, such
as displaying vibration levels on a large external red-orangegreen lamp. For details refer to the chapter Limits.
of the limit LED , thereby highlight-
Page 3

141
Vibration Meter
Overview
Numeric Result Page
The numeric result page 123 Values displays the selected
broadband vibration level results. You can change the font
size of the result. Depending on the font size chosen, the XL2
shows 2 up to 4 results simultaneously. The display of the actual or maximum level can be selected with the applicable frequency weighting.
1
2
3
Constant Percentage Bandwidth Analyzer Page
The real-time analyzer page Spectrum measures and displays the 1/3 or 1/1 octave spectrum in the selected frequency
range including the wideband result.
11 10
4
5
6
7
9
8
Page 4

142
Vibration Meter
1
Vibration Level Result 1
All vibration levels are measured and logged simultaneously. You select which vibration levels should be displayed.
Change Parameter
Turn the rotary wheel •
Press enter •
to open the selection menu and choose
to select the parameter Lxx.
the wideband vibration level to be displayed.
Turn the rotary wheel •
parameters and confirm with enter
to select the required test result
.
Change Font Size
Turn the rotary wheel •
Press enter •
1x, 2x or 3x to set the font size to small,
to select the actual test result.
medium or large.
The XL2 shows 2 vibration levels on the display if a large
font is chosen, otherwise it shows 4 vibration levels.
2
Vibration Level Result 2
Follow the setting instructions for vibration level result 1.
3
Filter
Select one of the following frequency filters:
FLAT no filter applied
1-80Hz Filter 1 - 80 Hz with decay rate of 12 dB /
octave in accordance with DIN 45669-1
1-315Hz Filter 1 - 315 Hz with decay rate of 12 dB /
octave in accordance with DIN 45669-1
10-1000Hz Filter 10 - 1000 Hz with decay rate of 18 dB /
octave in accordance with ISO 2954
4
Result Symbols / Capture
This field offers two functions:
Symbols for measurement results •
11
Upper parameter displayed as line.
Lower parameter displayed as bargraph.
Page 5

143
Vibration Meter
Capture•
One of the displayed frequency band readings may be
captured. Any measurement data can then be compared
with this captured reference live on the XL2 Analyzer.
Select the parameter to be captured• .
Confirm with enter •
Select the upper parameter •
Confirm with enter •
, to capture the reading.
15
and choose Capt.
.
The lower reading can be compared with the previously-
captured reference data.
5
Level Type
Select in the System Settings:
metric or imperial units•
RMS, peak or peak-peak level•
Upper parameter displayed as line.
Lower parameter displayed as bargraph.
6
Y-Scale setting
Select the Y-Axis with the rotary wheel •
with enter
.
and confirm
Select the zoom factor between • 20, 10, 5, 2.5 dB/div and
confirm with enter
.
Scroll up and down with the rotary wheel • to select the
Y-axis range.
Confirm with enter •
7
Measurement Result
.
Real-time analyzer results in 1/1 octave or 1/3 octave band
resolution.
8
X-Scale setting
Third-octave band resolution
2.5 Hz - 2.5 kHz frequency band levels including wide
band result
0.8 Hz - 1.0 kHz frequency band levels including wide
band result
0.8 Hz - 2.5 kHz frequency band levels
Page 6

144
Vibration Meter
Octave band resolution
4 Hz - 2.0 kHz frequency band levels including wide
band result
1 Hz - 0.5 kHz frequency band levels including wide
band result
1 Hz - 2.0 kHz frequency band levels
Select the X-Axis with the rotary wheel •
with enter
.
and confirm
Toggle with the rotary wheel • between the ranges.
Confirm with enter •
9
Broadband Results
.
Displays broadband level B.
10
Filter
Select the preset frequency filter here, which is already
used on the broadband page.
11
Measurement Result
Actual level result of the indicated frequency band. The cursor readout displays the center frequency and the level of
the band pointed to by the arrow.
Select the measurement unit as follows:
Acceleration a m/s2•
g•
in/s2•
dB•
Velocit
y v m/s•
in/s•
dB•
Displacement d m•
in•
dB•
Page 7

145
Vibration Meter
FFT Analysis + Tolerance
The XL2 Vibration Meter includes a fast real-time FFT.
The following features are available upon installing the Spectral
Limits Option in the XL2 Analyzer:
High-resolution Zoom-FFT up to 0.4 Hz steps in the frequen-•
cy range 1 Hz - 20 kHz
Capture and tolerance function provided with Spectral Limits •
Option; thus the main menu function reads FFT + Tol.
9
1
2
3
4
8
7
6
5
Page 8

146
Vibration Meter
1
Result Symbols / Capture & Start Tolerance Mode
This field offers two functions:
Symbols for measurement results •
Upper result displayed as line.
2
Manage
captures
Allows to rename captures, clear recorded captures, save captures to the
SD Card for export from the XL2 or
load captures from the SD Card for import to the XL2.
Lower result displayed as bargraph.
Capture & Start Tolerance Mode•
The displayed readings may be captured as reference
reading C1 to C8 for
Comparing measurement results against captured •
traces with relative or absolute curve display.
Creating tolerance masks based on captured refer-•
ence curves for passed / failed measurements.
Capture EQ Capt
ures the upper parameter
Capture Live Captures the lower parameter
Start tolerance
mode
Starts the tolerance mode for passed/
failed measurements comparing the
actual measurement results against a
tolerance band.
2
Measurement Result
Actual level result of the indicated frequency band. The cursor readout displays the center frequency and the level of
the band indicated by the arrow.
Upper parameter displayed as line.
Lower parameter displayed as bargraph.
Select in the System Settings:
metric or imperial units•
RMS, peak or peak-peak level•
Page 9

147
Vibration Meter
3
Y-Scale setting
Select the Y-Axis with the rotary wheel •
with enter
Select the zoom factor between • 20, 10, 5, 2.5 dB/div
and confirm with enter
Scroll up and down with the rotary wheel • to select the
Y-axis range.
Confirm with enter •
4
Measurement Result
Displays the actual and averaged measurement results.
5
Time Weighting
Offers selectable time weighting of 0.1, 0.2, 0.5, 1.0 seconds as well FAST (125 ms) and SLOW (1 second).
Applications:
Short Time
W
eighting
Long Time
Weighting
.
.
.
High-resolution in time with minimum
veraging
a
Low resolution in time with longer averaging
and confirm
6
Readout Frequency
You may select any frequency to read out individual levels.
The selected frequency is indicated by the cursor arrow.
Choose between the following settings:
The cursor follows automatically the highest level,
e.g. tracing the dominant frequency of a rotating
part.
Select the frequency with the rotary wheel •
Press enter •
You may readout any individual frequency.•
Return to auto frequency with enter •
.
.
The cursor returns to the frequency with high-
est level bar.
The cursor readout may be set manually to any
frequency. The readout remains at the selected frequency.
Select the frequency with the rotary wheel •
Press enter •
Select the frequency of interest.•
Confirm with enter •
The cursor readout
ment results of the selected frequency band.
.
.
2
displays the measure-
.
.
Page 10

148
Vibration Meter
7
Zoom Mode
(optional, applicable with the Spectral Limits Option)
Select the readout frequency •
10
and press enter
The zoom mode is displayed above the flashing arrow.•
Select the zoom-in frequency with the rotary wheel •
Press limit •
out with the rotary wheel
Release limit •
or right with the rotary wheel
and zoom the linear frequency scale in or
.
and scroll the linear frequency scale left
.
8
Measurement Unit
Select the measurement unit as follows:
.
Acceleration a m/s2•
g•
.
in/s2•
dBa•
Velocity v m/s•
in/s•
dBv•
Displacement d m•
in•
dBd•
The Spectral Limits Option extends the function with captures and tolerances. All tolerances are specified as acceleration.
Page 11

149
Vibration Meter
9
Page Selector X-Scale and Parameter Setting
Oscilloscope
1k7 Shows FFT result of the frequency band range.
Hz - 1.687 kHz in a resolution of
23
11.72 Hz with 143 bins shown on the display.
400 Shows FFT result of the frequency band range.
5 Hz - 421.02 Hz in a resolution of 2.92 Hz with
143 bins shown on the display.
100 Shows FFT result of the frequency band range.
1 Hz - 105.00 Hz in a resolution of 0.73 Hz with
143 bins shown on the display.
Usr User Range
(applicable with optional Extended Acoustic Pack
or Spectral Limits Option)
1 Hz - 20 kHz in zoom mode with a minimum resolution of 0.366 Hz and 143 bins displayed.
Set Selection for FFT Windowing:
Hann• : Default setting
Dolph-Chebyshev• : for analyzing small signals
(e.g. harmonics) close to a dominant signal.
The page button
switches these display modes.
The scope function visualizes the waveform of the electrical input signal. It automatically triggers to the fundamental frequency and selects the scaling of the X-axis (time) and Y-axis (level)
accordingly. The fundamental, or most dominant, frequency of
the input signals is displayed above the scope screen.
The scope scaling is fixed.
Page 12
150
Vibration Meter
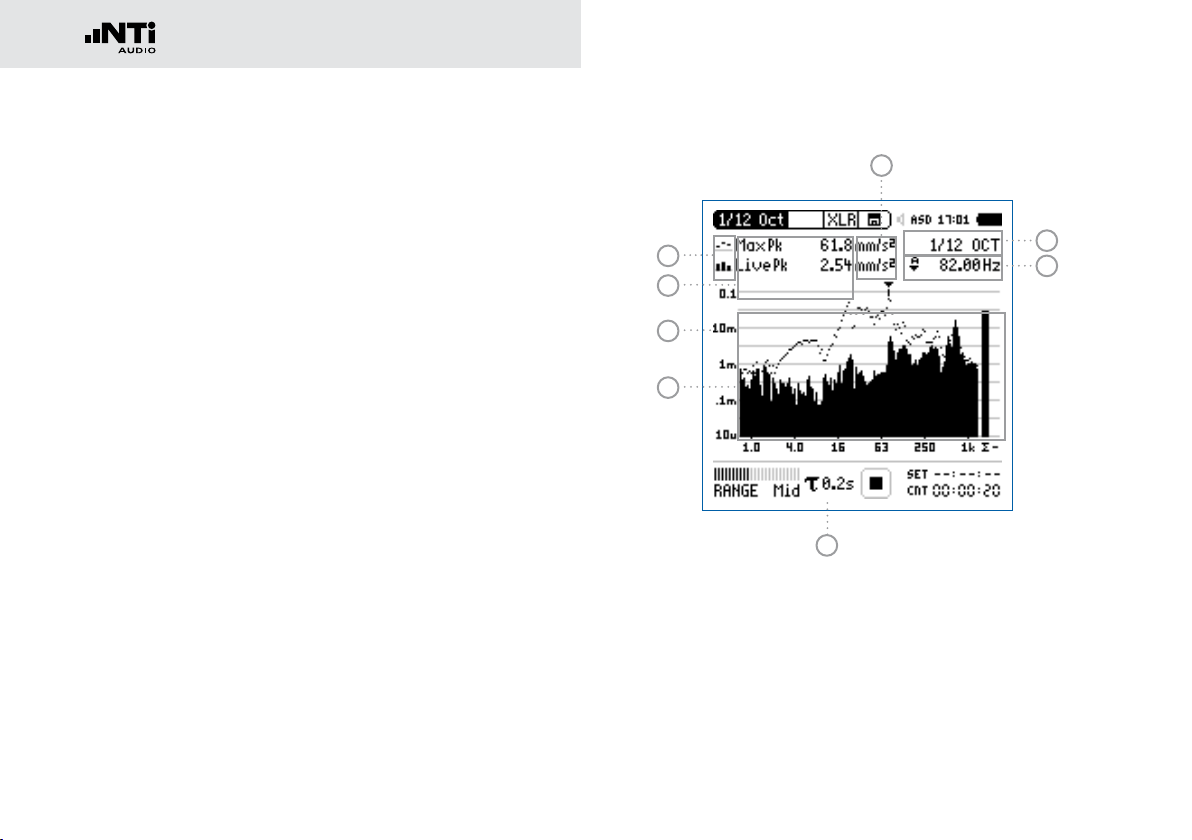
1/12 Octave + Tolerance (optional)
The Spectral Limits Option extends the function range of the
XL2 with trace capturing, relative curve display and comprehensive tolerance handling for the FFT Analysis and the highresolution 1/12 Oct + Tol spectral analysis.
Features:
Capturing of multiple readings into the internal memory •
Comparing measurement results against captures with rela-•
tive or absolute curve display
Comprehensive tolerance handling •
Creating tolerance masks based on captures for passed / •
failed measurements
8
1
2
3
4
5
7
6
Page 13

151
Vibration Meter
1
Result Symbols / Capture & Start Tolerance Mode
This field offers two functions:
Symbols for measurement results •
2
Upper result displayed as line.
Manage
captures
Allows to rename captures, clear recorded captures, save captures to the
SD Card for export from the XL2 or
load captures from the SD Card for import to the XL2.
Lower result displayed as bargraph.
Capture & Start Tolerance Mode•
The displayed readings may be captured as reference
reading C1 to C8 for
Comparing measurement results against captured •
traces with relative or absolute curve display.
Creating tolerance masks based on captured refer-•
ence curves for passed / failed measurements.
Capture EQ Capt
ures the upper parameter
Capture Live Captures the lower parameter
Start tolerance
mode
Starts the tolerance mode for passed/
failed measurements comparing the
actual measurement results against a
tolerance band.
2
Measurement Result
Actual level result of the indicated frequency band. The cursor readout displays the center frequency and the level of
the band indicated by the arrow.
Upper parameter displayed as line.
Lower parameter displayed as bargraph.
Select in the System Settings:
metric or imperial units•
RMS, peak or peak-peak level•
Page 14

152
Vibration Meter
3
Y-Scale setting
Select the Y-Axis with the rotary wheel •
with enter
Select the zoom factor between • 20, 10, 5, 2.5 dB/div
and confirm with enter
Scroll up and down with the rotary wheel • to select the
Y-axis range.
Confirm with enter •
4
Measurement Result
Displays the actual and averaged measurement results.
5
Time Weighting
Offers selectable time weighting of 0.1, 0.2, 0.5, 1.0 seconds as well FAST (125 ms) and SLOW (1 second).
Applications:
Short Time
W
eighting
Long Time
Weighting
.
.
.
High-resolution in time with minimum
veraging
a
Low resolution in time with longer averaging
and confirm
6
Readout Frequency
You may select any frequency to read out individual levels.
The selected frequency is indicated by the cursor arrow.
Choose between the following settings:
The cursor follows automatically the highest level,
e.g. tracing the dominant frequency of a rotating
part.
Select the frequency with the rotary wheel •
Press enter •
You may readout any individual frequency.•
Return to auto frequency with enter •
.
.
The cursor returns to the frequency with high-
est level bar.
The cursor readout may be set manually to any
frequency. The readout remains at the selected frequency.
Select the frequency with the rotary wheel •
Press enter •
Select the frequency of interest.•
Confirm with enter •
The cursor readout
ment results of the selected frequency band.
.
.
2
displays the measure-
.
.
Page 15

153
Vibration Meter
7
Setting of Test Result Resolution
Set the spectral result display to 1/1, 1/3, 1/6 or 1/12 octave
band resolution as follows:
Turn the rotary wheel •
Press enter •
to open the selection window.
to select the parameter 12.
Turn the rotary wheel • to select 1/1 OCT, 1/3 OCT,
1/6 OCT or 1/12 OCT
Press enter •
to confirm.
8
Measurement Unit
Select the measurement unit as follows:
Acceleration a m/s2•
g•
in/s2•
dBa•
Velocity v m/s•
in/s•
dBv•
Displacement d m•
in•
dBd•
The Spectral Limits Option extends the function with captures and tolerances. All tolerances are specified as acceleration.
 Loading...