

OPERATING MANUAL
HANDHELD AUDIO AND
XL2
ACOUSTIC ANALYZER

Contact NTi Audio at
Headquarter +423 239 6060 info@nti-audio.com
Americas +1 503 684 7050 americas@nti-audio.com
China +86 512 6802 0075 china@nti-audio.com
Czech +420 2209 99992 czech@nti-audio.com
Japan +81 3 3634 6110 japan@nti-audio.com
South Korea +82 2 6404 4978 korea@nti-audio.com
United Kingdom +44 1438 870632 uk@nti-audio.com
www.nti-audio.com
NTi Audio AG
Im alten Riet 102, 9494 Schaan
Liechtenstein, Europe
is an ISO 9001:2008 certified company.
Firmware V3.10
Version 3.10.00 / January 2016
All information subject to change without notice.
© All rights reserved.
® Minirator is a registered trademark of NTi Audio.
™ XL2, XL2-TA, EXEL, M2230, M2230-WP, M2211, M2215, M4260 and MA220
are trademarks of NTi Audio.
Ma d e i n
Switzerland

Table of Contents
Table of Contents
1. Introduction .....................................................................5
2. Overview .......................................................................... 7
Operation
The Screen Display
3. Getting Started
Power Supply
Attaching the Hand Strap
Unfolding the Stand
Connecting the XL2
Switching the XL2 On and Off
Select Measurement Function
Calibration prior Measurement
4. Sound Level Meter ........................................................ 22
Overview
Sound Level Meter - Getting Started
RTA Measurement - Getting Started
Reporting
Logging
Wav-File Recording
Events (optional)
Limits
Correction Value KSET
Locked Run Mode
....................................................................... 9
...................................................... 11
.............................................................14
.............................................................. 14
............................................. 17
..................................................... 18
.................................................... 18
.....................................20
.....................................20
....................................21
.....................................................................26
...........................34
...........................40
.....................................................................45
........................................................................ 46
......................................................48
..........................................................50
........................................................................... 57
.................................................59
........................................................ 63
5. Acoustic Analyzer ..........................................................64
FFT Analysis + Tolerance
Reverberation Time RT60
Polarity
.........................................................................86
Delay Time
1/12 Octave + Tolerance (optional)
Noise Curves (optional)
Speech Intelligibility STIPA (optional)
6. Audio Analyzer ............................................................134
RMS / THD+N
Oscilloscope
7. Calibration ...................................................................138
8. Profiles
9. Spectral Limits Option (Capture + Tolerances) .........149
10. System Settings
Settings
Information
Scheduler
...................................................................90
............................................................ 134
..............................................................137
......................................................................... 142
........................................................ 161
...................................................................... 161
................................................................164
................................................................... 165
..............................................64
............................................. 74
............................... 96
.............................................. 107
......................... 116
3

Table of Contents
11. Data Management ....................................................168
Record Voice Notes
Recall Measurements
Append Measurements
12. XL2 Data Explorer (optional)
13. XL2 Projector Software
14. NoiseScout
15. Remote Measurement
16. Microphones ............................................................192
17. Further Information .................................................. 196
My NTi Audio
Tips and Troubleshooting
Firmware Update
Options and Accessories
Warranty Conditions
Service and Repairs
Calibration Certificate
Declaration of Conformity
18. Technical Data XL2 .................................................... 216
19. Technical Data Microphones ....................................224
................................................................ 190
.................................................... 173
................................................ 180
............................................ 182
................................... 186
............................................188
.............................................. 191
............................................................. 196
...........................................197
.......................................................199
...........................................200
.................................................. 212
...................................................213
................................................. 213
.................................. 215
Appendix
.........................................................................233
Appendix 1: Standard - Optional Features
Appendix 2: Factory Default Profiles
Appendix 3: Description Sound Levels
Appendix 4: Common Sound Levels
.................233
.........................237
......................242
..........................247
20. Technical Data PreAmplifier
4
......................................232

1. Introduction
Introduction
Thank you for purchasing the XL2 Audio and Acoustic Analyzer.
The XL2 Analyzer forms the unique combination of a state-ofthe-art Sound Level Meter, a comprehensive Acoustic Analyzer
as well as a powerful Audio Analyzer. The wide range of functionalities is tailored for:
Audio-Acoustic Installations •
Installed Sound
Life Safety Systems
AV Installations Cinemas
-
Noise Measurements•
Live Events
Environmental Noise
Occupational Health
Vehicle Noise
-
Live Sound•
Sound Level Monitoring
Front of House
PA Rental
-
Broadcast•
Building Acoustics•
Industrial Quality Control and Aerospace•
How to Read this Manual
The XL2 push buttons are displayed as icons
, , , , . A detailed description of the push buttons is
listed in the chapter Overview - Operation.
Menu items displayed on the XL2 page screens are shown in
this user manual by a bold font, e.g., SLMeter, Parameter, ...
, , , ,
5

Introduction
Product Configurations
The following items are included with the respective model:
XL2
without
Microphone:
XL2 +
M2230:
XL2 Analyzer•
Test Signal CD•
USB cable•
Li-Po battery•
Hand strap•
Operating manual•
XL2 Analyzer•
M2230 Measurement Microphone•
consisting of
MA220 Microphone PreAmplifier
Microphone Capsule for M2230
-
50 mm Windscreen•
Microphone-holder MH01 •
with Adapter 5/8“ - 3/8“
Individual Frequency Response Chart•
Test Signal CD•
Li-Po battery•
USB cable•
Hand strap•
Operating manual•
XL2 +
M2211:
XL2 +
M4260:
XL2 Analyzer•
M2211 Measurement Microphone•
consisting of
MA220 Microphone PreAmplifier
Microphone Capsule for M2211
-
33 mm Windscreen•
Microphone-holder •
with Adapter 5/8“ - 3/8“
Test Signal CD•
Li-Po battery•
USB cable•
Hand strap•
Operating manual•
XL2 Analyzer•
M4260 Measurement Microphone•
33 mm Windscreen•
Microphone-holder •
with Adapter 5/8“ - 3/8“
Test Signal CD•
Li-Po battery•
USB cable•
Hand strap•
Operating manual•
6

2. Overview
Overview
Tripod Mount
11
XL2 interfaces:
1
XLR Input
RCA Input
Voice Note Input
2
Speaker
10
Digital I/O
6
USB Connector
3
5
DC Power Socket
4
SD Card
7
TOSLink Output
8
9
Headphone
Output
7

8
Overview
1
XLR Signal Input
Either a balanced audio signal, an NTi Audio measurement microphone or the microphone pre-amplifier MA220
plug directly into the XLR input. The Automated Sensor Detection (ASD) technology reads the electronic
data sheet of any connected NTi Audio device after the
48 V microphone phantom power is activated.
2
RCA Input
Unbalanced audio signal input.
3
Voice Note Input
Internal microphone for recording voice notes and measuring polarity and delay time. For polarity measurements, an
external microphone may also be used.
4
DC Power Socket
Socket for mains power adapter. Further details in the chapter Power Supply in this manual.
5
USB Connector
Mini-B USB connection, for accessing the SD Card.
6
Digital I/O
Programmable digital inputs/outputs.
7
SD Card
For storing data, screenshots, voice notes, wav-files.
8
TOSLink Output
24 bit linear PCM audio signal output. For future use; not
active at this time.
9
Headphone Output
The XLR/RCA input signals are routed to the headphone
connector (3.5 mm Minijack; mono monitor wired to both
channels of stereo jack). Connecting headphones mutes the
internal speaker. To connect the headphone output directly to a line input, a load impedance < 8 kOhm is required
for proper operation. This can be achieved by inserting a
1 kOhm resistance between tip and ground of the output
jack.
10
Speaker
The XLR/RCA input signals are routed to the speaker. Press
the speaker button
to toggle the speaker on/off. Press
and hold the speaker button to access the volume control.
Set the speaker level with the rotary wheel
11
Tripod Mount
.
Mechanical mount for attaching the XL2 to a tripod or microphone stand.

9
Overview
Operation
9 8 7
1
1
Page Control
2
3
Switches among various screens depending on the menu
function selected.
6
4
2
Volume of Speaker and Headphone Output
Press the button• briefly to enable or disable the speak-
er.
The speaker is activated and the speaker or headphone
icon shows up in the upper menu bar.
Press and hold the speaker button •
.
A pop-up window for volume is displayed.
5

10
Overview
Hold the speaker button •
down and adjust the level
of the speaker and headphone outputs with the rotary
wheel
. Digital gain control prevents gain increases beyond a level that will cause signal clipping. The maximum
gain setting depends on the connected input signal.
The headphone output provides a linear output signal •
using the SLMeter function (for input levels of approx.
-30 dBu and higher, which equals at M2230: 85 dBA,
M2211: 92 dBA utilizing a pink noise test signal).
3
Power & Backlight
The power button switches the instrument on. The XL2 is
immediately ready for operation. Holding down the power
button
a brief press of the power button
for one second switches the XL2 off. Additionally,
toggles the backlight
during operation.
4
Limit
SLMeter: • The limit button lights up green, yellow or red
according to the settings in the Limit page. Press the
limit button
to access the Limit page. For more details
visit the chapter Sound Level Meter: Limits.
FFT + Tol: • The limit button lights up green for results
within tolerance and red for out-of-tolerance results.
Polarity: • The limit button lights up green at positive polar-
ity and red at negative polarity.
1/12 Oct + Tol: • The limit button lights up green for results
within tolerance and red for out of tolerance results.
5
Pause
Pauses the current measurement. Press the pause button
or the start/stop button to continue the measure-
ment. The data logging is continued in the function SLMeter/RTA during the pause period and listed in the log file.
6
Start/Stop
Starts and stops a measurement.
7
Enter
Confirms a selection.
8
Rotary Wheel
Selects the required measurement function or the individual measurement parameter.
9
ESC
Terminates an entry, returns to the top menu level or closes
an open window.
11
Overview
The Screen Display
The XL2 displays the actual sound levels also in case of no
measurement has been started. Any displayed averaged level
refers to the previous measurement period. The XL2 shows
four lines in case of no previous measurement period is applicable.
Display Contrast Setting
Hold down escape •
desired contrast is reached.
Updating of display
Numeric values•
Updated every 500ms independent of the measurement
function. The maximum time span between the end of
the measurement period and the first test result display is
500ms.
Graphs and spectra•
Updated every 50ms
and turn the rotary wheel until the
2 3 4 75 986
1
The display is updated continuously during measurement.

12
Overview
1
Measurement Results
Individual level measurement results.
2
Main Menu
SLMeter/RTA SPL & RTA Measurement
FFT + Tol FFT Analysis with optional Tolerance
Management
RT60 Reverberation Time RT60
Polarity Polarity
Delay Time Delay Time
RMS/THD+N RMS Level and Distortion
Oscilloscope Scope
1/12 Oct + Tol Spectral Analysis with Tolerance Man-
agement (optional)
Noise Curves Noise Curves
STIPA Speech Intelligibility (optional)
Cinema Meter Calibration and verification of cinema
loudspeaker systems (optional)
Calibrate Calibration Menu for microphone
Profile ... Store and load measurement profiles
System System Settings
3
Page Selector
Toggles between available measurement and result pages
within the same function menu. Alternatively use the page
button
4
Input Selector
.
Select XLR or RCA input connectors as the source.
5
Memory Menu
The memory menu is used for data storage management.
One of the following symbols flashes before or after starting the measurement:
9-8-7 Time
in seconds until instrument is settled and
measurement will start.
RUN Indicates the ongoing measurement.
LOG Indicates the ongoing measurement with data
logging.
AUD Indicates the ongoing measurement with data
logging and audio recording.
Evt Indicates an ongoing triggered-event recording.

13
Overview
After a completed measurement, the memory symbol
indicates a non-saved measurement report. Your measurement needs to be stored manually. For more details visit
the chapter Data Management.
6
Speaker/Headphone
Indication of enabled rear speaker or headphone output.
7
Phantom Power Supply
48V T
he XL2 provides 48 V phantom power supply
to the connection microphone or sensor.
ASD An NTi Audio measurement microphone with
automated sensor detection ASD is connected. The XL2 reads the electronic data sheet of
the microphone and switches the 48V phantom power automatically on
48V Phantom power is switched off.
8
Real-Time Clock
The real-time clock is set in the System menu.
9
Battery Symbol
The battery symbol indicates the battery status as follows:
Using rechargeable Li-Po battery:
Level indication 100% (U > 4.0 Volt).
Level indication:
75%: U = 3.9 - 4.0 Volt
50%: U = 3.8 - 3.9 Volt
25%: U = 3.7 - 3.8 Volt
Level indication 0% (U < 3.7 Volt). The battery is
almost empty and must be recharged.
The battery is being recharged by the mains
power adapter or the USB connection to PC.
Using standard AA batteries:
No level indication as long as U > 4.5 Volt.
Level indication 0% (U < 4.5 Volt). The batteries
are almost empty and should be replaced.
Using mains or supply:
No indication of battery status.
14
Getting Started
3. Getting Started
Power Supply
The XL2 offers flexible power management options and can be
operated either by
Replaceable, rechargeable lithium-polymer (Li-Po) battery •
(included with the XL2 Analyzer)
4x AA-batteries•
Mains Power Adapter•
The new battery is charged to approximately 50% and should
be fully charged before use with:
Battery Charger
(optional)
Mains Power
Adapter
(optional)
USB Power
from PC
Charging Time: approx. 3 hours
NTi Audio #: 600 000 332
Charging Time: approx. 6 hours
Leave the battery inside and switch off
the XL2
NTi Audio #: 600 000 333
Charging Time: approx. 6 hours
Switch off the XL2
ing.
for charging.
for faster charg-
Operation using Mains Power Supply
You can also operate the XL2 with the optional NTi Audio Mains
Power Adapter. During such operation it is recommended to
leave the batteries inside the instrument.
Mains Power Adapter
Electrically-isolated, linear DC power supply•
A decreased THD+N performance will oc-•
cur with unbalanced input signals when using switching-type power supplies (approx.
3 dB).
Non-NTi Audio power supplies may have fur-•
ther negative effects on measurements.
Damage caused by using an inappropriate ex-•
ternal DC supply is not covered by warranty.
DC Power supply specifications
Voltage: 7.5 - 20.0 Volt•
Power: minimum 6 Watt•
Connector type: 2.1 x 5.5 x 9.5 mm•
Polarity: •
.

15
Getting Started
Rechargeable Li-Po Battery
Open the battery cover at the rear of the instrument.•
Insert the rechargeable Li-Po battery with the contacts edge •
first.
Close the battery cover.•
3.
Switch off the XL2 for faster recharging by
mains power adapter or USB connection.
2.
Caution
Switch the XL2 off prior opening the battery •
cover in order to prevent any electronic discharges.
Avoid short-circuits.•
Operate and charge the battery between 0°C •
and 45°C (32°F - 113°F).
Do not heat the battery above 60°C.•
Do not place the battery in or near fire.•
Do not solder directly on to the battery.•
Do not disassemble the battery.•
Do not insert the battery in reverse polarity.•
1.

16
Getting Started
AA-Batteries
Alternatively, the XL2 can be powered by AA type batteries
Open the battery cover.•
Insert 4 fully-charged AA batteries, observing correct polarity •
of the +/- indications in the battery compartment.
The polarity alternates with successive batteries.
Close the battery cover.•
2.
Switch the XL2 off prior opening the battery •
cover in order to prevent any electronic discharges.
Use only similar batteries from the same •
manufacturer.
Replace discharged batteries with new ones.•
Do not mix used and new batteries.•
During operation, the battery temperature •
may increase noticeably. This is not a defect.
Remove all batteries if the XL2 is not to be •
used over a long period of time.
1.

17
Getting Started
Attaching the Hand Strap
To avoid accidentally dropping the XL2, a hand strap is supplied
with the instrument.
Pull the loop of the hand strap through the opening.•
Pull the other end of the hand strap through the loop.•
Pull the hand strap tight.•
2.1. 3.

18
Getting Started
Unfolding the Stand
A convenient table stand is attached to the rear of the instrument.
Unfold the stand and rest the XL2 on a flat surface.•
Connecting the XL2
Acoustic Measurements
Connect an NTi Audio measurement microphone to the XLR
input connector of the XL2.

19
Getting Started
Audio Measurements: XLR Connection
Connect the source to the XL2 with an XLR cable.•
Select the XLR input in the menu.•
Audio Measurements: RCA Connection
Connect the source to the XL2 with an RCA (cinch) cable.•
Select the RCA input in the menu.•

20
Getting Started
Switching the XL2 On and Off
Switching On the XL2
Press power
There is a brief sound of relays and the display illuminates.
Switching Off the XL2
Press power
the XL2.
to switch on the XL2.
and hold it down for one second to switch off
Select Measurement Function
Navigate with the rotary wheel • to the main menu bar.
Confirm with enter •
The main menu window opens
Scroll up/down with the rotary wheel • to select the re-
quired function and confirm with enter
to select the measurement function.
Main menu with enabled options
.
The measurement function is selected.

21
Getting Started
Setting the Parameters with the Rotary Wheel
Turn the rotary wheel •
screen.
to navigate within the display
The selected parameter is highlighted with a black back-
ground.
Confirm with enter • .
The parameter display flashes and/or available parameters
or settings are shown.
Turn the rotary wheel •
enter
Confirm with enter • .
through the settings.
to set the parameter or toggle with
Now the parameter is set.
Calibration prior Measurement
We recommend the daily calibration of the XL2 Analyzer with
the precision calibrator. This ensures accurate measurement
results.
For more details see chapter Calibration.

22
Sound Level Meter
4. Sound Level Meter
The XL2 provides, together with the measurement microphone, a precise sound level meter for monitoring live sound
events and/or environmental noise.
The Type Approval Option upgrades the instrument to the
XL2-TA, the sound level meter dedicated to certified measurements. The XL2 with the M2230 microphone forms a type approved sound level meter offering class 1 performance according IEC61672 (see chapter Options and Accessories)
For example, Actual, Lmin, Lmax, Leq with frequency weighting A, C and Z and time weighting F and S can be measured
at the same time. All measurement results are simultaneously
available. You may log all acquired level information, including
real-time information, onto the removable SD Card. To complete the documentation of the measured sound pressure levels, the XL2 offers wav-file recording, as well as the facility
to add voice notes for each measurement. The XL2 measures
correction values between the loudest point of the live event
and the actual measurement positions in accordance with DIN
15905-5 and SLV. In parallel with the wide band parameters,
the XL2 measures the real-time spectrum either in 1/1 or 1/3
octave-band resolution. The RTA perfectly suits tasks such as
optimization of sound systems
Extended Acoustic Pack (optional)
The Extended Acoustic Pack offers the following additional features for sound-level and acoustic measurements:
SLMeter/RTA function•
Recording of linear wav-files (24 bit, 48 kHz)
Percentiles for wide band and spectrum with flexible set-
ting from 0.1% to 99.9%
Sound Exposure Level L
100ms logging
Event-triggered audio and data recording
Time weighting: Impulse (LxI, LxIeq with x= A, C, Z)
True peak level in 1/1 and 1/3 octave resolution
Clock-Impulse Maximum Level (TaktMax) and values as
specified in DIN 45645-1
FFT function•
High-resolution Zoom-FFT with selectable frequency
ranges and resolution up to 0.4 Hz in the range of 5 Hz to
20 kHz
RT60 function•
Reverberation time RT60 in 1/3 octave resolution
-
AE

23
Sound Level Meter
The sound level meter offers different pages:
Page Selection using the Page Button
Press page • to toggle between the 123 SLMeter page
and the RTA page.
Page Selection using the Rotary Wheel
Select the page • 123 SLMeter with the rotary wheel .
Confirm with enter •
.
Menu with enabled options
You have selected the individual sound level meter page.
123 SLMeter: Sound Level Meter
Displays the selected broadband sound level results. You can
change the font size of the result. Depending on the font size
chosen, the XL2 shows 3 or 5 results simultaneously. Individual
frequency weighting, time weighting, actual, minimum, maximum and correction values can be chosen for each displayed
result.
RTA: Real-Time Spectrum
Displays the 1/3 or 1/1 octave spectrum of the selected sound
level within the audio band. Additionally the wide band result is
shown graphically by a bar.
Reporting: Report Setting
Here you set which sound pressure levels shall be stored in a
.txt file after the completed measurement. Choose between:
ALL Stores all sound pressure levels.
Selected Stores up to 10 different individually-defined
sound pressure levels.
For details refer to the chapter Reporting.

24
Sound Level Meter
Logging: Setup of Data Logging
The XL2 features a powerful sound level meter data logger,
which allows you to record all required sound level values during the measurement. In the logging page you set which sound
pressure levels shall be logged over time. For details refer to
the chapter Logging. Choose between:
ALL Logs all sound pressure levels.
Selected Logs up to 10 different individually-defined sound
pressure levels.
Event Trigger: Event Setting (optional)
The event function is available with the optional Extended
Acoustic Pack. The XL2 event feature offers the following functionalities:
Automated event triggered at noise levels above/below a •
preset value including setting markers for specific noise categories. Application example: Recording the noise level for
LAF > 80 dB.
Event triggered by external key press of the XL2 Input Key-•
pad. You can utilize four keys (1-4) to categorize any noise of
interest or noise to be later excluded in the post-processing.
A typical application is categorizing any annoying industrial
noise by persons living in the neighborhood.
Limit LED: Limit Setting
H
ere you set the function
of the limit LED , thereby highlighting any sound level that exceeds the pre-set limits in orange
or red color. Further, external peripherals are controlled by the
optional Serial I/O Interface based on the sound level, such as
displaying sound levels on a large external red-orange-green
lamp. For details refer to the chapter Limits.
K
SET Correction: Setup of Correction Values
This page provides a wizard to measure correction values,
which could be helpful for compliant sound level monitoring
of live events. It measures the correction values between
the actual measurement position and the loudest position accessible by the audience. The XL2 displays and logs
the selected sound pressure levels including the correction
values, allowing the sound engineer to monitor the sound
level at the loudest position in the audience. The measurement meets the requirements of the standards DIN15905-5
and SLV. For details refer to chapter Correction Value K
SET.

25
Sound Level Meter
Set EQt, L%: Selection of measured levels
This page allows setting the following levels:
Moving Time-average Sound Level•
Gliding Leq with selectable time window from five seconds
to one hour. Four individual levels can be configured.
Percentile Sound Level•
Allows the individual configuration of seven statistic lev-
els from 0.1% to 99.9% (optional with Extended Acoustic
Pack).
The
- Broadband Source for the calculation of the level sta-
tistics can be chosen from a set of different levels with
either a frequency weighting A, C or Z. The time weightings F, S and the moving time-averaged sound level for one
second are supported.

26
Sound Level Meter
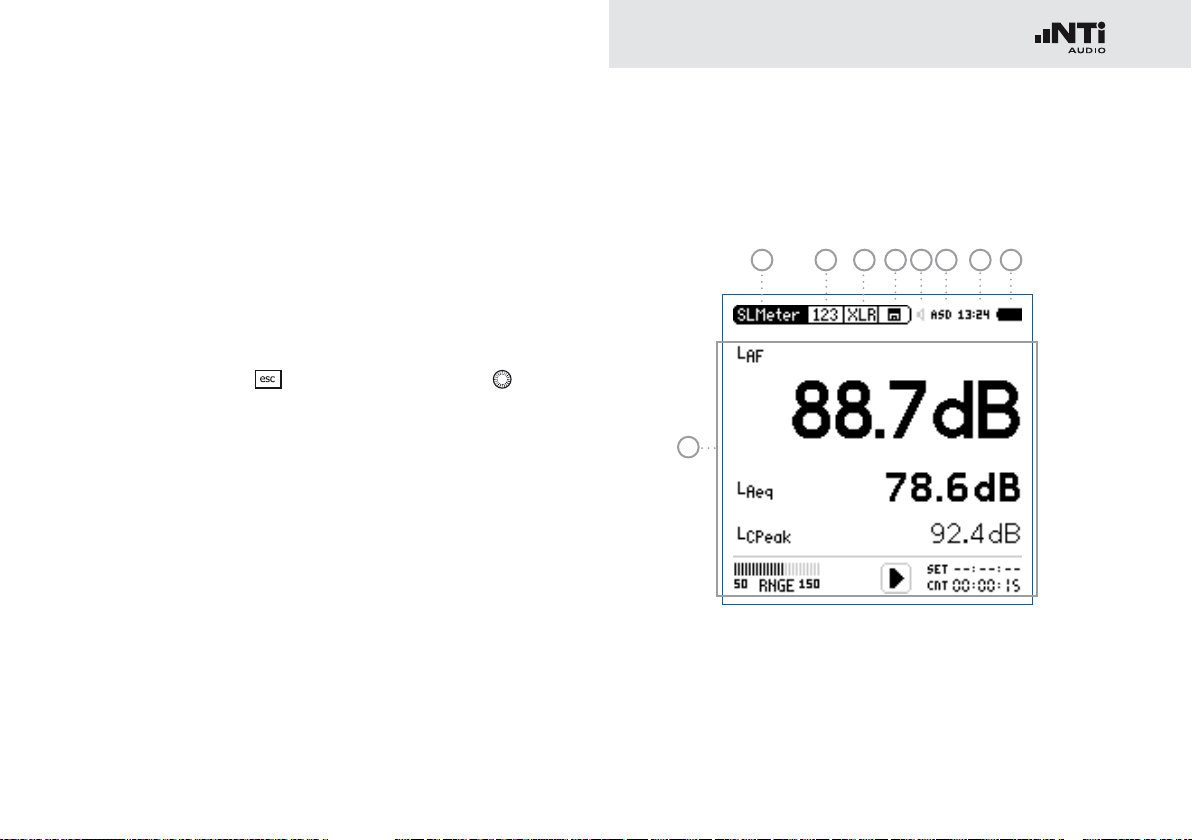
Overview
Numeric Result Page
The numeric result page 123 SLMeter displays the selected
broadband sound level results. You can change the font size of
the result. Depending on the font size chosen, the XL2 shows
three or five results simultaneously. Individual frequency
weighting, time weighting, actual, minimum, maximum and
correction values can be chosen for each displayed result.
8
1
2
3
7
6
4 5
Real-Time Analyzer Page
The real-time analyzer page RTA measures and displays
the 1/3 or 1/1 octave spectrum from 6.3 Hz to 20 kHz including
wideband results. The real-time spectrum RTA is measured in
parallel with the A and Z-weighted wideband levels.
17
9
10
11
12
13
16
15
14

27
Sound Level Meter
1
Sound Level Result 1
All sound levels are measured and logged simultaneously.
You select which sound levels should be displayed.
Change Parameter
Turn the rotary wheel •
Press enter •
to open the selection menu and choose
to select the parameter Lxx.
the wideband sound pressure level to be displayed.
Turn the rotary wheel •
parameters and confirm with enter
to select the required test result
.
Change Font Size
Turn the rotary wheel •
Press enter •
1x, 2x or 3x to set the font size to small,
to select the actual test result.
medium or large.
The XL2 shows 3 sound levels on the display if a large font
is chosen, otherwise it shows 5 sound levels.
2
Sound Level Result 2 & 3
Follow the setting instructions for sound level result 1.
3
Sound Level Result 4 & 5
To display sound level results 4 & 5, choose a smaller font
for all results. Follow the setting instructions for sound level
result 1.
4
Input Range
The XL2 Analyzer provides three input ranges to accommodate the wide range of input signals. The individual ranges are based on the microphone sensitivity setting in the
calibration menu of the XL2. For example at a sensitivity
S=20mV/Pa the input ranges are
Low: 10 - 110 dBSPL•
Mid: 30 - 130 dBSPL•
High: 50 - 150 dBSPL•
Select the lowest possible input range according to the
maximum level expected during the measurement; e.g., if
the sound pressure will always be below 110 dBSPL, then
select the lowest input range 10 - 110 dBSPL.
5
Run Indication
The run indication shows the measurement status running,
paused or stopped. Various measurement settings are
locked during ongoing measurements, such as changing
the input ranging or the preset measurement time.

28
Sound Level Meter
6
Actual Measurement Time
Counts actual measurement time in hrs:min:sec. Supports
time modes: continuous, single and (synchronized) repeat.
Timer Mode Continuous
(applicable for standard measurements)
All values are recorded and monitored continuously after starting a measurement with start
The actual measurement time is shown.
Timer Mode Single
Automatically stops the measurement after the
pre-set measurement time.
Set the required measurement time.•
Start the measurement •
The actual measurement time counts back to zero and
the measurement ends.
All measurement results may be recalled.•
.
Timer Mode Repeat
Provides automated repeated measurements with
user-defined, preset measurement time cycles.
Set the required measurement time.•
Press start •
.
The actual measurement time counts back to
zero. When the preset measurement time has
elapsed, the measurement time and the measurement results are reset and a new measurement is started. All measurement results
of the previous cycle are reset.
For consecutive storage of all measurement cycles, select the parameter Naming+Saving: auto
in the memory menu. Each individual cycle result
is then automatically stored to the SD Card.
.

29
Sound Level Meter
Timer Mode Repeat Synchronized
Provides automated repeated measurements synchronized to the XL2 real-time clock.
Press start
to begin the measurement.
In order to align the selected preset measurement
time with the real-time clock, the XL2 shortens
the first cycle to match the real-time clock synchronization. All following measurement cycles
are synchronized to the real-time clock.
8
Phantom Power Supply
48V T
ASD An NTi Audio measurement microphone with
he XL2 provides 48 V phantom power supply
to the connection microphone or sensor.
automated sensor detection ASD is connected. The XL2 reads the electronic data sheet of
the microphone and switches the 48V phantom power automatically on
For example, the cycle time setting is 30 minutes
and the measurement starts at 7.50 a.m. -> the
first test cycle measures from 7.50 - 8.00 a.m.
Thereafter a new test cycle starts automatically
for 30 minutes. The 30-minute cycles repeat until
the measurement is stopped.
The measurements in the synchronized repeat
timer mode start exactly on the half or full hour in
accordance with DIN 15905.
7
Preset Measurement Time
Adjustment of preset measurement time for single and repeat timer setting.
48V Phantom power is switched off.
9
Result Symbols / Capture
This field offers two functions:
Symbols for measurement results •
Upper RTA parameter displayed as line.
Lower RTA parameter displayed as bargraph.
15

30
Sound Level Meter
Capture•
One of the displayed RTA readings may be captured. Any
measurement data can then be compared with this captured reference live on the XL2 Analyzer. For example,
compare the RTA spectrum of the left and right speakers.
Select the parameter to be captured• .
Confirm with enter •
Select the upper RTA parameter •
Capt.
Confirm with enter •
The lower RTA reading can be compared with the previ-
ously-captured reference data.
10
Measurement Result
Actual level result of the indicated frequency band. The cursor readout displays the center frequency and the level of
the band pointed to by the arrow.
, to capture the reading.
15
and choose
.
11
Y-Scale setting
Select the Y-Axis with the rotary wheel •
with enter
.
and confirm
Select the zoom factor between • 20, 10, 5, 2.5 dB/div
and confirm with enter
.
Scroll up and down with the rotary wheel • to select the
Y-axis range.
Confirm with enter •
12
RTA Measurement Result
.
Real-time analyzer results in 1/1 octave or 1/3 octave band
resolution. Adjust the resolution at
13
X-Scale setting
17
.
Toggles X-scale range between
20 Hz - 20 kHz RTA levels including wide band results
6.3 Hz - 8 kHz RTA levels including wide band results
Upper parameter displayed as line.
Lower parameter displayed as bargraph.
6.3 Hz - 20 kHz RTA levels
Select the X-Axis with the rotary wheel • and confirm
with enter
.
Toggle with the rotary wheel • between the ranges.
Confirm with enter •
.

31
Sound Level Meter
14
Broadband Results
Actual sound level.
The broadband sound pressure level Leq, Lmin, Lmax and
Live are displayed here. The Live level is displayed with
time weighting Fast.
A A-w
Z Broadband sound pressure level without any fre-
15
Readout Frequency
You may select any frequency to read out individual levels.
The selected frequency is indicated by the cursor arrow.
Choose between the following settings:
eighted broadband sound pressure level
quency weighting
The cursor follows automatically the highest level,
e.g. tracing feedback frequencies at live sound.
Select the frequency with the rotary wheel •
Press enter •
You may readout any individual frequency.•
Return to auto frequency with enter •
.
.
The cursor returns to the frequency with high-
est level bar.
The cursor read out may be set manually to any
frequency band or wide band level. The read out remains at the selected frequency.
Select the frequency with the rotary wheel •
Press enter •
Select the frequency of interest.•
Confirm with enter •
The cursor readout
ment results of the selected frequency band.
16
Setting of Test Result Resolution
Set the RTA result display to 1/1 octave or 1/3 octave band
resolution as follows:
Turn the rotary wheel •
Press enter •
to set this parameter.
.
.
.
11
displays the measure-
to select the parameter 17.
to toggle between 1/1 OCT and 1/3 OCT.
.
32
Sound Level Meter
17
Measurement Unit
Select the measurement unit as follows:
dB Sound level in dBSPL
This measurement unit is permanently selected
upon connecting a NTi Audio measurement microphone with electronic data sheet.
dBu Input level in dBu
dBV Input level in dBV
V Input level in Volt
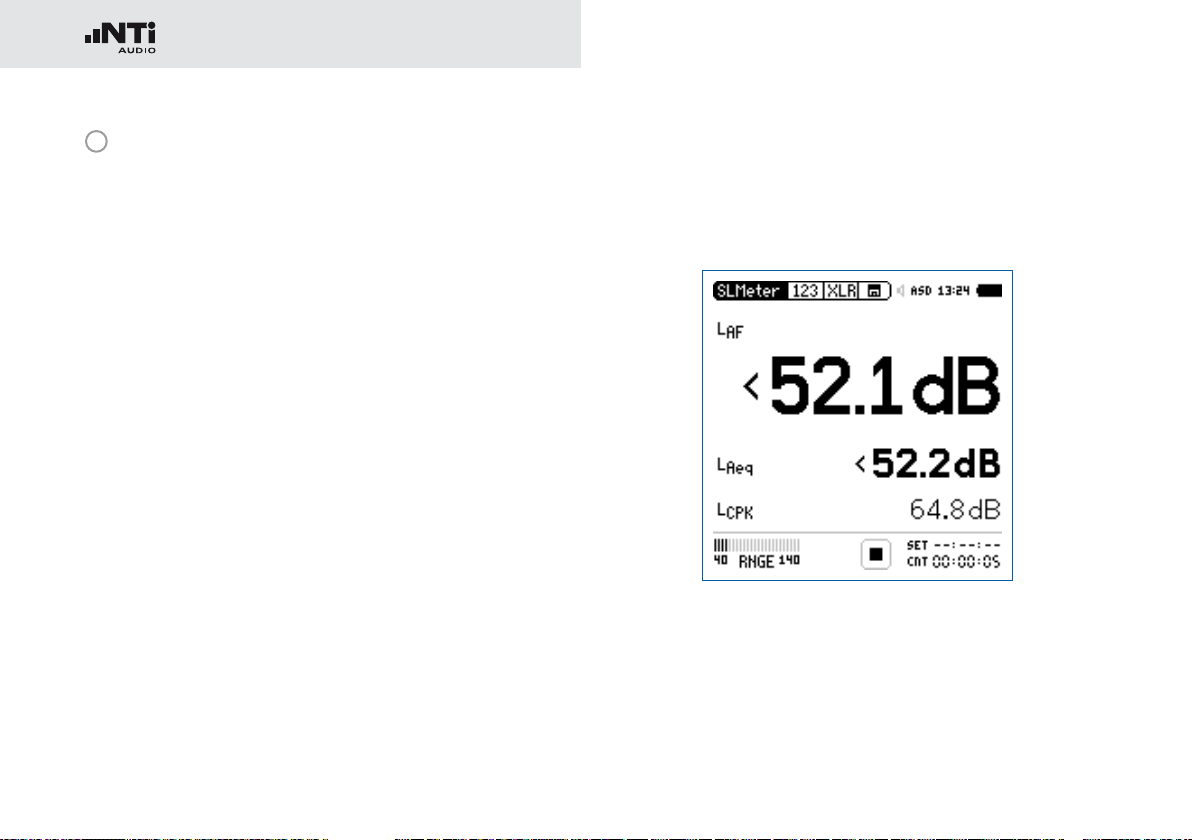
LOW - Indication
The low indicator for an individual level < is displayed when:
The measured sound pressure level is below the selected •
linear measurement range. In this case the results shown
are most likely higher than the actual sound pressure level ->
choose the next lower measurement range.
The measured sound pressure level is just above the resid-•
ual noise of the connected NTi Audio measurement microphone, which reduces the measurement accuracy -> choose
another microphone dedicated for low level measurements.
The low condition is registered in the log and report file in the
column “Low(eq/peak)“ individually for all frequency weightings, the RMS and the peak levels.

33
Sound Level Meter
Overload Indication
In case the measurement result exceeds the preset measurement range, then limit arrows
tion. The arrows
as long as the overload exists. Furthermore the once exceeded
measurement range triggers the OVR indication in the bottom
line, which remains displayed for the complete measurement
period. These exceeded range indications are reset at starting
a new measurement. Any overload condition is registered in
the log and report file.
Possible causes for exceeding measurement ranges are
The measured sound pressure level exceeds the pre-set •
measurement range during the measurement period. Once
this happens, the OVR indication remains displayed for the
complete measurement period -> select the next higher
measurement range or reduce the input signal level as applicable.
The input level is near the maximum level of the connected •
NTi Audio measurement microphone.
are displayed for minimum 1 seconds and
indicate this overload condi-

34
Sound Level Meter
Sound Level Meter - Getting Started
Test Preparations
The XL2 reads the electronic data sheet of any connected
ASD microphones provided by NTi Audio and switches the 48V
phantom power automatically on as follows:
Connect the measurement microphone to the XL2.•
Switch on the XL2 •
.
Position the XL2 at the measurement location using a micro-•
phone stand or a tripod.
Select the • SLMeter function in the measurement menu and
toggle with page
All wideband and RTA levels are measured and
logged simultaneously. You select which sound
levels should be displayed.
to the numeric result page .
The 48V phantom power indication in the upper menu bar
changes to ASD. The XL2 is ready for acoustic measurements.

35
Sound Level Meter
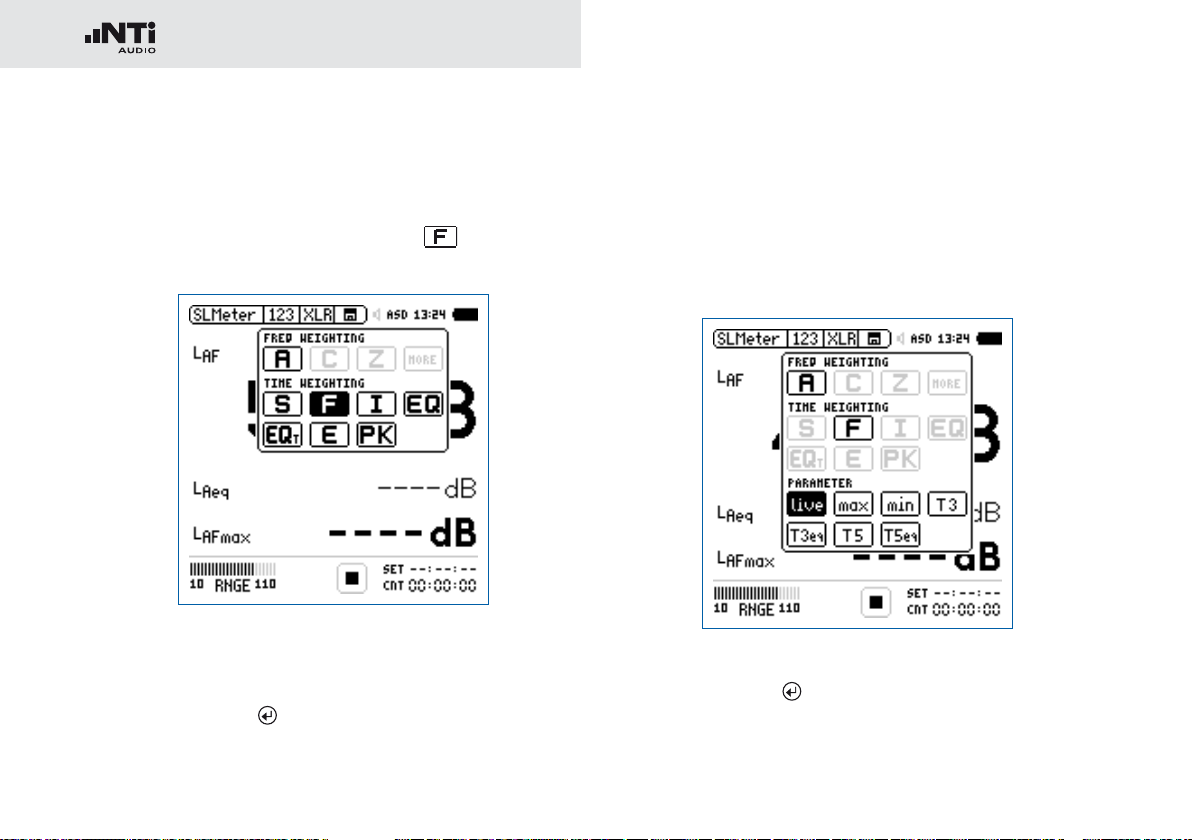
Select Displayed Test Result
This example describes the setting of the commonly-used actual sound pressure level L
weighting F).
Select the first parameter setting with the rotary wheel •
Confirm with enter •
Press start to measure and display the
sound levels results indicated with ----.
.
(frequency weighting A, time
AF
Select Frequency Weighting
The pop-up window FREQ WEIGHTING shows up.
Select the frequency weighting • A.
.
Pop-up windows shown at installed
Extended Acoustic Option
Confirm with enter • .
36
Sound Level Meter
Select Time Weighting
The pop-up window extends with TIME WEIGHTING.
Select the required time weighting; e.g. •
Confirm with enter • .
(=Fast).
Select Parameter
The pop-up window extends with PARAMETER settings.
Select the parameter • live.
Confirm with enter • .

37
Sound Level Meter
Select Correction Value
The pop-up window extends with CORRECTION settings.
Select the parameter • off.
Confirm with enter • .
The pop-up window closes and the measured sound pres-
sure level LAF is displayed.
Select further Sound Levels
Select further sound pressure levels as described above; •
e.g., L
Aeq
and L
AFmax
.

38
Sound Level Meter
Select Input Range
Select the lowest possible input range according to the maxi-•
mum level expected during the measurement. Wrong input
ranges are indicated by a < in front of the measurement value or a flashing OVR message in the lower menu bar.
Select the input range • RNGE and press enter
Turn the rotary wheel • to set the applicable input range and
confirm with enter
The numeric result page and the real-time analyzer page use the same input range.
.
.
Start Measurement
The XL2 is ready to measure the sound levels L•
L
AFmax
Press start •
.
.
AF
, L
Aeq
and
The run indication switches to running . The integrated
sound pressure level over time L
el in the measurement period L
parameter RUN, LOG (logging is enabled) or AUD (audio
recording is configured) flashes in the memory menu.
and the maximum lev-
Aeq
are displayed. The
AFmax

39
Sound Level Meter
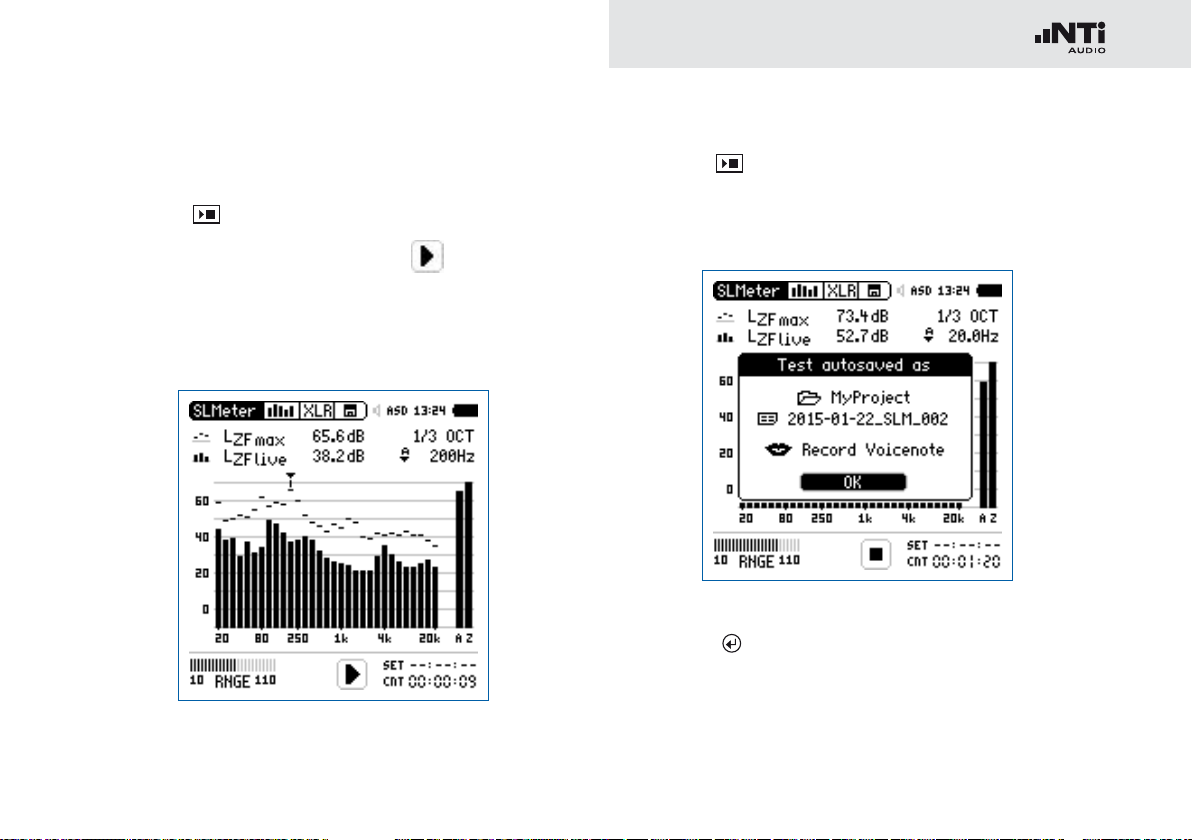
Stop Measurement and Data Saving
Press stop • .
The XL2 stores the broadband sound pressure levels and
the real-time analyzer results simultaneously.
Press enter • to confirm. The measurement data are stored
on the SD Card in ASCII format.
Data Post-Processing
The XL2 stores all data and audio onto the SD card for direct
transfer to the computer. Audio data is stored as .wav files.
Data reports and log files are stored in plain text format,
which can be opened with any text editor (Notepad, Wordpad,
etc.). The data is tab-delimited, so dropping the .txt file into a
spreadsheet application will conveniently show the results in
columns.
Furthermore a series of free MS Excel application templates provide a convenient way to view the measurement results of specific
tasks and create simple reports. They are available as free download for all registered XL2 customers on the support website at
http://my.nti-audio.com. (Enable all macros when opening the
document.)
For the most comprehensive analysis of logged noise monitoring data, use the XL2 Data Explorer software. The data import
into the software is enabled by the Data Explorer Option, which
needs to be installed in the XL2 Sound Level Meter. More details in chapter XL2 Data Explorer.
The sound pressure level measurement is completed.

40
Sound Level Meter
RTA Measurement - Getting Started
Test Preparations
The XL2 reads the electronic data sheet of any connected
ASD microphones provided by NTi Audio and switches the 48V
phantom power automatically on as follows:
Connect the measurement microphone to the XL2.•
Switch on the XL2 •
The 48V phantom power indication in the upper menu bar
changes to ASD. The XL2 is ready for acoustic measurements.
Position the XL2 at the measurement location using a micro-•
phone stand or tripod.
Select the • SLMeter function in the measurement menu and
toggle with page
.
All wideband and RTA levels are measured and
logged simultaneously. You select the sound
levels to be displayed.
.
to the real-time analyzer (RTA) page
RTA Configuration
The XL2 displays two different sound pressure levels at the
same time. You configure which test results to display; e.g.,
L
and L
ZFmax
Ensure no other measurement is going on. The run indication •
should display the stop symbol
Select the • LZF value with the rotary wheel .
ZF
live
.
.
Confirm with enter • .

41
Sound Level Meter
Select RTA Frequency Weighting
The pop-up window FREQ WEIGHTING shows up.
Select the frequency weighting • Z.
Confirm with enter • .
Press start to measure and display the
sound levels results indicated with ----.
Select RTA Time Weighting
The pop-up window extends with TIME WEIGHTING.
Select the required time weighting; e.g., •
Confirm with enter • .
(=Fast).

42
Sound Level Meter
Select Upper/Lower RTA Parameter
Select the parameter shown to the right of the upper • LZF
value with the rotary wheel
Press enter •
.
; e.g. max.
The pop-up window PARAMETER shows up.
Select the parameter • max.
Confirm with enter • .
Follow the same instruction and select the lower RTA pa-•
rameter live.
Select Input Range
Select the lowest possible input range according to the maxi-•
mum level expected during the measurement. Wrong input
ranges are indicated by a < in front of the measurement value or a flashing OVR message in the lower menu bar.
Select the input range • RNGE and press enter
Turn the rotary wheel • to set the applicable input range and
confirm with enter
The numeric result page and the real-time analyzer page use the same input range.
.
.
43
Sound Level Meter
Start RTA Measurement
The XL2 is ready to display the measured sound pressure •
levels L
Press start •
ZFmax
and L
.
ZF
live
.
The run indication switches to running . The actual sound
level L
The parameter RUN , LOG (logging is enabled) or AUD (au-
dio recording is configured) flashes in the memory menu.
and the maximum level L
ZFlive
AFmax
are displayed.
Stop the Measurement and Data Saving
Press stop • .
The XL2 stores the broadband sound pressure levels and
the real-time analyzer results simultaneously.
Press enter • to confirm. The measurement data are stored
on the SD Card in ASCII format.
The RTA measurement is completed.

44
Sound Level Meter

45
Sound Level Meter
Reporting
A report saves the conducted measurements onto the installed
SD Card. The XL2 Supports setting the individual levels to be
stored in the report after the measurement is completed.
1
2
3
1
Add Spectra
No No R
Leq The RTA Leq level is stored in the report.
TA measurement reporting.
Leq, Lmax,
Lmin
T
he RTA Leq, Lmin, Lmax levels are stored
in the report.
All All RTA levels are stored in the report.
2
Report Values
Choose between the following result reporting:
ALL Records all available sound pressure levels
without correction values.
Selected Records a subset of up to 10 different levels,
including correction values if you require.
Select • Report Values with the rotary wheel .
Press enter •
3
Selected Report Values
By setting • Selected at
to toggle between All or Selected.
2
up to 10 individual report val-
ues can be chosen. Select the first value Lxx with the
rotary wheel
and press enter .
The pop-up window for level selection shows up.
Select the reporting level with the rotary wheel •
confirm with enter
.
and

46
Sound Level Meter
Logging
The XL2 features a powerful sound level meter data logger,
which allows you to record all required sound level values during the selected period of time. All results are logged onto the
SD Card. The measurement results can be loaded to a PC for
documentation and visualization. The LOG menu offers the detailed setup of the log report.
1
2
3
4
5
6
7
1
Logging
Select Logging with the rotary wheel
and press enter
to enable the automated logging of test results.
On The XL2 logs measurement data every
interval dt
2
.
Off No Logging
2
Interval Dt
Adjust the logging interval. The optional Extended Acoustic
Pack offers the additional 100 ms logging.
3
Add Spectra
Select Ye s to log additionally the RTA spectrum at each logging interval.

47
Sound Level Meter
4
Log Audio
The XL2 logs audio data as a wav-file. Choose among the
following settings:
Off A
udio logging is off
On Audio logging is activate from mea-
surement start to stop.
Events Only Audio logging of triggered events
only.
For more details read the chapters Wav-File Recording and
Events.
5
Format
Choose among the following audio recording settings:
Compressed Compressed audio logging
Compressed+AGC Compressed audio logging with
automated gain control
24Bit_48kHz Linear audio logging in 24 bit,
48 kHz resolution (optional with
Extended Acoustic Pack)
6
Log Value Setting
Choose between the following settings:
ALL Logs all available sound pressure levels with-
out correction values.
Selected Logs a subset of up to 10 different sound
pressure levels, including correction values if
you require.
Select • Log Values with the rotary wheel
Press enter •
7
Selected Log Values
By setting Selected at
to toggle between All and Selected.
5
up to 10 individual log values can
.
be chosen.
Select the first value • Lxx with the rotary wheel
press enter
.
The pop-up window for level selection shows up.
Select the logging level with the rotary wheel •
firm with enter
.
At 100ms Logging is the log value selection limited to five
different parameters.
and con-
and

48
Sound Level Meter
Wav-File Recording
The XL2 records a wav-file of the measured input signal and
stores it on the SD Card. The available formats are:
Compressed• (default, using ADPCM compression). A new
wav-file is started automatically after 12 hours of recording
(typical maximum wav-file size = 512 MByte)
Compressed+AGC• , compressed with automated gain con-
trol. The gain control increases the level of low-level signals,
so that the wav-file is well-leveled during playback on the
PC.
24Bit_48kHz• , linear wav-file logging in 24 bit, 48kHz resolu-
tion with the optional Extended Acoustic Pack. A new wavfile is started automatically after 1 hour of recording (typical
maximum wav-file size = 512 MByte)
Broadcast Wave Format BWF
The XL2 stores date and time of the recording within the wav-file (according to EBU TECH
3285). This information is available through
professional audio/video tools typically used in
broadcast.
Sample name of wav-file:
MyTest_SLM_000_Audio_FS133.0dB(PK)_00.wav
1
MyTest
1
2 3 4
5
File name defined by user.
2
SLM
Measurement function.
3
000
Automatically incrementing file number.
4
Audio_FS133.0dB(PK)
Audio file with full scale peak level. In case of a Compressed + AGC recording, the file name reads “AGC”; this
file contains corrected level information only.
5
00
For wav-file recording over longer periods, the XL2 splits
the audio data into individual wav-files with about 500 MB
(compressed audio: 12 hours; linear: 1 hour), keeping the
file size small for easier handling on the PC. The number
increments for each successive wav-file.
5

49
Sound Level Meter
The advantage of wav-file recordings is to identify and document sound sources after the measurement. For example, at
a live event an excessive peak level may have been measured
and logged. Actually, this peak level was caused by people
shouting nearby the measurement microphone, and not by the
audio system being monitored. The recorded wav-file assists in
verifying this and the test results can then be post-processed.
Pausing Measurement
If any ongoing measurement is paused , the
XL2 continues the recording of wav-files during
the paused period. The logged data and audio
data can be synchronized using the stored realtime information.
Events
The wav-files are stored in a folder, named, for
example,
2011-11-30_SLM_000_AudioEvent_0001-0200.
The actual wav-files are named for example, as
xxxx_FS133.0dB(PK).wav (xxxx = incrementing
number)
Another example is environmental noise monitoring: Listening
to the recorded wav-file after the measurement may help to
determine the predominant sound source. The XL2 Analyzer
preserves the original absolute test signal level in the recorded
wav-file.
The XL2 Analyzer provides three input ranges to accommodate the wide range of input signals. The dynamic range
of the recorded wav-file is set according to the selected input range. For example, at a microphone sensitivity of
S= 20 mV/Pa, the full scale peak level is:
Range Name Range Level Full scale peak level
Low 10 - 110 dBSPL 117.8 dBSPL
Mid 30 - 130 dBSPL 135.9 dBSPL
High 50 - 150 dBSPL 159.9 dBSPL
Select the lowest possible input range according to the maximum level expected during the
measurement; e.g., If the sound pressure will
always be below 110 dBSPL, select the lowest
input range 10 - 110 dBSPL.

50
Sound Level Meter
Events (optional)
The event function is available with the XL2 Extended Acoustic
Pack Option. The XL2 Analyzer may be configured to record
wav-files and additional noise levels only when triggered, instead of the complete measurement duration.
Advantages
Reduces the data volume acquired, thereby
Simplifying data post-processing of the complete measure-•
ment period
Saving data memory for long-term measurement applica-•
tions.
Events
Events are triggered either automatically by sound levels above/
below a preset value or manually by external key press using
the XL2 Input Keypad.
Event Functions
The XL2 event feature offers the following functionalities:
Automated event triggered at noise levels above/below a •
preset value including setting markers for specific noise categories. Application example: Recording the noise level for
LAF > 80 dB.
Event triggered by external key press of the XL2 Input Key-•
pad. You can utilize four keys (1-4) to categorize any noise of
interest or noise to be later excluded in the post-processing.
A typical application is categorizing any annoying industrial
noise by persons living in the neighborhood.
Data Logging
The XL2 Analyzer logs the data specified in the
LOG setting for the complete measurement duration into a log file. The markers and triggered
events results are added to the same log file.
The XL2 Input Keypad is available as an accessory. Please see chapter Options and Accessories for details.

51
Sound Level Meter
Trigger Events: on level above/below
14
100
90
Level [dB]
80
2
14
70
3
60
13 12
Event Duration
Time [seconds]
Features:
The levels L•
Aeq
, L
Zeq
and L
are recorded for the event
CPeak
duration.
Audio data are recorded for the triggered event duration only, •
thus simplifying data post-processing and saving memory
space for long-term measurements.
Setting markers by external key press of the XL2 Input Key-•
pad.
1
2
3
4
5
6
7
8
9
10
13
12
11

52
Sound Level Meter
1
Trigger Events
Choose from the following settings:
Off No event triggering
on level
above
on level
below
on ext.
Events are triggered at noise levels above the
preset value
2
for the start duration 13.
Events are triggered at noise levels below the
preset value
2
for the start duration 13.
Events are triggered by external key press.
key
press
2
Start [dB]
Set the level at which the triggered event is started.
Start Duration
13
The event start is triggered when the noise level is higher
(or lower ) than the preset value and continues for the preset duration.
3
Stop [dB]
Set the level at which the triggered event is stopped.
on level
Stop level = Start level
2
- Hysteresis
above
on level
Stop level = Start level
2
+ Hysteresis
below
Stop Duration
12
The event stop is triggered when the noise level is lower (or
higher) than the preset value and continues for the preset
duration.
Hysteresis
14
Set the hysteresis to an appropriate value to prevent rapid
switching on and off as the level drifts around the Start
level.
4
Level Selection
Define the level type to be monitored.
14
14

53
Sound Level Meter
5
Log Audio
The XL2 logs audio data as a wav-file. Choose from the following settings:
Off A
udio logging is off
On Audio logging is activated from
measurement start to stop.
Events Only Audio logging of triggered events
only.
For more details read the chapter Wav-File Recording.
6
Format
Choose from the following audio recording formats:
Compressed Compressed audio logging
Compressed+AGC Compressed audio logging with
Automated Gain Control (AGC)
24Bit_48kHz Linear audio logging in 24 bit,
48 kHz resolution. (Required for
post-processing on the PC with
Extended Acoustic Pack)
7
Audio Logging Period
If Log Audio
5
is set to Events Only, then the duration
for the audio recording may be further specified:
Recording
whole ev
ent
Stop recording
after
Records a wav-file for the whole triggered event duration.
Records a wav-file for the specified
period after the event start is triggered.
8
Status Information
Displays current trigger status:
Waiting for trigger•
Armed • (during start duration
13
)
Audio + data recording•
Completing log cycle•
9
Actual Level
Measurement result of the defined level
10
Event Counter
4
.
Counts the number of triggered events that have occurred
during the ongoing measurement.

54
Sound Level Meter
11
Trigger and Marker Monitor
Answers the question: What caused the triggered event?
Lvl Event automatically triggered by level.
1 Event triggered or marker added by pressing key 1
of the XL2 Input Keypad.
Trigger Events: on external key press
Event recording by pressing a button at the external input keypad with automated or manual stop of the event.
100
Event Duration
90
Level [dB]
Event Duration
2 Event triggered or marker added by pressing key 2
of the XL2 Input Keypad.
3 Event triggered or marker added by pressing key 3
of the XL2 Input Keypad.
4 Event triggered or marker added by pressing key 4
of the XL2 Input Keypad.
12
Stop Duration
3
See
.
13
Start Duration
2
See
.
14
Hysteresis
3
See
.
80
70
60
Features:
The levels L•
duration.
Audio data may be recorded for the user-defined event dura-•
15
tion
Retrigger with every repeated key press within the event •
duration.
15
key press
Time [seconds]
, L
and L
Zeq
Aeq
after the key press.
key press
are recorded for the event
CPeak
15

55
Sound Level Meter
15
Event Stop Mode and Event Duration
on key release T
he event is recorded as long
as the button of the input keypad is kept pressed; minimum
the preset duration at Min. Event
Duration.
15
16
on ext. keypress
The event is stoped by pressing a button on the external input keypad; latest
after the preset duration at Max. Event
Duration.
16
Button Functionality of Input Keypad
treat each key
ately
separ
All four buttons operate individually.
For example pressing the button 2
will be recorded as button 2 in the
measurement report. This allows
characterizing different acoustic noise
sources.
treat all keys as
Key 1
All four buttons operate parallel and
will be recorded as button 1 in the
measurement report.

56
Sound Level Meter
How to Setup the XL2 for Triggered Event Measurements
Select the logging page, set• Logging On, Interval dt:
00:00:01 and choose the required log values.
Setup the event page. For example, the screenshot below •
starts the event recording after LAF exceeds 80 dB for 2 seconds and stops after LAF is lower than 70 dB for 3 seconds.
Select the memory menu and create a new folder. This folder •
will then be displayed in the memory menu. All log data and
event wav-files are stored in this folder.
Logging Enabled
Triggered-event recording requires the activation of sound level logging. Using the default
Interval dt: 1 second is recommended.
Auto Save
If Log Audio
the XL2 sets per default Naming+Saving: auto
in the memory menu. This ensures that the recorded triggered event data is stored on the SD
Card.
For convenience, in case more than 20 triggered events have been recorded, the Au-
tosave -> Delete function is disabled, as deleting such multiple wav-files on the XL2 takes a
long time.
Wav-files
All triggered-event wav-files are stored in an individual folder. For details see chapter Logging.
5
is set to Events Only, then
The XL2 is ready for the triggered event measurement.
57
Sound Level Meter
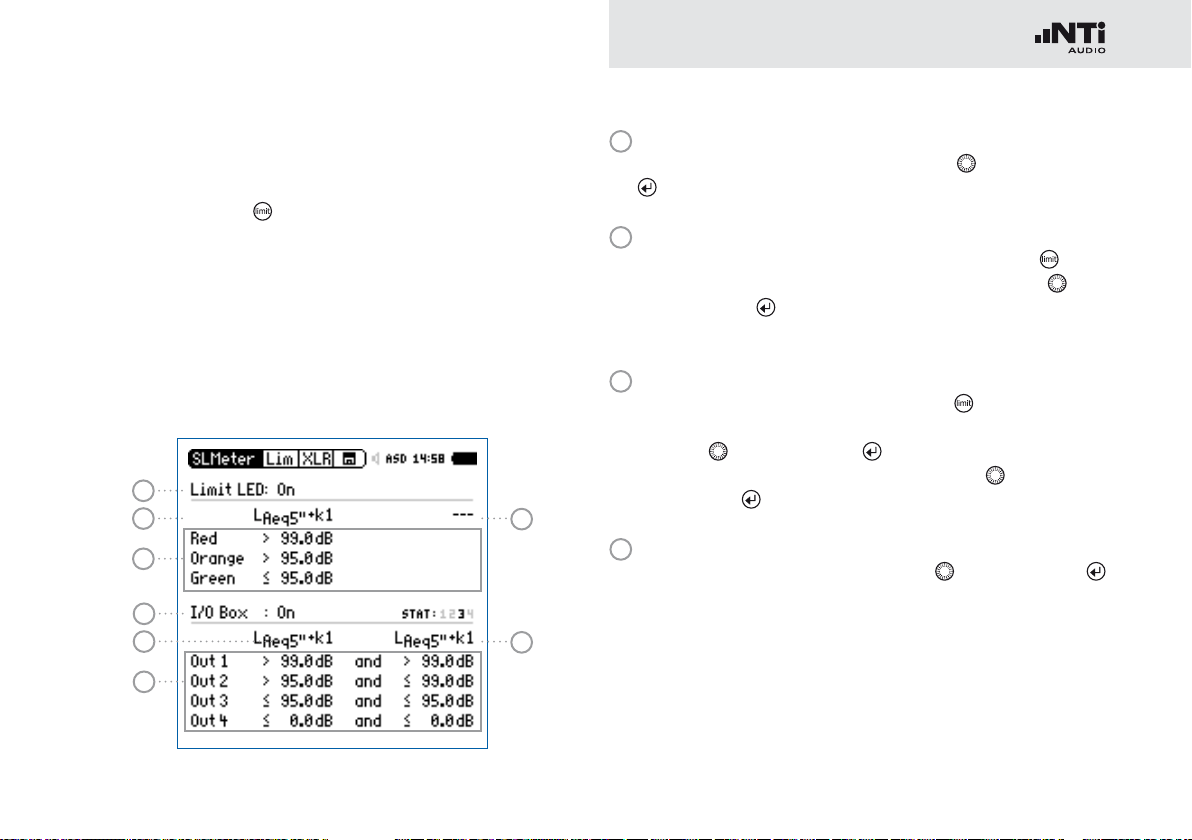
Limits
The limit page offers two functions:
Setup of limit LED •
any sound levels that exceed the pre-set limit in orange or
red color. The default color is green.
Limit parameter setup for the external Digital I/O Adapter •
which connects to the digital I/O interface of the XL2. Both,
the Digital I/O Adapter PCB and Box are optional accessories
for the XL2 Analyzer. They serve the control of any external
peripherals, such as the NTi Audio Stack Light.
1
2
3
4
5
6
function; enabling the XL2 to highlight
8
7
1
Limit LED On/Off
Select Limit LED with the rotary wheel
and press enter
to enable/disable the limit function.
2
LED - Level 1
Select one sound level for the limit LED indication
Select the soun•
Press enter •
d level field with the rotary wheel .
and select the sound level for the limit
LED indication.
3
Selected Level Values
To set the level values for the limit LED
Select the Red or Orange soun•
wheel
and press enter .
,
d level with the rotary
Set the level value with the rotary wheel • and confirm
with enter
4
I/O Box On/Off
Select I/O Box with the rotary wheel
.
and press enter
to enable/disable the limit function.
.

58
Sound Level Meter
5
I/O - Level 1
Setup the level for the control of e.g. the external Digital
I/O Adapter Box.
Select the •
Press enter •
level field with the rotary wheel .
and select the level for the control of the
external Digital I/O Adapter Box..
6
Selected Sound Level Values
To set the level values for the control of the external Digital
I/O Box.
Select the Out 1, Out 2, Out 3 or Out 4 •
tary wheel
and press enter .
level with the ro-
Set the level value with the rotary wheel • and confirm
with enter
7
I/O - Level 2
.
Follow the setting for I/O Sound Level 1. The I/O level 1 may
be combined with I/O level 2 using and/or combinations,
providing indications in level ranges. Alternatively, other levels can be selected for the control of the external Digital I/O
Adapter Box.
8
LED - Level 2
Follow the setting for LED - Level 1.
I/O Box Limits with Triggered Events
If triggered-event recording is enabled, the digital output 4 (OUT4) is utilized as confirmation
feedback to the XL2 Input Keypad, thus the setting is disabled.
59
Sound Level Meter
Correction Value KSET
The correction value page offers a measurement wizard for live
event monitoring, applicable in case the measurement location
differs from the loudest position in the live event area.
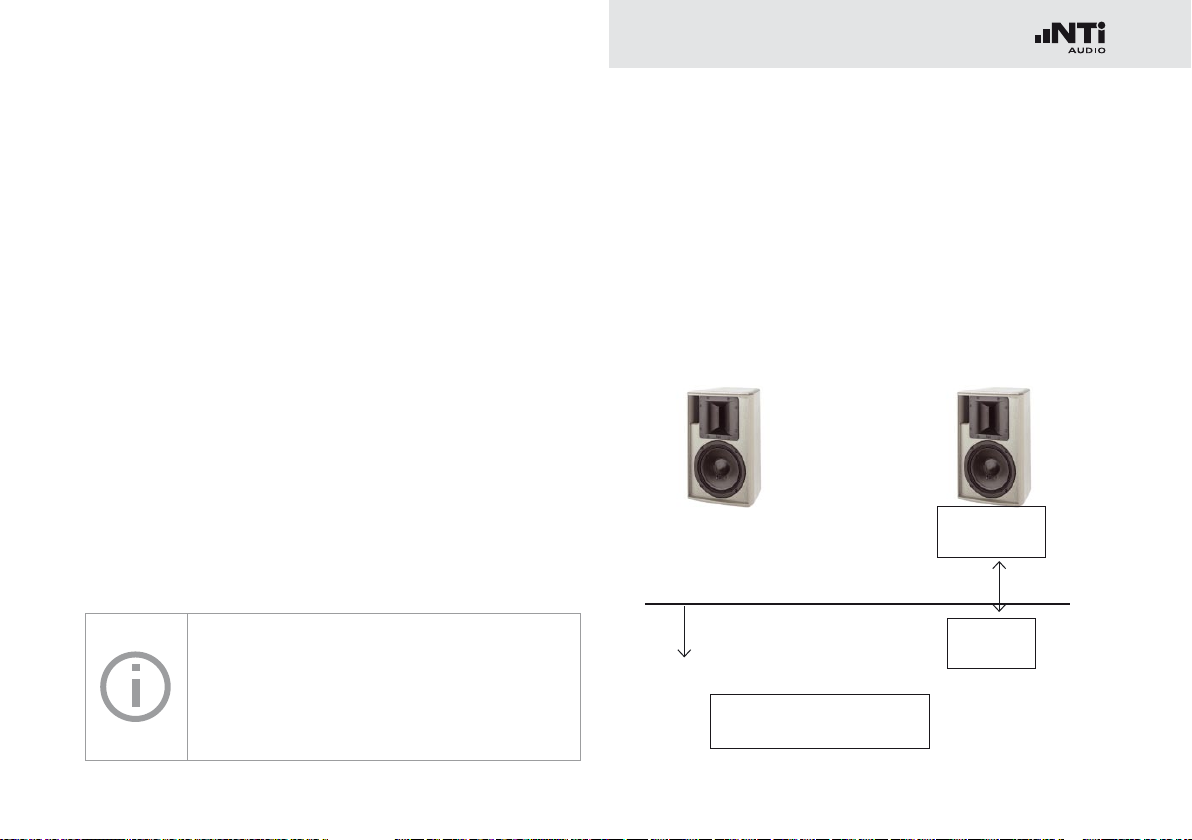
Measurement Position
The goal at live event monitoring is to measure the sound level
at the loudest position accessible by the audience. Setting up
any sound level measurement at this loudest location is typically not practical, thus an alternative measurement position is
chosen. The recommended measurement position in order to
minimize the influence that audience noise has on the measurement:
Mount the measurement microphone in front of the main •
speakers
Position the XL2 Analyzer at front of house (FOH)•
Connect the XL2 Analyzer and measurement microphone •
using a professional audio cable
Positioning the measurement microphone at
front of house (FOH) may result in audience
noise interfering with the measurement results.
The audience noise will be further amplified by
the measured k-values.
Level Difference
Prior to the start of the live event, the level difference between
the loudest and the measurement position is measured. The
XL2 Analyzer calculates the level difference automatically based
on the individual sound level measurements at both locations.
This level difference is included in the sound level reading during the live event, and the XL2 thereby displays and records the
sound pressure level of the loudest point.
Measurement
Position
(Microphone)
Level difference
audience area
XL2 positioned at FOH
Loudest
Audience
Position

60
Sound Level Meter
How to Measure the Correction Value
Play a pink noise signal at the typical sound pressure level of •
the live event. (signal source Minirator, NTi Audio Test CD)
Select the correction page •
Search the audience area for the location with the highest •
sound pressure level and position the XL2 Analyzer.
Turn the rotary wheel •
to Audience and press enter
.
to select the parameter RUN next
.
Wait until the measurement is completed.•
Position the XL2 at the measurement position.•
Turn the rotary wheel •
to Measure and press enter
to select the parameter RUN next
.
The XL2 measures the sound level at the loudest position
for 5 seconds. The timer counts down to zero.
The XL2 measures the sound level at the measurement
position for 5 seconds. The timer counts down to zero.

61
Sound Level Meter
Wait until the measurement is completed.•
The correction values k1 and k2 are calculated and displayed •
including date and time (in accordance with DIN15905).
Manual Setting of Correction Values
You may fine-tune the correction values k1 and k2 manually.
Such fine-tuning adds the remark “Manually Adjusted” in the
log file.
1
Turn the rotary wheel • to select the correction value
and press enter
.
The selected correction value starts flashing.
3
2
3
62
Sound Level Meter
Set the correction value with the rotary wheel • .
The note “Manually Adjusted” is displayed at
Reset Correction Values
You may clear all correction values back to zero
by pressing the Clear All
2
.
enter
.
1
and confirm with
To undo the manual setting turn the rotary wheel •
the parameter UNDO at
Confirm with enter •
to select
2
.
.
Display k1 and k2 during Measurement
The correction values k1 and k2 can be displayed in the numeric result page during the ongoing sound level measurement instead of any
other sound levels.
Correction Values in Profiles
The correction values k1 and k2 can optionally
be stored within profiles. This allows to use profiles with different correction values.
Wav-file Recording
A simultaneously-recorded wav-file supports
post-event reviewing of the cause of excessive
sound levels.

63
Sound Level Meter
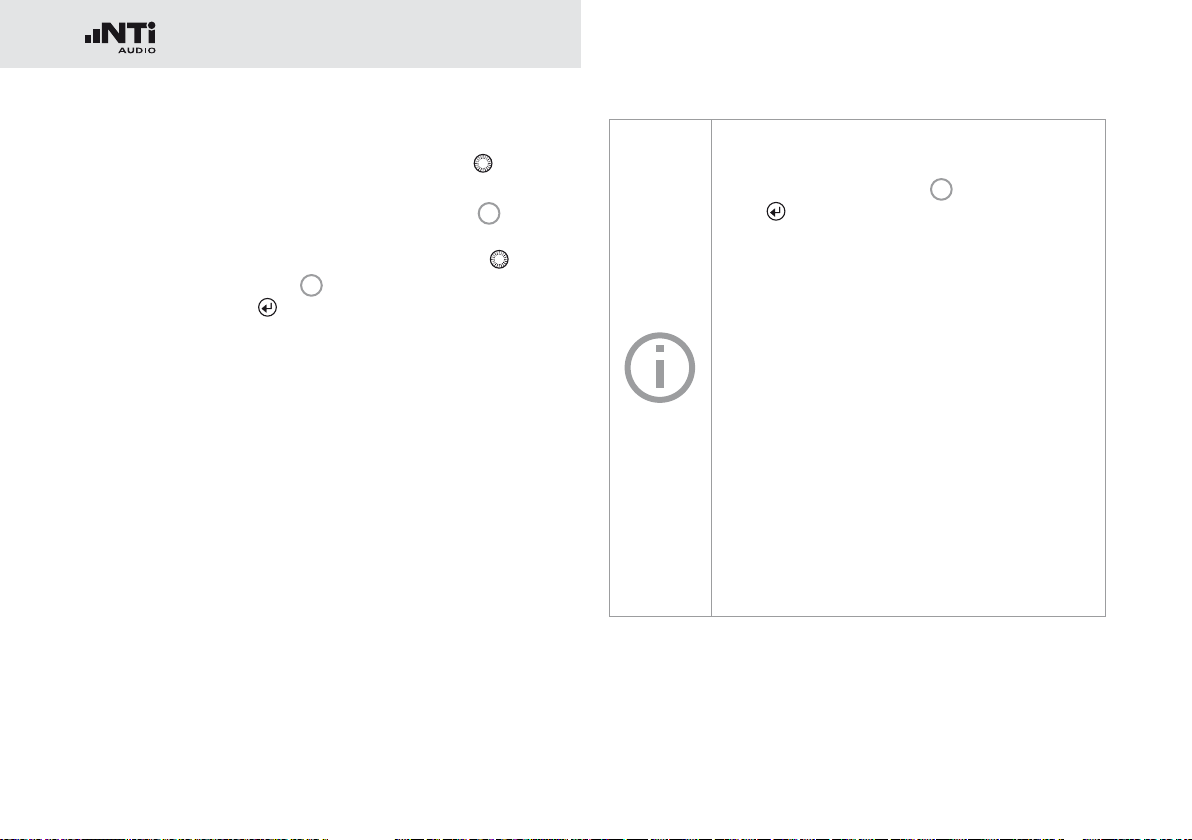
Locked Run Mode
The Locked Run Mode simplifies sound level monitoring. You
just need to power up the XL2 and the measurement starts
automatically. The measurement continues until you switch off
the instrument using the power button
data are stored by default.
Start Locked Run Mode
Set the required parameters in the sound level meter for •
your noise monitoring application.
Press and hold the start/stop button •
The Locked Run Mode is now activated. The Run Indicator
1
displays L. The Info window is displayed at the same
time.
Switch off the instrument.•
. The measurement
for 3 seconds.
The page button •
el meter and real time analyzer window. All other buttons are
deactivated during Locked Run Mode.
1
allows toggling between the sound lev-
The measurement is stopped and the data are saved.
Switch on the instrument.•
The sound level measurement starts automatically and
continues as long as the device is powered on.
End Locked Run Mode
Press and hold the start/stop button • for 3 seconds during
the ongoing measurement.
The measurement is stopped and the Locked Run Mode
deactivated.

64
FFT Analysis + Tolerance
5. Acoustic Analyzer
Besides the comprehensive sound level meter function, the
XL2 Audio and Acoustic Analyzer offers the following acoustic
measurement functions:
FFT Analysis with optional tolerance function•
Reverberation Time RT60•
Polarity•
Delay time•
1/12 Octave + Tolerance Analysis (optional)•
Noise Curves (optional)•
Speech intelligibility STIPA (optional) •
FFT Analysis + Tolerance
The FFT measurement is the ideal tool for visualization of comb
filters and narrow band effects. It allows a detailed frequency
response investigation of audio and acoustic systems. The XL2
includes an extremely fast, real-time FFT. Optional features
are
High-resolution Zoom-FFT up to 0.4 Hz steps in the fre-•
quency range 5 Hz - 20 kHz provided with optional Extended
Acoustic Pack or the Spectral Limits Option
Capture and tolerance function provided with Spectral Limits •
Option; thus the main menu function reads FFT + Tol.

65
FFT Analysis + Tolerance
1
Result Symbols / Capture & Start Tolerance Mode
This field offers two functions:
Symbols for measurement results •
13
1214
Upper result displayed as line.
Lower result displayed as bargraph.
1
2
11
10
Capture & Start Tolerance Mode•
The displayed readings may be captured as reference
3
reading C1 to C8 for
Comparing measurement results against captured •
4
traces with relative or absolute curve display.
Creating tolerance masks based on captured refer-•
ence curves for passed / failed measurements.
9
8
Capture EQ Capt
ures the upper parameter
2
5 7
6
Capture Live Captures the lower parameter

66
FFT Analysis + Tolerance
Manage
capt
ures
Allows to rename captures, clear recorded captures, save captures to SDCard for export from the XL2 or load
captures from SD-Card for import to
the XL2.
Start tolerance
mode
Starts the tolerance mode for passed/
failed measurements comparing the
actual measurement results against a
tolerance band.
2
Measurement Result
Actual level result of the indicated frequency band. The cursor readout displays the center frequency and the level of
the band indicated by the arrow.
Upper parameter displayed as line.
Lower parameter displayed as bargraph.
3
Y-Scale setting
Select the Y-Axis with the rotary wheel •
with enter
.
and confirm
Select the zoom factor between • 20, 10, 5, 2.5 dB/div
and confirm with enter
.
Scroll up and down with the rotary wheel • to select the
Y-axis range.
Confirm with enter •
4
Measurement Result
.
Displays the actual and averaged measurement results.
5
Input Range
The XL2 Analyzer provides three input ranges to accommodate the wide range of input signals. The individual ranges are based on the microphone sensitivity setting in the
calibration menu of the XL2. For example at a sensitivity
S=20mV/Pa the input ranges are
Lower range: 10 - 110 dBSPL•
Middle range: 30 - 130 dBSPL•
Upper range: 50 - 150 dBSPL•
Select the lowest possible input range according to the
maximum level expected during the measurement; e.g., if
the sound pressure will be always below 110 dBSPL, then
select the lowest input range 10 - 110 dBSPL.

67
FFT Analysis + Tolerance
6
Time Weighting
Offers selectable time weighting of 0.1, 0.2, 0.5, 1.0 second as well FAST (125 ms) and SLOW (1 second). Applications:
Short Time
W
eighting
Long Time
Weighting
7
Run Indication
High resolution in time with minimum
averaging
Low resolution in time with longer averaging
The run indication shows the measurement status running,
paused or stopped. Various measurement settings are
locked during ongoing measurements, such as changing
the input ranging or the preset measurement time.
For passed/failed measurements with the Spectral Limits
option the run indication may display A for a preset automated level trigger.
8
Actual Measurement Time
Counts actual measurement time in hrs:min:sec. Supports
setting of time modes: continuous and single.
Timer Mode Continuous
(applicable for standard measurements)
All values are recorded and monitored continuously after starting a measurement with start
The actual measurement time is shown.
Timer Mode Single
Automatically stops the measurement after the
pre-set measurement time.
Set the required measurement time.•
Start the measurement •
9
Preset Measurement Time
.
Adjustment of preset measurement time for single timer
setting.
.

68
FFT Analysis + Tolerance
10
Readout Frequency
You may select any frequency to read out individual levels.
The selected frequency is indicated by the cursor arrow.
Choose between the following settings:
The cursor follows automatically the highest level,
e.g. tracing feedback frequencies at live sound.
Select the frequency with the rotary wheel •
Press enter •
You may readout any individual frequency.•
Return to auto frequency with enter •
.
.
The cursor returns to the frequency with high-
est level bar.
The cursor read out may be set manually to any frequency. The read out remains at the selected frequency.
Select the frequency with the rotary wheel •
Press enter •
Select the frequency of interest.•
Confirm with enter •
The cursor readout
ment results of the selected frequency band.
.
.
2
displays the measure-
11
Zoom Mode
(optional, applicable with the Extended Acoustic Pack or
the Spectral Limits Option)
Select the readout frequency •
The zoom mode is displayed above the flashing arrow.•
Select the zoom-in frequency with the rotary wheel •
.
.
Press limit •
out with the rotary wheel
Release limit •
or right with the rotary wheel
12
Phantom Power Supply
48V T
ASD An NTi Audio measurement microphone with
48V Phantom power is switched off.
and zoom the linear frequency scale in or
and scroll the linear frequency scale left
he XL2 provides 48 V phantom power supply
to the connection microphone or sensor.
automated sensor detection ASD is connected. The XL2 reads the electronic data sheet of
the microphone and switches the 48V phantom power automatically on
10
and press enter
.
.
.
.

69
FFT Analysis + Tolerance
13
Measurement Unit
Select the measurement unit as follows:
dB Sound level in dBSPL
This measurement unit is permanently selected
upon connecting a NTi Audio measurement microphone with electronic data sheet.
dBu Input level in dBu
dBV Input level in dBV
V Input level in Volt
14
Page Selector X-Scale and Parameter Setting
20k Sho
ws FFT result of the frequency band range.
484.38 Hz - 20.453 kHz in a resolution of
140.62 Hz with 143 bins shown on the display.
1k7 Shows FFT result of the frequency band range.
58 Hz - 1.722 kHz in a resolution of 11.72 Hz with
143 bins shown on the display.
200 Shows FFT result of the frequency band range.
7 Hz - 215.01 Hz in a resolution of 1.46 Hz with 143
bins shown on the display.
Usr User Range
(applicable with optional Extended Acoustic Pack
or Spectral Limits Option)
5 Hz - 20 kHz in zoom mode with a minimum resolution of 0.366 Hz and 143 bins displayed.
Set Selection for FFT Windowing:
Hann• : Default for acoustic measurements
Dolph-Chebyshev• : for analyzing small signals
(e.g. harmonics) close to a dominant signal.
The page button
switches these display modes.

70
FFT Analysis + Tolerance
FFT Analysis - Getting Started
Test Preparations
Connect the measurement microphone to the XL2.•
Switch on the XL2 •
The 48V phantom power indication in the upper menu bar
changes to ASD. The XL2 is ready for acoustic measurements.
Position the XL2 at the measurement location using a micro-•
phone stand or tripod.
.
Configuration
The XL2 displays two different sound pressure levels at the
same time. You configure to display either the levels Live,
Max, Min, EQ or captured results.
Select the upper result parameter with the rotary wheel •
Confirm with enter • .
.
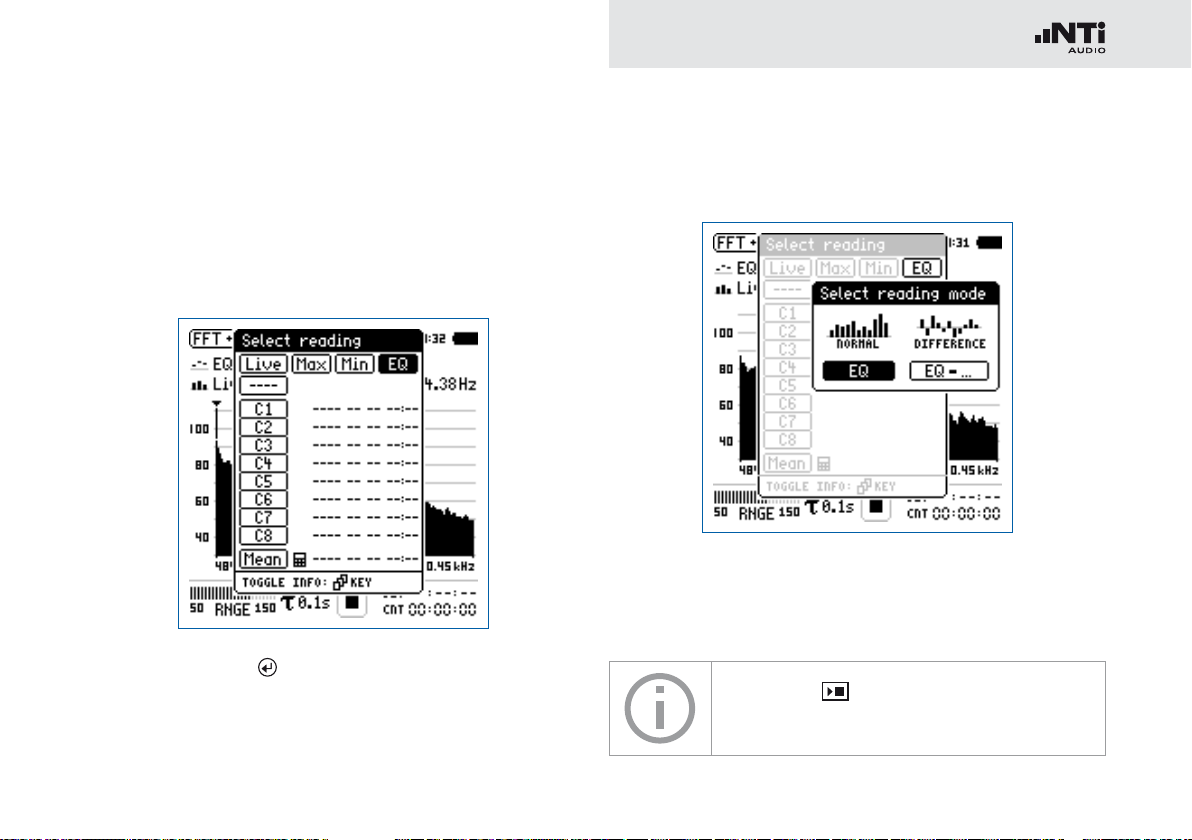
71
FFT Analysis + Tolerance
Select Upper/Lower Reading
The pop-up window Select reading shows up.
Select the integrated averaged reading • EQ. All available se-
lections are Z-weighted (= no weighting).
Confirm with enter • .
The pop-up window Select reading mode shows up.
Select • EQ for normal absolute display of measurements.
Follow the same instruction and select the lower FFT read-•
ing Live.
Press start to measure and display the
sound levels results indicated with ----.

72
FFT Analysis + Tolerance
Select Input Range
Select the lowest possible input range according to the maxi-•
mum level expected during the measurement.
Select the input range • RNGE and press enter
Turn the rotary wheel • to set the applicable input range and
confirm with enter
.
.
Start Measurement
The XL2 measures the selected sound pressure lev-•
els Live and EQ. All available sound levels are
Z-weighted (= no weighting).
Press start •
.
The run indication switches to running . The actual sound
level Live and the averaged level EQ are displayed. The parameter RUN flashes in the memory menu.

73
FFT Analysis + Tolerance
Stop Measurement and Data Saving
Press stop • .
The XL2 stores the measurement data automatically.
Press enter • to confirm. The measurement data are stored
on the SD Card in ASCII format.
The measurement is completed.
Capture References and Create Tolerances
The Spectral Limits Option extends the function range of the
XL2 with trace capturing, relative curve display and comprehensive tolerance handling for the FFT Analysis and the high
resolution 1/12 Oct + Tol spectral analysis.
Features:
Captures multiple traces in the internal memory•
Comparing measurement results against captured traces •
with relative or absolute curve display
Comprehensive tolerance handling•
Creating tolerance masks based on captured reference •
curves for passed / failed measurements
Export and import of tolerance and capture files•
True peak level in 1/1 and 1/3 octave resolution•
High-resolution Zoom-FFT up to 0.4 Hz steps in the frequen-•
cy range 5 Hz - 20 kHz
Read the detailed description in the separate chapter
Capture + Tolerance.
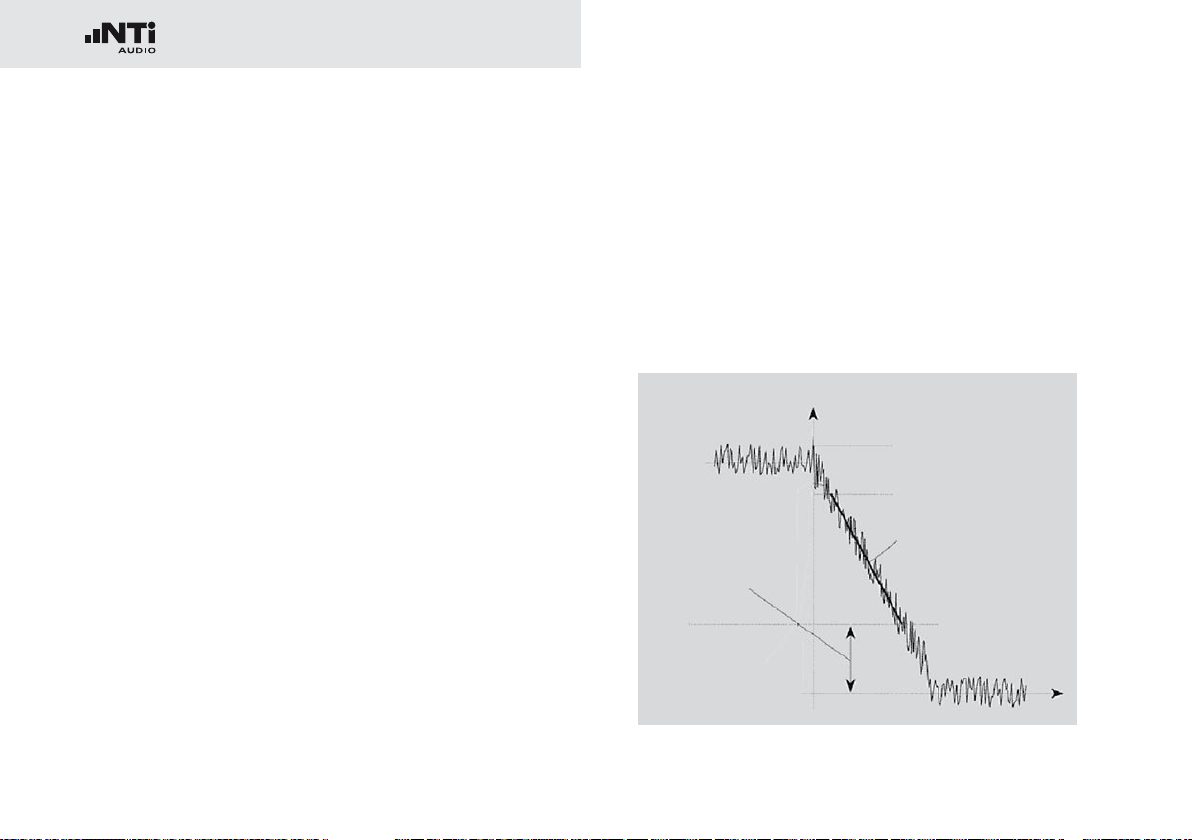
74
Reverberation Time RT60
Reverberation Time RT60
The XL2 measures the energy decay from 63 Hz to
8 kHz using the Schroeder method in 1/1 octave resolution. The
optional Extended Acoustic Pack enables 1/3 octave band resolution from 50 Hz to 10 kHz. Use either an impulse source (e.g.,
a starter pistol) or an interrupted pink noise as the test signal.
What is Reverberation Time RT60?
Reverberation time RT60 is the time required for the sound
pressure level to decrease by 60 dB after the sound stimulus
signal is stopped. For simple practical measurements the applicable standard ISO 3382 specifies the following two measurement methods:
T20•
The measurement requires just a small dynamic measure-
ment range of ~35 dB above the ambient noise level for
each frequency band.
RT60 (T20) = 3 x decay time of 20 dB
-
T30•
The measurement requires a dynamic measurement range of ~45 dB above the ambient noise level for each
frequency band.
RT60 (T30) = 2 x decay time of 30 dB
-
In detail the RT60 is based on a linear least-squares regression of the measured decay curve. If the overall RT60 is short
(e.g. < 0.3 seconds) the room acoustic is referred to as being “dead”; for example, a heavily furnished room with thick
carpets, curtains and upholstered furniture may have such an
acoustic character. If the overall RT60 is long (say more than
2 seconds) the room acoustic is referred to as being “live” and
echoic; for example, a large empty room with painted plaster
walls and a tiled floor may have such an acoustic character.
Level [dB]
0 dB
-5 dB
20 dB level range to
distance to
noise floor
-35 dB
obtain the reverberation time
-25 dB
Time
RT60 Measurement with T20 method
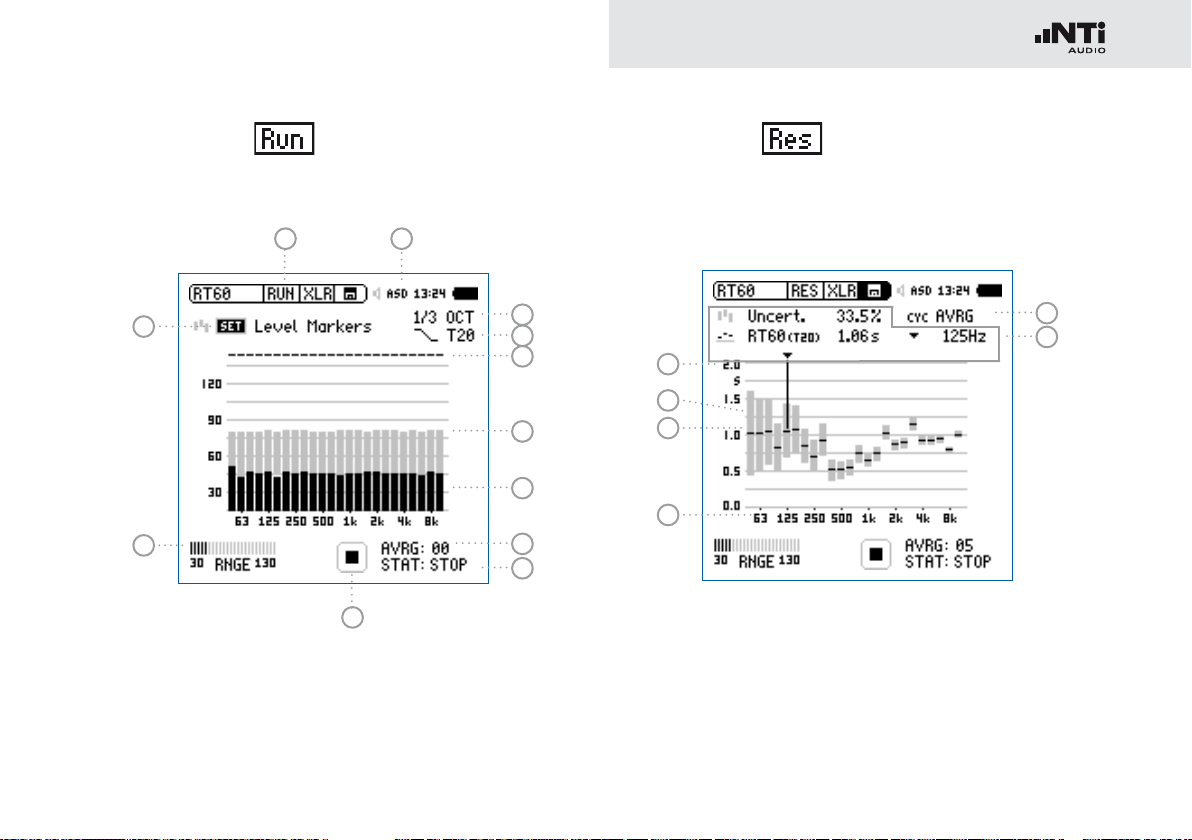
75
Reverberation Time RT60
RT60 Run Test Page
1
2
RT60 Result Page
1112
10
9
8
7
6
5
4
3
13
14
15
16
18
17

76
Reverberation Time RT60
RT60 Cycle Result Page
19
20
1
Set Level Markers
Prior to conducting a reverberation time measurement, the
environmental noise is measured, and the required energy
level of the test signal is determined.
Select • SET and press enter
to measure the actual en-
vironmental noise.
22
The required level markers appear in grey color.
21
2
Input Range
Select between the lower, mid and upper input range. The
exact ranges depend on the microphone sensitivity setting
in the calibration menu of the XL2.
3
Run Indication
This icon displays the running and stop status of the reverberation time measurement. It is controlled by start/stop
.

77
Reverberation Time RT60
4
Measurement Status STAT
Displays the actual measurement status. Start and stop the
reverberation time measurement with start/stop
following status information is displayed:
ARMED Measurement is waiting for the test signal
to exceed at least one measurement trigger
marker, then the measurement is triggered
automatically.
NOISE A sound stimulus signal above the trigger
marker is being received.
DECAY Decay is being measured.
PAUSE The measurement has been paused by press-
ing pause
.
STOP No RT60 measurement is presently being per-
formed.
5
Average AVRG
Counts the measurement cycles. When using an interrupted noise test signal, a minimum of 3 sequential cycles is
recommended.
. The
6
Actual Real-Time Spectrum
The black bars indicate the actual signal, including background noise. While setting up the reverberation time measurement you should increase the test signal level until the
black bars exceed the grey bars completely and the status
4
displays NOISE.
7
Level Marker
The grey bars indicate the signal level required for effective
reverberation time measurements in each octave band.
The marker has a length of 35 dB, and can be set by
Selecting • SET
Press enter •
1
with the rotary wheel
.
to measure the environmental noise in
the silent room.
8
Band Status
Indicates a successful reverberation time measurement
above each octave band with a tick
9
Measurement Method
.
Select between the measurement methods T20 and T30.
T20 requires just a small dynamic measurement range of
~35 dB above the ambient noise level for each frequency band. T30 requires a dynamic measurement range of
~45 dB.

78
Reverberation Time RT60
10
Measurement Resolution
Reverberation time measurement selectable in 1/3 octave or 1/1 octave band resolution. The optional Extended
Acoustic Pack enables 1/3 octave band resolution from
50 Hz to 10 kHz.
11
Phantom Power Supply
48V T
he XL2 provides 48 V phantom power supply
to the connection microphone or sensor.
ASD An NTi Audio measurement microphone with
automated sensor detection ASD is connected. The XL2 reads the electronic data sheet of
the microphone and switches the 48V phantom power automatically on
48V Phantom power is switched off.
12
Page Selector RT60
Select between the RT60 run test page and the result page.
The page button
toggles between these displays.
RT60 run test page
RT60 result page. Toggle with the measurement
result selection
18
among
AVRG RT60 result page showing average
of all cycles and uncertainty factor
CYC xx RT60 result page for each cycle
Last RT60 result page for last cycle
14
Y-Axis Reverberation Time
Reverberation time in seconds. The scaling is automatically
adjusted.

79
Reverberation Time RT60
14
Uncertainty Factor
The uncertainty factor is displayed in the RT60 average result page. It indicates the uncertainty of the averaged measurement results, reduces as more cycles are measured,
and depends on the measured reverberation time and the
bandwidth of the individual frequency band; lower bands
show a higher uncertainty factor. The number of measurement cycles is displayed at
15
Overall Reverberation Time Test Result
5
.
Readout of reverberation time and uncertainty factor.
Uncertainty factor. For more details see
14
.
Reverberation time measurement results.
16
X-Axis
RT60 Octave Bands 63Hz - 8 kHz
17
Cursor Readout
Select the individual frequency band and read out the following numeric measurement results
Uncertainty factor in % or correlation in %.•
Reverberation time RT60 (T20), of the selected frequen-•
cy band, in seconds (s).
18
Measurement Result Selection
The RT60 measurement function allows consecutive measurements within one test sequence. An averaged test result of all measurements is automatically calculated.
Select CYC and scroll with the rotary wheel
through the
individual test result cycles showing
Last Last Test Result
Displays the result of last measurement cycle.
xx Single Test Cycle Results
The individual single test results are marked
with CYC xx, where xx is an incriminating num-
ber. You may delete individual test results. The
averaged reverberation time result uses only the
remaining valid measurements. To delete results
in a cycle,
Select • DEL with the rotary wheel
Confirm with enter • .
AVRG Averaged Test Result
The averaged test results of all cycles are calculated and displayed.

80
Reverberation Time RT60
19
Correlation Factor in %
The correlation factor is 100% for perfectly linear sound
pressure level decay after the sound source has ceased.
The natural deviation from this linearity results in lower
correlation values. The correlation factor is typically 80 100%.
20
Cycle Reverberation Time Test Result
Readout of cycle reverberation time and correlation factor
19
when selection 18 is CYC xx or Last.
Correlation Factor. Scale is on the right Y-axis. For
more details see
Reverberation time measurement result of individual displayed cycle. Scale is on the left Y-axis.
21
Y-Axis Correlation Factor
The right Y-axis shows the correlation factor in %. The correlation factor Y-axis is displayed when test result selection
18
is CYC xx or Last.
19
.
Test Signals
Use either an interrupted pink noise or an impulse source as the test signal.
Interrupted pink noise •
Precision measurements require an omnidirectional speaker with identical radiation
characteristic in all directions. Various interrupted pink noise test signals with different
on/off times are offered by the NTi Audio Test
CD included with the XL2 or the Minirator signal generator. Minimum three measurement
cycles shall be performed. The XL2 averages
thee readings automatically.
Impulse •
The trigger signal is an impulse source, such
as a starter pistol, starter clap or bursting balloon. Individual measurements, or test sequences with repeated trigger signals, can be
carried out.
22
Delete Cycle Results
Individual cycle results may be deleted, thereby excluding
them from the calculation of the AVRG result.
81
Reverberation Time RT60
RT60 Measurement - Getting Started
Test Signal: Pink Noise
Play a pink noise signal through an omnidirectional speaker in
the room under test. The sound source should be played for
a long enough time period to ensure that a balance between
injected and absorbed acoustic energy has been reached. For
example the sound reflections should be given enough time
to reach all reflective surfaces in the room. As a rule of thumb,
ensure that the pink noise is played for at least the time period
of the estimated RT60 test result. If in doubt, play the Minirator MR-PRO or the Test Signal CD as sound source for at least
5 seconds for each cycle. Each time the source signal stops,
the XL2 recognizes this interruption, triggers, measures the
decay time and calculates the reverberation time automatically.
Minimum three measurement cycles shall be performed.
Test Signal: Impulse
Fire an impulse sound source in the room under test, e.g. use
a starter pistol, starter clap or bursting balloon. The XL2 measures the decay time and calculates the reverberation time automatically.
Test Preparations
The XL2 reads the electronic data sheet of any connected
ASD microphones provided by NTi Audio and switches the 48V
phantom power automatically on as follows:
Connect the measurement microphone to the XL2.•
Switch on the XL2 •
.
The 48V phantom power indication in the upper menu bar
changes to ASD. The XL2 is ready for acoustic measurements.
Position the XL2 at the measurement location using a micro-•
phone stand or tripod.
Select the • RT60 function in the measurement menu and
toggle with page
Prepare the environment for the measurement. For example •
mute all sound sources to establish silence.
to the run page RUN.

82
Reverberation Time RT60
Set Level Markers
Select the parameter • SET with the rotary wheel and
press enter
.
The environmental noise is measured and the grey level
markers are set.
Get Ready for the Reverberation Time Measurement
Protect the ears against high sound pressure levels, as the •
test signals might be very loud.
Setting the pink noise level:
Start the pink noise test signal with the appropriate on/off •
time according to the room. Use an initial low level.
Increase the test signal level until all level markers for the •
minimum test signal level are passed. Use an equalizer to
push individual band levels.
Switch off the interrupted pink noise signal after you have •
finished setting the pink noise level.

83
Reverberation Time RT60
Start the Measurement
Press start • . The status indication switches to ARMED.
Enable the test signal; e.g., switch on the interrupted pink •
noise signal or fire a starter pistol.
The black bars have to exceed the grey bars completely.•
Continue the Measurement
Using pink noise:
The interrupted pink noise test signal continues with the preset on/off time. The XL2 automatically triggers at each cycle.
Complete a minimum of three test cycles to accurately calculate the uncertainty factor. Perform more cycles to increase the
measurement accuracy (= smaller uncertainty factor).
Using an impulse source:
A single measurement is sufficient, thus press stop
the measurement. No further measurements are required to
increase the statistical measurement accuracy.
Confirmation marks indicating successful measurements, are displayed above each
band.
to end
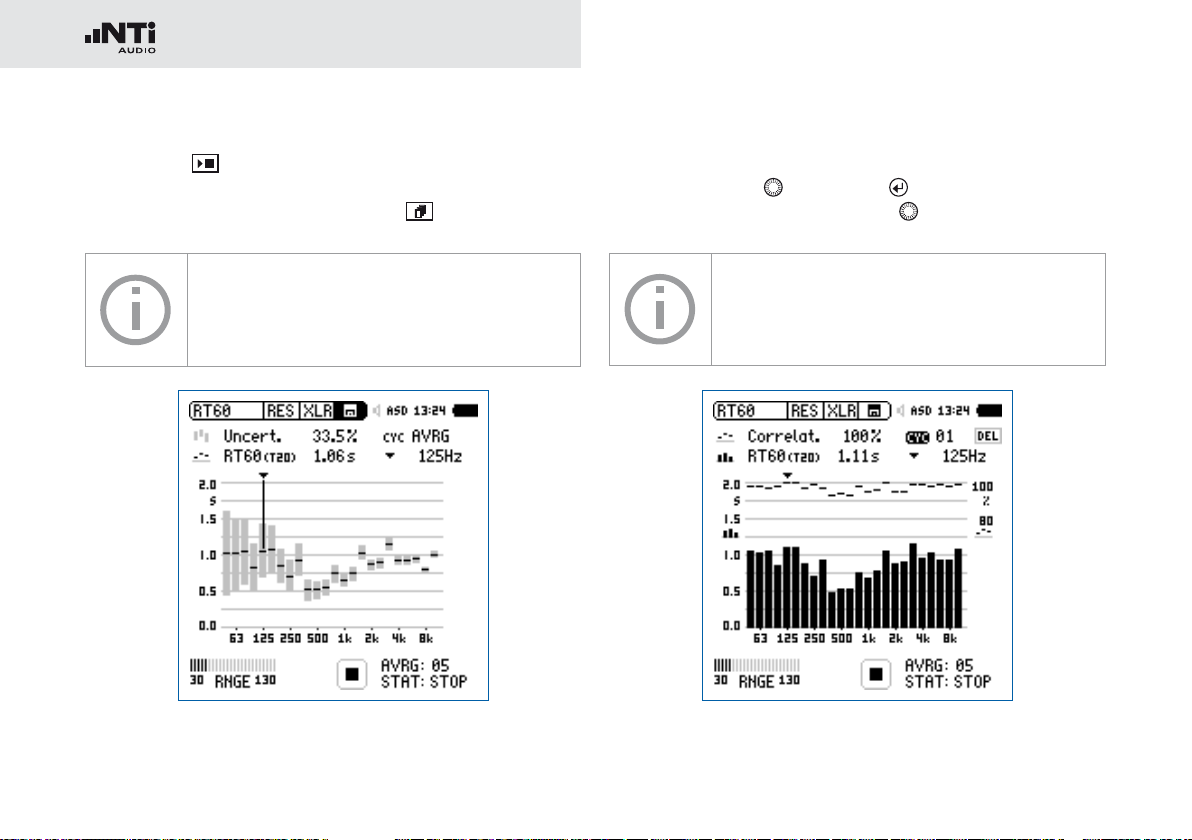
84
Reverberation Time RT60
Stop the Measurement and Read Out the Result
Press stop • .
If applicable, switch off the pink noise test signal.•
Select the result page • RES with page
The average reverberation time for each frequency band is displayed in seconds and the
measurement uncertainty in %.
•
•
•
•
.
Read Out the Individual Cycle Result
If multiple cycles have been recorded, then select • CYC with
the rotary wheel
cycle result with the rotary wheel .
Within each cycle, the reverberation time for
each frequency band is displayed in seconds
and the correlation factor in %.
, press enter and select the individual
•
•
•
•
•
•
•
•
•
•
•
•
The RT60 reverberation time measurement is completed.

85
Reverberation Time RT60
Error Indications
Various error indications are displayed for unsuccessful RT60
measurements. Corrupt cycles can be deleted individually.
These results are then excluded from the average calculations.
LOW LEVL•
This is the abbreviation of “low test signal level” during the
measurement. Increase the test signal level until the black
level markers exceed the grey level markers in every frequency band. Also, ensure that the level falls below the grey
level markers, otherwise use a RT60 test signal with longer
on/off times.
T>18S •
The measured reverberation time exceeds the time limit of
18 seconds. This is commonly caused by either an incorrect
analyzer range setting or environmental noise. In the first
case, choose another range setting. In the second case, ensure that the environmental noise remains constant during
the measurement, and/or SET the level markers again while
the environmental noise is high.

86
Polarity
Polarity
Polarity measurement is important in matching the left and right
speakers for a good stereo sound image. The polarity function
measures the polarity of cables, single speakers and speaker
cabinets. For testing, use the polarity signal provided on the
NTi Audio Test CD or the Minirator test signal generator.
The polarity of individual speakers or speaker cabinets might
change with the frequency. For example, the mid-range speaker polarity may differ from the woofer polarity within the same
speaker cabinet. Therefore the polarity detailed result page of
the XL2 displays the measured polarity of the individual octave
bands from 125 Hz to 8 kHz. This allows in-depth verification of
the polarity - frequency relationship.
Polarity is a simple test within the very com-•
plex science of signal phasing. Drivers, speakers and crossovers all cause phase shifts of
the audio signal.
The polarity of various speakers within the •
same cabinet may differ by design!
Polarity testing is useful for checking the cor-•
rect wiring of similar speaker systems.
Positive/Negative Result Page
4
1
3
2

87
Polarity
Detailed Result Page
5
6
connected directly to XL2 Analyzer
Polarity result for Minirator
1
Input Selection
Select the signal source as follows:
Select • Signal Source with the rotary wheel
Press enter •
Voice
Note
Mic
XLR
10
Input
to select either
Use the internal voice note microphone of the
XL2 for polarity measurements. This selection
disables the rear speaker.
Measure the acoustic polarity with a measurement microphone. Alternatively, measure the
.
polarity of an electrical signal connected with
9
8
RCA
Input
7
2
Polarity Test Result
an XLR audio cable.
Measure the polarity of an electrical signal connected with an RCA audio cable.
Displays either POSITIVE, NEGATIVE or ??? (=undefined).
For further visual indication, the limit button
illuminates
green for POSITIVE and red for NEGATIVE polarity.
3
Level RMS
Measures the absolute level of the input signal. The unit’s
dBu, dBV and V are selectable.

88
Polarity
4
Balance Indicator
Indication of the audio signal balance between pin 2 and 3
on the XLR input for input signals > -34 dBu.
The input signal is balanced.
The signal is unbalanced. The level of pin 2 is
higher than pin 3.
The signal is unbalanced. The level of pin 3 is
higher than pin 2.
5
Relative Level Indicator
The grey area shows the measured signal energy within
the individual frequency bands. The bands with the biggest
energy have the most effect on the actual displayed POSI-
TIVE / NEGATIVE polarity result.
6
Polarity Indication
olarity of frequency band is positive. The polarity re-
+ P
sult is in the upper display area; the + area.
- Polarity of frequency band is negative. The polarity
result is in the lower display area; the - area.
7
X-Axis
Seven octave bands with center frequencies from
125 Hz to 8 kHz. SUB displays the polarity of Sub-woofers;
frequency range < 100 Hz.
8
Negative Polarity Area
Measurement results area with negative polarity (-). The
black line in the middle of relative level indicator
5
displays
the measured polarity of the individual frequency band. The
dashed line indicates the lower limit of the measurement
result area.
9
Uncertain Polarity Area ???
Polarity results for frequency bands in this area are uncertain. Therefore the polarity result ??? is displayed.
10
Positive Polarity Area
Measurement results area with positive polarity (+). The
black line in the middle of relative level indicator
5
displays
the measured polarity of the individual frequency band. The
dashed line indicates the upper limit of the measurement
result area.

89
Polarity
Polarity Measurement - Getting Started
For acoustic polarity measurement you can use the internal
voice note microphone, or an external measurement microphone, plugged into the XLR input. The polarity result for left
and right speaker cabinets should match for a good stereo
sound image.
Feed the speaker cabinet with the polarity test signal of the •
Minirator.
Adjust the test level (at Minirator or amplifier) until the test •
signal is clearly heard.
Enable the polarity test signal at the left speaker cabinet; •
mute the right speaker cabinet.
To activate the internal microphone, select • Signal Source
with the rotary wheel
enter
Measure the polarity of the left speaker cabinet and save the •
screenshot in the memory menu
Enable the polarity test signal at the right speaker cabinet; •
mute the left speaker cabinet.
Measure the polarity of the right speaker cabinet.•
Compare the polarity test result of both speaker cabinets. •
.
The polarity measurement is completed.
and choose Voice Note Mic with
.
The sample result shows the polarity as:
Sub-woofer: Low energy, no sub installed•
Woofer: Positive•
Mid-range: Negative•
Tweeter: Positive (with small levels) •
The major part of the signal energy is measured
in the mid-range frequency bands. Therefore
the overall displayed polarity is NEGATIVE.
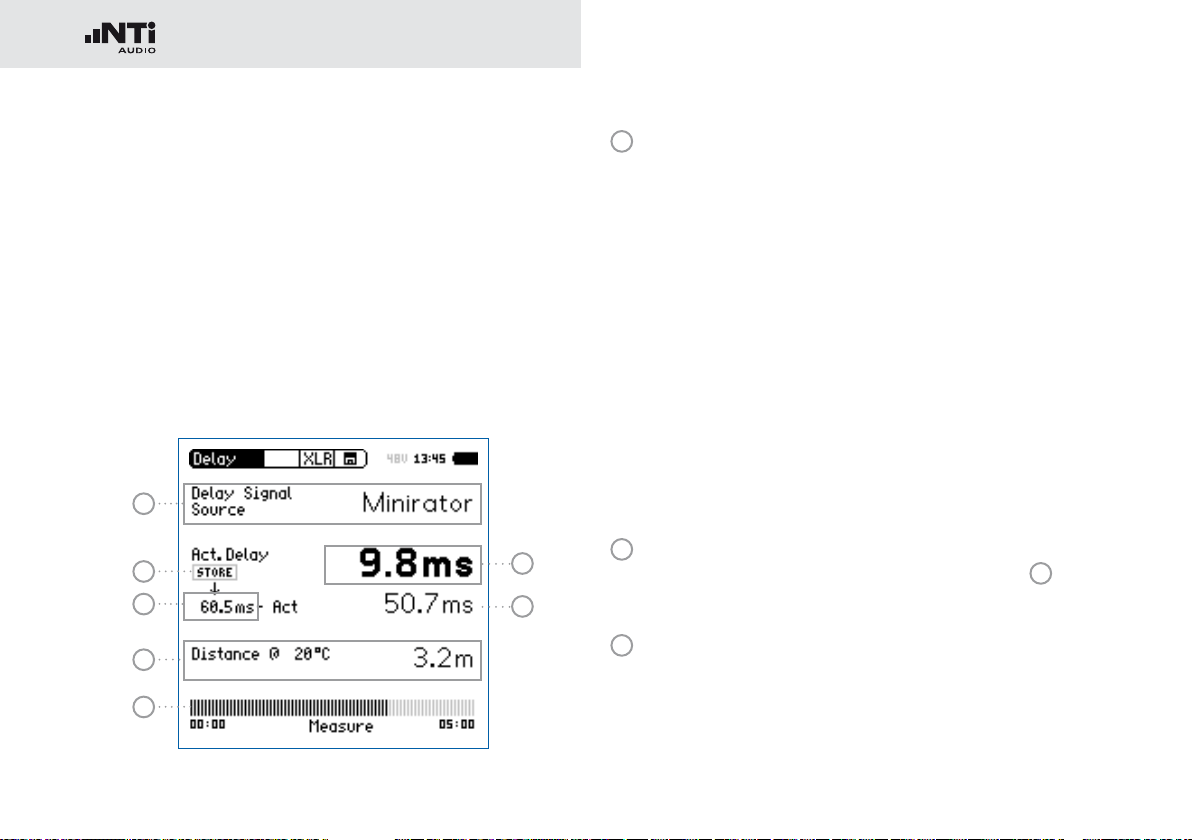
90
Delay Time
Delay Time
The delay time measurement function is suitable for accurate
configuration of delay line setups, by optimizing the directionality of the signal source. The XL2 measures the delay time
between the reference signal and the acoustic signal from the
speaker. The acoustic delay settings are displayed, allowing you
to easily set the measured delay time into the delay device in
the rack. The NTi Audio delay time test signal is provided either
by the Minirator MR-PRO, MR2 or the Test CD included with
the XL2.
1
2
3
4
5
7
6
1
Delay Signal Source
Select the signal source for the delay measurement:
CD Player Using the supplied NTi Audio Test CD; this
setting implies the synchronization time
bar is set to 100 seconds = 1 min. 40 sec.;
after 100 seconds the XL2 has to be synchronized to the delay test signal again.
Minirator The Minirator MR-PRO and MR2 provides
a more reliable test signal source than a
CD player. Therefore the XL2 offers an extended time range without synchronization.
Only after 300 seconds (5 minutes) does
the XL2 have to be synchronized to the delay test signal again.
2
Store Button
Press the store button to record the actual delay
reference speaker.
3
Reference Delay Time
Individually-stored delay time of reference speaker.
7
of the

91
Delay Time
4
Calculated Distance
Distance from measurement position to speaker in meters
or feet, based on the defined temperature in °C or °F
5
Synchronization Time Bar
The automated synchronization allows delay time measurements without any connected electrical reference signal for
100 seconds using the NTi Audio Test CD or 300 seconds
using the Minirator, MR2 or MR-PRO. It displays the time
remaining until the next required synchronization.
6
Calculated Delay Time: Store - Actual
Calculated difference between delay time of speaker A and
speaker B as shown on the next page. The automated difference calculation simplifies the verification of delay line
arrangements, such as those used in larger halls or auditoriums.
7
Actual Delay
Actual measured delay time referring to the electrical reference signal.
Delay Test utilizes VoiceNote Microphone
The XL2 uses the internal VoiceNote microphone to measure the acoustic delay. Do not
connect any measurement microphone to the
XL2 for the delay time measurement.
Rear Speaker
The rear speaker on the XL2 is disabled during
delay measurements, thereby avoiding measurement failures. The headphone output is active.

92
Delay Time
Delay Measurement - Getting Started
The delay time measurement is conducted between the synchronized electrical input signal and the acoustic signal measured by the built-in voice note microphone. In this example,
the delay between speakers A and B in the illustrated auditorium is measured.
speaker A
front left
lecturer
speaker B
sub left
measurement
position
speaker
front right
speaker
sub right
Test Preparations
Prepare the delay test signal; use either the•
NTi Audio Test CD•
NTi Audio Minirator for analog systems •
NTi Audio Digirator for digital or Dolby/DTS systems•
Start the delay test signal.•
Connect the generated delay test signal with an audio cable •
to the RCA or XLR input of the XL2, e.g. take the reference
signal from an auxiliary channel of a mixing console.
Select XLR or RCA input in the upper XL2 menu•
Set the actual environment temperature, to ensure that the •
distance is displayed correctly later.

93
Delay Time
Wait until the XL2 synchronizes to the incoming delay test •
signal, then the synchronization time bar fills up.
Disconnect the audio cable, with the synchronizing signal, •
from the XL2, allowing you to move around freely for the
delay measurement. When selecting Minirator as the delay
signal source, the XL2 has to be synchronized to the signal
source again after 5 minutes. When selecting CD Player as
the delay signal source, the XL2 has to be synchronized to
the signal source every 100 seconds.
Measure Reference Speaker A
Start the delay test signal at speaker A, mute speaker B.•
Position yourself with the XL2 at the measurement position •
next to speaker B sub left as indicated above. This is the
worst-case position in the auditorium with regard to acoustic
delay in the sound field. The XL2 uses the VoiceNote microphone for the delay test; do not connect any measurement
microphone.
The XL2 measures the delay time of speaker A in reference
to the electrical input signal in milliseconds.
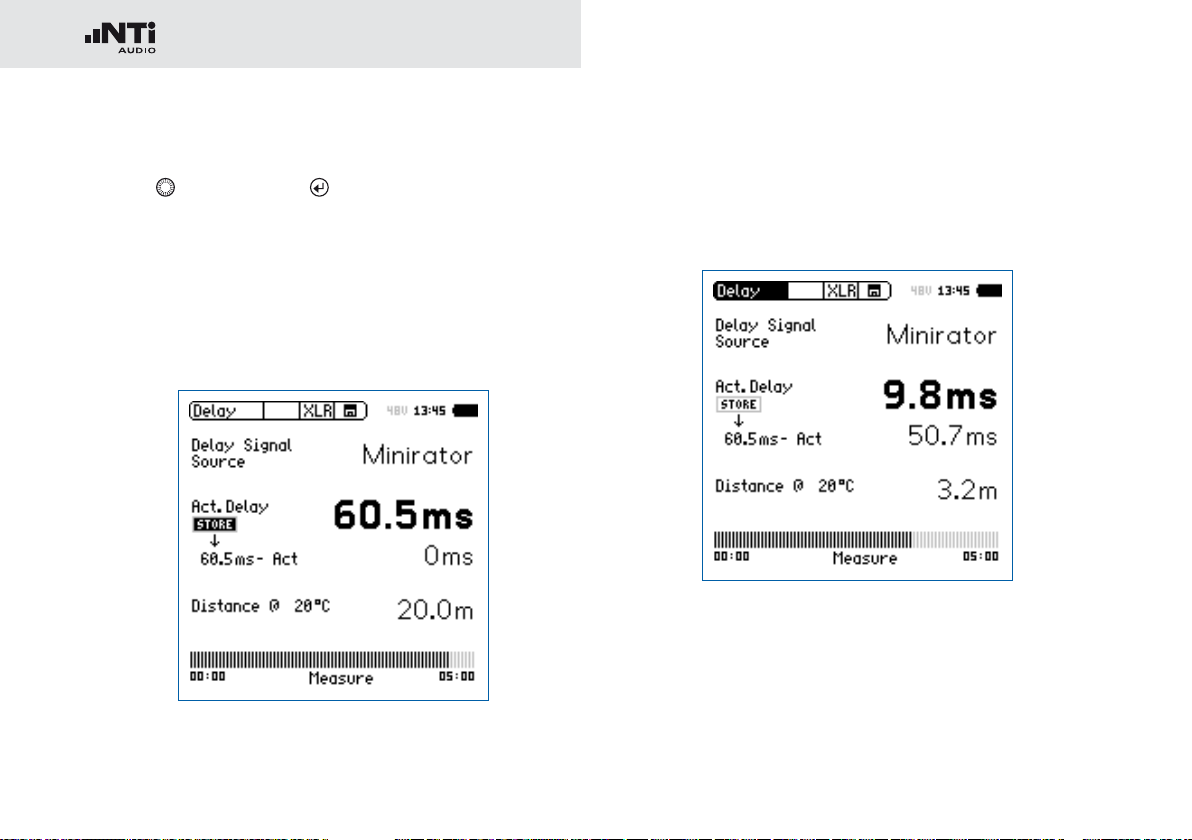
94
Delay Time
Store Reference
Select the displayed • 0.0 ms below Act. Delay with the rotary
wheel
and press enter .
The reference result of speaker A is stored for the differ-
ence calculation of delay A - B.
Stop the delay test signal at speaker A.•
Measure Sub Speaker B
Start the delay test signal at speaker B. Mute speaker A.•
Position yourself with the XL2 at the shown measurement •
position. The XL2 uses the VoiceNote microphone for the delay test; do not connect any measurement microphone.
The XL2 measures the delay time of speaker B in reference
to the electrical input signal in milliseconds.
95
Delay Time
Automated Difference Calculation
The delay time difference between speaker A and B is •
automatically calculated and shown below the Act. Delay
result.
The delay time is measured.
Delay Test utilizes VoiceNote Microphone
The XL2 uses the internal VoiceNote microphone to measure the acoustic delay. Do not
connect any measurement microphone to the
XL2 for the delay time measurement.
Measurement Position
Do not position the XL2 too close to reflecting
surfaces, such as walls or floors. The reflections
are likely to prevent accurate measurements.
Result Interpretation
The resulting time in milliseconds shows •
the time difference of the sound signal from
speaker A and B arriving at the measurement
position. Speaker B has to be delayed by the
displayed difference result.
To optimize directionality, add a further 5 ms •
to the calculated difference. The main signal
from speaker A then arrives at the measurement position first. The acoustic signal from
sub speaker B arrives 5 ms later. This improves the subjective directionality perception of the listeners.
Distance in meter/feet
The distance results in meter/feet are displayed
below for easy verification of the test results
accuracy. The readings are based on 330 m/s
sound speed at 0°C / 32°F.

96
1/12 Octave + Tolerance
1/12 Octave + Tolerance (optional)
The Spectral Limits Option extends the XL2 function range
with an RTA analyzer with spectral resolutions from 1/1 octave
down to 1/12th octave. Trace capturing, relative curve display
and comprehensive tolerance handling are supported in the
FFT Analysis and the high resolution 1/12 Oct + Tol spectral
analysis.
Features
High resolution RTA function “1/12 Oct + Tol” with select-•
able 1/1, 1/3, 1/6 and 1/12 octave spectral resolution
Capturing of multiple readings into the internal memory •
Comparing measurement results against captures with rela-•
tive or absolute curve display
Comprehensive tolerance handling with tolerance masks •
based on captures for passed/failed measurements
Export and import of tolerance and capture files•
Frequency band listening at rear speaker•
Applications
PA-rental: Verifying the frequency response of returned •
speakers and microphones against reference records ensuring they are back in stock in good working condition.
Industrial quality testing: Passed/Failed test in the production •
line or during service of any audible quality criteria, such as
with motors, machines, vacuum cleaners, ...
Cinema: Comparing frequency responses against an ideal •
response curve according the X-Curve requirements.
Tolerance Handling
The XL2 Analyzer compares spectral measurements against a
tolerance band and visualizes exceptions in every frequency
band. The passed/failed condition is further visualized by the
limit button
ment in order to drive an external alarm device such the accessory SPL Stack Light.
Tolerance curves can either be imported from txt-files or directly derived from captured measurements. The XL2 calculates
tolerance bands based on
Single captured results•
Manually generated txt-files on the PC•
Mean average of multiple captures•
Min/Max curves of multiple captures•
and forwarded to the I/O interface of the instru-

97
1/12 Octave + Tolerance
1
Result Symbols / Capture & Start Tolerance Mode
This field offers two functions:
13
14
Upper parameter displayed as line.
Symbols for measurement results •
2
1
2
12
11
Lower parameter displayed as bargraph.
Capture & Start Tolerance Mode•
3
10
4
The displayed spectral readings may be captured in C1
- C8 for
Comparing measurement results against captures •
with relative or absolute curve display.
Creating tolerance masks based on captures for •
passed / failed measurements.
Capture EQ Capt
ures the upper parameter
5 7
6
9
8
Capture Live Captures the lower parameter

98
1/12 Octave + Tolerance
Manage
captures
Allows to rename captures, clear recorded captures, save captures to SDCard for export from the XL2 or load
captures from SD-Card for import to
the XL2.
Start tolerance
mode
Starts the tolerance mode for passed/
failed measurements comparing the
actual measurement results against a
tolerance band.
2
Measurement Result
Actual level result of the indicated frequency band. The cursor readout displays the center frequency and the level of
the band indicated by the arrow.
Upper parameter displayed as line.
Lower parameter displayed as bargraph.
3
Y-Scale setting
Select the Y-Axis with the rotary wheel •
with enter
.
and confirm
Select the zoom factor between • 20, 10, 5, 2.5 dB/div
and confirm with enter
.
Scroll up and down with the rotary wheel • to select the
Y-axis range.
Confirm with enter •
4
Spectral Measurement Result
.
Spectral results in 1/1, 1/3, 1/6 or 1/12 octave band resolution. Adjust the resolution at
12
.

99
1/12 Octave + Tolerance
5
Input Range
The XL2 Analyzer provides three input ranges to accommodate the wide range of input signals. The individual ranges are based on the microphone sensitivity setting in the
calibration menu of the XL2. For example at a sensitivity
S=20mV/Pa the input ranges are
Lower range: 10 - 110 dBSPL•
Middle range: 30 - 130 dBSPL•
Upper range: 50 - 150 dBSPL•
Select the lowest possible input range according to the
maximum level expected during the measurement; e.g., if
the sound pressure will be always below 110 dBSPL, then
select the lowest input range 10 - 110 dBSPL.
6
Time Weighting
Offers selectable time weighting of 0.1, 0.2, 0.5, 1.0 second
as well FAST (125 ms) and SLOW (1 second). Applications:
Short Time
W
eighting
Long Time
Weighting
High resolution in time with minimum
averaging
Low resolution in time with longer averaging
7
Run Indication
The run indication shows the measurement status running,
paused or stopped. Various measurement settings are
locked during ongoing measurements, such as changing
the input ranging or the preset measurement time.
For passed/failed measurements with the Spectral Limits
option the run indication may display A for a preset automated level trigger.
8
Actual Measurement Time
Counts actual measurement time in hrs:min:sec. Supports
setting of time modes: continuous and single.
Timer Mode Continuous
(applicable for standard measurements)
All values are recorded and monitored continuously after starting a measurement with start
The actual measurement time is shown.
Timer Mode Single
Automatically stops the measurement after the
pre-set measurement time.
Set the required measurement time.•
Start the measurement •
.
.

100
1/12 Octave + Tolerance
9
Preset Measurement Time
Adjustment of preset measurement time for single timer
setting.
10
Broadband Results
User-selectable display of broadband results:
Broadband A A-weighted level
Broadband C C-weighted level
Broadband Z without any frequency weighting
- none
Sum of
bands
Sum of displayed frequency bands (only
available when #HideUnusedBands is
set to True within the tolerance file)
11
Readout Frequency
You may select any frequency to read out individual levels.
The selected frequency is indicated by the cursor arrow.
Choose between the following settings:
The cursor follows automatically the highest level,
e.g. tracing feedback frequencies at live sound.
Select the frequency with the rotary wheel •
Press enter •
You may readout any individual frequency.•
Return to auto frequency with enter •
.
.
The cursor returns to the frequency with high-
est level bar.
The cursor read out may be set manually to any
frequency band or wideband level. The read out remains at the selected frequency.
Select the frequency with the rotary wheel •
Press enter •
Select the frequency of interest.•
Confirm with enter •
The cursor readout
ment results of the selected frequency band.
.
.
2
displays the measure-
.
.
 Loading...