

Page 1
User Manual
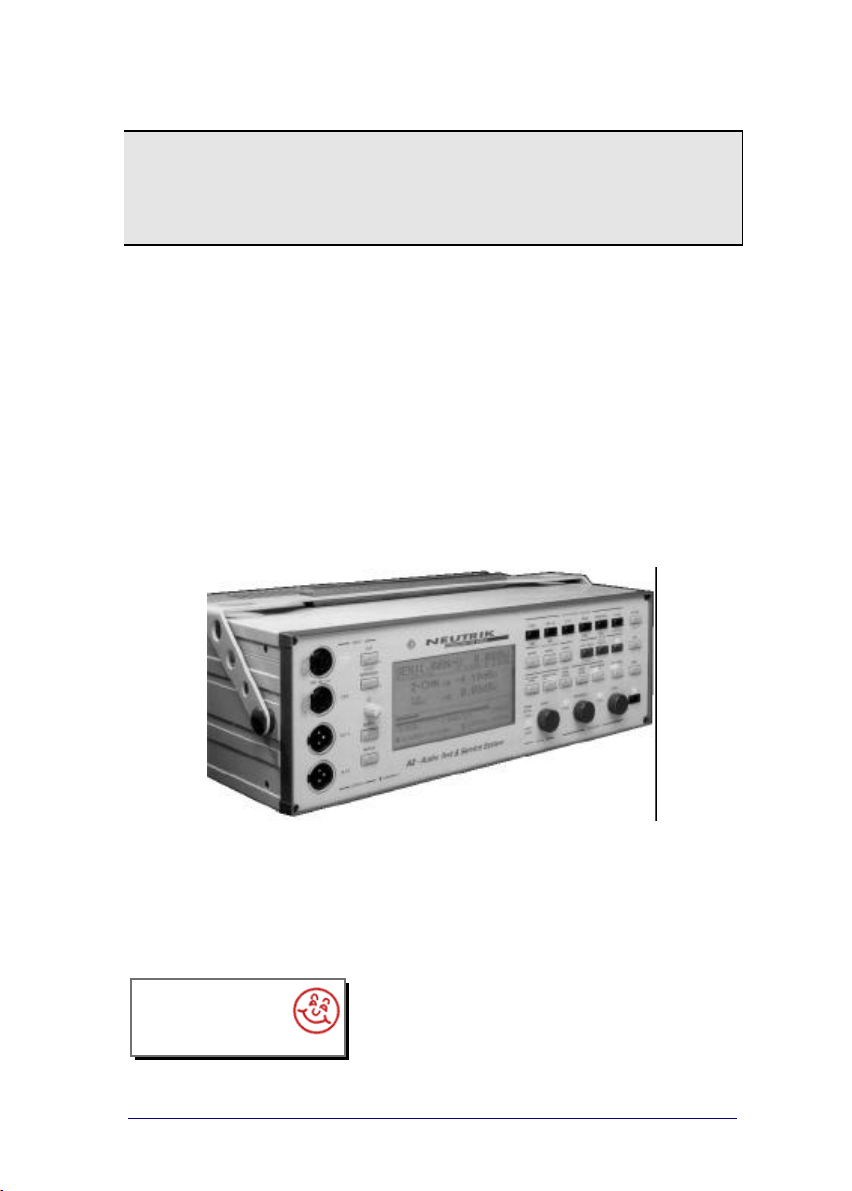
A2
Audio Test & Measurement System
interstage
Phistersvej 31, 2900 Hellerup, Danmark
Telefon 3946 0000, fax 3946 0040
www.interstage.dk
- pro audio with a smile
V
3.1 / July '01 / Ben
N:\A2Proj\#Manuals\User Manual\English\a2um_31e_nti.doc
Test & Measurement System
Version 3.1E
A2 firmware V2.0 or higher
Page 2

User Manual A2 Audio Test & Measurement System
2 / 104 V3.1
Page 3

A2 Audio Test & Measurement System User Manual
CE DECLARATION OF CONFORMITY
We, the manufacturer
hereby declare that the product
Product Name Audio Test & Service System
Model Number A2
Year of Construction 1995
conforms to the following standards or other normative documents
EC-Rules 89/392, 91/368, 93/44, 93/68, 73/23, 89/336, 92/31
Harmonized Standards IEC 65, IEC 68-2-31, IEC 348
EN50081-1, EN50082-1, EN50140, EN 61010-1
This declaration becomes void in case of any changes on the product without written
authorization by NTI.
Date Schaan, 28. 02. 1995
Signature
Position of Signatory Product Manager Test Instruments
Principality of Liechtenstein, Europe
Samples of this instrument have been tested and found to
conform with the statutory protective requirements. Instruments of
this type thus meet all requirements to be given the CE mark.
NTI AG
Im alten Riet 102
FL - 9494 Schaan
V3.1 3 / 104
Page 4

User Manual A2 Audio Test & Measurement System
4 / 104 V3.1
Page 5

A2 Audio Test & Measurement System User Manual
INTERNATIONAL WARRANTY
Limited Warranty
NTI guarantees the A2/A2 -D Audio Test & Service System and its components against
defects in material or workmanship for a period of one year from the date of original
purchase, and agrees to repair or to replace any defective unit at no cost for either parts or
labour during this period.
Restrictions
This warranty does not cover damages that have resulted of accidents, misuse, lack of care,
the attachment or installation of any components that were not provided with the product,
loss of parts or connecting the instrument to any other power supply, input signal voltage or
connector type than specified. In particular, no responsibility is granted for special, incidental,
or consequential damages.
This warranty becomes void if servicing or repairs of the product are performed by any other
party than an authorized service center.
No other warranty, written or oral, is authorized by NTI. Except as otherwise stated in this
warranty, NTI makes no representation or warranty of any kind, expressed or implied in law
or in fact, including, without limitation, merchasing or fitting for any particular purpose and
assumes no liability, either in tort, strict liability, contract or warranty for products.
Note
In case of malfunction, take - or ship prepaid - your NTI A2/A2 -D Audio Test & Service
System, packed in the original packing, to your nearest authorized service center. Be sure to
include a copy of your sales invoice as proof of purchase date. Transit damages are not
covered by this warranty.
Principality of Liechtenstein, Europe
Tel. +423 – 239 6060
Fax +423 – 239 6089
E-mail info@nt-instruments.com
NTI AG
Neutrik Test Instruments
Im alten Riet 102
FL - 9494 Schaan
V3.1 5 / 104
Page 6

User Manual A2 Audio Test & Measurement System
TABLE OF CONTENTS
1. INTRODUCTION ...........................................................................................10
Safety Information ............................................................................................................... 10
Overview.............................................................................................................................. 10
How to use this Manual....................................................................................................... 12
2. INSTALLATION.............................................................................................13
Unpacking............................................................................................................................ 13
Options and Accessories..................................................................................................... 13
Environmental Conditions ................................................................................................... 13
Mains Power Supply....................................................................................................... 13
Printer Connection.......................................................................................................... 14
Interface to PC................................................................................................................ 14
3. GETTING STARTED .....................................................................................15
Measurement Functions ...................................................................................................... 15
Menu Operation...................................................................................................................15
Generator Settings .............................................................................................................. 16
The Display Modes..............................................................................................................16
Sweep Operation............................................................................................................17
The A2/A2-D User Interface................................................................................................18
A2/A2-D Menu Overview.....................................................................................................19
4. A2/A2-D OPERATION .................................................................................21
Input Section........................................................................................................................21
Input Block Diagram........................................................................................................ 22
Input Wiring & Impedances.............................................................................................22
Input / Output Impedance Selection.................................................................................23
Auto / Fixed Range........................................................................................................24
Connection of a Balanced Output to the A2/A2-D.............................................................25
Connection of an Unbalanced Output to the A2/A2-D.......................................................25
Monitor Outputs............................................................................................................... 26
Monitor Loudspeaker......................................................................................................26
Overview.........................................................................................................................26
Output Section..................................................................................................................... 27
Output Circuit.................................................................................................................. 27
Balanced Operation .......................................................................................................28
Unbalanced Operation...................................................................................................28
Optional Transformer Output Stage.................................................................................28
Output Settings ............................................................................................................... 29
Output Parameters.........................................................................................................29
Signal Waveform...........................................................................................................29
Square Signal (Sym. / Asym.).........................................................................................30
IMD TestSig ..................................................................................................................30
Noise............................................................................................................................31
Warbled Sine.................................................................................................................31
Frequency.......................................................................................................................31
Level................................................................................................................................31
Readback........................................................................................................................32
Output Muting.................................................................................................................. 33
Overview.........................................................................................................................33
Display Modes.....................................................................................................................34
METER Display Mode..................................................................................................... 34
6 / 104 V3.1
Page 7

A2 Audio Test & Measurement System User Manual
Generator Settings.........................................................................................................35
Generator Readback......................................................................................................35
Measurement Results ....................................................................................................35
Units.............................................................................................................................35
The Bar-graph ...............................................................................................................36
Zooming the Bar-graph Scale.........................................................................................36
Scrolling the Bar-graph...................................................................................................36
Input Display..................................................................................................................37
Printouts........................................................................................................................37
GRAPH Display Mode....................................................................................................38
Cursor Function.............................................................................................................39
Y-Scaling.......................................................................................................................39
ZOOM...........................................................................................................................39
SCROLL.......................................................................................................................40
X-Scaling.......................................................................................................................40
GRAPH Printouts...........................................................................................................41
Store & Recall Graphs ....................................................................................................41
SCOPE Display Mode..................................................................................................... 42
Printouts........................................................................................................................43
Overview.........................................................................................................................43
5. MEASUREMENT FUNCTIONS .......................................................................44
Level Function ..................................................................................................................... 44
Mono / Stereo Measurements........................................................................................44
Units ................................................................................................................................ 44
Filters............................................................................................................................... 45
Applications..................................................................................................................... 46
Overview.........................................................................................................................46
Level Relative Function....................................................................................................... 47
Filters............................................................................................................................... 47
Units ................................................................................................................................ 48
Application Example.......................................................................................................48
Signal-to-Noise Measurement........................................................................................48
THD+N Function..................................................................................................................49
Notch Filter...................................................................................................................... 50
Additional Filters.............................................................................................................. 50
Units ................................................................................................................................ 50
SINAD Measurement......................................................................................................51
IMD Function.......................................................................................................................52
Standards ........................................................................................................................ 53
Unit.................................................................................................................................. 54
Filters............................................................................................................................... 54
Applications..................................................................................................................... 54
Noise Function.....................................................................................................................55
Units ................................................................................................................................ 55
Filters............................................................................................................................... 55
Applications..................................................................................................................... 56
Noise Relative Function ...................................................................................................... 57
Units ................................................................................................................................ 57
Filters............................................................................................................................... 57
Crosstalk Function...............................................................................................................59
Units ................................................................................................................................ 59
Filters............................................................................................................................... 59
External Source.............................................................................................................60
Level Selective Function..................................................................................................... 61
Filters............................................................................................................................... 61
V3.1 7 / 104
Page 8

User Manual A2 Audio Test & Measurement System
External Source.............................................................................................................62
Units ................................................................................................................................ 62
Applications..................................................................................................................... 62
Wow & Flutter Function....................................................................................................... 63
Standards ........................................................................................................................ 64
W&F Measurements (Replay only).................................................................................64
W & F Measurements (Record to Replay) ..................................................................... 64
W&F Signal Analysis....................................................................................................... 65
Phase Function.................................................................................................................... 66
Applications..................................................................................................................... 66
Filter Overview.....................................................................................................................67
ADDITIONAL Function........................................................................................................67
6. SWEEPS .....................................................................................................68
Preparing a Sweep.............................................................................................................. 68
Selecting the Sweep Mode............................................................................................. 68
Setting the Sweep Limits & Resolution.......................................................................... 69
Performing a Sweep............................................................................................................ 70
Synchronization (Internal / External).............................................................................. 70
Sweep Recording................................................................................................................ 71
Keep a Recorded Trace.................................................................................................. 71
Store & Recall Sweeps...................................................................................................71
Sweep Modes...................................................................................................................... 73
Frequency Sweep........................................................................................................... 73
Y-Axis Units and Scaling................................................................................................73
Re-Scaling of the Frequency Axis ...................................................................................73
Frequency Sweeps in Different Measurement Modes .......................................................74
Graphics Cursor.............................................................................................................74
Tape Sweep.................................................................................................................... 75
Recording a Tape Sweep...............................................................................................75
External Sweep............................................................................................................... 77
Preparing an External Sweep.........................................................................................77
List of Reference CD Tracks ...........................................................................................78
Stepped Sweeps............................................................................................................78
Gliding Sweeps..............................................................................................................78
Amplitude Sweep............................................................................................................ 79
Units of X- / Y-axis.........................................................................................................79
Time Sweep .................................................................................................................... 80
Table Sweep................................................................................................................... 81
Sweep Data Upload to a PC............................................................................................... 81
7. PRINTOUTS.................................................................................................82
Printer Driver Selection........................................................................................................ 82
Printer Settings....................................................................................................................83
EPSON FX-80, IBM Proprinter .......................................................................................83
EPSON LQ-550 / LQ-1050............................................................................................. 83
hp Laserjet, Deskjet........................................................................................................ 83
Printer Error......................................................................................................................... 83
8. INSTRUMENT SETUP ...................................................................................85
Store & Recall Setups ......................................................................................................... 85
Calibration............................................................................................................................ 85
Connector Pin Assignment.................................................................................................. 87
Centronics Connector..................................................................................................... 87
8 / 104 V3.1
Page 9

A2 Audio Test & Measurement System User Manual
Timing Diagram .............................................................................................................87
RS232 Connector...........................................................................................................87
Cable............................................................................................................................88
9. OPTIONS & ACCESSORIES..........................................................................89
Options Overview................................................................................................................ 89
RS232 Serial Interface (AO1 / AO16).............................................................................90
Baudrate Selection.........................................................................................................90
Filter Options................................................................................................................... 91
A-Weighting Filter (AO4).................................................................................................91
User Filter (AO5)............................................................................................................92
C-Message Filter (AO13)................................................................................................93
80kHz Lowpass Filter (AO14) .........................................................................................94
Transformer Option (AO7).............................................................................................. 95
Phantom Power (AO8)....................................................................................................95
Accessories Overview.........................................................................................................95
10. TECHNICAL SPECIFICATIONS ......................................................................96
Analog Generator................................................................................................................ 96
Digital Generator ................................................................................................................. 96
Sweep Function...................................................................................................................96
Analog Analyzer................................................................................................................... 96
Digital Analyzer.................................................................................................................... 97
Level Function ..................................................................................................................... 97
Total Harmonic Distortion (THD + N)..................................................................................97
Phase................................................................................................................................... 97
IMD ...................................................................................................................................... 97
Crosstalk / Level Selective .................................................................................................. 98
Noise.................................................................................................................................... 98
Wow & Flutter Function....................................................................................................... 98
Drift ...................................................................................................................................... 98
Frequency Function............................................................................................................. 98
Scope Function.................................................................................................................... 98
Filters ................................................................................................................................... 99
Display (of A2/A2-D)............................................................................................................ 99
Interfaces.............................................................................................................................99
General Data ....................................................................................................................... 99
11. INDEX........................................................................................................100
V3.1 9 / 104
Page 10

User Manual A2 Audio Test & Measurement System
1. INTRODUCTION
Safety Information
Please read this safety information thoroughly before starting to operate the A2.
• The NTI A2/A2-D Audio Test & Measurement System was designed to be connected to a
specified mains power source with safety grounding through an approved three -wire
mains power cable.
NEVER operate the instrument with missing or compromised
• To avoid fire hazard, the mains power fuse of the A2/A2-D must be replaced in case of
failure by a fuse with the correct rating (see chapter 2. Installation).
• For safety reasons never apply voltages higher than 200V
measurement inputs of the A2. Voltages higher than that may permanently destroy the
internal electronics.
• There are no parts inside the instrument that may be repaired or replaced by the user.
Therefore, never open the unit for any reason.
Do not try to service the instrument unless properly qualified.
safety ground connection.
or 300Vp to the
RMS
Overview
The NTI A2 is a comprehensive, high performance two -channel audio test set. It includes a
flexible generator, based on a Digital Signal Processor (DSP) and a high performance
analyzer providing a wide variety of measurement functions, as there are
• Level absolute (two-channel) in µV, mV, V, dBV and dBu or dBm
• Level relative in *1, % and dBr
• Level selective in µV, mV, V, dBV and dBu / dBm
• Total harmonic distortion & noise (THD+N) in % and dB
• IMD (Intermodulation distortion) in % and dB
• Wow & Flutter in %
• Noise (absolute), weighted and unweighted, in µVq, mVq, Vq and dBq
• Noise (relative), weighted and unweighted, in *1, % and dBr
• Crosstalk (frequency selective) in *1, % and dBr
• Frequency (two channels simultaneously)
• Phase (interchannel) in the range of ±180°.
In the METER display mode, all measurement results are displayed in numerical form as
large digits and in analog form through a bar-graph. Additional parameters like the I/Ofrequencies and impedances, the input levels and the generator settings are permantly
shown.
10 / 104 V3.1
Page 11

A2 Audio Test & Measurement System User Manual
The standard sweep capabilities of the A2/A2-D allow to perform
• Frequency sweeps
• Amplitude Sweeps
• Time Sweeps
• Table sweeps with freely definable pairs of frequency and level (with Option AO1)
Sweeps can be controlled by the built-in generator or by an external source (e.g. test tapes,
test CDs or other NTI A-series instruments) at a remote location. Several traces can be
recorded and displayed in the GRAPH mode, while up to four complete graphs may be
stored in the internal non-volatile memory of the A2/A2-D. This allows for instance to record
swept measurements in a studio and to print out the results in the office later.
Another powerful diagnostic aid of the A2 is the SCOPE function. In this mode, the waveform
of both input channels is shown on the LC-display just like on a dual trace oscilloscope. If set
to the THD+N function, the A2/A2-D shows both the original signal and the distortion
residual. In other measurement functions, the main input signal is shown as a single trace.
All measurements of level - except noise - are true RMS rectified. Noise is measured as
quasi-peak value according to the CCIR 468-3 standard. Both a 400Hz high -pass and a
22Hz-22kHz band-pass filter are available as a standard.
The two inputs of the A2/A2-D are DC -isolated up to ±300Vp, and equipped with selectable
input impedances to optimally match the output impedance of the device under test (DUT).
As an option, both inputs may also be Phantom-powered.
The normalized input signals are available at the BNC connectors at the rear panel of the
instrument. A small, built-in loudspeaker allows acoustical monitoring of the measured signal.
The versatile generator of the A2/A2-D, based on a Digital Signal Processor, is capable of
generating a large number of different test signals over the full level & frequency range.
• Low distortion pure sine signal
• Low distortion warbled sine
• Dual-tone IMD signal, covering all standards
• Symmetric square wave (50:50 duty cycle)
• Asymmetric square wave (40:60 duty cycle for phase reverse check)
• White noise
• Pink noise
The output impedance (<15Ω up to 600Ω) can be adjusted in a wide range as well in order to
match the input impedance of the device to be tested.
As an option, a RS-232 serial or IEEE-488 parallel interface may be installed into the
instrument to remote control all A2/A2-D features from a PC.
Regardless of the type of interface, AS04, a comprehensive Windows based software
package is included, supporting all operation modes, offering the possibility to store all
results, and allowing to write program sequences in the easy-to-learn Audio Measurement
Sequence Language (AMSL) for fully automatic measurements.
V3.1 11 / 104
Page 12

User Manual A2 Audio Test & Measurement System
How to use this Manual
This User Manual has been written to serve as a complete reference document for using the
A2/A2-D as a solution for your measurement requirements. Maintenance procedures, such
as installation of the instrument, are placed at the beginning while not so frequently required
tasks such as re-calibration are filed at the end of the manual.
The best way to familiarize with the instrument is to place the A2/A2-D in front of you and to
read through the chapters 2. Installation and 3. Getting Started. This way, it won't take long to
feel at ease with the instrument and its many features.
Do not operate the instrument without reading through the chapter
2. Installation. Important information about mains voltage selection and fuse
rating is given therein.
12 / 104 V3.1
Page 13

A2 Audio Test & Measurement System User Manual
1
0
2. INSTALLATION
Unpacking
Your new A2/A2-D comes along together with some accessories. Please check whether all
of the following items are enclosed.
• A2/A2D Audio Test & Service System
• Mains power cable
• Spare fuse for 110VAC
• A pair of rack-mount wings
• This User Manual.
It is strongly recommended to save the original cardboard box for the case that it ever
becomes necessary to ship the A2/A2-D. Never ship the instrument in a box not properly
protecting the unit against mechanical shock, since the NTI warranty does not cover
damages caused by improper packing.
Options and Accessories
Besides the wide range of already built-in features of the A2/A2-D, there are some optional
items available for the A2/A2-D as listed in chapter 8. Instrument Setup. Please ask your local
NTI agency for further details.
Environmental Conditions
The A2/A2D test system will operate in accordance with its specifi cations as long as the environmental conditions are kept within the following ranges.
Temperature 5°-45° Celsius
Humidity 10 -90% non condensing
Mains Power Supply
After having unpacked the unit, it is first necessary to connect the system to the AC mains
power of your country. For this purpose, the enclosed mains power cable has an unconnected end with three colored leads, corresponding to
Brown = Live
Blue = Ground
Green/Yellow = Earth
Attach a mains plug to this end of the cable, fitting to the receptacles of your area. Next,
make sure that the mains power voltage matches the power selection that is shown on the
mains power connector/fuse holder assembly on the rear panel of the A2/A2-D. If this selection is incompatible with the available power source, go through the following paragraph to
adjust the mains power requirements.
The A2/A2-D2 can operate from 100VAC, 120VAC, 230VAC or 240VAC. To configure the
input line voltage of the A2/A2-D, remove the mains cable and open the flap of the
connector/fuse holder assembly at the rear panle of the A2/A2-D by pressing a small
screwdriver into the slot on the top or ruin your fingernails.
V3.1 13 / 104
Page 14
User Manual A2 Audio Test & Measurement System
1
0
Take out the drum and insert it in the new, required position.
The label pointing towards the operator indicates the selected
line voltage.
At the same time, insert a new fuse with the proper current
rating must. For 100VAC and120VAC, a 2A fuse has to be
used, while for 230VAC and 240VAC a 1A fuse is required.
After having set the required line voltage and installation of the
proper fuse, close the flap and insert the power cable.
The A2/A2-D is designed to be connected to protective ground (earth) through the ground
wire in the power cable. This connection is essential for safe operation.
NEVER operate the instrument if the safety ground connection is not available or
has been compromised.
Printer Connection
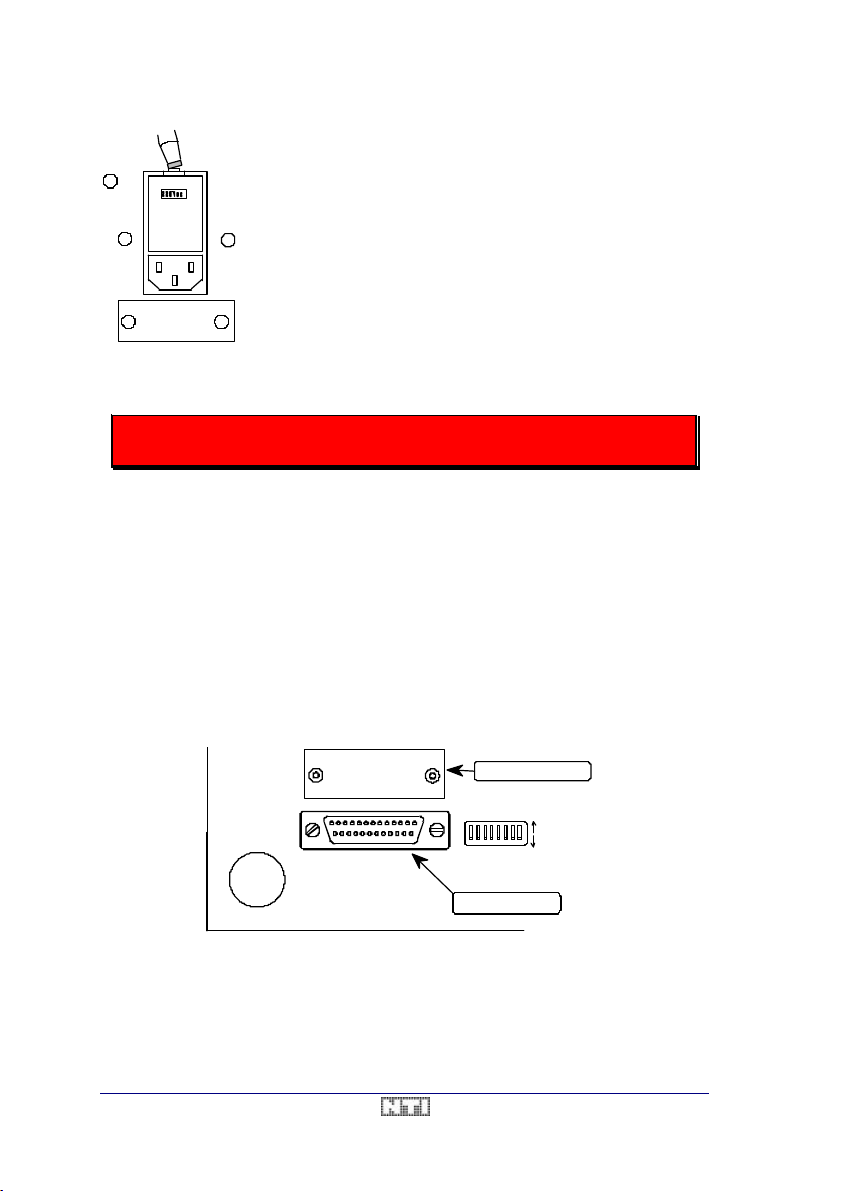
The CENTRONICS printer connector is located at the rear panel of the A2/A2 -D. It is a 25pin female D-type connector - the same as installed in a standard PC.
To select the required printer driver, please refer to the chapter 7. Printouts. The appendix
describes in detail the pin assignment and the timing of the CENTRONICS port.
Interface to PC
Connection The RS232C serial or IEEE-488 parallel interface is available as an option
together with the software package AS04 to control the A2/A2-D as a remote unit. As long as
this interface is not installed, the hole for the connector is covered with a blanking plate.
Both interface types can be upgraded at a later time by inserting a sub circuit. Please refer to
the chapter 8. Instrument Setup for more detailed information.
RS 232 / IEEE (optional)
0 1 2 3 4 5 6 7
Centronics Printer Port
Fig. 1 Rear Panel Interface Connectors
14 / 104 V3.1
Page 15

A2 Audio Test & Measurement System User Manual
. To confirm the chosen entry,
(« »)
3. GETTING STARTED
Read this chapter carefully to become familiar with the operation of the A2/A2-D.
Further details are filed in the following chapters.
The NTI A2/A2-D system is very easy to operate, despite its large number of functions and
the variety of options & settings. Since the user interface is arranged in logical blocks and
every key correlated to a certain function, operation of the unit is virtually self-explaining.
Nevertheless, regardless of the keys that are pressed, the internal logic of the system takes
care that every measurement is done according to the specified standards.
Measurement Functions
The measurement-related keys are arranged on the top row of the right hand side of the
A2/A2-D keyboard. Any measurement function may be selected at any time by pressing the
respective key.
Fig. 2 Measurement Function Keys
Some of the keys provide two selections, thus allowing to select another related
measurement (e.g. <THD+N> and <IMD>). To activate the second function, simply press the
key once more and the measurement mode will toggle. The actually selected function is
permanently displayed.
Menu Operation
To allow the user to activate a special option or setup, several menus may be opened by
double-clicking any of the keys marked with a capital "M" in the bottom right (see p. 19).
As soon as the menu is open, a list of selections appears,
with the currently active selection being displayed in inverted
characters.
In this example, by double-clicking the <GEN SIGNAL> key,
the Alt. Signal menu appears.
To change the actual setting, the small triangle arrow on the
left hand side may be moved to any entry of the menu by
turning the <SCALE> wheel
press the <SCALE> wheel once.
If a new selection has been confirmed, the menu will be
closed. Alternatively, leave the menu through the EXIT entry
or by prressing any key.
V3.1 15 / 104
Page 16
User Manual A2 Audio Test & Measurement System
(« »)
NOTE While a menu is open, any other keypress than to the <SCALE> wheel
will close the menu and execute the new command.
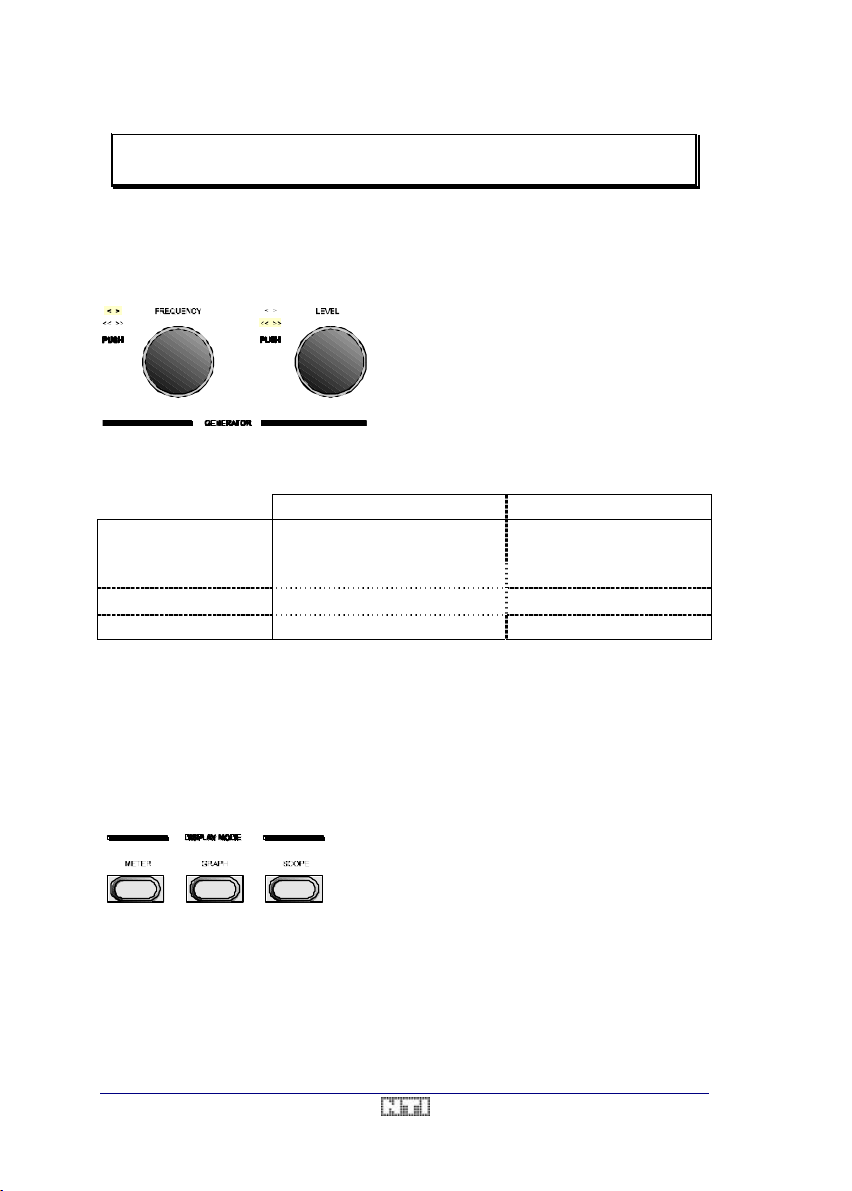
Generator Settings
The generator output frequency & level can be selected by the two softwheels labeled with
<FREQUENCY> and <LEVEL>.
By turning the <FREQUENCY> or <LEVEL> wheels slowly or quickly, the width of the step
up/down to the next value may be small or large as listed in Table 1.
<FREQUENCY> <LEVEL>
Coarse mode, quick turn 10Hz - 20Hz - 100Hz - 1kHz -
10kHz - 40kHz - 100kHz
Coarse mode, slow turn ± 12.5% ± 2dB / ± 25.9%
Fine mode, quick turn 3rd-octave steps ± 2dB / ∼ factor 2
Fine mode, slow turn ± 0.5% ± 0.04dB / ± 0.5%
Furthermore, the two generator outputs A and B can be muted by pressing the respective
<MUTE> keys. Otherwise, i.e. if they are muted, both outputs are permanently active.
Neither frequency nor level can be changed
continuously - as with a poti-controlled analog
generator - but in discrete steps only.
By pushing the softwheel once, the stepwidth
toggles between fine (< >) and coarse
mode. The actual selection is indicated by a lit
LED behind the corresponding sign.
Table 1 Softwheel Steps
± 20dB (logarithmic units)
or factor 10 (linear units)
The Display Modes
With the three DISPLAY MODE keys, the user may select one of the available modes, regardless of the actual measurement function.
All these modes can be selected at any time without affecting the actual measurement (e.g.
also during a running sweep).
To increase the lifetime of the backlight of the LC-display, it is automatically switched Off if
no key or wheel on the instrument is used for several minutes. However, any keypress immediately re-lights the illumination.
• The METER mode displays the single results together with all additional measurement parameters.
• Sweeps may be displayed in the GRAPH mode.
• The SCOPE mode shows the waveform of the
input signal in the time domain.
16 / 104 V3.1
Page 17
A2 Audio Test & Measurement System User Manual
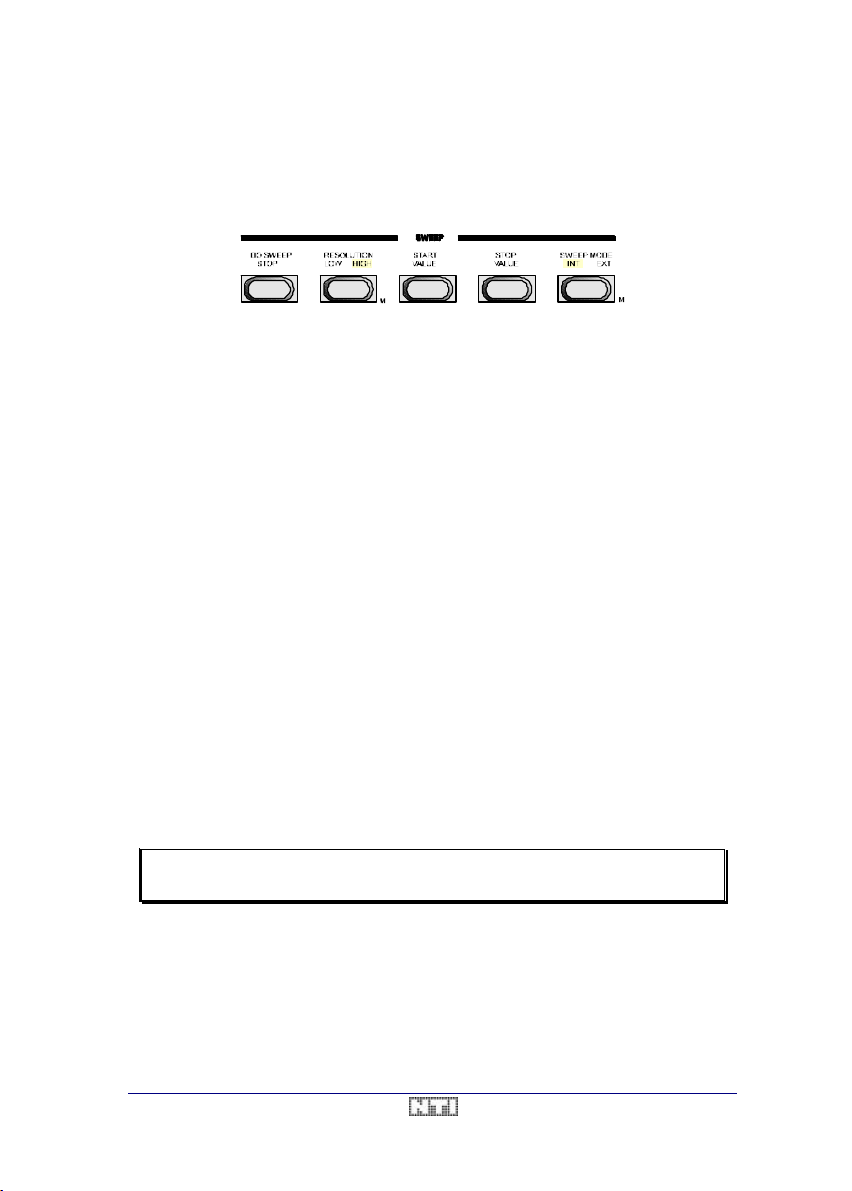
Sweep Operation
Sweeps are best performed in the display mode GRAPH, that continuously displays the
setup parameters and the recorded curve(s) on the LCD.
The specific sweep setup may be selected through the keys of the SWEEP block.
Fig. 3 SWEEP Block
Basically, there are 5 sweep modes available, that can be called through the menu behind
the key <SWEEP MODE>.
• Frequency sweeps measure the actually selected function vs. a changing frequency
• Tape sweeps allow to record a defined frequency pattern on a tape
• Amplitude sweeps measure the actually selected function vs. a changing amplitude
• Time sweeps measure the actually selected function vs. time
• Table sweeps allow to measure the actually selected function vs. a previously defined
frequency / amplitude table (requires RS232 or IEEE-488 option)
Furthermore, the <SWEEP MODE> key allows to toggle between internally and externally
generated sweeps.
To define the start / stop value of the X-axis (e.g. 20Hz / 20kHz for a frequency sweep), set
the generator to the desired value and press the <START> / <STOP> key respectively.
Choose the resolution of your sweep, i.e. the number of samples to be recorded, through the
<RESOLUTION> key. Both modes (LOW / HIGH) allow to set the required number of measurements by entering the sweep resolution menu.
The recording of a new sweep is started by pressing the <DO SWEEP / STOP> key, while a
running sweep may be stopped through the same action.
Several sweeps may be permanently stored by entering the menu behind the <GRAPH>
button, and selecting one of the four avilable memory locations (M1-M3). By this way, up to
four complete graphs with a max. of 6 curves per graph may be stored in the non-volatile
memory of thze A2/A2-D for a later printout or upload to a PC.
NOTE This is only a very brief description of the sweep capabilities of the A2.
Please refer also to the chapter 6. Sweeps to see all the possibilities.
V3.1 17 / 104
Page 18
User Manual A2 Audio Test & Measurement System
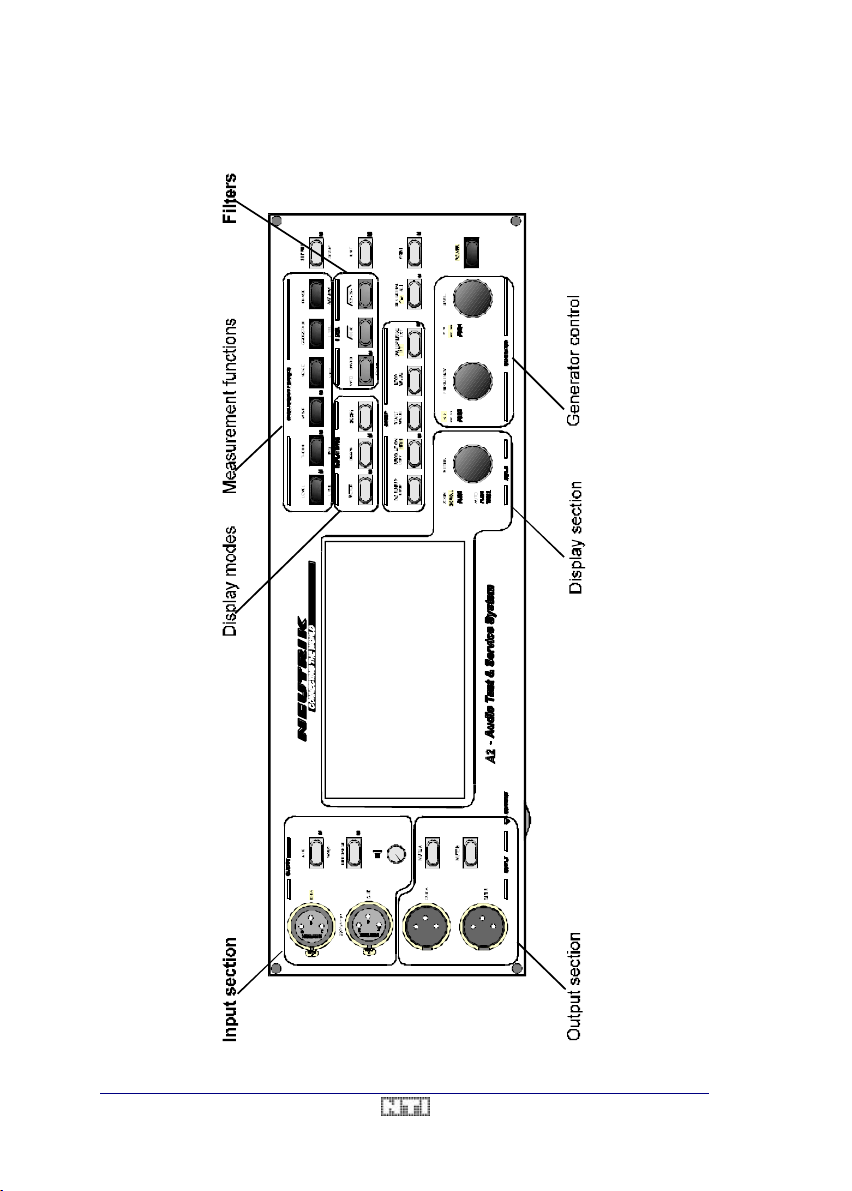
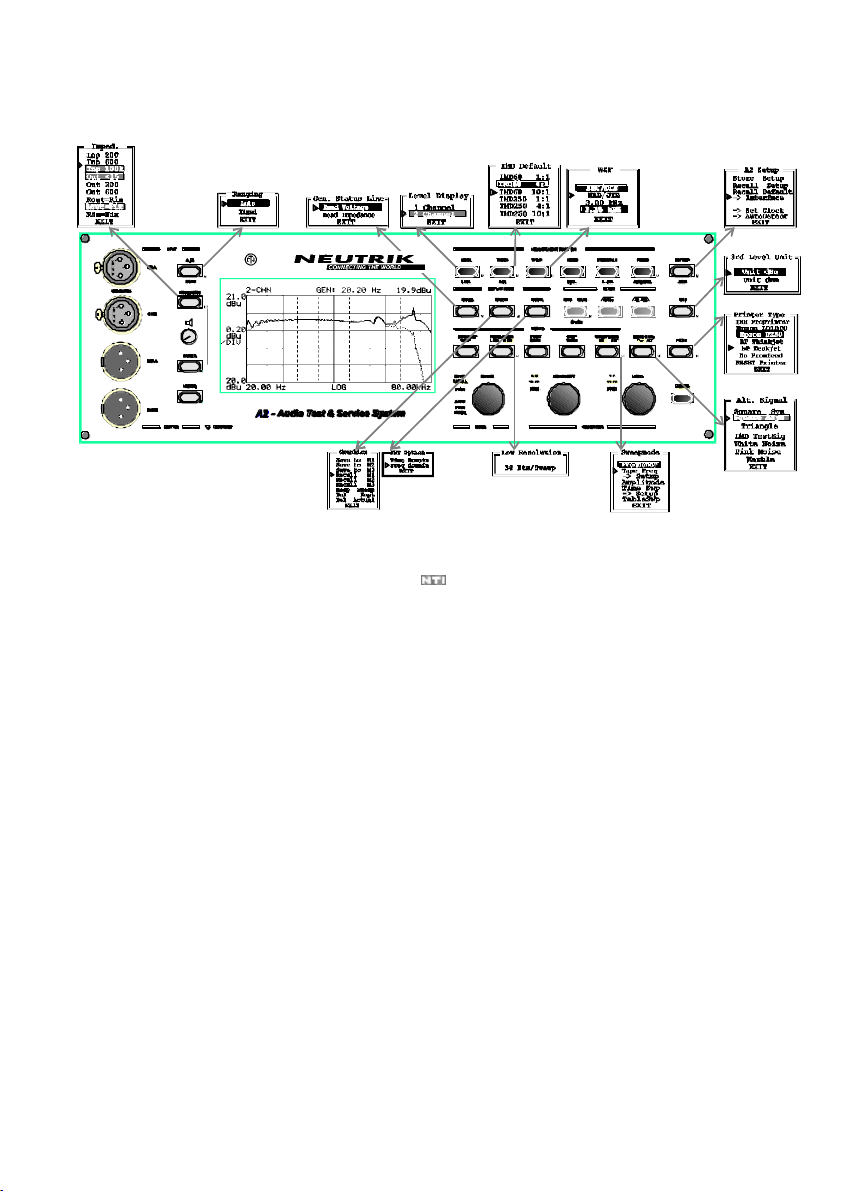
The A2/A2-D User Interface
18 / 104 V3.1
Page 19
_nti.docTest & Measurement System User Manual
A2/A2- D Menu Overview
V3.1 19 / 104
Page 20

_nti.docTest & Measurement System
V3.1
Page 21
A2 Audio Test & Measurement System User Manual
4. A2/A2-D OPERATION
NOTE Before switching On your A2/A2 -D, make sure that the selected mains
power voltage matches the one of your area. If not, please refer to chapter 2. Installation to set it correctly.
Each time the A2/A2-D is switched On, it perform s a short self-test, during which the A2 logo
will be displayed together with the software version, the current time setting of the internal
clock and the serial number of the unit.
After this test, the A2/A2-D will present itself in the last active setup, i.e. show the same settings and selections as when it was switched off. Nevertheless, it is also possible to define
and recall a user setup (see chapter Store & Recall Setups).
The A2/A2 -D is equipped with a screen saver function to extend the life time of the LCD
backlight. The backlight darkens after ~10 minutes without any operator activity. To turn it On
again, simply press any key or softwheel.
Input Section
The A2/A2-D is a two-channel measurement system, providing two fully independent measurement channels, named MAIN and ALTERNATE. Both channels are equipped with an in-
put impedance circuitry, input attenuators/amplifiers and a filter bank. This allows e.g. to
measure weighted or unweighted levels of both channels simultaneously.
Additionally, the main channel analyzer is equipped with a special filter section for Harmonic
Distortion, Intermodulation and Noise measurements, and also provides the demodulator and
filtering for W&F measurements.
The <A / B> key allows to select which of the input connectors shall be the main channel of
the instrument. In other terms, the input signal of the illuminated (i.e. active) channel is always fed to the main channel, while the other input signal is fed to the alternate channel.
If necessary, one may tilt the instrument
slightly either by turning the carrying handle
below the underside or use the reversible
footings in order to optimze the view on the
LCD.
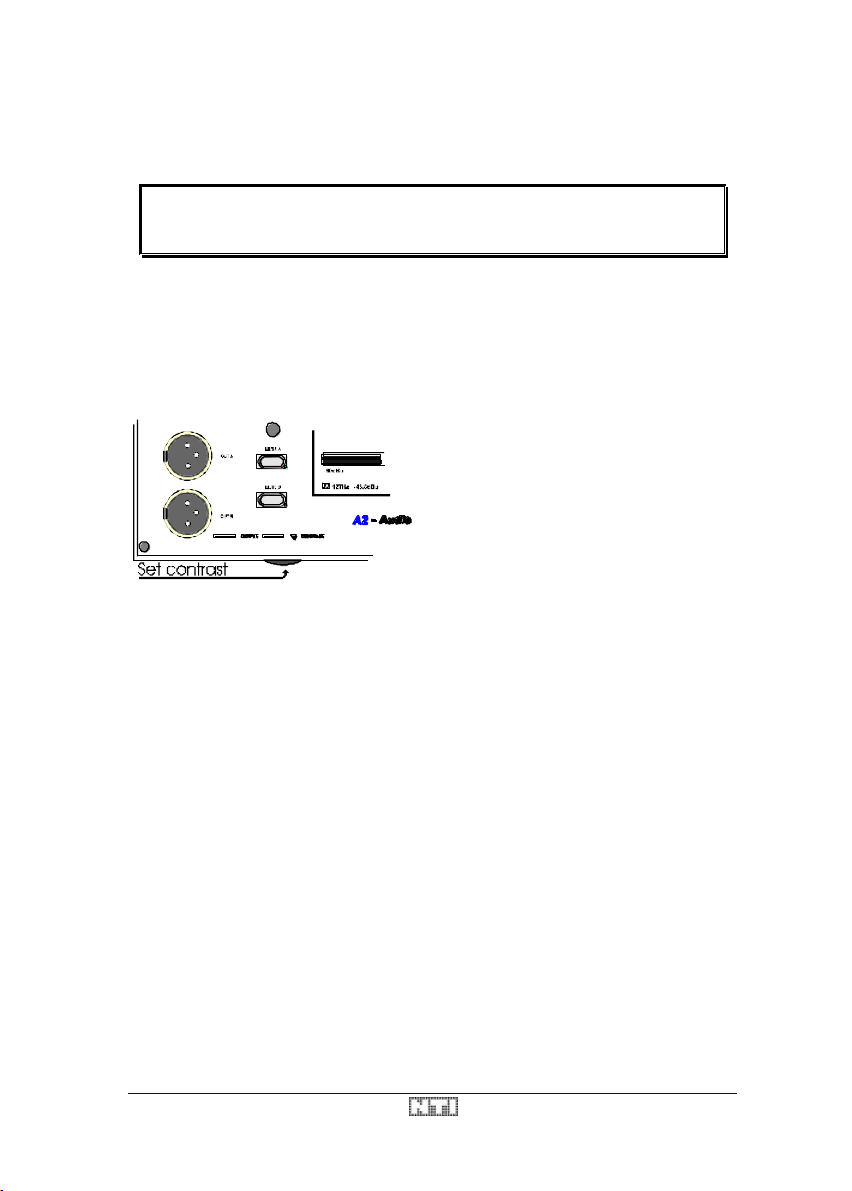
Furthermore, you may adjust the contrast of
the LC-display to your demands by turning
the potentiometer wheel on the left hand side.
V3.1 21 / 104
Page 22
User Manual A2 Audio Test & Measurement System
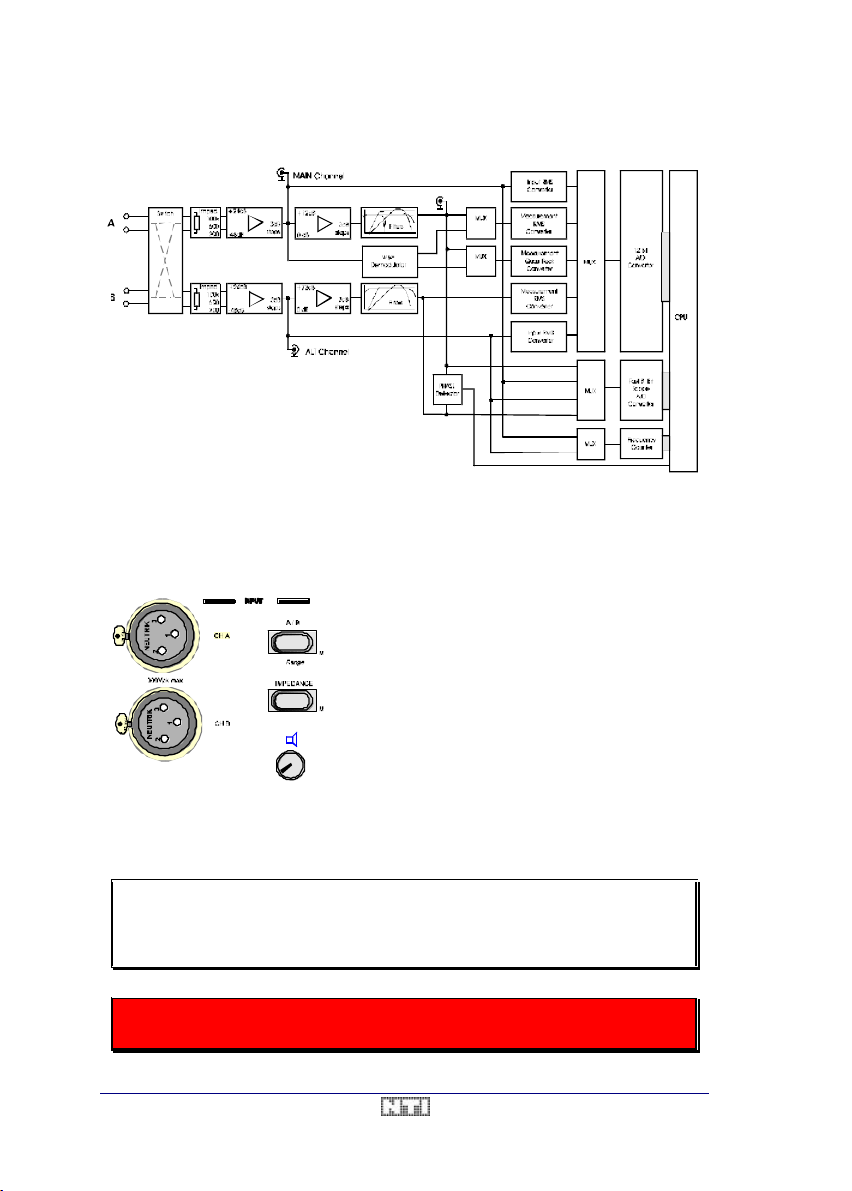
Input Block Diagram
Fig. 4 Block Diagram Analyzer
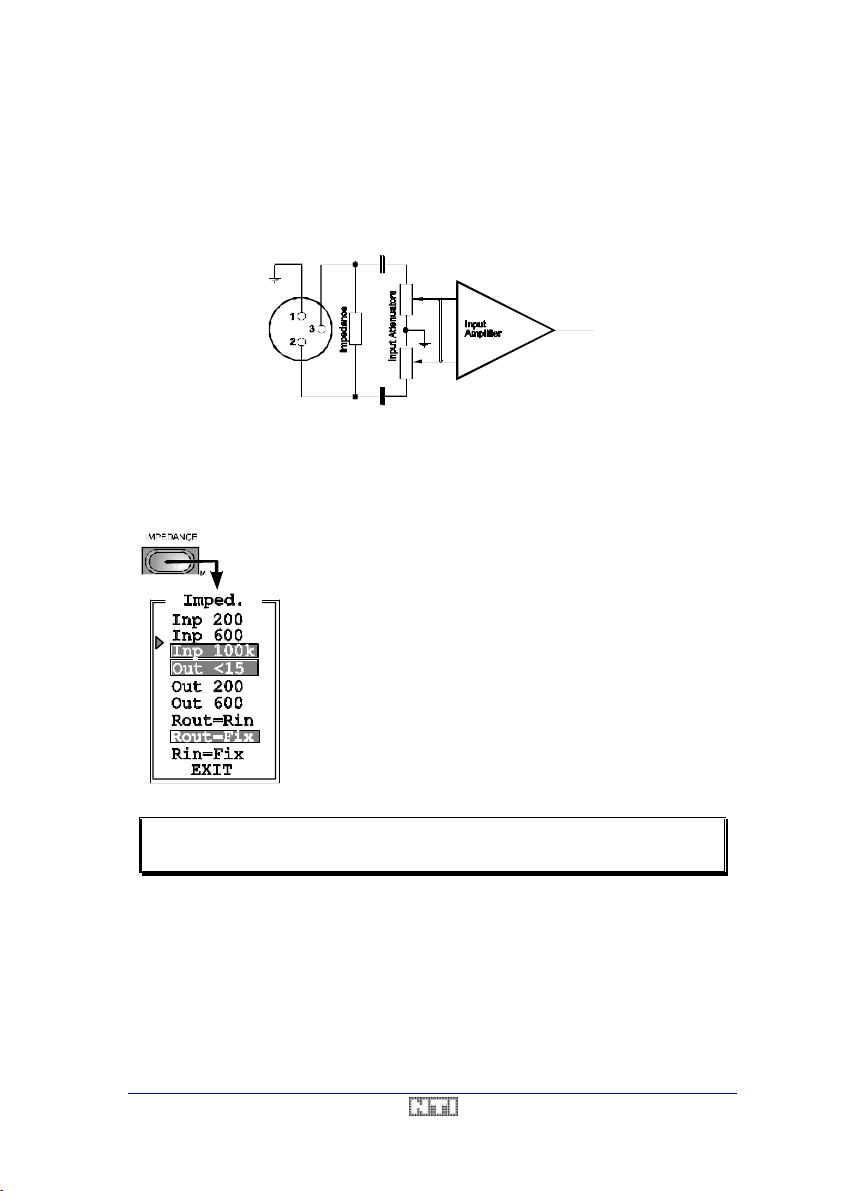
Input Wiring & Impedances
Both input channels are fully balanced and terminated with defined impedances right behind
the input connectors Three settings are available.
• The highest possible impedance terminates the
inputs with 100kΩ, corresponding a voltage
matching by means of a minimum load to the
output of the device under test.
• The second value, 600Ω, is intended for all instruments with this output impedance.
• The low input impedance can be set to 150Ω or
200Ω.
Choose one of these three settings by pressing the <IMPEDANCE> button. Each keypress
will toggle to the next impedance. The actually selected impedance is displayed on the left
hand side on top of the METER panel.
NOTE As soon as a level of more than 20V is applied to one of the inputs, the
LOW and MEDIUM impedance selections will be disabled automatically
to protect the inputs from being destroyed. An alert message will inform
you accordingly in this case.
If the LOW impedance is activated, NEVER apply an input voltage > 60V, since
higher voltages can permanently destroy the electronics!
22 / 104 V3.1
Page 23
A2 Audio Test & Measurement System User Manual
impedance, or to let the operator fix one impedance while having
the other one switchable. To select your preference, move the
ur selection by
pushing the <SCALE> wheel once. Always leave the menu
capacitor type microphone. Please notice, that the Phantom
d input impedance
The figure below shows the simplified input wiring and the connector pin assignment of one
channel. The circuit is a true instrument-grade differential input. Both input pins (2 and 3) are
loaded with ~100kOhm to ground. Additionally, the input impedances are applied between
the two pins. The inputs are fed to the microprocessor-controlled input attenuator/amplifier,
that adjusts the level of the input signal in order to achieve a high dynamic range at very a
very low distortion.
Input / Output Impedance Selection
In addition to the input impedance selection, a menu is available to choose all available configurations of the input and output impedances. To enter this menu, double -click on the
<IMPEDANCE> key.
The Imped. menu allows either to couple the input to the output
arrow with the <SCALE> wheel and confirm yo
through the EXIT entry.
Optionally, the input connectors of the A2/A2-D can be equipped
with a +15VDC or +48VDC Phantom power to directly connect a
power option replaces the LOW input impedance. Please refer to
chapter Phantom Power (AO8) for more details.
Depending on the configuration, the displaye
on the second line on the METER display, reads Inp 200, Inp 150
or Phantom .
NOTE If the Phantom power option is installed, the 200 Ω (150Ω) input imped-
ance is not available.
V3.1 23 / 104
Page 24
User Manual A2 Audio Test & Measurement System
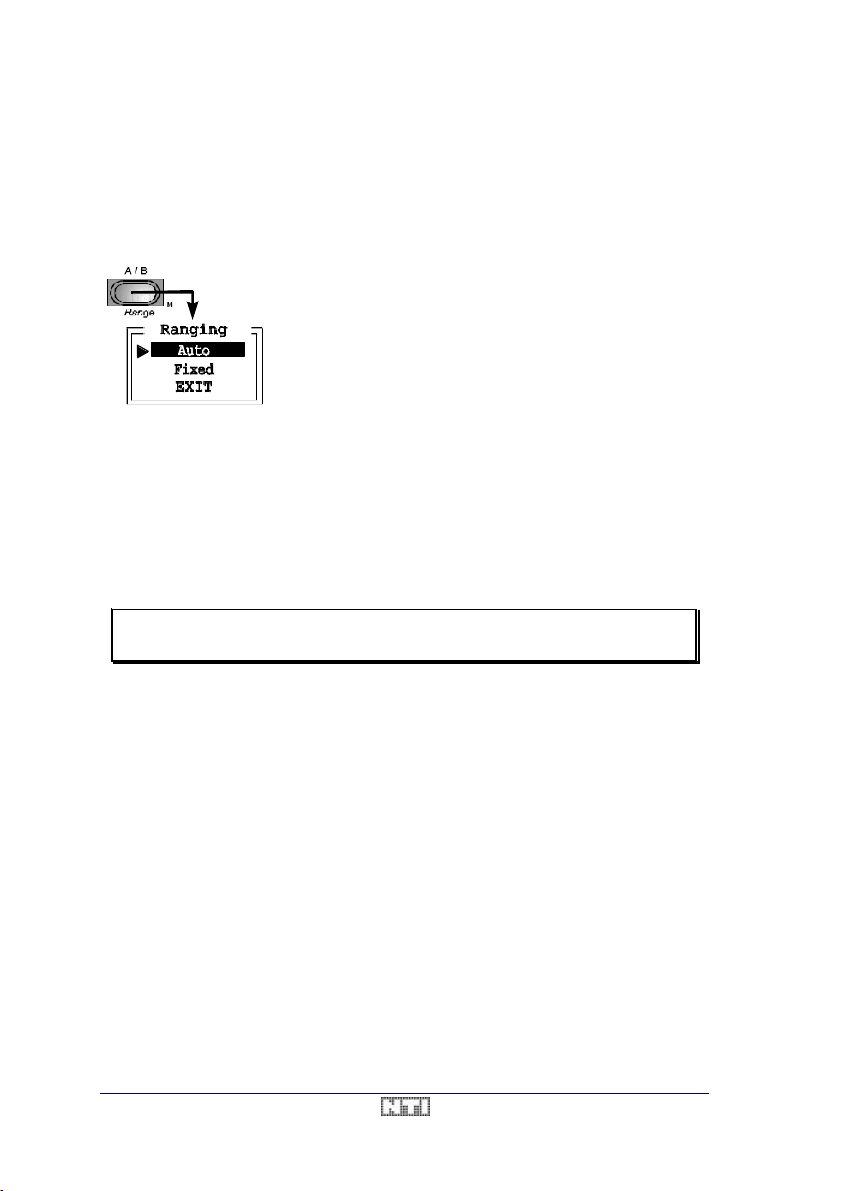
Auto / Fixed Range
The menu behind the <A / B> key allows you to choose between the Auto and Fixed range
setting. In the Auto range mode, i.e. the normal mode, the operator never has to wo rry about
the settings of the input amplifiers.
However, for some applications like testing short bursts, it might be helpful to lock the amplifiers in a certain state.
To lock the input attenuators/amplifiers to a fixed range, proceed as follows.
• Apply the input signal, to which you want to adjust the ranging.
• Call the Ranging menu by double-clicking to the <A / B> button.
• Select the entry Fixed by positioning the arrow through the <SCALE> wheel. Push the
wheel once to activate the setting (the menu closes automatically). The input stages are
now fixed, and all measurements will be performed in this mode.
• To switch back to automatic ranging (normal mode), enter the menu again and select
Auto.
NOTE The input attenuators/amplifiers of the analyzer remain fixed in their
range as long as the Fixed range mode is active.
The Fixed range selection locks the input attenuators/amplifiers
in their actual state as soon as it is chosen by a push on the
<SCALE> softwheel.
If the input signal level is under or over the actual Fixed range,
then the messages TOO LOW or TOO HIGH will appear on the
LCD instead of a measurement result.
24 / 104 V3.1
Page 25
A2 Audio Test & Measurement System User Manual
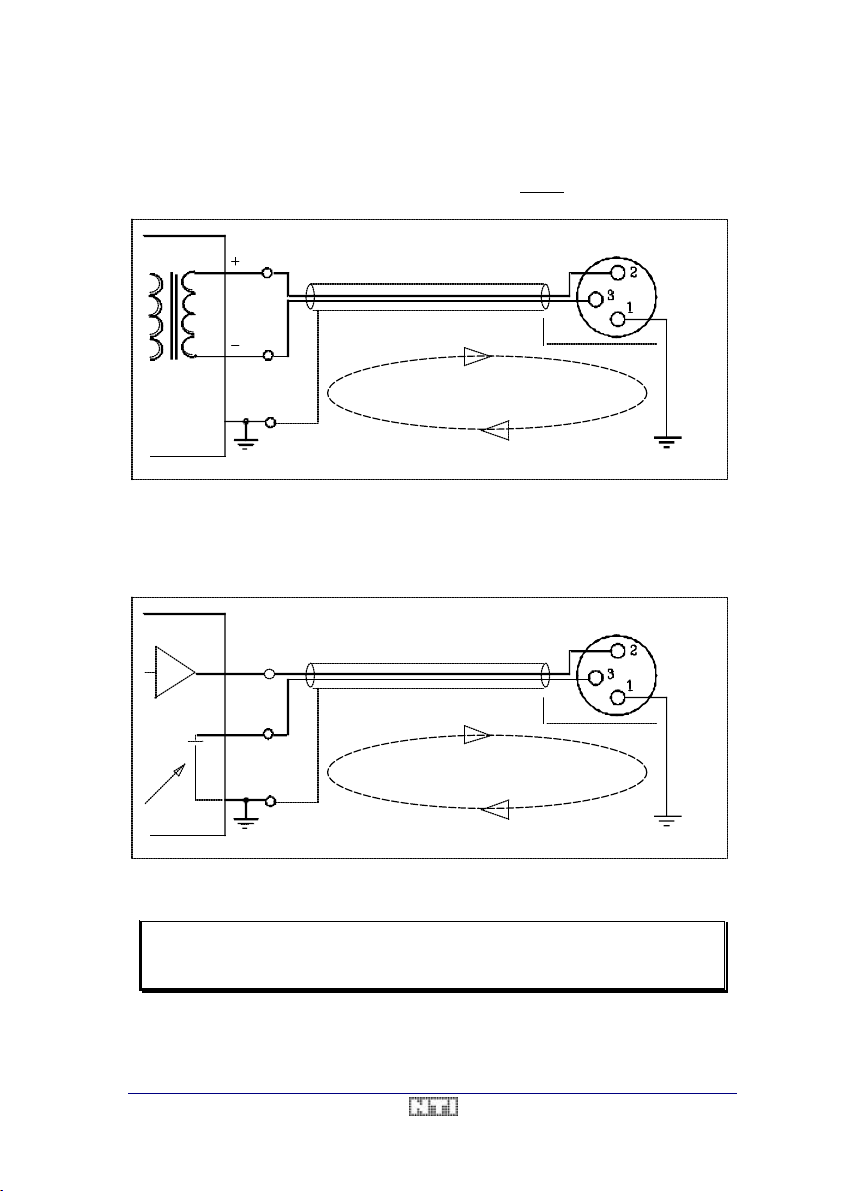
Connection of a Balanced Output to the A2/A2-D
The device under test (DUT) is connected between pin 2 (IN +) and pin 3 (IN -) of the XLR
input connector. The shield may be connected to pin 1, but do not ground the shield on both
ends of the connection, in order to avoid ground loops.
D.U.T.
Balanced
output
Fig. 5 Balanced Connection to the A2/A2-D
ATTENTION ! !
Shielded cable
Avoid ground loop
Input A2
Ground shield
only one side
Connection of an Unbalanced Output to the A2/A2-D
The device under test (DUT) is connected between pin 2 (Signal +) and pin 3 (GND) of the
XLR input connector.
D.U.T.
+
-
ATTENTION ! !
Shielded cable
Input A2
Ground shield
only one side
Avoid ground loop
Be sure not to have
internal connection!
Fig. 6 Unbalanced Connection to the A2/A2-D
NOTE Never c onnect pin 1 and pin 3 together as long as you are not absolutely
sure, that the GND output of the DUT is galvanically isolated from earth.
If in doubt, leave pin 1 of the A2/A2-D unconnected to avoid earth loops.
V3.1 25 / 104
Page 26

User Manual A2 Audio Test & Measurement System
Monitor Outputs
There are three BNC connectors and one headphone jack in the MONITOR section on the
rear panel, providing monitor signals for further processing. Output impedance through the
headphone connector is ~68Ω, while the BNC connectors have an impedance of 600Ω.
MONITOR
MAIN
ALT
CHANNEL
READING
HEADPHONE
CHANNEL
The two connectors MAIN CHANNEL and ALT CHANNEL offer
the signals of each input channel right behind the input amplifiers. The level of these signals are always around 1V (0dBV).
The third BNC output offers the READING signal, which is the analogue signal of the MAIN
channel after all the filtering and weighting, but before its rectification (see Input Block
Diagram).
Please notice, that the signal provided at the READING output is not necessarily the same
as at the two other connectors. Depending on the actual measurement function, the character of the READING signal will be totally different from the two other outputs (e.g. with meas-
urement function THD + N or IMD). More detailed information about this topic are given in the
respective chapters describing the measurement functions.
NOTE The MONITOR outputs are not calibrated and shall not be used for
measurements.
Monitor Loudspeaker
The READING signal is also fed to the internal loudspeaker. The volume can be changed
through the potentiometer on the front panel, marked with the loudspeaker sign.
Overview
• The input impedances may be selected through the <IMPEDANCE> key.
• The unit may be operated in the balanced or unbalanced mode, by setting the <FLOAT
GND> switch on the rear panel accordingly.
• Double-clicking to the <A / B> key opens a menu to select either Auto or Fixed ranging.
• The monitor speaker reflects input signal after the input stage and filtering. Its volume can
be controlled through the potentiometer on the front panel.
• The READING output monitors the input signal after the input and filter stage.
• The MAIN CHANNEL and ALT CHANNEL connectors provide the normalized, but
unweighted input signals.
26 / 104 V3.1
Page 27
A2 Audio Test & Measurement System User Manual
Output Section
The A2/A2-D is equipped with a versatile digital generator, providing optimum performance
with maximum flexibility to supply the device under test with purest signals.
The most important features of the generator are
• Output level -100dBV to +27.6dBV (10µV-24.5V
• Frequency range 10Hz-100kHz
• Selectable output impedances <15Ω to 600Ω
• Seven different signal waveforms
Very pure sine signal with typical THD+N < -91dB (<0.001%)
Warbled sine signal
IMD signal according to SMPTE and DIN
Squarewave (duty cycle 50/50 or 40/60)
W&F signal according to IEC and NAB
White noise
Pink noise
• Fast parameter setup through function keys and softwheels
• Individual mute function for each channel
• Sweep capability over the entire frequency & level range
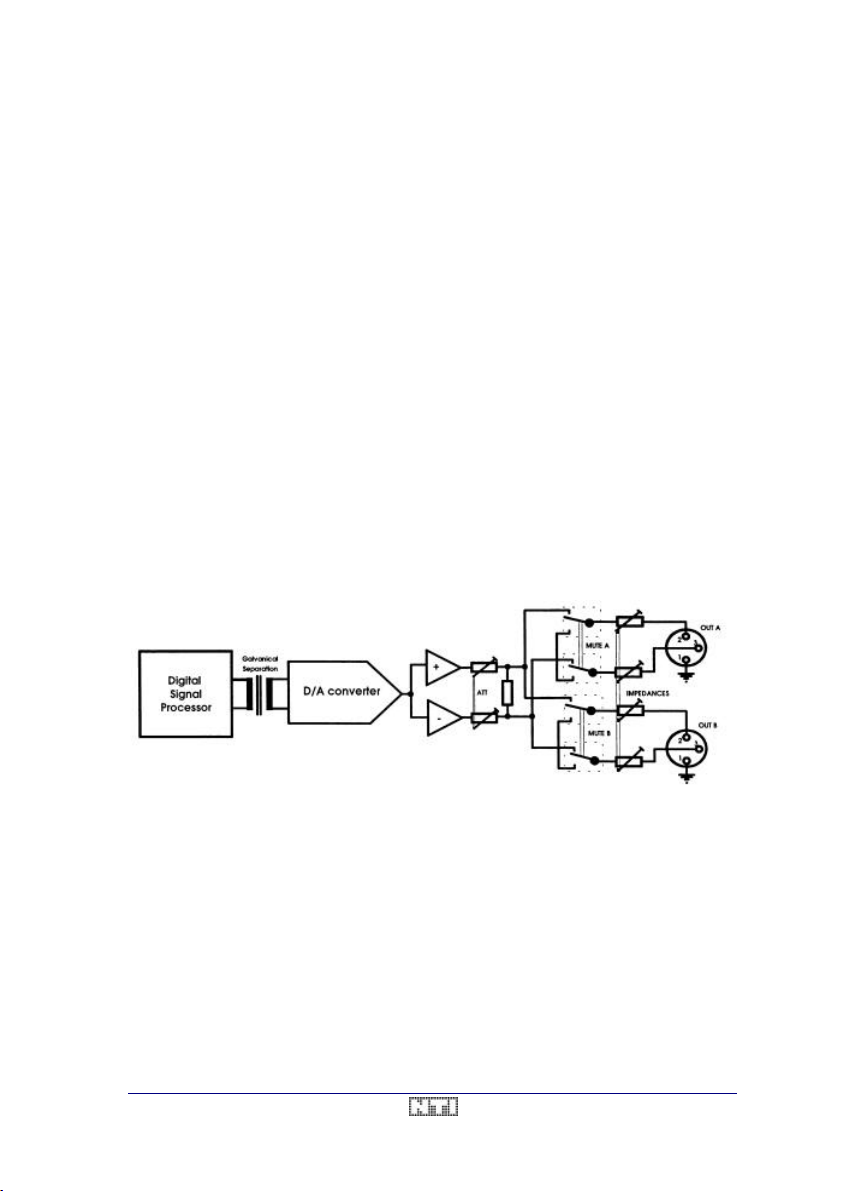
Output Circuit
The diagram below shows the simplified diagram of the A2 output stage.
RMS
)
Fig. 7 Generator Block Diagram
All output signals are generated by the internal Digital Signal Processor of the A2/A2-D. In
order to isolate the generator from the analyzer circuitry, optocouplers were inserted between
the DSP output and the D/A converter. The analog signal is filtered and fed into the balanced
output amplifier. Behind this stage, an attenuator selects the level range of the output signal.
The signal is then split to the two output channels and fed through the mute relays. The output impedances are wired behind these mute relays.
V3.1 27 / 104
Page 28
User Manual A2 Audio Test & Measurement System
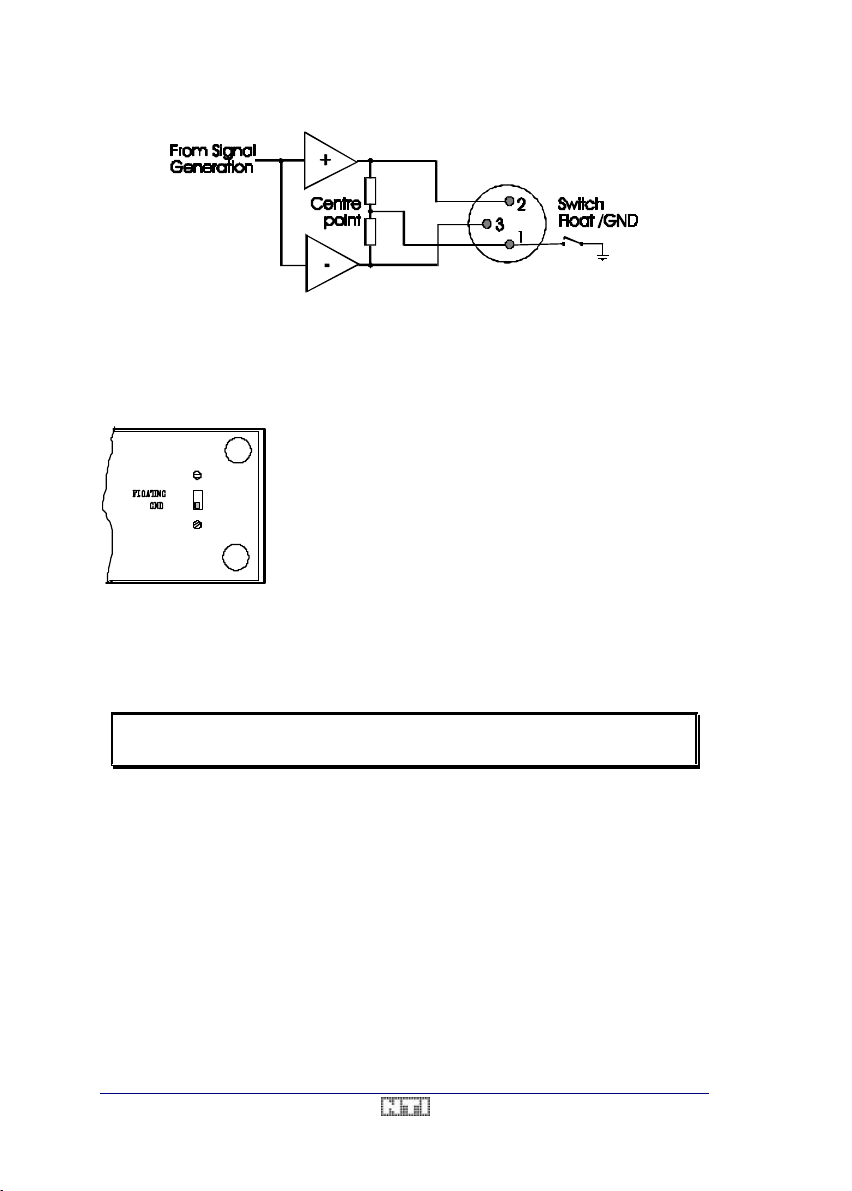
Fig. 8 Output Wiring
Pin 1 of each XLR output connector represents the center potential between pin 2 (+signal)
and pin 3 (-signal). It can either be kept floating or be connected to the chassis ground . In
general, it is recommended to operate the A2/A2-D in the FLOATING mode in order to avoid
ground loops.
The <FLOATING / GND> switch is located on the rear panel of
the A2/A2-D.
• FLOATING disconnects pin 1 from chassis ground, i.e. the
reference potential of the output amplifiers is floating.
• GND links the reference potential of the output amplifiers
to chassis ground.
Balanced Operation
Normally, the A2/A2-D is operated in the balanced (symmetric) mode. In this case, the device
under test (DUT) is connected to the two hot pins 2 (+signal) and 3 (-signal) of the generator
output stage.
NOTE If working with a balanced load, it is recommended to operate the unit in
the FLOATING mode.
Unbalanced Operation
When driving an unbalanced device, it is recommended to connect pin 2 (+signal) of the output stage to the hot input connector of the DUT, and to link pin 3 (-signal) of the output stage
with the ground of the DUT. In this case, operate the A2/A2-D in the FLOATING mode. By
this way only, the loss of half of the output level can be avoided.
On the other hand, unbalanced loads may also be connected between pin 2 (or pin 3) and
pin 1 of the A2/A2-D output stage (half side connection). In this mode, it is recommended to
set the switch on the rear panel to GND in order to get an invariant reference potential.
Optional Transformer Output Stage
Some applications require a complete galvanic separation between the generator output
connectors and the device under test. For this purpose, a transformer option is available (article code AO7), that adds a high quality Audio transformer behind the power amplifier of the
A2/A2-D.
28 / 104 V3.1
Page 29
A2 Audio Test & Measurement System User Manual
The A2/A2-D generator specifications as well as the output impedance circuitry are the same
with and without the transformer option. Please refer to chapter 8. Instrument Setup for further
details.
Output Settings
The METER display mode provides the best overview on the generator settings and measurement results. Therefore, it is recommended to enter this mode when reading through this
chapter.
Output Parameters
The generator frequency, output level,
waveform and output impedance are
continuously displayed on the upper
two lines of the LC display.
The top line shows in large characters the set generator frequency and level. In the second
line, the selected output impedance and waveform are indicated, as well the actual output
voltage (readback value) or the input impedance of the device under test (please refer to
chapter Readback for more detailed information).
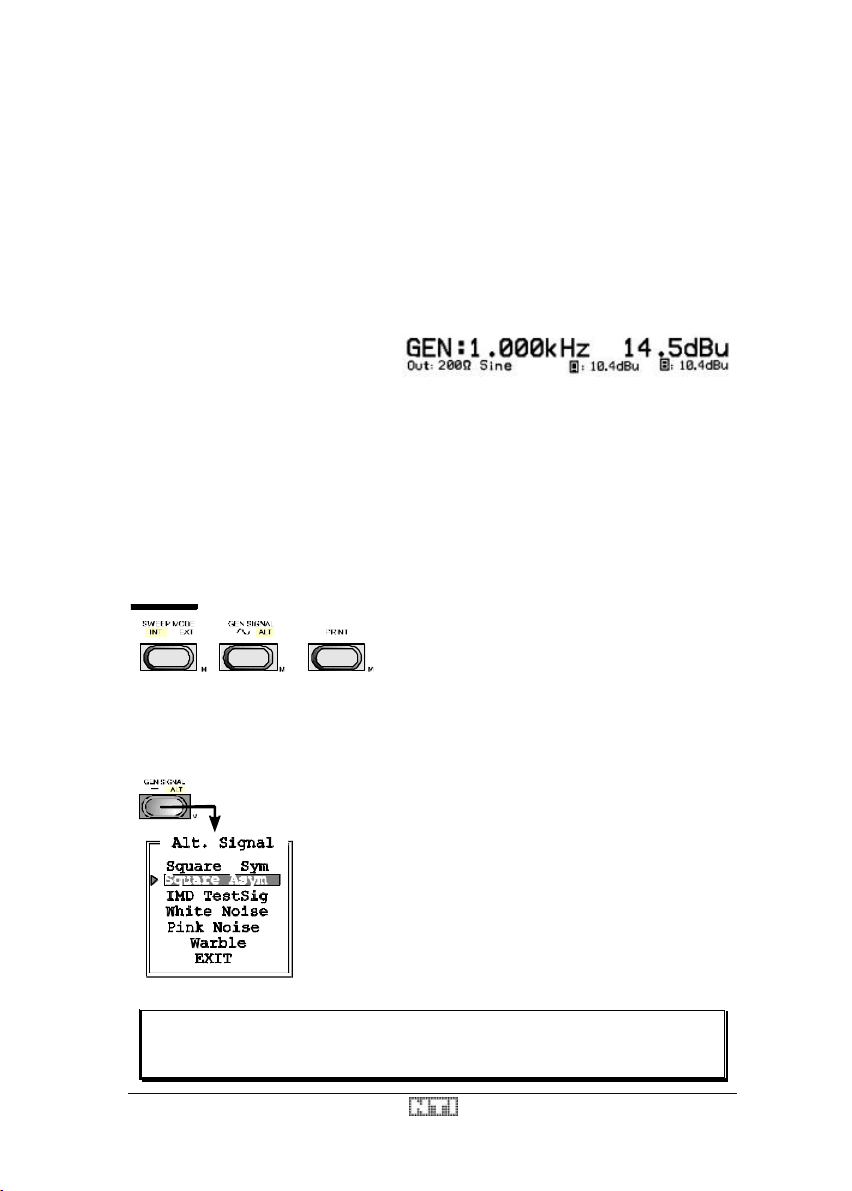
Signal Waveform
The <GEN SIGNAL> key allows to select the signal waveform to be generated. It will have
either the ~ (sine) or the ALT symbol illuminated from behind by a green LED. To toggle the
setting, simply push the button once.
• In the ~ mode, the generator output will be a
pure sine signal.
• In the ALT mode, the actually selected alter-
nate signal is active.
The A2/A2-D digital generator offers a wide range of alternate signals. To make one of them
the active signal, double-click on the <GEN SIGNAL> key. This opens the Alt Signal menu,
showing the list of available alternate signals.
The active signal is displayed inverted (white characters on a
black background). To change the selection, move the arrow
on the left-hand side through the <SCALE> softwheel to the
alternate signal you wish to select and press the <SCALE>
wheel once.
Consequently, the actual selection of the alternate signal will
change accordingly, i.e. the new signal will become active, and
the menu will close automatically.
Alternatively, selection of the EXIT entry or any keypress to the
A2/A2-D keyboard will leave the menu without a change of the
actual setting.
NOTE In some measurement functions like IMD and W&F, a predefined wave-
form - depending on the selected standard - is activated as alternate signal.
V3.1 29 / 104
Page 30
User Manual A2 Audio Test & Measurement System
Therefore, activation of the "Alt. Signal" menu will show this setting. Al-
though it is possible in this state to alter the signal in the menu, it will be
re-set automatically to the predefined waveform as soon as the menu is
closed.
Square Signal (Sym. / Asym.)
The Square Sym. and Square Asym. are squarewave signals with either a duty cycle of
50/50 (sym) or 40/60 (asym). Regardless of the duty cycle, the squarewave signal has the
actually selected frequency and level, calibrated in true V
A typical application for the 40/60 signal may be for quickly checking the polarity of lines.
RMS
.
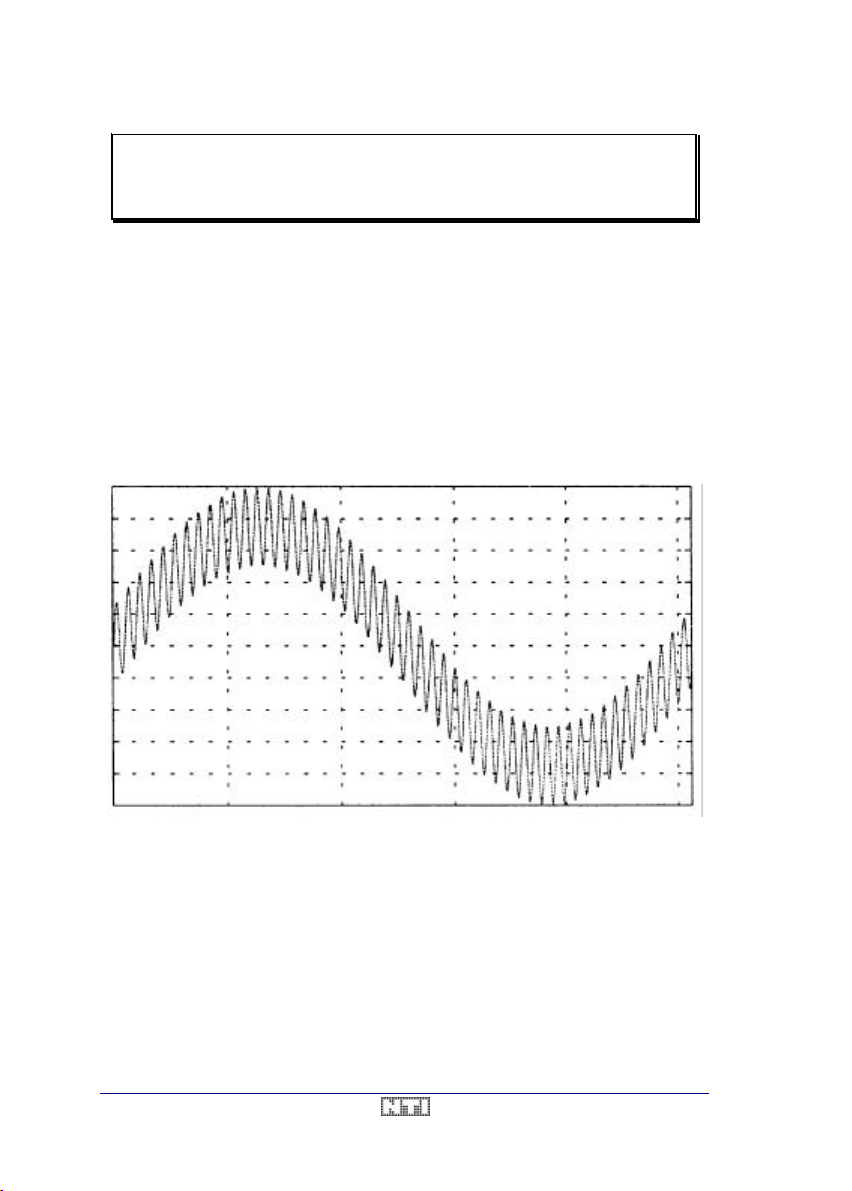
IMD TestSig
The IMD test signal consists of two signals components,
• a sinewave with a fixed frequency of 60Hz or 250Hz, and
• a second sinewave with a frequency of at least 4kHz, that may be set through the
<FREQUENCY> softwheel.
Fig. 9 IMD Testsignal
The level ratio between the low- and the high-frequency component is either 1:1, 4:1 or 10:1
(refer to chapter 5. Measurement Functions). Consequently, there are six different IMD test
signals available (according to the SMPTE and DIN standards). To define one of them as
default signal, the IMD Default menu must be opened by a double-click on the <IMD> key.
In normal operation, the IMD TestSig will be activated automatically as soon as the IMD
measurement function has been entered. Alternatively, it may also be activated manually
through the Alt. Signal menu.
30 / 104 V3.1
Page 31

A2 Audio Test & Measurement System User Manual
limits of +30dBu (27.7dBV / 24.49V)
Noise
The generator of the A2/A2-D offers White and Pink Noise , both with a bandwidth being limited to 20kHz, in order to maximize the energy falling into the Audio band.
• The characteristic of White Noise is a constant energy density for all frequency bands
with identical width (e.g. width = 100Hz). Consequently, the noise spectrum will show a
constant amplitude (energy) if analyzed vs. the linear frequency axis, or a linear rise of
10dB/decade if plotted vs. the logarithmic frequency axis.
• On the other hand, the amplitude of Pink Noise shows a linear decay of 10dB/decade if
analyzed vs. the linear frequency axis, or a constant amplitude if plotted vs. the logarithmic frequency axis.
NOTE Pink Noise has a very high Crest factor , i.e. a high Vp / V
Therefore, it is typical for Pink Noise that its amplitude, measured QuasiPeak or RMS, is never stable.
Warbled Sine
The Warble signal is a sinusoidal signal with oscillating frequency. The active generator fre-
quency defines the center frequency, while the modulating signal has a triangular shape with
4Hz. The Warble signal is best described in the frequency range, showing a fixed amplitude
that oscillates with about 4Hz and a 3rd-octave bandwidth around the center frequency, set
with the <FREQUENCY> softwheel.
level ratio.
RMS
Frequency
The generator ou tput frequency is set through the <FREQUENCY> softwheel. This wheel
has no end stops. Turning it counter-clockwise reduces the frequency or clockwise to increase the frequency. The limits of 10Hz and 100kHz cannot be exceeded.
NOTE In some measurement functions the frequency range is reduced to a
smaller bandwidth. Refer to the corresponding measurement function to
see the exact limits.
• A slow (i.e. stepwise) turn of the softwheel change the output frequency by 1/6 -octave
steps in the coarse mode, or 0.5% steps in the fine mode
• A fast turn in the coarse mode changes generator frequency to 20Hz, 100Hz, 1kHz,
10kHz, 40kHz, 100kHz , while in the fine mode, each fast turn causes the generator to
jump in 3rd- octave steps.
The frequency is not controlled in a continuous fashion - like with an
analog generator controlled by a potentiometer - but in discrete
steps. Pushing the wheel exchanges the step size between coarse
(« ») and fine (< >). The selected step size is indicated by an active
LED behind the respective sign.
Level
The generator level is controlled through the <LEVEL> softwheel.
V3.1 31 / 104
Page 32

User Manual A2 Audio Test & Measurement System
limits of +30dBu (27.7dBV / 24.49V)
Like the output frequency, also the generator level is controlled in discrete steps of 2dB (coarse) or 0.05dB (fine).
Please notice, that the absolute
and -97.7dBu (-100dBV / 10µV) cannot be exceeded.
• A fast turn of the <LEVEL> wheel in the coarse mode causes the generator to jump by
20dB to even values ([dBu] or [dBV] selected), or to the next decade ([V] selected).
• A fast turn in the fine mode forces the generator to jump jump by 2dB to even values, or
with an increment of 1V.
Readback
In case that the input impedance of the device under test is relatively low, a major output
voltage drop on the A2/A2 -D may occur. Actually, th e output voltage UO may be calculated
according to following formula.
U U
=+*
0
G
R
R R
i s
i
→
U R
*
s
0
R
=
i
U U
−
G
0
Obviously, it may happen that the generator voltage UG (set by the <LEVEL> wheel) differs
from the actual output voltage UO at XLR connectors.
In order to detect such cases, the A2/A2-D is equipped with the Readback function, that
measures the true voltage UO between pin 2 and pin 3 of both output channels, independently from the active analyzer function.
The readback measurement reuslts are displayed on right hand side of the status line in the
METER display mode. Alternatively, it is possible to show the load impedance Ri of the device under test with an accuracy of 5% + 1Ω.
To select whether the readback voltage or the load imped-
M
ance of the DUT shall be displayed, open the Gen. Status
Line menu by double-clicking on the <METER> button.
Next, make your selection by turning the <SCALE> softwheel to the respoective position and pushing the wheel
once.
NOTE The reading of the load impedance is most accurate if the selected
source impedance is closest to the displayed load impedance.
32 / 104 V3.1
Page 33

A2 Audio Test & Measurement System User Manual
DUT, that is not stimulated with any signal, by
Fig. 10 METER Mode
Consequently, the displayed values of the second line in the METER panel can be summarized as follows.
1. The selected output impedance
2. The actual waveform
3. The true output level / input impedance of the DUT of both channels.
Output Muting
On the right hand side of the output connectors
are the <MUTE> buttons, that allow to switch Off
the generator signal.
If activated, the mute function internally discon nects the generator from the output connector
and inserts a short circuit behind the impedances (see also Fig. 7). Muted outputs result in a
very quiet output, being properly terminated with
the selected impedance.
This feature simplifies output measurements of a
making the physical disconnection of the gen erator obsolete.
Overview
• The generator outputs may be operated either balanced or unbalanced.
• The selectable output signal parameters are the waveform, frequency and level.
• To set the output impedance, use the <IMPEDANCE> menu / key.
• In the METER mode, the output voltage or impedance may be displayed.
• The generator outputs may be mutes by pressing the respective <MUTE> keys.
V3.1 33 / 104
Page 34

User Manual A2 Audio Test & Measurement System
Fig. 10 METER Mode
Display Modes
Depending on the type of information you need, the A2/A2 -D offers three different display
modes.
• The METER panel for single measurements
• the GRAPH mode for sweep recordings and
• the SCOPE mode to watch the time signal.
NOTE Regardless of the active measurement (including sweeps), it is always
possible to switch to any other display mode without compromising the
accuracy of the measurement.
METER Display Mode
This display mode is entered by pressing the <METER> key once. It provides all the
necessary information and results of the selected measurement task and all related
information which may further help to qualify your measurements. The top line(s) always
contains the generator parameters and the bottom line is reserved for the input parameters.
Fig. 11 GRAPH Mode Fig. 12 SCOPE Mode
Fig. 13 METER Panel
Please notice, that the METER display will automatically change its layout for all 1-channel
measurement, by showing the single measurement result in large letters instead of the two
lines of the 2 -channel Level result.
34 / 104 V3.1
Page 35

A2 Audio Test & Measurement System User Manual
Generator Settings
The selected generator output voltage (nominal value) and frequency are always displayed
on the top of the METER display.
The unit, in which the frequency is expressed, cannot be influenced by the operator, while
the unit of the generator output voltage is the same as selected for the Level measurement
results. Please refer to chapter Output Section / Output Parameters for more details about the
generator settings.
NOTE If the generator signal is set to White or Pink Noise, the frequency of the
generator is still displayed, although a noise signal obviously has no
frequency.
However, the assignment of a generator frequency is necessary to set
the tunable notch-filter of the A2/A2-D to the desired frequency.
Generator Readback
In case of a relatively low input impedance of the device under test (DUT), the true output
voltage of the A2/A2 -D generator may be lower than the selected and displayed nominal
level.
Therefore, an additional readback reading of the true output voltage, or, alternatively, of the
input impedance of the DUT is permanently displayed. Please refer to chapter Output Section
/ Readback for further details.
Open the Gen. Status Line menu by double-clicking to the
<METER> key. Therein, one may toggle the display between the readback voltage and the load impedance of the
DUT by using the <SCALE> softwheel.
Please note that in measurement function IMD the readback feature is disabled.
Measurement Results
The results of the selected measurement function are displayed in both numerical and analog form through large digits and a bar-graph below. In the 2-channel Level measurement
mode, two lines of both display forms are placed on top of each other.
All measurements results - except of noise - are true RMS values. Noise is measured quasipeak according to the CCIR-468-3 standard.
NOTE The input and the readback voltage are always RMS values, independent
of the selected measurement function.
Units
The unit, in which the result shall be expressed, can be selected by pressing the <UNIT>
button on the right hand side of the front panel.
V3.1 35 / 104
Page 36

User Manual A2 Audio Test & Measurement System
Each keypress steps to the next available unit.
If there are no alternative units (e.g.
with measurement function W&F), presing the unit button has no effect.
NOTE The <UNIT> button influences the unit of the measurement result only,
i.e. not the generator level unit, except of measurement functions LEVEL
and 2-Channel, where the units are coupled together.
The Bar-graph
The bar-graph displays the measurement result in an analog way. This makes the bar-graph
very helpful to identify trends and tendencies of changin g / unstable signals, or when doing
adjustments to minimize / maximize a signal.
Normally, in the AUTO mode, the bar-graph is scaling automatically, but its scale can be
zoomed and scrolled to any point in the measuring scale manually.
Zooming the Bar-graph Scale
The <SCALE> softwheel provides the possibility to adjust the bar-graph scale exactly to your
needs. To enter the ZOOM mode, push the <SCALE> wheel once. Each further push to the
<SCALE> wheel will toggle between ZOOM and SCROLL mode. To return to the AUTO
mode, double-click on the wheel.
• In the ZOOM mode, every CW incremental step of the <SCALE> wheel increases the
sensitivity (units/division) of the bar-graph.
• A CCW increment decreases the sensitivity, i.e. it enlarges the displayed range.
• A fast turn of the <SCALE> wheel in the CW / CCW direction sets the scale of the bar-
graph to the highest / lowest sensitivity respectively.
If the bar-graph is zoomed, the center value is kept constant if possible (symmetric zooming).
However, in case that the value 0 (zero) would fall into the scale, it is shifted to the left border
value of the new scale.
Scrolling the Bar-graph
The SCROLL mode may be entered by pushing the <SCALE> softwheel once from the
ZOOM mode, or twice (slowly, no double-click!) from the AUTO mode. It allows to scroll the
visible range of the bar-graph scale through the availbale range.
• Every incremental step of the <SCALE> wheel in CW direction moves the visible part of
the bar-graph to the right by one division.
• On the other hand, a CCW increment moves the visible part of the bargraph to the left.
To quickly locate the range, where the signal is located in the bar-graph, make a fast turn of
the <SCALE> wheel in CW or CCW direction. This acts like a beam finder. Turn CCW if the
signal is 'larger' than the displayed scale, or CW if no signal is visible at all.
To set the scaling function back to AUTO mode, push the <SCALE> wheel twice quickly. The
actually selected mode (AUTO, ZOOM or SCROLL) is always indicated by a LED behind the
respective label.
36 / 104 V3.1
Page 37

A2 Audio Test & Measurement System User Manual
Input Display
On the bottom end of the METER display, additional information about the input signals are
available. The displayed values show the input voltage and frequency, measured right behind the input connectors. If the 2 -channel Level function is used, frequency and level of both
input channels are shown, while the parameters of the active channel, together with the input
impedance of the analyzer, are shown with all single channel functions.
This Input display is very helpful for all non-Level measurement functions (e.g. THD+N, IMD,
Noise etc.), that do not display the input signal level. For instance, in the IMD measurement
mode, it is important to know the frequency and level of the input signal to allow the proper
interpretation of the IMD results. Therefore, this information is shown on the Input display.
In case that the incoming signal is too small or too noisy to be measured, no frequency / level
values are displayed.
NOTE The input level results are always RMS values, regardless of the selected
measurement function. The measuring bandwidth is 500kHz, without any
weighting filter being involved.
Printouts
The METER Display display can be printed out to a printer by pressing the <PRINT> button.
The printout contains all relevant information to document the measurement result.
--------------------|-------------------------|-----------|---------------Output Imp: <15Ohm | Input Imp: 100kOhm | Filter: | LEVEL
Sine | | Off |
1.000 V / 1.000kHz | A: 775.6 mV / 1.000kHz | | 775.6 mV
--------------------|-------------------------|-----------|----------------
Fig. 14 Example of a METER Display Printout
V3.1 37 / 104
Page 38

User Manual A2 Audio Test & Measurement System
GRAPH Display Mode
Apart from the ability to measure and display single results, the A2/A2-D offers a big variety
of sweeps (sweep = sequence of measurements, plotted vs. the variation of one parameter)
as well. The GRAPH display mode supports best the definition of the sweep setup and allows to show the recorded curves.
The available sweep modes of the A2/A2-D are
• Internally controlled frequency sweeps
• Externally controlled frequency sweeps
• Amplitude sweeps
• Time sweeps
• Table sweeps
Fig. 15 GRAPH Display Example
The A2/A2-D2 comprises an curve tracer feature, that automatically controls and displays the
selected sweep type. It is able to record up to 6 sweep curves in one graph, depending on
the resolution, thus allowing their comparison. Furthermore, 4 complete graphs may be
stored in the internal memory of the A2/A2-D. They remein stored even after power Off, and
can be recalled at any time to be printed out or for additional sweep curve recordings.
The running and the fixed generator parameters are displayed on top of the GRAPH display,
together with the selected measurement function. The scaling of the Y-axis may be done
either manually or automatically by the A2/A2-D.
The unit of the measurement function (Y-axis) may be selected through the <UNIT> button.
Each press to this key steps through the available units.
NOTE When changing the unit, the A2/A2-D does not repeat the sweep meas -
urements, but re-calculates the recorded traces (even during a running
sweep recording). This allows for example a quick conversion from any
linear scale to a logarithmic scale and vice versa.
38 / 104 V3.1
Page 39

A2 Audio Test & Measurement System User Manual
Cursor Function
After having recorded a Frequency-, Amplitude-, or Table-sweep, it is possible to activate a
cursor to read out the individual measurement results of the curve. This allows to display all
result pairs, that are part of a sweep curve.
In practice, the <FREQUENCY> / <LEVEL> softwheel respectively allow to control the position of the cursor.
• To activate the cursor in a Frequency or Table sweep, simply set generator frequency
into the range of the recorded sweep (X-axis) by using the <FREQUENCY> softwheel.
Consequently, a crosshair becomes visible in the graph, representing the cursor. On the
bottom line of the graph, the frequency & measurement function results, corresponding to
the position of the crosshair, are displayed in inverse letters (white on black).
• For Amplitude sweeps, the cursor is available by setting the generator level into the
range of the recorded sweep (X-axis) by using the <LEVEL> softwheel. Again, the numerical values, that correspond to the position of the cursor, are displayed in inverse letters on the bottom line of the graph.
The cursor will disappear as soon as the upper or lower end of the X-axis is reached and reappears as soon as the generator frequency / level returns into the recorde range of the
sweep (X-axis).
To take full advantage of the Cursor feature, please notice the following.
• The <FREQUENCY> / <LEVEL> softwheel may be operated in either fine (< >) or
coarse (« ») mode.
• If the cursor is placed between two actually recorded measurements, the displayed values will be interpolated linearly.
• It is possible to enter the METER display and return to the GRAPH display at any time also during a running sweep - without loosing any information.
• The cursor will not beprinted out together with the graph.
• In the Time-sweep mode, there is no cursor function available.
Y-Scaling
The <SCALE> softwheel gives you the possibility to adjust the scaling of the Y-axis in the
GRAPH mode according to your needs.
• In the AUTO mode, the A2/A2 -D calculates the optimum scaling out of the valid measurements from all the traces within the graph.
• The ZOOM mode allows to manually adjust the sensitivity of the graph.
• The SCROLL mode allows to scroll the displayed graph through the avilable range.
To leave the AUTO mode, push the <SCALE> wheel once. Each further push will toggle
between the ZOOM and SCROLL mode. To set the SCALE function back to AUTO mode,
push the <SCALE> wheel twice quickly. The selected mode is always indicated by a LED
behind the label.
Every change of the scaling mode (AUTO, ZOOM or SCROLL) re -draws the recorded traces
completely in the new scale, without loosing any information.
ZOOM
The ZOOM mode allows to enlarge / reduce the scaling (units per division) of the Y-axis by
turning the <SCALE> sofwheel in clockwise (CW) / counter-clockwise (CCW) direction.
V3.1 39 / 104
Page 40

User Manual A2 Audio Test & Measurement System
• Every incremental step in CW direction of the <SCALE> wheel
increases the sensitivity of the Y-scale.
• A CCW increment decreases the sensitivity, i.e. enlarges the
displayed range of the Y-axis.
The actual sensitivity is displayed on the left hand side of the graph.
Every zooming keeps the centre value of the Y-axis at its place, if
possible. In case that the 0 (zero) value would fall into the scale,
the range will be scrolled upwards, so that the zero value corresponds to the bottom line of the graph.
NOTE A fast turn of the <SCALE> wheel in the ZOOM mode reduces (CW turn)
or expands (CCW turn) the Y-scaling to the Min / Max sensitivity
SCROLL
The SCROLL mode allows to scroll the range of the Y-axis scale upwards / downwards by
turning the <SCALE> sofwheel in clockwise (CW) / counter-clockwise (CCW) direction.
• Every incremental step of the <SCALE> wheel in CW direction
moves the visible range down by one division.
• A CCW increment of the <SCALE> wheel lowers the curve by
one division.
The borders of the actual range (Min & Max values) are always
displayed on the left hand side of the graph.
NOTE A fast turn of the <SCALE> wheel in the SCROLL mode acts like a beam -
finder, i.e. lets the A2/A2-D display any recorded curve, that is located either below (CW turn) or above (CCW turn) of the actual position.
X-Scaling
After having recorded a sweep, the scaling of the X-axis (Min / Max values) may be changed.
To do this, set the parameter of the X-axis by turning the corresponding softwheel to the desired value, and press the <START VALUE> / >STOP VALUE> key respectively.
• In a recorded Frequency sweep, use the <FREQUENCY> softwheel
• In a recorded Amplitude sweep, use the <LEVEL> softwheel
Consequently, the graph and all recorded curves are re -drawn automatically in the new
range. In other terms, the curves are not measured again, but fitted into the new graph. Refer
also to chapter 6. Sweeps for more information.
40 / 104 V3.1
Page 41

A2 Audio Test & Measurement System User Manual
GRAPH Printouts
Any graph may be printed out to a connected printer by pressing the <PRINT> button, which
is located on the right hand side of the front panel. Consequently, the complete graph including all curves, the grid and the scaling will be printed.
To select the printer driver, double-click on the <PRINT> key and choose from the menu that
will open. Details about the printers and its selection are given in chapter 7. Printouts.
Fig. 16 Example of a Printed GRAPH Display
The A2/A2-D is not blocked during the print-out. The print process is handled in the background so that any measurement may be performed or continued in the meantime.
Store & Recall Graphs
Sometimes, when using the A2/A2-D, no printer may be available for documentation. Therefore, to allow later printouts of recorded graphs, the A2/A2-D offers four memory locations to
store and recall a complete graphs in each of them, with all the curves and the scaling included. This memory is battery backed-up to allow to disconnect the instrument from mains
power and to return to the office for the print-out. The detailed description on how to store
and recall graphs is described in chapter 6. Sweeps.
V3.1 41 / 104
Page 42

User Manual A2 Audio Test & Measurement System
SCOPE Display Mode
The SCOPE mode extends the set of A2/A2-D tools by offering a simple audio oscilloscope,
that lets the operator analyze the waveform of the input signal(s) in the time domain.
To enter the SCOPE mode, simply push the <SCOPE> button. Consequently, the LC display
will change to the oscilloscope mode and show the input signal(s) vs. the time axis.
Fig. 17 SCOPE Display Example
On top of the LCD, the generator level and frequency are indicated like in the other display
modes. Below, the waveform(s) are plotted, whe reof the A2/A2 -D automatically determines
the scaling of the Y- (measurement function) and X- (time) axis, i.e. there is no possibility to
set the scaling manually.
• Both resolutions are displayed next to the corresponding axis to allow to read out accurately the amplitude and period. Minimum time resolution is 10µs per division.
• If possible, the auto scaling displays one period of the signal. This ensures, that the operator can qualify the waveform of the input signal without the need to modify the settings.
In the 2-channel Level mode, the sensitivity of the Y-axis is identical for both channels and
determined by the level of the active (main) channel. Optimized scaling for the alternate
channel can be obtained by making it the active channel (push the <A / B> key). Both in the
2-channel Level and Phase measurement function, the two input signals are shown in a true
phase position.
In the THD+N function, there are also two traces displayed: the smaller one is the distortion
residual after filtering out of the fundamental frequency, while the larger trace shows the unfiltered input signal.
Both traces are synchronized, to enable inspection of where the distortion is occurring. Beware though, due to the phase shift of the notchfilter which removes the fundamental frequency, that the distortion products cannot be exactly synchronized. This effect is worst with
the second harmonic.
In the Noise measurement function, the SCOPE mode is blocked in a way, that the A2/A2-D
automatically switches its display to the METER mode.
42 / 104 V3.1
Page 43

A2 Audio Test & Measurement System User Manual
To enter the Level measurement function, make
sure, that no sweep is running and press the
ured input level(s) on its LCD. Should the display
show L.REL then press the <LEVEL> key once
again to enter the (absolute) level measurement
click to the <LEVEL>
NOTE The SCOPE mode is blocked in measurement function Noise, by
switching the A2/A2-D display automatically to the METER mode.
This is because there would be no signal, but some flickering dots visible only.
The display can also be frozen to analyze moving signals by a second push to the <SCOPE>
button. The message STORED is then displayed to indicate the frozen state. Another push to
the <SCOPE> button releases this state.
Printouts
Like all other display modes, the SCOPE display can be printed out to a Printer by pressing
the <PRINT> key. During the print-out, the A2/A2-D automatically freezes the scope screen.
The operator can release this freezing mode by a double-press to the <SCOPE> button to
watch the trace even during the print-out, but with the side-effect of a slower print-out. In the
THD+N mode, only the residual is printed out.
See also chapter 7. Printouts for details about printer settings.
Fig. 18 Example of a Printout in the SCOPE mode
Overview
• The SCOPE screen displays the waveform of the input signal(s) in the time domain.
• The scaling of the X- & Y-axis are set automatically, i.e. cannot be changed manually.
• In the THD+N measurement function, the unfiltered input signal as well as the distortion
residual are displayed simultaneously.
• If the Noise measurement function is active, the SCOPE mode is not available.
V3.1 43 / 104
Page 44

User Manual A2 Audio Test & Measurement System
To enter the Level measurement function, make
sure, that no sweep is running and press the
ured input level(s) on its LCD. Should the display
show L.REL then press the <LEVEL> key once
again to enter the (absolute) level measurement
click to the <LEVEL>
5. MEASUREMENT FUNCTIONS
Level Function
The Level measurement function allows to perform an absolute level (amplitude) measurement in true RMS1 for either one channel, or two channels simultaneously. After having
passed the input amplifier / attenuator stage, the input signal is rectified by the true RMS
detector and A/D converted for further analysis. Additionally, several filters may be introduced into this path, in order to further weight the signal. Please refer also to the block diagram shown in Fig. 4.
The bandwidth of the A2/A2-D analyzer is limited to 2Hz-250kHz, while the allowed input
level ranges from 1µV to 200V
Mono / Stereo Measurements
The bottom line of the METER display shows the RMS level(s) and the frequency of both
input channels A and B, measured right behind the input connectors, i.e. the not-filtered input
signal(s). Please refer to chapter Input Display for further information.
Units
The A2/A2-D provides the possibility to express the Level measurement results in several
units. The linear unit [V] represents the absolute input voltage, measured against the 0V reference potential (GND).
On the other hand, the dBx units express the input voltage in a logarithmic scale vs. different
reference voltages.
Each of these units can be converted into any other by one of the mathematical equations,
listed in Table 2.
.
RMS
<LEVEL> key.
Consequently, the A2/A2-D will show the meas-
mode labeled 2-CH or LEVEL.
The <LEVEL> key hides the Level Display menu that allows
the operator to choose between 2-channel (stereo) or singlechannel (mono) level analysis.
This menu can be opened by a double button. Use the <SCALE> wheel to move the arrow to the required mode (1 / 2 Channel). A push to the <SCALE> wheel
activates the selection while any other key leaves the menu
without a change.
1
RMS= Root Mean Square. This is the energy equivalent value of the signal.
44 / 104 V3.1
Page 45

A2 Audio Test & Measurement System User Manual
1
000
.
V
0
7746
.
V
Unit lin/log Reference Calculation
V lin ISO unit dBV log 1.000V
dBu log 0.7746V
(2)
dBm
log 1mW
Table 2 Level Unit Conversions
NOTE The unit dBm in the LEVEL functions is handled as the dBu unit, as-
suming a load impedance of 600Ω
To alter the selected unit, simply press the <UNIT> button. Each press changes to the next
unit available in that function.
Please notice, that the generator level unit is coupled to the level measurement unit in meas-
urement function Level only. Therefore, in order to change the generator unit, it is necessary
to enter the Level measurement function and to select the required unit.
To toggle between the dBm and the dBu unit, open the 3rd
Level Unit menu behind the <UNIT> button by double clicking
to it in the measurement function Level.
Select the unit of your convenience with the <SCALE> wheel
and confirm by pushing to it. The menu closes automatically
after the selection. Leave it through the EXIT entry or by
pressing any key in case that no change is required.
U V
20
⋅log(
20
⋅log(
201⋅⋅log( )
)
U V
U V
mW RL Ω
)
Filters
The A2/A2-D has two frequently used filters built-in as a standard. The 400Hz highpass and
the 22Hz-22kHz Audio bandpass filter. Both filters are built by a 3rd order stage with an edge
steepness of 60 dB/decade.
To activate one or both of these filters at a time, press the /400Hz or the /22-22k\ key re spectively.
2
Although the definition of dBm is a power and not a voltage, it is mostly handled as a voltage, equal to the dBu,
representing the power into a 600Ω load.
V3.1 45 / 104
Page 46

User Manual A2 Audio Test & Measurement System
Furthermore, the A2/A2-D is prepared to handle one or two additional weighting filters per
channel for Level measurements. Following filter options are available.
• A-weighting filter (order code AO4)
• User-definable filter (order code AO5)
• C-message filter (order code AO13)
• 80kHz lowpass filter (order code AO14)
To activate the additionally installed filter(s), i.e. to insert it into the signal path, press the
<WTD UWTD> button. If a filter is installed, the LED behind the WTD will light up, indicating
that filter #1 is active.
If a second filter is installed on the same channel, the next keypress to the <WTD UWTD>
key will remove filter #1 from the signal path, but activate filter #2 and light up the LED behind UWTD.
A third press to the <WTD UWTD> button deactivates both LEDs, indicating that no more
weighting filter is active.
If only one additional filter is installed, the UWTD position is not available; the <WTD UWTD>
key will in this case toggle between WTD and Off.
NOTE The optional filters are handled exclusively; if they are activated, they
automatically switch Off any other active filter.
Applications
The LEVEL measurement is the most widely used measurement function in the Audio field. It
is useful to
• Check the signal level
• Line up tape machines
• Calculate the output impedance of a DUT out of the level over a certain impedance
• Measure the frequency response
• Measure the balance between two channels
• Calculate the power from the level over a certain impedance
To learn more about how to measure a frequency response, read chapter 6. Sweeps.
Overview
• The A2/A2-D analyzer provides a bandwidth of 2Hz-250kHz in the Level mode
• The menu behind the <LEVEL> key allows to set the unit to either between 1-chn.
(mono) or 2-chn. (stereo) measurements.
• All standard frequency weighting filters as well as installed filter options may be activated.
• The unit of the generator output level may be altered in the Level measurement mode
only.
46 / 104 V3.1
Page 47

A2 Audio Test & Measurement System User Manual
U
V
[][
]
Level Relative Function
The Level Relative function is an extension of the (absolute) Level measurement function,
allowing to change the reference voltage for the Level measurement, i.e. to measure the input level relatively to a user-defined reference.
To activate the Level Relative measurement function, make sure that no sweep is currently
running, enter the Level mode and press the <LEVEL> key a second time.
NOTE Every push to the <LEVEL> keys toggles between the two measurement
functions Level and Level Relative.
As soon as you have activated the Level Relative mode, L. REL will be displayed on the
LCD, and the A2/A2-D analyzer will immediately show the actual result. On the bottom line of
the METER display, the absolute input level and frequency of the active channel, as well as
the current reference level are indicated. All Level Relative measurements are made against
this reference.
To set or change this reference value, apply the reference voltage you require to the active
input channel and press the <SET REF> key on the upper right corner of the front panel.
The new reference level will be active and displayed immediately on the bottom line of the
METER display.
Keep in mind that the generator level, displayed continuously in the top line of the display, is
always measured in absolute terms.
Filters
For the Level Relative function, the Audio bandpass 22.4Hz-22.4kHz as well as the 400Hz
highpass filter are available in any combination.
Furthermore, all installed optional weighting filters can be activated as well. Select the filters
by pressing the corresponding key.
V3.1 47 / 104
Page 48

User Manual A2 Audio Test & Measurement System
U
V
[][
]
Units
As with the absolute Level function, several units are available for Level Relative measurements. They can be selected through the <UNIT> button. Each press toggles to the next
available unit.
Unit lin/log Reference Calculation
% lin U
*1 lin U
dBr log U
REF
REF
REF
Table 3 Level Relative Units
U VREF
20 ⋅log( )
U V
REF
U V
⋅100
U V
U VREF
or
U dB U dBREF−
Application Example
To measure the channel balance in a stereo equipment proceed as follows
1. Apply the signals to the inputs of the A2, e.g. left chn. to input A, right chn. to input B.
2. Select with the <A / B> key the reference channel which is usually left, e.g. input A.
3. Push the <SET REF> button, then make the other input channel the active one (press the
<A / B> key).
4. The channel balance can now be read out directly.
Signal-to-Noise Measurement
The signal -to -noise ratio (S/N), generally expressed in dB, reflects the ratio of the RMS
Voltage of the wanted signal to the coexistent noise in a transmission channel.
1. Set the analyzer to measurement function L.REL , expressed in [dBr].
2. Connect the A2/A2-D output to the input of the DUT and apply the wanted signal.
3. Mute the output of the generator or DUT, in order to receive the noise signal only.
4. Press the <SET REF> key
5. De -mute the output of the generator / DUT. The displayed measurement result
corresponds to the signal-to-noise ratio, expressed in dB.
NOTE Do not use the Noise function to evaluate the signal-to-noise ratio, since
this mode measures the quasi-peak weighted noise, instead of the RMS
voltage as required for S/N measurements.
48 / 104 V3.1
Page 49

A2 Audio Test & Measurement System User Manual
(
Distortion
Noise
)
+
THD+N Function
The A2/A2-D measures the Total Harmonic Distortion plus Noise (THD+N) of the active
channel by inserting a band-reject (notch) filter into the signal path. This notch filter is tuned
to the frequency of the main component of the input signal (i.e. the fundamental frequency).
Thus, the fundamental frequency is removed, leaving everything else - i.e. the harmonic distortion and noise - for the measurement. The result of this measurement is compared to the
level of the incoming signal and expressed in percent [%] or in dB.
Fig. 19 Principle of THD+N Measurement
To enter the THD+N measurement function, press the <THD + N> key. This button
toggles between the measurement function THD+N and IMD.
NOTE Activation of the THD+N measurement function automatically selects the
sine signal as output for the A2/A2-D generator.
At the same time, the notch filter is inserted into the signal path, and the THD+N value is
calculated according to Equation 1.
THD N
+ =
Signal ( Distortion Noise)
Equation 1 THD+N Calculation
NOTE If the level of the input signal is too low, or not present at all, the mes-
sage INP LOW will appear on the METER display.
V3.1 49 / 104
+ +
Page 50

User Manual A2 Audio Test & Measurement System
Notch Filter
To control of the center frequency of the notch filter, proceed in either of the two ways described below.
1. Lock the center frequency of the filter to the generator output frequency
2. Let the center frequency synchronize to the dominant frequency of the input signal.
Controlling the filter internally by the generator allows the filter settle in the quickest way. This
helps to speed-up sweeps, but requires the internal generator as signal source. Furthermore,
the DUT must not produce a frequency shift if using this mode.
Filter control externally, i.e. by the dominant frequency of the input signal may be useful and
necessary if the DUT is stimulated by another signal source than the A2/A2-D generator (e.g.
a test tape).
Hint The status of the <INT EXT> key only has an effect for measurement functions with
variable filters, such as THD+N, L.SEL and X-TALK.
To set the control of the filter center
frequency to either mode use the
<INT EXT> button. Each press toggles between the two settings.
• INT means, that the notch filter is
locked to the generator frequency
• EXT will synchronize the notch
filter to the dominant input frequency.
Additional Filters
The A2/A2-D allows to additionally use the complete set of availabel filters for THD+N measurements. If no additional filter is activated, the bandwidth is limited to 250kHz.
Activating the Audio bandpass filter (22Hz-22kHz) primarily reduces the noise content of the
signal.
But be careful - it will also reject all harmonics above 22kHz! For instance, with a stimulus of
6kHz and activated Audio bandpass filter, the THD+N result would make no sense, since
already k3 (the 3rd harmonic) and all upper harmonics will not be considered.
The 400Hz highpass filter mainly eliminates low-frequency disturbing signals like hum and its
harmonics as well as rumble.
However, do not measure the THD+N of signals below 250Hz with the 400Hz high pass filter
being enabled, since the second harmonic would not be measured in this mode.
NOTE To characterize the dominant type of distortion, enter the display mode
SCOPE. The second trace in that display shows the residual distortion
signal. Check for any correlation to a harmonic or hum etc.
Units
The THD+N measurement as well as the SINAD measurement described below are relative
measurements. The units available are therefore the linear percent [%] scale and the logarithmic decibel [dB] scale, that may be activated through the <UNIT> key.
50 / 104 V3.1
Page 51

A2 Audio Test & Measurement System User Manual
Distortion
Noise
+
(
)
+
+
=−+
Bandwidth
fnf=+
*
To select the IMD function, press the
Each further press toggles between the
SINAD Measurement
The A2/A2-D is also capable of measuring the SINAD value, although there is no special key
provided for this function. This is because of the SINAD function being very closely related to
the THD+N function.
The THD+N value quantifies the distortion of the signal, while the SINAD value expresses
the purity of the signal.
THD N
+ =
Signal Distortion Noise
+ +
From that follows
SINAD
From these equations we can see, that the SINAD value is the reciprocal value of the
THD+N.
• If expressed in a logarithmic unit (dB), the reciprocal value can be found by simply inverting the sign of the result.
• If expressed in a linear scale (%),the reciprocal value can be calculated by building the
reciprocal. However, expressing the SINAD in % is not common.
NOTE The SINAD value, expressed in dB, is the negative of the THD+N value,
expressed in dB.
( )
1
=
THD N%%
+
Equation 2 SINAD Calculation
and SINAD
and SINAD dB THD N dB
Signal Distortion Noise
=
( )
Distortion Noise
( )
+
Example
THD+N = -70dB ⇒ SINAD = 70dB
THD+N = 0.03% ⇒ SINAD = 3333
V3.1 51 / 104
Page 52

User Manual A2 Audio Test & Measurement System
Bandwidth
fnf=+
*
To select the IMD function, press the
Each further press toggles between the
IMD Function
IMD (Intermodulation Distortion) is another form of distortion measurement. The device under
test (DUT) is stimulated with a signal being composed of a low frequency and a high frequency tone.
If the DUT produces non-linear distortions, new frequencies will be added to the stimulating
signal. These distortion products are measured and set into relation to the total output signal
of the DUT, consisting of the stimulus plus the distortion products. The IMD value is a ratio
expressed in dB or in %.
Fig. 20 IMD Measurement Principle
The advantage of the IMD measurement function, in comparison to THD+N, is that its dualtone stimulus comes much closer to reality than a single tone test signal.
Furthermore, distortions can be measured up to higher frequencies, since the required
bandwidth is only
2 1
where n is the order of the distortion product.
The high-frequency signal component f2 can be set to any frequency above 4kHz. This al-
lows also to perform IMD sweeps. The 4kHz limit avoids, that intermodulation products are
filtered out by the highpass filter, i.e. that possible harmonics of the low-frequency tone would
not to be measured.
<IMD> button, which is identical to the
<THD+N> key, until the LCD shows IMD.
THD+N and IMD measurement functions.
52 / 104 V3.1
Page 53

A2 Audio Test & Measurement System User Manual
D. This is indicated by
Sidebands
Activation of the IMD measurement function will automatically make the
actual IMD test signal the output signal of the A2/A2the illuminated ALT LED on top of the <GEN SIGNAL> button.
The type of the IMD test signal is displayed in the generator status line on
top of the METER display (see chapter Standards below).
The frequency range of the higher frequency is limited from 4kHz to 40kHz. The displayed
generator frequency represents the frequency of the higher tone, while the lower tone is fixed
to either 60Hz or 250Hz. Should the selected generator frequency exceed this range, then it
is automatically set to the min / max allowed IMD frequency.
The displayed readbck level equals the RMS level of the output signal.
The displayed IMD value is calculated according to
The maximum IMD result is limited internally by the A2/A2-D to 10%, which equals -20dB.
Higher values would overload the reference circuitry.
Since the Crest factor of the IMD signal is higher than the one of a pure sine signal, the
maximum output level has to be limited too, in order to ensure that the output amplifier does
not clip at the maximum peak amplitude. Obviously, the maximum IMD amplitude depends
on the selected standard 1:1, 1:4 or 1:10 (see next chapter).
IMD
=
Signal f Sidebands
+( )2
Standards
Both the frequency of the lower tone f1 and the level ratio of the two tones are standardized.
Since several standards exist, the A2/A2-D was designed to allow IMD measurements according to all these standards.
The list of the implemented standards is given below.
DIN 45403/4 Frequency f2 shall be either 4kHz or 5kHz. The amplitude ratio shall be
IEC 268/3 The frequency f2 shall be 8*f1. f1 shall be preferably 250Hz. Amplitude
SMPTE Low frequency shall be 60Hz. High frequency either 7kHz or 8kHz. Ampli-
Some standards fix the high frequency to 7kHz or 8kHz. However, it may be useful to vary
the high frequency over the entire frequency range. Therefore, the A2/A2-D allows to set the
high frequency freely in the range from 4kHz to 40kHz.
preferably 4:1 but 10:1 is also allowed.
ratio is 4:1
tude ratio 4 : 1.
To select one of the available standards, enter the IMD
Default menu, by double-pressing the <IMD> button.
The menu shows a list of the two low frequencies 60Hz and
250 Hz and the three amplitude ratios 1:1, 4:1 and 10:1.
Use the <SCALE> softwheel to move the arrow to the required selection, and push the wheel once to activate the
selection. The menu closes automatically after the selection.
To leave the menu without altering the current signal, select
EXIT or press any other key.
V3.1 53 / 104
Page 54

User Manual A2 Audio Test & Measurement System
Unit
The IMD measurement result may be expressed either in dB or %, selected through the
<UNIT> button.
Filters
As shown in Fig. 20, the IMD measurement requires a special demodulation circuit and fixed
filters. All these filters are set automatically when activating the measurement function IMD.
Consequently, no other filters are allowed to be used for IMD measurement - thus, the whole
filter bank is disabled.
Applications
Intermodulation distortion measurements are of advantage in comparison to THD+N measurements especially in the higher frequency range, where a THD+N measurement requires a
fairly large bandwidth. Furthermore, the stimulation of a DUT with two in parallel comes
closer to the reality than a single sine stimulus.
IMD test are often used to characterize the non-linear distortions of amplifiers, mixers, compressors, etc.
54 / 104 V3.1
Page 55

A2 Audio Test & Measurement System User Manual
Noise Function
The Noise function of the A2 measures noise according to the CCIR Recommendation 468/3
and 468/4, in either absolute or relative terms. The signal path in the Noise function includes
either the Audio bandpass filter or the weighting filter defined in the above standard. The internal rectifier of the A2/A2-D always measures Quasi-peak in function Noise.
The Quasi-peak rectifier is a RC-network that has a very short attack time but quite a long
decay time. This type of rectifier especially weights the spikes in the noise signal, so that the
result corresponds closely to the audibility of the signal.
Nevertheless, some applications (e.g. signal -to-noise ratio require to measure noise RMS
rectified, maybe even with a specific weighting filter. The A2/A2-D can also perform these
measurements in the LEVEL function with the corresponding filter (e.g. A-weighting).
To perform a Noise measurement, apply the signal to be measured to the active input connector and press the <NOISE> key.
Each further press to the <NOISE> button will toggle between the absolute and relative
Noise measurement function, denoted by NOISE and N.REL in the display. Select NOISE for
absolute measurements.
The METER display shows the result together with the weighting mode on top, along with the
generator / input level and frequency.
If a signal consisting of random noise is applied to the A2/A2-D, the frequency reading will
not be stable, since no periodic signal is found.
Units
The available units in function Noise are dBq and Vq , where the "q" stands for Quasi-peak
rectified. The reference voltage (0dBq) for the Quasi-peak rectifier is 0.775V.
Filters
Noise measurements can be done either weighted or unweighted, whereof in both modes a
specific weighting filter is active. This is necessary according to the standards, since unlimited bandwidth would lead to an unlimited high noise signal.
• Press the <WTD UWTD> key to enter the weighted mode, where the CCIR-468/3 filter is
active (LED WTD lights up).
• If the unweighted mode is selected, the 22Hz-22kHz Audio Bandpass is activated
automatically (LEDs UWTD and 22 -22k are lit).
V3.1 55 / 104
Page 56

User Manual A2 Audio Test & Measurement System
Fig. 21 Noise Weighting Characteristics
Applications
Noise measurements are helpful if the noise content of the signal is dominant, e.g. to
measure the minimum output level of an amplifier. Please notice, that it is essential to terminate the inputs of the DUT properly, in order to avoid the introduction of external noise.
NOTE Do not use the Noise function to evaluate the Signal-to-Noise ratio. The
reason is, that the Noise mode of the A2/A2-D measures according to the
CCIR standard (peak-weighted), while for the S/N ratio, a RMS-weighted
measurement has to be executed (see p. 48).
56 / 104 V3.1
Page 57

A2 Audio Test & Measurement System User Manual
To define the reference noise level, apply
U
U
U
Noise Relative Function
In opposition to the absolute Noise function, that measures against the fixed reference of
0dBq = 0.775V, the Noise Relative mode allows to make any input signal the reference level.
To perform a Noise Relative measurement, push the <NOISE> button until N.REL appears
on the LCD.
Every push to the <NOISE> button toggles between the two functions NOISE and N.REL.
the desired signal to the main input
channel and press the <SET REF> button. This reference value is shown in the
bottom display in the generator unit.
Now apply the signal to be measured to
the analyzer. The displayed result reflects the ratio of the input noise level to
the stored reference.
Keep in mind, that the reference value remains active even after switching Off the system.
Furthermore, please notice that the reference noise level does not equal the reference levels
of other relative measurement functions (e.g. Level Relative).
Units
The Noise Relative function offers several units, which can be chosen through the <UNIT>
button.
Unit lin/log Calculation
*1 lin
% lin
dBr log
Filters
Like Noise measurements, Noise Relative can be measured as well either weighted or
unweighted (see p. 55).
• Press the <WTD UWTD> key to enter the weighted mode, where the CCIR-468/3 filter is
active (LED WTD lights up).
• If the unweighted mode is selected, the 22Hz-22kHz Audio Bandpass is activated
automatically (LEDs UWTD and 22 -22k are lit).
U
IN
REF
U
IN
⋅100
REF
U
20 ⋅log( )
IN
REF
V3.1 57 / 104
Page 58

User Manual A2 Audio Test & Measurement System
NOTE In the Noise Relative measurement function, the weighting by a CCIR 468
filter applies to both the input and reference signal. Therefore, the gain
with and without the filter is equal at 1kHz only.
58 / 104 V3.1
Page 59

A2 Audio Test & Measurement System User Manual
U
U
Crosstalk Function
The Crosstalk function - also called Stereo Separation - measures the interaction from one
channel to the other. The measurement is done by sending a sine signal through the one
channel, while the selective output level of the other channel (the one that is not stimulated),
is measured at a certain frequency. The resulting level ratio between the muted channel and
the active channel is the Crosstalk value.
Like with the Level Relative function, the Crosstalk measurement is performed by inserting a
narrow bandpass filter into the analyzer path.
To measure the Crosstalk, connect the generator outputs of the A2/A2-D with the inputs of
the device under test (DUT), and the two output lines of the DUT with the input channels A
and B of the A2/A2-D.
Then press the <CROSSTALK> button once, so that the display will show XTALK. Each further push toggles the function between XTALK and L.SEL.
The generator output of the active analyzer channel is automatically muted, in order to sim-
plify the Crosstalk measurement. Furthermore, the selective bandpass filter is inserted automatically into the analyzer path of the active channel, and tuned to the oscillator frequency.
The frequency range of the filter is from 10Hz to 50kHz.
NOTE The Crosstalk value depends very much of the frequency. Since most
Crosstalk is caused by capacitive or inductive coupling, an average increase of 6dB per octave and coupling element will result.
Units
Since the Crosstalk result is a ratio of two levels (relative value), it can be expressed in units
with no dimension only. Following units may be chosen through the <UNIT> button.
Unit lin/log Calculation
U
Active filtered
*1 lin
% lin
dBr log
( )
Inactive
U
Active filtered
( )
⋅100
Inactive
20⋅log( )
( )UUActive filtered
Inactive
Filters
The Crosstalk measurement automatically inserts the narrow bandpass filter (see Fig. 22)
into the active analyzer path.
V3.1 59 / 104
Page 60

User Manual A2 Audio Test & Measurement System
Fig. 22 Narrow Bandpass Filter Characteristics
Furthermore, in order to limit the measured bandwidth and / or to reject hum components in
the measurement signal the standard filters (400Hz HP and audio BP) may be activated.
External Source
The A2/A2-D is also capable to measure the Crosstalk from any external source like a CDplayer or a test tape instead from its own generator. The only difference to the previously
described method is, that the tracking/receive filter has to be controlled and tuned to the input frequency instead of the internal oscillator.
This can be done by pushing the <INT EXT> button
once, so that the LED behind the EXT sign lights up.
The rest of the procedure is exactly the same. The track
or tape with the test signal has to be fed to the inactive
input channel while the quiet channel is fed to the active
one.
NOTE It is advisable to measure Crosstalk not only from chn. A to B, but also
from chn. B to A. There might be noticeable differences in the results.
60 / 104 V3.1
Page 61

A2 Audio Test & Measurement System User Manual
On the other hand, pink noise exactly
frequency
, the
measured result will show a constant level
Level Selective Function
The Level Selective measurement function measures the RMS level of the input signal but,
by applying a narrow bandpass filter to analyze a small frequency band only.
To enter the Level Selective measurement function, press the <L.SEL> button one or two
times, so that the LCD shows L. SEL. Each further press to the button toggles the measurement mode of the A2/A2-D between XTALK and L.SEL.
Filters
In L. SEL mode, the displayed result equals the RMS energy content of the signal, measured
behind a narrow bandpass filter. This filter is of 2nd order with Q = 5 and a constant relative
bandwidth. This means, that the filter characteristic has the same shape if plotted vs. a logarithmic scale, regardless of the actual frequency to which it is set.
The characteristic of the narrow BP filter is the same as plotted in chapter Crosstalk Function,
p. 59.
This filter type has the advantage of being tunable over the whole Audio range up to 50kHz,
and of having a constant Q factor over the entire frequency range.
With its constant relative bandwidth, the energy content of white noise under the filter is not
constant but increases with 10dB/decade.
For instance, the thermal noise of electronic devices typically shows a linear distribution, i.e.
very similar to white noise. Therefore, if analyzed with the Level Selective measurement
function, the result will rise proportional to the frequency.
NOTE When analyzing white noise with the level selective function of the
A2/A2-D, the analyzed amplitude will increase by 10dB/decade if plotted
against the logarithmic frequency axis.
compensates this effect with its constant
amplitude vs. the logarithmic
axis (decrease of 10dB / decade vs. the
linear frequency axis).
Consequently, if pink noise is analyzed
with the Level Selective function
vs. the logaritmic frequency axis.
In practice, this effect may be used to evaluate the frequency response of a device under test
(DUT) while being stimulated with a broadband stimulus.
V3.1 61 / 104
Page 62

User Manual A2 Audio Test & Measurement System
To do this, simply set the generator of the A2/A2-D to Pink Noise and record a sweep with
the Level Selective function - the resulting curve will reflect the frequency response of the
DUT.
External Source
To control of the center frequency of the bandpass filter, proceed in either of the two ways
described below.
1. Lock the center frequency of the filter to the generator output frequency
2. Let the center frequency synchronize to the dominant frequency of the input signal.
The locking to the generator frequency has the main advantage of a faster settling. It is
therefore recommended for all measurements where the generator acts as the signal source,
and where the DUT shows no frequency shifts.
The second method, i.e. synchronizing the bandpass filter to the input frequency, is best fitted for all measurements where the stimulus of the DUT comes from an external generator
(e.g. measurements from a tape or a remote A2/A2-D).
Hint The status of the <INT EXT> key only has an effect for measurement functions with
variable filters, such as THD+N, L.SEL and X-TALK.
To set the control of the center frequency to either mode use the <INT
EXT> button. Each press toggles between the two settings.
• INT means, that the frequency is
locked to the generator frequency.
• EXT will lock the center frequency
of the bandpass filter to the dominant input frequency.
Units
Since Level Selective is an absolute measurement, the available units are the same as for
the measurement function Level (V, dBV, dBu / dBm).
Applications
• Spectral analysis of stationary signals.
• Accurate level measurements below the wide-band noise floor.
• Accurate frequency analysis in a noisy environment.
62 / 104 V3.1
Page 63

A2 Audio Test & Measurement System User Manual
Wow & Flutter Function
Wow and Flutter (W&F) describes the frequency modulation, that is introduced by an irregular motion of the recording medium (e.g. a tape), during the recording or reproduction process.
• Wow describes the modulations within the frequency range of 0.5Hz - 6Hz, which is
perceived as a fluctuation of the pitch.
• Flutter covers frequency modulation in the range of approx. 6Hz - 100Hz results in an
increase of the roughness of the sound.
The W&F function measures the Wow and Flutter of tape recorders and turntables, either
weighted or unweighted, according to various international standards, from either a 3.15kHz
or 3kHz signal. Though several standards exist, they fall into two groups; within these
groups, the standards are functionally identical.
One group consists of IEC 386, DIN 45 507 , BS 4847 and CCIR-409. They measure with
quasi-peak rectifier.
Fig. 23 W&F Weighting Filter Standards
The other group, comprising of NAB and JIS C 5551, measures with a VU-like response.
Both groups use the same weighting curve.
The IEC group normally measures from 3.15kHz, and the NAB group from 3kHz. However, in
the A2/A2-D measurements may be made according to either standard and frequency; there
is no need to buy two different test tapes.
V3.1 63 / 104
Page 64

User Manual A2 Audio Test & Measurement System
Standards
All standards described before can be selected out of the
W&F menu, that may be opened by a double-click ot key <W
& F>.
Move the arrow to the standard of your choice by turning the
<SCALE> wheel, and confirm by pushing the wheel. Alternatively, leave the menu through the EXIT entry or by pressing
any key.
Any time you enter the W&F functi on now, the last selected
standard is applied. Furthermore, it is displayed right of the
W&F sign on the METER display.
The generator is automatically set to the selected frequency in the W&F mode. When
switching to another measurement function (e.g. Level), the generator frequency is set back
to the previous value. This "intelligence" allows e.g., to execute very quickly a Level measurement at 1kHz, switch over to W&F at 3.15kHz and then measure THD+N at 1kHz without
the need to access the generator frequency.
W&F Measurements (Replay only)
For this measurement method you need a standard W&F test tape.
1. Connect the replay output of the recorder under test to the active input of the A2/A2 -D.
Load the standard wow and flutter test tape. Make sure, that the settings of the frequency
corresponds to the test tape.
2. Press the <W&F> and <METER> buttons. One of the LEDs over the <WTD UWTD>
button will be lit, indicating either the weighted (W&F filter active) or unweighted (audio
bandpass filter active) mode. Select the appropriate filter through the <WTD UWTD> key.
3. Start the tape in the replay mode. The LCD will show one measurement of Wow & Flutter
in big digits, and one of Drift on the bottom line, both as a percentage. The wow & flutter
result will also be shown on the bar-graph.
4. If the input level from the recorder is too low, the message INP LOW will appear.
NOTE The A2 does not strictly measure drift, but rather speed error. Drift is the
difference in speed between the beginning and end of a tape or disc.
Therefore, to measure drift, you will need to take two measurements, one
near the beginning and one near the end, and subtract one from the
other. Be careful if one has a positive and the other a negative result!
W & F Measurements (Record to Replay)
The procedure is basically the same as before, except that the blank tape has to be recorded
first. To do this, proceed as follows.
1. Connect the generator output of the A2/A2-D to the record input of the recorder.
2. Load a blank tape.
3. Start the tape machine in the record mode.
4. After a suitable length of recording (usually at least 30 seconds), rewind the tape and
restart in the replay mode.
64 / 104 V3.1
Page 65

A2 Audio Test & Measurement System User Manual
NOTE Don't measure wow and flutter whilst actually performing the recording,
because W&F at some frequencies will be canceled out, and the measurement will be lower than the truth. Frequencies which will be canceled,
are those where the delay from the record head to replay head is an exact multiple of the time period (duration of one cycle) of the wow frequency. The effect is that of a comb filter.
For the same reason, to get a more reliable result, rewind and repeat the measurements
several times, and average the results. Only one recording is necessary.
W&F Signal Analysis
By pressing the <SCOPE> button, the waveform of the demodulated wow & flutter signal will
be displayed on the screen. Regular periodic wow & flutter can be identified from this wave form. From the frequency, the offending rotating components can be deduced (capstan,
pinch wheel, idlers, intermediate wheels, etc.)
V3.1 65 / 104
Page 66

User Manual A2 Audio Test & Measurement System
Phase Function
This function evaluates the interchannel phase in degrees, i.e. it measures the phase shift of
the active channel against the inactive channel (reference channel). The phase correlation of
the two channels is displayed in the full range of ±180° degrees.
To enter the Phase measurement function, press the <PHASE> button. The LCD will show
PHASE and the measurement result.
A positive measurement result, e.g. +30°, with channel A being active, means that the signal
of channel A passed the zero volts line 30° before the signal of channel B did.
The <UNIT> button has no effect in the PHASE function, due to the fact that degrees is the
only available unit.
NOTE The max. allowed level difference between the input channels is 18dB.
Applications
• Phase response of the device under test (output to input).
• Phase relation of the two output channels.
• Tape head azimuth adjustments.
66 / 104 V3.1
Page 67

A2 Audio Test & Measurement System User Manual
Filter Overview
The table below list all standard and optional filters of the A2/A2 -D, and indicates their
availability for the different measurement functions (ü = available; ! = compulsory).
Meas.
Function
LEVEL ü ü - - - -
L.REL ü ü - - - -
THD+N ü ü
IMD - - W&F - - - - ü - - - - NOISE N.REL XTALK ü ü - - - - - - - -
L.SEL
PHASE - - - - - - - - - -
/400Hz
LP
ü ü
/22-22k\
Audio BP
!4
!4
Notch IMD W&F CCIR-
- - -
!
!
- - -
- - -
- - - -
486
- - - - - -
!4
!4
AO4
A-weight.
AO5
AO13
User
C-mess.
ü3
ü3 ü3 ü3 ü3
ü3 ü3 ü3 ü3
ü ü ü ü
ü3 ü3 ü3
- - - -
- - - -
AO14
80kHz LP
Table 4 Filter Availability
ADDITIONAL Function
If equipped with the Digital Option (order code: AO10), the A2/A2-D can offer even more
measurement functions, which may be very helpful for some applications.
In this case, the corresponding measurement mode may be entered through the
<ADDITIONAL> key (the second function of the <PHASE> key). Each press to this button
toggles between the functions <PHASE> and <ADDITIONAL >. If no digital option is installed,
the A2/A2-D will remain in the Phase measurement function.
Please refer to the AO10 User Manual for further information.
3
One filter option may be activated at a time only, while both the 400Hz LP and 22Hz-22kHz BP will be de-
activated
4
Either the 22Hz-22kHz (UWTD) or CCIR486 (WTD) filter is active in measurement function NOISE / N.REL
V3.1 67 / 104
Page 68

User Manual A2 Audio Test & Measurement System
6. SWEEPS
The A2/A2-D is not only capable to measure single values but also has a built-in set of powerful sweep capabilities, that enable the user to record complete graphs in a few steps.
Following sweep modes are supported, allowing to record almost all available measurement
functions of the A2/A2-D against various parameters.
• Frequency sweeps, internally controlled by the generator
• Frequency sweeps, controlled by an external source
• Frequency sweeps, controlled by the generator with av fixed interval per step (tape
sweeps)
• Amplitude sweeps, controlled by the generator
• Time sweeps
• Table sweeps, where discrete sets of frequency / level pairs are stored in the internal
memory of the A2/A2-D (requires RS232 or IEEE interface option)
All these sweep types can be performed at either LOW or HIGH resolution (number of samples between the start / stop values). Pleas notice, that not all measurement functions can be
swept in all available modes (e.g. W&F cannot be swept at all).
NOTE Several sweeps can be recorded, re-scaled and printed in the same
graph and up to four complete graphs can be stored in the internal
memory of the A2/A2-D for later use and printout.
Preparing a Sweep
Sweeps are normally visualized in the GRAPH display mode, that can be entered any time
by pressing the <GRAPH> button. Keep in mind, that even during the preparation or execution of a sweep, all three display modes (METER, GRAPH and SCOPE) may be entered.
To prepare a sweep, firs t define the sweep limits, i.e. the start / stop values. Although the
A2/A2-D offers default settings, they can be adapted individually to the actual demands.
Next, the resolution, i.e. the number of measurement points between these limits, has to be
set. Last but not least, select the measurement function to be recorded.
After starting the sweep, the A2/A2-D takes over control of the entire process, including
ranging and display scaling. It automatically chooses internal settling parameters, to make
the sweep as fast, but as accurate as possible too. Almosr simultaneously, the recorded
curve becomes visible in the GRAPH display.
If necessary, the recorded curve can be kept in the internal memory of the A2/A2-D, together
with the following one etc. In this way, up to six traces may be stored in one graph.
Of course, the complete analysis of a DUT may consist of several graphs, acquired with different measurement functions. Therefore, four complete graphs can be stored in the internal
memory of the A2/A2-D. Please refer to the following chapters for further details.
Selecting the Sweep Mode
The A2/A2-D is able to perform several sweep types. They can be chosen from the menu
behind the <SWEEP MODE> button (refer to chapter Sweep Modes for further details).
68 / 104 V3.1
Page 69

A2 Audio Test & Measurement System User Manual
button. The arrow in the menu can be moved
define some more parameters of the
ypress will close the menu without
Activate the Sweepmode menu by a double-click to the
<SWEEP MODE>
to the required entry with the <SCALE> wheel. Confirm your
selection by pushing the wheel once.
Some entries, like Tape Freq and Time Swp have a further
menu behind, that allows to
specific sweep type. The detailed explanations of these parameters are given in the description of the corresponding
sweep type.
The menu closes automatically after the confirmation. Selection
of the entry EXIT or any ke
any change.
Setting the Sweep Limits & Resolution
In the sweep modes Frequency and Amplitude, the limits of the sweep can be chosen freely
in the range of the internal generator.
This is done by setting the generator to the required start value (in Frequency mode: the start
frequency - in Amplitude mode: the start level) and pressing the <START VALUE> button.
Consequently, the A2/A2-D accepts the current generator frequency / level value as start
value and re-scales the X-axis of the graph.
To define the stop value, proceed the same way, but press the <STOP VALUE> button. Consequently, the X-axis will show the user-defined sweep range.
NOTE The start value doesn't need to be lower than the stop value - it is also
possible to sweep from a higher to a lower frequency / level by setting
the start & stop values accordingly. Nevertheless, the x-axis will always
drawn in increasing order from left to right, even if the sweep is performed in the other direction.
The resolution of the sweep can be set to two stati, either LOW or HIGH. High resolution
sweeps are performed if the accuracy is important, while the low resolution is chosen if
speed is the major issue.
The table below lists the possible ranges of the LOW / HIGH resolution.
V3.1 69 / 104
The number of points can be altered by the user for both settings by double-clicking the <RESOLUTION> key in the corresponding status.
This will open the Resolution menu, showing the actual number
of points. Turn the <SCALE> wheel to increase or decrease
the number and push the wheel to confirm the selection.
Page 70

User Manual A2 Audio Test & Measurement System
RES Min Max
LOW 2 50
HIGH 30 200
Performing a Sweep
As soon as the sweep parameter definition has been finished, the only step remaining is to
start the sweep by pressing the <DO SWEEP>> / <STOP> button.
This button starts a new or stops a running sweep. Keep in mind, that a running sweep will
be processed and scaled automatically.
NOTE If the sweep doesn't start after the DO SWEEP command, then the sweep
mode is most probably set to external.
Synchronization (Internal / External)
Normally, the variable sweep parameter (e.g. frequency) is controlled internally by the generator of the A2/A2 -D, so that the analyzer may be synchronized automatically to this parameter.
Nevertheless, there are also applications, where the variable sweep parameter is generated
externally, so that the analyzer of the A2/A2 -D must synchronize itself to this parameter.
Unfortunately, this cannot be done for all of the three available sweep parameters. For instance, synchronization to the externally generated, swept amplitude of an amplitude sweep
is not possible.
In practice, the synchronization of the A2/A2-D analyzer is necessary for THD+N, Level Selective and Crosstalk measurements. Each of these functions comprises a specific tracking
filter, i.e. a notch or bandpass filter with variable center frequency, that must be synchronized
to the generated frequency.
Table 5 provides an overview over the available synchronization modes for internally and
externally controlled sweeps.
Sweep Type Internal Control External Control
Frequency Sweep Yes Yes
Tape Frequency Sweep Yes Yes
Amplitude Sweep Yes No
Time Sweep Yes Yes
Table Sweep Yes No
Table 5 Sweep Synchronization Modes
70 / 104 V3.1
Page 71

A2 Audio Test & Measurement System User Manual
Reso
To set the sweep mode to external synchronisation, set the <SWEEP MODE> button to EXT.
In this mode, the tracking filter and the sweep measurements are controlled by the frequency
counter of the active A2/A2-D analyzer channel.
Please refer also to chapters Frequency Sweep and Tape Sweep for further information.
In position INT, the control of the sweep and the tracking filter is done by the
internal oscillator of the A2/A2-D.
This mode is much faster than external sweeps, since both the tracking filter
and analyzer get the frequency information directly from the generator.
Sweep Recording
Keep a Recorded Trace
To keep a recorded trace on the screen, open the Graphics menu by double-clicking to the
<GRAPH> button in the GRAPH display mode. Move the arrow to the entry Keep Sweep and
confirm by using the <SCALE> softwheel.
Store & Recall Sweeps
The A2/A2 -D also offes the possibility to store the actual graph to one of three available
memory locations. The stored information comprises the measurement function, the sweep
mode, the actual set of kept traces, the scaling and the time & date of the internal real-timeclock. The memory is battery backed -up, so that the instrument may be disconnected from
mains power and moved to another locations to get the print-outs etc.
To store a graph, select the menu behind the <GRAPH> button, and select one of the three
Save to Mx entries by using the <SCALE> wheel. A push on the wheel confirms the selection
and stores the Graph.
Depending on the resolution and the measurement function, up to 6 traces can be recorded
per graph. The minimum capacities are
Consequently, the last recorded trace will be stored permanently. Any new sweep curve will be added to the same graph
as long as actual the measurement function is not altered.
• To clear the current graph, use the command Del Kept. This
command deletes all kept traces, but leaves the actual trace
untouched.
• If you wish to delete the last (not yet kept) trace, use command Del Actual.
Keep in mind, that a recorded trace can be printed out only, if it
has been kept before.
Function
LOW HIGH
1-CH 6 2
2-CH 3 1
lution
V3.1 71 / 104
Page 72

User Manual A2 Audio Test & Measurement System
Table 6 Minimum No. of Recordable Sweep Curves
To recall a stored graph , open the Graphics menu and select one of the Recall Mx menu
entries. This process also re-activates the instrument set-up, that was active when the graph
was saved. Recalling a graph does not clear the corresponding memory.
When moving the arrow along the Recall Mx entries, the bottom line of the LC display shows
the stored time & date of the graph stored therein. If no graph has been stored in the corresponding memory location, NO DATA is shown instead. This feature simplifies the identifaction of stored graphs.
NOTE When recalling a graph, the actual graph on the display will be overwrit-
ten.
As soon as a graph has beeen recalled, additional traces may be recorded and added. The
only limitations are given by the number of recordable traces and the measurement function,
that must not be changed.
In other terms, if the measurement function is changed after having recorded one or more
sweeps, all displayed curves will be deleted. Nevertheless, previously stored graphs are not
affected by this.
72 / 104 V3.1
Page 73

A2 Audio Test & Measurement System User Manual
Sweep Modes
Frequency Sweep
The most common sweep type is the internal frequency sweep, where the frequency is the
variable sweep parameter, generated by the A2/A2 -D. This sweep type is best suitable for
DUTs that don't show a too long (< 2s) time delay between their in- and outputs. Obviously,
the in- and outputs must not be loceted too far apart, so that they can be wired-up through
cables to the A2/A2-D.
To perform an internal frequency sweep, proceed as follows.
1. Select the measurement function for the sweep (all functions available except W&F).
2. Enter the display mode to GRAPH by pressing the <GRAPH> button.
3. Activate the frequency sweep mode by double-clicking to the <SWEEP MODE> button
and selecting the entry Frequency. Consequently, the bottom line of the display will show
the actual sweep mode: Frequency LOG.
4. Use the <LEVEL> wheel to adjust the required generator output level. This setting will be
displayed on top of the screen. The level of the generator will not vary during the sweep.
5. Set the limits for the frequency sweep by using the <START VALUE> and the <STOP
VALUE> keys. Next, choose the resolution that meets your demands.
6. Press <DO SWEEP> to start the sweep. The status line at the bottom of the display will
show Freq RUNNING while the sweep is performed and switch over to Freq complete as
soon as the sweep is finished. You may abort a running sweep at any time by pressing
<DO SWEEP / STOP> again. The next push of the <DO SWEEP> button will re-start another sweep recording and replace the previous trace.
NOTE Each new sweep replaces the old one as long as the actual trace has not
been kept (see chapter Keep a Recorded Trace).
Y-Axis Units and Scaling
The <UNIT> button allows to set the unit of the Y-axis (measurement function). Please notice, hat the graph with all recorded traces will be re-calculated and re-drawn upon a change
of the unit.
To change the scaling of the Y-axis, use the <SCALE> wheel as described in chapter
GRAPH Display Mode (p. 38).
Re-Scaling of the Frequency Axis
If a sweep has already been recorded, but the displayed frequency range is too large, it can
be adjusted easily by re-setting the Start- and Stop-frequency.
Set the generator frequency to the desired value of the lower / upper border of the frequency
range. Next, press the <START VALUE> / <STOP VALUE> button respectively. Consequently, the recorded graph will be re-drawn in the new range.
NOTE The recorded graph is not measured again, but re -drawn in the new
range only. The parts of the curve(s) outside the displayed graph are not
lost, but just not visible. It is therefore always possible to return to the
original frequency range.
V3.1 73 / 104
Page 74

User Manual A2 Audio Test & Measurement System
Frequency Sweeps in Different Measurement Modes
The A2/A2 -D2 can perform frequency sweeps in the measurement functions Level, Level
Relative, Level Selective, THD+N, IMD, Noise, Noise Relative, Crosstalk and Phase, but not
Wow & Flutter.
NOTE It is useless to perform a LEVEL, L.REL, NOISE or N.REL sweep without
stimulating the DUT with a signal. Since all these measurement functions rectify the wideband signal, the absence of a stimulus would result
in no A2/A2-D input signal variation at all, i.e. the measured result would
be stable for all frequencies, regardless of the charactristics (e.g. frequency response) of the DUT.
Graphics Cursor
When turning the <FREQUENCY> softwheel after having recorded a sweep curve, a crosshair becomes visible in the graph at the gene rator frequency, while the bottom line of the
LCD will show the interpolated measurement value.
The cursor disappears as soon as the upper or lower end of the frequency axis is reached
and it is brought back as soon as the generator frequency is in the displayed range again.
In case of a 2-channel measurement, the cursor is assigned to the curve of the main channel, which is drawn in black. If you wish to measure the curve of the alternate channel, simply
press the <A / B> key to toggle the active channel. The graph is re -drawn with inverted line
style and the cursor is available on the other trace.
Keep in mind, that the cursor is not printed out with the curve.
74 / 104 V3.1
Page 75

A2 Audio Test & Measurement System User Manual
s the quality and stability
Tape Sweep
Tape sweeps are very similar to "normal" frequency sweeps, except that the frequency steps
last for a predefined duration. In other terms, with a normal frequency sweep, the generator
will change its output frequency as soon as the analyzer has successfully executed a valid
measurement, while with a tape sweep, the generator will let each frequency present for a
fixed time, regardless of the status of the analyzer.
To fully understand this approach, pleas read the subsequent explanation.
The A2/A2 -D has a built-in algorithm to ensure taht only stable signals are measured. In
practice, several consecutive samples are recorded and tested for stability. If these samples
are not stable enough, more samples are recorded until the stability criteria is met.
The required duration to get a stable measurem ent result strongly depends on the selected
measurement function and the stability of the incoming signal. Normally, the required time for
the data settling is rather short (typically ~200-500ms). However, this duration cannot be
predicted exactly and is never constant.
Therefore, in order to allow the recording of a sweep even under worst-case conditions
(THD+N measurement at very low frequencies) a special sweep mode has been introduced
in the A2/A2-D. This mode is called Tape Sweep.
Actually, a tape sweep consists of a stepwise rising generator frequency, with fixed time intervals between the steps. The user-defined sweep parameters as well as the analysis and
post rocessing capabilities are identical with the normal frequency sweep mode.
Recording a Tape Sweep
To record a tape sweep onto a tape, simply connect the outputs of the A2/A2-D to the inputs
of your tape recording machine. Next, execute the following steps.
1. Enter the GRAPH display mode and set the start- & stop-frequency as well as the resolu-
tion. The required time for the whole sweep is determined by the number of steps multiplied by the time interval.
V3.1 75 / 104
NOTE In some measurement functions, the allowed frequency band is limited
due to physical reasons. For instance, IMD measurements are not allowed to be measured below 4kHz. In these cases, the generator will not
exceed the allowed range.
2. Open the Sweepmode menu by double -clicking to the
<SWEEP MODE> button. Select the -> Setup line push
<SCALE> wheel once.
A sub-menu will open to allow the definition of the step
interval in the range of 0.5s, 1s, 2s, ..., 10s. The fastest
possible setting strongly depends on the selected
measurement function as well a
of the recording. Push the <SCALE> wheel to confirm
your selection.
The bottom line of the LCD shows the mode Tape and
the selected speed, as e.g. 3.0s /Step.
Page 76

User Manual A2 Audio Test & Measurement System
3. Set the generator to 1kHz and to the desired output level. The 1kHz tone is required to
identify the header of the sweep, i.e. to allow the sweep to start automatically.
4. Set the tape machine into the recording mode. The 1kHz output tone of the A2/A2-D shall
be recorded for at least 3 seconds.
5. Press the <DO SWEEP> button to start the tape frequency sweep. By this, the message
Tape RUNNING will be displayed on the bottom line of the LCD.
6. As soon as the sweep is completed, Tape COMPLETED will appear on the bottom line,
indicating that the tape recorder may be stopped, followed by the message Tape
x.x Sec/Step.
NOTE When using a 2-head tape machine, the output of the replay -head may be
connected to the analyzer of the A2/A2-D, in order to directly measure
the response of the DUT.
However, keep in mind that certain tape machines (those with one head
only) provide an "output" signal, that monitors to the preamplifier output, but not the recorded signal.
7. Rewind the tape to the starting point and use the recorded track as the source for an external frequency sweep.
Fig. 24 Tape Sweep
76 / 104 V3.1
Page 77

A2 Audio Test & Measurement System User Manual
n
−
+
1
External Sweep
The A2/A2-D is capable of performing external sweeps, i.e. to synchronize itself to the output
signal of an external device such as a tape recorder or a CD -player. Obviously, the characteristics of such an external signal must correspond to the Tape Sweep described in the previous chapter.
In the external sweep mode, the analyzer will synchronize its tracking filter to the incoming
signal. The recording external sweep will be started through a steady 315Hz or 1kHz tone,
being present for at least 3 second, and followed by a decrease of the frequency. This start
condition complies with the international standards for test tapes.
Preparing an External Sweep
1. Set the A2/A2-D in the GRAPH display mode and select the measurement function you
want to record.
2. Open the Sweepmode menu behind the <SWEEP MODE> key and select Frequency.
3. Set the synchronization to EXT by pressing the <SWEEP MODE> key.
4. Choose the start- and stop -frequency of your sweep as described chapter Setting the
Sweep Limits.
5. Open the Resolution menu behind the <RESOLUTION> key and enter the expected
number of sweep samples. This value is used by the A2/A2-D to calculate the frequency
increments. This logarithmic frequency increment is calculated as follows
log( ) log( )
log( )
∆f
NOTE In the external sweep mode, the A2/A2-D will record exactly the number
of points defined through the Resolution menu. Even in case that the external
source provides a higher resolution (i.e. a higher number of frequency steps), the
instrument will perform a measurement only, if an incoming frequency equals the
expected one or is higher than it.
fStart fStop
=
6. Connect the external source to the input of the A2/A2-D through the Device Under Test.
7. Check for the right settings of the external generator and let it start the sweep.
8. If the external sweep starts with a 315 or 1kHz header, the A2/A2 -D will display Freq.
STARTING, to indicate that it is waiting for the sweep to start. The starting condition itself
is an abrupt change from the 315 Hz or 1kHz header tone to a lower frequency.
9. In case of a missing header, the sweep can be started manually by pressin g the <DO
SWEEP> button.
10. Every abrupt decrease of the frequency during the sweep recording is interpreted as
STOP command (see Fig. 24).
NOTE Every analog audio analyzer requires a certain time to settle on the in-
coming frequency. For this reason, only stepped frequency sweeps may
be processed. Preferably, use the Tape Sweep of the A2/A2-D to get best
results.
Nevertheless, if the increase of frequency is not too fast, even continuos
sweeps may be handled correctly.
V3.1 77 / 104
Page 78

User Manual A2 Audio Test & Measurement System
List of Reference CD Tracks
Stepped Sweeps
• Test CD Hessischer Rundfunk, Track 18-35, 8s/step, LEVEL, THD+N
• PHILIPS Audio Signals disc 1, Track 8-23, 8Hz-20kHz 60s/step (w/o. 1kHz header)
Gliding Sweeps
• DENON Audio Technical CD Track 36, 20Hz-20kHz in 50s, LEVEL
• Test CD Hessischer Rundfunk, Track 36, 20Hz-20kHz in 50s, LEVEL
• PHILIPS Audio Signals disc 1, Track 5, 20Hz-20kHz in 50s (w/o. 1kHz header)
• PHILIPS Audio Signals disc 1, Track 6, 20Hz-20kHz in 120s (w/o. 1kHz header)
78 / 104 V3.1
Page 79

A2 Audio Test & Measurement System User Manual
y double clicking the <SWEEP
entry and push the
of the time sweep,
Amplitude Sweep
The A2/A2-D is capable of performing amplitude sweeps in all measurement functions. Again
in some measurement functions the variation of the level does not have a big influence on
the result which simply is not of interest, e.g. a W&F sweep over the amplitude does not
expect any variation.
Activate the Sweepmode menu b
MODE> button. The menu will appear. Move the arrow with the
SCALE wheel to the entry Amplitude and push the <SCALE>
wheel. The menu closes automatically after the selection. EXIT
or any other keypress leaves the menu without changes.
As soon as you enter the GRAPH display mode, you will find the
X-scale as an amplitude range now. The settings for the sweep
range is done exactly the same way, except that the generator
<LEVEL> wheel is now used for the selection.
Units of X- / Y-axis
The unit of the X-axis may be either linear [V] or logarithmic [dBV], [dBu] or [dBm], while the
unit of the Y-axis must be set in the respective measurement function.
1. Select the amplitude sweep mode as described above.
2. Activate the measurement function Level or 2-CH and choose the unit for the X-axis (V,
dBV, dBu/dBm) by pressing the <UNIT> key.
3. Select the measurement function to be recorded (e.g. THD+N), and set the unit for the Yaxis by pressing the <UNIT> key.
4. Choose the start- and stop -values of the amplitude sweep by setting the generator level
to the respective values and pressing the <START VALUE> and <STOP VALUE> keys.
5. Set the generator to the required frequency (the output frequency will not vary during the
sweep).
6. Start the sweep by pressing <DO SWEEP>.
V3.1 79 / 104
Page 80

User Manual A2 Audio Test & Measurement System
entry and push the
of the time sweep,
Time Sweep
The A2/A2-D offers the possibility to record any measurement function vs. time, e.g. to
monitor the long-term stability of a signal. In this mode, neither the output frequency, level
nor any other generator parameter is altered during the sweep.
To run a time sweep, double-click the <SWEEP MODE> button
to open the Sweepmode menu.
Below Time Swp, select the ->Setup
<SCALE> wheel to open the corresponding submenu. Therein,
you may specify the overall duration
expressed by a number between 3-180 and the dimensions
Seconds, Minutes or Hours.
Make your selection and confirm it by using the <SCALE> wheel
or leave the submenu without a change through the EXIT entry.
By this way, you can specify a time sweep lasting a from 3 seconds only up to one that takes
almost a week to complete.
The scale of the X-axis always starts at time zero. The resolution of the sweep, i.e. the
number of samples to be recorded within the selected sweep duration T [sec], may be set
through the Resolution menu, that is hidden behind the <RESOLUTION> key. Keep in mind,
that the time interval ∆t [sec] equals
and must not be shorter than the settling time, that the A2/A2-D requires for a single
measurement (∼300msec).
The sweep is started by pressing the <DO SWEEP> button.
NOTE The Time Sweep mode is the only one, that allows to enter the GRAPH
display mode in measurement function W&F. In all other sweep modes,
W&F cannot be recorded.
T
∆t
[sec]
Equation 3 Time Sweep Interval Calculation
[sec]
=
NoOfSamples
80 / 104 V3.1
Page 81

A2 Audio Test & Measurement System User Manual
INENERACENRC
S
Table Sweep
As an alternative to frequency sweeps, defined by a start & stop frequency, a fixed output
level and number of points, the A2/A2-D also offers the possibility to execute Table Sweeps.
They are driven by a discrete number of freely defined generator frequencies & levels, at
which the measurement function is recorded. Such a set of frequency / Level pairs is called
sweeptable. Obviously, the output level of a table sweep may be constant, while the set of
frequencies must change.
The table sweep mode allows the user to tailor the sweep characteristics to the specific
demands of the DUT, or even to define a de-emphasis curve as output signal for a sweep.
The definition of a sweeptable has to be done externally of the A2/A2-D on a PC. It may be
downloaded to the instrument either through the serial RS232 or parallel IEEE interface. For
this purpose, both the DOS-based AS03 and the Windows -based AS04 software package
provide the possibility to define and send sweep tables to the A2/A2-D.
In this way, sweeptables can be defined in a te xtfile format (extension: *.SWT) and stored in
the non-volatile memory of the A2/A2-D. Each sweep table may comprise an eight character
string for identification. This string is shown on the LCD of the A2/A2-D as soon as the table
sweep mode is activated. The time & date of the last downloaded sweeptable is displayed in
the bottom line of the GRAPH display when the arrow in the Sweep Mode menu is positioned
besides the entry F-Tab Swp.
Sweep Data Upload to a PC
With the aid of the software packages AS03/AS04, it is also possible to upload all stored
graphs from the A2/A2-D to a PC. The data are available both as tables and as graphics and
may be exported to other PC programs. Fo r further details please refer to the AS03/AS04
User Manuals.
V3.1 81 / 104
Page 82

User Manual A2 Audio Test & Measurement System
I
NTERINTE
RFA
CENTR
C
S
7. PRINTOUTS
Implemented as a standard feature, the A2/A2 -D allows to print out the screen contents in
every display mode through the CENTRONICS interface by pushing the <PRINT> button.
Various printer drivers as e.g. Epson FX-80, LQ-1000, HP Thinkjet, HP Deskjet/Laserjet and
IBM Proprinter are available.
RS 232C (optional)
PR
CE
(
ONI
)
Printer Interface
Printer Driver Selection
The A2/A2-D is very flexible and capable to drive a wide variety of different printers. Actually,
following printer types are supported.
• IBM Proprinters and its compatibles
• EPSON FX-80 and its compatibles
• EPSON LQ-1000 and its compatibles
• HP Thinkjet
• HP Deskjets / HP Laserjet (PCL3 and PCL5 language)
In case that your actual printer is not listed in this survey, refer to the user manual of your
printer for possible emulation modes. Almost all printers may emulate at least one of the
types as listed above. If in doubt, please contact your local printer supplier.
To select the printer driver of your choice, open the Printer
Type menu by double-clicking the <PRINT> button.
The menu offers the list of available printers. Move the arrow
on the left hand side by turning the <SCALE> softwheel and
place it besides the required printer driver. Confirm the
selection by pushing the <SCALE> wheel once.
The two last menu entries, Do FormFeed and RESET Printer
allow to send the respective commands to the printer.
Activation of the EXIT entry or any keypress will close the
menu without changes.
The CENTRONICS printer interface is
located on the rear panel of the A2/A2-D. It is
a 25 -pin D-type connector, of the same type
as in PC-compatible computers.
NOTE The RESET command meets the specific demands of the active printer
driver, i.e. will not be understood by the other (inactive) printer types.
82 / 104 V3.1
Page 83

A2 Audio Test & Measurement System User Manual
Printer Settings
Since there are a lot of possible settings for the different printers, the following list shall give
a quick guide for the DIP switch settings of those printers who have been tested to operate
properly with the A2/A2-D.
EPSON FX-80, IBM Proprinter
Parameter Settings
Page length 8"
Automatic form feed OFF (inactive)
Automatic line feed OFF (inactive)
Automatic CR OFF (inactive)
Print Quality Selectable by user
Graphics density 120dpi
Text density 12cpi
EPSON LQ-550 / LQ-1050
LQ - 550 LQ - 1050
Switch Set Function Set Function
SW1 1 ON Character set USA ON Character set GER
SW1 2 ON Character set USA OFF Character set GER
SW1 3 ON Character set USA ON Character set GER
SW1 4 ON Draft quality OFF Cursive
SW1 5 ON Draft quality OFF Bi-directional print
SW1 6 OFF Condensed printing OFF not used
SW1 7 ON Graphics ON Single sheet
SW1 8 OFF Single sheet ON 6k Buffer
SW2 1 ON 12" Page length ON 12" Page length
SW2 2 ON Skip over perforation OFF Skip over perforation
SW2 3 OFF Switched off OFF Parallel interface
SW2 4 OFF Auto LF OFF Parallel interface
SW2 5 ON 8k Buffer OFF Baudrate (not used)
SW2 6 ON Print bi-directional OFF Baudrate (not used)
SW2 7 OFF 10cpi OFF Hyphenate
SW2 8 OFF 10cpi OFF Auto LF
hp Laserjet, Deskjet
No settings required. All printers with PCL3 or PCL5 language may be controlled in this
mode. This covers almost all HP printers, including the color printer types that support
black&white printouts.
Printer Error
In case that it is not possible to properly communicate with the printer, an error message will
appear on the LC display of the A2/A2-D.
V3.1 83 / 104
Page 84

User Manual A2 Audio Test & Measurement System
Printer ERROR
or no printer connected
The reason for this message may be one of the following.
• Printer not connected to the CENTRONICS parallel interface of the A2/A2-D
• Printer is switched OFF
• Printer is Offline
• No paper in the printer
Any keypress to the A2/A2-D2 lets the error message disappear and return to normal
operation.
84 / 104 V3.1
Page 85

A2 Audio Test & Measurement System User Manual
8. INSTRUMENT SETUP
Store & Recall Setups
The A2/A2-D stores its actual setup when it is switched off. This means, that after the next
power-up, the instrument automatically resumes with the same settings.
Furthermore, the A2/A2 -D offers the possibility to store another setup in an internal nonvolatile memory location.
The stored parameters are the actual
• display mode
• measurement function
• filter(s)
• generator settings
• sweep setup
To memorize a special setup as well as to recall this stored or
to recall the factory settings, open the A2 Setup menu by
double-clicking the <SET REF> key.
Move the arrow to the selection Store Setup and confirm by
turning and pushing the <SCALE> wheel. There is only one
location available for a user-defined setup.
Leave the menu without a change through the entry EXIT or
by any other keypress.
NOTE Keep in mind, that if the default setup is recalled, the current settings are
lost, unless they have been saved before.
Calibration
The A2/A2-D has been designed to require almost no maintenance. Actually, the A2/A2 -D is
able to re-calibrate itself automatically, by measuring the parameters of each internal
amplifier, filter and rectifier. These parameters are stored in a table and used for calculation
of the measurement results.
This re-calibration procedure may be processed if the A2/A2-D is used in extreme
environments, as e.g. with very high / low temperatures or humidity.
Re-calibration of the A2/A2-D should be carried out by qualified personnel only.
To start the re-calibration procedure, proceed as follows.
V3.1 85 / 104
Contact your NTI agent if in doubt.
Page 86

User Manual A2 Audio Test & Measurement System
1. Warm up the instrument for at least 15 minutes!
2. Disconnect all cables from the input and output connectors.
3. Activate the A2 Setup menu behind the <SET REF> button by double-clicking it.
4. Move the arrow to the entry Calibrate A2 with the
<SCALE> softwheel.
5. Confirm the selection by pushing the <SCALE> wheel.
The calibration sequence starts, indicating the actual
step with a message on the display. For interpretation of
the messages, please refer to the A2/A2-D service
manual. The whole procedure takes about two minutes to
measure all the stages.
If the calibration is aborted with an ERROR message in the display, make sure that the unit
has been properly warmed up before and re-try the calibration. Contact your local NTI
distributor in case of several failures in a calibration.
86 / 104 V3.1
Page 87

A2 Audio Test & Measurement System User Manual
Connector Pin Assignment
Centronics Connector
The CENTRONICS 8bit parallel interface is equipped with a female 25-pin D-Sub connector
that is fully compatible to PC computers. Use a shielded standard Printer cable to connect
your printer to the A2/A2-D.
Timing Diagram
RS232 Connector
The RS232 interface is a fully PC compatible serial interface using the female 9 way Sub D
connector. The A2 acts as the DCE unit and has therefore the lines already twisted, so that
the cable to connect to the PC is a straight connected through cable.
The baudrate is selectable in the setup menu. Please refer to Baudrate Selection, on page 90
for their settings.
Pin No Name Type Description
1 +5V Output +5V from A2
2 TXD Output Send DATA
3 RXD Input Receive DATA
4 DTR Input Data terminal ready?
5 RSGND I/O DATA GND
6 DSR Output Data set ready! (+5V)
7 CTS Input Clear To Send
8 RTS Output Request To Send
9 -- -- NC
V3.1 87 / 104
Page 88

User Manual A2 Audio Test & Measurement System
Cable
To connect the A2/A2-D serial interface with the PC, a standard 1:1 cable is required, which
can be purchased easily. When assembling the cable yourself, please follow the wiring
shown below.
Fig. 25 MD9 Male to MD9 Female
88 / 104 V3.1
Page 89

A2 Audio Test & Measurement System User Manual
9. OPTIONS & ACCESSORIES
The following tables list all available options and accessories of the A2/A2D with a brief
description of their characteristics and performance. Please notice, that all options must be
installed by NTI or an authorized representative to maintain the warranty.
Options Overview
Code Article
AO1 RS232 interface with MS-DOS based software package AS03 for remote control
of the analog functions of the A2. The included easy-to-learn Audio Measurement
Programming Language (AMSL) allows to build up sequences and PASS/FAIL
tests for automated applications. Demo disk available.
AO4 A-weighting filter according to IEC 651. The filter may be activated with the
<WTD UWTD> key. For 2-chn. measurements, two filters are required.
AO5 User definable filter . A pre -wired board containing four operational amplifiers
and the switching electronics, but without passive components. The user can
build up a four-pole active filter with freely setable frequency response. For 2 chn. measurements, two filters are required.
AO7 Transformer output option. Adds a transformer behind the electronically
balanced output stage.
AO8 Phantom power option. Installs either +15V or +48V phantom power to both
input channels. Replaces the low input impedance (200Ω / 150Ω).
AO10 Digital option PCB to upgrade an A2 instrument to an A2 -D. The option allows
the generation and analysis of digital Audio signals according to AES and
IEC958 standards. Provides digital peak level, RMS level, THD+N, sampling
frequency, jitter, status and bit statistics analysis. Supports mixed signal
applications.
AO11 IEEE-488 interface for A2/A2-D. Allows remote control all functions of the
instrument through a GPIB interface. Cannot be installed together with RS232.
AO12 FFT option for A2-D. Performs spectral analysis of the main input channel.
Provides Windowing functions, Zoom & Scroll of axis as well as direct printouts.
AO13 C-Message filter. The filter may be activated with the <WTD UWTD> key. For 2-
chn. measurements, two filters are required.
AO14 80kHz lowpass filter. The filter may be activated with the <WTD UWTD> key.
For 2-chn. measurements, two filters are required.
AO15 Update software package from AS03 to AS04. Utilizes the AS03 interface.
AO16
High speed RS232 interface with Windows-based software package AS04.
Allows the remote control of all analog and digital functions of the A2 or A2-D.
Provides additional features, thus enhancing the performance of the instrument.
The included, easy-to-learn Audio Measurement Programming Language
(AMSL) allows to write sequences and PASS/FAIL tests for automated
applications. Supports conversion of AS03 AMSL programs. Demo disks
available.
V3.1 89 / 104
Page 90

User Manual A2 Audio Test & Measurement System
RS232 Serial Interface (AO1 / AO16)
Both options comprise the hardware board to allow the physical communication according to
RS-232 and eith er the software package AS03 or AS04. Both packages come on 3½" HD
diskettes with separate User Manual.
• The AS03 allows to comfortably control all analog functions of the A2. Requires a MSDOS PC with 286 processor or higher.
• The Windows™ based AS04 software package is able to control all analog and digital
features of the A2 or the A2-D, under a minimum configuration of a 486 CPU with coprocessor, Windows™ 3.1 or higher and 8MB RAM.
The serial interfaces have the following communications parameters.
AO1 AO16
Protocol AS03 AS03 / AS04
Selectable baud rate 2400 / 4800 / 9600 9600 / 19200 / 38400
Data bits 8 8
Stop bits 1 1
Parity even even
An upgrade package from AS03 to AS04 (comprising the software upgrade only) is also
available.
Baudrate Selection
To select the communication protocol and the baudrate (communication speed) of the serial
interface, open the Baudrate menu behind the <SET REF> key and select the entry ->
Interface.
The connection to the PC is performed through a female 9 -pin D-Sub connector. For pin
layout and description, see chapter RS232 Connector.
Depending on the installed interface (AO1 or
AO16), the submenu menu offers the available
baudrates and protocols. The example is shown for
the interface AO16, providing the three baudrates
9600, 19200 and 38400 baud, as well as both the
AS03 and AS04, protocol.
To alter the selection, move the arrow with the
<SCALE> wheel to your new choice and push the
wheel to make the selection active.
Leave the menu without a change through the EXIT
entry or any keypress.
90 / 104 V3.1
Page 91

A2 Audio Test & Measurement System User Manual
Filter Options
The A2/A2 -D allows to install weighting filter(s) on the main or both input channels. The
available filter characteristics are
• the standard A-weighting filter (AO4)
• a customer specific filter (AO5).
• the C-Message weighting filter (AO13) or
• the 80kHz lowpass filter (AO14).
A-Weighting Filter (AO4)
Frequency [Hz] Gain [dB] Frequency [Hz] Gain [dB] Frequency [Hz] Gain [dB]
20 -50.5 200 -10.9 2000 +1.2
25 -44.7 250 -8.6 2500 +1.3
31.5 -39.4 315 -6.6 3150 +1.2
40 -34.6 400 -4.8 4000 +1.0
50 -30.2 500 -3.2 5000 +0.5
63 -26.2 630 -1.9 6300 -0.1
80 -22.5 800 -0.8 8000 -1.1
100 -19.1 1000 0 10000 -2.5
125 -16.1 1250 +0.6 12500 -4.3
160 -13.4 1600 +1.0 16000 -6.6
20000 -9.3
Fig. 26 A-Weighting Filter Characteristics
V3.1 91 / 104
Page 92

User Manual A2 Audio Test & Measurement System
User Filter (AO5)
The user filter comprises a PCB with four operational amplifiers and the switching electronic
to enable and disable the filter(s). The space around these devices is reserved to add
passive components like resistors and capacitors, thus allowing to deaign a custom -specific
filter characteristic.
Possible applications of the User-filter are
• Fixed lowpass filter with 80dB / decade (24dB / octave) at any frequency
• Fixed highpass filter with 80dB / decade ( 24 dB/octave) at any frequency
• Fixed bandpass filter with 40dB / decade steepness at any frequency
• Any characteristics consisting of up to four kink points
In case of questions about the filter design or realization, contact your local NTI agency.
User Filter board AO5
Analog switch
DG201
Filter Input
Analog GND
- 15V DC
+ 15V DC
Filter Output
Digital GND
Switch Control
- +
-Vcc
OP-AMP
TL074
-+- +
-+
Fig. 27 User Filter Layout
92 / 104 V3.1
Page 93

A2 Audio Test & Measurement System User Manual
C-Message Filter (AO13)
Frequency [Hz] Gain [dBV] Limits [±dBV] Frequency [Hz] Gain [dBV] Limits [±dBV]
60 -55.7 2 1300 -0.7 1
100 -42.5 2 1500 -1.2 1
200 -25.1 2 1800 -1.3 1
300 -16.3 2 2000 -1.1 1
400 -11.2 1 2500 -1.1 1
500 -7.7 1 2800 -2.0 1
600 -5.0 1 3000 -3.0 1
700 -2.8 1 3300 -5.1 2
800 -1.3 1 3500 -7.1 2
900 -0.3 1 4000 -14.6 3
1000 0.0 reference 4500 -22.3 3
1200 -0.4 1 5000 -28.7 3
Fig. 28 C-Message Filter Characteristics
V3.1 93 / 104
Page 94

User Manual A2 Audio Test & Measurement System
80kHz Lowpass Filter (AO14)
Fig. 29 80kHz Lowpass Filter Characteristics
94 / 104 V3.1
Page 95

A2 Audio Test & Measurement System User Manual
Transformer Option (AO7)
The transformer option adds a high-quality Audio transformer behind the power amplifier of
the A2/A2-D. This features mainly allows an additional galvanic separation of the generator
output and a perfect balancing of the outputs.
The generator specifications remain the same with and without the transformer and also the
impedance circuitry remains active.
Phantom Power (AO8)
The A2/A2-D can be equipped with Phantom power on both inputs. Installing phantom power
replaces the lowest input impedance of 200Ω (150Ω).
The Phantom power option allows to select either +15V or +48V as supply voltage level in
the installation process. It is fixed and can be changed by soldering only.
NOTE As soon as the Phantom power option is installed, the lowest input
impedance is no more available.
Accessories Overview
Code Article
AA10 Soft carrying bag for A1, A2 or A2 -D. Perfectly protects the instrument on all
sides. Allows the instrument to be operated in the bag even in vertical position.
Comes complete with shoulder strap.
AA12 Additional User Manual (this document).
AA21 A2/A2-D Service Manual. Contains all schematic diagram, assembly drawings
and the complete calibration procedure.
AA22 Modem Cable. Allows the remote control of an A2/A2-D instrument from a PC
through a modem link under AS04 software. Requires installation of the RS232
interface.
3382 ¼" Measuring Microphone.
3384 ½" Measuring Microphone.
V3.1 95 / 104
Page 96

User Manual A2 Audio Test & Measurement System
10. TECHNICAL SPECIFICATIONS
Analog Generator
Signals Pure & Warbled Sine, Symmetric & Asymmetric Squarewave,
Frequency range 10Hz-100kHz
Frequency Resolution < 0.05%
Frequency Accuracy ± 0.01% of defined value
Output Level 10µV - 24.5Vrms (-100dBV to 27.7dBV)
Level Resolution < 0.05 dB
Level Accuracy (o.c.) 0.5% of defined value
Flatness ± 0.05 dB, 20Hz-20kHz, Ref = 1kHz, 0.05% typ.
Output Impedance < 15Ω, 150Ω (200Ω), 600Ω
Residual THD+N typ. -94dB (0.002%), < -90dB max. or 10µV, 20Hz-20kHz, unloaded,
Square wave rise & fall time < 5µs (unloaded)
IMD-Signal f1: 60Hz or 250Hz, f2: 4kHz-40kHz, ratio 1:1, 4:1, 10:1, sweeptable
Digital Generator
Output Format Professional according AES-3 and Consumer according IEC958,
Impedance 110Ω, 75Ω
Sampling Frequency 32kHz, 44.1kHz, 48kHz or input clock or analyzer clock
Frequency Accuracy ± 10ppm (± 2ppm on request)
Detune ± 1500ppm
Resolution 4-24bits
Dithering TPDF switchable
Jitter Generation 2-40ns with selectable modulation signal
Output Level 0.15-5Vpp
Trigger Output X-, Y-, Z-Preamble, Bitclock
Sweep Function
Modes Frequency-, Amplitude-, Time- & Tablesweeps over entire generator
Sweep Resolution 3-200 points
External Sweeps automatically synchronized
Analog Analyzer
Number of Channels 2 simultaneously operating inputs, balanced, fully differential
Triangular Wave, Pink & White Noise, IMD-Testsignals (see IMD)
10Hz-20kHz
20Hz-40kHz
4kHz-40kHz
DIN audio BP
optical TOS link
range
for Sine signal
for Squarewave and Noise
for Warbled Sine
for IMD Signal
96 / 104 V3.1
Page 97

A2 Audio Test & Measurement System User Manual
Impedance
Input voltage max. 300V peak / 200Vrms
Phantom Power
CMRR > 80dB (20Hz - 20kHz)
100kΩ / 50pF, 600Ω, 200 Ω (150Ω) selectable
optional +15V or +48V replaces 200Ω (150Ω) impedance
Digital Analyzer
Input Format Professional according AES-3 and Consumer according IEC 958,
Impedance
Sampling Frequency 32kHz, 44.1kHz, 48kHz, houseclock or input clock
Locking Range 25 -52kHz
Measuring Accuracy 2ppm
Jitter Function 0.1-40ns continuously measured
Input Level 0.1-10Vpp
optical TOS link
110Ω, 75Ω
Level Function
Range 1µV-200V (-120dBV to +46dBV)
Residual Noise < 1.5µV (short circuit, 22Hz-22kHz)
Flatness
Rectifier Type true RMS
3dB Bandwidth > 250kHz
± 0.05dB (20Hz-40kHz), ± 0.1dB (full band)
Total Harmonic Distortion (THD + N)
Fundamental Range 10Hz-50kHz
Display Range 0.001-100% (-100dB to 0dB)
Input Voltage 5mV-200V
Residual THD+N < -95dB typ. (DIN audio BP)
Input > 0dBV < -92dB (0.0025%) or 10µV (DIN audio bandpass)
3dB Bandwidth 2Hz-250kHz
Rectifier Type true RMS
Phase
Frequency 10Hz-100kHz
Level Range 10mV-200V
Level Difference < 18dB
Accuracy ± 1° (20Hz-40kHz)
IMD
Standards DIN 45403, SMPTE and TH 22.51
Frequency Ratio 1:1, 4:1, 10:1
Low Frequency 60Hz, 250Hz
High Frequency 4kHz-40kHz sweepable
V3.1 97 / 104
Page 98

User Manual A2 Audio Test & Measurement System
Residual IMD < -90dB (U > 0dBV, 1:1 @ 4kHz)
Crosstalk / Level Selective
Range 10Hz-50kHz
Accuracy
Filter tracking 2-pole BP, Q=5
Rectifier true RMS
Residual Noise
± 0.3 dB
< 0.7 µV (< 123dBV), Ref. = 1kHz, DIN audio BP
Noise
Filter Weighted CCIR 468-3
Filter Unweighted DIN audio bandpass, 22.4Hz-22.4kHz
Rectifier quasi-peak according CCIR 468 -3
Residual Noise < -104dB weighted (quasi-peak)
< -108dB unweighted (quasi-peak)
< -116dB weighted (RMS)
Wow & Flutter Function
Standards IEC 386, DIN 45507, CCIR 409, BS 4047:1972 (quasi peak), NAB,
Range 0.1-10% full scale
Accuracy
Frequency 3kHz or 3.15kHz
Input Voltage 100mV-100V
JIB C 5551 (RMS)
± 3% of reading
Drift
Range ± 15 %
Accuracy ± 20ppm (± 0.002%)
Frequency Function
Display Mode Continuous
Frequency Range 10Hz-200kHz
Resolution min. 0.1%
Accuracy
± 0.05 %
Scope Function
Trigger Mode Auto
Scaling Auto, 100µV-20V / Div.
Time Base Auto, 10 µs-20ms / Div.
Sampling Rate max. 2MS/s
98 / 104 V3.1
Page 99

A2 Audio Test & Measurement System User Manual
Filters
400Hz Highpass ± 10%, 3-pole
Bandpass 22.4Hz-22.4kHz (DIN), ± 10%, 3 -pole
Noise Filter CCIR 468/4
Selective Filter 2-pole tracking bandpass, Q=5
Psophometric Filter A-weighted according IEC 651 (optional)
Display (of A2/A2-D)
256 x 128 dot backlit graphics LCD module. Measurement display with large 15mm numeric
values and two 100mm Bargraphs.
Interfaces
Centronics compatible, parallel printer port (25pin Sub -D) for graphics and text printouts.
Supports Epson FX and LWQ, IBM Proprinter, HP Deskjet, Thinkjet and Laserjet printers.
RS232 serial port (optional) for remote control and data transfer between A2 and IBM PC
compatible computer.
IEEE-488 parallel remote control interface (optional) for remote control and data transfer
between A2 and PC..
BNC monitor outputs offering both input channels and reading signal; level typical 3Vpp,
Rout = 600Ω.
General Data
Dimensions 274 x 396 x 132mm (11" x 15" x 5")
Weight Approx. 9kg (20lbs)
Fab. Requirements 100 / 120 / 230 / 240VAC, 50 / 60Hz, 85VA
Temperature Range 0-45°C (32 -113°F)
Humidity 10-90% R.H. non condensing
V3.1 99 / 104
Page 100

User Manual A2 Audio Test & Measurement System
11. INDEX
%
%
CROSSTALK ..........................................59
IMD........................................................52
L.REL.....................................................48
N.REL ....................................................57
SINAD....................................................51
THD+N................................................... 51
*
*1
CROSSTALK .......................................... 59
L.REL.....................................................48
N.REL ....................................................57
3
3rd Level Unit Menu ............................... 45
A
A2 Setup Menu.......................................85
Accessories............................................ 95
ADDITIONAL (Measurement Function). 67
Agents................................................... 100
Alt
Input Channel.........................................21
Monitor Output........................................26
Signal Menu............................................ 29
Signals ................................................... 29
Alternate ..........................................See Alt
Amplitude Sweep ................................... 79
AOx Options ........................................... 89
Auto
Range....................................................24
Scaling of Bar-graph................................ 36
Scaling of Sweep Graph ..........................39
B
Backlight................................................. 21
Balance of Input Channel....................... 48
Balanced
Connection ............................................. 25
Operation................................................ 28
Band Reject......................See Notch Filter
Bandpass Filter................................. 59, 61
Bandwidth
of IMD Measurement............................... 52
of Noise Signal........................................31
of Sine Output Signal............................... 31
Bar-graph................................................36
Baudrate Menu....................................... 90
Beam Finder........................................... 36
Block Diagram
100 / 104 V3.1
Input Section ...........................................22
Output Stage...........................................27
BNC Connectors.....................................26
BS 4847..................................................63
C
Calibration...............................................85
CCIR
409.........................................................63
468.............................................35, 55, 57
CDs with Reference Tracks.................... 78
CE Declaration of Conformity................... 3
Centronics
Connector Pin Assignment .......................87
Interface..................................................82
Channel Balance ....................................48
Clock (internal)........................................21
Coarse Mode ....................................16, 31
Connection
Balanced.................................................25
Unbalanced.............................................25
Contrast...................................................21
Crest Factor
of IMD Signal...........................................53
of Pink Noise...........................................31
Crosshair.................................................74
Crosstalk.................................................59
Cursor...............................................39, 74
D
dB............................................................ 51
IMD ........................................................52
Signal-to-Noise........................................48
dBm .........................................................45
L.SEL......................................................62
dBq..........................................................55
dBr
CROSSTALK ..........................................59
L.REL .....................................................48
N.REL.....................................................57
dBu..........................................................44
L.SEL......................................................62
dBV .........................................................44
L.SEL......................................................62
Degree....................................................66
Deskjet.................................................... 83
Differential Inputs ....................................23
DIN
45403/4...................................................53
45507 .....................................................63
Standard for IMD .....................................30
Display
Backlight .................................................21
Contrast..................................................21
 Loading...