

Page 1

Novell®
www.novell.com
User Guide
SentinelTM Rapid Deployment
novdocx (en) 13 May 2009
AUTHORIZED DOCUMENTATION
6.1
December 2009
Sentinel 6.1 Rapid Deployment User Guide
Page 2

Legal Notices
Novell, Inc., makes no representations or warranties with respect to the contents or use of this documentation, and
specifically disclaims any express or implied warranties of merchantability or fitness for any particular purpose.
Further, Novell, Inc., reserves the right to revise this publication and to make changes to its content, at any time,
without obligation to notify any person or entity of such revisions or changes.
Further, Novell, Inc., makes no representations or warranties with respect to any software, and specifically disclaims
any express or implied warranties of merchantability or fitness for any particular purpose. Further, Novell, Inc.,
reserves the right to make changes to any and all parts of Novell software, at any time, without any obligation to
notify any person or entity of such changes.
Any products or technical information provided under this Agreement may be subject to U.S. export controls and the
trade laws of other countries. You agree to comply with all export control regulations and to obtain any required
licenses or classification to export, re-export or import deliverables. You agree not to export or re-export to entities on
the current U.S. export exclusion lists or to any embargoed or terrorist countries as specified in the U.S. export laws.
You agree to not use deliverables for prohibited nuclear, missile, or chemical biological weaponry end uses. See the
Novell International Trade Services Web page (http://www.novell.com/info/exports/) for more information on
exporting Novell software. Novell assumes no responsibility for your failure to obtain any necessary export
approvals.
novdocx (en) 13 May 2009
Copyright © 1999-2009 Novell, Inc. All rights reserved. No part of this publication may be reproduced, photocopied,
stored on a retrieval system, or transmitted without the express written consent of the publisher.
Novell, Inc., has intellectual property rights relating to technology embodied in the product that is described in this
document. In particular, and without limitation, these intellectual property rights may include one or more of the U.S.
patents listed on the Novell Legal Patents Web page (http://www.novell.com/company/legal/patents/) and one or
more additional patents or pending patent applications in the U.S. and in other countries.
Novell, Inc.
404 Wyman Street, Suite 500
Waltham, MA 02451
U.S.A.
www.novell.com
Online Documentation: To access the latest online documentation for this and other Novell products, see
the Novell Documentation Web page (http://www.novell.com/documentation).
Page 3

Novell Trademarks
For Novell trademarks, see the Novell Trademark and Service Mark list (http://www.novell.com/company/legal/
trademarks/tmlist.html).
Third-Party Materials
All third-party trademarks are the property of their respective owners.
novdocx (en) 13 May 2009
Page 4

novdocx (en) 13 May 2009
4 Sentinel 6.1 Rapid Deployment User Guide
Page 5

Contents
About This Guide 17
1 Managing Sentinel 6.1 Rapid Deployment Through the Web Interface 19
1.1 Accessing the Novell Sentinel Web Interface . . . . . . . . . . . . . . . . . . . . . . . . . . . . . . . . . . . . . 19
1.2 Applications and Installers . . . . . . . . . . . . . . . . . . . . . . . . . . . . . . . . . . . . . . . . . . . . . . . . . . . . 19
1.3 Reporting . . . . . . . . . . . . . . . . . . . . . . . . . . . . . . . . . . . . . . . . . . . . . . . . . . . . . . . . . . . . . . . . . 21
1.3.1 Running Reports . . . . . . . . . . . . . . . . . . . . . . . . . . . . . . . . . . . . . . . . . . . . . . . . . . . . 21
1.3.2 Viewing Reports. . . . . . . . . . . . . . . . . . . . . . . . . . . . . . . . . . . . . . . . . . . . . . . . . . . . . 24
1.3.3 Scheduling a Report . . . . . . . . . . . . . . . . . . . . . . . . . . . . . . . . . . . . . . . . . . . . . . . . . 26
1.3.4 Managing Reports . . . . . . . . . . . . . . . . . . . . . . . . . . . . . . . . . . . . . . . . . . . . . . . . . . . 27
1.4 Searching Events . . . . . . . . . . . . . . . . . . . . . . . . . . . . . . . . . . . . . . . . . . . . . . . . . . . . . . . . . . . 31
1.4.1 Running an Event Search . . . . . . . . . . . . . . . . . . . . . . . . . . . . . . . . . . . . . . . . . . . . . 31
1.4.2 Viewing Search Results. . . . . . . . . . . . . . . . . . . . . . . . . . . . . . . . . . . . . . . . . . . . . . . 34
1.4.3 Event Fields . . . . . . . . . . . . . . . . . . . . . . . . . . . . . . . . . . . . . . . . . . . . . . . . . . . . . . . . 37
novdocx (en) 13 May 2009
2 Sentinel Control Center 41
2.1 Log In to the Sentinel Control Center. . . . . . . . . . . . . . . . . . . . . . . . . . . . . . . . . . . . . . . . . . . . 41
2.1.1 Linux . . . . . . . . . . . . . . . . . . . . . . . . . . . . . . . . . . . . . . . . . . . . . . . . . . . . . . . . . . . . . 41
2.1.2 Windows . . . . . . . . . . . . . . . . . . . . . . . . . . . . . . . . . . . . . . . . . . . . . . . . . . . . . . . . . . 41
2.2 About Sentinel Control Center . . . . . . . . . . . . . . . . . . . . . . . . . . . . . . . . . . . . . . . . . . . . . . . . . 42
2.2.1 Active Views . . . . . . . . . . . . . . . . . . . . . . . . . . . . . . . . . . . . . . . . . . . . . . . . . . . . . . . 43
2.2.2 Incidents . . . . . . . . . . . . . . . . . . . . . . . . . . . . . . . . . . . . . . . . . . . . . . . . . . . . . . . . . . 43
2.2.3 iTRAC . . . . . . . . . . . . . . . . . . . . . . . . . . . . . . . . . . . . . . . . . . . . . . . . . . . . . . . . . . . . 43
2.2.4 Analysis . . . . . . . . . . . . . . . . . . . . . . . . . . . . . . . . . . . . . . . . . . . . . . . . . . . . . . . . . . . 44
2.2.5 Admin. . . . . . . . . . . . . . . . . . . . . . . . . . . . . . . . . . . . . . . . . . . . . . . . . . . . . . . . . . . . . 44
2.2.6 Correlation . . . . . . . . . . . . . . . . . . . . . . . . . . . . . . . . . . . . . . . . . . . . . . . . . . . . . . . . . 44
2.2.7 Event Source Management . . . . . . . . . . . . . . . . . . . . . . . . . . . . . . . . . . . . . . . . . . . . 44
2.2.8 Solution Packs . . . . . . . . . . . . . . . . . . . . . . . . . . . . . . . . . . . . . . . . . . . . . . . . . . . . . . 45
2.2.9 Identity Integration . . . . . . . . . . . . . . . . . . . . . . . . . . . . . . . . . . . . . . . . . . . . . . . . . . . 45
2.3 Introduction to the User Interface. . . . . . . . . . . . . . . . . . . . . . . . . . . . . . . . . . . . . . . . . . . . . . . 45
2.3.1 Menu Bar . . . . . . . . . . . . . . . . . . . . . . . . . . . . . . . . . . . . . . . . . . . . . . . . . . . . . . . . . . 46
2.3.2 Toolbar. . . . . . . . . . . . . . . . . . . . . . . . . . . . . . . . . . . . . . . . . . . . . . . . . . . . . . . . . . . . 46
2.3.3 Tabs. . . . . . . . . . . . . . . . . . . . . . . . . . . . . . . . . . . . . . . . . . . . . . . . . . . . . . . . . . . . . . 48
2.3.4 Frames. . . . . . . . . . . . . . . . . . . . . . . . . . . . . . . . . . . . . . . . . . . . . . . . . . . . . . . . . . . . 48
2.3.5 Using the Sentinel Control Center to Navigate . . . . . . . . . . . . . . . . . . . . . . . . . . . . . 48
2.3.6 Changing the Appearance of the Sentinel Control Center. . . . . . . . . . . . . . . . . . . . . 49
2.3.7 Saving User Preferences. . . . . . . . . . . . . . . . . . . . . . . . . . . . . . . . . . . . . . . . . . . . . . 50
2.3.8 Changing Password. . . . . . . . . . . . . . . . . . . . . . . . . . . . . . . . . . . . . . . . . . . . . . . . . . 50
2.3.9 Configuring the Attachment Viewer . . . . . . . . . . . . . . . . . . . . . . . . . . . . . . . . . . . . . . 50
3 Active Views Tab 53
3.1 Understanding Active Views . . . . . . . . . . . . . . . . . . . . . . . . . . . . . . . . . . . . . . . . . . . . . . . . . . 53
3.2 Introduction to the User Interface. . . . . . . . . . . . . . . . . . . . . . . . . . . . . . . . . . . . . . . . . . . . . . . 54
3.3 Reconfiguring Total Display Time . . . . . . . . . . . . . . . . . . . . . . . . . . . . . . . . . . . . . . . . . . . . . . 57
3.4 Viewing Real-Time Events . . . . . . . . . . . . . . . . . . . . . . . . . . . . . . . . . . . . . . . . . . . . . . . . . . . . 57
3.4.1 Resetting the Parameters and Chart Type of an Active View . . . . . . . . . . . . . . . . . . 60
3.4.2 Rotating a 3D Bar or Ribbon Chart . . . . . . . . . . . . . . . . . . . . . . . . . . . . . . . . . . . . . . 61
3.5 Showing and Hiding Event Details . . . . . . . . . . . . . . . . . . . . . . . . . . . . . . . . . . . . . . . . . . . . . . 61
Contents 5
Page 6

3.6 Sending Mail Messages about Events and Incidents. . . . . . . . . . . . . . . . . . . . . . . . . . . . . . . . 62
3.7 Creating Incidents . . . . . . . . . . . . . . . . . . . . . . . . . . . . . . . . . . . . . . . . . . . . . . . . . . . . . . . . . . 63
3.8 Viewing Events That Trigger Correlated Events . . . . . . . . . . . . . . . . . . . . . . . . . . . . . . . . . . . 64
3.9 Investigating an Event or Events . . . . . . . . . . . . . . . . . . . . . . . . . . . . . . . . . . . . . . . . . . . . . . . 65
3.9.1 Investigate: Event Query . . . . . . . . . . . . . . . . . . . . . . . . . . . . . . . . . . . . . . . . . . . . . . 66
3.9.2 Investigate: Graph Mapper . . . . . . . . . . . . . . . . . . . . . . . . . . . . . . . . . . . . . . . . . . . . 66
3.9.3 Historical Event Query . . . . . . . . . . . . . . . . . . . . . . . . . . . . . . . . . . . . . . . . . . . . . . . . 67
3.9.4 Active Browser. . . . . . . . . . . . . . . . . . . . . . . . . . . . . . . . . . . . . . . . . . . . . . . . . . . . . . 68
3.10 Viewing Advisor Data . . . . . . . . . . . . . . . . . . . . . . . . . . . . . . . . . . . . . . . . . . . . . . . . . . . . . . . . 70
3.11 Viewing Asset Data . . . . . . . . . . . . . . . . . . . . . . . . . . . . . . . . . . . . . . . . . . . . . . . . . . . . . . . . . 71
3.12 Viewing Vulnerabilities . . . . . . . . . . . . . . . . . . . . . . . . . . . . . . . . . . . . . . . . . . . . . . . . . . . . . . . 72
3.13 Ticketing System Integration . . . . . . . . . . . . . . . . . . . . . . . . . . . . . . . . . . . . . . . . . . . . . . . . . . 77
3.14 Viewing User Information . . . . . . . . . . . . . . . . . . . . . . . . . . . . . . . . . . . . . . . . . . . . . . . . . . . . . 77
3.15 Using Custom Menu Options with Events . . . . . . . . . . . . . . . . . . . . . . . . . . . . . . . . . . . . . . . . 77
3.16 Managing Columns in a Snapshot or Navigator Window . . . . . . . . . . . . . . . . . . . . . . . . . . . . . 78
3.17 Taking a Snapshot of a Navigator Window . . . . . . . . . . . . . . . . . . . . . . . . . . . . . . . . . . . . . . . 79
3.18 Sorting Columns in a Snapshot . . . . . . . . . . . . . . . . . . . . . . . . . . . . . . . . . . . . . . . . . . . . . . . . 79
3.19 Closing a Snapshot or Navigator . . . . . . . . . . . . . . . . . . . . . . . . . . . . . . . . . . . . . . . . . . . . . . . 79
3.20 Adding Events to an Incident . . . . . . . . . . . . . . . . . . . . . . . . . . . . . . . . . . . . . . . . . . . . . . . . . . 79
novdocx (en) 13 May 2009
4 Correlation Tab 83
4.1 Understanding Correlation . . . . . . . . . . . . . . . . . . . . . . . . . . . . . . . . . . . . . . . . . . . . . . . . . . . . 83
4.1.1 Technical Implementation . . . . . . . . . . . . . . . . . . . . . . . . . . . . . . . . . . . . . . . . . . . . . 84
4.2 Introduction to the User Interface. . . . . . . . . . . . . . . . . . . . . . . . . . . . . . . . . . . . . . . . . . . . . . . 85
4.3 Correlation Rules . . . . . . . . . . . . . . . . . . . . . . . . . . . . . . . . . . . . . . . . . . . . . . . . . . . . . . . . . . . 85
4.3.1 Opening the Correlation Rule Manager . . . . . . . . . . . . . . . . . . . . . . . . . . . . . . . . . . . 86
4.3.2 Creating a Rule Folder. . . . . . . . . . . . . . . . . . . . . . . . . . . . . . . . . . . . . . . . . . . . . . . . 86
4.3.3 Renaming a Rule Folder . . . . . . . . . . . . . . . . . . . . . . . . . . . . . . . . . . . . . . . . . . . . . . 86
4.3.4 Deleting a Rule Folder . . . . . . . . . . . . . . . . . . . . . . . . . . . . . . . . . . . . . . . . . . . . . . . . 86
4.3.5 Creating a Correlation Rule . . . . . . . . . . . . . . . . . . . . . . . . . . . . . . . . . . . . . . . . . . . . 86
4.3.6 Creating Correlation Rules . . . . . . . . . . . . . . . . . . . . . . . . . . . . . . . . . . . . . . . . . . . . 87
4.3.7 Deploying and Undeploying Correlation Rules . . . . . . . . . . . . . . . . . . . . . . . . . . . . . 95
4.3.8 Enabling and Disabling Rules . . . . . . . . . . . . . . . . . . . . . . . . . . . . . . . . . . . . . . . . . . 96
4.3.9 Renaming and Deleting a Correlation Rule . . . . . . . . . . . . . . . . . . . . . . . . . . . . . . . . 96
4.3.10 Sorting Correlation Rules. . . . . . . . . . . . . . . . . . . . . . . . . . . . . . . . . . . . . . . . . . . . . . 96
4.3.11 Moving a Correlation Rule . . . . . . . . . . . . . . . . . . . . . . . . . . . . . . . . . . . . . . . . . . . . . 97
4.3.12 Importing a Correlation Rule . . . . . . . . . . . . . . . . . . . . . . . . . . . . . . . . . . . . . . . . . . . 97
4.3.13 Exporting a Correlation Rule . . . . . . . . . . . . . . . . . . . . . . . . . . . . . . . . . . . . . . . . . . . 98
4.4 Dynamic Lists. . . . . . . . . . . . . . . . . . . . . . . . . . . . . . . . . . . . . . . . . . . . . . . . . . . . . . . . . . . . . . 98
4.4.1 Adding a Dynamic List . . . . . . . . . . . . . . . . . . . . . . . . . . . . . . . . . . . . . . . . . . . . . . . . 99
4.4.2 Modifying a Dynamic List. . . . . . . . . . . . . . . . . . . . . . . . . . . . . . . . . . . . . . . . . . . . . 100
4.4.3 Deleting a Dynamic List . . . . . . . . . . . . . . . . . . . . . . . . . . . . . . . . . . . . . . . . . . . . . . 100
4.4.4 Removing Dynamic List Elements . . . . . . . . . . . . . . . . . . . . . . . . . . . . . . . . . . . . . . 100
4.4.5 Using a Dynamic List in a Correlation Rule . . . . . . . . . . . . . . . . . . . . . . . . . . . . . . . 100
4.5 Correlation Engine . . . . . . . . . . . . . . . . . . . . . . . . . . . . . . . . . . . . . . . . . . . . . . . . . . . . . . . . . 102
4.5.1 Starting or Stopping a Correlation Engine . . . . . . . . . . . . . . . . . . . . . . . . . . . . . . . . 102
4.5.2 Renaming a Correlation Engine. . . . . . . . . . . . . . . . . . . . . . . . . . . . . . . . . . . . . . . . 102
4.6 Correlation Actions. . . . . . . . . . . . . . . . . . . . . . . . . . . . . . . . . . . . . . . . . . . . . . . . . . . . . . . . . 102
4.6.1 Configuring a Correlated Event . . . . . . . . . . . . . . . . . . . . . . . . . . . . . . . . . . . . . . . . 103
4.6.2 Adding to a Dynamic List . . . . . . . . . . . . . . . . . . . . . . . . . . . . . . . . . . . . . . . . . . . . . 104
4.6.3 Removing a Value from a Dynamic List. . . . . . . . . . . . . . . . . . . . . . . . . . . . . . . . . . 105
4.6.4 Executing a Command . . . . . . . . . . . . . . . . . . . . . . . . . . . . . . . . . . . . . . . . . . . . . . 106
4.6.5 Creating an Incident. . . . . . . . . . . . . . . . . . . . . . . . . . . . . . . . . . . . . . . . . . . . . . . . . 107
4.6.6 Sending an E-mail . . . . . . . . . . . . . . . . . . . . . . . . . . . . . . . . . . . . . . . . . . . . . . . . . . 108
4.6.7 Imported JavaScript Action Plugins . . . . . . . . . . . . . . . . . . . . . . . . . . . . . . . . . . . . . 108
6 Sentinel 6.1 Rapid Deployment User Guide
Page 7

5 Incidents Tab 109
5.1 Understanding an Incident . . . . . . . . . . . . . . . . . . . . . . . . . . . . . . . . . . . . . . . . . . . . . . . . . . . 109
5.2 Introduction to User Interface. . . . . . . . . . . . . . . . . . . . . . . . . . . . . . . . . . . . . . . . . . . . . . . . . 109
5.2.1 Incident View . . . . . . . . . . . . . . . . . . . . . . . . . . . . . . . . . . . . . . . . . . . . . . . . . . . . . . 110
5.2.2 Incident . . . . . . . . . . . . . . . . . . . . . . . . . . . . . . . . . . . . . . . . . . . . . . . . . . . . . . . . . . 110
5.3 Manage Incident Views . . . . . . . . . . . . . . . . . . . . . . . . . . . . . . . . . . . . . . . . . . . . . . . . . . . . . 111
5.3.1 Adding a View . . . . . . . . . . . . . . . . . . . . . . . . . . . . . . . . . . . . . . . . . . . . . . . . . . . . . 111
5.3.2 Modifying a View . . . . . . . . . . . . . . . . . . . . . . . . . . . . . . . . . . . . . . . . . . . . . . . . . . . 114
5.3.3 Deleting a View . . . . . . . . . . . . . . . . . . . . . . . . . . . . . . . . . . . . . . . . . . . . . . . . . . . . 115
5.3.4 Default View. . . . . . . . . . . . . . . . . . . . . . . . . . . . . . . . . . . . . . . . . . . . . . . . . . . . . . . 115
5.4 Manage Incidents . . . . . . . . . . . . . . . . . . . . . . . . . . . . . . . . . . . . . . . . . . . . . . . . . . . . . . . . . . 115
5.4.1 Creating Incidents . . . . . . . . . . . . . . . . . . . . . . . . . . . . . . . . . . . . . . . . . . . . . . . . . . 115
5.4.2 Viewing an Incident . . . . . . . . . . . . . . . . . . . . . . . . . . . . . . . . . . . . . . . . . . . . . . . . . 116
5.4.3 Attaching Workflows to Incidents. . . . . . . . . . . . . . . . . . . . . . . . . . . . . . . . . . . . . . . 116
5.4.4 Adding Notes to Incidents . . . . . . . . . . . . . . . . . . . . . . . . . . . . . . . . . . . . . . . . . . . . 117
5.4.5 Adding Attachments to Incidents . . . . . . . . . . . . . . . . . . . . . . . . . . . . . . . . . . . . . . . 117
5.4.6 Executing Incident Actions. . . . . . . . . . . . . . . . . . . . . . . . . . . . . . . . . . . . . . . . . . . . 118
5.4.7 E-Mailing an Incident . . . . . . . . . . . . . . . . . . . . . . . . . . . . . . . . . . . . . . . . . . . . . . . 119
5.4.8 Modifying Incidents . . . . . . . . . . . . . . . . . . . . . . . . . . . . . . . . . . . . . . . . . . . . . . . . . 120
5.4.9 Deleting Incidents . . . . . . . . . . . . . . . . . . . . . . . . . . . . . . . . . . . . . . . . . . . . . . . . . . 121
5.5 Switch between Existing Incident Views . . . . . . . . . . . . . . . . . . . . . . . . . . . . . . . . . . . . . . . . 121
novdocx (en) 13 May 2009
6 iTRAC Workflows 123
6.1 Understanding iTRAC Workflows. . . . . . . . . . . . . . . . . . . . . . . . . . . . . . . . . . . . . . . . . . . . . . 123
6.2 Introduction to the User Interface. . . . . . . . . . . . . . . . . . . . . . . . . . . . . . . . . . . . . . . . . . . . . . 124
6.3 Template Manager . . . . . . . . . . . . . . . . . . . . . . . . . . . . . . . . . . . . . . . . . . . . . . . . . . . . . . . . . 125
6.3.1 Default Templates . . . . . . . . . . . . . . . . . . . . . . . . . . . . . . . . . . . . . . . . . . . . . . . . . . 125
6.4 Template Builder Interface . . . . . . . . . . . . . . . . . . . . . . . . . . . . . . . . . . . . . . . . . . . . . . . . . . . 126
6.4.1 Creating Templates . . . . . . . . . . . . . . . . . . . . . . . . . . . . . . . . . . . . . . . . . . . . . . . . . 127
6.4.2 Managing Templates . . . . . . . . . . . . . . . . . . . . . . . . . . . . . . . . . . . . . . . . . . . . . . . . 128
6.5 Steps . . . . . . . . . . . . . . . . . . . . . . . . . . . . . . . . . . . . . . . . . . . . . . . . . . . . . . . . . . . . . . . . . . . 129
6.5.1 Start Step. . . . . . . . . . . . . . . . . . . . . . . . . . . . . . . . . . . . . . . . . . . . . . . . . . . . . . . . . 130
6.5.2 Manual Step. . . . . . . . . . . . . . . . . . . . . . . . . . . . . . . . . . . . . . . . . . . . . . . . . . . . . . . 130
6.5.3 Decision Step. . . . . . . . . . . . . . . . . . . . . . . . . . . . . . . . . . . . . . . . . . . . . . . . . . . . . . 134
6.5.4 Mail Step . . . . . . . . . . . . . . . . . . . . . . . . . . . . . . . . . . . . . . . . . . . . . . . . . . . . . . . . . 134
6.5.5 Command Step . . . . . . . . . . . . . . . . . . . . . . . . . . . . . . . . . . . . . . . . . . . . . . . . . . . . 134
6.5.6 Activity Step . . . . . . . . . . . . . . . . . . . . . . . . . . . . . . . . . . . . . . . . . . . . . . . . . . . . . . . 135
6.5.7 End Step . . . . . . . . . . . . . . . . . . . . . . . . . . . . . . . . . . . . . . . . . . . . . . . . . . . . . . . . . 136
6.5.8 Adding Steps to a Workflow. . . . . . . . . . . . . . . . . . . . . . . . . . . . . . . . . . . . . . . . . . . 136
6.5.9 Managing Steps. . . . . . . . . . . . . . . . . . . . . . . . . . . . . . . . . . . . . . . . . . . . . . . . . . . . 136
6.6 Transitions . . . . . . . . . . . . . . . . . . . . . . . . . . . . . . . . . . . . . . . . . . . . . . . . . . . . . . . . . . . . . . . 141
6.6.1 Unconditional Transitions . . . . . . . . . . . . . . . . . . . . . . . . . . . . . . . . . . . . . . . . . . . . 141
6.6.2 Conditional Transitions . . . . . . . . . . . . . . . . . . . . . . . . . . . . . . . . . . . . . . . . . . . . . . 142
6.6.3 Else Transitions . . . . . . . . . . . . . . . . . . . . . . . . . . . . . . . . . . . . . . . . . . . . . . . . . . . . 146
6.6.4 Timeout Transitions . . . . . . . . . . . . . . . . . . . . . . . . . . . . . . . . . . . . . . . . . . . . . . . . . 146
6.6.5 Alert Transitions. . . . . . . . . . . . . . . . . . . . . . . . . . . . . . . . . . . . . . . . . . . . . . . . . . . . 147
6.6.6 Error Transition . . . . . . . . . . . . . . . . . . . . . . . . . . . . . . . . . . . . . . . . . . . . . . . . . . . . 148
6.6.7 Managing Transitions . . . . . . . . . . . . . . . . . . . . . . . . . . . . . . . . . . . . . . . . . . . . . . . 148
6.7 Activities . . . . . . . . . . . . . . . . . . . . . . . . . . . . . . . . . . . . . . . . . . . . . . . . . . . . . . . . . . . . . . . . . 149
6.7.1 Incident Command Activity . . . . . . . . . . . . . . . . . . . . . . . . . . . . . . . . . . . . . . . . . . . 150
6.7.2 Incident Internal Activity. . . . . . . . . . . . . . . . . . . . . . . . . . . . . . . . . . . . . . . . . . . . . . 151
6.7.3 Eradication Activity . . . . . . . . . . . . . . . . . . . . . . . . . . . . . . . . . . . . . . . . . . . . . . . . . 151
6.7.4 Incident Composite Activity . . . . . . . . . . . . . . . . . . . . . . . . . . . . . . . . . . . . . . . . . . . 151
6.7.5 Creating iTRAC Activities . . . . . . . . . . . . . . . . . . . . . . . . . . . . . . . . . . . . . . . . . . . . 151
6.7.6 Managing Activities . . . . . . . . . . . . . . . . . . . . . . . . . . . . . . . . . . . . . . . . . . . . . . . . . 154
Contents 7
Page 8

6.8 Process Management . . . . . . . . . . . . . . . . . . . . . . . . . . . . . . . . . . . . . . . . . . . . . . . . . . . . . . 155
6.8.1 Instantiating a Process . . . . . . . . . . . . . . . . . . . . . . . . . . . . . . . . . . . . . . . . . . . . . . 156
6.8.2 Automatic Step Execution . . . . . . . . . . . . . . . . . . . . . . . . . . . . . . . . . . . . . . . . . . . . 156
6.8.3 Manual Step Execution . . . . . . . . . . . . . . . . . . . . . . . . . . . . . . . . . . . . . . . . . . . . . . 157
6.8.4 Displaying Status . . . . . . . . . . . . . . . . . . . . . . . . . . . . . . . . . . . . . . . . . . . . . . . . . . . 157
6.8.5 Displaying the Status of a Process . . . . . . . . . . . . . . . . . . . . . . . . . . . . . . . . . . . . . 157
6.8.6 Changing Views in the Process Manager . . . . . . . . . . . . . . . . . . . . . . . . . . . . . . . . 158
6.8.7 Starting or Terminating a Process . . . . . . . . . . . . . . . . . . . . . . . . . . . . . . . . . . . . . . 159
7 Work Items 161
7.1 Work Item Summary . . . . . . . . . . . . . . . . . . . . . . . . . . . . . . . . . . . . . . . . . . . . . . . . . . . . . . . 161
7.2 Processing a Work Item . . . . . . . . . . . . . . . . . . . . . . . . . . . . . . . . . . . . . . . . . . . . . . . . . . . . . 164
7.2.1 Accepting and Completing a Work Item . . . . . . . . . . . . . . . . . . . . . . . . . . . . . . . . . 164
7.3 Managing Work Items of Other Users . . . . . . . . . . . . . . . . . . . . . . . . . . . . . . . . . . . . . . . . . . 165
8 Analysis Tab 167
8.1 Introduction to the User Interface. . . . . . . . . . . . . . . . . . . . . . . . . . . . . . . . . . . . . . . . . . . . . . 167
8.1.1 Top Ten Dashboard. . . . . . . . . . . . . . . . . . . . . . . . . . . . . . . . . . . . . . . . . . . . . . . . . 167
8.2 Offline Query . . . . . . . . . . . . . . . . . . . . . . . . . . . . . . . . . . . . . . . . . . . . . . . . . . . . . . . . . . . . . 169
8.2.1 Creating an Offline Query . . . . . . . . . . . . . . . . . . . . . . . . . . . . . . . . . . . . . . . . . . . . 169
8.2.2 Viewing, Exporting, or Deleting an Offline Query . . . . . . . . . . . . . . . . . . . . . . . . . . 170
novdocx (en) 13 May 2009
9 Event Source Management 171
9.1 Understanding Event Source Management . . . . . . . . . . . . . . . . . . . . . . . . . . . . . . . . . . . . . . 171
9.1.1 Using Event Source Management . . . . . . . . . . . . . . . . . . . . . . . . . . . . . . . . . . . . . . 171
9.1.2 Plug-In Repository . . . . . . . . . . . . . . . . . . . . . . . . . . . . . . . . . . . . . . . . . . . . . . . . . . 172
9.1.3 Auxiliary Files. . . . . . . . . . . . . . . . . . . . . . . . . . . . . . . . . . . . . . . . . . . . . . . . . . . . . . 172
9.2 Introduction to the User Interface. . . . . . . . . . . . . . . . . . . . . . . . . . . . . . . . . . . . . . . . . . . . . . 172
9.2.1 Menu Bar . . . . . . . . . . . . . . . . . . . . . . . . . . . . . . . . . . . . . . . . . . . . . . . . . . . . . . . . . 173
9.2.2 Toolbar. . . . . . . . . . . . . . . . . . . . . . . . . . . . . . . . . . . . . . . . . . . . . . . . . . . . . . . . . . . 174
9.2.3 Zoom . . . . . . . . . . . . . . . . . . . . . . . . . . . . . . . . . . . . . . . . . . . . . . . . . . . . . . . . . . . . 174
9.2.4 Frames. . . . . . . . . . . . . . . . . . . . . . . . . . . . . . . . . . . . . . . . . . . . . . . . . . . . . . . . . . . 175
9.3 Live View . . . . . . . . . . . . . . . . . . . . . . . . . . . . . . . . . . . . . . . . . . . . . . . . . . . . . . . . . . . . . . . . 180
9.3.1 Graphical ESM View . . . . . . . . . . . . . . . . . . . . . . . . . . . . . . . . . . . . . . . . . . . . . . . . 180
9.3.2 Tabular ESM View . . . . . . . . . . . . . . . . . . . . . . . . . . . . . . . . . . . . . . . . . . . . . . . . . . 182
9.3.3 Right-Click Menu . . . . . . . . . . . . . . . . . . . . . . . . . . . . . . . . . . . . . . . . . . . . . . . . . . . 182
9.4 Components of Event Source Hierarchy . . . . . . . . . . . . . . . . . . . . . . . . . . . . . . . . . . . . . . . . 184
9.4.1 Component Status Indicators . . . . . . . . . . . . . . . . . . . . . . . . . . . . . . . . . . . . . . . . . 185
9.4.2 Adding Components to the Event Source Hierarchy . . . . . . . . . . . . . . . . . . . . . . . . 186
9.4.3 Collectors. . . . . . . . . . . . . . . . . . . . . . . . . . . . . . . . . . . . . . . . . . . . . . . . . . . . . . . . . 186
9.5 Debugging . . . . . . . . . . . . . . . . . . . . . . . . . . . . . . . . . . . . . . . . . . . . . . . . . . . . . . . . . . . . . . . 202
9.5.1 Collector Workspace and Collector Directory . . . . . . . . . . . . . . . . . . . . . . . . . . . . . 203
9.5.2 Debugging Proprietary Collectors . . . . . . . . . . . . . . . . . . . . . . . . . . . . . . . . . . . . . . 203
9.5.3 Debugging JavaScript Collectors. . . . . . . . . . . . . . . . . . . . . . . . . . . . . . . . . . . . . . . 205
9.5.4 Using the Raw Data Tap to Generate a Flat File . . . . . . . . . . . . . . . . . . . . . . . . . . . 209
9.6 Exporting a Configuration. . . . . . . . . . . . . . . . . . . . . . . . . . . . . . . . . . . . . . . . . . . . . . . . . . . . 210
9.7 Importing a Configuration. . . . . . . . . . . . . . . . . . . . . . . . . . . . . . . . . . . . . . . . . . . . . . . . . . . . 212
9.7.1 Enabling or Disabling the Import Configuration . . . . . . . . . . . . . . . . . . . . . . . . . . . . 213
9.7.2 Resetting the Layout . . . . . . . . . . . . . . . . . . . . . . . . . . . . . . . . . . . . . . . . . . . . . . . . 215
9.7.3 Undoing the Layout . . . . . . . . . . . . . . . . . . . . . . . . . . . . . . . . . . . . . . . . . . . . . . . . . 215
9.7.4 Redo Layout . . . . . . . . . . . . . . . . . . . . . . . . . . . . . . . . . . . . . . . . . . . . . . . . . . . . . . 215
9.8 Event Source Management Scratchpad . . . . . . . . . . . . . . . . . . . . . . . . . . . . . . . . . . . . . . . . 216
9.9 Comparing Sentinel 5.x and Sentinel 6.0. . . . . . . . . . . . . . . . . . . . . . . . . . . . . . . . . . . . . . . . 216
8 Sentinel 6.1 Rapid Deployment User Guide
Page 9

10 Administration 219
10.1 Understanding the Admin Tab . . . . . . . . . . . . . . . . . . . . . . . . . . . . . . . . . . . . . . . . . . . . . . . . 219
10.2 Introduction to the User Interface . . . . . . . . . . . . . . . . . . . . . . . . . . . . . . . . . . . . . . . . . . . . . . 220
10.3 Servers View . . . . . . . . . . . . . . . . . . . . . . . . . . . . . . . . . . . . . . . . . . . . . . . . . . . . . . . . . . . . . 221
10.3.1 Monitoring a Process . . . . . . . . . . . . . . . . . . . . . . . . . . . . . . . . . . . . . . . . . . . . . . . . 222
10.3.2 Creating a Servers View . . . . . . . . . . . . . . . . . . . . . . . . . . . . . . . . . . . . . . . . . . . . . 222
10.3.3 Starting, Stopping, and Restarting Processes . . . . . . . . . . . . . . . . . . . . . . . . . . . . . 223
10.4 Filters . . . . . . . . . . . . . . . . . . . . . . . . . . . . . . . . . . . . . . . . . . . . . . . . . . . . . . . . . . . . . . . . . . . 223
10.4.1 Public Filters . . . . . . . . . . . . . . . . . . . . . . . . . . . . . . . . . . . . . . . . . . . . . . . . . . . . . . 223
10.4.2 Private Filters. . . . . . . . . . . . . . . . . . . . . . . . . . . . . . . . . . . . . . . . . . . . . . . . . . . . . . 224
10.4.3 Global Filters . . . . . . . . . . . . . . . . . . . . . . . . . . . . . . . . . . . . . . . . . . . . . . . . . . . . . . 224
10.4.4 Configuring Public and Private Filters . . . . . . . . . . . . . . . . . . . . . . . . . . . . . . . . . . . 227
10.4.5 Color Filter Configuration. . . . . . . . . . . . . . . . . . . . . . . . . . . . . . . . . . . . . . . . . . . . . 229
10.5 Configure Menu Options . . . . . . . . . . . . . . . . . . . . . . . . . . . . . . . . . . . . . . . . . . . . . . . . . . . . 232
10.5.1 Adding an Option to the Event Menu. . . . . . . . . . . . . . . . . . . . . . . . . . . . . . . . . . . . 234
10.5.2 Cloning an Event Menu Option . . . . . . . . . . . . . . . . . . . . . . . . . . . . . . . . . . . . . . . . 235
10.5.3 Modifying an Event Menu Option. . . . . . . . . . . . . . . . . . . . . . . . . . . . . . . . . . . . . . . 236
10.5.4 Viewing Event Menu Option Parameters . . . . . . . . . . . . . . . . . . . . . . . . . . . . . . . . . 236
10.5.5 Activating or Deactivating an Event Menu Option . . . . . . . . . . . . . . . . . . . . . . . . . . 236
10.5.6 Rearranging Event Menu Options . . . . . . . . . . . . . . . . . . . . . . . . . . . . . . . . . . . . . . 236
10.5.7 Deleting an Event Menu Option . . . . . . . . . . . . . . . . . . . . . . . . . . . . . . . . . . . . . . . . 236
10.5.8 Editing Your Event Menu Browser Settings . . . . . . . . . . . . . . . . . . . . . . . . . . . . . . . 237
10.6 DAS Statistics . . . . . . . . . . . . . . . . . . . . . . . . . . . . . . . . . . . . . . . . . . . . . . . . . . . . . . . . . . . . 238
10.7 Mapping . . . . . . . . . . . . . . . . . . . . . . . . . . . . . . . . . . . . . . . . . . . . . . . . . . . . . . . . . . . . . . . . . 239
10.7.1 Adding Map Definitions . . . . . . . . . . . . . . . . . . . . . . . . . . . . . . . . . . . . . . . . . . . . . . 241
10.7.2 Adding a Number Range Map Definition . . . . . . . . . . . . . . . . . . . . . . . . . . . . . . . . . 243
10.7.3 Editing Map Definitions . . . . . . . . . . . . . . . . . . . . . . . . . . . . . . . . . . . . . . . . . . . . . . 246
10.7.4 Deleting Map Definitions . . . . . . . . . . . . . . . . . . . . . . . . . . . . . . . . . . . . . . . . . . . . . 246
10.7.5 Updating Map Data . . . . . . . . . . . . . . . . . . . . . . . . . . . . . . . . . . . . . . . . . . . . . . . . . 247
10.8 Event Configuration . . . . . . . . . . . . . . . . . . . . . . . . . . . . . . . . . . . . . . . . . . . . . . . . . . . . . . . . 249
10.8.1 Event Mapping. . . . . . . . . . . . . . . . . . . . . . . . . . . . . . . . . . . . . . . . . . . . . . . . . . . . . 249
10.8.2 Renaming Tags . . . . . . . . . . . . . . . . . . . . . . . . . . . . . . . . . . . . . . . . . . . . . . . . . . . . 253
10.9 Report Data Configuration . . . . . . . . . . . . . . . . . . . . . . . . . . . . . . . . . . . . . . . . . . . . . . . . . . . 254
10.9.1 Disabling or Enabling a Summary . . . . . . . . . . . . . . . . . . . . . . . . . . . . . . . . . . . . . . 255
10.9.2 Viewing Information for a Summary. . . . . . . . . . . . . . . . . . . . . . . . . . . . . . . . . . . . . 256
10.9.3 Checking the Validity of a Summary . . . . . . . . . . . . . . . . . . . . . . . . . . . . . . . . . . . . 256
10.9.4 Query the Event Files for a Summary . . . . . . . . . . . . . . . . . . . . . . . . . . . . . . . . . . . 257
10.9.5 Running the Event Files for a Summary . . . . . . . . . . . . . . . . . . . . . . . . . . . . . . . . . 258
10.10 User Configurations . . . . . . . . . . . . . . . . . . . . . . . . . . . . . . . . . . . . . . . . . . . . . . . . . . . . . . . . 259
10.10.1 Opening the User Manager Window . . . . . . . . . . . . . . . . . . . . . . . . . . . . . . . . . . . . 259
10.10.2 Creating a User Account . . . . . . . . . . . . . . . . . . . . . . . . . . . . . . . . . . . . . . . . . . . . . 259
10.10.3 Modifying a User Account . . . . . . . . . . . . . . . . . . . . . . . . . . . . . . . . . . . . . . . . . . . . 264
10.10.4 Viewing Details of a User Account. . . . . . . . . . . . . . . . . . . . . . . . . . . . . . . . . . . . . . 264
10.10.5 Cloning a User Account . . . . . . . . . . . . . . . . . . . . . . . . . . . . . . . . . . . . . . . . . . . . . . 264
10.10.6 Deleting a User Account . . . . . . . . . . . . . . . . . . . . . . . . . . . . . . . . . . . . . . . . . . . . . 264
10.10.7 Terminating an Active User Session . . . . . . . . . . . . . . . . . . . . . . . . . . . . . . . . . . . . 264
10.10.8 Adding an iTRAC Role. . . . . . . . . . . . . . . . . . . . . . . . . . . . . . . . . . . . . . . . . . . . . . . 265
10.10.9 Deleting an iTRAC Role. . . . . . . . . . . . . . . . . . . . . . . . . . . . . . . . . . . . . . . . . . . . . . 265
10.10.10Viewing the Details of a Role. . . . . . . . . . . . . . . . . . . . . . . . . . . . . . . . . . . . . . . . . . 265
novdocx (en) 13 May 2009
11 Sentinel Data Manager 267
11.1 Understanding the Sentinel Data Manager . . . . . . . . . . . . . . . . . . . . . . . . . . . . . . . . . . . . . . 267
11.2 Using the SDM GUI . . . . . . . . . . . . . . . . . . . . . . . . . . . . . . . . . . . . . . . . . . . . . . . . . . . . . . . . 267
11.2.1 Prerequisites . . . . . . . . . . . . . . . . . . . . . . . . . . . . . . . . . . . . . . . . . . . . . . . . . . . . . . 267
11.2.2 Starting the SDM GUI . . . . . . . . . . . . . . . . . . . . . . . . . . . . . . . . . . . . . . . . . . . . . . . 268
Contents 9
Page 10

11.2.3 Connecting to the Database . . . . . . . . . . . . . . . . . . . . . . . . . . . . . . . . . . . . . . . . . . 268
11.2.4 Partitions Tab. . . . . . . . . . . . . . . . . . . . . . . . . . . . . . . . . . . . . . . . . . . . . . . . . . . . . . 269
11.2.5 Tablespaces Tab . . . . . . . . . . . . . . . . . . . . . . . . . . . . . . . . . . . . . . . . . . . . . . . . . . . 272
11.2.6 Partition Configuration . . . . . . . . . . . . . . . . . . . . . . . . . . . . . . . . . . . . . . . . . . . . . . . 273
11.2.7 Managing Disk Space Allocation . . . . . . . . . . . . . . . . . . . . . . . . . . . . . . . . . . . . . . . 275
11.3 Using the SDM Command Line . . . . . . . . . . . . . . . . . . . . . . . . . . . . . . . . . . . . . . . . . . . . . . . 275
11.3.1 Prerequisite . . . . . . . . . . . . . . . . . . . . . . . . . . . . . . . . . . . . . . . . . . . . . . . . . . . . . . . 276
11.3.2 Syntax of the SDM command . . . . . . . . . . . . . . . . . . . . . . . . . . . . . . . . . . . . . . . . . 276
11.3.3 Starting the SDM GUI . . . . . . . . . . . . . . . . . . . . . . . . . . . . . . . . . . . . . . . . . . . . . . . 276
11.3.4 Saving Connection Properties for Sentinel Data Manager . . . . . . . . . . . . . . . . . . . 276
11.3.5 Adding Partitions . . . . . . . . . . . . . . . . . . . . . . . . . . . . . . . . . . . . . . . . . . . . . . . . . . . 277
11.3.6 Dropping Partitions . . . . . . . . . . . . . . . . . . . . . . . . . . . . . . . . . . . . . . . . . . . . . . . . . 278
11.3.7 Viewing Partition Summaries. . . . . . . . . . . . . . . . . . . . . . . . . . . . . . . . . . . . . . . . . . 279
11.3.8 Archiving Data . . . . . . . . . . . . . . . . . . . . . . . . . . . . . . . . . . . . . . . . . . . . . . . . . . . . . 280
11.3.9 Importing Data . . . . . . . . . . . . . . . . . . . . . . . . . . . . . . . . . . . . . . . . . . . . . . . . . . . . . 281
11.3.10 Deleting Imported Data . . . . . . . . . . . . . . . . . . . . . . . . . . . . . . . . . . . . . . . . . . . . . . 282
11.3.11 Viewing Sentinel Database Space Usage . . . . . . . . . . . . . . . . . . . . . . . . . . . . . . . . 283
12 Utilities 285
12.1 Introduction to Sentinel Utilities . . . . . . . . . . . . . . . . . . . . . . . . . . . . . . . . . . . . . . . . . . . . . . . 285
12.2 Starting and Stopping a Sentinel Server . . . . . . . . . . . . . . . . . . . . . . . . . . . . . . . . . . . . . . . . 285
12.2.1 Starting a Sentinel Server . . . . . . . . . . . . . . . . . . . . . . . . . . . . . . . . . . . . . . . . . . . . 286
12.2.2 Stopping a Sentinel Server . . . . . . . . . . . . . . . . . . . . . . . . . . . . . . . . . . . . . . . . . . . 286
12.3 Sentinel Scripts . . . . . . . . . . . . . . . . . . . . . . . . . . . . . . . . . . . . . . . . . . . . . . . . . . . . . . . . . . . 286
12.3.1 Operational Scripts . . . . . . . . . . . . . . . . . . . . . . . . . . . . . . . . . . . . . . . . . . . . . . . . . 286
12.3.2 Troubleshooting Scripts . . . . . . . . . . . . . . . . . . . . . . . . . . . . . . . . . . . . . . . . . . . . . . 287
12.4 Version Information . . . . . . . . . . . . . . . . . . . . . . . . . . . . . . . . . . . . . . . . . . . . . . . . . . . . . . . . 289
12.4.1 Executable Version Information. . . . . . . . . . . . . . . . . . . . . . . . . . . . . . . . . . . . . . . . 289
12.4.2 Sentinel .jar Version Information . . . . . . . . . . . . . . . . . . . . . . . . . . . . . . . . . . . . . . . 289
12.5 Database Cleanup . . . . . . . . . . . . . . . . . . . . . . . . . . . . . . . . . . . . . . . . . . . . . . . . . . . . . . . . . 289
12.5.1 Components . . . . . . . . . . . . . . . . . . . . . . . . . . . . . . . . . . . . . . . . . . . . . . . . . . . . . . 290
12.5.2 Prerequisites . . . . . . . . . . . . . . . . . . . . . . . . . . . . . . . . . . . . . . . . . . . . . . . . . . . . . . 290
12.5.3 Running Clean_Database.sh. . . . . . . . . . . . . . . . . . . . . . . . . . . . . . . . . . . . . . . . . . 290
12.6 Updating Your License Key . . . . . . . . . . . . . . . . . . . . . . . . . . . . . . . . . . . . . . . . . . . . . . . . . . 292
novdocx (en) 13 May 2009
13 Quick Start 293
13.1 Security Analysts . . . . . . . . . . . . . . . . . . . . . . . . . . . . . . . . . . . . . . . . . . . . . . . . . . . . . . . . . . 293
13.1.1 Active Views Tab . . . . . . . . . . . . . . . . . . . . . . . . . . . . . . . . . . . . . . . . . . . . . . . . . . . 293
13.1.2 Exploit Detection . . . . . . . . . . . . . . . . . . . . . . . . . . . . . . . . . . . . . . . . . . . . . . . . . . . 294
13.1.3 Asset Data . . . . . . . . . . . . . . . . . . . . . . . . . . . . . . . . . . . . . . . . . . . . . . . . . . . . . . . . 295
13.1.4 Event Query. . . . . . . . . . . . . . . . . . . . . . . . . . . . . . . . . . . . . . . . . . . . . . . . . . . . . . . 296
13.2 Creating Incidents . . . . . . . . . . . . . . . . . . . . . . . . . . . . . . . . . . . . . . . . . . . . . . . . . . . . . . . . . 297
13.3 iTRAC. . . . . . . . . . . . . . . . . . . . . . . . . . . . . . . . . . . . . . . . . . . . . . . . . . . . . . . . . . . . . . . . . . . 298
13.3.1 Instantiating a Process . . . . . . . . . . . . . . . . . . . . . . . . . . . . . . . . . . . . . . . . . . . . . . 298
13.4 Correlation . . . . . . . . . . . . . . . . . . . . . . . . . . . . . . . . . . . . . . . . . . . . . . . . . . . . . . . . . . . . . . . 308
13.4.1 Creating a Simple Correlation Rule . . . . . . . . . . . . . . . . . . . . . . . . . . . . . . . . . . . . . 309
13.4.2 Deploying the Simple Correlation Rule . . . . . . . . . . . . . . . . . . . . . . . . . . . . . . . . . . 309
13.4.3 Viewing the Events that Triggered Your Correlated Event . . . . . . . . . . . . . . . . . . . 310
14 Solution Packs 311
14.1 Solution Packs . . . . . . . . . . . . . . . . . . . . . . . . . . . . . . . . . . . . . . . . . . . . . . . . . . . . . . . . . . . . 311
14.1.1 Components of a Solution Pack . . . . . . . . . . . . . . . . . . . . . . . . . . . . . . . . . . . . . . . 312
14.1.2 Permissions for Using Solution Packs . . . . . . . . . . . . . . . . . . . . . . . . . . . . . . . . . . . 313
10 Sentinel 6.1 Rapid Deployment User Guide
Page 11

14.2 Solution Manager . . . . . . . . . . . . . . . . . . . . . . . . . . . . . . . . . . . . . . . . . . . . . . . . . . . . . . . . . . 314
14.2.1 Solution Manager Interface . . . . . . . . . . . . . . . . . . . . . . . . . . . . . . . . . . . . . . . . . . . 315
14.3 Managing Solution Packs. . . . . . . . . . . . . . . . . . . . . . . . . . . . . . . . . . . . . . . . . . . . . . . . . . . . 316
14.3.1 Importing Solution Packs . . . . . . . . . . . . . . . . . . . . . . . . . . . . . . . . . . . . . . . . . . . . . 317
14.3.2 Opening Solution Packs . . . . . . . . . . . . . . . . . . . . . . . . . . . . . . . . . . . . . . . . . . . . . 319
14.3.3 Installing Content from Solution Packs . . . . . . . . . . . . . . . . . . . . . . . . . . . . . . . . . . 321
14.3.4 Implementing Controls. . . . . . . . . . . . . . . . . . . . . . . . . . . . . . . . . . . . . . . . . . . . . . . 325
14.3.5 Testing Controls. . . . . . . . . . . . . . . . . . . . . . . . . . . . . . . . . . . . . . . . . . . . . . . . . . . . 326
14.3.6 Uninstalling Controls . . . . . . . . . . . . . . . . . . . . . . . . . . . . . . . . . . . . . . . . . . . . . . . . 326
14.3.7 Viewing Solution Pack Status . . . . . . . . . . . . . . . . . . . . . . . . . . . . . . . . . . . . . . . . . 328
14.3.8 Deleting Solution Packs. . . . . . . . . . . . . . . . . . . . . . . . . . . . . . . . . . . . . . . . . . . . . . 330
14.4 Solution Designer . . . . . . . . . . . . . . . . . . . . . . . . . . . . . . . . . . . . . . . . . . . . . . . . . . . . . . . . . . 331
14.4.1 Solution Designer Interface . . . . . . . . . . . . . . . . . . . . . . . . . . . . . . . . . . . . . . . . . . . 331
14.4.2 Connection Modes. . . . . . . . . . . . . . . . . . . . . . . . . . . . . . . . . . . . . . . . . . . . . . . . . . 333
14.4.3 Creating a Solution Pack . . . . . . . . . . . . . . . . . . . . . . . . . . . . . . . . . . . . . . . . . . . . . 334
14.4.4 Managing Content Hierarchy Nodes . . . . . . . . . . . . . . . . . . . . . . . . . . . . . . . . . . . . 335
14.4.5 Adding Content to a Solution Pack . . . . . . . . . . . . . . . . . . . . . . . . . . . . . . . . . . . . . 336
14.4.6 Documenting a Solution Pack . . . . . . . . . . . . . . . . . . . . . . . . . . . . . . . . . . . . . . . . . 338
14.4.7 Editing a Solution Pack . . . . . . . . . . . . . . . . . . . . . . . . . . . . . . . . . . . . . . . . . . . . . . 339
14.5 Deploying an Edited Solution Pack . . . . . . . . . . . . . . . . . . . . . . . . . . . . . . . . . . . . . . . . . . . . 340
novdocx (en) 13 May 2009
15 Action Manager and Integrator 341
15.1 Action Manager . . . . . . . . . . . . . . . . . . . . . . . . . . . . . . . . . . . . . . . . . . . . . . . . . . . . . . . . . . . 341
15.2 Action Plug-Ins . . . . . . . . . . . . . . . . . . . . . . . . . . . . . . . . . . . . . . . . . . . . . . . . . . . . . . . . . . . . 343
15.2.1 Importing JavaScript Action Plug-Ins . . . . . . . . . . . . . . . . . . . . . . . . . . . . . . . . . . . . 343
15.2.2 Importing JavaScript Files . . . . . . . . . . . . . . . . . . . . . . . . . . . . . . . . . . . . . . . . . . . . 346
15.3 Actions . . . . . . . . . . . . . . . . . . . . . . . . . . . . . . . . . . . . . . . . . . . . . . . . . . . . . . . . . . . . . . . . . . 354
15.3.1 Creating Actions . . . . . . . . . . . . . . . . . . . . . . . . . . . . . . . . . . . . . . . . . . . . . . . . . . . 354
15.3.2 Editing Actions . . . . . . . . . . . . . . . . . . . . . . . . . . . . . . . . . . . . . . . . . . . . . . . . . . . . . 355
15.3.3 Deleting Actions. . . . . . . . . . . . . . . . . . . . . . . . . . . . . . . . . . . . . . . . . . . . . . . . . . . . 355
15.3.4 Using JavaScript Actions . . . . . . . . . . . . . . . . . . . . . . . . . . . . . . . . . . . . . . . . . . . . . 355
15.3.5 Developing JavaScript Actions . . . . . . . . . . . . . . . . . . . . . . . . . . . . . . . . . . . . . . . . 356
15.4 Integrator Manager. . . . . . . . . . . . . . . . . . . . . . . . . . . . . . . . . . . . . . . . . . . . . . . . . . . . . . . . . 360
15.4.1 Permissions for Using Integrators . . . . . . . . . . . . . . . . . . . . . . . . . . . . . . . . . . . . . . 361
15.5 Integrator Plug-Ins . . . . . . . . . . . . . . . . . . . . . . . . . . . . . . . . . . . . . . . . . . . . . . . . . . . . . . . . . 362
15.5.1 Importing Integrator Plugins. . . . . . . . . . . . . . . . . . . . . . . . . . . . . . . . . . . . . . . . . . . 362
15.5.2 Deleting Integrator Plug-Ins . . . . . . . . . . . . . . . . . . . . . . . . . . . . . . . . . . . . . . . . . . . 362
15.6 Integrators . . . . . . . . . . . . . . . . . . . . . . . . . . . . . . . . . . . . . . . . . . . . . . . . . . . . . . . . . . . . . . . 363
15.6.1 Creating an Integrator Instance . . . . . . . . . . . . . . . . . . . . . . . . . . . . . . . . . . . . . . . . 363
15.6.2 Editing an Integrator Instance . . . . . . . . . . . . . . . . . . . . . . . . . . . . . . . . . . . . . . . . . 363
15.6.3 Deleting an Integrator Instance . . . . . . . . . . . . . . . . . . . . . . . . . . . . . . . . . . . . . . . . 363
15.6.4 Integrator Connection Status . . . . . . . . . . . . . . . . . . . . . . . . . . . . . . . . . . . . . . . . . . 363
15.6.5 Viewing Integrator Health Details . . . . . . . . . . . . . . . . . . . . . . . . . . . . . . . . . . . . . . 364
15.6.6 Integrator Events Query. . . . . . . . . . . . . . . . . . . . . . . . . . . . . . . . . . . . . . . . . . . . . . 365
15.6.7 Using Integrators from Actions . . . . . . . . . . . . . . . . . . . . . . . . . . . . . . . . . . . . . . . . 367
16 Identity Integration 369
16.1 Integration with Novell Identity Manager . . . . . . . . . . . . . . . . . . . . . . . . . . . . . . . . . . . . . . . . 370
16.2 Identity Browser . . . . . . . . . . . . . . . . . . . . . . . . . . . . . . . . . . . . . . . . . . . . . . . . . . . . . . . . . . . 373
16.2.1 Searching Profiles . . . . . . . . . . . . . . . . . . . . . . . . . . . . . . . . . . . . . . . . . . . . . . . . . . 373
16.2.2 Viewing Profile Details . . . . . . . . . . . . . . . . . . . . . . . . . . . . . . . . . . . . . . . . . . . . . . . 374
16.2.3 Using the Clipboard Functionality . . . . . . . . . . . . . . . . . . . . . . . . . . . . . . . . . . . . . . 377
16.3 Reports. . . . . . . . . . . . . . . . . . . . . . . . . . . . . . . . . . . . . . . . . . . . . . . . . . . . . . . . . . . . . . . . . . 377
Contents 11
Page 12

17 Advisor Usage and Maintenance 379
17.1 Understanding Advisor . . . . . . . . . . . . . . . . . . . . . . . . . . . . . . . . . . . . . . . . . . . . . . . . . . . . . . 379
17.2 Installing Advisor . . . . . . . . . . . . . . . . . . . . . . . . . . . . . . . . . . . . . . . . . . . . . . . . . . . . . . . . . . 381
17.3 Viewing Advisor Data . . . . . . . . . . . . . . . . . . . . . . . . . . . . . . . . . . . . . . . . . . . . . . . . . . . . . . . 381
17.3.1 Using Menu Options to View Data . . . . . . . . . . . . . . . . . . . . . . . . . . . . . . . . . . . . . . 381
17.4 Maintaining Advisor . . . . . . . . . . . . . . . . . . . . . . . . . . . . . . . . . . . . . . . . . . . . . . . . . . . . . . . . 381
17.4.1 Updating Data in Advisor Tables . . . . . . . . . . . . . . . . . . . . . . . . . . . . . . . . . . . . . . . 382
17.4.2 Changing the Advisor E-Mail Configuration . . . . . . . . . . . . . . . . . . . . . . . . . . . . . . . 382
17.4.3 Changing the Scheduled Data Update Time . . . . . . . . . . . . . . . . . . . . . . . . . . . . . . 383
A Sentinel 6.1 Rapid Deployment Architecture 385
A.1 Sentinel 6.1 Rapid Deployment Features . . . . . . . . . . . . . . . . . . . . . . . . . . . . . . . . . . . . . . . 385
A.2 Functional Architecture . . . . . . . . . . . . . . . . . . . . . . . . . . . . . . . . . . . . . . . . . . . . . . . . . . . . . 385
A.3 Architecture Overview . . . . . . . . . . . . . . . . . . . . . . . . . . . . . . . . . . . . . . . . . . . . . . . . . . . . . . 387
A.3.1 Communication Server . . . . . . . . . . . . . . . . . . . . . . . . . . . . . . . . . . . . . . . . . . . . . . 388
A.3.2 Sentinel Events . . . . . . . . . . . . . . . . . . . . . . . . . . . . . . . . . . . . . . . . . . . . . . . . . . . . 389
A.3.3 Event Source Management . . . . . . . . . . . . . . . . . . . . . . . . . . . . . . . . . . . . . . . . . . . 393
A.3.4 Application Integration . . . . . . . . . . . . . . . . . . . . . . . . . . . . . . . . . . . . . . . . . . . . . . . 394
A.3.5 Time . . . . . . . . . . . . . . . . . . . . . . . . . . . . . . . . . . . . . . . . . . . . . . . . . . . . . . . . . . . . . 394
A.3.6 System Events . . . . . . . . . . . . . . . . . . . . . . . . . . . . . . . . . . . . . . . . . . . . . . . . . . . . . 395
A.3.7 Processes . . . . . . . . . . . . . . . . . . . . . . . . . . . . . . . . . . . . . . . . . . . . . . . . . . . . . . . . 396
A.4 Logical Architecture . . . . . . . . . . . . . . . . . . . . . . . . . . . . . . . . . . . . . . . . . . . . . . . . . . . . . . . . 398
A.4.1 Collection and Enrichment Layer . . . . . . . . . . . . . . . . . . . . . . . . . . . . . . . . . . . . . . . 399
A.4.2 Business Logic Layer. . . . . . . . . . . . . . . . . . . . . . . . . . . . . . . . . . . . . . . . . . . . . . . . 403
A.4.3 Presentation Layer. . . . . . . . . . . . . . . . . . . . . . . . . . . . . . . . . . . . . . . . . . . . . . . . . . 409
novdocx (en) 13 May 2009
B System Events for Sentinel 413
B.1 Authentication Events . . . . . . . . . . . . . . . . . . . . . . . . . . . . . . . . . . . . . . . . . . . . . . . . . . . . . . 413
B.1.1 Authentication . . . . . . . . . . . . . . . . . . . . . . . . . . . . . . . . . . . . . . . . . . . . . . . . . . . . . 413
B.1.2 Creating Entry For External User. . . . . . . . . . . . . . . . . . . . . . . . . . . . . . . . . . . . . . . 414
B.1.3 Duplicate User Objects . . . . . . . . . . . . . . . . . . . . . . . . . . . . . . . . . . . . . . . . . . . . . . 414
B.1.4 Failed Authentication . . . . . . . . . . . . . . . . . . . . . . . . . . . . . . . . . . . . . . . . . . . . . . . . 414
B.1.5 Locked Account . . . . . . . . . . . . . . . . . . . . . . . . . . . . . . . . . . . . . . . . . . . . . . . . . . . . 415
B.1.6 No Such User Event . . . . . . . . . . . . . . . . . . . . . . . . . . . . . . . . . . . . . . . . . . . . . . . . 415
B.1.7 Too Many Active Users . . . . . . . . . . . . . . . . . . . . . . . . . . . . . . . . . . . . . . . . . . . . . . 416
B.1.8 User Discovered . . . . . . . . . . . . . . . . . . . . . . . . . . . . . . . . . . . . . . . . . . . . . . . . . . . 416
B.1.9 User Logged In . . . . . . . . . . . . . . . . . . . . . . . . . . . . . . . . . . . . . . . . . . . . . . . . . . . . 416
B.1.10 User Logged Out . . . . . . . . . . . . . . . . . . . . . . . . . . . . . . . . . . . . . . . . . . . . . . . . . . . 417
B.2 User Management . . . . . . . . . . . . . . . . . . . . . . . . . . . . . . . . . . . . . . . . . . . . . . . . . . . . . . . . . 417
B.2.1 Add Users To Role . . . . . . . . . . . . . . . . . . . . . . . . . . . . . . . . . . . . . . . . . . . . . . . . . 417
B.2.2 Create Role . . . . . . . . . . . . . . . . . . . . . . . . . . . . . . . . . . . . . . . . . . . . . . . . . . . . . . . 418
B.2.3 Create User . . . . . . . . . . . . . . . . . . . . . . . . . . . . . . . . . . . . . . . . . . . . . . . . . . . . . . . 418
B.2.4 Creating User Account. . . . . . . . . . . . . . . . . . . . . . . . . . . . . . . . . . . . . . . . . . . . . . . 418
B.2.5 Delete Role . . . . . . . . . . . . . . . . . . . . . . . . . . . . . . . . . . . . . . . . . . . . . . . . . . . . . . . 419
B.2.6 Deleting User Account . . . . . . . . . . . . . . . . . . . . . . . . . . . . . . . . . . . . . . . . . . . . . . . 419
B.2.7 Locking User Account . . . . . . . . . . . . . . . . . . . . . . . . . . . . . . . . . . . . . . . . . . . . . . . 419
B.2.8 Remove Users From Role . . . . . . . . . . . . . . . . . . . . . . . . . . . . . . . . . . . . . . . . . . . . 420
B.2.9 Resetting Password . . . . . . . . . . . . . . . . . . . . . . . . . . . . . . . . . . . . . . . . . . . . . . . . . 420
B.2.10 Unlocking User Account . . . . . . . . . . . . . . . . . . . . . . . . . . . . . . . . . . . . . . . . . . . . . 420
B.2.11 Updating User . . . . . . . . . . . . . . . . . . . . . . . . . . . . . . . . . . . . . . . . . . . . . . . . . . . . . 421
B.3 Database Event Management . . . . . . . . . . . . . . . . . . . . . . . . . . . . . . . . . . . . . . . . . . . . . . . . 421
B.3.1 Diskspace Usage Reached Lower Threshold . . . . . . . . . . . . . . . . . . . . . . . . . . . . . 422
B.3.2 Diskspace Usage Reached Upper Threshold . . . . . . . . . . . . . . . . . . . . . . . . . . . . . 422
B.3.3 Dropping the Oldest Partition. . . . . . . . . . . . . . . . . . . . . . . . . . . . . . . . . . . . . . . . . . 422
12 Sentinel 6.1 Rapid Deployment User Guide
Page 13

B.3.4 Failing to Drop Online CurrentPartition . . . . . . . . . . . . . . . . . . . . . . . . . . . . . . . . . . 423
B.3.5 Database Space Reached Specified Percent Threshold. . . . . . . . . . . . . . . . . . . . . 423
B.3.6 Database Space Reached Specified Time Threshold . . . . . . . . . . . . . . . . . . . . . . . 423
B.3.7 Database Space Very Low . . . . . . . . . . . . . . . . . . . . . . . . . . . . . . . . . . . . . . . . . . . 424
B.3.8 Error inserting events. . . . . . . . . . . . . . . . . . . . . . . . . . . . . . . . . . . . . . . . . . . . . . . . 424
B.3.9 Error Moving Completed File . . . . . . . . . . . . . . . . . . . . . . . . . . . . . . . . . . . . . . . . . . 424
B.3.10 Error Processing Event Message . . . . . . . . . . . . . . . . . . . . . . . . . . . . . . . . . . . . . . 425
B.3.11 Error Saving Failed Events . . . . . . . . . . . . . . . . . . . . . . . . . . . . . . . . . . . . . . . . . . . 425
B.3.12 Event Insertion Is Blocked . . . . . . . . . . . . . . . . . . . . . . . . . . . . . . . . . . . . . . . . . . . . 425
B.3.13 Event Insertion Is Resumed. . . . . . . . . . . . . . . . . . . . . . . . . . . . . . . . . . . . . . . . . . . 426
B.3.14 Event Message Queue Overflow. . . . . . . . . . . . . . . . . . . . . . . . . . . . . . . . . . . . . . . 426
B.3.15 Event Processing Failed . . . . . . . . . . . . . . . . . . . . . . . . . . . . . . . . . . . . . . . . . . . . . 426
B.3.16 No Space In The Database . . . . . . . . . . . . . . . . . . . . . . . . . . . . . . . . . . . . . . . . . . . 427
B.3.17 Opening Archive File Failed. . . . . . . . . . . . . . . . . . . . . . . . . . . . . . . . . . . . . . . . . . . 427
B.3.18 Partition Configuration . . . . . . . . . . . . . . . . . . . . . . . . . . . . . . . . . . . . . . . . . . . . . . . 427
B.3.19 Writing to Archive File failed . . . . . . . . . . . . . . . . . . . . . . . . . . . . . . . . . . . . . . . . . . 428
B.3.20 Writing to the overflow partition (P_MAX) . . . . . . . . . . . . . . . . . . . . . . . . . . . . . . . . 428
B.4 Database Aggregation . . . . . . . . . . . . . . . . . . . . . . . . . . . . . . . . . . . . . . . . . . . . . . . . . . . . . . 428
B.4.1 Creating Summary . . . . . . . . . . . . . . . . . . . . . . . . . . . . . . . . . . . . . . . . . . . . . . . . . . 429
B.4.2 Deleting Summary . . . . . . . . . . . . . . . . . . . . . . . . . . . . . . . . . . . . . . . . . . . . . . . . . . 429
B.4.3 Disabling Summary . . . . . . . . . . . . . . . . . . . . . . . . . . . . . . . . . . . . . . . . . . . . . . . . . 429
B.4.4 Enabling Summary . . . . . . . . . . . . . . . . . . . . . . . . . . . . . . . . . . . . . . . . . . . . . . . . . 430
B.4.5 Error inserting Summary Data into the Database . . . . . . . . . . . . . . . . . . . . . . . . . . 430
B.4.6 Saving Summary . . . . . . . . . . . . . . . . . . . . . . . . . . . . . . . . . . . . . . . . . . . . . . . . . . . 430
B.5 Mapping Service . . . . . . . . . . . . . . . . . . . . . . . . . . . . . . . . . . . . . . . . . . . . . . . . . . . . . . . . . . 430
B.5.1 Error . . . . . . . . . . . . . . . . . . . . . . . . . . . . . . . . . . . . . . . . . . . . . . . . . . . . . . . . . . . . . 431
B.5.2 Error Applying Incremental Update . . . . . . . . . . . . . . . . . . . . . . . . . . . . . . . . . . . . . 431
B.5.3 Error initializing map with ID . . . . . . . . . . . . . . . . . . . . . . . . . . . . . . . . . . . . . . . . . . 432
B.5.4 Error Refreshing Map . . . . . . . . . . . . . . . . . . . . . . . . . . . . . . . . . . . . . . . . . . . . . . . 432
B.5.5 Error Saving Data File . . . . . . . . . . . . . . . . . . . . . . . . . . . . . . . . . . . . . . . . . . . . . . . 433
B.5.6 Get File Size . . . . . . . . . . . . . . . . . . . . . . . . . . . . . . . . . . . . . . . . . . . . . . . . . . . . . . 433
B.5.7 Loaded Large Map. . . . . . . . . . . . . . . . . . . . . . . . . . . . . . . . . . . . . . . . . . . . . . . . . . 433
B.5.8 Long Time To Load Map . . . . . . . . . . . . . . . . . . . . . . . . . . . . . . . . . . . . . . . . . . . . . 434
B.5.9 Out Of Sync Detected . . . . . . . . . . . . . . . . . . . . . . . . . . . . . . . . . . . . . . . . . . . . . . . 434
B.5.10 Refreshing Map from Cache . . . . . . . . . . . . . . . . . . . . . . . . . . . . . . . . . . . . . . . . . . 434
B.5.11 Refreshing Map from Server . . . . . . . . . . . . . . . . . . . . . . . . . . . . . . . . . . . . . . . . . . 435
B.5.12 Save Data File . . . . . . . . . . . . . . . . . . . . . . . . . . . . . . . . . . . . . . . . . . . . . . . . . . . . . 435
B.5.13 Saved Data File . . . . . . . . . . . . . . . . . . . . . . . . . . . . . . . . . . . . . . . . . . . . . . . . . . . . 436
B.5.14 Timed Out Waiting For Callback . . . . . . . . . . . . . . . . . . . . . . . . . . . . . . . . . . . . . . . 436
B.5.15 Timeout Refreshing Map . . . . . . . . . . . . . . . . . . . . . . . . . . . . . . . . . . . . . . . . . . . . . 436
B.5.16 Update . . . . . . . . . . . . . . . . . . . . . . . . . . . . . . . . . . . . . . . . . . . . . . . . . . . . . . . . . . . 437
B.5.17 Update . . . . . . . . . . . . . . . . . . . . . . . . . . . . . . . . . . . . . . . . . . . . . . . . . . . . . . . . . . . 437
B.6 Event Router . . . . . . . . . . . . . . . . . . . . . . . . . . . . . . . . . . . . . . . . . . . . . . . . . . . . . . . . . . . . . 437
B.6.1 Event Router is Initializing . . . . . . . . . . . . . . . . . . . . . . . . . . . . . . . . . . . . . . . . . . . . 438
B.6.2 Event Router Is Running . . . . . . . . . . . . . . . . . . . . . . . . . . . . . . . . . . . . . . . . . . . . . 438
B.6.3 Event Router is Stopping . . . . . . . . . . . . . . . . . . . . . . . . . . . . . . . . . . . . . . . . . . . . . 438
B.6.4 Event Router is Terminating . . . . . . . . . . . . . . . . . . . . . . . . . . . . . . . . . . . . . . . . . . 439
B.7 Correlation Engine . . . . . . . . . . . . . . . . . . . . . . . . . . . . . . . . . . . . . . . . . . . . . . . . . . . . . . . . . 439
B.7.1 Correlation Action Definition . . . . . . . . . . . . . . . . . . . . . . . . . . . . . . . . . . . . . . . . . . 440
B.7.2 Correlation Engine Configuration. . . . . . . . . . . . . . . . . . . . . . . . . . . . . . . . . . . . . . . 440
B.7.3 Correlation Engine is Running . . . . . . . . . . . . . . . . . . . . . . . . . . . . . . . . . . . . . . . . . 440
B.7.4 Correlation Engine is Stopped . . . . . . . . . . . . . . . . . . . . . . . . . . . . . . . . . . . . . . . . . 441
B.7.5 Correlation Rule . . . . . . . . . . . . . . . . . . . . . . . . . . . . . . . . . . . . . . . . . . . . . . . . . . . . 441
B.7.6 Correlation Rule Configuration . . . . . . . . . . . . . . . . . . . . . . . . . . . . . . . . . . . . . . . . 441
B.7.7 Deploy Rules With Actions To Engine . . . . . . . . . . . . . . . . . . . . . . . . . . . . . . . . . . . 442
B.7.8 Disabling Rule . . . . . . . . . . . . . . . . . . . . . . . . . . . . . . . . . . . . . . . . . . . . . . . . . . . . . 442
B.7.9 Enabling Rule . . . . . . . . . . . . . . . . . . . . . . . . . . . . . . . . . . . . . . . . . . . . . . . . . . . . . 442
B.7.10 Rename Correlation Engine . . . . . . . . . . . . . . . . . . . . . . . . . . . . . . . . . . . . . . . . . . 443
novdocx (en) 13 May 2009
Contents 13
Page 14

B.7.11 Rule Deployment is Modified. . . . . . . . . . . . . . . . . . . . . . . . . . . . . . . . . . . . . . . . . . 443
B.7.12 Rule Deployment Is Started. . . . . . . . . . . . . . . . . . . . . . . . . . . . . . . . . . . . . . . . . . . 443
B.7.13 Rule Deployment is Stopped . . . . . . . . . . . . . . . . . . . . . . . . . . . . . . . . . . . . . . . . . . 444
B.7.14 Starting Engine . . . . . . . . . . . . . . . . . . . . . . . . . . . . . . . . . . . . . . . . . . . . . . . . . . . . 444
B.7.15 Stopping Engine . . . . . . . . . . . . . . . . . . . . . . . . . . . . . . . . . . . . . . . . . . . . . . . . . . . 444
B.7.16 UnDeploy All Rules From Engine . . . . . . . . . . . . . . . . . . . . . . . . . . . . . . . . . . . . . . 445
B.7.17 UnDeploy Rule. . . . . . . . . . . . . . . . . . . . . . . . . . . . . . . . . . . . . . . . . . . . . . . . . . . . . 445
B.7.18 Update Correlation Rule Actions . . . . . . . . . . . . . . . . . . . . . . . . . . . . . . . . . . . . . . . 445
B.8 Event Source Management:General . . . . . . . . . . . . . . . . . . . . . . . . . . . . . . . . . . . . . . . . . . . 445
B.8.1 Collector Manager Initialized . . . . . . . . . . . . . . . . . . . . . . . . . . . . . . . . . . . . . . . . . . 446
B.8.2 Collector Manager Is Down . . . . . . . . . . . . . . . . . . . . . . . . . . . . . . . . . . . . . . . . . . . 447
B.8.3 Collector Manager Started . . . . . . . . . . . . . . . . . . . . . . . . . . . . . . . . . . . . . . . . . . . . 447
B.8.4 Collector Manager Stopped . . . . . . . . . . . . . . . . . . . . . . . . . . . . . . . . . . . . . . . . . . . 447
B.8.5 Collector Service Callback . . . . . . . . . . . . . . . . . . . . . . . . . . . . . . . . . . . . . . . . . . . . 448
B.8.6 Cyclical Dependency . . . . . . . . . . . . . . . . . . . . . . . . . . . . . . . . . . . . . . . . . . . . . . . . 448
B.8.7 Event Source Manager Callback . . . . . . . . . . . . . . . . . . . . . . . . . . . . . . . . . . . . . . . 448
B.8.8 Initializing Collector Manager. . . . . . . . . . . . . . . . . . . . . . . . . . . . . . . . . . . . . . . . . . 449
B.8.9 Lost Contact With Collector Manager . . . . . . . . . . . . . . . . . . . . . . . . . . . . . . . . . . . 449
B.8.10 No Data Alert . . . . . . . . . . . . . . . . . . . . . . . . . . . . . . . . . . . . . . . . . . . . . . . . . . . . . . 449
B.8.11 Persistent Process Died . . . . . . . . . . . . . . . . . . . . . . . . . . . . . . . . . . . . . . . . . . . . . 449
B.8.12 Persistent Process Restarted . . . . . . . . . . . . . . . . . . . . . . . . . . . . . . . . . . . . . . . . . 450
B.8.13 Port Start . . . . . . . . . . . . . . . . . . . . . . . . . . . . . . . . . . . . . . . . . . . . . . . . . . . . . . . . . 450
B.8.14 Port Stop . . . . . . . . . . . . . . . . . . . . . . . . . . . . . . . . . . . . . . . . . . . . . . . . . . . . . . . . . 450
B.8.15 Reestablished Contact With Collector Manager . . . . . . . . . . . . . . . . . . . . . . . . . . . 451
B.8.16 Restart Plugin Deployments . . . . . . . . . . . . . . . . . . . . . . . . . . . . . . . . . . . . . . . . . . 451
B.8.17 Restarting Collector Manager (Cold Restart). . . . . . . . . . . . . . . . . . . . . . . . . . . . . . 452
B.8.18 Restarting Collector Manager (Warm Restart). . . . . . . . . . . . . . . . . . . . . . . . . . . . . 452
B.8.19 Start Event Source Group . . . . . . . . . . . . . . . . . . . . . . . . . . . . . . . . . . . . . . . . . . . . 452
B.8.20 Start Event Source Manager . . . . . . . . . . . . . . . . . . . . . . . . . . . . . . . . . . . . . . . . . . 453
B.8.21 Starting Collector Manager . . . . . . . . . . . . . . . . . . . . . . . . . . . . . . . . . . . . . . . . . . . 453
B.8.22 Stop Event Source Group . . . . . . . . . . . . . . . . . . . . . . . . . . . . . . . . . . . . . . . . . . . . 453
B.8.23 Stop Event Source Manager . . . . . . . . . . . . . . . . . . . . . . . . . . . . . . . . . . . . . . . . . . 454
B.8.24 Stopping Collector Manager . . . . . . . . . . . . . . . . . . . . . . . . . . . . . . . . . . . . . . . . . . 454
B.9 Event Source Management-Event Sources . . . . . . . . . . . . . . . . . . . . . . . . . . . . . . . . . . . . . . 454
B.9.1 Start Event Source. . . . . . . . . . . . . . . . . . . . . . . . . . . . . . . . . . . . . . . . . . . . . . . . . . 454
B.9.2 Stop Event Source . . . . . . . . . . . . . . . . . . . . . . . . . . . . . . . . . . . . . . . . . . . . . . . . . . 455
B.10 Event Source Management-Collectors . . . . . . . . . . . . . . . . . . . . . . . . . . . . . . . . . . . . . . . . . 455
B.10.1 Start Collector . . . . . . . . . . . . . . . . . . . . . . . . . . . . . . . . . . . . . . . . . . . . . . . . . . . . . 455
B.10.2 Stop Collector . . . . . . . . . . . . . . . . . . . . . . . . . . . . . . . . . . . . . . . . . . . . . . . . . . . . . 455
B.11 Event Source Management-Event Source Servers . . . . . . . . . . . . . . . . . . . . . . . . . . . . . . . . 456
B.11.1 Start Event Source Server . . . . . . . . . . . . . . . . . . . . . . . . . . . . . . . . . . . . . . . . . . . . 456
B.11.2 Stop Event Source Server . . . . . . . . . . . . . . . . . . . . . . . . . . . . . . . . . . . . . . . . . . . . 456
B.11.3 Stop Event Source Server . . . . . . . . . . . . . . . . . . . . . . . . . . . . . . . . . . . . . . . . . . . . 456
B.12 Event Source Management-Connectors . . . . . . . . . . . . . . . . . . . . . . . . . . . . . . . . . . . . . . . . 457
B.12.1 Data Received After Timeout. . . . . . . . . . . . . . . . . . . . . . . . . . . . . . . . . . . . . . . . . . 457
B.12.2 Data Timeout . . . . . . . . . . . . . . . . . . . . . . . . . . . . . . . . . . . . . . . . . . . . . . . . . . . . . . 457
B.12.3 File Rotation. . . . . . . . . . . . . . . . . . . . . . . . . . . . . . . . . . . . . . . . . . . . . . . . . . . . . . . 458
B.12.4 Process Auto Restart Error . . . . . . . . . . . . . . . . . . . . . . . . . . . . . . . . . . . . . . . . . . . 458
B.12.5 Process Start Error . . . . . . . . . . . . . . . . . . . . . . . . . . . . . . . . . . . . . . . . . . . . . . . . . 458
B.12.6 Process Stop . . . . . . . . . . . . . . . . . . . . . . . . . . . . . . . . . . . . . . . . . . . . . . . . . . . . . . 459
B.12.7 WMI Connector Status Message. . . . . . . . . . . . . . . . . . . . . . . . . . . . . . . . . . . . . . . 459
B.13 Active Views. . . . . . . . . . . . . . . . . . . . . . . . . . . . . . . . . . . . . . . . . . . . . . . . . . . . . . . . . . . . . . 459
B.13.1 Active View Created . . . . . . . . . . . . . . . . . . . . . . . . . . . . . . . . . . . . . . . . . . . . . . . . 460
B.13.2 Active View Joined. . . . . . . . . . . . . . . . . . . . . . . . . . . . . . . . . . . . . . . . . . . . . . . . . . 460
B.13.3 Active View No Longer Permanent . . . . . . . . . . . . . . . . . . . . . . . . . . . . . . . . . . . . . 460
B.13.4 Active View Now Permanent . . . . . . . . . . . . . . . . . . . . . . . . . . . . . . . . . . . . . . . . . . 461
B.13.5 Idle Active View Removed . . . . . . . . . . . . . . . . . . . . . . . . . . . . . . . . . . . . . . . . . . . . 461
B.13.6 Idle Permanent Active View Removed . . . . . . . . . . . . . . . . . . . . . . . . . . . . . . . . . . 461
novdocx (en) 13 May 2009
14 Sentinel 6.1 Rapid Deployment User Guide
Page 15

B.14 Data Objects . . . . . . . . . . . . . . . . . . . . . . . . . . . . . . . . . . . . . . . . . . . . . . . . . . . . . . . . . . . . . 462
B.14.1 Activity Definition . . . . . . . . . . . . . . . . . . . . . . . . . . . . . . . . . . . . . . . . . . . . . . . . . . . 462
B.14.2 Configuration . . . . . . . . . . . . . . . . . . . . . . . . . . . . . . . . . . . . . . . . . . . . . . . . . . . . . . 462
B.14.3 Viewing Configuration Store . . . . . . . . . . . . . . . . . . . . . . . . . . . . . . . . . . . . . . . . . . 463
B.14.4 Write Data . . . . . . . . . . . . . . . . . . . . . . . . . . . . . . . . . . . . . . . . . . . . . . . . . . . . . . . . 463
B.15 Activities . . . . . . . . . . . . . . . . . . . . . . . . . . . . . . . . . . . . . . . . . . . . . . . . . . . . . . . . . . . . . . . . . 463
B.15.1 Creating an Activity . . . . . . . . . . . . . . . . . . . . . . . . . . . . . . . . . . . . . . . . . . . . . . . . . 464
B.15.2 Deleting an Activity . . . . . . . . . . . . . . . . . . . . . . . . . . . . . . . . . . . . . . . . . . . . . . . . . 464
B.15.3 Saving an Activity . . . . . . . . . . . . . . . . . . . . . . . . . . . . . . . . . . . . . . . . . . . . . . . . . . 464
B.16 Incidents and Workflows . . . . . . . . . . . . . . . . . . . . . . . . . . . . . . . . . . . . . . . . . . . . . . . . . . . . 464
B.16.1 Add Events to Incident. . . . . . . . . . . . . . . . . . . . . . . . . . . . . . . . . . . . . . . . . . . . . . . 465
B.16.2 Adding Process Definition . . . . . . . . . . . . . . . . . . . . . . . . . . . . . . . . . . . . . . . . . . . . 465
B.16.3 Create Incident . . . . . . . . . . . . . . . . . . . . . . . . . . . . . . . . . . . . . . . . . . . . . . . . . . . . 466
B.16.4 Creating Group . . . . . . . . . . . . . . . . . . . . . . . . . . . . . . . . . . . . . . . . . . . . . . . . . . . . 466
B.16.5 Creating User. . . . . . . . . . . . . . . . . . . . . . . . . . . . . . . . . . . . . . . . . . . . . . . . . . . . . . 466
B.16.6 Delete Incident. . . . . . . . . . . . . . . . . . . . . . . . . . . . . . . . . . . . . . . . . . . . . . . . . . . . . 467
B.16.7 Deleting Group. . . . . . . . . . . . . . . . . . . . . . . . . . . . . . . . . . . . . . . . . . . . . . . . . . . . . 467
B.16.8 Deleting Process Definition . . . . . . . . . . . . . . . . . . . . . . . . . . . . . . . . . . . . . . . . . . . 467
B.16.9 Deleting User . . . . . . . . . . . . . . . . . . . . . . . . . . . . . . . . . . . . . . . . . . . . . . . . . . . . . . 468
B.16.10 E-Mail Incident . . . . . . . . . . . . . . . . . . . . . . . . . . . . . . . . . . . . . . . . . . . . . . . . . . . . . 468
B.16.11 Get Incident . . . . . . . . . . . . . . . . . . . . . . . . . . . . . . . . . . . . . . . . . . . . . . . . . . . . . . . 468
B.16.12 Save Incident . . . . . . . . . . . . . . . . . . . . . . . . . . . . . . . . . . . . . . . . . . . . . . . . . . . . . . 469
B.16.13 Saving Group . . . . . . . . . . . . . . . . . . . . . . . . . . . . . . . . . . . . . . . . . . . . . . . . . . . . . . 469
B.16.14 Saving Process Definition . . . . . . . . . . . . . . . . . . . . . . . . . . . . . . . . . . . . . . . . . . . . 469
B.16.15 Send Incident to Hp Service Desk . . . . . . . . . . . . . . . . . . . . . . . . . . . . . . . . . . . . . . 470
B.16.16 Send Incident to HpOVO . . . . . . . . . . . . . . . . . . . . . . . . . . . . . . . . . . . . . . . . . . . . . 470
B.16.17 Viewing Process Definition . . . . . . . . . . . . . . . . . . . . . . . . . . . . . . . . . . . . . . . . . . . 470
B.17 General . . . . . . . . . . . . . . . . . . . . . . . . . . . . . . . . . . . . . . . . . . . . . . . . . . . . . . . . . . . . . . . . . 470
B.17.1 Configuration Service . . . . . . . . . . . . . . . . . . . . . . . . . . . . . . . . . . . . . . . . . . . . . . . 471
B.17.2 Controlled Process is started. . . . . . . . . . . . . . . . . . . . . . . . . . . . . . . . . . . . . . . . . . 471
B.17.3 Controlled Process Is Stopped . . . . . . . . . . . . . . . . . . . . . . . . . . . . . . . . . . . . . . . . 472
B.17.4 Importing Auxiliary . . . . . . . . . . . . . . . . . . . . . . . . . . . . . . . . . . . . . . . . . . . . . . . . . . 472
B.17.5 Importing Plug-In . . . . . . . . . . . . . . . . . . . . . . . . . . . . . . . . . . . . . . . . . . . . . . . . . . . 472
B.17.6 Load Esec Taxonomy to XML . . . . . . . . . . . . . . . . . . . . . . . . . . . . . . . . . . . . . . . . . 473
B.17.7 Process Auto Restart Error . . . . . . . . . . . . . . . . . . . . . . . . . . . . . . . . . . . . . . . . . . . 473
B.17.8 Process Restarts . . . . . . . . . . . . . . . . . . . . . . . . . . . . . . . . . . . . . . . . . . . . . . . . . . . 473
B.17.9 Proxy Client Registration Service (medium) . . . . . . . . . . . . . . . . . . . . . . . . . . . . . . 474
B.17.10 Restarting Process . . . . . . . . . . . . . . . . . . . . . . . . . . . . . . . . . . . . . . . . . . . . . . . . . 474
B.17.11 Restarting Processes. . . . . . . . . . . . . . . . . . . . . . . . . . . . . . . . . . . . . . . . . . . . . . . . 474
B.17.12 Starting Process . . . . . . . . . . . . . . . . . . . . . . . . . . . . . . . . . . . . . . . . . . . . . . . . . . . 475
B.17.13 Starting Processes. . . . . . . . . . . . . . . . . . . . . . . . . . . . . . . . . . . . . . . . . . . . . . . . . . 475
B.17.14 Stopping Process. . . . . . . . . . . . . . . . . . . . . . . . . . . . . . . . . . . . . . . . . . . . . . . . . . . 475
B.17.15 Stopping Processes . . . . . . . . . . . . . . . . . . . . . . . . . . . . . . . . . . . . . . . . . . . . . . . . . 476
B.17.16 Store Esec Taxonomy From XML . . . . . . . . . . . . . . . . . . . . . . . . . . . . . . . . . . . . . . 476
B.17.17 Watchdog Process is started . . . . . . . . . . . . . . . . . . . . . . . . . . . . . . . . . . . . . . . . . . 476
B.17.18 Watchdog Process Is stopped . . . . . . . . . . . . . . . . . . . . . . . . . . . . . . . . . . . . . . . . . 477
novdocx (en) 13 May 2009
C Documentation Updates 479
C.1 September 2009. . . . . . . . . . . . . . . . . . . . . . . . . . . . . . . . . . . . . . . . . . . . . . . . . . . . . . . . . . . 479
C.2 August 2009 . . . . . . . . . . . . . . . . . . . . . . . . . . . . . . . . . . . . . . . . . . . . . . . . . . . . . . . . . . . . . . 479
Contents 15
Page 16

novdocx (en) 13 May 2009
16 Sentinel 6.1 Rapid Deployment User Guide
Page 17

About This Guide
Novell® SentinelTM 6.1 Rapid Deployment is a security information and event management solution
that receives information from many sources throughout an enterprise, standardizes it, prioritizes it,
and presents it to you to make threat, risk, and policy-related decisions. This guide is divided into
the following sections:
Chapter 1, “Managing Sentinel 6.1 Rapid Deployment Through the Web Interface,” on page 19
Chapter 2, “Sentinel Control Center,” on page 41
Chapter 3, “Active Views Tab,” on page 53
Chapter 4, “Correlation Tab,” on page 83
Chapter 5, “Incidents Tab,” on page 109
Chapter 6, “iTRAC Workflows,” on page 123
Chapter 7, “Work Items,” on page 161
Chapter 8, “Analysis Tab,” on page 167
novdocx (en) 13 May 2009
Chapter 9, “Event Source Management,” on page 171
Chapter 10, “Administration,” on page 219
Chapter 11, “Sentinel Data Manager,” on page 267
Chapter 12, “Utilities,” on page 285
Chapter 13, “Quick Start,” on page 293
Chapter 14, “Solution Packs,” on page 311
Chapter 15, “Action Manager and Integrator,” on page 341
Chapter 17, “Advisor Usage and Maintenance,” on page 379
Appendix A, “Sentinel 6.1 Rapid Deployment Architecture,” on page 385
Appendix B, “System Events for Sentinel,” on page 413
Audience
This documentation is intended for information security professionals.
Feedback
We want to hear your comments and suggestions about this manual and the other documentation
included with this product. Please use the User Comments feature at the bottom of each page of the
online documentation or go to Novell Documentation Feedback (http://www.novell.com/
documentation/feedback.html) and enter your comments there.
Additional Documentation
Sentinel technical documentation includes several different volumes:
Novell Sentinel 6.1 Rapid Deployment Installation Guide (http://www.novell.com/
documentation/sentinel61rd/s61rd_install/data/index.html)
About This Guide 17
Page 18

Novell Sentinel 6.1 Rapid Deployment User Guide (http://www.novell.com/documentation/
sentinel61rd/s61rd_user/data/index.html)
Novell Sentinel 6.1 Rapid Deployment Reference Guide (http://www.novell.com/
documentation/sentinel61rd/s61rd_reference/data/index.html)
Sentinel 6.1 Install Guide (http://www.novell.com/documentation/sentinel61/pdfdoc/
sentinel_61_installation_guide.pdf)
Sentinel 6.1 User Guide (http://www.novell.com/documentation/sentinel61/pdfdoc/
sentinel_61_user_guide.pdf)
Sentinel 6.1 Reference Guide (http://www.novell.com/documentation/sentinel61/pdfdoc/
sentinel_61_reference_guide.pdf)
Sentinel SDK (http://developer.novell.com/wiki/index.php?title=Develop_to_Sentinel)
The Sentinel SDK site provides the details about developing Collectors (proprietary or
JavaScript*) and JavaScript correlation actions.
Documentation Conventions
In this documentation, a greater-than symbol (>) is used to separate actions within a step and items
within a cross-reference path.
novdocx (en) 13 May 2009
A trademark symbol (®, ™, etc.) denotes a Novell trademark. An asterisk (*) denotes a third-party
trademark.
When a single path name can be written with a backslash for some platforms or a forward slash for
other platforms, the path name is presented with forward slashes to reflect the Linux* convention.
®
Users of platforms that require a backslash, such as NetWare
, should use backlashes as required by
your software.
Contacting Novell
Novell Web site (http://www.novell.com)
Novell Support (http://support.novell.com/phone.html?sourceidint=suplnav4_phonesup)
Novell Self Support (http://support.novell.com/
support_options.html?sourceidint=suplnav_supportprog)
Patch Download Site (http://download.novell.com/index.jsp)
Novell 24x7 Support (http://www.novell.com/company/contact.html)
Sentinel TIDS (http://support.novell.com/products/sentinel)
18 Sentinel 6.1 Rapid Deployment User Guide
Page 19

1
Managing Sentinel 6.1 Rapid
novdocx (en) 13 May 2009
Deployment Through the Web
Interface
This section discusses how to manage the services for Novell® SentinelTM by using the Sentinel Web
interface.
Section 1.1, “Accessing the Novell Sentinel Web Interface,” on page 19
Section 1.2, “Applications and Installers,” on page 19
Section 1.3, “Reporting,” on page 21
Section 1.4, “Searching Events,” on page 31
1.1 Accessing the Novell Sentinel Web Interface
Use the Novell Sentinel Web interface to manage, run, schedule, and search reports, launch the
Sentinel Control Center (SCC), the Sentinel Data Manager (SDM), and the Solution Designer, and
download the Collector Manager installer and the Client installer. You can also perform full-text
search on events by using the Web interface.
1 Open a Web browser to the following URL:
https://svrname.example.com: port/sentinel
Replace
192.168.1.1
svrname.example.com
) of the server where Sentinel is running.
with the actual DNS name or IP address (such as
1
IMPORTANT: The URL is case sensitive.
2 If you are prompted to verify the certificates, review the certificate information, then click Yes
if it is valid.
3 Specify the username and password for the Sentinel account you want to access.
4 Use the Languages drop-down list to specify which language you want to use.
This is typically the same language as the language code of the Sentinel server and your local
computer. Make sure to configure your browser's Languages setting to support the desired
language.
5 Click Sign in.
1.2 Applications and Installers
Click Applications in the left panel of the Novell Sentinel 6.1 Rapid Deployment Web interface to
download the Sentinel components.
Managing Sentinel 6.1 Rapid Deployment Through the Web Interface
19
Page 20
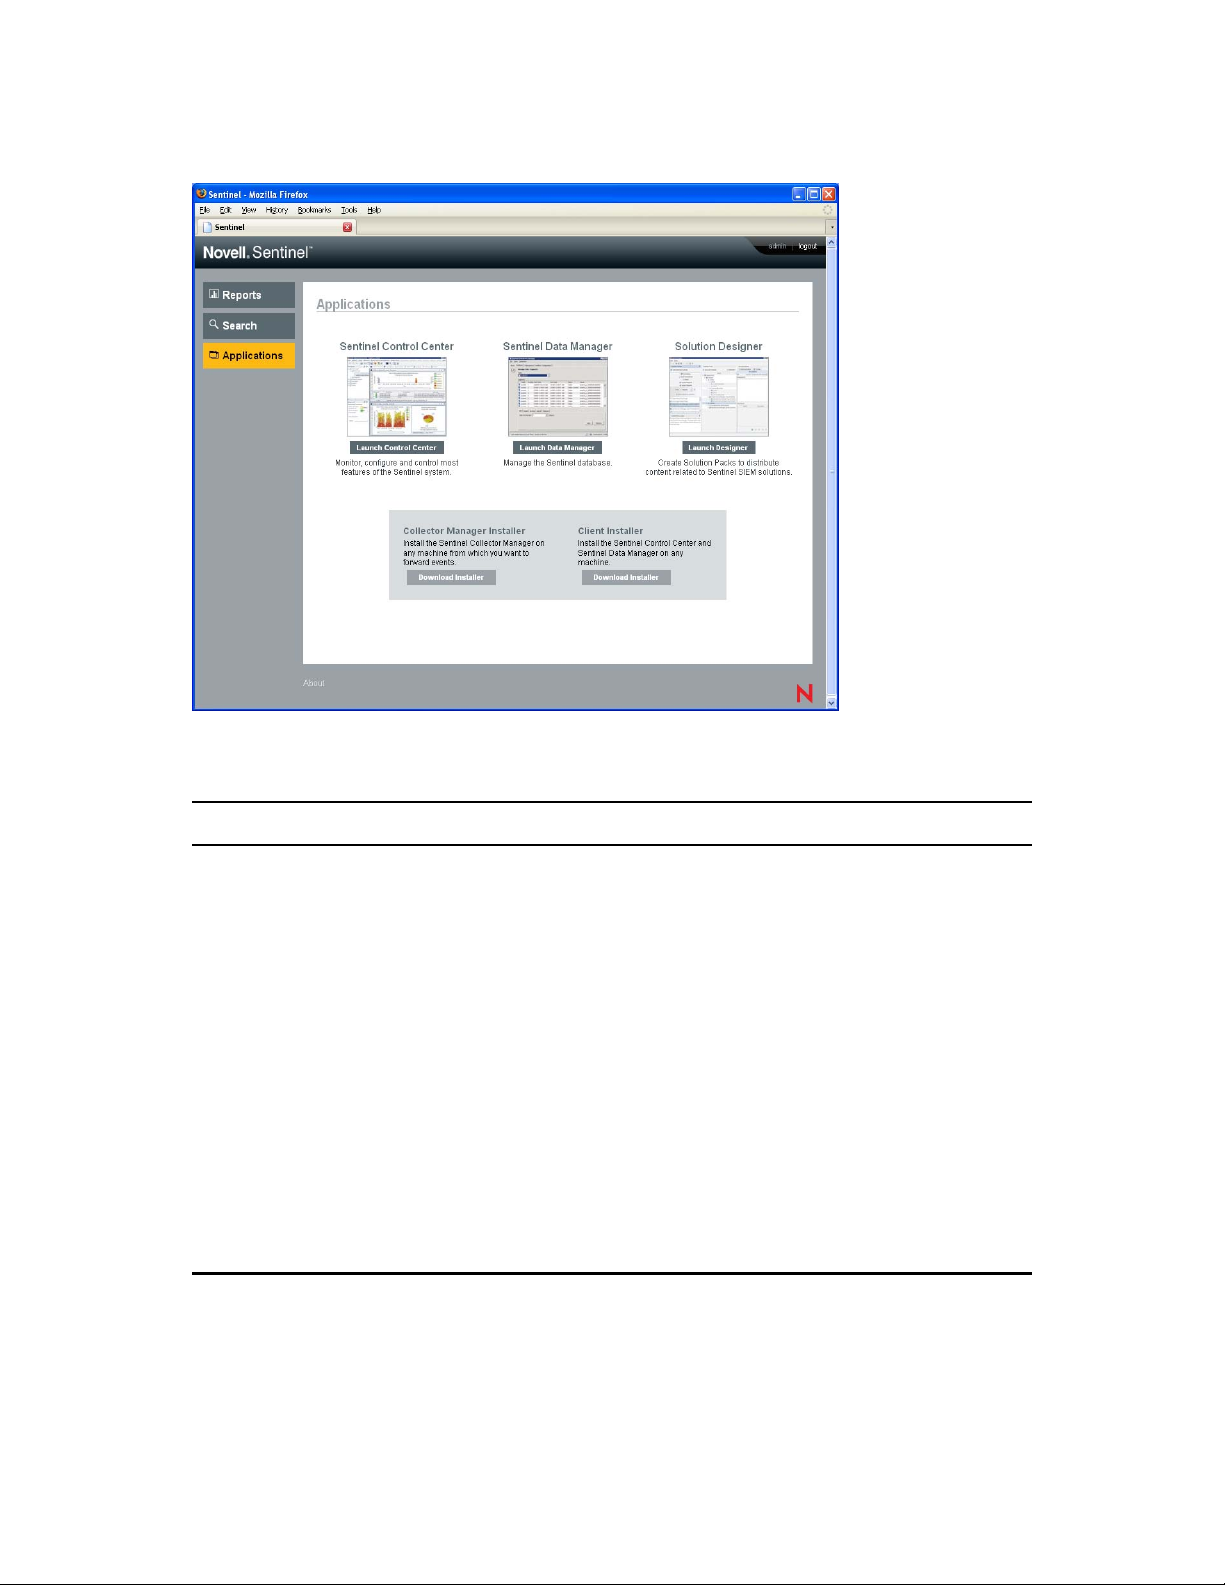
Figure 1-1 We bS ta rt
novdocx (en) 13 May 2009
Table 1-1 Downloading Options
Options Description Action
The Sentinel Control
Center (SCC)
The Sentinel Control Center
allows you monitor, configure,
and control most features of
1. Click Launch Control Center.
2. Open SCC with the Java* Web Start
the Sentinel system.
3. Specify the user credentials and click Login.
The SCC interface helps you
manage and monitor the
security information received
from different network
resources. It creates and
deploys rules to detect
suspicious or malicious
patterns of events, provides
real-time indication of attacks
and related risks, and
manages and monitors
connections between
Sentinel and its event
sources.
Launcher.
20 Sentinel 6.1 Rapid Deployment User Guide
Page 21

Options Description Action
novdocx (en) 13 May 2009
The Sentinel Data
Manager (SDM)
The Solution Designer
Collector Manager
Installer
Client Installer The Client Installer allows
The Sentinel Data Manager
allows you manage the
Sentinel database.
You can monitor database
space utilization, view and
manage database partitions,
configure auto-archives, and
configure auto-addition of
partitions.
The Collector Manager
Installer allows you install the
Sentinel Collector Manager
on any machine where you
want to forward the events
from.
you install the Sentinel
Control Center, Sentinel
Collector Builder, Sentinel
Solution Designer, and
Sentinel Data Manager on
any client machine.
1. Click Launch Data Manager.
2. Open SDM with the Java Web Start
Launcher.
3. Specify the server, database, host, and port
number.
4. Specify the user credentials and click
Connect.
Click download Collector Manager installer and
follow the on-screen instructions.
Click download Client installer and follow the onscreen instructions.
1.3 Reporting
You can upload, run, view, and delete reports or report definitions by using the Sentinel 6.1 Rapid
Deployment Web interface. You can run a report by using the desired parameters (such as start and
end date) as given in the report definition. The report results are saved with a name of your choice.
After the report runs, you can retrieve the results and view them as a PDF file.
Reports are organized by category.
Section 1.3.1, “Running Reports,” on page 21
Section 1.3.2, “Viewing Reports,” on page 24
Section 1.3.3, “Scheduling a Report,” on page 26
Section 1.3.4, “Managing Reports,” on page 27
1.3.1 Running Reports
Sentinel 6.1 Rapid Deployment is installed with a set of reports organized into several product
categories. Reports run asynchronously, so you can continue to do other things in the application
while the report is running. You can view the PDF report results after the report finishes running.
Many report definitions include parameters. You are prompted to set them before running the
reports. Depending on how the report developer designed the report, the report parameters can be
text, numbers, Boolean values, or dates. A parameter might have a default value or a list based on
values in the Sentinel RD database.
Managing Sentinel 6.1 Rapid Deployment Through the Web Interface 21
Page 22
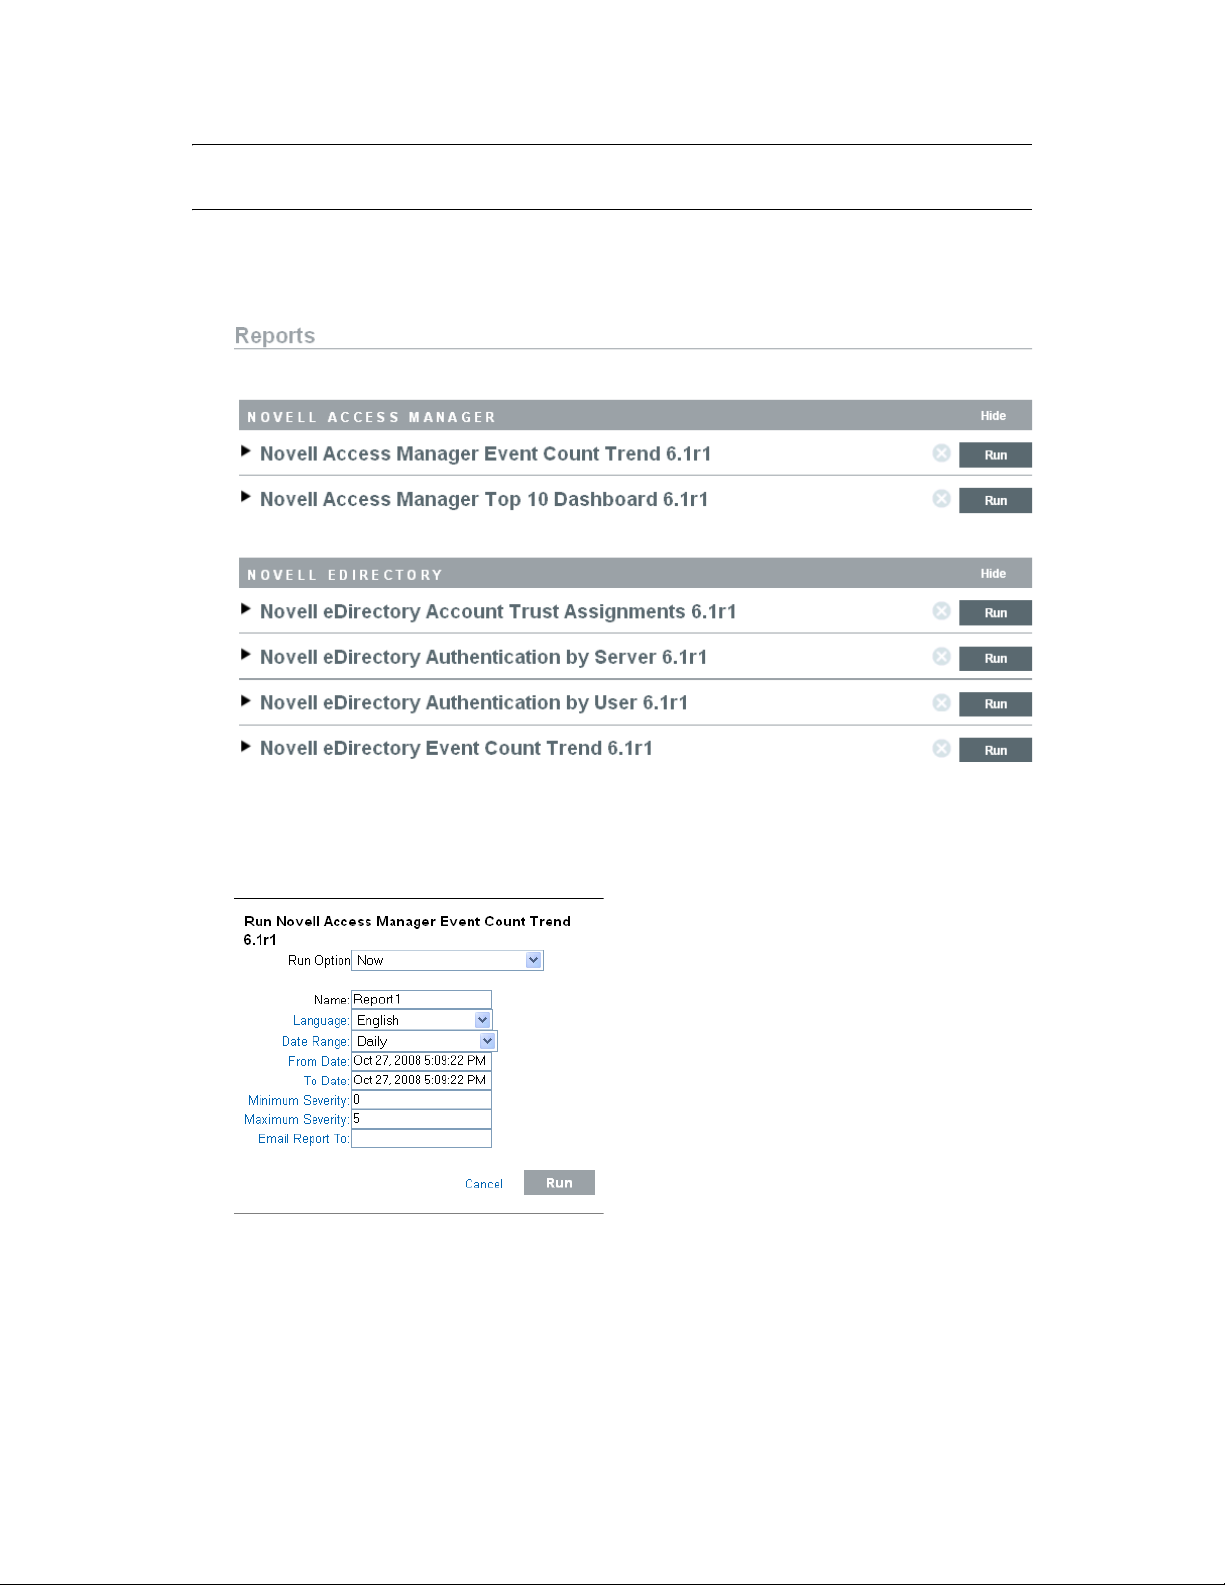
IMPORTANT: If a report in progress is canceled by using the Cancel link, the query on the
database is canceled.
Manually Running a Report
1 Click Reports to display the available reports.
novdocx (en) 13 May 2009
2 If desired, click a report definition to expand it. If you see a Sample Report link, you can click
View to find out how the completed report looks with a set of sample data.
3 Select the report you want to run and click Run.
4 Specify the following:
The report parameters are specific to the report definition. Therefore, the report parameters
might vary based on the report definition you select.
22 Sentinel 6.1 Rapid Deployment User Guide
Page 23

Report Parameters Description
Run Option Set the schedule for running the report. If you want the report to
run later, you must also enter a start time.
Now: This is the default. It runs the report immediately.
Once: Runs the report once at the specified date and time.
Daily: Runs the report once a day at the specified time.
Weekly: Runs the report once a week on the same day at
the specified time.
Monthly: Runs the report on the same day of the month
every month, starting at the specified date and time. For
example, if the start date and time is October 28 at 2:00 p.m,
the report will run on the 28th day of the month at 2:00 p.m
every month.
All time settings are based on the browser’s local time.
Name Specify a name to identify the report results.
novdocx (en) 13 May 2009
Because the username and time are also used to identify the
report results, the report name does not need to be unique.
Language Choose the language in which the report labels and descriptions
should be displayed (English, French, German, Italian, Japanese,
Traditional Chinese, Simplified Chinese, Spanish, or Portuguese).
The data in the report is displayed in whatever language was
originally used by the event source.
Date Range If the report includes time period parameters, choose the date
range. You can also set start and end dates for all the time
periods. All time periods are based on the local time for the
browser.
Current Day: Shows events from midnight of the current
day until 11:59 p.m of the current day. If the current time is 8
a.m, the report shows 8 hours of data.
Previous Day: Shows events from midnight yesterday until
11:59 p.m yesterday.
Week To Date: Shows events from midnight Sunday of the
current week until the end of the current day.
Previous Week: Shows seven days of events, from
midnight Sunday of the previous week until 11:59 p.m
Saturday of the previous week
Month to Date: Shows events from midnight the first day of
the current month until the end of the current day.
Previous Month: Shows a month of events, from midnight
of the first day of the previous month until 11:59 p.m of the
last day of the previous month
Custom Date Range: For this setting only, you also need to
set a start date and end date below.
From Date and To Date Set the start date (From Date) and the end date (To Date) for the
report.
Managing Sentinel 6.1 Rapid Deployment Through the Web Interface 23
Page 24

Report Parameters Description
MinSev Specify the minimum severity of events to be included in the
report. The range is 0-5.
MaxSev Specify the maximum severity of events to be included in the
report. The range is 0-5.
Email Report To If the report should be mailed to a user or users, specify their e-
mail addresses, separated by commas.
To enable mailing reports, the administrator must configure the
mail relay under Rules > Configuration.
5 Click Run.
A report results entry is created and mailed to the designated recipients.
1.3.2 Viewing Reports
You can view the reports for different applications in the Sentinel Rapid Deployment Web interface
for reports. The report GUI by default shows up to 10 report results for any given report definition.
The 10 report results displayed are the 10 most recent report results for that report definition.
novdocx (en) 13 May 2009
If there are more than 10 report results for any given report definition (that is, the report has been run
more than 10 times), a Show all x reports link is displayed after the 10th report, where x is the total
number of results available for that given report definition.
1 To view the list of report results, click View.
All previously run reports are shown with the user-defined report name, the user who ran them,
and the time the report was run.
IMPORTANT: The default number of report results to be displayed for each report definition
is managed by the
das_core.xml
<obj-component id="JasperReportingComponent">
<class>esecurity.ccs.comp.reporting.jasper.JasperReportingComponent</
class>
<property name="reporting.reportResultsDisplayed">10</property>
</obj-component>
You can change the
reporting.reportResultsDisplayed
file.
reporting.reportResultsDisplayed
property specified in the
property value. After changing
this value, ensure that you restart the das_core to apply the changes.
24 Sentinel 6.1 Rapid Deployment User Guide
Page 25
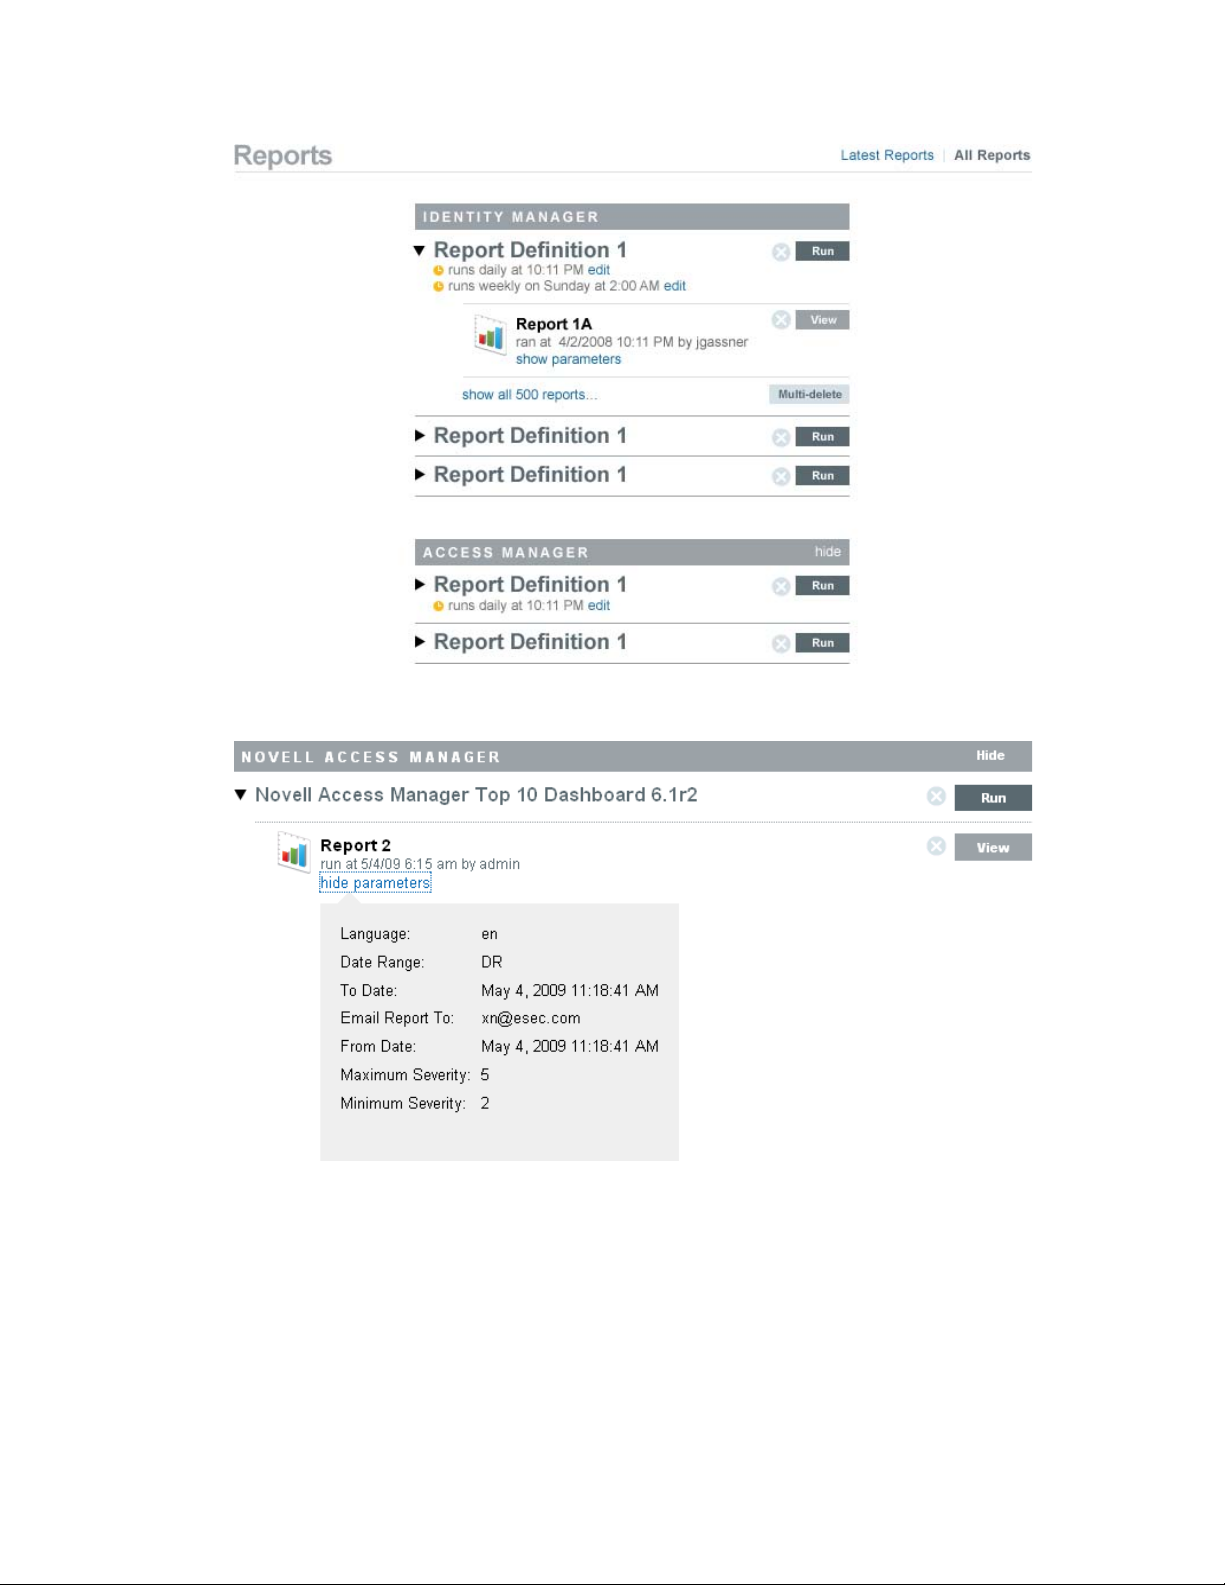
novdocx (en) 13 May 2009
2 Click show parameters to see the exact values used to run the report.
For Date Range, D=Current Day, PD=Previous Day, W=Week To Date, PW=Previous
Week, M=Month To Date, PM=Previous Month, and DR=Custom Date Range.
For Language, en=English, fr=French, de=German, it=Italian, ja=Japanese, pt=Brazilian
Portuguese, es=Spanish, zh=Simplified Chinese, and zh_TW=Traditional Chinese.
3 Click View for the report results you want to see. The report results are displayed in a new
window in .
pdf
format.
Managing Sentinel 6.1 Rapid Deployment Through the Web Interface 25
Page 26

novdocx (en) 13 May 2009
TIP: Report results are organized from newest to oldest.
1.3.3 Scheduling a Report
When you run a report, you can run the report immediately or schedule it to be run later, either once
or on a recurring basis. For scheduled reports, you must choose a frequency and enter a time at
which the report should run.
Now: This is the default. It runs the report immediately.
Once: Runs the report once at the specified date and time.
Daily: Runs the report once a day at the specified time.
Weekly: Runs the report once a week on the same day at the specified time.
Monthly: Runs the report on the same day of the month every month, starting at the specified
date and time. For example, if the start date and time is October 28 at 2:00 p.m, the report runs
on the 28th day of the month at 2:00 p.m.every month.
NOTE: All time settings are based on the browser’s local time.
26 Sentinel 6.1 Rapid Deployment User Guide
Page 27
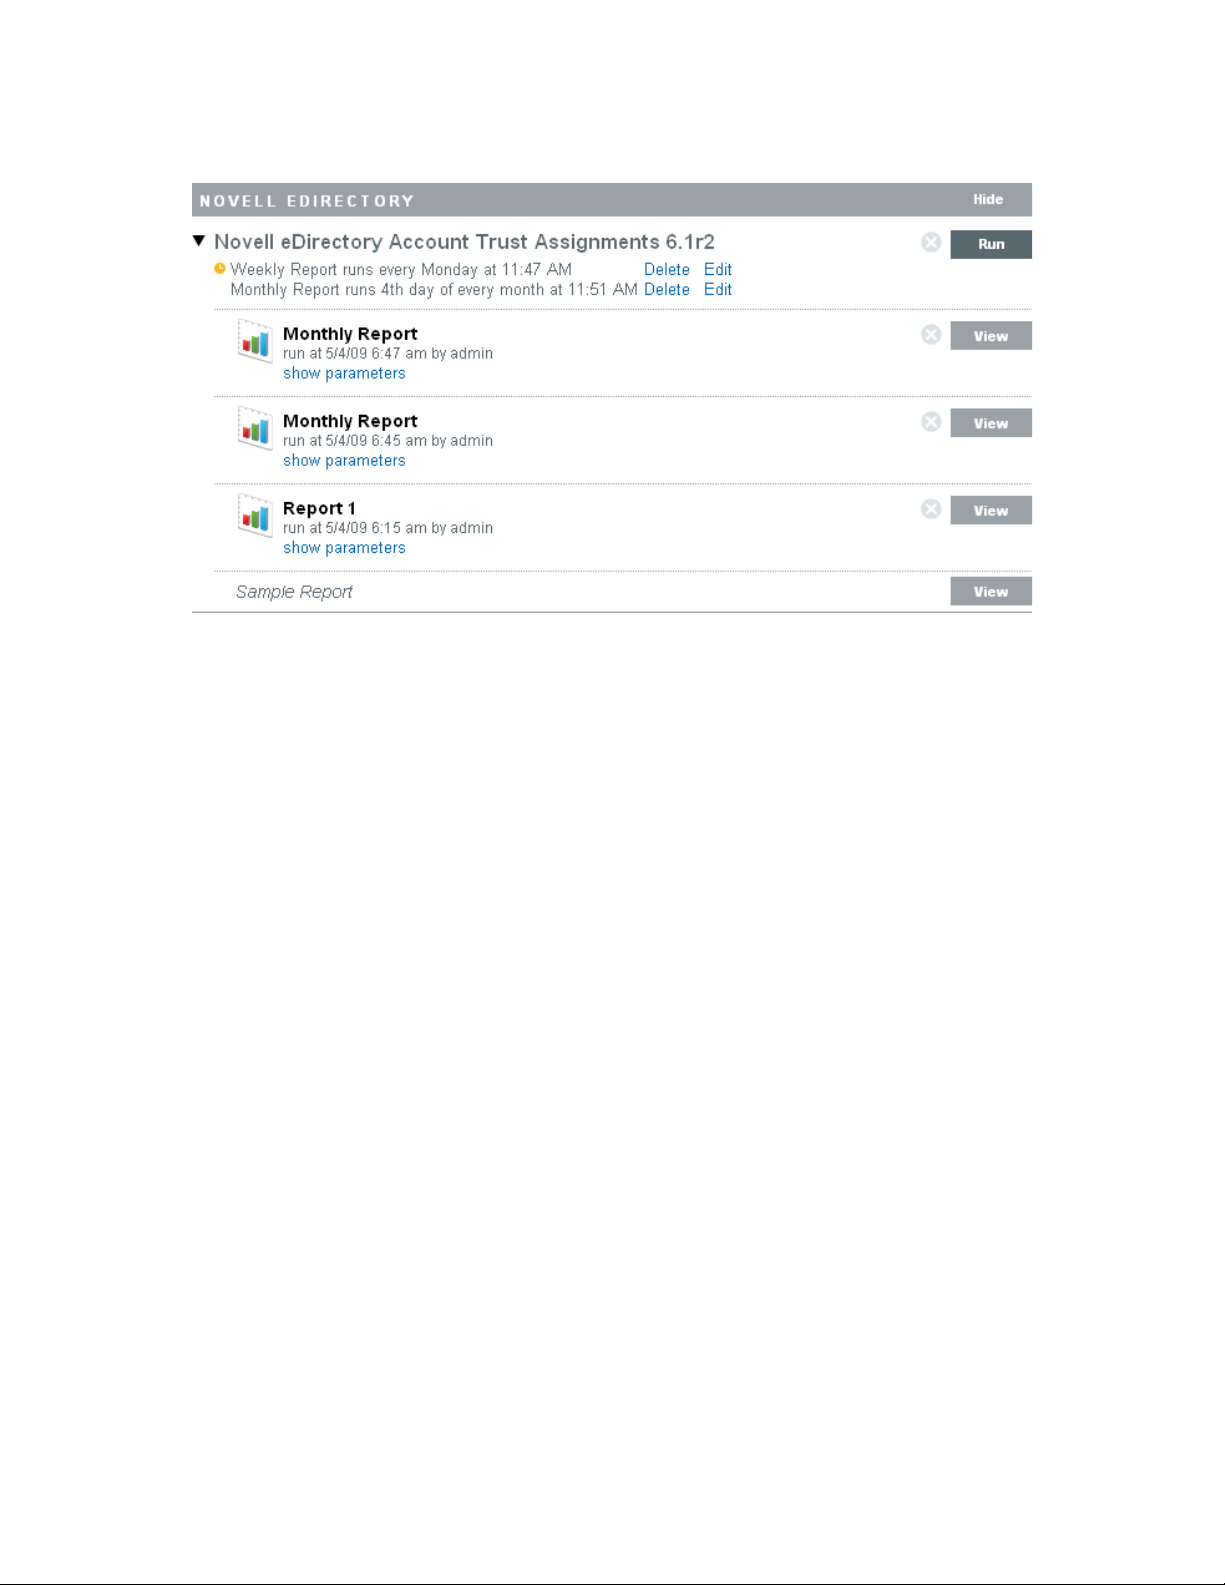
Figure 1-2 Scheduled Reports
novdocx (en) 13 May 2009
Report schedules can be removed or modified by using the Delete and Edit links.
1.3.4 Managing Reports
Sentinel Rapid Deployment users can add, delete, update, and schedule reports.
“Adding Reports” on page 27
“Creating New Reports” on page 29
“Renaming Report Results” on page 29
“Deleting Reports and Report Definitions” on page 29
“Updating Report Definitions” on page 31
Adding Reports
Any user can add or update reports in Sentinel 6.1 Rapid Deployment.
“Downloading New or Updated Reports” on page 27
“Adding New Reports” on page 27
Downloading New or Updated Reports
New or updated reports by Novell can be downloaded from the Novell Content Web site (http://
support.novell.com/products/sentinel/secure/identityaudit.html).
Adding New Reports
Sentinel Rapid Deployment comes preloaded with reports, but new report plug-ins (special .
files that include the report definition plus metadata) can be uploaded into Sentinel 6.1 Rapid
Deployment. If there are no reports in the system, the following screen displays:
Managing Sentinel 6.1 Rapid Deployment Through the Web Interface 27
zip
Page 28
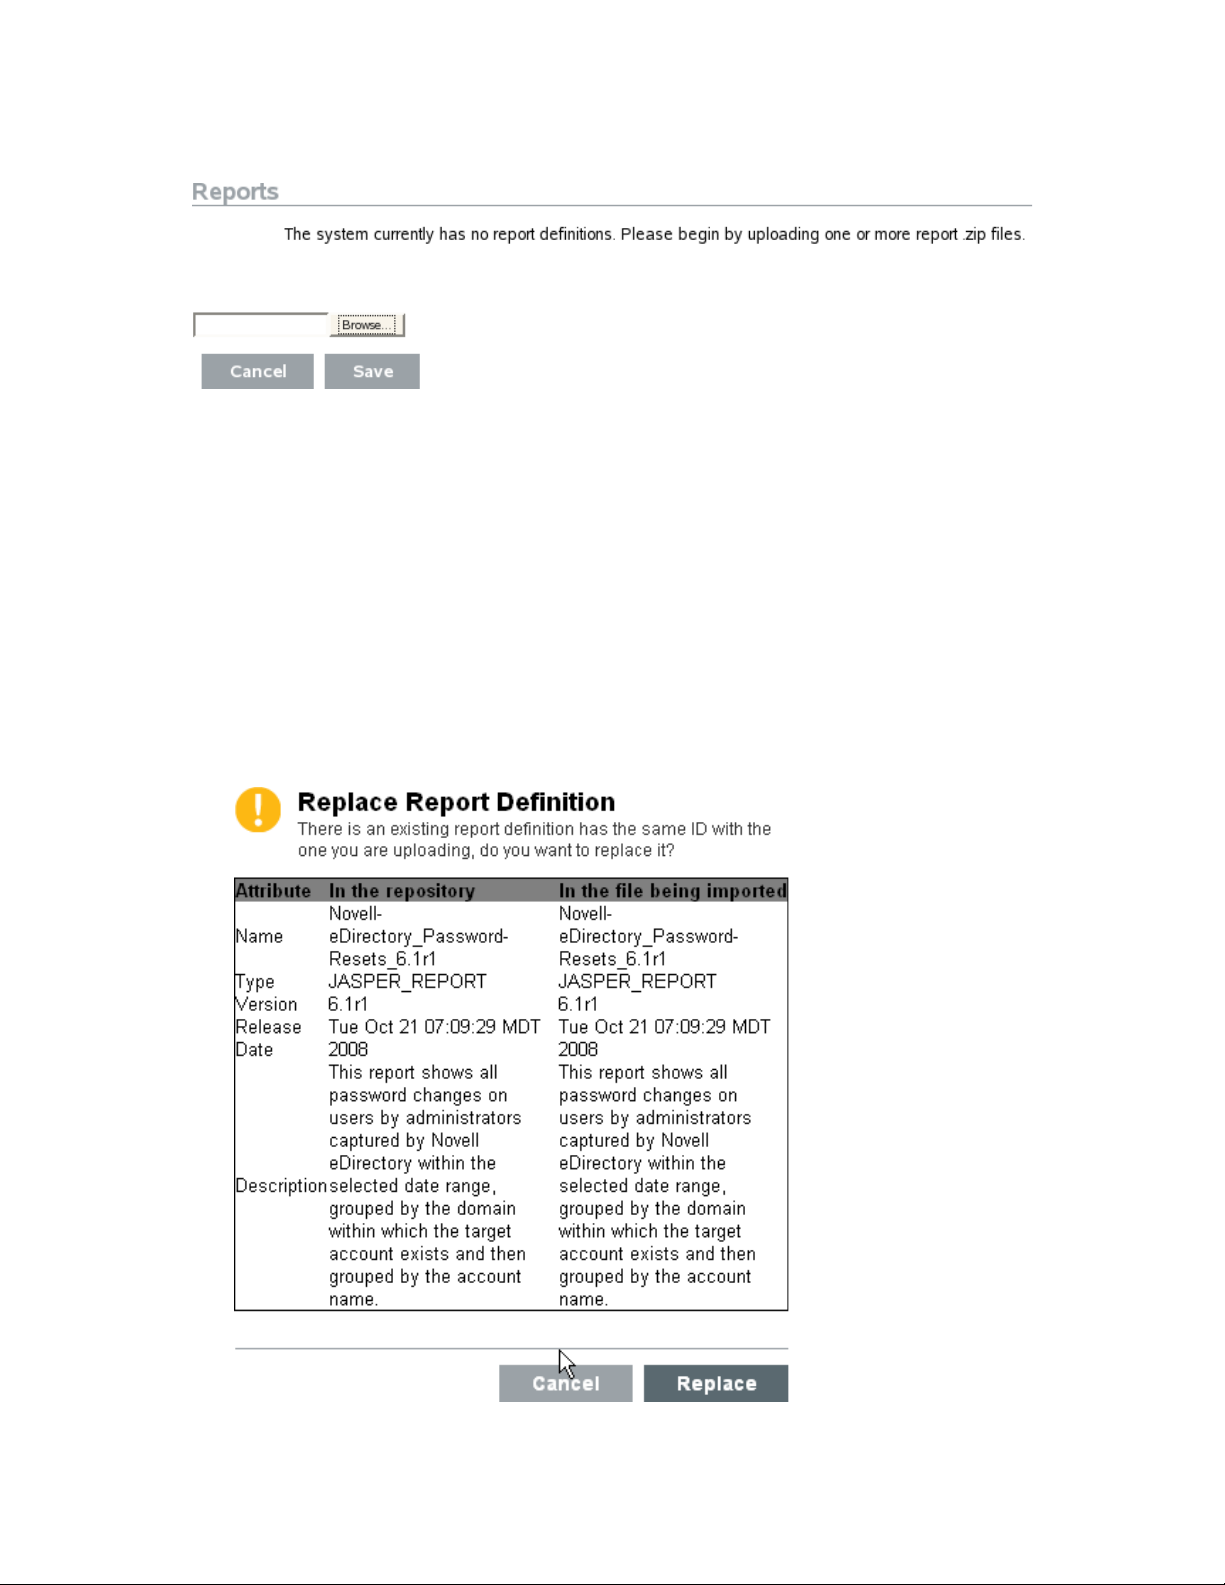
Figure 1-3 No Reports Loaded
To add a report:
1 Click the Reports button on the left side of the screen.
2 Click the Upload Report button.
novdocx (en) 13 May 2009
3 Browse and select the report plug-in .
zip
file on your local machine.
4 Click Open.
5 Click Save.
6 If the same report already exists in the report repository (based on the report’s unique ID),
decide whether to replace the existing report.
Sentinel Rapid Deployment displays the details of both the report in the system and the one
being imported. In the example below, the imported report is the same version as the existing
report.
28 Sentinel 6.1 Rapid Deployment User Guide
Page 29

The new report definition is added to the list in alphabetical order and can be run immediately, if
desired.
Creating New Reports
Users can modify or write reports by using JasperForge iReport. a graphical report designer for
JasperReports. iReport is an open source report development tool that is available for download
from JasperForge.org (http://jasperforge.org/plugins/project/project_home.php?group_id=83) (as of
the time of this publication).
New or modified reports can include additional database fields that are not presented in the Sentinel
Rapid Deployment Web interface. They must adhere to the file and format requirements of the
report plug-ins. For more information about database fields and file and format requirements for
report plug-ins, see the Sentinel SDK Web site (http://developer.novell.com/wiki/
index.php?title=Develop_to_Sentinel).
Renaming Report Results
Report results (but not report definitions) can be renamed in the interface.
novdocx (en) 13 May 2009
1 Click the Reports button on the left side of the screen.
2 Click a report name to expand it.
3 Click the name of the report results you want to rename.
4 Specify the new name.
5 Click Rename.
Deleting Reports and Report Definitions
“Deleting Report Definitions” on page 29
“Deleting Report Results” on page 30
Deleting Report Definitions
You can delete either a set of report results or a report definition by using the button at the right
side of the report definition. If a report definition is deleted, all associated report results are also
deleted.
IMPORTANT: Only the users with Manage Reports permissions can delete the report definitions.
For more information on permissions, see “Reporting” in the Sentinel 6.1 Rapid Deployment
Reference Guide.
Managing Sentinel 6.1 Rapid Deployment Through the Web Interface 29
Page 30
Deleting Report Results
There are two ways to delete report results.
Delete a single report by using the button at the right side of the report result.
IMPORTANT: Users with the Run/View Reports or Manage Reports permission can delete
the report results. For more information on permissions, see “Reporting” in the Sentinel 6.1
Rapid Deployment Reference Guide.
Delete multiple report results by using the option at the bottom right side of the
report results for each report definition.
NOTE: If the number of report results you have created for a report definition is less than or
equal to the default value, you need to use the button to delete each report result.
However, you can change the default value by editing the following property of the
JasperReportingComponent
<property name="reporting.reportResultsDisplayed">10</property>
in the
config/das_core.xml
file:
novdocx (en) 13 May 2009
After you modify this property value, restart the Sentinel services to apply the changes.
Using the Multi-delete Option
The option is displayed only if:
You have either Run/View Reports or Manage Reports permissions.
The number of report results created for a report definition is higher than the default value
specified in the Jasper Reporting component.
1 Click the Multi-delete option to:
Expand the Multi-delete panel to list Select all and delete reports options.
Display a check box next to each report result.
2 Select the report results for deletion.
You can also use the select all or unselect all options from the Multi-delete options panel.
3 Click delete # reports to delete the selected report results, where # is the number of report result
selected for deletion.
For example, if you select 3 reports for deletion, a delete 3 reports option displays under Multi-
delete panel. Click delete 3 reports to delete all the selected reports. Click Select all and select
delete reports to remove all the reports for a selected report definition.
Click cancel to remove the Multi-delete panel and the check boxes for all the report results.
30 Sentinel 6.1 Rapid Deployment User Guide
Page 31

Figure 1-4 Multi-delete
novdocx (en) 13 May 2009
Updating Report Definitions
Users can upload updated reports to replace an existing report. For more information, see “Adding
Reports” on page 27.
1.4 Searching Events
Novell Sentinel Rapid Deployment provides the ability to perform a search events. The search
includes all online data currently in the database, but internal events generated by the Sentinel
system are excluded unless you select Include System Events. By default, events are sorted based on
the search engine’s relevancy algorithm.
Basic event information includes event name, source, time, severity, information about the initiator
(represented by an arrow icon), and information about the target (represented by a bull’s-eye icon).
1.4.1 Running an Event Search
You can run simple and advanced searches.
“Basic Search” on page 32
“Advanced Search” on page 33
Managing Sentinel 6.1 Rapid Deployment Through the Web Interface 31
Page 32

Basic Search
A basic search runs against all of the event fields in Table 1-2 on page 37. Some sample basic
searches include the following:
root
127.0.0.1
Lock*
driverset0
NOTE: If time is not synchronized between the end user machine and the Sentinel Rapid
Deployment server (for example, one machine is 25 minutes behind), you might get unexpected
results from your search. Searches such as Last 1 hour or Last 24 hours are based on the end user’s
machine time.
1 Click the Search link on the left.
Sentinel Rapid Deployment is configured to run a default search for non-system events with
severity 3 to 5 the first time you the Search link. Otherwise, it defaults to the last search term
you entered.
novdocx (en) 13 May 2009
2 For a different search, type a search term in the search field (for example,
not case sensitive.
3 Select a time period for which the search should be performed. Most of the time settings are
self-explanatory, and the default is Last 30 Days.
Custom allows you to select a start date and time and an end date and time for the query.
The start date must be before the end date, and the time is based on the browser’s local
time.
All time searches all the data in the database.
4 Select Include System Events to include events that are generated by Sentinel Rapid
Deployment system operations.
5 Select Sort By Time to arrange data with the most recent events at the beginning.
Sorting by time takes longer than sorting by relevance, which is the default.
6 Click Search.
All fields in the index are searched for the specified text. A spinning icon indicates that the
search is taking place.
32 Sentinel 6.1 Rapid Deployment User Guide
admin
). The search is
Page 33

The event summaries are displayed.
Advanced Search
An advanced search can search for a value in a specific event field or fields. The advanced search
criteria are based on the short names for each event field and the search logic for the index. To view
the field names and descriptions, the short names that are used in advanced searches, and whether
the fields are visible in the basic and detailed event views, see Table 1-2 on page 37.
To search for a value in a specific field, use the short name of the field, a colon, and the value. For
example, to search for an authentication attempt to Sentinel RD by user2, use the following text in
the search field:
evt:authentication AND sun:user2
Other advanced searches might include:
novdocx (en) 13 May 2009
pn:NMAS AND sev:5
sip:123.45.67.89 AND evt:“Set Password”
Figure 1-5 Advanced Search Example
Multiple advanced search criteria can be combined by using the following Boolean operators:
AND (must be capitalized)
OR (must be capitalized)
NOT (must be capitalized and cannot be used as the only search criterion)
+
-
Managing Sentinel 6.1 Rapid Deployment Through the Web Interface 33
Page 34

Special characters must be escaped by using a \ symbol:
+ - && || ! ( ) { } [ ] ^ " ~ * ? : \
The advanced search criteria are modeled on the search criteria for the Apache* Lucene* open
source package. More detail about the search criteria is available on the Web: Lucene Query Parser
Syntax (http://lucene.apache.org/java/2_3_2/queryparsersyntax.html).
1.4.2 Viewing Search Results
Searches return a set of events. Users can view basic or detailed event information and configure the
number of results per page. Search results are returned in batches. The default batch size is 25
results, but this is easily configured.
When results are sorted by relevance, only the top 100,000 events can be viewed. When they are
sorted by time, this limitation does not exist.
“Basic Event View” on page 34
“Event View with Details” on page 35
“Refining Search Results” on page 35
novdocx (en) 13 May 2009
Basic Event View
The information in each event is grouped into initiator information and target information. If data
isn’t available for a particular event field, the fields are labeled Unknown.
Figure 1-6 Basic Event View
Occasionally, the search engine might index events faster than they are inserted into the database. If
you run a search that returns events that have not been inserted into the database, you get a message
that some events match the search query but could not be found in the database. If you run the search
again later, the events are usually in the database and the search is successful.
34 Sentinel 6.1 Rapid Deployment User Guide
Page 35

Figure 1-7 Events Indexed but Not Yet in Database
novdocx (en) 13 May 2009
Event View with Details
You can view additional details about any event or events by clicking the details link on the right
side of the page.The details for all events on a page can be expanded or collapsed by using the all
details ++ or details-- link. This preference is retained as you scan through multiple pages of results
or execute new searches.
Figure 1-8 Event View
The event in Figure 1-8 shows the same event as in Figure 1-6 on page 34, but with an expanded
view that shows additional data fields that might have been populated.
Refining Search Results
After viewing the results of a search, it might be necessary to refine the search results and add
additional search criteria. For example, you might see one initiator user’s name appear several times
in the search results and want to see more events from that initiator.
To filter the search results using a specific value appearing in the search results:
1 Identify the desired filter criteria in the search results.
2 Click the value (for example, target hostname test 1900) by which you want to filter the results.
Managing Sentinel 6.1 Rapid Deployment Through the Web Interface 35
Page 36

novdocx (en) 13 May 2009
TIP: This adds the value to your filter with an AND operator. To add the value to your filter
with an NOT operator, press the Alt key as you click the value.
3 Click Search.
Some fields cannot be selected to refine a search this way:
EventTime
Message
Any field related to the Reporter
Any field related to the Observer
Any field related to TargetTrust
Any field with a value
36 Sentinel 6.1 Rapid Deployment User Guide
Unknown
Page 37

1.4.3 Event Fields
Each event has fields that might or might not be populated, depending on the specific event. The
values for these event fields can be viewed by using a search or running a report. Each field has a
short name that is used in advanced searches. The values for most of these fields are visible in the
detailed event view; other values are also visible in the basic event view.
Table 1-2 Event Fields
novdocx (en) 13 May 2009
Field
Severity sev Normalized severity of the event on a scale
EventTime dt Time stamp of the event. Can be the
EventName evt Short name of the event. X X
Message msg Detailed event message. Invisible X
ProductName pn Product that generated the event; the
InitUserName sun Username of the user who initiated the
InitUserID iuid User ID of the user who initiated the event,
Short
Description
Name
of 0 (informational) to 5 (critical).
Sentinel Rapid Deployment server time
stamp or the time stamp from the original
event source (if trust event time is
enabled).
event source.
Displayed after the event name.
event.
based on the raw data reported by the
device.
Visible in
Basic View
XX
XX
XX
XX
Invisible X
Visible in
Detailed
View
InitUserDomain rv35 Domain of the user who initiated the event.
Searchable but not displayed in either
event view.
InitHostName shn Hostname of the machine from which the
event initiated.
InitHostDomain rv42 Domain of the machine from which the
event initiated.
InitIP sip IP address of the machine from which the
event initiated.
InitServicePort spint Port number from which the event initiated
(for example, HTTP)
InitServicePortName sp Type of port from which the event initiated
(for example, HTTP).
TargetUserName dun Username of the user who was the target
of the event.
Managing Sentinel 6.1 Rapid Deployment Through the Web Interface 37
Invisible Invisible
XX
XX
Invisible X
Invisible X
Invisible X
XX
Page 38

novdocx (en) 13 May 2009
Field
Short
Name
Description
TargetUserID tuid User ID of the user who was the target of
the event, based on the raw data reported
by the device.
TargetUserDomain rv45 Domain of the user who was the target of
the event.
Searchable but not displayed in either
event view.
TargetHostName dhn Hostname of the machine that was the
target of the event.
TargetHostDomain rv41 Domain of the machine that was the target
of the event.
TargetIP dip IP address of the machine that was the
target of the event.
TargetServicePort dpint Port number that was the target of the
event (for example, 80).
TargetServicePortName dp Type of port that was the target of the event
(for example, HTTP).
Visible in
Basic View
Visible in
Detailed
View
Invisible X
Invisible X
XX
XX
Invisible X
Invisible X
Invisible X
TargetTrustName ttn Role of the user that was a target of the
event (for example, FinanceAdmin).
Searchable but not displayed in either
event view.
TargetTrustID ttid Numerical ID representing the role of the
user that was a target of the event.
Searchable but not displayed in either
event view.
TargetTrustDomain ttd Domain (namespace) within which the
target trust exists.
Searchable but not displayed in either
event view.
EffectiveUserName eunameName of the user that the InitUser is
impersonating (
root
using su, for
example); follows Initiator Username
(Initiator User ID) as in the detailed event
view.
EffectiveUserID euid Numerical ID of the user that the InitUser is
impersonating (
root
using su, for
example), based on the raw data reported
by the device.
Invisible Invisible
Invisible Invisible
Invisible Invisible
Invisible X
Invisible X
38 Sentinel 6.1 Rapid Deployment User Guide
Page 39

novdocx (en) 13 May 2009
Field
Short
Name
Description
ObserverHostName sn Hostname of the machine that forwarded
the event to the security information event
management system (for example, the
hostname of a syslog server).
Searchable but not displayed in either
event view.
ObserverHostDomain obsdomDomain of the machine that forwarded the
event to the security information event
management system (for example, the
domain of a syslog server).
Searchable but not displayed in either
event view.
ObserverIP obsip IP address of the machine that forwarded
the event to the security information event
management system (for example, the IP
address of a syslog server).
Searchable but not displayed in either
event view.
ReporterHostName rn Hostname of the machine that reported the
event to an observer.
Visible in
Basic View
Visible in
Detailed
View
Invisible Invisible
Invisible Invisible
Invisible Invisible
Invisible Invisible
Searchable but not displayed in either
event view.
ReporterHostDomain repdomDomain of the machine that reported the
event to an observer.
Searchable but not displayed in either
event view.
ReporterIP repip IP address of the machine that reported the
event to an observer.
Searchable but not displayed in either
event view.
SensorType st The single character designator for the
sensor type (N=network, H=host,
O=operating system, A and I=Sentinel
Rapid Deployment auditing events,
P=Sentinel RDSentinel Rapid Deployment
performance events).
Searchable but not displayed in either
event view.
DataName/Filename fn Data object name reported in the event (for
example, the file name or database table
name).
Invisible Invisible
Invisible Invisible
Invisible Invisible
Invisible X
Managing Sentinel 6.1 Rapid Deployment Through the Web Interface 39
Page 40

novdocx (en) 13 May 2009
Field
DataContext rv36 Container for the FileName data object (for
TaxonomyLevel1 rv50 Target classification for event. Displayed
TaxonomyLevel2 rv51 Subtarget classification for the event.
TaxonomyLevel3 rv52 Action information for the event. Displayed
TaxonomyLevel4 rv53 Detail information for the event. Displayed
Short
Description
Name
example, a directory for a file or a database
instance for a database table)
under the event name in the format:
TaxonomyLevel1>> TaxonomyLevel2>>
TaxonomyLevel3>> TaxonomyLevel4
Displayed under the event name in the
format:
TaxonomyLevel1>> TaxonomyLevel2>>
TaxonomyLevel3>> TaxonomyLevel4
under the event name in the format:
TaxonomyLevel1>> TaxonomyLevel2>>
TaxonomyLevel3>> TaxonomyLevel4
under the event name in the format:
Visible in
Basic View
XX
XX
XX
XX
Visible in
Detailed
View
X
TaxonomyLevel1>> TaxonomyLevel2>>
TaxonomyLevel3>> TaxonomyLevel4
Some fields are tokenized. Tokenizing the fields makes it possible to search for an individual word
in the field without a wildcard. The fields are tokenized based on spaces and other special
characters. For these fields, articles such as “a” or “the” are removed from the search index.
EventName
Message
ProductName
FileName
DataContext
TaxonomyLevel1
TaxonomyLevel2
TaxonomyLevel3
TaxonomyLevel4
40 Sentinel 6.1 Rapid Deployment User Guide
Page 41

2
Sentinel Control Center
Novell® SentinelTM gathers and correlates security and non-security information from across an
organization's networked infrastructure, as well as third-party systems, devices, and applications.
Sentinel presents the collected data in an richly functional interface, identifies security or
compliance issues, and tracks remediation activities, streamlining previously error-prone processes
and building a more rigorous and secure management program. The Sentinel Control Center (SCC)
is the main user interface for viewing and interacting with this data.
Section 2.1, “Log In to the Sentinel Control Center,” on page 41
Section 2.2, “About Sentinel Control Center,” on page 42
Section 2.3, “Introduction to the User Interface,” on page 45
2.1 Log In to the Sentinel Control Center
Section 2.1.1, “Linux,” on page 41
novdocx (en) 13 May 2009
2
Section 2.1.2, “Windows,” on page 41
2.1.1 Linux
1 As the Sentinel Administrator (admin), change directory to:
<Install_directory>/bin
2 Run the following command:
./control_center.sh
3 Specify your username and password, then click OK.
A Certificate window displays.
4 Select Accept, if you want this message to display every time you start Sentinel on your system.
To avoid this, you can select Accept Permanently.
2.1.2 Windows
1 Perform either of the following:
Go to Start > Programs > Sentinel and select Sentinel Control Center. The Sentinel Login
window displays.
Click Applications in the left panel of the Novell Sentinel 6.1 Rapid Deployment Web
interface, then click Launch Control Center:
Sentinel Control Center
41
Page 42

2 Specify your username and password.
novdocx (en) 13 May 2009
3 Click Login.
On the first login, the following warning message displays. You must accept the certificate in
order to securely log in to the Sentinel Control Center
4 Select Accept, if you want this message to display every time you start Sentinel on your system.
To avoid this, you can select Accept Permanently.
2.2 About Sentinel Control Center
The Sentinel Control Center includes the following functional tabs and interfaces:
Section 2.2.1, “Active Views,” on page 43
Section 2.2.2, “Incidents,” on page 43
Section 2.2.3, “iTRAC,” on page 43
42 Sentinel 6.1 Rapid Deployment User Guide
Page 43

Section 2.2.4, “Analysis,” on page 44
Section 2.2.5, “Admin,” on page 44
Section 2.2.6, “Correlation,” on page 44
Section 2.2.7, “Event Source Management,” on page 44
Section 2.2.8, “Solution Packs,” on page 45
Section 2.2.9, “Identity Integration,” on page 45
2.2.1 Active Views
The Active Views tab presents events in near-real time.
In the Active Views tab, you can:
View events occurring in near-real time
Investigate events
Graph events
Perform historical queries to collect data for a specified period
novdocx (en) 13 May 2009
Invoke right-click functions
Initiate manual incidents and remediation workflows
2.2.2 Incidents
An incident is a set of events that require attention (for example, a possible attack). Incidents
centralize the data and are typically made up of a correlated event, the associated events that
triggered a correlation rule, asset details of the affected systems, vulnerability state of the affected
systems, and any remediation information, if known. Incidents can be associated with a remediation
TM
workflow in iTRAC
, if specified. An incident associated to an iTRAC workflow allows users to
track the remediation state of the incident.
In the Incidents tab, you can:
Manage incident views
View and manage incidents and their associated data
Switch between existing incident views
2.2.3 iTRAC
The iTRAC stateful incident remediation workflow capability allows you to incorporate your
organization’s incident response processes into Sentinel.
In the iTRAC tab, you can:
Create custom workflow templates
Edit workflow templates
Create custom activities
Edit activities
Sentinel Control Center 43
Page 44

Associate activities with workflow steps
Initiate and execute processes
2.2.4 Analysis
The Analysis tab is used to run and save an offline query for later quick retrieval of search results.
2.2.5 Admin
The Admin tab provides you access to perform the administrative actions and configuration settings
in Sentinel. In the Admin tab, you can:
Create and modify filters
Use filters to format data
Use filters to determine event routing
View system statistics about the Data Access Service
Start and stop system components
Configure Sentinel event fields
Configure the mapping service
novdocx (en) 13 May 2009
Create new options for right-click event menus
Aggregate data for reporting
Create users and assign them to roles for workflows
Manage user sessions
2.2.6 Correlation
The Correlation tab provides an interface to create and deploy rules to detect suspicious or
malicious patterns of events.
In the Correlation tab, you can:
Create and edit rules
Deploy/undeploy rules
Add an action and associate it to a rule
Configure dynamic lists
2.2.7 Event Source Management
The Event Source Management (ESM) interface is available through the Sentinel Control Center
menu. It allows you to manage and monitor connections between Sentinel and its event sources by
using Sentinel Connectors and Sentinel Collectors.
In the ESM, you can:
Import/export Connectors and Collectors from and to the centralized repository available in
ESM
44 Sentinel 6.1 Rapid Deployment User Guide
Page 45

Add/edit connections to event sources through the configuration wizards
View the real-time status of the connections to event sources
Monitor data flowing through the Collectors and Connectors
Sentinel Collectors
The Collectors parse the data and deliver a richer event stream by injecting taxonomy, exploit
detection, and business relevance into the data stream before events are correlated and analyzed and
sent to the database.
Sentinel Connectors
The Connectors use industry standard methods to connect to the data source to get raw data.
2.2.8 Solution Packs
You can use the Solution Packs interface through the To ol s menu in the Sentinel Control Center.
Solution Packs provide a framework within which sets of content can be packaged into controls,
each of which is designed to enforce a specific business or technical policy.
novdocx (en) 13 May 2009
2.2.9 Identity Integration
The Sentinel integration framework for identity management systems provides functionality on
several levels. When identity integration is implemented, you can:
Look up the following information about a user from the Identity Browser:
Contact information
Accounts associated with that user
Most recent authentication events
Most recent access events
Most recent permissions changes
Look up user information by right-clicking an event
2.3 Introduction to the User Interface
In the Sentinel Control Center user interface, you can perform the activities through the following
components:
Section 2.3.1, “Menu Bar,” on page 46
Section 2.3.2, “Toolbar,” on page 46
Section 2.3.3, “Tabs,” on page 48
Section 2.3.4, “Frames,” on page 48
Sentinel Control Center provides you the “dockable” framework, which allows you to move the
toolbars, tabs or frames from their default location to user-specific locations for ease of use.
Sentinel Control Center 45
Page 46

Figure 2-1 Sentinel Control Center
novdocx (en) 13 May 2009
2.3.1 Menu Bar
The menu bar has the menus required to navigate, perform activities, and change the appearance of
the Sentinel Control Center.
Figure 2-2 Menu Bar
The File, Options, Event Source Management, Windows, and Help menus are always available. The
availability of other menus depends on your location in the console and the permissions you have.
2.3.2 Toolbar
The toolbar allows you to perform tab-specific functions. There are four system-wide toolbar
buttons that are always displayed: View Sentinel Help, Cascade All Display Windows, Tile All
Display Windows, and Save User Preferences. The availability of other toolbar buttons depends on
your location in the console and the permissions you have.
“System-Wide Toolbar” on page 47
“Tab-Specific Toolbar Buttons” on page 47
46 Sentinel 6.1 Rapid Deployment User Guide
Page 47

System-Wide Toolbar
The system-wide toolbar buttons are:
Figure 2-3 Toolbar Buttons
Tab-Specific Toolbar Buttons
Tab-specific toolbar buttons allows you to perform the functions related to each tab.
Table 2-1 Tab-Specific Toolbar Buttons
Too lbar View
novdocx (en) 13 May 2009
Active Views
Correlation
Incidents
iTRAC
Analysis
Admin
For more information on tab-specific toolbar buttons, see the sections on each of the tabs listed in
Section 2.3.3, “Tabs,” on page 48.
Sentinel Control Center 47
Page 48

2.3.3 Tabs
Depending on your access permissions, Sentinel Control Center displays the following tabs.
Active Views tab. For more information, see Chapter 3, “Active Views Tab,” on page 53
Correlation tab. For more information, see Chapter 4, “Correlation Tab,” on page 83
Incidents tab. For more information, see Chapter 5, “Incidents Tab,” on page 109
iTRAC tab. For more information, see Chapter 6, “iTRAC Workflows,” on page 123
Analysis tab. For more information, see Chapter 8, “Analysis Tab,” on page 167
Admin tab. For more information, see Chapter 10, “Administration,” on page 219
2.3.4 Frames
Sentinel provides a dockable framework that allows you to drag frames on the screen to place them
in your preferred locations. The following buttons allow you to drag and/ hide frames.
Toggle Floating
Toggle Auto-hide
novdocx (en) 13 May 2009
Figure 2-4 Navigator Frame
To drag a frame to any location:
1 Click the Toggle Floating icon on the frame or hold the frame and drag it to the desired
location.
To hide a frame:
1 Click the Toggle Auto-hide icon.
NOTE: You can undo dragging or reset the framework to the default position by using the toolbar
buttons.
2.3.5 Using the Sentinel Control Center to Navigate
To navigate by using the toolbar:
1 Click the tab you need to use.
2 Click toolbar buttons to perform the actions.
To navigate by using the menu bar:
1 Click the tab menu in the menu bar.
2 Select an action you need to perform.
48 Sentinel 6.1 Rapid Deployment User Guide
Page 49

NOTE: This procedure is generic for all the tabs in the Sentinel Control Center. Navigation
procedures for tabs are discussed in the relevant sections.
2.3.6 Changing the Appearance of the Sentinel Control Center
You can change the Sentinel Control Center’s look by:
“Setting the Tab Position” on page 49
“Cascading Windows” on page 49
“Tiling Windows” on page 49
“Minimizing Windows” on page 49
“Restoring Windows to Original Size” on page 49
“Closing all Open Windows” on page 49
Setting the Tab Position
1 Click Options > Tab Placement.
2 Select either Top or
Bottom
.
novdocx (en) 13 May 2009
Cascading Windows
1 Click Windows > Cascade All. All open windows in the right panel cascade.
Tiling Windows
1 Click Windows > Tile All.
2 Select from the following options:
Tile Best Fit
Tile Vertical
Tile Horizontal
Minimizing Windows
1 Click Windows > Minimize All. All open windows in the right panel minimize.
Restoring Windows to Original Size
1 Click Windows > Restore All. All open windows in the right panel are restored to their original
size.
NOTE: Use the Minimize and Restore options provided on the top right corner of the tab to
minimize individual tabs.
Closing all Open Windows
1 Click Windows > Close All.
Sentinel Control Center 49
Page 50

2.3.7 Saving User Preferences
If the user has permissions to save the workspace, they can save the following preferences:
Permanent windows that are not dependent on data that was available at the time of their
original creation.
Active Views
Summary displays
Window positions
Window sizes, including the application window
Tab positions
Navigator docked or floating and showing or hidden
The following preferences are not saved when the user logs out:
Snapshots
Historical event queries
TM
novdocx (en) 13 May 2009
Secondary windows opened from one of the primary windows in the Admin Navigator
Column widths in Active Views
To save your preferences:
1 Click File > Save Preferences or click
2.3.8 Changing Password
1 Click Options > Change Password.
2 Provide the old password.
3 Provide the new password and confirm it.
4 Click OK.
For more information on password security, see the Sentinel 6.1 Rapid Deployment Reference
Guide.
2.3.9 Configuring the Attachment Viewer
1 On the Tools menu, click Attachment Viewer Configuration or alternatively click the Configure
Attachment Viewers button. The Attachment Viewer Configuration window displays.
50 Sentinel 6.1 Rapid Deployment User Guide
Page 51

novdocx (en) 13 May 2009
2 Click Add. The Attachment Identification window displays.
Specify the extension type (such as
.doc, .xls, .txt, .html
type in the application program to launch the file type (such as
3 Click OK.
and so on) and click Browse or
notepad.exe
for Notepad).
Sentinel Control Center 51
Page 52

novdocx (en) 13 May 2009
52 Sentinel 6.1 Rapid Deployment User Guide
Page 53

3
Active Views Tab
The Active Views tab presents events in near-real time.
Section 3.1, “Understanding Active Views,” on page 53
Section 3.2, “Introduction to the User Interface,” on page 54
Section 3.3, “Reconfiguring Total Display Time,” on page 57
Section 3.4, “Viewing Real-Time Events,” on page 57
Section 3.5, “Showing and Hiding Event Details,” on page 61
Section 3.6, “Sending Mail Messages about Events and Incidents,” on page 62
Section 3.7, “Creating Incidents,” on page 63
Section 3.8, “Viewing Events That Trigger Correlated Events,” on page 64
Section 3.9, “Investigating an Event or Events,” on page 65
Section 3.10, “Viewing Advisor Data,” on page 70
Section 3.11, “Viewing Asset Data,” on page 71
novdocx (en) 13 May 2009
3
Section 3.12, “Viewing Vulnerabilities,” on page 72
Section 3.13, “Ticketing System Integration,” on page 77
Section 3.14, “Viewing User Information,” on page 77
Section 3.15, “Using Custom Menu Options with Events,” on page 77
Section 3.16, “Managing Columns in a Snapshot or Navigator Window,” on page 78
Section 3.17, “Taking a Snapshot of a Navigator Window,” on page 79
Section 3.18, “Sorting Columns in a Snapshot,” on page 79
Section 3.19, “Closing a Snapshot or Navigator,” on page 79
Section 3.20, “Adding Events to an Incident,” on page 79
3.1 Understanding Active Views
In the Active Views tab, you can:
View events occurring in near-real time
Investigate events
Graph events
Perform historical statistical analysis
Invoke right-click functions
Initiate manual incidents and remediation workflows
TM
An event represents a normalized log record reported to Sentinel
network, or application device or from an internal Sentinel source. There are several types of events:
External events (event received from a security device), such as:
An attack detected by an intrusion detection system
from a third-party security,
Active Views Tab
53
Page 54

A successful login reported by an operating system
A customer-defined situation such as a user accessing a file
Internal events (an event generated by Sentinel), including:
A correlation rule being disabled
The database filling up
Correlated events
You can monitor the events in a tabular form or you can use several different types of charts to
perform queries for recent events. Access to these features can be enabled or disabled for each user.
3.2 Introduction to the User Interface
In an Active ViewsTM, you can see Create Active View, Event Real Time, and Event Query. You can
navigate to these functions from:
Table 3-1 Active Views User Interface
novdocx (en) 13 May 2009
User Interface Description
The Active Views menu in the menu bar
When you create a filter, the Active Views menu
has these additional options.
The Navigation tree in the Navigation pane
54 Sentinel 6.1 Rapid Deployment User Guide
Page 55

User Interface Description
The toolbar buttons
Active Views provides two types of views that display the events in tables and graphs.
The Table format displays the variables of the events as columns in a table. You can sort the
information in the grid by clicking the column name.
Figure 3-1 Active View Tabular Format
novdocx (en) 13 May 2009
The Graphical format displays events as graphs. You can change the chart types to display
other chart types.
Figure 3-2 Active View Graphical Format
There are two types of Active Views:
Near Real Time Event Table:
Holds up to 750 events per 30-second period. If there are more than 750 events, the events
are displayed in the following priority order: correlated events, events that are sent to the
GUI by using a global filter, and all remaining events.
By default, the client maintains a 24-hour period of cached events. This is configurable
through Active View Properties.
By default, the smallest possible display interval of an active view is 30 seconds. This is
represented by a gray line in the event table.
Active Views Tab 55
Page 56

Figure 3-3 Gray Line Smallest Possible Display Interval
If there are more than 750 events per 30-second time period, a red separation line displays
indicating that there are more events than are displayed. The other events can be viewed
by using Historical Queries.
Figure 3-4 Red Line More Events Displayed
On saving user preferences, the system continues to collect data for four days. For
instance, if you save your preferences, log out, and log back in the following day, your
Active View displays data as if you never logged off.
If an Active View is created and not saved, it continues to collect data for an hour. If an
identical Active View is created within that hour, the Active View displays data for the last
hour.
novdocx (en) 13 May 2009
Snapshot: Time-stamped views of a Real Time Event View table.
Active View provides you the following unique features:
Filter assigned to an Active View
The z-axis attribute
The security filter assigned to a user
The Active Views tab allows you to:
Reconfigure total display time
Add events to an incident
Close a Snapshot or Navigator window
Create an incident
Custom menu options with events
Investigate an event query
Investigate a graph map
View Advisor data
Manage columnsSend messages about events by e-mail
Show or hide event details
Take a Snapshot of a Navigator window
View events that triggered a correlated event
View vulnerability visualization
View asset data
Integrate with the ticketing system
56 Sentinel 6.1 Rapid Deployment User Guide
Page 57

You can change labels (column names) to user-friendly names and the new names are populated
throughout the system. For more information, see Section 3.15, “Using Custom Menu Options with
Events,” on page 77.
3.3 Reconfiguring Total Display Time
Active View Properties allows you to configure the cached time in each client. The default cache
time value in an Active View is 24 hours.
To configure Maximum Total Display Time:
1 Click the Active Views tab.
2 Click Active Views > Properties.
3 Make your changes, then click OK.
novdocx (en) 13 May 2009
The new values do not take effect until you restart the Sentinel Control Center.
3.4 Viewing Real-Time Events
1 Click the Active Views tab.
2 Click Active Views > Create Active View or click the Create Active View icon .
3 In the Event Visualization Wizard window, click the down-arrows to select your Event
Attribute (Z Axis), Filter, and to Display Events (Yes or No).
In the Filter Selection window, you can build your own filter or select one of the already built
filters. Selecting the All filter allows all events to display in your window. When you are
creating an Active View, if the filter assigned to the Active View is changed or deleted after
creation of the Active View, the Active View is unaffected.
Active Views Tab 57
Page 58

novdocx (en) 13 May 2009
After making your selection, you can click Next or Finish. If you select Finish, the following
default values are selected:
Display Interval and Refresh rate of 30 seconds
Total Display Time of 15 minutes
Y-axis as Event Count
Chart type of Stacked Bar 2D
4 If you click Next, click the down-arrows and fill in the fields:
Display Interval and Refresh rate:
Display Interval is the time interval to display events.
Refresh Rate is the rate at which Active Views should refresh.
Total Di s p l a y T i m e : Amount of time to display the chart.
Y-axi s: Either the total Event Count or Event Count per Second.
5 Click Next.
6 Select your chart type from the drop-down list and click Finish.
Your graph looks similar to:
58 Sentinel 6.1 Rapid Deployment User Guide
Page 59

The five buttons to the left of the chart perform the following functions:
Table 3-2 Functions of the Buttons
novdocx (en) 13 May 2009
Buttons Description
Lock/Unlock the Chart Used when performing a drill-down, zoom in, zoom out, and
zoom to selection, and saving a chart as an HTML file.
Increase Display Interval Increases the display time interval for the incoming events.
Decrease Display Interval Decreases the display time interval for the incoming events.
Increase Display Time Increases the time interval along the x-axis.
Decrease Display Time Decreases the time interval along the x-axis.
When you click the Lock button, additional available buttons are the following:
Table 3-3 Additional Buttons
Buttons Description
Lock/Unlock the Chart Used when performing a drill-down, zoom in, zoom out, and zoom to
selection, and saving a chart as an HTML file.
Zoom In Zooms in without changing any of the time settings of the chart.
Zoom Out Zooms out without changing any of the time settings of the chart.
Zoom to Selection Zooms in on a selection of time intervals of events.
Snapshot Active View Save as an HTML file with chart as images and events in a tabular
format.
Active Views Tab 59
Page 60

3.4.1 Resetting the Parameters and Chart Type of an Active View
When viewing an Active View, you can reset your chart parameters and change your chart type.
1 Within an Active View displaying a chart, right-click and select Properties.
novdocx (en) 13 May 2009
2 Under the Parameters tab, set the following options:
Display Interval: Time between each interval.
Refresh Rate: Number of seconds for the event rate to be updated.
Total Di s p l a y T i m e : Amount of time to display the chart.
Y-axi s: Either total Event Count or Event Count per Second.
60 Sentinel 6.1 Rapid Deployment User Guide
Page 61

3 Under the Chart Types tab, set your chart to Stacked Bar2D, Bar 3D, Line, or Ribbon.
novdocx (en) 13 May 2009
3.4.2 Rotating a 3D Bar or Ribbon Chart
1 Click anywhere on the chart and hold the mouse button.
2 Reposition the chart as desired by moving the mouse and holding the button.
3.5 Showing and Hiding Event Details
To show event details:
1 In a Real Time Event Table of the Navigator or in a Snapshot, double-click or right-click an
event and click Show Details. The event details displaying the left panel of the Real Time
Event Table.
Active Views Tab 61
Page 62

To hide event details:
1 In a Real Time Event Table of the Navigator or in a Snapshot, with event details displayed in
the left panel, right-click an event and click Show Details. The Event Details window closes.
3.6 Sending Mail Messages about Events and Incidents
IMPORTANT: Before you send a mail by using the Sentinel Control Center, ensure that you have
an SMTP Integrator configured with connection information and with the
SentinelDefaultEMailServer property SentinelDefaultEMailServer set to
To send an event message by e-mail:
1 In a Real Time Event Table, select an event or a group of events, then right-click and select
Email.
true
.
novdocx (en) 13 May 2009
2 Provide the following information:
Email Address
Email Subject
Email Message
3 Click OK.
62 Sentinel 6.1 Rapid Deployment User Guide
Page 63

To e-mail an incident:
1 After you save your incident, click the Incidents tab, Incidents > Incidents View.
2 Click the All Incidents option in the Switch View drop-down list located at the bottom right
corner.
3 Double-click an incident.
4 Click Email Incident icon.
5 Provide the following information:
Email Address
Email Subject
Email Message
6 Click OK.
The e-mail messages have HTML attachments that address incident details, events, assets,
vulnerabilities, advisor information, attachment information, incident notes, and incident
history.
novdocx (en) 13 May 2009
3.7 Creating Incidents
To perform this function you must have user permission to create incidents.
This is useful in grouping a set of events together as a whole representing something of interest
(group of similar events or set of different events that indicate a pattern of interest such an attack).
If events are not initially displayed in a newly created incident, it is probably because of a lag in the
time between display in the Real Time Events window and insertion into the database. If this occurs,
it takes a few minutes for the original events to be inserted into the database and display in the
incident.
To create an incident:
1 In a Real Time Event Table of the Navigator or a Snapshot Real Time Event Table, select an
event or a group of events, then right-click and select Create Incident.
2 In the New Incident window, fill in the necessary information in the following tabs:
Events: Shows which events make up the incident
Assets: Show affected assets
Active Views Tab 63
Page 64

Vulnerability: Show related asset vulnerabilities
Advisor: Asset attack and alert information
iTRAC: Under this tab, you can assign a WorkFlow (iTRAC
History: Incident history
Attachments: You can attach any document or text file with pertinent information to this
incident
Notes: You can specify any general notes regarding this incident.
3 In the Create Incident dialog box, specify:
Title
State
Severity
Priority
Category
Responsible
Description
TM
)
novdocx (en) 13 May 2009
Resolution
4 Click Create. The incident is added under the Incidents tab of the Sentinel Control Center.
3.8 Viewing Events That Trigger Correlated Events
You must right-click a correlated event in order to view the events that triggered the correlated
event. In the event table from which you are selecting the event, look in the summary display panel
on the right for an event that has a property of SensorType with a Value of C (C: correlated event).
To view events that triggered a correlated event:
1 In a Real Time Event Table of the Navigator or Snapshot, or in an event query table, right-click
a correlated event and select View Trigger Events.
A window opens, showing the events that triggered the rule and the name of the correlation
rule.
64 Sentinel 6.1 Rapid Deployment User Guide
Page 65

3.9 Investigating an Event or Events
The right-click option Investigate allows you to:
Perform an event query for the last hour on a single event for:
Other events with the same target IP address
Other events with the same source (initiator) IP address
Other targets with the same event name
NOTE: You cannot perform a query on a null (empty) field.
Graphically display the mappings between any two fields in the selected events. This is
particularly useful to view the relationship between the initiators (IP, port, event, sensor type,
Collector) and the targets (IP, port, event, sensor type, Collector name) of the selected events,
but any fields can be used
Figure 3-5 is an illustration of initiator IP addresses mapped to target IP addresses.
Figure 3-5 Graph Mapper
novdocx (en) 13 May 2009
Section 3.9.1, “Investigate: Event Query,” on page 66
Section 3.9.2, “Investigate: Graph Mapper,” on page 66
Section 3.9.3, “Historical Event Query,” on page 67
Section 3.9.4, “Active Browser,” on page 68
Active Views Tab 65
Page 66

3.9.1 Investigate: Event Query
This function allows you to perform an event query within the last hour for events similar to the
selected event.
1 In a Navigator or Snapshot window, right-click an event, click Investigate, and select one of
three options given below:
Option Function
Show More Events to this target Events with the same destination IP address
Show More Events from this source Events with the same initiator IP address
What are the target objects of this event? Events with the same event name as the
selected event
An event table opens, showing the chosen event information.
3.9.2 Investigate: Graph Mapper
novdocx (en) 13 May 2009
To create a graph map:
1 In a Real Time Event Table, right-click an event or events and select Investigate >Show Graph.
The following is a graphic depiction of Sensor Name to Event Name of severity 5 in an organic
format. You can view a graphic mapping in the following formats:
Circular
Hierarchical
Organic
Orthogonal
66 Sentinel 6.1 Rapid Deployment User Guide
Page 67

2 You must specify the From and To fields and click Finish. The Graph Mapper window
displays.
novdocx (en) 13 May 2009
3.9.3 Historical Event Query
You can query the database for the past events through a historical event query. The events can be
queried according to the filter and severity criteria in required batch size. You can export the results
in HTML or CSV file format.
To query events in the Historical Event Query window:
1 In the Active Views tab, select Active Views > Event Query. You can also open the Historical
Event Query window by clicking the Historical Query icon on the toolbar. The Historical Event
Query window displays.
2 Click Filter. In Filter Selection window, select a filter from the list of available filters.
Active Views Tab 67
Page 68

3 Click Severity icon. The Select Severity Values window displays.
4 Select one or more values for Severity and click OK.
5 Select a From and To date and time.The time you select corresponds your system time.
6 Select a batch size. The events queried display in the batch size you specify.
If you select a batch size of 100, the first 100 events are displayed in the window. After the
query is processed, the Begin Searching icon changes to the More results icon. You can see next
100 events along with the previous events by clicking the More results icon.
novdocx (en) 13 May 2009
7 Click the Begin Searching icon. The query is processed. You can cancel the search by clicking
the Cancel search icon.
TIP: Select HTML or CSV from the drop-down list to export query results.
3.9.4 Active Browser
The Active Browser provides the ability to browse through a selected set of data to look for patterns
and perform investigation. You can view the selected events in the Active Views in the Active
Browser. When you open the Active Browser using Analysis > Offline Query and click Browse
against a specific offline query, the events table is displayed only when the number of events is less
than or equal to1000.
68 Sentinel 6.1 Rapid Deployment User Guide
Page 69

The events are grouped according to the meta tags. In these meta tags, various sub categories are
defined. The numbers in the parentheses against these sub categories displays the total number of
event counts corresponding to the value of the meta tag.
To view events in Active Browser:
1 In the Active Views tab, select the event or events you want to view in Active Browser.
2 Right-click the event or events and select View in the Active Browser. The selected event/s
displays in the Active Browser window.
or
In the Active Views tab, select Active Views > Event Query. Historical Event Query window
displays.
3 In the Historical EventQuery window, run a query and click the Active Browser tab. The
selected query displays in the Active Browser window.
NOTE: The Active Browser tab is enabled only if the query results in at least one event display.
To view events in Active Browser in the Analysis tab:
novdocx (en) 13 May 2009
1 In the Analysis tab, select the query you want to view in the Active Browser.
2 Click Browse. The selected query result displays in the Active Browser window.
To search in the Active Browser:
1 Specify the value or text you want to search for in the Search field.
2 Press Enter or click the Search icon next to the Search field to search.
NOTE: You can move between the various searches by using the Forward and Backward buttons
above the Search field.
Active Views Tab 69
Page 70

To add attributes in Active Browser:
1 Click the Add an attribute for categorization icon as shown below:
2 Select an attribute in the Add an Attribute for categorization window that displays.
novdocx (en) 13 May 2009
3 Click OK.
3.10 Viewing Advisor Data
The Advisor provides a cross-reference between real-time intrusion detection systems attack
signatures and the Advisor's knowledge base of vulnerabilities. The Advisor feed has an alert and
attack feed. The alert feed contains information about vulnerabilities and viruses. The attack feed
lists the exploits associated with vulnerabilities. The Advisor data is updated on a regular basis if
you have opted for the optional Advisor data subscription service.
To View Advis or Data :
1 In a Real Time Event Table of the Navigator or Snapshot, right-click an event or a series of
selected events, then click Analyze > Advisor Data.
70 Sentinel 6.1 Rapid Deployment User Guide
Page 71

If the DeviceAttackName field is properly populated, a report similar to the one below displays.
This example is for a WEB-MISC amazon 1-click cookie theft.
novdocx (en) 13 May 2009
3.11 Viewing Asset Data
This function allows you to view and save your view as an HTML file of your Asset report. You
must run your asset management Collector to view this data. The available data for viewing are:
Hardware
MAC Address
Name
Type
Vendor
Product
Ve rs io n
Va lu e
Criticality
Sensitivity
Environment
Location
Network
IP Address
Hostname
Software
Name
Type
Active Views Tab 71
Page 72

Vendor
Product
Ve rs io n
Contacts
Order
Name
Role
Email
Phone Number
Location
Room
Rack
Address
To view Asset Data:
novdocx (en) 13 May 2009
1 In a Real Time Event Table of the Navigator or a Snapshot window, right-click an event or
click events >Analyze >Asset Data.
A window similar to the one below displays.
3.12 Viewing Vulnerabilities
Vulnerability Visualization provides a textual or graphical representation of the vulnerabilities of
selected destination systems. Vulnerabilities for the selected destination IPs can be seen for the
current time or for the time of the selected events.
72 Sentinel 6.1 Rapid Deployment User Guide
Page 73

Vulnerability Visualization requires that a vulnerability Collector is running and adding
vulnerability scan information to the Sentinel database. The Novell Sentinel Content (http://
support.novell.com/products/sentinel/secure/sentinel61.html) provides Collectors for several
industry-standard vulnerability scanners, and additional vulnerability Collectors can be written by
using the Sentinel SDK (http://developer.novell.com/wiki/index.php?title=Develop_to_Sentinel).
NOTE: Vulnerability Collectors are distinct from Event Collectors and use different commands.
There are several Vulnerability Visualization views:
HTML
Graphical
Circular
Organic
Hierarchical
Orthogonal
The HTML view is a report view that lists relevant fields, depending on which vulnerability scanner
you have:
novdocx (en) 13 May 2009
IP
Host
Vulnerability
Port/protocol
Figure 3-6 Viewing Vulnerability
The graphical display is a rendering of vulnerabilities that link them to an event through common
ports. Below are the examples of the four available views:
Active Views Tab 73
Page 74

Figure 3-7 Organic View
novdocx (en) 13 May 2009
Figure 3-8 Hierarchical View
74 Sentinel 6.1 Rapid Deployment User Guide
Page 75

Figure 3-9 Circular View
novdocx (en) 13 May 2009
Figure 3-10 Orthogonal View
The graphical display has four panels:
Graph panel
Tree panel
Control panel
Details/events panel
The graph panel display associates vulnerabilities to a port/protocol combination of a resource (IP
address). For example, if a resource has five unique port/protocol combinations that are vulnerable,
there are five nodes attached to that resource. The resources are grouped together under the scanner
that scanned the resources and reported the vulnerabilities. If two different scanners are used (ISS
and Nessus*), there are two independent scanner nodes that have vulnerabilities associated with
them.
Active Views Tab 75
Page 76

NOTE: Event mapping takes place only between the selected events and the vulnerability data
returned.
The tree panel organizes data in same hierarchy as the graph. The tree panel also allows users to
hide/show nodes at any level in the hierarchy.
The control panel exposes all the functionality available in the display. This includes:
Four different algorithms to display
The ability to show all or selected nodes which have events mapped to them
Zooming in and out of selected areas of the graph
There are two tabs in the Details/Events panel. When you are in the Details tab, clicking a node
displays node details. When you are in the Events tab, clicking an event associated with a node
displays the node in tabular form as in a Real Time or Event Query window.
To run a Vulnerability Visualization:
1 In a Real Time Event Table of the Navigator or Snapshot, right-click an event or a series of
selected events and click Analysis.
Current Vulnerability: Queries the database for vulnerabilities that are active (effective)
at the current date and time.
Event Time Vulnerability: Queries the database for vulnerabilities that were active
(effective) at the date and time of the selected event.
novdocx (en) 13 May 2009
2 At the bottom the vulnerability results window, click one of the following:
Event to Vulnerability Graph
Vulnerability Report
3 (For Event to Vulnerability Graph) Adjust the display as desired:
Move nodes and their labels
76 Sentinel 6.1 Rapid Deployment User Guide
Page 77

Use one of four different layout algorithms to display the graph
Show all nodes or only those nodes that have events mapped to them
Use in-line tree filtering if a large number of resources are returned as vulnerable
Zoom in and out of selected areas
3.13 Ticketing System Integration
Novell provides optional integration modules for BMC Remedy* that allow you to send events from
any display screen to one of these external ticketing systems. You can also send incidents and their
associated information (asset data, vulnerability data, or attached files) to Remedy.
For more information on Remedy integration, see the Remedy Integration Guide, available at the
Novell Sentinel Content Web site (http://support.novell.com/products/sentinel/sentinel61.html) for
users with a Remedy integration license.
NOTE: The permission to create Remedy incidents is controlled by the administrator on a user-byuser basis.
novdocx (en) 13 May 2009
3.14 Viewing User Information
Novell provides optional integration with identity management systems, specifically Novell Identity
Manager. With this integration, user identity information is added to incoming events when the
account name matches one from Novell Identity Manager. When the InitUserIdentity or
TargetUserIdentity column is populated in an event, a right-click option menu option is enabled to
open the user’s page in the Identity Browser.
When you select Show Identity Details, you can choose to view the identity of the Initiator user, the
Target user, or both. The Identity Browser opens and shows identifying information about the user
(or users) from the identity management system, all the accounts to which the user is provisioned,
and the recent activity by that user. For more information on the Identity Browser, see Chapter 16,
“Identity Integration,” on page 369.
3.15 Using Custom Menu Options with Events
1 In an existing Real Time Event Table of the Visual Navigator or Snapshot, right-click an event
and select a menu option. The default custom menu options are as follows:
ping
nslookup
Active Views Tab 77
Page 78

tracert
Whois?
You can further assign user permissions to view vulnerability and to perform HP actions. You
can add options by using the Event Menu Configuration option on the Admin tab.
novdocx (en) 13 May 2009
3.16 Managing Columns in a Snapshot or Navigator Window
To select and arrange columns in a Snapshot or Navigator:
1 With a Snapshot or Navigator window open, click Active View > Event Real Time > Manage
Columns or click the Manage Columns icon of a Real Time Event Table.
2 Use the Add and Remove buttons to move column titles between the Available Columns list and
the Show these columns in this order list. The Insert button can be used to insert an available
column item into a specific location.
For example, in the illustration below, clicking Insert places AttackId above DateTime.
78 Sentinel 6.1 Rapid Deployment User Guide
Page 79

Use the up-arrow and down-arrow buttons to arrange the order of the columns as you want
them to display in the Real Time Event Table. The top-to-bottom order of column titles in the
Manage Column dialog box determines the left-to-right order of the columns in the Real Time
Event Table.
3 In the Manage Column dialog box, click OK.
4 If you want your columns to display the next time you open the Sentinel Control Center, click
File > Save Preferences or click the Save User Preference icon.
3.17 Taking a Snapshot of a Navigator Window
It is useful to study events this way because the Navigator refreshes automatically and the alert or
alerts of interest scroll off the screen. Also, within a Snapshot, you can sort by column.
To perform this function, you must have the Snapshot user permission.
1 With a Navigator window open, click Active Views > Event Real Time > Snapshot or click the
Snapshot Event Real Time Table icon.
A Snapshot window opens and is added to the Snap Shots folder list under Active Views in the
Navigator. The graphical display is not part of the Snapshot.
novdocx (en) 13 May 2009
3.18 Sorting Columns in a Snapshot
1 Click any column header once to sort by ascending value and twice to sort by descending
value.
3.19 Closing a Snapshot or Navigator
1 When a Snapshot or Navigator is open, close it by using the Close button in the upper right
corner.
NOTE: The view or Snapshot does not redisplay when you close and reopen the Sentinel Control
Center.
3.20 Adding Events to an Incident
To perform this function you must have user permissions to Modify Incident(s) and Add to existing
Incident(s).
1 In a Real Time Event Table or a Snapshot, select an event or a group of events and right-click.
Click Add To Incident.
2 In the Add Events To Incident dialog box, click Browse to list the available incidents.
Active Views Tab 79
Page 80

novdocx (en) 13 May 2009
The Select Incident window displays.
3 Click Search to view a list of incidents with the selected criteria.
You can define your criteria to search for a particular incident or incidents in Select Incident
window.
4 Select an incident and click Add.
80 Sentinel 6.1 Rapid Deployment User Guide
Page 81

5 Click OK. The event or events selected are added to the incident in the Incidents Navigator.
If events are not initially displayed in a newly created incident, it is probably because of a lag in
the time between displaying in the Real Time Events window and insertion into the database. If
this occurs, it takes a few minutes for the original events to be inserted into the database and
display in the incident.
novdocx (en) 13 May 2009
Active Views Tab 81
Page 82

novdocx (en) 13 May 2009
82 Sentinel 6.1 Rapid Deployment User Guide
Page 83

4
Correlation Tab
Sometimes, an event viewed in the system might not necessarily draw your attention. However,
when you correlate a set of similar or comparable events in a given period, it might lead you to a
significant event. Sentinel
the Correlation engine so you can take appropriate action to mitigate any alarming situation.
Section 4.1, “Understanding Correlation,” on page 83
Section 4.2, “Introduction to the User Interface,” on page 85
Section 4.3, “Correlation Rules,” on page 85
Section 4.4, “Dynamic Lists,” on page 98
Section 4.5, “Correlation Engine,” on page 102
Section 4.6, “Correlation Actions,” on page 102
TM
helps you correlate such events with the rules you create and deploy in
novdocx (en) 13 May 2009
4
4.1 Understanding Correlation
Correlation adds intelligence to security event management by automating analysis of the incoming
event stream to find patterns of interest. Correlation allows you to define rules that identify critical
threats and complex attack patterns so that you can prioritize events and initiate effective incident
management and response. Starting with Sentinel 6.0, the Correlation engine is built with a
pluggable framework, which allows the addition of new Correlation engines in the future.
Correlation rules define a pattern of events that should trigger, or fire, a rule. Using either the
Correlation Rule Wizard or the simple RuleLG language, you can create rules that range from
simple to extremely complex, for example:
High severity event from a finance server
High severity event from any server brought online in the past 10 days
Five failed logins in 2 minutes
Five failed logins in 2 minutes to the same server from the same username
Intrusion detection event targeting a server, followed by an attempted login to root originating
from that same server within 60 seconds
Two or more of these rules can be combined into one composite rule. The rule definition determines
the conditions under which the composite rule fires:
All subrules must fire
A specified number of subrules must fire
The subrules must fire in a particular sequence
After the rule is defined, it should be deployed to an active Correlation engine, and one or more
actions can be associated with it. After the rule is deployed, the Correlation engine processes events
from the real-time event stream to determine whether they should trigger any of the active rules.
NOTE: Events that are sent directly to the database or dropped by a global filter are not processed
by the Correlation engine.
Correlation Tab
83
Page 84

When a rule fires, a correlated event is sent to the Sentinel Control Center, where it can be viewed in
the Active Views window.
Figure 4-1 Active Views Window
novdocx (en) 13 May 2009
The correlated event can also trigger actions, such as sending an e-mail with the correlated event’s
TM
details or creating an incident associated with an iTRAC
workflow.
4.1.1 Technical Implementation
All correlation is done in-memory on the machine (or machines) that host the Correlation engine.
This model allows fast, distributed processing that does not contend with database operations such
as inserting events into the database.
For environments with large numbers of Correlation rules or extremely high event rates, it might be
advantageous to install more than one Correlation engine and redeploy some rules to the new
Correlation engine. The ability to deploy multiple Correlation engines provides the ability to scale
as the Sentinel system incorporates additional data sources or as event rates increase.
Sentinel correlation is nearly real-time and depends on the time stamp for the individual events. To
synchronize time, you can use an NTP (Network Time Protocol) server to synchronize the time on
all devices on your network, or you can rely on the time on the Collector Manager servers and
synchronize only those few machines.
Correlation relies on the data that is collected, parsed, and normalized by the Collectors, so a
working understanding of the data is necessary to write rules. Many Novell
on an event taxonomy that ensures that a “failed login” and an “unsuccessful logon” from two
devices are classified the same.
®
Correlation rules rely
84 Sentinel 6.1 Rapid Deployment User Guide
Page 85

In the Correlation tab, you can:
Create/modify Correlation rules and rule folders
Deploy Correlation rules on the Correlation engine
Create and associate an action to a rule
Configure dynamic lists
NOTE: Access to the correlation functions can be enabled by the administrator on a user-by-user
basis.
4.2 Introduction to the User Interface
In Correlation, you can see the Correlation Rule Manager, Correlation Engine Manager, Correlation
Action Manager, and dynamic lists.
You can navigate to these functions from:
Table 4-1 Correlation User Interface
novdocx (en) 13 May 2009
User Interface Description
The Correlation menu in the Menu bar
The Navigation tree in the Navigation pane
The Toolbar buttons
4.3 Correlation Rules
Correlation rules are created, modified, renamed, deployed, and undeployed in the Correlation Rule
Manager. Correlation rules are organized into rule folders, which can also be managed in the
Correlation Rule Manager.
NOTE: There is no limit to the number of users that can access Correlation rules. When more than
one user is editing the same rule, the last person to save overwrites all previous saves.
Section 4.3.1, “Opening the Correlation Rule Manager,” on page 86
Section 4.3.2, “Creating a Rule Folder,” on page 86
Correlation Tab 85
Page 86

Section 4.3.3, “Renaming a Rule Folder,” on page 86
Section 4.3.4, “Deleting a Rule Folder,” on page 86
Section 4.3.5, “Creating a Correlation Rule,” on page 86
Section 4.3.6, “Creating Correlation Rules,” on page 87
Section 4.3.7, “Deploying and Undeploying Correlation Rules,” on page 95
Section 4.3.8, “Enabling and Disabling Rules,” on page 96
Section 4.3.9, “Renaming and Deleting a Correlation Rule,” on page 96
Section 4.3.10, “Sorting Correlation Rules,” on page 96
Section 4.3.11, “Moving a Correlation Rule,” on page 97
Section 4.3.12, “Importing a Correlation Rule,” on page 97
Section 4.3.13, “Exporting a Correlation Rule,” on page 98
4.3.1 Opening the Correlation Rule Manager
1 Click the Correlation tab.
2 In the navigator, click Correlation Rules Manager. Alternatively, click the Correlation Rules
Manager button in the tool bar. The Correlation Rule Manager window displays.
novdocx (en) 13 May 2009
4.3.2 Creating a Rule Folder
1 Open the Correlation Rule Manager window and click Manage Folder.
2 Right-click a folder and select Add Folder.
3 Specify the Rule Folder name.
4.3.3 Renaming a Rule Folder
1 Open the Correlation Rule Manager window and click Manage Folder.
2 Select a folder and click Rename. Change the name of the folder.
4.3.4 Deleting a Rule Folder
1 Open the Correlation Rule Manager window and click Manage Folder.
2 Select a folder and click Delete. Click Yes when the system asks for confirmation.
4.3.5 Creating a Correlation Rule
1 Open the Correlation Rule Manager window and select a folder from the Folder drop-down list
to which this rule is added.
2 Click the Add button located on the top left corner of the screen.
86 Sentinel 6.1 Rapid Deployment User Guide
Page 87

3 The Rule Wizard displays. Select one of the following rule types and follow the steps for that
particular rule type:
Simple
Composite
Aggregate
Sequence
Custom/Freeform
4 Define the update criteria for the rule.
If you select Continue to perform actions every time this rule fires, the rule fires every time the
criteria is met. If you select Do not perform actions every time this rule fires for the next (t)
time, the event fires only once as per user-defined time period.
All the other events that match the Correlation rule within the specified time are grouped
together with this correlated event. This user-defined time period can be a certain number of
seconds, minutes, or hours.
5 Click Next.
6 Provide the rule name. The syntax of the rule is checked at the time it is created.
7 Under Namespace, select a Correlation rule folder in which to store the rule.
8 Type the description of the rule.
novdocx (en) 13 May 2009
9 Click Next. The rule is created and displays in the Correlation Rules Manager window.
10 Select Yes if you want to create another rule or select No if you do not want to create another
rule. Click Next.
The rule types and the steps to create them are described in Section 4.3.6, “Creating Correlation
Rules,” on page 87.
4.3.6 Creating Correlation Rules
Correlation rules can be defined in the Correlation Rule Wizard by walking through the wizard or by
choosing the Custom/Freeform option to write the rule in the proprietary RuleLG language. All rule
definitions are stored in the database in RuleLG.
Correlation rules can be defined based on any populated event field.
NOTE: When creating a rule, you can refer to a dynamic list for it. For more information, see
Section 4.4.5, “Using a Dynamic List in a Correlation Rule,” on page 100.
“Simple Rule” on page 88
“Aggregate Rule” on page 90
“Composite Rule” on page 92
“Sequence” on page 93
“Custom or Freeform Correlation Rules” on page 94
Correlation Tab 87
Page 88

Simple Rule
A simple rule is defined by specifying the events that can trigger the rule to fire (For example,
firewall events, firewall events of severity 3 or higher). The filter criteria can be intersected (using
the “all”option in the GUI or the “AND” operator in RuleLG) or the filter criteria can be unioned
(using the “any” option in the GUI or the “OR” operator in RuleLG).
For example, a rule might be defined so that it fires anytime an event takes place on a server that is
on the critical list. Another rule might be defined to fire anytime an event of severity 4 or greater
takes place on a server that is on the critical list.
A simple rule requires only one event in order to fire.
For users familiar with the Correlation rule language (RuleLG), the defining operator for a simple
rule is the “filter” operator. For more information about RuleLG, see “Sentinel 6.1 Rapid
Deployment Correlation Engine RuleLG Language” in the Sentinel 6.1 Rapid Deployment
Reference Guide.
In Sentinel 6, filter criteria must be defined in the Correlation Rule Wizard. You cannot use existing
public filters.
novdocx (en) 13 May 2009
To create a simple rule:
1 Open the Correlation Rule Manager window and select a folder from the drop-down list to
which this rule is added.
2 Click the Add button located on the top left corner of the screen. The Correlation Rule window
displays. Select Simple Rule.
3 In the Simple Rule window, define a condition for this rule. Select the Property and Operator
values from the drop-down lists and specify data in the value field.
88 Sentinel 6.1 Rapid Deployment User Guide
Page 89

novdocx (en) 13 May 2009
4 Click Add to add additional definitions for this rule.
5 Preview the rule in the RuleLG preview window. For example,
filter(e.sev=3)
.
6 Click Next.The Update Criteria window displays.
7 Enable the update criteria for the rule to fire and click Next. The General Description window
displays.
Correlation Tab 89
Page 90

8 Provide a name for this rule. You have an option to modify the rule folder.
9 Provide rule description and click Next.
10 You have an option to create another rule from this wizard. Select your option and click Next.
Aggregate Rule
An aggregate rule is defined by specifying a subrule and the number of times the subrule must fire
within a specific time window in order to trigger the aggregate rule. For example, an aggregate rule
might require that a subrule fire 10 times within 5 minutes for the aggregate rule to fire.
Aggregate rules have an optional group by field, which can be any populated field from the events.
For example, an aggregate rule might require that a subrule fire 10 times within 5 minutes where
each of the 10 events has the same destination server.
NOTE: For users familiar with the Correlation rule language (RuleLG), the defining operator for an
aggregate rule is the “trigger” operator. The trigger clause might also use the “discriminator”
operator to define the group by field. For more information about RuleLG, see “Sentinel 6.1 Rapid
Deployment Correlation Engine RuleLG Language” in the Sentinel 6.1 Rapid Deployment
Reference Guide.
novdocx (en) 13 May 2009
To create an aggregate rule:
1 Open the Correlation Rule Manager window and select a folder from the drop-down list to
which this rule is added.
2 Click the Add button located on the top left corner of the screen. The Correlation Rule window
displays. Select Aggregate Rule.
90 Sentinel 6.1 Rapid Deployment User Guide
Page 91

3 In Aggregate Rule window, click the Add Rule button to select a sub rule to create an aggregate
rule. The Add Rule window displays.
You can select only one sub rule when creating an aggregate rule.
4 Select a rule and click OK.
5 Set parameters for the rule to fire.
novdocx (en) 13 May 2009
6 To group event tags according to the attributes, Click Add/Edit. The Attribute List window
displays.
7 Select the attribute you want, then preview the rule in the RuleLG preview window.
8 Click Next.The Update Criteria window displays.
9 Update the criteria for the rule to fire and click Next. The General Description window
displays.
10 Provide a name for this rule. You have an option to modify the rule folder.
11 Provide a rule description and click Next.
12 You have an option to create another rule from this wizard. Select your option and click Next.
Correlation Tab 91
Page 92

Composite Rule
A composite rule is comprised of two or more subrules. A composite rule can be defined so that all
or a specified number of the subrules must fire within the defined time frame. Composite rules have
an optional group by field, which can be any populated field from the events.
NOTE: When a subrule is used to create a composite rule, a copy of the subrule is added to the
composite rule’s definition. Because a copy is added, changes to the original subrule do not affect
the composite rule.
To create a composite rule:
1 Open the Correlation Rule Manager window and select a folder from the drop-down list to
which this rule is added.
2 Click the Add button located on the top left corner of the screen. The Correlation Rule window
displays. Select Composite Rule.
novdocx (en) 13 May 2009
3 In the Composite Rule window, click Add Rule to select sub rules to create a composite rule.
The Add Rule window displays.
4 Select a rule or a set of rules nd click OK.
5 Set parameters for the rule to fire.
6 To group event tags according to the attributes, click Add/Edit. The Attribute window displays.
7 Select the attribute you want, then preview the rule in RuleLg preview box.
8 Click Next.The Update Criteria window displays.
9 Update criteria for the rule to fire and click Next.
10 Provide a name for this rule. You have an option to modify the rule folder.
92 Sentinel 6.1 Rapid Deployment User Guide
Page 93

11 Provide a rule description and click Next.
12 You have an option to create another rule from this wizard. Select your option and click Next.
Sequence
A sequence rule is comprised of two or more subrules that must be triggered in a specific order
within the defined time frame. Sequence rules have an optional group by field, which can be any
populated field from the events.
NOTE: When a subrule is used to create a sequence rule, a copy of the subrule is added to the
sequence rule’s definition. Because a copy is added, changes to the original subrule do not affect the
sequence rule.
To create a sequence rule:
1 Open the Correlation Rule Manager window and select a folder from the Folder drop-down list
to which this rule is added.
2 Click the Add button located on the top left corner of the screen. The Correlation Rule window
displays. Select Sequence Rule.
novdocx (en) 13 May 2009
3 In the Sequence Rule window, click the Add Rule button to select a sub rule to create a
sequence rule. The Add Rule window displays.
4 Select a rule and click OK.
5 Set parameters for the rule to fire. To group event tags according to the attributes, click Add/
Edit. The Attribute List window displays.
6 Select the attribute you want, then You can preview the rule in RuleLg preview box.
7 Click Next.The Update Criteria window displays.
8 Update criteria for the rule to fire and click Next.
9 Provide a name for this rule. You have an option to modify the rule folder.
Correlation Tab 93
Page 94

10 Provide rule description and click Next.
11 You have an option to create another rule from this wizard. Select your option and click Next.
Custom or Freeform Correlation Rules
The custom or freeform rule option is the most powerful option for creating a correlation rule. This
allows the user to create any of the previous types of rules by typing the RuleLG correlation rule
language directly into the Correlation Rule Wizard.
Freeform rules are the only way to include certain functionality in a correlation rule. Freeform rules
give you the ability to do the following:
Nest operations by using parentheses to specify order of operations
Use the
inlist
operator to refer to a dynamic list
novdocx (en) 13 May 2009
Use the
Use the
isnull
w.
operator to refer to unpopulated fields
prefix for a field name in the window operation to compare an incoming event’s
value to a set of previous events
TIP: You can select the functions, operators, and meta tags from the drop-down list selection. Type
e.
or w. in the Correlation Rule section to view the drop-down lists.
To create a custom or freeform rule:
1 Open the Correlation Rule Manager window and select a folder from the Folder drop-down list
to which this rule is added.
2 Click the Add button located on the top left corner of the screen. The Correlation Rule window
displays. Select Custom/Freeform Rule.
3 In the Custom/Freeform Rule window, write the condition for the rule and click Validate to test
the validity of the rule.
4 After validation of the rule, click Next. The Update Criteria window displays.
5 Update the criteria for the rule to fire and click Next.
6 Provide a name for this rule. You have an option to modify the rule folder.
7 Provide rule description and click Next.
8 You have an option to create another rule from this wizard. Select your option and click Next.
94 Sentinel 6.1 Rapid Deployment User Guide
Page 95

4.3.7 Deploying and Undeploying Correlation Rules
Correlation rules can be deployed or undeployed from the Correlation Engine Manager or the
Correlation Rule Manager. You can undeploy all rules or a single rule.
The rules can be associated with one or more actions. If no action is selected, a default correlated
event is generated with the following values:
Table 4-2 Default Correlated Event Details
Field Name Default Values
Severity 4
Event Name Same as the event name for the trigger event
Message Same as the message for the trigger event
Resource Correlation
SubResource <Rule Name>
novdocx (en) 13 May 2009
Other types of actions can be configured in the Action Manager:
Configure a Correlated Event replaces the default correlated event settings
Add to Dynamic List adds an element to a dynamic list
Remove from Dynamic List removes an element from a dynamic list
Execute a Command executes a shell or batch script
Execute a Script executes a script; only available for actions created in Sentinel 6.0
Send an Email by using default Sentinel mail settings
Create an Incident creates a Sentinel incident
Configure any Action from the Action Manager that was created from an Action plug-in that
takes a correlated event as input. For more information on the Action Manager, see Chapter 15,
“Action Manager and Integrator,” on page 341.
To deploy correlation rules in the Correlation Engine Manager:
1 Open the Correlation Engine Manager window.
2 Right-click the engine you want to deploy the rule on and select Deploy Rule.
3 In the Rules tab, select the rule or rules you want to deploy.
4 In the Actions tab, select the action or actions you want to associate with the rule.
5 Click Deploy. Rules are deployed in an enabled state.
To deploy correlation rules in the Correlation Rule Manager:
1 Open the Correlation Rule Manager window.
2 Select a rule and click the Deploy rules link. The Deploy Rule window displays.
3 In the Deploy Rule window, select the engine to deploy the rule from the drop-down list.
4 (Optional) Select an action or add a new action.
Correlation Tab 95
Page 96

If nothing is selected, a Correlated event with default values is created.
5 Click Deploy.
To undeploy a single rule:
1 In the Correlation Engine Manager, right-click the rule and select Undeploy Rule.
or
In the Correlation Rule Manager, select the rule and click the Undeploy rule link.
To undeploy all correlation rules:
1 Open the Correlation Engine Manager window.
2 Right-click the Correlation engine and select Undeploy All Rules.
4.3.8 Enabling and Disabling Rules
1 Open the Correlation Engine Manager window.
2 Right-click the rule or set of rules and select Enable Rule or Disable Rule.
novdocx (en) 13 May 2009
4.3.9 Renaming and Deleting a Correlation Rule
To rename a correlation rule:
NOTE: You must undeploy a rule before you rename or delete the rule.
1 Open the Correlation Rule Manager window and select the rule you want to rename.
2 If the rule is deployed, click the Undeploy Rule link to undeploy the rule.
3 Click the Vie w/Edit link. In the General Description tab, change the name of the Correlation
rule.
4 Click OK.
To delete a correlation rule:
1 Open the Correlation Rule Manager window and select the rule you want to delete.
2 If the rule is deployed, click the Undeploy Rule link to undeploy the rule.
3 Click the Delete link. Click Yes when the system prompts for confirmation.
4.3.10 Sorting Correlation Rules
To sort the list of correlation rules, click the Sort button at the top left of the Correlation Rule
Manager window.
96 Sentinel 6.1 Rapid Deployment User Guide
Page 97

4.3.11 Moving a Correlation Rule
1 Open the Correlation Rule Manager window and click Manage Folder.
2 Drag a correlation rule from one folder to another.
4.3.12 Importing a Correlation Rule
1 Open the Correlation Rule Manager window and click the Import/Export Correlation Rule
icon.
The Import Export Rule window displays.
novdocx (en) 13 May 2009
2 Select the Import option from the Action pane. The description in the Description pane changes
to Import.
3 Click Browse to select the Correlation rule you want to import. Select the file and click Import,
then click Next. The Import Rule window displays.
4 Select the folder you want to import the Correlation rule into, then click Finish.
When importing a correlation rule in a folder, if a correlation rule with the same name exists,
the system displays a message and does not import the file.
Correlation Tab 97
Page 98

novdocx (en) 13 May 2009
IMPORTANT: If you import a correlation rule using the
aligned to that rule must exist or you must create the dynamic list with the same name on the
system to which it is imported.
inlist
operator, the dynamic list
4.3.13 Exporting a Correlation Rule
1 Open the Correlation Rule Manager window and click the Import/Export Correlation Rule
icon. The Import Export Rule window displays.
2 Select the Export option from the Action pane. The description in the Description pane changes
to Export.d
3 Click Browse to export the rule. Specify a filename and click Export, then click Next. The
Export Rule window displays.
4 Select the Correlation rule you want to export. Click Finish.
4.4 Dynamic Lists
Dynamic lists are distributed list structures that can be used to store string elements, such as IP
addresses, server names, or usernames. The lists are then used within a Correlation rule for a quick
lookup to see whether an incoming event includes an element from the dynamic list. Some examples
of dynamic list include:
Terminated user lists
Suspicious user watchlist
Privileged user watchlist
Authorized ports and services list
Authorized server list
A dynamic list can be built by using the text values for any event meta tag. Elements can be added to
the list manually (by an administrator) or automatically whenever a Correlation rule fires. Elements
can be removed from a list manually (by an administrator), automatically whenever a correlation
rule fires, when their time limit expires, or when the maximum list size is reached.
IMPORTANT: The Time To Live (TTL) must be between 60 seconds and 90 days and the
maximum list size is 100,000.
98 Sentinel 6.1 Rapid Deployment User Guide
Page 99

Regardless of how the values were added, they can be persistent (active until manually removed or
until the maximum list size is reached) or transient (active only for a specified time frame after being
added to the list, also known as the Time to Live). The Time to Live can range from 60 seconds to 90
days.
NOTE: If the Time to Live period is updated on an active dynamic list, the change is not retroactive
to elements already on the list. Elements that are already added to the dynamic list retain their
original Time to Live.
4.4.1 Adding a Dynamic List
1 Click Correlation on the menu bar and select Dynamic Lists. Alternatively, you can click the
Dynamic Lists button on the toolbar.
2 Click the Add button located on the top left corner of the screen. The Dynamic List Properties
window displays.
3 Provide the name of the list.
novdocx (en) 13 May 2009
The name cannot contain special characters, such as quotations or hyphens.
4 Click Add. The Add Element window displays:
5 Provide the name of the Element. To make the Element persistent, select the Make Persistent
check box and click OK.
Correlation Tab 99
Page 100

To make an existing element persistent, select the check box next to the element name in the
Dynamic Properties window.
6 Select Transient elements life span, then specify the time the persistent values are active in the
list
7 Specify the maximum number of elements. The number defined here limits the number of
elements in the list.
8 Click OK.
Select a filter type from Quick Filter drop-down list and specify the name of the element, to
filter the available elements.
4.4.2 Modifying a Dynamic List
1 Click Correlation on the menu bar and select Dynamic Lists. Alternatively, you can click the
Dynamic Lists button on the toolbar.
2 Select a dynamic list and click the Vie w/Edi t link.
3 The Dynamic List Properties window displays. Edit the options as required and click OK.
novdocx (en) 13 May 2009
4.4.3 Deleting a Dynamic List
WARNING: Do not delete a dynamic list that is part of a correlation rule or rules.
1 Click Correlation on the menu bar and select Dynamic Lists. Alternatively, you can click the
Dynamic Lists button on the toolbar.
2 Select a dynamic list and click the Delete link next to it. A confirmation message alert
displays.
3 Click Yes to delete the list.
4.4.4 Removing Dynamic List Elements
There are several ways an element can be removed from a dynamic list:
A user can remove it manually
The element can be removed by a Correlation rule action
The transient element life span can expire
If the maximum number of elements for a dynamic list is reached, elements are removed from
the list to keep the list at or below the maximum list size. The transient elements are removed
(from oldest to newest) before any persistent elements are removed.
4.4.5 Using a Dynamic List in a Correlation Rule
Dynamic lists can be referenced in a Correlation rule by using the Custom/Freeform option of the
Correlation Rule Wizard. For example:
filter(e.<tagname> inlist <Dynamic List Name>)
100 Sentinel 6.1 Rapid Deployment User Guide
 Loading...