

Page 1

Novell®
www.novell.com
User Guide
novdocx (en) 7 January 2010
AUTHORIZED DOCUMENTATION
Sentinel
6.1 SP2
February 2010
TM
Sentinel 6.1 User Guide
Page 2

Legal Notices
Novell, Inc., makes no representations or warranties with respect to the contents or use of this documentation, and
specifically disclaims any express or implied warranties of merchantability or fitness for any particular purpose.
Further, Novell, Inc., reserves the right to revise this publication and to make changes to its content, at any time,
without obligation to notify any person or entity of such revisions or changes.
Further, Novell, Inc., makes no representations or warranties with respect to any software, and specifically disclaims
any express or implied warranties of merchantability or fitness for any particular purpose. Further, Novell, Inc.,
reserves the right to make changes to any and all parts of Novell software, at any time, without any obligation to
notify any person or entity of such changes.
Any products or technical information provided under this Agreement may be subject to U.S. export controls and the
trade laws of other countries. You agree to comply with all export control regulations and to obtain any required
licenses or classification to export, re-export or import deliverables. You agree not to export or re-export to entities
on the current U.S. export exclusion lists or to any embargoed or terrorist countries as specified in the U.S. export
laws. You agree to not use deliverables for prohibited nuclear, missile, or chemical biological weaponry end uses.
See the Novell International Trade Services Web page (http://www.novell.com/info/exports/) for more information
on exporting Novell software. Novell assumes no responsibility for your failure to obtain any necessary export
approvals.
novdocx (en) 7 January 2010
Copyright © 1999-2010 Novell, Inc. All rights reserved. No part of this publication may be reproduced, photocopied,
stored on a retrieval system, or transmitted without the express written consent of the publisher.
Novell, Inc.
404 Wyman Street, Suite 500
Waltham, MA 02451
U.S.A.
www.novell.com
Online Documentation: To access the latest online documentation for this and other Novell products, see
the Novell Documentation Web page (http://www.novell.com/documentation).
Page 3

Novell Trademarks
For Novell trademarks, see the Novell Trademark and Service Mark list (http://www.novell.com/company/legal/
trademarks/tmlist.html).
Third-Party Materials
All third-party trademarks are the property of their respective owners.
novdocx (en) 7 January 2010
Page 4

novdocx (en) 7 January 2010
4 Sentinel 6.1 User Guide
Page 5

Contents
Preface 17
1 Sentinel Control Center 21
1.1 About Sentinel Control Center . . . . . . . . . . . . . . . . . . . . . . . . . . . . . . . . . . . . . . . . . . . . . . . . . 21
1.1.1 Active Views . . . . . . . . . . . . . . . . . . . . . . . . . . . . . . . . . . . . . . . . . . . . . . . . . . . . . . . 21
1.1.2 Incidents . . . . . . . . . . . . . . . . . . . . . . . . . . . . . . . . . . . . . . . . . . . . . . . . . . . . . . . . . . 22
1.1.3 iTRAC . . . . . . . . . . . . . . . . . . . . . . . . . . . . . . . . . . . . . . . . . . . . . . . . . . . . . . . . . . . . 22
1.1.4 Analysis . . . . . . . . . . . . . . . . . . . . . . . . . . . . . . . . . . . . . . . . . . . . . . . . . . . . . . . . . . . 22
1.1.5 Advisor. . . . . . . . . . . . . . . . . . . . . . . . . . . . . . . . . . . . . . . . . . . . . . . . . . . . . . . . . . . . 22
1.1.6 Admin. . . . . . . . . . . . . . . . . . . . . . . . . . . . . . . . . . . . . . . . . . . . . . . . . . . . . . . . . . . . . 22
1.1.7 Correlation . . . . . . . . . . . . . . . . . . . . . . . . . . . . . . . . . . . . . . . . . . . . . . . . . . . . . . . . . 23
1.1.8 Event Source Management . . . . . . . . . . . . . . . . . . . . . . . . . . . . . . . . . . . . . . . . . . . . 23
1.1.9 Solution Packs . . . . . . . . . . . . . . . . . . . . . . . . . . . . . . . . . . . . . . . . . . . . . . . . . . . . . . 24
1.1.10 Identity Integration . . . . . . . . . . . . . . . . . . . . . . . . . . . . . . . . . . . . . . . . . . . . . . . . . . . 24
1.2 Log in to the Sentinel Control Center . . . . . . . . . . . . . . . . . . . . . . . . . . . . . . . . . . . . . . . . . . . . 24
1.3 Introduction to the User Interface. . . . . . . . . . . . . . . . . . . . . . . . . . . . . . . . . . . . . . . . . . . . . . . 25
1.3.1 Menu Bar . . . . . . . . . . . . . . . . . . . . . . . . . . . . . . . . . . . . . . . . . . . . . . . . . . . . . . . . . . 26
1.3.2 Toolbar. . . . . . . . . . . . . . . . . . . . . . . . . . . . . . . . . . . . . . . . . . . . . . . . . . . . . . . . . . . . 26
1.3.3 Tabs. . . . . . . . . . . . . . . . . . . . . . . . . . . . . . . . . . . . . . . . . . . . . . . . . . . . . . . . . . . . . . 27
1.3.4 Frames. . . . . . . . . . . . . . . . . . . . . . . . . . . . . . . . . . . . . . . . . . . . . . . . . . . . . . . . . . . . 28
1.3.5 Navigating through Sentinel Control Center . . . . . . . . . . . . . . . . . . . . . . . . . . . . . . . 28
1.3.6 Changing the appearance of Sentinel Control Center . . . . . . . . . . . . . . . . . . . . . . . . 28
1.3.7 Saving User Preferences. . . . . . . . . . . . . . . . . . . . . . . . . . . . . . . . . . . . . . . . . . . . . . 30
1.3.8 Changing Password. . . . . . . . . . . . . . . . . . . . . . . . . . . . . . . . . . . . . . . . . . . . . . . . . . 30
1.3.9 Hostname updates. . . . . . . . . . . . . . . . . . . . . . . . . . . . . . . . . . . . . . . . . . . . . . . . . . . 30
1.3.10 Configuring the Attachment Viewer . . . . . . . . . . . . . . . . . . . . . . . . . . . . . . . . . . . . . . 32
novdocx (en) 7 January 2010
2 Active Views Tab 35
2.1 Understanding Active Views . . . . . . . . . . . . . . . . . . . . . . . . . . . . . . . . . . . . . . . . . . . . . . . . . . 35
2.2 Introduction to the User Interface. . . . . . . . . . . . . . . . . . . . . . . . . . . . . . . . . . . . . . . . . . . . . . . 36
2.3 Reconfiguring Total Display Time . . . . . . . . . . . . . . . . . . . . . . . . . . . . . . . . . . . . . . . . . . . . . . 39
2.4 Viewing Real Time Events . . . . . . . . . . . . . . . . . . . . . . . . . . . . . . . . . . . . . . . . . . . . . . . . . . . . 39
2.4.1 To Reset Parameters and Chart Type of an Active View . . . . . . . . . . . . . . . . . . . . . 41
2.4.2 Rotating a 3D Bar or Ribbon Chart . . . . . . . . . . . . . . . . . . . . . . . . . . . . . . . . . . . . . . 43
2.5 Showing and Hiding Event Details . . . . . . . . . . . . . . . . . . . . . . . . . . . . . . . . . . . . . . . . . . . . . . 43
2.6 Sending Mail Messages about Events and Incidents . . . . . . . . . . . . . . . . . . . . . . . . . . . . . . . 43
2.7 Creating Incidents . . . . . . . . . . . . . . . . . . . . . . . . . . . . . . . . . . . . . . . . . . . . . . . . . . . . . . . . . . 45
2.8 Viewing Events that Triggered Correlated Events . . . . . . . . . . . . . . . . . . . . . . . . . . . . . . . . . . 46
2.9 Investigating an Event or Events . . . . . . . . . . . . . . . . . . . . . . . . . . . . . . . . . . . . . . . . . . . . . . . 47
2.9.1 Investigate – Event Query . . . . . . . . . . . . . . . . . . . . . . . . . . . . . . . . . . . . . . . . . . . . . 47
2.9.2 Investigate – Graph Mapper . . . . . . . . . . . . . . . . . . . . . . . . . . . . . . . . . . . . . . . . . . . 48
2.9.3 Historical Event Query . . . . . . . . . . . . . . . . . . . . . . . . . . . . . . . . . . . . . . . . . . . . . . . . 49
2.9.4 Active Browser. . . . . . . . . . . . . . . . . . . . . . . . . . . . . . . . . . . . . . . . . . . . . . . . . . . . . . 51
2.10 Viewing Advisor Data . . . . . . . . . . . . . . . . . . . . . . . . . . . . . . . . . . . . . . . . . . . . . . . . . . . . . . . . 53
2.11 Viewing Asset Data . . . . . . . . . . . . . . . . . . . . . . . . . . . . . . . . . . . . . . . . . . . . . . . . . . . . . . . . . 54
2.12 Viewing Vulnerabilities . . . . . . . . . . . . . . . . . . . . . . . . . . . . . . . . . . . . . . . . . . . . . . . . . . . . . . . 55
2.13 Ticketing System Integration . . . . . . . . . . . . . . . . . . . . . . . . . . . . . . . . . . . . . . . . . . . . . . . . . . 60
2.14 Viewing User Information . . . . . . . . . . . . . . . . . . . . . . . . . . . . . . . . . . . . . . . . . . . . . . . . . . . . . 60
Contents 5
Page 6

2.15 Using Custom Menu Options with Events . . . . . . . . . . . . . . . . . . . . . . . . . . . . . . . . . . . . . . . . 61
2.16 Managing Columns in a Snapshot or Navigator Window . . . . . . . . . . . . . . . . . . . . . . . . . . . . . 61
2.17 Taking a Snapshot of a Navigator Window . . . . . . . . . . . . . . . . . . . . . . . . . . . . . . . . . . . . . . . 62
2.18 Sorting Columns in a Snapshot . . . . . . . . . . . . . . . . . . . . . . . . . . . . . . . . . . . . . . . . . . . . . . . . 63
2.19 Closing a Snapshot or Navigator . . . . . . . . . . . . . . . . . . . . . . . . . . . . . . . . . . . . . . . . . . . . . . . 63
2.20 Adding Events to an Incident . . . . . . . . . . . . . . . . . . . . . . . . . . . . . . . . . . . . . . . . . . . . . . . . . . 63
3 Correlation Tab 65
3.1 Understanding Correlation . . . . . . . . . . . . . . . . . . . . . . . . . . . . . . . . . . . . . . . . . . . . . . . . . . . . 65
3.1.1 Technical Implementation . . . . . . . . . . . . . . . . . . . . . . . . . . . . . . . . . . . . . . . . . . . . . 66
3.2 Introduction to the User Interface. . . . . . . . . . . . . . . . . . . . . . . . . . . . . . . . . . . . . . . . . . . . . . . 67
3.3 Correlation Rules . . . . . . . . . . . . . . . . . . . . . . . . . . . . . . . . . . . . . . . . . . . . . . . . . . . . . . . . . . . 67
3.3.1 Opening the Correlation Rule Manager . . . . . . . . . . . . . . . . . . . . . . . . . . . . . . . . . . . 68
3.3.2 Creating a Rule Folder. . . . . . . . . . . . . . . . . . . . . . . . . . . . . . . . . . . . . . . . . . . . . . . . 68
3.3.3 Renaming a Rule Folder . . . . . . . . . . . . . . . . . . . . . . . . . . . . . . . . . . . . . . . . . . . . . . 68
3.3.4 Creating a Correlation Rule . . . . . . . . . . . . . . . . . . . . . . . . . . . . . . . . . . . . . . . . . . . . 68
3.3.5 Creating Correlation Rules . . . . . . . . . . . . . . . . . . . . . . . . . . . . . . . . . . . . . . . . . . . . 69
3.3.6 Deploying/Undeploying Correlation Rules . . . . . . . . . . . . . . . . . . . . . . . . . . . . . . . . . 76
3.3.7 Enabling/Disabling Rules. . . . . . . . . . . . . . . . . . . . . . . . . . . . . . . . . . . . . . . . . . . . . . 79
3.3.8 Renaming and Deleting a Correlation Rule . . . . . . . . . . . . . . . . . . . . . . . . . . . . . . . . 80
3.3.9 Moving a Correlation Rule . . . . . . . . . . . . . . . . . . . . . . . . . . . . . . . . . . . . . . . . . . . . . 80
3.3.10 Importing a Correlation Rule . . . . . . . . . . . . . . . . . . . . . . . . . . . . . . . . . . . . . . . . . . . 80
3.3.11 Exporting a Correlation Rule . . . . . . . . . . . . . . . . . . . . . . . . . . . . . . . . . . . . . . . . . . . 81
3.4 Dynamic Lists. . . . . . . . . . . . . . . . . . . . . . . . . . . . . . . . . . . . . . . . . . . . . . . . . . . . . . . . . . . . . . 82
3.4.1 Adding a Dynamic List . . . . . . . . . . . . . . . . . . . . . . . . . . . . . . . . . . . . . . . . . . . . . . . . 83
3.4.2 Modifying a Dynamic List. . . . . . . . . . . . . . . . . . . . . . . . . . . . . . . . . . . . . . . . . . . . . . 84
3.4.3 Deleting a Dynamic List . . . . . . . . . . . . . . . . . . . . . . . . . . . . . . . . . . . . . . . . . . . . . . . 84
3.4.4 Removing Dynamic List Elements . . . . . . . . . . . . . . . . . . . . . . . . . . . . . . . . . . . . . . . 84
3.4.5 Using a Dynamic List in a Correlation Rule . . . . . . . . . . . . . . . . . . . . . . . . . . . . . . . . 84
3.5 Correlation Engine . . . . . . . . . . . . . . . . . . . . . . . . . . . . . . . . . . . . . . . . . . . . . . . . . . . . . . . . . . 85
3.5.1 Starting or Stopping Correlation Engine . . . . . . . . . . . . . . . . . . . . . . . . . . . . . . . . . . 86
3.5.2 Renaming Correlation Engine . . . . . . . . . . . . . . . . . . . . . . . . . . . . . . . . . . . . . . . . . . 86
3.6 Correlation Actions. . . . . . . . . . . . . . . . . . . . . . . . . . . . . . . . . . . . . . . . . . . . . . . . . . . . . . . . . . 86
3.6.1 Configure Correlated Event . . . . . . . . . . . . . . . . . . . . . . . . . . . . . . . . . . . . . . . . . . . . 87
3.6.2 Add to Dynamic List. . . . . . . . . . . . . . . . . . . . . . . . . . . . . . . . . . . . . . . . . . . . . . . . . . 88
3.6.3 Remove from Dynamic List . . . . . . . . . . . . . . . . . . . . . . . . . . . . . . . . . . . . . . . . . . . . 89
3.6.4 Execute a Command . . . . . . . . . . . . . . . . . . . . . . . . . . . . . . . . . . . . . . . . . . . . . . . . . 90
3.6.5 Create Incident . . . . . . . . . . . . . . . . . . . . . . . . . . . . . . . . . . . . . . . . . . . . . . . . . . . . . 91
3.6.6 Send Email . . . . . . . . . . . . . . . . . . . . . . . . . . . . . . . . . . . . . . . . . . . . . . . . . . . . . . . . 92
3.6.7 Imported JavaScript Action Plugins . . . . . . . . . . . . . . . . . . . . . . . . . . . . . . . . . . . . . . 92
novdocx (en) 7 January 2010
4 Incidents Tab 93
4.1 Understanding an Incident . . . . . . . . . . . . . . . . . . . . . . . . . . . . . . . . . . . . . . . . . . . . . . . . . . . . 93
4.2 Introduction to User Interface. . . . . . . . . . . . . . . . . . . . . . . . . . . . . . . . . . . . . . . . . . . . . . . . . . 93
4.2.1 Incident View . . . . . . . . . . . . . . . . . . . . . . . . . . . . . . . . . . . . . . . . . . . . . . . . . . . . . . . 94
4.2.2 Incident . . . . . . . . . . . . . . . . . . . . . . . . . . . . . . . . . . . . . . . . . . . . . . . . . . . . . . . . . . . 94
4.3 Manage Incident Views . . . . . . . . . . . . . . . . . . . . . . . . . . . . . . . . . . . . . . . . . . . . . . . . . . . . . . 95
4.3.1 Adding a View . . . . . . . . . . . . . . . . . . . . . . . . . . . . . . . . . . . . . . . . . . . . . . . . . . . . . . 95
4.3.2 Modifying a View . . . . . . . . . . . . . . . . . . . . . . . . . . . . . . . . . . . . . . . . . . . . . . . . . . . . 98
4.3.3 Deleting a View . . . . . . . . . . . . . . . . . . . . . . . . . . . . . . . . . . . . . . . . . . . . . . . . . . . . . 99
4.3.4 Default View. . . . . . . . . . . . . . . . . . . . . . . . . . . . . . . . . . . . . . . . . . . . . . . . . . . . . . . . 99
4.4 Manage Incidents . . . . . . . . . . . . . . . . . . . . . . . . . . . . . . . . . . . . . . . . . . . . . . . . . . . . . . . . . . . 99
4.4.1 Creating Incidents . . . . . . . . . . . . . . . . . . . . . . . . . . . . . . . . . . . . . . . . . . . . . . . . . . 100
4.4.2 Viewing an Incident . . . . . . . . . . . . . . . . . . . . . . . . . . . . . . . . . . . . . . . . . . . . . . . . . 101
6 Sentinel 6.1 User Guide
Page 7

4.4.3 Attaching Workflows to Incidents. . . . . . . . . . . . . . . . . . . . . . . . . . . . . . . . . . . . . . . 101
4.4.4 Adding Notes to Incidents . . . . . . . . . . . . . . . . . . . . . . . . . . . . . . . . . . . . . . . . . . . . 101
4.4.5 Adding Attachments to Incidents . . . . . . . . . . . . . . . . . . . . . . . . . . . . . . . . . . . . . . . 101
4.4.6 Executing Incident Actions . . . . . . . . . . . . . . . . . . . . . . . . . . . . . . . . . . . . . . . . . . . 102
4.4.7 Emailing an Incident . . . . . . . . . . . . . . . . . . . . . . . . . . . . . . . . . . . . . . . . . . . . . . . . 104
4.4.8 Modifying Incidents . . . . . . . . . . . . . . . . . . . . . . . . . . . . . . . . . . . . . . . . . . . . . . . . . 105
4.4.9 Deleting Incidents . . . . . . . . . . . . . . . . . . . . . . . . . . . . . . . . . . . . . . . . . . . . . . . . . . 106
4.5 Switch between existing Incident Views. . . . . . . . . . . . . . . . . . . . . . . . . . . . . . . . . . . . . . . . . 106
5 iTRAC Workflows 107
5.1 Understanding iTRAC Workflows. . . . . . . . . . . . . . . . . . . . . . . . . . . . . . . . . . . . . . . . . . . . . . 107
5.2 Introduction to the User Interface. . . . . . . . . . . . . . . . . . . . . . . . . . . . . . . . . . . . . . . . . . . . . . 108
5.3 Template Manager . . . . . . . . . . . . . . . . . . . . . . . . . . . . . . . . . . . . . . . . . . . . . . . . . . . . . . . . . 109
5.3.1 Default Templates . . . . . . . . . . . . . . . . . . . . . . . . . . . . . . . . . . . . . . . . . . . . . . . . . . 109
5.4 Template Builder Interface . . . . . . . . . . . . . . . . . . . . . . . . . . . . . . . . . . . . . . . . . . . . . . . . . . . 110
5.4.1 Creating Templates . . . . . . . . . . . . . . . . . . . . . . . . . . . . . . . . . . . . . . . . . . . . . . . . . 112
5.4.2 Managing Templates . . . . . . . . . . . . . . . . . . . . . . . . . . . . . . . . . . . . . . . . . . . . . . . . 113
5.5 Steps . . . . . . . . . . . . . . . . . . . . . . . . . . . . . . . . . . . . . . . . . . . . . . . . . . . . . . . . . . . . . . . . . . . 114
5.5.1 Start Step. . . . . . . . . . . . . . . . . . . . . . . . . . . . . . . . . . . . . . . . . . . . . . . . . . . . . . . . . 114
5.5.2 Manual Steps. . . . . . . . . . . . . . . . . . . . . . . . . . . . . . . . . . . . . . . . . . . . . . . . . . . . . . 114
5.5.3 Decision Steps. . . . . . . . . . . . . . . . . . . . . . . . . . . . . . . . . . . . . . . . . . . . . . . . . . . . . 118
5.5.4 Mail Steps . . . . . . . . . . . . . . . . . . . . . . . . . . . . . . . . . . . . . . . . . . . . . . . . . . . . . . . . 118
5.5.5 Command Steps . . . . . . . . . . . . . . . . . . . . . . . . . . . . . . . . . . . . . . . . . . . . . . . . . . . 118
5.5.6 Activity Steps . . . . . . . . . . . . . . . . . . . . . . . . . . . . . . . . . . . . . . . . . . . . . . . . . . . . . . 119
5.5.7 End Step . . . . . . . . . . . . . . . . . . . . . . . . . . . . . . . . . . . . . . . . . . . . . . . . . . . . . . . . . 120
5.5.8 Adding Steps to a Workflow. . . . . . . . . . . . . . . . . . . . . . . . . . . . . . . . . . . . . . . . . . . 120
5.5.9 Managing Steps. . . . . . . . . . . . . . . . . . . . . . . . . . . . . . . . . . . . . . . . . . . . . . . . . . . . 121
5.6 Transitions . . . . . . . . . . . . . . . . . . . . . . . . . . . . . . . . . . . . . . . . . . . . . . . . . . . . . . . . . . . . . . . 125
5.6.1 Unconditional Transitions . . . . . . . . . . . . . . . . . . . . . . . . . . . . . . . . . . . . . . . . . . . . 125
5.6.2 Conditional Transitions . . . . . . . . . . . . . . . . . . . . . . . . . . . . . . . . . . . . . . . . . . . . . . 126
5.6.3 Else Transitions . . . . . . . . . . . . . . . . . . . . . . . . . . . . . . . . . . . . . . . . . . . . . . . . . . . . 130
5.6.4 Timeout Transitions . . . . . . . . . . . . . . . . . . . . . . . . . . . . . . . . . . . . . . . . . . . . . . . . . 131
5.6.5 Alert Transitions. . . . . . . . . . . . . . . . . . . . . . . . . . . . . . . . . . . . . . . . . . . . . . . . . . . . 131
5.6.6 Error Transition . . . . . . . . . . . . . . . . . . . . . . . . . . . . . . . . . . . . . . . . . . . . . . . . . . . . 132
5.6.7 Managing Transitions . . . . . . . . . . . . . . . . . . . . . . . . . . . . . . . . . . . . . . . . . . . . . . . 132
5.7 Activities . . . . . . . . . . . . . . . . . . . . . . . . . . . . . . . . . . . . . . . . . . . . . . . . . . . . . . . . . . . . . . . . . 133
5.7.1 Incident Command Activity . . . . . . . . . . . . . . . . . . . . . . . . . . . . . . . . . . . . . . . . . . . 134
5.7.2 Incident Internal Activity. . . . . . . . . . . . . . . . . . . . . . . . . . . . . . . . . . . . . . . . . . . . . . 134
5.7.3 Incident Composite Activity . . . . . . . . . . . . . . . . . . . . . . . . . . . . . . . . . . . . . . . . . . . 135
5.7.4 Creating iTRAC Activities . . . . . . . . . . . . . . . . . . . . . . . . . . . . . . . . . . . . . . . . . . . . 135
5.7.5 Managing Activities . . . . . . . . . . . . . . . . . . . . . . . . . . . . . . . . . . . . . . . . . . . . . . . . . 140
5.8 Process Management . . . . . . . . . . . . . . . . . . . . . . . . . . . . . . . . . . . . . . . . . . . . . . . . . . . . . . 142
5.8.1 Instantiating a Process . . . . . . . . . . . . . . . . . . . . . . . . . . . . . . . . . . . . . . . . . . . . . . 142
5.8.2 Automatic Step Execution . . . . . . . . . . . . . . . . . . . . . . . . . . . . . . . . . . . . . . . . . . . . 142
5.8.3 Manual Step Execution . . . . . . . . . . . . . . . . . . . . . . . . . . . . . . . . . . . . . . . . . . . . . . 142
5.8.4 Display Status . . . . . . . . . . . . . . . . . . . . . . . . . . . . . . . . . . . . . . . . . . . . . . . . . . . . . 143
5.8.5 Displaying Status of a Process . . . . . . . . . . . . . . . . . . . . . . . . . . . . . . . . . . . . . . . . 143
5.8.6 Changing Views in Process Manager . . . . . . . . . . . . . . . . . . . . . . . . . . . . . . . . . . . 144
5.8.7 Starting or Terminating a Process . . . . . . . . . . . . . . . . . . . . . . . . . . . . . . . . . . . . . . 145
novdocx (en) 7 January 2010
6 Work Items 147
6.1 Understanding Work Items. . . . . . . . . . . . . . . . . . . . . . . . . . . . . . . . . . . . . . . . . . . . . . . . . . . 147
6.1.1 Work Item Summary . . . . . . . . . . . . . . . . . . . . . . . . . . . . . . . . . . . . . . . . . . . . . . . . 147
6.2 Processing a Work Item . . . . . . . . . . . . . . . . . . . . . . . . . . . . . . . . . . . . . . . . . . . . . . . . . . . . . 150
6.2.1 Accepting a Work Item. . . . . . . . . . . . . . . . . . . . . . . . . . . . . . . . . . . . . . . . . . . . . . . 150
Contents 7
Page 8

6.3 Manage Work Items Of Other Users . . . . . . . . . . . . . . . . . . . . . . . . . . . . . . . . . . . . . . . . . . . 151
7 Analysis Tab 153
7.1 Understanding Analysis . . . . . . . . . . . . . . . . . . . . . . . . . . . . . . . . . . . . . . . . . . . . . . . . . . . . . 153
7.2 Introduction to the User Interface. . . . . . . . . . . . . . . . . . . . . . . . . . . . . . . . . . . . . . . . . . . . . . 153
7.2.1 Top Ten Reports . . . . . . . . . . . . . . . . . . . . . . . . . . . . . . . . . . . . . . . . . . . . . . . . . . . 154
7.2.2 Running a Report from Crystal Reports Server . . . . . . . . . . . . . . . . . . . . . . . . . . . . 156
7.2.3 Running an Event Query Report . . . . . . . . . . . . . . . . . . . . . . . . . . . . . . . . . . . . . . . 156
7.3 Offline Query . . . . . . . . . . . . . . . . . . . . . . . . . . . . . . . . . . . . . . . . . . . . . . . . . . . . . . . . . . . . . 156
7.3.1 Creating an Offline Query . . . . . . . . . . . . . . . . . . . . . . . . . . . . . . . . . . . . . . . . . . . . 157
7.3.2 Viewing, Exporting or Deleting an Offline Query . . . . . . . . . . . . . . . . . . . . . . . . . . . 157
8 Advisor Usage and Maintenance 159
8.1 Understanding Advisor. . . . . . . . . . . . . . . . . . . . . . . . . . . . . . . . . . . . . . . . . . . . . . . . . . . . . . 159
8.2 Understanding Exploit Detection . . . . . . . . . . . . . . . . . . . . . . . . . . . . . . . . . . . . . . . . . . . . . . 160
8.2.1 How Exploit Detection Works . . . . . . . . . . . . . . . . . . . . . . . . . . . . . . . . . . . . . . . . . 160
8.2.2 Generating the Exploit Detection File . . . . . . . . . . . . . . . . . . . . . . . . . . . . . . . . . . . 162
8.2.3 Viewing the Events . . . . . . . . . . . . . . . . . . . . . . . . . . . . . . . . . . . . . . . . . . . . . . . . . 162
8.3 Introduction to the Advisor User Interface . . . . . . . . . . . . . . . . . . . . . . . . . . . . . . . . . . . . . . . 162
8.3.1 The Advisor Window . . . . . . . . . . . . . . . . . . . . . . . . . . . . . . . . . . . . . . . . . . . . . . . . 163
8.3.2 Processing the Advisor Feed. . . . . . . . . . . . . . . . . . . . . . . . . . . . . . . . . . . . . . . . . . 164
8.3.3 Configuring the Advisor Products for Exploit Detection . . . . . . . . . . . . . . . . . . . . . . 165
8.4 Downloading the Advisor Feed . . . . . . . . . . . . . . . . . . . . . . . . . . . . . . . . . . . . . . . . . . . . . . . 166
8.4.1 Configuring the Sentinel Server for Automated Downloads . . . . . . . . . . . . . . . . . . 166
8.4.2 Downloading the Advisor Feed Manually . . . . . . . . . . . . . . . . . . . . . . . . . . . . . . . . 167
8.5 Viewing the Advisor Status . . . . . . . . . . . . . . . . . . . . . . . . . . . . . . . . . . . . . . . . . . . . . . . . . . 167
8.6 Viewing the Advisor Data . . . . . . . . . . . . . . . . . . . . . . . . . . . . . . . . . . . . . . . . . . . . . . . . . . . . 169
8.7 Advisor Reports . . . . . . . . . . . . . . . . . . . . . . . . . . . . . . . . . . . . . . . . . . . . . . . . . . . . . . . . . . . 170
8.7.1 Generating the Advisor Reports . . . . . . . . . . . . . . . . . . . . . . . . . . . . . . . . . . . . . . . 170
8.7.2 Viewing the Advisor Reports . . . . . . . . . . . . . . . . . . . . . . . . . . . . . . . . . . . . . . . . . . 170
8.8 Resetting the Advisor Password . . . . . . . . . . . . . . . . . . . . . . . . . . . . . . . . . . . . . . . . . . . . . . 171
8.9 Deleting the Advisor Data . . . . . . . . . . . . . . . . . . . . . . . . . . . . . . . . . . . . . . . . . . . . . . . . . . . 171
8.10 Advisor Audit Events . . . . . . . . . . . . . . . . . . . . . . . . . . . . . . . . . . . . . . . . . . . . . . . . . . . . . . . 171
novdocx (en) 7 January 2010
9 Download Manager 173
9.1 Understanding the Download Manager User Interface . . . . . . . . . . . . . . . . . . . . . . . . . . . . . 173
9.2 Creating a Download Configuration . . . . . . . . . . . . . . . . . . . . . . . . . . . . . . . . . . . . . . . . . . . 174
9.3 Editing a Download Configuration . . . . . . . . . . . . . . . . . . . . . . . . . . . . . . . . . . . . . . . . . . . . . 176
9.4 Downloading the Feed Instantly . . . . . . . . . . . . . . . . . . . . . . . . . . . . . . . . . . . . . . . . . . . . . . 177
9.5 Deleting a Download Configuration . . . . . . . . . . . . . . . . . . . . . . . . . . . . . . . . . . . . . . . . . . . . 177
9.6 Audit Events for the Download Manager . . . . . . . . . . . . . . . . . . . . . . . . . . . . . . . . . . . . . . . . 177
10 Event Source Management 179
10.1 Understanding Event Source Management . . . . . . . . . . . . . . . . . . . . . . . . . . . . . . . . . . . . . . 179
10.1.1 Plugin Repository. . . . . . . . . . . . . . . . . . . . . . . . . . . . . . . . . . . . . . . . . . . . . . . . . . . 180
10.2 Introduction to the User Interface. . . . . . . . . . . . . . . . . . . . . . . . . . . . . . . . . . . . . . . . . . . . . . 180
10.2.1 Menu Bar . . . . . . . . . . . . . . . . . . . . . . . . . . . . . . . . . . . . . . . . . . . . . . . . . . . . . . . . . 181
10.2.2 Tool Bar . . . . . . . . . . . . . . . . . . . . . . . . . . . . . . . . . . . . . . . . . . . . . . . . . . . . . . . . . . 182
10.2.3 Zoom . . . . . . . . . . . . . . . . . . . . . . . . . . . . . . . . . . . . . . . . . . . . . . . . . . . . . . . . . . . . 182
10.2.4 Frames. . . . . . . . . . . . . . . . . . . . . . . . . . . . . . . . . . . . . . . . . . . . . . . . . . . . . . . . . . . 183
10.3 Live View . . . . . . . . . . . . . . . . . . . . . . . . . . . . . . . . . . . . . . . . . . . . . . . . . . . . . . . . . . . . . . . . 187
8 Sentinel 6.1 User Guide
Page 9

10.3.1 Graphical ESM View . . . . . . . . . . . . . . . . . . . . . . . . . . . . . . . . . . . . . . . . . . . . . . . . 188
10.3.2 Tabular ESM View . . . . . . . . . . . . . . . . . . . . . . . . . . . . . . . . . . . . . . . . . . . . . . . . . . 190
10.3.3 Right-Click Menu . . . . . . . . . . . . . . . . . . . . . . . . . . . . . . . . . . . . . . . . . . . . . . . . . . . 190
10.4 Components of Event Source Hierarchy . . . . . . . . . . . . . . . . . . . . . . . . . . . . . . . . . . . . . . . . 192
10.4.1 Component Status Indicators . . . . . . . . . . . . . . . . . . . . . . . . . . . . . . . . . . . . . . . . . 193
10.4.2 Adding Components to Event Source Hierarchy . . . . . . . . . . . . . . . . . . . . . . . . . . 194
10.4.3 Collectors. . . . . . . . . . . . . . . . . . . . . . . . . . . . . . . . . . . . . . . . . . . . . . . . . . . . . . . . . 194
10.5 Debugging . . . . . . . . . . . . . . . . . . . . . . . . . . . . . . . . . . . . . . . . . . . . . . . . . . . . . . . . . . . . . . . 211
10.5.1 Collector Workspace and Collector Directory . . . . . . . . . . . . . . . . . . . . . . . . . . . . . 212
10.5.2 Debugging Proprietary Collectors . . . . . . . . . . . . . . . . . . . . . . . . . . . . . . . . . . . . . . 212
10.5.3 Debugging JavaScript Collectors. . . . . . . . . . . . . . . . . . . . . . . . . . . . . . . . . . . . . . . 214
10.5.4 Generating a Flat File using the Raw Data Tap. . . . . . . . . . . . . . . . . . . . . . . . . . . . 218
10.6 Export Configuration . . . . . . . . . . . . . . . . . . . . . . . . . . . . . . . . . . . . . . . . . . . . . . . . . . . . . . . 219
10.7 Import Configuration. . . . . . . . . . . . . . . . . . . . . . . . . . . . . . . . . . . . . . . . . . . . . . . . . . . . . . . . 221
10.7.1 Enable/Disable Import Configuration . . . . . . . . . . . . . . . . . . . . . . . . . . . . . . . . . . . . 221
10.7.2 Reset Layout . . . . . . . . . . . . . . . . . . . . . . . . . . . . . . . . . . . . . . . . . . . . . . . . . . . . . . 224
10.7.3 Undo Layout . . . . . . . . . . . . . . . . . . . . . . . . . . . . . . . . . . . . . . . . . . . . . . . . . . . . . . 224
10.7.4 Redo Layout . . . . . . . . . . . . . . . . . . . . . . . . . . . . . . . . . . . . . . . . . . . . . . . . . . . . . . 225
10.8 Event Source Management Scratchpad . . . . . . . . . . . . . . . . . . . . . . . . . . . . . . . . . . . . . . . . 225
10.9 Comparison between Sentinel 5.x and Sentinel 6.0 . . . . . . . . . . . . . . . . . . . . . . . . . . . . . . . 225
novdocx (en) 7 January 2010
11 Administration 227
11.1 Understanding Admin Tab . . . . . . . . . . . . . . . . . . . . . . . . . . . . . . . . . . . . . . . . . . . . . . . . . . . 227
11.2 Introduction to User Interface. . . . . . . . . . . . . . . . . . . . . . . . . . . . . . . . . . . . . . . . . . . . . . . . . 228
11.3 Crystal Report Configuration . . . . . . . . . . . . . . . . . . . . . . . . . . . . . . . . . . . . . . . . . . . . . . . . . 229
11.4 Servers View . . . . . . . . . . . . . . . . . . . . . . . . . . . . . . . . . . . . . . . . . . . . . . . . . . . . . . . . . . . . . 231
11.4.1 Monitoring a Process . . . . . . . . . . . . . . . . . . . . . . . . . . . . . . . . . . . . . . . . . . . . . . . . 232
11.4.2 Creating a Servers View . . . . . . . . . . . . . . . . . . . . . . . . . . . . . . . . . . . . . . . . . . . . . 233
11.4.3 Starting, Stopping and Restarting Processes . . . . . . . . . . . . . . . . . . . . . . . . . . . . . 233
11.5 Filters . . . . . . . . . . . . . . . . . . . . . . . . . . . . . . . . . . . . . . . . . . . . . . . . . . . . . . . . . . . . . . . . . . . 234
11.5.1 Public Filters . . . . . . . . . . . . . . . . . . . . . . . . . . . . . . . . . . . . . . . . . . . . . . . . . . . . . . 234
11.5.2 Private Filters. . . . . . . . . . . . . . . . . . . . . . . . . . . . . . . . . . . . . . . . . . . . . . . . . . . . . . 234
11.5.3 Global Filters . . . . . . . . . . . . . . . . . . . . . . . . . . . . . . . . . . . . . . . . . . . . . . . . . . . . . . 235
11.5.4 Configuring Public and Private Filters . . . . . . . . . . . . . . . . . . . . . . . . . . . . . . . . . . . 237
11.5.5 Color Filter Configuration. . . . . . . . . . . . . . . . . . . . . . . . . . . . . . . . . . . . . . . . . . . . . 240
11.6 Configure Menu Options . . . . . . . . . . . . . . . . . . . . . . . . . . . . . . . . . . . . . . . . . . . . . . . . . . . . 243
11.6.1 Adding an Option to the Event Menu. . . . . . . . . . . . . . . . . . . . . . . . . . . . . . . . . . . . 245
11.6.2 Cloning an Event Menu Option . . . . . . . . . . . . . . . . . . . . . . . . . . . . . . . . . . . . . . . . 246
11.6.3 Modifying an Event Menu Option. . . . . . . . . . . . . . . . . . . . . . . . . . . . . . . . . . . . . . . 247
11.6.4 Viewing Event Menu Option Parameters . . . . . . . . . . . . . . . . . . . . . . . . . . . . . . . . . 247
11.6.5 Activating or Deactivating an Event Menu Option . . . . . . . . . . . . . . . . . . . . . . . . . . 247
11.6.6 Rearranging Event Menu Options . . . . . . . . . . . . . . . . . . . . . . . . . . . . . . . . . . . . . . 248
11.6.7 Deleting an Event Menu Option. . . . . . . . . . . . . . . . . . . . . . . . . . . . . . . . . . . . . . . . 248
11.6.8 Editing Your Event Menu Browser Settings . . . . . . . . . . . . . . . . . . . . . . . . . . . . . . . 248
11.7 DAS Statistics . . . . . . . . . . . . . . . . . . . . . . . . . . . . . . . . . . . . . . . . . . . . . . . . . . . . . . . . . . . . 249
11.8 Mapping . . . . . . . . . . . . . . . . . . . . . . . . . . . . . . . . . . . . . . . . . . . . . . . . . . . . . . . . . . . . . . . . . 251
11.8.1 Adding Map Definitions . . . . . . . . . . . . . . . . . . . . . . . . . . . . . . . . . . . . . . . . . . . . . . 252
11.8.2 Adding a Number Range Map Definition . . . . . . . . . . . . . . . . . . . . . . . . . . . . . . . . . 254
11.8.3 Editing Map Definitions . . . . . . . . . . . . . . . . . . . . . . . . . . . . . . . . . . . . . . . . . . . . . . 257
11.8.4 Deleting Map Definitions . . . . . . . . . . . . . . . . . . . . . . . . . . . . . . . . . . . . . . . . . . . . . 258
11.8.5 Updating Map Data . . . . . . . . . . . . . . . . . . . . . . . . . . . . . . . . . . . . . . . . . . . . . . . . . 259
11.9 Event Configuration . . . . . . . . . . . . . . . . . . . . . . . . . . . . . . . . . . . . . . . . . . . . . . . . . . . . . . . . 261
11.9.1 Event Mapping. . . . . . . . . . . . . . . . . . . . . . . . . . . . . . . . . . . . . . . . . . . . . . . . . . . . . 261
11.9.2 Renaming Tags . . . . . . . . . . . . . . . . . . . . . . . . . . . . . . . . . . . . . . . . . . . . . . . . . . . . 265
11.10 Report Data Configuration . . . . . . . . . . . . . . . . . . . . . . . . . . . . . . . . . . . . . . . . . . . . . . . . . . . 266
Contents 9
Page 10

11.11 User Configurations . . . . . . . . . . . . . . . . . . . . . . . . . . . . . . . . . . . . . . . . . . . . . . . . . . . . . . . . 271
11.11.1 Oracle and Microsoft SQL 2005 Authentication: . . . . . . . . . . . . . . . . . . . . . . . . . . . 271
11.11.2 Windows Authentication: . . . . . . . . . . . . . . . . . . . . . . . . . . . . . . . . . . . . . . . . . . . . . 271
11.11.3 Opening the User Manager Window . . . . . . . . . . . . . . . . . . . . . . . . . . . . . . . . . . . . 272
11.11.4 Creating a User Account . . . . . . . . . . . . . . . . . . . . . . . . . . . . . . . . . . . . . . . . . . . . . 272
11.11.5 Modifying a User Account . . . . . . . . . . . . . . . . . . . . . . . . . . . . . . . . . . . . . . . . . . . . 276
11.11.6 Viewing Details of a User Account. . . . . . . . . . . . . . . . . . . . . . . . . . . . . . . . . . . . . . 277
11.11.7 Cloning a User Account . . . . . . . . . . . . . . . . . . . . . . . . . . . . . . . . . . . . . . . . . . . . . . 277
11.11.8 Deleting a User Account . . . . . . . . . . . . . . . . . . . . . . . . . . . . . . . . . . . . . . . . . . . . . 277
11.11.9 Terminating an Active Session . . . . . . . . . . . . . . . . . . . . . . . . . . . . . . . . . . . . . . . . 277
11.11.10Adding an iTRAC Role. . . . . . . . . . . . . . . . . . . . . . . . . . . . . . . . . . . . . . . . . . . . . . . 278
11.11.11Deleting an iTRAC Role. . . . . . . . . . . . . . . . . . . . . . . . . . . . . . . . . . . . . . . . . . . . . . 278
11.11.12Viewing Details of a Role. . . . . . . . . . . . . . . . . . . . . . . . . . . . . . . . . . . . . . . . . . . . . 279
12 Sentinel Data Manager 281
12.1 Understanding Sentinel Data Manager . . . . . . . . . . . . . . . . . . . . . . . . . . . . . . . . . . . . . . . . . 281
12.2 Starting the SDM GUI . . . . . . . . . . . . . . . . . . . . . . . . . . . . . . . . . . . . . . . . . . . . . . . . . . . . . . 281
12.2.1 Partitions Tab. . . . . . . . . . . . . . . . . . . . . . . . . . . . . . . . . . . . . . . . . . . . . . . . . . . . . . 283
12.2.2 Tablespaces Tab . . . . . . . . . . . . . . . . . . . . . . . . . . . . . . . . . . . . . . . . . . . . . . . . . . . 286
12.2.3 Partition Configuration . . . . . . . . . . . . . . . . . . . . . . . . . . . . . . . . . . . . . . . . . . . . . . . 287
12.3 SDM Command Line . . . . . . . . . . . . . . . . . . . . . . . . . . . . . . . . . . . . . . . . . . . . . . . . . . . . . . . 289
12.3.1 General Syntax of the SDM command . . . . . . . . . . . . . . . . . . . . . . . . . . . . . . . . . . 289
12.3.2 Starting SDM GUI . . . . . . . . . . . . . . . . . . . . . . . . . . . . . . . . . . . . . . . . . . . . . . . . . . 289
12.3.3 Viewing Sentinel Database Space Usage . . . . . . . . . . . . . . . . . . . . . . . . . . . . . . . . 289
novdocx (en) 7 January 2010
13 Utilities 291
13.1 Introduction to Sentinel Utilities . . . . . . . . . . . . . . . . . . . . . . . . . . . . . . . . . . . . . . . . . . . . . . . 291
13.2 Starting and Stopping Sentinel Server . . . . . . . . . . . . . . . . . . . . . . . . . . . . . . . . . . . . . . . . . . 291
13.2.1 Starting a Sentinel Server . . . . . . . . . . . . . . . . . . . . . . . . . . . . . . . . . . . . . . . . . . . . 292
13.2.2 Stopping a Sentinel Server . . . . . . . . . . . . . . . . . . . . . . . . . . . . . . . . . . . . . . . . . . . 292
13.3 Sentinel Scripts . . . . . . . . . . . . . . . . . . . . . . . . . . . . . . . . . . . . . . . . . . . . . . . . . . . . . . . . . . . 292
13.3.1 Operational Scripts . . . . . . . . . . . . . . . . . . . . . . . . . . . . . . . . . . . . . . . . . . . . . . . . . 293
13.3.2 Troubleshooting Scripts . . . . . . . . . . . . . . . . . . . . . . . . . . . . . . . . . . . . . . . . . . . . . . 295
13.4 Version Information . . . . . . . . . . . . . . . . . . . . . . . . . . . . . . . . . . . . . . . . . . . . . . . . . . . . . . . . 298
13.4.1 Executable Version Information. . . . . . . . . . . . . . . . . . . . . . . . . . . . . . . . . . . . . . . . 298
13.4.2 Sentinel .dll and .exe File Version Information . . . . . . . . . . . . . . . . . . . . . . . . . . . . 299
13.4.3 Sentinel .jar Version Information . . . . . . . . . . . . . . . . . . . . . . . . . . . . . . . . . . . . . . . 299
13.5 Database Cleanup . . . . . . . . . . . . . . . . . . . . . . . . . . . . . . . . . . . . . . . . . . . . . . . . . . . . . . . . . 299
13.5.1 Components . . . . . . . . . . . . . . . . . . . . . . . . . . . . . . . . . . . . . . . . . . . . . . . . . . . . . . 300
13.5.2 Prerequisites . . . . . . . . . . . . . . . . . . . . . . . . . . . . . . . . . . . . . . . . . . . . . . . . . . . . . . 301
13.6 Updating Your License Key . . . . . . . . . . . . . . . . . . . . . . . . . . . . . . . . . . . . . . . . . . . . . . . . . . 304
14 Quick Start 307
14.1 Security Analysts . . . . . . . . . . . . . . . . . . . . . . . . . . . . . . . . . . . . . . . . . . . . . . . . . . . . . . . . . . 307
14.1.1 Active Views Tab . . . . . . . . . . . . . . . . . . . . . . . . . . . . . . . . . . . . . . . . . . . . . . . . . . . 307
14.1.2 Exploit Detection . . . . . . . . . . . . . . . . . . . . . . . . . . . . . . . . . . . . . . . . . . . . . . . . . . . 308
14.1.3 Asset Data . . . . . . . . . . . . . . . . . . . . . . . . . . . . . . . . . . . . . . . . . . . . . . . . . . . . . . . . 308
14.1.4 Event Query. . . . . . . . . . . . . . . . . . . . . . . . . . . . . . . . . . . . . . . . . . . . . . . . . . . . . . . 309
14.2 Creating Incidents . . . . . . . . . . . . . . . . . . . . . . . . . . . . . . . . . . . . . . . . . . . . . . . . . . . . . . . . . 310
14.3 iTRAC. . . . . . . . . . . . . . . . . . . . . . . . . . . . . . . . . . . . . . . . . . . . . . . . . . . . . . . . . . . . . . . . . . . 312
14.3.1 Instantiating a Process . . . . . . . . . . . . . . . . . . . . . . . . . . . . . . . . . . . . . . . . . . . . . . 312
14.4 Report Analyst . . . . . . . . . . . . . . . . . . . . . . . . . . . . . . . . . . . . . . . . . . . . . . . . . . . . . . . . . . . . 325
14.4.1 Analysis Tab . . . . . . . . . . . . . . . . . . . . . . . . . . . . . . . . . . . . . . . . . . . . . . . . . . . . . . 325
10 Sentinel 6.1 User Guide
Page 11

14.5 Administrators . . . . . . . . . . . . . . . . . . . . . . . . . . . . . . . . . . . . . . . . . . . . . . . . . . . . . . . . . . . . 326
14.5.1 Simple Correlation . . . . . . . . . . . . . . . . . . . . . . . . . . . . . . . . . . . . . . . . . . . . . . . . . . 326
15 Solution Packs 331
15.1 Solution Packs . . . . . . . . . . . . . . . . . . . . . . . . . . . . . . . . . . . . . . . . . . . . . . . . . . . . . . . . . . . . 331
15.1.1 Components of a Solution Pack . . . . . . . . . . . . . . . . . . . . . . . . . . . . . . . . . . . . . . . 331
15.1.2 Permissions for Using Solution Packs . . . . . . . . . . . . . . . . . . . . . . . . . . . . . . . . . . . 333
15.2 Solution Manager . . . . . . . . . . . . . . . . . . . . . . . . . . . . . . . . . . . . . . . . . . . . . . . . . . . . . . . . . . 334
15.2.1 Solution Manager Interface . . . . . . . . . . . . . . . . . . . . . . . . . . . . . . . . . . . . . . . . . . . 334
15.3 Managing Solution Packs. . . . . . . . . . . . . . . . . . . . . . . . . . . . . . . . . . . . . . . . . . . . . . . . . . . . 336
15.3.1 Importing Solution Packs . . . . . . . . . . . . . . . . . . . . . . . . . . . . . . . . . . . . . . . . . . . . . 336
15.3.2 Opening Solution Packs . . . . . . . . . . . . . . . . . . . . . . . . . . . . . . . . . . . . . . . . . . . . . 338
15.3.3 Installing Content from Solution Packs . . . . . . . . . . . . . . . . . . . . . . . . . . . . . . . . . . 340
15.3.4 Implementing Controls. . . . . . . . . . . . . . . . . . . . . . . . . . . . . . . . . . . . . . . . . . . . . . . 348
15.3.5 Testing Controls. . . . . . . . . . . . . . . . . . . . . . . . . . . . . . . . . . . . . . . . . . . . . . . . . . . . 349
15.3.6 Uninstalling Controls . . . . . . . . . . . . . . . . . . . . . . . . . . . . . . . . . . . . . . . . . . . . . . . . 350
15.3.7 Viewing Solution Pack Status . . . . . . . . . . . . . . . . . . . . . . . . . . . . . . . . . . . . . . . . . 351
15.3.8 Deleting Solution Packs. . . . . . . . . . . . . . . . . . . . . . . . . . . . . . . . . . . . . . . . . . . . . . 353
15.4 Solution Designer . . . . . . . . . . . . . . . . . . . . . . . . . . . . . . . . . . . . . . . . . . . . . . . . . . . . . . . . . . 354
15.4.1 Solution Designer Interface . . . . . . . . . . . . . . . . . . . . . . . . . . . . . . . . . . . . . . . . . . . 354
15.4.2 Connection Modes. . . . . . . . . . . . . . . . . . . . . . . . . . . . . . . . . . . . . . . . . . . . . . . . . . 356
15.4.3 Creating a Solution Pack . . . . . . . . . . . . . . . . . . . . . . . . . . . . . . . . . . . . . . . . . . . . . 357
15.4.4 Managing Content Hierarchy Nodes . . . . . . . . . . . . . . . . . . . . . . . . . . . . . . . . . . . . 357
15.4.5 Adding Content to a Solution Pack . . . . . . . . . . . . . . . . . . . . . . . . . . . . . . . . . . . . . 358
15.4.6 Documenting a Solution Pack . . . . . . . . . . . . . . . . . . . . . . . . . . . . . . . . . . . . . . . . . 362
15.4.7 Editing a Solution Pack . . . . . . . . . . . . . . . . . . . . . . . . . . . . . . . . . . . . . . . . . . . . . . 363
15.5 Deploying an Edited Solution Pack . . . . . . . . . . . . . . . . . . . . . . . . . . . . . . . . . . . . . . . . . . . . 364
novdocx (en) 7 January 2010
16 Actions and Integrator 365
16.1 Overview . . . . . . . . . . . . . . . . . . . . . . . . . . . . . . . . . . . . . . . . . . . . . . . . . . . . . . . . . . . . . . . . 365
16.2 Action Manager . . . . . . . . . . . . . . . . . . . . . . . . . . . . . . . . . . . . . . . . . . . . . . . . . . . . . . . . . . . 366
16.2.1 Permissions for Using Action Plugins . . . . . . . . . . . . . . . . . . . . . . . . . . . . . . . . . . . 366
16.3 Action Plugins . . . . . . . . . . . . . . . . . . . . . . . . . . . . . . . . . . . . . . . . . . . . . . . . . . . . . . . . . . . . 367
16.3.1 Importing JavaScript Action Plugins . . . . . . . . . . . . . . . . . . . . . . . . . . . . . . . . . . . . 367
16.3.2 Importing JavaScript Files . . . . . . . . . . . . . . . . . . . . . . . . . . . . . . . . . . . . . . . . . . . . 370
16.4 Actions . . . . . . . . . . . . . . . . . . . . . . . . . . . . . . . . . . . . . . . . . . . . . . . . . . . . . . . . . . . . . . . . . . 379
16.4.1 Creating Actions . . . . . . . . . . . . . . . . . . . . . . . . . . . . . . . . . . . . . . . . . . . . . . . . . . . 379
16.4.2 Editing Actions . . . . . . . . . . . . . . . . . . . . . . . . . . . . . . . . . . . . . . . . . . . . . . . . . . . . . 380
16.4.3 Deleting Actions. . . . . . . . . . . . . . . . . . . . . . . . . . . . . . . . . . . . . . . . . . . . . . . . . . . . 380
16.4.4 Using JavaScript Actions . . . . . . . . . . . . . . . . . . . . . . . . . . . . . . . . . . . . . . . . . . . . . 381
16.4.5 Developing JavaScript Actions . . . . . . . . . . . . . . . . . . . . . . . . . . . . . . . . . . . . . . . . 381
16.5 Integrator Manager. . . . . . . . . . . . . . . . . . . . . . . . . . . . . . . . . . . . . . . . . . . . . . . . . . . . . . . . . 385
16.5.1 Permissions for Using Integrators . . . . . . . . . . . . . . . . . . . . . . . . . . . . . . . . . . . . . . 386
16.6 Integrator Plugins . . . . . . . . . . . . . . . . . . . . . . . . . . . . . . . . . . . . . . . . . . . . . . . . . . . . . . . . . . 387
16.6.1 Importing Integrator Plugins. . . . . . . . . . . . . . . . . . . . . . . . . . . . . . . . . . . . . . . . . . . 387
16.6.2 Deleting Integrator Plugins . . . . . . . . . . . . . . . . . . . . . . . . . . . . . . . . . . . . . . . . . . . 388
16.7 Integrators . . . . . . . . . . . . . . . . . . . . . . . . . . . . . . . . . . . . . . . . . . . . . . . . . . . . . . . . . . . . . . . 388
16.7.1 Creating an Integrator Instance . . . . . . . . . . . . . . . . . . . . . . . . . . . . . . . . . . . . . . . . 388
16.7.2 Editing an Integrator Instance . . . . . . . . . . . . . . . . . . . . . . . . . . . . . . . . . . . . . . . . . 388
16.7.3 Deleting an Integrator Instance . . . . . . . . . . . . . . . . . . . . . . . . . . . . . . . . . . . . . . . . 389
16.7.4 Integrator Connection Status . . . . . . . . . . . . . . . . . . . . . . . . . . . . . . . . . . . . . . . . . . 389
16.7.5 Viewing Integrator Health Details . . . . . . . . . . . . . . . . . . . . . . . . . . . . . . . . . . . . . . 389
16.7.6 Integrator Events Query. . . . . . . . . . . . . . . . . . . . . . . . . . . . . . . . . . . . . . . . . . . . . . 391
16.7.7 Using Integrators from Actions . . . . . . . . . . . . . . . . . . . . . . . . . . . . . . . . . . . . . . . . 392
Contents 11
Page 12

17 Sentinel Link Solution 393
17.1 Benefits . . . . . . . . . . . . . . . . . . . . . . . . . . . . . . . . . . . . . . . . . . . . . . . . . . . . . . . . . . . . . . . . . 393
17.2 Supported Platforms . . . . . . . . . . . . . . . . . . . . . . . . . . . . . . . . . . . . . . . . . . . . . . . . . . . . . . . 393
17.3 Prerequisite . . . . . . . . . . . . . . . . . . . . . . . . . . . . . . . . . . . . . . . . . . . . . . . . . . . . . . . . . . . . . . 393
17.4 Configuring Sentinel Link . . . . . . . . . . . . . . . . . . . . . . . . . . . . . . . . . . . . . . . . . . . . . . . . . . . . 394
17.5 Configuring Sentinel Systems for Receiving Events . . . . . . . . . . . . . . . . . . . . . . . . . . . . . . . 394
17.5.1 Accessing Event Source Management . . . . . . . . . . . . . . . . . . . . . . . . . . . . . . . . . . 394
17.5.2 Setting Up a Sentinel Link Connection . . . . . . . . . . . . . . . . . . . . . . . . . . . . . . . . . . 395
17.6 Configuring Sentinel Systems for Sending Events. . . . . . . . . . . . . . . . . . . . . . . . . . . . . . . . . 411
17.6.1 Configuring Sentinel Log Manager as a Sender . . . . . . . . . . . . . . . . . . . . . . . . . . . 411
17.6.2 Configuring Sentinel or Sentinel Rapid Deployment System as a Sender . . . . . . . 416
17.7 Verifying a Sentinel Link. . . . . . . . . . . . . . . . . . . . . . . . . . . . . . . . . . . . . . . . . . . . . . . . . . . . . 428
18 Identity Integration 431
18.1 Overview . . . . . . . . . . . . . . . . . . . . . . . . . . . . . . . . . . . . . . . . . . . . . . . . . . . . . . . . . . . . . . . . 431
18.1.1 Integration with Novell Identity Manager . . . . . . . . . . . . . . . . . . . . . . . . . . . . . . . . . 432
18.2 Identity Browser . . . . . . . . . . . . . . . . . . . . . . . . . . . . . . . . . . . . . . . . . . . . . . . . . . . . . . . . . . . 434
18.2.1 Searching Profiles . . . . . . . . . . . . . . . . . . . . . . . . . . . . . . . . . . . . . . . . . . . . . . . . . . 435
18.2.2 Viewing Profile Details . . . . . . . . . . . . . . . . . . . . . . . . . . . . . . . . . . . . . . . . . . . . . . . 436
18.3 Reports. . . . . . . . . . . . . . . . . . . . . . . . . . . . . . . . . . . . . . . . . . . . . . . . . . . . . . . . . . . . . . . . . . 439
novdocx (en) 7 January 2010
A Sentinel Architecture 441
A.1 Sentinel Features . . . . . . . . . . . . . . . . . . . . . . . . . . . . . . . . . . . . . . . . . . . . . . . . . . . . . . . . . . 441
A.2 Functional Architecture . . . . . . . . . . . . . . . . . . . . . . . . . . . . . . . . . . . . . . . . . . . . . . . . . . . . . 441
A.3 Architecture Overview . . . . . . . . . . . . . . . . . . . . . . . . . . . . . . . . . . . . . . . . . . . . . . . . . . . . . . 442
A.3.1 iSCALE Platform . . . . . . . . . . . . . . . . . . . . . . . . . . . . . . . . . . . . . . . . . . . . . . . . . . . 442
A.3.2 Sentinel Event . . . . . . . . . . . . . . . . . . . . . . . . . . . . . . . . . . . . . . . . . . . . . . . . . . . . . 444
A.3.3 Event Source Management . . . . . . . . . . . . . . . . . . . . . . . . . . . . . . . . . . . . . . . . . . . 447
A.3.4 Application Integration . . . . . . . . . . . . . . . . . . . . . . . . . . . . . . . . . . . . . . . . . . . . . . . 448
A.3.5 Time . . . . . . . . . . . . . . . . . . . . . . . . . . . . . . . . . . . . . . . . . . . . . . . . . . . . . . . . . . . . . 448
A.3.6 System Events . . . . . . . . . . . . . . . . . . . . . . . . . . . . . . . . . . . . . . . . . . . . . . . . . . . . . 449
A.3.7 Processes . . . . . . . . . . . . . . . . . . . . . . . . . . . . . . . . . . . . . . . . . . . . . . . . . . . . . . . . 450
A.4 Logical Architecture . . . . . . . . . . . . . . . . . . . . . . . . . . . . . . . . . . . . . . . . . . . . . . . . . . . . . . . . 452
A.4.1 Collection and Enrichment Layer . . . . . . . . . . . . . . . . . . . . . . . . . . . . . . . . . . . . . . . 453
A.4.2 Business Logic Layer. . . . . . . . . . . . . . . . . . . . . . . . . . . . . . . . . . . . . . . . . . . . . . . . 456
A.4.3 Presentation Layer. . . . . . . . . . . . . . . . . . . . . . . . . . . . . . . . . . . . . . . . . . . . . . . . . . 464
B System Events for Sentinel 467
B.1 Advisor Audit Events . . . . . . . . . . . . . . . . . . . . . . . . . . . . . . . . . . . . . . . . . . . . . . . . . . . . . . . 467
B.1.1 Advisor Update Successful . . . . . . . . . . . . . . . . . . . . . . . . . . . . . . . . . . . . . . . . . . . 467
B.1.2 Advisor Update Failure . . . . . . . . . . . . . . . . . . . . . . . . . . . . . . . . . . . . . . . . . . . . . . 467
B.2 Download Manager Audit Events . . . . . . . . . . . . . . . . . . . . . . . . . . . . . . . . . . . . . . . . . . . . . . 468
B.2.1 Download Successful . . . . . . . . . . . . . . . . . . . . . . . . . . . . . . . . . . . . . . . . . . . . . . . 468
B.2.2 Download Failed . . . . . . . . . . . . . . . . . . . . . . . . . . . . . . . . . . . . . . . . . . . . . . . . . . . 468
B.2.3 Download Config Updated . . . . . . . . . . . . . . . . . . . . . . . . . . . . . . . . . . . . . . . . . . . . 469
B.2.4 Download Config Added . . . . . . . . . . . . . . . . . . . . . . . . . . . . . . . . . . . . . . . . . . . . . 469
B.2.5 Download Config Removed . . . . . . . . . . . . . . . . . . . . . . . . . . . . . . . . . . . . . . . . . . . 469
B.3 Authentication Events . . . . . . . . . . . . . . . . . . . . . . . . . . . . . . . . . . . . . . . . . . . . . . . . . . . . . . 469
B.3.1 Authentication . . . . . . . . . . . . . . . . . . . . . . . . . . . . . . . . . . . . . . . . . . . . . . . . . . . . . 469
B.3.2 Creating Entry For External User. . . . . . . . . . . . . . . . . . . . . . . . . . . . . . . . . . . . . . . 470
B.3.3 Duplicate User Objects . . . . . . . . . . . . . . . . . . . . . . . . . . . . . . . . . . . . . . . . . . . . . . 470
B.3.4 Failed Authentication . . . . . . . . . . . . . . . . . . . . . . . . . . . . . . . . . . . . . . . . . . . . . . . . 470
12 Sentinel 6.1 User Guide
Page 13

B.3.5 Locked Account . . . . . . . . . . . . . . . . . . . . . . . . . . . . . . . . . . . . . . . . . . . . . . . . . . . . 471
B.3.6 No Such User Event . . . . . . . . . . . . . . . . . . . . . . . . . . . . . . . . . . . . . . . . . . . . . . . . 471
B.3.7 Too Many Active Users . . . . . . . . . . . . . . . . . . . . . . . . . . . . . . . . . . . . . . . . . . . . . . 472
B.3.8 User Discovered . . . . . . . . . . . . . . . . . . . . . . . . . . . . . . . . . . . . . . . . . . . . . . . . . . . 472
B.3.9 User Logged In . . . . . . . . . . . . . . . . . . . . . . . . . . . . . . . . . . . . . . . . . . . . . . . . . . . . 472
B.3.10 User Logged Out . . . . . . . . . . . . . . . . . . . . . . . . . . . . . . . . . . . . . . . . . . . . . . . . . . . 473
B.4 User Management . . . . . . . . . . . . . . . . . . . . . . . . . . . . . . . . . . . . . . . . . . . . . . . . . . . . . . . . . 473
B.4.1 Add Users To Role . . . . . . . . . . . . . . . . . . . . . . . . . . . . . . . . . . . . . . . . . . . . . . . . . 473
B.4.2 Create Role . . . . . . . . . . . . . . . . . . . . . . . . . . . . . . . . . . . . . . . . . . . . . . . . . . . . . . . 474
B.4.3 Create User . . . . . . . . . . . . . . . . . . . . . . . . . . . . . . . . . . . . . . . . . . . . . . . . . . . . . . . 474
B.4.4 Creating User Account. . . . . . . . . . . . . . . . . . . . . . . . . . . . . . . . . . . . . . . . . . . . . . . 474
B.4.5 Delete Role . . . . . . . . . . . . . . . . . . . . . . . . . . . . . . . . . . . . . . . . . . . . . . . . . . . . . . . 475
B.4.6 Deleting User Account . . . . . . . . . . . . . . . . . . . . . . . . . . . . . . . . . . . . . . . . . . . . . . . 475
B.4.7 Locking User Account . . . . . . . . . . . . . . . . . . . . . . . . . . . . . . . . . . . . . . . . . . . . . . . 475
B.4.8 Remove Users From Role . . . . . . . . . . . . . . . . . . . . . . . . . . . . . . . . . . . . . . . . . . . . 476
B.4.9 Resetting Password . . . . . . . . . . . . . . . . . . . . . . . . . . . . . . . . . . . . . . . . . . . . . . . . . 476
B.4.10 Unlocking User Account . . . . . . . . . . . . . . . . . . . . . . . . . . . . . . . . . . . . . . . . . . . . . 476
B.4.11 Updating User . . . . . . . . . . . . . . . . . . . . . . . . . . . . . . . . . . . . . . . . . . . . . . . . . . . . . 477
B.5 Database Event Management . . . . . . . . . . . . . . . . . . . . . . . . . . . . . . . . . . . . . . . . . . . . . . . . 477
B.5.1 Database Space Reached Specified Percent Threshold. . . . . . . . . . . . . . . . . . . . . 477
B.5.2 Database Space Reached Specified Time Threshold . . . . . . . . . . . . . . . . . . . . . . . 477
B.5.3 Database Space Very Low . . . . . . . . . . . . . . . . . . . . . . . . . . . . . . . . . . . . . . . . . . . 478
B.5.4 Error inserting events. . . . . . . . . . . . . . . . . . . . . . . . . . . . . . . . . . . . . . . . . . . . . . . . 478
B.5.5 Error Moving Completed File . . . . . . . . . . . . . . . . . . . . . . . . . . . . . . . . . . . . . . . . . . 478
B.5.6 Error Processing Event Message . . . . . . . . . . . . . . . . . . . . . . . . . . . . . . . . . . . . . . 479
B.5.7 Error Saving Failed Events . . . . . . . . . . . . . . . . . . . . . . . . . . . . . . . . . . . . . . . . . . . 479
B.5.8 Event Insertion is blocked . . . . . . . . . . . . . . . . . . . . . . . . . . . . . . . . . . . . . . . . . . . . 479
B.5.9 Event Insertion is resumed . . . . . . . . . . . . . . . . . . . . . . . . . . . . . . . . . . . . . . . . . . . 480
B.5.10 Event Message Queue Overflow . . . . . . . . . . . . . . . . . . . . . . . . . . . . . . . . . . . . . . 480
B.5.11 Event Processing Failed . . . . . . . . . . . . . . . . . . . . . . . . . . . . . . . . . . . . . . . . . . . . . 481
B.5.12 No Space In The Database . . . . . . . . . . . . . . . . . . . . . . . . . . . . . . . . . . . . . . . . . . . 481
B.5.13 Opening Archive File failed . . . . . . . . . . . . . . . . . . . . . . . . . . . . . . . . . . . . . . . . . . . 481
B.5.14 Partition Configuration . . . . . . . . . . . . . . . . . . . . . . . . . . . . . . . . . . . . . . . . . . . . . . . 482
B.5.15 Writing to Archive File failed . . . . . . . . . . . . . . . . . . . . . . . . . . . . . . . . . . . . . . . . . . 482
B.5.16 Writing to the overflow partition (P_MAX) . . . . . . . . . . . . . . . . . . . . . . . . . . . . . . . . 482
B.6 Database Aggregation . . . . . . . . . . . . . . . . . . . . . . . . . . . . . . . . . . . . . . . . . . . . . . . . . . . . . . 483
B.6.1 Creating Summary . . . . . . . . . . . . . . . . . . . . . . . . . . . . . . . . . . . . . . . . . . . . . . . . . . 483
B.6.2 Deleting Summary . . . . . . . . . . . . . . . . . . . . . . . . . . . . . . . . . . . . . . . . . . . . . . . . . . 483
B.6.3 Disabling Summary . . . . . . . . . . . . . . . . . . . . . . . . . . . . . . . . . . . . . . . . . . . . . . . . . 483
B.6.4 Enabling Summary . . . . . . . . . . . . . . . . . . . . . . . . . . . . . . . . . . . . . . . . . . . . . . . . . 484
B.6.5 Error inserting summary data into the database . . . . . . . . . . . . . . . . . . . . . . . . . . . 484
B.6.6 Saving Summary . . . . . . . . . . . . . . . . . . . . . . . . . . . . . . . . . . . . . . . . . . . . . . . . . . . 484
B.7 Mapping Service . . . . . . . . . . . . . . . . . . . . . . . . . . . . . . . . . . . . . . . . . . . . . . . . . . . . . . . . . . 484
B.7.1 Error . . . . . . . . . . . . . . . . . . . . . . . . . . . . . . . . . . . . . . . . . . . . . . . . . . . . . . . . . . . . . 485
B.7.2 Error Applying Incremental Update . . . . . . . . . . . . . . . . . . . . . . . . . . . . . . . . . . . . . 485
B.7.3 Error initializing map with ID . . . . . . . . . . . . . . . . . . . . . . . . . . . . . . . . . . . . . . . . . . 485
B.7.4 Error Refreshing Map . . . . . . . . . . . . . . . . . . . . . . . . . . . . . . . . . . . . . . . . . . . . . . . 486
B.7.5 Error Saving Data File . . . . . . . . . . . . . . . . . . . . . . . . . . . . . . . . . . . . . . . . . . . . . . . 486
B.7.6 Get File Size . . . . . . . . . . . . . . . . . . . . . . . . . . . . . . . . . . . . . . . . . . . . . . . . . . . . . . 486
B.7.7 Loaded Large Map. . . . . . . . . . . . . . . . . . . . . . . . . . . . . . . . . . . . . . . . . . . . . . . . . . 487
B.7.8 Long Time To Load Map . . . . . . . . . . . . . . . . . . . . . . . . . . . . . . . . . . . . . . . . . . . . . 487
B.7.9 Out Of Sync Detected . . . . . . . . . . . . . . . . . . . . . . . . . . . . . . . . . . . . . . . . . . . . . . . 487
B.7.10 Refreshing Map from Cache . . . . . . . . . . . . . . . . . . . . . . . . . . . . . . . . . . . . . . . . . . 488
B.7.11 Refreshing Map from Server . . . . . . . . . . . . . . . . . . . . . . . . . . . . . . . . . . . . . . . . . . 488
B.7.12 Save Data File . . . . . . . . . . . . . . . . . . . . . . . . . . . . . . . . . . . . . . . . . . . . . . . . . . . . . 489
B.7.13 Saved Data File . . . . . . . . . . . . . . . . . . . . . . . . . . . . . . . . . . . . . . . . . . . . . . . . . . . . 489
B.7.14 Timed Out Waiting For Callback . . . . . . . . . . . . . . . . . . . . . . . . . . . . . . . . . . . . . . . 489
B.7.15 Timeout Refreshing Map . . . . . . . . . . . . . . . . . . . . . . . . . . . . . . . . . . . . . . . . . . . . . 490
novdocx (en) 7 January 2010
Contents 13
Page 14

B.7.16 Update . . . . . . . . . . . . . . . . . . . . . . . . . . . . . . . . . . . . . . . . . . . . . . . . . . . . . . . . . . . 490
B.7.17 Update . . . . . . . . . . . . . . . . . . . . . . . . . . . . . . . . . . . . . . . . . . . . . . . . . . . . . . . . . . . 491
B.8 Event Router . . . . . . . . . . . . . . . . . . . . . . . . . . . . . . . . . . . . . . . . . . . . . . . . . . . . . . . . . . . . . 491
B.8.1 Event Router is Initializing . . . . . . . . . . . . . . . . . . . . . . . . . . . . . . . . . . . . . . . . . . . . 491
B.8.2 Event Router is Running . . . . . . . . . . . . . . . . . . . . . . . . . . . . . . . . . . . . . . . . . . . . . 491
B.8.3 Event Router is Stopping . . . . . . . . . . . . . . . . . . . . . . . . . . . . . . . . . . . . . . . . . . . . . 492
B.8.4 Event Router is Terminating . . . . . . . . . . . . . . . . . . . . . . . . . . . . . . . . . . . . . . . . . . 492
B.9 Correlation Engine . . . . . . . . . . . . . . . . . . . . . . . . . . . . . . . . . . . . . . . . . . . . . . . . . . . . . . . . . 492
B.9.1 Correlation Action Definition . . . . . . . . . . . . . . . . . . . . . . . . . . . . . . . . . . . . . . . . . . 493
B.9.2 Correlation Engine Configuration. . . . . . . . . . . . . . . . . . . . . . . . . . . . . . . . . . . . . . . 493
B.9.3 Correlation Engine is Running . . . . . . . . . . . . . . . . . . . . . . . . . . . . . . . . . . . . . . . . . 493
B.9.4 Correlation Engine is Stopped . . . . . . . . . . . . . . . . . . . . . . . . . . . . . . . . . . . . . . . . . 494
B.9.5 Correlation Rule . . . . . . . . . . . . . . . . . . . . . . . . . . . . . . . . . . . . . . . . . . . . . . . . . . . . 494
B.9.6 Correlation Rule Configuration . . . . . . . . . . . . . . . . . . . . . . . . . . . . . . . . . . . . . . . . 494
B.9.7 Deploy Rules With Actions To Engine . . . . . . . . . . . . . . . . . . . . . . . . . . . . . . . . . . . 495
B.9.8 Disabling Rule . . . . . . . . . . . . . . . . . . . . . . . . . . . . . . . . . . . . . . . . . . . . . . . . . . . . . 495
B.9.9 Enabling Rule . . . . . . . . . . . . . . . . . . . . . . . . . . . . . . . . . . . . . . . . . . . . . . . . . . . . . 495
B.9.10 Rename Correlation Engine . . . . . . . . . . . . . . . . . . . . . . . . . . . . . . . . . . . . . . . . . . 496
B.9.11 Rule Deployment is Modified. . . . . . . . . . . . . . . . . . . . . . . . . . . . . . . . . . . . . . . . . . 496
B.9.12 Rule Deployment is Started . . . . . . . . . . . . . . . . . . . . . . . . . . . . . . . . . . . . . . . . . . . 496
B.9.13 Rule Deployment is Stopped . . . . . . . . . . . . . . . . . . . . . . . . . . . . . . . . . . . . . . . . . . 497
B.9.14 Starting Engine . . . . . . . . . . . . . . . . . . . . . . . . . . . . . . . . . . . . . . . . . . . . . . . . . . . . 497
B.9.15 Stopping Engine . . . . . . . . . . . . . . . . . . . . . . . . . . . . . . . . . . . . . . . . . . . . . . . . . . . 497
B.9.16 UnDeploy All Rules From Engine . . . . . . . . . . . . . . . . . . . . . . . . . . . . . . . . . . . . . . 498
B.9.17 UnDeploy Rule. . . . . . . . . . . . . . . . . . . . . . . . . . . . . . . . . . . . . . . . . . . . . . . . . . . . . 498
B.9.18 Update Correlation Rule Actions . . . . . . . . . . . . . . . . . . . . . . . . . . . . . . . . . . . . . . . 498
B.10 Event Source Management-General . . . . . . . . . . . . . . . . . . . . . . . . . . . . . . . . . . . . . . . . . . . 498
B.10.1 Collector Manager Initialized . . . . . . . . . . . . . . . . . . . . . . . . . . . . . . . . . . . . . . . . . . 499
B.10.2 Collector Manager Is Down . . . . . . . . . . . . . . . . . . . . . . . . . . . . . . . . . . . . . . . . . . . 499
B.10.3 Collector Manager Started. . . . . . . . . . . . . . . . . . . . . . . . . . . . . . . . . . . . . . . . . . . . 499
B.10.4 Collector Manager Stopped . . . . . . . . . . . . . . . . . . . . . . . . . . . . . . . . . . . . . . . . . . . 500
B.10.5 Collector Service Callback. . . . . . . . . . . . . . . . . . . . . . . . . . . . . . . . . . . . . . . . . . . . 500
B.10.6 Cyclical Dependency . . . . . . . . . . . . . . . . . . . . . . . . . . . . . . . . . . . . . . . . . . . . . . . . 500
B.10.7 Event Source Manager Callback . . . . . . . . . . . . . . . . . . . . . . . . . . . . . . . . . . . . . . . 501
B.10.8 Initializing Collector Manager. . . . . . . . . . . . . . . . . . . . . . . . . . . . . . . . . . . . . . . . . . 501
B.10.9 Lost Contact With Collector Manager . . . . . . . . . . . . . . . . . . . . . . . . . . . . . . . . . . . 501
B.10.10 No Data Alert . . . . . . . . . . . . . . . . . . . . . . . . . . . . . . . . . . . . . . . . . . . . . . . . . . . . . . 502
B.10.11 Persistent Process Died . . . . . . . . . . . . . . . . . . . . . . . . . . . . . . . . . . . . . . . . . . . . . 502
B.10.12 Persistent Process Restarted . . . . . . . . . . . . . . . . . . . . . . . . . . . . . . . . . . . . . . . . . 502
B.10.13 Port Start . . . . . . . . . . . . . . . . . . . . . . . . . . . . . . . . . . . . . . . . . . . . . . . . . . . . . . . . . 503
B.10.14 Port Stop . . . . . . . . . . . . . . . . . . . . . . . . . . . . . . . . . . . . . . . . . . . . . . . . . . . . . . . . . 503
B.10.15 Reestablished Contact With Collector Manager . . . . . . . . . . . . . . . . . . . . . . . . . . . 503
B.10.16 Restart Plugin Deployments . . . . . . . . . . . . . . . . . . . . . . . . . . . . . . . . . . . . . . . . . . 504
B.10.17 Restarting Collector Manager (Cold Restart). . . . . . . . . . . . . . . . . . . . . . . . . . . . . . 504
B.10.18 Restarting Collector Manager (Warm Restart). . . . . . . . . . . . . . . . . . . . . . . . . . . . . 504
B.10.19 Start Event Source Group . . . . . . . . . . . . . . . . . . . . . . . . . . . . . . . . . . . . . . . . . . . . 505
B.10.20 Start Event Source Manager . . . . . . . . . . . . . . . . . . . . . . . . . . . . . . . . . . . . . . . . . . 505
B.10.21 Starting Collector Manager . . . . . . . . . . . . . . . . . . . . . . . . . . . . . . . . . . . . . . . . . . . 505
B.10.22 Stop Event Source Group . . . . . . . . . . . . . . . . . . . . . . . . . . . . . . . . . . . . . . . . . . . . 506
B.10.23 Stop Event Source Manager . . . . . . . . . . . . . . . . . . . . . . . . . . . . . . . . . . . . . . . . . . 506
B.10.24 Stopping Collector Manager . . . . . . . . . . . . . . . . . . . . . . . . . . . . . . . . . . . . . . . . . . 506
B.11 Event Source Management-Event Sources . . . . . . . . . . . . . . . . . . . . . . . . . . . . . . . . . . . . . . 506
B.11.1 Start Event Source. . . . . . . . . . . . . . . . . . . . . . . . . . . . . . . . . . . . . . . . . . . . . . . . . . 507
B.11.2 Stop Event Source. . . . . . . . . . . . . . . . . . . . . . . . . . . . . . . . . . . . . . . . . . . . . . . . . . 507
B.12 Event Source Management-Collectors . . . . . . . . . . . . . . . . . . . . . . . . . . . . . . . . . . . . . . . . . 507
B.12.1 Start Collector . . . . . . . . . . . . . . . . . . . . . . . . . . . . . . . . . . . . . . . . . . . . . . . . . . . . . 507
B.12.2 Stop Collector . . . . . . . . . . . . . . . . . . . . . . . . . . . . . . . . . . . . . . . . . . . . . . . . . . . . . 508
B.13 Event Source Management-Event Source Servers . . . . . . . . . . . . . . . . . . . . . . . . . . . . . . . . 508
novdocx (en) 7 January 2010
14 Sentinel 6.1 User Guide
Page 15

B.13.1 Start Event Source Server . . . . . . . . . . . . . . . . . . . . . . . . . . . . . . . . . . . . . . . . . . . . 508
B.13.2 Stop Event Source Server . . . . . . . . . . . . . . . . . . . . . . . . . . . . . . . . . . . . . . . . . . . . 508
B.13.3 Stop Event Source Server . . . . . . . . . . . . . . . . . . . . . . . . . . . . . . . . . . . . . . . . . . . . 509
B.14 Event Source Management-Connectors . . . . . . . . . . . . . . . . . . . . . . . . . . . . . . . . . . . . . . . . 509
B.14.1 Data Received After Timeout. . . . . . . . . . . . . . . . . . . . . . . . . . . . . . . . . . . . . . . . . . 509
B.14.2 Data Timeout . . . . . . . . . . . . . . . . . . . . . . . . . . . . . . . . . . . . . . . . . . . . . . . . . . . . . . 509
B.14.3 File Rotation. . . . . . . . . . . . . . . . . . . . . . . . . . . . . . . . . . . . . . . . . . . . . . . . . . . . . . . 510
B.14.4 Process Auto Restart Error . . . . . . . . . . . . . . . . . . . . . . . . . . . . . . . . . . . . . . . . . . . 510
B.14.5 Process Start Error . . . . . . . . . . . . . . . . . . . . . . . . . . . . . . . . . . . . . . . . . . . . . . . . . 511
B.14.6 Process Stop . . . . . . . . . . . . . . . . . . . . . . . . . . . . . . . . . . . . . . . . . . . . . . . . . . . . . . 511
B.14.7 WMI Connector Status Message. . . . . . . . . . . . . . . . . . . . . . . . . . . . . . . . . . . . . . . 511
B.15 Active Views. . . . . . . . . . . . . . . . . . . . . . . . . . . . . . . . . . . . . . . . . . . . . . . . . . . . . . . . . . . . . . 511
B.15.1 Active View Created . . . . . . . . . . . . . . . . . . . . . . . . . . . . . . . . . . . . . . . . . . . . . . . . 512
B.15.2 Active View Joined. . . . . . . . . . . . . . . . . . . . . . . . . . . . . . . . . . . . . . . . . . . . . . . . . . 512
B.15.3 Active View No Longer Permanent . . . . . . . . . . . . . . . . . . . . . . . . . . . . . . . . . . . . . 512
B.15.4 Active View Now Permanent . . . . . . . . . . . . . . . . . . . . . . . . . . . . . . . . . . . . . . . . . . 513
B.15.5 Idle Active View Removed . . . . . . . . . . . . . . . . . . . . . . . . . . . . . . . . . . . . . . . . . . . . 513
B.15.6 Idle Permanent Active View Removed . . . . . . . . . . . . . . . . . . . . . . . . . . . . . . . . . . 513
B.16 Data Objects . . . . . . . . . . . . . . . . . . . . . . . . . . . . . . . . . . . . . . . . . . . . . . . . . . . . . . . . . . . . . 514
B.16.1 Activity Definition . . . . . . . . . . . . . . . . . . . . . . . . . . . . . . . . . . . . . . . . . . . . . . . . . . . 514
B.16.2 Configuration . . . . . . . . . . . . . . . . . . . . . . . . . . . . . . . . . . . . . . . . . . . . . . . . . . . . . . 514
B.16.3 Viewing Configuration Store . . . . . . . . . . . . . . . . . . . . . . . . . . . . . . . . . . . . . . . . . . 515
B.16.4 Write Data . . . . . . . . . . . . . . . . . . . . . . . . . . . . . . . . . . . . . . . . . . . . . . . . . . . . . . . . 515
B.17 Activities . . . . . . . . . . . . . . . . . . . . . . . . . . . . . . . . . . . . . . . . . . . . . . . . . . . . . . . . . . . . . . . . . 515
B.17.1 Creating an Activity . . . . . . . . . . . . . . . . . . . . . . . . . . . . . . . . . . . . . . . . . . . . . . . . . 515
B.17.2 Deleting an Activity . . . . . . . . . . . . . . . . . . . . . . . . . . . . . . . . . . . . . . . . . . . . . . . . . 516
B.17.3 Saving an Activity . . . . . . . . . . . . . . . . . . . . . . . . . . . . . . . . . . . . . . . . . . . . . . . . . . 516
B.18 Incidents and Workflows . . . . . . . . . . . . . . . . . . . . . . . . . . . . . . . . . . . . . . . . . . . . . . . . . . . . 516
B.18.1 Add Events To Incident . . . . . . . . . . . . . . . . . . . . . . . . . . . . . . . . . . . . . . . . . . . . . . 516
B.18.2 Adding Process Definition . . . . . . . . . . . . . . . . . . . . . . . . . . . . . . . . . . . . . . . . . . . . 517
B.18.3 Create Incident . . . . . . . . . . . . . . . . . . . . . . . . . . . . . . . . . . . . . . . . . . . . . . . . . . . . 517
B.18.4 Creating Group . . . . . . . . . . . . . . . . . . . . . . . . . . . . . . . . . . . . . . . . . . . . . . . . . . . . 517
B.18.5 Creating User. . . . . . . . . . . . . . . . . . . . . . . . . . . . . . . . . . . . . . . . . . . . . . . . . . . . . . 518
B.18.6 Delete Incident. . . . . . . . . . . . . . . . . . . . . . . . . . . . . . . . . . . . . . . . . . . . . . . . . . . . . 518
B.18.7 Deleting Group. . . . . . . . . . . . . . . . . . . . . . . . . . . . . . . . . . . . . . . . . . . . . . . . . . . . . 518
B.18.8 Deleting Process Definition . . . . . . . . . . . . . . . . . . . . . . . . . . . . . . . . . . . . . . . . . . . 519
B.18.9 Deleting User . . . . . . . . . . . . . . . . . . . . . . . . . . . . . . . . . . . . . . . . . . . . . . . . . . . . . . 519
B.18.10 E-mail Incident . . . . . . . . . . . . . . . . . . . . . . . . . . . . . . . . . . . . . . . . . . . . . . . . . . . . . 519
B.18.11 Get Incident . . . . . . . . . . . . . . . . . . . . . . . . . . . . . . . . . . . . . . . . . . . . . . . . . . . . . . . 520
B.18.12 Save Incident . . . . . . . . . . . . . . . . . . . . . . . . . . . . . . . . . . . . . . . . . . . . . . . . . . . . . . 520
B.18.13 Saving Group . . . . . . . . . . . . . . . . . . . . . . . . . . . . . . . . . . . . . . . . . . . . . . . . . . . . . . 520
B.18.14 Saving Process Definition . . . . . . . . . . . . . . . . . . . . . . . . . . . . . . . . . . . . . . . . . . . . 521
B.18.15 Viewing Process Definition . . . . . . . . . . . . . . . . . . . . . . . . . . . . . . . . . . . . . . . . . . . 521
B.19 General . . . . . . . . . . . . . . . . . . . . . . . . . . . . . . . . . . . . . . . . . . . . . . . . . . . . . . . . . . . . . . . . . 521
B.19.1 Configuration Service . . . . . . . . . . . . . . . . . . . . . . . . . . . . . . . . . . . . . . . . . . . . . . . 521
B.19.2 Controlled Process is started. . . . . . . . . . . . . . . . . . . . . . . . . . . . . . . . . . . . . . . . . . 522
B.19.3 Controlled Process is stopped . . . . . . . . . . . . . . . . . . . . . . . . . . . . . . . . . . . . . . . . . 522
B.19.4 Importing Auxiliary . . . . . . . . . . . . . . . . . . . . . . . . . . . . . . . . . . . . . . . . . . . . . . . . . . 522
B.19.5 Importing Plugin. . . . . . . . . . . . . . . . . . . . . . . . . . . . . . . . . . . . . . . . . . . . . . . . . . . . 523
B.19.6 Load Esec Taxonomy To XML . . . . . . . . . . . . . . . . . . . . . . . . . . . . . . . . . . . . . . . . 523
B.19.7 Process Auto Restart Error . . . . . . . . . . . . . . . . . . . . . . . . . . . . . . . . . . . . . . . . . . . 523
B.19.8 Process Restarts . . . . . . . . . . . . . . . . . . . . . . . . . . . . . . . . . . . . . . . . . . . . . . . . . . . 524
B.19.9 Proxy Client Registration Service (medium) . . . . . . . . . . . . . . . . . . . . . . . . . . . . . . 524
B.19.10 Restarting Process . . . . . . . . . . . . . . . . . . . . . . . . . . . . . . . . . . . . . . . . . . . . . . . . . 524
B.19.11 Restarting Processes. . . . . . . . . . . . . . . . . . . . . . . . . . . . . . . . . . . . . . . . . . . . . . . . 525
B.19.12 Starting Process . . . . . . . . . . . . . . . . . . . . . . . . . . . . . . . . . . . . . . . . . . . . . . . . . . . 525
B.19.13 Starting Processes. . . . . . . . . . . . . . . . . . . . . . . . . . . . . . . . . . . . . . . . . . . . . . . . . . 525
B.19.14 Stopping Process. . . . . . . . . . . . . . . . . . . . . . . . . . . . . . . . . . . . . . . . . . . . . . . . . . . 526
novdocx (en) 7 January 2010
Contents 15
Page 16

B.19.15 Stopping Processes . . . . . . . . . . . . . . . . . . . . . . . . . . . . . . . . . . . . . . . . . . . . . . . . . 526
B.19.16 Store Esec Taxonomy From XML . . . . . . . . . . . . . . . . . . . . . . . . . . . . . . . . . . . . . . 526
B.19.17 Watchdog Process is started . . . . . . . . . . . . . . . . . . . . . . . . . . . . . . . . . . . . . . . . . . 526
B.19.18 Watchdog Process is stopped . . . . . . . . . . . . . . . . . . . . . . . . . . . . . . . . . . . . . . . . . 527
novdocx (en) 7 January 2010
16 Sentinel 6.1 User Guide
Page 17

Preface
SentinelTM is a security information and event management solution that receives information from
many sources throughout an enterprise, standardizes it, prioritizes it and presents it to you to make
threat, risk and policy related decisions.
Chapter 1, “Sentinel Control Center,” on page 21
Chapter 2, “Active Views Tab,” on page 35
Chapter 3, “Correlation Tab,” on page 65
Chapter 4, “Incidents Tab,” on page 93
Chapter 5, “iTRAC Workflows,” on page 107
Chapter 6, “Work Items,” on page 147
Chapter 7, “Analysis Tab,” on page 153
Chapter 8, “Advisor Usage and Maintenance,” on page 159
Chapter 9, “Download Manager,” on page 173
novdocx (en) 7 January 2010
Chapter 10, “Event Source Management,” on page 179
Chapter 11, “Administration,” on page 227
Chapter 12, “Sentinel Data Manager,” on page 281
Chapter 13, “Utilities,” on page 291
Chapter 14, “Quick Start,” on page 307
Chapter 15, “Solution Packs,” on page 331
Chapter 16, “Actions and Integrator,” on page 365
Chapter 17, “Sentinel Link Solution,” on page 393
Chapter 18, “Identity Integration,” on page 431
Appendix A, “Sentinel Architecture,” on page 441
Appendix B, “System Events for Sentinel,” on page 467
Audience
This documentation is intended for Information Security Professionals.
Feedback
We want to hear your comments and suggestions about this manual and the other documentation
included with this product. Please use the User Comments feature at the bottom of each page of the
online documentation and enter your comments there.
Additional Documentation
Sentinel Technical documentation is broken down into several different volumes. They are:
Sentinel 6.1 Installation Guide
Preface 17
Page 18

Sentinel 6.1 Reference Guide
Documentation on developing collectors (proprietary or JavaScript) and JavaScript correlation
actions is available at the Novell Developer Community web site: http://developer.novell.com/
wiki/index.php?title=Develop_to_Sentinel (http://developer.novell.com/wiki/
index.php?title=Develop_to_Sentinel)
The documentation for this product is available at http://www.novell.com/documentation/
sentinel61/index.html (http://www.novell.com/documentation/sentinel61/index.html)
Documentation Conventions
The following are the conventions used in this manual:
Notes and Warnings
NOTE: Notes provide additional information that may be useful or for reference.
WARNING: Warnings provide additional information that helps you identify and stop performing
actions in the system that cause damage or loss of data.
novdocx (en) 7 January 2010
Commands appear in courier font. For example:
useradd –g dba –d /export/home/oracle –m –s /bin/csh oracle
Go to Start > Program Files > Control Panel to perform this action: Multiple actions in a step.
References
For more information, see “Section Name” (if in the same Chapter).
For more information, see “Chapter Name” (if in the same Guide).
For more information, see “Section Name” in “Chapter Name”, Name of the Guide (if in a
different Guide).
In Novell documentation, a greater-than symbol (>) is used to separate actions within a step and
items in a cross-reference path.
®
A trademark symbol (
, TM, etc.) denotes a Novell trademark. An asterisk (*) denotes a third-party
trademark.
When a single pathname can be written with a backslash for some platforms or a forward slash for
other platforms, the pathname is presented with a backslash. Users of platforms that require a
forward slash, such as Linux or UNIX, should use forward slashes as required by your software.
Contacting Novell
Web Site: http://www.novell.com (http://www.novell.com)
Novell Technical Support: http://support.novell.com/
phone.html?sourceidint=suplnav4_phonesup (http://support.novell.com/
phone.html?sourceidint=suplnav4_phonesup)
Self Support: http://support.novell.com/
support_options.html?sourceidint=suplnav_supportprog (http://support.novell.com/
support_options.html?sourceidint=suplnav_supportprog)
18 Sentinel 6.1 User Guide
Page 19

Patch Download Site: http://download.novell.com/index.jsp (http://download.novell.com/
index.jsp)
24x7 support: http://www.novell.com/company/contact.html (http://www.novell.com/
company/contact.html)
For Collectors/Connectors/Reports/Correlation/Hotfixes/TIDS: http://support.novell.com/
products/sentinel (http://support.novell.com/products/sentinel)
novdocx (en) 7 January 2010
Preface 19
Page 20

novdocx (en) 7 January 2010
20 Sentinel 6.1 User Guide
Page 21

1
Sentinel Control Center
Section 1.1, “About Sentinel Control Center,” on page 21
Section 1.2, “Log in to the Sentinel Control Center,” on page 24
Section 1.3, “Introduction to the User Interface,” on page 25
1.1 About Sentinel Control Center
SentinelTM is a Security Information and Event Management solution that receives information from
many sources throughout an enterprise, standardizes it, prioritizes it and presents it to you to make
threat, risk and policy related decisions. The Sentinel Control Center (SCC) is the main user
interface for viewing and interacting with this data.
Sentinel gathers and correlates security and non-security information from across an organization's
networked infrastructure, as well as third-party systems, devices and applications. Sentinel presents
the collected data in a more sensible GUI, identifies security or compliance issues, and tracks
remediation activities, streamlining previously error-prone processes and building a more rigorous
and secure management program.
novdocx (en) 7 January 2010
1
The Sentinel Control Center includes the following functional tabs and interfaces:
Section 1.1.1, “Active Views,” on page 21
Section 1.1.2, “Incidents,” on page 22
Section 1.1.3, “iTRAC,” on page 22
Section 1.1.4, “Analysis,” on page 22
Section 1.1.5, “Advisor,” on page 22
Section 1.1.6, “Admin,” on page 22
Section 1.1.7, “Correlation,” on page 23
Section 1.1.8, “Event Source Management,” on page 23
Section 1.1.9, “Solution Packs,” on page 24
Section 1.1.10, “Identity Integration,” on page 24
1.1.1 Active Views
The Active Views tab presents events in near-real time.
In the Active Views tab, you can:
View events occurring in near real-time
Investigate events
Graph events
Perform historical queries to collect data for a specified period
Invoke right-click functions
Initiate manual incidents and remediation workflows
Sentinel Control Center
21
Page 22

1.1.2 Incidents
An incident is a set of events that require attention (for example, a possible attack). Incidents
centralize the data and typically comprise a correlated event, the associated events that triggered a
correlation rule, asset details of the affected systems, vulnerability state of the affected systems and
any remediation information, if known. Incidents can be associated with a remediation workflow in
iTRAC, if specified. An incident associated to an iTRAC workflow allows users to track the
remediation state of the incident.
In the Incidents Tab, you can:
Manage incident views
View and manage incidents and their associated data
Switch between existing incident views
1.1.3 iTRAC
iTRAC’s stateful incident remediation workflow capability allows you to incorporate your
organization’s incident response processes into Sentinel.
novdocx (en) 7 January 2010
In the iTRAC tab, you can:
Create custom workflow templates
Edit workflow templates
Create custom activities
Edit activities
Associate activities with workflow steps
Initiate and execute Processes
1.1.4 Analysis
The Analysis tab is the historical reporting interface for Sentinel. Reports are published on a Web
server and can be rendered in the analysis tab or in an external browser. You can also run and save
an Offline Query for later quick retrieval of search results.
1.1.5 Advisor
Advisor is an optional module that provides real-time correlation between detected IDS attacks and
vulnerability scan output in order to immediately indicate increased risk to an organization.
In the Advisor tab, you can view the products that Novell supports for Advisor and also the status of
the last five Advisor feed files that have been processed or are being processed.
1.1.6 Admin
The Admin tab provides you access to perform the administrative actions and configuration settings
in Sentinel. In the Admin tab, you can:
Configure connection to Crystal Reports
22 Sentinel 6.1 User Guide
Page 23

Create and modify filters
Use filters to format data
Use filters to determine event routing
View system statistics about the Data Access Service
Start and Stop system components
Configure Sentinel event fields
Configure the mapping service
Create new options for right-click event menus
Aggregate data for reporting
Create users and assign them to roles for workflows
Manage user sessions
1.1.7 Correlation
The Correlation tab provides an interface to create and deploy rules to detect suspicious or malicious
patterns of events.
novdocx (en) 7 January 2010
In the Correlation tab, you can:
Create and edit rules
Deploy/Undeploy rules
Add an action and associate it to a rule
Configure dynamic lists
1.1.8 Event Source Management
The Event Source Management (ESM) interface is available through the Sentinel Control Center
menu. It allows you to manage and monitor connections between Sentinel and its event sources
using Sentinel Connectors and Sentinel Collectors.
In the ESM, you can:
Import/export Connectors and Collectors from/to the centralized repository available in ESM
Add/edit connections to event sources through the configuration wizards
View the real-time status of the connections to event sources
Monitor data flowing through the Collectors and Connector
Sentinel Collectors
The Collectors parse the data and deliver a richer event stream by injecting taxonomy, exploit
detection and business relevance into the data stream before events are correlated and analyzed and
sent to the database.
Sentinel Connectors
The Connectors use industry standard methods to connect to the data source to get raw data.
Sentinel Control Center 23
Page 24
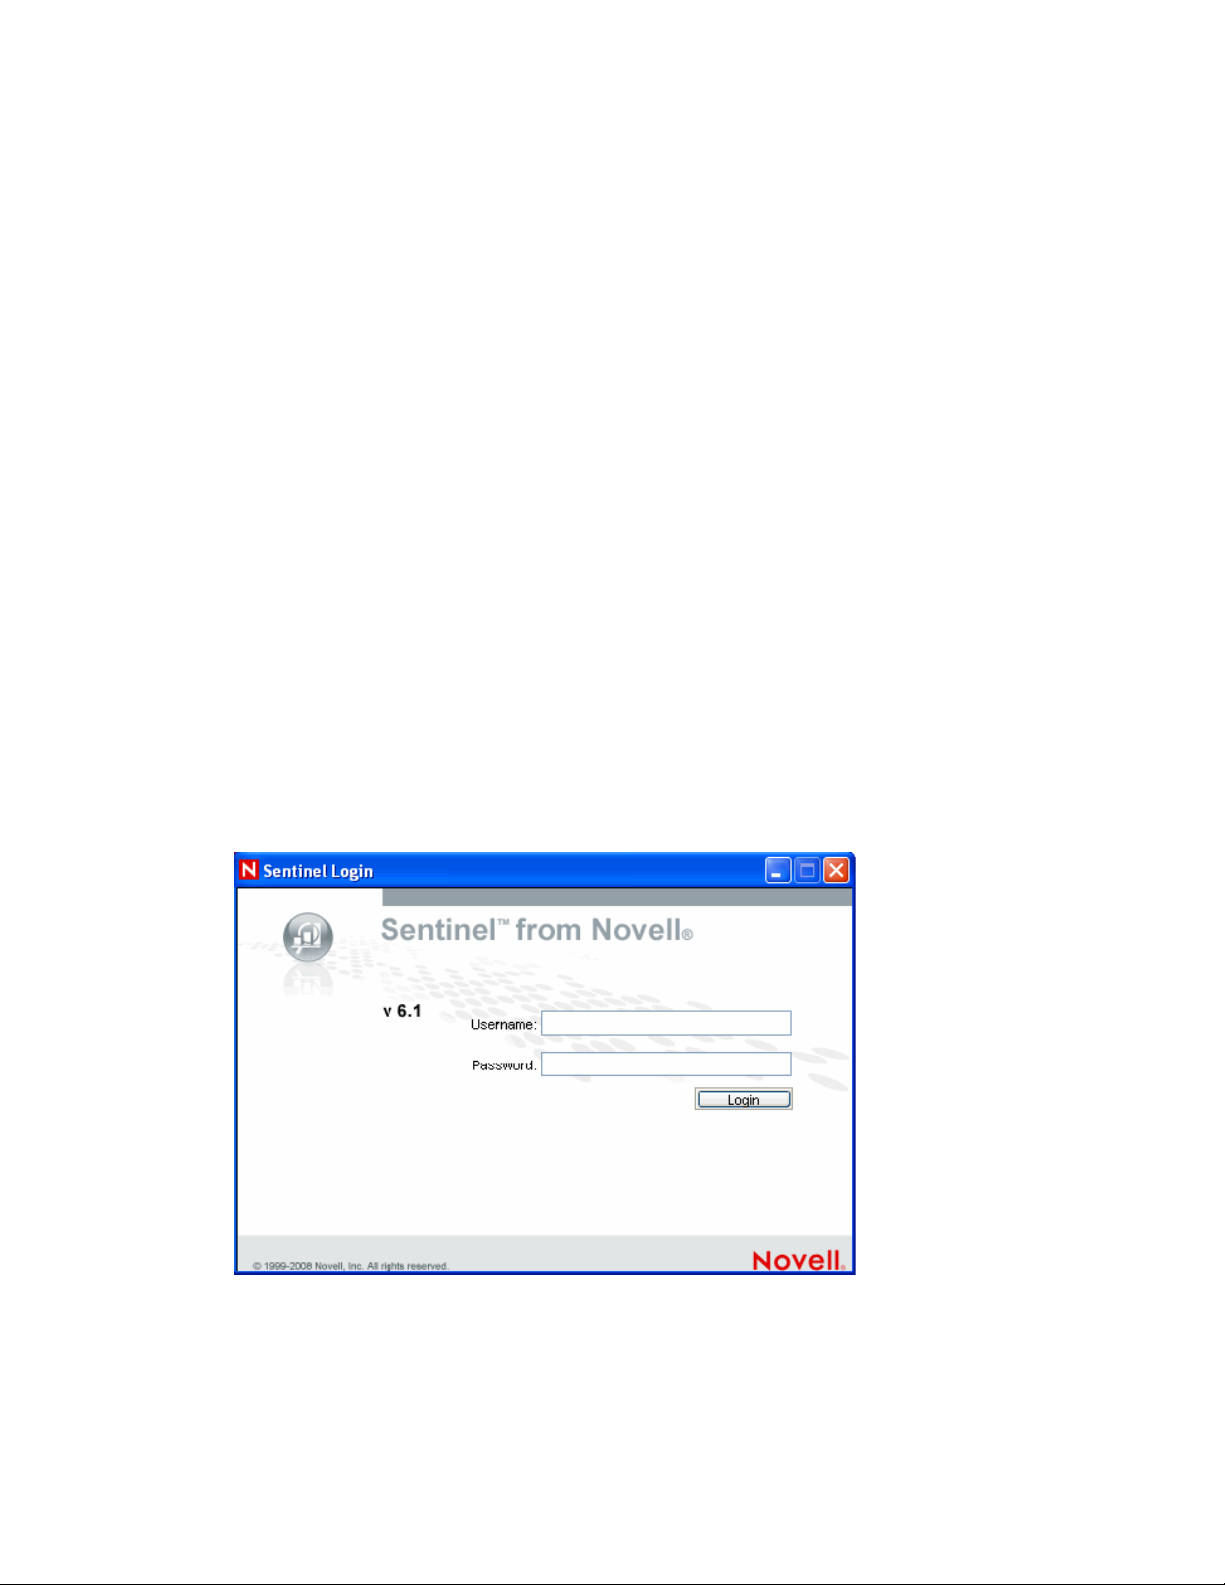
1.1.9 Solution Packs
You can use the Solution Packs interface through the Tools menu in Sentinel Control Center.
Solution Packs provide a framework within which sets of content can be packaged into controls,
each of which is designed to enforce a specific business or technical policy.
1.1.10 Identity Integration
Novell Sentinel 6.1 provides an integration framework for identity management systems. This
integration provides functionality on several levels. With the Identity Browser you can:
Look up the following information about a user:
Contact information
Accounts associated with that user
Most recent authentication events
Most recent access events
Most recent permissions changes
novdocx (en) 7 January 2010
Lookup from events
1.2 Log in to the Sentinel Control Center
To Start the Sentinel Control Center on Windows:
1 Go to Start > Programs > Sentinel and select Sentinel Control Center. Sentinel Login window
displays.
2 Provide the user credentials you are provided with to log-in to Sentinel Control Center.
Username and password, if using SQL Server authentication, OR
Domain\username and password, if using Windows authentication
3 Click Login.
24 Sentinel 6.1 User Guide
Page 25
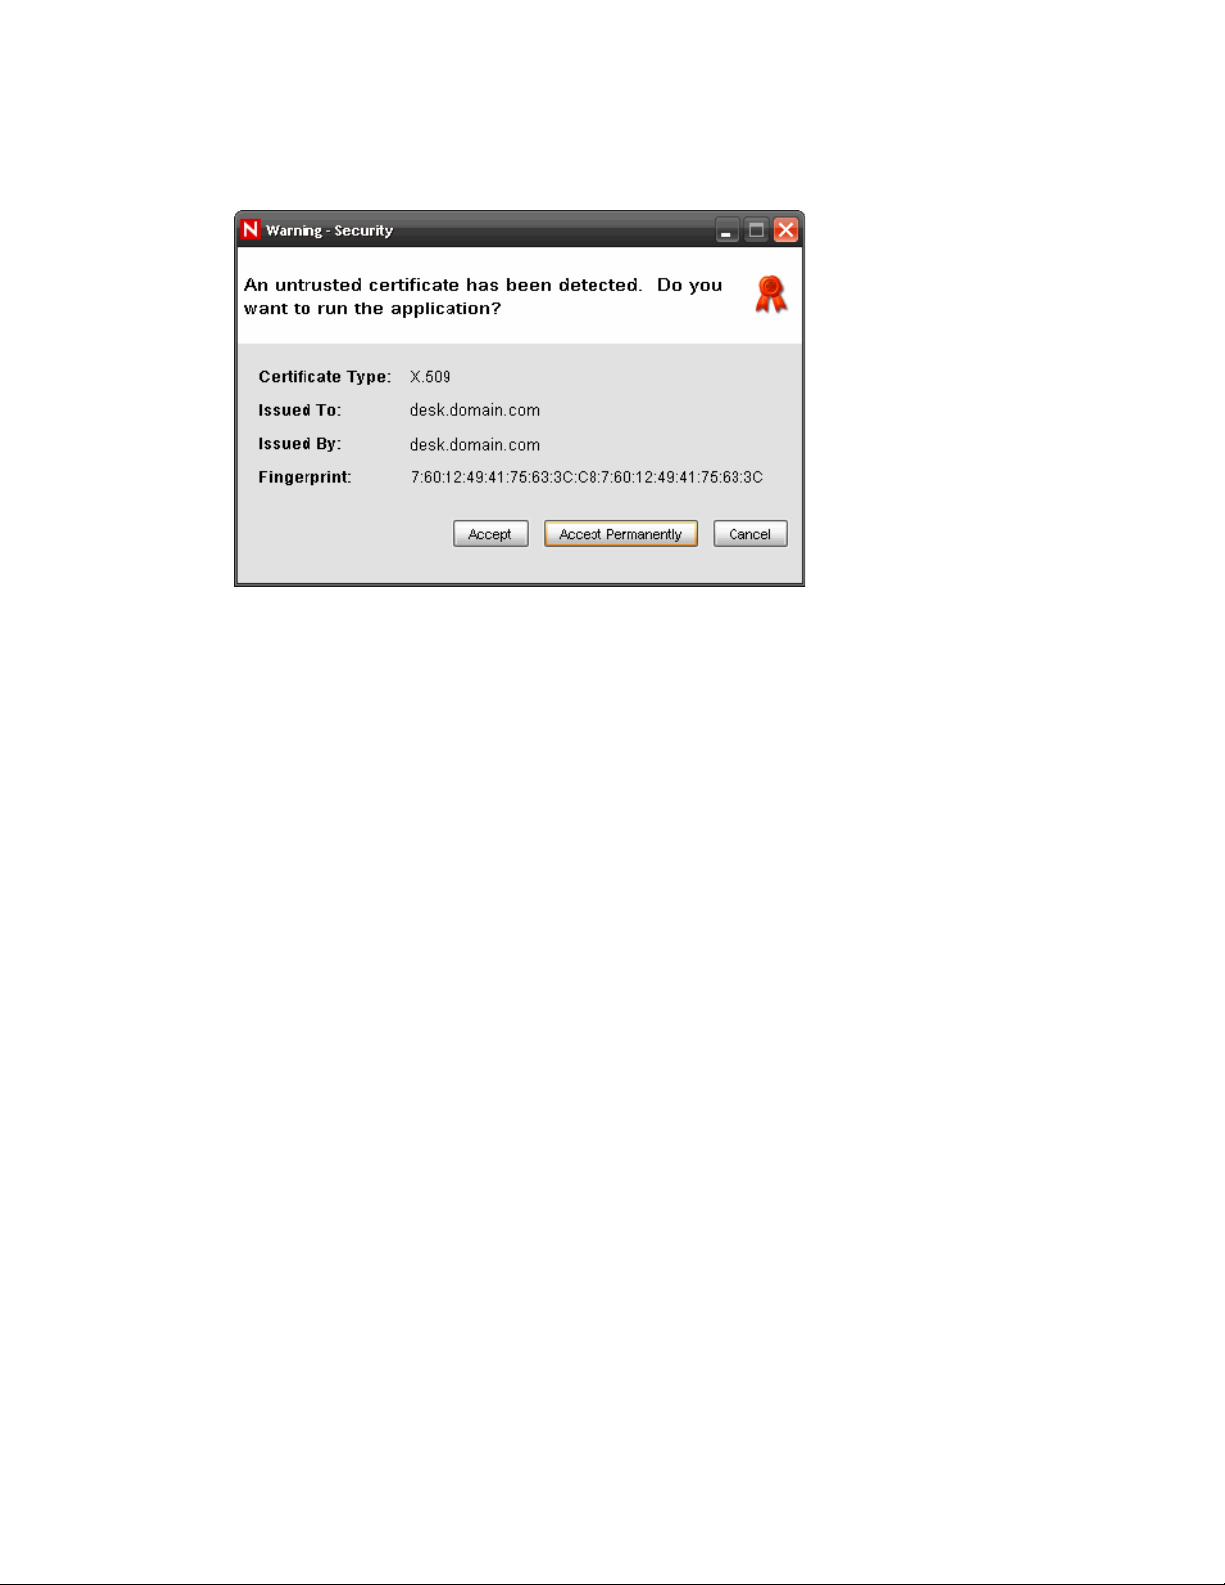
4 On the first login, the following warning message displays. The user must accept the certificate
in order to securely log in to the Sentinel Control Center
novdocx (en) 7 January 2010
5 If you select Accept, this message displays every time you try to start Sentinel on your system.
To avoid this, you can select Accept permanently.
To Start the Sentinel Control Center on Linux and Solaris:
1 As the Sentinel Administrator User (esecadm), change directory to:
$ESEC_HOME/bin
2 Run the following command:
control_center.sh
3 Provide your username and password and click OK.
4 A Certificate window displays, if you select Accept, this message displays every time you try
to start Sentinel on your system. To avoid this, you can select Accept permanently.
1.3 Introduction to the User Interface
In the Sentinel Control Center user interface, you can perform the activities through the following
components:
Section 1.3.1, “Menu Bar,” on page 26
Section 1.3.2, “Toolbar,” on page 26
Section 1.3.3, “Tabs,” on page 27
Section 1.3.4, “Frames,” on page 28
Sentinel Control Center provides you the “dockable” framework, which allows you to move the
Toolbars, Tabs or Frames from their default location to user-specific locations for ease-of-use.
Sentinel Control Center 25
Page 26
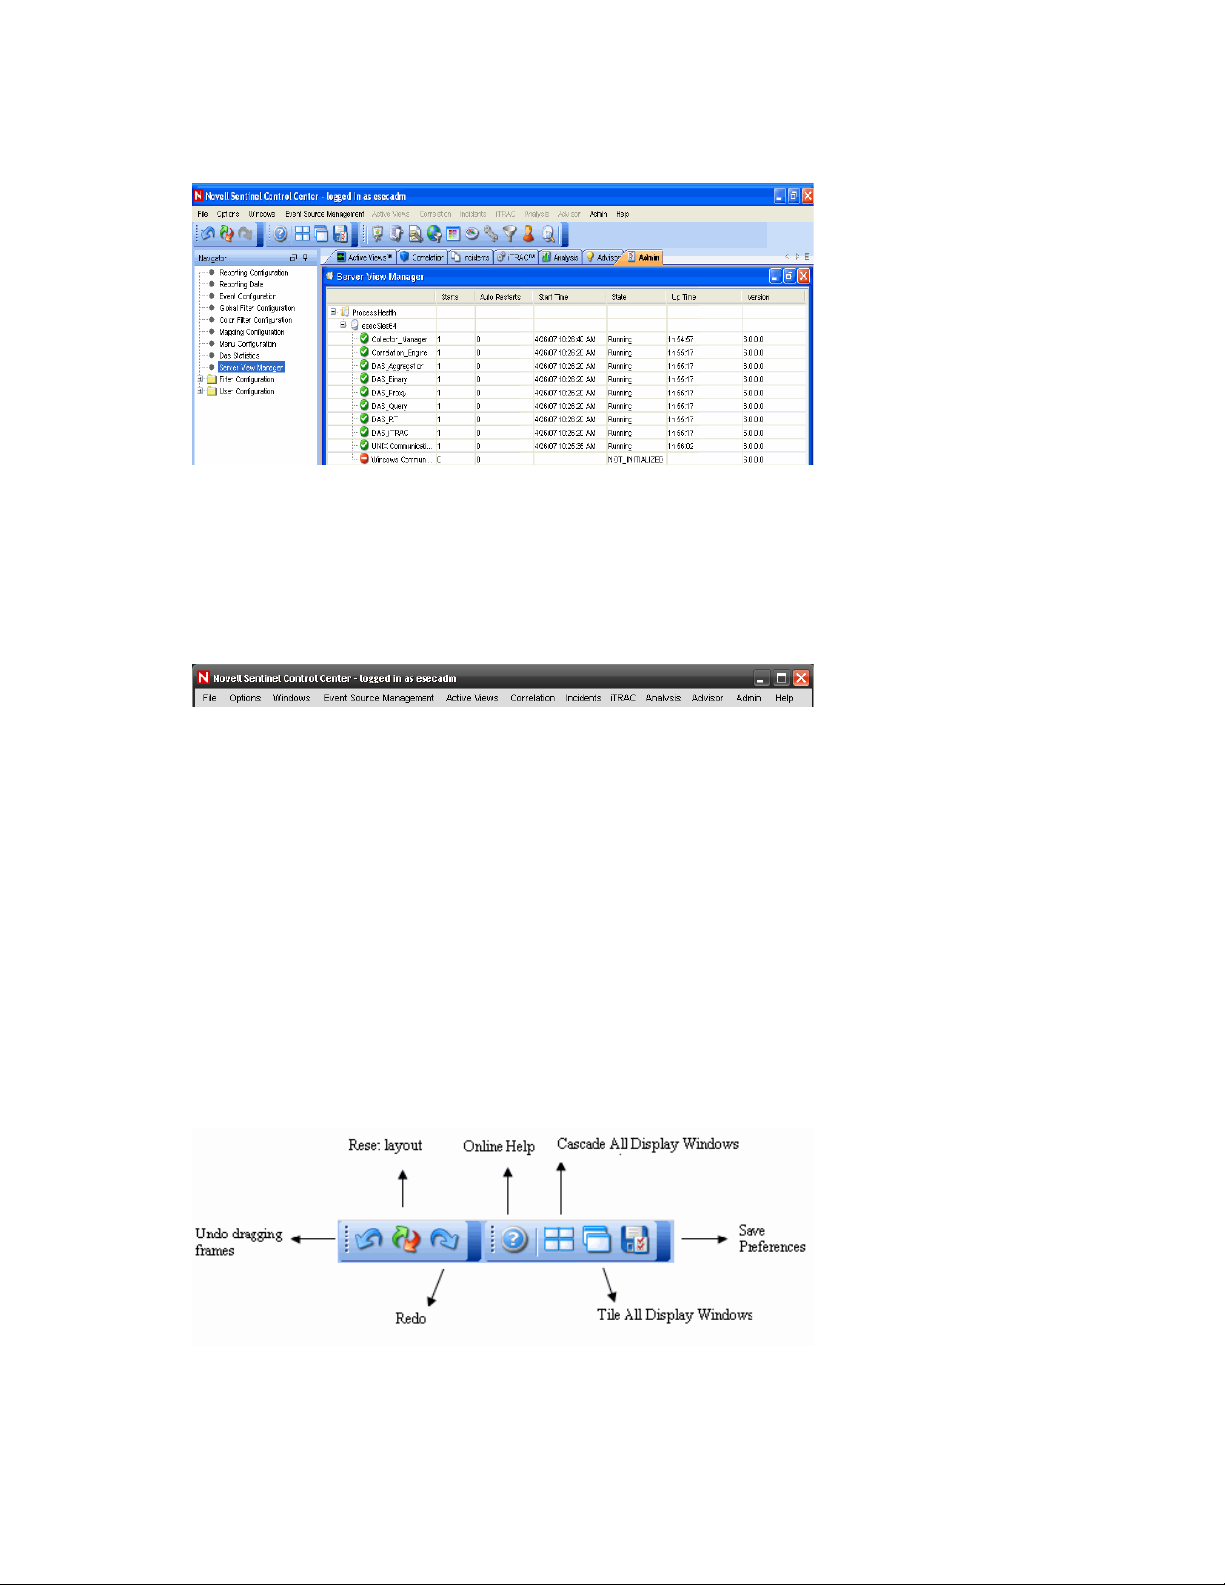
Figure 1-1 Sentinel Control Center
1.3.1 Menu Bar
The menu bar has the menus required to Navigate, perform activities and change the appearance of
Sentinel Control Center.
novdocx (en) 7 January 2010
Figure 1-2 Figure 1-2: Menu Bar
The File, Options, Event Source Management, Windows and Help menus are always available. The
availability of other menus depends on your location in the console and permissions.
1.3.2 Toolbar
The Tool Bar allows you to perform the Tab specific functions. There are four system-wide toolbar
buttons that are always displayed. These toolbar buttons are View Sentinel Help, Cascade All
Display Windows, Tile All Display Windows and Save User Preferences. The availability of other
toolbar buttons depends on your location in the console and permissions.
System-Wide Toolbar
The system-wide toolbar buttons are:
Figure 1-3 System-Wide Toolbar
26 Sentinel 6.1 User Guide
Page 27
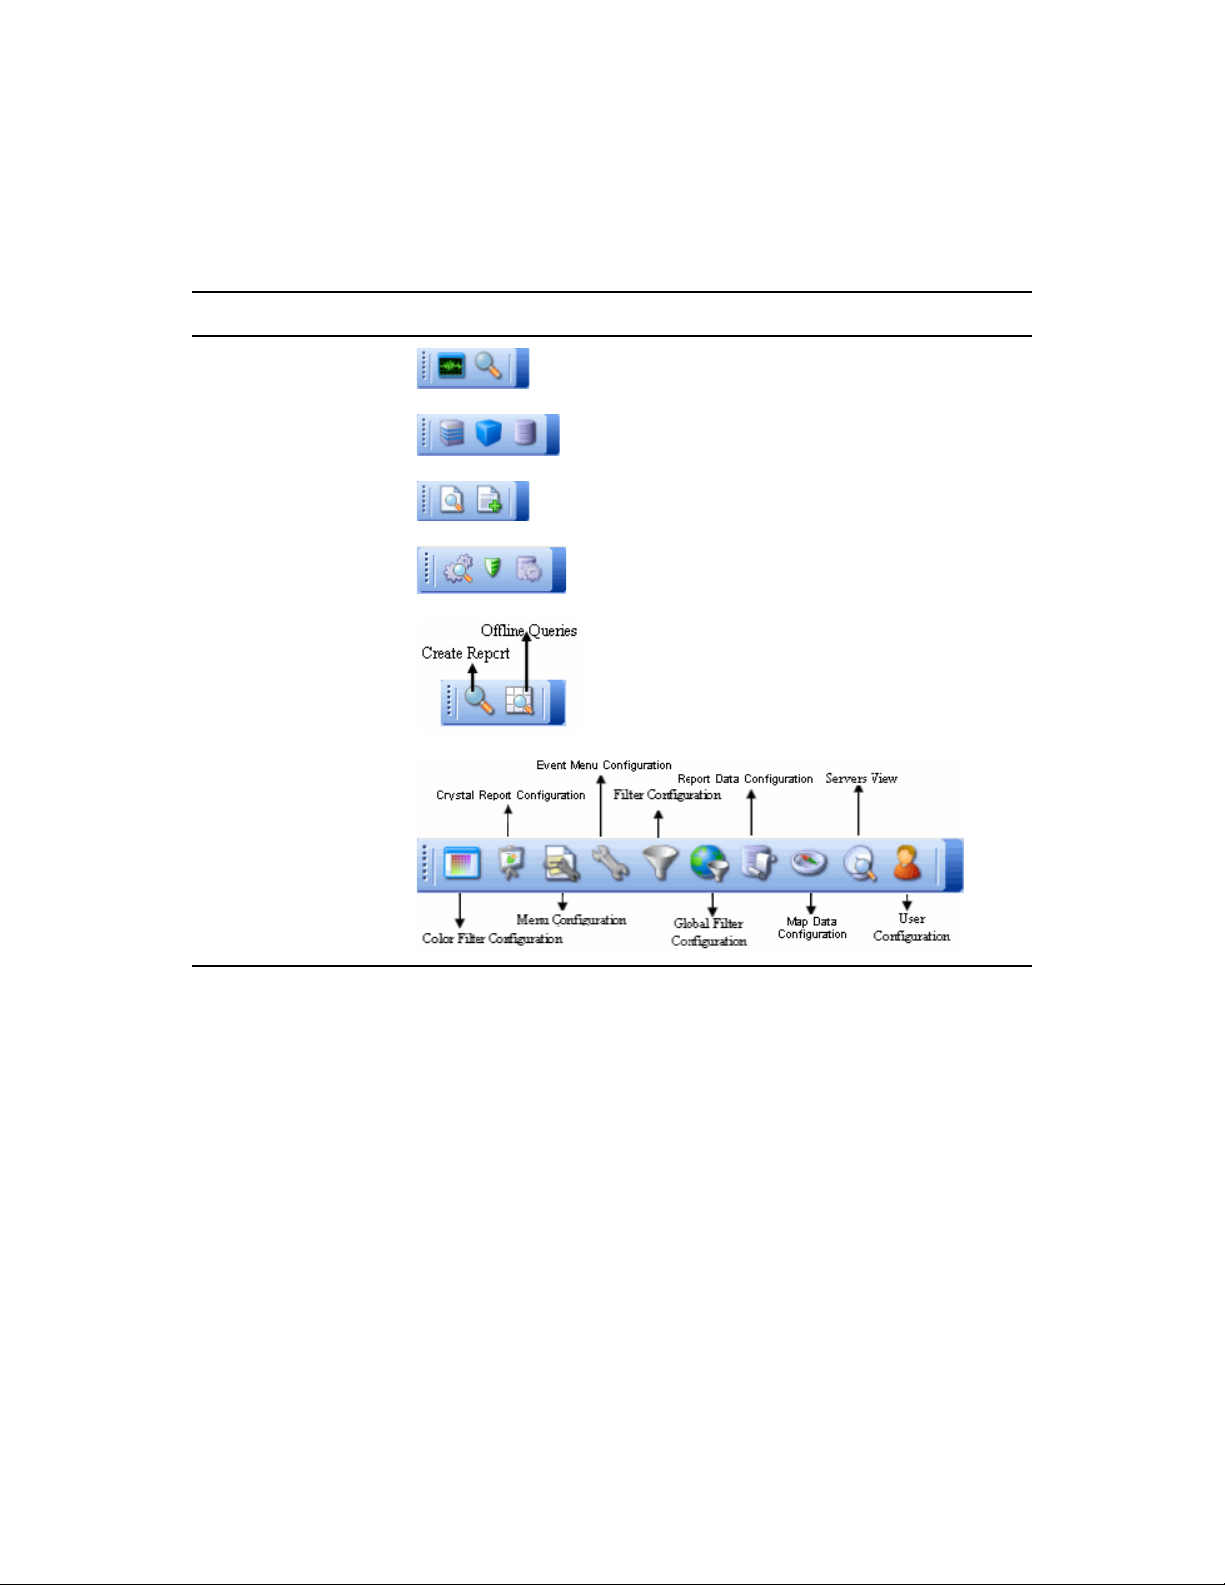
Tab Specific Toolbar buttons
Tab-specific toolbar buttons allows you to perform the functions related to each tab.
Table 1-1 Tab Specific Toolbar Buttons
Toolbar View
Active Views
Correlation
Incidents
iTRAC
novdocx (en) 7 January 2010
Analysis
Admin
For more information on Tabs-specific toolbar buttons, see the sections on each of the Tabs
mentioned in the list above.
1.3.3 Tabs
Depending on your access permissions, Sentinel Control Center displays the following tabs.
Active Views
Correlation
TM
Incidents
iTRAC
TM
Analysis
Advisor
Admin
For more information about Tabs, see the sections on each tab.
Sentinel Control Center 27
Page 28
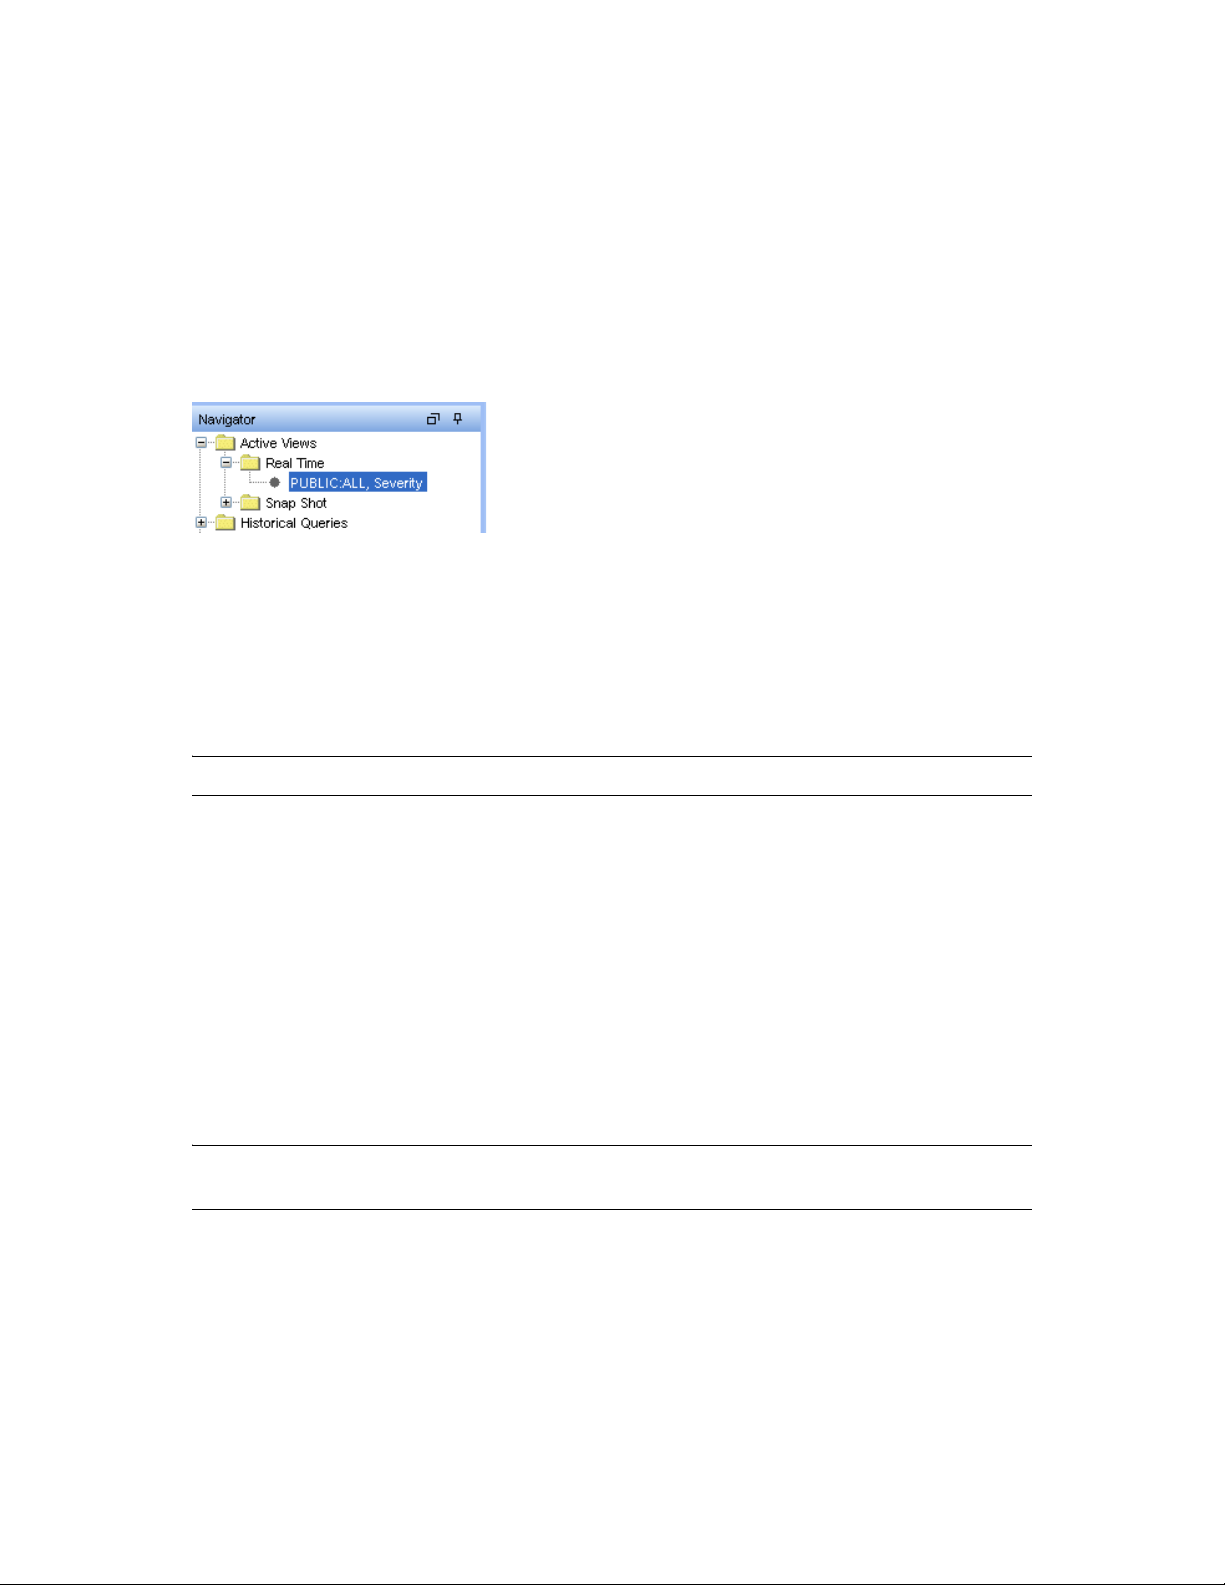
1.3.4 Frames
Sentinel provides a dock-able framework which allows you to drag frames on the screen to place
them in user preferred locations. In a frame the following buttons displays, which allow you to drag/
hide frames.
Toggle Floating
Toggle Auto-hide
Figure 1-4 Navigator Frame
To drag a frame to any location:
novdocx (en) 7 January 2010
1 Click Toggle Floating icon on the Frame or hold the frame and drag it to the desired location.
To hide a frame:
1 Click Toggle Auto-hide icon.
NOTE: You can undo dragging or reset to default position using the toolbar buttons.
1.3.5 Navigating through Sentinel Control Center
To navigate using Toolbar:
1 Click the tab you need to work on.
2 Click toolbar buttons to perform the actions.
To navigate using Menu bar:
1 Click the tab menu in the Menu bar.
2 Select an action you need to perform.
NOTE: This procedure is generic for all the tabs in Sentinel Control Center. Navigation specific
procedures for tabs are discussed in the relevant sections.
1.3.6 Changing the appearance of Sentinel Control Center
You can change the Sentinel Control Center’s look by:
“Setting the Tab Position” on page 29
“Cascading Windows” on page 29
“Tiling Windows” on page 29
28 Sentinel 6.1 User Guide
Page 29

“Minimizing and Restoring Windows” on page 29
“Closing all open Windows” on page 29
Setting the Tab Position
To set the tab position:
1 Click Options > Tab Placement.
2 Select either Top or Bottom.
Cascading Windows
To cascade windows:
1 Click Windows > Cascade All. All open windows in the right panel cascade.
Tiling Windows
novdocx (en) 7 January 2010
To Tile Windows:
1 Click Windows > Tile All.
2 Select from the following to meet your requirement:
Tile Best Fit
Tile Vertical
Tile Horizontal
Minimizing and Restoring Windows
To minimize all windows:
1 Click Windows > Minimize All. All open windows in the right panel minimize.
To restore windows to original size:
1 Click Windows > Restore All. All open windows in the right panel restores to their original
size.
NOTE: Use the Minimize and Restore options provided on the top-right corner of the tab to
minimize individual tabs.
Closing all open Windows
To close all windows:
1 Click Windows > Close All.
Sentinel Control Center 29
Page 30
1.3.7 Saving User Preferences
If the user has permissions to save their workspace, they can save the following preferences:
Permanent windows that are not dependent on data that was available at the time of their
original creation.
Active Views
Summary displays
Window positions
Window sizes, including the application window
Tab positions
Navigator docked or floating and showing or hidden
The following preferences are not saved when the user logs out:
Snapshots
Historical event queries
novdocx (en) 7 January 2010
Secondary windows opened from one of the primary windows in the Admin Navigator
Column widths in Active Views
To save your preferences:
1 Click File > Save Preferences or click
1.3.8 Changing Password
To change your Sentinel Control Center password:
1 Click Options > Change Password.
2 Provide the old password.
3 Provide the new password and matching confirm password.
4 Click OK.
NOTE: For more information on password security, see “Setting Passwords” in “Best Practices
section” in Sentinel Installation Guide.
1.3.9 Hostname updates
If the hostname of a system is changed, you might need to perform some of the following actions on
the system depending on the Sentinel components installed on it.
IMPORTANT: Stop Sentinel Service before you perform these actions.
30 Sentinel 6.1 User Guide
Page 31

You might need to update all the machines (which have components affected by the hostname
change) before you restart Sentinel service on any machine.
Scenario 1: Change in Sentinel Database Hostname
In this scenario, the affected components are DAS and SDM. So you might need to
Update the DAS
Update SDM
The configuration file enables DAS to connect to the database. So, you need to update the
configuration files to update DAS.
To update DAS:
1 Login to the machine where DAS is installed as esecadm (on UNIX), or as an administrator (on
Windows).
2 Stop the Sentinel Services running on the machine.
3 Go to ESEC_HOME\bin:
On Unix, type the command cd $ESEC_HOME/bin
novdocx (en) 7 January 2010
On Windows, type the command cd /d %ESEC_HOME%\bin
4 Update DAS configuration files on Unix and Windows using the following commands.
On Unix, execute
On Windows, execute
./dbconfig -a ../config -h <new DB hostname>
.\dbconfig -a ..\config -h <new DB hostname>
.
.
You require the Database Hostname to login to SDM. To login to SDM, you might need to update
the Database Hostname in SDM login window.
To Update SDM
1 Open Sentinel Data Manager.
2 In the login window, provide details of the Database, new hostname and other required details.
3 Click Connect.
Scenario 2: Change in Sentinel Communication Server Hostname
In this scenario, the affected components are Communication Server, DAS, Correlation Engine,
Sentinel Collector Manager and Sentinel Control Center. So you might need to
Update the Communication Server
Update DAS, Correlation Engine, Sentinel Collector Manager, Sentinel Control Center
You might need to re-install the Communication Server to update the Hostname change.
To re-install Communication Server:
1 Login as root (Unix) or administrator (Windows) on the system where the Communication
Server is installed.
Sentinel Control Center 31
Page 32

2 Run Sentinel Uninstaller. In the Select components to Uninstall window, select Communication
Server and deselect all other options.
Follow instructions in “Uninstalling Sentinel” in Sentinel 6.1 Installation Guide as required and
complete uninstallation.
3 Click Finish.
4 Insert (and mount, on Solaris/Linux only) the Sentinel Installer CD.
5 Run the setup file. In the Select components to Install window, select Communication Server
only.
Follow the instructions in “Installing Sentinel 6.1 SP2” in Sentinel 6.1 Installation Guide as
required and complete installation.
6 Reboot the system.
The configuration file that connects the Communication Server and Sentinel processes needs to be
updated. You might need to perform the steps given below on all machines with DAS, Correlation
Engine, Collector Manager, and Sentinel Control Center installed.
To update DAS, Correlation Engine, Collector Manager, and Sentinel Control Center:
novdocx (en) 7 January 2010
1 Go to ESEC_HOME/config/ and edit
2 Replace the four occurrences of the Communications Server Hostname with the new
Hostname.
3 Save and exit the
IMPORTANT: After the steps mentioned above are performed, restart the Sentinel Services for the
changes to take affect.
configuration.xml
configuration.xml
file.
.
1.3.10 Configuring the Attachment Viewer
To configure the Attachment Viewer:
1 On the Tools menu, click Attachment Viewer Configuration or alternatively click Configure
Attachment Viewers button. The Attachment Viewer Configuration window displays.
32 Sentinel 6.1 User Guide
Page 33

novdocx (en) 7 January 2010
2 Click Add. The Attachment Identification window displays.
Specify the extension type (such as
.doc, .xls, .txt, .html
type in the application program to launch the file type (such as
3 Click OK.
and so on) and click Browse or
notepad.exe
for Notepad).
Sentinel Control Center 33
Page 34

novdocx (en) 7 January 2010
34 Sentinel 6.1 User Guide
Page 35

2
Active Views Tab
Section 2.1, “Understanding Active Views,” on page 35
Section 2.2, “Introduction to the User Interface,” on page 36
Section 2.3, “Reconfiguring Total Display Time,” on page 39
Section 2.4, “Viewing Real Time Events,” on page 39
Section 2.5, “Showing and Hiding Event Details,” on page 43
Section 2.6, “Sending Mail Messages about Events and Incidents,” on page 43
Section 2.7, “Creating Incidents,” on page 45
Section 2.8, “Viewing Events that Triggered Correlated Events,” on page 46
Section 2.9, “Investigating an Event or Events,” on page 47
Section 2.10, “Viewing Advisor Data,” on page 53
Section 2.11, “Viewing Asset Data,” on page 54
novdocx (en) 7 January 2010
2
Section 2.12, “Viewing Vulnerabilities,” on page 55
Section 2.13, “Ticketing System Integration,” on page 60
Section 2.14, “Viewing User Information,” on page 60
Section 2.15, “Using Custom Menu Options with Events,” on page 61
Section 2.16, “Managing Columns in a Snapshot or Navigator Window,” on page 61
Section 2.17, “Taking a Snapshot of a Navigator Window,” on page 62
Section 2.18, “Sorting Columns in a Snapshot,” on page 63
Section 2.19, “Closing a Snapshot or Navigator,” on page 63
Section 2.20, “Adding Events to an Incident,” on page 63
2.1 Understanding Active Views
The Active Views tab presents events in near-real time. In the Active Views tab, you can:
View events occurring in near real time
Investigate events
Graph Events
Perform Historical Statistical Analysis
Invoke right-click functions
Initiate manual incidents and remediation workflows
An event represents a normalized log record reported to Sentinel from a third party security,
network, or application device or from an internal Sentinel source. There are several types of events:
External Events (event received from a security device), such as:
An attack detected by an Intrusion Detection System (IDS)
Active Views Tab
35
Page 36

A successful login reported by an operating system
A customer-defined situation such as a user accessing a file
Internal Events (an event generated by Sentinel), including:
A correlation rule being disabled
Database filling up
You can monitor the events in a tabular form or using several different types of charts, you can
perform queries for recent events.
NOTE: Access to these features can be enabled or disabled for each user. For more information, see
“Sentinel Database Users, Roles, and Access Permissions ” in Sentinel 6.1 Reference Guide
2.2 Introduction to the User Interface
In Active Views, you can see Create Active View and Event Query. You can navigate to these
functions from:
novdocx (en) 7 January 2010
Table 2-1 Active View-User Interface
The Active View menu in the Menu Bar
When you create a filter, The Active View
menu has these additional options.
The Navigation Tree in the Navigation Pane
36 Sentinel 6.1 User Guide
Page 37

The Toolbar Buttons
Active Views provides two types of views which display the events in Tables and Graphs.
Table Format displays the variables of the events as columns in a table. You can sort the information
in the grid by clicking on the column name.
Figure 2-1 Active View-Tabular Format
Graphical Format displays events as Graphs. You can change the chart types to display other chart
types.
novdocx (en) 7 January 2010
Figure 2-2 Active View-Graphical Format
A near Real Time Event Table with graphical presentation and Snapshot are the two types of Active
Views.
Near Real Time Event Table:
Holds up to 750 events per 30-second period. If there are more than 750 events, the events
are displayed in the following priority order: correlated events, events that are sent to the
GUI only using a global filter, and all remaining events.
By default, the client maintains a 24-hour period of cached events. This is configurable
through Active View Properties.
By default, the smallest possible display interval of an active view is 30 seconds. This is
represented by a gray line in the event table.
Active Views Tab 37
Page 38

Figure 2-3 Gray Line- Smallest Possible Display Interval
In the event when there are more than 750 per 30-second time period, a red separation line
displays indicating that there are more events than what is displayed. The other events can
be viewed by using Historical Queries.
Figure 2-4 Red Line- More Events then Displayed
On saving user preferences, system continues to collect data for 4 days. For instance, if
you save your preferences, log out and log back in the following day, your Active View
displays data as if you never logged off.
If an Active View is created and not saved, it will continue to collect data for an hour.
Within that hour time frame if an identical Active View is created, the Active View
displays data for the last hour.
novdocx (en) 7 January 2010
Snapshot: Time-stamped views of a Real Time Event View table.
The following is what makes an Active View unique.
Filter assigned to an Active View
The z-axis attribute
The security filter assigned to a user
The Active Views Tab allows you to:
Reconfigure Total Display Time
Add Events to an incident
Close a Snapshot or Navigator Window
Create an Incident
Custom Menu Options with Events
Investigate Event Query
Investigate Graph Map
View Advisor Data
Manage Columns
Send messages about Events by e-mail
Show or Hide Event Details
Snapshot of a Navigator Window
View Events that triggered a correlated event
View Vulnerability Visualization
View Asset Data
Integrate with Ticketing System
View Identity Browser
You can change labels (column names) to user-friendly names and the new names will be populated
throughout the system. For more information, see Section 2.15, “Using Custom Menu Options with
Events,” on page 61.
38 Sentinel 6.1 User Guide
Page 39

2.3 Reconfiguring Total Display Time
Active View Properties allows you to configure the cached time in each client. The default cache
time value in an Active View is 24 hours.
To configure Maximum Total Display Time:
1 Click the Active Views tab.
2 Click Active Views > Properties.
3 Make your changes. Click OK.
novdocx (en) 7 January 2010
NOTE: The new values will not take effect until you restart the Sentinel Control Center.
2.4 Viewing Real Time Events
To View Real Time Events:
1 Click the Active Views tab.
2 Click Active Views > Create Active View or click Create Active View icon.
3 In the Event Visualization Wizard window, click the down arrows to select your Event
Attribute (Z Axis), Filter and to Display Events (Yes or No).
NOTE: In the Filter Selection window you can build your own filter or select one of the
already built filters. Selecting the All filter allows all events to display in your window. When
creating an Active View, if the filter assigned to the Active View is changed or deleted after
creation of the Active View, the Active View is unaffected.
Active Views Tab 39
Page 40

novdocx (en) 7 January 2010
After making your selection, you can click Next or Finish. If you select Finish, the following
default values are selected:
Display Interval and Refresh rate of 30 seconds
Total Display Time of 15 minutes
Y-axis as Event Count
Chart type: Stacked Bar 2D
4 If you click Next, click the down arrows to select your:
Display Interval and Refresh rate:
Display Interval is the Time interval to display events.
Refresh Rate is the rate at which Active Views should refresh.
Total Display Time: Amount of time to display the chart
Y-a x is : Either total Event Count or Event Count per Second
Click Next.
5 Select your chart type from the drop-down list and click Finish.
Chart type: Stacked Bar 2D, Bar 3D, Line and Ribbon
Your graph looks similar to:
40 Sentinel 6.1 User Guide
Page 41

The five buttons to the left of the chart perform the following functions:
novdocx (en) 7 January 2010
When you click the Lock button, additional available buttons are:
2.4.1 To Reset Parameters and Chart Type of an Active View
When viewing an Active View, you can reset your chart parameters, change your chart type.
To Reset Parameters and Chart Type of an Active View:
1 Within an Active View displaying a chart, right-click and select Properties.
Active Views Tab 41
Page 42

novdocx (en) 7 January 2010
Under the Parameters tab, you can set:
Display Interval: Time between each interval
Refresh Rate: Number of seconds for event rate to be updated
Total Display Time: Amount of time to display the chart
Y-a x is : Either total Event Count or Event Count per Second
Under the Chart Types tab, you can set your chart to Stacked Bar2D, Bar 3D, Line or Ribbon.
42 Sentinel 6.1 User Guide
Page 43

2.4.2 Rotating a 3D Bar or Ribbon Chart
To rotate a 3D bar or ribbon chart:
1 Click anywhere on the chart and hold the mouse button.
2 Reposition the chart as desired by moving the mouse and holding the button.
2.5 Showing and Hiding Event Details
To show event details:
1 In a Real Time Event Table of the Navigator or Snapshot, double-click or right-click an event
and click Show Details. An event details displays in the left panel of the Real Time Event
Table.
novdocx (en) 7 January 2010
To hide an event detail:
1 In an Real Time Event Table of the Navigator or Snapshot, with event details displayed in the
left panel, right-click an event and click Show Details. The Event Details window closes.
2.6 Sending Mail Messages about Events and Incidents
To send mail messages from within the Sentinel Control Center, you must have an SMTP Integrator
is configured with connection information and with the property SentinelDefaultEMailServer set to
“true”.
To send an event message by e-mail:
1 In a Real Time Event Table, select an event or a group of events, right-click and select Email.
Active Views Tab 43
Page 44

novdocx (en) 7 January 2010
2 Provide the following information:
Email Address
Email Subject
Email Message
3 Click OK.
To e-mail an Incident:
1 After you save your incident, click the Incidents tab, Incidents > Incidents View.
2 Click All Incidents option in the Switch View drop down list located at the bottom right corner.
3 Double-click an Incident.
4 Click Email Incident.
5 Provide the following information:
Email Address
44 Sentinel 6.1 User Guide
Page 45

Email Subject
Email Message
6 Click OK. The e-mail messages have html attachments that address incident details, events,
assets, vulnerabilities, advisor information, attachment information, Incident Notes and
incident history.
2.7 Creating Incidents
NOTE: To perform this function you must have user permission to create Incident(s).
This is useful in grouping a set of events together as a whole representing something of interest
(group of similar events or set of different events that indicate a pattern of interest such an attack).
NOTE: If events are not initially displayed in a newly created Incident, it is most likely because of a
lag in the time between display in the Real Time Events window and insertion into the database. If
this occurs, it will take a few minutes for the original events to finally be inserted into the database
and display in the incident.
novdocx (en) 7 January 2010
To create an incident:
1 In a Real Time Event Table of the Navigator or a Snapshot Real Time Event Table, select an
event or a group of events and right-click and select Create Incident.
2 In the New Incident window, you will find the following tabs:
Events: Shows which events make up the incident
Assets: Show affected assets
Vulnerability: Show related asset vulnerabilities
Advisor: Asset attack and alert information
iTRAC: Under this tab, you can assign a WorkFlow (iTRAC)
History: Incident history
Attachments: You can attach any document or text file with pertinent information to this
incident
Notes: You can specify any general notes you want to refer regarding this incident.
Active Views Tab 45
Page 46

3 In the Create Incident dialog box, specify:
Title
State
Severity
Priority
Category
Responsible
Description
Resolution
4 Click Create. The incident is added under the Incidents tab of the Sentinel Control Center.
2.8 Viewing Events that Triggered Correlated Events
Correlated events are determined based on the RT2 field value of the event. The RT2 field is set to
the name of the Correlation rule that triggered the Correlated event. This value is set only when the
event is generated by the Correlation engine. For the Correlated events, the Resource field is set to
Correlation
and the SensorType field is set to C. However, the following are the exceptions:
novdocx (en) 7 January 2010
The SensorType field is set to T for the Correlated events that are routed to
If you are using the action
the Resource field to any value, the Resource field displays the value that you have set.
The View Trigger Events option is enabled only for Correlated events.
1 In the Real-Time event table of the Navigator or Snapshot, or an Event Query table, right-click
a Correlated event, and select View Trigger Events.
A window displays showing the events that triggered the rule and the name of the Correlation
Rule.
NOTE: For Correlated events, Trigger events are not available if events were routed to GUI
only. However, the View Trigger Events option is enabled even if the Trigger events are not
available.
Configure Correlated Event
with a Correlation rule and you set
gui only
.
46 Sentinel 6.1 User Guide
Page 47

2.9 Investigating an Event or Events
This Investigate options on the Event Menu allow you to:
Perform a Event Query for the last hour on a single event for:
Other events with the same target IP address
Other events with the same source (initiator) IP address
Other targets with the same event name
NOTE: You cannot perform a query on a null (empty) field.
Graphically display the mappings between any two fields in the selected events. This is
particularly useful to view the relationship between the initiatiors (IP, port, event, sensor type,
Collector) and the targets (IP, port, event, sensor type, Collector name) of the selected events,
but any fields can be used
Below is an illustration of initiator IP addresses mapped to target IP addresses.
Figure 2-5 Graph Mapper
novdocx (en) 7 January 2010
2.9.1 Investigate – Event Query
This function allows you to perform Event Query within the last hour for events similar to the
selected event.
To perform an Event Query using the Investigate function:
1 In a Navigator or Snapshot window, right-click an event>Investigate> <select one of three
options below>
Active Views Tab 47
Page 48

Option Function
Show More Events to this target Events with the same Destination IP address
Show More Events from this source Events with the same Initiator IP address
What are the target objects of this event? Events with the same event name as the
selected event
2 An event table opens showing the chosen event information.
2.9.2 Investigate – Graph Mapper
To create a graph map:
1 In Real Time Event Table right-click an event or events and select Investigate>Show Graph.
novdocx (en) 7 January 2010
2 You must specify the From and To fields and click Finish. The Graph Mapper window
displays.
The following is a graphic depiction of Sensor Name to Event Name of severity 5 in an organic
format. You can view a graphic mapping in the following formats:
48 Sentinel 6.1 User Guide
Page 49

novdocx (en) 7 January 2010
Circular
Hierarchical
Organic
Orthogonal
2.9.3 Historical Event Query
You can query the database for the past events through Historical Event Query. The events can be
queried according to the filter and severity criteria in required batch size. You can export the results
HTML
or
CSV
in
To query events in Historical Event Query window:
1 In the Active Views tab, select Active Views > Event Query. You can also open Historical
Event Query window by clicking Historical Query Icon on the toolbar. The Historical Event
Query window displays.
file format.
Active Views Tab 49
Page 50

2 Click Filter. In Filter Selection window, select a filter from the list of available filters.
3 Click Severity Icon. Select Severity values window displays.
Select one or more values for Severity and click OK
4 You must select From and To Date and Time from From and To drop-down. The Time you
select corresponds your system time.
novdocx (en) 7 January 2010
5 Select a batch size from the Batch size drop down. The events queried displays in the batch size
you specify.
If you select a batch size of 100, the first 100 events are displayed in the window first. After the
query is processed, the Begin Searching icon changes to More results icon. You can see next
100 events along with the previous events by clicking More results icon.
6 Click Begin Searching Icon. The query is processed. You can stop/cancel the search by
clicking Cancel search icon.
TIP: Select HTML or CSV from the drop-down list to export query results.
50 Sentinel 6.1 User Guide
Page 51

2.9.4 Active Browser
The Active Browser provides the ability to browse through a selected set of data to look for patterns
and perform investigation. You can view the selected events in the Active Views in Active Browser.
You can perform all the right-click activities that are available in Active Views in Active Browser
too. When you open the Active Browser using Analysis > Offline Query and click Browse against a
specific offline query, the events table is displayed only when the number of events are less than or
equal to1000.
The events are grouped according to the metatags. In these metatags various sub-categories are
defined. The numbers in the parentheses against these sub-categories displays the total number of
event counts corresponding to the value of the metatag.
To view events in Active Browser:
1 In the Active Views tab, highlight the event/s you want to view in Active Browser.
2 Right-click event/s and select View in Active Browser. The selected event/s displays in the
Active Browser window.
Or
3 In the Active Views tab, select Active Views > Event Query. Historical Event Query window
displays.
4 In the Historical EventQuery window, run a Query and click Active Browser tab. The selected
Query displays in the Active Browser window.
novdocx (en) 7 January 2010
NOTE: The Active Browser tab will be enabled only if the Query results in at least one event
displays.
To view events in Active Browser in Analysis tab:
1 In the Analysis tab, highlight the Query you want to view in Active Browser.
Active Views Tab 51
Page 52

2 Click Browse. The selected Query result displays in the Active Browser window.
novdocx (en) 7 January 2010
To search in Active Browser:
1 Specify the value or text you want to search for in the Search field
2 Press Enter or click the Search icon against the search field to search.
NOTE: You can move between the various searches by using the Forward and Backward button
above the search field.
To add attributes in Active Browser:
1 Click Add an attribute for categorization icon as shown below:
2 Select an attribute in the Add an attribute for categorization window that displays.
52 Sentinel 6.1 User Guide
Page 53

3 Click OK.
2.10 Viewing Advisor Data
novdocx (en) 7 January 2010
Advisor provides a cross-reference between real-time IDS attack signatures and Advisor's
knowledge base of vulnerabilities.
The supported Intrusion Detection Systems are listed in Chapter 8, “Advisor Usage and
Maintenance,” on page 159.
To View Advisor Data:
1 In a Real Time Event Table of the Navigator or Snapshot, right-click an event or a series of
selected events > Analyze > Advisor Data. If the
populated, a report similar to the one below displays. This example is for a WEB-MISC
amazon 1-click cookie theft.
DeviceAttackName
field is properly
Active Views Tab 53
Page 54

2.11 Viewing Asset Data
Asset data displays the asset information related to a machine or device from which you are
receiving events. You can view and save the Asset data report as an HTML file. You must run your
asset management Collector to view this data. The available data for viewing are:
Hardware
MAC Address
Name
Type
Vendor
Product
Version
Value
Criticality
Network
novdocx (en) 7 January 2010
IP Address
Hostname
Software
Name
Type
Vendor
Product
Version
Contacts
Order
Name
Role
Email
Phone Number
Location
Location
Address
To view Asset Data:
1 In the Active Views table of the Navigator or Snapshot window, right-click an event or multiple
events.
2 Select Analyze > Asset Data.
54 Sentinel 6.1 User Guide
Page 55

If both the Source IP and Destination IP are populated in an event, the asset data is displayed
for both. If either of them is populated, the respective asset data is displayed.
novdocx (en) 7 January 2010
2.12 Viewing Vulnerabilities
Vulnerability Visualization provides a textual or graphical representation of the vulnerabilities of
selected destination systems. Vulnerabilities for the selected destination IPs can be seen for the
current time or for the time of the selected events.
Vulnerability Visualization requires that a vulnerability Collector is running and adding
vulnerability scan information to the Sentinel database. The Novell Web site (http://
support.novell.com/products/sentinel/collectors.html) provides Collectors for several industry-
standard vulnerability scanners, and additional vulnerability Collectors can be written using
Collector Builder.
NOTE: Vulnerability Collectors are distinct from Event Collectors and use different commands.
There are several Vulnerability Visualization views:
HTML
Graphical
Circular
Organic
Active Views Tab 55
Page 56

Hierarchical
Orthogonal
The HTML view is a report view that lists relevant fields, depending on which vulnerability scanner
you have:
IP
Host
Vulnerability
Port/protocol
Figure 2-6 Viewing Vulnerability
novdocx (en) 7 January 2010
The graphical display is a rendering of vulnerabilities that link them to an event through common
ports. Below are the examples of the four available views:
56 Sentinel 6.1 User Guide
Page 57

Figure 2-7 Organic View
novdocx (en) 7 January 2010
Figure 2-8 Hierarchical View
Active Views Tab 57
Page 58

Figure 2-9 Circular View
novdocx (en) 7 January 2010
Figure 2-10 Orthogonal View
In the graphical display there are four panels. They are:
Graph panel
Tree panel
Control panel
Details/events panel
The graph panel display associates vulnerabilities to a port/protocol combination of a resource (IP
address). For example, if a resource has five unique port/protocol combinations that are vulnerable,
there are five nodes attached to that resource. The resources are grouped together under the scanner
that scanned the resources and reported the vulnerabilities. If two different scanners are used (ISS
and Nessus), there are two independent scanner nodes that will have vulnerabilities associated with
them.
58 Sentinel 6.1 User Guide
Page 59

NOTE: Event mapping takes place only between the selected events and the vulnerability data
returned.
The tree panel organizes data in same hierarchy as the graph. The tree panel also allows users to
hide/show nodes at any level in the hierarchy.
The control panel exposes all the functionality available in the display. This includes:
Four different algorithms to display
Ability to show all or selected nodes which have events mapped to them
Zooming in and out of selected areas of the graph
There are two tabs in the Details/Events panel. When in the Details tab, clicking on a node results in
displaying node details. When in the Events tab, clicking on an event associated with a node the
node displays in tabular form as in a Real Time or Event Query window.
To run a Vulnerability Visualization:
1 In an Real Time Event Table of the Navigator or Snapshot, right-click an event or a series of
selected events and click:
Analysis:
novdocx (en) 7 January 2010
Current Vulnerability: Queries the database for vulnerabilities that are active
(effective) at the current date and time.
Event Time Vulnerability: Queries the database for vulnerabilities that were active
(effective) at the date and time of the selected event.
2 At the bottom the vulnerability results window, click either:
Event to Vulnerability Graph
Vulnerability Report
Active Views Tab 59
Page 60
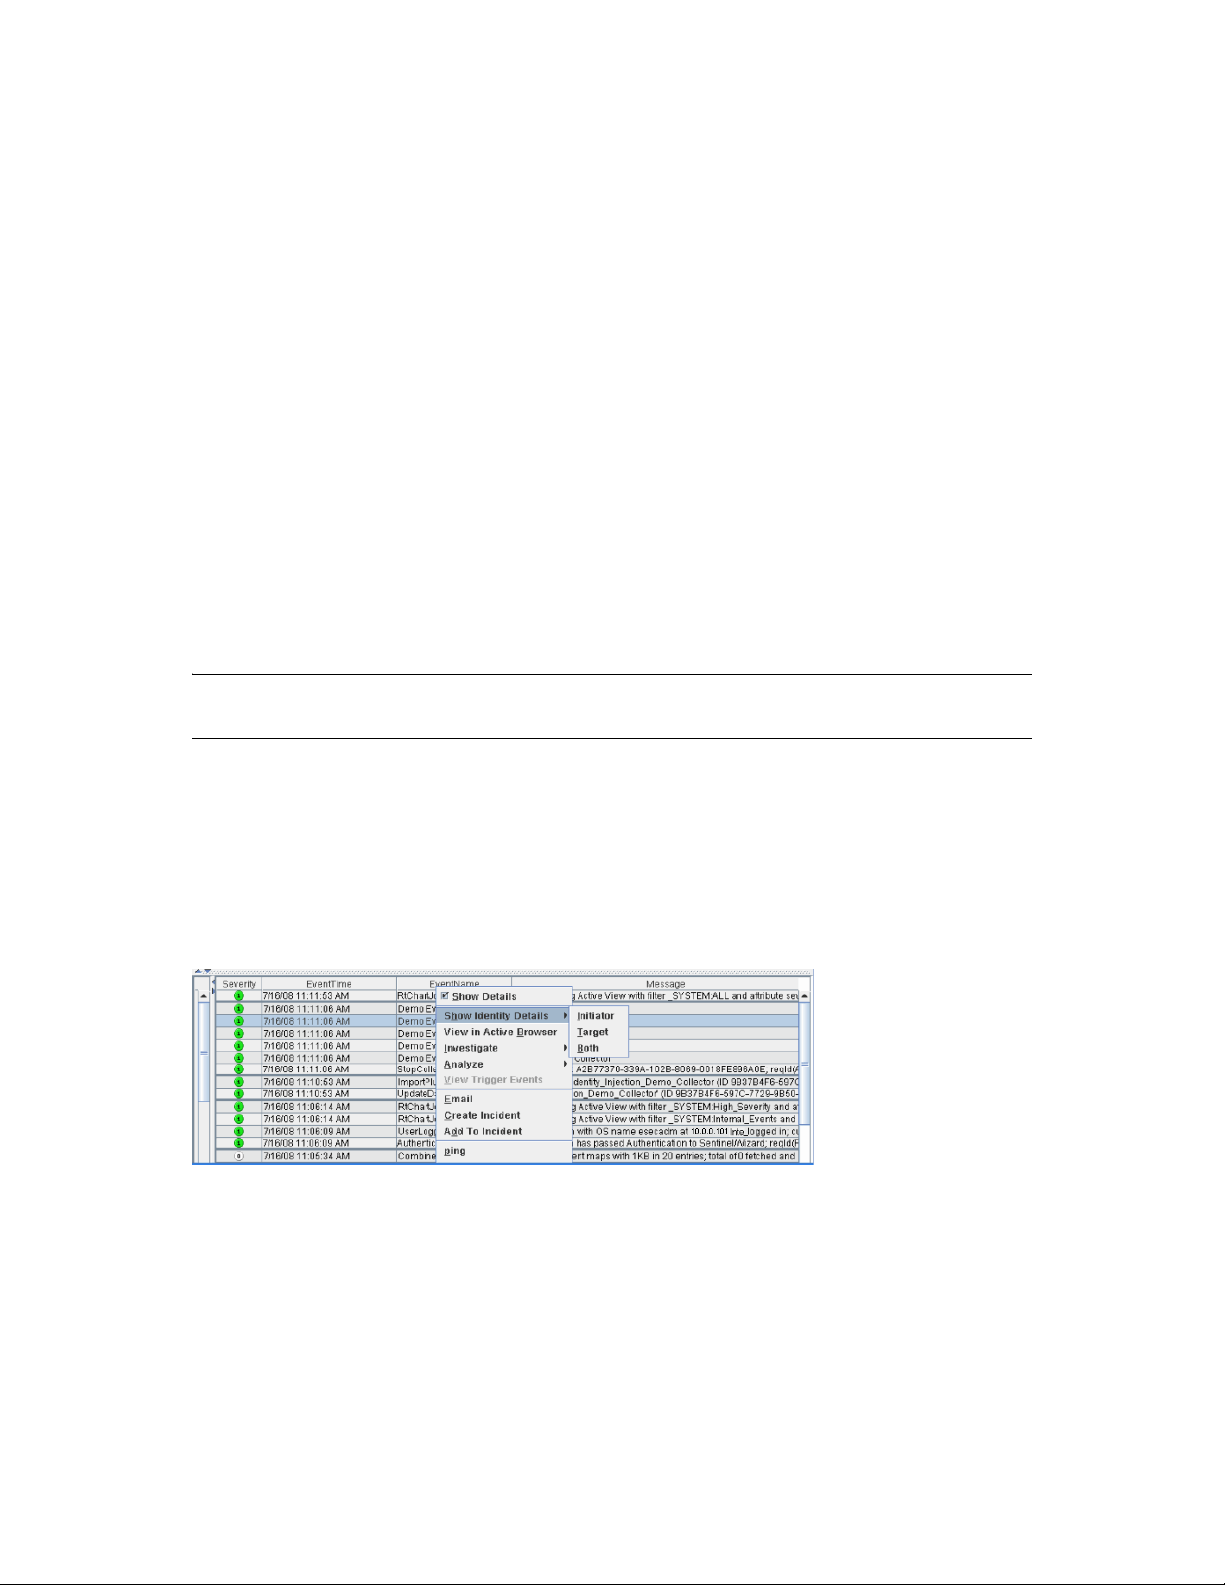
3 (For Event to Vulnerability Graph) Within the display, you can:
move nodes and their labels
use one of four different layout algorithms to display the graph
show all nodes or only those nodes that have events mapped to them
in-line tree filtering in the event that a large number of resources are returned as
vulnerable
zoom in and out of selected areas
2.13 Ticketing System Integration
Novell provides optional integration modules for BMC Remedy that allows you to send events from
any display screen to one of these external ticketing systems.
You can also send incidents and their associated information (asset data, vulnerability data, or
attached files) to Remedy.
For more information on Remedy integration, see Remedy Integration Guide, available at the
following web site for users with a Remedy integration license: http://support.novell.com/products/
sentinel/sentinel61.html (http://support.novell.com/products/sentinel/sentinel61.html).
novdocx (en) 7 January 2010
NOTE: The permission to create Remedy incidents is controlled by the administrator on a user-byuser basis.
2.14 Viewing User Information
Novell provides optional integration with identity management systems, specifically Novell Identity
Manager. With this integration, user identity information will be added to incoming events when the
account name matches one from Novell Identity Manager. When the
TargetUserIdentity
to open the user’s page in the Identity Browser.
When you select Show Identity Details, you can choose to view the identity of the Initiator user, the
Target user, or Both. The Identity Browser opens and shows identifying information about the user
(or users) from the identity management system, all the accounts to which the user is provisioned,
and the recent activity by that user. For more information on Identity Browser, see Chapter 18,
“Identity Integration,” on page 431 section.
column is populated in an event, a right-click option menu option is enabled
InitUserIdentity
or
60 Sentinel 6.1 User Guide
Page 61

2.15 Using Custom Menu Options with Events
In an existing Real Time Event Table of the Visual Navigator or Snapshot, right-click an event and
select a menu option. The default custom menu options are as follows:
ping
nslookup
tracert
Whois?
The default custom menu options are only available when you right-click a single event, and are
disabled when you right-click multiple events. However, custom menus with JavaScript based
actions are available as JavaScript actions support multiple events. You can further assign user
permissions to View Vulnerability. You can add options using the Event Menu Configuration option
on the Admin tab.
novdocx (en) 7 January 2010
2.16 Managing Columns in a Snapshot or Navigator Window
To select and arrange columns in a Snapshot or Navigator:
1 With a Snapshot or Navigator window open, click Active View > Event Real Time > Manage
Columns or click the Manage Columns of Real Time Event Table.
2 Use the Add and Remove buttons to move column titles between the Available Columns list
and the Show these columns in this order list. The Insert button can be used to insert an
available column item into a specific location. For example, in the illustration below clicking
Insert will place AttackId above DateTime.
Active Views Tab 61
Page 62

novdocx (en) 7 January 2010
Use the Up and Down arrow buttons to arrange the order of the columns as you want them to
display in the Real Time Event Table. The top to bottom order of column titles in the Manage
Column dialog box determines the left to right order of the columns in the Real Time Event
Table.
3 In the Manage Column dialog box, click OK.
4 If you want your columns to display the next time you open the Sentinel Control Center, click
File > Save Preferences or click Save User Preference icon
2.17 Taking a Snapshot of a Navigator Window
To perform this function you must have user permission Snapshot.
This is useful to study events of interest because the Navigator refreshes automatically and the alert
or alerts of interest will scroll off the screen. Also, within a snapshot, you can sort by column.
To take a snapshot of a Real Time Event Table:
1 With a Navigator window open, click Active View > Event Real Time > Snapshot or click
Snapshot Event Real Time Table icon
A Snapshot window opens and is added to the Snap Shots folder list under Active Views in the
Navigator. The graphical display will not be part of the snapshot.
62 Sentinel 6.1 User Guide
Page 63

2.18 Sorting Columns in a Snapshot
To sort columns in a Snapshot:
1 Click any column header once to sort by ascending value and twice to sort by descending
value.
2.19 Closing a Snapshot or Navigator
To close a Snapshot or a Real Time Event Table:
1 With a Snapshot or Navigator open, close by using the Close button (upper right corner in
Windows or upper right corner in Windows/SUSE Linux/Red Hat Linux or upper left corner in
Solaris).
NOTE: The view or snapshot will not redisplay when you close and reopen the Sentinel Control
Center.
novdocx (en) 7 January 2010
2.20 Adding Events to an Incident
To perform this function you must have user permissions to Modify Incident(s) and Add to existing
Incident(s).
To add events to an incident:
1 In a Real Time Event Table or a Snapshot, select an event or a group of events and right-click.
Click Add To Incident.
2 In the Add Events To Incident dialog box, click Browse to list the available incidents.
Active Views Tab 63
Page 64

3 Select Incident window displays. Click Search to view a list of incidents. List of incidents of
selected criteria displays.
NOTE: You can define your criteria to better search for a particular incident or incidents in
Select Incident window.
novdocx (en) 7 January 2010
4 Highlight an incident and click Add.
5 Click OK. The event or events selected are added to the incident in the Incidents Navigator.
NOTE: If events are not initially displayed in a newly created Incident, it is most likely
because of a lag in the time between display in the Real Time Events window and insertion into
the database. If this occurs, it will take a few minutes for the original events to finally be
inserted into the database and display in the incident.
64 Sentinel 6.1 User Guide
Page 65

3
Correlation Tab
Section 3.1, “Understanding Correlation,” on page 65
Section 3.2, “Introduction to the User Interface,” on page 67
Section 3.3, “Correlation Rules,” on page 67
Section 3.4, “Dynamic Lists,” on page 82
Section 3.5, “Correlation Engine,” on page 85
Section 3.6, “Correlation Actions,” on page 86
3.1 Understanding Correlation
Sometimes, an event viewed in the system might not necessarily draw your attention. But, when you
correlate a set of similar or comparable events in a given period, it might lead you to an alarming
event. Sentinel helps you correlate such events with the rules you create and deploy in the
Correlation engine and take appropriate action to mitigate any alarming situation.
novdocx (en) 7 January 2010
3
Correlation adds intelligence to security event management by automating analysis of the incoming
event stream to find patterns of interest. Correlation allows you to define rules that identify critical
threats and complex attack patterns so that you can prioritize events and initiate effective incident
management and response. Starting with Sentinel 6.0, the correlation engine is built with a
pluggable framework, which allows the addition of new correlation engines in the future.
Correlation rules define a pattern of events that should trigger, or fire, a rule. Using either the
correlation rule wizard or the simple RuleLG language, you can create rules that range from simple
to extremely complex, for example:
High severity event from a finance server
High severity event from any server brought online in the past 10 days
Five failed logins in 2 minutes
Five failed logins in 2 minutes to the same server from the same username
Intrusion detection event targeting a server, followed by an attempted login to root originating
from that same server within 60 seconds
Two or more of these rules can be combined into one composite rule. The rule definition determines
the conditions under which the composite rule fires:
All subrules must fire
A specified number of subrules must fire
The subrules must fire in a particular sequence
After the rule is defined, it should be deployed to an active Correlation Engine, and one or more
actions can be associated with it. After the rule is deployed, the Correlation Engine processes events
from the real-time event stream to determine whether they should trigger any of the active rules to
fire.
Correlation Tab
65
Page 66

NOTE: Events that are sent directly to the database or dropped by a Global Filter is not processed
by the Correlation Engine.
When a rule fires, a correlated event is sent to the Sentinel Control Center, where it can be viewed in
the Active Views window.
Figure 3-1 Active View window
novdocx (en) 7 January 2010
The correlated event can also trigger actions, such as sending an email with the correlated event’s
details or creating an incident associated with an iTRAC workflow.
3.1.1 Technical Implementation
All correlation is done in-memory on the machine (or machines) that host the correlation engine.
This model allows fast, distributed processing that does not contend with database operations such
as inserting events into the database.
For environments with large numbers of correlation rules or extremely high event rates, it might be
advantageous to install more than one correlation engine and redeploy some rules to the new
correlation engine. The ability to deploy multiple correlation engines provides the ability to scale as
the Sentinel system incorporates additional data sources or as event rates increase.
Sentinel’s correlation is near real-time and depends on the timestamp for the individual events. To
synchronize time, you can use an NTP (Network Time Protocol) server to synchronize the time on
all devices on your network, or you can rely on the time on the Collector Manager servers and
synchronize only those few machines.
Correlation relies on the data that is collected, parsed, and normalized by the Collectors, so a
working understanding of the data is necessary to write rules. Many Novell correlation rules rely on
an event taxonomy that ensures that a “failed login” and an “unsuccessful logon” from two devices
are classified the same.
66 Sentinel 6.1 User Guide
Page 67

In the Correlation tab, you can:
Create/Modify Correlation rules and rule folders
Deploy Correlation rules on Correlation Engine
Create and associate an action to a rule
Configure Dynamic lists
NOTE: Access to the correlation functions can be enabled by the administrator on a user-by-user
basis.
3.2 Introduction to the User Interface
In Correlation, you can see the Correlation Rule Manager, Correlation Engine Manager, Correlation
Action Manager and Dynamic Lists.
You can navigate to these functions from:
Table 3-1 Correlation-User Interface
novdocx (en) 7 January 2010
The Correlation menu in the Menu Bar
The Navigation Tree in the Navigation Pane
The Toolbar Buttons
3.3 Correlation Rules
Correlation Rules are created, modified, renamed, deployed/undeployed in the Correlation Rule
Manager. Correlation Rules are organized into Rule Folders, which can also be managed in the
Correlation Rule Manager.
NOTE: There is no limit to the number of users that can access Correlation Rules. When more than
one user is editing the same rule, the last person to save overwrites all previous saves.
Correlation Tab 67
Page 68

3.3.1 Opening the Correlation Rule Manager
To open the Correlation Rules Manager:
1 Click Correlation tab.
2 In the navigator, click Correlation Rules Manager. Alternatively, click Correlation Rules
Manager button in the Tool Bar. The Correlation Rule Manager window displays.
3.3.2 Creating a Rule Folder
novdocx (en) 7 January 2010
To create a Rule Folder:
1 Open the Correlation Rules Manager window and click Manage Folder.
2 Highlight and right-click a folder and select Add Folder.
3 Specify Rule Folder name.
3.3.3 Renaming a Rule Folder
To rename a Rule Folder:
1 Open the Correlation Rules Manager window and click Manage Folder.
2 Select a folder and click Rename. Change the name of the folder.
To delete a Rule Folder:
1 Open the Correlation Rules Manager window and click Manage Folder.
2 Select a folder and click Delete. Click Yes when the system asks for confirmation.
3.3.4 Creating a Correlation Rule
To create a Correlation Rule:
1 Open the Correlation Rules Manager window and select a folder from the Folder drop-down
list to which this rule is added.
2 Click Add button located on the top left corner of the screen.
3 The Rule Wizard displays. Select one of the following rule types and follow the steps for that
particular rule type:
Simple
Composite
68 Sentinel 6.1 User Guide
Page 69

Aggregate
Sequence
Custom/Freeform
4 Define the update criteria for the rule. If you select Continue to perform actions every time this
rule fires, the rule fires every time the criteria is met. If you select Do not perform actions every
time this rule fires for the next (t) time the events fires only once as per user-defined time
period. All the other events that match the correlation rule within the specified time are grouped
together with this correlated event. This user-defined time period can be a certain number of
seconds, minutes, or hours.
5 Click Next.
6 Provide the rule name. The syntax of the rule is checked at the time it is created.
7 Under Namespace, select a correlation rule folder in which to store the rule.
8 Type the description of the rule.
9 Click Next. The rule is created and displays in the Correlation Rules Manager window.
10 Select Yes if you want to create another rule or No if you do not want to create another rule.
Click Next.
novdocx (en) 7 January 2010
The rule types and the steps to create them are described below.
3.3.5 Creating Correlation Rules
Correlation rules can be defined in the Correlation Rule wizard by walking through the wizard or by
choosing the Custom/Freeform option to write the rule in the proprietary RuleLG language. All rule
definitions are stored in the database in RuleLG.
Correlation rules can be defined based on any populated event field.
NOTE: When creating a Rule, you can refer to a dynamic list to it. For more information, see
Section 3.4.5, “Using a Dynamic List in a Correlation Rule,” on page 84.
Simple Rule
A simple rule is defined by specifying which events can trigger the rule to fire (For example,
firewall events, firewall events of severity 3 or higher). The filter criteria can be intersected (using
the “all”option in the GUI or the “AND” operator in RuleLG) or the filter criteria can be unioned
(using the “any” option in the GUI or the “OR” operator in RuleLG).
For example, a rule might be defined so that it fires anytime an event takes place on a server that is
on the critical list. Another rule might be defined to fire anytime an event of severity 4 or greater
takes place on a server that is on the critical list.
A simple rule requires only one event in order to fire.
NOTE: For users familiar with the correlation rule language (RuleLG), the defining operator for a
simple rule is the “filter” operator. For more information about RuleLG, see “Sentinel Correlation
Engine RuleLG Language” in the Sentinel 6.1 Reference Guide.
Correlation Tab 69
Page 70

NOTE: In Sentinel 6, filter criteria must be defined in the correlation rule wizard. You cannot use
existing public filters.
To create a simple rule:
1 Open the Correlation Rules Manager window and select a folder from the drop-down list to
which this rule is added.
2 Click Add button located on the top left corner of the screen. The Correlation Rule window
displays. Select Simple Rule.
novdocx (en) 7 January 2010
3 In the Simple Rule window, define a condition for this rule. Select the Property and Operator
values from the drop-down lists and specify data in value field.
70 Sentinel 6.1 User Guide
Page 71

4 Click Add to add additional definitions for this rule.
novdocx (en) 7 January 2010
5 You can preview the rule in the RuleLG preview window. For example,
filter(e.sev=3)
.
Click Next. The Update Criteria window displays.
6 Enable the update criteria for the rule to fire and click Next. The General Description window
displays.
7 Provide a name to this rule. You have an option to modify the rule folder.
8 Provide rule description and click Next.
9 You have an option to create another rule from this wizard. Select your option and click Next.
Aggregate Rule
An aggregate rule is defined by specifying a subrule and the number of times the subrule must fire
within a specific time window in order to trigger the aggregate rule. For example, an aggregate rule
might require that a subrule fire 10 times within 5 minutes for the aggregate rule to fire.
Aggregate rules have an optional group by field, which can be any populated field from the events.
For example, an aggregate rule might require that a subrule fire 10 times within 5 minutes where
each of the 10 events has the same destination server.
NOTE: For users familiar with the correlation rule language (RuleLG), the defining operator for an
aggregate rule is the “trigger” operator. The trigger clause might also use the “discriminator”
operator to define the group by field. For more information about RuleLG, see the “Sentinel
Correlation Engine RuleLG Language” in the Sentinel 6.1 Reference Guide.
Correlation Tab 71
Page 72

To create an aggregate rule:
1 Open the Correlation Rules Manager window and select a folder from the drop-down list to
which this rule is added.
2 Click Add button located on the top left corner of the screen. The Correlation Rule window
displays. Select Aggregate Rule.
novdocx (en) 7 January 2010
3 In Aggregate Rule window, you can select a sub-rule to create an aggregate rule. To select a
sub-rule, click Add Rule button. Add Rule window displays.
NOTE: You can select only one sub-rule when creating an aggregate rule.
72 Sentinel 6.1 User Guide
Page 73

4 Select a rule and click OK.
5 Set parameters for the rule to fire.
6 To group event tags according to the attributes, Click Add/Edit. The Attribute List window
displays.
novdocx (en) 7 January 2010
7 Check the attribute as per your requirement. You can preview the rule in the RuleLG preview
window. Click Next. The Update Criteria window displays.
8 Update the criteria for the rule to fire and click Next. The General Description window
displays.
9 Provide a name to this rule. You have an option to modify the rule folder.
10 Provide rule description and click Next.
11 You have an option to create another rule from this wizard. Select your option and click Next.
Composite Rule
A composite rule is comprised of 2 or more subrules. A composite rule can be defined so that all or
a specified number of the subrules must fire within the defined timeframe. Composite rules have an
optional group by field, which can be any populated field from the events.
NOTE: When a subrule is used to create a composite rule, a copy of the subrule is added to the
composite rule’s definition. Because a copy is added, changes to the original subrule do not affect
the composite rule.
To create a composite rule:
1 Open the Correlation Rules Manager window and select a folder from the drop-down list to
which this rule is added.
2 Click Add button located on the top left corner of the screen. The Correlation Rule window
displays. Select Composite Rule.
Correlation Tab 73
Page 74

novdocx (en) 7 January 2010
3 In Composite Rule window, you can select sub-rules to create a composite rule. To select a sub-
rule, click Add Rule button. Add Rule window displays.
4 Select a rule or a set of rules (hold control on your keyboard to select a set of rules) and click
OK.
5 Set parameters for the rule to fire.
6 To group event tags according to the attributes, Click Add/Edit. The Attribute window
displays.
7 Check the attribute as per your requirement. You can preview the rule in RuleLg preview box.
Click Next, the Update Criteria window displays.
8 Update criteria for the rule to fire and click Next.
9 Provide a name to this rule. You have an option to modify the rule folder.
10 Provide rule description and click Next.
11 You have an option to create another rule from this wizard. Select your option and click Next.
Sequence
A sequence rule is comprised of 2 or more subrules that must have been triggered in a specific order
within the defined timeframe. Sequence rules have an optional group by field, which can be any
populated field from the events.
NOTE: When a subrule is used to create a sequence rule, a copy of the subrule is added to the
sequence rule’s definition. Because a copy is added, changes to the original subrule do not affect the
sequence rule.
74 Sentinel 6.1 User Guide
Page 75

To create a sequence rule:
1 Open the Correlation Rules Manager window and select a folder from the Folder drop-down
list to which this rule is added.
2 Click Add button located on the top left corner of the screen. The Correlation Rule window
displays. Select Sequence Rule.
novdocx (en) 7 January 2010
3 In Sequence Rule window, you can select a sub-rule to create a sequence rule. To select a sub-
rule, click Add Rule button. Add Rule window displays.
4 Select a rule and click OK.
5 Set parameters for the rule to fire. To group event tags according to the attributes, Click Add/
Edit. The Attribute List window displays.
6 Check the attribute as per your requirement. You can preview the rule in RuleLg preview box.
Click Next, the Update Criteria window displays.
7 Update criteria for the rule to fire and click Next.
8 Provide a name to this rule. You have an option to modify the rule folder.
9 Provide rule description and click Next.
10 You have an option to create another rule from this wizard. Select your option and click Next.
Custom or Freeform Correlation Rules
The custom or freeform rule option is the most powerful option for creating a correlation rule. This
allows the user to create any of the previous types of rules by typing the RuleLG correlation rule
language directly into the Correlation Rule Wizard.
Freeform rules are the only way to include certain functionality in a correlation rule. Freeform rules
give you the ability to do the following:
Nest operations using parentheses (to specify order of operations)
Use the
inlist
operator to refer to a dynamic list
Correlation Tab 75
Page 76

novdocx (en) 7 January 2010
Use the
Use the
isnull
w.
operator to refer to unpopulated fields
prefix for a field name in the window operation to compare an incoming event’s
value to a set of previous events
TIP: You can select the Functions, Operators and Meta-Tags from the drop-down list selection.
Type e. or w. in the Correlation Rule section to view the drop-down lists.
To create a custom or freeform rule:
1 Open the Correlation Rules Manager window and select a folder from the Folder drop-down
list to which this rule is added.
2 Click the Add button located on the top left corner of the screen. The Correlation Rule window
displays. Select Custom/Freeform Rule.
3 In the Custom/Freeform Rule window, write the condition for the rule and click Validate to test
the validity of the rule.
4 After validation of the rule, click Next, the Update Criteria window displays.
Update the criteria for the rule to fire and click Next.
5 Provide a name to this rule. You have an option to modify the rule folder.
6 Provide rule description and click Next.
7 You have an option to create another rule from this wizard. Select your option and click Next.
3.3.6 Deploying/Undeploying Correlation Rules
Correlation rules can be deployed or undeployed from the Correlation Engine Manager or the
Correlation Rule Manager. You can undeploy all rules or a single rule.
The rules can be associated with one or more actions. If no action is selected, a default Correlated
Event is generated with the following values:
Table 3-2 Default Correlated Event Details
Field Name Default Values
Severity 4
Event Name Same as the event name for the trigger event
76 Sentinel 6.1 User Guide
Page 77

Field Name Default Values
Message Same as the message for the trigger event
Resource Correlation
SubResource <Rule Name>
Other types of actions can be configured in the Action Manager:
Configure a Correlated Event (replaces the default correlated event settings)
Add to Dynamic List (adds an element to a dynamic list)
Remove from Dynamic List (removes an element from a dynamic list)
Execute a Command (executes a shell or batch script)
Execute a Script (executes a script; only available for actions created in Sentinel 6.0)
Send an Email (using default Sentinel mail settings)
Create an Incident (creates a Sentinel incident)
Any Action configured in the Action Manager that was created from an Action plugin that
takes a Correlated Event as input. For more information on Action Manager (page 366), see the
Chapter 16, “Actions and Integrator,” on page 365.
novdocx (en) 7 January 2010
To deploy Correlation Rules (in Correlation Engine Manager):
1 Open the Correlation Engine Manager window.
2 Highlight and right-click the engine you want to deploy the rule on and select Deploy Rule.
3 In the Rules tab, select the rule or rules you want to deploy.
4 In the Actions tab, select the action or actions you want to associate with the rule.
Correlation Tab 77
Page 78

novdocx (en) 7 January 2010
5 Click Deploy. Rules are deployed in an enabled state.
To deploy Correlation Rules (in Correlation Rule Manager):
1 Open the Correlation Rule Manager window.
2 Highlight a rule and click Deploy rules link. The Deploy Rule window displays.
3 In the Deploy Rule window, select the Engine to deploy the rule from the drop-down list.
4 [Optional] Select an action or add a new action.
78 Sentinel 6.1 User Guide
Page 79

novdocx (en) 7 January 2010
If nothing is selected, a Correlated Event with default values is created.
Click Deploy.
To Undeploy a Single Rule:
1 In the Correlation Engine Manager, right-click the rule and select Undeploy Rule.
2 Alternatively, in the Correlation Rule Manager, highlight the rule and click Undeploy rule link.
To Undeploy All Correlation Rules:
1 Open the Correlation Engine Manager window.
2 Right-click the Correlation Engine and select Undeploy All Rules.
3.3.7 Enabling/Disabling Rules
To Enable/Disable Rule:
1 Open the Correlation Engine Manager window.
2 Highlight and right-click the rule or set of rules and select Enable Rule or Disable Rule.
Correlation Tab 79
Page 80

3.3.8 Renaming and Deleting a Correlation Rule
To rename a Correlation Rule:
NOTE: You must undeploy a rule before you rename or delete the rule.
1 Open the Correlation Rules Manager window and select the rule you want to rename.
2 If the rule is deployed, click Undeploy Rule link to undeploy the rule.
3 Click View/Edit link. In the General Description tab change the name of the Correlation Rule.
4 Click OK.
To delete a Correlation Rule:
1 Open the Correlation Rules Manager window and select the rule you want to delete.
2 If the rule is deployed, click Undeploy Rule link to undeploy the rule.
3 Click Delete link. Click Yes when the system prompts for confirmation.
novdocx (en) 7 January 2010
3.3.9 Moving a Correlation Rule
To move a Correlation Rule:
1 Open the Correlation Rules Manager window and click Manage Folder.
2 Click and drag a correlation rule from one folder to another.
3.3.10 Importing a Correlation Rule
To Import a Correlation Rule:
1 Open the Correlation Rules Manager window and click Import/Export Correlation Rule icon.
The Import Export Rule window displays.
80 Sentinel 6.1 User Guide
Page 81

2 Select the Import option from the Action pane. The Description in the Description pane
changes to Import.
3 Click Browse to select the Correlation Rule you want to import. Select the file and click
Import. Click Next. The Import Rule window displays.
novdocx (en) 7 January 2010
4 Select the folder you want to import the Correlation rule into. Click Finish.
NOTE: When importing a correlation rule in a folder, if the correlation rule with the same
name exists, the system displays a message and does not import the file.
IMPORTANT: If you import a correlation rule using the
aligned to that rule must exist or you must create the dynamic list with the same name on the
system to it is imported.
inlist
operator, the dynamic list
3.3.11 Exporting a Correlation Rule
To Export a Correlation Rule:
1 Open the Correlation Rules Manager window and click Import/Export Correlation Rule icon.
The Import Export Rule window displays.
Correlation Tab 81
Page 82

2 Select the Export option from the Action pane. The Description in the Description pane
changes to Export.
3 Click Browse to export the rule. Specify a file name and click Export. Click Next. The Export
Rule window displays.
4 Select the Correlation Rule you want to export. Click Finish.
novdocx (en) 7 January 2010
3.4 Dynamic Lists
Dynamic Lists are distributed list structures that can be used to store string elements, such as IP
addresses, server names, or usernames. The lists are then used within a correlation rule for a quick
lookup to see whether an incoming event includes an element from the Dynamic List. Some
examples of Dynamic Lists include:
Terminated user lists
Suspicious user watchlist
Privileged user watchlist
Authorized ports and services list
Authorized server list
A Dynamic List can be built using the text values for any event metatag. Elements can be added to
the list manually (by an administrator) or automatically whenever a correlation rule fires. Elements
can be removed from a list if manually (by an administrator), automatically whenever a correlation
rule fires, when their time limit expires, or when the maximum list size is reached.
IMPORTANT: The Time To Live (TTL) must be between 60 seconds and 90 days and the
maximum list size is 100,000.
Regardless of how the values were added, they can be Persistent (active until manually removed or
until the maximum list size is reached) or Transient (active only for a specified timeframe after
being added to the list, also known as the Time to Live). The Time to Live can range from 60
seconds to 90 days.
NOTE: If the Time to Live period is updated on an active Dynamic List, the change is not
retroactive to elements already on the list. Elements that are already added to the dynamic list retains
their original Time to Live.
82 Sentinel 6.1 User Guide
Page 83

3.4.1 Adding a Dynamic List
To add Dynamic Lists:
1 Click Correlation on the Menu Bar and select Dynamic Lists. Alternatively, you can click
Dynamic Lists button on the Tool Bar.
2 Click Add button located on the top left corner of the screen. Dynamic List Properties window
displays.
3 Provide the Name of the List.
novdocx (en) 7 January 2010
NOTE: The name cannot contain special characters, such as quotations or hyphens. For MSSP
customers, provide an intuitive name so that it can be easily identified as MSSP customer
dynamic list.
4 Click Add. The Add Element window displays:
5 Provide name of the Element. To make the Element persistent, check Make Persistent Check
box and Click OK.
NOTE: To make an existing element persistent, select the checkbox before the element name
in the Dynamic Properties window.
6 Select Transient elements life span. It specify the time the persistent values are active in the list
7 Specify the Maximum Number of Elements. The number defined here limits the number of
elements in the list.
8 Click OK.
Correlation Tab 83
Page 84

NOTE: Select a filter type from Quick Filter drop-down list and specify the name of the
element, to filter the available elements.
3.4.2 Modifying a Dynamic List
To edit a Dynamic List:
1 Click Correlation on the Menu Bar and select Dynamic Lists. Alternatively, you can click
Dynamic Lists button on the Tool Bar.
2 Select a Dynamic List and click View/Edit link.
3 The Dynamic List Properties window displays. Edit the options as required and click OK.
3.4.3 Deleting a Dynamic List
WARNING: Do not delete a Dynamic List that is part of a correlation rule or rules.
novdocx (en) 7 January 2010
To delete a Dynamic List:
1 Click Correlation on the Menu Bar and select Dynamic Lists. Alternatively, you can click the
Dynamic Lists button on the Tool Bar.
2 Select a Dynamic List and click Delete link against it. Confirmation message alert displays.
3 Click Yes to delete.
3.4.4 Removing Dynamic List Elements
There are several ways an element can be removed from a Dynamic List.
A user can remove it manually
The element can be removed by a correlation rule action
The Transient elements life span can expire
If the maximum number of elements for a Dynamic List is reached, elements are removed from
the list to keep the list at or below the maximum list size. The transient elements are removed
(from oldest to newest) before any persistent elements are removed.
3.4.5 Using a Dynamic List in a Correlation Rule
Dynamic Lists can be referenced in a Correlation Rule by using the Custom/Freeform option of the
Correlation Rule Wizard. For example:
filter(e.<tagname> inlist <Dynamic List Name>)
where
e.<tagname> represents a metatag in the incoming event, such as e.shn (Source
Host Name) or e.dip (Destination IP address)
<Dynamic List Name> is the name of an existing Dynamic List, such as
CriticalServerList
84 Sentinel 6.1 User Guide
Page 85

The following instructions assume that a Dynamic List already exists.
To add a Dynamic List to correlation rule:
1 Open the Correlation Rules Manager window and select a folder from the drop-down list to
which this rule is added.
2 Click Add button located on the top left corner of the screen. The Correlation Rule window
displays. Select Custom/Freeform Rule.
3 In the Custom/Freeform Rule window, write the condition for the rule including the name of
the dynamic list. For example,
dynamic list name.
4 Click Validate to test the validity of the rule.
5 After validation of the rule, click Next, the Update Criteria window displays.
6 Update the criteria for the rule to fire and click Next.
7 Provide a name to this rule. You have an option to modify the rule folder.
8 Provide rule description and click Next.
filter(e.sev inlist Severity)
where Severity is the
novdocx (en) 7 January 2010
9 You have an option to create another rule from this wizard. Select your option and click Next.
NOTE: Users must have the permission to Start/Stop Correlation Engine to perform these actions.
The two states of Correlation engine are
Enable
Disable .
When the Correlation Engine is enabled, it processes active correlation Rules. When in a disabled
state, all its in-memory data is preserved and no new correlation events are generated. Disabling the
Correlation Engine does not affect other parts of the Sentinel system.
Correlation rules are stored in the Sentinel database. When you activate the Correlation Engine in
Sentinel Control Center, it requests the deployment information and rules from the database.
Changes to a rule are not reflected in the Correlation Engine until one of the following things
happens:
The rule is undeployed, edited and redeployed.
The rule is freshly deployed
3.5 Correlation Engine
Correlation Tab 85
Page 86

3.5.1 Starting or Stopping Correlation Engine
To Start or to Stop a Correlation Engine:
1 Open the Correlation Engine Manager window.
2 Highlight and right-click a Correlation Engine and select Start or Stop Engine.
3.5.2 Renaming Correlation Engine
A Sentinel system can have one or more Correlation Engines. You can rename the engines if
desired.
novdocx (en) 7 January 2010
To Rename a Correlation Engine:
1 Open the Correlation Engine Manager window.
2 Right-click the Correlation Engine and select Rename Engine.
3 Modify the name of the Engine and click OK.
3.6 Correlation Actions
The Action Manager allows you to configure repeatable Actions. There are several different types of
Actions that can be configured and then associated with a correlation rule deployment:
Configure a Correlated Event
Add to Dynamic List
Remove from Dynamic List
Execute a Command
Send an Email
Create an Incident
Any Imported JavaScript Action Plugin that is marked by the plugin developer as requiring a
Correlated Event as input
NOTE: Although all of these actions can be used in correlation rule deployments, only the
JavaScript Actions can be used in other areas of the Sentinel Control Center. For more information,
see Chapter 16, “Actions and Integrator,” on page 365.
Actions associated with a Correlation Rule are executed when the deployed correlation rule fires
(with the frequency of their execution determined by settings on the Update Criteria window of the
Correlation Rule Wizard).
86 Sentinel 6.1 User Guide
Page 87

If no Action is specifically selected when deploying a correlation rule, a correlated event with the
following default settings is created:
Table 3-3 Default Settings
Field Name Default Values
Severity 4
Event Name Final Event Name
Message <message>
Resource Correlation
SubResource <Rule Name>
3.6.1 Configure Correlated Event
Figure 3-2 Configure Correlated Event
novdocx (en) 7 January 2010
NOTE: This type of action can only be used in Correlation deployments.
To override the default values for the correlated event created when a rule fires, an action can be
created to populate the following fields in the correlated event:
Severity
Event Name
Message
Resource
SubResource
Correlation Tab 87
Page 88

3.6.2 Add to Dynamic List
Figure 3-3 Adding to Dynamic List
novdocx (en) 7 January 2010
NOTE: This type of action can only be used in Correlation deployments.
This action type can be used to add a constant value or the value of an event attribute (such as Target
IP or Initiator User Name) to an existing Dynamic List. Any values that are repeated across multiple
events are only be added to the dynamic list once. The various parameters available are:
Table 3-4 Parameters
Option Function
Element Values [optional] Specify a constant value to add to the dynamic list. If this is
blank, Attribute Name must be populated.
Element Type Persistent or Transient
Dynamic List Name Select an existing Dynamic List from the dropdown menu.
Attribute Names [optional] For every event that is part of a correlated event, the value or
values of the selected event attribute is added to the Dynamic List. If
this is blank, Element Values must be populated.
If there are entries for both Element Values and Attribute Names, both are added to the Dynamic
List when the rule fires. If the Element Value is filled in and the Element Type is Transient, the
timestamp for the element in the Dynamic List is updated each time the rule fires.
88 Sentinel 6.1 User Guide
Page 89

3.6.3 Remove from Dynamic List
Figure 3-4 Removing from Dynamic List
novdocx (en) 7 January 2010
NOTE: This type of action can only be used in Correlation deployments
This action type can be used to add a constant value or the value of an event attribute (such as Target
IP or Initiator User Name) from an existing Dynamic List. The various parameters available are:
Table 3-5 Parameters
Option Function
Element Values Specify a constant value to remove from the list.
Dynamic List Name Select an existing Dynamic List from the dropdown menu.
Attribute Names For every event that is part of a correlated event, the value or values of
the selected event attribute are deleted from the Dynamic List.
Correlation Tab 89
Page 90

3.6.4 Execute a Command
Figure 3-5 Executing a Command
novdocx (en) 7 January 2010
NOTE: This type of action can only be used in Correlation deployments.
This action type can be used to execute a command when a correlated event triggers. You can set the
following parameters:
Command
NOTE: For actions that execute a command or run a script, the command or script must reside
in the $ESEC_HOME/config/exec or %ESEC_HOME%\config\exec folder on the Correlation
Engine. Symbolic links on UNIX are not supported.
Arguments: This can include constants or references to an event attribute in the last event, the
one that caused the rule to fire.
NOTE: References to event attributes must use the values in the metatag column enclosed in %
or $ symbols. For example, %InitIP% represents the Initiator IP address value from the
Correlated Event, except in the Configure Correlated Event action. Because the correlated
event has not been created before the action is executed, the InitIP value comes from the trigger
event. $InitIP$ always represents the value from the current event.Both %all% and $all$ are the
same, and they pass information (a limited set of attributes from both the trigger event and the
correlated event along with some correlation rule data) to a correlation action. They are
provided primarily for backward compatibility with existing correlation actions. They cannot
be used in JavaScript actions or in the Configure Correlated Event action. For more information
on metatags, see “Sentinel Event Fields” in Sentinel 6.1 Reference Guide.
90 Sentinel 6.1 User Guide
Page 91

Command actions can be created to perform a non-interactive action, such as modifying a firewall
policy, entering a record in a database, or deactivating a user account. For an action that generates
output, such as a command to run a vulnerability scan, the command should refer to a script that runs
the command and then writes the output to a file.
NOTE: By default, the action output is stored to the working directory, $ESEC_HOME/data. The
action output can be written to a different directory by specifying a different storage location of the
output file in the script
3.6.5 Create Incident
Figure 3-6 Configure Action- Create Incident
novdocx (en) 7 January 2010
NOTE: This type of action can only be used in Correlation deployments
This action type create an incident whenever a correlated event fires. You can also initiate an iTRAC
workflow process for remediation of that incident. For more information about the values of the
following parameters, see Chapter 4, “Incidents Tab,” on page 93.
Responsible
Title
Category
Severity
Priority
State
[Optional] iTRAC Process: dropdown of configured iTRAC processes
[Optional] Action Plugin to Execute: dropdown of configured JavaScript Actions
Correlation Tab 91
Page 92
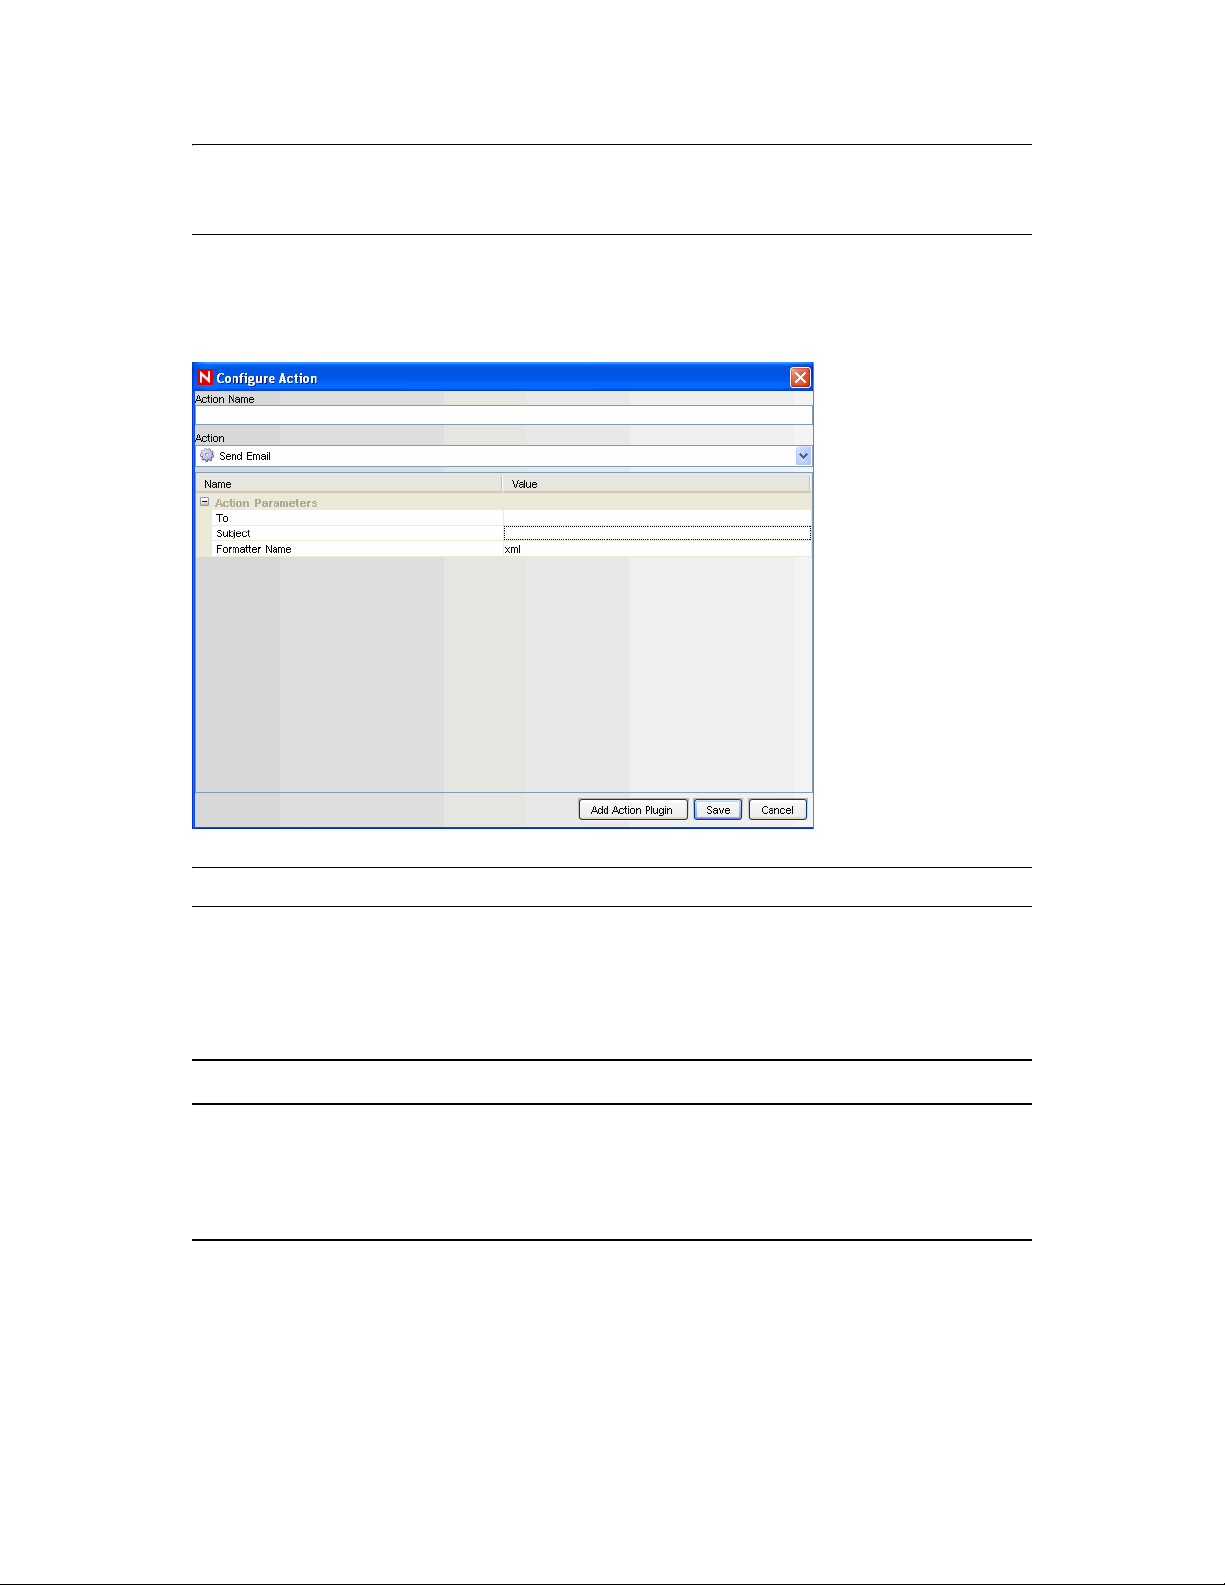
WARNING: Do not enable the Create Incident action until the correlation rule has been tuned. If
the rule fires frequently, the system can create more incidents or initiate more iTRAC workflow
processes than desired.
3.6.6 Send Email
Figure 3-7 Configure Action- Send Email
novdocx (en) 7 January 2010
NOTE: This type of action can only be used in Correlation deployments
This action type can be used to send an Email when a correlated event triggers. The various
parameters available are:
Table 3-6 Parameters
Option Function
To Specify the recipient email address
Subject Specify the subject of the mail
Formatter Name The format of the email will contain the correlated event formatted as “xml”
or “Name Value Pair”, depending on what you select
3.6.7 Imported JavaScript Action Plugins
For information on the JavaScript related actions and how to debug them, see Section 16.2, “Action
Manager,” on page 366 in Chapter 16, “Actions and Integrator,” on page 365. The JavaScript
Actions can be used in many places throughout the Sentinel interface.
92 Sentinel 6.1 User Guide
Page 93

4
Incidents Tab
Section 4.1, “Understanding an Incident,” on page 93
Section 4.2, “Introduction to User Interface,” on page 93
Section 4.3, “Manage Incident Views,” on page 95
Section 4.4, “Manage Incidents,” on page 99
Section 4.5, “Switch between existing Incident Views,” on page 106
4.1 Understanding an Incident
In Sentinel, a set of related events (for example, a possible attack) can be grouped together form an
Incident. An Incident in “open” state alerts you to investigate, resolve, and close the incident. For
example, the resolution to an attack might be to close a port, block a source IP, or rebuild a machine.
Incidents can be created:
novdocx (en) 7 January 2010
4
Manually, by a security analyst monitoring incoming data or querying past data.
Automatically, as a result of a correlation rule being triggered. For more information, see
“Correlation Tab” section.
In the Incidents Tab, you can:
Manage Incident Views
Manage Incidents
Switch between existing Incident Views
NOTE: You need to have appropriate permissions to access this tab. Only an Administrator has
controls to enable/disable access to the features of Incidents for a user.
4.2 Introduction to User Interface
In the Incidents Tab, you will see the Display Incident View, Create Incident and Attachment
Viewer Configuration.
You can navigate to these functions from:
Table 4-1 Table 4-1: Incident Tab -User Interface
The Incident menu in the Menu Bar
Incidents Tab
93
Page 94

The Navigation Tree in the Navigation Pane
The Toolbar Buttons
novdocx (en) 7 January 2010
4.2.1 Incident View
In the Incident View Manager, you can view the list of incidents and the parameters you specified
when adding an incident.
To open Incident View Manager:
1 Click Incidents on Menu Bar and select Display Incident Views or click Display Incident View
button in the Tool Bar.
4.2.2 Incident
When you add/edit an incident, you will see the tabs listed below where you can perform the
incident related activities. As you investigate and remediate an incident, additional information can
be added to these tabs. Except for Events and History, entering information on the tabs is optional.
94 Sentinel 6.1 User Guide
Page 95

Figure 4-1 Add/Edit Incident
novdocx (en) 7 January 2010
Events: Lists events attached to this incident. You can attach events to incidents in Active
Views.
Assets: Lists assets affected by the events of this incident.
Vulnerability: Lists asset vulnerabilities.
Advisor: Displays Asset attack and alert information.
iTRAC: Allows you to add a workflow to incident from iTRAC Tab.
History: Lists activities performed on the current incident.
Attachments: Allows you to add an attachment to the incident created in the system.
Notes: Allows you to add notes to the incident.
4.3 Manage Incident Views
Manage View allows you to:
Add Views
Edit Views
Delete Views
Mark a View as default
4.3.1 Adding a View
To add an Incident View:
1 Click Incidents > Display Incident View Manager. Alternatively, click Display Incident View
button on the Tool Bar.
Incidents Tab 95
Page 96

2 Open the View Options by either:
Clicking the down-arrow on the Manage Views button located in bottom right corner of
the window and selecting Add View. or
Clicking the down arrow on the Manage Views button located in the bottom right corner
of the window, selecting Manage Views and then clicking the Add View button.
novdocx (en) 7 January 2010
3 Provide a name in the Option Name field. Click each button (listed below) to specify the
options.
Fields: The variables of the events attached to incidents are displayed as fields. By
default, all the fields are arranged as columns in the Incident View. In the Field options
window, you can add or remove columns that display and arrange the order of the columns
by moving the up and down arrows.
Group By: You can set rules to group incidents in the display View.
96 Sentinel 6.1 User Guide
Page 97

Sort By: You can set rules to sort the incidents in the display view.
novdocx (en) 7 January 2010
Incidents Tab 97
Page 98
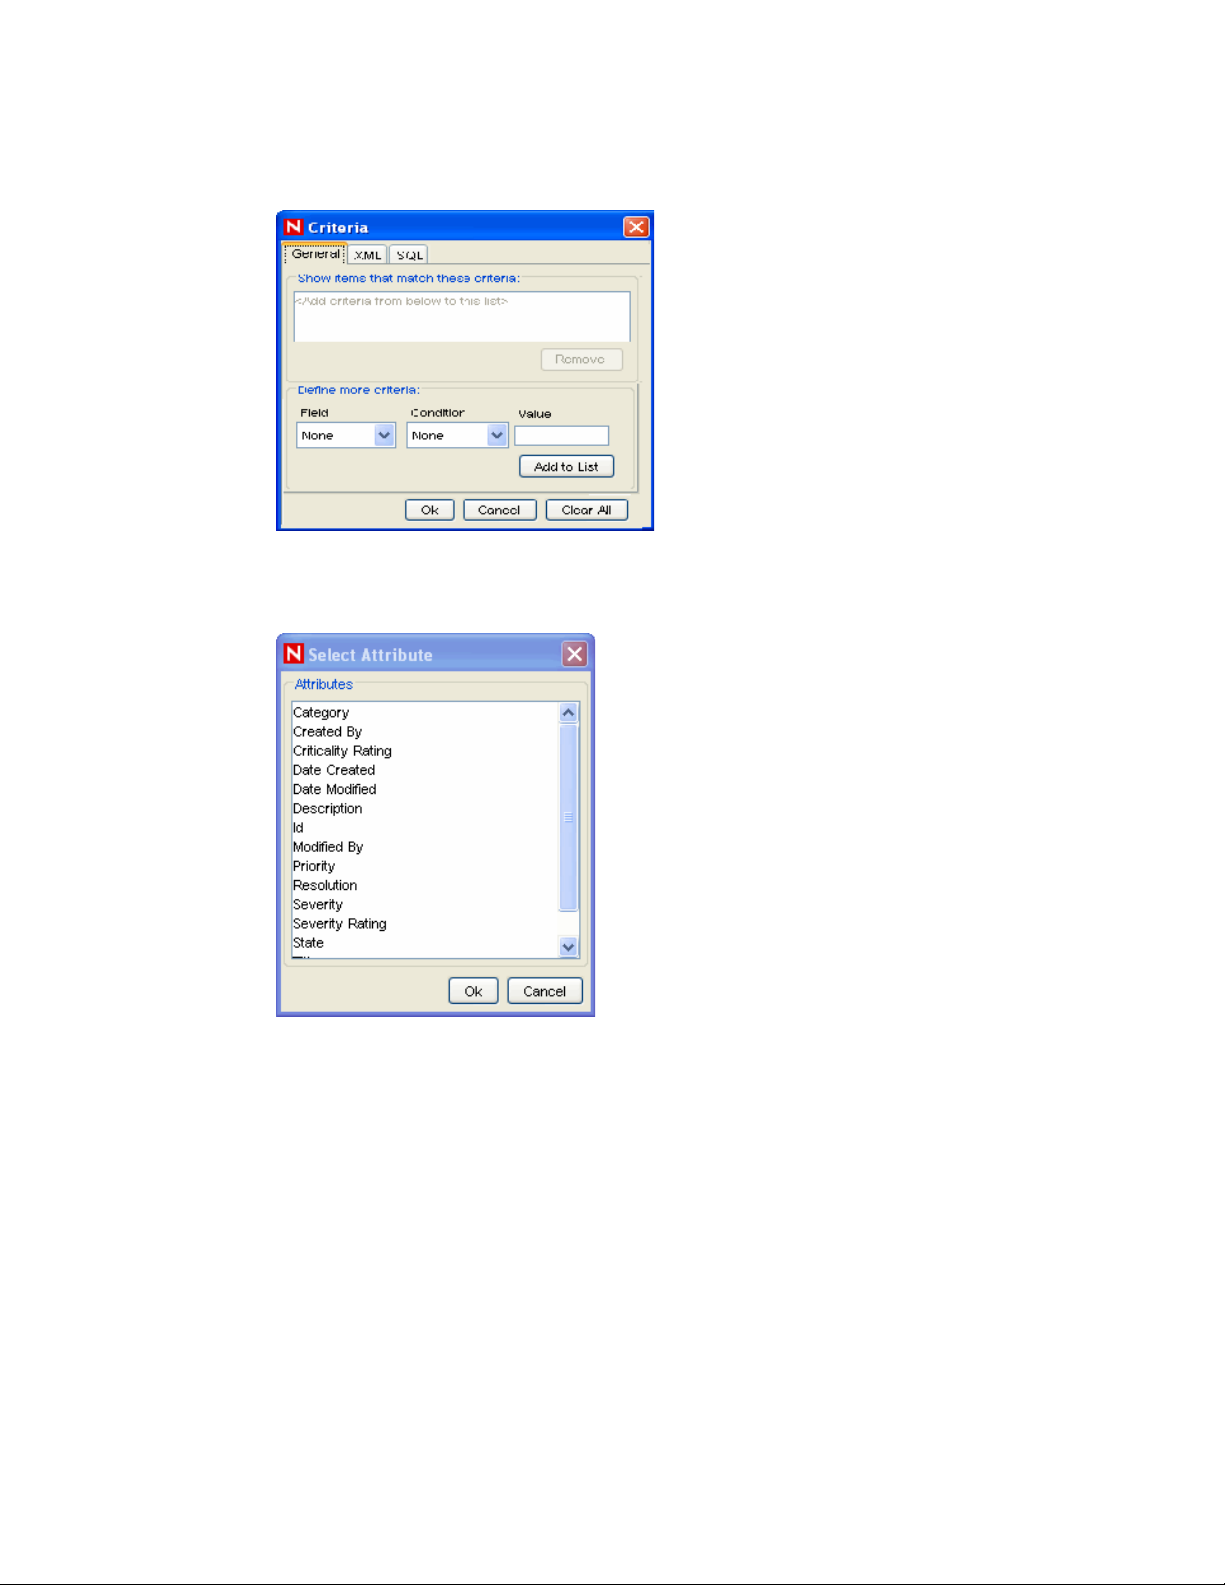
Filter: You can set Incident filters. Only the Incidents that match your filter displays in
the View.
Leaf Attribute: You can select an attribute from the list which is displayed as the first
column in the Incident View.
novdocx (en) 7 January 2010
4 Click Save.
4.3.2 Modifying a View
To edit an Incident View:
1 Click Incidents > Display Incident View or click Display Incident View Manager button on the
Tool Bar.
98 Sentinel 6.1 User Guide
Page 99

2 Open a view by:
Clicking the down-arrow on the Switch View button in the bottom right corner, select the
view you want to edit. Click the down-arrow on the Manage View button located in
bottom right corner of the screen and select Edit Current View from the list. or
Clicking the down arrow on the Manage Views button located in the bottom right corner
of the window, select Manage Views. Select a view to edit and click View/Edit.
3 Edit the options as required and click Save.
4.3.3 Deleting a View
To delete an Incident View:
1 Click Incidents > Incident View Manager or click Display Incident View button on the Tool
Bar.
2 Click the down-arrow on the Manage Views button located in bottom right corner of the screen
and select Manage View from the list. The Manage View window displays. Select a view and
click Delete. A confirmation message alert displays.
3 Click Yes to delete.
novdocx (en) 7 January 2010
4.3.4 Default View
To mark a View as default:
1 Click Incidents > Display Incident View Manager, or click Display Incident View Manager
icon on the Tool Bar.
2 Click the down-arrow on the Manage Views button located in bottom right corner of the screen
and select Manage Views from the list. The Incident View window displays.
3 Select the incident view you want as default, and click Mark as Default.
4.4 Manage Incidents
You can perform the following activities related to Incidents:
Create an Incident
Attach Workflows to Incidents
Add Notes to Incidents
Add Attachments to Incidents
Execute an Incident Action
Email an Incident
Edit an Incident
Delete an Incident
Incidents Tab 99
Page 100

4.4.1 Creating Incidents
To create an Incident:
1 Click Incidents > Create Incident, or click Create Incident button on the Tool Bar. The New
Incident window displays.
novdocx (en) 7 January 2010
2 Specify the following information:
Title: Specify the Title of the Incident.
State: To set state of the incident, select from the drop-down list.
Severity: To mention the severity of the incident, select from the drop-down list.
Priority: To mention the priority of the incident, select from the drop-down list.
Category: Specify the category of the Incident.
Responsible: To assign the responsibility to investigate and close the incident, select
from the drop-down list.
Description: Specify the description of the Incident in the text area.
Resolution: Specify the resolution description in the text area.
3 Click Create. The Incident ID automatically generates after you click Create.
NOTE: For more information on creating an incident grouping events, see Creating Incident in
“Active Views Tab” section.
100 Sentinel 6.1 User Guide
 Loading...