

Page 1

XIV
Monitor
Chapter 62, “Understanding the Monitor Agent Consoles,” on page 1003
Chapter 63, “Configuring the Monitor Agent,” on page 1007
Chapter 64, “Configuring the Monitor Application,” on page 1029
Chapter 65, “Using GroupWise Monitor,” on page 1037
Chapter 66, “Comparing the Monitor Consoles,” on page 1061
Chapter 67, “Using Monitor Agent Startup Switches,” on page 1063
novdocx (en) 22 June 2009
XIV
Monitor
1001
Page 2

novdocx (en) 22 June 2009
1002 GroupWise 8 Administration Guide
Page 3
62
Understanding the Monitor Agent
novdocx (en) 22 June 2009
Consoles
The Monitor Agent offers three different consoles where you can check the status of your
GroupWise agents:
Section 62.1, “Monitor Agent Server Console,” on page 1003
Section 62.2, “Monitor Agent Web Console,” on page 1003
Section 62.3, “Monitor Web Console,” on page 1004
For a comparison of the capabilities of the three consoles, see Chapter 66, “Comparing the Monitor
Consoles,” on page 1061
®
For detailed instructions about installing and starting the GroupWise
time, see “Installing GroupWise Monitor” in the GroupWise 8 Installation Guide.
62.1 Monitor Agent Server Console
The Monitor Agent server console is available for the Windows Monitor Agent but not for the Linux
Monitor Agent.
Figure 62-1 Monitor Agent Server Console
Monitor Agent for the first
62
All agent configuration tasks can be performed at the Monitor Agent server console, but some
reports are not available.
62.2 Monitor Agent Web Console
The Monitor Agent Web console is platform-independent and can be viewed at the following URL:
http://web_server_address:8200
Understanding the Monitor Agent Consoles
1003
Page 4
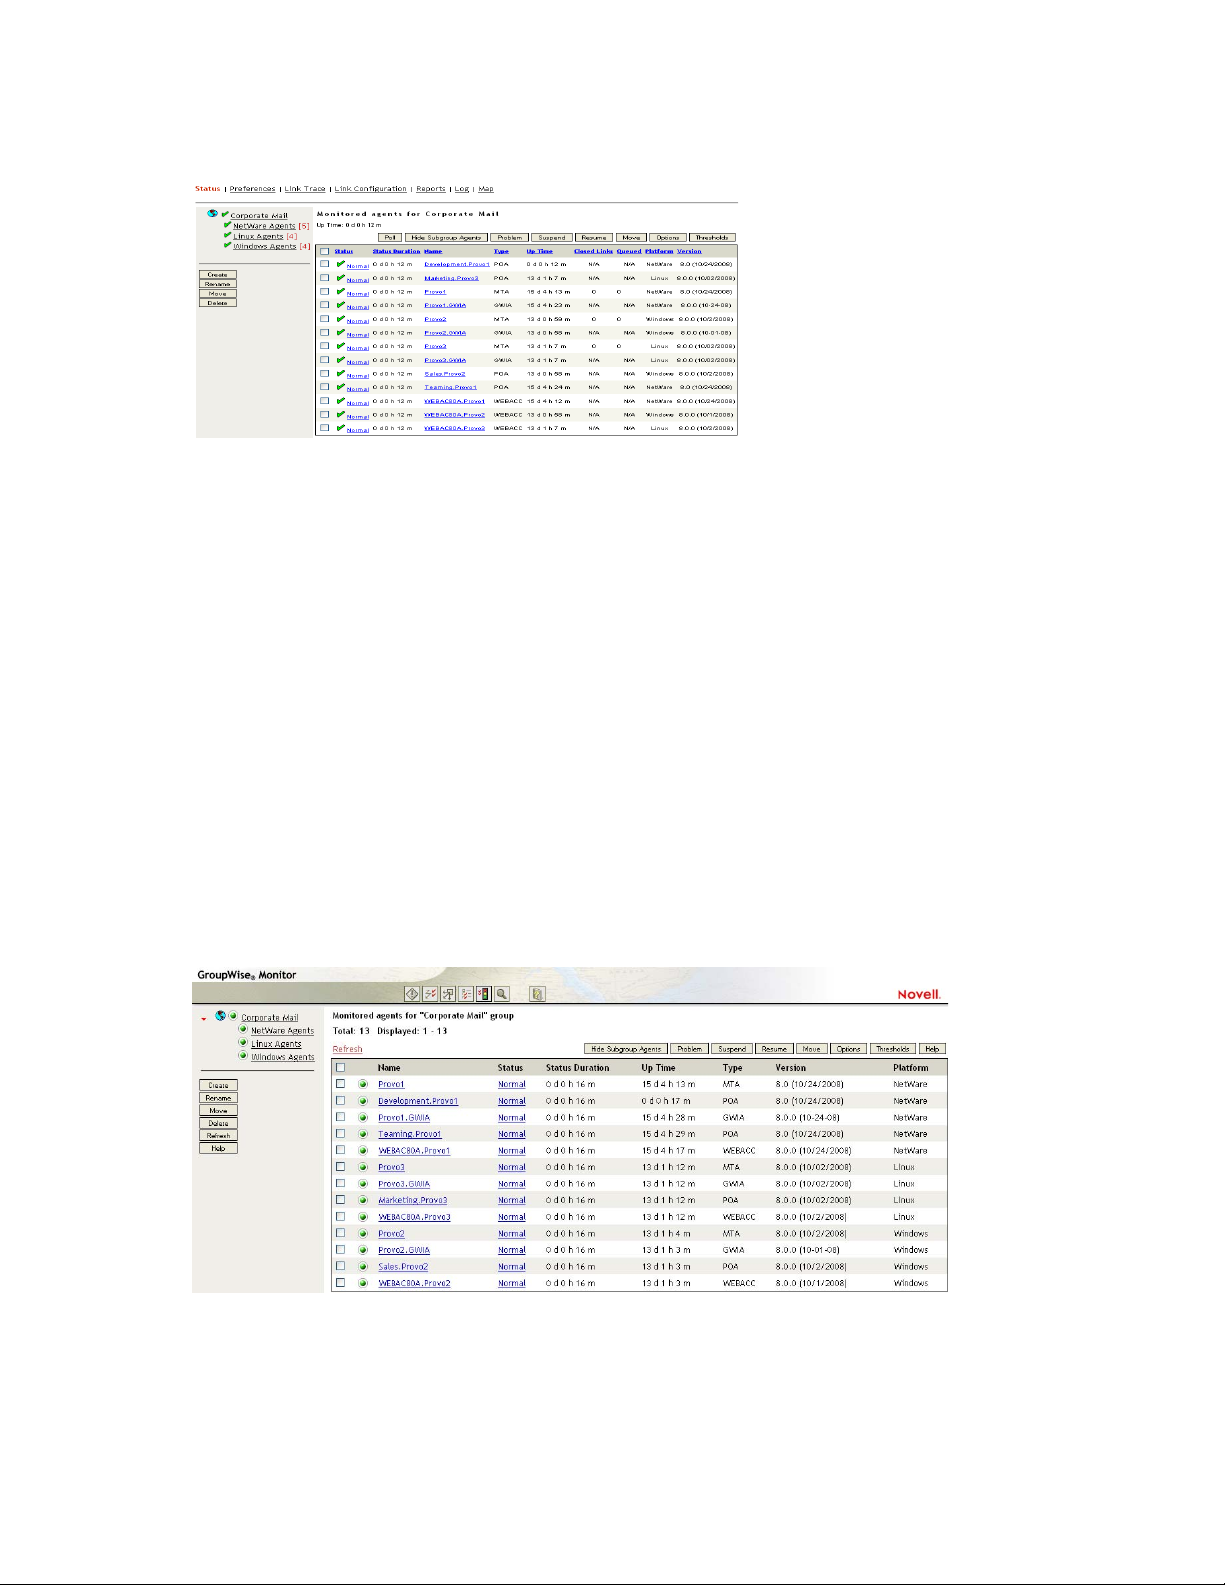
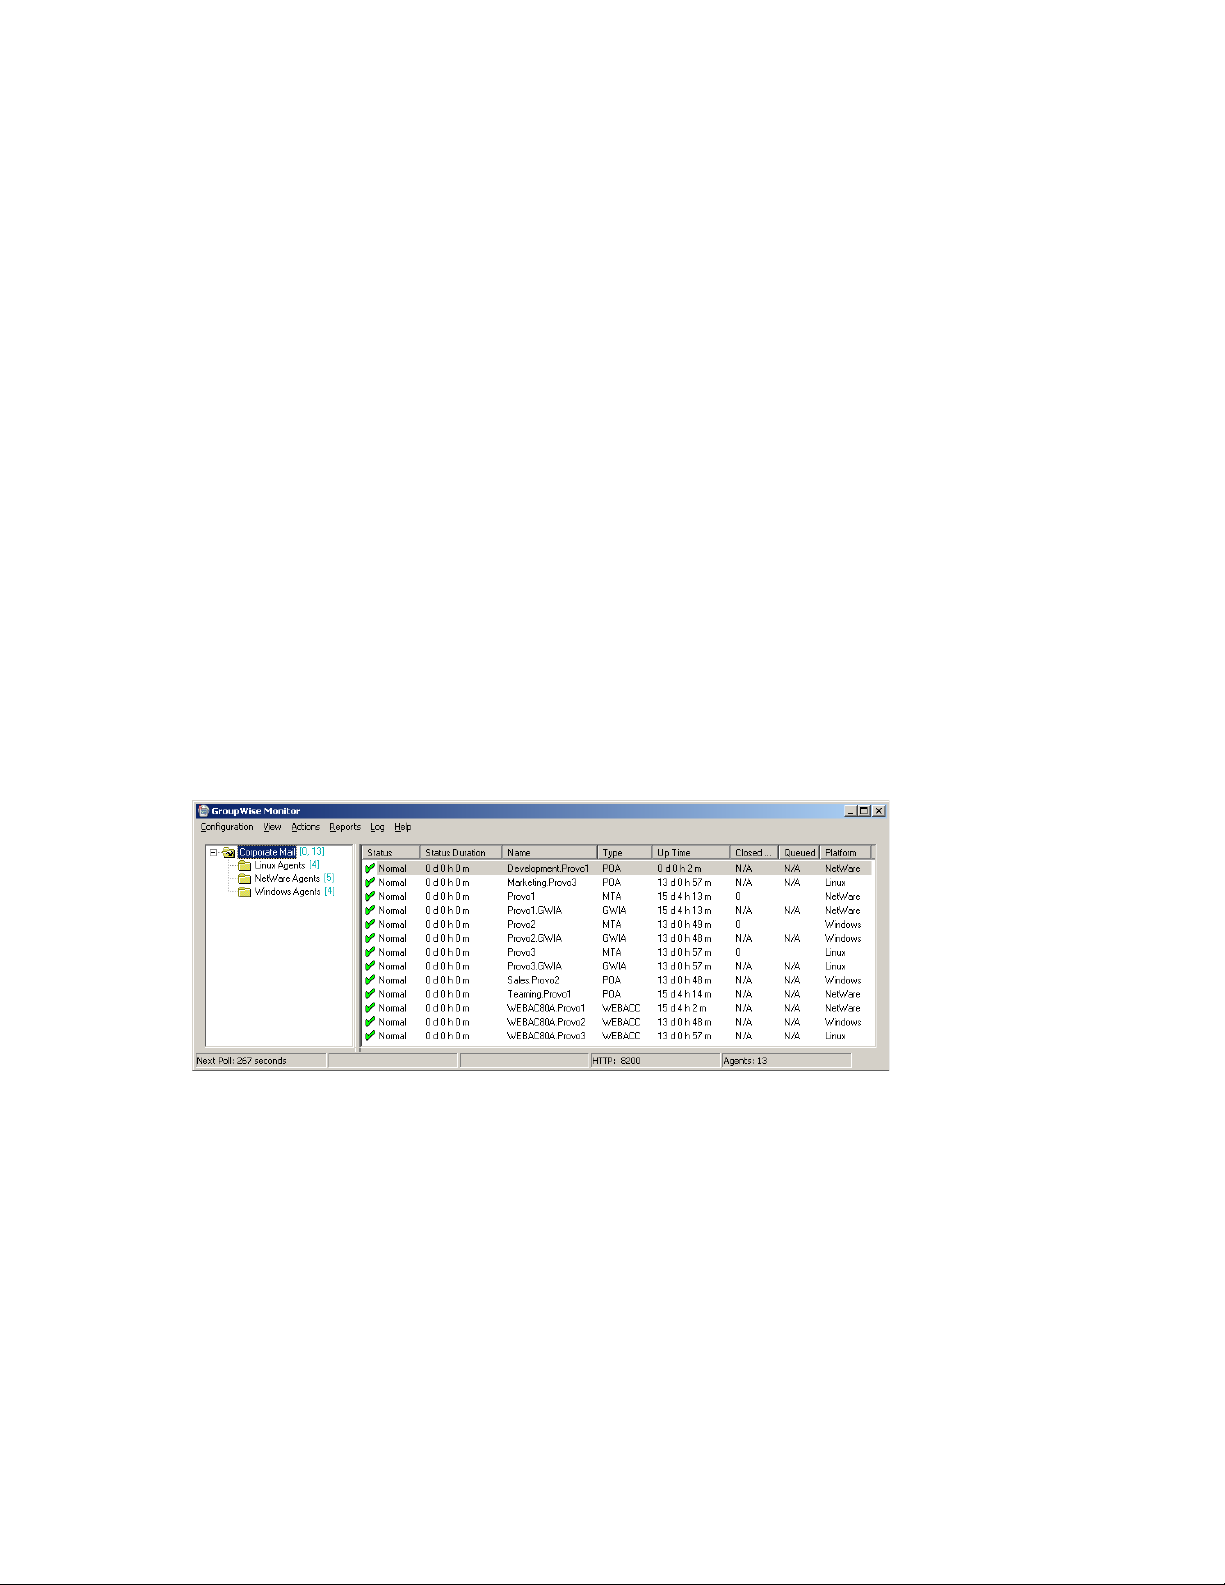
Figure 62-2 Monitor Agent Web Console
To create the Monitor Agent Web console display, your Web server communicates directly with the
Monitor Agent to obtain agent status information. You must be behind your firewall to use the
Monitor Agent Web console. Because the Linux Monitor Agent does not have a server console, you
use the Monitor Agent Web console in its place on Linux.
The Monitor Agent Web console is divided into the Agent Groups window on the left and the Agent
Status window on the right. Using the Agents Groups window, you can create and manage agent
groups the same as you can at the Monitor Agent server console.
novdocx (en) 22 June 2009
Several Monitor features are available at the Monitor Agent Web console that are not available at the
Monitor Agent server console or the Monitor Web console. These are summarized in Chapter 66,
“Comparing the Monitor Consoles,” on page 1061.
62.3 Monitor Web Console
The Monitor Web console is also platform-independent and can be viewed at the following URL:
http://web_server_address/gwmon/gwmonitor
Figure 62-3 Monitor Web Console
To create the Monitor Web console display, your Web server communicates with the Monitor
Application (a component of your Web server), which then communicates with the Monitor Agent
to obtain agent status information. This enables the Monitor Web console to be available outside
your firewall, while the Monitor Agent Web console can be used only inside your firewall.
1004 GroupWise 8 Administration Guide
Page 5

The Monitor Web console is divided into the Agent Groups window on the left and the Agent Status
window on the right. Using the Agents Groups window, you can create and manage agent groups the
same as you can at the Monitor Agent server console.
The Monitor Web console does not include some features that are available at the Monitor Agent
server console and the Monitor Agent Web console. These are summarized in Chapter 66,
“Comparing the Monitor Consoles,” on page 1061.
novdocx (en) 22 June 2009
Understanding the Monitor Agent Consoles 1005
Page 6

novdocx (en) 22 June 2009
1006 GroupWise 8 Administration Guide
Page 7
63
Configuring the Monitor Agent
For detailed instructions about installing and starting the GroupWise® Monitor Agent for the first
time, see “Installing GroupWise Monitor” in the GroupWise 8 Installation Guide.
®
The default configuration of the GroupWise
existing GroupWise agents (Post Office Agents, Message Transfer Agents, Internet Agents, and
WebAccess Agents). You can also customize the configuration to meet your specific monitoring
needs.
On Windows, you configure the Monitor Agent at the Monitor Agent server console on the
Windows server where the Monitor Agent is running.
Figure 63-1 Monitor Agent Server Console on Windows
Monitor Agent is adequate to begin monitoring
novdocx (en) 22 June 2009
63
On Linux, similar functionality is available in your Web browser at the Monitor Agent Web console:
http://localhost:8200
Configuring the Monitor Agent
1007
Page 8

Figure 63-2 Monitor Agent Web Console on Linux
novdocx (en) 22 June 2009
The following topics help you customize the Monitor Agent for your specific needs:
Section 63.1, “Selecting Agents to Monitor,” on page 1008
Section 63.2, “Creating and Managing Agent Groups,” on page 1011
Section 63.3, “Configuring Monitoring Protocols,” on page 1014
Section 63.4, “Configuring Polling of Monitored Agents,” on page 1017
Section 63.5, “Configuring E-Mail Notification for Agent Problems,” on page 1018
Section 63.6, “Configuring Audible Notification for Agent Problems,” on page 1021
Section 63.7, “Configuring SNMP Trap Notification for Agent Problems,” on page 1022
Section 63.8, “Configuring Authentication and Intruder Lockout for the Monitor Web
Console,” on page 1023
Section 63.9, “Configuring Monitor Agent Log Settings,” on page 1024
Section 63.10, “Configuring Proxy Service Support for the Monitor Web Console,” on
page 1026
Section 63.11, “Monitoring Messenger Agents,” on page 1026
Section 63.12, “Supporting the GroupWise High Availability Service on Linux,” on page 1028
63.1 Selecting Agents to Monitor
By default, the Monitor Agent starts monitoring all GroupWise agents (Post Office Agents, Message
Transfer Agents, Internet Agents, and WebAccess Agents) in your GroupWise system, based on the
information from a domain database (
wpdomain.db
agents. And under certain circumstances, you might want to monitor agents that are not part of your
local GroupWise system.
). You might not want to continue monitoring all
Section 63.1.1, “Filtering the Agent List,” on page 1009
1008 GroupWise 8 Administration Guide
Page 9
Section 63.1.2, “Adding All Agents on a Server,” on page 1009
Section 63.1.3, “Adding All Agents on a Subnet,” on page 1010
Section 63.1.4, “Adding an Individual Agent,” on page 1010
Section 63.1.5, “Removing Added Agents,” on page 1011
63.1.1 Filtering the Agent List
You can configure the Monitor Agent to stop and start monitoring selected agents as needed.
At the Windows Monitor Agent server console:
1 Click Configuration > Filter.
or
On Linux, at the Monitor Agent Web console, click Preferences > Filter.
novdocx (en) 22 June 2009
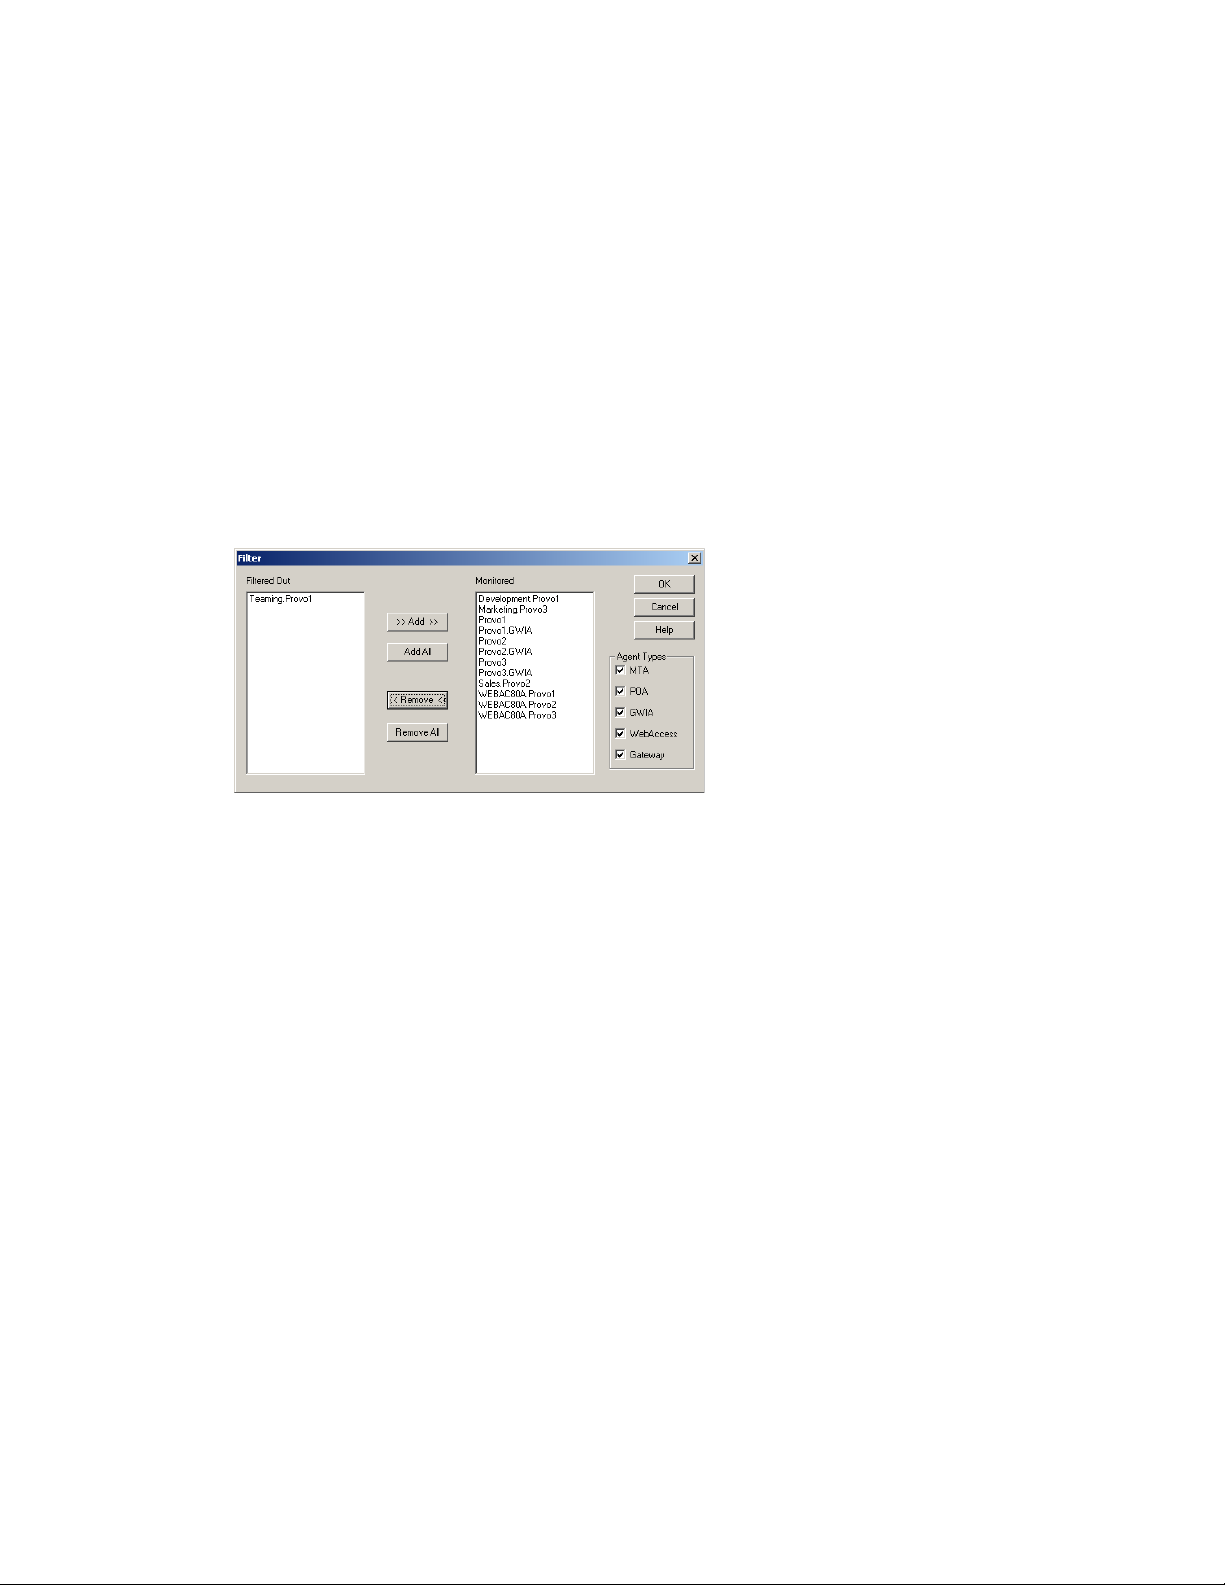
The Filtered Out list displays all agents that are not currently being monitored.
2 Select one or more agents in the Monitored list, then click Remove to move them to the Filtered
Out list.
3 Click OK.
Agents in the Filtered Out list are not monitored and do not appear at the Monitor Agent server
console or at the Monitor Agent Web console. To start monitoring a filtered-out agent, move it back
to the Monitored list.
63.1.2 Adding All Agents on a Server
If you add a new server to your GroupWise system or want to monitor agents in a different
GroupWise system, you can easily start monitoring all the agents running on that server.
At the Windows Monitor Agent server console:
1 Click Configuration > Add from Machine.
or
On Linux, at the Monitor Agent Web console, click Preferences > Add Agents.
Configuring the Monitor Agent 1009
Page 10
2 Type the IP address of the new server, then click OK.
All GroupWise agents on the new server are added to the list of monitored agents.
If the new server is part of your local GroupWise system, you can simply restart the Monitor Agent
and it picks up all new agents in your system.
63.1.3 Adding All Agents on a Subnet
If you add several new servers to your GroupWise system or want to monitor agents in a different
GroupWise system, you can easily start monitoring all the agents running on the same subnet.
At the Windows Monitor Agent server console:
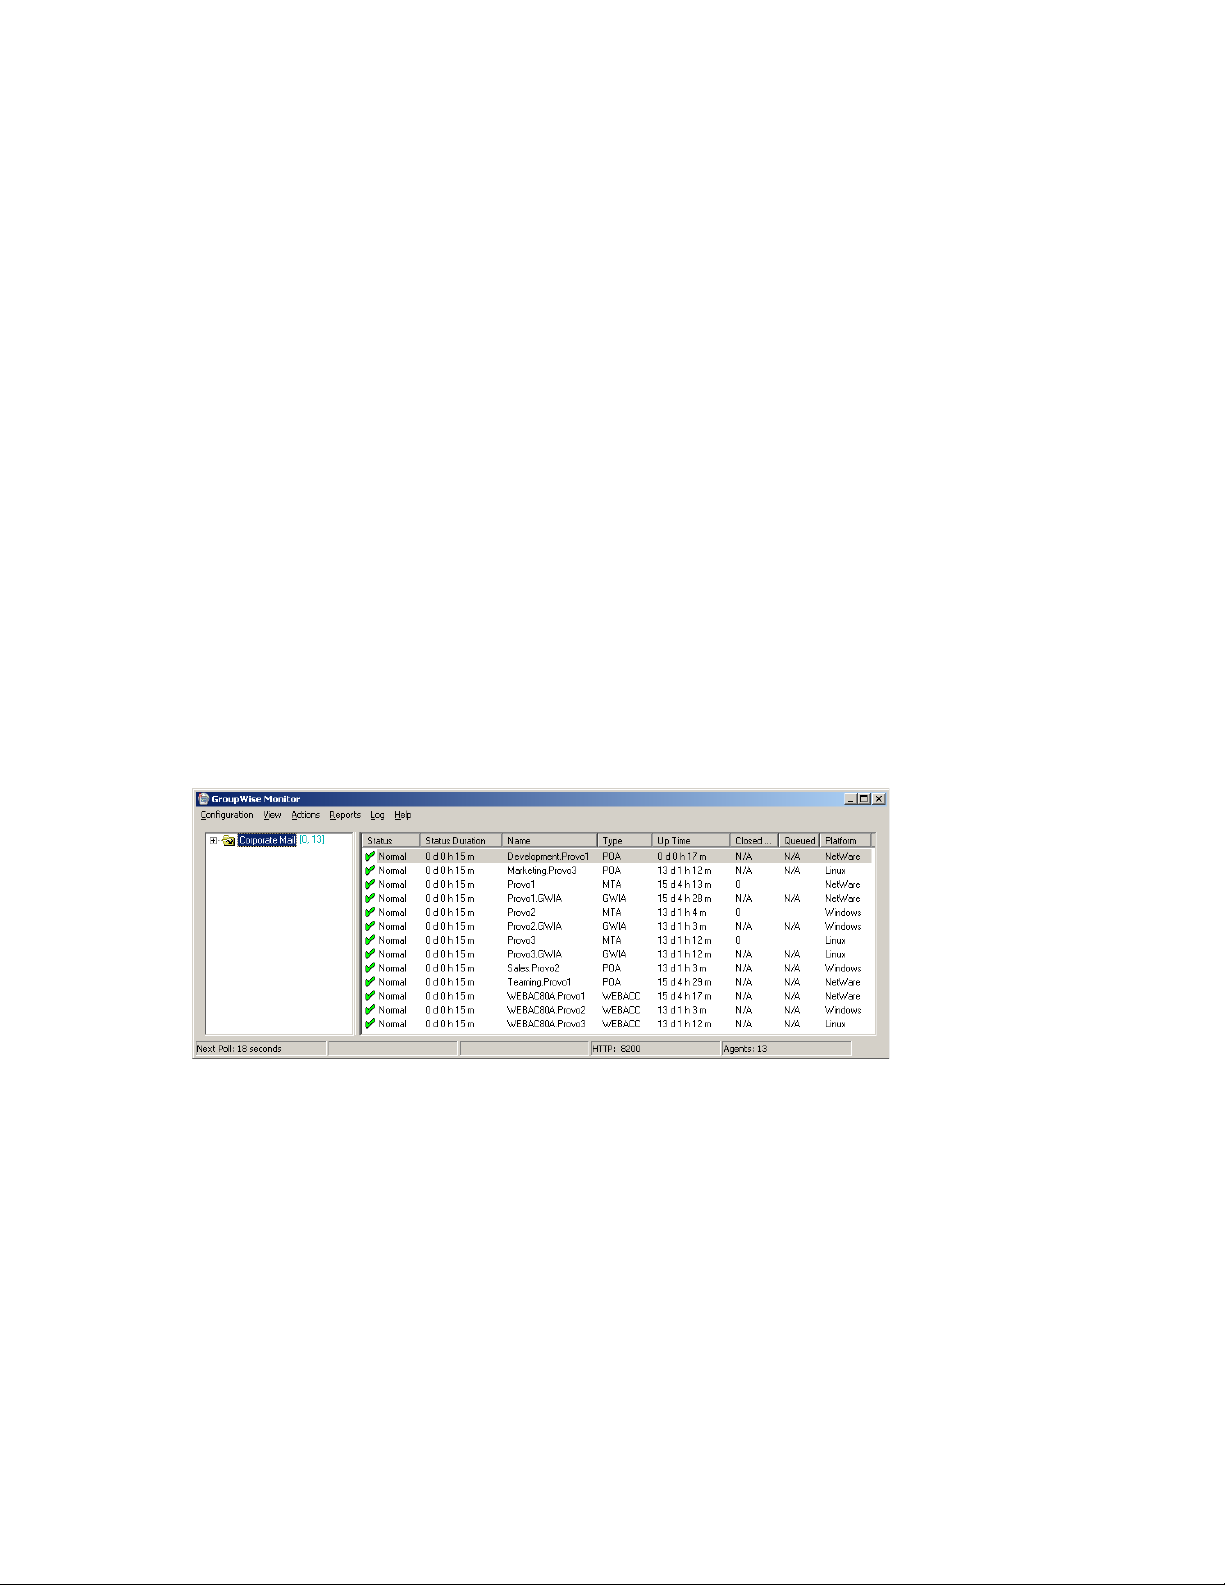
1 Click Configuration > Add from Network.
novdocx (en) 22 June 2009
or
On Linux, at the Monitor Agent Web console, click Preferences > Add Agents.
2 Type the subnet portion of the IP addresses of the new servers, then click OK.
All GroupWise agents on the subnet are added to the list of monitored agents.
If the new servers are part of your local GroupWise system, you can simply restart the Monitor
Agent and it picks up all new agents in your system.
63.1.4 Adding an Individual Agent
You can start monitoring an individual agent anywhere in your GroupWise system or another
GroupWise system.
At the Windows Monitor Agent server console:
1 Click Configuration > Add Agent.
or
On Linux, at the Monitor Agent Web console, click Preferences > Add Agents.
1010 GroupWise 8 Administration Guide
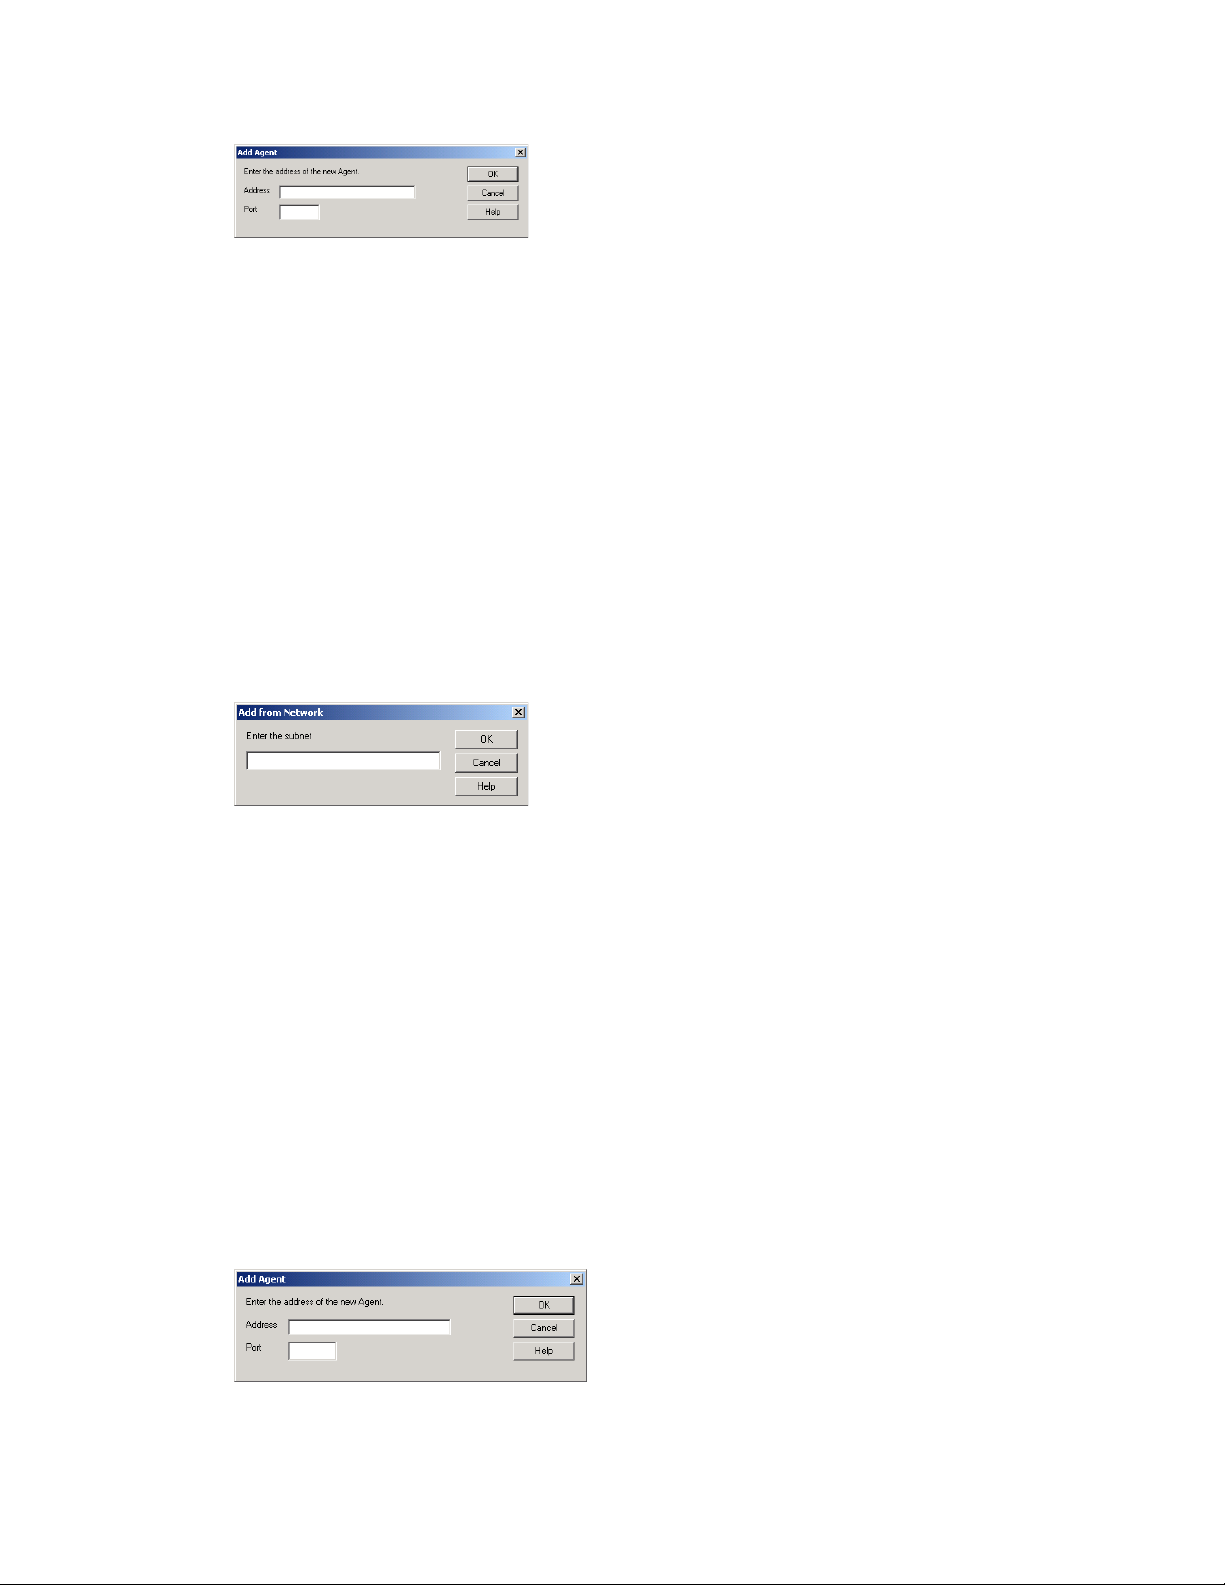
Page 11
2 Type the IP address of the server where the agent runs.
3 Type the port number the agent listens on.
4 Click OK.
The agent is added to the list of monitored agents.
63.1.5 Removing Added Agents
To stop monitoring agents that you have manually added to the Monitor Agent’s configuration:
At the Windows Monitor Agent server console:
1 Click Configuration > Remove Agents.
or
On Linux, at the Monitor Agent Web console, click Preferences > Remove Agents.
2 Select the agents you want to remove, then click Remove.
3 Click OK.
novdocx (en) 22 June 2009
63.2 Creating and Managing Agent Groups
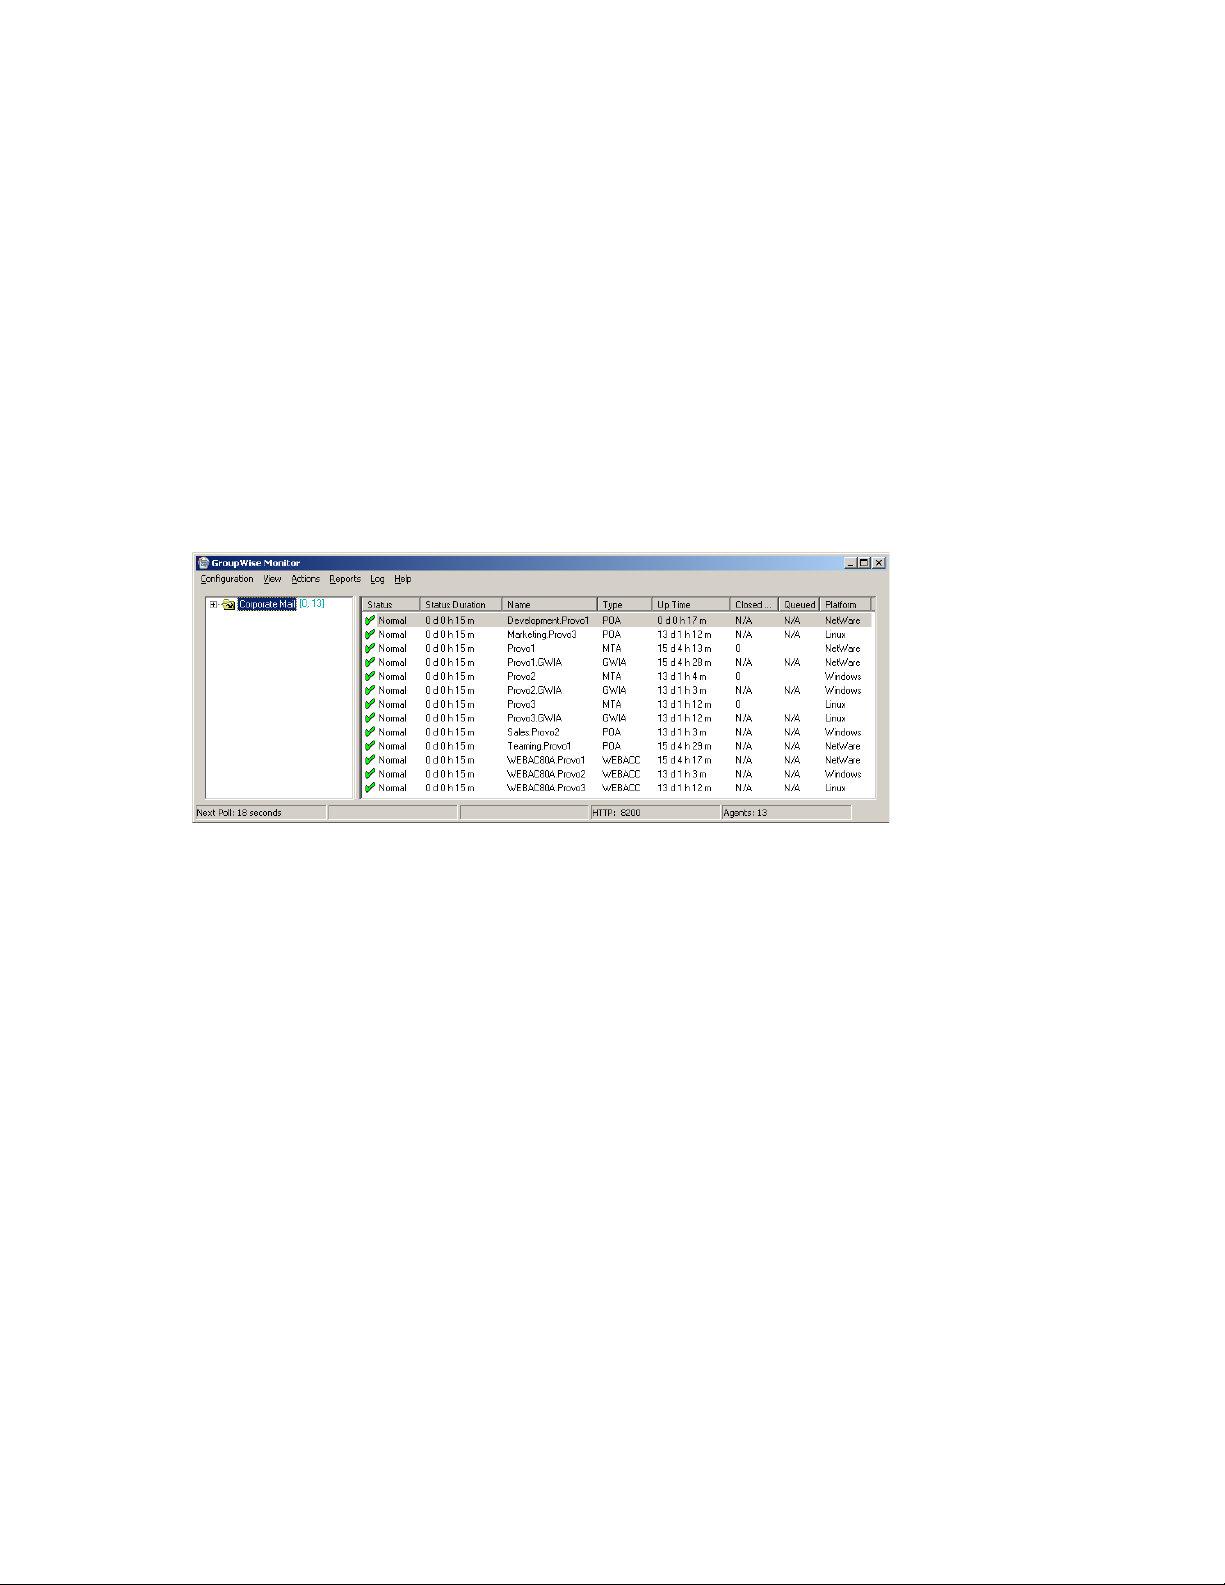
You might find it convenient to group related agents together for monitoring purposes. Initially, all
agents are in a single group with the same name as your GroupWise system.
Figure 63-3 Monitor Agent Console on Initial Startup
Agent groups are displayed on the left side of the Monitor Agent server console. When you select an
agent group, the monitored agents in the group and their status information are listed on the right
side of the Monitor Agent server console.
Configuring the Monitor Agent 1011
Page 12
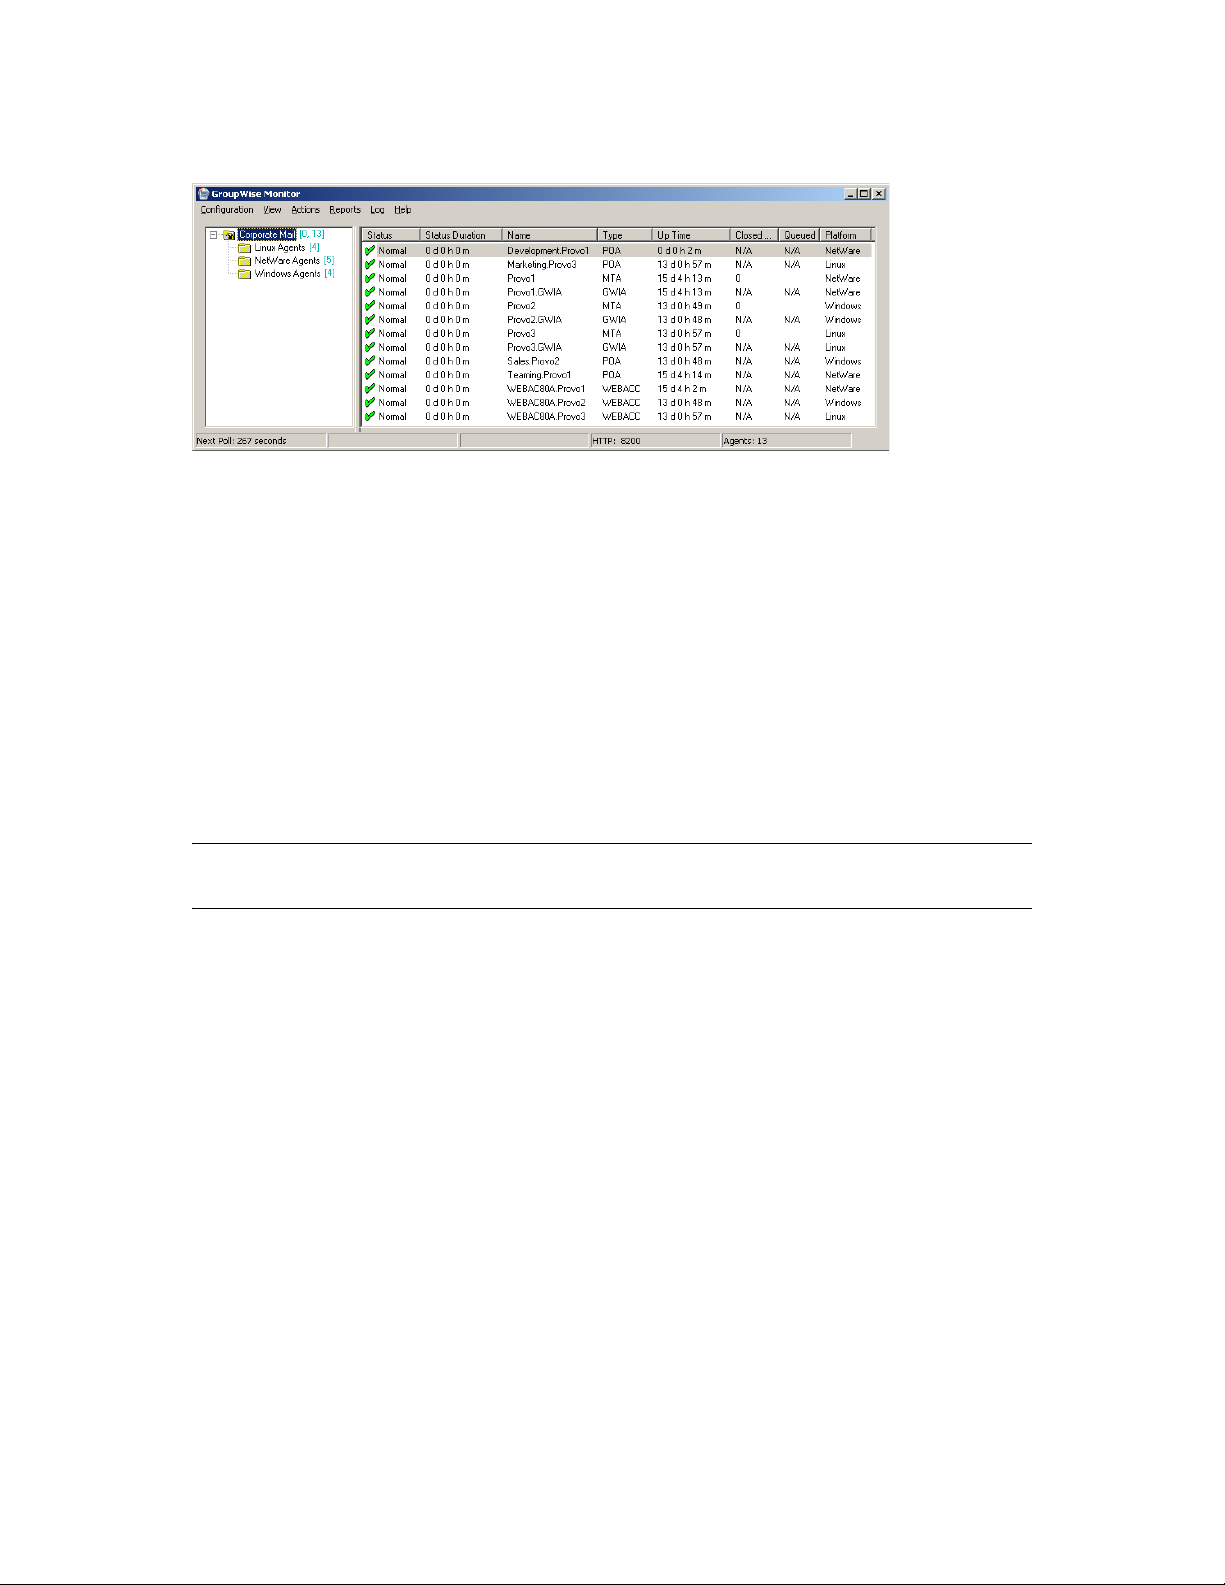
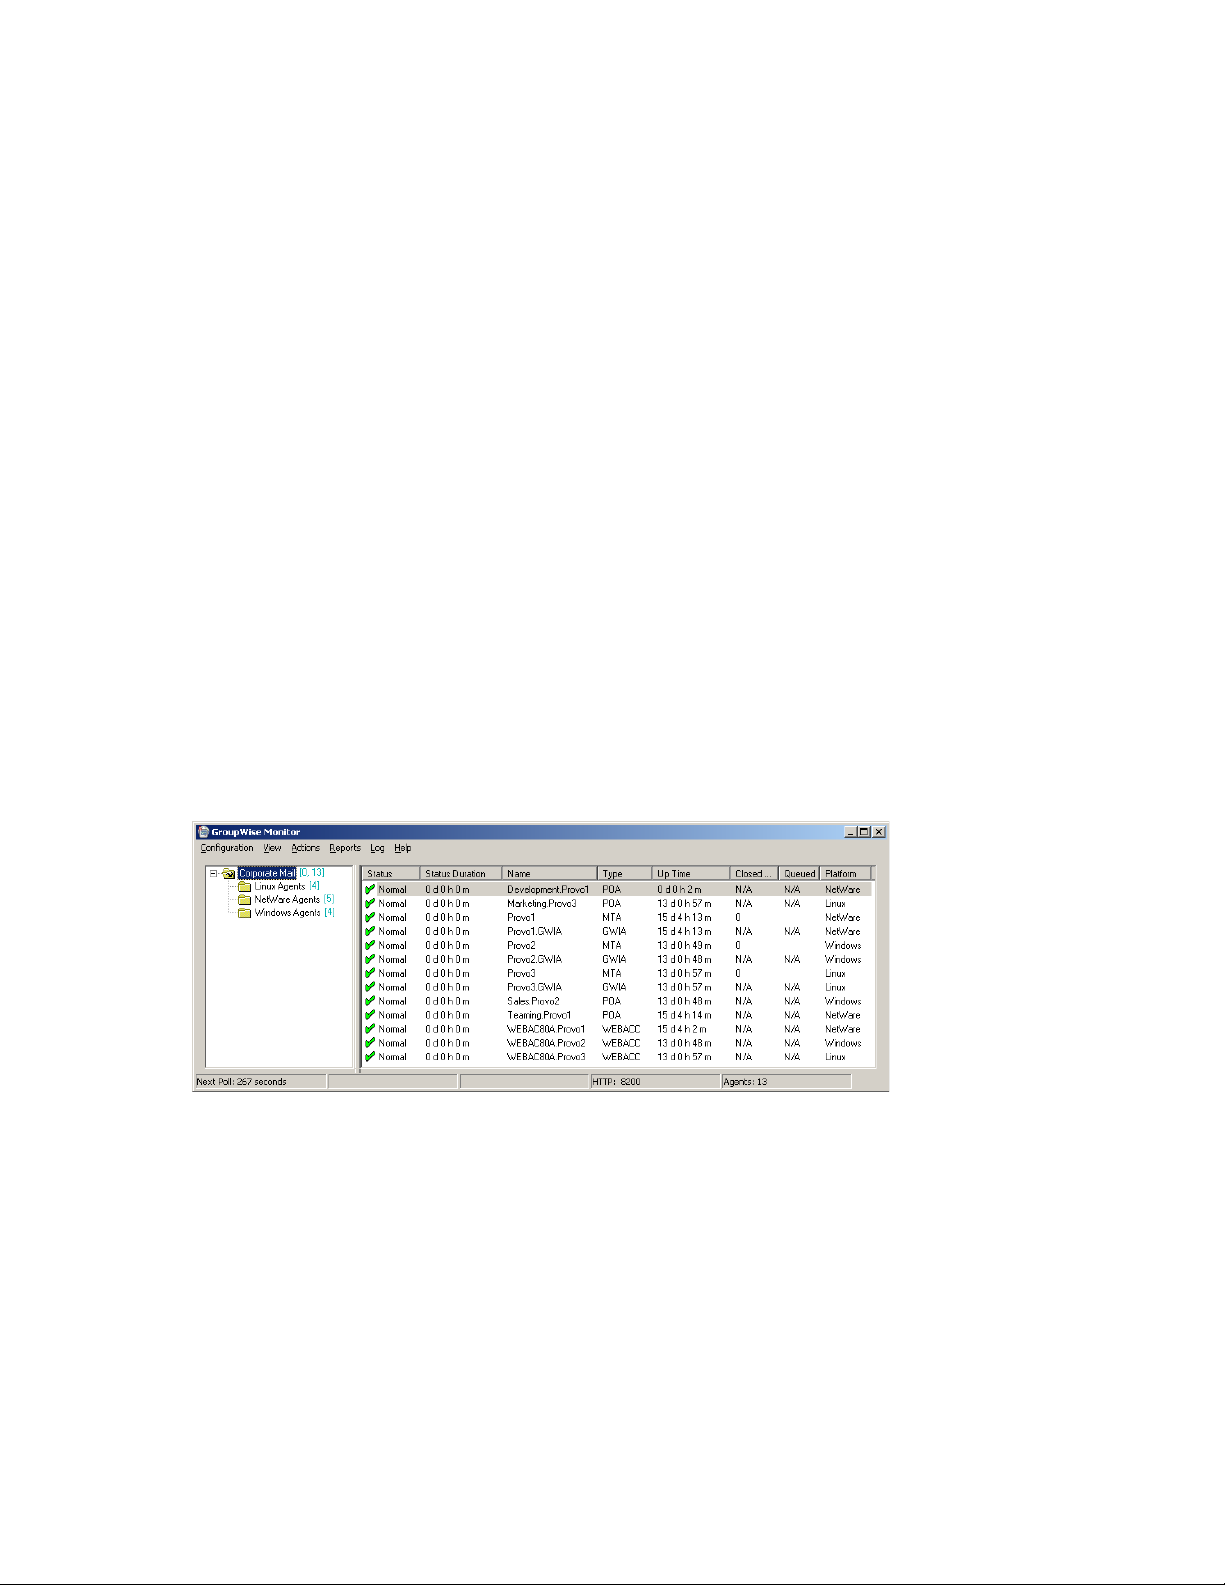
Figure 63-4 Monitor Agent Console with Agent Groups Defined
You can create additional groups and subgroups as needed to make monitoring similar agents easier.
You might want to create agent groups based on geographical areas, on administrative
responsibilities, or on agent configuration similarities. The number of agents in the group is
displayed to the right of the group name in the agent groups window.
In addition, by creating agent groups, you can provide configuration settings for monitoring just
once for all agents in each group, rather than having to provide them individually for each agent in
your GroupWise system.
novdocx (en) 22 June 2009
Section 63.2.1, “Creating an Agent Group,” on page 1012
Section 63.2.2, “Managing Agent Groups,” on page 1013
Section 63.2.3, “Viewing Your Agent Group Hierarchy,” on page 1013
Section 63.2.4, “Configuring an Agent Group,” on page 1013
NOTE: On Linux, you perform these tasks at the Monitor Agent Web console or Monitor Web
console, using steps similar to those provided in this section
63.2.1 Creating an Agent Group
At the Windows Monitor Agent server console:
1 Right-click the folder where you want to create the agent group, then click Create.
2 Type a name for the group, then click OK to create a new folder for the agent group.
The group name must be unique within its parent group.
3 Click a folder containing agents that you want to add to the new group.
4 Drag and drop agents into the new group as needed.
5 Click the new group to view its contents.
You can nest groups within groups as needed.
1012 GroupWise 8 Administration Guide
Page 13
63.2.2 Managing Agent Groups
Managing agent groups is easy at the Monitor Agent server console:
To rename an agent group, right-click the agent group, click Rename, type the new name, then
press Enter.
To move an agent group, drag and drop it to its new location.
To delete an agent group, right-click the agent group, then click Delete. A group must be empty
before you can delete it.
63.2.3 Viewing Your Agent Group Hierarchy
When you create nested groups, you can choose how much of the hierarchy you want displayed at
the Monitor Agent server console:
You can open and close groups manually by clicking the plus and minus icons beside each
folder.
To expand your entire group hierarchy, click View > Expand Tree.
To collapse your entire group hierarchy, click View > C o l lapse Tree.
novdocx (en) 22 June 2009
You can also decide whether you want to view just the agents in the currently selected group or the
agents in subgroups as well. By default, only the agents in the selected folder are listed in the agent
window. Right-click an agent group, then click Show Subgroup Agents to display the contents of
nested groups along with the selected group.
Figure 63-5 Monitor Agent Server Console with Subgroup Agents Displayed
Numbers in brackets beside each group indicate the number of agents in the selected group and the
total number displayed.
63.2.4 Configuring an Agent Group
Configuration settings for monitoring can be set individually for each monitored agent, for each
agent group, or for all monitored agents collectively. You can establish default configuration settings
for all agents by setting them on the root agent group that is named the same as your GroupWise
system. Those default settings can be inherited by each subgroup that you create thereafter if you
select Apply Options to Subgroups. Those default settings can be overridden by establishing
different settings for an agent group or for an individual agent if you deselect Use Parent Options.
Configuring the Monitor Agent 1013
Page 14
63.3 Configuring Monitoring Protocols
By default, the Monitor Agent uses HTTP to communicate with the agents it monitors. If HTTP is
not available, the Monitor Agent changes automatically to SNMP.
GroupWise 8 agents, GroupWise 7 agents, GroupWise 6.x agents and 6.x-level gateways, as well as
the GroupWise agents provided with the GroupWise 5.5 Enhancement Pack, can be monitored using
HTTP. Agents dating from GroupWise 5.5 and earlier, as well as 5.5-level GroupWise gateways,
must be monitored using SNMP.
Section 63.3.1, “Configuring the Monitor Agent for HTTP,” on page 1014
Section 63.3.2, “Configuring the Monitor Agent for SNMP,” on page 1016
63.3.1 Configuring the Monitor Agent for HTTP
You can customize how the Monitor Agent communicates with your Web browser.
At the Windows Monitor Agent server console:
1 Click Configuration > HTTP.
novdocx (en) 22 June 2009
or
At the Linux Monitor Agent Web console, click Preferences > Setup, then scroll down to the
HTTP Settings section.
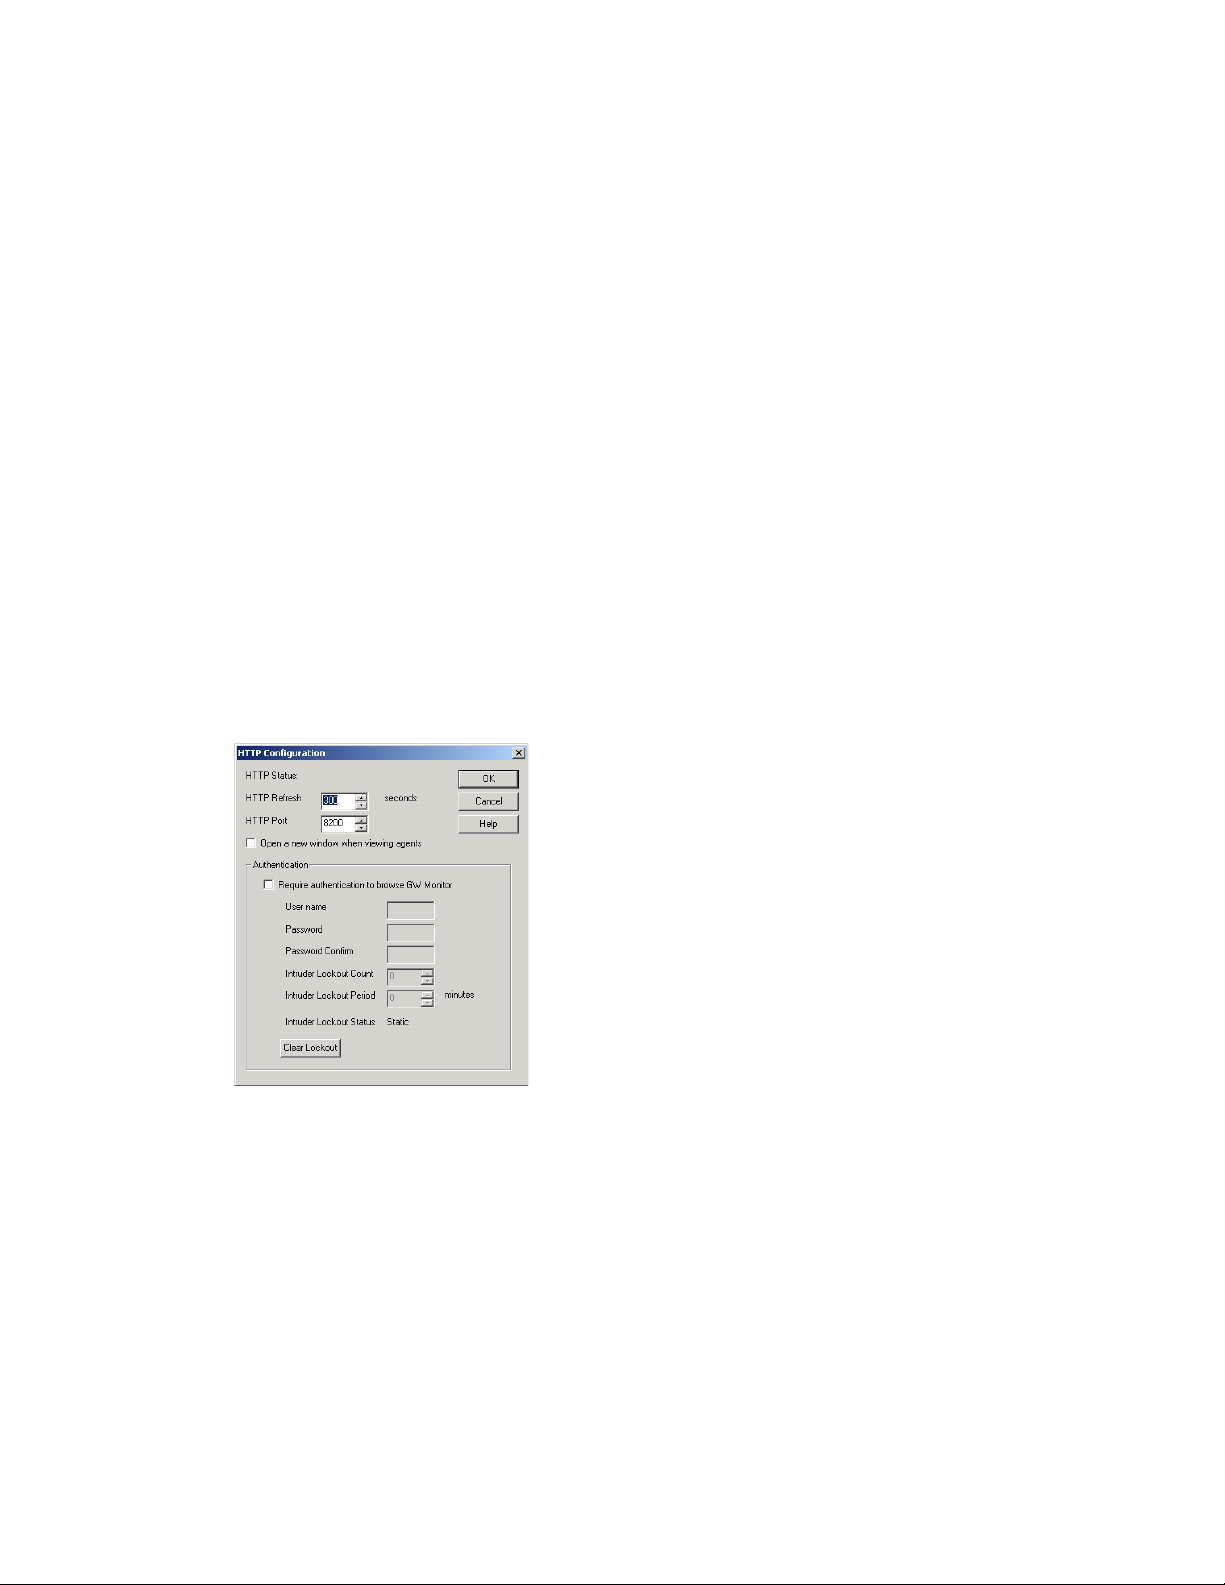
2 Modify the HTTP settings as needed:
HTTP Refresh: Specify the number of seconds after which the Monitor Agent sends updated
information to the Monitor Web console. The default is 300 seconds (5 minutes).
HTTP Port: Specify the port number for the Monitor Agent to listen on for requests for
information from the Web console. The default port number is 8200.
Open a new window when viewing agents: Select this option to open a new Web browser
window whenever you display an agent Web console. This enables you to view the Monitor
Web console and an agent Web console at the same time, or to view two agent Web consoles at
the same time for comparison.
3 Click OK to put the new HTTP settings into effect.
1014 GroupWise 8 Administration Guide
Page 15
At the Windows Monitor Agent server console:
4 Click Configuration > Poll Settings.
or
On Linux, at the Monitor Agent Web console, click Preferences > Setup, then scroll down to
the HTTP Settings section.
novdocx (en) 22 June 2009
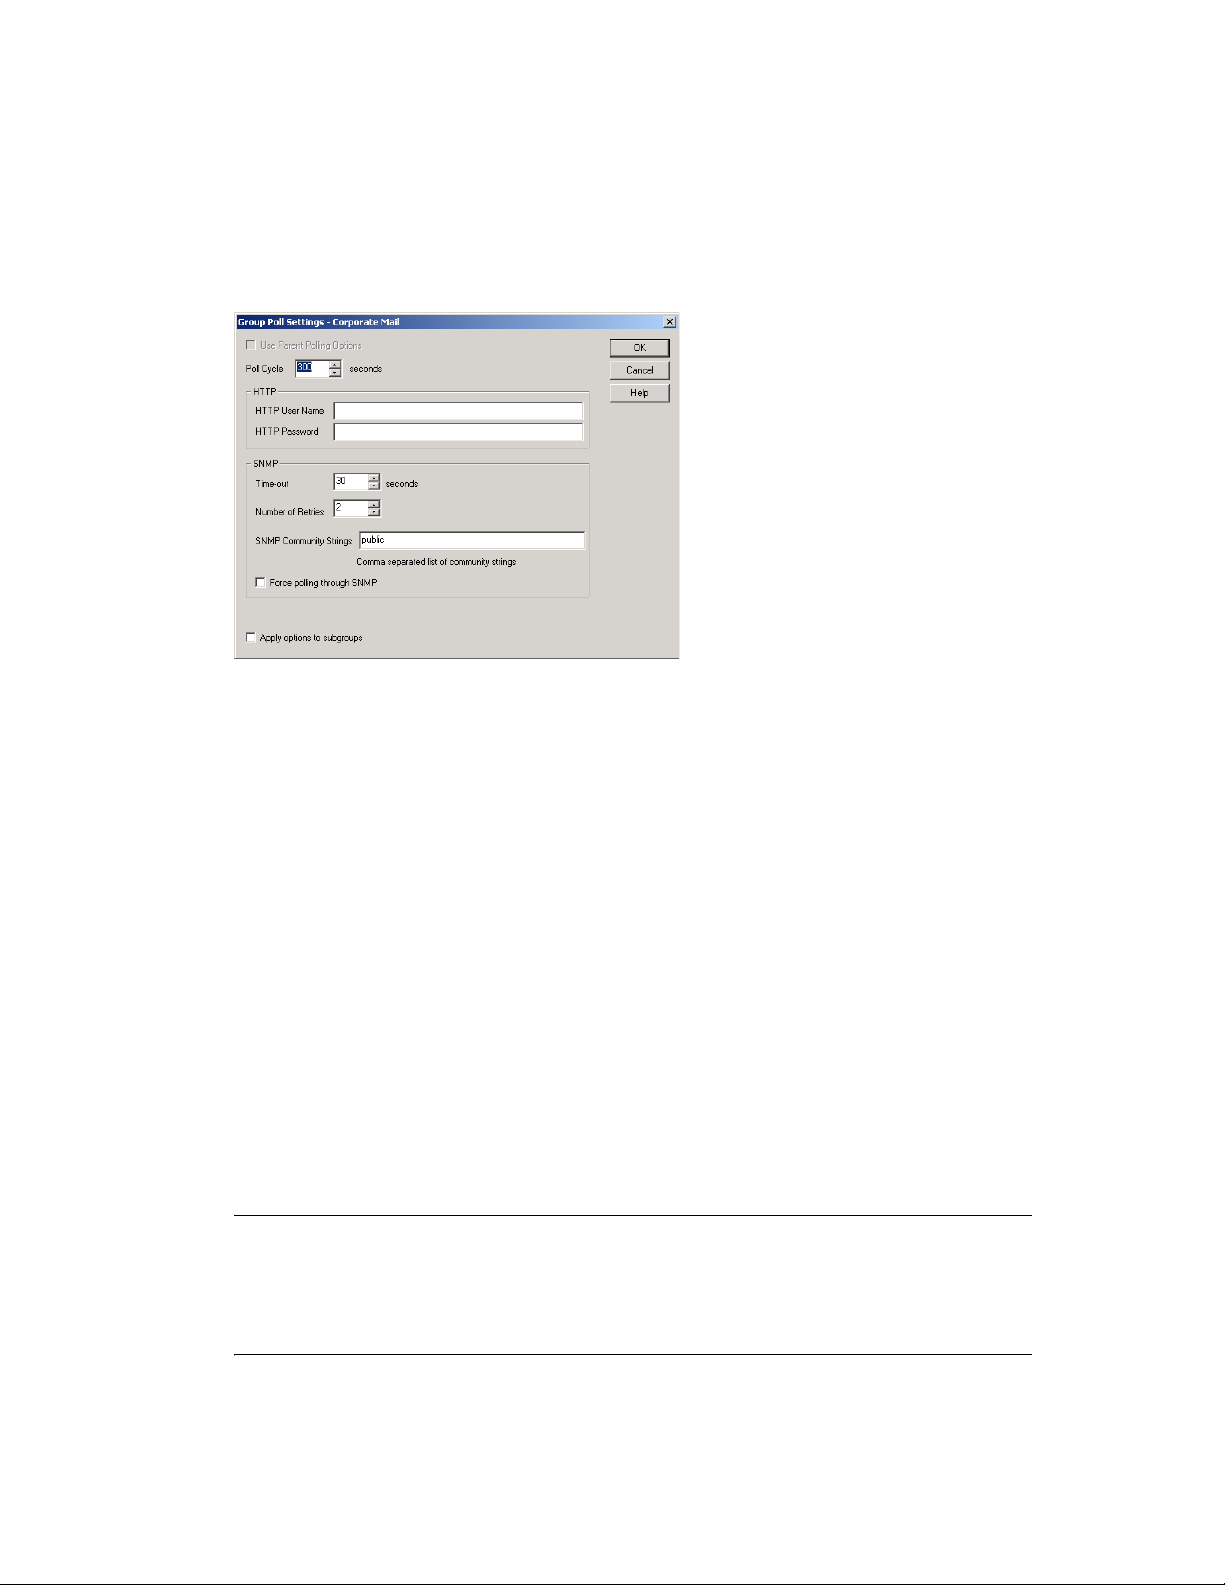
5 Fill in the following fields:
Poll Cycle: Specify the number of seconds after which the Monitor Agent polls all monitored
GroupWise agents for updated information.
By default, the Monitor Agent starts 20 threads to poll monitored agents. You can use the /
pollthreads startup switch to adjust the number of threads. For more information, see
Chapter 67, “Using Monitor Agent Startup Switches,” on page 1063.
By default, the Monitor Agent communicates with other GroupWise agents by way of XML.
However, if XML is unavailable, the Monitor Agent automatically uses SNMP instead. Prior to
the GroupWise 5.5 Enhancement Pack, GroupWise agents did not support XML, so the
Monitor Agent must use SNMP to monitor these older agents. If you need to monitor older
agents, see Section 63.3.2, “Configuring the Monitor Agent for SNMP,” on page 1016.
If all monitored agents in the group require the same username and password in order to
communicate with the Monitor Agent, you can provide that information as part of the Monitor
Agent’s configuration.
HTTP User Name: Provide the username for the Monitor Agent to use when contacting
monitored agents in the group for status information.
HTTP Password: Provide the password, if any, associated with the username specified in the
field above.
NOTE: On Linux, at the Monitor Agent Web console, the HTTP User Name and HTTP
Password fields are not available. However, you can use the --httpagentuser and --
httpagentpassword startup switches when you start the Monitor Agent to achieve the same
functionality. For more information, see Chapter 67, “Using Monitor Agent Startup Switches,”
on page 1063.
If the monitored agents use different usernames and passwords, you are prompted to supply
them when the Monitor Agent needs to communicate with the monitored agents.
Configuring the Monitor Agent 1015
Page 16
6 Select Apply options to subgroups if you want subgroups to inherit these settings.
7 Click OK to put the specified poll cycle into effect.
63.3.2 Configuring the Monitor Agent for SNMP
The Monitor Agent must use SNMP to communicate with GroupWise agents that date from earlier
than the GroupWise 5.5 Enhancement Pack. You can customize how the Monitor Agent
communicates with such older agents and how it communicates with SNMP monitoring and
management programs.
At the Windows Monitor Agent server console:
1 Click Configuration > Poll Settings.
or
On Linux, at the Monitor Agent Web console, click Preferences > Setup, then scroll down to
the SNMP Settings section.
novdocx (en) 22 June 2009
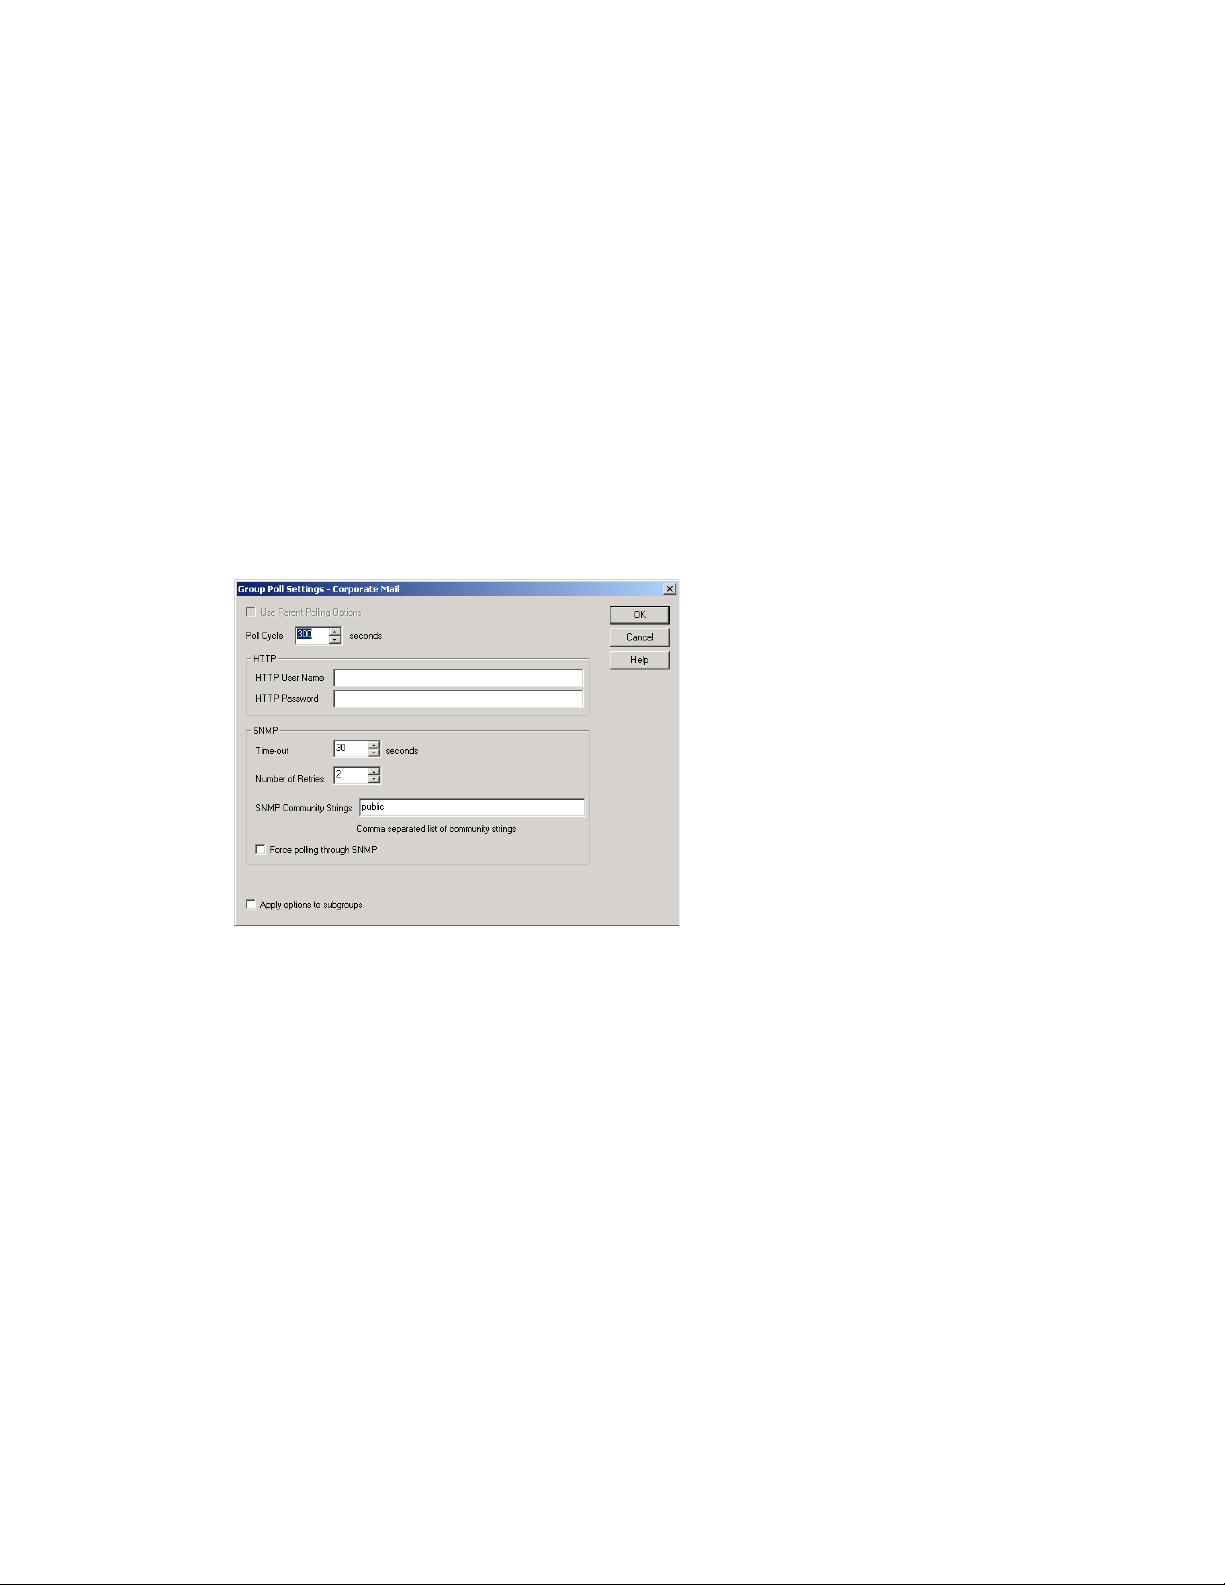
2 Specify the number of seconds after which the Monitor Agent polls all monitored GroupWise
agents for updated information using SNMP.
3 In the SNMP box, modify the SNMP settings as needed:
Time-out: Specify the number of seconds the Monitor Agent should wait for a response from
servers where GroupWise agents run.
Number of Retries: Specify how often the Monitor Agent should try to contact the servers
where GroupWise agents run.
SNMP Community Strings: Provide a comma-delimited list of community strings required to
access the servers where GroupWise agents run.
Force polling through SNMP: Select this option to use SNMP polling instead of the default
of XML polling when contacting servers where agents in the group run.
4 Click Apply options to subgroups if you want subgroups to inherit these settings.
1016 GroupWise 8 Administration Guide
Page 17
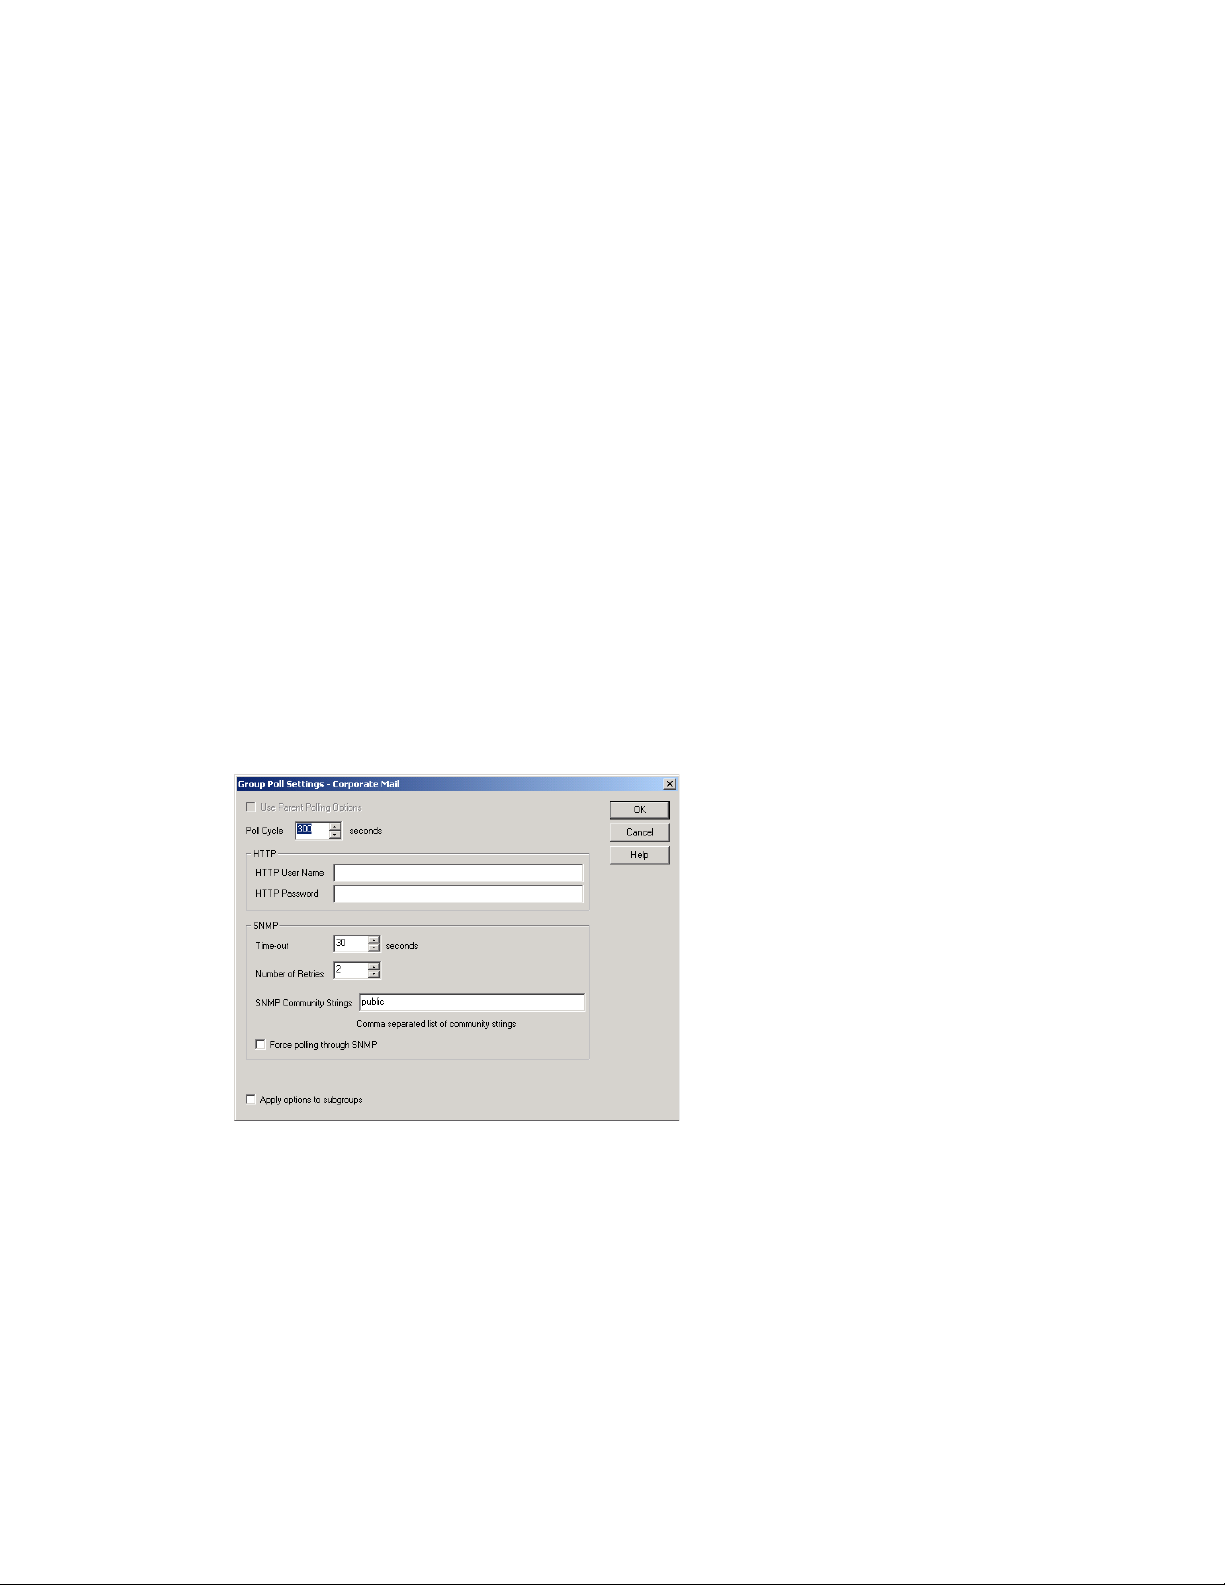
5 Click OK to put the new SNMP settings into effect.
6 Make sure the GroupWise agents you want to monitor using SNMP are enabled for SNMP. See
Section 37.6.1, “Setting Up SNMP Services for the POA,” on page 555 and Section 42.6.1,
“Setting Up SNMP Services for the MTA,” on page 683. The same instructions can be
followed for all GroupWise 5.x, 6.x, 7, and 8 agents.
63.4 Configuring Polling of Monitored Agents
By default, the Monitor Agent polls all monitored agents every five minutes. You can adjust the poll
cycle as needed.
At the Windows Monitor Agent server console:
1 Select the root agent group to set the poll cycle default for all monitored agents.
or
Select any agent group to set the poll cycle for the agents in the selected group.
or
Select any agent to set the poll cycle for that individual agent.
2 Click Configuration > Poll Settings.
or
novdocx (en) 22 June 2009
At the Linux Monitor Agent Web console, select one ore more agents, click Preferences >
Setup, then scroll down to the HTTP Settings section.
Unless you selected the root agent group, Use Parent Notification Options is selected and all
options are dimmed. Deselect Use Parent Notification Options to set up e-mail notification for
an agent group.
3 Increase or decrease the poll cycle as needed, then click OK.
Configuring the Monitor Agent 1017
Page 18
63.5 Configuring E-Mail Notification for Agent Problems
The Monitor Agent can notify you by e-mail when agent problems arise.
Section 63.5.1, “Configuring E-Mail Notification,” on page 1018
Section 63.5.2, “Customizing Notification Thresholds,” on page 1019
63.5.1 Configuring E-Mail Notification
You can configure the Monitor Agent to notify one or more users by e-mail if an agent goes down.
You can also receive e-mail confirmation messages showing that the Monitor Agent itself is still
running normally.
At the Windows Monitor Agent server console:
1 Select the root agent group to set up e-mail notification defaults for all monitored agents.
or
Select any agent group to set up e-mail notification for the agents in the selected group.
novdocx (en) 22 June 2009
or
Select any agent to set up e-mail notification for that individual agent.
2 Click Configuration > Notification.
or
On Linux, at the Monitor Agent Web console, select one or more agents, then click Preferences
> Setup to display the Notify settings.
Unless you selected the root agent group, Use Parent Notification Options is selected and all
options are dimmed. Deselect Use Parent Notification Options to set up e-mail notification for
an agent group or an individual agent.
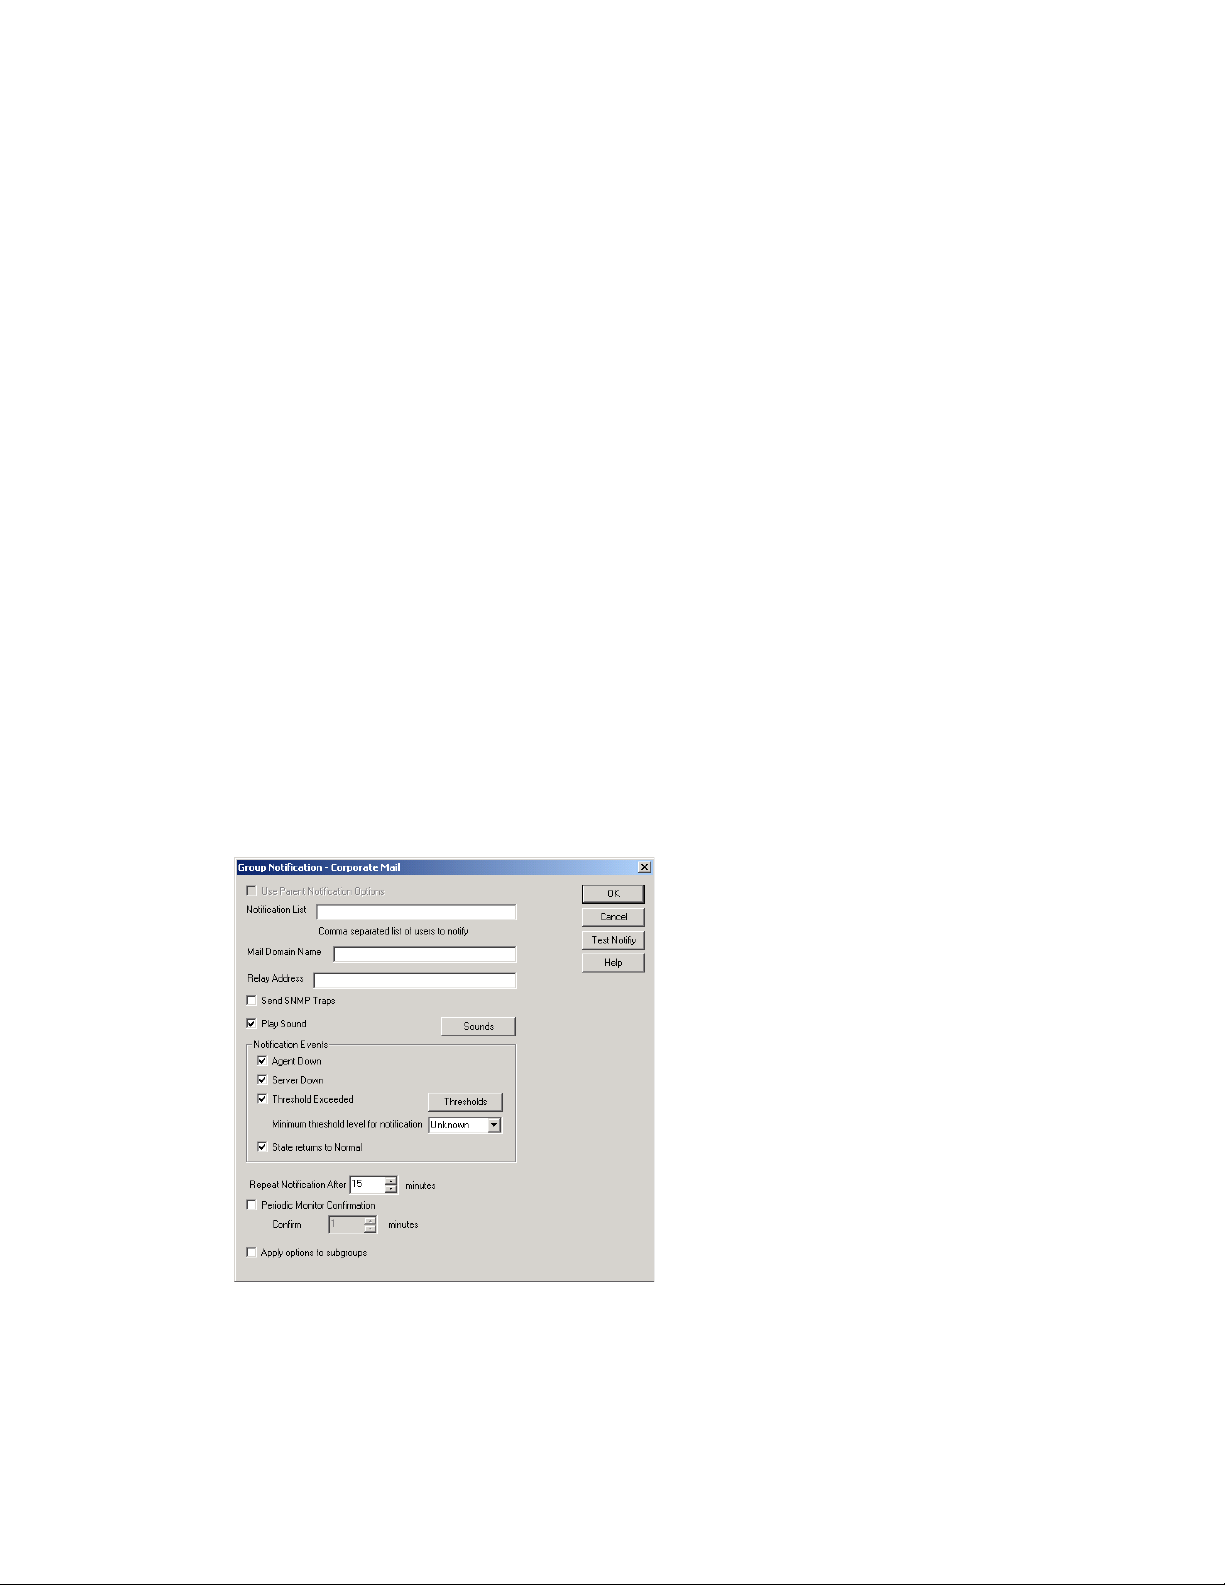
3 Specify one or more e-mail addresses or pager addresses to send notifications to.
1018 GroupWise 8 Administration Guide
Page 19

4 Specify the Internet domain name of your GroupWise system.
5 If the mail system to which e-mail notification is being sent performs reverse DNS lookups,
specify the IP address or hostname of a server to relay the notification messages through.
The Monitor Agent should relay e-mail notifications through a server that has a published DNS
address.
6 Click Test Notify to determine if the Monitor Agent can successfully send to the addresses
specified in the Notification List field.
A message informs you of the results of the test. If the test is successful, a test message arrives
shortly at each address. If the test is unsuccessful, double-check the information you provided
in the Notification List, Mail Domain Name, and Relay Address fields.
7 Select the events to trigger e-mail notification messages.
Agent Down
Server Down
Threshold Exceeded
State returns to Normal
If you want to be notified of more specific states, see Section 63.5.2, “Customizing Notification
Thresholds,” on page 1019.
8 Select the amount of time that you want to elapse before repeat e-mail notifications are sent.
novdocx (en) 22 June 2009
9 To monitor the Monitor Agent and assure it is functioning normally, select Periodic Monitor
Confirmation, then select the number of minutes between Monitor Agent e-mail confirmation
messages.
10 Click OK to save the e-mail notification settings.
63.5.2 Customizing Notification Thresholds
To refine the types of events that trigger e-mail notification messages, you can create your own
thresholds that describe very specific states. Using thresholds, you can configure the Monitor Agent
to notify you of problem situations peculiar to your GroupWise system.
1 Make sure that notification has been properly set up as described in Section 63.5.1,
“Configuring E-Mail Notification,” on page 1018.
2 Select one or more agents or agent groups.
At the Windows Monitor Agent server console:
3 Click Configuration > Thresholds.
or
On Linux, at the Monitor Agent Web console, click Preferences > Thresholds.
Configuring the Monitor Agent 1019
Page 20
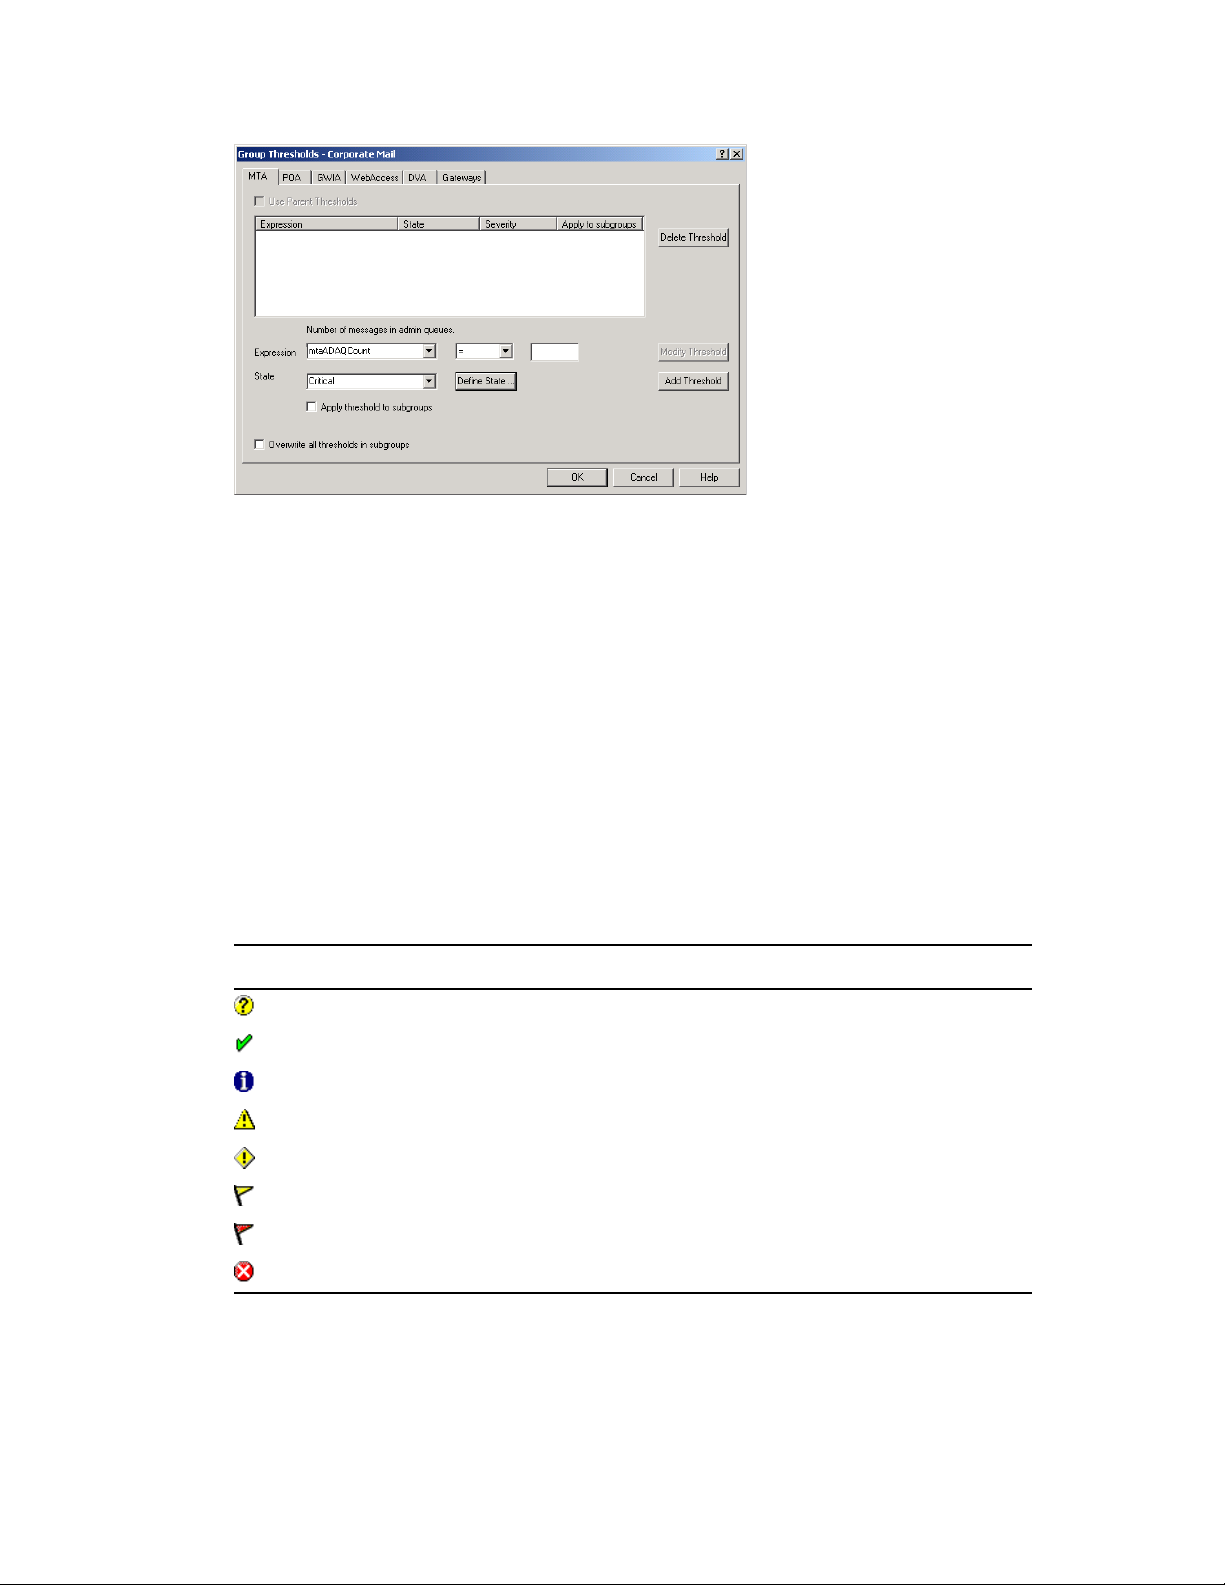
The tabs at the top of the dialog box enable you to create a separate threshold for each type of
GroupWise agent.
4 Select the type of agent to create a threshold for.
novdocx (en) 22 June 2009
5 In the Expression field, select a MIB variable.
GroupWise agent MIB files are located in the
\agents\snmp
directory of your GroupWise
software distribution directory or the GroupWise 8 DVD or downloaded GroupWise 8 image.
The MIB files list the meanings of the MIB variables and what type of values they represent.
The meaning of the MIB variable selected in the Expression field is displayed above the field.
6 Select an operator from the drop-down list.
7 Type the value to test for.
For example, you might want to test the mtaOldestQMsg variable for a specific number of
seconds that you consider to be too long for a message to be in the queue.
8 In the State field, select an existing state.
Icon State
Unknown
Normal
Informational
Marginal
Warning
Minor
Major
Critical
or
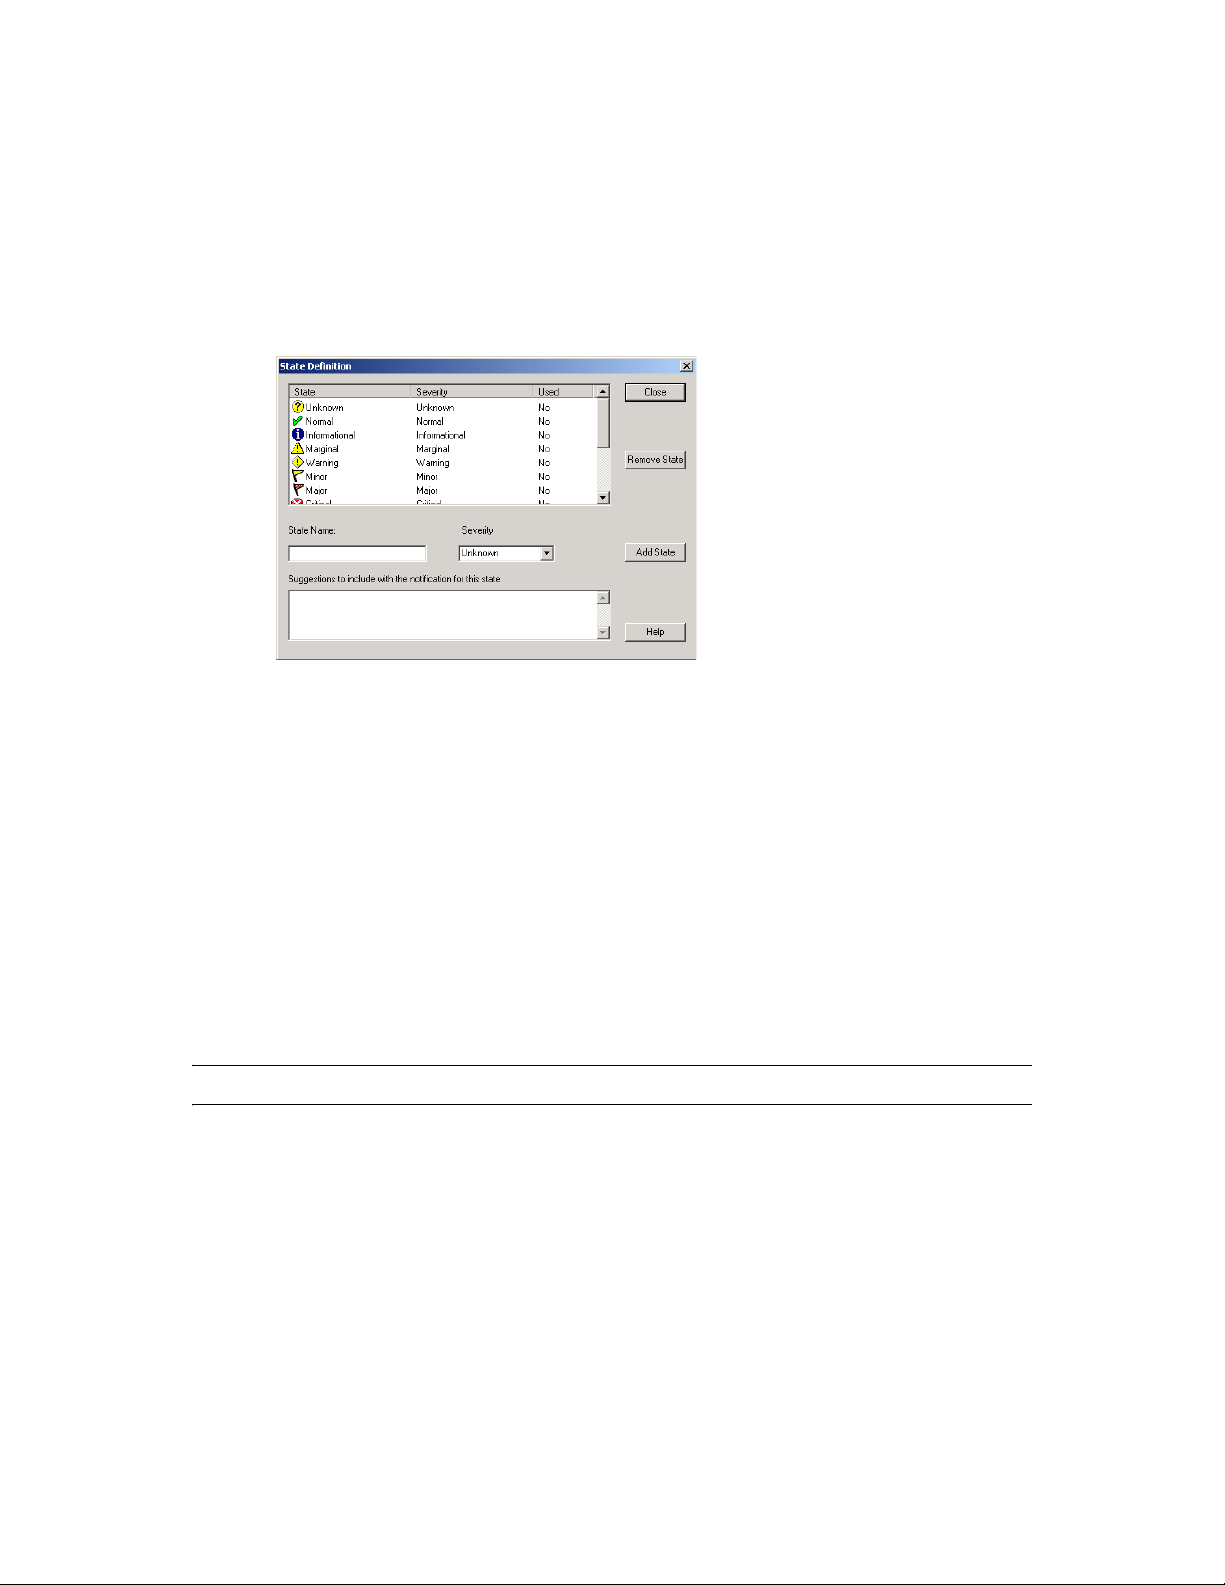
Create a new state:
8a In the Group Thresholds window, next to the State field, click Define State.
1020 GroupWise 8 Administration Guide
Page 21
or
On Linux, at the Monitor Agent Web console, click Preferences > States.
8b Type a name for the new state.
8c Select a severity level.
8d Provide instructions about how to handle the new state.
8e Click Close to save the new state.
novdocx (en) 22 June 2009
9 Click OK to create the new threshold.
10 Repeat Step 3 through Step 9 for each type of agent that you want to create a customized state
for.
11 Make sure Threshold Exceeded is selected in the Notification Events box.
12 Click OK to save the new notification settings.
63.6 Configuring Audible Notification for Agent Problems
If the server where the Monitor Agent runs is located where someone can respond immediately to a
GroupWise agent problem, you can configure the Monitor Agent to produce a different sound
according to the nature of the problem.
NOTE: Audible notification is not available on Linux.
At the Windows Monitor Agent server console:
1 Select the root agent group to set up audible notification defaults for all monitored agents.
or
Select any agent group to set up audible notification for the agents in the selected group.
or
Select any agent to set up audible notification for that individual agent.
2 Click Configuration > Notification.
Configuring the Monitor Agent 1021
Page 22
Unless you selected the root agent group, Use Parent Notification Options is selected and all
options are dimmed. Deselect Use Parent Notification Options to set up notification for an
agent group or individual agent.
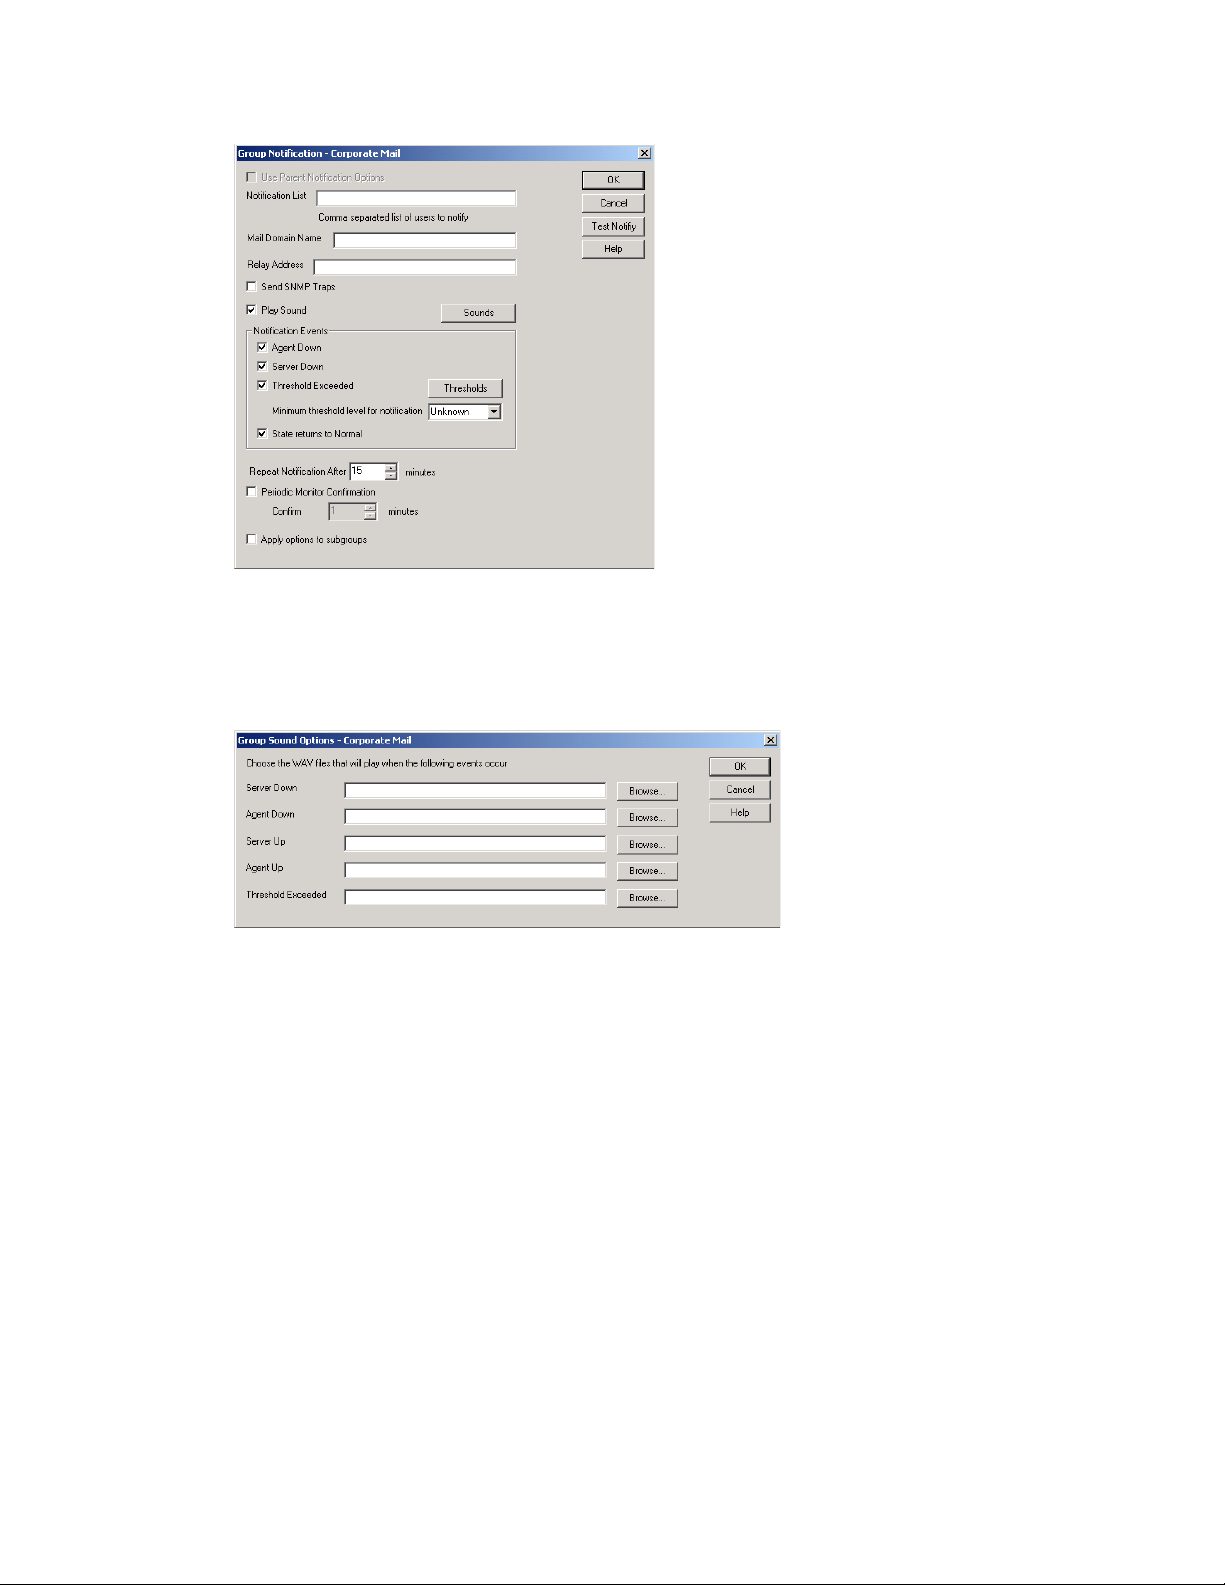
3 Select Play Sound, then click Sounds.
novdocx (en) 22 June 2009
4 For each event, browse to and select a sound file to provide audible notification for each type of
event for the selected agent group.
The Monitor Agent launches the default media player for whatever type of sound file you
select. Basic sound files are available in the
5 Click OK to return to the Notification dialog box.
6 Select notification events and other notification settings as described in Section 63.5,
“Configuring E-Mail Notification for Agent Problems,” on page 1018.
7 Click OK to save the audible notification settings.
63.7 Configuring SNMP Trap Notification for Agent Problems
The Monitor Agent can throw SNMP traps for use by the Management and Monitoring component
of Novell
1022 GroupWise 8 Administration Guide
®
ZENworks® for Servers or any other SNMP management and monitoring program.
c:\windows\media
directory.
Page 23

At the Windows Monitor Agent server console:
1 Select the root agent group to set up SNMP trap notification defaults for all monitored agents.
or
Select any agent group to set up SNMP trap notification for the agents in the selected group.
or
Select any agent to set up SNMP trap notification for that individual agent.
2 Click Configuration > Notification.
or
On Linux, at the Monitor Agent Web console, select one or more agents, then click Preferences
> Setup to display the Notify settings.
novdocx (en) 22 June 2009
Unless you selected the root agent group, Use Parent Notification Options is selected and all
options are dimmed. Deselect Use Parent Notification Options to set up notification for an
agent group or individual agent.
3 Select Send SNMP Traps, then click OK.
4 Make sure that the Monitor Agent is properly configured for SNMP, as described in
Section 63.3.2, “Configuring the Monitor Agent for SNMP,” on page 1016.
63.8 Configuring Authentication and Intruder Lockout for the Monitor Web Console
Accessing GroupWise agent status information from your Web browser is very convenient.
However, you might want to limit access to that information. You can configure the Monitor Agent
to request a username and password before allowing users to access the Monitor Web console. In
addition, you can configure the Monitor Agent to detect break-in attempts in the form of repeated
unsuccessful logins.
Configuring the Monitor Agent 1023
Page 24

NOTE: To limit access on Linux, use the --httpmonuser and --httpmonpassword startup switches
when you start the Monitor Agent. For more information, see Chapter 67, “Using Monitor Agent
Startup Switches,” on page 1063 The intruder lockout functionality is not available on Linux.
At the Windows Monitor Agent server console:
1 Click Configuration > HTTP.
novdocx (en) 22 June 2009
2 In the Authentication box, select Require authentication to browse GW Monitor.
3 Fill in the fields:
User Name: Provide a username for the Monitor Agent to prompt for when a user attempts to
access the Monitor Web console.
Password: Provide a password for the Monitor Agent to prompt for when a user attempts
access. Repeat the password in the Password Confirm field.
For optimum security for the Monitor Web console, use the /httpssl and /httpcertfile startup
switches, along with a certificate file, when starting the Monitor Agent. For more information,
see Chapter 67, “Using Monitor Agent Startup Switches,” on page 1063.
Intruder Lockout Count: Specify the number of failed attempts the Monitor Agent should
allow before it stops prompting the potentially unauthorized user for a valid username and
password.
Intruder Lockout Period: Specify the number of minutes that must elapse before the user can
again attempt to access the Monitor Web console.
If a valid user gets locked out of the Monitor Web console, you can use Clear Lockout to grant
access before the intruder lockout period has elapsed.
4 Click OK to put the authentication settings into effect.
63.9 Configuring Monitor Agent Log Settings
The Monitor Agent writes to two different types of log files.
Event log files record error messages, status messages, and other types of event-related
messages.
History log files record dumps of all MIB values gathered during each poll cycle.
1024 GroupWise 8 Administration Guide
Page 25

Log files can provide a wealth of information for resolving problems with Monitor Agent
functioning or agent monitoring.
At the Windows Monitor Agent server console:
1 Click Log > Log Settings.
or
On Linux, at the Monitor Agent Web console, click Log.
novdocx (en) 22 June 2009
2 Fill in the fields:
Log File Path: Specify the full path of the directory where the Monitor Agent writes its log
files.
The default log file location varies by platform.
Linux:
Windows:
/var/log/novell/groupwise/gwmon
c:\Program Files\Novell\GroupWise Server\Monitor
Maximum Event Log File Age: Specify the number of days you want Monitor Agent event
log files to remain on disk before being automatically deleted. The default event log file age is
30 days.
Maximum Event Log Disk Space: Specify the maximum amount of disk space for all
Monitor event log files. When the specified disk space is used, the Monitor Agent overwrites
existing Monitor Agent event log files, starting with the oldest. The default is 102400 KB (100
MB) of disk space for all Monitor Agent event log files.
Maximum History Log File Age: Specify the number of days you want Monitor Agent
history log files to remain on disk before being automatically deleted. The default history log
file age is 30 days.
Maximum History Log Disk Space: Specify the maximum amount of disk space for all
Monitor history log files. When the specified disk space is used, the Monitor Agent overwrites
existing Monitor Agent history log files, starting with the oldest. The default is 102400 KB
(100 MB) of disk space for all Monitor Agent history log files.
3 Click OK to put the new log settings into effect.
4 To view existing event logs, click View > View Log Files.
5 To view existing history log files, click Log > Vie w Histo r y F iles.
Configuring the Monitor Agent 1025
Page 26

63.10 Configuring Proxy Service Support for the Monitor Web Console
The Monitor Web console provides links to the agent Web consoles. Although you can access the
Monitor Web console from outside your firewall, by default you cannot access the agent Web
consoles from outside your firewall. To enable the Monitor Web console to display the agent Web
consoles from outside your firewall, you need to enable the Monitor Agent to support proxy service.
novdocx (en) 22 June 2009
1 In a text editor, open the Monitor Application configuration file (
The default location of this file varies by platform.
Linux:
Windows:
2 Locate the following line:
Provider.GWMP.Agent.Http.level=basic
3 Change it to:
Provider.GWMP.Agent.Http.level=full
The basic setting restricts use of the Monitor Web console to within a firewall, while the full
setting allows use of the Web console both inside and outside a firewall. A third setting, none,
disables use of the Web console.
4 Save and exit the Monitor Application configuration file.
5 Start the Monitor Agent with the /proxy startup switch.
For information about startup switches, see Chapter 67, “Using Monitor Agent Startup
Switches,” on page 1063.
Without proxy service support enabled, the Monitor Web console, after it gets a GroupWise agent’s
address from the Monitor Agent, communicates directly with the GroupWise agent. This process,
however, does not work when communicating through a firewall.
/opt/novell/groupwise/gwmonitor
c:\Novell\GroupWise\gwmonitor
on the Web server
gwmonitor.cfg
)
With proxy service support enabled, all communication is routed through the Monitor Agent and
Monitor Application (on the Web server). As long as the Web server can be accessed through the
firewall, the Monitor Web console can receive information about all GroupWise agents that the
Monitor Agent knows about.
63.11 Monitoring Messenger Agents
Monitor can be used to monitor Messenger agents as well as GroupWise agents. In fact, Monitor can
be used independently to monitor Messenger Agents. If you start Monitor with no access to
GroupWise system, you are prompted for the information Monitor needs in order to start monitoring
Messenger agents.
1026 GroupWise 8 Administration Guide
Page 27

Figure 63-6 GroupWise Monitor Setup Dialog Box
To make this information a permanent part of your independent Messenger system, follow the
instructions in “Using GroupWise Monitor” in “Managing the Messaging Agent” in the Novell
Messenger Administration Guide.
novdocx (en) 22 June 2009
If Monitor is already monitoring GroupWise agents, then it is easy to add Messenger agents.
At the Windows Monitor Agent server console:
1 Click Configuration > Add Novell Messenger System.
2 Fill in the following fields in the GroupWise Monitor Startup dialog box or the Add Novell
Messenger System dialog box:
TM
Novell Messenger System Object: Browse to and select the eDirectory
container where you
created the Messenger system.
User Name: Browse to and select a User object that has sufficient rights to enable the Monitor
Agent to access Messenger object properties in eDirectory.
Password: Specify the network password associated with the User object.
Replica Address: Specify the IP address of a server where an eDirectory replica is available.
3 Click OK to add the Messenger Agent and the Archive Agent to the list of monitored agents.
Configuring the Monitor Agent 1027
Page 28

NOTE: On Linux, use the Preferences > Add Agents at the Monitor Agent Web console to add the
individual Messenger agents to the list of monitored agents. For more information, see
Section 63.1.4, “Adding an Individual Agent,” on page 1010.
63.12 Supporting the GroupWise High Availability Service on Linux
The GroupWise High Availability service, described in “Enabling the High Availability Service for
the Linux GroupWise Agents” in “Installing GroupWise Agents” in the GroupWise 8 Installation
Guide, relies on the Monitor Agent to know when an agent has stopped and needs to be restarted. To
enable communication between the Monitor Agent and the High Availability service, start the
Monitor Agent with the --hauser and --hapassword startup switches, set to the username and
password of the Linux user you set up to represent the High Availability service on your Linux
server. You can also use the --hapoll startup switch to control how often the Monitor Agent contacts
the High Availability service with agent status information. The default is every 2 minutes.
novdocx (en) 22 June 2009
1028 GroupWise 8 Administration Guide
Page 29

64
Configuring the Monitor
novdocx (en) 22 June 2009
Application
During installation, the GroupWise® Monitor Application is set up with a default configuration.
However, you can use the information in the following sections to optimize the Monitor Application
configuration:
Section 64.1, “Modifying Monitor Application Environment Settings,” on page 1029
Section 64.2, “Modifying Monitor Application Log Settings,” on page 1030
Section 64.3, “Adding or Removing Service Providers,” on page 1032
Section 64.4, “Modifying Monitor Application Template Settings,” on page 1033
64.1 Modifying Monitor Application Environment Settings
Using ConsoleOne®, you can modify the Monitor Application’s environment settings. The
environment settings determine such things as the location where ConsoleOne stores the Monitor
Application’s configuration file and how long the Monitor Application maintains an open session
with an inactive user.
1 In ConsoleOne, use the Console View to browse to the Monitor Application object (named
GroupWiseMonitor).
64
The Monitor Application object is not available in the GroupWise View.
2 Right-click the Monitor Application object, then click Properties to display the Environment
page.
Configuring the Monitor Application
1029
Page 30

3 Modify the fields as needed:
Configuration File: The Monitor Application does not have access to Novell
the GroupWise domain database (
wpdomain.db
). Therefore, ConsoleOne writes the
®
eDirectory® or
application’s configuration information to the file specified in this field. By default, this is the
gwmonitor.cfg
file located in the Monitor Application’s home directory. The location of this
home directory varies by platform.
novdocx (en) 22 June 2009
Linux:
Windows:
/opt/novell/groupwise/gwmonitor
c:\Novell\GroupWise\gwmonitor
on the Web server
In general, you should avoid changing the location of the file.
IMPORTANT: On Linux, do not change the location of the
gwmonitor.cfg
file.
Logout URL: By default, if users are required to log in to the Monitor Web console, they are
returned to the login page when they log out. If desired, you can enter the URL for a different
page.
4 Click OK to save the changes.
64.2 Modifying Monitor Application Log Settings
The Monitor Application logs information to log files on disk. You can control the following
logging features:
The type of information to log
How long to retain log files
The maximum amount of disk space to use for log files
Where to store log files
1030 GroupWise 8 Administration Guide
Page 31

The Monitor Application creates a new log file each day and each time it is restarted (as part of the
Web server startup). The log file is named
mmddmon.nnn
, where mm is the month, dd is the year, and
nnn is a sequenced log file number (001 for the first log file of the day, 002 for the second, and so
forth).
To modify the log settings:
1 In ConsoleOne, browse to and right-click the Monitor Application object (named
GroupWiseMonitor), then click Properties.
2 Click Application > Log Settings.
novdocx (en) 22 June 2009
3 Modify the log settings as needed:
Log File Path: Specify the path to the directory where you want to store the log files. The
default log file directory varies by platform.
Linux:
Windows:
/var/log/novell/groupwise/gwmon
c:\Novell\GroupWise\gwmonitor\logs
on the Web server
Maximum Log File Age: Specify the number of days you want to retain the log files. The
Monitor Application retains the log file for the specified number of days unless the maximum
disk space for the log files is exceeded. The default age is 30 days.
Maximum Log Disk Space: Specify the maximum amount of disk space you want to use for
the log files. If the disk space limit is exceeded, the Monitor Application deletes log files,
beginning with the oldest file, until the limit is no longer exceeded. The default disk space is
102400 KB (100 MB).
Logging Level: There are four logging levels: None, Normal, Ve rb o s e , and Diagnostic. None
turns logging off; Normal displays warnings and errors; Ve r b o s e displays Normal logging plus
information messages and user requests; and Diagnostic displays all possible information. The
default is Normal logging. Use Diagnostic only if you are troubleshooting a problem with
Monitor.
Configuring the Monitor Application 1031
Page 32

The verbose and diagnostic logging levels do not degrade Monitor Agent performance, but log
files saved to disk consume more disk space when verbose or diagnostic logging is in use.
Log Language: Select the language in which you want information written to the log files. The
list contains many languages, some of which the Monitor Application might not support. If you
select an unsupported language, the information is written in English.
Log Time Format: Choose from the following formats to use when the Monitor Application
records dates and times in the log files: HH:mm:ss:SS, MM/dd: H:mm:ss.SS, or dd/MM:
H:mm:ss.SS. H and HH represent hours, mm represents minutes, ss and SS represent seconds,
MM represents months, and dd represents days.
4 Click OK to save the log settings.
64.3 Adding or Removing Service Providers
The Monitor Application receives requests from Monitor Web console users and then passes the
requests to the appropriate service provider. The service provider fills the requests and returns the
required information to the Monitor Application. The Monitor Application merges the information
into the appropriate template and displays it to the user.
novdocx (en) 22 June 2009
To function properly, the Monitor Application must know which service providers are available. The
Monitor service provider communicates with the Monitor Agent to fill Monitor Web console
requests. The Monitor service provider is installed and configured at the same time as the Monitor
Application.
You can disable the Monitor service by removing the Monitor service provider. If you have created
new service providers to expose additional services through GroupWise Monitor, you must define
those service providers so that the Monitor Application knows about them.
To define service providers:
1 In ConsoleOne, right-click the Monitor Application object (named GroupWiseMonitor), then
click Properties.
2 Click Application > Services.
The Provider List displays all service providers that the Monitor Application is configured to
use.
1032 GroupWise 8 Administration Guide
Page 33

3 Choose from the following options:
Add: To add a service provider to the list, click Add, browse to and select the service provider’s
object, then click OK.
novdocx (en) 22 June 2009
Edit: To edit a service provider’s information, select the provider in the list, then click Edit.
Delete: To remove a service provider from the list, select the provider, then click Delete.
4 Click OK to save the changes.
64.4 Modifying Monitor Application Template Settings
When the Monitor Application receives information from a service provider, it merges the
information into the appropriate Monitor template before displaying the information to the Monitor
Web console user. Using ConsoleOne, you can modify the Monitor Application’s template settings.
The template settings determine such things as the location of the templates, the maximum amount
of server memory to use for caching the templates, and the default template language.
1 In ConsoleOne, browse to and right-click the Monitor Application object (named
GroupWiseMonitor), then click Properties.
2 Click Application > Templates to display the Templates page.
Configuring the Monitor Application 1033
Page 34

3 Modify the fields as needed:
novdocx (en) 22 June 2009
Template Path: Select the location of the template base directory. The template base directory
contains the subdirectories (
simple, frames, hdml
, and
wml
) for each of the templates
provided with GroupWise Monitor. If you create your own templates, you need to place the
templates in a new subdirectory in the template base directory. The default template path is
based on the Tomcat installation location and varies by platform:
NetWare:
OES Linux:
SLES:
Windows:
sys:\tomcat\4\webapps\gwmon\WEB-INF\classes\templates
/var/opt/novell/tomcat5/
webapps/gwmon/WEB-INF/classes/templates
/srv/www/tomcat5/base/
webapps/gwmon/WEB-INF/classes/templates
c:\Novell\GroupWise\Tomcat5.5\
webapps\gwmon\WEB-INF\classes\templates
Java Package: Specify the Java package that contains the template resources used by the
Monitor Application. The default package is
com.novell.gwmonitor.templates
.
Images URL: Specify the URL for the GroupWise Monitor image files. These images are
merged into the templates along with the GroupWise information. This URL must be relative to
the
tomcat_directory/webapps
/gwmon/images
. The default relative URL is:
Help URL: Specify the URL for the GroupWise Monitor Help files. This URL must be
relative to the
/gwmon/com/novell/gwmonitor/help/language_code
tomcat_directory/webapps
directory. The default relative URL is:
Enable template caching: To speed up access to the template files, the Monitor Application
can cache the files in memory. Select this option to turn on template caching.
1034 GroupWise 8 Administration Guide
Page 35

Cache Size: Select the maximum amount of memory, in kilobytes, you want to use when
caching the templates. The default cache size, 1024 KB, is sufficient to cache all templates
shipped with GroupWise Monitor. If you modify or add templates, you can turn on Verbose
logging on the Monitor Application object Log Settings page to view the size of the template
files. Using this information, you can then change the cache size appropriately.
Default Language: Select the language to use when displaying the initial Monitor Web
console page.
Define User Interfaces: GroupWise Monitor supports Web browsers on many different
devices (for example, computers and wireless telephones). Each device supports specific
content types such as HTML, HDML, and WML. When returning information to a device’s
Web browser, the Monitor Application must merge the information into a set of templates to
create an interface that supports the content type required by the Web browser.
GroupWise Monitor ships with several predefined user interfaces. These interfaces support
Web browsers that require HTML, HDML, and WML content types. Click the User Interface
button to view, add, modify, or delete user interfaces.
4 Click OK to save the new template settings.
novdocx (en) 22 June 2009
Configuring the Monitor Application 1035
Page 36

novdocx (en) 22 June 2009
1036 GroupWise 8 Administration Guide
Page 37

65
Using GroupWise Monitor
For a review of the three Monitor Agent consoles, see Section 62, “Understanding the Monitor
Agent Consoles,” on page 1003. This section focuses on using the Windows Monitor Agent server
console and the Monitor Agent Web console, although many of these tasks can be performed at the
Monitor Web console as well.
®
The GroupWise
server where the Monitor Agent runs. On Linux, similar information can be displayed at the Monitor
Agent Web console.
Section 65.1, “Using the Monitor Agent Server Console,” on page 1037
Section 65.2, “Using the Monitor Web Console,” on page 1041
Section 65.3, “Generating Reports,” on page 1042
Section 65.4, “Measuring Agent Performance,” on page 1052
Section 65.5, “Collecting Gateway Accounting Data,” on page 1055
Section 65.6, “Assigning Responsibility for Specific Agents,” on page 1059
Windows Monitor Agent server console displays GroupWise agent status on the
novdocx (en) 22 June 2009
65
Section 65.7, “Searching for Agents,” on page 1059
65.1 Using the Monitor Agent Server Console
Initially, the Windows Monitor Agent server console lists all monitored GroupWise agents, along
with their statuses.
NOTE: On Windows, agents and agent groups are displayed at the Monitor Agent server console.
On Linux, agent groups are displayed only at the Monitor Web console.
Figure 65-1 Windows Monitor Agent Console with the Monitored GroupWise Agents Displayed
After you create agent groups, as described in Section 63.2, “Creating and Managing Agent
Groups,” on page 1011, the agents in each group are displayed when you select a group.
Using GroupWise Monitor
1037
Page 38

Figure 65-2 Windows Monitor Agent Console
You can display many types of monitoring information at the Windows Monitor Agent server
console.
Section 65.1.1, “Viewing All Agents,” on page 1038
Section 65.1.2, “Viewing Problem Agents,” on page 1038
Section 65.1.3, “Viewing an Agent Server Console,” on page 1039
Section 65.1.4, “Viewing an Agent Web Console,” on page 1040
novdocx (en) 22 June 2009
Section 65.1.5, “Polling the Agents for Updated Status Information,” on page 1040
65.1.1 Viewing All Agents
After you have separated your agents into groups, you can still view all agents in your GroupWise
system in a single list.
At the Windows Monitor Agent server console:
1 Right-click the root agent group, then click Show Subgroup Agents.
You can use the Show Subgroup Agents feature on any group that contains nested subgroups.
65.1.2 Viewing Problem Agents
In a single agent group or in a group with subgroups shown, you can filter the list to show only those
agents whose status is not Normal.
1038 GroupWise 8 Administration Guide
Page 39

At the Windows Monitor Agent server console:
1 Click View > Problem Agents.
or
On Linux, at the Monitor Agent Web console, click Problems.
Only problem agents are now displayed. If you leave the Monitor Agent with only problem
agents displayed, many groups might appear empty because all agents have a status of Normal.
2 To view all monitored agents again, click View > All Agents.
novdocx (en) 22 June 2009
or
On Linux, at the Monitor Agent Web console, click System.
65.1.3 Viewing an Agent Server Console
An active agent server console displays on each server where a GroupWise agent is running. You
can display a similar agent server console from the Windows Monitor Agent server console.
NOTE: This feature is not available on Linux.
1 Right-click an agent, then click Agent Console.
You cannot control the agent from the Monitor Agent like you can at the actual agent server console,
but you can gather status information about the monitored agent.
Using GroupWise Monitor 1039
Page 40

65.1.4 Viewing an Agent Web Console
An agent Web console can be displayed anywhere you have access to a Web browser and the
Internet. You can launch an agent Web console from the Windows Monitor Agent server console.
1 Right-click an agent, then click Agent Web Console.
or
On Linux, at the Monitor Agent Web console, click the domain or post office link.
novdocx (en) 22 June 2009
For information about the agent Web consoles, see the GroupWise agent documentation:
Section 37.2, “Using the POA Web Console,” on page 544
Section 42.2, “Using the MTA Web Console,” on page 673
Section 49.2, “Using the Internet Agent Web Console,” on page 805
Section 56.1.2, “Using the WebAccess Agent Web Console,” on page 949
65.1.5 Polling the Agents for Updated Status Information
By default, the Monitor Agent polls the monitored agents every five minutes. You can change the
default poll cycle, as described in Section 63.4, “Configuring Polling of Monitored Agents,” on
page 1017. The time remaining until the next poll cycle is displayed in the lower left corner of the
Monitor Agent server console.
You can also manually poll monitored agents:
To poll all agents, click Action > Poll All Agents.
To poll a specific agent, right-click the agent, then click Poll Agent.
To stop polling a specific agent (for example, because the server it runs on is awaiting repairs),
right-click the agent, then click Suspend Polling. You can specify a time interval for the agent
to be suspended, after which polling resumes automatically. By suspending polling, you
prevent repeat notifications for a problem that is already being addressed.
1040 GroupWise 8 Administration Guide
Page 41

The suspended agent’s status is listed as Suspended, accompanied by the same icon used for the
Unknown status .
To restart regular polling of an agent for which polling was suspended, right-click the agent,
then click Resume Polling.
65.2 Using the Monitor Web Console
The Monitor Web console lists all GroupWise agents that the Monitor agent is polling for status
information. Use the following URL to access the Monitor Web console:
http://web_server_address/gwmon/gwmonitor
where web_server_address represents the IP address or hostname of the Web server where the
Monitor Application is installed.
Figure 65-3 GroupWise Monitor Web Console
novdocx (en) 22 June 2009
Features of the Monitor Web console are available on buttons at the top of the Monitor page.
Button Feature
Problems
Link Trace
Link Configuration
Global Options
States
Search
Click an agent group in the left panel to display all monitored agents in the group. Click the Problem
button to display only those agents whose status is other than Normal in the agent group. Click the
Problems icon to display all agents in your GroupWise system whose status is other than Normal.
Click the status of an agent in the Status column to display agent status details.
Using GroupWise Monitor 1041
Page 42

Click an agent in the Name column to open its agent Web console. For information about the agent
Web consoles, see Section 65.1.4, “Viewing an Agent Web Console,” on page 1040.
Click Refresh to update the agent status information. To modify the default poll cycle, see
Section 63.4, “Configuring Polling of Monitored Agents,” on page 1017.
To see what specific tasks can be performed at the Monitor Web console, see Chapter 66,
“Comparing the Monitor Consoles,” on page 1061.
65.3 Generating Reports
You can generate reports on demand at the Monitor Agent consoles to help you manage message
flow throughout your GroupWise system.
Section 65.3.1, “Link Trace Report,” on page 1042
Section 65.3.2, “Link Configuration Report,” on page 1043
Section 65.3.3, “Image Map Report,” on page 1044
Section 65.3.4, “Environment Report,” on page 1049
Section 65.3.5, “User Traffic Report,” on page 1049
novdocx (en) 22 June 2009
Section 65.3.6, “Link Traffic Report,” on page 1050
Section 65.3.7, “Message Tracking Report,” on page 1050
Section 65.3.8, “Performance Tracking Report,” on page 1051
Section 65.3.9, “Connected User Report,” on page 1051
Section 65.3.10, “Gateway Accounting Report,” on page 1051
Section 65.3.11, “Trends Report,” on page 1051
Section 65.3.12, “Down Time Report,” on page 1052
65.3.1 Link Trace Report
A link trace report enables you to follow the path a message would take between two GroupWise
domains. A link trace report includes a list of all the domains through which a message would need
to pass, along with their current status, link type, address, and number of messages currently queued
in each domain. If any domain along the link path is closed, an error message is displayed.
If a message fails to arrive at its destination, this report can help you pinpoint its current location, so
you can resolve the problem and get messages flowing smoothly again.
At the Windows Monitor Agent server console:
1 Click Reports > Link Trace.
or
On Linux, at the Monitor Agent Web console, click Link Trace.
2 Select a starting domain and a target domain.
3 If you want to trace the path back, which is the route status messages will take, select Trace
Return Path.
4 Click Tra c e.
1042 GroupWise 8 Administration Guide
Page 43

If any domain in the path is closed, an error message displays so you know where the problem
is occurring.
5 When you are finished tracing links, click Close.
novdocx (en) 22 June 2009
65.3.2 Link Configuration Report
A link configuration report enables you to list the links from one or more GroupWise domains to all
other domains in your GroupWise system. This helps you identify inefficient link paths, loops, and
unreachable domains. All domains must be open to obtain an accurate link map of your GroupWise
system.
1 Make sure all domains in your GroupWise system are open.
You cannot obtain an accurate link map of your GroupWise system if any domains are closed.
For assistance with closed domains, see “Message Transfer Agent Problems” in GroupWise 8
Troubleshooting 2: Solutions to Common Problems.
At the Windows Monitor Agent server console:
2 Click Reports > Link Configuration
or
On Linux, at the Monitor Agent Web console, click Link Configuration
3 Select All Agents
or
Select Selected Agent and select a specific agent from the drop-down list.
4 Click Run
Using GroupWise Monitor 1043
Page 44

The list shows what domains a message would pass through to travel from the domain in the
Source column to the domain in the Destination column. If a domain displays as closed, it
means that the Monitor Agent could not contact the MTA for the domain or that a loop was
detected in the link configuration.
5 When you are finished checking links, click Close.
novdocx (en) 22 June 2009
65.3.3 Image Map Report
An image map enables you to create a visual picture of your GroupWise system, whether it resides
in a single office building or spans the globe. You provide the maps; Monitor provides the up-to-theminute status information at a glance.
“Making Maps Available in Monitor” on page 1044
“Setting Up Maps” on page 1045
“Setting Up Regions” on page 1046
“Adding Agents to a Map” on page 1047
“Using an Image Map to Monitor Agents” on page 1048
NOTE: The image map report cannot be generated at the Windows Monitor Agent server console.
You must use the Monitor Agent Web console.
Making Maps Available in Monitor
1 Obtain useful maps from the Internet or other location.
You can use maps that vary in detail. For example, you could have one map the focuses on a
particular corporate office building, another that shows offices throughout your country, and
another that shows offices throughout the world. You can select from images in PNG and JPG
format.
maps
2 Copy the maps you want to use into the
The default location of the
monwork
directory varies by platform.
subdirectory of the
monwork
directory.
Linux:
Windows:
1044 GroupWise 8 Administration Guide
/tmp/gwmon/monwork/maps
c:\Program Files\Novell\GroupWise Server\Monitor\monwork\maps
Page 45

You can change the location using the /monwork startup switch. For more information, see
Chapter 67, “Using Monitor Agent Startup Switches,” on page 1063
3 Continue with Setting Up Maps.
Setting Up Maps
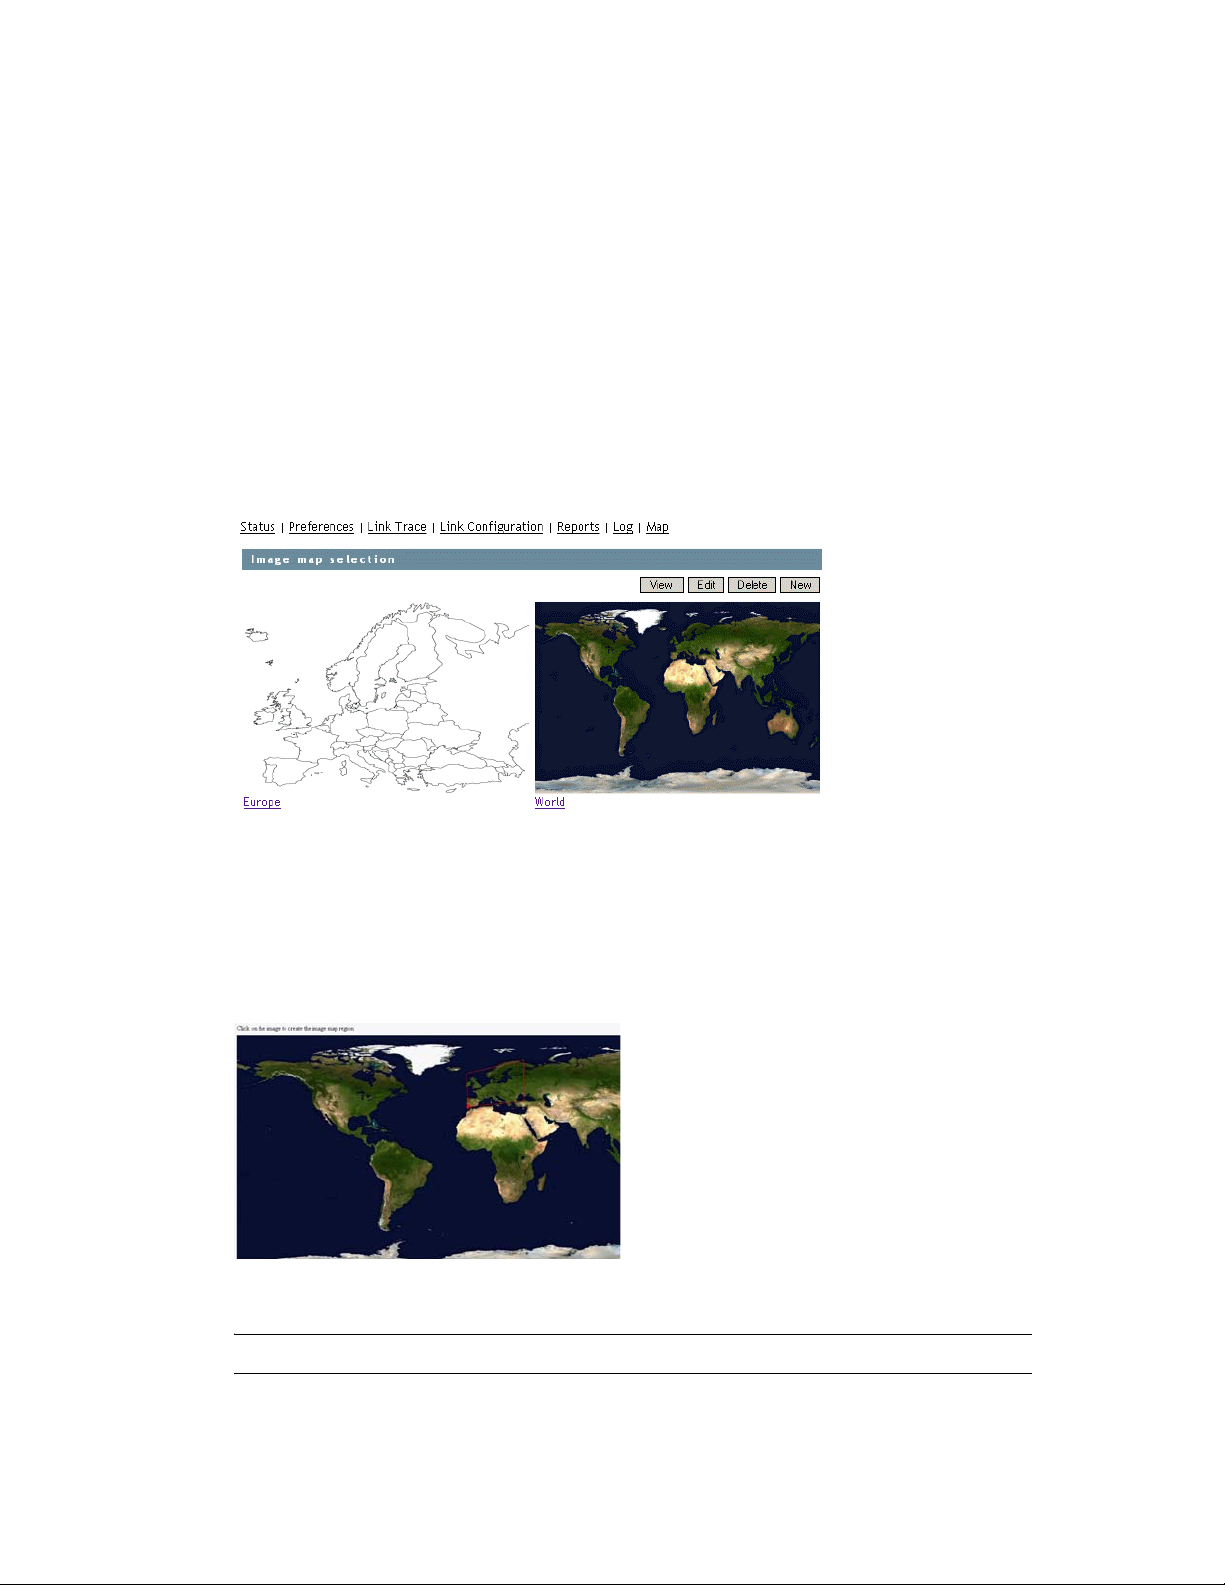
1 In the Monitor Agent Web console, click Map.
Initially, no maps are available in Monitor.
2 Click New to display all the maps that are available in the
maps
directory.
novdocx (en) 22 June 2009
The filename of each map is displayed below it.
3 Click the map that you want to set up, specify a custom name for the map, then click Create.
This makes the map available for use in Monitor.
4 To set up additional maps for use in Monitor, click Done to return to the Image Map Selection
maps
menu, then repeat Step 2 and Step 3 for each map that is available in the
directory to
make it available in Monitor.
5 If you want to make one or more smaller-scale maps available from a large-scale map, continue
with “Setting Up Regions” on page 1046.
Using GroupWise Monitor 1045
Page 46
or
If your maps are all independent from each other, skip to “Adding Agents to a Map” on
page 1047.
Setting Up Regions
If some of your maps are subsets of other maps, you can set up a large-scale map so that it links to
one or more smaller-scale maps. For example, a map of the world could have a region for each
continent or country, or a map of a city or country could have a region for each office where
GroupWise domains or post offices are located.
1 Set up at least two maps in Monitor, as described in “Making Maps Available in Monitor” on
page 1044.
2 In the Monitor Agent Web console, click Map to display the maps that are available in Monitor.
novdocx (en) 22 June 2009
The custom name of each map is displayed below it.
3 Click Edit, then click a large-scale map.
4 In the drop-down list, scroll down through the agents, click the smaller-scale map that you want
to define as a region, then click on the large-scale map to refresh the view.
5 Click points on the map to surround the region.
6 Click Done to define the region.
NOTE: With a very wide map, you need to scroll horizontally to display the Done button.
The region appears labeled on the large-scale map.
1046 GroupWise 8 Administration Guide
Page 47

7 To define more regions on the large-scale map, click Done to return to the available maps, then
repeat Step 3 through Step 6 for each region.
or
To place agents on a map, continue with Adding Agents to a Map.
Adding Agents to a Map
novdocx (en) 22 June 2009
1 In the Monitor Agent Web console, click Map to display the maps that are available in Monitor.
The custom name of each map is displayed below it.
2 Click Edit, then click the map where you want to add agents.
3 Select an agent in the drop-down list, then click the place on the map where that agent is
located.
The agent name appears in a blue box.
4 Select additional agents and locations as needed.
Using GroupWise Monitor 1047
Page 48

5 In the Line Color drop-down list, select the color to use to show links between locations.
Make sure you select a color that shows up well on the particular map. Lines display on the
map only when links between locations are down.
6 Click Done when the map includes all the needed GroupWise agents in their respective
locations.
novdocx (en) 22 June 2009
7 Continue with Using an Image Map to Monitor Agents
Using an Image Map to Monitor Agents
1 In the Monitor Agent Web console, click Map > View.
2 Click a map to view agent status.
or
If the map has regions, click a region to display the map that has agent status for that region.
At this point, the Monitor Agent checks the status of each agent on the map. Any agent that is
down or that has a status of Major, Critical, or War nin g displays in red on the map. Agents with
a lower status do not display on the map. If a link between agents is down, a line displays
between the agents.
1048 GroupWise 8 Administration Guide
Page 49

65.3.4 Environment Report
novdocx (en) 22 June 2009
An environment report lists all monitored agents, along with each agent’s location, version, IP
®
address, port number, and operating system information. For NetWare
TM
CLIB version, TCP/IP version, Novell eDirectory
version, and the number of packet receive
agents, the server name,
buffers are also listed.
At the Windows Monitor Agent server console or the Monitor Agent Web console:
1 Click Reports > Environment.
2 Scroll through the displayed information for your own use.
or
Click Send, type your e-mail address, type one or more e-mail addresses to send the
environment report to, then click Send.
3 Click OK to close the Environment Report dialog box.
65.3.5 User Traffic Report
A user traffic report enables you to determine how many messages a user has sent outside his or her
post office. The user traffic report lists all messages sent by a specified user during a specified date/
time range, along with date, time, and size information for each message. You can also generate a
user traffic report for all users whose messages pass through a selected domain.
In order for the information to be available to generate a user traffic report, you must configure the
MTA to perform message logging. See Section 41.4.2, “Enabling MTA Message Logging,” on
page 658.
At the Windows Monitor Agent server console or the Monitor Agent Web console:
1 Click Reports > User Traffic.
2 Select the user’s domain or the domain you want to generate a user traffic report for.
3 Type the GroupWise user ID that you want to create a report for.
or
Leave the field blank to create a report for all users whose messages pass through the selected
domain.
4 If you want to restrict the report to a particular time interval, specify start and end dates and
times.
5 Click Run.
Using GroupWise Monitor 1049
Page 50

6 After the results are displayed, click Save, provide a filename for the report, select the format
for the report, then click OK.
Reports can be saved in comma-separated or tab-separated format to meet the needs of the
program you plan to use to display and print the report. For example, you could bring the data
into a spreadsheet program. If needed, you can include column headings to create an initial line
in the output file that labels the contents of each column.
7 When you are finished generating user traffic reports, click Close.
65.3.6 Link Traffic Report
A link traffic report enables you to determine how many messages are passing from a selected
GroupWise domain across a specified link. The link traffic report lists the total number and total size
of all messages passing through the link during each hour or half hour of operation.
In order for the information to be available to generate a link traffic report, you must configure the
MTA to perform message logging. See Section 41.4.2, “Enabling MTA Message Logging,” on
page 658.
At the Windows Monitor Agent server console or Monitor Agent Web console:
novdocx (en) 22 June 2009
1 Click Reports > Link Traffic.
2 Select the source domain of the link.
The list includes all domains that the Monitor Agent uses XML to communicate with. If the
Monitor Agent must use SNMP to communicate with a domain, that domain is not included in
the list.
3 Select the other end of the link, which could be another domain, a post office, or a gateway.
4 If you want to restrict the report to a particular time interval, specify start and end dates and
times.
5 Click Run.
6 After the results are displayed, click Save, provide a filename for the report, select the format
for the report, then click OK.
Reports can be saved in comma-separated or tab-separated format to meet the needs of the
program you plan to use to display and print the report. For example, you could bring the data
into a spreadsheet program. If needed, you can include column headings to create an initial line
in the output file that labels the contents of each column.
7 When you are finished generating link traffic reports, click Close.
65.3.7 Message Tracking Report
A message tracking report enables you to track an individual message through your GroupWise
system. The message tracking report provides information about when a message was sent, what
queues the message has passed through, and how long it spent in each message queue. If the
message has not been delivered, the message tracking report shows where it is.
In order for the information to be available to generate a message tracking report, you must
configure the MTAs in your GroupWise system to perform message logging. See Section 41.4.2,
“Enabling MTA Message Logging,” on page 658.
1050 GroupWise 8 Administration Guide
Page 51

In addition, you need to determine the message ID of the message. Have the sender check the Sent
Item Advanced Properties of the message in the GroupWise client. The Message Id field displays
the message ID of the message; for example, 3AD5EDEB.31D : 3 : 12763.
At the Windows Monitor Agent server console or Monitor Agent Web console:
1 Click Reports > Message Tracking.
2 Type the message ID of the message to track.
You can obtain the message file ID in the GroupWise client. Open the Sent Items folder, rightclick the message, click Properties, then click the Style drop-down list and click Advanced
Properties. The Message Id field displays the message file ID; for example, 3A75BAB9.FF1 :
8 : 31642.
3 Select the domain where you want to start tracking.
4 Click Tra c k.
5 When you are finished generating message tracking reports, click Close.
65.3.8 Performance Tracking Report
novdocx (en) 22 June 2009
Before you can run a performance tracking report, you must configure the Monitor Agent for
performance tracking. See Section 65.4, “Measuring Agent Performance,” on page 1052.
65.3.9 Connected User Report
The Connected Users report lists all users that are currently connected to POAs throughout your
GroupWise system. It lists username; client version, date, and platform; login time; and the IP
address of the client user.
At the Monitor Agent Web console:
1 Click Reports > Connected Users.
NOTE: The Connected Users report cannot be generated at the Windows Monitor Agent
server console or the Monitor Web console.
65.3.10 Gateway Accounting Report
Before you can run a gateway accounting report, you must configure the Monitor Agent to collect
gateway accounting data. See Section 65.5, “Collecting Gateway Accounting Data,” on page 1055.
65.3.11 Trends Report
The Trends report presents graphs of agent MIB variables as sampled over time. Graphs are
generated based on data gathered from Monitor Agent log files. The quality of the graphs depends
on the quantity of data that has been gathered when the graph is generated.
In the Monitor Agent Web console:
1 Click Reports > Trends.
NOTE: The Trends report cannot be generated at the Windows Monitor Agent server console.
Using GroupWise Monitor 1051
Page 52

2 Click the type of agent for which you want to set up a Trend report.
3 Specify a unique name for the Trend report.
4 Select the MIB variables that you want to collect values for over time, then click Add Trend.
The Trend report appears in the Agent Trends list.
5 Click the Trend report to view the graphs.
65.3.12 Down Time Report
The Down Time report graphically illustrates how much time each GroupWise agent has been down
during the day.
In the Monitor Agent Web console:
1 Click Reports > Down Time.
NOTE: The Down Time report cannot be generated at the Windows Monitor Agent server
console.
novdocx (en) 22 June 2009
65.4 Measuring Agent Performance
To test the performance of the agents in your GroupWise system, you can send performance test
messages from a specially configured Monitor domain to target domains anywhere in your
GroupWise system. The Monitor Agent measures the amount of time it takes for replies to return
from the target domains, which lets you ascertain the speed at which messages flow through your
GroupWise system.
Perform the following steps to set up agent performance testing:
Section 65.4.1, “Setting Up an External Monitor Domain,” on page 1052
Section 65.4.2, “Selecting an MTA to Communicate with the Monitor Agent,” on page 1053
Section 65.4.3, “Configuring the Monitor Agent for Agent Performance Testing,” on
page 1054
Section 65.4.4, “Viewing Agent Performance Data,” on page 1055
Section 65.4.5, “Viewing an Agent Performance Report,” on page 1055
Section 65.4.6, “Receiving Notification of Agent Performance Problems,” on page 1055
65.4.1 Setting Up an External Monitor Domain
Before you can use the GroupWise Performance Testing dialog box to configure and enable
GroupWise performance testing, you must create a specially configured Monitor domain and select
an MTA to receive performance test messages from the Monitor Agent. The Monitor Agent uses an
external GroupWise domain as part of measuring performance.
In ConsoleOne:
1 Create an external GroupWise domain.
For information about external GroupWise domains, see “Creating an External Domain” in
“Connecting to Other GroupWise Systems” in the GroupWise 8 Multi-System Administration
Guide. By creating an external domain, you enable the Monitor Agent to approximate the
1052 GroupWise 8 Administration Guide
Page 53

round-trip time for e-mail messages to travel to recipients and for status messages to travel
back to senders. If you are going to set up gateway accounting reports, as described in
Section 65.5, “Collecting Gateway Accounting Data,” on page 1055, you can use this same
external domain for collecting accounting data.
2 Name the external domain to reflect its role in your GroupWise system.
For example, you could name it ExternalMonitorDomain. It does not matter which domain you
link the external domain to.
3 Continue with Section 65.4.2, “Selecting an MTA to Communicate with the Monitor Agent,”
on page 1053.
novdocx (en) 22 June 2009
65.4.2 Selecting an MTA to Communicate with the Monitor Agent
The Monitor Agent needs to send its performance testing messages to a specific MTA in your
GroupWise system. It does not matter which MTA you decide to use. It could be the MTA for the
domain to which the external Monitor domain is linked.
1 In ConsoleOne, click Tools > GroupWise Utilities > Link Configuration.
2 In the Outbound Links From box, double-click the domain whose MTA you want the Monitor
Agent to communicate with.
3 Configure the outbound link from the selected MTA to the external Monitor domain to be a
TCP/IP link:
3a Click the pencil icon to provide the IP address of the server where the Monitor Agent runs.
Using GroupWise Monitor 1053
Page 54

3b Specify a unique port number for the MTA to use to communicate with the Monitor
Agent.
3c Click OK.
4 Click OK to save your changes to the link.
5 Exit the Link Configuration Tool to save the new link configuration information.
6 Continue with Section 65.4.3, “Configuring the Monitor Agent for Agent Performance
Testing,” on page 1054.
65.4.3 Configuring the Monitor Agent for Agent Performance Test ing
After you have created an external Monitor domain and configured a link from it to an MTA, you are
ready to configure the Monitor Agent for performance testing.
At the Windows Monitor Agent server console:
1 Click Configuration > Performance Testing.
novdocx (en) 22 June 2009
or
On Linux, at the Monitor Agent Web console, click Preferences > Setup, then scroll down to
the Performance Testing section.
2 Fill in the fields:
Domain to send messages to: Select the external Monitor domain that you configured for
system performance testing.
You might need to restart the Monitor Agent in order to see the new Monitor domain in the
drop-down list.
Send performance messages every: Specify in minutes the time interval for the Monitor
Agent to send performance test messages.
Enable GroupWise Performance Testing: Select this option to turn on performance testing.
Deselect this option when you have finished your performance testing.
Send performance messages to: Select All Agents to send performance test messages to all
domains in your GroupWise system. Select Monitored Agents to send performance test
messages only to the agents currently listed at the Monitor Agent console.
3 Click OK to put the performance testing settings into effect.
4 Continue with Section 65.4.4, “Viewing Agent Performance Data,” on page 1055.
or
Continue with Section 65.4.6, “Receiving Notification of Agent Performance Problems,” on
page 1055.
1054 GroupWise 8 Administration Guide
Page 55

65.4.4 Viewing Agent Performance Data
The information gathered by the Monitor Agent through performance test messages is recorded in
the Monitor history log.
At the Windows Monitor Agent server console or Monitor Agent Web console:
1 Click Log > View History Files.
2 Select a history log file, then click View.
65.4.5 Viewing an Agent Performance Report
A performance testing report enables you to measure how long it takes messages to travel through
your GroupWise system. The performance testing report lists each domain that a performance test
message was sent to, when it was sent by the Monitor Agent, and the number of seconds between
when it was sent and when the Monitor Agent received a response from the tested agent.
At the Windows Monitor Agent server console or Monitor Agent Web console:
1 Click Reports > Performance Testing.
novdocx (en) 22 June 2009
2 Select All Domains to generate a performance testing report for all domains in your GroupWise
system.
or
Select one domain to generate a performance testing report for it.
3 Click Run to generate the performance testing report.
65.4.6 Receiving Notification of Agent Performance Problems
If you want the Monitor Agent to notify you if system performance drops to an unacceptable level,
you can create a threshold to check the mtaLastResponseTime and mtaAvgResponseTime MIB
variables. The average response time is a daily average that is reset at midnight. See Section 63.5.2,
“Customizing Notification Thresholds,” on page 1019 for setup instructions.
65.5 Collecting Gateway Accounting Data
To gather gateway accounting data for a gateway, you set up a specially configured Monitor domain.
The Monitor Agent then measures the traffic that passes through the gateway.
Perform the following steps to set up gateway accounting:
Section 65.5.1, “Setting Up an External Monitor Domain,” on page 1056
Section 65.5.2, “Selecting an MTA to Communicate with the Monitor Agent,” on page 1056
Section 65.5.3, “Setting Up an External Post Office and External User for Monitor,” on
page 1057
Section 65.5.4, “Receiving the Accounting Files,” on page 1058
Section 65.5.5, “Viewing the Gateway Accounting Report,” on page 1058
Using GroupWise Monitor 1055
Page 56

65.5.1 Setting Up an External Monitor Domain
Before you can run a gateway accounting report, you must create a specially configured Monitor
domain and select an MTA to transfer accounting data to and from the Monitor Agent. The Monitor
Agent uses an external GroupWise domain as part of this process.
®
In ConsoleOne
1 Create an external GroupWise domain.
For information about external GroupWise domains, see “Creating an External Domain” in
“Connecting to Other GroupWise Systems” in the GroupWise 8 Multi-System Administration
Guide. If you are going to set up agent performance reports, as described in Section 65.4,
“Measuring Agent Performance,” on page 1052, you can use this same external domain for
collecting agent performance data.
:
novdocx (en) 22 June 2009
2 Name the external domain to reflect its role in your GroupWise system.
For example, you could name it ExternalMonitorDomain. It does not matter which domain you
link the external domain to.
3 Continue with Section 65.4.2, “Selecting an MTA to Communicate with the Monitor Agent,”
on page 1053.
65.5.2 Selecting an MTA to Communicate with the Monitor Agent
The Monitor Agent needs to receive its gateway accounting messages from a specific MTA in your
GroupWise system. It does not matter which MTA you decide to use. It could be the MTA for the
domain to which the external Monitor domain is linked.
1 In ConsoleOne, click Tools > GroupWise Utilities > Link Configuration.
2 In the Outbound Links From box, double-click the domain whose MTA you want the Monitor
Agent to communicate with.
3 Configure the outbound link from the selected MTA to the external Monitor domain to be a
TCP/IP link:
1056 GroupWise 8 Administration Guide
Page 57

3a Click the pencil icon to provide the IP address of the server where the Monitor Agent runs.
3b Specify a unique port number for the MTA to use to communicate with the Monitor
Agent.
3c Click OK.
4 Click OK to save your change to the link.
5 Exit the Link Configuration Tool to save the new link configuration information.
6 Continue with Setting Up an External Post Office and External User for Monitor.
novdocx (en) 22 June 2009
65.5.3 Setting Up an External Post Office and External User for Monitor
The setup for gateway accounting requires an external post office and an external user in the
external domain.
1 Create an external GroupWise post office.
1a Right-click the External Domain object, then click New External Post Office.
1b Name the external post office to reflect its role, such as ExternalMonitorPO.
1c Click OK.
2 Create an external user.
2a Right-click the External Post Office object, then click New > External User.
2b Name the external user to reflect its role, such as ExternalMonitorUser.
Using GroupWise Monitor 1057
Page 58

2c Click OK.
2d Continue with Receiving the Accounting Files
65.5.4 Receiving the Accounting Files
1 Make sure that you are set up to receive gateway accounting files.
For example, if you want to set up a gateway accounting report for activity to and from the
Internet through the Internet Agent, you would add yourself as an Accountant on the Gateway
Administrators page of the Internet Agent object, as described in Section 47.3, “Tracking
Internet Traffic with Accounting Data,” on page 780. The Exchange Gateway and the Notes
Gateway have comparable property pages.
2 In the GroupWise client, create a rule to forward all gateway accounting messages (that is,
those messages with an attached acct file) to the Monitor user in the external gateway
accounting post office.
3 In order to establish the link, restart the Monitor Agent and the MTA selected in Section 65.5.2,
“Selecting an MTA to Communicate with the Monitor Agent,” on page 1056.
4 To see that the logs are being received by the Monitor Agent:
4a At the Monitor Agent Web console, click Log > Gateway Accounting Logs.
4b Select the Internet Agent or gateway, then click View Accounting Logs.
novdocx (en) 22 June 2009
If logs are listed, then data is successfully arriving to the Monitor Agent. The Monitor
Agent uses this data to generate gateway accounting reports.
The accounting log files on stored on the server where the Monitor Agent is running. The
default location varies by platform.
Linux:
Windows:
/var/log/novell/groupwise/gwmon/acc
c:\Program Files\Novell\GroupWise Server\Monitor\acct
t
65.5.5 Viewing the Gateway Accounting Report
After gateway accounting files are being successfully sent to the Monitor Agent for processing, you
can view the Gateway Accounting report in your Web browser. The Gateway Accounting report
organizes information gathered in gateway accounting files into a format that is visually easy to
read.
1 At the Monitor Agent Web console, click Reports > Gateway Accounting.
NOTE: The Gateway Accounting report cannot be generated at the Windows Monitor Agent
server console.
2 Select the Internet Agent (GWIA) or gateway for which you want to view accounting reports,
then click View Accounting Reports.
You can view the report by domains or by users. You can sort the report on any column.
1058 GroupWise 8 Administration Guide
Page 59

65.6 Assigning Responsibility for Specific Agents
If multiple GroupWise administrators manage the agents throughout your GroupWise system, you
can assign a contact for each agent. Or, in a help desk environment, a person can be assigned to an
agent when a problem occurs. The person assigned to the agent can record notes about the
functioning of the agent, which are then available to other administrators.
At the Windows Monitor Agent server console:
1 Right-click an agent in the agent status window, then click Agent Details.
or
On Linux, at the Monitor Agent Web console, click the agent status link.
novdocx (en) 22 June 2009
2 In the Assigned To field, type the name of the GroupWise administrator who is responsible for
this agent.
The name is displayed to the right of the agent status in the status window of the Monitor Agent
console and the Monitor Web console.
3 In the Notes field, type any comments you might have about the agent.
If a problem with the agent occurs, the Thresholds field and the Suggestions field display
helpful information about the problem if you have set up customized thresholds, as described in
Section 63.5.2, “Customizing Notification Thresholds,” on page 1019.
4 Click OK to save the information about who is assigned to the agent.
65.7 Searching for Agents
If you monitor a large number of agents, the list displayed in the Monitor Web console can become
very long. You can easily search for an individual agent or for a group of related agents.
At the Monitor Web console:
1 Click the Search icon.
Using GroupWise Monitor 1059
Page 60

NOTE: The Search feature is not available in the Windows Monitor Agent server console or
the Monitor Agent Web console.
2 Type the name of an agent.
or
Select Problems to list all agents whose status is other than Normal.
or
novdocx (en) 22 June 2009
Select one or more types of agent to list.
3 Select the number of instances you want listed at one time.
4 Click Search.
The results display on the Search page with the same functionality as is available on the regular
Monitor Web console pages.
1060 GroupWise 8 Administration Guide
Page 61

66
Comparing the Monitor Consoles
Many aspects of agent monitoring are available in one or more of the Monitor Agent consoles. The
table below summarizes agent monitoring features and where they are available.
novdocx (en) 22 June 2009
66
Task Windows Monitor
Agent Server
Console
Selecting Agents to Monitor Yes Yes No
Creating and Managing Agent Groups Ye s Yes Ye s
Viewing All Agents Yes Yes Yes if not in
Viewing Problem Agents Yes Yes Yes
Viewing an Agent Server Console Yes No No
Viewing an Agent Web Console Yes Yes Yes
Searching for Agents No No Yes
Assigning Responsibility for Specific Agents Yes Yes Ye s
Configuring the Monitor Agent for HTTP Yes Yes Yes
Configuring the Monitor Agent for SNMP Yes Yes Yes
Configuring Polling of Monitored Agents Yes Yes Yes
Configuring E-Mail Notification for Agent
Problems
Yes Yes Yes
Monitor Agent Web
Console
Monitor Web
Console
groups
Configuring Audible Notification for Agent
Problems
Configuring SNMP Trap Notification for
Agent Problems
Configuring Authentication and Intruder
Lockout for the Monitor Web Console
Configuring Monitor Agent Log Settings Yes Yes Yes
Monitoring Messenger Agents Yes Yes Yes
Generating Reports Yes Yes Yes
Link Trace Report Yes Yes Yes
Link Configuration Report Yes Yes Yes
Image Map Report No Yes No
Environment Report Yes Yes No
User Traffic Report Yes Yes No
Yes No No
Yes Yes Yes
Yes Authentication: Yes
Intruder Lockout: No
Comparing the Monitor Consoles
No
1061
Page 62

Link Traffic Report Yes Yes No
Message Tracking Report Ye s Yes No
Performance Tracking Report Yes Yes No
Connected User Report No Yes No
Gateway Accounting Report No Yes No
Trends Report No Yes No
Down Time Report No Yes No
novdocx (en) 22 June 2009
1062 GroupWise 8 Administration Guide
Page 63

67
Using Monitor Agent Startup
novdocx (en) 22 June 2009
Switches
GroupWise® Monitor Agent startup switches must be used on the command line when you start the
Monitor Agent, or in a script or batch file created to start the Monitor Agent. The Monitor Agent
does not have a startup file for switches.
Linux: If you start the Monitor Agent by running the gwmon executable, you can create a script
like the following:
/opt/novell/groupwise/agents/bin/gwmon --home /domain_directory
--other_switches &
If you start the Monitor Agent by running the
MA_OPTIONS variable to include any switches you want to set.
Windows: You can create a batch file like the following:
c:\Program Files\Novell\GroupWise Server\Monitor\gwmon.exe
...
You can create a desktop icon for your batch file, or you can add startup switches to the
Monitor Agent desktop icon that is created when you install the Monitor Agent.
grpwise-ma
/startup_switch /startup_switch
script, you can edit the
67
The table below summarizes Monitor Agent startup switches for all platforms and how they
correspond to configuration settings in the Windows Monitor Agent Server Console.
Switch starts with: a b c d e f g h i j k l m n o p q r s t u v w x y z
Linux Monitor Agent Windows Monitor Agent Windows Monitor Agent Server Console
--hapassword /hapassword N/A
--hapoll /hapoll N/A
--hauser /hauser N/A
--help /help N/A
--home /home N/A
--httpagentpassword /httpagentpassword Configuration > Poll Settings > HTTP Password
--httpagentuser /httpagentuser Configuration > Poll Settings HTTP User
--httpcertfile /httpcertfile N/A
--httpmonpassword /httpmonpassword Configuration > HTTP > HTTP Password
--httpmonuser /httpmonuser Configuration > HTTP > HTTP User
--httpport /httpport Configuration > HTTP > HTTP Port
--httpssl /httpssl N/A
Using Monitor Agent Startup Switches
1063
Page 64

Linux Monitor Agent Windows Monitor Agent Windows Monitor Agent Server Console
--ipa /ipa N/A
--ipp /ipp N/A
--lang /lang N/A
--log /log Log > Log Settings > Log File Path
--monwork /monwork N/A
--nmaddress /nmaddress Configuration > Add Novell Messenger System
> Replica Address
--nmhome /nmhome Configuration > Add Novell Messenger System
> Novell Messenger System Object
--nmpassword /nmpassword Configuration > Add Novell Messenger System
> Password
--nmuser /nmuser Configuration > Add Novell Messenger System
> User Name
novdocx (en) 22 June 2009
--nosnmp /nosnmp N/A
--pollthreads /pollthreads N/A
--proxy /proxy N/A
--tcpwaitconnect /tcpwaitconnect N/A
NOTE: The Monitor Agent Web console does not include any settings comparable to the Monitor
Agent startup switches.
67.1 /hapassword
Specifies the password for the Linux username that the Monitor Agent uses to log in to the Linux
server where the GroupWise High Availability service is running. See Section 63.12, “Supporting
the GroupWise High Availability Service on Linux,” on page 1028.
Linux Monitor Agent Windows Monitor Agent
Syntax: --hapassword password /hapassword-password
Example: --hapassword high /hapassword-high
See also /hauser and /hapoll.
67.2 /hapoll
Specifies in seconds the poll cycle on which the Monitor Agent contacts the GroupWise High
Availability service to provide agent status information. The default is 120. The actual duration of
the poll cycle can vary from the specified number of seconds because the actual duration includes
1064 GroupWise 8 Administration Guide
Page 65

the time during which the Monitor Agent is checking agent status and restarting agents as needed.
Then the specified poll cycle begins again and continues for the specified number of seconds. See
Section 63.12, “Supporting the GroupWise High Availability Service on Linux,” on page 1028.
Linux Monitor Agent Windows Monitor Agent
Syntax: --hapoll seconds /hapoll-seconds
Example: --hapoll 240 /hapoll-60
See also /hauser and /hapassword.
67.3 /hauser
Specifies the Linux username that the Monitor Agent can use to log in to the Linux server where the
GroupWise High Availability service is running. See Section 63.12, “Supporting the GroupWise
High Availability Service on Linux,” on page 1028.
Linux Monitor Agent Windows Monitor Agent
novdocx (en) 22 June 2009
Syntax: --hauser username /hauser-username
Example: --hauser gwha /hauser-gwha
See also /hapassword and /hapoll.
67.4 /help
Displays the Monitor Agent startup switch Help information. When this switch is used, the Monitor
Agent does not start.
Linux Monitor Agent Windows Monitor Agent
Syntax: --help /help
67.5 /home
Specifies a domain directory, where the Monitor Agent can access a domain database
(wpdomain.db). From the domain database, the Monitor Agent can determine which agents to
monitor, what usernames and passwords are necessary to access them, and so on.
Linux Monitor Agent Windows Monitor Agent
Syntax: --home /directory /home-[svr\][vol:]\dir
/home-\\svr\vol\dir
/home-[drive:]\dir
/home-\\svr\sharename\dir
Using Monitor Agent Startup Switches 1065
Page 66

Linux Monitor Agent Windows Monitor Agent
Example: --home /gwsystem/provo2 /home-\provo2
/home-mail:\provo2
/home-server2\mail:\provo2
/home-\\server2\mail\provo2
/home-\provo2
/home-m:\provo2
/home-\\server2\c\mail\provo
See also /ipa and /ipp.
67.6 /httpagentpassword
Specifies the password for the Monitor Agent to prompt for when contacting monitored agents for
status information. Providing a password is optional. See Section 63.3.1, “Configuring the Monitor
Agent for HTTP,” on page 1014.
novdocx (en) 22 June 2009
Linux Monitor Agent Windows Monitor Agent
Syntax: --httpagentpassword unique_password /httpagentpassword-unique_password
Example: --httpagentpassword WatchIt /httpagentpassword-WatchIt
See also /httpagentuser.
67.7 /httpagentuser
Specifies the username for the Monitor Agent to use when contacting monitored agents for status
information. Providing a username is optional. See Section 63.3.1, “Configuring the Monitor Agent
for HTTP,” on page 1014.
Linux Monitor Agent Windows Monitor Agent
Syntax: --httpagentuser unique_username /httpagentuser-unique_username
Example: --httpagentuser AgentWatcher /httpagentuser-AgentWatcher
See also /httpagentpassword.
67.8 /httpcertfile
Specifies the full path to the public certificate file used to provide secure SSL communication
between the Monitor Agent and the Monitor Web console displayed in your Web browser. See
Section 63.8, “Configuring Authentication and Intruder Lockout for the Monitor Web Console,” on
page 1023.
1066 GroupWise 8 Administration Guide
Page 67

Linux Monitor Agent Windows Monitor Agent
Syntax: --httpcertfile /dir/file /httpcertfile-[drive:]\dir\file
/httpcertfile-\\svr\sharename\dir\file
Example: --httpcertfile /certs/gw.crt /httpcertfile-\ssl\gw.crt
/httpcertfile-m:\ssl\gw.crt
/httpcertfile-\\server2\c\ssl\gw.crt
See also /httpssl.
67.9 /httpmonpassword
novdocx (en) 22 June 2009
Specifies the password for the Monitor Web console to prompt for before allowing a user to display
®
the Monitor Web console. Do not use an existing Novell
eDirectoryTM password because the
information passes over the non-secure connection between your Web browser and the Monitor
Agent. See Section 63.8, “Configuring Authentication and Intruder Lockout for the Monitor Web
Console,” on page 1023.
Linux Monitor Agent Windows Monitor Agent
Syntax: --httpmonpassword unique_password /httpmonpassword-unique_password
Example: --httpmonpassword WatchIt /httpmonpassword-WatchIt
See also /httpmonuser.
67.10 /httpmonuser
Specifies the username for the Monitor Web console to prompt for before allowing a user to display
the Monitor Web console. Providing a username is optional. Do not use an existing eDirectory
username because the information passes over the non-secure connection between your Web
browser and the Monitor Agent. See Section 63.8, “Configuring Authentication and Intruder
Lockout for the Monitor Web Console,” on page 1023.
Linux Monitor Agent Windows Monitor Agent
Syntax: --httpmonuser unique_username /httpmonuser-unique_username
Example: --httpmonuser MonAdmin /httpmonuser-MonAdmin
See also /httpmonpassword.
67.11 /httpport
Sets the HTTP port number used for the Monitor Agent to communicate with your Web browser.
The default is 8200; the setting must be unique. See Section 63.3.1, “Configuring the Monitor Agent
for HTTP,” on page 1014.
Using Monitor Agent Startup Switches 1067
Page 68

Linux Monitor Agent Windows Monitor Agent
Syntax: --httpport port_number /httpport-port_number
Example: --httpport 8201 /httpport-9200
67.12 /httpssl
Enables secure SSL communication between the Monitor Agent and the Monitor Web console
displayed in your Web browser. See Section 63.8, “Configuring Authentication and Intruder
Lockout for the Monitor Web Console,” on page 1023.
Linux Monitor Agent Windows Monitor Agent
Syntax: --httpssl /httpssl
See also /httpcertfile.
novdocx (en) 22 June 2009
67.13 /ipa
Specifies the network address (IP address or DNS hostname) of a server where an MTA is running.
The Monitor Agent can communicate with the MTA to obtain information about agents to monitor.
Linux Monitor Agent Windows Monitor Agent
Syntax: --ipa network_address /ipa-network_address
Example: --ipa 172.16.5.19
--ipa server2
/ipa-172.16.5.20
/ipa-server3
See also /ipp.
67.14 /ipp
Specifies the TCP port number associated with the network address of an MTA with which the
Monitor Agent can communicate to obtain information about agents to monitor. Typically, the MTA
listens for service requests on port 7100.
Linux Monitor Agent Windows Monitor Agent
Syntax: --ipp port_number /ipp-port_number
Example: --ipp 7110 /ipp-7111
See also /ipa.
1068 GroupWise 8 Administration Guide
Page 69

67.15 /lang
Specifies the language to run the Monitor Agent in, using a two-letter language code as listed below.
You must install the Monitor Agent in the selected language in order for the Monitor Agent to
display in the selected language.
Linux Monitor Agent Windows Monitor Agent
Syntax: --lang code /lang-code
Example: --lang de /lang-fr
Contact your local Novell sales office for information about language availability. See Chapter 7,
“Multilingual GroupWise Systems,” on page 111 for a list of language codes.
67.16 /log
Specifies the full path of the directory where the Monitor Agent writes its log files. The default
location varies by platform:
novdocx (en) 22 June 2009
Linux:
Windows:
/var/log/novell/groupwise/gwmon
c:\Program Files\Novell\GroupWise Server\Monitor
See Section 63.9, “Configuring Monitor Agent Log Settings,” on page 1024.
Linux Monitor Agent Windows Monitor Agent
Syntax: --log /dir/file /log-[drive:]\dir\file
/log-\\svr\sharename\dir\file
Example: --log /opt/novell/groupwise/agents/logs /log-\gw\logs
/log-m:\gw\logs
/log-\\server2\c\gw\logs
67.17 /monwork
Specifies the location where the Monitor Agent creates it working directory. The default location
varies by platform.
Linux:
Windows:
/tmp/gwmon
c:\Program Files\Novell\GroupWise Server\Monitor
Linux Monitor Agent Windows Monitor Agent
Syntax: --monwork /directory /monwork-[svr\][vol:]\dir
/monwork-\\svr\vol\dir
/monwork-[drive:]\dir
/monwork-\\svr\sharename\dir
Using Monitor Agent Startup Switches 1069
Page 70

Linux Monitor Agent Windows Monitor Agent
Example: --monwork /tmp /monwork-\temp
/monwork-mail:\ temp
/monwork-server2\mail:temp
/monwork-\\server2\mail\ temp
/monwork-\ temp
/monwork-m:\temp
/monwork-\\server2\c\mail\temp
67.18 /nmaddress
Specifies the IP address where an eDirectory replica is available, from which the Monitor Agent can
obtain the information it needs to monitor Messenger Agents. See Section 63.11, “Monitoring
Messenger Agents,” on page 1026.
Linux Monitor Agent Windows Monitor Agent
novdocx (en) 22 June 2009
Syntax: --nmaddress IP_address /nmaddress-IP_address
Example: --nmaddress 172.16.5.18 /nmaddress-172.16.5.19
See also /nmuser, /nmpassword, and /nmhome.
67.19 /nmhome
Specifies the context of the eDirectory container object where a Novell Messenger system is located.
See Section 63.11, “Monitoring Messenger Agents,” on page 1026.
Linux Monitor Agent Windows Monitor Agent
Syntax: --nmhome eDirectory_context /nmhome-eDirectory_context
Example: --nmhome
OU=MessengerService,O=Messenger
/nmhomeOU=MessengerService,OU=Provo,O=Novell
See also /nmuser, /nmpassword, and /nmaddress.
67.20 /nmpassword
Specifies the password for the eDirectory user that the Monitor Agent uses to log into eDirectory to
obtain Messenger information. See Section 63.11, “Monitoring Messenger Agents,” on page 1026
Linux Monitor Agent Windows Monitor Agent
Syntax: --nmpassword password /nmpassword-password
Example: --nmpassword december /nmpassword-sailboat
See also /nmuser, /nmhome, and /nmaddress.
1070 GroupWise 8 Administration Guide
Page 71

67.21 /nmuser
Specifies a user that the Monitor Agent can use to log in to eDirectory to obtain information about
the Messenger system from the various Messenger objects. See Section 63.11, “Monitoring
Messenger Agents,” on page 1026
Linux Monitor Agent Windows Monitor Agent
Syntax: --nmuser eDirectory_context /nmuser-eDirectory_context
Example: --nmuser CN=Admin,OU=Users,O=Novell /nmuser-CN=Admin,OU=Provo,O=Novell
See also /nmpassword, /nmhome, and /nmaddress.
67.22 /nosnmp
Disables SNMP for the Monitor Agent. The default is to have SNMP enabled. See Section 63.3.2,
“Configuring the Monitor Agent for SNMP,” on page 1016.
novdocx (en) 22 June 2009
Linux Monitor Agent Windows Monitor Agent
Syntax: --nosnmp /nosnmp
67.23 /pollthreads
Specifies the number of threads that the Monitor Agent uses for polling the agents for status
information. Valid values range from 1 to 32. The default is 20. See Section 63.4, “Configuring
Polling of Monitored Agents,” on page 1017.
Linux Monitor Agent Windows Monitor Agent
Syntax: --pollthreads number /pollthreads-number
Example: --pollthreads 10 /pollthreads-32
67.24 /proxy
Routes all communication through the Monitor Agent and the Monitor Application (on the Web
server). As long as the Web server can be accessed through the firewall, the Monitor Web console
can receive information about all GroupWise agents that the Monitor Agent knows about. Without /
proxy, the Monitor Web console cannot communicate with the GroupWise agents through a firewall.
See Section 63.10, “Configuring Proxy Service Support for the Monitor Web Console,” on
page 1026.
Linux Monitor Agent Windows Monitor Agent
Syntax: --proxy /proxy
Using Monitor Agent Startup Switches 1071
Page 72

67.25 /tcpwaitconnect
Sets the maximum number of seconds the Monitor Agent waits for a connection to a monitored
agent. The default is 5.
Linux Monitor Agent Windows Monitor Agent
Syntax: --tcpwaitconnect seconds /tcpwaitconnect-seconds
Example: --tcpwaitconnect 10 /tcpwaitconnect-15
novdocx (en) 22 June 2009
1072 GroupWise 8 Administration Guide
 Loading...