

Page 1

SmartMesh IP Application
Notes
SmartMesh IP Application Notes Page of 1 159
Page 2

Table of Contents
1 Revision History _________________________________________________________________________________ 8
2 Application Note Summary _________________________________________________________________________ 9
3 Application Note: How to Evaluate Network and Device Performance ________________________________________ 11
3.1 Introduction _______________________________________________________________________________ 11
3.2 Join Behavior ______________________________________________________________________________ 11
3.2.1 Tradeoff Between Search Time and Average Current __________________________________________ 12
3.2.2 Measuring Join Time __________________________________________________________________ 14
3.2.3 Effect of Downstream Bandwidth on Join __________________________________________________ 14
3.2.4 Network Formation vs Single Mote Join ___________________________________________________ 17
3.2.5 Measuring Time to Recover from a Lost Mote _______________________________________________ 17
3.3 Latency ___________________________________________________________________________________ 19
3.3.1 Measuring Latency ____________________________________________________________________ 19
3.3.2 Comparison with a Star Topology ________________________________________________________ 20
3.3.3 Tradeoff Between Power and Latency _____________________________________________________ 22
3.3.4 Roundtrip Latency ____________________________________________________________________ 22
3.4 Channel Hopping and Range __________________________________________________________________ 24
3.4.1 Using radiotest for Single Channel Measurements ___________________________________________ 24
3.4.2 Range Testing _______________________________________________________________________ 25
3.4.3 Blacklisting __________________________________________________________________________ 26
3.5 Power ____________________________________________________________________________________ 29
3.6 Mesh Behavior _____________________________________________________________________________ 30
3.6.1 Testing the Mesh _____________________________________________________________________ 30
3.6.2 Changing Mesh Policies ________________________________________________________________ 30
3.7 Data Rates ________________________________________________________________________________ 31
4 Application Note: How to use Filters in the Subscribe API _________________________________________________ 32
4.1 The Subscribe Filter _________________________________________________________________________ 32
4.2 Acknowledged or Unacknowledged? ____________________________________________________________ 32
5 Application Note: Monitoring SmartMesh IP Network Health ______________________________________________ 33
5.1 Health Reports _____________________________________________________________________________ 33
5.1.1 Neighbors HR _______________________________________________________________________ 33
5.1.2 Device HR __________________________________________________________________________ 34
5.2 Periodic API Calls ___________________________________________________________________________ 34
5.2.1 getMoteConfig _______________________________________________________________________ 34
5.2.2 getMoteInfo _________________________________________________________________________ 34
5.2.3 getNextPathInfo ______________________________________________________________________ 35
5.3 Tests _____________________________________________________________________________________ 35
5.3.1 For the AP Only ______________________________________________________________________ 35
5.3.2 Iterate Over All Motes _________________________________________________________________ 36
5.3.3 Iterate Over All Paths __________________________________________________________________ 37
SmartMesh IP Application Notes Page of 2 159
Page 3

5.3.4 Network Checks ______________________________________________________________________ 37
5.4 Graphing __________________________________________________________________________________ 37
6 Application Note: Data Publishing for SmartMesh IP ____________________________________________________ 38
6.1 Request and Response Packet Formatting ________________________________________________________ 38
6.1.1 Header _____________________________________________________________________________ 38
6.1.2 Flag Byte ___________________________________________________________________________ 39
6.2 Basic Steps ________________________________________________________________________________ 39
6.3 Next Steps ________________________________________________________________________________ 44
7 Application Note: Managing Advertising in an LTC5800-IPR Based Network __________________________________ 45
7.1 Advertising State Machine ____________________________________________________________________ 45
8 Application Note: Configuring Networks for Short-term Data Bursts _________________________________________ 46
8.1 Introduction _______________________________________________________________________________ 46
8.1.1 Network Requirements and Service Requests _______________________________________________ 46
8.2 Network 1: Base Configuration _________________________________________________________________ 46
8.3 Network 2: Longer Downstream Slotframe _______________________________________________________ 49
8.4 Network 3: Higher Power, Low Latency __________________________________________________________ 50
8.5 Network 4: Backbone Example _________________________________________________________________ 51
8.6 Network 5: Star Network _____________________________________________________________________ 52
8.7 Advertising Management _____________________________________________________________________ 53
9 Application Note: How to Get Redundancy in an IP Network _______________________________________________ 54
10 Application Note: Using the Powered Backbone to Improve Latency _________________________________________ 55
10.1 Introduction _______________________________________________________________________________ 55
10.1.1 General Motivation ____________________________________________________________________ 55
10.1.2 Settings to Enable RX in the Upstream Backbone ____________________________________________ 56
10.2 Application 1: Low-latency Alarms ______________________________________________________________ 56
10.3 Application 2: Call and Response _______________________________________________________________ 57
10.4 Application 3: Lower Latency in All Low-Traffic Networks ____________________________________________ 58
10.5 Unsuitable Use of Backbone 1: Replacing Dedicated Links ___________________________________________ 59
10.6 Unsuitable Use of Backbone 2: High-Traffic Networks _______________________________________________ 59
11 Application Note: Building a Mesh-of-Meshes __________________________________________________________ 61
11.1 Introduction _______________________________________________________________________________ 61
11.1.1 Tunneling ___________________________________________________________________________ 63
11.1.2 Backhaul Bridge ______________________________________________________________________ 63
11.1.3 Backhaul and Host Applications __________________________________________________________ 64
11.2 Tunneling Protocol __________________________________________________________________________ 65
11.2.1 Downstream Data ____________________________________________________________________ 66
11.2.2 Upstream Data _______________________________________________________________________ 67
11.2.3 Request ____________________________________________________________________________ 68
11.2.4 Reply ______________________________________________________________________________ 69
11.3 Remote Procedure Interface ___________________________________________________________________ 70
11.3.1 getOperationalMotes Procedure __________________________________________________________ 71
11.4 Bandwidth Considerations ____________________________________________________________________ 72
11.5 Miscellaneous ______________________________________________________________________________ 72
SmartMesh IP Application Notes Page of 3 159
Page 4

12 Application Note: Building Deep IP Networks __________________________________________________________ 73
12.1 Introduction _______________________________________________________________________________ 73
12.2 Deployment Guidelines _______________________________________________________________________ 73
12.3 Determining Range __________________________________________________________________________ 74
12.4 Mote and Manager Versions and Settings ________________________________________________________ 74
12.5 Calculating Links ___________________________________________________________________________ 75
12.6 Estimating Latency __________________________________________________________________________ 75
12.7 Over-the-Air Programming ____________________________________________________________________ 77
13 Application Note: Overlapping Networks ______________________________________________________________ 78
13.1 Introduction _______________________________________________________________________________ 78
13.2 Method ___________________________________________________________________________________ 78
13.3 Results ___________________________________________________________________________________ 80
13.4 Conclusions _______________________________________________________________________________ 84
14 Application Note: Planning A Deployment _____________________________________________________________ 85
14.1 Estimating Range ___________________________________________________________________________ 85
14.2 Mapping out a Deployment ___________________________________________________________________ 85
14.3 Estimating Power and Latency _________________________________________________________________ 86
15 Application Note: Predicting Network Health ___________________________________________________________ 87
15.1 Motivation ________________________________________________________________________________ 87
15.2 Overview __________________________________________________________________________________ 87
15.3 Does the Network LOOK GOOD? _______________________________________________________________ 88
15.4 Does the Network Have the Building Blocks to BE GOOD? ____________________________________________ 88
16 Application Note: Common Problems and Solutions _____________________________________________________ 89
16.1 Introduction _______________________________________________________________________________ 89
16.2 No Motes Join _____________________________________________________________________________ 90
16.3 A Collection of Motes Doesn't Join _____________________________________________________________ 90
16.4 One Mote Doesn't Join _______________________________________________________________________ 90
16.5 One Mote Gets Lost and Rejoins Over and Over ____________________________________________________ 91
16.6 Devices Within Operating Range Have Bad Path Stability _____________________________________________ 91
16.7 I Need to Install a Repeater but I'm Already at Max Motes ____________________________________________ 91
16.8 Data Latency is Higher than I Expect ____________________________________________________________ 91
16.9 The Network is Using Paths that Don't Look Optimal ________________________________________________ 91
17 Application Note: Changing Provisioning Factor to Increase Manager Throughput ______________________________ 92
17.1 Introduction _______________________________________________________________________________ 92
17.2 Changing Provisioning: IP ____________________________________________________________________ 92
17.3 Changing Provisioning: WirelessHART ___________________________________________________________ 93
18 Application Note: Debugging Congested Networks ______________________________________________________ 94
18.1 Introduction _______________________________________________________________________________ 94
18.2 Respecting Services _________________________________________________________________________ 94
18.3 Estimating Availability _______________________________________________________________________ 94
18.4 Identifying Congestion _______________________________________________________________________ 96
18.5 Bandwidth Model ___________________________________________________________________________ 96
18.6 Mitigating Congestion _______________________________________________________________________ 97
SmartMesh IP Application Notes Page of 4 159
Page 5

19 Application Note: Identifying and Mitigating the Effects of Interference ______________________________________ 98
19.1 Introduction _______________________________________________________________________________ 98
19.2 Checking RSSI and Path Stability _______________________________________________________________ 99
19.3 Checking Mote Latency, Queue Lengths and Reliability _____________________________________________ 101
19.4 Mitigation ________________________________________________________________________________ 102
20 Application Note: Obtaining Accurate Timestamps _____________________________________________________ 103
20.1 Time ____________________________________________________________________________________ 103
20.2 References _______________________________________________________________________________ 103
20.3 IP Eterna-Based Systems ____________________________________________________________________ 103
20.4 Loose Timing _____________________________________________________________________________ 105
20.5 Tight Timing ______________________________________________________________________________ 105
20.6 Highest Precision Timing ____________________________________________________________________ 105
20.7 Quantifying IP Uncertainty ___________________________________________________________________ 106
20.8 WirelessHART (Linux SBC-Based) Systems ______________________________________________________ 106
20.9 Quantifying WirelessHART Uncertainty _________________________________________________________ 107
20.10Synchronous Events ________________________________________________________________________ 108
21 Application Note: Using Multiple Managers to Build Large Networks _______________________________________ 109
21.1 Large Deployments ________________________________________________________________________ 109
21.2 RF Limitations ____________________________________________________________________________ 109
21.3 Ideal Deployment Guidelines _________________________________________________________________ 110
21.4 Large IP Networks - Different Network ID and Common Join Key _____________________________________ 111
21.5 Large WirelessHART Networks - Different Network ID and Shared ACL _________________________________ 112
21.6 Multiple-Manager Deployment Risks ___________________________________________________________ 112
21.7 Setting Network ID and Join Key Over the Air ____________________________________________________ 113
22 Application Note: Using the SmartMesh Power and Performance Estimator __________________________________ 114
22.1 Introduction ______________________________________________________________________________ 114
22.2 Problem: What is my Battery Life? _____________________________________________________________ 114
22.3 The Power and Performance Estimator _________________________________________________________ 114
22.4 Q1: How Does Reporting Rate Affect Power? _____________________________________________________ 115
22.5 Q2: How Much Does Routing Cost? ____________________________________________________________ 116
22.6 Q3: How Much Does Retransmission Cost? ______________________________________________________ 118
22.7 Q4: Can Packet Aggregation Save Power? _______________________________________________________ 119
22.8 Q5: How Does Network Depth Impact Power? ____________________________________________________ 121
22.9 Q6: Turn Off Advertising in an IP Network to Save Power? __________________________________________ 122
23 Application Note: What to Expect with Motes That Move ________________________________________________ 123
23.1 Moving Motes ____________________________________________________________________________ 123
23.2 SmartMesh WirelessHART ___________________________________________________________________ 123
23.3 SmartMesh IP ____________________________________________________________________________ 123
23.4 Summary of Differences Between SmartMesh WirelessHART and IP __________________________________ 124
24 Application Note: Migrating Motes Between Networks __________________________________________________ 125
24.1 Migrating Motes ___________________________________________________________________________ 125
24.2 Procedure ________________________________________________________________________________ 125
24.3 Security _________________________________________________________________________________ 126
SmartMesh IP Application Notes Page of 5 159
Page 6

25 Application Note: Configuring a Network for Bounded Data Latency ________________________________________ 127
25.1 Increasing Provisioning _____________________________________________________________________ 127
25.2 Restrictions ______________________________________________________________________________ 127
25.3 Provisioning ______________________________________________________________________________ 127
25.4 Changing Provisioning ______________________________________________________________________ 128
25.5 Power Increases ___________________________________________________________________________ 128
26 Application Note: Network Coexistence ______________________________________________________________ 129
26.1 Overlapping Networks ______________________________________________________________________ 129
26.2 Collisions in a Single Network ________________________________________________________________ 129
26.3 Avoiding Periodic Collisions __________________________________________________________________ 129
26.3.1 SmartMesh WirelessHART _____________________________________________________________ 130
26.3.2 SmartMesh IP ______________________________________________________________________ 131
26.3.3 Mixed IP - WirelessHART Environments __________________________________________________ 131
26.4 Clear Channel Assessment ___________________________________________________________________ 131
26.5 Empirical Results __________________________________________________________________________ 131
27 Application Note: How to Choose a Join Duty Cycle ____________________________________________________ 133
27.1 Background - What is the Join Duty Cycle? ______________________________________________________ 133
27.2 What Join Duty Cycle Should I Use? ___________________________________________________________ 133
27.3 The Sensor Application State Machine __________________________________________________________ 134
27.4 Summary ________________________________________________________________________________ 135
28 Application Note: SmartMesh Security ______________________________________________________________ 136
28.1 Introduction ______________________________________________________________________________ 136
28.2 Goals ___________________________________________________________________________________ 136
28.3 SmartMesh Security Features ________________________________________________________________ 137
28.4 Encryption and Authentication ________________________________________________________________ 137
28.4.1 Keying Model _______________________________________________________________________ 137
28.4.2 Manager Security Policies for Joining ____________________________________________________ 138
28.4.3 Key Management ____________________________________________________________________ 138
28.4.4 A Note on CCM* ____________________________________________________________________ 139
29 Application Note: Using the TestRadio Commands _____________________________________________________ 140
29.1 The testRadio Commands ___________________________________________________________________ 140
29.2 Setup ___________________________________________________________________________________ 140
29.3 Running the Experiment _____________________________________________________________________ 140
29.4 Interpreting the Results _____________________________________________________________________ 141
30 Application Note: Best Practices to Limit Average Current During Peak Periods _______________________________ 142
31 Application Note: Methodology For Pilot Network Evaluation _____________________________________________ 144
31.1 Summary ________________________________________________________________________________ 144
31.2 SmartMesh Starter Kits and SDK ______________________________________________________________ 144
31.3 Evaluation Methodology _____________________________________________________________________ 144
31.4 Step 1: SDK Installation on a PC ______________________________________________________________ 145
31.5 Step 2: Pilot Network Deployment of the SDK Motes and Manager ____________________________________ 145
31.6 Step 3: Configuring Motes for Specific Data Rates _________________________________________________ 147
31.7 Step 4: Gathering Statistics __________________________________________________________________ 149
SmartMesh IP Application Notes Page of 6 159
Page 7

31.8 Step 5: Analyzing Data ______________________________________________________________________ 151
31.8.1 Wireless Hart Snapshot Log ___________________________________________________________ 151
31.8.2 Log File Interpretation and Analysis ______________________________________________________ 153
31.8.3 Neighbor Stability Analysis ____________________________________________________________ 154
32 Application Note: What is Packet ID and why do I Need it? _______________________________________________ 155
32.1 Scope ___________________________________________________________________________________ 155
32.2 What is Packet ID? _________________________________________________________________________ 155
32.3 There are Two Packet IDs ____________________________________________________________________ 156
32.4 The Sync Bit ______________________________________________________________________________ 157
32.5 Ignoring Packet ID _________________________________________________________________________ 157
SmartMesh IP Application Notes Page of 7 159
Page 8

1 Revision History
Revision Date Description
1 03/18/2013 Initial Release
2 07/18/2013 Added "What is Packet ID and why do I Need it?" Application Note
3 10/22/2013 Minor corrections
4 01/30/2014 Added "Overlapping Networks" Application Note
Modified "Building a Mesh-of-Meshes" Application Note to reflect sample implementation
5 04/04/2014 Clarified how Q is calculated
SmartMesh IP Application Notes Page of 8 159
Page 9
2 Application Note Summary
This document contains a collection of Application Notes about the SmartMesh IP product family:
- Methods for measuring a host of performance metrics.How to Evaluate Network and Device Performance
- Strategies for monitoring manager notifications.How to use the Subscribe API Filter
- Automated checks to ensure that your network is performing well.Monitoring SmartMesh IP Network Health
- Low-level descriptions of how to use the mote's API for sending data.Data Publishing for SmartMesh IP
- A state machine to save power by turning advertising off.Managing Advertising in an LTC5800-IPR Based Network
- Strategies for low-power solutions when motes may suddenlyConfiguring Networks for Short-term Data Bursts
queue up several packets.
- Using more devices to get different levels of redundancy.How to Get Redundancy in an IP Network
- Description of several backbone use cases.Using the Powered Backbone to Improve Latency
Building a Mesh of Meshes - Very large networks constructed with a hierarchical model.
- Settings to use for networks up to 32 hops deep.Building Deep IP Networks
- Calculations of how many motes can safely coexist in the same radio space.Overlapping Networks
The following Application Notes apply to both SmartMesh IP and WirelessHART families. Differences between the products, if
any, are highlighted:
- High-level considerations prior to deploying a network.Planning A Deployment
- Initial post-deployment assessment tips.Predicting Network Health
- General troubleshooting advice.Common Problems and Solutions
- Decreasing per-mote bandwidth to support moreChanging Provisioning Factor to Increase Manager Throughput
total traffic in high-stability conditions.
- Understanding impact on network operation when mote queues are full and tips onDebugging Congested Networks
remedying such situations.
- Graphically representing network statistics to noticeIdentifying and Mitigating the Effects of Interference
interference-related problems.
- How to use the network time synchronization properly for timestamping packets.Obtaining Accurate Timestamps
- Considerations for deployments exceeding the mote limits of aUsing Multiple Managers to Build Large Networks
single manager.
- Examples on using the spreadsheet for predicting powerUsing the SmartMesh Power and Performance Estimator
and latency in a variety of networks.
- Details on the behavior of a mote moving to a different location in the sameWhat to Expect with Motes That Move
network.
- Details on how to migrate motes between different networks.Moving Motes Between Networks
- Adding bandwidth to a network to decrease the packet latency.Configuring a Network for Bounded Data Latency
- Features that allow multiple networks to operate in the same radio space.Network Coexistence
- Considerations for trading off power and join speed.How to Choose a Join Duty Cycle
- A description of the security used in all SmartMesh networks.SmartMesh Security
SmartMesh IP Application Notes Page of 9 159
Page 10

- A description of how to use APIs for testing radio performance or certification.Using the TestRadio Commands
- Guidelines to follow in order to keep average currentBest Practices to Limit Average Current During Peak Periods
down when booting or writing flash.
- Overview of deployment and statistics collection for network pilots.Methodology For Pilot Network Evaluation
- Details on the single bit used to provide reliable call and response with theWhat is Packet ID and why do I Need it?
Sensor Processor.
SmartMesh IP Application Notes Page of 10 159
Page 11

3 Application Note: How to Evaluate Network and Device
Performance
3.1 Introduction
OK, you just got a - now what? This app note describes a number of tests you can run to evaluateSmartMesh IP starter kit
specific performance characteristics of a SmartMesh network. It assumes that you have installed the SmartMesh IP SDK
python tools, and the necessary FTDI drivers to communicate with manager and motes. It also presumes you have access to
the Manager and Mote CLI and API documentation.
First thing is to connect to the manager ( ) and log into the manager's CLI as described in the Introduction in the DC9001
SmartMesh IP Manager CLI Guide
> login user
You will also need to connect a Eterna Interface Card to one or more A-B motes in order to access the mote'sDC9006 DC9003
CLI to configure it.
3.2 Join Behavior
How fast does a mote join? Mote join speed is a function of 6 things:
Advertising rate - the rate at which motes in-network advertise. The user has little control of this other than mote
density, or turning it off explicitly at the manager
Join duty cycle - how much time a searching mote spends listening for a network versus sleeping
Mote join state machine timeouts - there is no user control over these timeouts in SmartMesh IP
Downstream bandwidth - affects how quickly motes can move from being synchronized to the network to ,Operational
i.e. able to send data
Number of motes - contention among many motes simultaneously trying to join for limited resources slows down
joining with collisions
Path stability - over which the user has little or no control; path stability is the ratio of successful (acknowledged)
packets to sent packets between a pair of motes
The join process is broken up into three phases: search, synchronization, and message exchange.
Search time is determined by advertising rate, path stability, and mote join duty cycle - this can be 10's of seconds to
10's of minutes, largely depending upon join duty cycle
Synchronization is determined by mote state machine timeouts - this period is only a few seconds in SmartMesh IP.
SmartMesh IP Application Notes Page of 11 159
Page 12

Message exchange is determined by downstream bandwidth and number of motes (which compete for downstream
bandwidth). This is a minimum of ~10 s per mote, and can be much slower.
So, for example, it may seem that to join a network quickly, you would set the join duty cycle to maximum. However, this may
result in a lot of motes competing for downstream bandwidth, and a network may form more quickly with a lower setting. In
the experiments below, you will examine the "knobs" you have to control search and message exchange phases.
3.2.1 Tradeoff Between Search Time and Average Current
An unsynchronized mote listens for manager and other mote advertisements to synchronize to the network. The fraction of
time spent listening versus sleeping is called the . The join duty cycle is one-byte field that can be set from 0
join duty cycle
(0.2%) to 255 (almost 100%) - the default for Starter Kits is 100% or a setting of 255. Lower settings result in longer search
times at lower average current, while higher settings shorten search but increase average current. Provided that at least one
mote is advertising in the mote's vicinity, the dedicated to joining remains the same - join duty cycle only affectsenergy
average . If a mote is isolated, or if the manager is not on, or if advertising has been turned off, a mote couldcurrent
potentially exhaust its battery looking for a network. Join duty cycle gives the user control over the tradeoff between speed
when a network is present and how much energy is used when it isn't.
The time for a mote to synchronize and send in its join request is the first visible sign of a mote joining a network. You can
activate the manager's mote state trace using the CLI command:trace
> trace motest on
When the manager sees the mote's join request, it will mark the mote as being in the (Negot1) state.Negotiation1
To see the effect of join duty cycle:
Connect to the manager CLI and turn on the mote state trace as described above.
Connect to the mote CLI by using an Eterna Interface Card ( )DC9006
Reset the mote - it will print out a reset message
> reset
SmartMesh IP mote, ver 1.1.0.32 (0x0)
this will cause the mote to begin searching for the network with it's default duty cycle. You should see a series of notifications
as it changes state, with a timestamp in ms followed by the state:
52727 : Joining
56227 : Connected
60121 : Active
SmartMesh IP Application Notes Page of 12 159
Page 13

It should take <10 seconds on average for a mote to synchronize and sent its join request. You may want to repeat several
times (resetting each time) to see the distribution of synchronization times.
Reset the mote and use the mote CLI to set the join duty cycle to 5% (0.05 * 255 = 13) - this is controlled through the
mote CLI command Join duty cycle is non-volatile in a SmartMesh IP mote - it persists through resetmset joindc
or power cycle, so you only need to do this step once for each join duty cycle change. Measure how long it takes the
mote to transition to the state, repeating the measurement as described above. It should be ~3 min onNegotiating1
average.
> mset joindc 13
Reset the mote and use the mote CLI to set the join duty cycle to 25% (64). Measure how long it takes the mote to
transition to the state. It should be ~30 s on average.Negotiating1
> mset joindc 64
Note: When the manager sees a join request from a mote that was previously operational, it will mark it firstLost
before promoting it to connected. It will appear as:
264504 : Mote #2 State: Lost -> Negot1
266178 : Mote #2 State: Negot1 -> Negot2
SmartMesh IP Application Notes Page of 13 159
Page 14

3.2.2 Measuring Join Time
It takes a number of packets sent by the manager and acknowledged by the mote to transition a mote to the Operational
(Oper) state where it can begin sending data. We can use the manager mote state trace CLI command (this trace should still
be on from the test above) to see these state transitions and measure how long they take. The timestamps are in ms. Reset
the mote and watch it transition to . Each line in the following trace represents one handshake between the moteOperational
and the manager:
117757 : Created mote 2
117765 : Mote #2 State: Idle -> Negot1
119853 : Mote #2 State: Negot1 -> Negot2
122366 : Mote #2 State: Negot2 -> Conn1
125222 : Mote #2 State: Conn1 -> Conn2
127127 : Mote #2 State: Conn2 -> Conn3
129185 : Mote #2 State: Conn3 -> Oper
Here it took ~11.5 s to transition.
3.2.3 Effect of Downstream Bandwidth on Join
The rate at which the manager can send packets is a function of the downstream slotframe size - the manager assigns the
same number of dowstream links, regardless of slotframe size, so a 4x longer slotframe has 1/4 the bandwidth. This is shown
in Figure 1 - Slot 1 in a 100-slot slotframe repeats twice as often as the same slot in a 200-slot slotframe. By default, the
manager builds the network on a "fast" 256-slot slotframe, and then transitions to a "slow" slotframe after one hour. The slow
slotframe can be 256 (default), 512, or 1024 slots - this is set via the (downstream slotframe multiplier) parameter.
dnfr_mult
A longer frame means fewer downstream listens per unit time, so it will lower the average current for all motes, but also slow
down the join process (and any other downstream data) for motes added later. While this has no effect on the time it takes to
synchronize to the network (time to the state), it spaces out the other state transitions.Negotiating1
SmartMesh IP Application Notes Page of 14 159
Page 15
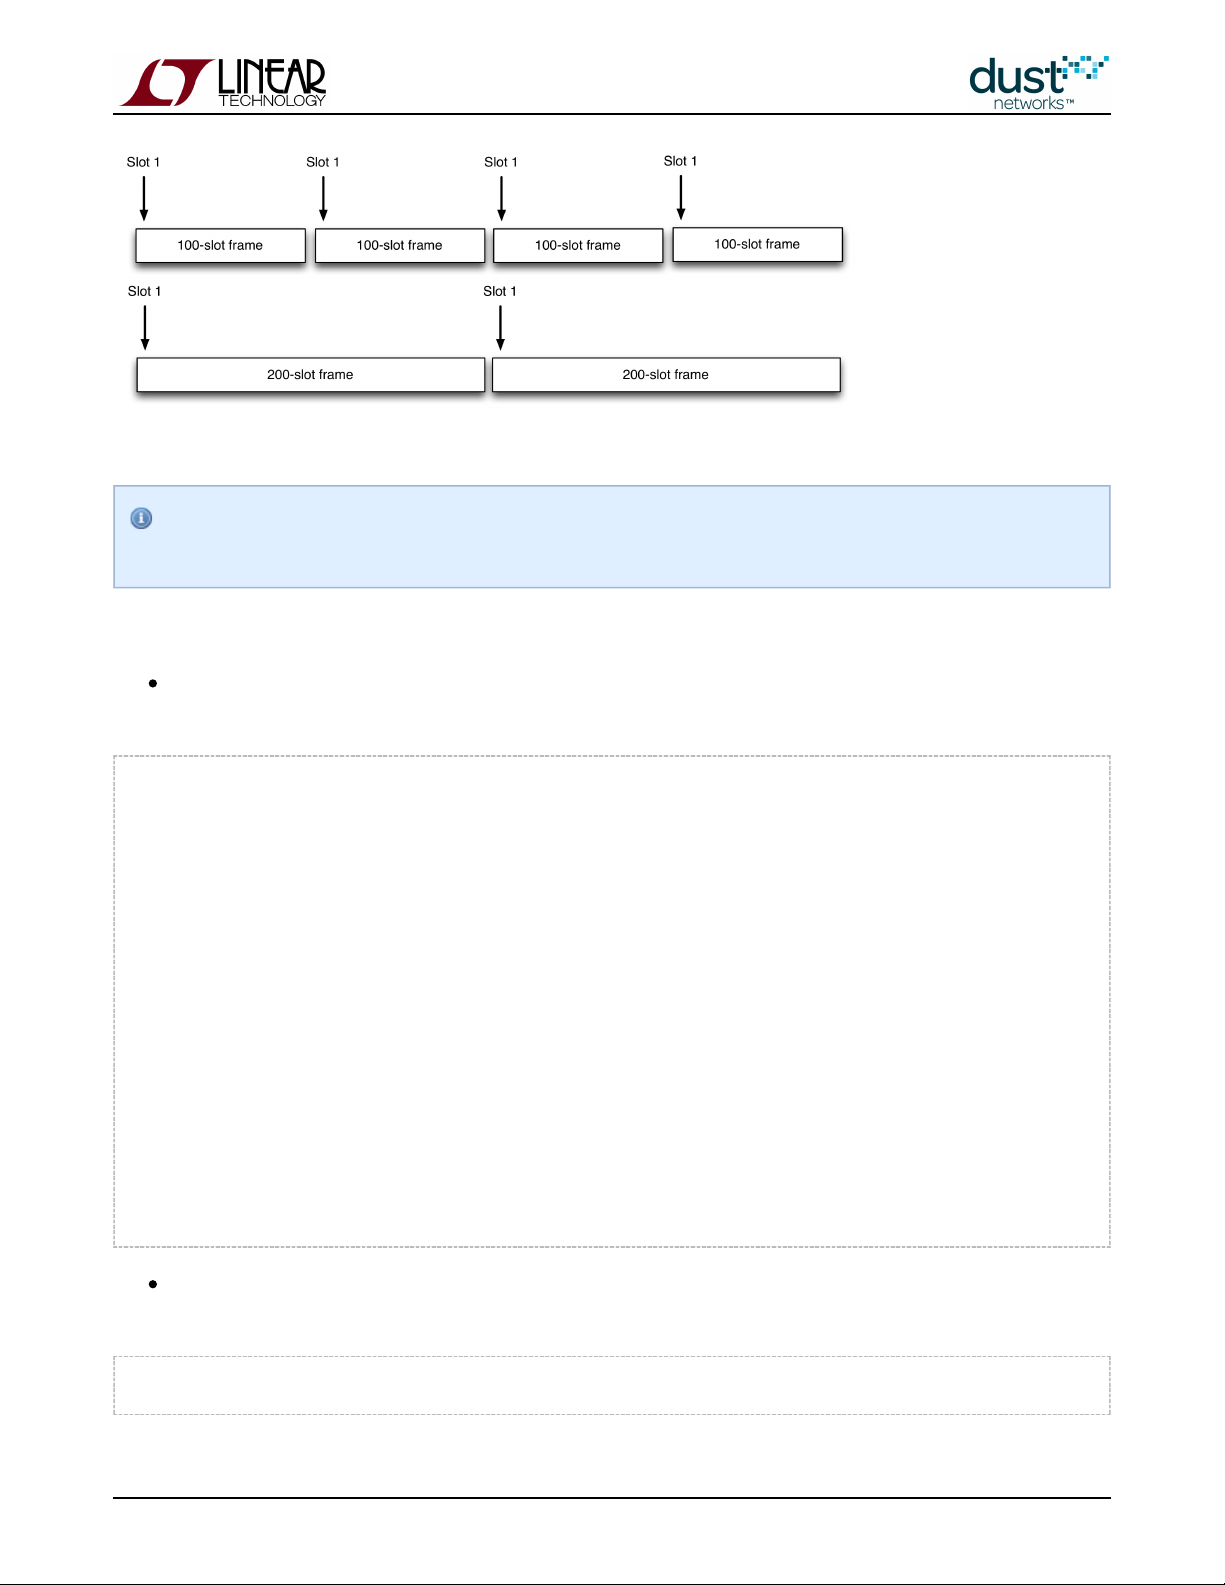
Figure 1 - Slot 1 repeats more often on a 100-slot frame than in a 200-slot frame
Note these are the nominal sizes - the actual slotframe sizes are randomized a bit to improve coexistence when
multiple networks are overlapping. We will refer to their nominal sizes throughout.
To see the effect of longer downstream slotframe:
Via manager CLI, confirm that the normal "fast" slotframes are being used. Look for the line that shows the
downstream slotframe multiplier ( ):
dnfr_mult
> show config
netid = 1229
txpower = 8
frprofile = 1
maxmotes = 17
basebw = 9000
dnfr_mult = 1
numparents = 2
cca = 0
channellist = 00:00:7f:ff
autostart = 1
locmode = 0
bbmode = 0
bbsize = 1
license = 00:00:00:00:00:00:00:00:00:00:00:00:00
ip6prefix = fe:80:00:00:00:00:00:00:00:00:00:00:00:00:00:00
ip6mask = ff:ff:ff:ff:ff:ff:ff:ff:00:00:00:00:00:00:00:00
radiotest = 0
bwmult = 300
Now you will adjust the downstream slotframe multiplier to give a 1024 slot slotframe - by setting the multiplier to 4,
you get a 4*256 slot slotframe. Config parameters are non-volatile:
> set config dnfr_mult 4
SmartMesh IP Application Notes Page of 15 159
Page 16

Force the longer slotframe use:
> exec setDnframe normal
Start Global Unicast Command setDnFrame
This may take a couple minutes to take effect.
Confirm that the manager is using the longer downstream slotframe:
> show status
S/N: 00-17-0D-00-00-38-0C-8C
MAC: 00-17-0D-00-00-38-0C-8C
IP6: FE:80:00:00:00:00:00:00:00:17:0D:00:00:38:0C:8C
HW ver: 1.2
NetworkID: 293
Base bandwidth (min links): 9000 (1)
Frame size Up/Down 277/1052. Number of working timeslots 256.
Available channels 15.
Base timeslot(TS0) 20
Network mode is Steady State
Downstream frame 1052 timeslots
Optimization is On
Advertisement is On
AP output CTS is Ready
Backbone is off
Location is off
API is Not Connected
License 00:00:00:00:00:00:00:00:00:00:00:00:00
Network Regular Mode
Total saved links 3
Manager CLI commands often use the term "frame" instead of the more formal "slotframe." "Frame" is never used to
indicate an 802.15.4 packet.
Now power cycle the single mote again and note the time it takes for the mote to transition from to Negotiating1
. This should be ~4x the "fast" join time you saw above.Operational
Path stability also affects join time, as worse path stability means more retries. Having a mesh architecture means
that the effect of any individual path is minimized.
SmartMesh IP Application Notes Page of 16 159
Page 17

1.
2.
3.
3.2.4 Network Formation vs Single Mote Join
The number of motes joining simultaneously also affects network formation time, as these motes must compete for limited
join links and downstream bandwidth. To see this effect (this assumes you are using the longer downstream frame from
above):
Configure all of your motes for 100% join duty cycle (as described above) - we aren't concerned with average current
here
Reset a single mote, and let it join. Repeat this 10 times to get an average join time.
Reset all motes and note the time it takes for the network to form completely, i.e. all motes transition to Operational
when the join trace is on. You may want to repeat this experiment a few times to get a feel for the variability.
Having 5 motes means, on average, that someone will hear the advertisement faster than one mote would in a single mote
network so you may see the first mote join quicker in the 5-mote case. However, if too many motes synch up at once they will
contend for the same shared Access Point (AP) links which can slow down the overall network join time.
Return the manager to the "fast" downstream frame before proceeding:
> set config dnfr_mult 1
Reset the manager and log back in.
3.2.5 Measuring Time to Recover from a Lost Mote
One of the reasons a mesh is important is the robustness to path failures. In star and tree structures, a single RF path can
represent a single point of failure for one or many devices data. In evaluating the mesh, many observers will want to see the
mesh recover from a path failure. The most reliable way to make a path fail is to power off a device. Many observers also care
a great deal about recovery time after the loss of a device, so this test can address both.
First we must decide what we mean by 'recovery'. If a user walks up to a 10-device mesh, and powers down one device, we
consider the network recovered if the only change in data delivery is that the one node powered down stops sending data. If
all other nodes continue to send data at their configured rates without interruption, then we consider the recovery time to be
zero. The network survived the loss of a node with no disturbance to the remainder of the network. Another way to look at it is
to establish some metric for quality of service, like data latency, that is being met prior to powering down a node, and then
looking for the loss of the node to cause that QoS metric to degrade, and look for that QoS metric to get back to where it was
before. This involves more of a judgement call from the observer and depending on the reporting rates might not be easy to
assign a hard time value. The third way to identify recovery is to power down a node that is a parent of one or more nodes,
and measure the time it takes for the network to detect that a parent has been lost and establish a new parent.
To summarize the three different "time to recover" test motivations are:
SmartMesh IP Application Notes Page of 17 159
Page 18

1.
2.
3.
1.
2.
3.
Uninterrupted data delivery. If powering down a mote causes no interruption to data delivery from any other motes,
then time to recover = 0. If data delivery is interrupted, then time to recover is the time until data delivery from all
nodes its restored
QoS data delivery. Baseline the QoS of a network through data analysis. Power down a node, and note degradation in
the QoS metric for some or all nodes. Time to recover is the time until that previous QoS metric is met again
Time to repair the mesh. Look at the mesh. Power down a node that will cause other nodes to have only a single
parent. Time to recover is the time it takes for the network to detect the loss and re-establish a full mesh
Test 1 and 2 are essentially the same. We recommend you deploy a network (see Tip below) and connect to CLI and turn
. Each packet received by the manager will then print the Mote ID and the latency of that packet. Capturetrace stat on
this text for some time, and then power down a mote. The mote you power down could be chosen randomly or you could
specifically identify a mote with many children in the mesh. Note an approximate timestamp in your text capture when you
powered down a node. Let the network continue to run for several minutes. Then you should be able to plot the data from this
text capture to identify the moment when the last packet was received from the powered down mote, and after that time you
should be able to identify if there are any gaps or delays in data delivery from any other nodes. You will need to provide your
own parsing an data analysis tools - MATLAB, Excel, and Python are all suitable.
Wait for the first few motes to join before powering up the remaining motes to form a mesh more quickly than if
you power up all motes simultaneously. Motes report who they heard advertising when they join - when you power
up all motes at the same time, only the AP is advertising, so likely motes will only report the AP as a possible
neighbor. Motes discover and report other neighbors slowly to minimize energy, it takes up to 5 minutes after
joining for the manager to begin "meshing" the network. In real deployments the delay to discover neighbors is
unimportant, but in demo or evaluation scenarios, waiting for a few motes to join allows immediate meshing.
Test 3 involves a different trace function on the manager. Deploy your initial network, and observe that a mesh has been
established (i.e. if numparents=2, then all motes will have two parents except one mote will have exactly one parent). Start a
text capture of the manager . Select and power down a mote. Note the approximate timestamp for thetrace link on
moment you powered the mote down and watch the events associated with detecting paths that have failed and the activity
associated with establishing new paths. After a few minutes stop the trace, and convince yourself that a full mesh has been
restored. The 'time to recover' is the time from when you powered down the mote to the timestamp of the final link add event
in your capture. Expected results
If the network was a good mesh to start with, we expect no data loss and no additional mote loss due to the removal
of a single device.
At moderate report rates (one packet per 5s or slower), we expect no disturbance in QoS. At faster report rates, you
may see latency delays associated with a single device loss. Motes that had ~200ms latency might have ~500ms
latency for a short time. Recovery time should be between one and two minutes.
Powering down a mote should be detected and repaired between one and two minutes
The Stargazer GUI tool, which is typically installed with an evaluation kit, allows you to see the mesh forming
SmartMesh IP Application Notes Page of 18 159
Page 19

3.3 Latency
3.3.1 Measuring Latency
Activating the manager CLI statistics trace provides a latency measure for every upstream packet received at the manager:
> trace stats on
281098 : STAT: #2: ASN Rx/Tx = 38694/38570, latency = 899, hops = 1
281100 : STAT: new average hops10=10 latency/10=56
This trace has two lines of report for each upstream packet. The first line shows when, in Absolute Slot Number (ASN) the
packet was received (Rx) at the manager and when the packet was generated (Tx) at the mote. ASN is the number of timeslots
that have elapsed since the network was started, or The difference20:00:00 UTC July 2,2002 if manager UTC time is set.
between these two counts, multiplied by 7.25 ms per slot, gives the value reported here as 899 ms. The time between the
sensor generating the data, and the notification at the manager will be slightly longer, as there may be some queueing delay.
The first line also shows how many hops upstream the packet took.
The second line shows the manager averaging the statistics after receiving this packet. It shows the average hops for this
mote (in units of 0.1 hops) and the average latency (in 10 ms units). So here the average latency is 56*10 ms = 560 ms.
You can collect a large number of latency trace prints and plot a distribution. It should look something like this:
SmartMesh IP Application Notes Page of 19 159
Page 20
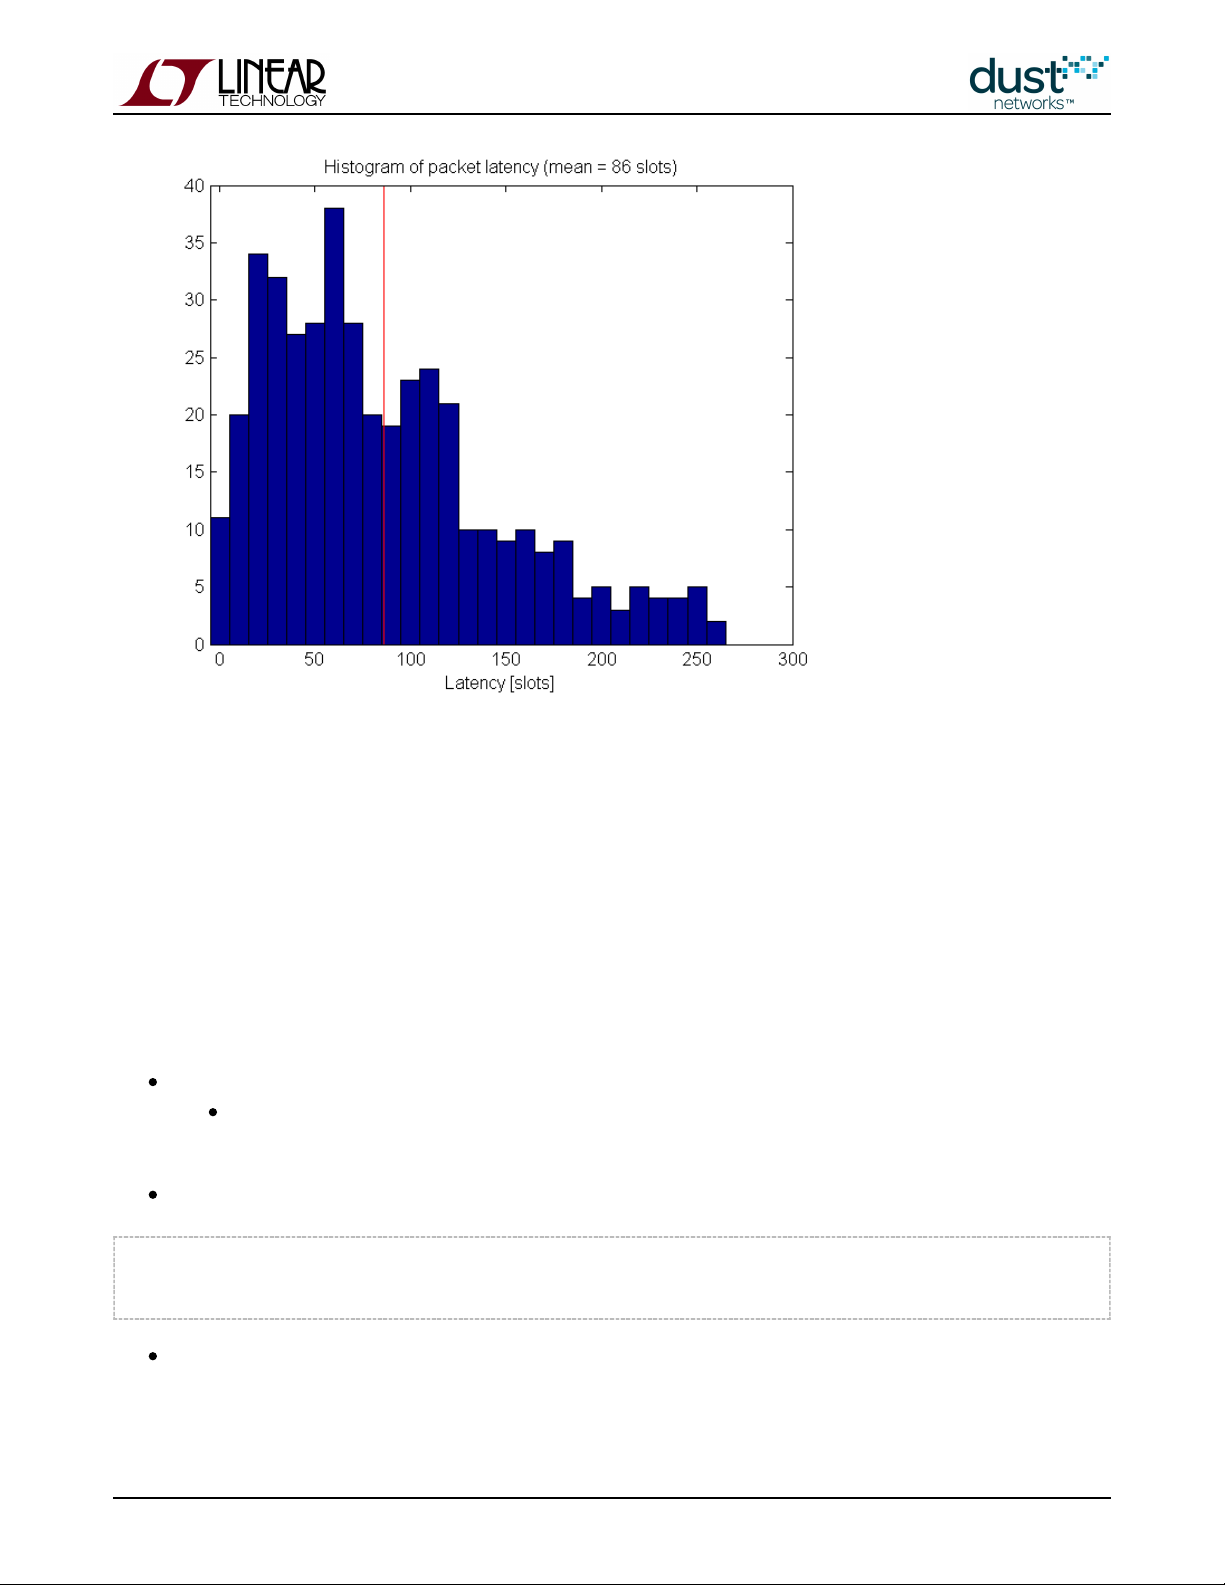
On average, unless path stability is very low, we expect a per-hop upstream latency of < 1/2 the upstream slotframe length.
3.3.2 Comparison with a Star Topology
In ZigBee networks, sensor nodes typically report to powered, always-on routers. As a result, data latency can be very low until the link fails.
Dust's networks offer a number of means to achieve low data latency - through a powered backbone (see note below) which
affects the entire network, through network-wide base bandwidth settings, or through per-mote services.
Try the following experiment:
Place the motes within a few meters of each other and form a mesh network (default).
Measure average latency as described in the previous section. By default each mote will send temperature data
once every 30 s, so you should take > 10 minutes of data.
Form a star network, by forcing the motes to be non-routing. This is done via the mote CLI
:
> mset rtmode 1
> mset maxStCur 20
and are non-volatile - it persists through reset/power cycle, but it must be changed before the mote
rtmode maxStCur
joins the network or the mote must rejoin the network if the setting is changed after joining. You will need to connect
the board, use CLI to change the routing mode, then disconnect the and repeat with another mote.DC9006 DC9006
SmartMesh IP Application Notes Page of 20 159
Page 21

We use the setting here to ensure that the mote is in the absolutely lowest power mode possible.
maxStCur
Measure average latency - you should see it has decreased slightly, as now motes will only have the AP as a parent.
This star configuration makes motes vulnerable to link failures, and didn't really improve latency much, and isn't really
the right solution to improve latency.
Set the motes back to routing-capable, and turn the upstream backbone on - this is done by the set config
manager CLI command. The backbone is a short slotframe with contention-access slots (as opposed to the normal
dedicated slots used in other frames) that can be used to provide low-latency shared bandwidth across many motes.
To get the lowest possible power mote configuration, we'll also eliminate the manager downstream multicast links by
setting to zero. Note that you need to input the superuser password prior to making this change.
nummlinks
> set config bbsize 1
> set config bbmode 1
> su becareful
> seti ini nummlinks 0
After this, a manager reset is required for the backbone to come on. Backbone mode is non-volatile and persists
through reset.
After reconnecting to the manager and joining all motes, turn manager CLI latency trace back on:
> trace stats on
Measure the average latency - it should be dramatically lower, despite motes occasionally routing through peers.
Turn off the backbone:
> set config bbmode 0
Reset the manager and turn the stats trace back on.
Increase the base bandwidth in the network. The default is 9000 ms (i.e. 1 packet per 9000 ms, or .11 packets/s). You
will set it to 1000 ms. This is also done with the command:set config
> set config basebw 1000
After this, a manager reset is required.
After reconnecting to the manager and joining all motes, turn CLI latency trace back on
Measure average latency - it should have dropped. Even though motes are not publishing any faster, they have
received more links, so latency decreases.
Set the base bandwidth back to 9000 ms.
SmartMesh IP Application Notes Page of 21 159
Page 22

> set config basebw 9000
Request a service on one mote.
Measure average latency - you should see that it dropped for the mote with a service, and may have dropped a little on
other motes that have that mote as a parent.
By default, motes only have a transmit link in the upstream powered backbone - this only has a miniscule effect on
mote power. In order to receive (and thus forward packets for other motes on the backbone) the
API must be invoked on the mote. This is discussed in the app note "
setParameter<pwrSource>
Application Note:
." This can improve latency network wide - either upstream, orUsing the Powered Backbone to Improve Latency
bi-directionally, but it increases mote current considerably. However, even with a bidirectional backbone on, a Dust
mote will still be 10x lower current than a typical ZigBee router.
3.3.3 Tradeoff Between Power and Latency
In general there is a tradeoff between power and latency. The more links a mote has, the lower the latency will be on any given
packet, since we tend to space links relatively evenly throughout the slotframe. This means that motes that forward traffic
have lower latencies than motes that don't, even if they generate packets at the same rate. It also means that a mote can
improve latency by asking for services at a mean latency target even if the data generation rate is lower.
Some of the power measurement experiments in the Power section show the correlation between power and latency.
3.3.4 Roundtrip Latency
Dust's networks are designed to primarily act as data collection networks, so most bandwidth is spent on upstream traffic.
While the use of services can improve the upstream contribution, if fast (< 2 s per message) call-response is needed, the
bidirectional backbone can be used. Try the following experiment:
Turn the and traces on via the manager CLIio iodata
Use APIExplorer in manager mode to send acknowledged application packet to a mote. This is done using the
API - set the source/destination ports= (0xF0B9), and the payload = .
sendData
61625 050002FF020302000100
This turns the indicator LED on on the mote, and causes the mote to acknowledge that the LED has been set. You
should see a print similar to the following on the manager CLI:
SmartMesh IP Application Notes Page of 22 159
Page 23

442887 : TX ie=32:2c mesh=1222 ttl=127 asn=59614 gr=2 dst=2 rt=r4 r=1:2 tr=u:req:8; sec=s nc=0
ie=fe:00 IP=7d77 UDP=f7 sP=f0b9 dP=f0b9;
443503 : TxDone
444269 : RX ie=32:1c mesh=4002 ttl=127 asn=59699 gr=1 src=2 rt=g tr=u:req:0; sec=s nc=11 ie=fe:00
IP=7d77 UDP=f7 sP=f0b9 dP=f0b9;
Repeat this several times and measure the roundtrip latency (delta between TX time and RX time, here 1382 ms)
Turn on bidirectional backbone:
> set config bbsize 2
> set config bbmode 2
After this, a manager reset is required for the backbone to come on.
After reconnecting to the manager and joining all motes, turn CLI latency trace back on:
> trace stats on
Repeat the test of step one - you should see a dramatic improvement in roundtrip latency.
sendData
The powered backbone persists through reset/power cycle until deactivated and the network is reset again. It
results in the motes consuming 1-2 mA average current.
SmartMesh IP Application Notes Page of 23 159
Page 24

3.4 Channel Hopping and Range
Unlike most other 15.4 based systems, Dust's products employ a Time Slotted Channel Hopping MAC - this means that
transmissions are spread out over all (or some - see Blacklisting below) channels in the 2.4 GHz band. This has the advantage
that the system's performance depends on the average channel stability, rather than a single channel's stability. The following
test will show you the how to measure single channel stability and see the effect of channel hopping. This test requires that
you have access to a 802.11g Wi-Fi router and can set it on a particular channel - set the router to 802.11 channel 6 - this
should cover mote channels 4–7. You will also need to configure your manager and a mote for radio test.
Note that in the various APIs below, channels are numbered 0-15. These correspond to channels 11-26 in the IEEE
channel numbering scheme.
3.4.1 Using radiotest for Single Channel Measurements
This description places the manager in the role of transmitter, and the mote in the role of receiver, but the test can be run
easily with roles swapped.
On the manager CLI, log in and place the manager into radio test mode
> login user
> radiotest on
> reset system
System reset by CLI
SmartMesh IP Manager ver 1.1.0.30.
658 : **** AP connected. Network started
After the manager resets, configure it to be the transmitter, setting it for a packet test, on channel 0, at +8 dBm power,
1000 packets, 80 byte payload - wait to hit return until you've configured the mote as receiver. Login is optional in
radiotest mode.
> radiotest tx reg 0 8 1000 80
On the mote CLI, place into radio test mode and reset. Then configure it to receive on channel 0 for two minutes
SmartMesh IP Application Notes Page of 24 159
Page 25

> radiotest on
> reset
SmartMesh IP mote, version 1.1.0.41 (0x0)
> radiotest rx 0 120
At this point hit return on the manager to start the test. After the manager is done sending, record the number of
packets received on the mote CLI:
> radiotest stat
Radio Test Statistics
OkCnt : 998
FailCnt : 2
The ratio of received to sent is the path stability (or packet success ratio) for this channel. Note that 1000 - may not
OkCnt
equal , since the manager only counts packet that it can lock onto.
FailCnt
Repeat for all channels. You should see a dip in path stability around the channels being used by the Wi-Fi router - note how
the dip isn't as big as you might expect. This is in part due to the fact that the router is also duty cycling, and is only on a
small fraction of the time.
3.4.2 Range Testing
The radioTest commands can also be used to do range testing. Range is the distance at which two devices can reliably
exchange packets, but it is also a grey area, since the following all affect the ability of two devices to communicate at a
distance:
Reflectors - things the radio signal bounces off of, including the ground.
Obstacles - things the radio signal must go through
Presence of interferers
Antenna design
Radio power settings
The simplest test is to repeat the single channel measurement described above, and repeat for all channels, since a real
network will use all channels. You will find that the packet error rate is strongly influenced by the height of the radio off the
ground, due to self-interference between the line-of-sight path and the bounce path. With motes at 1 m elevation, you may see
a drop off in packet success ratio near 50 m spacing, only to have it improve farther out. Motes placed several meters above
an open field should be able to communicate at hundreds of meters.
After this test, return the manager and mote to normal operation:
SmartMesh IP Application Notes Page of 25 159
Page 26

> radiotest off
OK
> reset
The boards come with an integrated chip antenna that has significantly less gain (-2.3 dBi average vs +2DC9003
dBi) than a dipole antenna. Range measurements should take this difference into account.
3.4.3 Blacklisting
The manager provides an API to blacklist certain channels in the case of a known interferer. In general, unless you know that
there is a strong interferer (such as a very busy wifi router) you should not blacklist
Form a 5 mote network - after all motes have joined, clear statistics:
> exec clearstat
Run for an hour. Use the manager CLI to look at the path stability for the network as a whole. At no time should you
see packets lost due to the interferer.
SmartMesh IP Application Notes Page of 26 159
Page 27

> show stat
Manager Statistics --------------------------------
established connections: 1
dropped connections : 0
transmit OK : 1907
transmit error : 0
transmit repeat : 0
receive OK : 35
receive error : 0
acknowledge delay avrg : 15 msec
acknowledge delay max : 35 msec
Network Statistics --------------------------------
reliability: 100% (Arrived/Lost: 1931/0)
stability: 98% (Transmit/Fails: 983/25)
latency: 200 msec
Motes Statistics -----------------------------------
Mote Received Lost Reliability Latency Hops
#2 1019 0 100% 120 1.0
#3 19 0 100% 1050 1.0
SmartMesh IP Application Notes Page of 27 159
Page 28

Reset the manager, blacklist channels 4-7, and reset the manager. The blacklist persists through reset/power cycle.
> login user
> set config channellist 00007f0f
> reset system
System reset by CLI
SmartMesh IP Manager ver 1.1.0.30.
658 : **** AP connected. Network started
After the network has formed, clear stats, run for another hour, and observe the path stability - it should have
improved.
Return the manager to 15 channels before proceeding:
> login user
> set config channellist 00007fff
> reset system
System reset by CLI
SmartMesh IP Manager ver 1.1.0.30.
658 : **** AP connected. Network started
SmartMesh IP Application Notes Page of 28 159
Page 29
3.5 Power
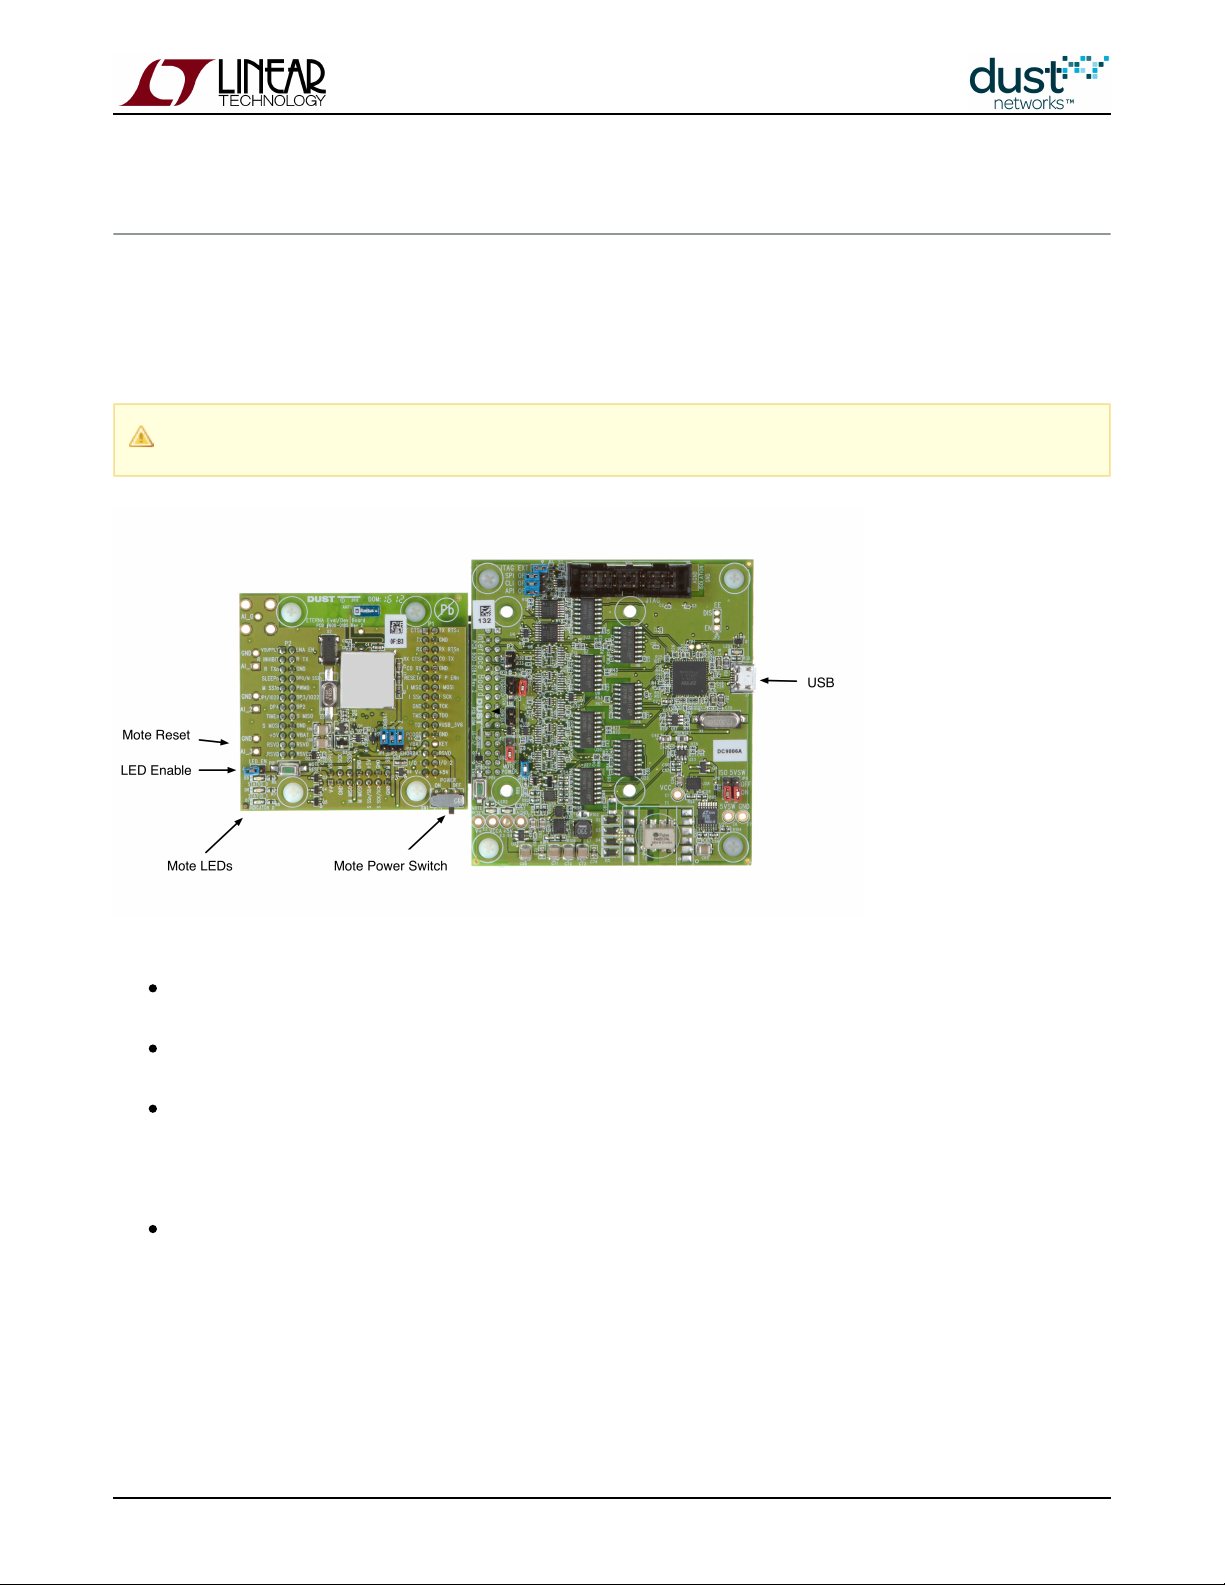
This section details how to measure power on an Eval/Dev board. In order to measure mote current, you should use a DC9003
A-B/ combination. You can either connect a scope across the jumper marked VSENSE on the - this measuresDC9006 DC9006
the voltage drop across a 10 Ω series resistor, or you can remove both the CURRENT jumper (black) and the red jumper
behind it, and connect an averaging current meter across the CURRENT jumper pins.
The LED_EN jumper on the A-B board must be disabled or the current measurement will be incorrect.DC9003
Suggested Measurements:
Idle current - when a mote has been reset, but no join API command has been issued. The mote must be configured in
mode to prevent automatic joining. After measuring idle current, return the mote to mode.slave master
Searching - Measure at 5% duty cycle, and 100% duty cycle. You should see the current change from ~250 µA
average to 5 mA average.
Mote joined - Set to 4, and to fast and reset the manager before joining the mote. After an hour,
dnfr_mult setDnframe
the manager will transition to the longer downstream frame, allowing you to compare the average current. It should be
about 29 µA before the transition, and 24 µA after. Turn off advertising with a 'exec setAdv off' command in the CLI
and see that the average current falls to 10 µA.
Backbone - Set the bbmode to 2 and bbsize to 2 and reset the manager. Measure the average current - it should be
about 500 µA.
Dust provides a to help estimate mote average current under various useSmartMesh Power and Performance Estimator
cases. Compare your test results to the spreadsheet results.
SmartMesh IP Application Notes Page of 29 159
Page 30

3.6 Mesh Behavior
Dust's networks automatically form meshes - each mote has multiple neighbors through which it can send or forward data.
This setting is a manager policy that is visible with the manager CLI command >show config (see above). The config element
that sets this policy is numparents, and as you can see above the default value is 2. The manager will make sure every mote
has at least the number of parents indicated by numparents, provided there are no loops in the mesh. Try to sketch this on
your white board and you'll find that in a one mote network, that one mote will have only the AP mote as a parent. Add a
second mote, and one mote will get two parents, but the other will be left with only one parent, to avoid making a loop.
Regardless how many motes you add, there will always be one 'single parent mote'.
3.6.1 Testing the Mesh
The Stargazer GUI application will allow you to see the mesh as it forms - if you haven't already installed it, do so now. It also
requires that you install the Serial Mux.
A mote having two parents is the best balance between robustness and power consumption under most operating conditions.
Robustness is achieved by having multiple parents. To confirm that we recommend you find a mote in your network that is a
parent to one or many motes. Power that mote off. Data delivery from that mote will stop, but the children will continue to
send data. Use 'trace stats on' as above to show a live stream of data from all the children motes, which are sending data
through their other parents. You may see a temporary increase in latency for a few minutes, and if you capture that trace to a
file you can show this graphically. The manager will take a few minutes to reassign parents and links in the system to account
for the loss of the mote you powered down.
3.6.2 Changing Mesh Policies
The parameter 'numparents' can be given any of 4 values: 1, 2, 3 or 4. If you set numparents to 1, your network will be a tree,
not a mesh. Each mote will have one parent, and that one parent may not be the AP. This is better than a star in that a tree
supports multi-hopping. But like a star, a tree network has numerous 'single points of failure'. If you power down the parent
of a mote in a tree, the child mote will drop off the network because it has no connections to any other devices. It will reset
and will have to join again, most likely resulting in data loss. A tree structure can be slightly lower power, because each device
only has to listen to one parent for downstream messages and only has to maintain synchronization with one parent.
Furthermore it is assumed that data latency will be more bounded in a tree, because individual packets can't 'wander' around
the mesh. We believe that the likelihood of network collapse and data loss far outweigh the potential benefit in power and
latency.
Two is the default and has a nice balance of robustness vs power. Setting numparents to 3 or even 4 increases the
'meshiness' of the system and gives the network additional robustness at the cost of somewhat higher power. We
recommend increasing the number of parents in networks where you know that paths will be breaking frequently. See the
Application note . Moderate mobility of some nodes may be betterIdentifying and Mitigating the Effects of Interference
supported with numparents = 4.
SmartMesh IP Application Notes Page of 30 159
Page 31

3.7 Data Rates
The SmartMesh SDK contains two sample applications: TempMonitor, which allows you to set the rate of temperature
publication on one or more motes in a SmartMesh IP network, and PkGen, which allows you to generate packets of a
particular size and at a particular rate. Both of these applications can be used simultaneously to generate both temperature
and simulated data, at different rates, at the same time. The Stargazer application can also be used to configure temperature
reporting as well as analog and digital data.
With these applications you can answer the following questions:
What does real data flow in a network look like?
How fast can a single mote go?
How fast can all motes go? With upstream backbone on?
Remember final data rates depend upon the number of motes, the services each mote is asking for (or base bandwidth in
addition to or instead of services), topology, and path stability, but this tool gives a good sample of the kind of flexibility you
can expect.
SmartMesh IP Application Notes Page of 31 159
Page 32

4 Application Note: How to use Filters in the Subscribe API
4.1 The Subscribe Filter
The API is used to configure which notifications the manager should send to a host application. The list of
subscribe
notificiations is specified in one of two bitmaps:
The bitmap specifies notification to be sent.
filter
The bitmap specifies notifications to be sent using unacknowledged (best-effort) communication. The
unackFilter
manager will send each notification as it is generated, regardless of host behavior. The default behavior is to send
using acknowledged communication, in which subsequent notification packets will be queued while waiting for the
host to acknowledge each notification.
The bits in the bitmap have no meaning unless the corresponding bit is set in the bitmap.
unackFilter filter
4.2 Acknowledged or Unacknowledged?
In cases where the link is unlikely to have errors, the host UART is always available and has sufficient buffers (e.g. when the
host is a PC), or the application can tolerate some lost data (e.g. a missed report does not result in an alarm condition), then
unacknowledged communication may be used for and notifications. Other notifications are far less frequent and
data ipData
more important not to miss, so they should always use acknowledged communications. Unacknowledged communication is
faster than acknowledged, since the inter-packet delay can be as small as a bit-time (~10 µs), and no time is spent sending the
acknowlegement. Given current serial port speeds (115200 bps), it may be necessary to use unacknowledged
communications to maximize Manager data throughput, and you should consider using it when more than 10 packets/s are
being generated.
The acknowledged transfer mechanism ensures that the host receives each packet in the face of certain errors:
framing errors (typically caused when the host is asleep when the packet starts)
bit errors (caused by a link with insufficient SNR, e.g. from a poorly shielded cable)
host out of Rx buffers or isn't ready to receive for another reason
The manager waits 200 ms before retrying each packet. Once a packet has been retried 3 times without acknowledgement, the
manager will consider the session dead, drop the pending packet (and any other queued notifications) and disconnect. The
host will need to re-establish the session as described in the and re-subscribe toSmartMesh IP Manager API Guide
notifications.
The manager will queue a small number of packets before refusing packets from the AP. Depending upon generation rate and
path stability, the network may not be able to tolerate the maximum number of retries on each packet before the motes'
queues will fill and they will begin refusing packets. This may result in lost or stale packets. If the aggregate packet rate is < 1
packet/s, the network will never drop packets due to notification retries.
SmartMesh IP Application Notes Page of 32 159
Page 33

5 Application Note: Monitoring SmartMesh IP Network
Health
LTC5800-based IP networks maintain a minimal set of statistics needed to manage and optimize the network. They do not
aggregate statistics for tracking historical trends, and per-mote granularity is not often available. However, the source of much
of this statistical information, namely raw mote health and state reports, are available in the form of notifications to which the
client application can subscribe in order to provide network health and debugging feedback to the user. Some examples:
By watching state changes, the application can tell if any motes are resetting.
By watching neighbor health reports, the application can make sure that all motes have a sufficient number of good
neighbors for recovery if paths fail.
Additionally, the application can use the manager API to get more information about the network. This document details
several tests that can be continuously run on functioning networks to monitor their health.
This process is broken up into two parts. The first is the set of notifications that the application should be continuously
monitoring upon their output from the manager. The second is a set of API calls that the application should make periodically
to gather the rest of the required information. Ideally, the application is started at the same time as the network and monitors
health for the entire lifetime of the network.
We recommend storing all notification data (perhaps breaking it into daily logs). If storage is a concern, then storing max,
min, and FIR filtered average for each item (e.g. path x RSSI) may be sufficient for providing user feedback.
With LTC5800/590x Managers, Mote IDs are NOT guaranteed to be the same after a manager reset. Your
application will need to match Mote ID to Mote MAC address in case of manager reset if you with to present
consistent lifetime statistics.
5.1 Health Reports
There are three types of Health Report (HR) sent by each mote in the network, and each is sent once every 15 minutes. We
only need to monitor the Neighbors Health Report and Device Health Report. The third type, Neighbors Discovery Health
Report, provides information that becomes more easily accessible through the manager API. The application should monitor
HR notifications as they come asynchronously from the manager.
5.1.1 Neighbors HR
This HR gives us information about all the used paths that the mote is involved in. From this HR, we want to capture:
, , , , . Also note the time stamp on the notification.
neighborId neighborFlag rssi numTxPackets numTxFailures
SmartMesh IP Application Notes Page of 33 159
Page 34

For calculating stability of a path, we are interested in the HR from the child's perspective. A mote is reporting a child path if
=1. In this case, the stability in percent is 100*(1- / ). We want to record this stability
neighborFlag numTxFailures numTxPackets
along with the of this path. We record these two items as a pair for each path.
rssi
5.1.2 Device HR
This HR provides information about the internal operation of the mote. Here we want to pull out values that tell us how
successful the mote was in receiving messages from the application. This will factor into our calculation of overall network
availability later. From this HR, we want to capture: , and .
numTxOk numTxFail
The availability of the mote, in percent, is 100*(1- /( + ))
numTxFail numTxFail numTxOk .
For calculating the overall network availability, define two new variables and initialize them to zero. Call them and
appTxPk
.
appTxFail
To keep a running tally with each Device HR:
+=
appTxPk numTxOk + numTxFail
appTxFail += numTxFail
5.2 Periodic API Calls
We recommend polling the manager every 15 minutes with these API calls to match the period of the HR. Iterate through
starting with 0 for each mote.
getNextPathInfo
5.2.1 getMoteConfig
Store: , ,
macAddress moteId isAP
This command is a convenient way to learn the MAC address for every mote present in the network. Iterate through this to get
all the MAC address/Mote ID pairs by using the flag, and start with a =0 to kick things off. Storing this
next macAddress
address correspondence allows the application to decipher the rest of the health information which can be reported either by
MAC address or by Mote ID. Generally the information returned by this API will not change providing no new motes are added
to the network.
5.2.2 getMoteInfo
Store: , , , , ,
numGoodNbrs requestedBw totalNeededBw assignedBw packetsReceived packetsLost
The information returned by this API is continuously updated by the manager as it receives packets from the mote. Once all
the possible connectivity of the network has been fully discovered, the value will remain static, but optimization
numGoodNbrs
can change the bandwidth distribution requirements throughout the network.
SmartMesh IP Application Notes Page of 34 159
Page 35

For calculating the overall network reliability, define two new variables and initialize them to zero. Call them
networkRX and
.
networkLost
To keep a running tally with each call:
getMoteInfo
+=
networkRX packetsReceived
+= networkLost packetsLost
5.2.3 getNextPathInfo
Store: , , , , , ,
source dest direction numLinks quality rssiSrcDest rssiDestSrc
The manager maintains all of the path information, but only in a coarse and averaged form. You can get all of this information
at a more precise resolution by watching the HR activity.
5.3 Tests
These are the tests that can be run on all the collected data to provide warnings about network health.
The tests below list conditions that should raise warning flags, i.e. you want your network to have any of thesenot
conditions.
To calculate the number of upstream links, look at the reported in each path.
direction
total TX links sums up the of paths with =2
numLinks direction
total RX links sums up the of paths with =3
numLinks direction
total number of parents is the count of paths with =2
direction
5.3.1 For the AP Only
These tests run only on the AP. This device is identified by having the flag set.
isAP
AP Close to Link Saturation
Sum up the on all =3 paths as described above. An AP without external RAM can support 150 RX links, so
numLinks direction
anything above 140 RX links indicates that any additional services are in danger of not being granted. An AP with external
RAM can support 250 RX links, so 230 RX links is a good threshold to raise a warning.
SmartMesh IP Application Notes Page of 35 159
Page 36

5.3.2 Iterate Over All Motes
These tests are run on each mote individually.
Fewer Than 3 Good Neighbors
Every mote in the network should have three "good" neighbors, . having a quality score over 50%. The manager keeps track
i.e
of the count of good neighbors, so verify that the manager reports at least 3 good neighbors for each mote in the
field.
numGoodNbrs
Mote Close to Link Saturation
Sum up the on all paths as described above to add together the number of upstream TX and RX links. Since Eterna
numLinks
motes can store 200 links total, A mote having more than 150 links can indicate a danger of a bottleneck developing.
More Joins than the AP
Count the number of times that a mote has transitioned to the state, and count the same number for the AP. If the moteOper
has joined more times than the AP, it means the mote has reset and rejoined. Mote resets, especially if they happen in groups,
are the biggest indication that there is something wrong with the network, such as interference, motes being too far apart, or a
hardware issue that causes resets.
More than One Single-Parent Mote
There should be exactly one single-parent mote, and this mote should have the AP as its parent. If not, there is insufficient
connectivity for some motes in the network. Consider adding repeater motes near the parents of any other single-parent
motes.
Insufficient Bandwidth
The manager keeps track of the requested and assigned bandwidth for each mote. The bandwidth reported here is the average
time between links on the mote, so a lower number means more links per second. Check to make sure that >
totalNeededBw
assignedBW.
Other tests
Motes also report details about their queue occupancy. This additional data can be used to run more health checks.
The API returns information about average latency. Monitor this over time and flag any case where it rises
getMoteInfo
unexpectedly.
SmartMesh IP Application Notes Page of 36 159
Page 37

5.3.3 Iterate Over All Paths
The HR notifications capture 15-minute snapshots of every path in the network. Iterating over these snapshots can help to
identify bad paths.
Bad Stability-RSSI
Flag any path that has either:
RSSI above -80 dBm and stability < 50%
RSSI above -70 dBm and stability < 70%
These paths lie beneath our prototype RSSI-Stability waterfall curve. If there are occasional outliers here, it is not a large
concern. Consistent points below either threshold for a mote can indicate a hardware problem or interference in the vicinity.
See "Application Note: Identifying and Mitigating the Effects of Interference" for more details.
As we captured the time of the notification from each HR, it is easy to print out the times of the outlier points to see if they are
temporally grouped.
5.3.4 Network Checks
These are properties that can be checked for the network as a whole.
Reliability < 99.9%
The manager maintains a coarse measure of overall reliability, rounded to the nearest percent, in the returned
netReliability
from the API. Often reliability is expressed as a "number of nines" metric, so precise values are required.
getNetworkInfo
SmartMesh networks are designed for three nines of reliability or more.
The total reliability, calculated from our variables above, is 100.0*(1- /( )).
networkLost networkLost + networkRX
Availability < 99%
To get the average availability for the network, take the mean of the per-mote availability measured earlier.
5.4 Graphing
If the application is continuously running, each of the quantities above could be plotted with 15-minute resolution. We have
previously seen daily rhythms in network stability and latency in networks deployed in industrial environments where the
amount of interference and moving machinery varies greatly between the workday and nighttime. Often tracking these metrics
over time is much more revealing than taking a single snapshot.
SmartMesh IP Application Notes Page of 37 159
Page 38

6 Application Note: Data Publishing for SmartMesh IP
This note describes the specific steps required for an OEM microprocessor's firmware application to connect to a mote in the
network and then have it send data over the wireless network. The key concepts from the and SmartMesh IP User's Guide
are brought together here. The User's Guide describes the details of how the mote and theSmartMesh IP Mote API Guide
OEM microprocessor interact and combine to form a system.
6.1 Request and Response Packet Formatting
All packets must use HDLC Encapsulation as described in the . This means that the packet isSmartMesh IP Mote API Guide
preceded and followed by a framing byte 0x7E. A 2-byte frame check sequence (FCS) bytes must be computed for the packet
and appended before the trailing framing byte. Instances of 0x7D and 0x7E in the payload or FCS require escaping, as
described in the Mote API Guide in the "Protocol" section under "Packet Format."
Flag Payload FCS Flag
7E Packet Payload 2 bytes 7E
6.1.1 Header
The payload of both response and request packets begins with a 3-byte header. The first byte indicates the type of command
or notification being sent or responded to. The next byte is the length of the remaining payload (not counting header or
response code). The third byte is a set of flags. A complete description of the header and flags can be found in the Protocol
section of the mote API guide under "Packet Format."
Request
Header Payload
3 bytes Request Payload
Response
Header Response Code Payload
3 bytes 1 byte Response Response Payload
The length byte does not include the 3-byte header, or the response code.
SmartMesh IP Application Notes Page of 38 159
Page 39

1.
2.
3.
4.
5.
6.
6.1.2 Flag Byte
The third byte in the three byte header is the flag byte. The flag byte currently has only 3 usable bits:
: Bit 0 is cleared (0) if the packet is a request and is set (1) if the packet is a response.Bit 0 - Request/Response
Acknowledgement (ACK) packets are response packets and must have this bit set.
For every new request packet by the OEM micro, the packet ID bit must be toggled.Bit 1 - Packet ID:
The SYNC bit must be set (1) on the first request packet OEM micro sends to the mote. It mustBit 3 - SYNC bit setting rule:
be cleared (0) for subsequent requests. The SYNC bit is set (1) on boot event packet, which is the first request packet sent
from the mote to the OEM micro.
6.2 Basic Steps
There are a total of 6 basic steps that the OEM micro needs to perform in order to get the mote to join a network and start
publishing data. The setup of the OEM micro's serial port is a very important first step in order for the rest of the
communication to be successful. To generate sample firmware for a simple publish application, we need only to code these in
order to get the combined micro+mote system to start publishing data. The steps that follow are:
Set up the serial interface
ACK the mote boot event
Perform pre-join mote configuration
Issue command
join
Monitor join progress
Publish data
The communication between the OEM micro and the mote takes place on the API serial port1. Set up the Serial Interface:
using a 4-wire protocol (UART Mode 4: TX, RX, UART_TX_CTSn, UART_TX_RTSn lines) by default. By default, the API port
settings are: baud rate is 115.2 Kbps, 8 data bits, no parity, 1 stop bit.
The baud rate on the LTC5800-IPM can be changed to 9600 if required, by updating the fuse table programming on
the mote.
Whenever the mote is powered up (or reset) it sends a boot event packet on the API port. The2. ACK the Mote Boot Event:
boot event packet is as follows:
7E 0F 09 08 00 00 00 01 01 00 00 00 00 D7 67 7E
SmartMesh IP Application Notes Page of 39 159
Page 40

The mote will continue to send this packet until it is explicitly acknowledged by the OEM micro. If the serial port settings are
correct then the micro should be able to see this packet show up in its receive buffer. If the micro's serial port is configured
incorrectly, one can see this packet on a scope or Logic Analyzer on the Tx pin of the mote. It usually takes about a second
after power up to receive this packet.
The ACK packet for this event is:
7E 0F 00 01 00 FF 57 7E
The OEM micro needs to respond with this packet in order for the mote to stop sending the boot event packet. Responding
with this ACK will move the mote from state 0 ( ) to state 1 ( ).Init Idle
Once the mote boot event has been acknowledged and it is in the state, it is3. Perform Pre-Join Mote Configuration: Idle
ready to join the network. Before issuing the command, you may want to change one or more of the pre-join configuration
join
settings. These settings may be left as the factory default at first, but should be later adjusted for optimal operation. Some of
these configurable parameters are:
< > - The default Network ID is 0x04CD (1229).
setParameter networkId
< >: The default join key is 0x
setParameter joinKey
445553544E4554574F524B53524F434B. For the highest level of
security, each mote should have a unique join key.
< >: Default is or 100% (of 255)
setParameter joinDutyCycle
0xFF
See the Mote API Guide - the "Commands" section details each API, and the "Definitions" section gives the encoding for
arguments.
Assuming it had been set previously to a different value, the packet to change the parameter to 0xFF or 100%
joinDutyCycle
(255) is:
7E 01 02 08 06 FF 2F 60 7E
Header = 01 02 08, so this is the command (0x01), length of payload = 2 bytes (0x02), and the flags byte has bit
setParameter
3 set (SYNC, request, packet ID = 0)
Payload = 06 FF, so this is the being changed (0x06), and the value is 100%, i.e. 255 (0xFF)
joinDutyCycle
Here we have this as the first command sent to the mote, so the SYNC bit is high. If this is not the 1st request
packet the OEM micro is sending to the mote, make sure to unset (bit 3 = 0) the SYNC flag.
The mote will then reply with this response:
7E 01 01 09 00 06 A0 21 7E
SmartMesh IP Application Notes Page of 40 159
Page 41

Header = 01 01 09, so this is the command (0x01), length of payload = 1 bytes (0x01), and the flags byte has
setParameter
bits 3 and 0 set (SYNC, response, packet ID = 0)
Response code = 00, so the command had no errors (0x00)
Payload = 06 , so this is the being changed (0x06)
joinDutyCycle
Now that the pre-join configuration is done, the OEM micro is ready to issue a command to the4. Issue Command:
join join
mote that will prompt it to enter the process of joining a network (specified by its Network ID). Assuming that this is not the
first packet to the mote (Here SYNC=0), the join packet is:
7E 06 00 02 07 33 7E
The mote will respond with an acknowledgement:
7E 06 00 03 00 2C 9D 7E
In the process of joining the mote will send several event notifications to the OEM micro that must5. Monitor Join Process:
be acknowledged. These notifications are as follows:
mote notification:
joinStarted
7E 0F 09 02 00 00 01 00 03 00 00 00 00 C6 DB 7E
OEM micro acknowledgement:
7E 0F 00 03 00 4F 64 7E
mote notification:
operational
7E 0F 09 00 00 00 00 20 05 00 00 00 00 A5 A2 7E
OEM micro acknowledgement:
7E 0F 00 01 00 FF 57 7E
mote notification:
svcChange
7E 0F 09 02 00 00 00 80 05 00 00 00 00 29 7A 7E
SmartMesh IP Application Notes Page of 41 159
Page 42

1.
2.
3.
4.
OEM micro acknowledgement:
7E 0F 00 03 00 4F 64 7E
To send your own packets, you will need to use the command, as described in the 6. Publish Data:
sendTo
SmartMesh IP
. Before you can send data to a particular destination, you must open and bind a socket to the destination. TheMote API Guide
default destination for packets should be the Manager. This process is described in the in theSmartMesh IP User's Guide
"Communications" section.
These steps are:
Call command to open a communication socket - this will give you a for the socket. Currently
openSocket socketID
only UDP sockets are supported.
Call command to bind the socket to a port, the you will use in the command
bindSocket destPort sendTo .
Use command to send data. You will need to specify a , in addition to the
sendTo serviceType, priority, and packetId
payload and socket information. These are discussed in the documentation in the Mote API Guide. Currently
sendTo
only bandwidth (as opposed to latency) services are supported. Repeated calls to can be made on the open
sendTo
socket.
Call command when you will no longer need to send data to that destination. This removes the port
closeSocket
binding and frees any memory associated with the socket. It is not required to close a socket after each packet.
Each step will require that the micro send a packet to the mote and then receiving the acknowledgement.
1. - This will open a UDP socket:Call
openSocket
7E 15 01 00 00 F4 0B 7E
Mote acknowledgement, returning socket ID 22 (0x16):
7E 15 01 01 00 16 B3 6E 7E
2. - While any port can be used, payload is maximized when a port in the range of 0xF0B8-0xF0BF is used.Call
bindSocket
This example will bind the previously obtained UDP socket to port 0xF0B8.
7E 17 03 02 16 F0 B8 D3 9B 7E
Mote Acknowledgement:
7E 17 00 03 00 26 42 7E
SmartMesh IP Application Notes Page of 42 159
Page 43

3. - In this packet, sample data 0xAABBCCDDEE is the to be sent to the manager ( =Call
sendTo payload destAddr
0xFF020000000000000000000000000002) with packet ID 0 (0x0000), See the for details on other fields.Mote API Guide
Note that for a different payload the FCS would be different.
7E 18 1C 00 16 FF 02 00 00 00 00 00 00 00 00 00 00 00 00 00 02 F0 B8 00 00 00 00 AA BB CC DD EE AF
B2 7E
Mote Acknowledgement:
7E 18 00 01 00 7F C3 7E
After you send the packet to the Tx queue, the mote will send a notification indicating when it has finished the transmit. This
will need to be responded to as well.
Mote notification with packet ID 0 (0x0000):
txDone
7E 25 03 00 00 00 00 A4 7B 7E
Micro acknowledgement:
7E 25 00 01 00 02 04 7E
If you set the packet ID in the command to 0xFFFF, a notification packet will not be generated.
sendTo txDone
4. - When you are done sending messages to this destination, it is recommended that you close the socketCall
closeSocket
you were using. This is more common when the communications is in response from an message from an internet host,
where a finite "transaction" is taking place. For a sensor configured for periodic publishing, the socket would only be closed
should the micro need to reset.
This can be done with the command as follows:
closeSocket
7E 16 01 02 16 3E 68 7E
Mote acknowledgement:
7E 16 00 03 00 8D 5E 7E
SmartMesh IP Application Notes Page of 43 159
Page 44

6.3 Next Steps
Now that you have successfully sent a data payload to the manager you can look at the mote API guide for more commands
and detailed descriptions of customization options.
Test Radio Commands - these can be used for manufacturing tests to verify the top level assembly, e.g. that the
antenna has been properly connected.
The test radio commands ( and ) are described in detail in the . .
testRadioTx testRadioRx
SmartMesh IP Mote API Guide
Bandwidth Service
Once , the mote is available to send the data through the wireless network. By default, an IP network is
operational
configured such that every mote can publish data at 9 second intervals (the for an IP network) without
base bandwidth
requesting a service. If this will always be sufficient, the OEM micro need not request any services from the manager.
Should the application require sensor data (like temperature, humidity, voltage, current) faster than every 9 s where all
motes publish at the same rate, it is a network, and base bandwidth may be increased. If the
homogeneous bandwidth
application calls for publishing data at different rates for different devices, this is a network
heterogeneous bandwidth
and all devices should request services. We recommend that OEM integrators always use services, since they are
simple to implement and offer the most flexibility. Services are discussed the "Services" section of the SmartMesh IP
, and "Bandwidth and Latency" section of the .User's Guide SmartMesh IP User's Guide
Sockets and UDP ports
These are discussed further the "Communication" section of the .SmartMesh IP User's Guide
SmartMesh IP Application Notes Page of 44 159
Page 45

7 Application Note: Managing Advertising in an LTC5800-IPR
Based Network
Unlike the WirelessHART managers, the LTC5800-IPR based managers do not control advertising in response to network
conditions. Advertising costs each mote ~14 µA average current, which can be significant to low-traffic motes. The
LTC5800-IPR presents a API for enabling/disabling advertising, so on cases where this is overhead is
setAdvertising
unacceptable, the host application can implement the logic to control advertising. This application note presents an example
state machine for this purpose.
When advertising is off, new motes, or motes that have gone , cannot find and join the network. For that reasonLost
we recommend leaving advertising on.
7.1 Advertising State Machine
Advertising comes on automatically when the manager starts. If is enabled, this is when the manager resets
autoStartNetwork
or powers on. If is disabled, then this is when the command is issued by the host application.
autoStartNetwork startNetwork
The state machine should have the following logic:
Leave advertising on when no motes are present - until there is a event for a device other than the
moteOperational
AP, advertising should be left on. Waiting for the notification (rather than ) ensures that a
moteOperational moteJoin
mote that starts but fails to complete joining will still be able to hear the network.
Deactivate after the "last" mote has joined - there should be a suitable timeout after the last event, e.g.
moteOperational
1 hour.
Reactivate when a mote is lost - advertising should be restarted when either a or event is
moteLost moteReset
generated.
Deactivate when no lost/reset mote joins within a timeout - for lowest power operation, there should be a suitable
timeout after the last or event, e.g. 1 hour. Note that a lost device that doesn't rejoin within this
moteLost moteReset
timeout will not be able to rejoin until advertising is re-activated for another reason.
Reactivate advertising when a user wants to add more motes to the system.
SmartMesh IP Application Notes Page of 45 159
Page 46

8 Application Note: Configuring Networks for Short-term
Data Bursts
8.1 Introduction
All SmartMesh Managers have a variety of configuration “knobs” that can be used to adjust key network performance metrics
such as average mote power and message latency. There may be several different ways to tune a network to solve a particular
problem – this document presents an example network, and examines the effect of configuration changes on performance
metrics. We start by presenting the requirements for the network and then detail five different ways that the network can be
adjusted all with their own pros and cons for the application.
Power calculations are done with the “32 mote small cloud network” setting in the SmartMesh Power and Performance
. This network has three hops with 16x 1st-hop, 10x 2nd-hop, and 6x 3rd-hop motes. The rest of the parameters areEstimator
left as default (80% stability, 80 B payloads).
8.1.1 Network Requirements and Service Requests
The network under consideration is a 32-mote SmartMesh IP network. Here is an explanation of all the requirements:
Half of the motes are within radio range of the Manager – “1-hop” motes
All motes report one packet every 5 seconds
Occasionally, motes will generate "bursts" of data at 1 second intervals
Settings should work for 80% stability, typical of an indoor deployment with moderate interference and/or multi-path
fading
The customer has turned off advertising to save power - advertising management is discussed at the end of the
analysis
In each of the following 5 network configurations, we adjust the settings a little to provide slightly different performance and
discuss the tradeoffs. We are going to focus on the response to the data bursts which are the unique element in this analysis.
In each configuration, the manager provides at least enough bandwidth for regular network operation with 5 second reporting,
the configurations differ in if/how the network responds dynamically to the data bursts.
8.2 Network 1: Base Configuration
Network
Upstream slotframe size: 256 (nominal)
Downstream slotframe size: 256 (nominal)
SmartMesh IP Application Notes Page of 46 159
Page 47

Base bandwidth: 5000 (ms) - this has been changed from the default 9000 ms to accommodate the heterogeneous 5 s
publish rate. This can be done through the CLI , or through the API.set config basebw
setNetworkConfig
Customer Sensor Processor
Publish interval: 5 sec - devices are not expected to request services to get to this service level, since it is done with
base BW.
Burst interval: 1 sec
Expected Average Performance Metrics
Latency by hop in seconds: [0.3, 0.8, 1.5]
Power by hop in µA: [62, 47, 29]
Upstream TX by hop per second: [2.5, 1.5, 1.0] link/s
Upstream traffic by hop per second (scaled by stability): [0.65, 0.40, 0.25] pkt/s
Downstream traffic (scaled by stability): 0.4 pkts/s
If we want to start sending from a given mote at 1 pkt/s instead of 5 pkt/s, we need to determine if the allocated base BW links
can support it. As long as the links/s > packets/s, we can support it for a short period providing that the stability on the used
paths in the network remains relatively constant.
For 1-hop motes, normal provisioning should allow it. Upstream traffic is now 1.65 pkt/s, below threshold of 2.5 link/s.
Latency will remain at 0.3 s
For 2-hop motes, normal provisioning should allow it. Upstream traffic is now 1.4 pkt/s, below threshold of 1.5 link/s.
Latency will remain at 0.8 s
For a 3-hop mote, upstream traffic increases to 1.25 pkt/s with stability, so there are not enough TX links/s (namely
1.0) to support it. Application will get throttled to 0.8 pkt/s real output, and latency will increase as packets back up.
Changes to path stability could result in 1st and 2nd-hop motes being under-provisioned. In this example, dropping to 60%
puts the 2-hop mote in jeopardy. We would recommend that the sensor processor request a 1 s service before publishing at
that rate, and remove it when finished.
SmartMesh IP Application Notes Page of 47 159
Page 48

1.
2.
3.
4.
5.
The algorithm is as follows:
Sensor processor requests 1 s service, if possible about 10 s before the burst starts
Sensor processor immediately starts publishing at burst rate
Sensor sends at the burst rate until it is held off by the mote, at which point the sensor processor follows
recommended backoff guidelines (see Services for details)
When the service request is granted, sensor processor can resume full speed
After burst is complete, delete the 1 s service
We would expect the additional links supporting the service to be able to be added within 7.5 s of the request under these
conditions. In some cases the burst traffic will be done by the time the mote gets the extra links added. If this happens, the
mote sends the service delete command anyway.
Here is how the process looks in time.
Figure 1. The sequence of packets through a burst period for a mote. Prior to the burst the mote is able to transmit packets as
quickly as the application can hand them over. When the burst mode begins, the mote starts to NACK the application which
needs to throttle in response. After the mote gets new links in response to the service request, the application can send the
burst packets as quickly as it can generate them.
SmartMesh IP Application Notes Page of 48 159
Page 49

8.3 Network 2: Longer Downstream Slotframe
To save power, the user can control the size of the downstream slotframe. This lowers average current, since downstream idle
listens are reduced, but it also reduces downstream bandwidth, since there are fewer links/s.
Network
Upstream slotframe size: 256 (nominal)
Downstream slotframe size: 1024 (longest) - this can be done through the CLIset config dnfr_mult
command, which requires a reset to take effect, or through the API followed by reset or the
setNetworkConfig
API.
setDownstreamFrameMode
Base bandwidth: 5000 - same as Network 1 configuration
Customer Sensor Processor
Publish interval: 5 sec
Burst interval: 1 sec
Expected Average Performance Metrics
Latency by hop in seconds: [0.3, 0.8, 1.5]
Power by hop in µA: [54, 39, 21]
The upstream latency and steady-state behavior is identical to the base configuration except that we can inject fewer packets
downstream - 0.1 pkt/s. To add the links for burst mode it then takes 30 s. The backup of burst packets will vary according to
hop, but if the sensor is able to detect a burst before it happens, additional services should be requested earlier when the
downstream slotframe is longer.
SmartMesh IP Application Notes Page of 49 159
Page 50

8.4 Network 3: Higher Power, Low Latency
We had assumed that bursts were uncorrelated - they were infrequent enough that only one mote was bursting at a time. We
now change the network to support all motes bursting simultaneously.
Network
Upstream slotframe size: 256 (nominal)
Downstream slotframe size: 256 (nominal)
Base bandwidth: 1500 - we've now increased base bandwidth such that every mote can burst simultaneously
Customer Sensor Processor
Publish interval: 5 sec
Burst interval: 1 sec
Expected Average Performance Metrics
Latency by hop in seconds: [0.3, 0.6, 1.2]
Power by hop in µA: [68, 51, 29]
Here we have provisioned the network so that everyone can send packets every second at the same time, but the power is
calculated assuming all motes are publishing at the 5 s rate - this assumes that the bursts are short enough to not affect
average power much. The advantage here is that there is no waiting period for service approval and link addition during burst
times and that any number of bursts can occur safely in parallel.
Note that there is no increase in power at the 3 hop motes as they are only adding TX links. Links assigned for TX do not
rd
cost energy unless they are used to actually transmit packets, and these motes are not transmitting more packets, they are
just getting more frequent opportunities to transmit them. Links assigned for RX cost energy whether a packet is received or
not, so we see power increases in both the first and second hop motes.
This setup nears the AP RX link limit, so we can't assign much more bandwidth to the network.
SmartMesh IP Application Notes Page of 50 159
Page 51

8.5 Network 4: Backbone Example
Network
Upstream slotframe size: 256 (nominal)
Downstream slotframe size: 256 (nominal)
Base bandwidth: 5000
Upstream 64-slot backbone slotframe (0.464 s) - configured using the and set config bbmode set config
CLI commands, which requires a reset to take effect, or through the API followed by reset.bbsize
setNetworkConfig
Expected Average Performance Metrics
64-slot upstream backbone costs 15 µA, but only at parents
Latency by hop in seconds: [0.2, 0.4, 0.6]
Power by hop in µA: [77, 62, 29]
The backbone is a contention-based frame in which motes share transmit opportunities similar to a slotted version of a ZigBee
network. In our networks, the backbone works in parallel with the dedicated bandwidth assigned in the network. The downside
to the backbone is that all parent motes listen the same amount - this is a different situation than our usual link
cascading
wherein motes closer to the AP end up listening more because they forward more descendant traffic. We find that the
backbone is a great option when all parents are line-powered and we need very low-latency on packet bursts or alarms. In this
case we can put in a very short backbone frame, one or two slots long, because parent motes are not power constrained.
However, we can also put in a lower-power backbone, like the one that we would need to use in this power-constrained
network, that has a power comparable to Network 3.
With our 64-slot upstream backbone, we have enough reserve bandwidth to carry the extra traffic when any single motes
starts bursting unannounced. Additionally, the backbone will reduce the mean latency for all motes during normal operation.
Just like regular upstream TX links, the backbone does not cost the leaf motes any extra power. We still recommend that the
backbone be used in tandem with the service request model. In this case the backbone links provide a bridge which allows
about one mote at a time to burst packets immediately without having to throttle the application. As long as these burst events
are separated by 7.5 seconds for a 256-slot downstream frame or by 30 seconds for the 1024-slot downstream frame, the
combination of the backbone and service link additions allow unimpeded publishing.
When we compare the latency and power results to Network 3, the backbone links can be used to decrease latency a little
more than is available through dedicated bandwidth alone at the cost of a little more power. However, note that Network 3
allowed motes to burst simultaneously and not have to request additional services. all
SmartMesh IP Application Notes Page of 51 159
Page 52

8.6 Network 5: Star Network
Network
Upstream slotframe size: 256 (nominal)
Downstream slotframe size: 1024 (longest)
Base bandwidth: 5000
All motes designated non-routing - this is configured on the mote using the API.
setParameter<routingMode>
Customer Sensor Processor
Publish interval: 5 sec
Burst interval: 1 sec
Expected Average Performance Metrics
Latency by hop in seconds: [0.7]
Power by hop in µA: [19]
To get the absolute lowest power network, we can make all motes “non-routing”. This means they are unable to accept
children and the network gets built as a star topology with the AP as the only parent for all the motes. No multi-hop networks
are possible, all motes must be placed and remain within range of the AP. In this setting, all motes will use about 19 µA. This
is only 2 µA less than the leaf nodes in the mesh Network 2. To look at this in terms of lifetime, we can again use the Power
and Performance Estimator this time on the "Battery Life" tab. As an example with the a CR2450 coin cell, a non-routing mote
lasts 3.1 years versus a 2.8 year lifetime for the more reliable solution in Network 2.
By making this restriction, motes can reset when a single path fails, and since motes have only one choice for this parent
path, this will be much more frequent than in the mesh case. Because of the single point of failure for each mote, we would
not recommend this configuration for entire networks. Setting motes to non-routing is recommended for heterogeneous
networks where most of the motes have routing-level battery capacities and a few motes are severely power-limited because
they use a scavenged energy source. In such a network, the routing-enabled motes can provide a multi-hop mesh and the
scavenging non-routing motes can be as low power as possible.
SmartMesh IP Application Notes Page of 52 159
Page 53

8.7 Advertising Management
The application is responsible for controlling advertising in IP networks. For a mote to initially join during the building phase
or to rejoin if it goes lost during steady-state operation, it needs to be in range of neighbors that are actively advertising.
During periods when all motes are safely in the network, which is the vast majority of the time, advertising can be deactivated
to reduce power. Here is a simple algorithm for how this can be controlled:
Start the network with advertising on and keep it on if no motes join
Turn advertising off when:
All motes have joined
OR one hour after the last mote joined
Turn advertising on when:
Any mote goes lost
Turn off again when this mote rejoins
Manual indication that a new mote will be joining
Turn off again when new motes have joined
For the power numbers in this app note, we assume that advertising has been deactivated. During active advertising, motes
use an extra 14 µA. For many customers, this additional power is not significant enough to warrant the additional logic
required to control advertising in the application. Let's take a 1-hop mote from Network 2 which uses 54 µA with advertising
off and 68 µA with advertising on. Again using the Power and Performance Estimator on the "Battery Life" tab, if this mote
uses a single Tadiran AA battery, this is the difference between a lifetime of 4.6 years and 3.6 years.
SmartMesh IP Application Notes Page of 53 159
Page 54

9 Application Note: How to Get Redundancy in an IP Network
Motes in a mesh network are inherently redundant in that if one fails, another can automatically take over its traffic load.
Where each sense point is critical, multiple motes can be used to measure the same point. But what happens if the device
manager or AP go down?
Some SmartMesh WirelessHART Managers offer failover – a slave manager communicates over a dedicated
cold heartbeat
serial port, and stands by to take over the network should the master fail. This approach requires that the network reform with
the slave manager running the show, and that the managers be roughly collocated. Unfortunately, cold failover is not available
on the single-chip SmartMesh IP manager.
Separating two managers reduces the risk that both are damaged at the same time - this is a benefit in applications such as
fire alarms. This can be done with either SmartMesh IP or SmartMesh WirelessHART networks to achieve redundancy by
physically separating the two managers and spreading the motes out evenly into the two networks.
For cost-sensitive applications, a single mote monitors each sense point. Configure both managers on the same Network ID,
and include all the motes on each manager's access control list. The proviso in this scenario is that there needs to be
sufficient density so each mote will be well connected regardless of which network it winds up in. Some motes will join one
manager, some the other - it is the responsibility of the host application to synthesize both data streams, and to keep track of
which manager to use to communicate with a particular mote.
For maximum redundancy at increased cost, each sense point is assigned a pair of motes. Each of the two managers gets a
separate Network ID, and each pair has one mote for each network. If one manager fails, all the motes belonging to this
manager will be lost but each mote's twin will still report data to the remaining manager. This scenario requires that the
application can deal with two reports for every sense point while both managers are functioning.
SmartMesh IP Application Notes Page of 54 159
Page 55

10 Application Note: Using the Powered Backbone to
Improve Latency
10.1 Introduction
All SmartMesh managers have a variety of configuration that can be used to adjust key network performance metrics
knobs
such as average mote power and message latency. There may be several different ways to tune a network to solve a particular
problem – this document presents the Powered Backbone feature in SmartMesh IP and details when it should and should not
be used in networks. Typically just called the backbone for short, this slotframe enables low-latency communication either
upstream or in both directions. The upstream communication comes without additional energy costs at unpowered devices
while enabling a bi-directional backbone requires increased power at all devices.
Limitations:
In the current version of the SmartMesh IP products, there is no way to have a downstream-only backbone.
The backbone mode and size are chosen before booting up the manager and cannot be changed without a manager
reset.
Power source settings presented at mote join determine backbone behavior - changing power source settings after
join will not affect the backbone behavior once assigned.
Example Power calculations in this document are done with values from the .SmartMesh Power and Performance Estimator
10.1.1 General Motivation
The backbone was developed to achieve ZigBee-like low-latency upstream. In ZigBee networks, the routers are powered and
all devices have to be within range of a router. In a SmartMesh IP network with the upstream backbone active (set using
= 1), any mote can transmit in any slot provided it has a parent that is a powered node.
bbmode
The powered nodes, if they themselves are not transmitting in a slot, will listen for packets from their children. As a
consequence, unpowered devices will have a lot of idle TX events which do not cost any energy when using Eterna motes.
Powered devices have a lot of idle RX events, and these do use energy because the radio has to activate in receive mode to be
ready if a packet does come in. The upstream backbone could be set on a longer slotframe length, but we will see below that
most applications work best when the backbone has a minimum-length 1-slot slotframe. The length is set through the
bbsize
parameter and the allowed values are 1, 2, 4, and 8 slots.
SmartMesh IP Application Notes Page of 55 159
Page 56

The downstream backbone works in a similar way, except now devices need to listen and use energy. When theall
bi-directional backbone is active (set using = 2), even slots are used for the upstream backbone and odd slots are
bbmode
used for the downstream backbone. This even/odd separation ensures that traffic does not collide between the two directions
which is critical for call-response traffic in imperfect RF environments. Dust command traffic does not use the downstream
backbone, it is reserved for user traffic. The only bi-directional backbone length supported is 2 slots long.
All backbone activity happens on shared links. In parallel, the rest of the network continues to operate on higher-priority
dedicated links. The backbone links are on a different channel offset than all other activity so even though traffic on the
backbone might collide with other backbone traffic, it does not impact the reliable communication that still occurs on the
dedicated links. Under no circumstances will the backbone decrease the overall reliability or increase the latency of a network.
10.1.2 Settings to Enable RX in the Upstream Backbone
SmartMesh IP motes report their maximum steady state current in their join request packet in the field in the
maxStCur
structure. The manager uses the highest setting, 0xFFFF, as the flag for enabling a mote to have RX links in the
powerSrcInfo
upstream backbone. This highest setting must be provided by the sensor application and should only be used if the mote truly
is powered or has a very large battery supply, since motes with receive links in the backbone can draw > 1 mA. For simplicity,
we will refer to motes with = 0xFFFF as motes. All motes are permitted to have TX links in the upstream
maxStCur powered
backbone, but only powered motes will be given RX links. A node is considered "powered" if the field in the
maxStCurrent
API is set to 0xFFFF, any other setting is unpowered. By default, nodes ship with maxStCurrent
setParameter<powerSrcInfo>
= 0xFFFE, which allows the manager to add links as needed without invoking the backbone - such a device will likely see < 500
µA average current in the busiest of networks. The distinguishing behavior of a powered node is that it gets receive links in the
upstream backbone slotframe, there is no other difference between the schedules of powered and unpowered nodes.
10.2 Application 1: Low-latency Alarms
Network
Backbone mode : 1
bbmode
Backbone slotframe size : 1
bbsize
Expected Average Performance Metrics
Latency: about 15 ms per hop
Additional power at leaf nodes: none
Additional power at routing devices: 925 µA (1-slot backbone)
Total traffic limit: about 45 pkt/s
SmartMesh IP Application Notes Page of 56 159
Page 57

For a low-latency alarm network, we need to make sure that each unpowered mote is in range of a powered mote. The
powered motes then form the backbone and any mote is at most one hop away from this backbone. As such, everypowered
mote can transmit in any slot. If the transmission fails, the transmitting mote assumes that the failure was due to a packet
collision since the backbone slots are shared. The mote has a random exponentially increasing backoff to correctly use this
contention-based set of links. There is nothing preventing the backbone from extending multiple hops from the AP. Taking
average stability and the backoff mechanism into account, the mean latency per hop will be about 15 ms, or two slots.
However, because the backbone can have collisions, the application must be able to tolerate the latency delivered by the
parallel dedicated links in the worst case.
For routing purposes, the dedicated upstream and backbone links are treated equally. If a mote has an upstream packet and a
dedicated upstream link to its parent in the next slot, it will transmit the packet on the dedicated link rather than the shared
backbone link, and the parent will also listen on the dedicated link. This will necessarily be on a different channel offset so
another child of the same parent trying to transmit on the backbone link will not collide with the first transmission. Similarly, if
a mote has any other link, such as a join listen link or a downstream RX link, it will service this instead of servicing the
upstream backbone link. Also, a packet going multiple hops could end up traveling some hops on dedicated links and some
on the backbone links. All of this will happen as a random result of which link is available first for the mote and if any backoff
occurs.
A mote will only have one backbone parent at a time, this will be one of the (usually two) upstream parents. The backbone
links are not used to determine path failure, but if a path failure is detected on the dedicated links to the backbone parent, the
mote will automatically start using the backbone to the second parent. The dedicated links were being used all along to this
second parent, but the application again needs to be tolerant of longer-latency periods during path failures.
The upstream backbone is most enabling for a network that does not send much data but needs low latency when it does
generate packets. For a 30-mote network with an average latency requirement below 100 ms, there just aren't enough slots at
the AP to provide this with only dedicated links. If power is a concern, a longer setting of 2, 4, or 8 slots can be used.
bbsize
These reduce the routing device power, and increase latency, correspondingly.
10.3 Application 2: Call and Response
Network
Backbone mode : 2
bbmode
Backbone slotframe size : 2
bbsize
Expected Average Performance Metrics
Round-Trip Latency: about 60 ms per hop
Additional power at leaf nodes: 462 µA
Additional power at routing devices: 925 µA
Total traffic limit: about 20 pkt/s
SmartMesh IP Application Notes Page of 57 159
Page 58

When sending packets to a single destination, the default SmartMesh IP network restricts packet ingress (downstream) to one
per slotframe. With imperfect stability, this is less than one packet per two seconds. For applications with faster downstream
requirements, the bi-directional backbone can be used. Contrary to the upstream backbone, the downstream backbone is not
routing-equivalent. Internal command traffic does not use the downstream backbone links, and when the downstream
backbone is active, user traffic is restricted to only use the downstream backbone.
In order to make the Application Layer timeouts agree with non-backbone networks, only the 2-slot bi-directional backbone is
available. This bi-directional backbone consumes at least 462 µA at all devices, and an additional 462 µA if the device happens
to be an upstream router. As a rule of thumb, a packet should be able to go from the AP to a mote, and the response should
come back in about 60 ms per hop. Again, this is an average time and applications need to be able to tolerate outliers which
are more severe for motes at deeper hops. While the application is waiting for a response from one mote, it is safe to initiate a
call to another mote as the packets can travel in parallel through the network. When parallelized, the fastest bi-directional
backbone can support about 20 call and response pairs per second.
10.4 Application 3: Lower Latency in All Low-Traffic Networks
Network
Backbone mode : 1
bbmode
Backbone slotframe size : 1
bbsize
Expected Average Performance Metrics
Latency from one-hop motes: about 15 ms
Additional power at motes: none
If the AP is not a power-constrained device, the upstream backbone can be used to decrease overall network latency without
any increase in power at the motes. This is done by activating the upstream backbone and marking the AP as the only
powered device. Consequently, only the one-hop children motes of the AP will have the backbone TX links, and remember that
these do not cost the mote any energy when unused. Any one-hop mote that either generates a packet or receives one from a
child is able to forward the packet on to the AP in the following slot. The latency in multi-hop networks will remain the same
up to the first hop of the network, but since all packets must pass through the one-hop ring, all motes should see a decrease
in their average latency with the upstream backbone active.
If there is significant traffic in the network (> 15 pkt/s total), there will be contention for the backbone links and transmissions
will collide. The increased number of retries resulting from these collisions does impact the power at the 1-hop motes, though
it does not decrease the throughput or increase the latency. For power-sensitive applications, we recommend using this 1-hop
backbone only if traffic is known to be low.
SmartMesh IP Application Notes Page of 58 159
Page 59

10.5 Unsuitable Use of Backbone 1: Replacing Dedicated Links
Network
Backbone mode : 1
bbmode
Backbone slotframe size : 8
bbsize
Expected Average Performance Metrics
Additional power at leaf nodes: none
Additional power at routing devices: 116 µA
Having read all of the above applications, it may be tempting to use the backbone for everything. However, there are certain
cases where the backbone is higher power and higher latency than the equivalent set of dedicated links. For example, suppose
the network doesn't have any truly powered motes but we want to reduce the upstream latency a little from what we have
observed in networks using only dedicated links. So we decide to report that all motes are in fact "powered" and increase the
size of the upstream backbone to 8 slots with the idea that we can tolerate the extra 116 µA that this is going to cost at any
mote with a child.
The inefficient part about the upstream backbone in this case is that the motes with children are having to listen as much as
the AP to the backbone links, exactly once per 8 slots. When we assign cascaded dedicated links, no mote will end up with as
many links as the AP. Since it is the idle RX links and not the idle TX links, an efficient network puts as much of the burden as
possible on the AP. For the 116 µA that it costs, the same network could be built with a faster base bandwidth that would
result in lower overall latency. And better yet, the trick discussed in Application 3 above can be used to further reduce the
latency in this network for free.
In fact, if you are tempted to use an upstream backbone that is not the minimum length, you should carefully consider your
options.
10.6 Unsuitable Use of Backbone 2: High-Traffic Networks
Network
Backbone mode : 1
bbmode
Backbone slotframe size : 1
bbsize
30 pkt/s total traffic to the Access Point
100 motes
Expected Average Performance Metrics
Additional power at nodes: up to 120 µA
SmartMesh IP Application Notes Page of 59 159
Page 60

Remember that dedicated links take priority over the backbone links. If the network is busy, the Access Point will have
dedicated links in most slots to receive the upstream traffic. Because the motes do not know the Access Point's full schedule,
they will often transmit and fail on a backbone link which the Access Point is busy listening on a dedicated link. If there are
several motes contending for the backbone bandwidth in this way, then even with backoff, most backbone transmissions will
fail. If the mote is sending full-sized packets, all of these failures could result in spending up to 120 µA in extra transmit
attempts. This may not be a huge penalty for a routing device, but it can be serious for a low-power device that is expected to
use 30 µA total. This scenario may arise as a network grows - a network that starts out with a small number of motes
reporting infrequently would see a huge latency improvement with the backbone, but as additional faster-reporting motes are
added, the latency benefit to these original motes will decrease, and the backbone links that were originally free could now
come at significant cost due as they repeatedly fail. Also note that the network would need to be reset in order to deactivate
the backbone in such a scenario.
As stated in Application 3, the 15 pkt/s threshold is a good rule-of-thumb for deciding when the backbone will be beneficial or
problematic. Again, having the backbone active will not increase the packet latency or decrease reliability in this busy network,
it will just have a power penalty for the affected motes.
Backbone failures count as packet failures, so path stability values reported by motes in an overused backbone network will be
very low. Watch for stability values below 50% to help diagnose this issue. These affected paths will be most apparent when
drawing the RSSI-stability waterfall curve.
SmartMesh IP Application Notes Page of 60 159
Page 61

11 Application Note: Building a Mesh-of-Meshes
11.1 Introduction
LTC5800-IPR-based networks can be configured as a collection of subnets to create very large deployments even with
per-network limits of 32 or 100 motes. The low cost of a chip-scale manager makes this deployment
mesh-of-meshes
affordable.
Backing up to what is considered a "normal" deployment: each network is deployed independently, and each manager is
connected to a host application. These host applications can be running on separate computers connected to a WiFi or
Ethernet campus network. This is illustrated in Figure 1.
Figure 1 - A deployment with several independent wireless data networks.
SmartMesh IP Application Notes Page of 61 159
Page 62

In some application scenarios, having a number of managers spread around a deployment can be problematic. In the
mesh-of-meshes, one wireless network acts as the backhaul for a number of other wireless networks. This is illustrated in
Figure 2, which also highlights the devices that run the standard SmartMesh IP manager and SmartMesh IP mote firmware,
and the devices which run custom firmware.
Figure 2 - A Mesh-of-Meshes deployment.
This application note details the advantages and limitations of building a mesh-of-meshes, and discusses the important
considerations when building such a network.
Using the mesh-of-meshes setup has the following advantages:
Only a single host application is needed.
The receives data from all .
Host Application Data Motes
SmartMesh IP Application Notes Page of 62 159
Page 63

The can send data to all .
Host Application Data Motes
The receives health reports and statistics information from the Wireless Backhaul Network and from
Host Application
each Wireless Data Network.
However, there are some trade-offs:
The maximum payload length from the is reduced by 8 bytes.
Data Motes
Source and destination UDP ports of data packets need to be the same.
UDP port cannot be used by an application.0xf0bf
Two separate security sessions are used for upstream and downsteam data: one between the and
Backhaul Manager
, another between the and . This means that there is no end-to-end security
Backhaul Mote Data Manager Data Mote
session between the and the .
Backhaul Manager Data Mote
Communication between the and on a bridge device is done in-the-clear over a serial
Backhaul Motes Data Manager
connection. Physical access to a bridge device allows man-in-the-middle attacks.
A is unaware that upstream and downstream data is tunneled through the Wireless Backhaul Network.
Data Mote
Only unicast transmissions are supported. Broadcast and reliable broadcast are not supported.
Because of the design of the tunneling protocol, the loses the network layer timestamp of the data
Host Application
received from the Wireless Data Networks.
11.1.1 Tunneling
Figure 2 is an example of a mesh-of-meshes. It consists of a single connected to a . The
Host Application Backhaul Manager
is the single ingress/egress point of data coming from and sent into the mesh-of-meshes. The
Host Application Host
receives upstream data, and is responsible for sending data downstream. The Wireless Backhaul Network contains
Application
"bridge" devices consisting of a connected to the serial API of a .
Backhaul Mote Data Manager
Sending data downstream to a is done is two steps. When the in Figure 2 sends data to
Data Mote Host Application Data Mote
B1, it sends the packet to A2, indicating inside the packet that the data is really meant for B1. This
Backhaul Mote Data Mote
requires A2 to understand that the data is not meant for itself, and relay the packet to B1. This
Backhaul Mote Data Mote
process is common in networking and known as "tunneling".
11.1.2 Backhaul Bridge
A bridge device contains a connected to a . Two setups are possible, as illustrated in Figure 3.
Backhaul Mote Data Manager
SmartMesh IP Application Notes Page of 63 159
Page 64

1.
2.
Figure 3 - Setups for the backhaul bridge.
The runs custom firmware, allowing it to communicate with the over the 's
Backhaul Mote Data Manager Data Manager
serial API.
An external micro-controller is connected to serial API of both the and , both of which
Backhaul Mote Data Manager
running unmodified firmware.
This Application Note describes case (1). While not detailed in this application note, the discussions and technical solutions
can be generalized to case (2).
11.1.3 Backhaul and Host Applications
The runs custom firmware to support tunneling of packets to/from its . We will refer to this as
Backhaul Mote Data Manager
the . The :
Backhaul Application Backhaul Application
Interacts with the over the 's serial API.
Data Manager Data Manager
Subscribes to all notifications from the . It subscribes using the "unacknowledged" filter to prevent
Data Manager
timeout problems on the 's serial API.
Backhaul Manager
Gathers the list of motes in the 's subnet, and sends that information to the (see the
Data Manager Host Application
description of the discovery mechanism below).
Relays tunneled downstream data to the appropriate destination over the 's serial API.
Data Mote Data Manager
Relays upstream data received over the 's serial API to the using the tunneling
Data Manager Backhaul Manager
protocol.
Relays health reports received over the 's serial API to the using the tunneling
Data Manager Backhaul Manager
protocol.
SmartMesh IP Application Notes Page of 64 159
Page 65

Requests a service to the representative of the aggregate of the services requested by the
Backhaul Manager Data
to the it is connected to.
Motes Data Manager
The host application:
Listens for discovery packets and maintains a routing table which indicates, for each , which
Data Mote Data Manager
it is connected to.
Routes downstream data for a through the appropriate using the tunneling protocol.
Data Mote Data Manager
De-capsulates upstream data from a .
Data Mote
11.2 Tunneling Protocol
This tunneling protocol described in this section allows the following flows, illustrated in Figure 4:
: the sends data to the through the Wireless Backhaul Network.Downstream data
Host Application Data Mote
: the sends data to the through the Wireless Backhaul Network.Upstream data
Data Mote Host Application
: the sends a request to the . Different types of request exist.Request
Host Application Backhaul Mote
: the sends a response to the . Different types of responses exist.Response
Backhaul Mote Host Application
SmartMesh IP Application Notes Page of 65 159
Page 66

Figure 4 - The different flows handled by the tunneling protocol.
The tunneling protocol uses two mechanisms:
It reserves the use of a UDP port ( ) for tunneling operation. Any packet sent over the Wireless Backhaul0xf0bf
Network with source or destination UDP port set to indicates that the packet is part of the tunneling protocol.0xf0bf
For data transmission, the data is prepended with the 8-byte MAC address of the .
Data Mote
For request/response interactions, dispatch bytes indicate the packet type.
11.2.1 Downstream Data
Downstream data is sent by the to a particular . We use Figure 4 to illustrate this data flow. We
Host Application Data Mote
assume that the is asked to send some data to B1 on UDP port .
Host Application Data Mote
P
SmartMesh IP Application Notes Page of 66 159
Page 67

At the :
Host Application
The transmission is aborted and the appropriate error returned if at least one of the following conditions is
true:
The source and UDP destination ports are different.
The destination MAC address is not present in the routing table.
The length of the data plus 8 is larger than the maximum data length.
The retrieves the MAC address of the that the destination is
Host Application Backhaul Manager Data Mote
attached to; in our case A2.
The issues a command to the with the following parameters:
Host Application sendData Backhaul Manager
is set to A2.
macAddress
is set to Low.
priority
is to set to .
srcPort
P
is set to .
dstPort
0xf0bf
is set to 0.
options
is set to the concatenation of the MAC address of the destination (8 bytes), and the
data Data Mote
data.
At the :
Backhaul Mote
The has previously opened and bound a socket to port . Any packet received on that
Backhaul Mote
0xf0bf
port is part of the tunneling protocol.
The packet is silently dropped if its length is less or equal than 8.
The received payload is split in two parts:
The first 8 bytes is the MAC address of the destination .
Data Mote
The remainder is treated as an opaque string of bytes, and called "data" below.
The issues a command to the with the following parameters:
Backhaul Mote sendData Data Manager
is set to the MAC address of the destination , here B1.
macAddress Data Mote
is set to Low.
priority
is to set to the source port of the received packet, here .
srcPort
P
is to set to the source port of the received packet, here .
dstPort
P
is set to 0.
options
is set to the "data" portion of the received packet.
data
At the :
Data Mote
The has previously opened and bound a socket to port .
Data Mote
P
The receives the packet from the , and is unaware of the fact that it was tunneled
Data Mote Data Manager
through the Wireless Backhaul Network.
11.2.2 Upstream Data
Upstream data is sent by a to the . We use Figure 4 to illustrate this data flow. We assume that
Data Mote Host Application
B1 sends data to UDP port on the .
Data Mote
P
Host Application
SmartMesh IP Application Notes Page of 67 159
Page 68

At the :
Data Mote
The has previously opened and bound a socket to port .
Data Mote
P
The issues a command with the following parameters:
Data Mote sendTo
set to .
destIP
ff02::2
set to .
destPort
P
is set to bandwidth.
serviceType
is set to Low.
priority
contains the data to send.
payload
From the 's point of view, it is sending data to the , and is unaware that it will be
Data Mote Data Manager
tunneled to the over the Wireless Backhaul Network.
Host Application
At the :
Backhaul Mote
The has previously registered to receive all notifications from the .
Backhaul Mote Data Manager
The has previously opened and bound a socket to port .
Backhaul Mote
0xf0bf
The data packet sent by the appears on the serial API as a data notification.
Data Mote
The silently drops the received packet if at least one of the following conditions is true:
Data Mote
The source and UDP destination ports are different.
The length of the data plus 8 is larger than the maximum data length.
The issues a command with the following parameters:
Backhaul Mote sendTo
set to the .
destIP
ff02::2
set to the source port of the received data, here .
destPort
P
is set to bandwidth.
serviceType
is set to Low.
priority
contains the concatenation of the MAC address of the source (8 bytes), and the
payload Data Mote
data.
Since this packet is sent over the previously opened socket, it is sent with source UDP port .0xf0bf
At the :
Host Application
The receives data from source UDP port , which indicates it is part of the tunneling protocol.
Host Application
0xf0bf
If the received data is sent to destination UDP port , it's either a forwarded notification, or a mote discovery0xf0bf
packet. See below for a description of the packet handling.
The silently drops the received packet if the payload length is less or equal to 8.
Host Application
The splits the received payload in two portions:
Host Application
The first 8 bytes are the MAC address of the source , here B1.
Data Mote
The remainder is the "data" sent by the source .
Data Mote
The processes the received data.
Host Application
11.2.3 Request
The can issue a request to a particular by sending a packet with both source and destination
Host Application Backhaul Mote
UDP port set to .0xf0bf
The first byte of the request, called the dispatch byte, identifies the type of request.
SmartMesh IP Application Notes Page of 68 159
Page 69

request dispatch byte meaning
0x00 Serial API Command
0x01 Remote Procedure Call
Serial API Command
This use of this request type is not defined in this version of the Application Note. It is listed here for possible future
extensions.
Remote Procedure Call
This request type allows the to have the start a procedure. The completion of this procedure
Host Application Backhaul Mote
can result in a Remote Procedure Response being returned. Supported remote procedures are listed in the Remote Procedure
Interface section below.
11.2.4 Reply
The can issue responses to a particular by sending a packet with both source and
Backhaul Mote Backhaul Manager
destination UDP port set to .0xf0bf
The first byte of the response, called the dispatch byte, identifies the type of response.
response dispatch byte meaning
0x00 Serial API Response
0x01 Remote Procedure Response
0x02 Serial API Notification
Serial API Response
This use of this response type is not defined in this version of the Application Note. It is listed here for possible
future extensions.
Remote Procedure Response
SmartMesh IP Application Notes Page of 69 159
Page 70

This request type allows the to have the start a procedure. The completion of this procedure
Host Application Backhaul Mote
can result in a Remote Procedure Response being returned. Supported remote procedure are listed in the Remote Procedure
Interface section below.
Serial API Notification
The registers to all notifications over the serial API of the . All data notifications are handled by
Backhaul Mote Data Manager
the Upstream Data procedure described above. All other notifications are forwarded to the Host Application according to the
procedure described in this section.
At the :
Backhaul Mote
The has previously registered to all notifications from the .
Backhaul Mote Data Manager
The has previously opened and bound a socket to port .
Backhaul Mote
0xf0bf
A notification of type data is handled by the "Upstream Data" procedure described above.
The notification is silently dropped if its length plus 1 exceeds the maximum payload length.
The issues a command with the following parameters:
Backhaul Mote sendTo
set to .
destIP
ff02::2
set to .
destPort
0xf0bf
is to set bandwidth.
serviceType
is set to High.
priority
contains the byte (indicating a Serial API Notification) followed by the exact bytes of the
payload
0x02
notification, as received over the serial port.
Since this packet is sent over the previously opened socket, it is sent with source UDP port .0xf0bf
At the :
Host Application
The receives data from source UDP port , which indicates it is part of the tunneling
Host Application
0xf0bf
protocol.
If the received data is sent to a destination UDP port different from , it's an Upstream Data packet,0xf0bf
which is handled by the "Upstream Data" procedure above.
If the first byte of the payload is , it's a Serial API Notification.0x02
The parses the notification as if it were received directly from the serial port of a Manager.
Host Application
11.3 Remote Procedure Interface
The tunneling protocol allows the to start a procedure on a and retrieve its outcome through
Host Application Backhaul Mote
the exchange of Remote Procedure Call and Remote Procedure Response packets. A Remote Procedure Call can be followed
by zero, one, or multiple Remote Procedure Response packets.A Remote Procedure Call packet is formatted as follows:
request dispatch byte procedure ID procedure-specific parameters
0x01 see below procedure-specific
1 byte 1 byte variable
SmartMesh IP Application Notes Page of 70 159
Page 71

A Remote Procedure Response packet is formatted as follows:
response dispatch byte procedure ID procedure-specific return value
0x01 see below procedure-specific
1 byte 1 byte variable
The valid procedure IDs are:
procedure ID value corresponding procedure
0x00 getOperationalMotes
This section lists the different supported procedures.
11.3.1 getOperationalMotes Procedure
This procedure allows the to retrieve the list of operational motes managed by a specific .
Host Application Data Manager
Remote Procedure Call Packet Format
No procedure-specific parameters are passed in the Remote Procedure Call packet.
Procedure Description
When this procedure is triggered, the issues a series of commands over the serial API of the
Backhaul Mote getMoteConfig
to retrieve the list of MAC addresses of the motes which are currently operational.
Data Manager
Remote Procedure Response Packet Format
One or more Remote Procedure Response packets are used by the to return the number and MAC addresses
Backhaul Mote
of the operational joined to this .
Data Motes Data Manager
Each Remote Procedure Response has the following format:
total number of motes index of the first mote in this list (0==first mote) delta-encoded list of MAC addresses
1 byte 1 byte
variable
The list of MAC addresses is delta-encoded to the Remote Procedure Response payload size. Each entry in the list consists of
a 1-byte length field, followed by the possibly truncated MAC address. When two MAC addresses follow each other, the
left-most common bytes are elided from the second MAC address encoding.
That is, the following list of MAC addresses:
SmartMesh IP Application Notes Page of 71 159
Page 72

00-17-0d-00-00-11-22-33
00-17-0d-00-00-11-33-44
00-17-0d-00-00-11-33-55
00-17-0d-00-00-22-22-33
Is encoded as (underlines bytes highlight the length bytes):
In this example, delta encoding allows the08 00 17 0d 00 00 11 22 33 02 33 44 01 55 03 22 22 33
payload shrink from 32 bytes to 18 bytes.If the list of motes is too long to fit in one packet, the list is split across multiple
packets, and the index byte at the beginning of each packet indicates the index of the first mote in the list.
11.4 Bandwidth Considerations
The network must be configured such that the total throughput at each level is not exceeded. The total for all the backhaul
motes should not exceed the throughput for the backhaul manager. The throughput of each data manager should match that
of its backhaul mote.
Assume the As an example, let's use a uniform service level, though heterogeneous distributions of bandwidth are possible.
is connected to 32 , and each is connected to 32 motes. By default, the base
Backhaul Manager Backhaul Motes Data Manager
bandwidth of the is 0.11 packet/s, i.e. each is expected to send 1 packet every 9 s.
Backhaul Manager Backhaul Mote
We will change the base bandwidth of the to 1 packet/s. This can be done by using the
Backhaul Manager set config basebw
CLI command prior to deployment. Each can then support 1 packet/s total traffic from its 32 motes, or ~1
Data Manager
packet/30 s from each mote. Since the base bandwidth is already set to 9 s, we won't need to change it on the .
Data Managers
With this configuration, we support 30 s homogeneous reporting from 32 subnets, with 1024 motes total. The applications
driving the data motes' APIs are not required to request services to be able to transmit at this rate, although it is still
recommended practice. If services are used, no mote should request a service faster than 30 s.
It is also possible to extend the system to 10000 motes (100 , each with a supporting 100
Backhaul Motes Data Manager
motes) by using SmartMesh IP managers with external RAM. In this case, the base bandwidth on the
Backhaul Manager
needs to be scaled down to 3 s, and the base bandwidth on the should be scaled back to 100 s. No mote
Data Managers
should publish faster than once every 100 s.
Other combinations of the number of and and are possible, with the base bandwidth needing to
Backhaul Motes Data Motes
be scaled at each level accordingly.
11.5 Miscellaneous
The preferred implementation is to configure each Wireless Data Network with a different Network ID and have yet
another Network ID for the Wireless Backhaul Network. This enables spreading the evenly among the
Data Motes
Wireless Data Networks.
Alternatively, by using ACLs, it is possible to share a single Network ID and join key throughout all the Wireless Data
Networks.
SmartMesh IP Application Notes Page of 72 159
Page 73

1.
2.
3.
4.
12 Application Note: Building Deep IP Networks
12.1 Introduction
The SmartMesh IP family is well suited to building networks spanning a long linear distance. This includes applications such
as monitoring the environment in a mineshaft and transmission line monitoring, where sensors tend to be deployed in the
same direction away from an egress point. With a one-dimensional deployment in mind, packets from wireless sensor nodes
("motes") further from the manager will require more hops to get to their destination. We refer to these motes as being "deep"
in the multihop network. There are some performance characteristics that are specific to such deep multihop networks, as
compared to denser mesh networks:
The network will take longer to fully join.
The manager will be able to support lower total traffic limits. A maximum total egress of 10.5 packets per second
should be respected.
More attention needs to be placed on deployment locations and connectivity.
Packet latency will increase with network depth.
12.2 Deployment Guidelines
As with all SmartMesh deployments, motes should all be deployed within range of three other potential parents to ensure
network reliability. In the case of a linear deployment, this means all sensor motes must have three motes within range and
closer to the manager. Furthermore, to preserve this property near the manager, we recommend placing some repeater motes
(motes with or without sensors) close to the manager. If the radio range in the desired environment is , then the deployment
R
should be carried out according to Figure 1.
Figure 1. Each sensor mote (dark blue circle) has three upstream neighbors closer to the manager (triangle). The
repeaters (light blue circles) provide traffic handling and spatial diversity.
SmartMesh IP Application Notes Page of 73 159
Page 74

If there are fewer sense points than this in the deployment, repeaters should be added to make up the required density of
three potential parents per device. The total distance that can be covered is greatly affected by the deployment environment
which affects range. As drawn in Figure 1, if for example =100m, a 100-mote network can monitor out to beyond 3km.
R
Placing the devices 20 to 30 meters off the ground and in line-of-sight can extend this range by 5x (i.e. > 15 km), and placing
them in a mine shaft 1 meter off the ground can reduce it by half (1.5 km).
12.3 Determining Range
The two example deployments, mineshafts and transmission lines, are expected to lie at opposite ends of the device range
spectrum due to the radio propagation characteristics in these very different environments. In either of these settings, there is
no substitute for directly measuring device-to-device range with a pair of fully integrated motes using the actual finished or
prototyped wireless sensor with the antenna you plan to use. This measured range informs both the number of repeaters and
the maximum distance for the network. For this reason, we encourage OEMs to make range measurements as early as
possible in the development cycle.
For more information on estimating range, see the application note "Planning a Deployment."
12.4 Mote and Manager Versions and Settings
To build deep networks, the user must have SmartMesh IP Manager version 1.2.1 or later and SmartMesh IP Mote version 1.3
or later. If upgrading is necessary, it must be done before deployment.
In addition to the version requirement, the manager needs some configuration changes that are different from traditional
deployments. These settings must also be changed before building the network and are persistent. From the manager CLI
interface, type the following:
su becareful
set config numparents 3
seti ini rlblbcto_f 240
seti ini rlblskto_f 240
seti ini rlblmaxto_f 240
seti ini rlblskto_s 240
(refer to the calculation of L in the "Calculating Links" section)seti ini minlinks 8
seti ini iscascading 0
seti ini nummlinks 0
No configuration changes are required at the motes.
SmartMesh IP Application Notes Page of 74 159
Page 75

12.5 Calculating Links
At a minimum, the number of links assigned should be set to 8 (as in the settings detailed above). More links may be required
for faster reporting rates or lower latency in the network, and can be calculated using the following formula:
L = [1.8M/T]
Where the number of links is the number of motes including repeaters in the network is , and the reporting interval is
L, M T.
The square bracket here indicates that you should round up. We recommend limiting the total network egress to 10.5 pkt/s, so
to get the maximum throughput for 100 motes, this is one packet per 10s per mote and a little extra to carry the health report
packets. Calculating the link requirement in this case yields =18.
L
Because of memory limits, restrict the maximum value of the product to 1800. For example, with our 100-mote deep
LM
network, the =18 value is the maximum permitted. For a smaller network of 50 motes, we could set =36 if we wanted to
L L
minimize packet latency. As in all SmartMesh networks, the user should keep in mind the tradeoff between adding more links
and increasing the average energy use.
12.6 Estimating Latency
The latency distribution for each mote in a network is difficult to predict exactly. Consider for example the by-mote latency
shown in Figure 2 from a 100-mote test with the default settings. While latency generally increases with mote depth, there is
significant variation in the measured latency values, particularly in the maximum measurements. As an example from the plot,
for the deepest mote the median latency is 10.2s and the 99 percentile latency is 20.6s.
th
SmartMesh IP Application Notes Page of 75 159
Page 76

Figure 2. Latency as a function of Mote ID with the default settings over an hour of data collection. The max values are
shown as red dots, the median as blue dots, and the minimum as green dots. The measured average path stability was
85% for this network.
This data can be used to provide an estimate of the latency of the deepest mote in the network. In this context, the average
path stability is an important parameter. refers to the concept that due to a variety of RF related factors, not every
S S
transmission will get through on the first try: for example, 100% path stability means every packet gets through on the first
try; 80% path stability means 8/10 packets get through on the first try, and 2/10 are resent automatically.
<median(latency)> = 0.75M/LS
The red dots in Figure 2 are an approximation of the 99 percentile latency that can be expected. Accordingly, you can expect
th
the 99 percentile to be between 2-3 times the median latency. If path stability is low, packets may build up in the motes'
th
queues and further increase the tails of the latency distribution. See the Application Note: Debugging Congested Networks for
more discussion on identifying and mitigating the effects of full queues.
SmartMesh IP Application Notes Page of 76 159
Page 77

12.7 Over-the-Air Programming
SmartMesh IP motes support Over-the-Air Programming (OTAP) with an external application called the OTAP Communicator.
When upgrading motes in deep networks, the OTAP Communicator needs to be run in slow mode as the default mode will
result in congestion deeper in the network. For a 100-mote deep network, a typical OTAP upgrade will take about 12 hours.
SmartMesh IP Application Notes Page of 77 159
Page 78

13 Application Note: Overlapping Networks
13.1 Introduction
A deployment may require hundreds or thousands of motes in a small area, more than can fit in a single SmartMesh IP
network. Since the SmartMesh protocol emphasizes time synchronization as a requirement for reliability, it can seem risky to
deploy these motes in multiple networks located in overlapping spaces. As we will show in this Application Note, providing
that the base path stability is high enough, there are no significant risks to deploying overlapping networks. We'll quantify the
largest effect, which is drop in the effective path stability across all the overlapping networks. We define a single
radio space
as the area covered by the transmission from one wireless device. Saying that several devices are in the same radio space
means that each device will be able to hear transmissions from any other device in this space, and also will be subject to
interference from the other devices. When two transmissions occur simultaneously from two different devices in the same
radio space on at the same transmission frequency, we say that these transmissions .
collide
As a real-world example of overlapping network operation, at Dust Networks we run all of our testing in an environment where
1000 motes in 10 to 30 networks are simultaneously running within the same radio space. These networks have colliding
transmissions, but there are no qualitative reductions in overall data reliability.
13.2 Method
We consider a deployment where multiple SmartMesh IP networks are each given their full capacity of 100 motes. Suppose
there are 10 such networks all in the same radio space, and that we pick one mote from one of the networks. Because of the
SmartMesh manager's bandwidth allocation algorithms, a transmission from this mote will never collide with any other
transmission from the other 99 motes in its network. However, it does have a chance at colliding with a transmission from
one of the overlapping networks. Because of the decoding involved, whichever transmission started earlier is likely to be
properly received and whichever transmission started midway through is likely to require a retransmission.
Based on how often motes in each network report, we can calculate the total number of transmissions per unit time for that
network. And based on this total number of transmissions, we can calculate the chance of collisions with the single mote we
picked out. If a collision results in our mote failing its transmission, it will automatically retry the transmission on the next
assigned link. Each retry lowers the measured path stability for our mote, but data reliability is maintained since the data is
simply transmitted on the next assigned link.
If you deployed a single 100-mote network and measured the path stability, it might be 80%. This is what we will call the
base
. If we now have 10 overlapping networks, the stability is going to drop; it'll drop more the more traffic there is in
path stability
the overlapping networks. We will call this final value the . In the following section we will calculate the
effective path stability
effective stability given different numbers of overlapping networks, different reporting rates, and different base stability.
SmartMesh networks are designed to operate with perfect data reliability even when each transmission, on average, requires
one retry to be successfully received.
SmartMesh IP Application Notes Page of 78 159
Page 79

In general, we do not recommend operating networks when the effective path stability is less than 50%. Networks operating in
this stability regime are more prone to mote resets due to transport layer failures with the manager and can experience lower
data reliability. Building networks which operate reliably in <50% stability regimes would require the SmartMesh manager to
allocate bandwidth very conservatively which would limit network throughput and increase mote power.
SmartMesh IP Application Notes Page of 79 159
Page 80

13.3 Results
For our calculations, we assume the worst case for the deployments. First, all motes and managers are assumed to be in the
same radio space. Second, all transmissions are assumed to have the maximum application-layer payload of 90 bytes so that
they last as long as possible. Third, each network has a full 100 motes. We also assume that all the motes in all the
overlapping networks are reporting data at the same rate. At the slow end, the motes report data on 60-second intervals. At
the fast end, which is near the packet/s limit for a SmartMesh IP network, motes report data on 3-second intervals.
Starting with a base stability of 80%, we see that we can tolerate many networks in the same space before stability starts to
suffer.
From this plot, it is apparent that if you have a base stability of 80%, you can run 15 overlapping networks at their full capacity
(i.e. each mote reporting 1 packet every 3s) and not see an effective stability below 50%. There will be power and latency
increases commensurate with the drop in effective stability, but reliability should be preserved.
SmartMesh IP Application Notes Page of 80 159
Page 81

Repeating the same analysis for 70% base stability gives us reporting limits for anything at or above 12 overlapping networks.
To get these limits, look at where the various curves intersect the 50% effective stability axis. It is within the recommended
guidelines to run 9 networks in the same radio space with each mote reporting 1 packet every 3s.
SmartMesh IP Application Notes Page of 81 159
Page 82

If we next consider a base stability of 60% plotted on the same axes, there is much less margin for reliable operation within
the recommended guidelines.
Here all but the 3-network case can have sub-50% effective stability.
SmartMesh IP Application Notes Page of 82 159
Page 83

There is one more way we can frame these results: if we have minimally reporting motes at 60s intervals, how many motes
can we safely locate in the same radio space?
The family of curves for 60%, 70%, and 80% base stability is shown in the above figure. If we are starting with a high base
stability, it is possible that a single radio space can support several thousands of motes. At these high mote densities it
doesn't really matter how many networks are present. For example, we could have 5,000 motes as 100 networks of 50 motes
each or 50 networks of 100 motes each. The same amount of traffic, and hence interference, will be present.
SmartMesh IP Application Notes Page of 83 159
Page 84

13.4 Conclusions
We can draw some conclusions from the plots in the previous section:
Any installation with up to 1,800 motes spread out over 18 networks, averaging a publish interval of 1 packet per 15s,
will meet the recommended guidelines. An effective path stability reduction of 5% to 10% is expected which will result
in a small increase in mote energy consumption and latency. Use the toSmartMesh Power and Performance Estimator
quantify these increases.
Measuring the base stability with a test deployment of a single network of 100 motes is recommended to determining
the degree of overlap and traffic level that is safe for maintaining network reliability.
To further mitigate any interference effects, these steps can be taken:
If you are sending packets with less than full payloads, accumulate the data until a full payload is waiting at the sensor
processor before sending the data to the mote. This results in higher latency but less overall radio on-time that can
cause collisions. If the application can tolerate longer latency, this is a good policy for lowering mote power anyway.
Increase the number of parents per mote from 2 to 3 - this provides more path diversity for the motes, in case some
paths fail the mote will be less likely to reset. This does require more power at the parent motes, however. From the
SmartMesh manager CLI, issue the commands:
> set config numparents=3
> reset system
If the network is a low-traffic network, increase the minimum number of links per mote. This randomizes the motes'
transmission schedules and prevents persistent collisions and has a similar power penalty as the additional parent
above. From the SmartMesh manager CLI, issue the commands:
> su becareful
> seti ini minlinks=4
> reset system
Any co-located Access Point devices for different networks should always be separated by at least one meter.
We do not recommend lowering the transmit power to improve overlapping network performance as this will lower all signals,
including the desired ones, by the same amount. Additionally it will lower the base stability if there is any ambient RF noise in
the environment.
SmartMesh IP Application Notes Page of 84 159
Page 85

14 Application Note: Planning A Deployment
14.1 Estimating Range
Hardware integration choices influence how well devices can communicate with each other over a distance with antenna
choice being the most obvious. Post-integration, device placement can change the effective range over orders of magnitude.
At one end of the spectrum, devices placed on elevated poles or towers with clear line of sight to other motes in the network
may have a range of 1000 m or more. At the other end, devices placed on the ground or next to large metal objects may have
an effective range of 10 m or less. So when a customer asks you "What's the range of your radios", in some ways that is a
meaningless or unanswerable question. You can refer to the datasheet for transmit power and receive sensitivity and the
resulting link budget, but the customer will determine the range with choices they make in the development of their products
and an evaluation in a real environment similar to their expected deployments.
We recommend that customers at the beginning of development plan on their devices working at a spacing of 50 m. Analysis
of the first several 'typical' deployments can guide the typical range number up or down. Deployment planning simply requires
that each mote, is being placed within this range of at least three existing devices. In order to form a reliable mesh, every
device must have multiple neighbors and hence numerous opportunities to connect. Placing motes within range of only one
other device along a maximally spaced string will result in a fragile network prone to mote resets and data loss.
14.2 Mapping out a Deployment
Once you have settled on a range for your environment, you can use a scale map to place motes at all the required sense
points for the network. If possible, the AP should be located near the middle of the distribution of motes to reduce latency and
mote power. Mark the AP location. Supposing that the range estimated above is 50 m, draw a circle with a 50 m radius
around the manager. Not all motes within this circle will be able to communicate directly with the AP, but some motes outside
the circle will, so on average it will balance out. The number of motes inside this circle approximates the number of 1-hop
motes in the deployment.
Next draw a 100 m radius circle centered at the AP. The number of motes in the ring between 50 m and 100 m approximates
the number of 2-hop motes. Repeat this process with circles of increasing radius until all motes have been encircled and note
how many motes are in each hop. We'll use these hop counts in a minute.
There are two more things to check:
Each mote, including the AP, should be within the estimated range of 3 other devices.
The network should be no more than 8 hops. Deeper networks are indeed possible and should just work, but they are
harder to model.
SmartMesh IP Application Notes Page of 85 159
Page 86

14.3 Estimating Power and Latency
Dust has provided a that estimates network performance for both productSmartMesh Power and Performance Estimator
families. It can be used to estimate battery size for a given topology, packet rate, per hop latencies, and desired lifetime.
The inputs are:
Number of motes at each hop
Reporting interval and packet size
Network configuration
Path stability
With these inputs, the estimator first evaluates whether the network will form, and if so, gives:
Mote average current by hop
Mean latency by hop
Network join time
Joining mote current
We recommend using the example configurations provided to guide customer thinking on power budgeting.
There are many factors that influence power consumption and latency in actual deployments, including path
stability (which changes over time) and the connectivity of the network as deployed (how many hops deep it is).
The estimator provides reasonable average power for motes at a given hop - there may be motes with 3x the hop
average. These estimates are for expectation setting - actual in-network performance will vary.
SmartMesh IP Application Notes Page of 86 159
Page 87

1.
2.
15 Application Note: Predicting Network Health
Evaluating the health of a deployed and running network is important to ensure that long-term performance targets are
achievable. Network health verification is simple and based on interpreting readily available information. When a network fails
this network health verification test, adding more motes in key locations will usually remedy the problem.
15.1 Motivation
Once a network has been deployed and is running, an important step is to verify that the network is healthy, and more
. The network itself collects all the required diagnostic data which is then servedimportantly, that it will be healthy in the future
up at the software interfaces of the manager. It is important that early on in the development of products that the developer
integrating software to the manager knows that diagnostics are important. Building the tools to automate the health
verification of networks is an extremely good investment that will instill confidence in the minds of end users, particularly
those skeptical about wireless.
The process described below will let the user know if it is safe to walk away from a network (a "green light"), and also serves
to identify the source of problems in the rare case that a properly installed network does have problems.
15.2 Overview
Verifying a network involves answering two multi-part questions:
Does the network LOOK GOOD?
Does the network have the building blocks to BE GOOD?
The desired answer to both these questions is YES. If the answer is YES to both these questions, the test has passed and the
network in question should be expected to run well for the foreseeable future.
SmartMesh IP Application Notes Page of 87 159
Page 88

15.3 Does the Network LOOK GOOD?
This part of the network evaluation test involves answering three very simple observational questions about the network. They
are:
Is the data reliability high? In any good deployment, the data delivery rate in the network be close to 100%. Dust networks are
built with very few mechanisms for losing data, and data reliability of >99.99% is expected. Confirm that this is the case.
Is the joining behavior correct? The first part of this question is: did all your devices join? Only the installer can know for sure
how many devices were deployed. They must make sure that if they put 100 devices out there, that 100 devices joined. The
second part of this question is making sure that all devices joined precisely once. If a device joined more than once, has it
been continuously live in the network long enough to make you confident it is not constantly dropping out and rejoining? A
device that dropped out and rejoined once while the network was building is not as ominous as one that resets long after
building is complete.
Does it look like a mesh? This question can be answered at a glance if there is a GUI for visualizing the network. If there is no
GUI, then you simply check that all motes have two parents in the mesh. There should be exactly one mote in the one hop ring
that has only one parent. That is OK and expected.
15.4 Does the Network Have the Building Blocks to BE GOOD?
This part of the network evaluation test involves answering three quantitative questions about the details of connectivity in the
mesh. Those three questions are:
Are there enough motes in the one-hop ring? All traffic in the network converges at the AP mote, the mote connected to the
network manager. That single mote is critical for all data to be delivered. By extension, all the motes that
one-hop
communicate directly with the AP are important as well. The hardest working motes in the mesh will be in the one-hop ring.
Those are the motes that are forwarding the most traffic from their descendants. The more one-hop motes, the better for a
network as there is more opportunity to balance the traffic and to survive a single mote reset. We never want to build a system
where removing one mote will cause the loss of many motes' data. As a rule of thumb, there should be at least 5 motes or
10% of the total, whichever is larger, in the one-hop ring. If you have a 120 mote network with 10 one hop motes, it is not
guaranteed that it will fall apart. But you should have good quantifiable guidelines here so a non-expert can answer a yes/no
question, with actionable instructions on what to do when the answer is no.
Does every mote have enough good neighbors? This step involves waiting until 15 minutes after the last mote has joined,
looking at all the discovered paths in the network, and making sure that every mote has enough good quality neighbors. The
bare minimum is that every mote should have at least 3 good neighbors. A good neighbor is a neighbor that this mote can
hear at >-75dBm or has >50% path stability. These paths do not have to be currently in use, they just have to be discovered
and reported by the network.
Are any motes at or near their link limit? In all current products, motes at 90 links or more indicate a risk of bandwidth issues
in the network.
SmartMesh IP Application Notes Page of 88 159
Page 89

16 Application Note: Common Problems and Solutions
16.1 Introduction
Networks are built with the goal of providing reliable services while keeping power as low as possible on the wireless devices.
Since links use energy, motes are given as few links as possible to adequately carry the expected traffic through the mote
during the joining and steady-state phases of the network lifetime. The manager depends on the motes accurately reporting
their service requirements and each path averaging better than 50% stability. If there is a bottleneck, meaning that any mote
has run out of links due to power or memory constraints, there may not be enough bandwidth to carry all the traffic from the
descendants of this mote.
Symptoms of a low-performing network are:
Slow formation time
Mote resets
Large variation in packet latency
Manager reports lost packets from any mote
The causes of these performance issues are typically one or more of:
Poor connectivity - motes do not have enough neighbors with good quality paths
Interference - in-band WiFi or Bluetooth is present or a strong out-of-band interferer is nearby to lower path stability
Oversubscription - motes are reporting more than their accepted service requests allow causing congestion
Motes report their internal and path statistics in Health Report packets. These statistics are broken up into 2 or 3 packets and
are generated every 15 minutes. In particular, check the reported path stability values on the paths that are currently being
used by the mote. The mote reports the maximum and average size of its internal packet queue. Dust networks are
provisioned so as to rarely have more than one packet at any mote at any time, so a nonzero average queue length usually
indicates a problem.
The manager also keeps track of the network topology and the link assignments at every mote in the network. This perspective
can immediately identify if any motes have run into link limits or have skipped a sequence number indicating a lost packet.
Furthermore, the manager issues an alarm when a mote resets.
Interference can also be the result of many co-located Dust networks. In the current product line, networks are not
synchronized in terms of time or bandwidth allocation so transmissions from one network can occur at the same time and on
the same channel as another network. Measures have been taken to reduce the chance that this inter-network interference will
cause serious performance issues, but it is possible to see overall path stability be lower in the a multiple co-located networks
environment, and is a function of the total combined amount of traffic. Note that lower path stability may not necessarily
translate into lower data reliability, severe interference will need to occur for that to happen.
SmartMesh IP Application Notes Page of 89 159
Page 90

16.2 No Motes Join
Reasons that no motes at all join to the manager include:
The manager is not running.
There is no AP mote connected to the manager.
There is no antenna connected to the AP mote.
The network ID and/or join key of the manager do not match the security credentials of the motes.
The Access Control List on the manager does not include any of the motes.
The motes are all placed too far away from the AP.
The motes are not powered on.
The sensor firmware on the motes is not sending the join command correctly.
16.3 A Collection of Motes Doesn't Join
If some motes join and others do not, you have at least established that the manager and AP are functional. Reasons that
some motes won't join can include:
Some motes are placed too far away.
Max motes on the manager has been reached.
Some of the motes do not have the correct security credentials to join this manager (network ID, join key, ACL entry).
The motes that are within range have been configured as leaf nodes.
16.4 One Mote Doesn't Join
If the number of motes that fail to join is small relative to network size (i.e. 1 in 100), then potential reasons include:
That mote has an RF problem (like it is broken or the antenna is not attached).
That mote has the wrong security credentials.
That mote is not powered up.
Max motes has been reached.
That mote is placed too far away from the rest of the network.
SmartMesh IP Application Notes Page of 90 159
Page 91

16.5 One Mote Gets Lost and Rejoins Over and Over
Motes should stay connected to the network indefinitely. Possible reasons for a single mote to join and drop off the network
and join again include:
A power supply problem on the mote is resetting it.
The RF connectivity to neighbors is marginal.
The RF connectivity to neighbors is highly transient and unstable.
The mote is in a location where RF connectivity can be severed and then re-established (like in an enclosure or behind
a large obstacle).
16.6 Devices Within Operating Range Have Bad Path Stability
It's probably interference, place them closer together to boost SNR.
16.7 I Need to Install a Repeater but I'm Already at Max Motes
Repeater needed for connectivity: Remove one mote and place the repeater, or rearrange motes to shorten paths.
Repeater needed for 1st hop bandwidth: Cut back on reporting rate, or move a mote from farther out into the 1st hop ring.
16.8 Data Latency is Higher than I Expect
Data latency can be lowered on an individual device at the expense of battery life (for the mote and its ancestors) by
shortening the service period in a request but keeping publish rate unchanged. Latency can also be improved network wide by
increasing the base bandwidth.
16.9 The Network is Using Paths that Don't Look Optimal
The network continually tries to optimize for lowest power - part of which includes trying new paths periodically. There are
other considerations besides path stability that come into play.
SmartMesh IP Application Notes Page of 91 159
Page 92

17 Application Note: Changing Provisioning Factor to
Increase Manager Throughput
17.1 Introduction
Managers guard for short-term changes in path stability through , assigning links to motes as a function of the
provisioning
traffic they generate. By default, the provisioning factor in a SmartMesh network is 3x - for every packet expected to pass
through a mote, it gets three links. This allows a device to ride through temporary stability drops down to 33% without risk of
its queue filling, which could result in lost data. However, there are a limited number of links available at the manager's access
point, so provisioning places a cap on packet throughput.
For applications where manager throughput cap is limiting, breaking the network into smaller subnetworks is the preferred
method for increasing total throughput. If this is not an acceptable solution, the customer can modify the provisioning factor
to increase throughput, within limits. Dust recommends that provisioning never be set lower than 1.5x - path stability dips to
< 70% are not uncommon in customer networks we've observed, and without clear knowledge that the network is operating in
a low-noise, low-multipath environment, setting it lower is risky. In general, where paths are > 67%, set the provisioning
factor to the reciprocal of the lowest observed path stability.
Note that SmartMesh managers use links for functions other than carrying data traffic, . sending Keep Alives with enough
e.g
retries to avoid a path alarm. Because of this, some motes may have more links to the access point than required by traffic
alone. If the access point has reached its link limit, these links prevent any other motes from adding links for bandwidth
purposes; it is more difficult to approach the limits discussed below in larger and/or deeper networks.
17.2 Changing Provisioning: IP
IP managers with external RAM have 223 links dedicated to upstream data (150 links when no external RAM is used) on a
randomized slotframe from 256-284 slots (270 average). Each slot is 7.25 ms. With 3x provisioning, this is 36.1 packets/s.
Setting provisioning to 1.5x achieves a maximum throughput of 72.2 packets/s, but requires that all paths have > 70%
stability.
To change the provisioning factor using manager CLI (here 1.5x):
> set config bwmult=150
> reset system
To change the provisioning factor programmatically, use the manager API.
setNetworkConfig<bwMult>
SmartMesh IP Application Notes Page of 92 159
Page 93

17.3 Changing Provisioning: WirelessHART
WirelessHART managers have 737 links dedicated to upstream data on a 1024-slot superframe, where each slot is 10 ms.
With 3x provisioning, this is 24.0 packets/s. Setting provisioning to 1.5x achieves a maximum throughput of 48.0 packets/s.
To change the provisioning factor (here 1.5x), you need to modify the parameter in the file in
link_oversubscribe
dcc.ini
./opt/dust-manager/conf/config/dcc.ini
# Oversubscribe coefficient for link (1.0 no oversubscribing)
# Range: 1-100
link_oversubscribe = 1.5
By default, the file does not exist. If you haven't already made parameter changes, you'll have to createdcc.ini
the file to change the provisioning factor. Be sure to create it in the directory listed above.dcc.ini
SmartMesh IP Application Notes Page of 93 159
Page 94

1.
2.
3.
4.
18 Application Note: Debugging Congested Networks
18.1 Introduction
SmartMesh networks are designed to deliver every packet accepted by each mote from each sensor. If a packet is accepted by
a mote but does not make it to the manager, this packet is classified as and counts against the of the network.
lost reliability
The reliability statistic that the manager reports is the ratio of non-lost packets to the total number of accepted packets.
There is another important metric called Availability is the fraction of times that the sensor was able to hand its
availability.
packet off to the mote when it wanted to. SmartMesh networks are generally provisioned with enough links to ensure 100%
availability in addition to 100% reliability, but we do not directly measure availability because it is an application-layer metric.
The only time that a mote is unable to accept a packet is when it has a full queue of packets, we call this a mote. A
congested
congested mote doesn't have enough upstream links to support its local and forwarding traffic. To determine if a network is in
danger of losing availability, one must look for congested motes.
18.2 Respecting Services
SmartMesh managers use a model to assign bandwidth in a network. In this model, each sensor application is
service
responsible for figuring out how much data it needs to send and the associated mote is responsible for requesting enough
bandwidth from the manager. In short, the responsibility of the application is to:
Calculate the packet generation interval for each separate data flow
Request a service for the sum total of all these data flows (these can be separate in SmartMesh WirelessHART but
only one service in SmartMesh IP)
Wait for confirmation that this service, or a faster service, has been accepted by the manager before publishing
If no confirmation arrives, re-request the service after a timeout.
There are many details about the service model that are different between SmartMesh WirelessHART and SmartMesh IP. Refer
to the respective guides for more information (SmartMesh WirelessHART Services and SmartMesh IP Services).
18.3 Estimating Availability
If you know that a mote is generating periodic data and you know the period, you can estimate how many packets should be
received at the manager every 15 minutes. For example, if all motes are reporting once per second, you should expect 900
data packets per 15 minutes. On top of this, the mote sends three health report packets per 15 minutes and may also send
responses to manager requests and path alarms. Availability typically is 100% or will drop considerably, so anything around
903 packets per 15 minute interval should be considered good in this example.
SmartMesh IP Application Notes Page of 94 159
Page 95

When there are fewer packets sent per interval, it gets more difficult to ascertain if they were all accepted by the mote and
successfully received by the manager. Networks with less reporting have fewer links so the latency is generally longer which
can push packet into the next 15 minute interval and a couple packets plus or minus can be a big fraction of the total number
reported. In the following capture of mote statistics, all motes are reporting once per 5 seconds so we expect about 183
packets per interval. Mote 11 has a suspiciously low number in the PkArr column which tells us how many packets arrived
during the interval. While the examples shown below show manager statistics, the same conceptsSmartMesh WirelessHART
apply to SmartMesh IP networks.
> show stat short 0
It is now .................. 06/06/12 16:30:17.
This interval started at ... 06/06/12 16:15:00.
--------------------------------NETWORK STATS----------------------------------
PkArr PkLost PkTx(Fail/ Mic/ Seq) PkRx Relia. Latency Stability
1806 0 5395(2430/ 0/ 0) 3098 100% 3.61s 54.96%
---------------------------------MOTE STATS------------------------------------
Id PkArr PkLst PkGen PkTer PkFwd PkDrp PkDup Late. Jn Hop avQ mxQ me ne Chg T
2 181 0 181 0 356 0 16 1.34 0 1 0 4 0 0 0 22
3 182 0 182 0 194 0 20 1.49 0 1.2 0 3 0 0 0 22
4 182 0 183 1 98 0 17 1.63 0 1 0 4 0 0 0 22
5 182 0 182 0 329 0 18 1.46 0 1.4 0 4 0 0 0 22
6 182 0 182 0 82 0 16 1.7 0 1.2 0 2 0 0 0 22
7 154 0 -- -- -- -- 42 20.7 0 2.6 - - - - - -
8 183 0 157 4 43 0 30 2.66 0 2.3 0 1 0 0 0 22
9 183 0 182 0 0 0 30 3.39 0 2 0 2 0 0 0 22
10 182 0 188 6 65 0 45 2.96 0 2.1 0 3 0 0 0 22
11 166 0 169 1 0 0 42 17.2 0 3 1 4 0 0 0 22
Reliability here is 100% because there are no entries in the PkLst column, but the application was expecting more packets
from motes 7 and 11 so availability < 100% for these motes. In general, you will not know how many packets the sensor is
trying to send so you need to look instead for signs of congestion.
SmartMesh IP Application Notes Page of 95 159
Page 96

18.4 Identifying Congestion
In addition to the estimated availability, congestion can be identified by larger-than-expected latency or by looking at the mote
queues in the stats. As a rule of thumb, motes that have an average queue length (avQ) greater than 0 are in danger of seeing
congestion at some point. Motes that have a maximum queue length (mxQ) of 4 or more may have experienced acute
congestion during the interval. Finally, congested motes typically have higher latency than their peers. Mote 11 in the above
stats meets all of these criteria and was definitely congested during the previous 15 minutes.
A missing health report can also indicate congestion. In this scenario, when it was time for the mote to generate a health
report, its queue was full and the mote was unable to complete the action. In the mote stats, this manifests like the mote 7
row above. We do not directly get a report on the queue occupancy, but we do still have the lower PkArr than its peers and
high latency. When a mote does miss a health report, it continues to keep increasing its counters so that the next health report
still summarizes the missing information.
When a mote is congested, it will start sending NACKs to its children when they try to unload their packets. This reduces the
effective upstream bandwidth at the children of the congested mote and can, if there isn't enough provisioning margin, lead to
the children becoming congested themselves. This process can repeat down through the mesh. Because of this, a mote three
hops deeper than the problem mote may get congested and see that its sensor is backing off. This results in fewer data
packets from this mote being received at the Manager than expected. In order to find the source of the congestion, the
upstream route of each congested mote should be traced towards the AP. The lowest-hop mote that is congested is likely the
source of the congestion of its descendants.
18.5 Bandwidth Model
The manager tries to give each mote three times as many links as it theoretically needs to carry local and forwarded traffic in a
100% stability network. This means that the network can operate down to 33% stability, though note that 33% stability often
means that it is 100% for a little while and then 0% for a while later which is less conducive to successful multi-hop data
collection than a constant two-failure-one-success pattern. If there is congestion anywhere, it means that something has
broken down in this model, and one of the following is true for the source of congestion:
It recently lost a parent due to a path alarm
Path stability is below 33%
It ran out of assignable links due to power or memory constraints
A descendant is reporting more than allowed for its service/base bandwidth level
Path alarms can be monitored by subscribing to the manager notifications and are typically induce very temporary congestion
that is resolved if the mote has a sufficient number of good neighbors. If the mote does not have enough good neighbors, the
path stability could consistently be low and cause chronic congestion, and this can be due to interference. See the
_inc_AN_IdentifyingandMitigatingInterference page for guidance.
A command can be issued on the manager CLI to see how close the congested mote is to its link limit.show mote
Specifically, you should check these two rows:
SmartMesh IP Application Notes Page of 96 159
Page 97

Neighbours: 27 (max 32). Links: 34 (max 100)
Links per second: 4.882812 (limit: 11.648407)
The indicated number of links here, 34, is safely below the maximum of 100 and the power-induced limit of 11.6 link/s is
safely above the current 4.9 link/s. If any mote is approaching the link limit, repeater motes should be added in close
proximity to these motes.
Finally, the manager expects that each sensor will respect the service model. If a sensor is going to report at a faster rate than
that specified in the base bandwidth for the network, it should request a faster service. Still, there is no guarantee that the
sensor will do this properly so it should still be considered as a potential root cause.
To confirm that the mote is not overstepping its requested service level, the result can again be used:show mote
Bandwidth:
output planned 0.3906 current 0.3906
global service 0.3614 delta -0.0108
local service goal 0.0250 current 0.0250
guaranteed for services 0.0250 for child 0.3241 Free 0.0415
Here we are looking at the local service line. The first value of 0.025 here is the pkt/s that the manager thinks the mote has
requested including both the service and the base bandwidth. The current value is the same which indicates that the manager
has indeed assigned this bandwidth. The negative value of delta indicates that this mote ostensibly has enough bandwidth to
support all local and descendant traffic. At 0.025 pkt/s, the mote should generate at most 36 data packets in each 15 minute
interval. The mote stats shown earlier, specifically the PkArr column, can be used to confirm that the mote is not generating
more than this maximum level and exceeding its allotment.
18.6 Mitigating Congestion
If your SmartMesh network is congested at several locations, it may be that the path stability throughout the network is too
low to function properly. In this scenario, the preferred response is to increase the mote density in the deployment. These
additional motes, spread out among the previously deployed motes, can multiply the number of potential paths to choose
from and thereby increase the overall path stability. If the new motes are not reporting additional data, this solution does not
increase the total egress bandwidth required, and if anything, it should decrease the average power of the existing motes.
If the density of the deployment cannot be increased, we can increase the number of links at the congested motes. If the
congestion is global, there are two equivalent ways of increasing the number of links at every mote in the network. Either the
provisioning can be increased or the base bandwidth can be decreased. If the congestion is localized to one branch in the
network, the motes in this branch can request faster services. When we increase the number of links, the motes with the link
increases will have corresponding power increases. Furthermore, any of these increases requires extra receive links at the
Access Point. If the Access Point does not have extra bandwidth available for allocation, it may be that the network has to be
split into two networks to support the extra links.
SmartMesh IP Application Notes Page of 97 159
Page 98

19 Application Note: Identifying and Mitigating the Effects of
Interference
19.1 Introduction
SmartMesh networks are designed to be able to tolerate interference with minimal performance degradation (compared to a
non-interference environment) and only a small increase in power. In a small number of cases however, interference can be
strong enough to impact performance, typically manifesting with the following symptoms:
A large number path stability < 60 %, even at RSSI > -70 dBm
Upstream latency >> 3x the upstream frame length
Average queue occupancy >= 1, or max occupancy >= 3
Reliability < 99.9%
Interference can take the form of an in-band interferer such as an 802.11g wireless router, or an extremely loud out of band
interferer such as WiMax. Use of a spectrum analyzer (even an inexpensive WiFi sniffer such as a ) can help identifyWi-Spy
the region of the spectrum being jammed, e.g.
A fast-hopping interferer such as Bluetooth will appear as a uniformly raised noise floor.
A 802.11 WiFi router will appear as a broad peak.
An out of band interferer may not show up at all, but could still saturate receivers in-network.
A directional antenna coupled with a spectrum analyzer may help pinpoint the source of the interference, but it is often
possible to deduce the presence of an interferer without using a spectrum analyzer at all - network statistics can often be used
to infer the presence of an interferer, and additionally determine if the interferer is significant enough of a problem to warrant
mitigation.
SmartMesh IP Application Notes Page of 98 159
Page 99

19.2 Checking RSSI and Path Stability
Dust provides a tool that takes a network snapshot file and turns it into a waterfall curve showing the RSSI and path stability.
A good waterfall curve looks like this:
In the top histogram, verify that there are a number of paths used in the -90 to -80 dBm range and also in the -60 to -50 dBm
bin. In the right histogram, verify that a significant fraction of the paths are 80% or better and that there aren't many paths
below 50%. In the scatter plot, we expect most paths better than -70 dBm to be 60% or higher stability. The waterfall plotter
breaks out mote-mote paths and mote-AP paths because sometimes there are hardware or interference differences specific to
the AP.
SmartMesh IP Application Notes Page of 99 159
Page 100

Contrast the good waterfall with this one:
The whole curve here has shifted right and we see very few paths below -70 dBm. This type of waterfall is exemplary of either
bad receiver or interference because devices are having a hard time hearing weak signals. There is still a chance that this
network could meet customer performance expectations, but special care should be taken to ensure that all motes have
sufficient connectivity in a deployment like this.
Each customer should deploy a test network with their specific hardware in a "known good" environment similar to their target
deployment environments and without measurable interference. A waterfall curve generated from this test deployment should
be used as the best case against which any in-field data can be compared. Antenna choice in particular can have a large
impact on receive sensitivity, so it isn't sufficient to use the same best case curve for all customers.
SmartMesh IP Application Notes Page of 100 159
 Loading...