

Page 1

Companion Diagnostic Software
User Guide
P0887339
Issue 02 Standard
November 1998
© 1998 Northern Telecom
All rights reserved
Printed in the United States of America
Companion is a trademark of Northern Telecom.
Page 2

Page 3

P0887339 Issue 02 Standard Companion Diagnostic Software User Guide 1
Contents
Companion Diagnostic Software basics 5
CDS package checklist 6
Equipment checklist 6
Local access equipment 6
Remote access equipment using the RAD internal modem 7
Remote access equipment using a RAD external modem 7
Optional equipment 8
Connect the equipment 8
Local access connections 9
To connect the PC to the RAD 9
Remote access connections using the RAD internal modem 10
Remote access connections using a RAD external modem 13
Wireless system programming 15
Local access programming 16
Remote access programming using the RAD internal modem 16
Remote access programming using a RAD external modem 17
Make a working copy 17
Installing and using CDS on your hard drive 17
Using CDS from your floppy drive 18
Files needed by CDS 18
Site administration 21
Page 4

2
Companion Diagnostic Software User Guide P0887339 Issue 02 Standard
Setting up CDS for a new site 22
Local access 22
Remote access 24
Files created by setting up a new site 26
Changing the administration data of an existing site 26
Local access 26
Remote access 28
Using Companion Diagnostic Software 33
Selecting data 36
Automatic system configuration 37
Exiting CDS 38
Display screen components 39
A Typical CDS Session 40
Keyboard functions 41
Making menu selections 42
Files created when using CDS 42
Display screens 43
Command map 44
Main menu 45
Diagnosis Option 45
Monitor Option 46
Utilities Option 46
Diagnosis 47
Automatic System Diagnosis 47
Diagnosis Menu Options 52
Quality of Service 52
Quality of Service components 53
System Faults components 59
Radio Signals 66
Cell Signals 71
Interference 74
Traffic 76
Page 5

3
P0887339 Issue 02 Standard Companion Diagnostic Software User Guide
Monitor 85
Background RSSI 86
CRC Errors 90
Reset RIM 91
Query BS Faults 94
Clear BS Faults 96
Clear Counters 97
Utilities 99
View System Configuration 100
Create Dataset 101
Delete Dataset 102
Change Language 103
Appendix A 105
Equipment requirements 106
CDS software 106
PC 106
RAD 106
PC modem 107
RAD external modem 107
RS232 cable 108
RAD TCM cable 108
RS232 null modem cable 108
Public switch line cable 109
PC modem initialization string 109
Appendix B 111
Diagnosis Action Recommendations 112
How to report a problem 112
System Faults 112
Traffic 120
Interference 123
Radio Signals 124
Appendix C 127
CDS Error Messages 128
Appendix D 131
RUNCDS: Running CDS in Batch Mode 132
RUNCDS Command Line Syntax 134
Page 6

4
Companion Diagnostic Software User Guide P0887339 Issue 02 Standard
The CDS Macro Language 135
Macro Language Rules 135
CDS Macro Language Commands 135
Examples 138
Appendix E 143
CDS DOS Hard Drive Disk File Management 144
Files needed by CDS 144
Files created by administering a new site 144
Files created when using CDS 145
Saved Datasets 146
DOS File Summary 149
Index 151
Page 7

P0887339 Issue 02 Standard Companion Diagnostic Software User Guide 5
Companion Diagnostic Software basics
• Introduction
• Checklists
• Connections
• Modem Access
• Installing CDS
Page 8

6 Companion Diagnostic Software basics
Companion Diagnostic Software User Guide P0887339 Issue 02 Standard
About Companion Diagnostic Software for PCI
Companion Diagnostic Software (CDS) for CT2Plus allows you to
examine the opera ting ch aracteristics of a wirele ss system while the
system is operating at a customer site. The CDS application runs on
a personal computer (PC). You can use it locally at the customer site
or remotely from another location. When you use remote access, the
PC interfaces with the wireless system indirectly via mode ms. When
you use local access, the PC interfaces with the wireless system
directly without modems. CDS performs automatic system
configuration and automatic system diagnosis. It also presents on
your PC screen data derived from wireless operation. The displays
contain various le vels of detail and are in the f orm of bar charts and
statistical tables, with accompanying commentaries.
The two radio transce ivers in a Base Station opera te in an alloc ated
frequency spectrum. Base Stations are grouped into cells, a cell may
have two or more radios in it depending upon the number of Base
Stations making up the cell. These cells overlap each other to ensure
continuous radio coverage throughout the desired coverage area. In
each cell, at any one time, one radio may be used to provide a
common signalling channel (CSC) which locates and tracks portable
movements. Companion Diagnostic Software provides access to
information on the operating characteristics of both regular traffic
and CSC radios.
CDS package checklist
The CDS package includes the following:
• high density 3 1/2" CDS diskette
• Companion Diagnostic Software User Guide
Equipment checklist
The following is a checklist of equipment requirements for each type
of connection. For more detailed descriptions of the equipment
required, see Appendix A of this guide.
Local access equipment
To install and use CDS with local access, you must have the
following:
Page 9

Companion Diagnostic Software basics 7
P0887339 Issue 02 Standard Companion Diagnostic Software User Guide
• Remote Access Device (RAD)
• RAD Time Compression Multiplexing (TCM) cable, to connect
the RAD to the Controller
• IBM compatible PC (386 processor or greater)
• RS232 cable, to connect the PC to the RAD
Remote access equipment using the RAD internal modem
To install and use CDS with remote access via the RAD internal
modem, you must have the following:
•RAD
• RAD TCM cable, to connect the RAD to the Controller
• IBM compatible PC (386 processor or greater)
• PC modem
• RS232 cable, to connect the PC to the PC modem
• Public switch line cable, to connect the PC modem to the public
switch
Remote access equipment using a RAD external modem
To install and use CDS with remote access via the RAD external
modem, you must have the following:
•RAD
• RAD TCM cable, 32 in (80 cm), to connect the RAD to the
Controller
• IBM compatible PC (386 processor or greater)
• PC modem
• RS232 cable, to connect the PC to the PC modem
• Public switch line cable, to connect the PC modem to the public
switch
• RAD external modem
• RS232 null modem cable, to connect the RAD to the RAD
external modem
Page 10

8 Companion Diagnostic Software basics
Companion Diagnostic Software User Guide P0887339 Issue 02 Standard
Optional equipment
You may want to have the following hardware:
• high density 3 1/2" diskette to make a working copy of the
application
• hard drive for storing large amounts of data
• portable computer with battery power supply f or greater mobility
Connect the equipment
You can make two types of equipment connections to examine
wireless system operation using CDS. A local access connection
may be made using an R S232 cable at the customer site, or a remote
connection may be made through a PC modem to use CDS at a
location other than the customer site.
Note: The RAD cannot be programmed if an RS232 cable is
connected to its serial port. Ensure that the required RAD
programming has been done before connecting the RS232
cable to the RAD serial port.
Page 11
Companion Diagnostic Software basics 9
P0887339 Issue 02 Standard Companion Diagnostic Software User Guide
Local access connections
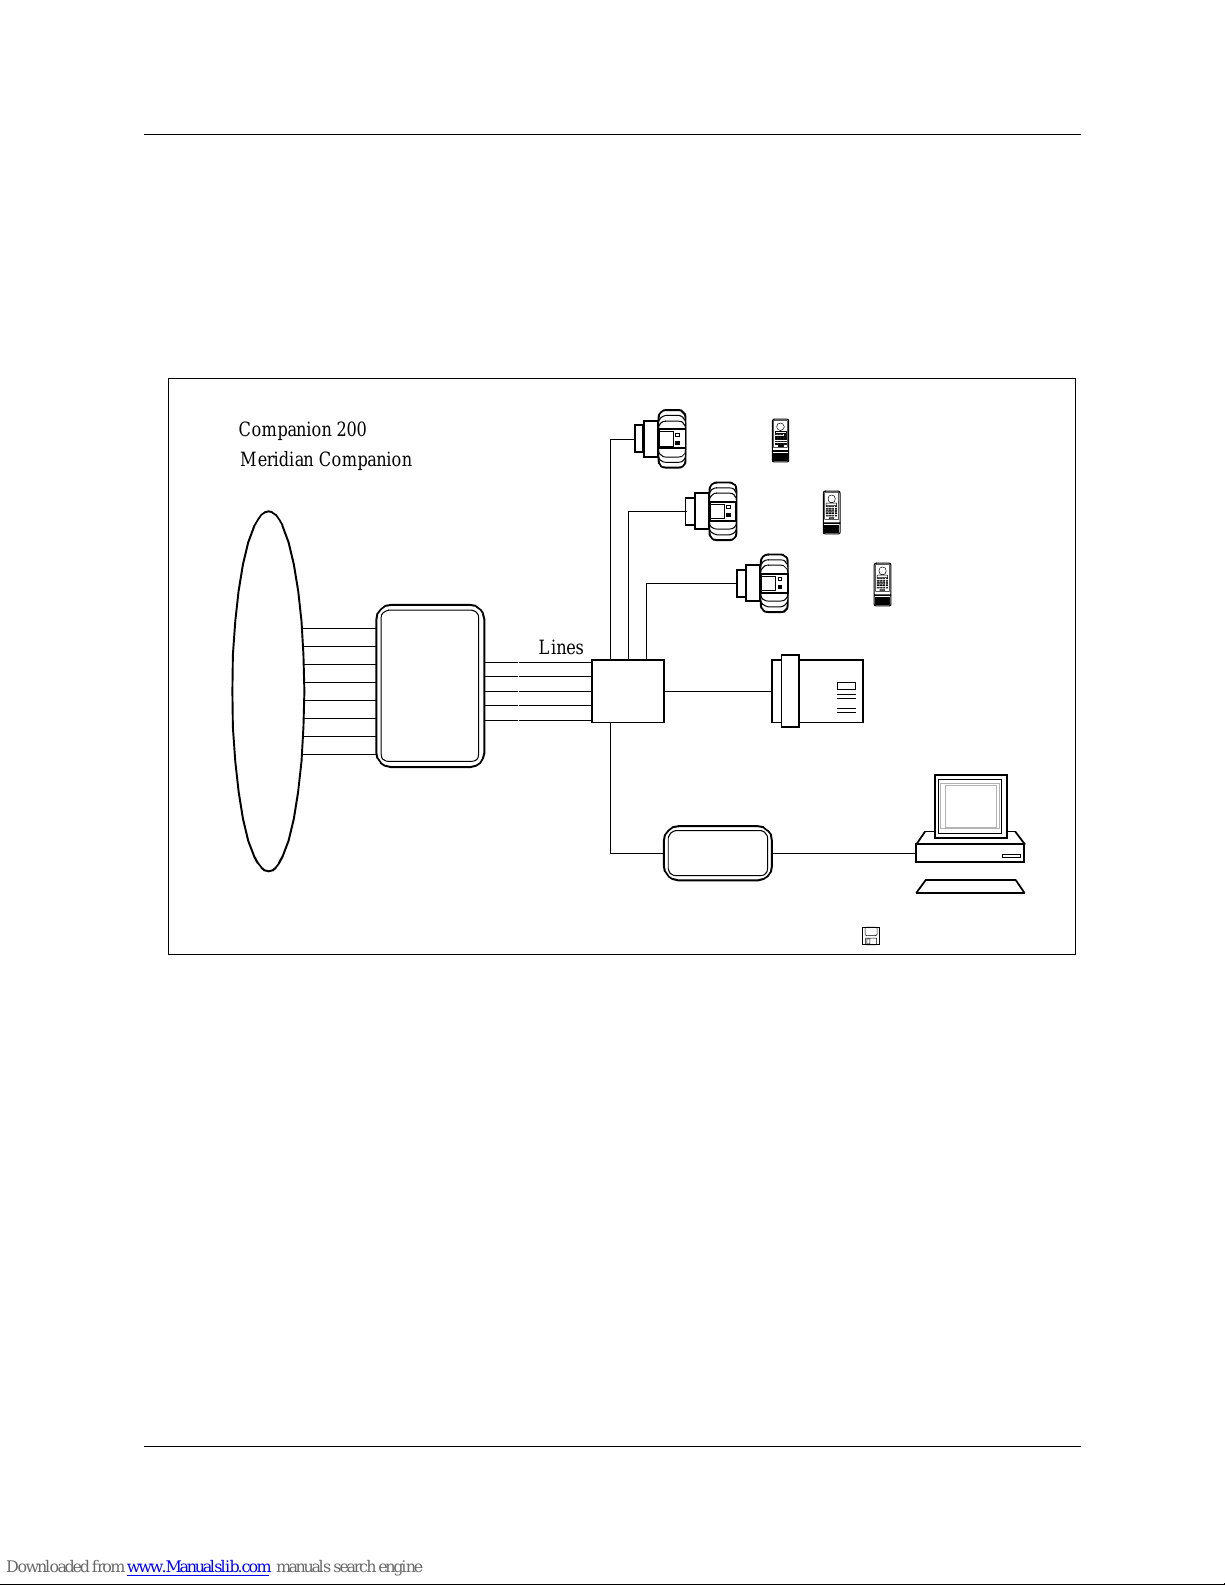
Figure 1 shows the connections that you must make to examine a
wireless system using CDS at the customer site. Refer to the Rem ote
Access Device Installation Guide if you require more detail on RAD
hardware connections or programming.
Figure 1: Overview of CDS local connections and wireless system
To connect the PC to the RAD
1. Connect one end of the RS232 cable to serial port 1 or 2 on the
PC using a connector that matches your PC’s port.
2. Place the PC within 100 feet (30 meters) of the RAD.
3. Connect the other end of the RS232 cable to the serial port on the
RAD using a female 25-pin connector.
To connect the RAD to the Controller:
1. Connect one end of the RAD TCM cable to the RJ-11 port on the
back of the RAD using the RJ-11 connector.
2. Place the RAD near the distribution block and within 100 feet
(30 meters) of the Controller.
Public
Switch
or
PBX
Controller
TCM
RAD
PC
Keyboard
Companion
Diagnostic
Software
CDS Application
Administrat ion
Terminal (M7310)
Distribut ion
Block
RS232 Cable
(max. 100 ft)
RAD
Base Stat ions
Public
Switch
or
PBX
Access
Lines
Portables
TCM
Cable
Companion 200
Lines
Meridian Companion
Page 12

10 Companion Diagnostic Software basics
Companion Diagnostic Software User Guide P0887339 Issue 02 Standard
Note: Place the RAD as close as possible to the distribution block.
Make sure that the combined length of the RAD TCM cable
and the TCM lines between the distribution block and the
Controller is less than 100 feet (30 meters).
3. Connect the loose wires on the other end of the RAD TCM cable
to an allowable free port (one of the first five TCM ports) at the
distribution block.
Note: Although an y of the f irst f i v e TCM ports are allow able for the
purposes of CDS, if you also intend to use the backup/restore
feature in Companion Manager, you should use the first TCM
port.
Ensure that the RAD TCM cable is free of bridge-taps and loading
coils.
Remote access connections using the RAD internal modem
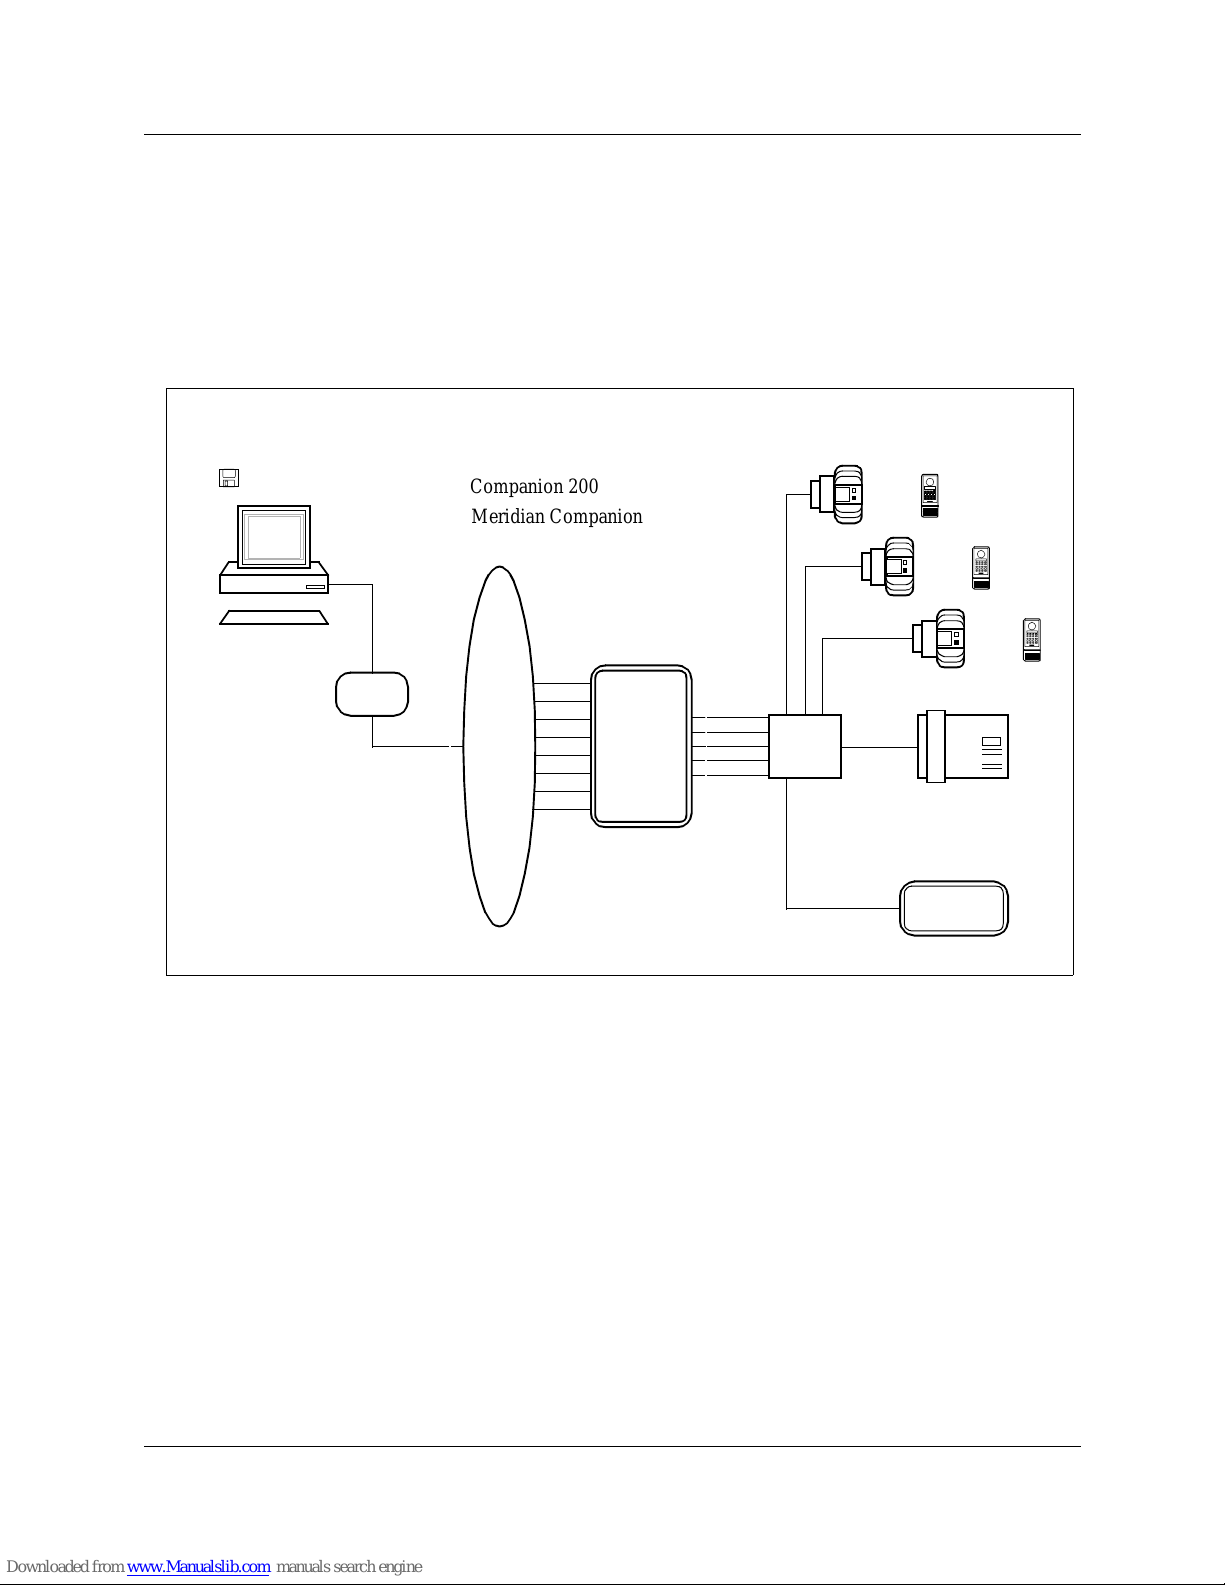
Figure 2 shows the connections that you must make to examine a
wireless system using CDS from a remote location via the RAD
internal modem. One of the lines into the Controller is dedicated to
the RAD. This line is not avail able for other devices. If a dedicated
line is not av ailable through the Controller , the RAD can share a line
with another device, although this is not recommended.
Page 13
Companion Diagnostic Software basics 11
P0887339 Issue 02 Standard Companion Diagnostic Software User Guide
The RAD must be programmed to answer the line automatically
when the PC dials in through the public switch. Refer to the Re m ote
Access Device Installation Guide if you require more detail on RAD
hardware connections or programming. If you require more detail on
wireless system hardware connections, refer to the wireless system
documentation.
Figure 2: Overview of CDS remote connections using the RAD internal modem
Public
Switch
or
PBX
Controller
TCM
RAD
PC
Companion
Diagnostic
Software
CDS Application
Administration
Terminal
Distribution
Block
RS232
RAD
Base Stat ions
Public
Switch
or
PBX
Access
Lines
Portables
Lines
(M7310)
Cable
(max.
100 ft)
PC
modem
Public
Switch
Line
Keyboard
TCM
Cable
Companion 200
Meridian Companion
Page 14

12 Companion Diagnostic Software basics
Companion Diagnostic Software User Guide P0887339 Issue 02 Standard
On-site connections required for remote access (with internal
modem)
To connect the RAD to the Controller:
1. Connect one end of the RAD TCM cable to the RJ-11 port on the
back of the RAD using the RJ-11 connector.
2. Place the RAD near the distribution block and within 100 feet
(30 meters) of the Controller.
Note: Place the RAD as close as possible to the distribution block.
Make sure that the combined length of the RAD TCM cable
and the TCM lines between the distribution block and the
Controller is less than 100 feet (30 meters).
3. Connect the loose wires on the other end of the RAD TCM cable
to an allowable free port (one of the first fi ve TCM ports) at the
distribution block.
Note: While any of the first five TCM ports are allowable for the
purposes of CDS, if you also intend to use the backup/restore
feature in Companion Manager, you should use the first TCM
port.
Ensure that the RAD TCM cable is free of bridge-taps and
loading coils.
Off-site connections required for remote access (with internal
modem)
PC serial ports 1 and 2 are supported by CDS.
To connect the PC to an external PC modem:
1. Connect one end of the RS232 cable to serial port 1 or 2 on the
PC using a connector that matches your PC’s port.
2. Connect the other end of the RS232 cable to the serial port on the
PC modem using a connector that matches the modem serial
port.
Note: The maximum length of an RS232 cable is 100 feet
(30 meters).
To connect the PC modem to the public switch:
1. Connect one end of the public switch line cable to the RJ -11 port
on the PC modem using an RJ-11 connector .
2. Connect the other end of the public switch line cable to the
public switch network.
Page 15
Companion Diagnostic Software basics 13
P0887339 Issue 02 Standard Companion Diagnostic Software User Guide
Remote access connections using a RAD external modem
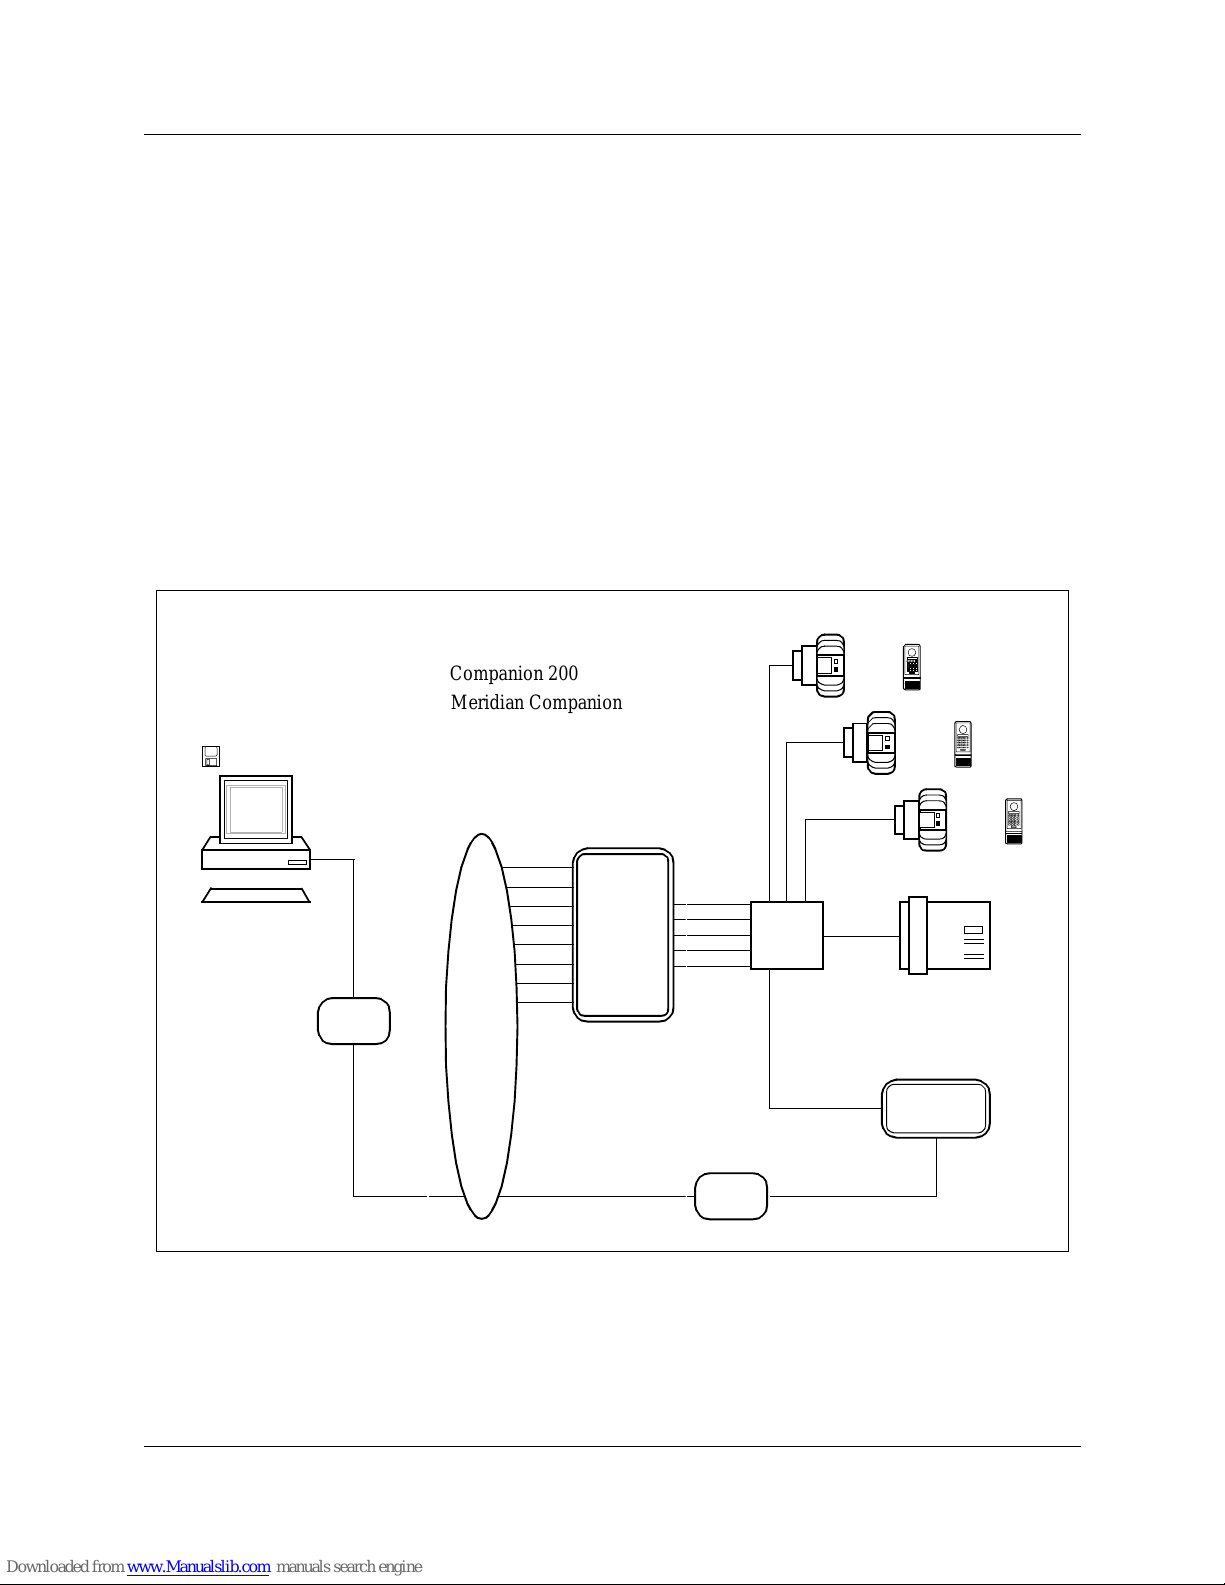
T o e xamine a wireless system using CDS from a remote loc ation via
a RAD external modem, no line into the c ontroller is dedicated to the
RAD. A line connects the RAD external modem directly to the
public switch or Private Branch Exchange (PBX), bypassing the
Controller . The PC dials the telephone number assigned to this line.
The external modem is connected to the RAD by an RS232 null
modem cable. See Figure 3 for the connections you must make to
examine a wireless system using CDS from a remote location using
a RAD external modem.
Note: Only 9600 baud can be supported with the external modem.
Figure 3: Overview of CDS remote connections using a RAD external modem
Public
Switch
or
PBX
Controller
TCM
RAD
PC
Companion
Diagnostic
Software
CDS Application
Administration
Terminal
Distribution
Block
RS232
RAD
Base Stat ions
Public
Switch
or
PBX
Access
Lines
Portables
lines
TCM
(M7310)
Cable
(max.
100 ft)
PC
modem
Public
Switch
Line
Keyboard
Public Switch
RAD
RS232 Null
Modem Cable
or PBX Line
External
Modem
Cable
Companion 200
Meridian Companion
Page 16

14 Companion Diagnostic Software basics
Companion Diagnostic Software User Guide P0887339 Issue 02 Standard
On-site connections required for remote access (with external
modem)
To connect a RAD to the Controller:
1. Connect one end of a RAD TCM cable to the RJ-11 port on the
back of a RAD using the RJ-11 connector.
2. Place the RAD near the distribution block and within 100 feet
(30 meters) of the Controller.
Note: Place the RAD as close as possible to the distribution block (a
32 inch (80 centimeter) cable has be e n provided). M a ke sure
that the combined length of the RAD TCM cable and the
TCM lines between the distribution block and the Contr oller
is less than 100 feet (30 meters).
3. Connect the loose wires on the other end of the RAD TCM cable
to an allowable free port (one of the first five TCM ports) (refer
to the Remote Access Device Instal l at ion Guide) at the
distribution block.
Note: Although an y of the f irst f i v e TCM ports are allow able for the
purposes of CDS, if you also intend to use the backup/restore
feature in Companion Manager, you should use the first TCM
port.
Ensure that the RAD TCM cable is free of bridge-taps and loading
coils.
To connect a RAD to a RAD external modem:
1. Connect one end of the RS232 null modem cable to the serial
port on the RAD using a female 25-pin connector.
2. Connect the other end of the RS232 null modem cable to the
serial port on the RAD external modem using an appropriate
connector.
To connect a RAD external modem to the public switch or PBX:
1. Connect one end of the line cable to the RJ-11 port on the RAD
external modem using an RJ-11 connector.
2. Connect the other end of the line cable to the public switch or
PBX.
Note: Only 9600 baud can be supported with the external modem.
Page 17

Companion Diagnostic Software basics 15
P0887339 Issue 02 Standard Companion Diagnostic Software User Guide
Off-site connections required for remote access (with external
modem)
PC serial ports 1 and 2 are supported by CDS.
To connect the PC to an external PC modem:
1. Connect one end of the RS232 cable to serial port 1 or 2 on the
PC using a connector that matches your PC’s port.
2. Connect the other end of the RS232 cable to the serial port on the
PC modem using an appropriate connector.
Note: The maximum length of an RS232 cable is 100 feet
(30 meters).
To connect the PC modem to the public switch:
1. Connect one end of the public switch line cable to the RJ -11 port
on the PC modem using an RJ-11 connector .
2. Connect the other end of the public switch line cable to the
public switch network.
Wireless system programming
The following is a summary of the wireless system progra mming
required for a local or remote connection. This programming is
performed on the wireless system’s Administration Terminal, and
should be recorded in the Programming Record of the Remote
Access Device Installation Guide. Programming must be complete d
at the customer site before you can use CDS. Refer to the Remote
Access Device Installation Guide if you require more detail on RAD
programming. Refer to the wireless system documentation if you
require more detail on wireless system programming.
Note: A RAD cannot be programmed if an RS232 cable is connected
to its serial port. Ensure that the required RAD programming
has been done before connecting the R S232 cable to the RAD
serial port.
Note: The System ID must be programmed for the RAD before you
can proceed. Refer to the Remote Access Device Installation
Guide for instructions on how to program the System ID for
the RAD. The RAD password defaults to the System ID.
Page 18

16 Companion Diagnostic Software basics
Companion Diagnostic Software User Guide P0887339 Issue 02 Standard
Note: Displayed data is referenced to the time and date of the
system. To ensure accurate referencing, use the
Administration Terminal to set the time correctly.
Local access programming
Ensure that the following steps have been completed before setting
up a new CDS site with local access:
• System ID programmed for the RAD
Remote access programming using the RAD internal modem
Ensure that the following steps have been completed before setting
up a new CDS site with remote access using the RAD inter nal
modem:
• the line into the wireless system dedicated to the RAD (note the
telephone number)
• System ID programmed for the RAD
• line type programmed as Key Service Unit (KSU) for the RAD
• allowable line number programmed for the RAD (refer to Remote
Access Device Installation Guide)
• Auto Answer programmed for the RAD
The Auto Answer settings programmed depend on how the RAD
internal modem is used.
If a line is dedicated to the RAD:
• set auto answer ‘on’ for the RAD
• set the number of rings before auto answer to ‘1’
If a line is shared with the RAD:
• set auto answer ‘on’ for the RAD
• set the number of rings before auto answer to a number between
‘1’ and ‘10’
Note: Beware of any telephony application that may cause the call
to be answered before the RAD answers automatically (e.g.,
Call Forward or Voice Mail).
In the case of a shared line, an alternate approach, is to set RAD Auto
Answer ‘off’ for normal wireless system operation. When you need
Page 19

Companion Diagnostic Software basics 17
P0887339 Issue 02 Standard Companion Diagnostic Software User Guide
to initiate a diagnostic session, contact someone at that site and ask
them to program RAD Auto Answer ‘on’, with the number of rings
before Auto Answer to ‘1’. You may then make the modem call to
the site and perform the diagnostics. At the end of the session,
contact the on-site person and ask them to program RAD Auto
Answe r ‘o ff’ again.
Remote access programming using a RAD external modem
Ensure that the following have been completed before setting up a
new CDS site with remote access using a RAD external modem:
• public switch line connected direc tly to the RAD external modem
(note the telephone number)
• System ID programmed for the RAD
Note: The only modem speed supported for this configuration is at
9600 bps.
Make a working copy
Make a working copy of the original CDS diskette. Use the working
copy diskette to install CDS on your hard dri ve or to use CDS from
your floppy drive. Store your original diskette as backup.
Installing and using CDS on your hard drive
To install CDS on your hard drive:
1. Insert the working copy diskette of CDS into your floppy drive.
Assuming your hard drive is ‘C’ and your floppy drive is ‘A’,
2. At the MS-DOS C:\> command prompt, type:
A:
and press
3. At the prompt A>, type:
CD_SETUP <source-drive> <destination-drive> [-d<lng>]
[-l<lng>]
for example: CD_SETUP A C -D ENG -L FRA
and press
Enter
Enter
Page 20

18 Companion Diagnostic Software basics
Companion Diagnostic Software User Guide P0887339 Issue 02 Standard
Note: The DOS commands in CD_SETUP and similar applic ations
are not case-sensitive.
CDS supports more than one language. Currently the two language
choices are:
1. ENG for English.
2. FRA for French.
In the above example both English and French will be installed on
your hard drive. The -d indicates the default language, and -l the
alternate language. English will be set up as the default language to
by used by CDS, CDS_ADM and RUNCDS.
If no language is entered during setup, the language used will be the
default set for your version. If an alternate language is not entered
during setup, only the default language will be installed. During
operation of CDS, the current default language can be changed to
any of the languages that were installed by CD_SETUP . This default
language will then be applied to both RUNCDS and CDS_ADM.
A CDSPLUS directory will be created containing all the files listed
below (see ‘Files needed by CDS’ and also ‘Appendix E’). You can
now use CDS from your hard drive.
Using CDS from your floppy drive
You can use CDS from your floppy drive, b ut beware of diskette
space limitations. If you plan to use CDS from your floppy drive:
1. Insert the working copy diskette of CDS into your floppy drive.
You can now use CDS from your floppy drive. Ensure that DOS
write protect is off and that the diskette remains in the floppy drive
for the entire CDS session. To set up, follow the same procedure as
for setting up CDS for a new site. See the section on ‘Site
administration’.
Files needed by CDS
The CDS application provides a directory called CDSPLUS at the
highest level on the drive that you have chosen. The following files
are in the CDSPLUS directory and are required to use the
application:
Page 21

Companion Diagnostic Software basics 19
P0887339 Issue 02 Standard Companion Diagnostic Software User Guide
• CDS.EXE: the main CDS program
• CDS_ADM.EXE: the CDS Administration Utility program
• HELVB.FON: the Helvetica font used to format text on the
display screens of CDS
• RUNCDS.EXE: the batch program for CDS, only required when
CDS is run in batch mode
• LNG_MSG.DAT: the default language file
• ???_MSG.DAT: the alternate language file (It will be either
ENG_MSG.DAT or FRA_MSG.D AT depending on the default
language.)
Page 22

20 Companion Diagnostic Software basics
Companion Diagnostic Software User Guide P0887339 Issue 02 Standard
Page 23

P0887339 Issue 02 Standard Companion Diagnostic Software User Guide 21
Site administration
• Location access
• Administration data
Page 24

22 Site administration
Companion Diagnostic Software User Guide P0887339 Issue 02 Standard
To create new sites or change the administration data of an existing
site, you must first access the CDS Administration Utility. CDS can
be set up to investig ate and store data for multiple sites.
The steps to create a new site or change the administration data of an
existing site var y with the type of connection, either local or remote.
If you want to use CDS on an existing site with its current
administration data, go dire ctly to ‘Starting CDS’ in the Us ing CDS
section of this guide.
Setting up CDS for a new site
When you are setting up CDS for a new site, you must know the
RAD System ID of the wireless system and the set value that
determines the edge of a cell or “cell edge RSSI” (default is
-70 dBm).
Note: The System ID must be programmed for the RAD before you
can proceed. Refer to the Remote Access Device Installation
Guide for instructions on how to program the System ID for
the RAD. The RAD password defaults to the System ID.
Local access
To set up a new site with local access:
1. Change to the CDSPLUS directory. Type:
CD \CDSPLUS
and press
2. Open the CDS Administration Utility. Type:
CDS_ADM
and press
3. When you are prompted for the site name, type an alphanumeric
name with a maximum of eight characters to identify the new
site, and press:
4. If no site sub-directory by that name exists, a prompt will ask
you to confirm the new site name. When you are prompted for
this confirmation, type:
Enter
Enter
Enter
Page 25
Site administration 23
P0887339 Issue 02 Standard Companion Diagnostic Software User Guide
Y
press
and go directly to step 5.
OR
If a site sub-directory by that name exists, the previous RAD
password of the existing site is presented on your PC screen. A
prompt will ask you to enter a new RAD password. If you do not
want to change the value, you can press to get the
previous value.
If you still want to create a new site, return to step 2 and repeat the
procedure with another site name.
Note: Once you have opened the administration data of an existing
site, you must follow all of the prompts before you are able to
exit. If you do not want to change a value, you can
press to get the previous value.
5. When you are prompted for the RAD password, a maximum of
10 numeric characters, type the RAD password and press:
Note: The RAD password is the same as the System ID, unless
another application has changed it.
6. When you are prompted for the type of connection, type:
L
and press
7. When you are prompted for the PC serial port, type the one-digit
number (1 or 2) that identifies the serial port on the PC that is
connected to the serial port on the RAD. Press:
8. When you are prompted for the cell edge RSSI, type the cell
edge RSSI (default is -70 dBm). Press:
Enter
Enter
Enter
Enter
Enter
Enter
Enter
Page 26

24 Site administration
Companion Diagnostic Software User Guide P0887339 Issue 02 Standard
When the new site sub-directory has been successfully created, CDS
displays a message and exits the CDS Administration Utility.
Remote access
When you are setting up CDS for a new site with remote access, you
must know some relev ant wireless system values. Before you begin,
obtain the follo wing values from the wireless system coordinator at
the site.
RAD System ID The System ID/password programmed for the
RAD.
Telephone number The telephone number of the line dedicated to
the RAD internal modem or the external modem. Valid characters
for remote access are the digits 0 to 9 and a comma (,). The comma
can be used to make the modem pause for dial tone. The duration of
the pause is modem dependent.
Dial type The dial mode, Pulse or T one, of the line connecting the
PC modem to the public switch.
Cell edge RSSI T h e system measured RSSI value at the cell edge
(default is -70 dBm).
Note: If the required wireless system programming has not been
done, you must complete these tasks before you can proceed.
See ‘W irele s s system programming’ in the CDS Basics
section of this guide for more detail on wireless system
programming requirements.
To set up a new site with remote access:
1. Follow steps 1 to 5 under the ‘Local access’ heading.
2. When you are prompted for the connection type, type:
R
and press
3. When you are prompted for the number to dial, type the
telephone number assigned to the line dedicated to the internal
or external RAD modem and press:
Enter
Enter
Page 27

Site administration 25
P0887339 Issue 02 Standard Companion Diagnostic Software User Guide
4. A prompt will ask for the dial type of t he line connecting the PC
modem to the public switch. When prompted for the dial type,
type:
P for Pulse or T for Tone
and press
5. When you are prompted for the modem speed, type the baud rate
(300, 1200, 2400, 9600) for the PC modem and press:
Note: A baud rate of 300, 1200, and 2400 for the PC modem dictates
the baud rate of the RAD internal modem. The 9600 baud rate
can only be used in the case of an external modem connected
to the RAD via a RS232 null modem cable, or in the case of
an autobaud with the FastRad.
6. You will be prompted with the recommended modem
initialization string. You will then be prompted with the current
modem initialization string. When you are creating a new site,
the current modem initialization string is the same as the
recommended one. If you do not want to change the modem
initialization string press:
and go directly to step 7.
OR
If the PC modem is Hayes compatible but does not default to the
Hayes mode, you will need to change the modem initialization
string. Type the string required by the Hayes compatible PC
modem and press:
Note: See Appendix A in this guide for further information on the
PC modem initialization string.
7. When you are prompted for the PC serial port, type the one-digit
number (1 or 2) that identif ies the serial port on the PC connected
to the serial port on the PC modem. Press:
Enter
Enter
Enter
Enter
Enter
Page 28

26 Site administration
Companion Diagnostic Software User Guide P0887339 Issue 02 Standard
8. When you are prompted for the cell edge RSSI, type the cell
edge RSSI (default is -70 dBm) . Press:
When the new site sub-directory has been successfully created, CDS
displays a message and exits the CDS Administration Utility.
Files created by setting up a new site
The procedure to set up CDS for a new site creates a site subdirectory with an extension of .SIT in the main CDSPLUS
directory. You can have many site sub-directories in the main
CDSPLUS directory . The following f ile is in each site sub-directory:
CDS_ADM.DAT
This site administration file contai ns the administration da ta
pertaining to the site for which the sub-directory was created.
Changing the administration data of an existing site
If relevant wireless system programming, or the type of connection
has changed, any attempt to start CDS for an e xis ting s ite under the
previous administration data will result in an error. Before you can
successfully start CDS for that site, you must access the CDS
Administration Utility and change the administration data of the
affected CDS site to correspond to the new wireless system values.
Note: Once you ha ve opened the CDS Administration Utility for an
existing site, you must follow all of the prompts before you
are able to exit. If you do not want to change a value, you can
press the key to get the previous value settings.
Local access
To change the administration data of an existing site with local
access, or to change an existing site from remote acces s to local
access:
1. Change to the CDSPLUS directory. Type:
CD \CDSPLUS
and press
Enter
Enter
Enter
Page 29
Site administration 27
P0887339 Issue 02 Standard Companion Diagnostic Software User Guide
2. Open the CDS Administration Utility. Type:
CDS_ADM
and press
3. When you are prompted for the site name, type the alphanumeric
name that identifies the existing site. Press:
4. If a site sub-directory by that name exists, the previous RAD
password of the existing site is presented on your PC screen. A
prompt will ask you to enter the new RAD password with a
maximum of 10 numeric characters. When you are prompted,
type the new RAD password. Press:
Go directly to step 5.
If you do not want to change the RAD password of the existing
site, press:
OR
If no site sub-directory by that name exists, a prompt will ask
you to confirm a new site name. If you still want to attempt to
change the administration data of an existing site, you must
return to step 3 and try again.
When you are prompted, type:
N
and press
OR
If you no longer want to attempt to change the administration
data of an existing site, exit the CDS Administration Utility.
When you are prompted, type:
E
and press
Enter
Enter
Enter
Enter
Enter
Enter
Page 30

28 Site administration
Companion Diagnostic Software User Guide P0887339 Issue 02 Standard
5. The previous connection type is displayed. When you are
prompted for the new connection type, type:
L
and press
6. The previous serial port number is displayed. When you are
prompted for the new PC serial port, type the one-digit number
(1 or 2) that identifies the serial port on the PC c onnec ted to the
serial port on the RAD and press:
7. When you are prompted for the cell edge RSSI, type the cell
edge RSSI (default is -70 dB m). Press:
When the administration data has been successfully changed, CDS
confirms the site data and exits the CDS Administration Utility.
Remote access
If the administration data of an e xisting site with remote access has
changed, or you want to change an existing site from local access to
remote access, you must know some relevant wireless system
values. Before you begin, contact the wireless system coordinator at
the site to ensure that you know the following:
RAD System ID The System ID/password programmed for the
RAD.
Telephone number The telephone number of the line dedicated to
the RAD internal modem or the external modem. Valid characters
for remote access are the digits 0 to 9 and a comma (,). You can use
the comma to insert a pause for dial tone. T he length of the pause is
modem-dependent.
Dial type The dial mode, Pulse or Tone, of the line connecting the
PC modem to the public switch.
Cell edge RSSI T he syst em measur ed Receive Signal Strength
Indicator (RSSI) value at the cell edge (default is -70 dBm).
Enter
Enter
Enter
Page 31
Site administration 29
P0887339 Issue 02 Standard Companion Diagnostic Software User Guide
To change the administration data of an existing site with remote
access, or to change an existing site from local access to remote
access:
1. Follow steps 1 to 4 under the ‘Local access’ heading.
2. The previous connection t ype is displayed and you are prompted
for the new connection type. If you are already in remote access,
press:
If you are in local access, type:
R
and press
3. The previous number of the remote modem is displayed and you
are asked if you want to change it. If you do not want to change
the number, press:
Go directly to step 4.
OR
If you want to change the number, when you are prompted with
the new telephone number, type the new telephone number
assigned to the line dedicated to the internal or external modem
RAD and press:
4. The previous dial type of the line connecting the PC modem to
the public switch is displayed and you are asked if you want to
change it. If you do not want to change the dial type, press:
Go directly to step 5.
OR
If you want to change the dial type of the line connecting the PC
modem to the public switch, when you are prompted for the new
dial type, type:
Enter
Enter
Enter
Enter
Enter
Page 32
30 Site administration
Companion Diagnostic Software User Guide P0887339 Issue 02 Standard
P for Pulse or T for Tone
and press
5. The previous modem speed is displayed. You are asked if you
want to change the modem speed. If you do not want to change
the modem speed, press:
Go directly to step 6.
OR
If you want to change the modem speed, when you are prompted
for the new modem speed, type the new baud rate (300, 1200,
2400, 9600) for the PC modem and press:
Note: A baud rate of 300, 1200, and 2400 for the PC modem dictates
the baud rate of the RAD internal modem. The 9600 baud rate
can only be used in the case of an external modem connected
to the RAD via a RS232 null modem cable, or in the case of
an autobaud with the FastRad.
6. You will be asked if you want to change the initialization string
sent to the PC modem. If you do not want to change the
initialization string, when prompted, press:
Go directly to step 7.
OR
If you want to change the initialization string, when prompted
type the new initialization string and press:
Note that the current modem initialization string and the
recommended modem initialization string are not necessarily the
same. The current modem initialization string is the last value
that you entered.
Enter
Enter
Enter
Enter
Enter
Page 33
Site administration 31
P0887339 Issue 02 Standard Companion Diagnostic Software User Guide
Note: See Appendix A in this guide for further information on the
PC modem initialization string.
7. The previous PC serial port is displayed. You are asked if you
want to change the PC serial port. If you do not want to change
the PC serial port, press:
If you want to change the PC serial port, when you are prompted
for the new PC serial port, type the one-digit number (1 or 2) that
identifies the serial port on the PC connected to the serial port on
the PC modem. Press:
8. When you are prompted for the cell edge RSSI, type the cell
edge RSSI (default is -70 dBm) . Press:
When the administration data has been successfully changed, CDS
confirms the site data and exits the CDS Administration Utility.
Enter
Enter
Enter
Page 34

32 Site administration
Companion Diagnostic Software User Guide P0887339 Issue 02 Standard
Page 35

P0887339 Issue 02 Standard Companion Diagnostic Software User Guide 33
Using Companion Diagnostic Software
• Getting started
• Selecting data
• Screen components
• Keyboard functions
Page 36
34 Using Companion Diagnostic Software
Companion Diagnostic Software User Guide P0887339 Issue 02 Standard
Starting CDS
To start the application:
1. From the CDSPLUS directory, type:
CDS
and press
2. At start up, CDS presents a site selection display screen.
3. The site selection display screen prompts you for a site name.
Type the name of the site you want to examine. Press:
OR
To display the list of all possible sites, press:
Enter
Enter
Enter
Page 37
Using Companion Diagnostic Software 35
P0887339 Issue 02 Standard Companion Diagnostic Software User Guide
Figure 4: List of Sites display screen
The list of sites display screen prompts you for a site name. T ype the
name of the site you want to examine. Press:
Note: Once you start CDS for a selected site, you must exit and start
a new CDS session to examine data from another site.
Site Selection
Site name
Site 1
Site 2
Site 3
Num ber of
2
5
1
LIST OF SITES
Enter site name:
datasets
^Brk
F9F8F7F6F5F2F1 F4^F3Esc
Exit Up Down
F10
Enter
Page 38
36 Using Companion Diagnostic Software
Companion Diagnostic Software User Guide P0887339 Issue 02 Standard
Selecting data
During a CDS session, you can examine data fetched directly from
the wireless system or a dataset. A dataset is data fetched from the
wireless system in a pre vious CDS session t hat was sa ved in a f ile on
disk. See the Utilities section in this guide for instruction on how to
manage site datasets.
After you enter the target site name, CDS searches the site subdirectory for saved datasets. If the target site has previously saved
datasets, CDS presents a saved datasets display screen.
Figure 5: Saved datasets display screen
SITE DATA ACCESS
Site Directory:
XYZ
Dataset
C - 290698
C - 100798
C - 100898
C - 230998
C - 250998
Dataset
1
2
3
4
5
Time of
29/06/98-14:38
10/07/98-12:01
10/08/98-21:54
23/09/98-08:32
25/09/98-10:47
LIST OF SITE DATASETS
Direct Wireless System access is default. (Press Enter).
Otherwise, enter a dataset no.:
No. Creation Title
^BrkF9F8F7F6F5F2F1 F4^F3Esc
Exit Up Down
F10
Page 39
Using Companion Diagnostic Software 37
P0887339 Issue 02 Standard Companion Diagnostic Software User Guide
1. To select a saved dataset, type the dataset number and press:
OR
To fetch data directly from the wireless system, press:
Note: You cannot examine both a saved dataset and data fetched
directly from the wireless system during a single CDS
session. You must start a new CDS session to change the type
of data being examined.
Automatic system configuration
CDS automatically determines the system configuration whenever
you fetch data directly from a wireless system.
CDS informs you if there have been any hardware changes since the
last time CDS was connected to the system. If there are any
differences from the configuration of a previous diagnosis session, a
warning appears on the screen (see Figure 7). File or display the new
configuration by going to the “Vie w System Configuration” in the
Utilities Menu.
Enter
Enter
Page 40
38 Using Companion Diagnostic Software
Companion Diagnostic Software User Guide P0887339 Issue 02 Standard
Figure 6: Configuration Change Notice
After automatic system configuration is completed the Main menu
screen is displayed, if no changes are found.
Exiting CDS
To exit CDS:
1. Press:
Note: This is signified by ‘^F3’ on your screen. (^ = ‘Ctrl’)
****************************
****************************
IMPORTANT
^Brk
F8F7F6F2F1 F4^F3Esc F10
Press any key to continue...
The wireless system configuration has changed!
Display or file the new configuration using the
“View System Configuration” command in the UTILITIES Menu.
***Message Logged at Wed Mar 19 13:48:05 1998
064 CCV-I-AUTOVRFY Configuration was automatically verified for all cells.
F5
F9
Ctrl
F3
Page 41
Using Companion Diagnostic Software 39
P0887339 Issue 02 Standard Companion Diagnostic Software User Guide
Display screen components
The display screens have four basic components. They may have a
fifth component, depending on the depth of analysis a vailable on the
current display screen.
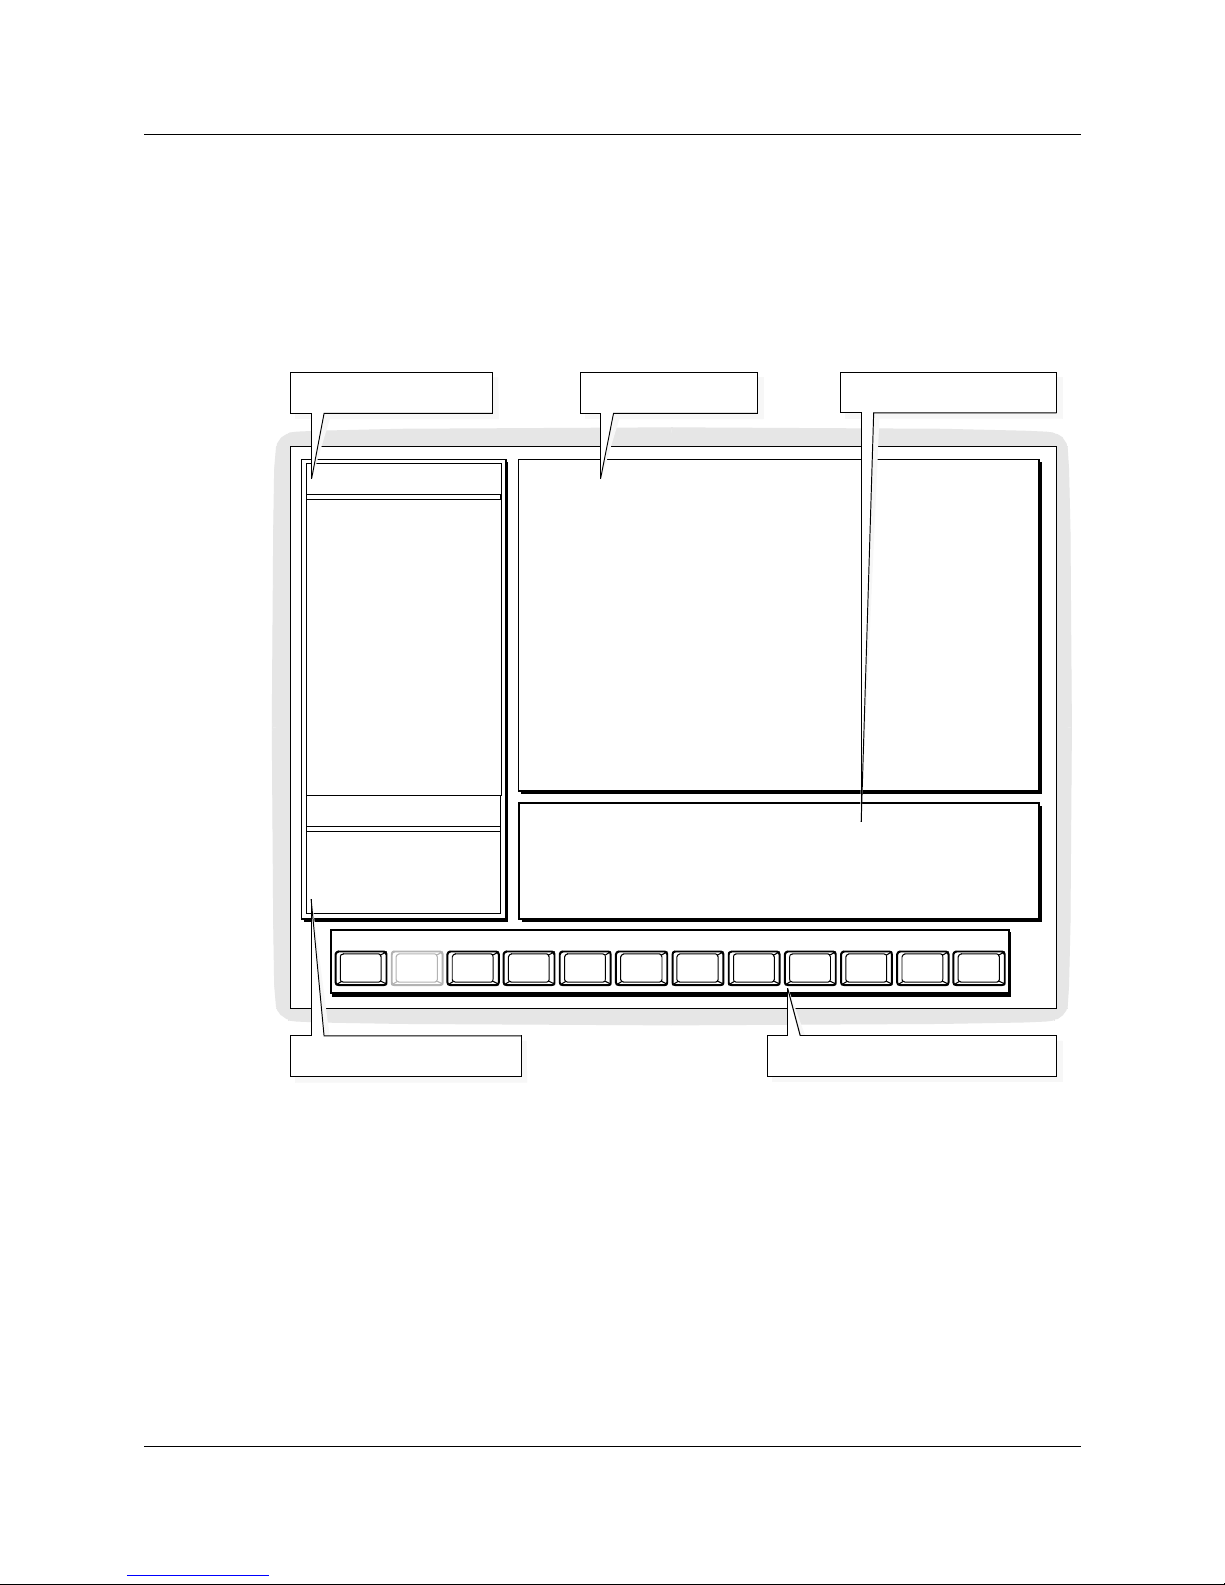
Figure 7: Display screen components
1. The command menu presents the commands available to access
more detailed information from the current display screen.
2. The data window presents statistics in the form of tables, bar
graphs, or text explaining the results of the automatic system
diagnosis.
3. The dialogue window briefly summarizes or supplements the
tables or bar graphs presented in the data window.
2.
Data Window
1.
Command Menu
^BrkF9F8F7F6F5F2F1 F4^F3Esc
GoBack Exit File Up DownCancel Disable/Yes Details Commit Abort
F10
4.
Keyboard Function Window
5.
Subcommand Menus
3.
Dialogue Window
No
Page 42

40 Using Companion Diagnostic Software
Companion Diagnostic Software User Guide P0887339 Issue 02 Standard
4. The keyboard function window indicates the keyboard
functions available on the current display screen. Bold keys are
active.
5. The subcommand menus of fer further choices, if available, to
select time interval, type of comparison data, or type of data
display.
A Typical CDS Session
Assuming that a site is already set up (as given in the “Site
Administration” section), the CDS operator will normally perform
the following steps:
1.
Start CDS
—In the CDSPLUS directory, type
CDS
and press Enter.
CDS will displa y the Site Selection screen (Fig ur e 4) .
2.
Select Site
—CDS will prompt you for the name of the Site.
Type in the
<sitename>
and press Enter.
CDS then displa ys the list of available data sets for the selected site.
3.
Choose current syst em information or historical dataset
—You may review a previously
saved dataset [type th e datase t name and Ent er], or the system 's prese nt status [p ress
Enter]. While CDS is fetching data and configuring a wireless system, it displays a
fetch status bar. Wai t about five minutes, depending on the size of the system.
The main menu appears when completed.
4.
Conduct Diagnosis
—The Diagnosis command is highlighted. Press
D
or Enter.
The Diagnosis Display Screen is displayed (see Figure 12).
5.
Analyze Results
—The Diagnosis Results bar chart summarizes the s ys tem’s performance.
Press F6 to obtain further on-screen deta ils (press F6 again to return to the graph). Refer to
Appendix B for full explanations.
6.
Save Information
—The compiled data is now resident in active memory. To save it for
future reference, create a dataset in this way:
• Return to the main menu —> Press the ESC key
• Select the Utilities-l evel menu —> Press
U(tilities)
• Create a dataset —> Press
C(reate Dataset)
CDS will prompt you for a dataset name (Hint: use today’s date, up to 15 characters) and
press Enter. CDS will indicate when the dataset has been saved and return you to the
Utilities display screen.
7.
Exit CDS
—Press the Ctrl + F3 keys (^F3) to close the CDS session.
Page 43
Using Companion Diagnostic Software 41
P0887339 Issue 02 Standard Companion Diagnostic Software User Guide
Keyboard functions
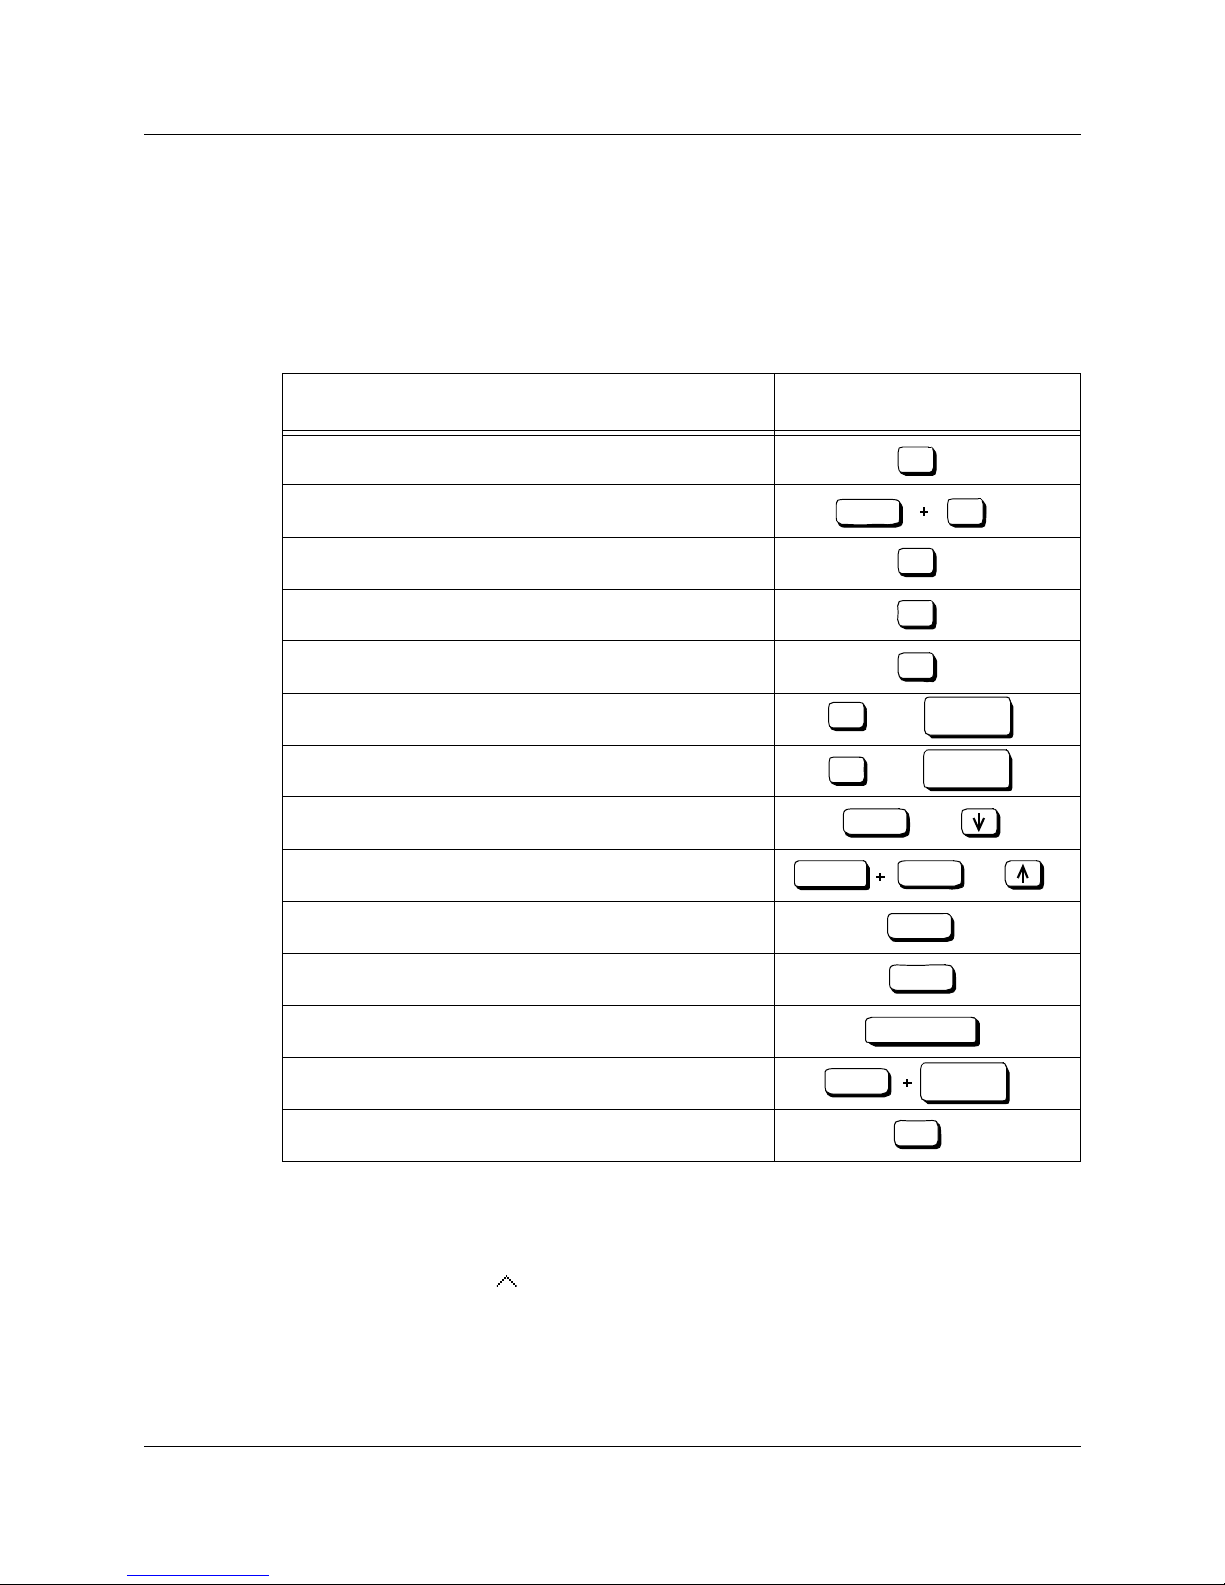
The PC function keys shown below are used to manipulate the
display screens and to select commands. Keys that must be pressed
in unison are joined by a plus sign.
Table 1: Keyboard functions
Although not e very keyboard f unction is available for every display
screen, the Keyboard Function window highlights the keys you can
use with the current display screen. The Control key is represented
by the symbol on the Keyboard Function window.
Functions Keys
Cancel procedure pending disable command.
Exit Companion Diagnostic Software.
File displayed statistical information to disk.
Disable a radio to monitor it.
Diagnosis details or display.
Scroll data up one page.
Scroll data down one page.
Select the next command.
Select the previous command.
Go to the top of the list.
Go to the bottom of the list.
Delete the last character entered.
Abort the current command.
Go back to the previous display screen.
F2
Ctrl F3
F4F5F6
or
F7
Page
Up
or
F8
Page
Down
or
Tab
or
Shift
Tab
Home
End
Backspace
Ctrl
Pause
(Break)
Esc
Page 44

42 Using Companion Diagnostic Software
Companion Diagnostic Software User Guide P0887339 Issue 02 Standard
Making menu selections
To make a selection from a Command or Subcommand Menu:
1. Type the letter of the command highlighted.
OR
Press the Tab or arrow keys until the command you want is
highlighted by the box outline, then press:
Commands and subcommands that are active on the current display
screen are enclosed in a shaded box. If no shaded box appears on the
current display screen, the active command is the title of the
Command Menu.
To go to the previous level of a command path:
1. Press:
Files created when using CDS
The following file is created in the \CDSPLUS directory when using
CDS:
CDS_ERR.LOG
The following files are created in the \CDSPLUS\<sitename>.SIT
directory when using CDS:
R_RESULT.LOG
<filename>.PDM
(for example, 194HCN38.PDM)
RADIOS.CEL
REPORT.TXT
CDS_ADM.DAT
See Appendix E for more information on these files.
Enter
Esc
Page 45

P0887339 Issue 02 Standard Companion Diagnostic Software User Guide 43
Display screens
• Diagnosis
• Monitor
• Utilities
Page 46

44 Display screens
Companion Diagnostic Software User Guide P0887339 Issue 02 Standard
Command map
The following map shows the hierarchy of commands and
subcommands av aila ble to access information. Typing the outlined
letters selects the command.
Table 2: Command map
Level 1 Commands Level 2 Commands Level 3 Commands Subcommands
Diagnosis Quality of Service Lost Links
Voice Quality
Auto Interval
Busiest Hour
24 Hour Interval
System Faults Base Station Resets
Radio Resets
Synch Failure
Lost Integrity
Radio Signals Weakest Radio
Next Weakest
Versus System
Versus Cell
Radio Statistics
Cell Signals Weakest Cell
Next Weakest
Cell Statistics
CSC-Link Statistics
Interference Lost Link RSSI
Traffic Radio Occupancy
Cell Occupancy
Busiest Hour
Next Busiest
Bar Chart
Statistics
CSC Links CSC Signals Weakest Cell
Next Weakest
Cell Statistics
Radio Statistics
CSC Usage Cell Statistics
Radio Statistics
Busiest Hour
Next Busiest
Monitor Background RSSI
Reset RIM
Query BS Faults
Clear BS Faults
Clear Counters
Traffic Chans 1-40
CSC Receive Scan
CSC Transmit Scan
CSC Rx & Tx Scan
Utilities View System Configuration
Create Dataset
Delete Dataset
Change Language
Page 47
Display screens 45
P0887339 Issue 02 Standard Companion Diagnostic Software User Guide
Main menu
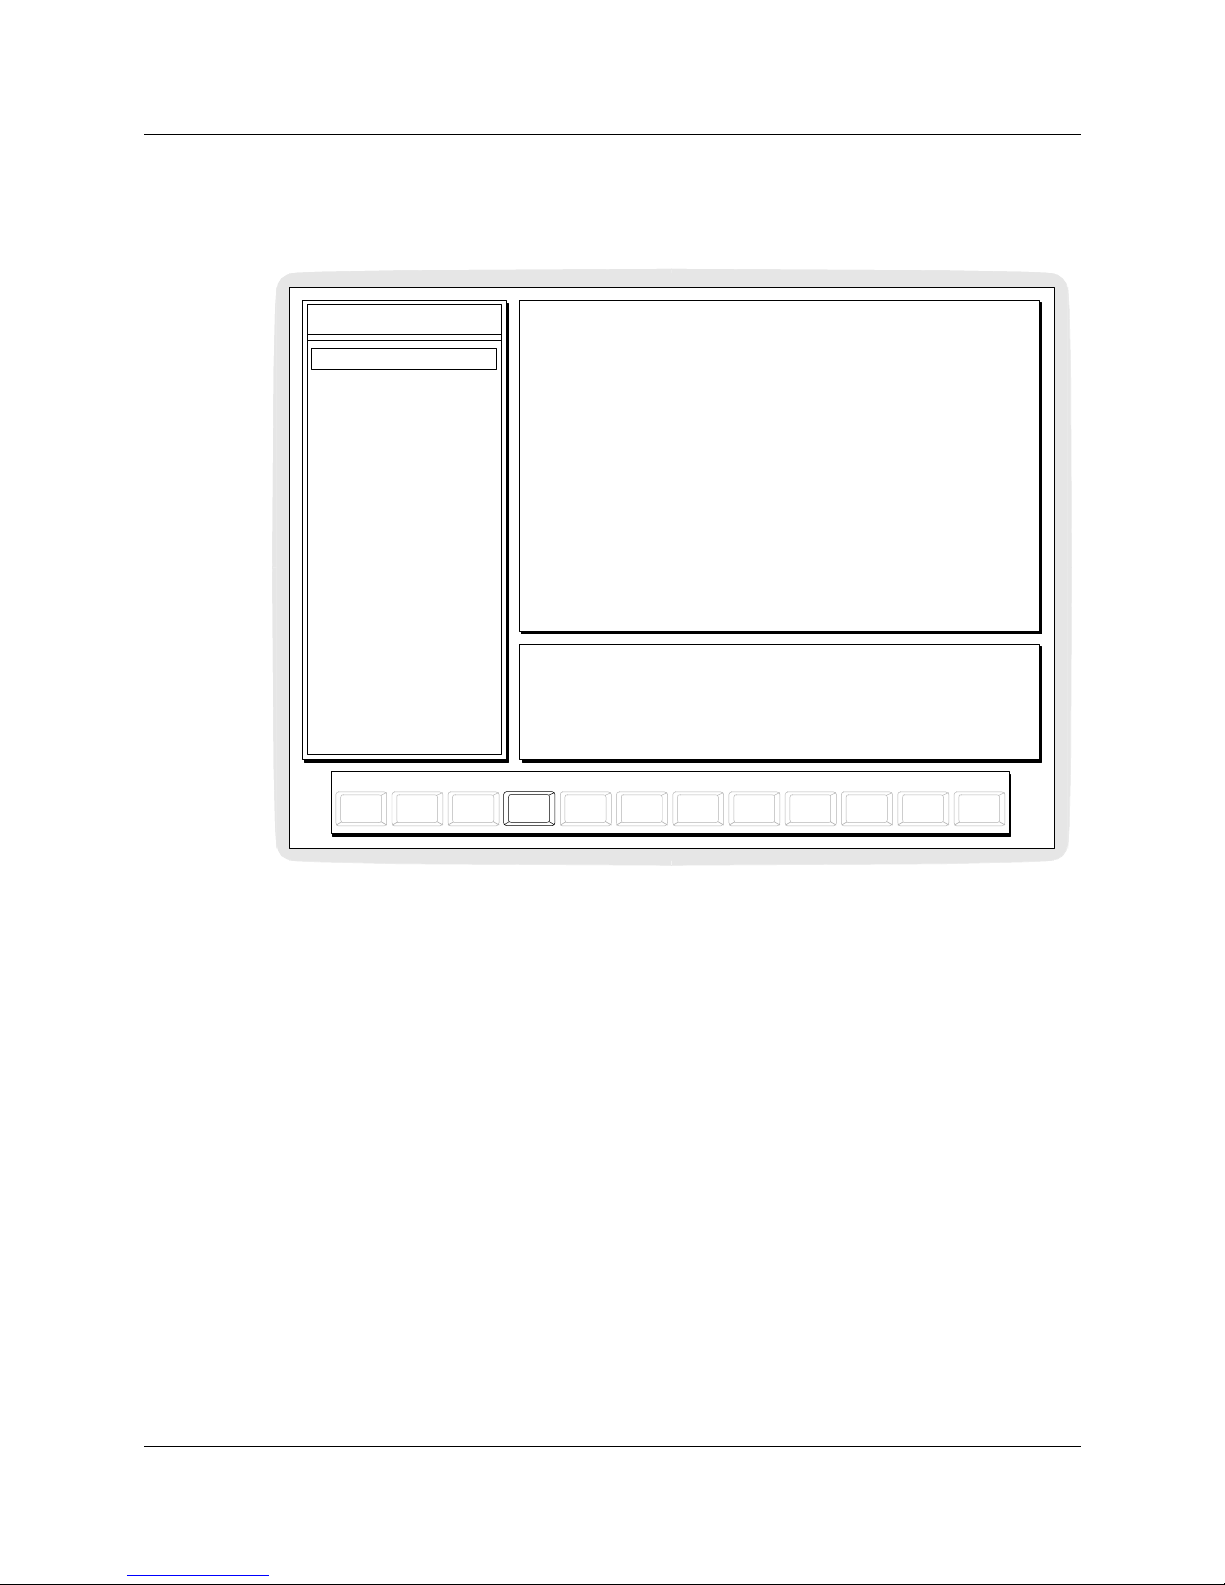
Figure 8: Main menu
After entering the target site name and selecting the data, the main
menu display screen is presented. Select from the available first le vel
command choices.
Diagnosis Option
The diagnosis option is the single most powerful command in CDS.
Selecting this option results in the following:
1. A ut omatic System Diagnosis
The CDS diagnostic function analyses and evaluates stored
historical data from the wireless system and automatically
determines what problems your system is experiencing. The data
examined can be fetched from a previously saved dataset in the
site sub-directory or it can be fetched directly from the wireless
system. A diagnostic results summary is immediately displayed
in the form of a bar chart annotated with a summary of the
number of alarms and warnings that may have been found. A
detailed description of these alarms and warnings along with
MAIN MENU
M
onitor
U
tilities
D
iagnosis
^Brk
F9F8
F7F6F5F2F1 F4^F3Esc
Exit
F10
Page 48

46 Display screens
Companion Diagnostic Software User Guide P0887339 Issue 02 Standard
recommended actions is made available to you through further
display screens as well as being written to the site directory in
the REPORT.TXT file (see “Automatic System Diagnosis”
below).
2. Diagnosis Menu
Diagnosis display screens allow you to manually evaluate and
examine historical data on the operation of the wireless system.
The data examined can be a previous ly saved dataset in the site
sub-directory or data can be fetched directly from the wireless
system (see ‘Diagnosis Menu Options’ below). The level 2
commands available under the Diagnosis menu are:
•Quality of Service
•System Faults
•Radio Signals
•Cell Signals
•Interference
•Traffic
•CSC Links
Monitor Option
Monitor display screens present real time wireless system
information and are not available if you start CDS with a saved
dataset (see ‘Monitor’ belo w). The le vel 2 commands availa ble
under the Monitor menu are:
• Background RSSI
• CRC Erro rs
• Reset RIM
• Query BS Faults
• Clear BS Faults
• Clear Counters
Utilities Option
The Utilities option manages the data captured by CDS (see
‘Utilities’ below). The le vel 2 commands available under the
Utilities menu are:
• V iew System Configuration
• Create Dataset
Page 49

Display screens 47
P0887339 Issue 02 Standard Companion Diagnostic Software User Guide
• Delete Dataset
• Change Language
Diagnosis
Select the diagnosis key whenever you want to diagnose problems
on a wireless sy st em .
Automatic System Diagnosis
The Automatic System Diagnosis function is automatically in v oked
when you choose the diagnosis option from the main menu.
Automatic System Diagnosis identifies problems in the wireless
system and gives you e xplicit actions for these problems. Automatic
System Diagnosis determines what operational problems exist in
four major areas corresponding to the vertical bars in the graph in
Diagnosis Display Screen on page 50.
1. System Faults
System Faults provides an overall view of detected system faults,
since the last system autodiagnosis on a live system, in the
following categor ies:
•Base Station resets
•Radio resets
•Synchronization failures
•Lost integrity
Alarms and warnings are issued based on the number of times
the fault has occurred.
2. Signals
Signals examines the av erage signal strength of individual radios
and cells in the wireless system.
Radio signal statistics are calculated for the elapsed time since
the last system reset.To get enough radio signal samples to allow
accurate analysis, the system should have been operating for
about a week. If the number of samples for a given radio or cell
is below a system- calculated threshold, the analysis is not done
for that radio or cell.
There are two types of warnings issued in this category.
Page 50

48 Display screens
Companion Diagnostic Software User Guide P0887339 Issue 02 Standard
a. The average radio RSSI is weak in a cell.
This warning is issued for cells whose radios have an av erage
Receiv e Signal Strength Indicator (RSSI) below a systemcalculated threshold. The cause of a weak average radio RSSI
in a cell may be high traffic in adjacent cells.
b. The average radio RSSI is weak for a radio.
This warning is issued for radios whose average RSSI is
below a threshold. The calculated threshold is based on the
quality of service measure. If a radio in a Base Station is
demonstrating lo w RSSI, it must be checked against the other
radio in the Base Station.
3. Interference
Interference examines the channel occupancy pattern. If the
higher channel segments are used more than the lower ones, this
is an indication of a potential source of interference.
Channel occupancy statistic s are kept for the elapse d time s inc e
the last system reset. In order to perform an interference
analysis, the number of link attempts in the system must be
greater than a system calculated threshold. A link is an
established radio signal communication between a portable and
a Base Station radio.
There is only one warning in this category . It is used when there
are one or more radio channels that have not been used. In this
case, you should search for a source of external interference
using the Monitor Background RSSI utility (see “Monitor”
below).
Note: If channel 40 is not used, a warning is not issued because
channel 40 is rarely used i n CT2Plus. Its primary us e is to
serve as a guard band between traffic and CSC channels.
4. Traffic
Traffic examines individual radios and cells for traffic
overloading.
Traf fic statistics are kept for the last 24 hours of operation. Every
hour is checked for high traffic conditions for both cells and
radios.
Page 51

Display screens 49
P0887339 Issue 02 Standard Companion Diagnostic Software User Guide
There are three types of warnings issued in this category.
a. Total tra ffic is high in a cell.
This warning is issued for cells whose total traffic (i.e. the
sum of the traf fic on a ll radios in the c ell) is greater than a predefined threshold (currently set to 2.4 Erlangs). When this
situation occurs, the cell starts to run out of free channels or
radios. In this case you should add another Base Station to the
cell and/or redeploy the system focusing on increasing the
cell density near the high traffic cell.
b. Average radio traffic is high in a cell.
This warning is issued for cells whose average radio traffic is
greater than a system calculated threshold. When this
situation occurs, there is a high proba bility that a call attempt
will be blocked because there are no radios available in the
cell. In this case, you should add another Base Station to the
cell.
c. Average radio traffic is high for a given radio, and another
radio in the same cell has handled little or no traffic.
When this situation occurs, there is a high probability that the
radio that has handled a small percentage of the traffic is not
functioning properly. In this case, you should check the radio
to determine if it is functioning properly.
Note: If the low traffic radio has been operating as a CSC radio for
a significant percentage of the past 24 hours, then this
warning is not issued.
Page 52
50 Display screens
Companion Diagnostic Software User Guide P0887339 Issue 02 Standard
Figure 9: Diagnosis Display Screen
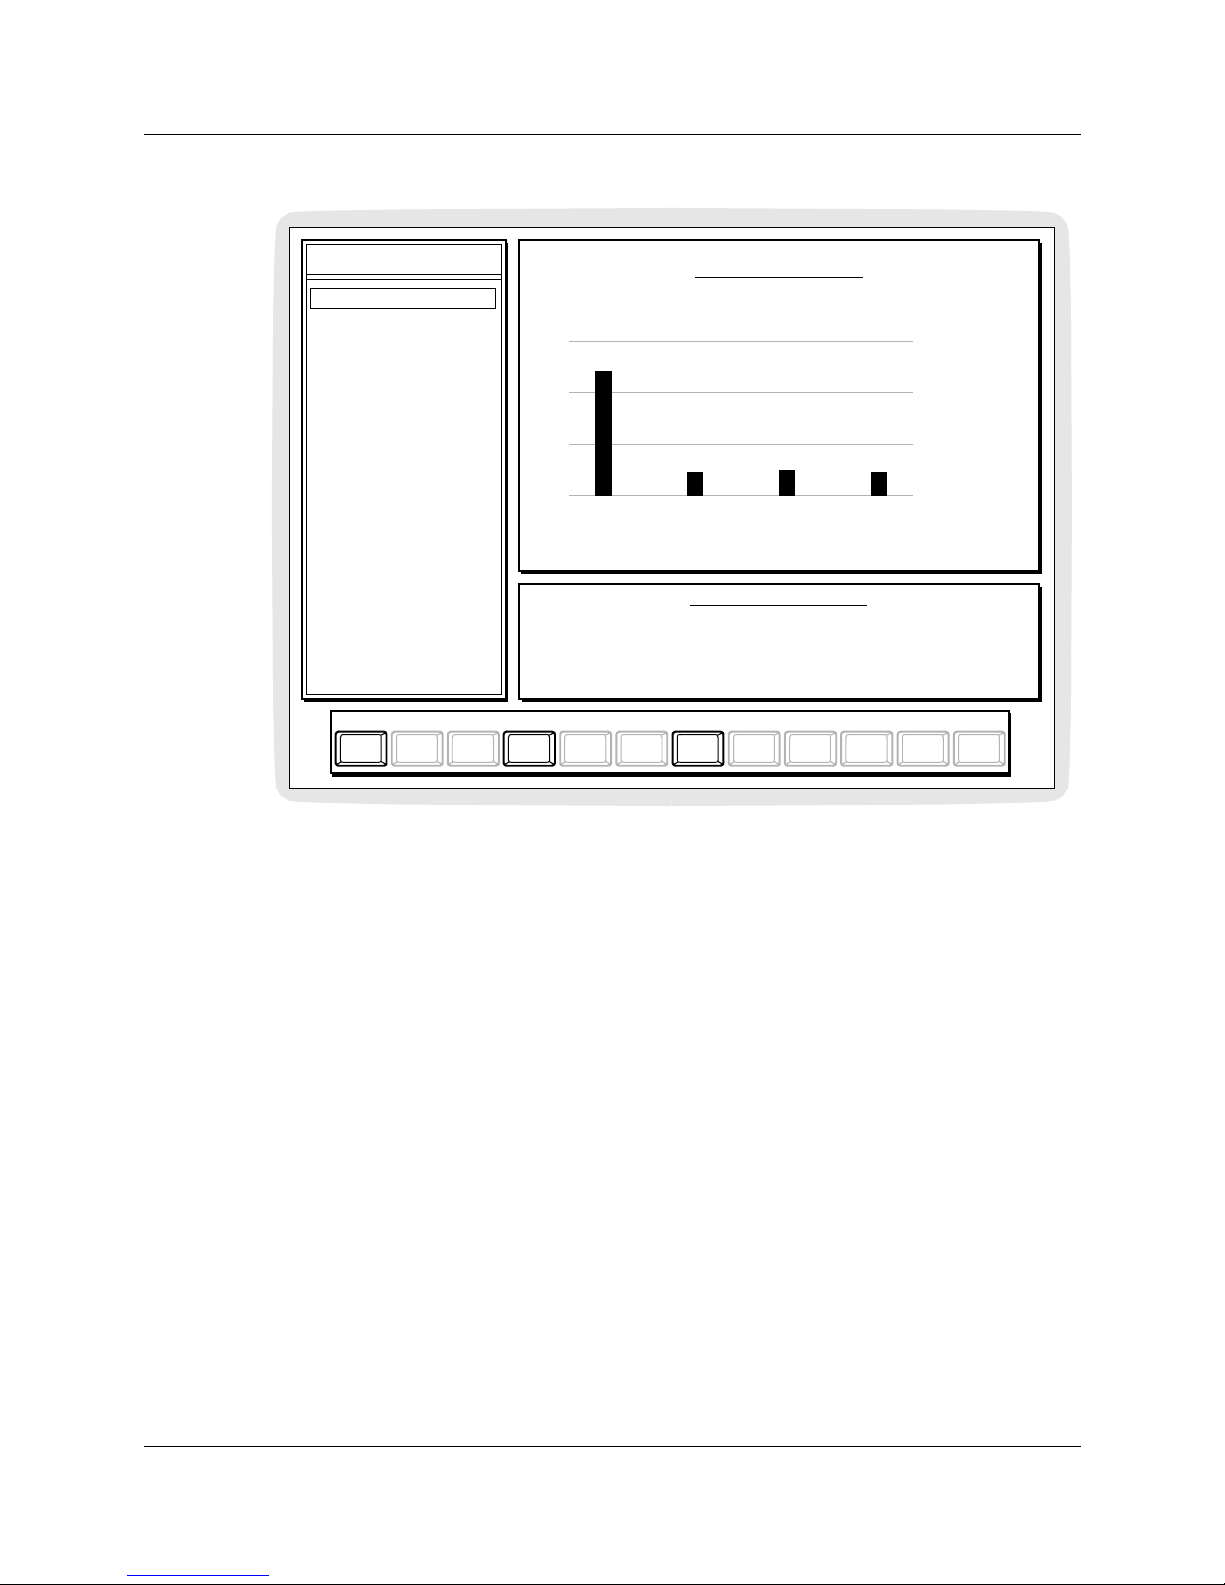
The ‘DIAGNOSIS RESULTS’ bar chart shown in the data windo w
tells you if the system is performi ng within normal operating r anges.
A textual explanation is generated if any bar on the graph crosses the
warning or alarm threshold lines in the graph. If any alarms or
warnings have been detected, you can see more details by pressing
F6. This text screen can be scrolled to provide more details and
suggestions for actions you can take.To go back to the graph, press
F6 again.
ALARM area
If any bar on the chart reaches into the ‘ ALARM’ area, there are
system performance faults that should be resolved. Press F6 to
display details of events that caused the warnings and/or alarms and
the recommended actions (see Figure 12).
WARNING area
If any bar on the chart reaches into the ‘WARNING’ area there is
sub-standard system performance. You can toggle to the te xt s creen
1 ALARM and 0 WARNINGS have been detected.
DIAGNOSIS RESULTS
The cell edge RSSI used in the diagnosis is -70 dBm.
The results of the diagnosis are stored in REPORT.TXT.
System Faults Signals Interference Traffic
ALARM
WA RNING
PASS
DIAGNOSIS SUMMARY
Press F6 for more details.
^Brk
F9F8F7F6F5F2F1 F4^F3Esc
GoBack Exit Details
F10
DIAGNOSIS
S
ystem Faults
R
adio Signals
Q
uality of Service
C
ell Signals
I
nterference
T
raffic
CSC
U
sage
Page 53
Display screens 51
P0887339 Issue 02 Standard Companion Diagnostic Software User Guide
with F6 to see details of events that caused the warnings and/or
alarms and the recommended actions.
PASS area
Bars on the chart in the ‘PASS’ area indicate that there were no
problems found in the diagnosis.
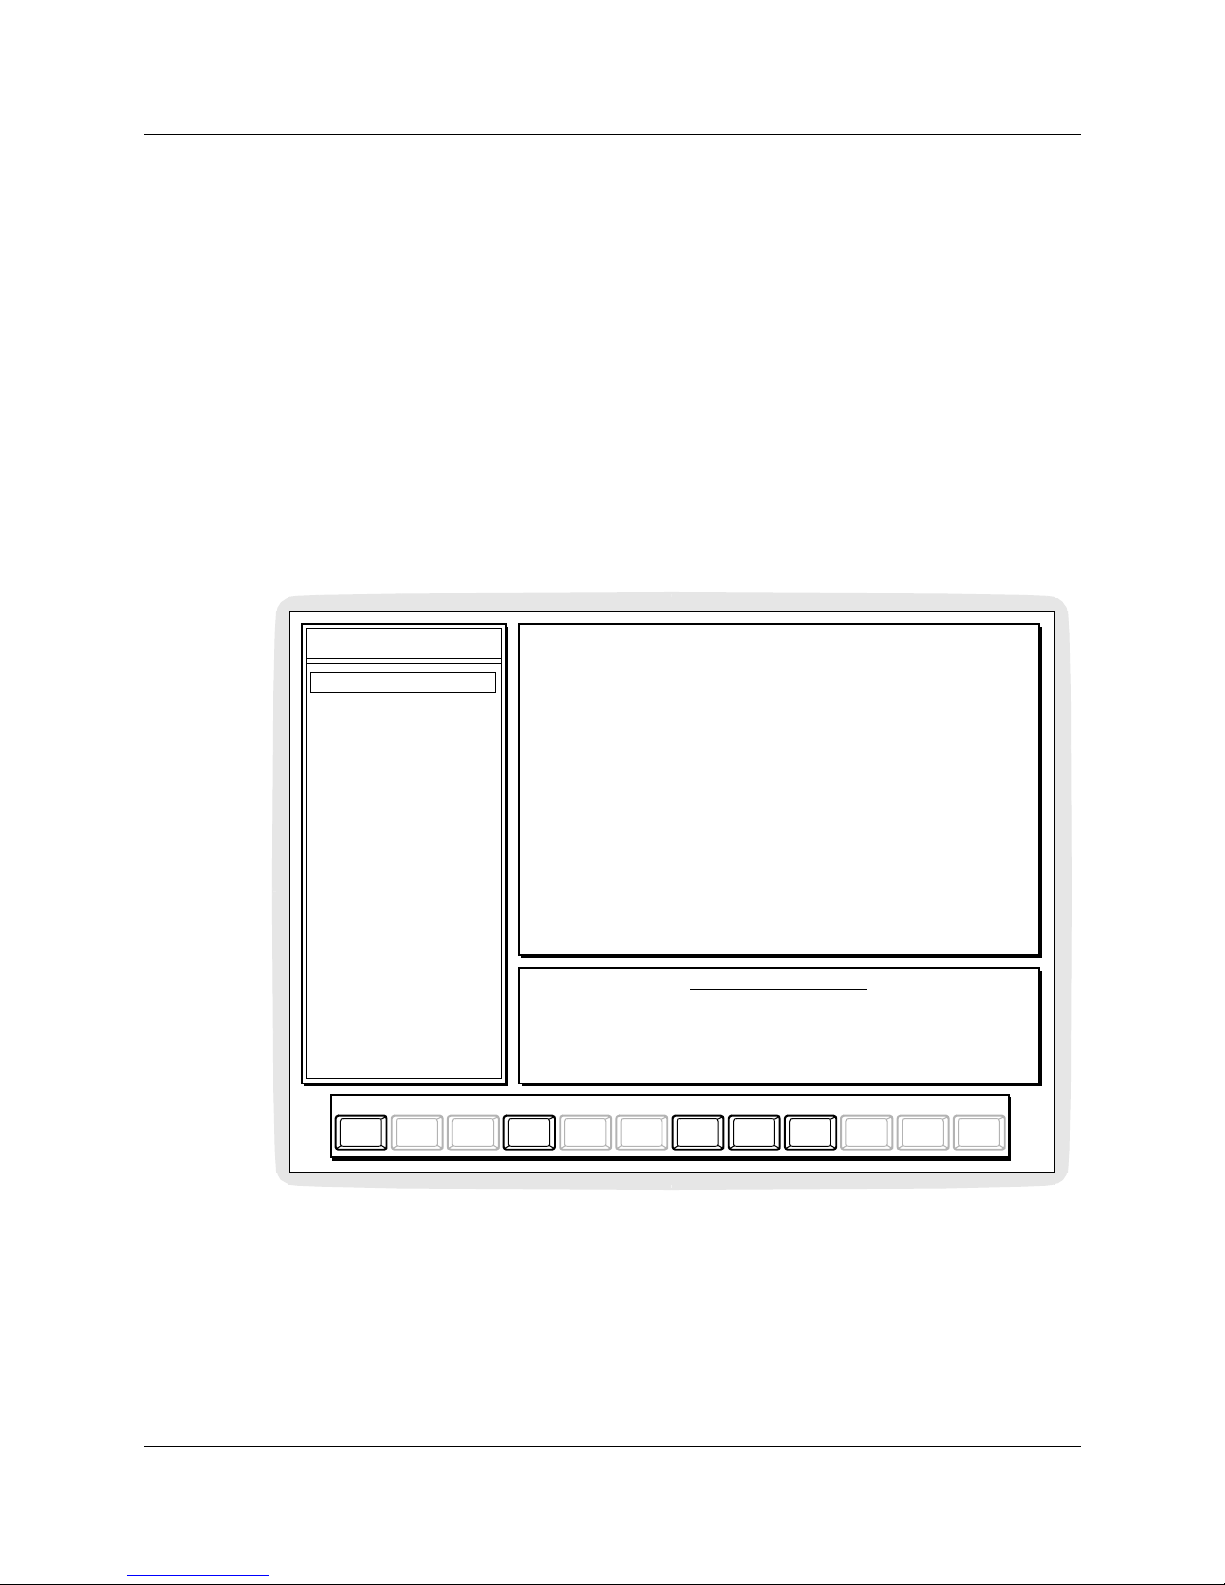
Text Screen Controls
If there is more than one page of information, you can scroll through
the text using the Up and Down softkeys or the page-up and pagedown keys in the PC keypad.
Note: The results of the diagnosis will be recorded in REPOR T.TXT .
Figure 10: Diagnosis Text
Note: The CDS Automatic System Diagnosis carries out diagnosis
on all available samples. For sample sizes less than 100, the
amount of data is insufficient for meaningful diagnosis and no
warning is issued.
1 ALARM and 0 WARNINGS have been detected.
The cell edge RSSI used in the diagnosis is -70 dBm.
The results of the diagnosis are stored in REPORT.TXT.
DIAGNOSIS SUMMARY
Press F6 to return to diagnosis display.
^BrkF9F8F7F6F5F2F1 F4^F3Esc
GoBack Exit Display
F10
System Faults
1 Alarm(s) 0 Warning(s)
ALARM C202
Evaluation:
Action:
Base Station 0106 reset 1 time.
The reset was softtrap 703.
Refer to Appendix in the CDS User Guide.
DIAGNOSIS
S
ystem Faults
R
adio Signals
Q
uality of Service
C
ell Signals
I
nterference
T
raffic
CSC
U
sage
Up Down
Page 54
52 Display screens
Companion Diagnostic Software User Guide P0887339 Issue 02 Standard
Note: For every alarm and warning, you should consult Appendix B
for more details.
Diagnosis Menu Options
In most cases the Automatic System Diagnosis will meet your needs.
Howe ver, if you need detailed statistics on a particular aspect of
system operation, you can access the level 2 commands available
under the Diagnosis menu. A series of diagnosis charts and tables is
av ailable, sho wing various operating statistics.
Quality of Service
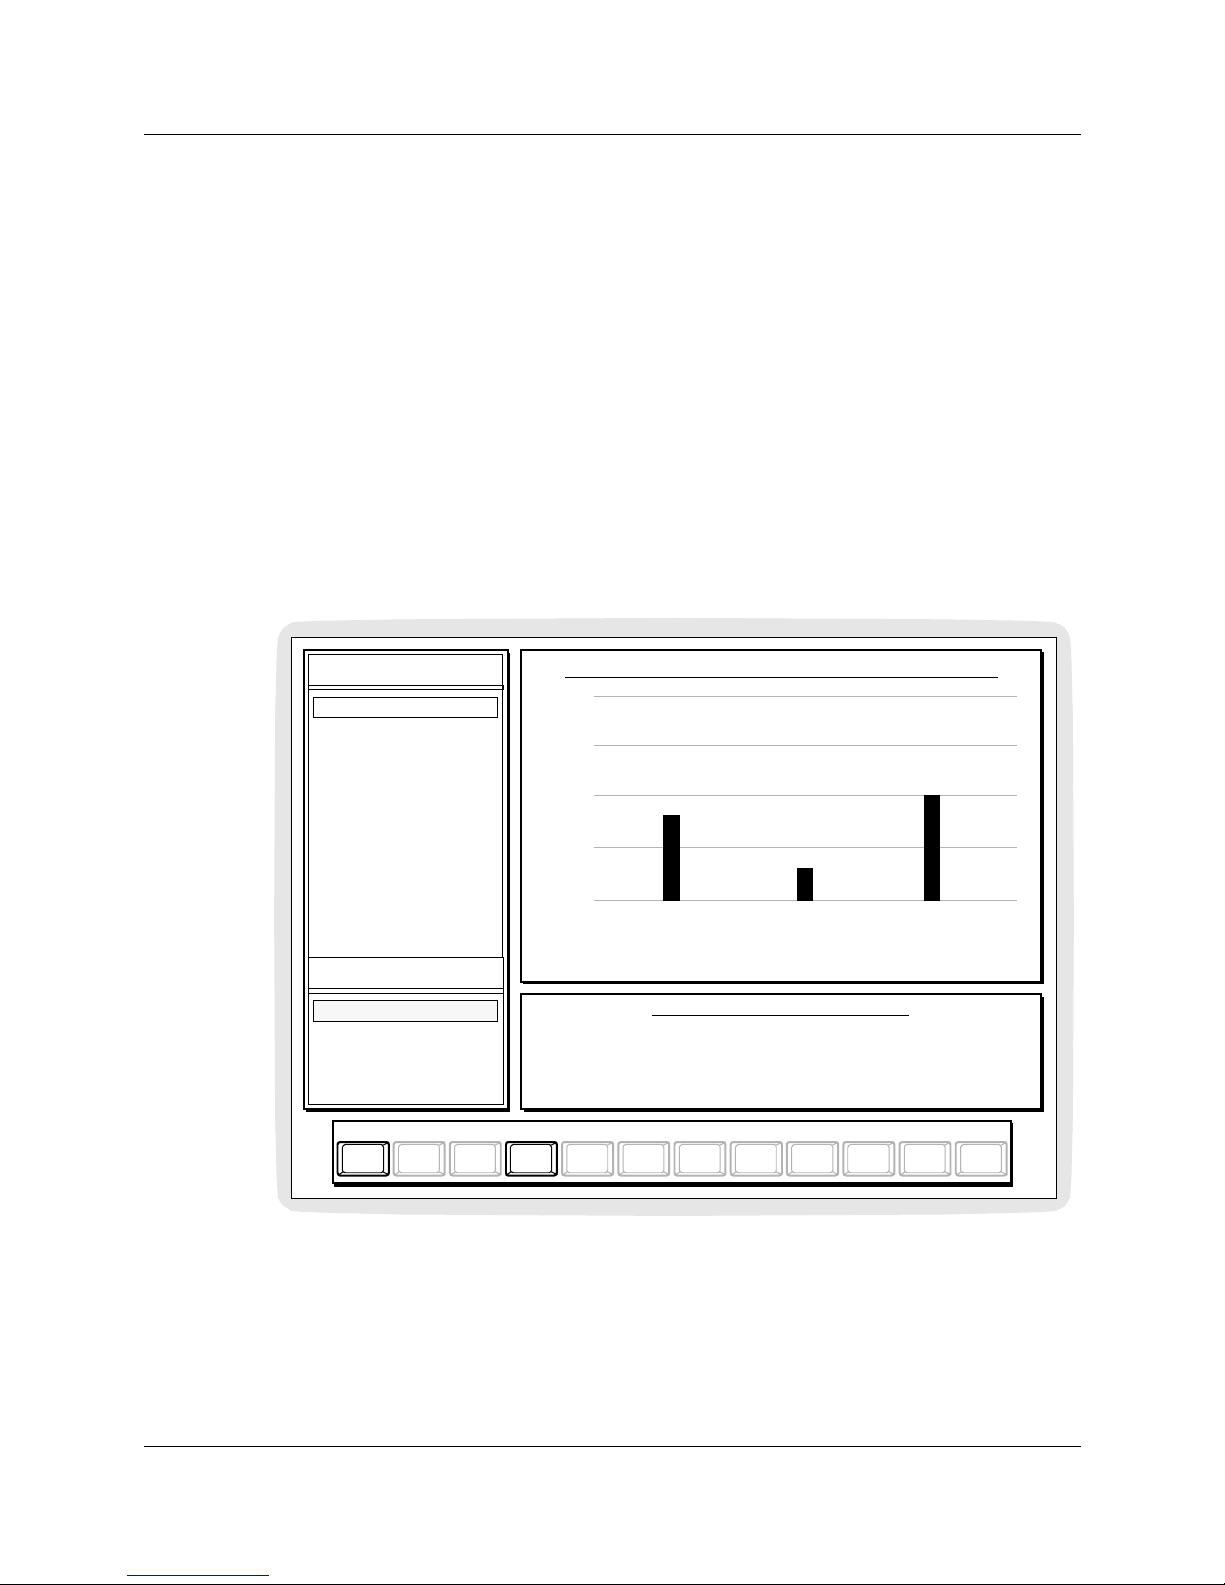
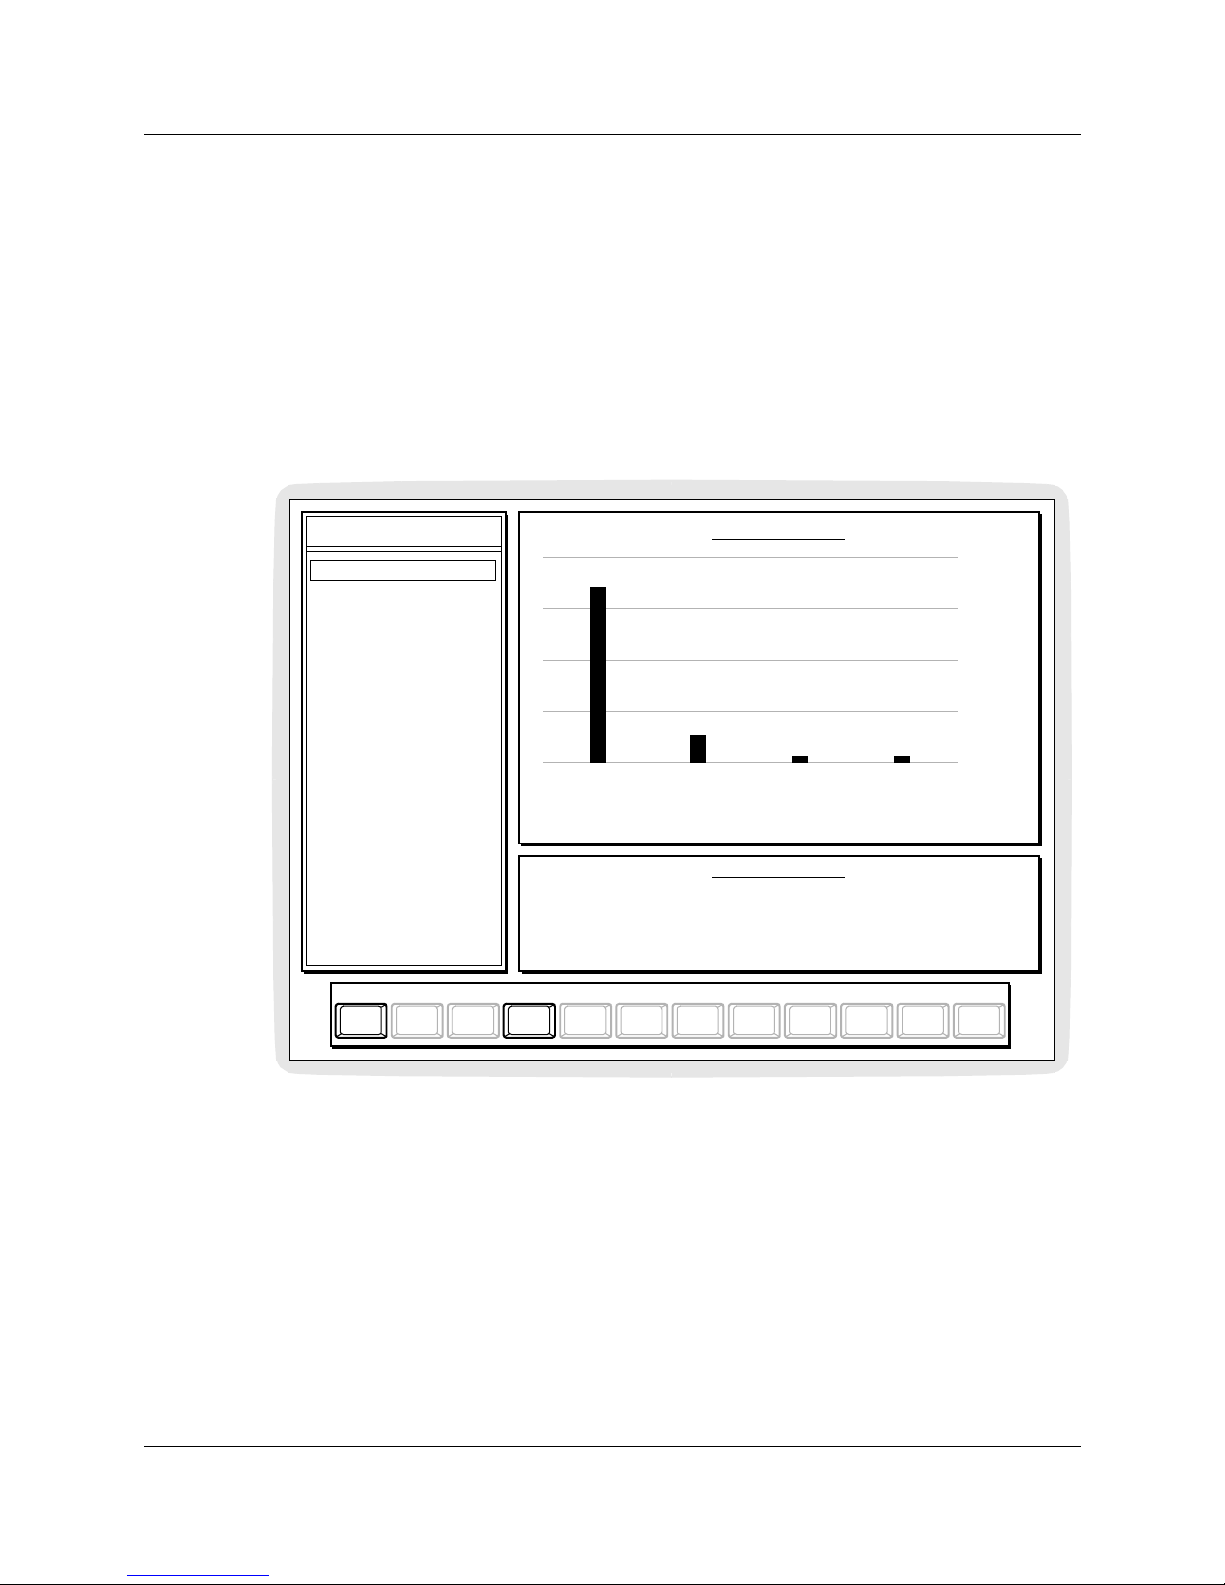
Quality of Service (QOS) indicates ove rall wire le s s system status.
Figure 11: Quality of Service display screen
The data window presents a bar chart sh owing the overall quality of
service percentage, and percentages for each of the components over
the selected time interv al. Lo wer pe rcentages indica te better quality
of service. The specific time interval is indicated above the bar
graph.
Q.O.S. calculation, in the current interval, gives 1.11%.
Interval displayed is: May 15 between 15:00 and 17:00 hr.
LV
Tot
QUALITY OF SERVICE ANALYSIS
There were 64 links established in the displayed interval.
There were 4 lost links, and 11 impure voice samples.
2.0%
1.5%
1.0%
0.5%
0.0%
Lost Links Impure Voice
= Q.O.S.
INTERVAL
Busiest Hour
2
4 Hour Interval
A
uto Interval
^BrkF9F8F7F6F5F2F1 F4^F3Esc
GoBack Exit
F10
QUALITY OF
V
oice Quality
L
ost Links
SERVICE
+
Page 55
Display screens 53
P0887339 Issue 02 Standard Companion Diagnostic Software User Guide
Note: The maximum height of a bar presented in the data windo w is
2.0% because the majority of percentages fall well within the
0.0% to 2.0% range. If a bar height is at this maximum, see
the dialogue window to determine the actual percentage.
By selecting from the Interval subcommand menu, you can view
QOS data for the following:
•
Auto Interval
This interval is the sustained pe riod of above a verage traff ic in the
last 24 hours. It is the default.
•
Busiest Hour
This interval is the busiest hour in the last 24 hours.
•
24 Hour Interval
This interval is the last 24 hours.
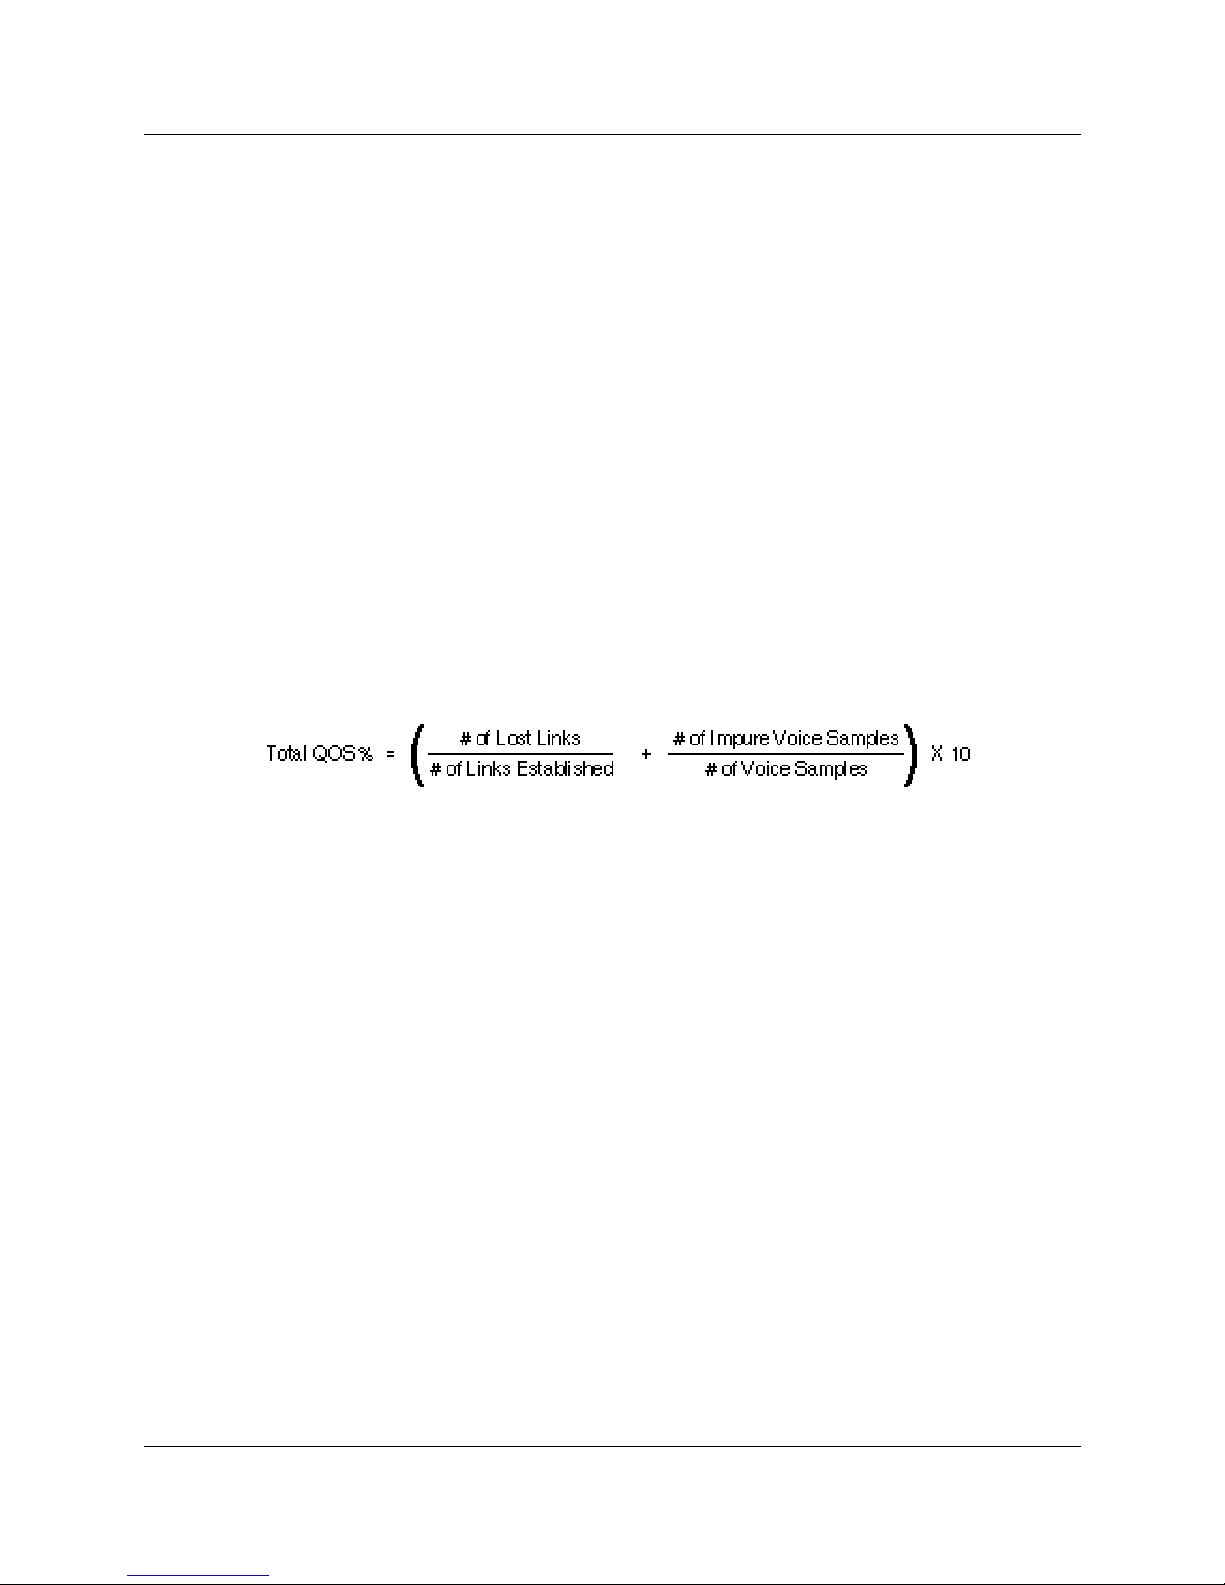
The total QOS percentage over the sele cted time interval is currently
calculated as follows:
The dialogue window gives the total QOS percentage, the actual
incidence for each component and the total number of links
established over the selected time interval.
Quality of Service components
You can view detailed information on any of the available QOS
components by selecting from the lev el 3 commands under the QOS
menu. The Interval subcommands are also available on these level 3
command display screens.
Lost Links
Lost Links is a measure of the number of breaks in an established
communication link between the portable and the radio. Lost links
are a normal part of wireless system operation, but acceptable levels
will vary from site to site.
Page 56
54 Display screens
Companion Diagnostic Software User Guide P0887339 Issue 02 Standard
Figure 12: Lost Links display screen
Either the portable or the radio can be the source of the lost link.
Attempts to reestablish links are generally successful. A brief
interruption in communication occurs before the link is
reestablished. A dropped call result s if the atte mpt to ree stablish the
link fails.
The data window presents, in table format, the number of both
sources of lost links for each radio ov e r the selected time inter val.
The specific time interval is indicated above the table. The
percentage of lost link s for each radio is also presented. It is the total
of lost links divided by the number of links established over the
selected time interv al. Radios are listed in order of the perce ntage of
lost links, with the radio having the highest percentage of lost links
placed first.
The number of links established over the selected time interval for
each radio is also presented in the data window. Sample size is an
important consideration when judging the validity of the statistics.
The larger the sample size, the more meaningful the data.
The two sources of lost links are as follows:
In the selected interval, there were 287 system links established.
LINKS LOST BY RADIOS
2 radio(s) have shown lost link levels greater than 5%.
Interval displayed is: May 20, 11:00 for a 24 hour period.
Percent
10.00%
7.14%
4.17%
0.00%
0.00%
0.00%
0.00%
0.00%
0.00%
0.00%
Lost
LINKS LOST BY RADIOS
Radio Lost
1
2
1
0
0
0
0
0
0
0
Links
Portable
1
0
0
0
0
0
0
0
0
0
Reestablish
Links
20
28
29
39
24
25
27
22
19
15
Estab’d
Radio
0101-2
0104-1
0101-1
0105-1
0103-2
0103-1
0105-2
0104-2
0106-1
0106-2
Cell
01
02
01
02
01
01
02
02
03
03
INTERVAL
Busiest Hour
A
uto Interval
QUALITY OF
V
oice Quality
L
ost Links
SERVICE
2
4 Hour Interval
^Brk
F9F8F7F6F5F2F1 F4^F3Esc
GoBack Exit File Up Down
F10
Page 57

Display screens 55
P0887339 Issue 02 Standard Companion Diagnostic Software User Guide
Portable Reestablish
A portable may attempt to reestablish a link on a different channel
when it identifie s i nte rfere nce or s igna l los s on t he cur rent c ha nnel.
The portable sends a reestablish message to the radio that results in
the loss of the original link. If the attempt is successful a short voice
break is experienced before a link is reestablished with the portable
on a new channel.
Radio Lost Links
Links may also be lost when a radio cannot receive the portable's
signal or when it cannot decipher the portable's signal. The portable
attempts to reestablish the link after this radio link is lost. If the
attempt is successful a short voice break is experienced before a link
is reestablished on a new channel.
The dialogue window giv es the number of system links established
and the number of radios with lost link levels greater than 5% over
the selected time interval.
Contents of the displayed screen may be filed in REPOR T.TXT and
R_RESULT. LOG by pressing F4. A standard text editor (e.g., edit
on DOS 5.0) can be used to view this stored data.
Page 58
56 Display screens
Companion Diagnostic Software User Guide P0887339 Issue 02 Standard
Voice Quality
Voice Quality is the ratio of the number of impure voice
transmissions ov er the number of transmission samples tak en. Voice
transmission sample quality is determined by counting Cyclic
Redundancy Check (CRC) errors.
Figure 13: Voice Quality display screen.
The data window presents, in table format, the number of Type 1
and Type 2 voice samples, and the percentage of voice impurity for
each radio over the selected time interval. The specific time interval
is indicated above the table. Radios are listed in order of the
percentage of voice impurity starting from the highest percentage.
The number of voice samples collected for each radio over the
selected time interval is also pres ented in the data window. Sample
size is an important consideration when judging the validity of the
statistics. The larger the sample size, the more meaningful the data.
Voice impurities are a normal occurrence and are to be expected in
the operation of a wireless system. The exte nt to which the s e levels
of voice impurity are found to be disruptive will vary with each
individual wireless system user.
In the selected interval, there were 228 system voice samples.
CRC ERRORS BY RADIOS
3 radio(s) have shown voice impurity levels greater than 5%.
Interval displayed is: May 16 between 15:00 and 17:00 hr.
Voice
14.81%
11.54%
10.53%
3.45%
0.00%
0.00%
0.00%
0.00%
0.00%
0.00%
Impurity
CRC ERRORS BY RADIOS
Type 2
4
2
3
0
0
0
0
0
0
0
Samples
Type 1
0
1
1
1
0
0
0
0
0
0
Samples
Voice
27
26
38
29
23
9
8
8
7
5
Samples
Radio
0101-2
0104-1
0101-1
0105-1
0103-2
0103-1
0105-2
0104-2
0106-1
0106-2
Cell
01
02
01
02
01
01
02
02
03
03
^BrkF9F8F7F6F5F2F1 F4^F3Esc
GoBack Exit File Up Down
F10
INTERVAL
Busiest Hour
QUALITY OF
V
oice Quality
L
ost Links
SERVICE
2
4 Hour Interval
A
uto Interval
Page 59

Display screens 57
P0887339 Issue 02 Standard Companion Diagnostic Software User Guide
The level of voice impurity increases with greater distance between
the portable and the radio and higher radio traffic. Impure voice
samples are categorized by level of severity as Type 1 or Type 2.
These categories are described as follows:
Typ e 1 S amp les
The human ear is just capable of discerning the lower levels of a
Type 1 sample. User perception increases at the upper levels of a
Type 1 sample and may be manifested as clicks, pops or muted
intervals .
Type 1 Samples contain at least one instance of a detected CRC
Packet Error Rate greater than 1.3 per second and less than or equal
to 3.6 per second. This sample of digitally encoded voice is taken
from a 15 second interval and corresponds to an average bit error
rate greater than two in 1000 bits and less than or equal to seven in
1000 bits.
Typ e 2 S amp les
Type 2 samples are readily perceived by the user and may be heard
as hissing or garbled speech in addition to the Type 1 sample
manifestations.
Type 2 Samples contain at least one instance of a detected CRC
Packet Error Rate greater than 3.6 per second. This sample of
digitally encoded voice is taken from a 15 second interval and
corresponds to an average bit error rate greater than seven in 1000
bits.
Voice Impurity
Voice Impurity is a percentage calculated for each radio by adding
the radio's Type 1 and Type 2 samples and dividing by the number
of voice samples collected over the selected time interval.
The dialogue window gives the number of system voice samples
taken and the number of radios with voice impurity levels greater
than 5% over the selected time interval.
Contents of the displayed screen may be filed in REPOR T.TXT and
R_RESULT. LOG by pressing F4. A standard text editor (e.g., edit
on DOS 5.0) can be used to view this stored data.
Page 60
58 Display screens
Companion Diagnostic Software User Guide P0887339 Issue 02 Standard
System Faults
System Faults is an ove ra ll view of detected system faults as
indicated by the number of:
• Base Station Resets
• Radio Resets
• Synchronization (Synch.) Failures
• Lost Integrity
Figure 14: System Faults display screen.
The data window presents a bar graph that classifies each of these
four components by performance level. Performance levels are
based on the number of system fault occurrences since the last
wireless system power up. The criterion for each level is listed
below. Base Station Resets are only classified as Level 1 or Level 4.
There were 1 Base Station Resets, 1 Radio Resets,
SYSTEM FAULTS
Radio rst. Synch fail. Lst integ.
SYSTEM FAULTS
0 Synch. Failures, and 0 Lost Integrity. This data has been
collected over the last 946 call sessions, from 10 Base Stations.
LEVEL 4
LEVEL 3
LEVEL 2
LEVEL 1
BS rst.
^BrkF9F8F7F6F5F2F1 F4^F3Esc
GoBack Exit
F10
SYSTEM FAULTS
R
adio Resets
S
ynch Failure
B
ase Station Resets
L
ost Integrity
Page 61

Display screens 59
P0887339 Issue 02 Standard Companion Diagnostic Software User Guide
Level 1
Level 1 indicates perfectly or near perfectly functioning hardware:
• Base Station Resets 0
• Radio Resets ≤1
• Synch. Failure ≤1
• Lost Integrity ≤1
Level 2
Leve l 2 indicates that there have been two problem counts for an
applicable component:
• Radio Resets 2
• Synch. Failure 2
• Lost Integrity 2
Level 3
Level 3 indicates that there have been three problem counts for an
applicable component:
• Radio Resets 3
• Synch. Failure 3
• Lost Integrity 3
Level 4
Leve l 4 indicates that there have been enough problem counts to
warrant concern:
• Base Station Resets ≥1
• Radio Resets ≥4
• Synch. Failure ≥4
• Lost Integrity ≥4
The dialogue window gi ves the actual incidence of each of the four
components and the number of call sessions and Base Stations from
which the data was collected.
System Faults components
You can view detailed information on the four System Faults
components in table format by selecting from the level 3 commands
av ailable under the System Faults menu.
Page 62
60 Display screens
Companion Diagnostic Software User Guide P0887339 Issue 02 Standard
Note: System fault counters can be reset to zero manually or by
power interruptions. Selecting the Clear Counters level 2
command from the Monitor menu resets these and all other
counters to zero. Interruption of power to a Base Station
resets all counters to zero for the aff ected Base Station.
Interruption of power to the wireless system resets all Base
Station counters across the system to zero except for Base
Station Resets.
Base Station Resets
Base Station Resets gives the number of times each Base Station in
the system has been reset since the last Base Station power-up.
Figure 15: Base Station Resets display screen
The data window presents the number of Base Station resets since
the last Base Station power up. Codes indicating the reason for each
reset and information necessary should the Base Station require
servicing are also presented.
The most common causes of Base Station resets are manual
disconnection of the TCM cable connecting the Base Station and the
Controller, and interruption in the power supply to the Controller .
Reset
0000
0000
009C
0000
0000
0000
0000
0000
0000
0000
Base
0101
0104
0105
0106
0107
0108
0109
0110
0111
0112
Reset
0
0
1
0
0
0
0
0
0
0
SoftTrap
0000
0000
0110
0000
0000
0000
0000
0000
0000
0000
Reason
Function
0000
0000
0000
0000
0000
0000
0000
0000
0000
0000
Code
Access
00000000
00000000
00000000
00000000
00000000
00000000
00000000
00000000
00000000
00000000
AddressCode
BASE STATION RESET REASONS
^BrkF9F8F7F6F5F2F1 F4^F3Esc
GoBack Exit File Up Down
F10
Station
Count
Program
00000000
00000000
00007010
00000000
00000000
00000000
00000000
00000000
00000000
00000000
Counter
Status
0000
0000
2000
0000
0000
0000
0000
0000
0000
0000
Register
Instruct ion
0000
0000
0000
0000
0000
0000
0000
0000
0000
0000
Register
SYSTEM FAULTS
R
adio Resets
S
ynch Failure
B
ase Station Resets
L
ost Integrity
Page 63
Display screens 61
P0887339 Issue 02 Standard Companion Diagnostic Software User Guide
Both these causes of Base Sta tion resets re sult in a Reset Reason 9C
and a Softtrap Code 110.
Note: When the 9C reason code is give n and the r eset did not result
from either of these common causes, the RJ-11 connectors
and TCM cable should be examined and replaced if
necessary.
All other reasons indicate hardware problems for which the wireless
system supplier should be consulted.
Radio Resets
Radio resets disable the radio. Any active calls are dropped. The
other radio sharing the Base Station is not affected.
Figure 16: Radio Resets display screen
Note: If a radio consistently malfunctions, the entire Base Station
must be replaced.
The data window pr esents, for each radio, the number of times each
type of radio reset has occurred since the last Base Station reset. The
SCL
0
0
0
0
0
0
0
0
0
0
Radio
0101-1
0101-2
0104-1
0104-2
0105-1
0105-2
0106-1
0106-2
0107-1
0107-2
RIM
0
0
0
0
0
0
0
0
0
0
Mem
0
0
0
0
0
0
0
0
0
0
Fault
Snty
0
0
0
0
0
0
0
0
0
0
Fault
SS
0
0
1
0
0
0
0
0
0
0
ResetFail
RADIO RESETS
^Brk
F9F8F7F6F5F2F1 F4^F3Esc
GoBack Exit File Up Down
F10
Reset
Last
00
00
00
00
00
00
00
00
00
00
Fault
Halt
0
DwnLd
0
Fail
0108-1
0108-2
0109-1
0109-2
0110-1
0110-2
0
0
0
0
0
0
0
0
0
0
0
0
0
0
0
0
0
0
0
0
0
0
0
0
0
0
0
0
0
0
0
0
0
0
0
0
0
0
0
0
0
0
0
0
0
0
0
0
0
0
0
0
0
0
0
0
0
0
0
0
00
00
00
00
00
00
SYSTEM FAULTS
S
ynch Failure
B
ase Station Resets
L
ost Integrity
R
adio Resets
Page 64

62 Display screens
Companion Diagnostic Software User Guide P0887339 Issue 02 Standard
data window also presents the most recent type of radio reset, and
information necessary should the Base Station require servicing or
replacement. The seven types of radio resets tracked by the Base
Station, and their corresponding fault type codes, are as follows:
RIM Reset
A Radio Interface Module (RIM) Reset indicates that a spontaneous
reset of the radio's R IM has occurred. Po wer fluctuations, high static
discharges or intermittent hardware failure may be responsible. If
power supply voltage is steady, and RIM resets persist, replace the
Base Station.
SCL Fault
A Serial Communications Link (SCL) Fault indicates a failure in
communication between the RIM and the Line Interface Module
(LIM). An intermitte nt or complete failure of hardware, such as the
internal connector between the RIM and the LIM, may be
responsible. If this type of radio reset persists, replace the Base
Station.
Memory Fault
A Memory Fault indicates that a problem reading or writing RIM
memory exists. An intermitt ent problem, such as static disc harge, or
complete hardware failure may be responsible. If this type of radio
reset persists, replace the Base Station.
Sanity Failure
When a Sanity Failure occurs, a RIM or LIM software problem is
likely. Disconnect and then reconnect the power to the Base Station
to ensure that the software load is not corrupt.
Note: If this type of radio reset persists, contact the wireless system
supplier .
Station Set Reset
A Station Set ( SS) Reset indicates that a problem e xists eith er within
the Controller or with the hardware connection between the Base
Station and the Controller . Examine the Synch. Failure and Inte grity
Lost display screens to determine if the RJ-11 connectors or TCM
cable are defective. If you confirm that a defective connection
between the Controller and the Base Station is the source of the
problem, replace the TCM cable and RJ-11 connectors.
Page 65

Display screens 63
P0887339 Issue 02 Standard Companion Diagnostic Software User Guide
Note: If the connection is not the problem, contact the wireless
system supplier concerning a possible Controller
malfunction.
Download Failure
A Download Failure indic ate s an intermittent hardware or software
problem, which occurs only during Base Station or RIM
initialization. This type of radio reset does not cause any problems
for the user during normal wireless system operation. Notify the
wireless system supplier at your convenience. If this type of radio
reset is severe enou gh to cause a problem, it will be identified as a
Halt Count.
Halt Count
A Halt Count indicates that persistent download failures or complete
hardware failures ha ve caused the Base Station to go out of service.
Note: A count of one for this type of radio reset is cause for alarm.
Disconnect and then recondite the power to the Base Station.
If the halt count persists, replace the Base Station.
Last Fault
If there is more than one type of radio reset for a radio, the Last F ault
column indicates the most recent radio reset type by code as follows:
•RIM Reset 01
• SCL Fault 02, 03
• Memory Fault 04
• Sanity Failure 05
•SS Reset 06
• Download Failure 07
• Halt Count 08, 09, 0A
Page 66
64 Display screens
Companion Diagnostic Software User Guide P0887339 Issue 02 Standard
Synch. Failure
Synch Failure (Synchronization Failure) occurs when a Base Station
experiences a problem with digital frame synchronization on the
TCM cable connecting it to the Controller. The Base Station or the
Controller receives incomplete frames from the other, and the shared
frame reference point is lost. Automatic resynchronization occurs
upon detection of a synchronization failure. Information being
transmitted during the synchronization failu re may be corrupted or
lost.
Figure 17: Synch Failure display screen
The data window presents the number of times each Base Station
has experienced synchronization failure since the last wireless
system power-up.
Note: If the count for a particular Base Station is greater than four,
examine the RJ-11 connectors and TCM cable, and replace
them if necessary.
0101
0104
0105
0106
0107
0108
0109
0110
0111
0112
Base Station
SYNCHRONIZATION LOST
^BrkF9F8F7F6F5F2F1 F4^F3Esc
GoBack Exit File Up Down
F10
0
0
0
0
0
0
0
0
0
0
Count
SYSTEM FAULTS
S
ynch Failure
B
ase Station Resets
L
ost Integrity
R
adio Resets
Page 67
Display screens 65
P0887339 Issue 02 Standard Companion Diagnostic Software User Guide
Lost Integrity
Lost Integrity occurs when corrupted data is received by the Base
Station from the Controller. Lost integrity is transient and is usually
caused by a problem with the connection between the Base Station
and the Controller .
Figure 18: Lost Integrity display screen
The data window presents the number of times each Base Station
has experienced lost integrity since the last wireless system powerup.
Note: If the count for a particular Base Station is greater than four,
examine the RJ-11 connectors and TCM cable, and replace
them if necessary.
0101
0104
0105
0106
0107
0108
0109
0110
0111
0112
Base Station
INTEGRITY FAILURE
^BrkF9F8F7F6F5F2F1 F4^F3Esc
GoBack Exit File Up Down
F10
0
0
0
0
0
0
0
0
0
0
Count
SYSTEM FAULTS
S
ynch Failure
B
ase Station Resets
L
ost Integrity
R
adio Resets
Page 68

66 Display screens
Companion Diagnostic Software User Guide P0887339 Issue 02 Standard
Radio Signals
Radio Signals display screens may be used to examine the
performance of individual radios on the wireless system. When you
select a level 3 command from the Radio Signals menu, RSSI
measures for regular radio traffic collected since the last Base
Station reset are displayed.
A sufficient number of random samples must be taken for a radio
before its performance can be properly judged. Generally, the
wireless system should be running for a number of days, typically a
week, before the Radio Signals display screens can be used to
provide meaningful data. Seldom used radios may require an even
longer period over which to collect random samples.
The three lev el 3 commands av ailable under the Radio Signals menu
to select the particular RSSI data of interest are:
• Weakest Radio
• Next Weakest
• Radio Statistics
The Versus System or Versus Cell subcommands under the
Comparison menu are currently used to com par e th e RSSI
measures of an individual radio to the average system RSSI or the
average cell RSSI.
Page 69
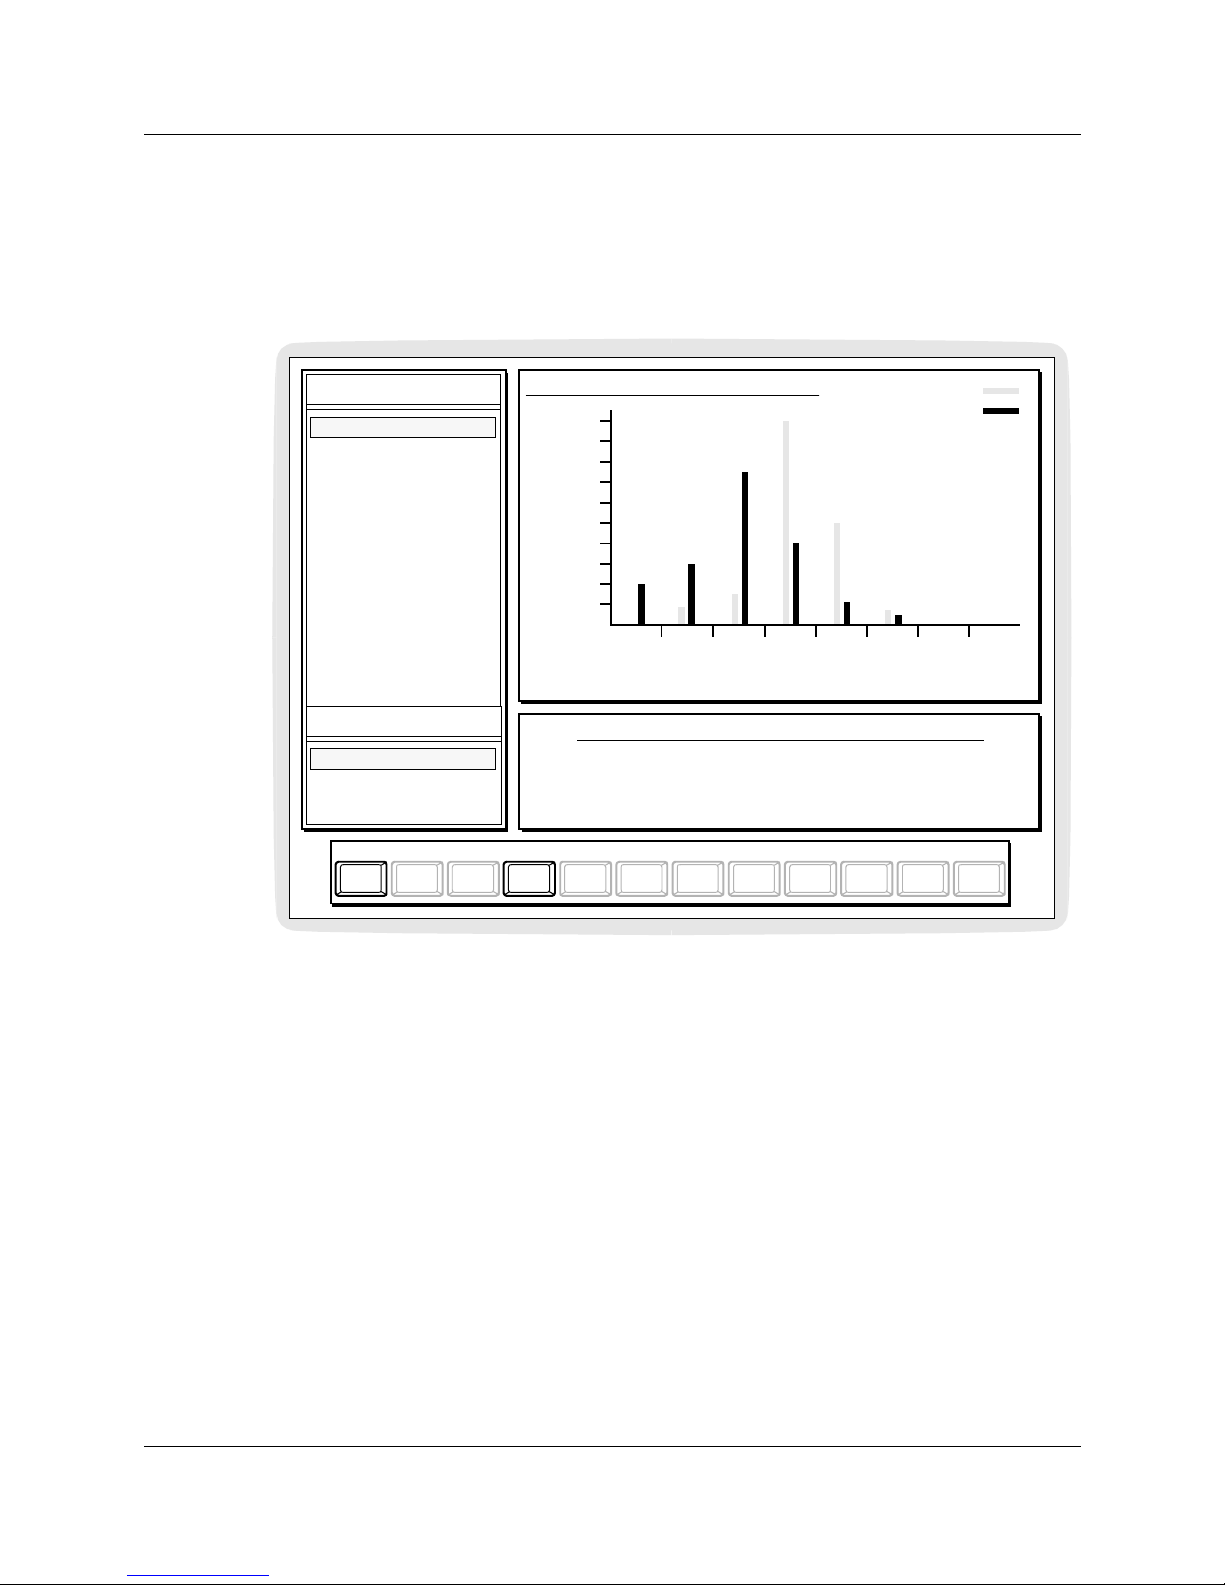
Display screens 67
P0887339 Issue 02 Standard Companion Diagnostic Software User Guide
Weakest Radio
The W eakest Radio level 3 command shows the RSSI data collected
for the radio with the weakest average RSSI measure since the last
Base St ation re set.
Figure 19: Weakest Radio by System display screen
The Versus System comparison option of the Radio Signals display
shows the weakest radio RSSI value compared with the average
RSSI val ue of the system.
The data window presents a histogram plotting the RSSI
distribution for the identified weakest radio against the system
average RSSI distribution. The white or yellow bars, shown as
hatched lines above, represent the radio RSSI; the black bars
represent the RSSI of the whole system.
The dialogue window identifies the weakest radio and gives the
average RSSI value and sample size for that radio. The average
system RSSI value and system sample size are also given.
When the Versus Cell comparison option is chosen, the comparison
is made against the average RSSI value of the cell to which the
weakest radio belongs.
RADIO SIGN AL HI STO GRA M VERS US SYS TEM AV ERAG E
Radio 0111-2 compar ed to System Avera ge RSSI
The radio currently displayed is 0111-2, with an average RSSI value
^Brk
F9F8F7F6F5F2F1 F4^F3Esc
GoBack Exit
F10
-40 -50 -60 -70 -80 -90 -100
Relative
Frequency
RSSI - dBm
of approximately: -77.3 dBm.
The system average RSSI is approximately -64.8 dBm.
The current radio RSSI histogram is made from 57 RSSI samples.
The system average histogram uses a total of 779 RSSI samples.
Radio RSSI
System RSSI
RADIO SIGNALS
Radio Statistics
W
eakest Radio
N
ext Weakest
COMPARISON
V
ersus System
Versus
C
ell
Page 70
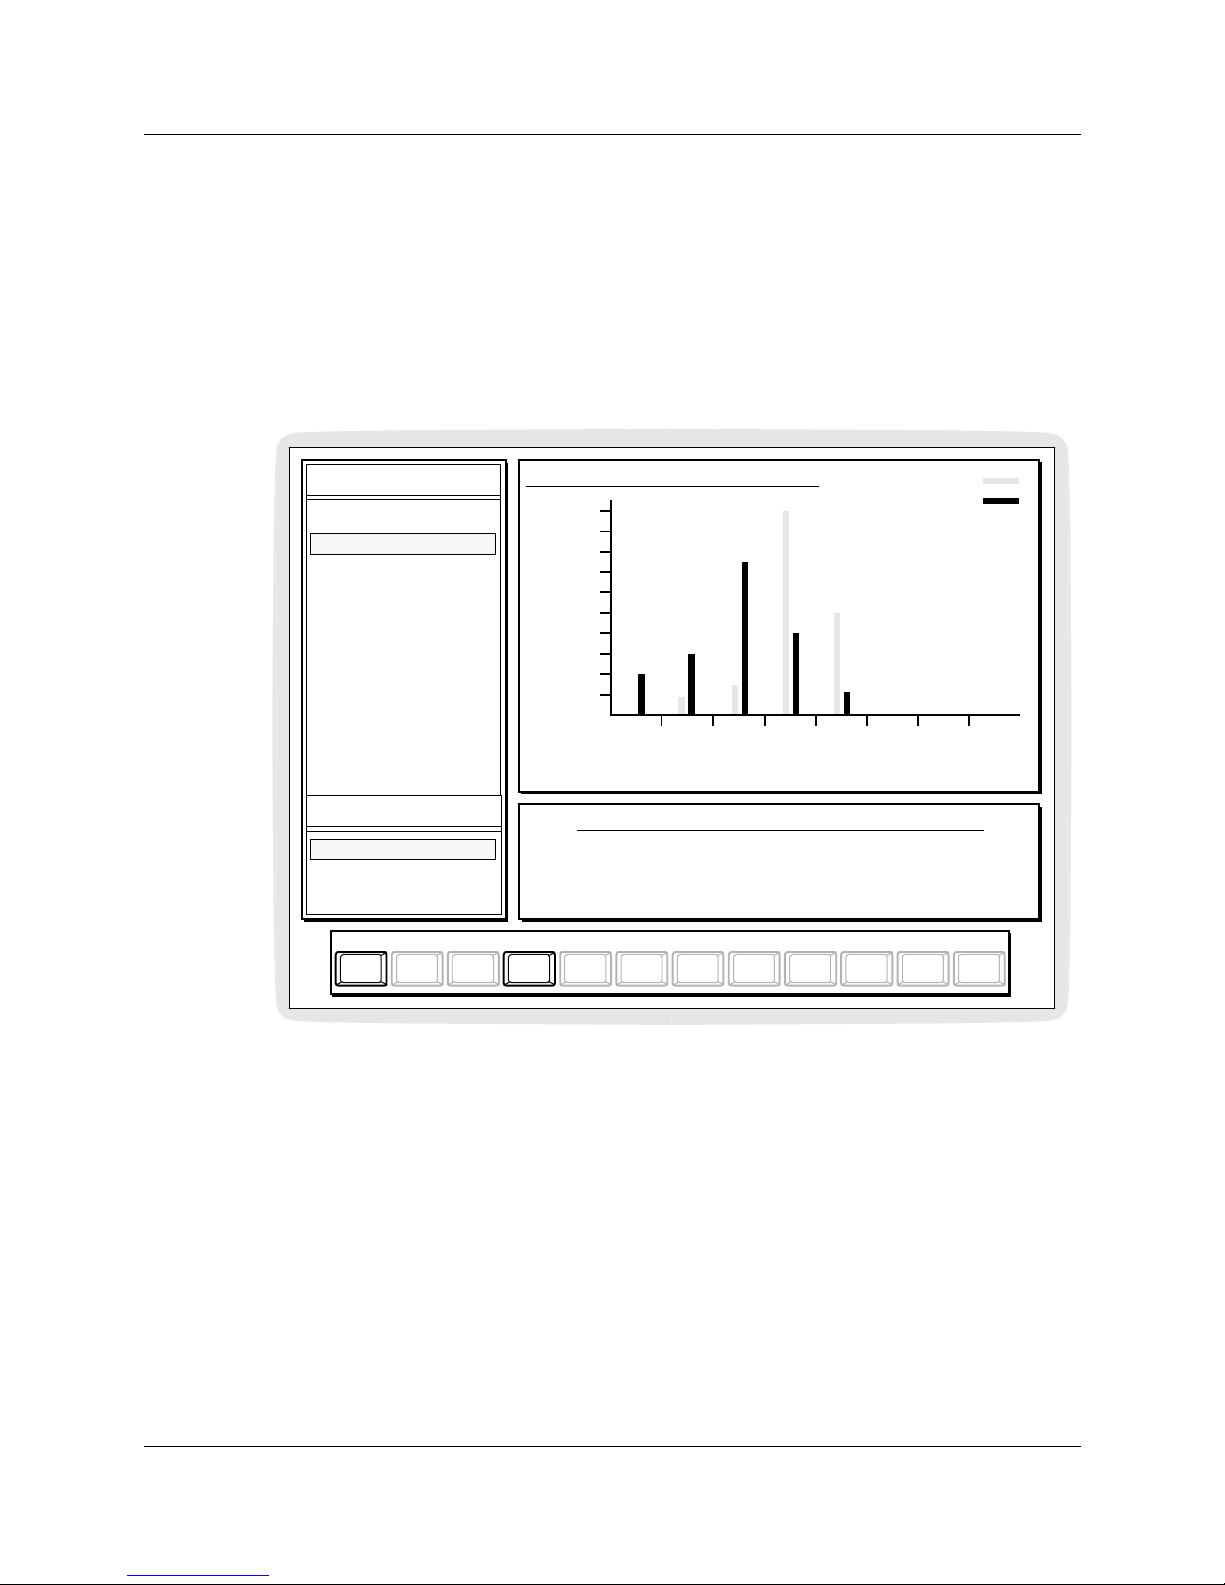
68 Display screens
Companion Diagnostic Software User Guide P0887339 Issue 02 Standard
Next Weakest Radio
The Next Weakest level 3 command, upon initial selection, shows
the RSSI data collected for the radio with the second weakest
average RSSI measure since the last Base Station rese t . Repeated
selection of the Next Weakest level 3 command provides detail on
each radio successively from the second weakest average RSSI to
the strongest.
Figure 20: Next Weakest Radio display screen
The data window presents a histogram plotting the RSSI
distribution for the identified radio against the system av erage RSSI
distribution. The white or yello w bars, shown as hatched lines abov e,
represent the radio RSSI, and the black bars represent the RSSI of
the whole system.
The dialogue window identifies the radio and gives the average
RSSI value and sample size for that radio. The av erage system RSSI
value and system sample size are also given.
RADIO SIGN AL HI STO GRA M VERS US SYS TEM AV ERAG E
Radio 0110-2 compar ed to System Avera ge RSSI
The radio currently displayed is 0110-2, with an average RSSI value
^BrkF9F8F7F6F5F2F1 F4^F3Esc
GoBack Exit
F10
-40 -50 -60 -70 -80 -90 -100
Relative
Frequency
RSSI - dBm
of approximately: -75.8 dBm.
The system average RSSI is approximately -64.8 dBm.
The current radio RSSI histogram is made from 63 RSSI samples.
The system average histogram uses a total of 779 RSSI samples.
Radio RSSI
System RSSI
RADIO SIGNALS
Radio Statistics
W
eakest Radio
N
ext Weakest
COMPARISON
V
ersus System
Versus
C
ell
Page 71
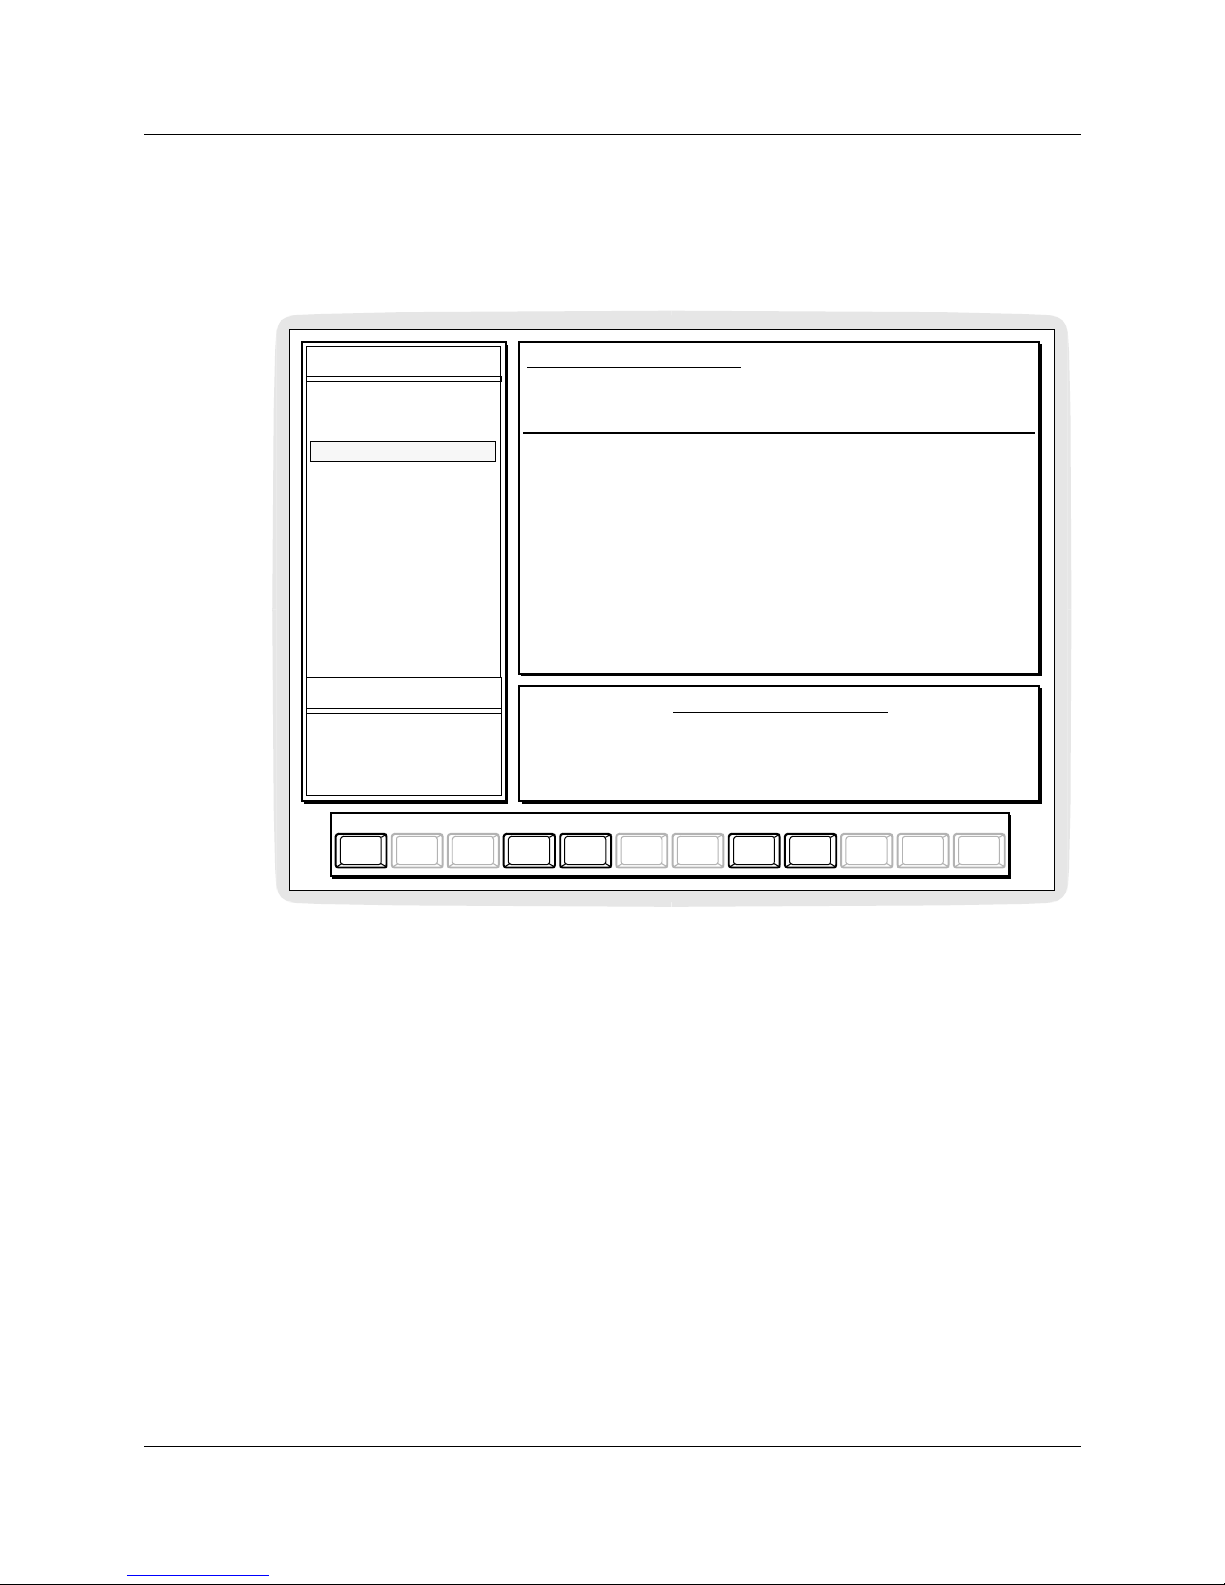
Display screens 69
P0887339 Issue 02 Standard Companion Diagnostic Software User Guide
Radio Statistics
Radio Statistics shows the radio signal data collected for all radios
on the wireless system.
Figure 21: Radio Statistics display screen
The data window presents a table showing av erage RSSI values for
each radio since the last Base Station reset. Radios are listed in order
from weakest average RSSI value to strongest. The link information
described below is collected for each radio and presented in the table
as well.
The number of RSSI samples for each radio is also presented in the
data window. Sample size is an important consideration when
judging the validity of the statistics. The larger the sample size the
more meaningful the data.
24hr Links Established
This column lists the number of links established by the radio over
the last 24 hours.
24hr Links Reestablished
This column lists the number of times the radio handed off an
established link due to mobility over the last 24 hours.
RADIO SIGNAL STATISTICS
From Weakest RSSI to Strongest
Average
-75.0 dBm
-70.0 dBm
-69.3 dBm
-68.3 dBm
-66.4 dBm
-65.0 dBm
-65.0 dBm
-64.8 dBm
-64.7 dBm
-63.5 dBm
-61.6 dBm
-61.4 dBm
-60.7 dBm
-60.6 dBm
-60.0 dBm
Radio
0107-2
0110-2
0306-1
0123-2
0307-1
0115-1
0120-2
0124-1
0118-1
0304-1
0305-1
0122-2
0119-1
0122-1
0119-2
Cell
02
03
15
12
16
06
09
12
07
13
14
11
08
11
08
RSSI
Sample
18
59
115
23
89
92
123
95
245
167
65
93
74
145
64
Size
24 hr Li nks
12
6
15
6
12
8
15
16
18
19
13
7
17
14
10
Estab’d
24hr Links
5
3
9
8
4
3
10
7
14
12
5
7
4
10
9
Reestab
24hr Lost
0
0
0
0
0
0
0
0
0
0
0
0
0
0
0
Links
RADIO SIGNAL STATISTICS
The average RSSI level over 9098 system RSSI sample was -59.1 dBm.
The radio with weakest average RSSI was 0107-2 at -75.0 dBm, based on
18 samples.
^BrkF9F8F7F6F5F2F1 F4^F3Esc
GoBack Exit File Up Down
F10
RADIO SIGNALS
Radio Statistics
W
eakest Radio
N
ext Weakest
COMPARISON
Versus System
Versus Cell
Page 72

70 Display screens
Companion Diagnostic Software User Guide P0887339 Issue 02 Standard
This type of hand-off occurs when a portable user moves from one
cell to another during an active call. A voice break is experienced for
a fraction of a second before the link is reestablished on the same
channel.
24hr Lost Links
This column lists the number of times the radio handed off an
established link due to interference over the last 24 hours.
This type of hand-off occurs when either the radio or the portable
forces the loss of the established link on the current channel. The
radio is the source of the lost link when it cannot decipher the
portable's signal. The portable is the source of the lost link when it
identifies interf ere nce or signal loss.
Regardless of the source of the lost link, a short voice break is
experienced before the link is reestablished on another channel.
The dialogue window gives, for comparison, the average system
RSSI value and the number of samples f or the system. The dialogue
window also identifies the radio with the weakest RSSI, and that
radio's sample size.
The ‘Versus System’ and ‘Versus Cell’ options are disabled on the
Radio Statistics Display Screen.
Page 73
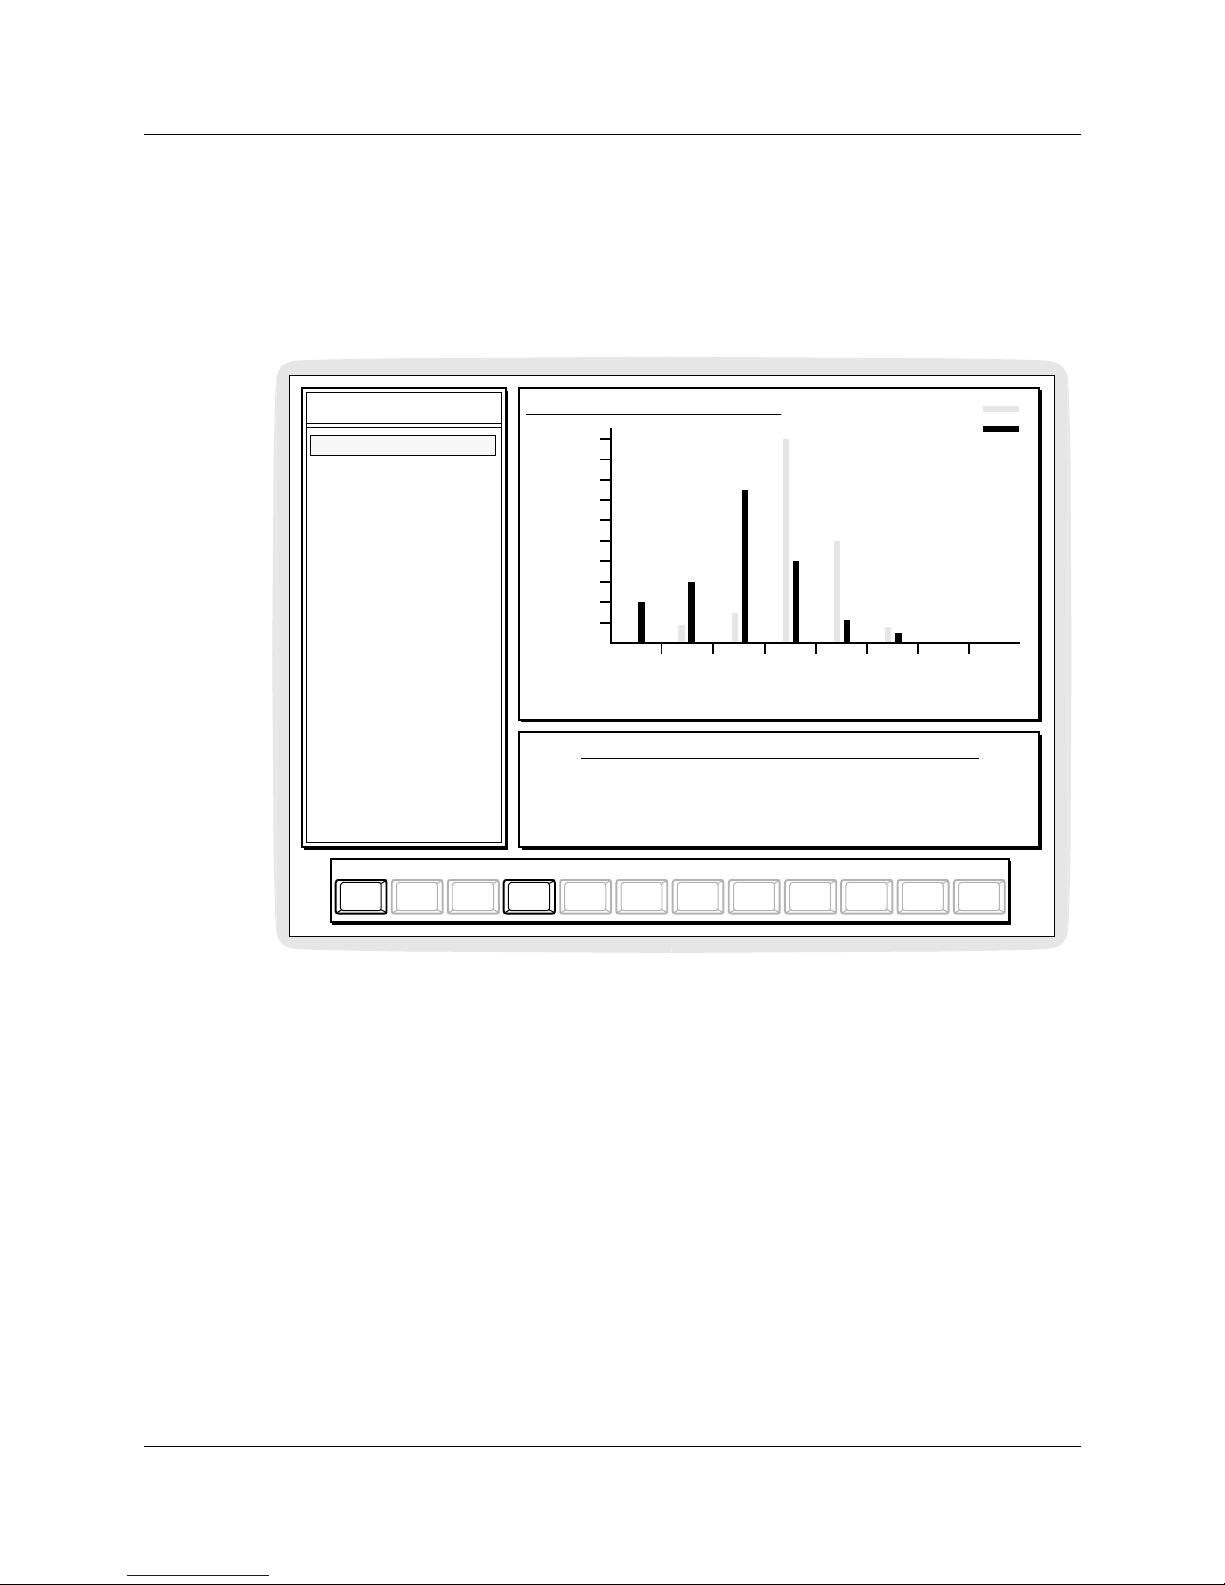
Display screens 71
P0887339 Issue 02 Standard Companion Diagnostic Software User Guide
Cell Signals
Weakest Cell
The Weakest Cell level 3 command shows the RSSI data collected
for the cell with the weakest average RSSI measure.
Figure 22: Weakest Cell display screen
The data window presents a histogram plotting the RSSI
distribution for the identified weakest cell against the system
average RSSI distribution. The white or yellow bars, shown as
hatched lines in the figure above, represent the cell RSSI. The black
bars represent the RSSI of the whole system.
The dialogue window identifies the weakest cell and gives the
average RSSI value and sample size for that cell. The average system
RSSI value and system sample size are also given.
Next Weakest
The Next Weakest level 3 command, upon initial selection, shows
the RSSI data collected for the cell with the second weakest average
RSSI measure. Repeated selection of the Next Weakest level 3
command provides detail on each cell successively from the
second weakest average RSSI to the strongest.
CELL SIGNAL HISTOGRAM VERSUS SYSTEM AVERAGE
Cell 01 compared to Syste m Average RSSI
The cell currently displayed is: 01, with an average RSSI value
^BrkF9F8F7F6F5F2F1 F4^F3Esc
GoBack Exit
F10
-40 -50 -60 -70 -80 -90 -100
Relative
Frequency
RSSI - dBm
of approximately: -77.3 dBm.
The system average RSSI is approximately: -64.8 dBm.
The current cell RSSI histogram is made from 57 RSSI samples.
The system average histogram uses a total of 779 RSSI samples.
Cell RSSI
System RSSI
CELL SIGNALS
Cell Statistics
W
eakest Cell
N
ext Weakest
Page 74
72 Display screens
Companion Diagnostic Software User Guide P0887339 Issue 02 Standard
Cell Statistics
Cell Statistics sho ws the cell signal data collected for all the cells on
the wireless system.
Figure 23: Cell Statistics display screen
The data window presents a table showing av erage RSSI values for
each cell. Cells are listed in numerical order. The link information
described below is collected for each cell and presented in the table
as well.
The number of RSSI samples for each cell is also presented in the
data window. Sample size is an important consideration when
judging the validity of the statistics. The larger the sample size the
more meaningful the data.
24hr Links Established
This column lists the number of links establishe d by the radios in the
cell over the last 24 hours.
24hr Links Reestablished
This column lists the number of times the radios in the cell handed
off an established link due to mobility over the last 24 hours.
CELL SIGNALS
CELL SIGNAL STATISTICS
From Weakest RSSI to Stro ngest
Average
-77.3 dBm
-75.8 dBm
-75.0 dBm
-75.0 dBm
Cell
01
02
03
04
RSSI
Sample
57
63
1
1
Size
24 hr Li nks
9
8
2
1
Estab’d
24hr Lin ks
0
1
1
1
Reestab
24hr Lost
0
0
0
0
Links
CELL SIGNAL STATISTICS
The average RSSI level over 122 system RSSI samples was: -76.5 dBm.
The weakest average RSSI was cell 01 at -77.3 dBm, based on
57 samples.
^BrkF9F8F7F6F5F2F1 F4^F3Esc
GoBack Exit File Up Down
F10
Cell Statistics
W
eakest Cell
N
ext Weakest
Page 75

Display screens 73
P0887339 Issue 02 Standard Companion Diagnostic Software User Guide
This type of hand-off occurs when a portable user moves from one
cell to another during an active call. The user experiences a voice
break for a fraction of a second before the link is reestablished on the
same channel.
24hr Lost Links
This column lists the number of times the radios in the cell handed
off an established link due to interference over the last 24 hours.
This type of hand-off occurs when a radio or a portable forces the
loss of the established link on the current channel. A radio is the
source of a lost link when it cannot decipher the portable's signal. A
portable is the source of a lost link when it identifie s interferenc e or
signal l oss.
The dialogue window gives, for comparison, the average system
RSSI value and the number of samples f or the system. The dialogue
window also identifies the cell with the weakest average RSSI, and
that cell's sample size.
CSC-Link Statistics
Each cell contains one signalling channel to locate and track
portable movements. This common signalling channel (CSC) is
provided by makin g one of the radios in a cell into a CSC radio on a
random availability basis. Common signalling channel RSSI
measures for the CSC channels are displayed under CSC Link
statistics.
The data window presents a table showing average CSC RSSI
values and the number of samples for each cell. Cells are sorted in
order of increasing signal strength.
Regular traffi c RSSI and samples are also included for the purpose
of comparison.
The dialogue win dow give the average cell CSC RSSI le vel ove r the
wir eless system. The weake st cell is also i d entified.
Page 76

74 Display screens
Companion Diagnostic Software User Guide P0887339 Issue 02 Standard
Interference
Interference may be exter nal or internal to the wireless system. The
level 3 commands available under the Interference menu aid in the
identification of these types of interference. Once identifie d, all
sources of interference should be minimized.
Interference data is generally collected from all Base Stations on a
per radio basis since the last wireless system reset. Individual Base
Stations, and radios, may be reset in the interim.
Channel Occupancy
Channel Occupancy measures may be used to detect interference
from equipment outside the wireless system. The number of calls
providing the data is an important consideration when inferring
meaning from this display screen. The wireless system should be
running for several weeks to collect a sufficient sample size.
The data window presents a bar chart th at plots the occupany of all
channels relative to each other since the last wrieless system rese t.
CDS records the number of times each cahnnel was used and sets the
channel with the highest usage to represent 100%. All other channel
usage is presented relative to the most frequently used channel. A
hole in the bar chart (at least three channels in a row with below
average occupancy) suggests that signals from other sources are
using part of the wireless system’s capacity. Since channel 40 is not
normally used, it is blank.
Channel CRC Error
Channel Cyclic Redundancy Check (CRC) Error measures may be
used to detect interference from equipment outside the wireless
system. The number of calls providing the data is an important
consideration when inferring meaning from this display screen. The
wireless system should be running for several weeks to collect a
sufficient sample size.
The data window presents a bar chart that plots the CRC errors of
all channels relative to each other since the last wireless system
reset. CDS records the number of times a CRC error was detected on
each channel and sets the channel with the highest number of errors
to represent 100%. CRC errors for all other channels are presented
relative to the channel with the highest number of CRC errors. A
spike of high CRC errors on one channel on the bar graph suggests
outside interference.
Page 77
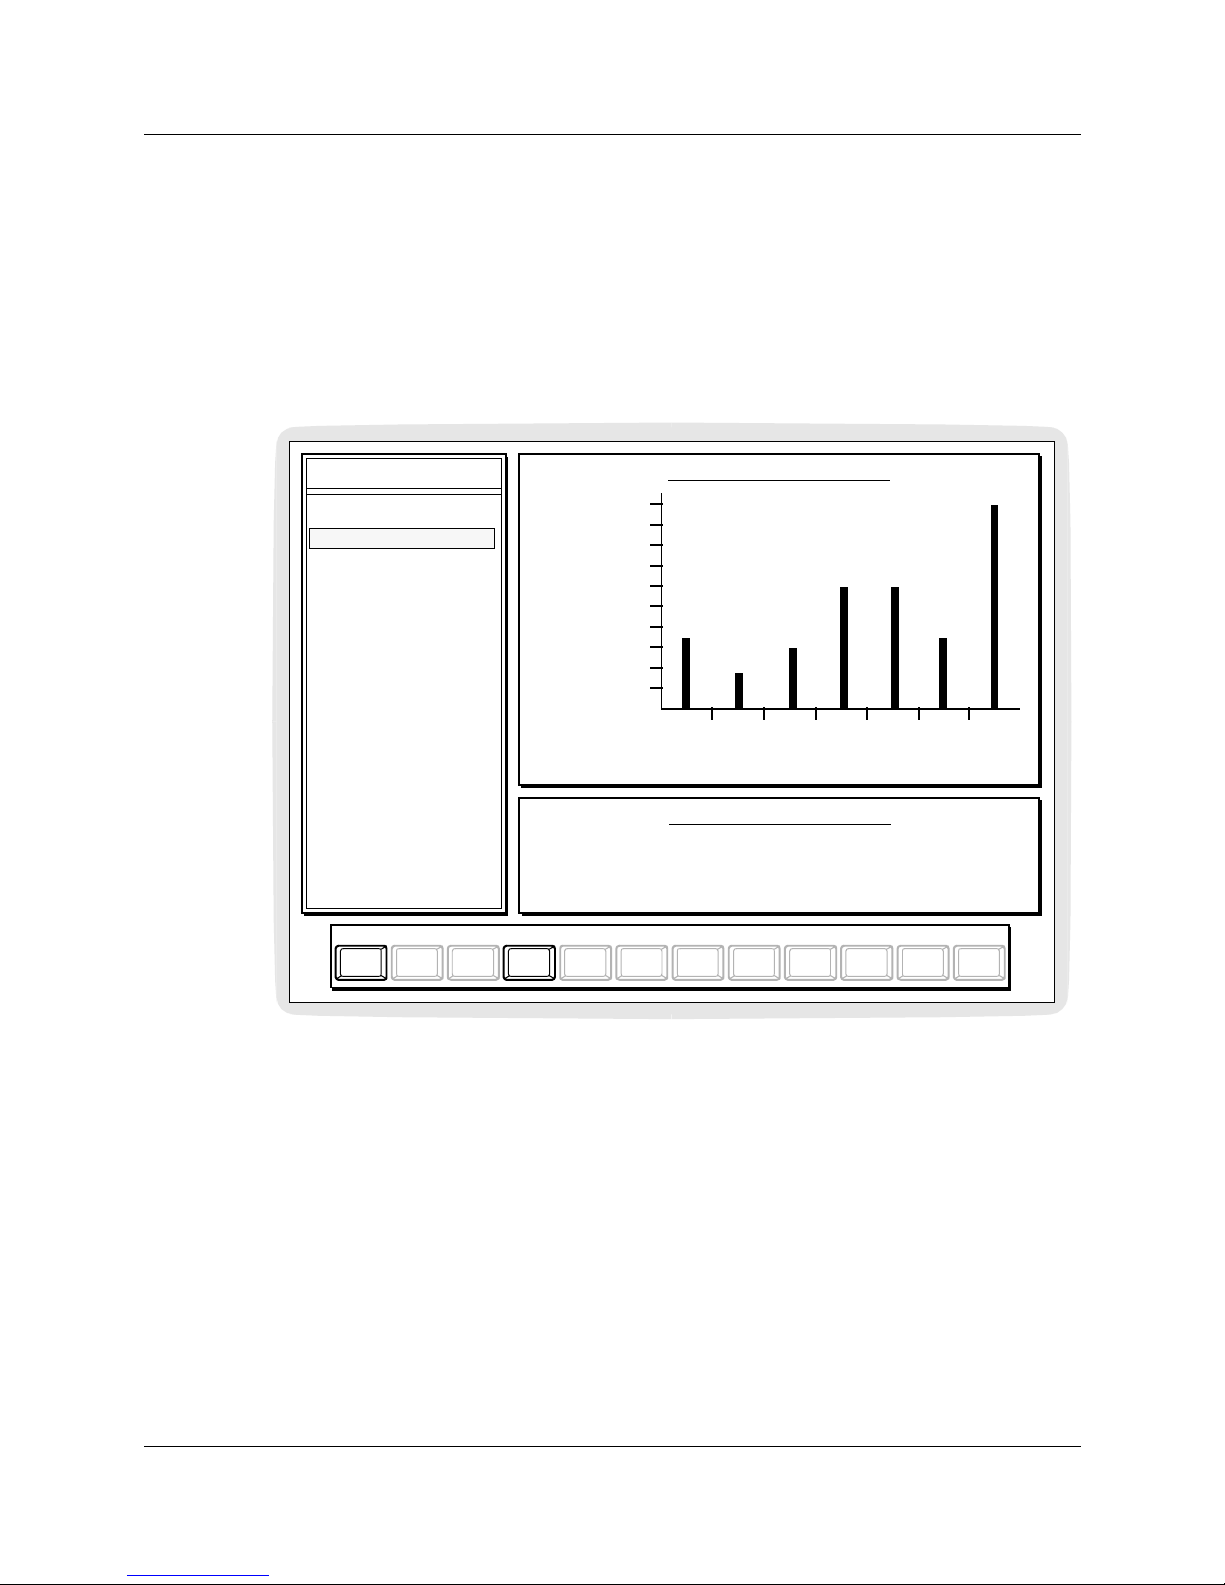
Display screens 75
P0887339 Issue 02 Standard Companion Diagnostic Software User Guide
Lost Link RSSI
Lost Link RSSI measures aid in the detection of internal inte rference
and cell layout problems. These problems may be indicated by
examining the range of RSSI le vels at which links are lost with
respect to the wireless system's normal cell boundary value. T he cell
boundary value is the RSSI level that defines the perimeter of the
cell.
Figure 24: Lost Link RSSI display screen
The data window presents a bar chart that plots the relati ve number
of lost links across the typical range of system RSSI levels since the
last wireless system reset. RSSI measurement units, dBm, are
negati ve numbers. The larger the RSSI measure, the stronger the
radio signal (for example, -55 dBm is stronger than -80 dBm).
Links lost in RSSI ranges stronger than the normal RSSI cell
boundary value may indicate internal interference caused by links
established on the same channel in nearby cells.
When links are lost from ranges below the normal RSSI cell
boundary value, the indication is that cell layout is ineffective or that
users are attempting to go outside the bounds of the area covered by
the wireless system.
INTERFERENCE
LOST LINK RSSI DISTRIBUTION
^Brk
F9F8F7F6F5F2F1 F4^F3Esc
GoBack Exit
F10
-40 -50 -60 -70 -80 -90
Relative
Lost Links
RSSI - dBm
(Long te rm)
LOST LINK RSSI DISTRIBUTION
This histogram shows the relative number of links lost over the range of RSSI
values across the whole system.
-80 dBm.
L
ost Link RSSI
41% of all links lost were from RSSI ranges stronger than
Page 78
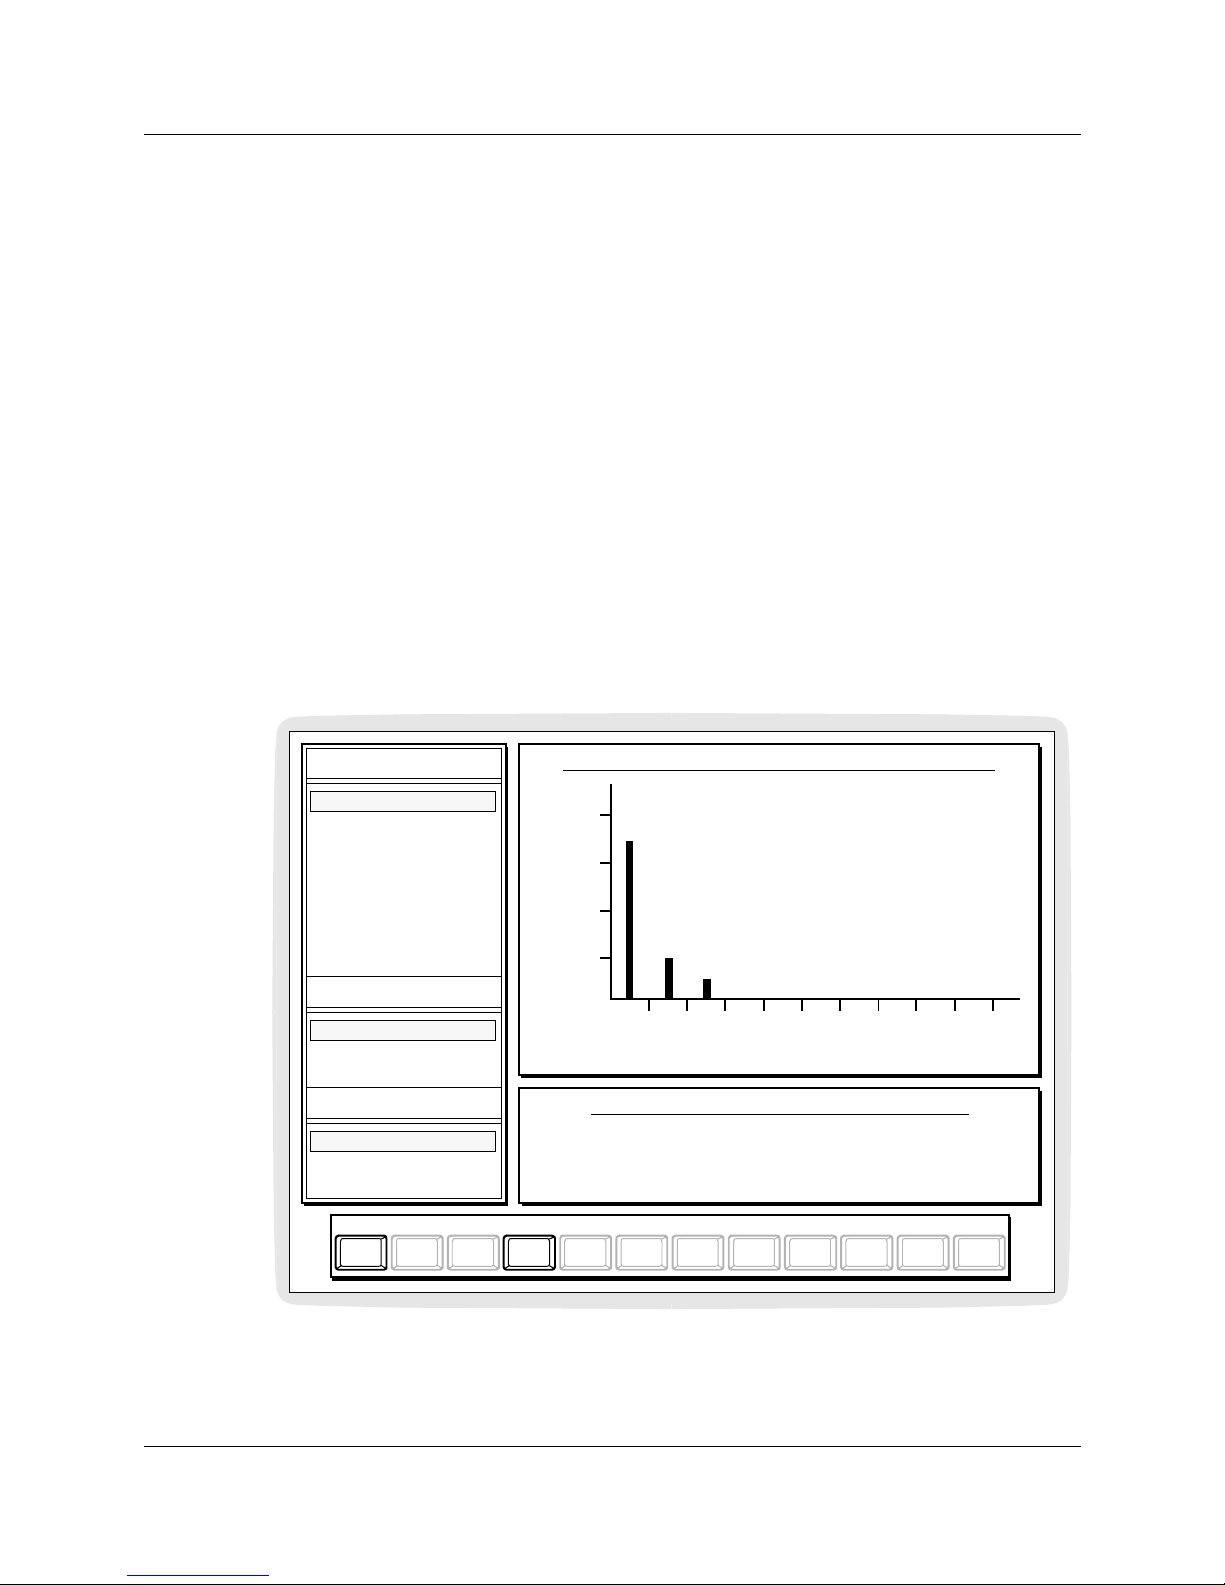
76 Display screens
Companion Diagnostic Software User Guide P0887339 Issue 02 Standard
The dialog ue window gives commentary on the strength of the
RSSI range fro m w hic h most links were lost .
Traffic
Traffic measurements help identify problems with cell layout. If
traff ic is too high across all radios in a cell, the incidence of blocked
calls will increase. Calls are blocked when links cannot be
established because all radios in the cell are already in use.
Two subcommand menus are available under Traffi c display
screens. You can select either the Busiest Hour statistics or the Next
Busiest hour statistics from the HOUR subcommand menu. You can
also select either Bar Chart or Statistics from the Display
subcommand menu.
Radio Occupancy
The Radio Occupancy Bar Chart measures how well radio traffic is
distributed across the wireless system.
Figure 25: Radio Occupancy Bar Chart
The data window presents a bar chart showing the number of radios
plotted against Erlangs per r adio over the selec ted time interv al. The
TRAFFIC
BUSY HOUR RADIO OCCUPANCY DISTRIBUTION
Interval displayed is: May 16 between 15:00 and 16:00 hr.
The busiest radio in the system this hour is: 0106-1 at 0.21 Erlang.
^Brk
F9F8F7F6F5F2F1 F4^F3Esc
GoBack Exit
F10
.1
# Radios
Erlangs per Radio
The least used radio this hour is: 0111-1 at 0.00 Erlang.
The average radio occupancy for this hour is 0.04 Erlang.
2
4
6
8+
.2 .3 .4 .5 .6 .7 .8 .9 1.0
R
adio Occupancy
Cell
O
ccupancy
DISPLAY
Bar Chart
S
tatistics
HOUR
B
usiest Hour
N
ext Busiest
Page 79
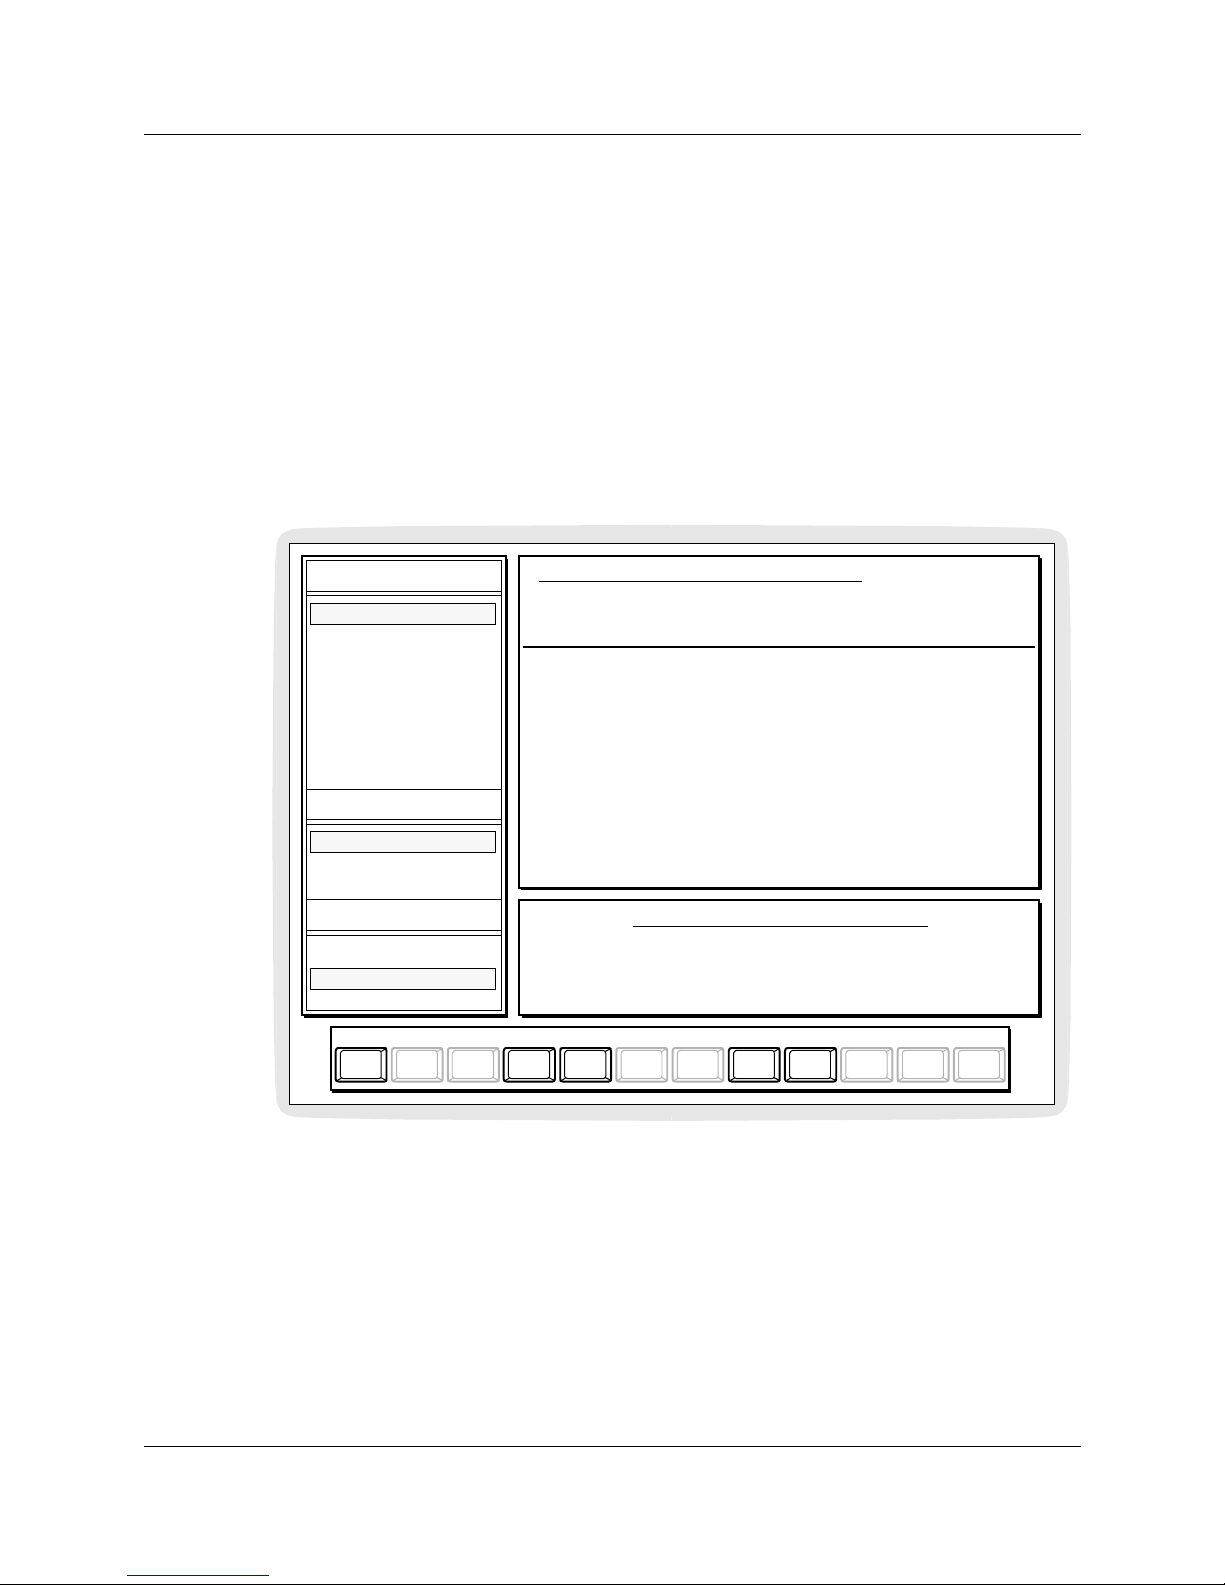
Display screens 77
P0887339 Issue 02 Standard Companion Diagnostic Software User Guide
specific time interv al is indicated abov e the bar chart. An Erlang is a
ratio of the amount of time a radio is in use over a given time
interval. A radio occupanc y measure of 1.0 Erlang indicates t hat the
radio was in use for 100% of the selected time interval.
The dialogue window identifies the busiest and least used radios
over the selected time interval and gives their respective occupancies
in Erlangs. The system average radio occupancy is also given.
The Radio Occupancy Statistics screen provides traffic measures for
each radio. You can use these statistics to examine cell occupancy
measures by collecting data on each radio.
Figure 26: Radio Occupancy Statistics
Occupancy measures must be examined on a per cell basis in order
to determine if a traffic problem exis ts. A lar ge number of radios in
one cell with high Erlang values indicates a traffic problem. High
traff ic on one radio in a cell does not necessarily mean that calls are
being blocked. A user may maintain an established link for the entire
sample hour, but calls will not be block ed in that cell if other radios
are available.
The data window presents a table that lists the occupancy measure
for each radio in Erlangs over the selected time interval. The specific
BUSY HOUR RADIO TRAFFIC STATISTICS
In this hour, there were 10 incoming calls and 28 portable originated
^BrkF9F8F7F6F5F2F1 F4^F3Esc
GoBack Exit
F10
call sessions. The system occupancy for this hour averages 0.04 Erl/radio.
The highest occupancy for this hour is 0.21 Erlang.
Interval displayed is: May 16 between 15:00 and 16:00 hr.
Lost
0
1
0
0
0
0
0
0
0
0
Links
BUSY HOUR RADIO TRAFFIC STATISTICS
Out
5
3
6
5
4
1
3
3
1
1
Links
Cell
0.45 Erl
0.19 Erl
0.19 Erl
0.19 Erl
0.45 Erl
0.45 Erl
0.19 Erl
0.19 Erl
0.09 Erl
0.09 Erl
Occ Avg
Radio
0.21 Erl
0.15 Erl
0.10 Erl
0.10 Erl
0.06 Erl
0.05 Erl
0.03 Erl
0.03 Erl
0.03 Erl
0.02 Erl
Occ
Radio
0106-1
0104-1
0101-1
0105-1
0103-2
0103-1
0107-1
0106-2
0104-2
0101-2
Cell
01
02
01
02
01
01
02
02
03
03
In
1
4
0
1
1
2
0
0
1
0
Calls
TRAFFIC
R
adio Occupancy
Cell
O
ccupancy
DISPLAY
Bar Chart
S
tatistics
HOUR
B
usiest Hour
N
ext Busiest
File Up Down
Page 80

78 Display screens
Companion Diagnostic Software User Guide P0887339 Issue 02 Standard
time interv al is indic ate d a bove the table. R adios ar e listed in order,
starting from the busiest as determined by the highest Erlang value.
The following information is collected for each radio and is also
presented in the data window.
In Calls
This column lists the number of calls recei ved b y portables from the
radio listed.
Out Links
This column lists the total number of links established by the
portables to initiate call setup, plus the total number of links
reestablished by portables due to interference or mobility hand-off
(on the radio listed).
Lost Links
This column lists the total number of established links that we re lost
from the radio listed.
The dialogue window gives the number of incoming calls and the
number of portable originated call sessions for the system over the
selected time interval. The number of portable originated call
sessions is the number of links established by portables less the
number of links reestablished by portables less the number of links
lost. The average system occupancy and the highest occupancy by a
single radio are also given in Erlangs.
Page 81
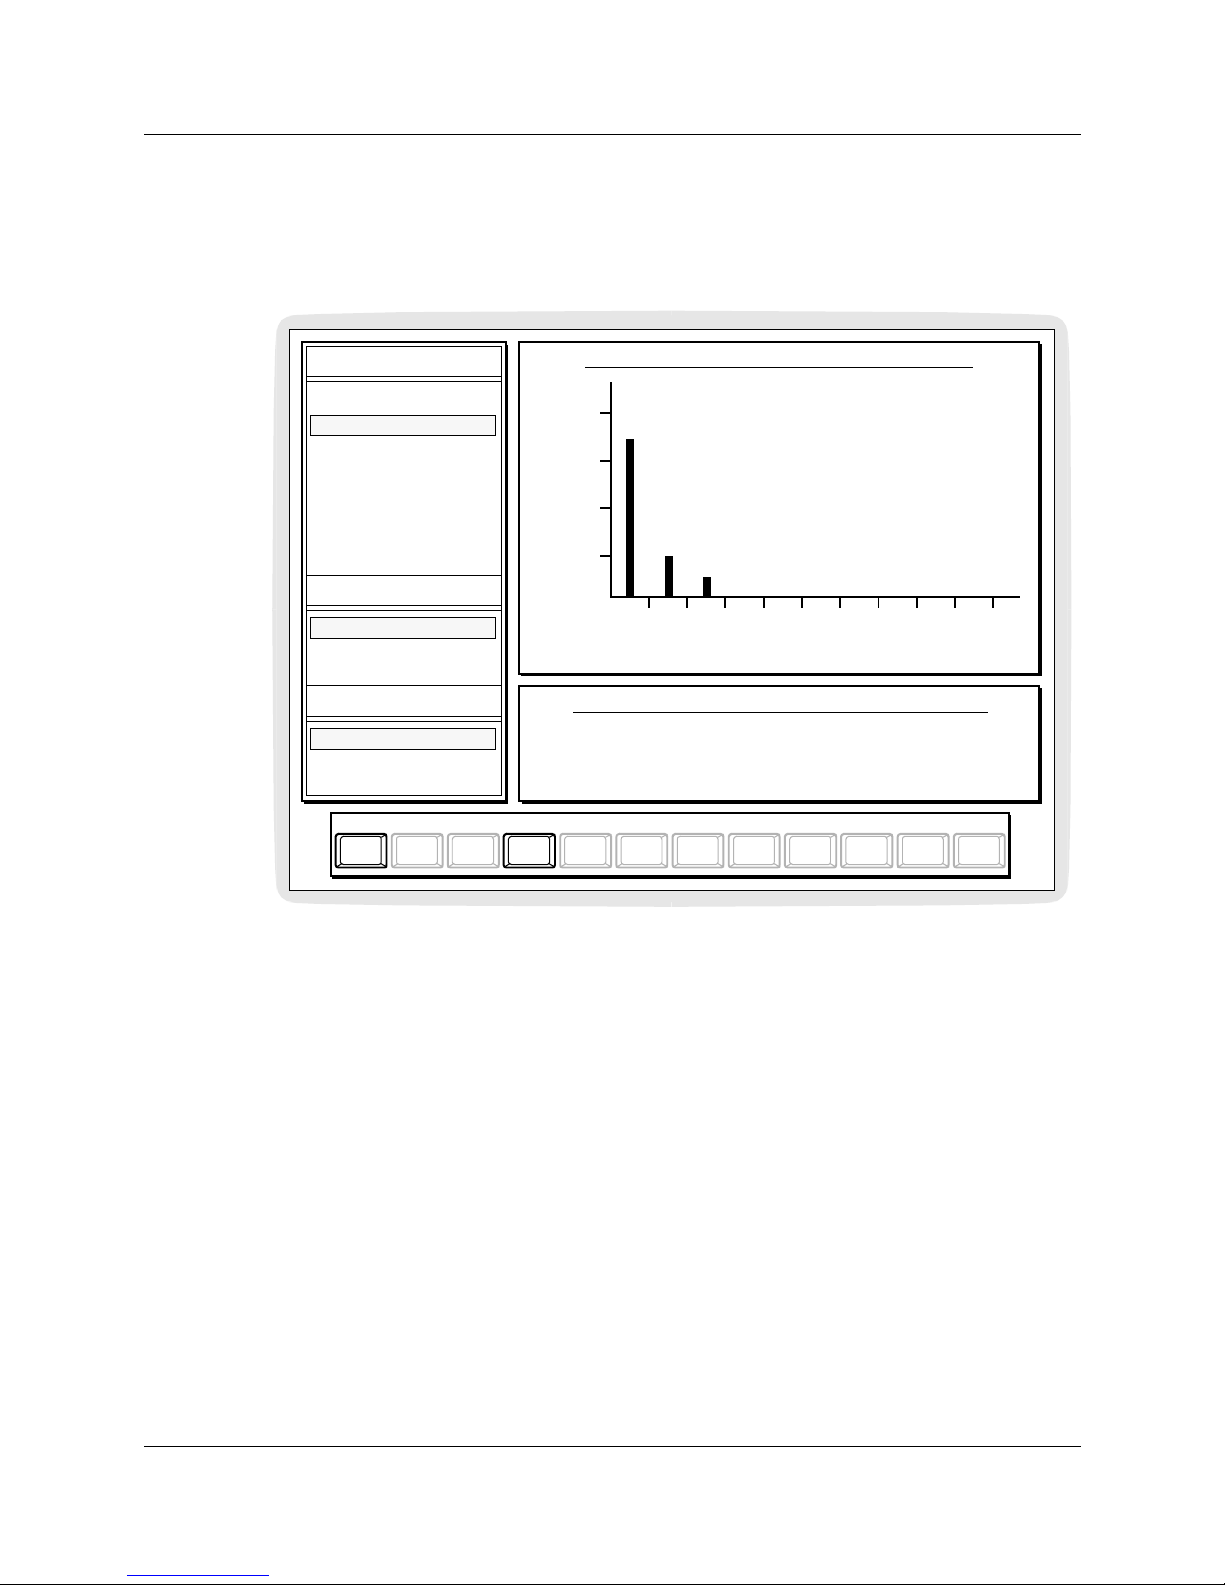
Display screens 79
P0887339 Issue 02 Standard Companion Diagnostic Software User Guide
Cell Occupancy
The Cell Occupancy Bar Chart measures how well radio traffic is
distribute d across the wireless system at the cell le vel.
Figure 27: Cell Occupancy Bar Chart
The data window presents a bar chart showing the number of cells
plotted against the Cell Occupancy average over the selected time
interval. The Cell Occupancy av erage is the total radio occupancy in
the cell averaged over the total number of radios in that cell. The
specific time interval is indicated above the bar chart. Radio
occupancy is measured in Erlangs. An Erlang is a ratio of the amount
of time a radio is in use over a given time interva l. 1.0 Erlang
indicates the radio was in use for 100% of the selected time interval.
The dialogue window identifies the busiest cells over the selected
time interval and giv es their res pecti ve occupancies in Erlangs. The
system average cell occupancy is also given.
BUSY HOUR CELL OCCUPANCY AVERAGE DISTRIBUTION
Interval displ ayed is : May 16 bet ween 15:00 an d 16 :00 hr.
The highest cell occupancy average in the system this hour is 0.24 Erlang
^BrkF9F8F7F6F5F2F1 F4^F3Esc
GoBack Exit
F10
.1
# Cells
Cell Occupancy Average (Erlangs/Radio)
in Cell 05.
The busiest cell this hour is Cell 05, with total occupancy of 0.96 Erlang.
2
4
6
8+
.2 .3 .4 .5 .6 .7 .8 .9 1.0
TRAFFIC
R
adio Occupancy
Cell
O
ccupancy
DISPLAY
Bar Chart
S
tatistics
HOUR
B
usiest Hour
N
ext Busiest
The system occupancy for this hour is 0.06 Erlang.
Page 82
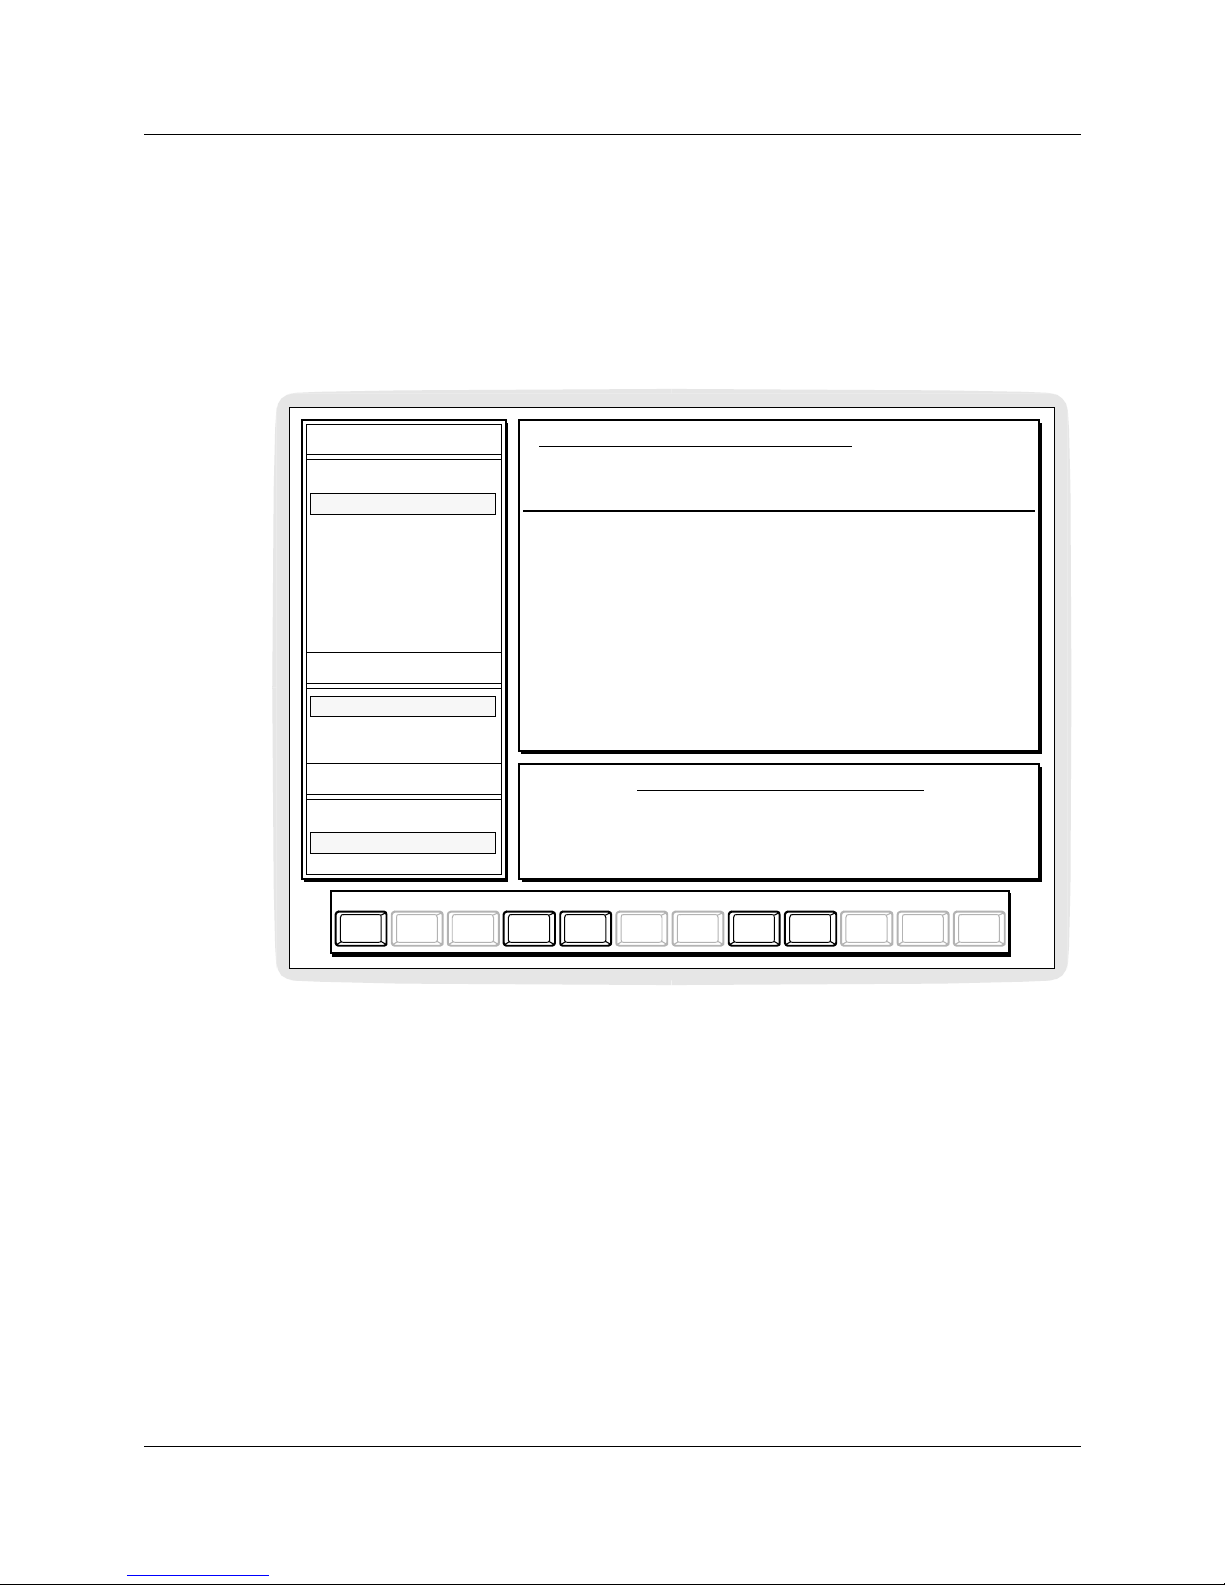
80 Display screens
Companion Diagnostic Software User Guide P0887339 Issue 02 Standard
Cell Occupancy Statistics pro vide traff ic measures for each cell. The
total cell occupancy is the total ra dio occupancy in that cell. The Cell
Occupancy average is the total cell occupancy divided by the total
number of radios in the cell. You can use these statistics to find
heavily used cells, under-provisioned cells and under-used cells, and
to determine the overa ll cell traffic pattern.
Figure 28: Cell Occupancy Statistics
The data window presents a table that lists both the total and
average occupancy measure of each cell in Erlangs over the selected
time interva l. The specif ic time interv a l is indicated abo v e the table.
Cells are listed in order, starting from the busiest as determined by
the cell occupancy average. The following information is collected
for each cell and is also presented in the data window.
In Calls
This column lists the number of calls recei ved b y portables from the
radios in that cell.
Out Links
This column lists the total number of links established by the
portables to initiate call setup plus the total number of links
BUSY HOUR CELL TRAFFIC STATISTICS
In this hour, there were 56 incoming calls and 28 portable originated
^Brk
F9F8F7F6F5F2F1 F4^F3Esc
GoBack Exit
F10
call sessions. The system occupancy for this hour averages 0.06 Erl/radio.
The highest cell occupancy for this hour is 0.96 Erlang.
Interval displayed is: May 16 between 15:00 and 16:00 hr.
Lost
0
1
0
1
0
Links
BUSY HOUR CELL TRAFFIC STATISTICS
Out
7
5
7
11
7
Links
Total
0.96 Erl
0.04 Erl
0.04 Erl
0.04 Erl
0.04 Erl
Occ
No. of
4
2
2
2
2
Radios
Cell
05
02
03
01
04
Cell
0.24 Erl
0.02 Erl
0.02 Erl
0.02 Erl
0.02 Erl
In
39
5
4
5
3
CallsOcc Avg.
TRAFFIC
R
adio Occupancy
Cell
O
ccupancy
DISPLAY
Bar Chart
S
tatistics
HOUR
B
usiest Hour
N
ext Busiest
File Up Down
Page 83

Display screens 81
P0887339 Issue 02 Standard Companion Diagnostic Software User Guide
reestablished by portables due to interference or mobility hand-off
(for radios in the cell indicated).
Lost Links
This column lists the total number of e stablished links that were los t.
The dialogue window gives the number of incoming calls and the
number of portable-originated call sessions for the system over the
selected time interval. The number of portable-originated call
sessions is the number of links established by portables less the
number of links reestablished by portables less the number of lost
links. The average system occupancy and the highest occupanc y b y
a single cell are also given in Erlangs.
CSC Links
CSC Links presents common signalling channel (CSC) related data.
A comparison is mad of average system CSC RSSI and average
system traffic RSSI on both a system and a cell basis. CSC RSSI
statistics and other CSC related data is also given for cells and
individual radios. Thi s information is a v ailable under CSC Links by
selecting either CSC Signals or CSC Usage. The CSC Links data is
valid since the la st syst em reset.
A main CSC links display screen is displayed by default when the
CSC Links option is selected from the Diagnosis menu. The CSC
Links menu screen displays the two sup-options available: CSC
Signals and CSC Usage.
The data window sho w s a CSC RSSI h i stogram fo r t h e system
alsong with a corresponding traffic RSSI histogram. This gives an
overall indication of CSC versus traff ic radio operation.
In the dialogue window there is information on the average RSSI
for the CSC radios and the average RSSI for the traffic radios.
CSC Signals
The CSC Signals menu displays the RSSI of CSC radios in the form
of a histogram or a statistical table. There are four sub-menu options
av ailable in this menue: weakest cell, next weakest cell, cell statistics
and radio statistics. The default option is the weakest cell.
The data window of the weakest cell and next weakest cell options
display the RSSI of the CSC and traffic radios in the chosen cell in
the form of a histogram. The CSC radio RSSI is displayed along
with the traffic radio RSSI for comparison purposes.
Page 84

82 Display screens
Companion Diagnostic Software User Guide P0887339 Issue 02 Standard
The dialogue window states the average CSC RSSI value and the
average traffic RSSI for the chosen cell.
The Cell Statistics option provides CSC signal statistics from the
weakest CSC RSSI cell to the strongest cell.
The data window displays in table form the cell, CSC RSSI, the
number of samples used in determining the RSSI, and for
comparison purposes the traffic RSSI and the number of traffic
samples used.
The dialogue window gives the average RSSI level over all of the
system cells and the cell with the weakest average CSC RSSI.
The Radio Statistics option provides CSC signal statistics from the
radio with the weakest CSC RSSI to the strongest.
The data w indow displays, in table form, the radio, the cell in which
the radio is located, the radio CSC RSSI, the number of samples
used in determining the RSSI, and for comparison purposes the
traffic RSSI and the number of traffic samples used.
The dialogue window give the average RSSI level over all of the
system radios and the radio with the weakest average CSC RSSI.
Page 85
Display screens 83
P0887339 Issue 02 Standard Companion Diagnostic Software User Guide
CSC Usage
The CSC usage menu displays the CSC radio usage in terms of
either cell statistics or radio statistics. This information can be
looked at for the busiest hour or any subsequent hour. The default
selections for this screen are cell statistics and busiest hour.
Figure 29: CSC Usage Cell Statistics Display Screen
Cell statistics shows, for each cell, the percentage of time a CSC
radio is available for the chosen hour.
The data window presents a table showing the cells, the number of
radios in the cell, and the percentage of time a CSC radio is available
in each cell. The data is displayed in order of increasing CSC radio
availability.
^BrkF9F8F7F6F5F2F1 F4^F3Esc
GoBack Exit File Up Down
F10
Interval displayed is June 2 between 13:00 and 14:00 hr.
Number of
2
4
2
4
Cell
02
03
15
12
Radios i n Ce ll
Percentage of time
55
61
68
76
CSC is available
CELL CSC USAGE STATISTICS
16
06
09
04
07
13
14
11
01
05
08
4
4
4
6
4
4
6
4
4
8
6
76
83
83
85
86
90
90
95
97
100
100
CSC USAGE
C
ell Statistics
R
adio Statistics
HOUR
B
usiest Hour
N
ext Busiest
Page 86
84 Display screens
Companion Diagnostic Software User Guide P0887339 Issue 02 Standard
Radio Statistics shows the percentage of time each radio serves as a
CSC radio.
Figure 30: CSC Usage Radio Statistics Display Screen
The data window presents a table showing each radio gr ouped into
cells, the percentage of time each radio serves as a CSC radio, and
the number of portable registrations. Data is displayed in order of
increasing cell number.
^BrkF9F8F7F6F5F2F1 F4^F3Esc
GoBack Exit File Up Down
F10
Interval displayed is June 2 between 13:00 and 14:00 hr.
Radio
0101-1
0101-2
0107-1
0107-2
Cell
01
01
02
02
Percent time as
100
0
20
35
a CSC radio
RADIO CSC USAGE STATISTICS
03
03
03
03
04
04
04
04
04
04
05
0110-1
0110-2
0111-1
0111-2
0113-1
0113-2
0126-1
0126-2
0302-1
0302-2
0121-1
0
61
0
0
30
45
0
0
25
0
40
CSC USAGE
C
ell Statistics
R
adio Statistics
HOUR
B
usiest Hour
N
ext Busiest
Page 87
Display screens 85
P0887339 Issue 02 Standard Companion Diagnostic Software User Guide
Monitor
The Monitor display screen offers a choice of five different level 2
command paths. The Monitor display screens examine specific parts
of the wireless system in real time, and aid in the detection of
individual malfunctioning radios, poor cell layout, and interference
problems.
Figure 31: Monitor display screen
Note: If you select a saved dataset for your current CDS session,
the Moni tor display screens a r e not available.
^BrkF9F8F7F6F5F2F1 F4^F3Esc
GoBack Exit
F10
MONITOR
R
eset RIM
B
ackground RSSI
Q
uery BS Faults
Clear BS
F
aults
C
lear Counters
Page 88
86 Display screens
Companion Diagnostic Software User Guide P0887339 Issue 02 Standard
Background RSSI
After you select Background RSSI from the Monitor menu, a screen
prompts you to select the radio you wish to monitor. CDS identifies
radios by a four -digit port number follo wed by a hyphen and a single
digit radio number (for example, 0101-2).
Figure 32: Background RSSI radio selection
1. Type the radio identification and press:
MONITOR
^BrkF9F8F7F6F5F2F1 F4^F3Esc
GoBack
F10
BACKGRO UND CHA NNEL R SSI
Enter radio to be monitored:
R
eset RIM
Q
uery BS Faults
Clear BS
F
aults
C
lear Counters
B
ackground RSSI
Enter
Page 89
Display screens 87
P0887339 Issue 02 Standard Companion Diagnostic Software User Guide
The radio you specify must be taken out of service to be monitored.
A screen prompts you to conf irm your r equest. In the data window
a warning is given that the selected radio will be disabled while
monitoring is taking place. Calls are not dropped because CDS waits
until the radio is inactive before disabling it. The radio will be
reactivated after monitoring is completed.
Figure 33: Background RSSI radio disable warning
1. To continue, and to disable the radio, press:
OR
To cancel your request and return to the Monitor display screen,
press:
^Brk
F9F8F7F6F5F2F1 F4^F3Esc F10
BACKGROUND CHANNEL RSSI
Radio 0101-2 is currently selected.
******************
******************
WARNING
THIS COMMAND WILL DISABLE THE RADIO
F2 to Cancel, F5 to Disable
Cancel Disable
MONITOR
R
eset RIM
Q
uery BS Faults
Clear BS
F
aults
C
lear Counters
B
ackground RSSI
F5
F2
Page 90
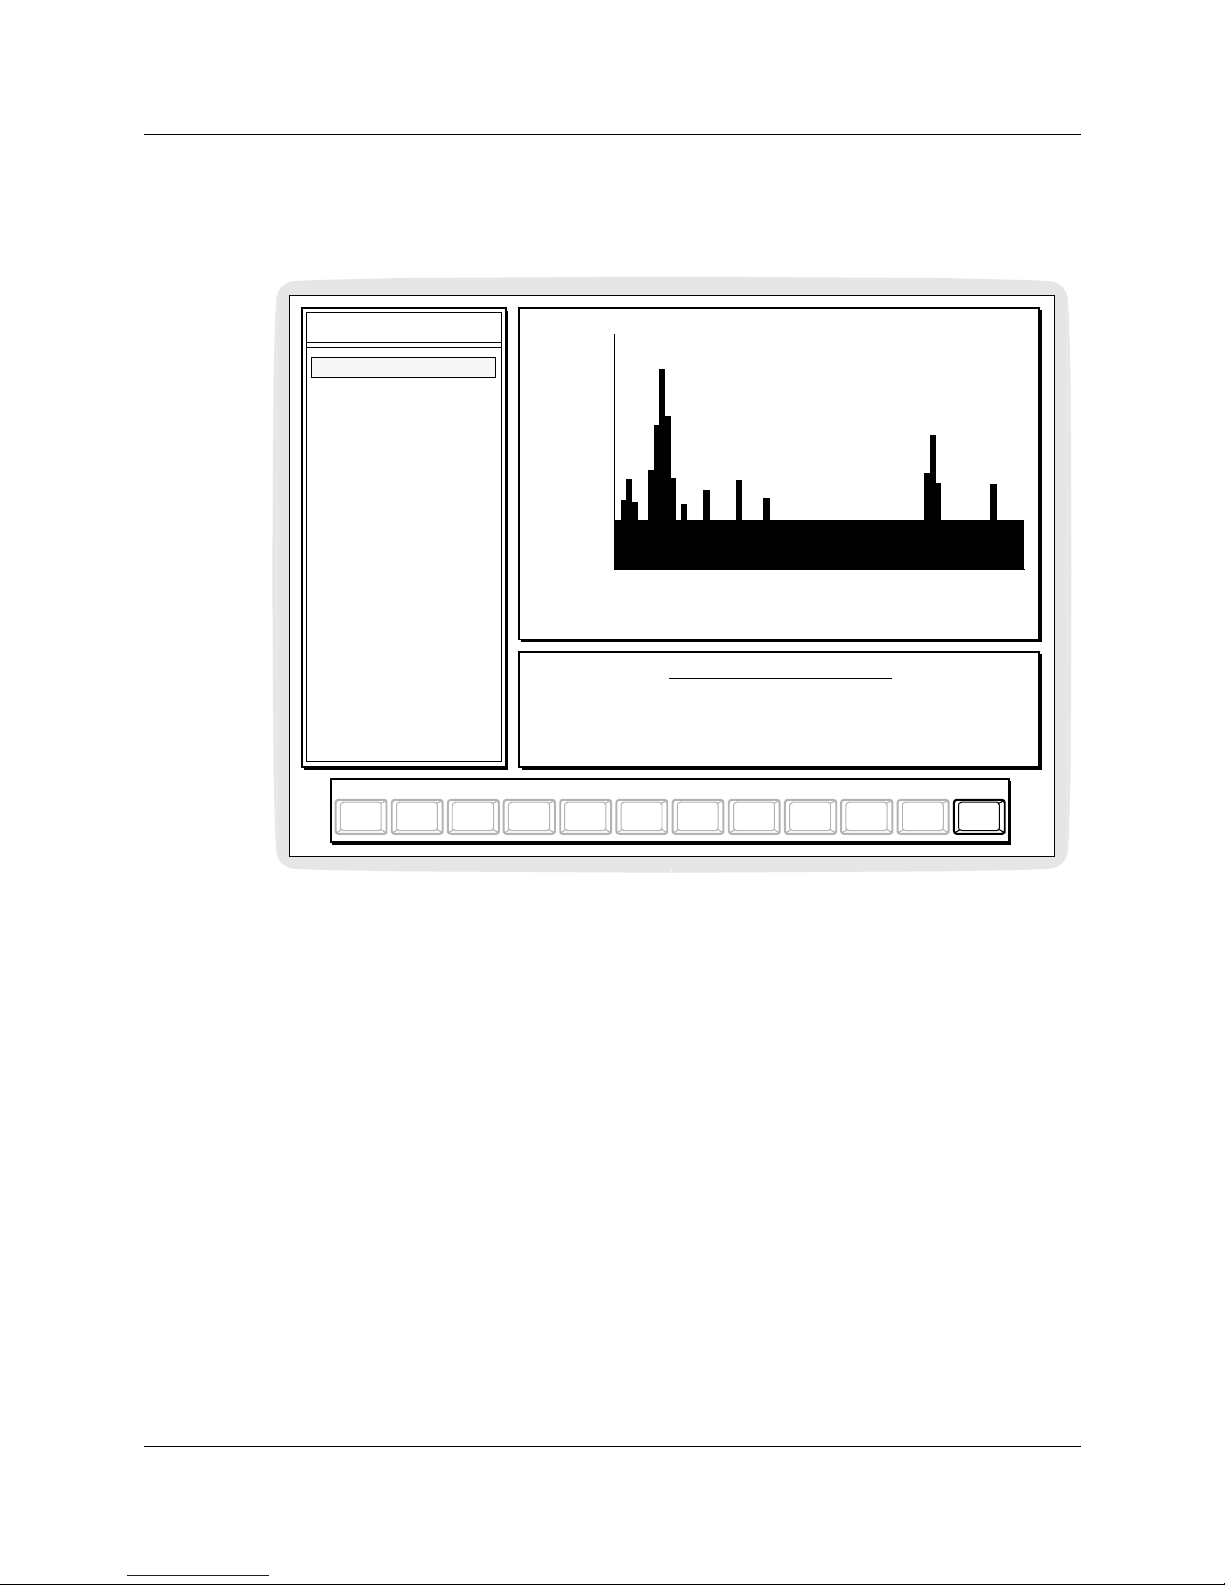
88 Display screens
Companion Diagnostic Software User Guide P0887339 Issue 02 Standard
Background RSSI allows you to monitor the RSSI readings of
channels 1–99 from the perspective of the radio selected.
Figure 34: Background RSSI display screen
The data window displays a bar chart of data resulting from the
channel monitoring. The signal level is indicated by the height of the
channel RSSI bar. Internal or adjacent channel interference is
indicated by an increase in the height of a bar next to an occupied
channel.
You can also use this display screen to find external sources of
interference. When there are no calls active on the wireless system
(you may have to restrict access for a test period), the bar chart
should be relatively flat at RSSI levels between -95 dBm and -110
dBm. If you do not observe this behavior, it is most likely that
external interference is hindering the operation of the wireless
system. Once identified, all sources of external interference should
be eliminated if possible.
Note: If a call is active on the other radio of the Base Station
associated with the selected radio, the RSSI of the channel on
which the other radio's call is active is displayed as -35 dBm
regardless of its true value. For example, if you are
BACKGROUND RSSI
BACKGROUND CHANNEL RSSI
^BrkF9F8F7F6F5F2F1 F4^F3Esc F10
Radio 0101-2 is currently being monitored.
Abort
-30
-50
-70
-90
0
1
0
2
0
3
0
4
0
5
0
6
0
7
0
8
0
9
0
1
0
0
dBm
Channels
R
eset RIM
B
ackground RSSI
Q
uery BS Faults
Clear BS
F
aults
C
lear Counters
Page 91

Display screens 89
P0887339 Issue 02 Standard Companion Diagnostic Software User Guide
monitoring a call on radio 0101-2 and there is also an active
call on radio 0101-1, the RSSI level of the channel currently
being used by radio 0101-1 is displayed as -35 dBm.
The dialogue window identifies the radio being monitored.
CT2Plus supports 5 common signalling channels separate from the
40 traffic channels. Each of these 5 CSC channels has 12 timeslots
for a total of 60 timeslot s. Every cell in the system chooses one radio
in the cell as that cell’s CSC radio. Each CSC radio in the system is
giv en one of the 60 time sl ots and tran smits a message beacon on its
assigned timeslot. A portable in the coverage area scans all visible
beacons and registers to the CSC radio whose beacon has the
strongest signal. The portable and CSC radio will continue to
communicate ove r that same CSC timeslot until the portable user
moves to a new location .
Background channel RSSI can be used to ensure that all CSC
timeslot frequencies are free of external interference. Even when
there is no regular radi o traf fic, t here will be acti vity in the common
signalling channels. Each CSC radio beacon appears in its
appropriate timeslot. These CSC radio beacons should not be
confused with sources of fixed interference . To eliminate confusion
when checking Background Channel RSSI, suspend CSC operation
by diabling all radios except one in ev ery cell. This will prev ent any
radio from becoming a CSC radio and sending out a beacon signal.
If there are other Companion systems located nearby, beacons may
appear from them b ut will be uns ynchronized. The y will appear as a
bar that gradually shifts through all 12 timeslots on one or more of
the 5 CSC channels.
When the user selects one of the three channel scans CSC Receive
Scan, CSC Transmit Scan or SCS Rx & Tx Scan, the channel scan
graph displays the 60 timeslots grouped as 5 channels with 12
timeslots in each.
Selecting CSC Receive Scan monitors each of the 60 CSC receive
timeslots for RSSI data. This shows if there are any portables
transmitting on any of those times lots and also shows if there are any
co-located unsynchronized systems interfering with those timeslots.
Selecting CSC Tr ansmit Scan monitors each of the 60 CSC transmit
timeslots for RSSI data. This shows all the CSC radio beacons that
are in use in the system, and any co-located unsynchronized systems
in range of the scanning radio.
Page 92

90 Display screens
Companion Diagnostic Software User Guide P0887339 Issue 02 Standard
Selecting CSC Rx & Tx Scan monitors both receive and transmit
timeslots.
The data window displays a bar chart of data resulting from CSC
channel monitoring.
The dialogue window gives the radio currently being monitored.
The Abort softkey will reacti vate the radio and go back to the
Monitor menu.
CRC Errors
You can use the Cyclical Redundancy Check (CRC) Errors display
screen to exa mine the voice quality of a call in progress on a s pecific
radio. Use this display screen in conjunction with the directed or
undirected RSSI feature on a portable to ensure that you monitor the
radio to which the portable is connected. Refer to the wireless
system documentation for more information on directed and
undirected RSSI features.
Directed RSSI
1. Establish a link from your portable.
2. Invoke the directed RSSI feature and enter the radio to which
you want the portable to connect.
3. Enter the same radio on the CRC Errors radio selection display
screen as described below.
Undirected RSSI
1. Establish a link from your portable.
2. Inv ok e the undirected RSSI feature and enter the radio to which
you want the portable to connect.
3. Enter the identified radio on the CRC Errors radio selection
display screen as described below.
After you select CRC Errors from the Monitor men, a screen
prompts you to select the radio you wish to monitor. CDS identifies
radios by a four -digit port number follo wed by a hyphen and a single
radio number (for example, 0112-2).
1. Type the radio identification and press:
The data window presents the voic e quality of the selected radio in
the form of a bar graph. The height of the bar updates every second
Enter
Page 93
Display screens 91
P0887339 Issue 02 Standard Companion Diagnostic Software User Guide
and is the weighted average of bad CRC packets over the last 10
seconds. Perfect voice quality is indicated b y zero bad CRC packets
per 10-second sample. The higher the number of bad packets per 10second sample, the more degraded the voice quality.
The dialogue window identifies the radio being monitored.
The Abort softkey will reacti vate the radio and go back to the
Monitor menu.
Reset RIM
After you select Reset RIM from the Monitor menu, a screen
prompts you to select the radio whose RIM you wish to reset. CDS
identifies radios by a four digit port number followed by a hyphen
and the single digit radio number (for example, 0109-1).
Figure 35: Reset RIM radio selection
1. Type the radio identification and press:
MONITOR
^BrkF9F8F7F6F5F2F1 F4^F3Esc
GoBack
F10
RESET RIM
Enter radio to be reset:
R
eset RIM
B
ackground RSSI
Q
uery BS Faults
Clear BS
F
aults
C
lear Counters
Enter
Page 94
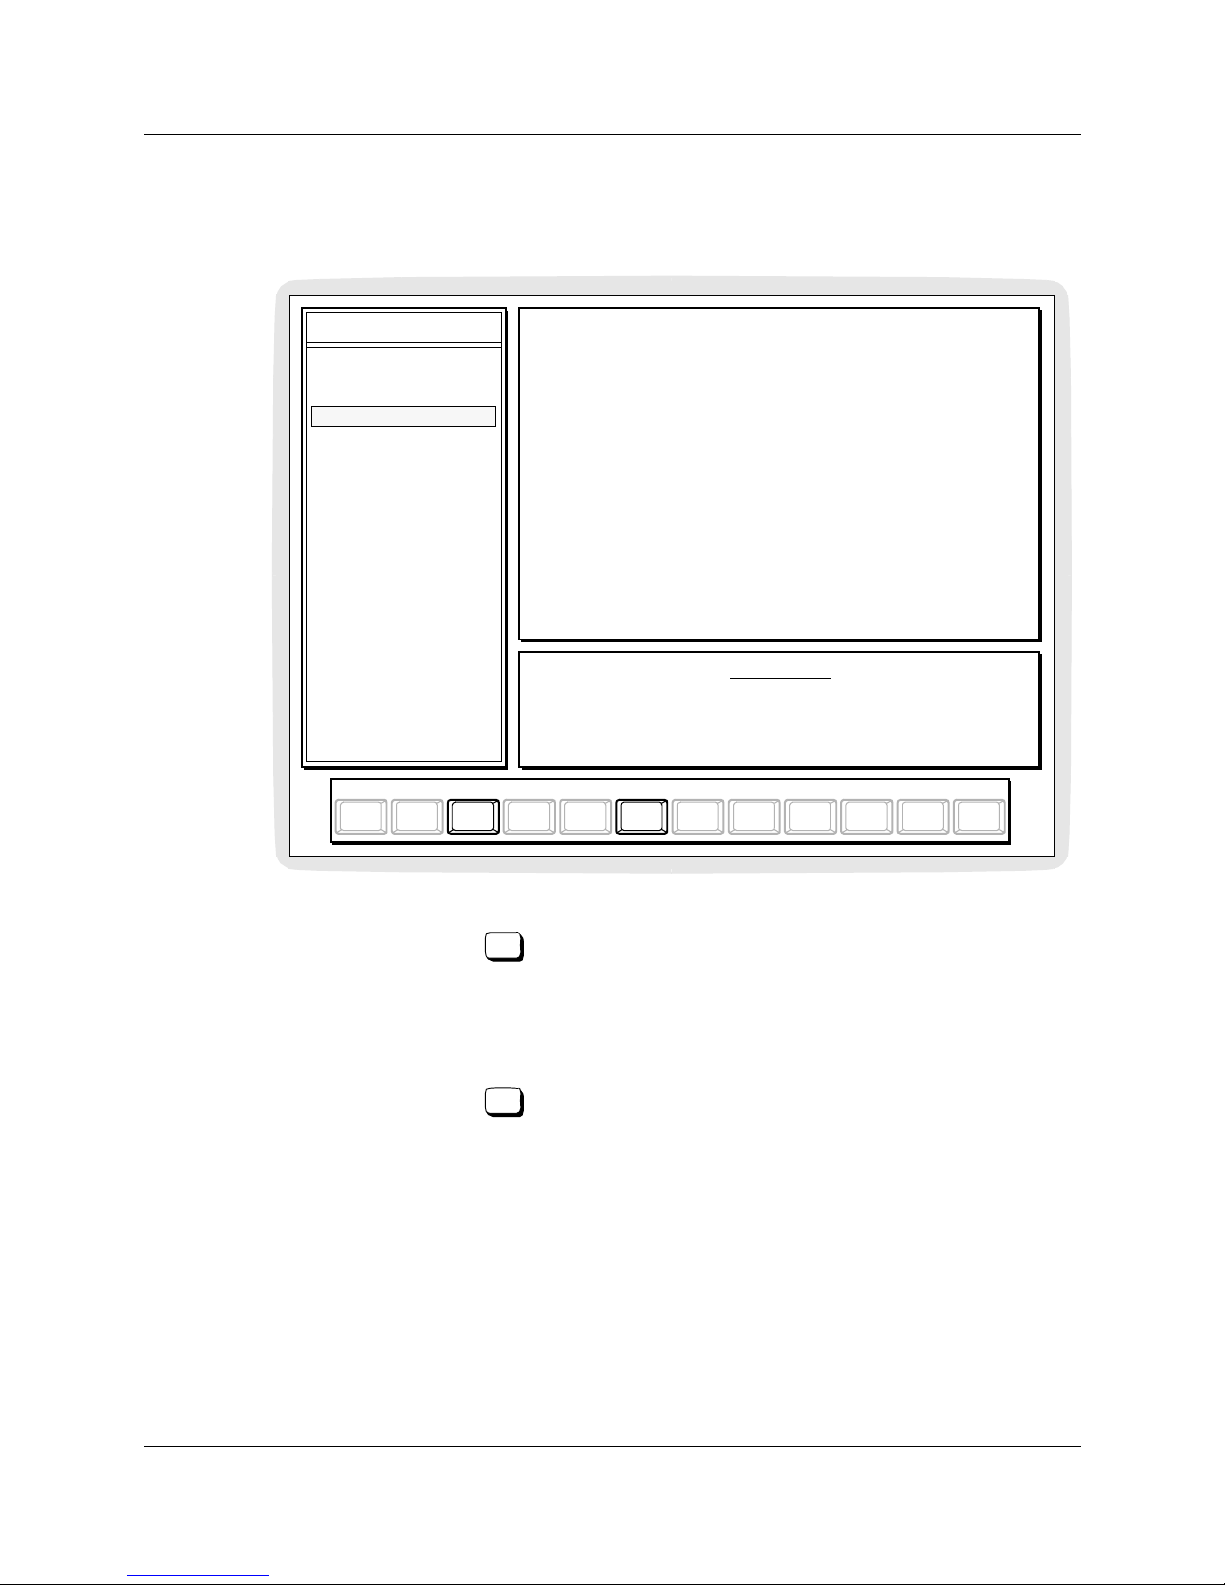
92 Display screens
Companion Diagnostic Software User Guide P0887339 Issue 02 Standard
The radio you specify must be taken out of service to be reset. A
screen prompts you to confirm your request.
Figure 36: Reset RIM radio disable warning
1. To continue, and disable the radio, press:
OR
To cancel your request and return to the Monitor display screen,
press:
If there is an active call on the selected radio, you cannot reset the
radio. If you try, you see an error message saying, “Radio not
suspended; either it is busy or it is missing.”
MONITOR
^BrkF9F8F7F6F1 F4^F3Esc F10
RESET RIM
F5F2
RIM of radio 0109-1 is currently selected.
******************
******************
WARNING
THIS COMMAND WILL DISABLE THE RADIO
F2 to Cancel, F5 to Disable
Cancel Disable
R
eset RIM
B
ackground RSSI
Q
uery BS Faults
Clear BS
F
aults
C
lear Counters
F5
F2
Page 95
Display screens 93
P0887339 Issue 02 Standard Companion Diagnostic Software User Guide
The Reset RIM command resets the RIM of the select ed r adi o.
Figure 37: Reset RIM display screen
The dialogue wind ow identifi es the radio whose RIM is being reset.
The data window displays a message when the RIM Reset has been
successfully executed, after which you are automatically returned to
the Monitor display screen.
MONITOR
^BrkF9F8F7F6F5F2F1 F4^F3Esc
GoBack
F10
RESET RIM
RIM of radio 0109-1 is being reset. Please wait 30 seconds...
RIM reset successf ul!
R
eset RIM
B
ackground RSSI
Q
uery B S Faul t s
Clear BS
F
aults
C
lear Counters
Page 96
94 Display screens
Companion Diagnostic Software User Guide P0887339 Issue 02 Standard
Query BS Faults
After you select Query Base Station (BS) Faults from the Monitor
menu, a screen prompts you to select the Base Station you wish to
monitor. CDS identifies a Base Station by a four-digit port number
(for example, 0104).
Figure 38: Query BS Faults Base Station selection
1. Type the Base Station identification and press:
MONITOR
^BrkF9F8F7F6F5F2F1 F4^F3Esc
GoBack
F10
BASE STATION FAULTS
Enter Base Station to be probed:
R
eset RIM
B
ackground RSSI
Q
uery BS Faults
Clear BS
F
aults
C
lear Counters
Enter
Page 97
Display screens 95
P0887339 Issue 02 Standard Companion Diagnostic Software User Guide
Query BS Faults summarizes the detected system faults for the
selected Base Station.
Figure 39: Query BS Faults display screen
The data window presents the number of system faults experienced
by the selected Base Station since it was last reset. The system fault
counts are categorized under the following columns:
•BS Resets
• Radio Resets
• Integrity Lost
• Synch. Lost
These categories correspond to the System Faults display screens
av ailable under the Diagnosis menu. See ‘System Faults
components’ in the Diagnosis section of this guide for more
information on the categories listed.
Radio Reset Types are also pr esented f or each radio of the selected
Base Station. See ‘Radio Resets’ in the Diagnosis section of this
guide for definitions of the types of radio resets listed.
MONITOR
^BrkF9F8F7F6F5F2F1 F4^F3Esc F10
BASE STAT ION FAULTS
Base Station 0104.
0
BS Resets
Faults for Base Station 0104.
0
Synch. Lo st
File Abort
1
Radio Resets
0
Integ. L ost
0 - RIM Reset Count
Radio 1 Rese t Types
0 - SCL Fault Count
0 - Mem Fault Count
0 - Sanity Fail Count
1 - SS Reset Co unt
0 - Download Fail Count
0 - Halt Cou nt
0 - RI M R eset Count
Radio 2 R eset Typ es
0 - SCL Fault Count
0 - Mem Fault Count
0 - Sanity Fail Count
0 - SS Reset Count
0 - Download Fail Count
0 - Halt Count
R
eset RIM
B
ackground RSSI
Q
uery BS Faults
Clear BS
F
aults
C
lear Counters
Page 98
96 Display screens
Companion Diagnostic Software User Guide P0887339 Issue 02 Standard
If you require more detailed data on a system fault experienced by
the selected Base Station, select the corresponding display screen
from the System Faults menu.
The dialogue window identifies the Base Station for which system
faults are being displayed.
In Query BS Faults the contents of the displayed scr een may be filed
in R_RESUL T .LOG by pressing F4. A standard text editor (e.g., edit
on DOS 5.0) can be used to view this stored data.
Clear BS Faults
The Clear BS Faults command clears all Base Station fault data.
Calls in progress are not affected.
Figure 40: Clear BS Faults display screen
The dialogue wind ow displays a message indicating that the process
of clearing all Base Station fault data is in progress.
MONITOR
^BrkF9F8F7F6F1 F4^F3Esc F10F5F2
Clearing all Base Station faults in all radios. Please wait...
All Base Station fault counters cleared!
R
eset RIM
B
ackground RSSI
Q
uery BS Faults
Clear BS
F
aults
C
lear Counters
Page 99
Display screens 97
P0887339 Issue 02 Standard Companion Diagnostic Software User Guide
The data window displays a message when all Base Station fault
data has been cleared, after which you are automatically returned to
the Monitor display screen.
Clear Counters
The Clear Counters command clears all Base Station operation and
maintenance data. Calls in progress are not affected. A warning that
this command clears all system counters is given first.
Figure 41: Clear Counters display screen
1. To continue, and commit to clearing the counters, press:
OR
!
Warning
All Base Station fault data are permanently cleared.
MONITOR
^BrkF9F8F7F6F1 F4^F3Esc F5
F2 to Cancel, F10 to Commit
******************
******************
WARNING
THIS COMMAND CLEARS ALL SYSTEM COUNTERS
F2 to Cancel, F10 to Commit
F10
Commit
F2
Cancel
R
eset RIM
B
ackground RSSI
Q
uery BS Faults
Clear BS
F
aults
C
lear Counters
F10
Page 100
98 Display screens
Companion Diagnostic Software User Guide P0887339 Issue 02 Standard
To cancel your request and return to the Monitor display screen,
press:
While the system counters are being cleared, the dialogue window
displays a message indicating that the process of clearing all
operation and maintenance data is in progress.
The data window displays a message when all operation and
maintenance data has been cleared, after which you are
automatically returned to the Monitor display screen.
!
Warning
All operation and maintenance data are permanently cleared.
F2
 Loading...