

Page 1
Testing Wearable Electronics
Application Note
The Importance of Testing
Mechanical and Electrical
Performance Simultaneously
Introduction
Wearable electronics present exciting new opportunities for
technology such as health monitoring, fashion and sports
performance evaluation. Sensors, antennae and batteries
can all be incorporated into textiles, making clothing an
integrated circuit that is capable of tirelessly monitoring vital
human body functions, and the environment of the wearer.
One of the main challenges in developing this technology
into consumer products is in understanding how they will
perform in dierent conditions and how they will deteriorate
through their intended life.
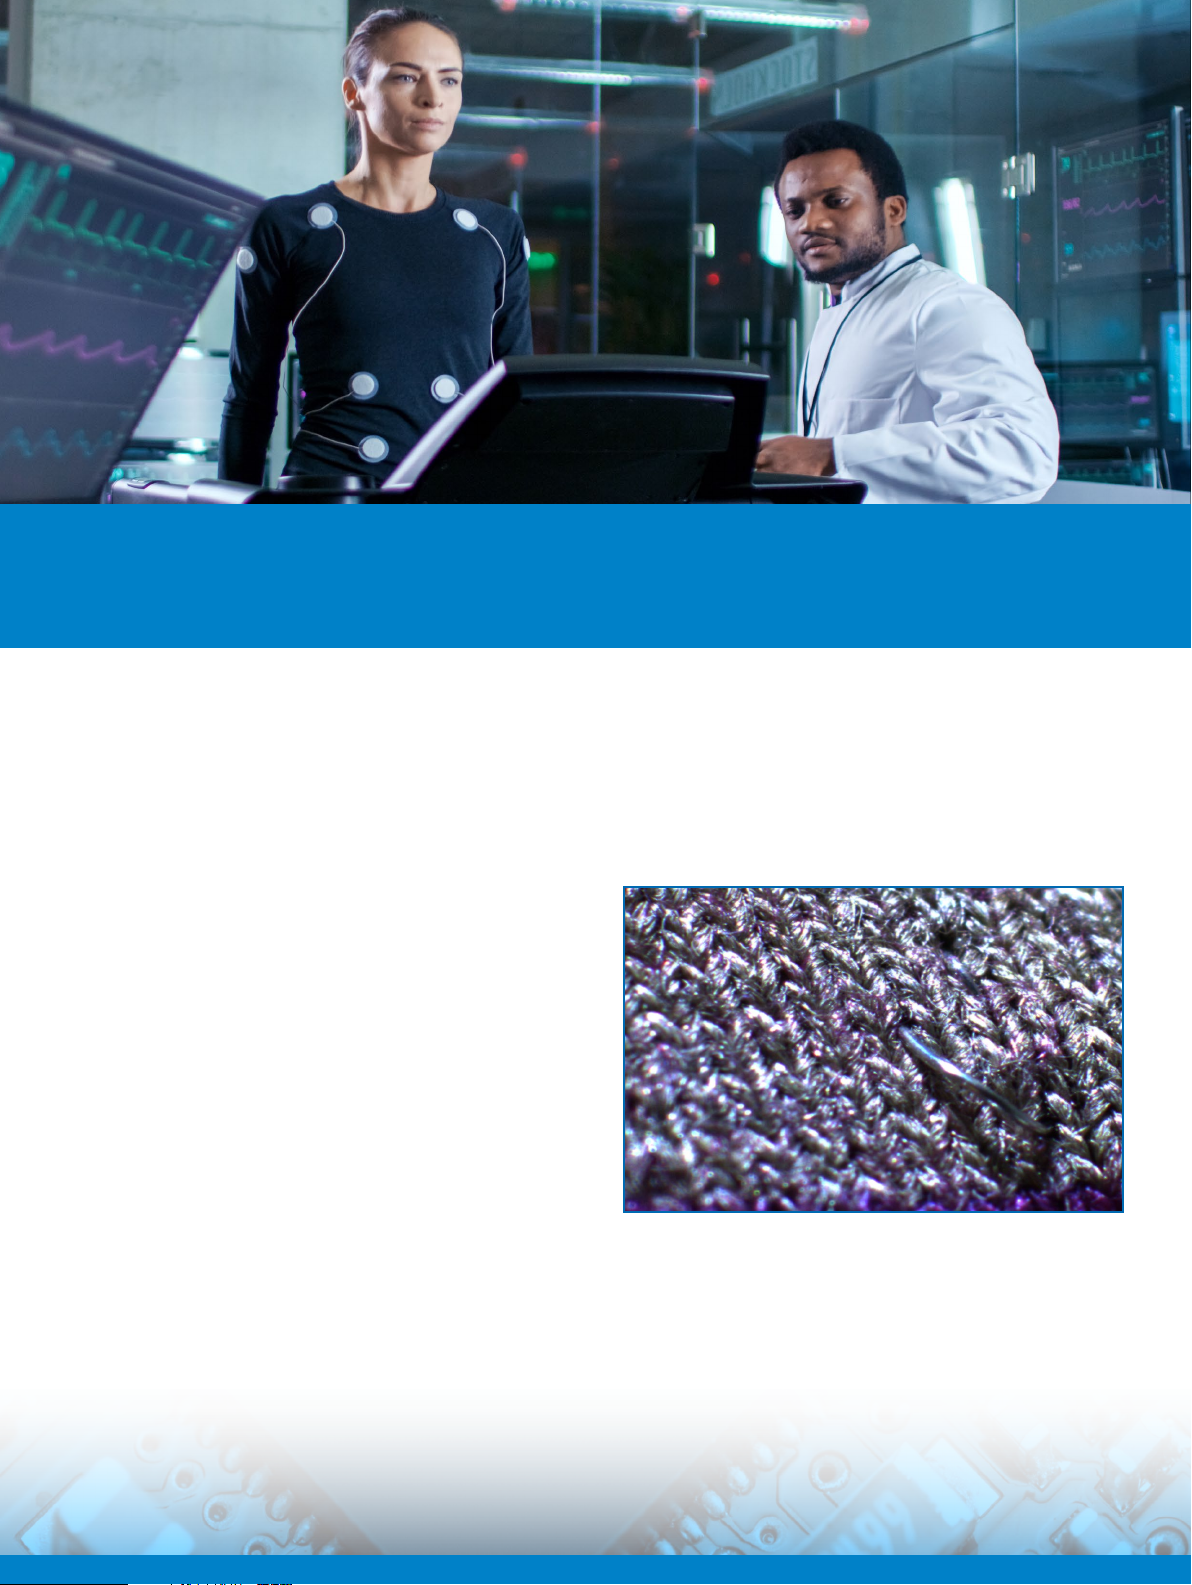
Conductive fabrics have been developed to provide
connections between electronic components distributed
around a garment, allowing an array of sensors to connect
back to a central processing unit.
The integrity of these connections is crucial if the end
product is to perform reliably. Even a small change
in voltage drop across a connection can result in
a corrupted signal.
Here we show how the integrity of conductive fiber
connections can be qualified over a range of
dierent conditions.
Figure 1. Metalized fibers form a conductive track through an electrically
voltage drop across fabric (purple); the metal wire transfers signal back to
the Prospector.
Page 2
Testing Wearable Electronics
Application Note
Setting up the Test
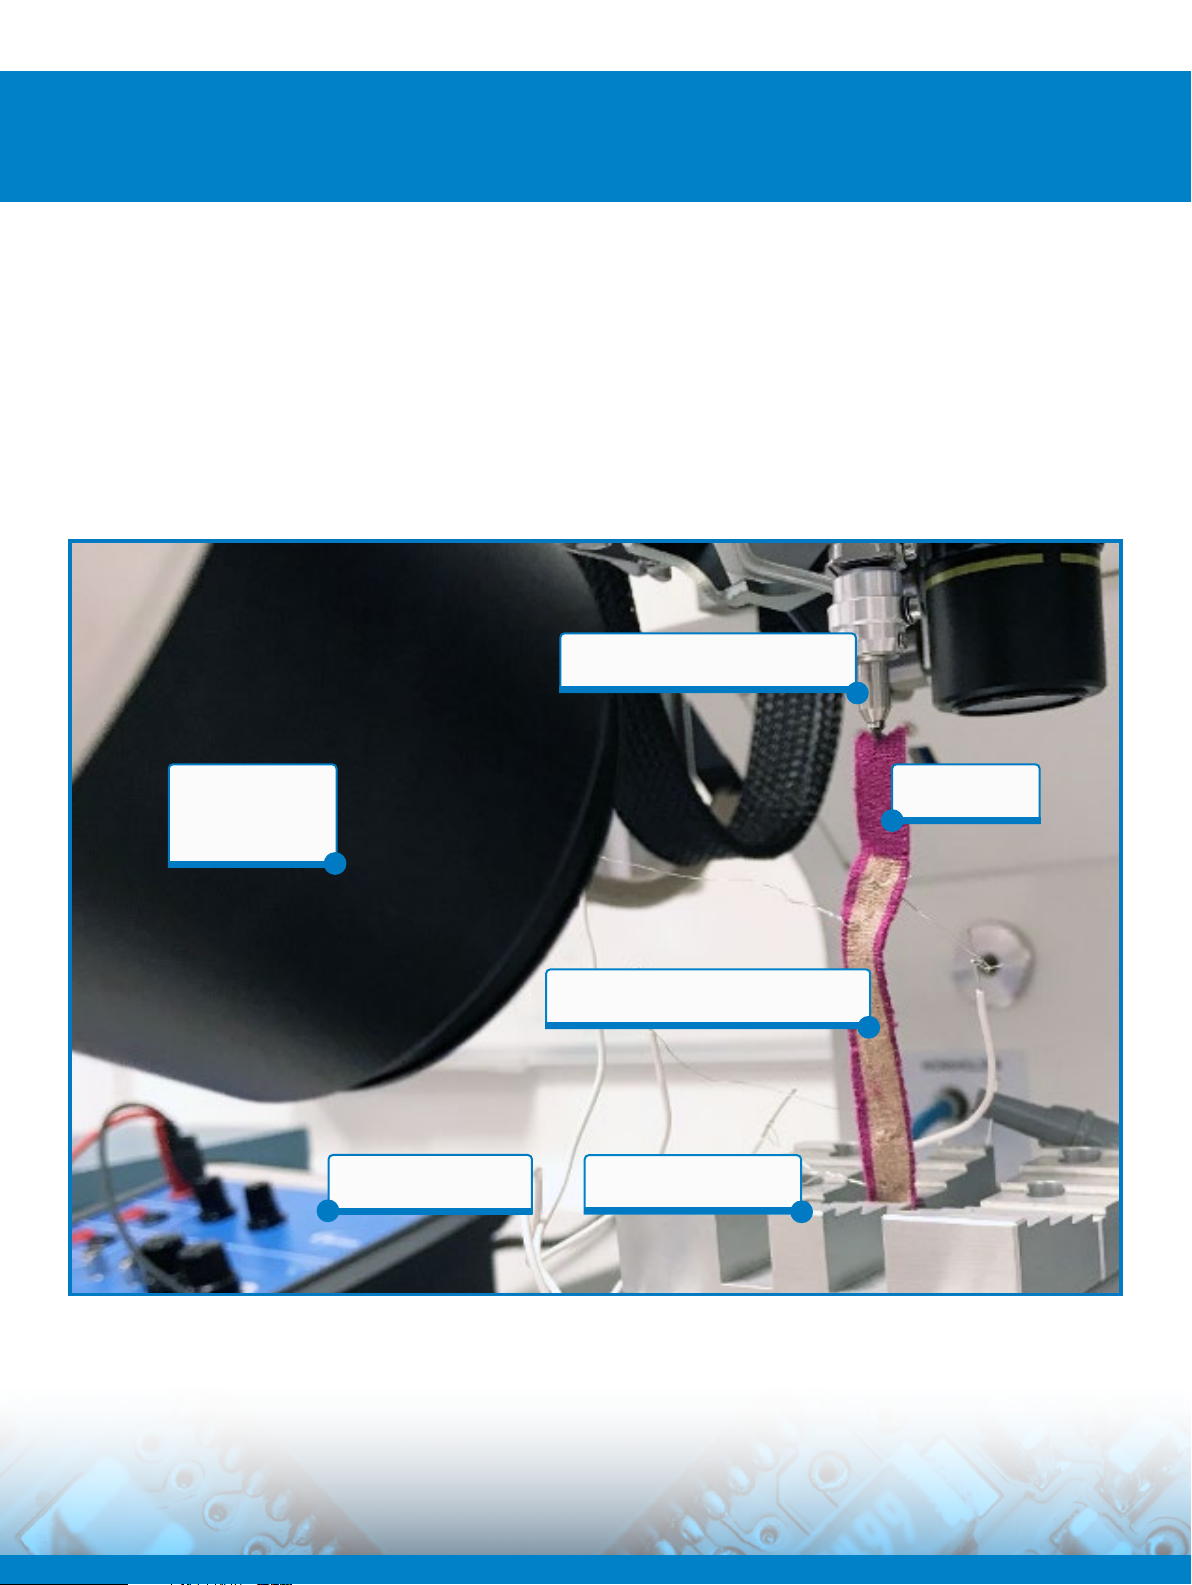
A conductive fabric sample was tested using the DAGE
ProspectorTM Micro Materials Tester. The fabric was cyclically
stretched under displacement control and the voltage drop
was measured over the length of the fabric using a fourpoint resistivity measurement set-up shown in Figure 2.
The electrical measurements were taken using Prospector’s
accessory sensor box, and were automatically plotted
Trinocular camera,
recording video of
the test
against the force and displacement measurements in real
time. It is important that the voltage drop is constant,
independent of fabric stretching.
A change in voltage drop across the conductive track will be
presented to the processor as a change in the signal from
the sensor.
DAGE 5 kg capacity tweezer cartridge
Insulating fabric
Electrical connection to conductive fabric
Accessory sensor box
Figure 2. A strip of conductive fabric with 4-point voltage drop across wires attached. External sensor box can be seen in the background.
Standard vice workholder
Page 3
Testing Wearable Electronics
Application Note
Test Findings
Figure 3 shows the force measured throughout a 30 second test cycle. The force versus time response is a consequence of the
position, time in the cycle and stress relaxation of the fabric.
Relaxation in load following initial peak
30
20
10
Force (gf)
0
0 5 10 15 20 25 30 35
Times (s)
Figure 3. Force versus time plot of several cycles of fabric stretching,
showing relaxation of load at constant displacement.
Fabric Connection 1_07 cycle30
Fabric Connection 1_07 cycle48
Fabric Connection 1_07 cycle64
Fabric Connection 1_07 cycle66
Page 4

Testing Wearable Electronics
Application Note
Force Peak and Relaxation
ProspectorTM is controlled by a fully featured soware
package called ParagonTM Materials. One of the key
advantages of Paragon Materials is the ability to analyze the
data without having to export it to post processing soware.
This allows users to quickly adapt their experiments on the
basis of early results.
Voltage recorded at maximum fabric stretch
position during cycle
1.9
1.8
1.7
1.6
1.5
1.4
1.3
One of the trends that is easily observed was a change in
the maximum and minimum voltage levels in each cycle,
shown in Figure 4. The voltage at the maximum pull force
was relatively constant throughout the testing, but the
minimum voltage dropped throughout the test. As the test
progresses, the individual fibers in the fabric shi position,
altering the voltage drop across of the fabric.
1.2
1.1
External (Volts)
1
0.9
0.8
0.7
0.6
0.5
10 20 30 40 50 60 70 80
Cycles
Figure 4. The maximum (blue) and minimum (pink) voltage for each cycle; all plots were produced using Paragon Materials.
Voltage recorded at minimum fabric stretch
position during cycle
Page 5

Testing Wearable Electronics
Application Note
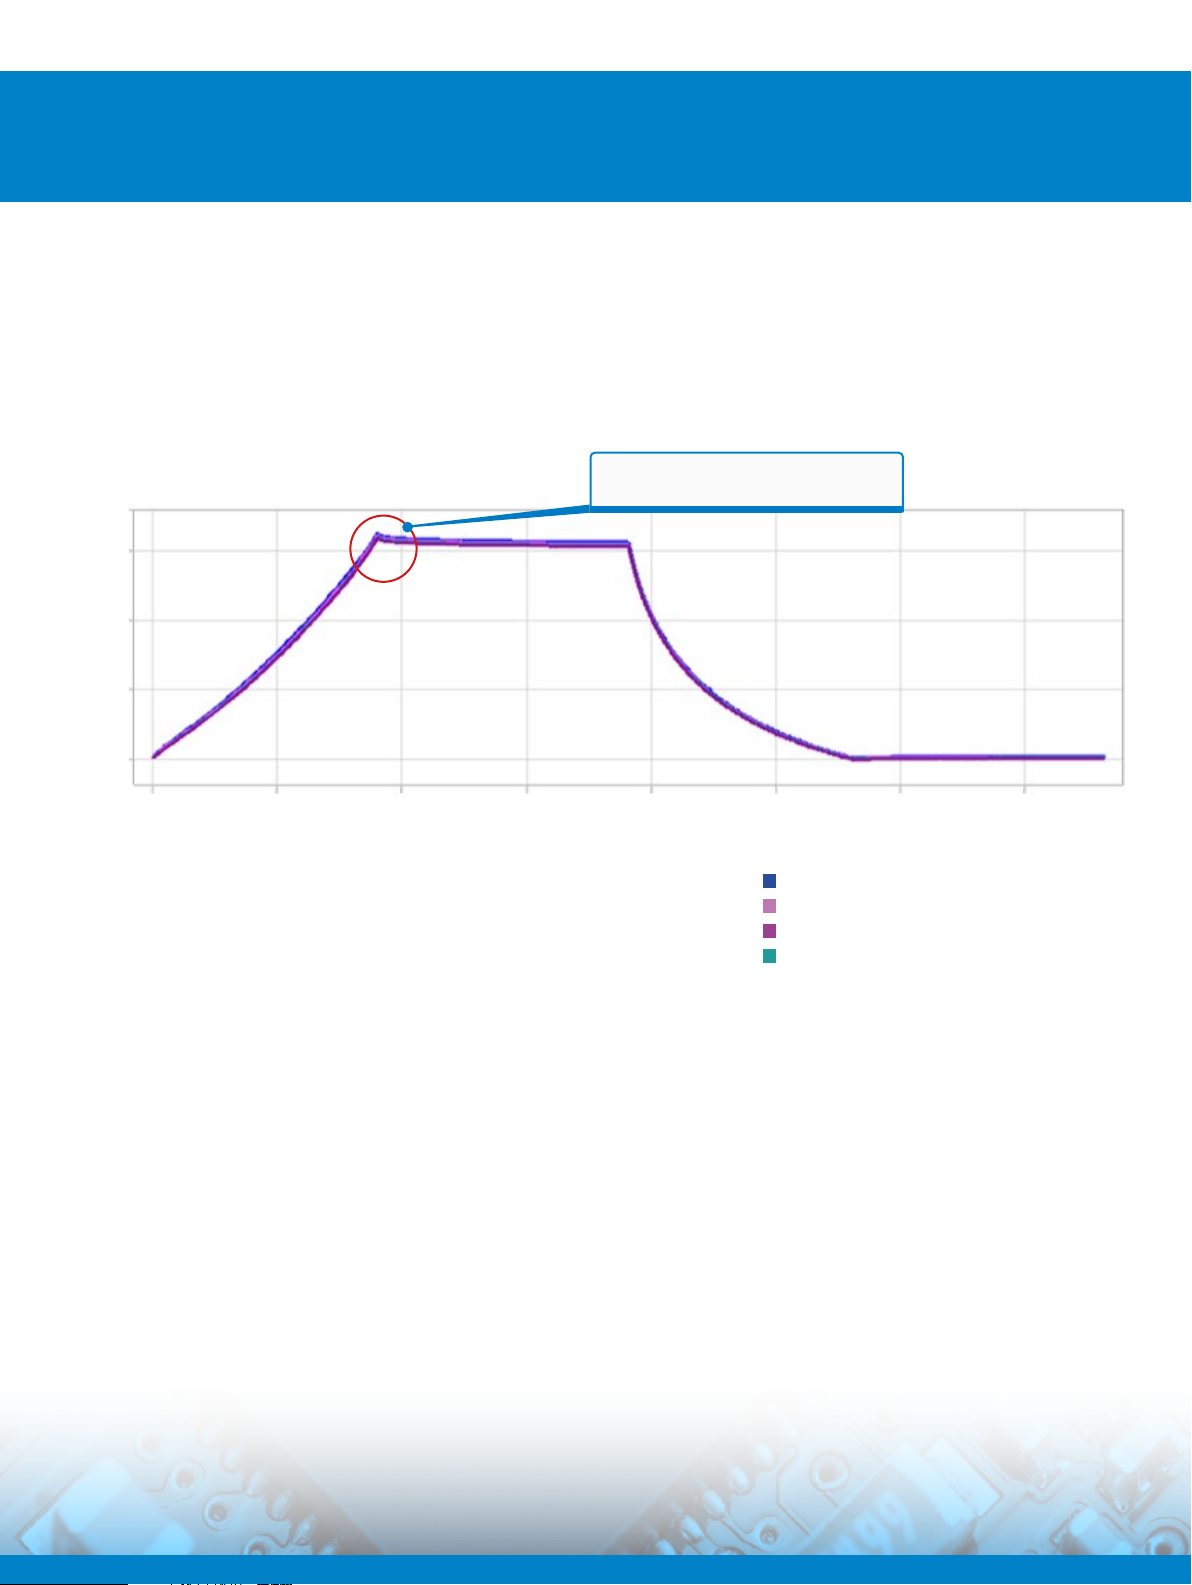
Figure 5 shows the voltage drop at maximum load remains
fairly constant between cycles, but the minimum load
voltage drop reduces significantly with cyclic stretching,
as shown between the spread in curves from each cycle.
The plot also shows how the voltage drop increases slightly
when the fabric is held at maximum load, but the increase is
much greater when held at the minimum load.
2
1.5
1
0.5
External (Volts)
0
0 5 10 15 20 25 30 35
Prospector’s Omni-scope allows the trinocular camera
to be focused on specific points of interest at high
magnification. Video can be recorded throughout the test
so the movement of individual fibers can be monitored and
reviewed during the test investigation. This is especially
useful for wearable electronics samples where fiber position
determines the electrical properties.
The voltage drop changes between cycles
Times (s)
Figure 5. Electrical behavior of the fabric on four cycles spread over the test.
Fabric Connection 1_07 cycle4
Fabric Connection 1_07 cycle31
Fabric Connection 1_07 cycle58
Fabric Connection 1_07 cycle84
Page 6

Testing Wearable Electronics
Application Note
Figure 6. High magnification video image taken during the test, using the omni-scope mounted trinocular system; individual fibers can be seen in the weave.
External Sensor using the Break-out Box
These experiments used the ProspectorTM external sensor
break out box. The break out box easily allows the user
to connect a wide range of external sensors such as load
cells and strain gauges to the Prospector Micro Materials
Tester. It provides a variable voltage power supply (up to 10
V DC) and separate analogue inputs that can be adjusted
with manual oset and gain settings on the box. Paragon™
Materials digitizes the reading and converts it to grams or
microstrain before plotting the information against its own
load cell and position readings synchronously. The breakout box transforms the Prospector system from a flexible
micro-mechanical testing machine into a truly multifunctional experimental platform.
Page 7

Testing Wearable Electronics
Application Note
Conclusion
Conductive fabrics for wearable technology show complex electrical behaviour,
varying with force, hold time and between stretching cycles. Analogue signals would
suer from distortion and dri if they were transmitted through this particular fabric,
due to the constantly shiing electrical voltage drop across.
Studying behaviour in detail is of critical importance to make sure that the ‘smart’
garment is working as intended. These types of studies are ideally suited to the
powerful capabilities of the ProspectorTM Micro Materials Tester allowing the user
to easily carry complex experiments and analysis using one integrated system.
For more information,
speak with your Nordson
representative or contact
your Nordson regional oice
Americas
+ 1 760 930 3307
sales@nordsondage.com
Europe
+44 1296 317800
globalsales@nordsondage.com
China
+86 512 6665 2008
sales.ch@nordsondage.com
Germany
+49 89 2000 338 270
sales.de@nordsondage.com
Japan
+81 120 537 555
sales.jp@nordsondage.com
Korea
+82 31 462 9642
korea.at.cs@nordson.com
South East Asia
+65 6552 7533
sales.sg@nordsondage.com
Prospector Micro Materials Tester covers a wide range of test scenarios for the most
advanced product assessment applications.
Taiwan
+886 2 2902 1860
globalsales@nordsondage.com
United Kingdom
+44 1296 317800
globalsales@nordsondage.com
www.nordson.com
 Loading...