

Page 1
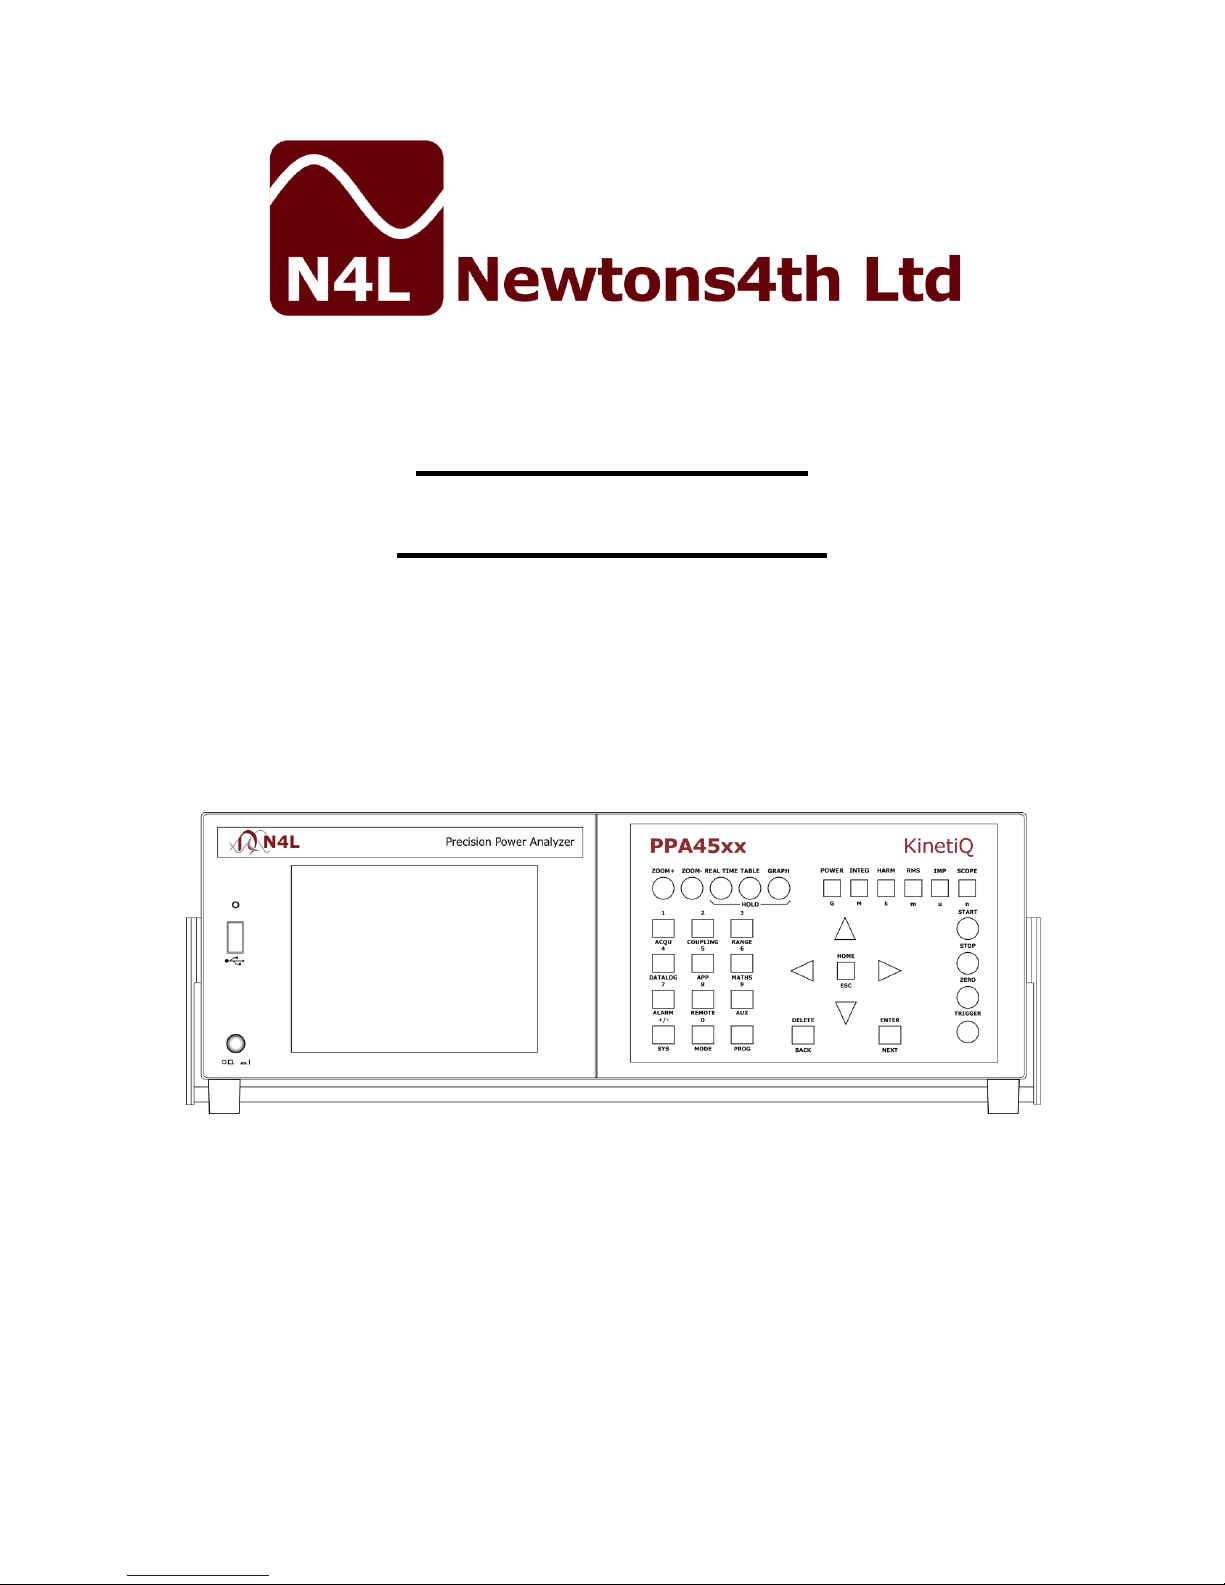
PPA45xx series
START UP GUIDE
Firmware v2_169
06th November 2017
Page 2

PPA45xx Quick User Guide
Page 1
CONTENTS
Contents
......................................................................
Page.1
1.
Getting Started................................................
Page.2
1.1
Unpacking and Contents....................................
Page.3
1.2
Handle Fitment.................................................
Pages.4-5
2.
Safety.............................................................
Page.6
2.1
Safety Instructions...........................................
Page.6
2.2
Cautions.........................................................
Page.7
2.3
Warranty.........................................................
Page.8
3.
Front Panel Layout Diagram...............................
Page.9
3.1
Front Panel Display Key Functions......................
Pages.10-28
4.
Rear Panel Layout Diagram................................
Page.29
5.
Basic Key Operation..........................................
Page.30
5.1
Set up to start.................................................
Page.30
5.2
Setting the Time..............................................
Page.30
5.3
Setting the Date..............................................
Page.31
5.4
Adjusting the Screen Brightness........................
Page.31
5.5
Adjusting Keyboard Beep..................................
Page.31
5.6
Setting User Data............................................
Page.32
6.
Quick User Guide.............................................
Page.33
6.1
Wiring............................................................
Pages.33-36
6.2
Start Up.........................................................
Page.37
6.3
6.3.1
6.4
6.4.1
Zoom Functions...............................................
Analogue Output..............................................
Speed & Smoothing..........................................
Efficiency........................................................
Pages.38-39
Page.40-43
Pages.44-46
Page.47
6.5
Application Modes............................................
Page.48
6.5.1
PWM Motor Drive Mode.....................................
Pages.49-55
6.5.2
6.5.3
6.5.4
6.5.5
6.5.6
6.5.7
6.5.8
6.5.9
Lighting Ballast Mode........................................
Inrush Current Mode........................................
Transformer Mode............................................
Standby Power Mode........................................
Calibration Mode..............................................
Oscilloscope Mode............................................
Interharmonic Sweeps......................................
HF Current Shunts / Rogowski Coil.....................
Page.56
Pages.57-63
Pages.64-69
Pages.70-72
Page.73
Pages.74-77
Pages.78-83
Pages.84-89
Page 3

PPA45xx Quick User Guide
Page 2
7.
7.1
7.1.1
7.2
Remote Settings..............................................
Transferring Internal Datalogs to USB Memory Stick
Data Logging to USB Memory Stick....................
Program Store / Recall / Delete.........................
Pages.90-92
Pages.93-94
Pages.95-96
Pages.97-100
8.
8.1
9.
10.
Repair / Recalibration.......................................
Basic Functionality Check..................................
Specifications..................................................
PPA Comparison Table......................................
Page.101
Page.102-118
Page.119-122
Page.123
Page 4
PPA45xx Quick User Guide
Page 3
1 Getting Started
1.1 Unpacking
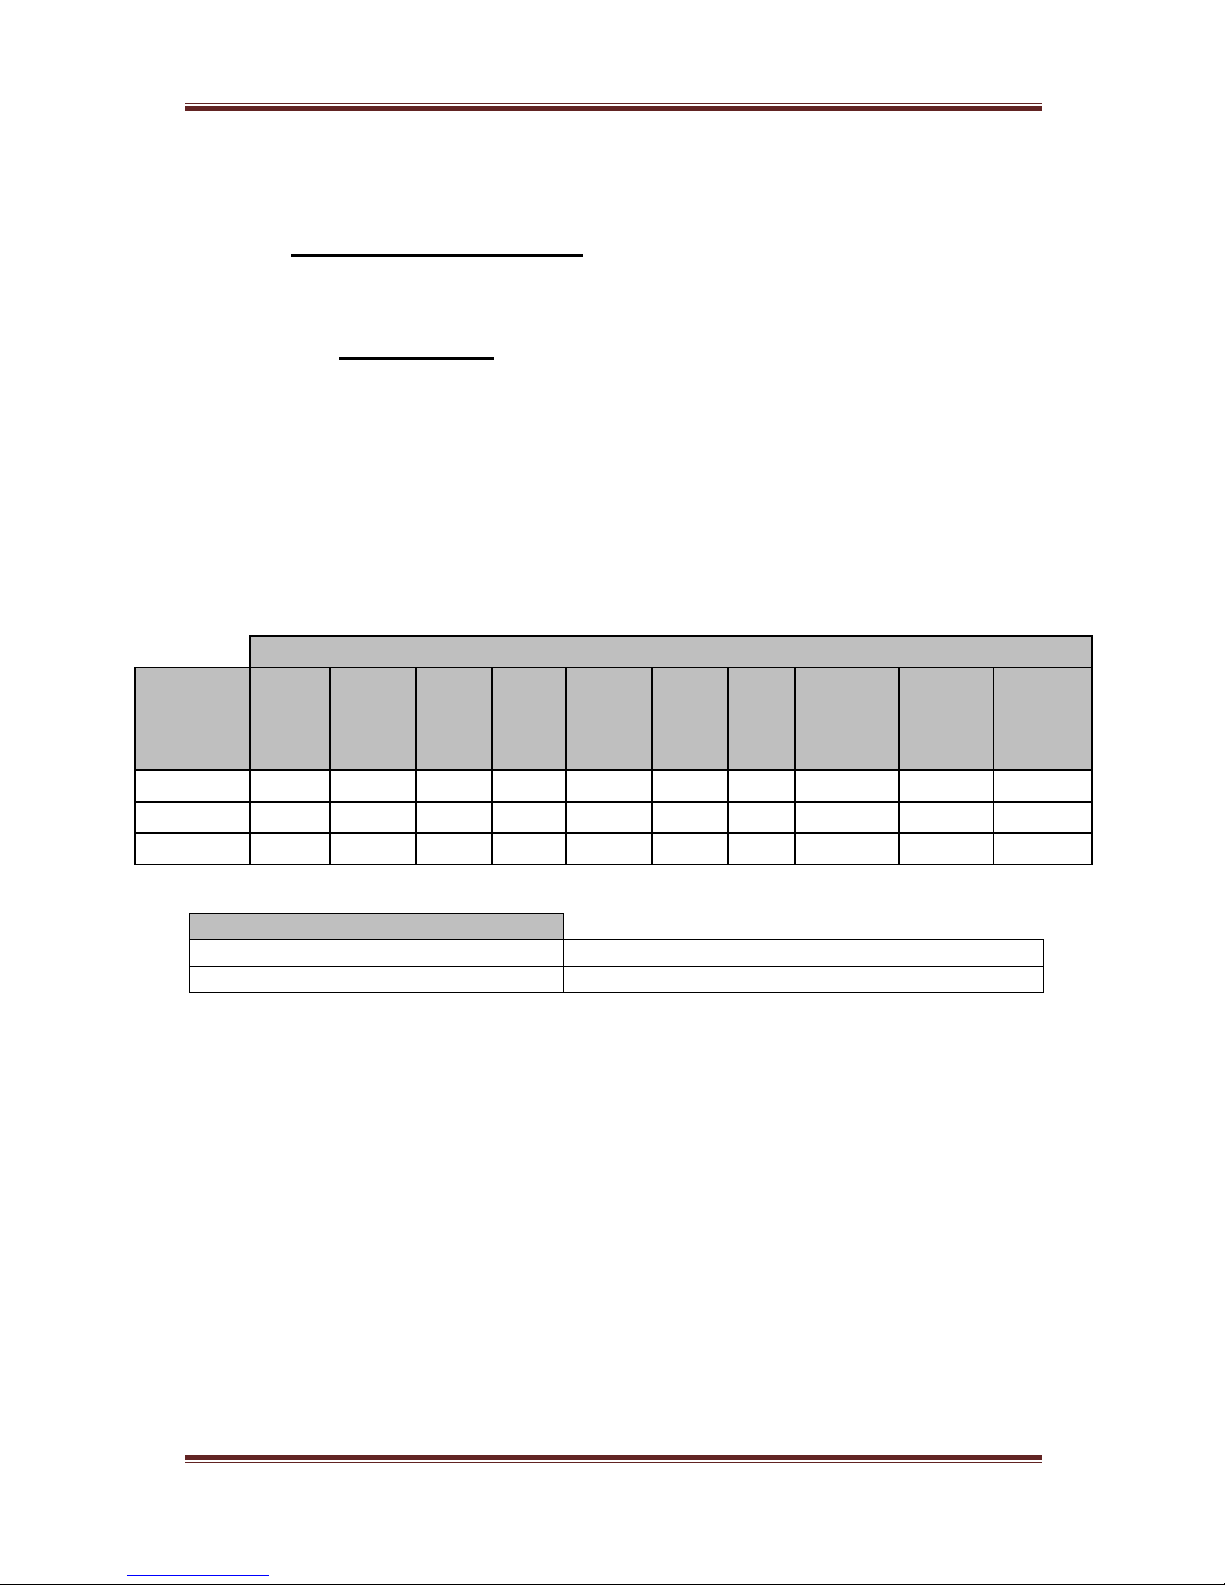
When you receive your product, check that the following items are included for
the appropriate PPA. Refer to the contents list below for each model. If any item
is missing or damaged during transportation, immediately contact your local
sales distributor or N4L office
CONTENTS
MODEL
Mains
Lead
4mm
Yellow
Lead
4mm
Black
Lead
4mm
Red
Lead
Yellow
Croc
Clip
Black
Croc
Clip
Red
Croc
Clip
N4L
2GB
Memory
Stick
Start
Up
Guide
Manual
Comms
Manual
PPA4510
1 1 2 1 1 2 1 1 1
1
PPA4520
1 2 4 2 2 4 2 1 1
1
PPA4530
1 3 6 3 3 6 3 1 1
1 Communication Cables
USB
Filtered USB 2.0 A male to B male 2m lead
RS232
9 pin to 9 pin null modem cable
Page 5
PPA45xx Quick User Guide
Page 4
1.2 Fitment of the PPA series Carry/Tilt handle
PPA5/15/45/55 series power analyzers are supplied with a Carry/Tilt Handle that
is located within the accessory pack..............................................................
The handle allows a user to position the instrument upwards at one of two angles
for easier viewing when the instrument is positioned below the line of sight. The
design also allows storage under the unit without obstruction of the rubber feet
so that instruments can be stacked and is easily removed to allow the connection
of rack mounting brackets without the need to remove instrument covers.
Correct installation of the handle is important to ensure the correct operation
and long life the handle.
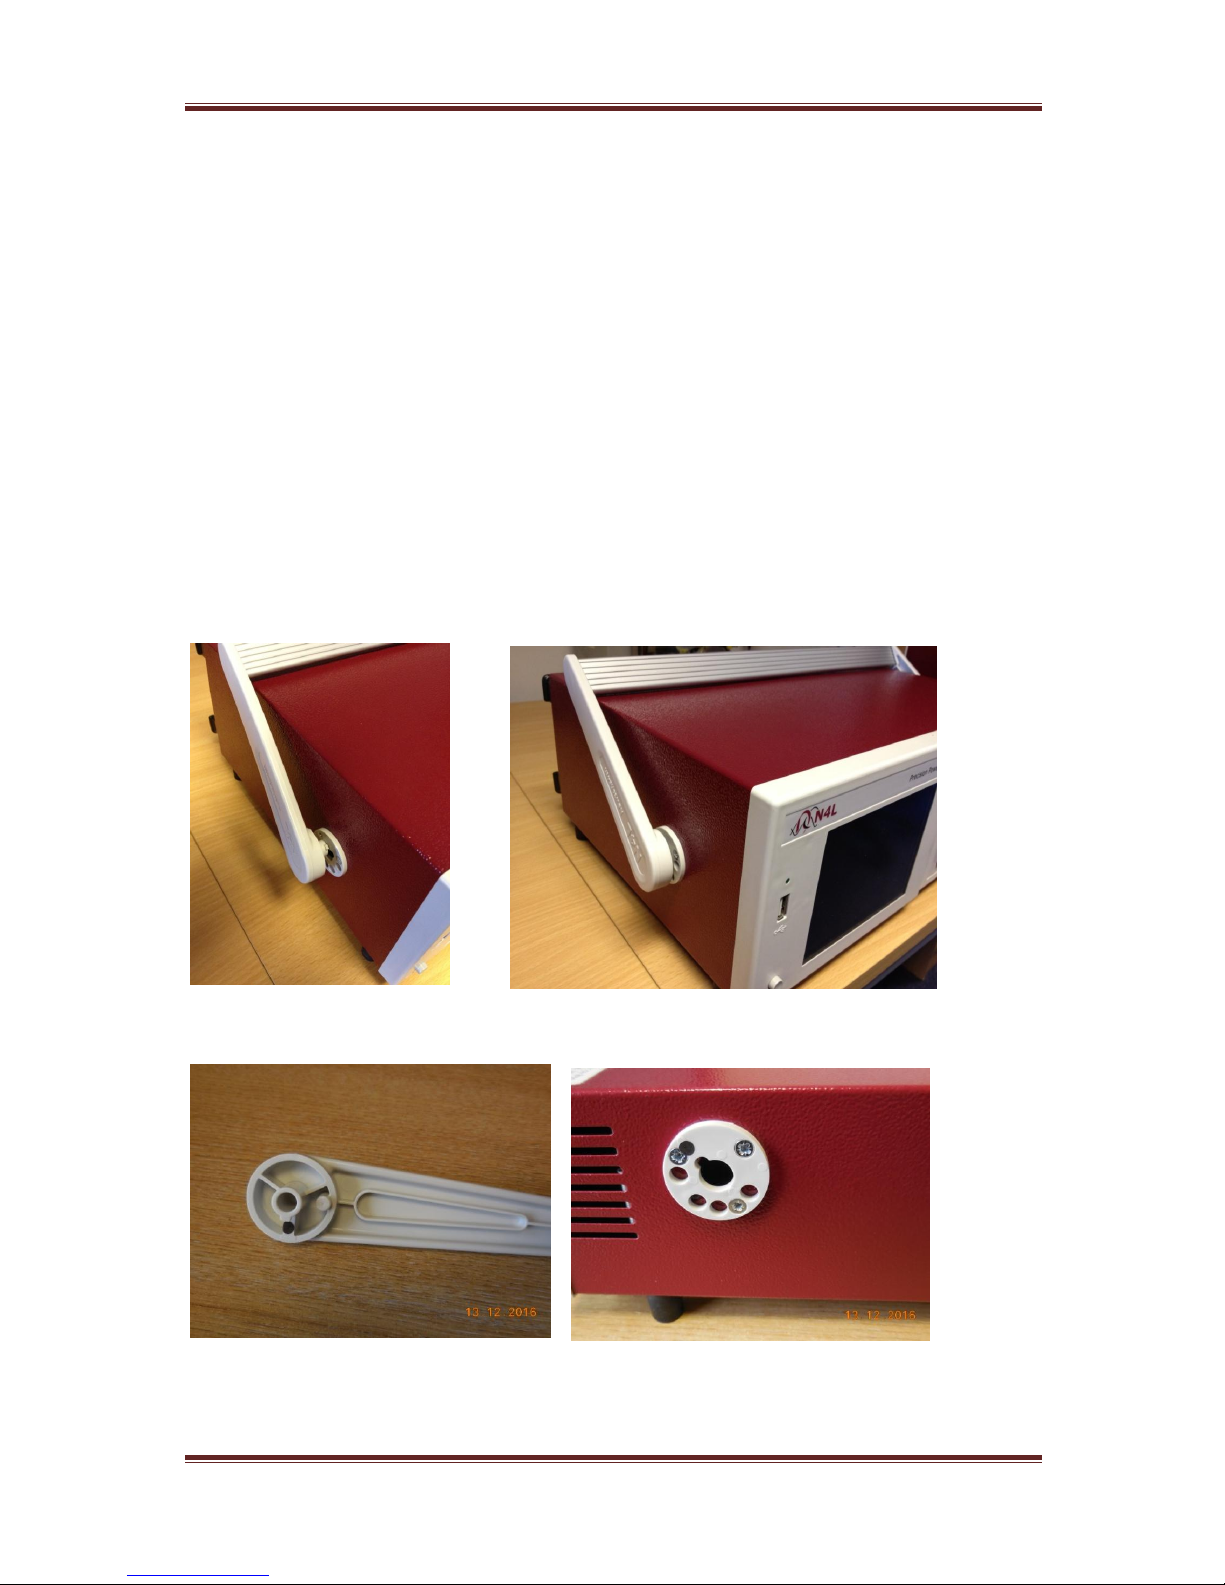
The following pictures illustrate correct and incorrect handle fitment:
Correct 1/2 – Correct fitting is from the top of the unit as shown here
Correct 1 Correct 2
A coloured dot for identification and alignment purposes can be found on the
handle and mounting bush on the instrument
Page 6
PPA45xx Quick User Guide
Page 5
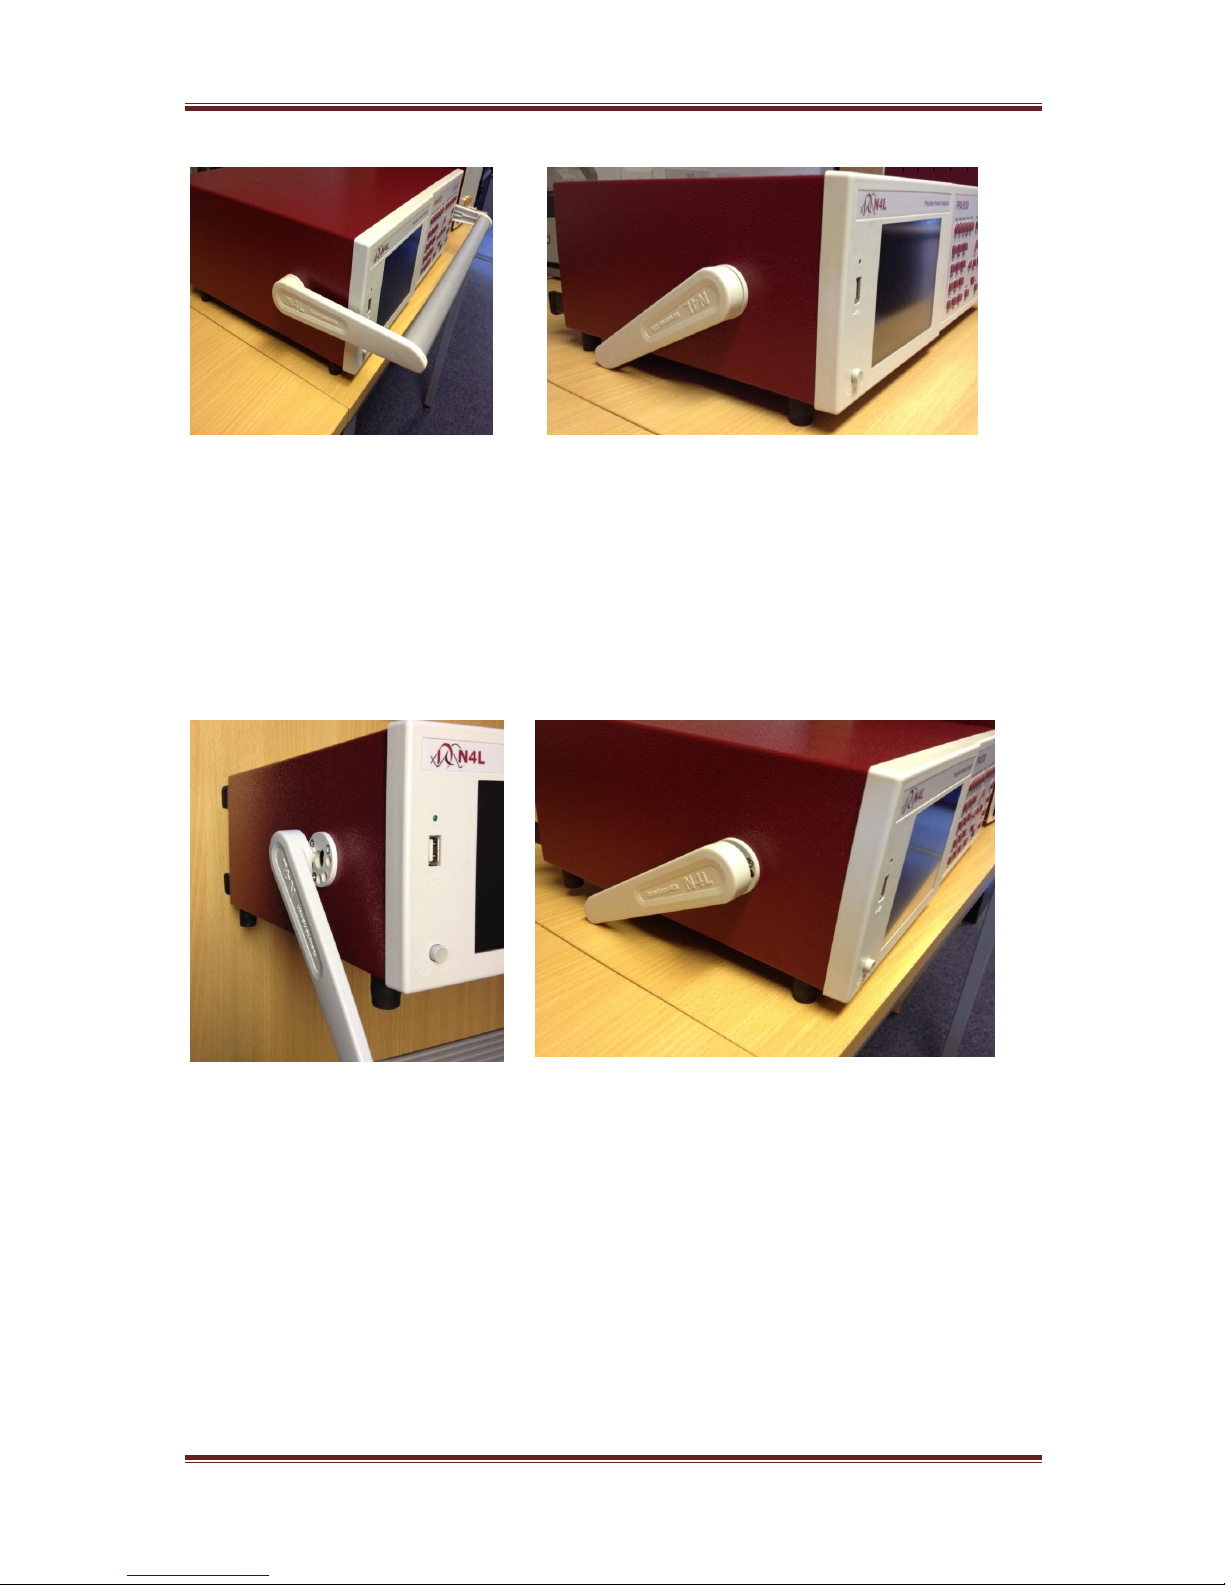
Correct 3 Correct 4
A correctly fitted handle will have the ‘N4L Newtons4th’ wording in the correct
reading plane when the handle is to the front of the instrument (Pic. 3)
Also, a correctly fitted handle will allow storage under the unit (Pic. 4)
Using the coloured dots for alignment will ensure a correctly fitting handle
Incorrect 1 Incorrect 2
Fitting the handle from the bottom of the unit as shown here is wrong...
(Incorrect 1)
Incorrect fitting can be seen because the handle does not fit correctly under the
unit and handle sides do not fit flush with the registration washer (Incorrect 2)
Page 7

PPA45xx Quick User Guide
Page 6
2 Safety
2.1 IMPORTANT SAFETY INSTRUCTIONS
This equipment is designed to comply with BSEN 61010-1 (2001) (Safety
requirements for electrical equipment for measurement, control, and laboratory
use) – observe the following precautions:
Ensure that the supply voltage agrees with the rating of the instrument
printed on the back panel before connecting the mains cord to the supply
This appliance must be earthed. Ensure that the instrument is powered from
a properly grounded supply
The inputs are rated at 1kV rms or dc cat II; 600V rms or dc cat III. Do not
exceed the rated input
Keep the ventilation holes on the underneath and rear free from obstruction
There are no user serviceable parts inside the instrument – do not attempt to
open the instrument, refer service to the manufacturer or his appointed agent
Note: Newtons4th Ltd shall not be liable for any consequential damages,
losses, costs or expenses arising from the use or misuse of this product
however caused
Page 8

PPA45xx Quick User Guide
Page 7
2.2 CAUTIONS
Do not use a damaged power cord or cables
Doing so may cause an electric shock or a fire
Do not place any object on this instrument
Do not use this instrument if faulty
If you suspect the instrument to be faulty, contact your local N4L office or
representative for repair (see section 8)
Page 9

PPA45xx Quick User Guide
Page 8
2.3 Warranty
This product is guaranteed to be free from defects in materials and workmanship
for a period of 36 months from the date of purchase
In the unlikely event of a problem within this guarantee period, first contact
Newtons4th Ltd or your local representative to give a description of the problem.
Please have as much relative information to hand as possible – particularly the
serial number and release number these can be found by pressing the SYSTEM
button then the “Left Arrow”
If the problem cannot be resolved directly then you will be given an RMA number
and asked to return the unit. The instrument will be repaired or replaced at the
sole discretion of Newtons4th Ltd
This guarantee is limited to the cost of the PPA45xx itself and does not extend to
any consequential damage or losses whatsoever including, but not limited to,
any loss of earnings arising from a failure of the product or software
In the event of any problem with the instrument outside of the guarantee period,
Newtons4th Ltd offers a full repair and re-calibration service. Contact your local
representative. It is recommended that the PPA45xx be re-calibrated annually
Page 10
PPA45xx Quick User Guide
Page 9
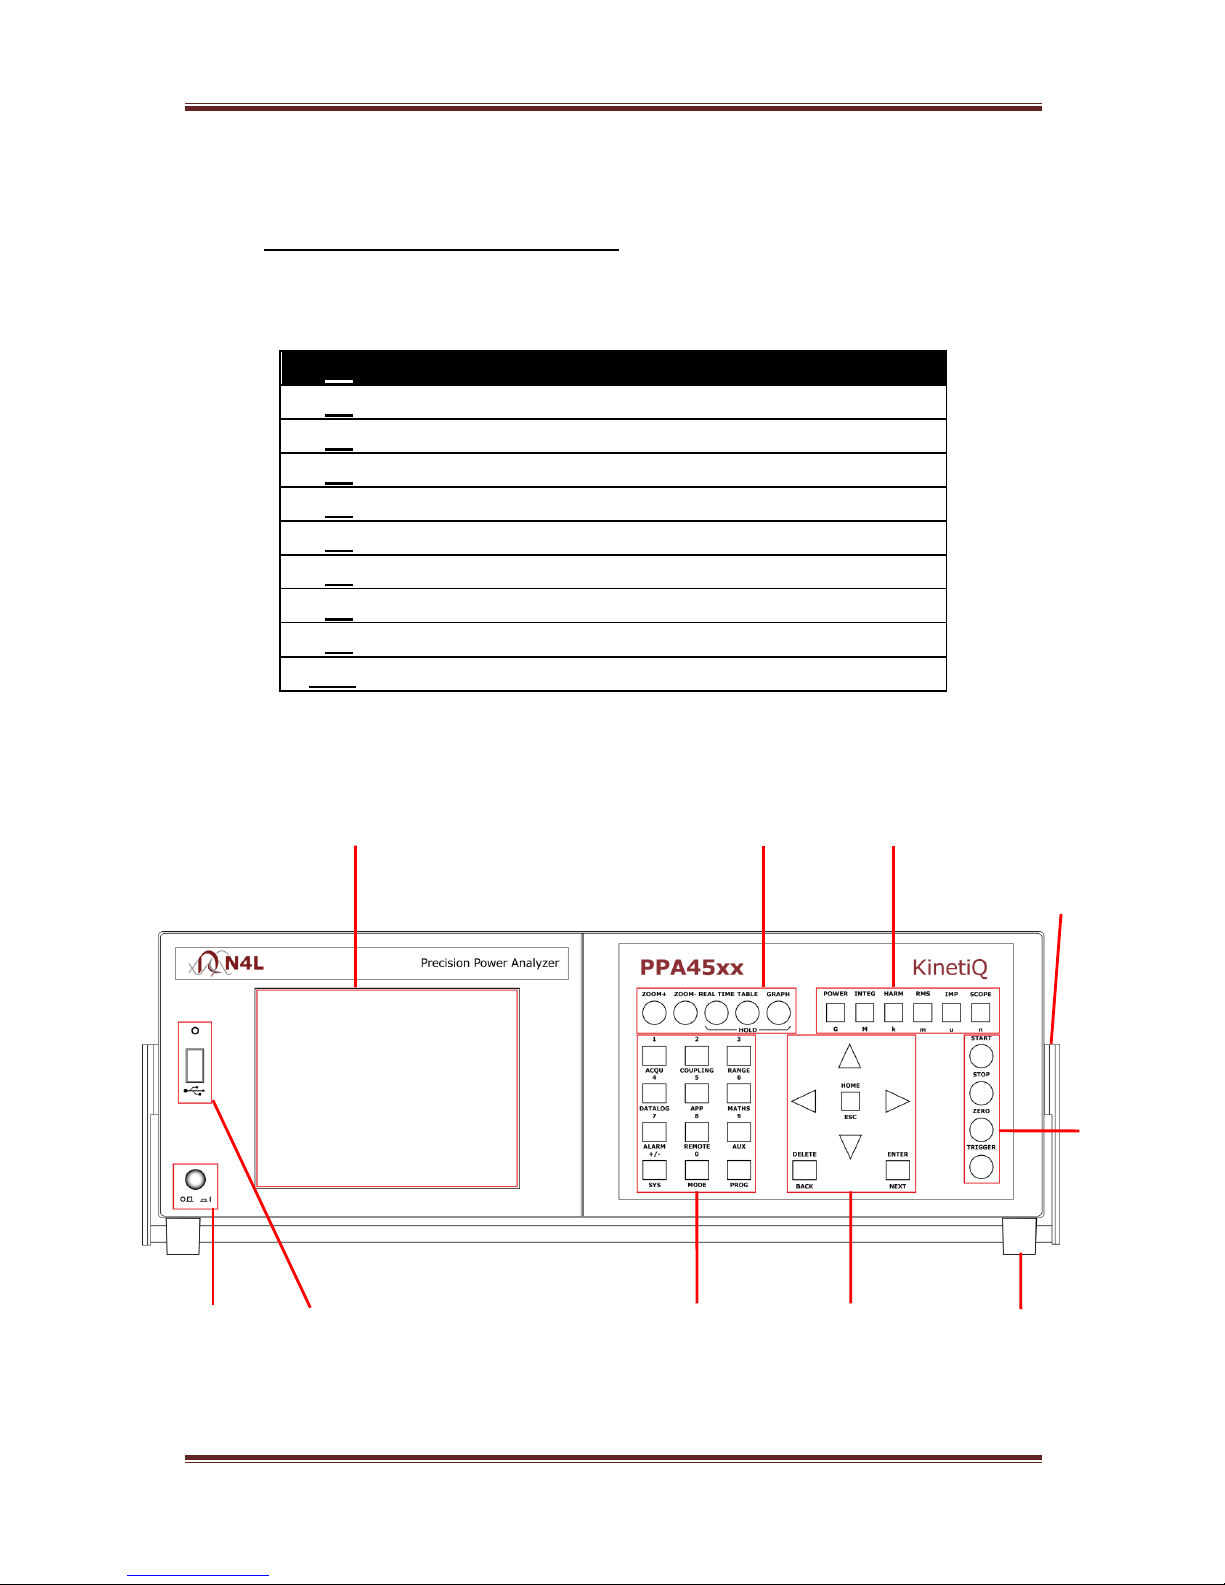
3 Front Panel Layout
1. Display Screen
2. Screen Display Function Buttons
3. Power Analyzer Mode Buttons
4. Handle
5. Measurement Control Function Keys
6. Rubber Feet
7. Menu Selection and Cursor Controls
8. Measurement Settings Buttons
9. Front USB Port
10. Power On / Off Button
1 2 3
4
5
10 9 8 7 6
Page 11
PPA45xx Quick User Guide
Page 10
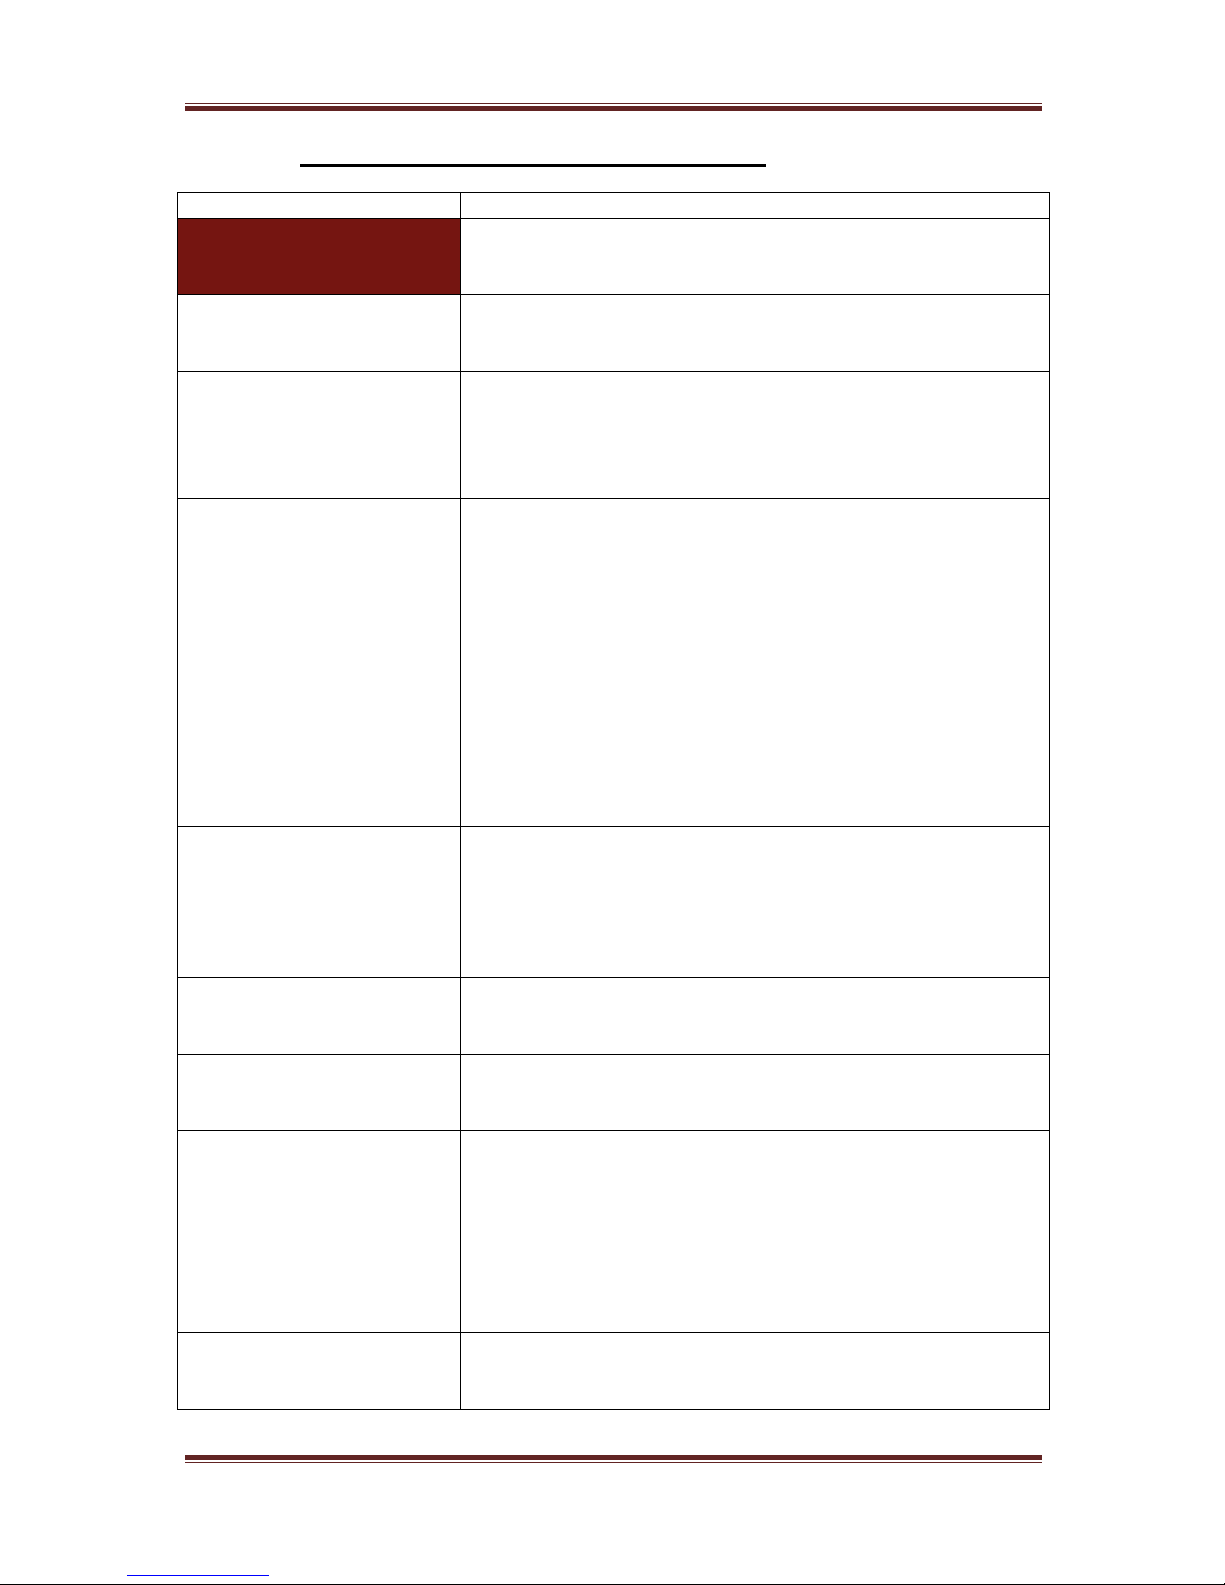
3.1 PPA45xx Display Key Functions
Key & Sub Categories
Description
ACQU
Wiring:
Acquisition Control: Used for configuring inputs
appropriate to source and nature of signals being
analyzed
Single Phase 1
In single phase 1 configuration, (phase 2 & phase 3)
inputs are disabled and the selected phase acts as a
completely independent single phase power analyzer
2 Phase 2 Wattmeter
In the 2 phase 2 wattmeter configuration, the
voltages are measured relative to each individual
phase input, with a single frequency reference
selected within the frequency reference parameter
(see page 8)
3 Phase 2 Wattmeter
In the 3 phase 2 wattmeter configurations, the
voltages are measured relative to phase 3. Typically
the phase 1 voltage input is connected across phase 1
and phase 3, and phase 2 voltage input is connected
across phase 2 and phase 3, thus measuring phase to
phase voltage directly. Phase 1 and 2 current inputs
are connected normally. There is no need to measure
the current in phase 3 as phase 3 has no voltage
relative to itself so the power contribution is zero. In
this mode, the neutral channel displays the
synthesized phase 3 current. The advantage of this
connection method is that 3 phase power can be
measured with only 2 wattmeters
3 Phase 3 Wattmeter
With the 3 phase 3 wattmeter configuration, each
measurement phase is connected to a phase of the
load with the voltage low inputs measuring to neutral.
In this mode, phase to neutral voltages are measured
directly and phase to phase voltages are also
computed
Single Phase 2
In single phase 2 mode, (phase 1 & phase 3) inputs
are disabled and the selected phase acts as a
completely independent single phase power analyzer
Single Phase 3
In single phase 3 mode, (phase 1 & phase 2) inputs
are disabled and the selected phase acts as a
completely independent single phase power analyzer
3 Phase 2 Wattmeter +
PH3
As above(3 phase, 2 wattmeter) but with the option
to use PH3 as an independent meter i.e., use PH3 to
measure a DC bus plus Phase’s 2 & 3 to measure a 3
phase inverter output. PH3 can be set as an
additional connection for Torque & Speed to
supplement the existing "EXT" BNC connections on
the rear panel. This mode essentially facilitates
independent frequency synchronisation of PH3
Independent
In independent wiring mode each phase can be
selected as an individual analyzer enabling the ability
to select its own frequency, coupling ranging etc
Page 12
PPA45xx Quick User Guide
Page 11
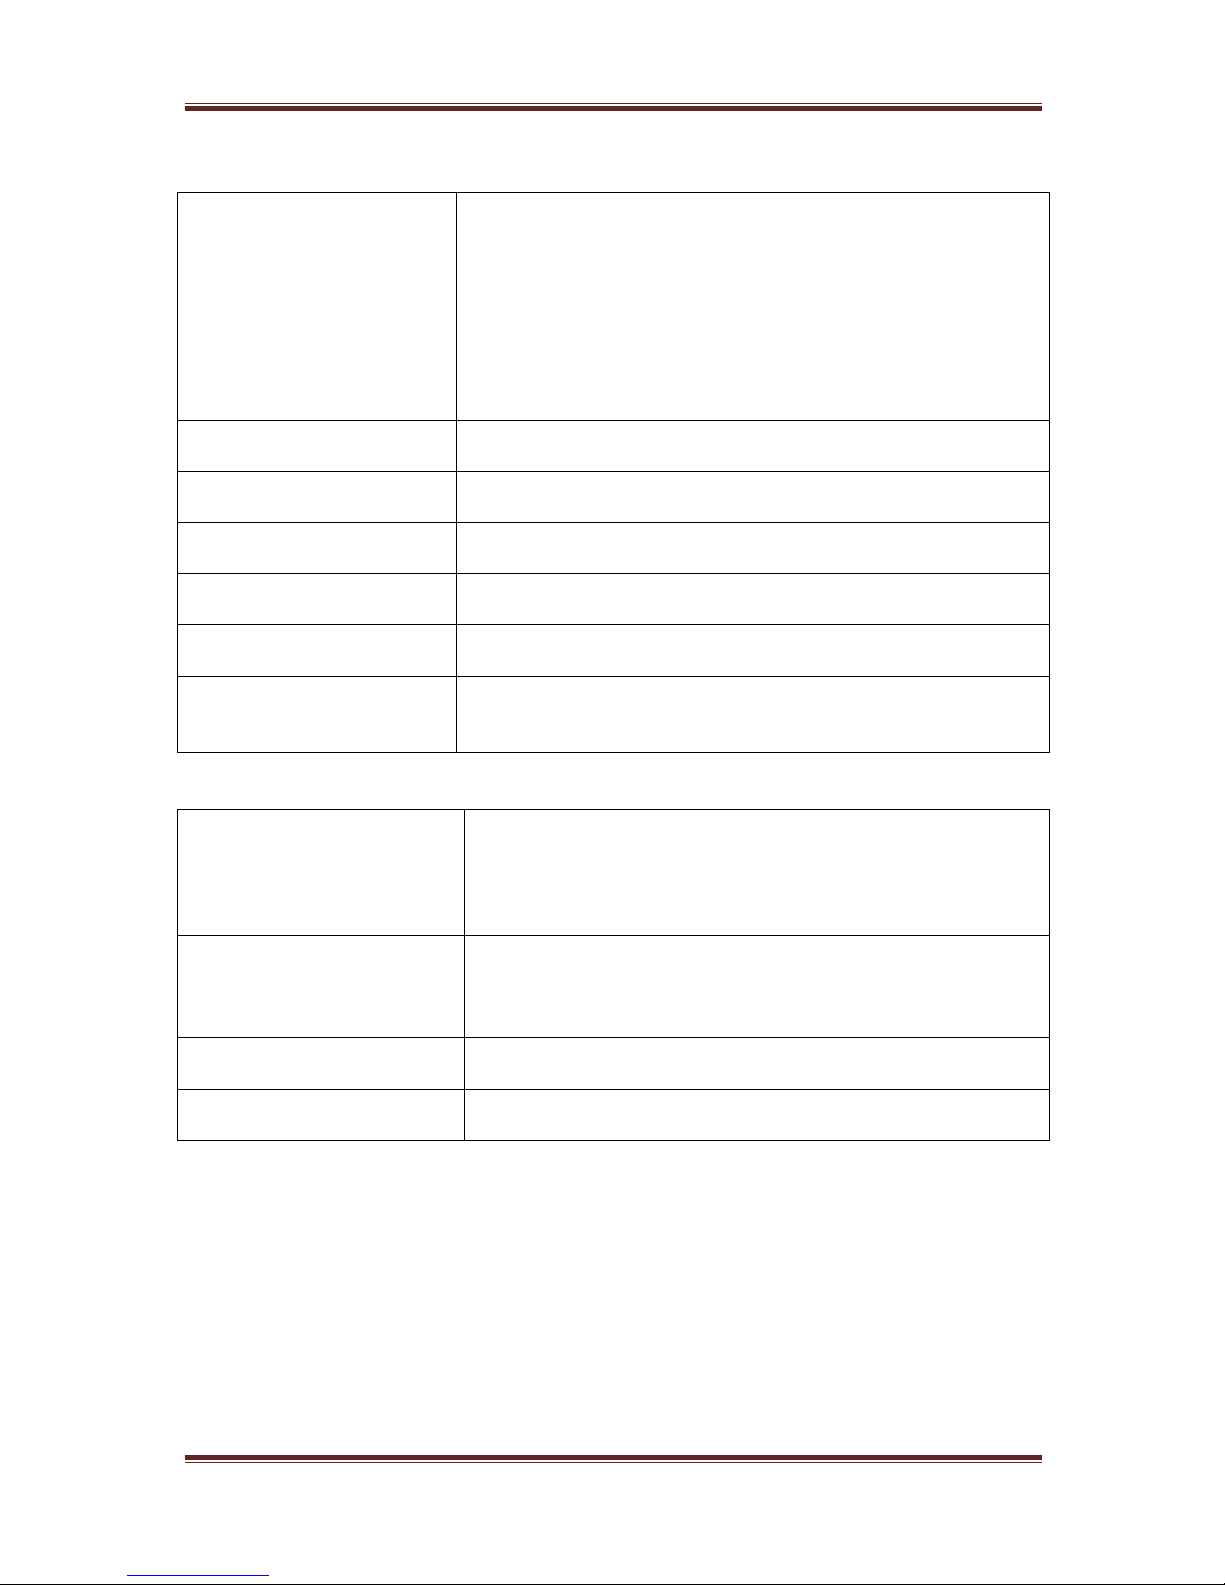
Speed
In normal acquisition mode the window over which
the measurements are computed is adjusted to give
an integral number of cycles of the input waveform.
The results from each window are passed through a
smoothing filter. There are 5 pre set speed options
that adjust the nominal size of the window, and
therefore the update rate and time constant of the
filter. Greater stability is achieved at a slower speed at
the expense of a slower update rate
Very Slow
Update rate = 10s. Results window size will update
every 10 seconds
Slow
Update rate = 2.5s. Results window size will update
every 2.5 seconds
Medium
Update rate = 1/3s. Results window size will update 3
times per second
Fast
Update rate = 1/20s. Results window size will update
20 times per second
Very Fast
Update rate = 1/80s. Results window size will update
80 times per second
Window
The window application will allow the user to input
their own speed settings different to any of the 5 pre
set settings above
Smoothing
Smoothing filter will gather the data and average out
over a sliding window time scale. This is very useful
when gathering data which could be affected by
noise. Each speed above has its own time constant
for filtering and data updates
Normal
With Normal smoothing applied the following update
windows will apply to the relevant speed selected.
V.Fast =0.05s, Fast = 0.2s, Medium = 1.5s,
Slow = 12s, V.Slow = 48s
Slow
With Slow smoothing selected all results are X4
greater than in normal smoothing mode
None
With no smoothing to computed results the data
update will be dictated by the speed only
Page 13
PPA45xx Quick User Guide
Page 12
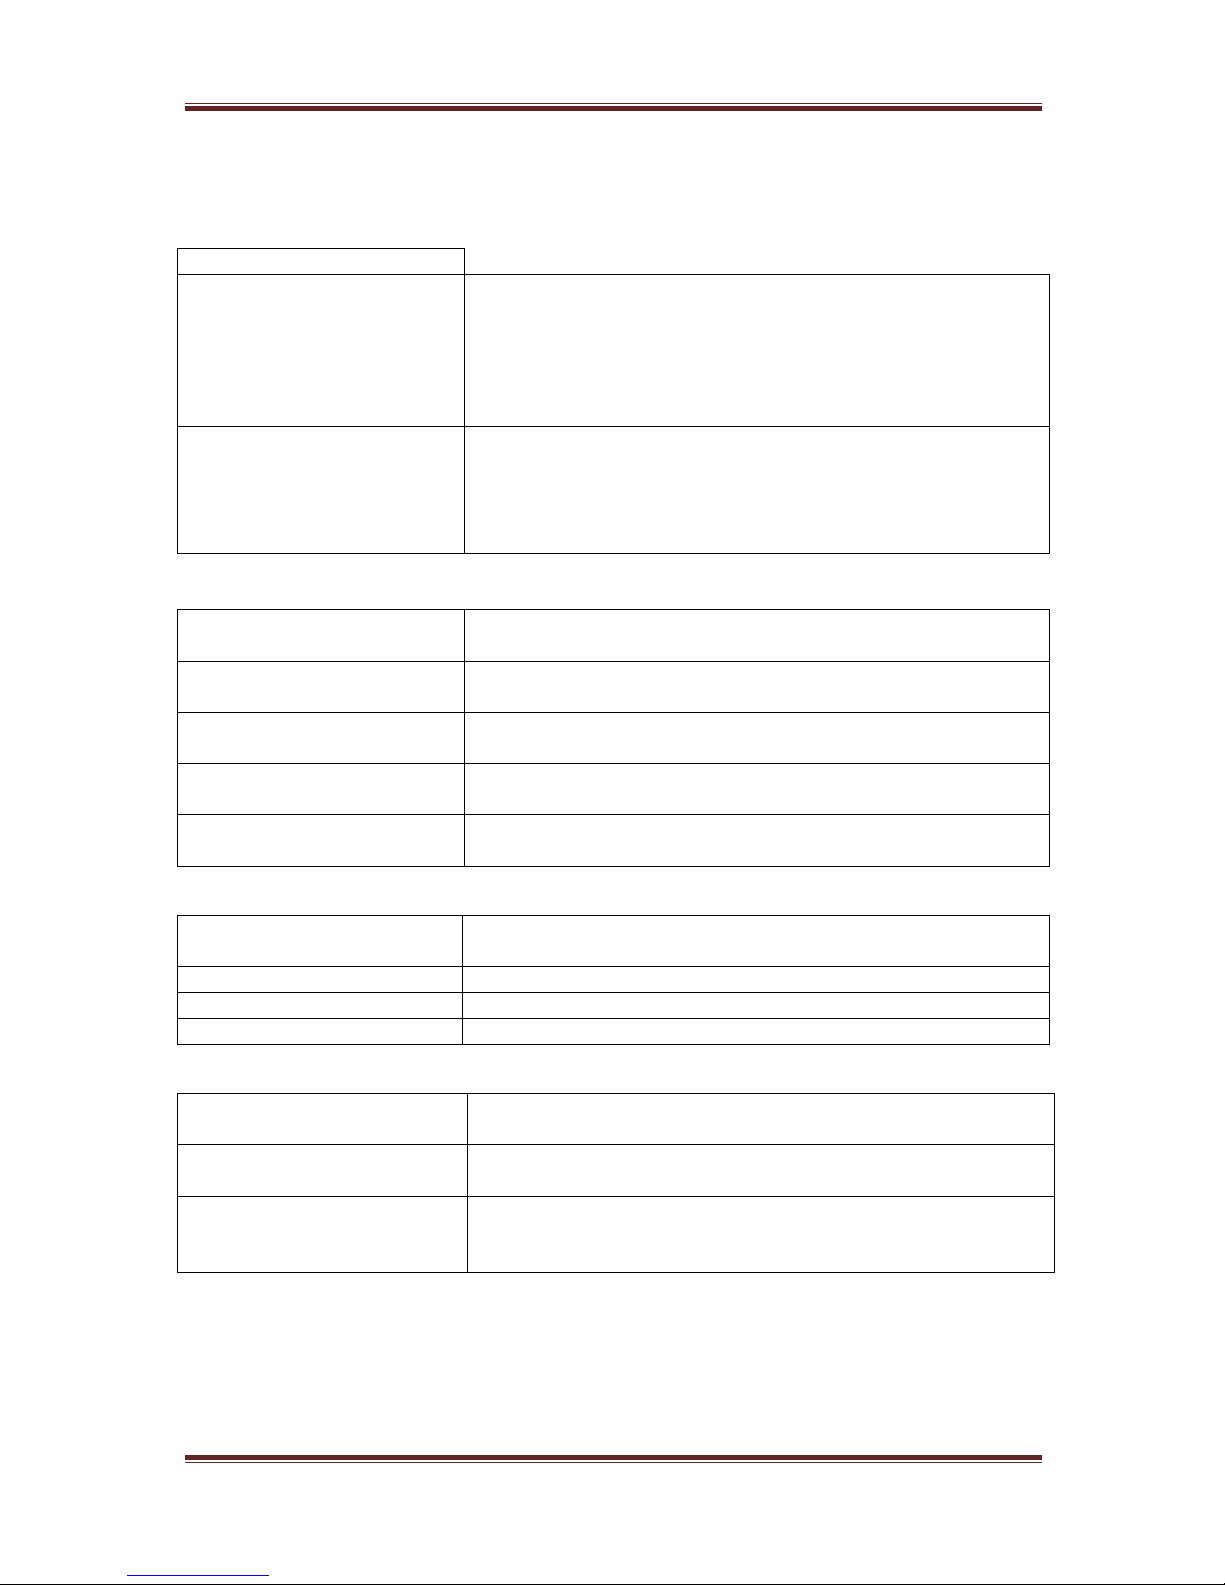
Smoothing Response
Auto Reset
The smoothing response is by default set to “auto
reset” where the filtering described in “smoothing” is
reset in response to a significant change in data such
as frequency, voltage and current levels. This speeds
up the response of the instrument to changing
conditions
Fixed Time
Auto reset can be disabled so that the filtering has a
fixed time constant, which would have an exponential
response to a step change, this is useful for PWM
inverter drive evaluation where variable frequency
tracking is required
Frequency Reference
The frequency may be measured from any of the
following inputs:
Voltage
Select Voltage to detect frequency from the input
voltage
Current
Select Current to detect frequency from the input
current
Speed Input
Select speed input to frequency detection to set
frequency via “speed input” BNC
AC line
Select ac line to read frequency from the ac line
input, measured from power inlet to PPA
Frequency Reference
On a multi-phase instrument, any channel may be
selected for the frequency measurement
Phase 1
Select this option to detect frequency from phase 1
Phase 2
Select this option to detect frequency from phase 2
Phase 3
Select this option to detect frequency from phase 3
Phase Angle Reference
Phase angle measurements must be made with
reference to a specific input
Voltage
Phase 1 voltage is by default set as the input
reference channel
Current
The phase angle reference can be set to current
which is useful if operating the instrument with only
current inputs, or with low level voltage inputs
Page 14
PPA45xx Quick User Guide
Page 13
Frequency Filter
A parallel digital frequency filter of low-pass may be
selected to filter out the HF carrier component of a
PWM waveform ensuring measurements are carried
out on the fundamental frequency, further filter
settings for PWM waveforms can be found within the
APP/PWM section
Off
No frequency filter selected
On
Switches On frequency filter (4kHz)
Low Frequency
Normal frequency measurement is from 5Hz upwards
so that there is not a very long delay if measuring dc.
There is a low frequency option that extends the
frequency measurement down to 20mHz. This low
frequency option also applies a digital filter, which
can be useful when measuring in a low frequency,
noisy environment
Off
Select to switch this mode Off
On
Select to switch this mode On
ADVANCED OPTIONS
DFT Selectivity
Analysis of the fundamental component uses a DFT
(Discrete Fourier Transform) algorithm. The
selectivity of the DFT analysis is a compromise
between noise rejection of frequencies close to the
frequency of the fundamental component and the
required stability of the frequency component
Normal
Default settings for the fundamental calculations
Narrow
Selecting “narrow” increases the selectivity of the
DFT analysis (reducing the effective bandwidth at
each component) which has the effect of improving
the noise rejection. It does however require that the
frequency of the fundamental component is more
stable
Ignore Overload
In a noisy application any spikes present on the signal
may push the instrument onto a higher range than is
necessary for the signal being measured. If the
nature of the spurious spikes are such that they do
not contribute to the measurement and can safely be
ignored then the range can be manually set to the
appropriate range for the signal to be measured and
the instrument can be told to ignore any overload. If
using this mode it is wise to check the signal on the
oscilloscope to be sure that the signal being measured
is not genuinely over range
Off
Select to switch this mode Off
On
Select to switch this mode On
Page 15
PPA45xx Quick User Guide
Page 14
Frequency Lock
In a very noisy application, where the frequency of
the signal is known but the instrument is unable to
measure the frequency even with PWM filters or low
frequency mode filters applied, it is possible to
manually enter the frequency to be used for analysis
Normal
Utilises N4L unique signal processing techniques for
fundamental frequency synchronisation including
hysteresis to increase frequency noise immunity
Constant
Constant selection will allow the user to overwrite the
present measured frequency with the known
frequency. This entered frequency is then used for all
the analysis and the frequency of the input signal is
not measured
Dynamic
As per “Normal” without hysteresis. This option
should not be used when DC only coupling is selected
in the Coupling menu.
High Speed
High speed mode can be selected for data log speeds
less than 100ms
Disabled
Disable high speed function
Enabled
Activate high speed data log function
COUPLING
Coupling
There are three coupling options - AC only, AC+DC,
or DC only. AC+DC coupling is the default option and
should be used where possible. AC coupling should be
used for measuring signals that are biased on a dc
level (such as an amplifier operating on a single
supply or the output of a dc PSU). DC coupling should
be selected when making DC measurements as it
prevents noise from resetting the frequency
measurement algorithm. The coupling option does not
affect the bandwidth of the instrument only the
frequency detection
ac + dc
Will allow both ac and dc signals to be calculated in all
measurements
ac
AC Coupling only allows ac signals to be measured
and will filter out all dc components
dc
DC coupling should be selected when making DC
measurements as it prevents noise from resetting the
frequency measurement algorithm, the bandwidth of
the instrument is not affected. When DC coupling is
selected “Dynamic” Frequency lock has no meaning
and so should not be used.
Page 16

PPA45xx Quick User Guide
Page 15
Bandwidth
The bandwidth setting dictates the frequency range of
the instrument. This selection sets an inline analogue
filter as per the selection
Wide (dc - 2MHz)
HC Version (dc – 1MHz)
Wide bandwidth will offer the full range of frequency
components available for analysis
Low (dc - 200KHz)
Low bandwidth may be useful in noisy applications for
example where there are switching spikes
superimposed on the waveform of interest. The
switching spikes may push the input channels onto a
higher range than is necessary for the measurement.
Selecting low bandwidth puts a hardware filter in the
analogue input path to eliminate unwanted high
frequency components
dc (dc – 5Hz)
The DC only bandwidth option applies a dc-accurate
low pass filter of around 10Hz to reduce the ac signal.
This is particularly useful when accurately measuring
the dc content of an ac waveform such as the output
of a UPS (uninterruptible Power Supply). A 50Hz or
60Hz ac signal would not be removed entirely so that
the measurement may still be synchronised to the
waveform, but the amplitude would be greatly
reduced so that the instrument would be on a more
appropriate range for the dc component
Page 17
PPA45xx Quick User Guide
Page 16
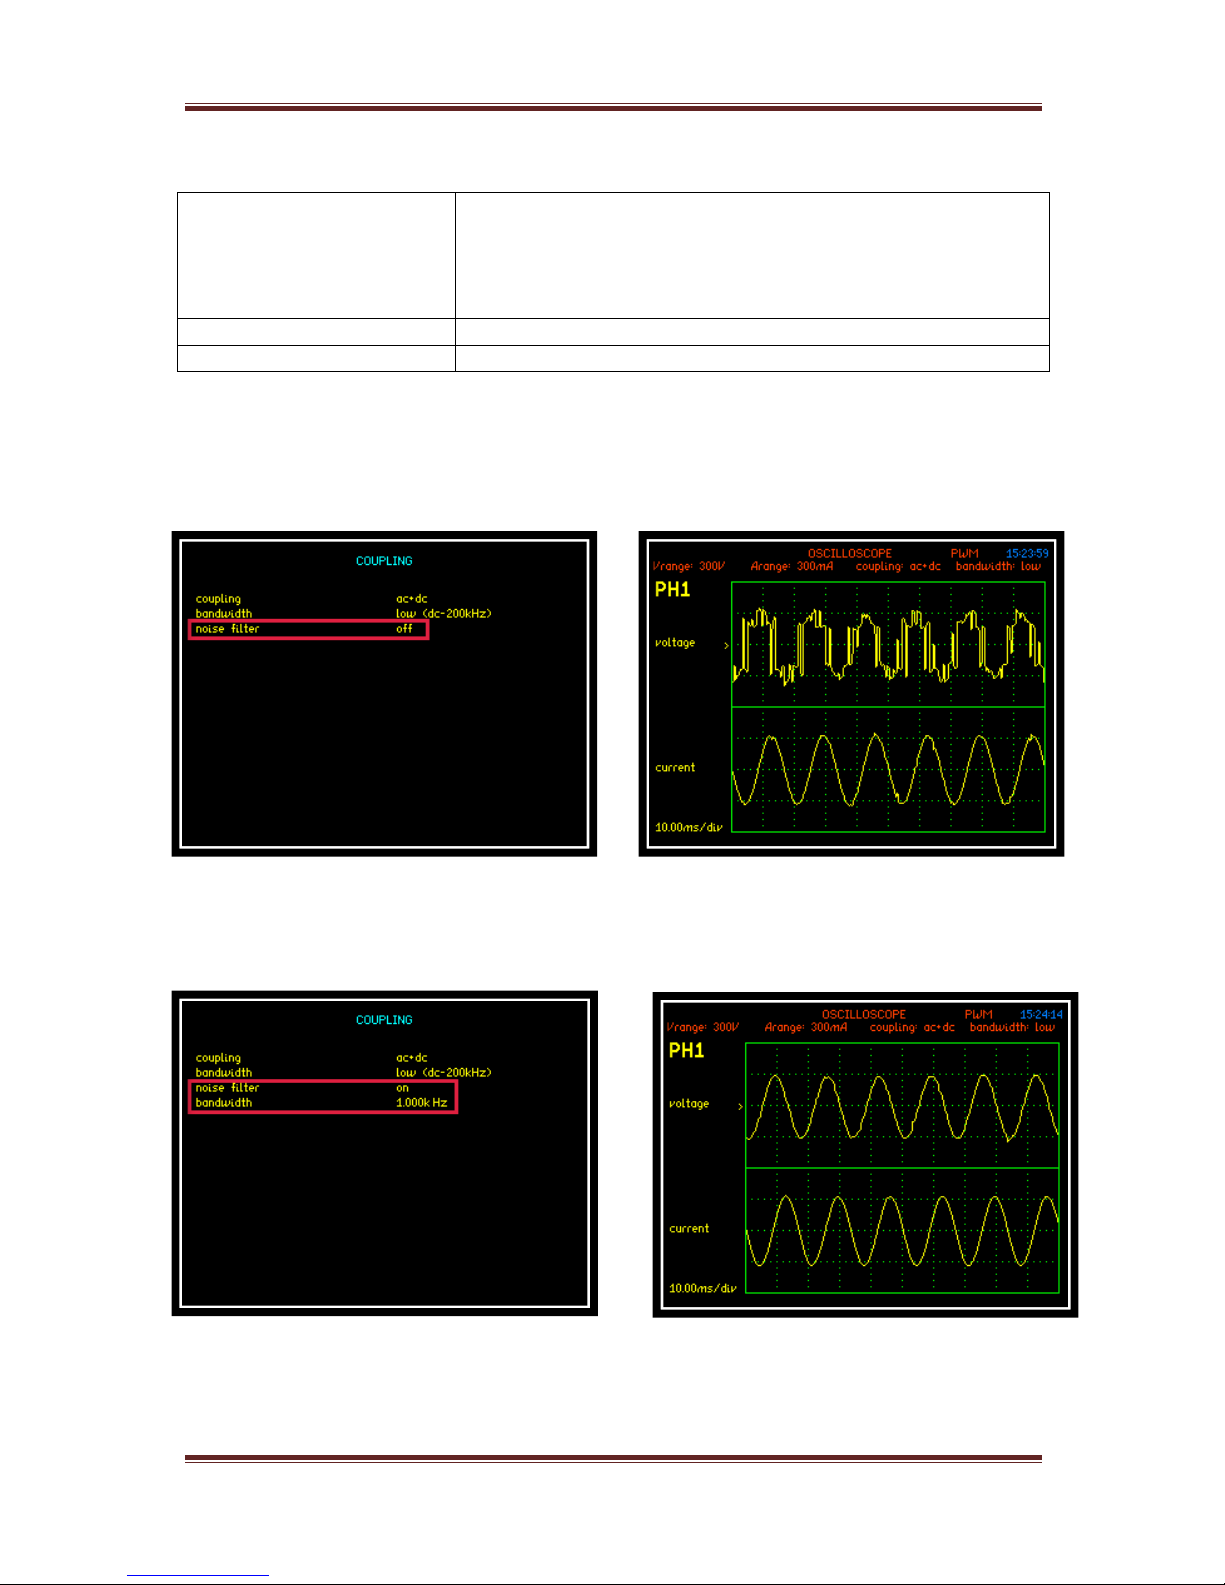
Noise Filter
In signal processing, a “FILTER” is a device or process
that removes from a signal some unwanted
component or feature. The noise filter is a digitally
selectable in line filter which will alter the bandwidth
of the processed signal
Off
Select to switch this mode off
On
Select to switch this mode on
The following screenshots are taken from the “Scope” display with the PPA set in
PWM application mode
Noise filter set to OFF the scope display shows a PWM switching Voltage
waveform with noise distortion
Noise filter activated and bandwidth set to 1KHz the Voltage waveform is now
displayed and is smoother and more sinusoidal
Page 18
PPA45xx Quick User Guide
Page 17
RANGE
Input channel options
Voltage Input
Internal
The internal voltage attenuator selects the 4mm
connections on the rear of the instrument and has a
max input of 3000Vpk
External Attenuator
(for connection to a HF
shunt).....etc
An External Sensor / Shunt can be connected to the
instrument which will give the operator more
versatility in selecting the Input range required. Note:
if this option is selected then the resulting data is
scaled by the appropriate value within the attenuator
and scale factor sub section. Max input of 3Vpk
Autoranging
Full Autorange
Default setting. Full autoranging will be selected and
implemented within the instrument
Range up only
Selecting this option will allow the test being carried
out to find the highest range via peak detection and
hold on this range. Once this value has been found
another test can be carried out by pressing the
"Trigger" button which will restart from the minimum
value set parameter use for "Low” Frequency
measurements
Manual
Selecting this option will allow the user to set up the
range from the configured measurements available,
this is useful for inrush testing when a mid-analysis
range change is not desirable
Minimum Range
Pre set Input Voltage minimum range
1V
Minimum Input Voltage range will not be below 1v
3V
Minimum Input Voltage range will not be below 3v
10V
Minimum Input Voltage range will not be below 10v
30V
Minimum Input Voltage range will not be below 30v
100V
Minimum Input Voltage range will not be below 100v
300V
Minimum Input Voltage range will not be below 300v
1Kv
Minimum Input Voltage range will not be below 1Kv
3Kv
Minimum Input Voltage range will not be below 3Kv
Scale Factor
Manually set the scale factor required, normally used
in conjunction with current transformers
Page 19
PPA45xx Quick User Guide
Page 18
Current Input
Internal
The internal current shunt selects the 4mm
connections on the rear of the instrument. Max Apk is
dependent upon model type; LC (10A rms),
Standard (30A rms) or HC (50Arms)
External Shunt
An External Shunt can be connected to the instrument
which will give the operator more versatility in
selecting the Input range required. Note: if this option
is selected then the resulting data is scaled by the
appropriate value within the scale factor and shunt
value sub section
Autoranging
Full Autorange
Default setting. Full autoranging will be selected and
implemented within the instrument
Range up only
Selecting this option will allow the test being carried
out to find the highest range via peak detection and
hold on this range. Once this value has been found
another test can be carried out by pressing the
"Trigger" button which will restart from the minimum
value set parameter
Manual
Selecting this option will allow the user to set up the
minimum range from the configured measurements
available
Minimum Range
Pre set current input minimum range
10mA LC Version Only
Minimum Input Current range will not be below 10mA
30mA LC
Minimum Input Current range will not be below 30mA
100mA LC, SC
Minimum Input Current range will not be below
100mA
300mA LC, SC, HC
Minimum Input Current range will not be below
300mA
1A LC, SC, HC
Minimum Input Current range will not be below 1A
3A LC, SC, HC
Minimum Input Current range will not be below 3A
10A LC, SC, HC
Minimum Input Current range will not be below 10A
30A LC, SC, HC
Minimum Input Current range will not be below 30A
100A SC, HC
Minimum Input Current range will not be below 100A
300A SC, HC
Minimum Input Current range will not be below 300A
1000A HC Version Only
Minimum Input Current range will not be below
1000A
Scale Factor
Manually set the scale factor required
DC offset
Used to trim out DC offset commonly found on
external current transducers
Page 20
PPA45xx Quick User Guide
Page 19
DATALOG
Datalog
Interrogation and extraction of information resulting
from a test log in a specified time scale and at a set
speed
Disabled
No memory selected
RAM
Instruments internal memory selected for data
storage, this offers the fastest performance
Internal Flash
Utilises 200MB internal memory
USB memory stick
External USB memory stick selected for data storage
APP
Mode
Application function to be selected
Normal
Using the Normal Application the default settings
within the instrument will be applied to all
measurements, useful for general measurements
Default Settings
All default parameters will be selected when “ENTER”
is pressed
PWM Motor Drive
The nature of the waveforms in a PWM motor drive
application makes measurement of the fundamental
frequency difficult. The application mode for PWM
motor drives applies a selectable filter which is a
parallel digital filter and will not affect the bandwidth
of the instrument; it is only used for frequency
detection. The best filter to use for a given application
should be selected by experiment. The filter does not
change the measured data at all. PWM application
mode also allows torque and speed to be
simultaneously measured so that efficiency can be
computed
Default Settings
All default parameters will be selected when “ENTER”
is pressed
Frequency Filter
Pre selectable filter options 64Hz, 250Hz, 1KHz,
4KHz, 16KHz, 64KHz, 250KHz
Frequency Reference
Select which parameter frequency reference will be
detected from input signal
Low Frequency
Can be selected as On or Off if “On” is selected
manually enter the minimum frequency required
Torque + Speed
Power Measurement function can be set to disabled or
enable to measure the desired function from
analogue, pulsed speed, pulsed torque, or pulsed.
Once enabled a scale factor / offset will require
setting in relation to either Voltage or Frequency
Efficiency
(Not applicable to the PPA4510) Efficiency can be
measured between selected channels from the drop
down menu
Page 21
PPA45xx Quick User Guide
Page 20
Lighting Ballast
Electronic lighting ballast waveforms consist of a high
frequency carrier signal modulated by the line
frequency. The instrument measures the line
frequency independently of the input waveform
frequency and synchronises the measurement period
to the line frequency. The carrier frequency
measurement ignores any "dead band" around the
zero crossing of the ac line to compute the actual
switching frequency of the ballast. Both the frequency
measured on the input waveform and the frequency
of the line input is displayed, the output of the ballast
should always be connected to Phase 1
Default Settings
All default parameters will be selected when “ENTER”
is pressed
Frequency Tracking
Selectable tracking speed from drop down menu
Efficiency
(Not applicable to the PPA4510) Efficiency can be
measured between selected channels from the drop
down menu
Inrush Current
Inrush current (surge) requires very fast sampling to
catch the highest instantaneous value. Measurements
must be made under conditions of manual ranging
and with the voltage applied to the instrument. Then
when the load is switched on the highest peak value
can be detected. If the peak current is unknown then
a minimum of two tests should be performed, one to
set the range and a second test to capture the inrush
current
Default Settings
All default parameters will be selected when “ENTER”
is pressed
Minimum Range
Select the minimum current range applicable from the
drop down menu
Auxiliary Device
Allows PCIS inrush switch to be used for
measurement of Inrush Current. If selected phase
offset and waveform cycle for results will require
setting
Page 22
PPA45xx Quick User Guide
Page 21
Transformer Mode
Large power transformers operate at very low power
factor (<0.01) and the phase accuracy is critical to
measure the losses. Power transformer application
mode sets the configuration options to the optimum
for phase accuracy e.g. AC+DC coupling range lock
across phases. The temperature can be monitored at
the same time by connecting a suitable temperature
sensor to the “torque” BNC input
Default Settings
All default parameters will be selected when “ENTER”
is pressed
Temperature
Temperature mode can be disabled or selected to
measure C or F via a suitable temperature sensor
connected to the “Torque” BNC input
Standby Power
In order to minimise standby power, some devices
operate in a “dormant” mode whereby power is only
drawn from the supply when needed. These devices
draw very little current for most of the time and then
draw a larger current for a single cycle to charge a
reservoir capacitor. This pattern is repeated on an
irregular basis. Most of the power consumed by
devices in this mode is taken in the periodic higher
current cycles so to accurately measure the power
drawn by these devices; the instrument synchronises
to the power frequency for the analysis but extends
the measurement window to the irregular period of
higher energy pulses. Because the instrument
samples in true real time without any gaps, no data is
missed and every power cycle is captured. It is
important that ranging is set to manual or up only
autoranging so that the power cycles are not missed
while ranging
Default Settings
All default parameters will be selected when “ENTER”
is pressed
Low Frequency
Select “On” or “Off” if low frequency filter is required
Calibration
This mode is used when calibrating the instrument
with N4L software
Default AC Settings
Select to calibrate AC
Default DC Settings
Select to calibrate DC
Frequency Filter
Frequency synchronisation for calibration gives more
accuracy at low levels, applies to AC only
Page 23
PPA45xx Quick User Guide
Page 22
Maths
Formula
Disabled
No maths formula is selected
(term1 + term2) /
(term3 + term4)
Sum of (term1 + term2) divided by sum of (term3 +
term4)
(term1 + term2) x
(term3 / term4)
Sum of (term1 + term2) multiplied by sum of (term3
÷ term4)
(term1 x term2) /
(term3 + term4)
Sum of (term1 x term2) divided by sum of (term3 +
term4)
(term1 + term2 +
term3) / term4
Sum of (term1 + term2 + term3) divided by term4
Note: Selection of “TERMS” is via the zoom order
selections (see section 6.3)
Alarm
Alarm 1 Data
Alarm on selected parameter and thresholds
Zoom 1
Zoom 1 parameter selected for alarm threshold
Zoom 2
Zoom 2 parameter selected for alarm threshold
Zoom 3
Zoom 3 parameter selected for alarm threshold
Zoom 4
Zoom 4 parameter selected for alarm threshold
Alarm Type (Alarm 1)
Disabled
No alarm
Linear
Frequency of beep increases linearly as value reaches
its limit
Alarm if high
Alarm will sound if values exceed a threshold
Alarm if low
Alarm will sound if values fall below a threshold
Outside window
Alarm will sound if values are outside a permitted
window setting
Inside window
Alarm will sound if values are within a permitted
window setting
Alarm 2 Data
Alarm on selected parameter and thresholds
Zoom 1
Zoom 1 parameter selected for alarm threshold
Zoom 2
Zoom 2 parameter selected for alarm threshold
Zoom 3
Zoom 3 parameter selected for alarm threshold
Zoom 4
Zoom 4 parameter selected for alarm threshold
Alarm Type (Alarm 2)
Disabled
No alarm
Alarm if high
Alarm will sound if values exceed a threshold
Alarm if low
Alarm will sound if values fall below a threshold
Outside window
Alarm will sound if values are outside a permitted
window setting
Inside window
Alarm will sound if values are within a permitted
window setting
Page 24
PPA45xx Quick User Guide
Page 23
Analogue Output
Disabled
No analogue output
Zoom 1
Set an analogue output voltage representative of
zoom 1
Zoom 2
Set an analogue output voltage representative of
zoom 2
Zoom 3
Set an analogue output voltage representative of
zoom 3
Zoom 4
Set an analogue output voltage representative of
zoom 4
Manual
Set a constant analogue output voltage
REMOTE
Resolution
Press to set the data resolution and change the
format to which the instrument responds to future
commands, via Comms interface
Normal
Data Resolution set to 5 decimal points
High
Data Resolution set to 6 decimal points
Binary
Data transmitted in Binary Format
Interface
Communications type between instrument and pc
RS232
RS232 Comms interface
USB
USB Comms interface
LAN
LAN Comms interface
GPIB
GPIB Comms interface – optional on the PPA45xx
Recall with Program
When enabled recalls communication port settings
from any stored memory location
Off
Turn OFF this option
On
Turn ON this option
Screen Print
Disabled
No Screen print option selected
RS232
Print screen via RS232 Cable i.e. to printer
USB Memory Stick
Print screen directly onto USB memory stick
Page 25
PPA45xx Quick User Guide
Page 24
AUX
Master / Slave
Select if 2 x PPA45xx units are to be used as a PPA45
40/50/60
Disabled
Master / Slave configuration disabled
Master
Select to set PPA45xx as master unit within
4 -6 phase configuration
Slave
Select to set PPA45xx as slave unit within
4 - 6 phase configuration
Simple Slave
In simple slave mode the results window is not
synchronised between the 2 units, the master unit will
only ask the slave unit for the results from the Watts
measurement
Auxiliary Device
None
No Auxiliary device connected
PCIS Inrush Switch
Phase Controlled Inrush Switch – is an active device
which is controlled over the extension port within the
instrument. It accurately synchronises to the line
input, measures the frequency and switches on the
output at a precise phase angle selected from the
instruments front panel. Useful for testing inrush
current of ballasts
SYS
Set Clock
Manual Setting Required. Use Numerical Keys
Set Date
Manual Setting of Date and Year, Month settings are
preset
Display
Colour
Display data will be in colour
White on Black
Display data will be displayed as white font on black
background
Black on White
Display data will be displayed as black font on white
background
Brightness
Low
Screen brightness set to Low
High
Screen brightness set to High
Phase Convention
Measurements of Phase can be expressed in one of
three formats:
-180 to +180
Commonly used in circuit analysis
0 to -360
Commonly used in power applications
0 to +360
Select as required
Page 26
PPA45xx Quick User Guide
Page 25
Keyboard Beep
Audible sound when keys are pressed
Disabled
Audible sound disabled
Enabled
Audible sound activated
Autozero
Autozero
Periodically re-zero’s input to prevent drift, useful for
long periods of DC analysis
Manual
Unit will only zero inputs if “Zero” is pressed by user
Program 1-6 Direct
Load
Program 1-6 may be recalled with a direct press of
the function keys (POWER, INTEG etc)
Disabled
Function will be disabled
Enabled
Function will be enabled
Zoom 2 High
Resolution
The data displayed in zoom 2 may be displayed to
one digit greater resolution than normal, this is
particularly useful when measuring phase at power
line frequencies
Disabled
Function will be disabled
Enabled
Function will be enabled
Independent Ranging
This allows the user to set different scale factors and
select independently internal / external shunts
separately on each phase
Disabled
Function will be disabled
Enabled
Function will be enabled
Low Value Blanking
Low value blanking will zero to display values under
the following conditions
Input Signal Peak
< 45% of RNG 1
< 25% of RNG 2
< 15% of all other ranges
Disabled
Function will be disabled
Enabled
Function will be enabled
← System
Information
The information given in this section cannot be
changed by the user
Serial Number
Instruments unique serial number
Manufacturing Code
Code attributed to build date of instrument
Main Release
Current firmware release installed in instrument
DSP Release
Digital Signal Processing release version
FPGA Release
Field Programmable Gate Array release version
Boot Release
Release version of Instruments boot up firmware
Last Calibration
Instruments last calibration date
Page 27
PPA45xx Quick User Guide
Page 26
→ User Data
Supervisor Access
Enable or Disable
User Data
Manually enter company name
User Data
Manually enter individual or company
User Data
Manually enter unique ID for instrument
Save
Save all above settings
MODE
True RMS Voltmeter
The RMS voltmeter displays the additional secondary
parameters of ac, crest factor, surge, mean and form
factor
Phase meter
The phase meter mode is a secondary function which
does not have a separate button. The phase meter
uses the terminology of channel 1 for voltage and
channel 2 for current as it is normal to use a phase
meter to compare voltages directly. The phase meter
measures the phase and gain of channel 2 relative to
channel 1 using a Discrete Fourier Transform (DFT)
algorithm at the fundamental frequency
Power Analyzer
In the POWER mode, the analyzer measures power
values for each phase
Impedance Meter
The IMP mode on the PPA uses the real and imaginary
components at the fundamental frequency using DFT
analysis to compute the impedance of the load and
associated parameters
Power Integrator
In the INTEG mode, the PPA will compute additional
power values within a Datalog and display them
relative to time (total power)
Harmonic Analyzer
The HARM mode of the PPA computes multiple DFTs
on the input waveforms in real time. There are two
modes of operation: difference THD, and series
harmonics. Series harmonic mode includes options for
THD, TIF, THF, TRD, TDD and phase. There is also an
option of a series harmonic bargraph display which
shows both the voltage and current harmonics
simultaneously. In difference THD mode, the THD
(Total Harmonic Distortion) is computed from the rms
and fundamental: In series THD mode, the THD is
computed from a series of up to 100 harmonics
Oscilloscope
The PPA provides a storage oscilloscope function in
order to view the waveforms being measured
Page 28
PPA45xx Quick User Guide
Page 27
PROG
Memory
Program Store / Recall Options
Internal Flash
Instruments internal memory utilised to store or recall
data to/from
USB Memory Stick
External USB memory stick utilised to store or recall
data to/from
Data
Program
Upload or download a program
Results
Upload or download results
Datalog
Upload or download Datalog
Action
Recall
Recall any Data selections from above
Store
Store any Data selections from above
Delete
Delete any Data selections from above
Location
999 selectable locations for data to be; stored,
recalled or deleted from
Name
Allows user to name data within location
Execute
Press to execute any change made to any parameter
within “PROG” mode
Memory Status
Status of memory in either Internal or USB
configuration
ZOOM +
Increase font size on selected parameters on display
screen
ZOOM -
Decrease font size on selected parameters on display
screen
REAL TIME
Press Real Time to return to the display screen and
see all data in real time. Pressing the real time button
will also put the display screen into hold mode
TABLE
Press Table to view results either during or at the
completion of a Datalog in tabular format, this is also
the default screen whilst Datalog is running
GRAPH
Press Graph during Datalog to view plotted data
points whilst log is in process, or view graph plots
once Datalog is complete. Press “GRAPH” to move
through screen display options
Page 29
PPA45xx Quick User Guide
Page 28
POWER
Direct button to Power Analyzer mode functions
INTEG
Direct button to Power Integrator mode functions
HARM
Direct button to Harmonic Analyzer mode functions
RMS
Direct button to True RMS Voltmeter mode functions
IMP
Direct button to Impedance Analyzer mode functions
SCOPE
Direct button to Scope mode where waveforms can be
viewed from measurements being taken. The left and
right directional arrows will allow the time base to be
changed and the up and down arrows will allow the
trigger level to be set
START
Start button will start any Datalog. Is also the button
used to initialise a screen dump of any data displayed
onto a USB memory stick
STOP
Stop button will stop any Datalog
ZERO
Zero button will reset the inputs to zero
TRIGGER
Trigger returns display screen back to real time from
a hold command. Also triggers a single shot in SCOPE
mode, all trigger settings can be found by pressing
the “scope” button whilst in SCOPE mode
ENTER / NEXT
(Dual use button)
Enter / Next will enable the user to confirm any
configurations they have set within the menu's and
will scroll through the display screen to view all
individual phase screens or all phases together
DELETE / BACK
(Dual use button)
Delete / Back will enable the user to delete any
inputted data or scroll back through any results
screens
HOME / ESC
(Dual use button)
Home / Esc will enable the user to return to the home
page once data within parameters have been adjusted
and entered, or will escape from any screen view and
return to the selected mode's home screen
Page 30
PPA45xx Quick User Guide
Page 29
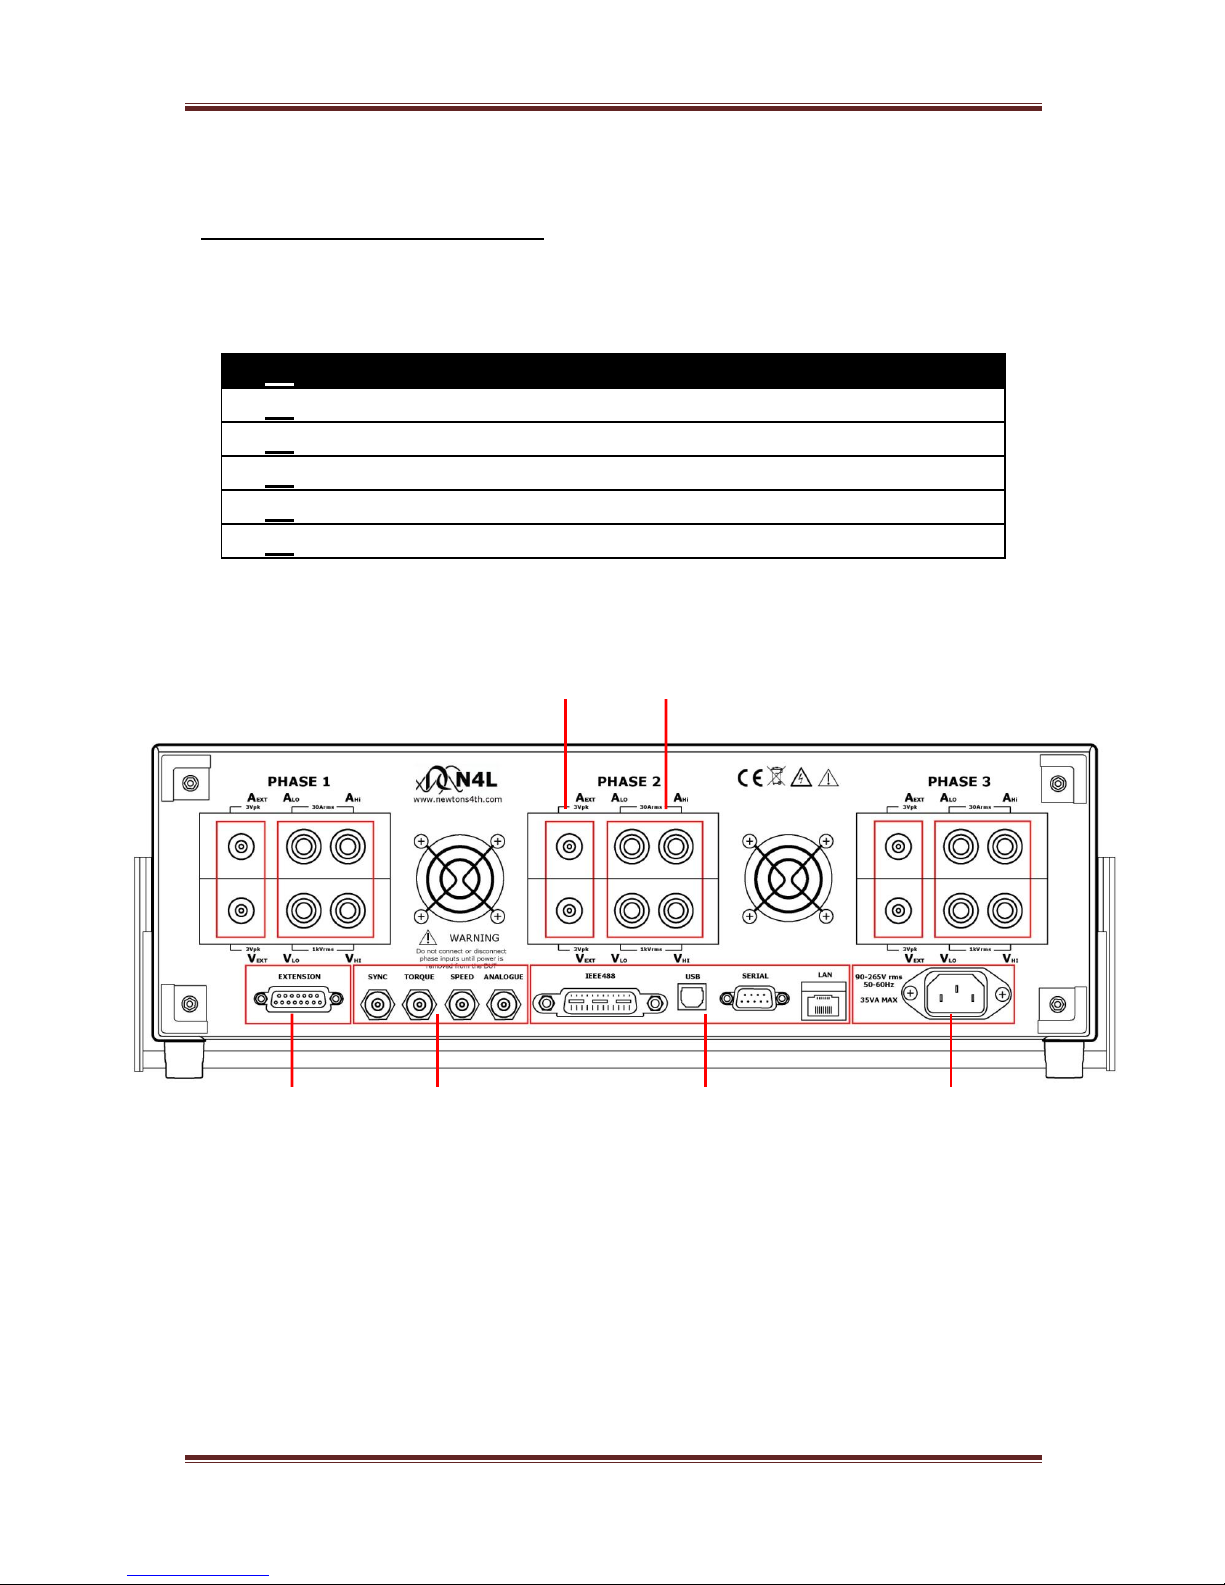
Rear Panel Layout
1. Voltage & Current External Analogue Inputs
2. Voltage & Current Internal Inputs
3. Mains Supply Inlet
4. Communication Ports
5. Auxiliary Ports
6. Master / Slave Connection Port
1 2
6 5 4 3
Page 31
PPA45xx Quick User Guide
Page 30
5 Basic Key Operations
This chapter is designed to help the user familiarise themselves with the
instrument by setting up some basic functions
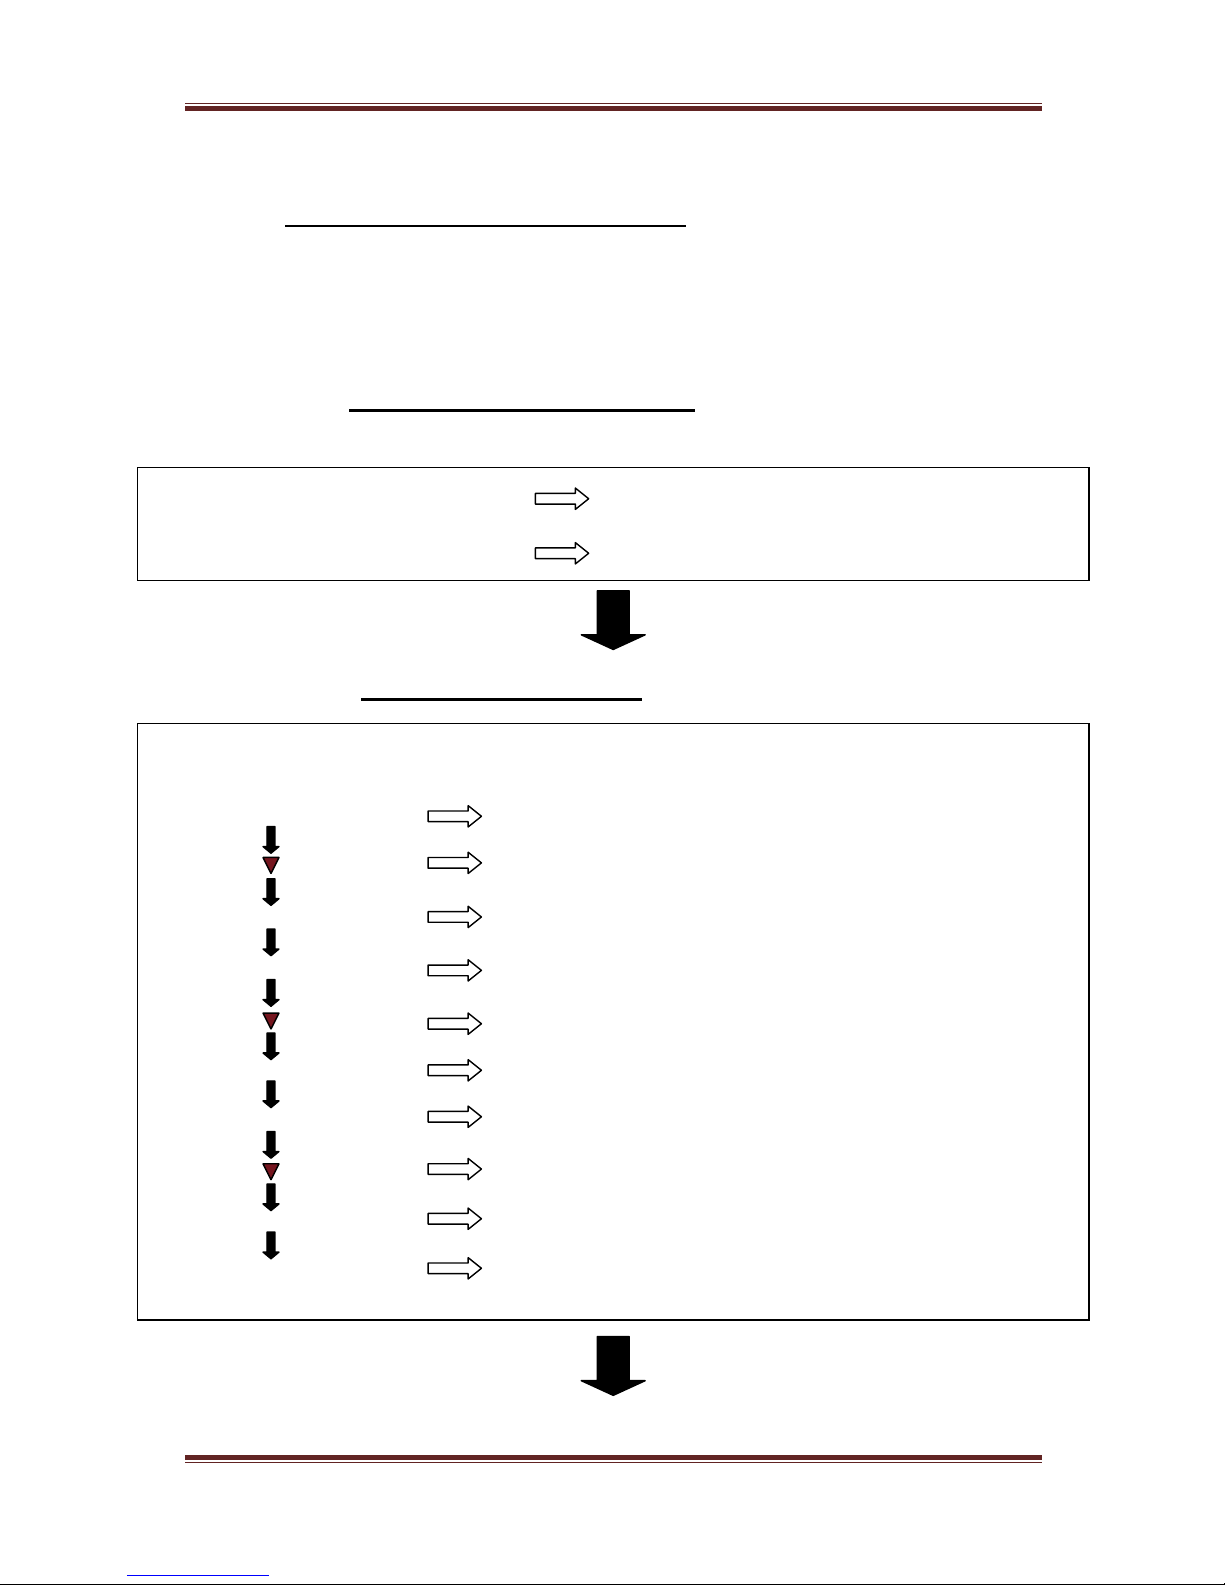
5.1 SET UP FOR POWER ON
Install Equipment Installation of Equipment
Plug in and turn on power Power Supply Connection
5.2 SETTING THE TIME
Power Analyzer Default Screen Appears
Press “SYS” Key System Option Screen Opens
Press Key Flashing Red Cursor will surround Hrs
Use Numerical Keys Set Hours within cursor
Press Enter Key Hours in clock now set
Press Key Flashing Red Cursor moves to Minutes
Use Numerical Keys Set Minutes within cursor
Press Enter Key Minutes in clock now set
Press Key Flashing Red Cursor moves to Seconds
Use Numerical Keys Set Seconds within cursor
Press Enter Key Clock settings will now be complete
Page 32
PPA45xx Quick User Guide
Page 31
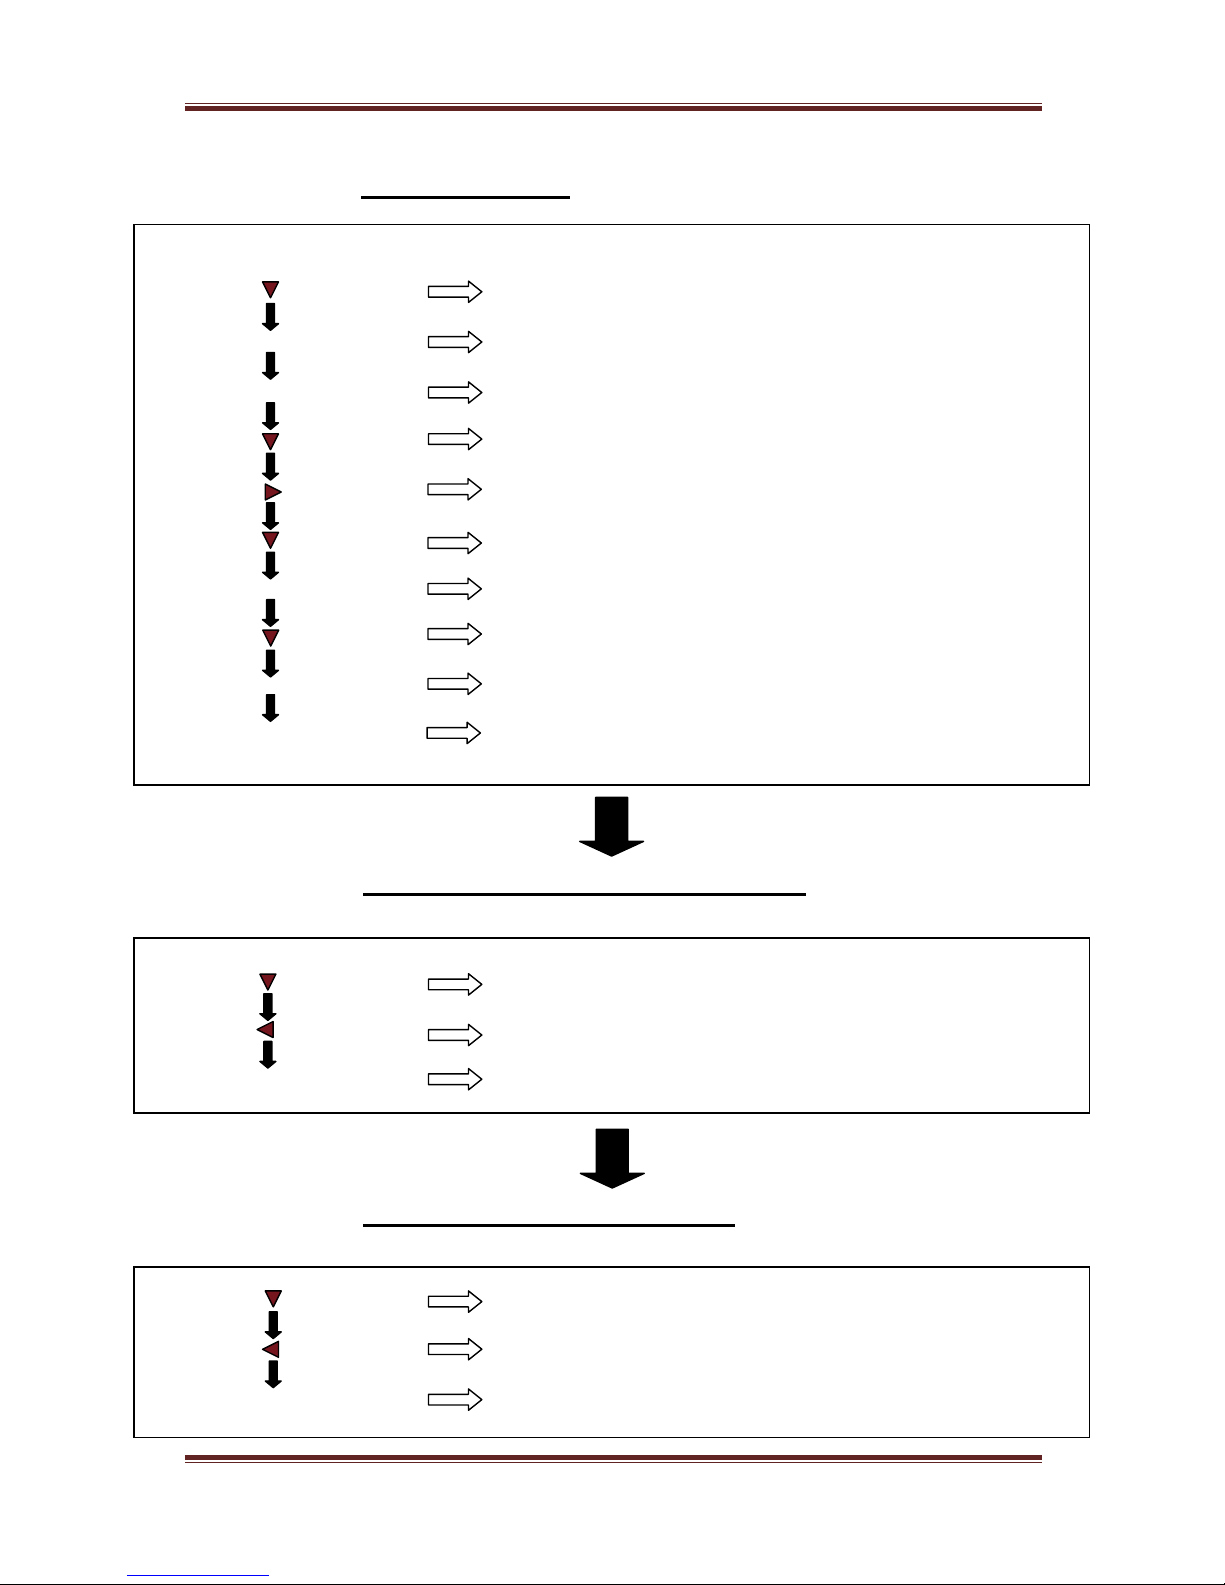
5.3 SET THE DATE
Press Key Flashing Red Cursor moves to Date
Use Numerical keys Set Date within Flashing Box
Press Enter Key Numerical Day of Month is set
Press Key Flashing Red Cursor moves to Month
Press Key Month Calendar Opens
Press Key Select Month to be entered
Press Enter Key Month will be set
Press Key Flashing Red Cursor moves to Year
Use Numerical Keys Set Year within Cursor
Press Enter Key Date will now be Set
5.4 ADJUSTING THE BRIGHTNESS
Press Key Flashing Red Cursor moves to Brightness
Press Key Changes between High or Low option
Press Enter Key Screen Brightness will now be set
5.5 ADJUST KEYBOARD BEEP
Press Key Twice Red cursor moves to Keyboard beep
Press Key Changes between Enable / Disable option
Press Enter Key Keyboard beep now set
Page 33
PPA45xx Quick User Guide
Page 32
Now that you have familiarised yourself with the instruments keypad we can
complete this section by filling in the User Data Information
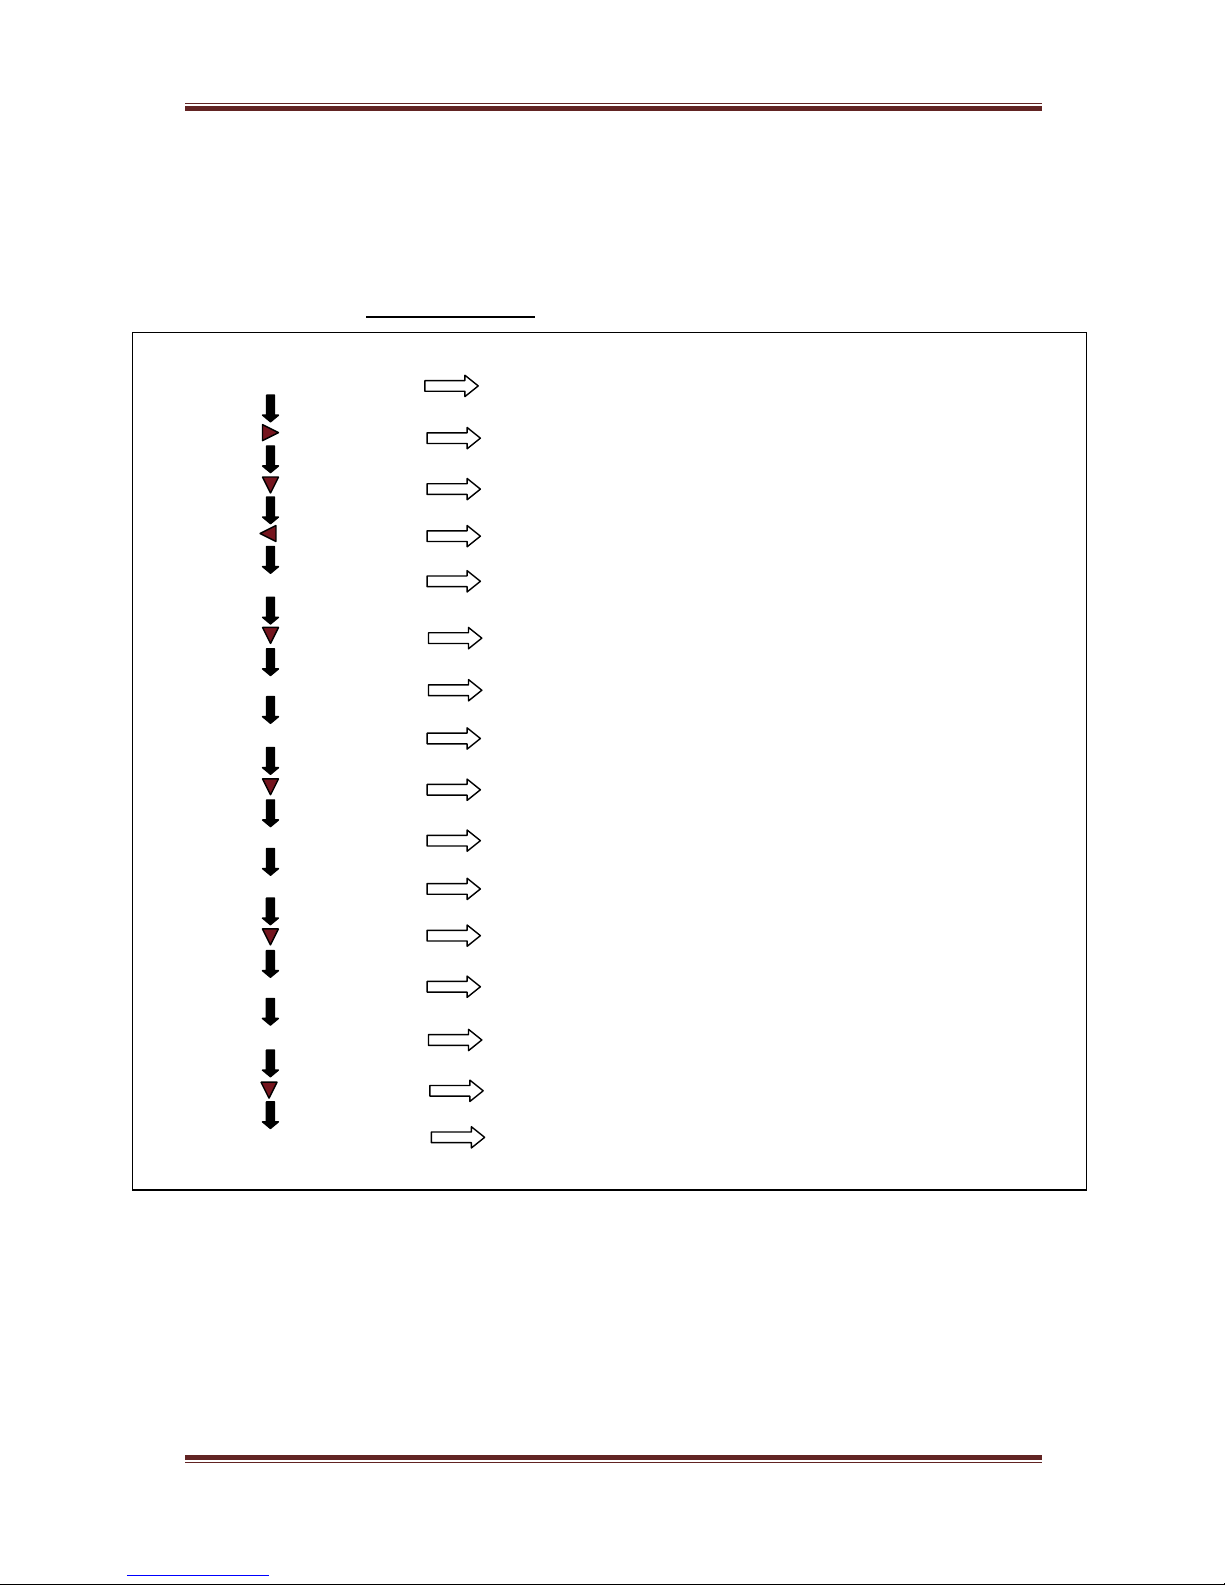
5.6 USER DATA
Press “SYS” Key System option screen opens
Press Key User settings screen appears
Press Key Red cursor moves to supervisor access
Press Key Changes between Enable / Disable option
Press Enter Key Supervisor access selected
Press Key Red cursor moves to User Data
Use Numerical Keys On this line we can enter a Company Name
Press Enter Key Company Name now set
Press Key Red Cursor moves to User Data
Use Numerical Keys Enter an Individual Name or Department
Press Enter Key Name / Department now set
Press Key Red cursor moves to User Data
Use Numerical Keys Enter a Unique ID for the instrument
Press Enter Key User Data now set
Press Key Red cursor moves to Save
Press Enter Key All User Data details will be saved
Page 34
PPA45xx Quick User Guide
Page 33
6 PPA45xx Quick User Guide
N4L Power Analyzers cover 1 to 3 phase applications in one instrument
depending upon the model and up to 12 phases via N4L’s PPALoG software
application in both low and high current models. Each phase input has wide
ranging voltage and current channels which are fully isolated from each other
and from ground.
The voltage and current inputs are simultaneously sampled and the data is
analyzed in real time by a high speed DSP (digital signal processor). A separate
CPU (central processing unit) takes the DSP results for display and
communications. At the heart of the system is an FPGA (field programmable gate
array) that interfaces the various elements.
This powerful, versatile structure allows the measurement of a wide range of
power related parameters.
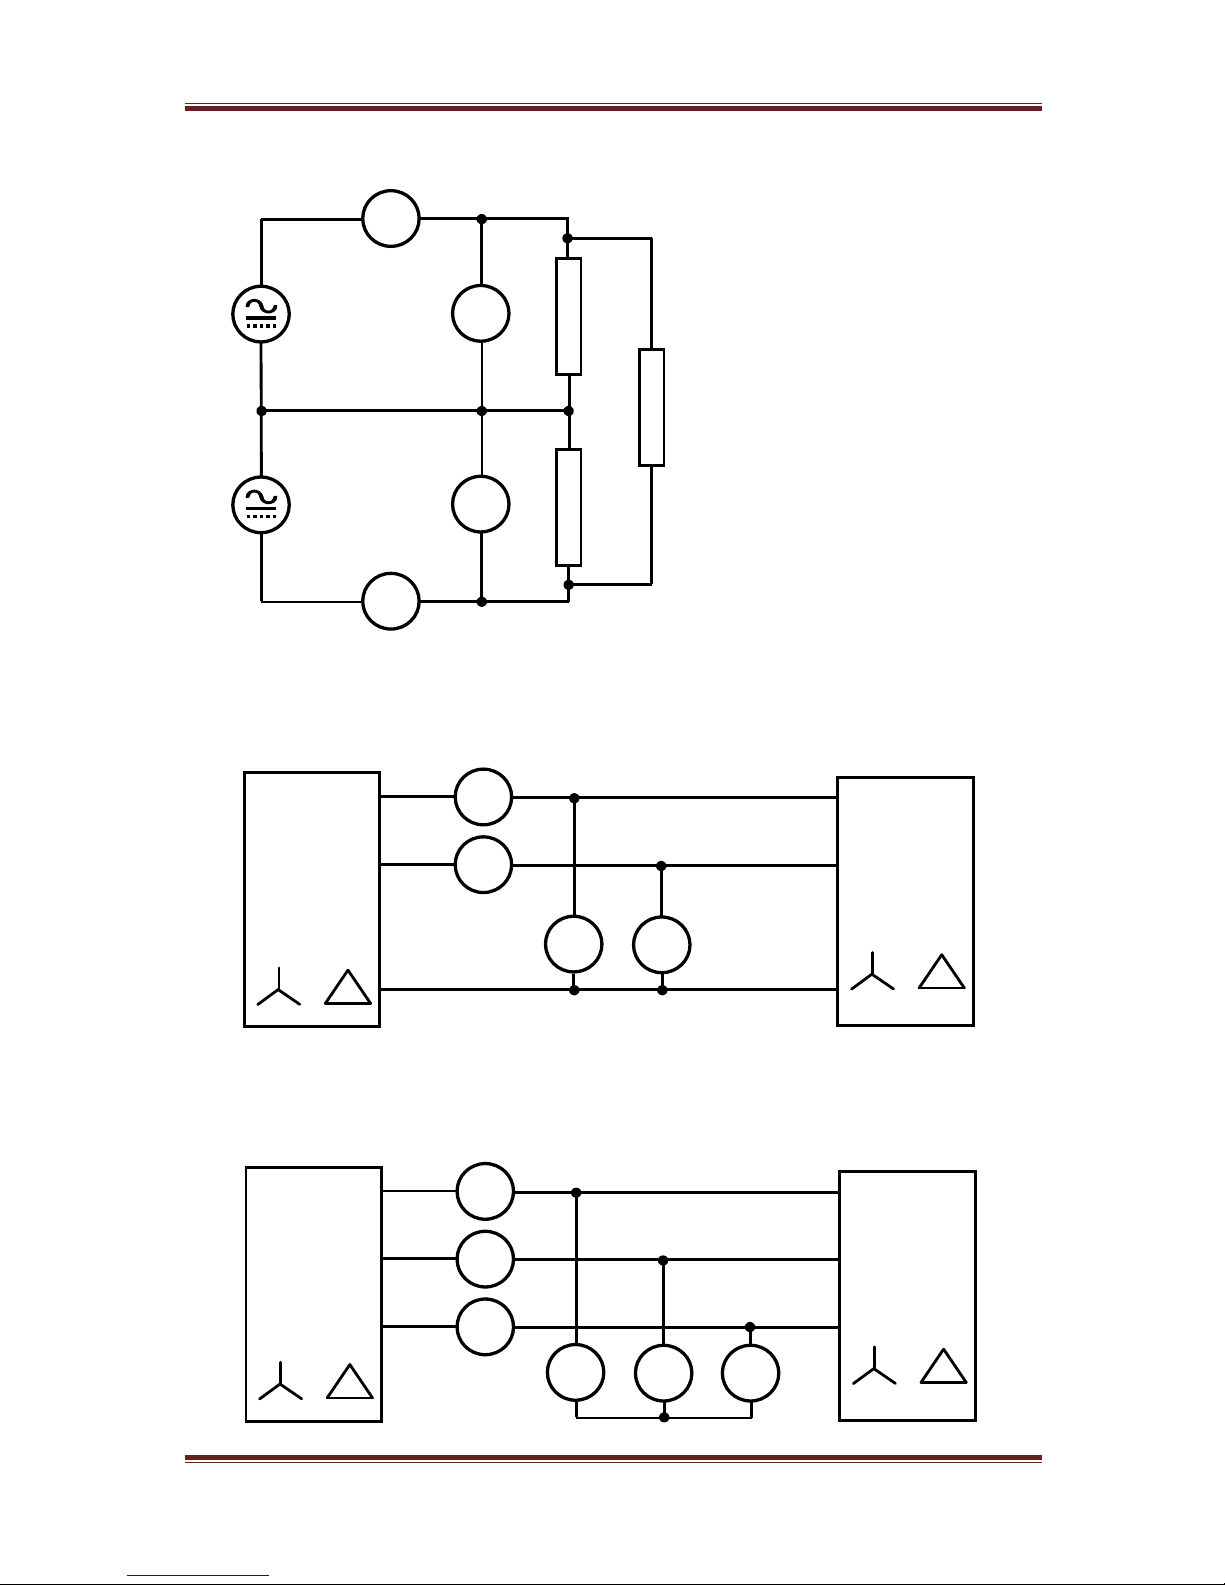
6.1 WIRING
Care must be taken when connecting up the instrument.
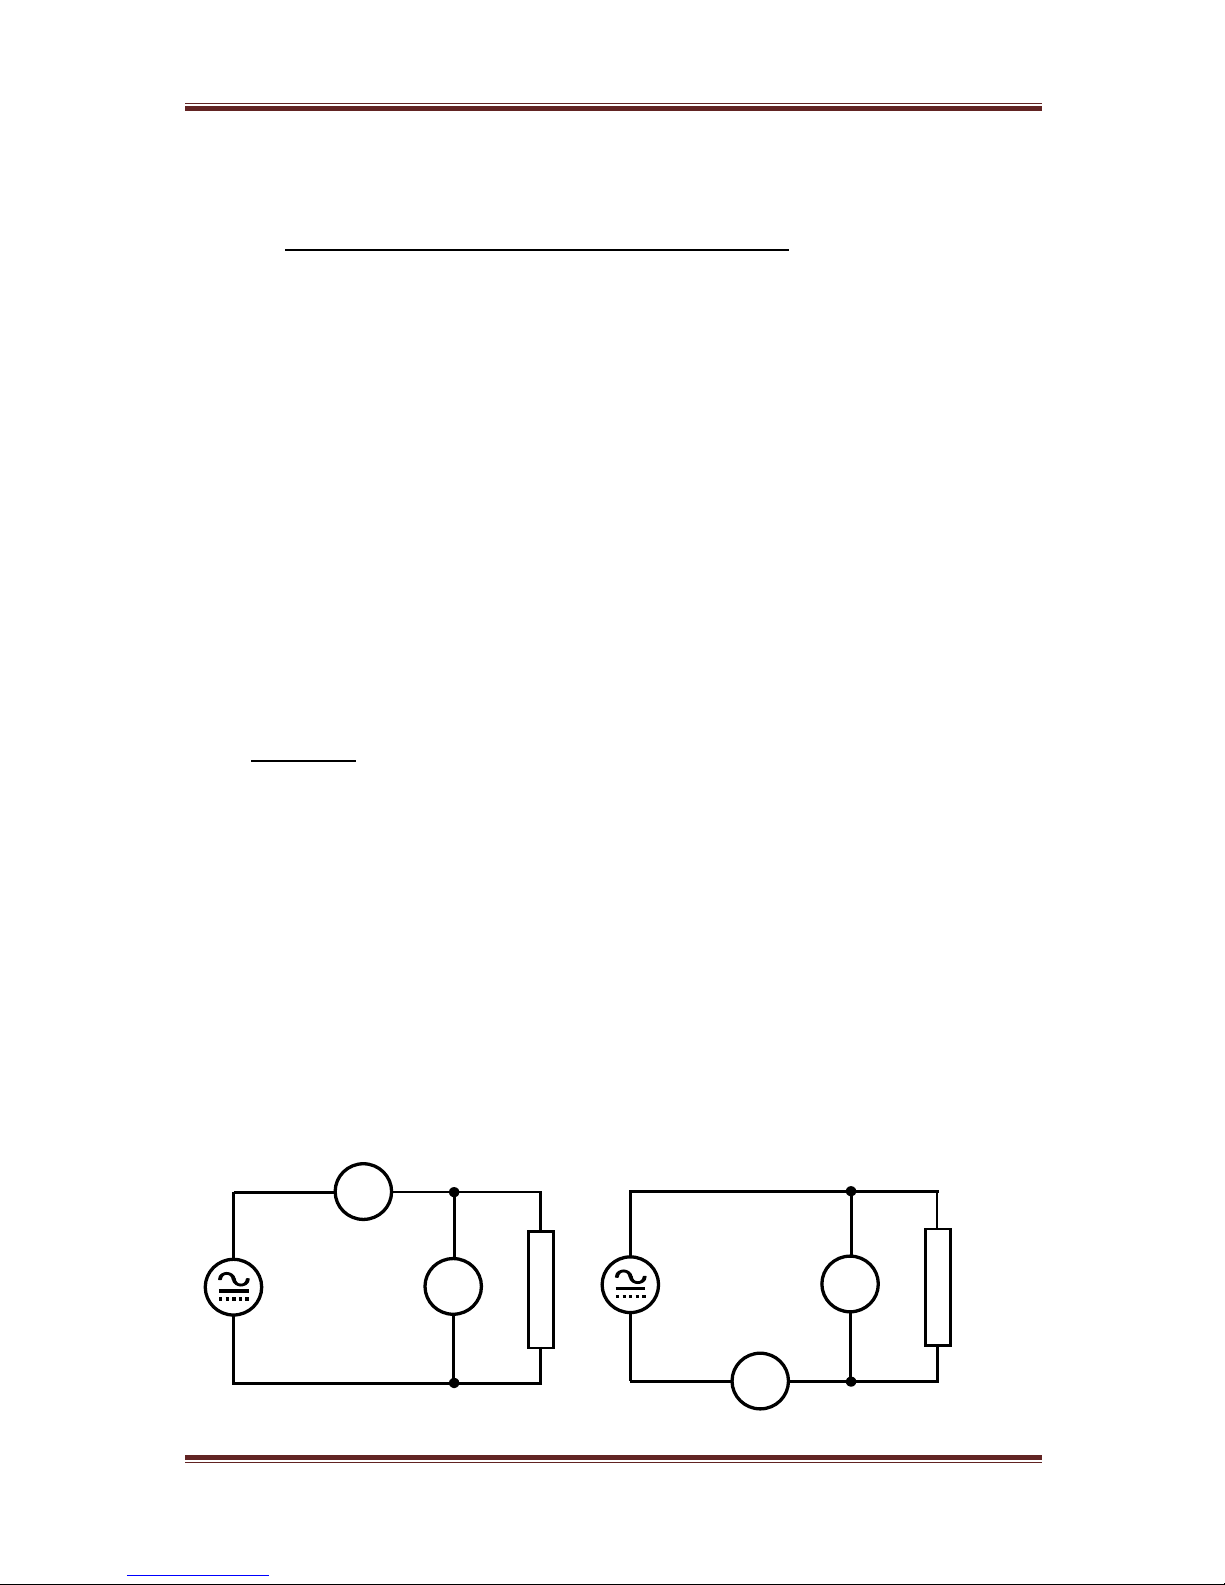
Remember to configure the Voltage and Current inputs as per the diagrams
shown
Current in Series – (Hi in, Low out)
Voltage in Parallel
Single Phase Configuration
L
O
A
D
ACH1
VCH1
HI
LO
HI
LO
L
N
L
O
A
D
ACH1
VCH1
HI
LO
HI
LO
L
N
Page 35
PPA45xx Quick User Guide
Page 34
Two Phase Two Wattmeter Configuration
Three Phase Two Wattmeter Configuration
Three Phase Three Wattmeter - simulated neutral configuration
L
O
A
D
ACH1
VCH1
HI
LO
HI
LO
L
O
A
D
ACH2
VCH2
HI
LO
HI
LO
L
L
L
O
A
D
Three
Phase
Source
or
ACH1
ACH2
Three
Phase
Load
or
VCH1
VCH2
HI
LO
LO
HI
HI
HI
LO
LO
Ph1
Ph2
Ph3
Ph3
Ph2
Ph1
Three
Phase
Source
or
ACH1
ACH2
ACH3
Three
Phase
Load
or
VCH1
VCH2
VCH3
LO
LO
LO
HI
HI
HI
HI
HI
HI
Ph1
Ph1
Ph2
Ph2
Ph3
Ph3
LO
LO
LO
Page 36
PPA45xx Quick User Guide
Page 35
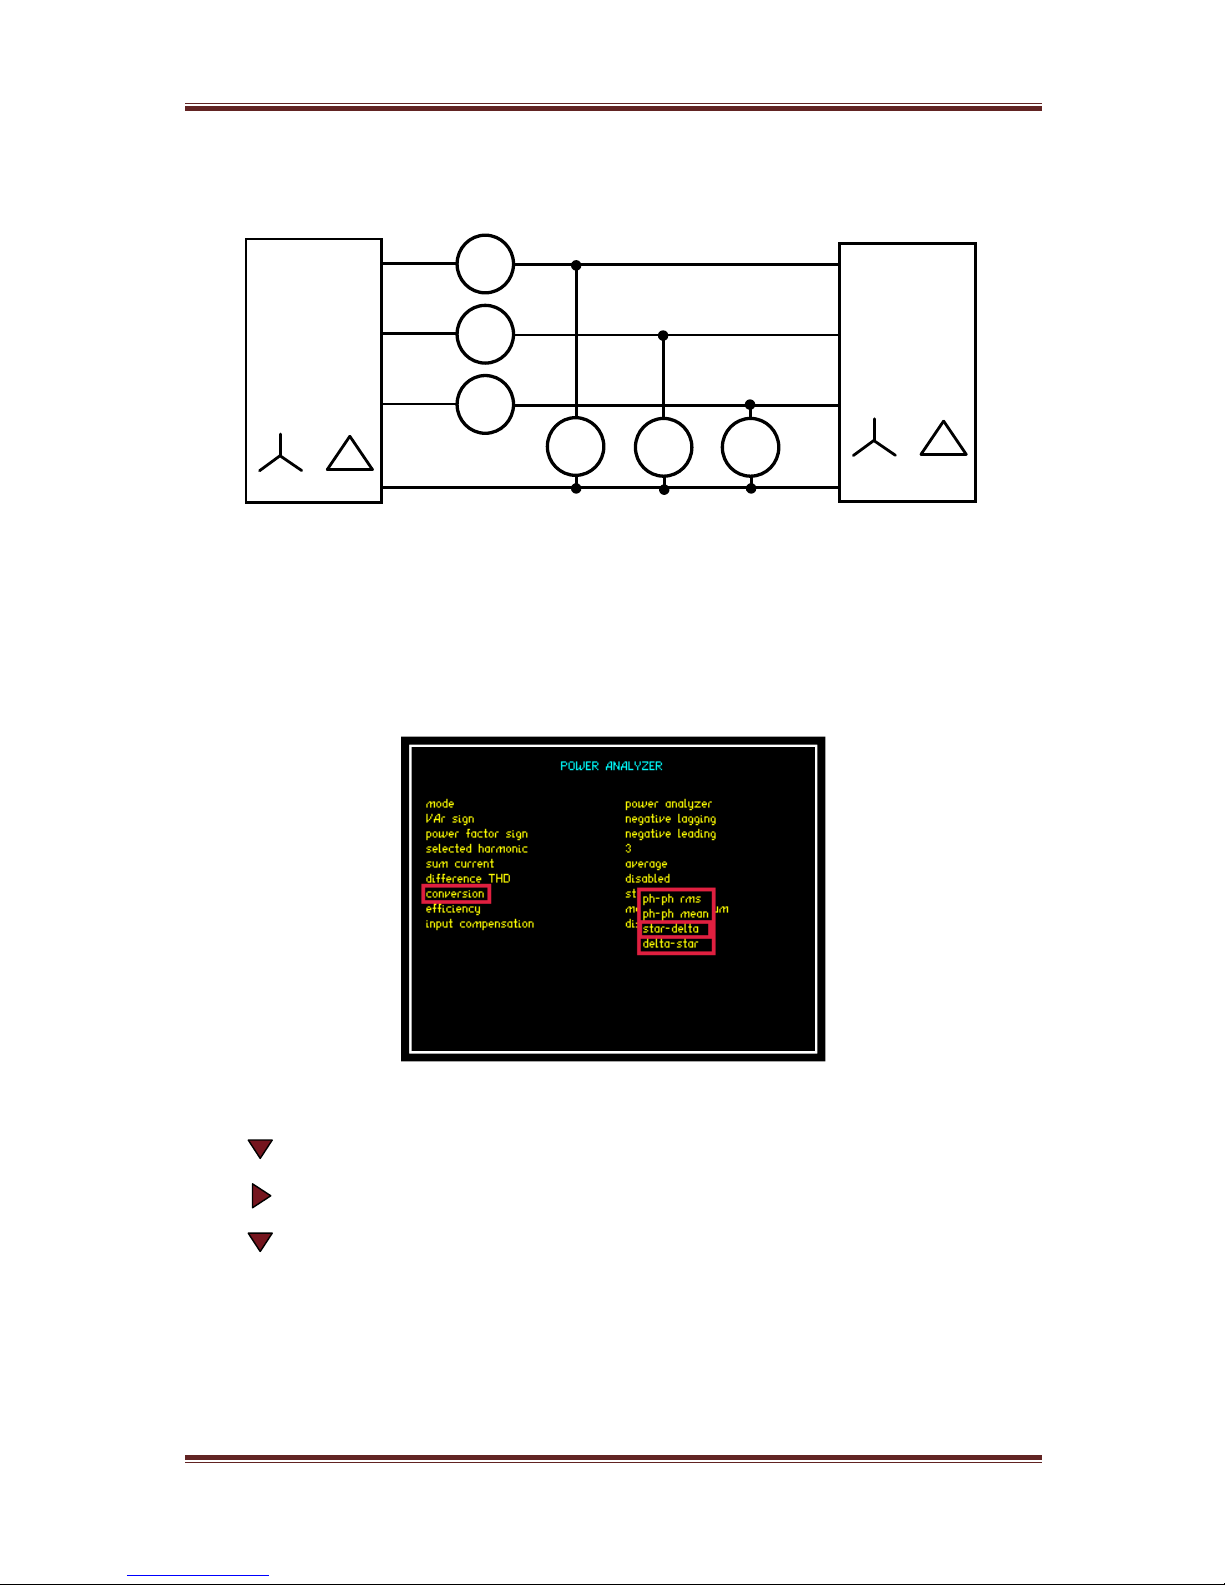
Three Phase Three Wattmeter – Star Connections
To configure PPA45xx to calculate the correct phase power when the Load
topology is in a Star Configuration;
Access “Power Analyzer” mode either through the “Mode” or the “POWER” button
as per the screenshot below
Press 7 times until red box surrounds “conversion”
Press to open up dropdown menu selections
Press until red box surrounds “star-delta”
Press “ENTER” to confirm selection
Three
Phase
Source
or
ACH1
ACH2
ACH3
Three
Phase
Load
or
VCH1
VCH2
VCH3
HI
HI
HI
HI
HI
HI
LO
LO
LO
Ph1
Ph1
Ph2
Ph3
Ph3
Ph2 N N
LO
LO
LO
Page 37
PPA45xx Quick User Guide
Page 36
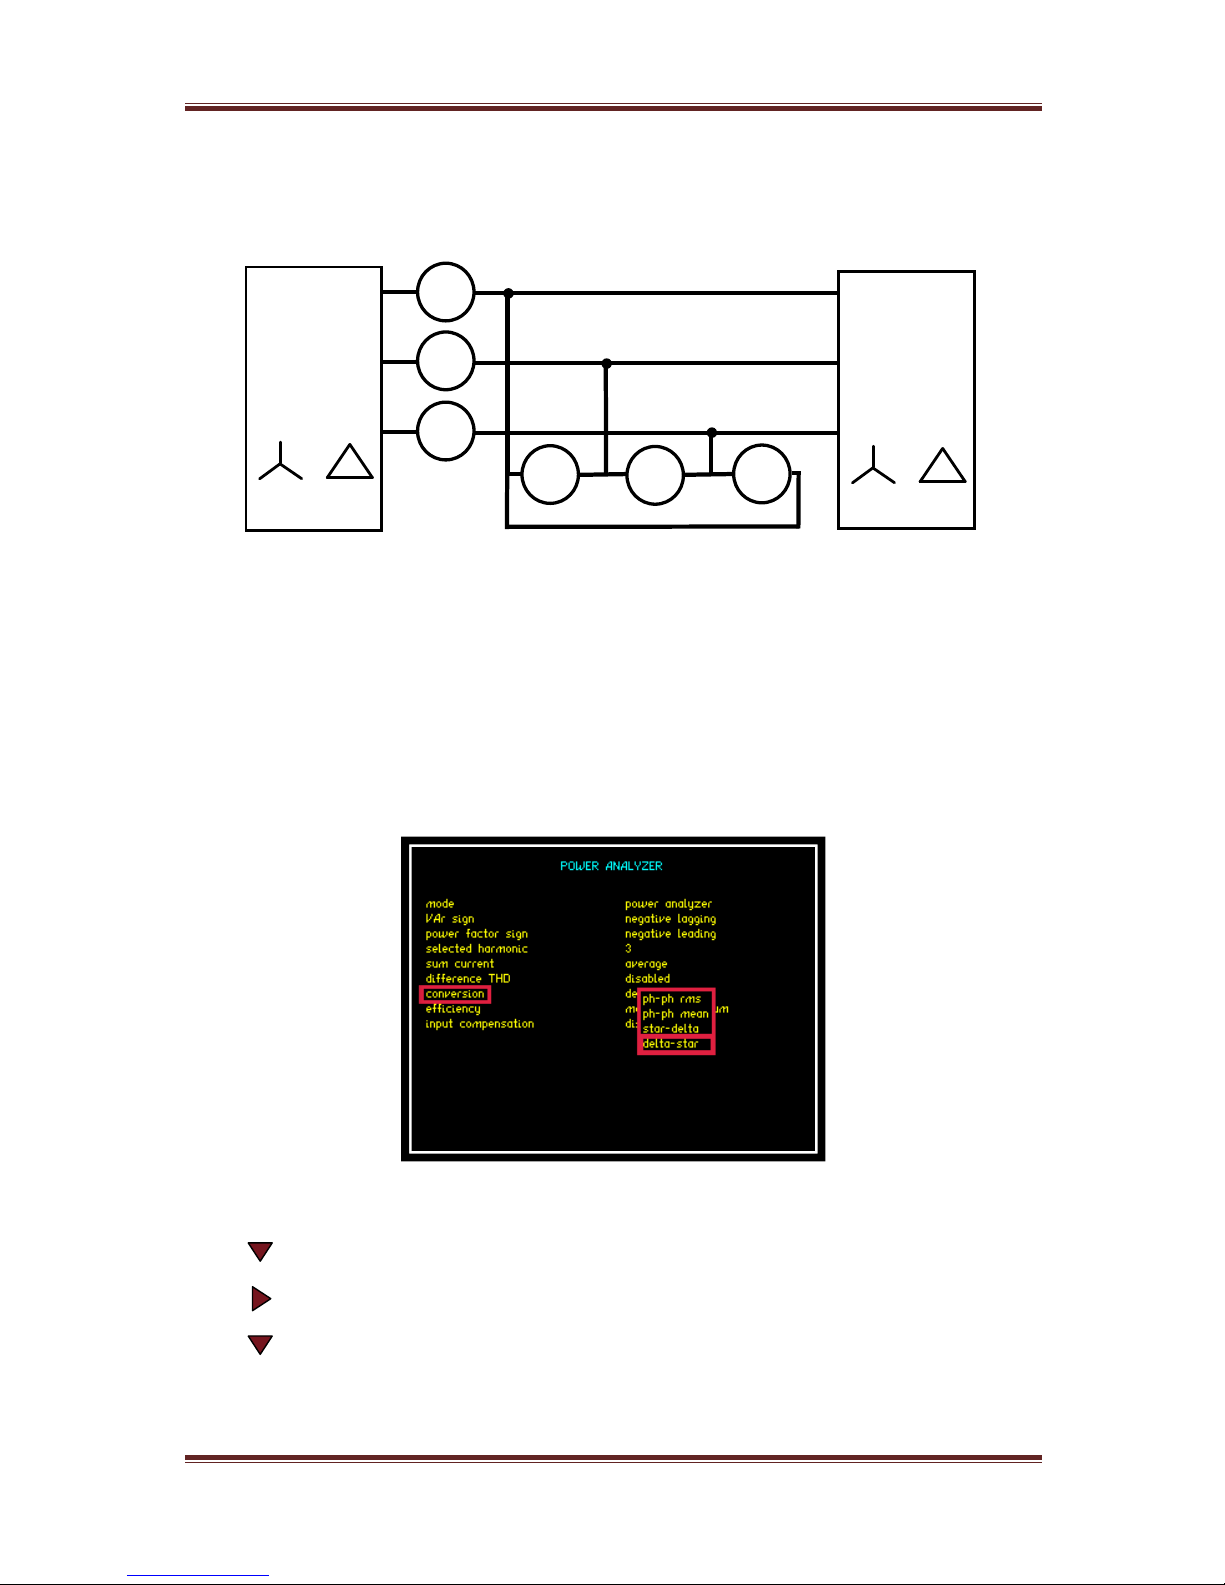
Three Phase Three Wattmeter– Delta Connections
To configure PPA45xx to calculate the correct phase power when the Load
topology is in a Delta Configuration;
Access “Power Analyzer” mode either through the “Mode” or the “POWER” button
as per the screenshot below
Press 7 times until red box surrounds “conversion”
Press to open up dropdown menu selections
Press until red box surrounds “delta – star”
Press “ENTER” to confirm selection
Three
Phase
Source
or
ACH1
ACH2
ACH3
Three
Phase
Load
or
VCH1
VCH2
VCH3
HI
HI
HI
HI
HI
HI
LO
LO
LO
Ph1
Ph1
Ph2
Ph3
Ph3
Ph2
LO
LO
LO
Page 38
PPA45xx Quick User Guide
Page 37
6.2 START UP
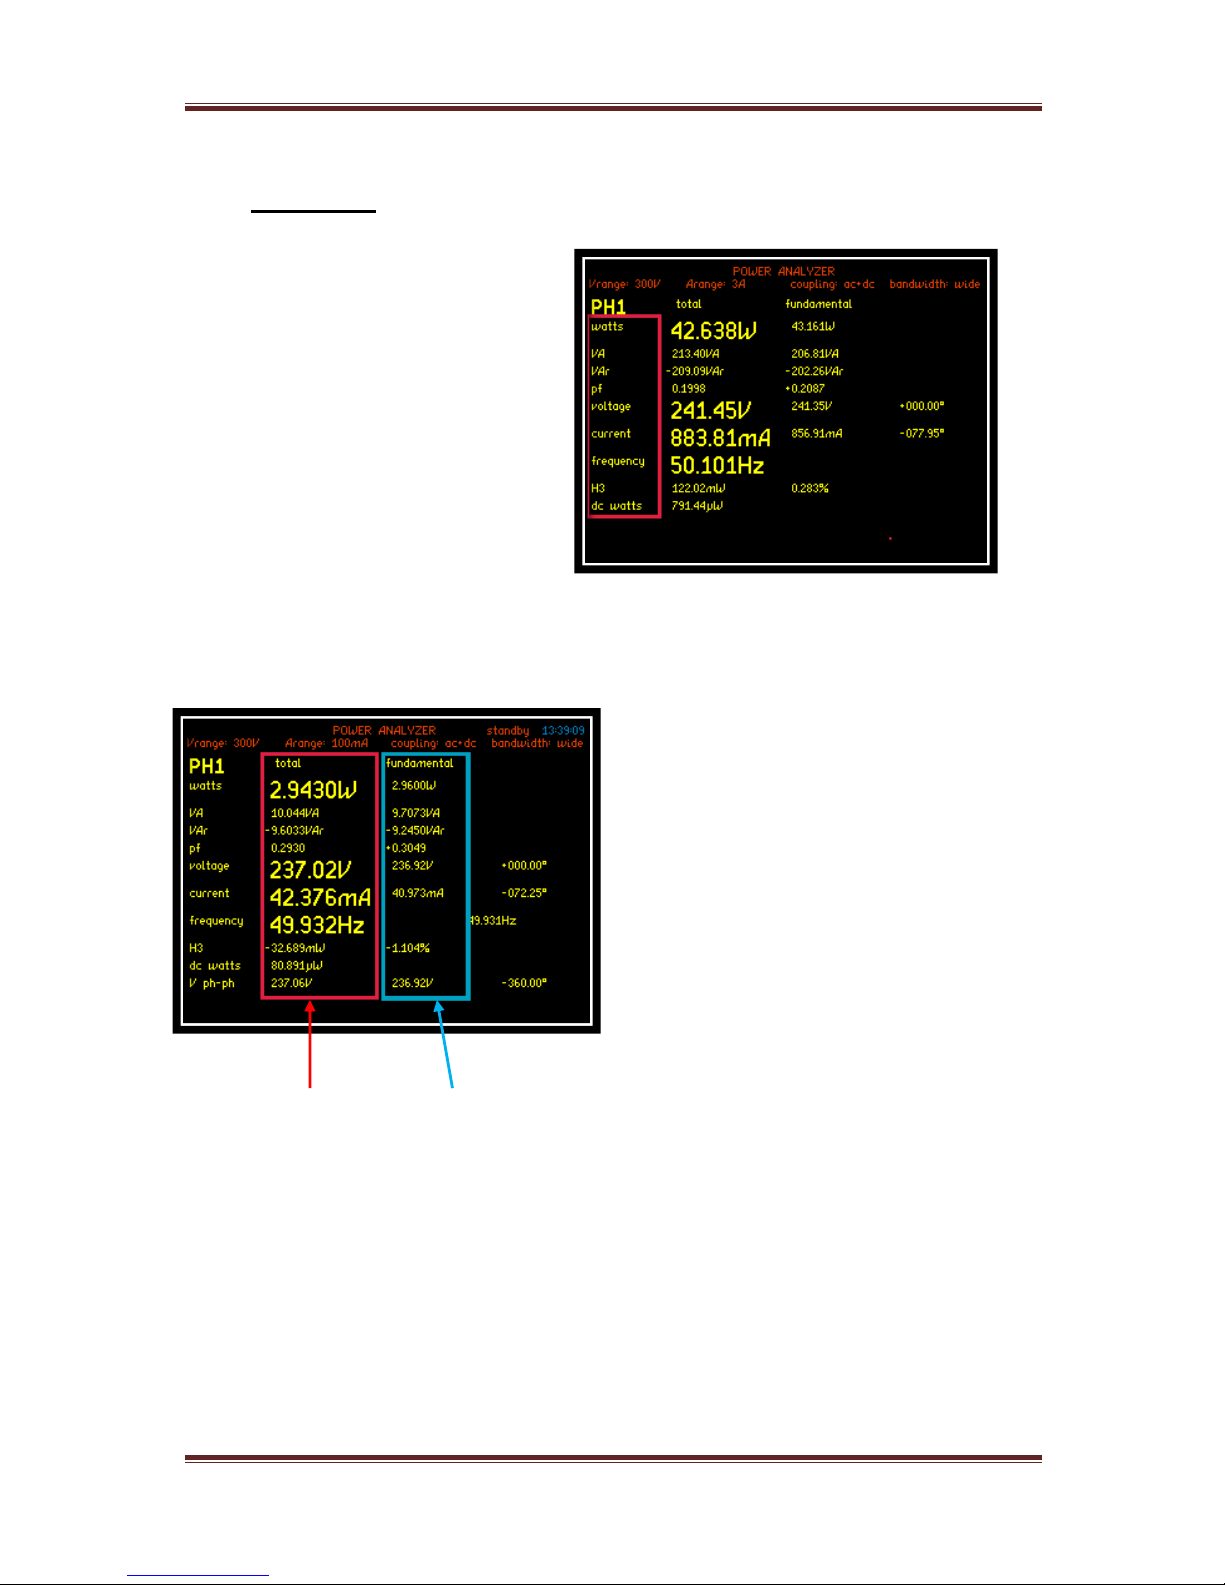
Within the Power screen you will notice
2 sets of measurements “Total” and
“Fundamental”
Total Measurements Fundamental Measurements
Total Measurements = Fundamental + Harmonics + Noise
Fundamental = Fundamental Power Measurements (All Distortion Removed)
Each measurement mode is pre-configured to display relevant parameters. Up to
4 functions can be selected and zoomed in. These can be viewed within 3 zoom
screens, the Zoom function is described in the next section of this manual
Once connected, power on
the instrument and the
analyzers factory default
settings from memory
location 0 will be displayed as
shown, Note these can be
altered to your own desired
settings (see the User Data
section under System
Options, section 6 of
the main user guide,
downloadable from the N4L
website)
Page 39

PPA45xx Quick User Guide
Page 38
6.3 ZOOM FUNCTION
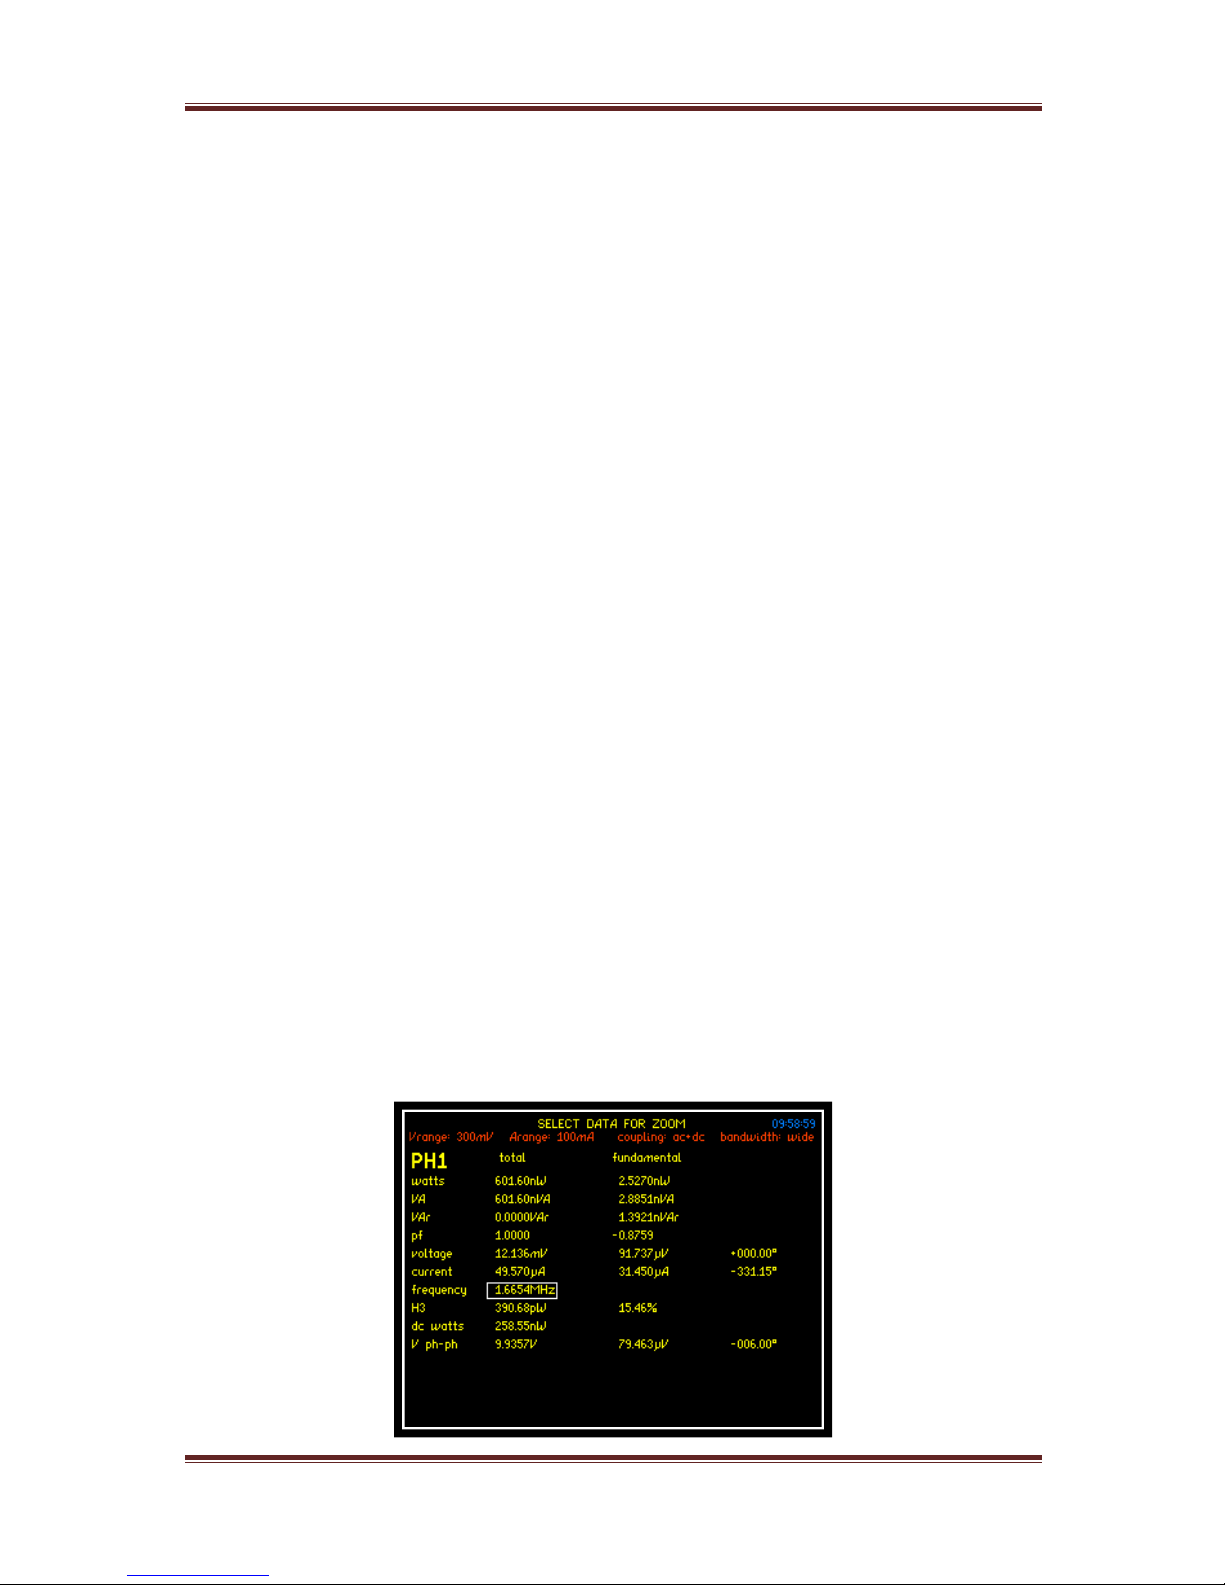
Within the Power screen you are able to select up to 4 measurements that can
be made more prominent from the rest, these can be selected and changed by
the user as required
To select or change any zoom measurement
Action Result
Press “ZOOM-” All measurement parameters revert to same size
Press “ZOOM+” Red boxes will flash around currently selected
zoom parameters
Press “DELETE” Red Boxes will disappear replaced by 1 white
flashing box
Press Keys Move Box to desired measurement parameter
to be zoomed
Press “ENTER” Measurement will be selected
Press Keys Move Box to next desired measurement
parameter to be zoomed
Press “ENTER” Measurement will be selected
Continue until all measurements you require are selected, up to a maximum of 4
By pressing the ZOOM+ or ZOOM- button you can now alter the on screen
display to show a different configuration of the selected measurements
Page 40
PPA45xx Quick User Guide
Page 39
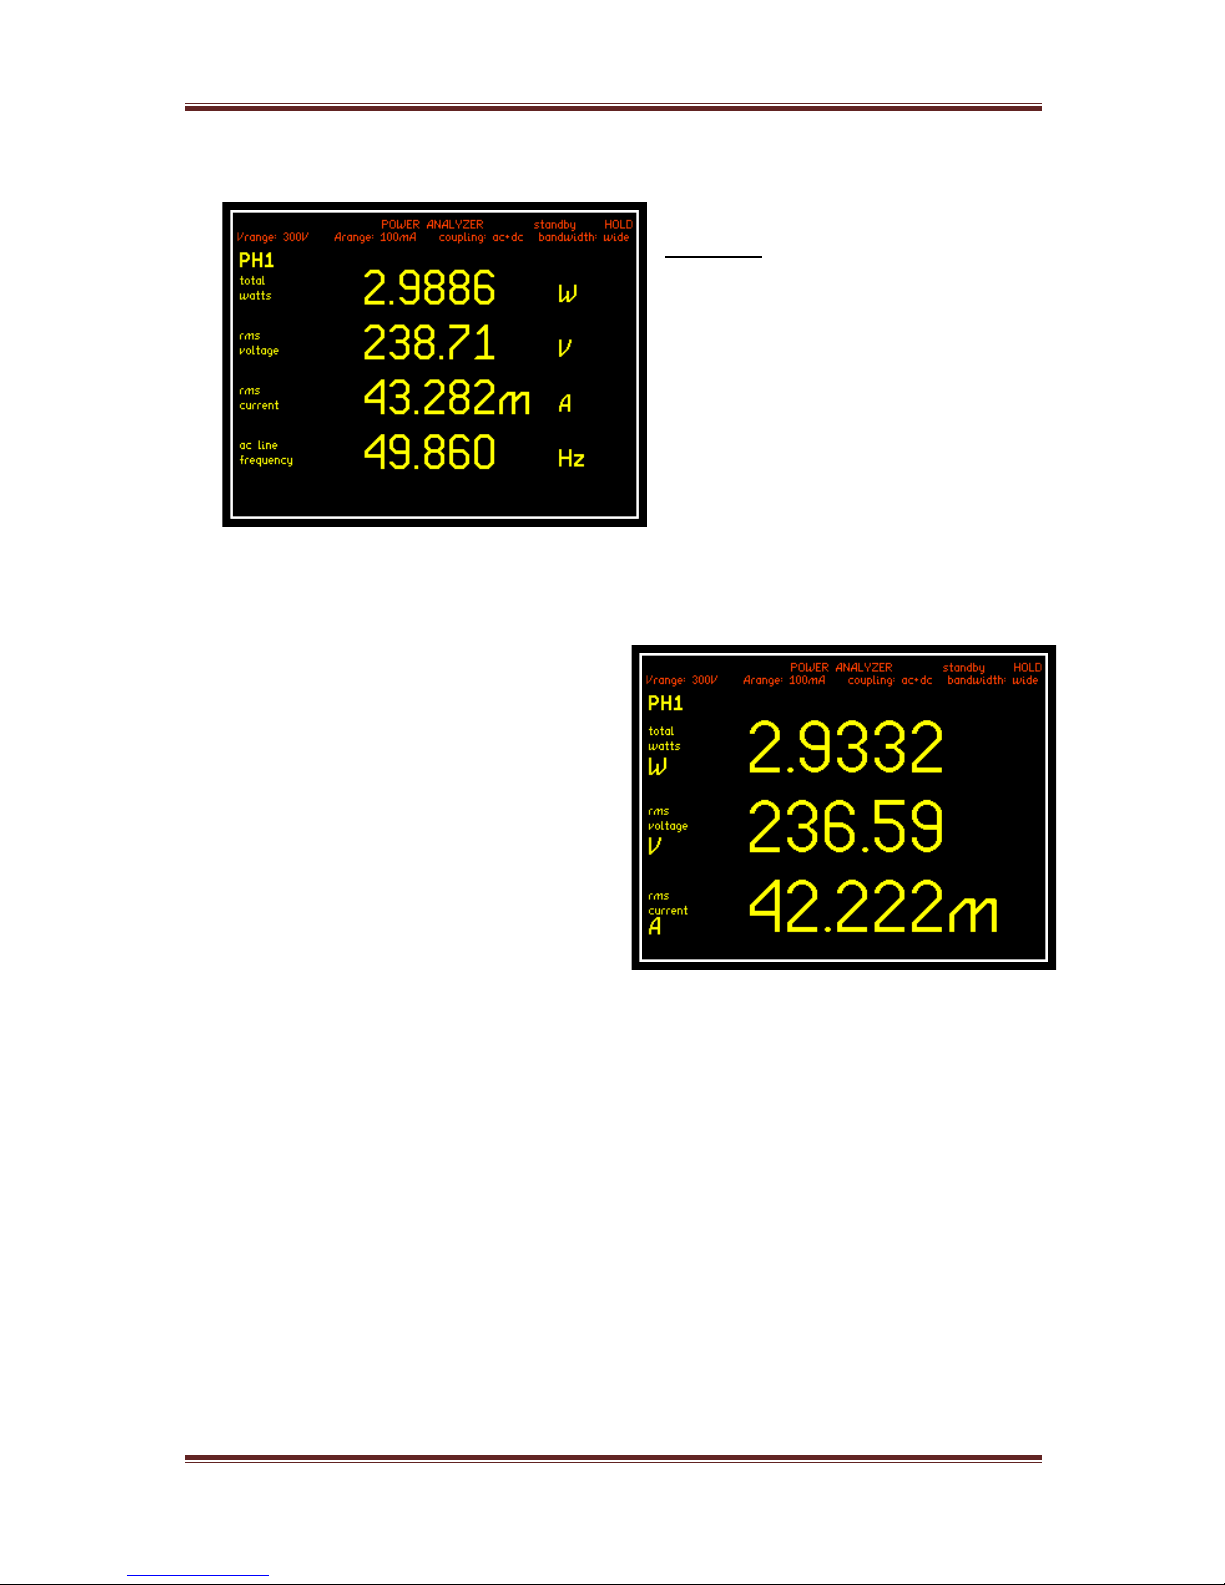
Zoom +
Press Zoom+ to display the 4
selected zoomed measurements as
shown
Note: These will be displayed in the
order they were selected
Pressing Zoom+ again will display only
the first 3 selected zoomed
measurements as shown
Press ZOOM- button to revert real time display back to all measurement
parameters
Page 41
PPA45xx Quick User Guide
Page 40
6.3.1 ANALOGUE (ANALOG) OUTPUT
The Analogue Output BNC connector is located on the rear of the instrument.
The output voltage (max ±10V) can be controlled using the ALARM functions to
generate a voltage representative of Zoom 1-4 measurements or a manual level.
The Voltage present at the Analogue Output can be calculated using this
formula:
Analogue Output = 10V x (measured – zero) / (full scale – zero)
“Measured” is the value measured on the instrument.
“Zero” and “Full Scale” are user defined values.
In the following example a 2V Peak 50Hz signal will be monitored by the Power
Analyzer. The frequency will be adjustable by +/-2Hz. Therefore in the above
formula Zero will be 50 and Full Scale will be 52.
With a Full scale value of +/-2Hz, the Analogue Output will vary between -10V at
48Hz up to +10V at 52Hz. The Analogue Output Voltage will be 0V when the
frequency is 50Hz.
Zoom 1 in the Alarm menus will be used to control the voltage levels on the
Analogue Output.
Connections
Connect the input signal to Phase 1 on the PPA and connect the Analogue output
to Phase 2. In this example a 2.00V Peak 50Hz input signal was used.
PPA Settings
Using the ZOOM buttons select frequency for Zoom 1. Other parameters can also
be selected but for this example Zoom 1 must be set to frequency.
Page 42
PPA45xx Quick User Guide
Page 41
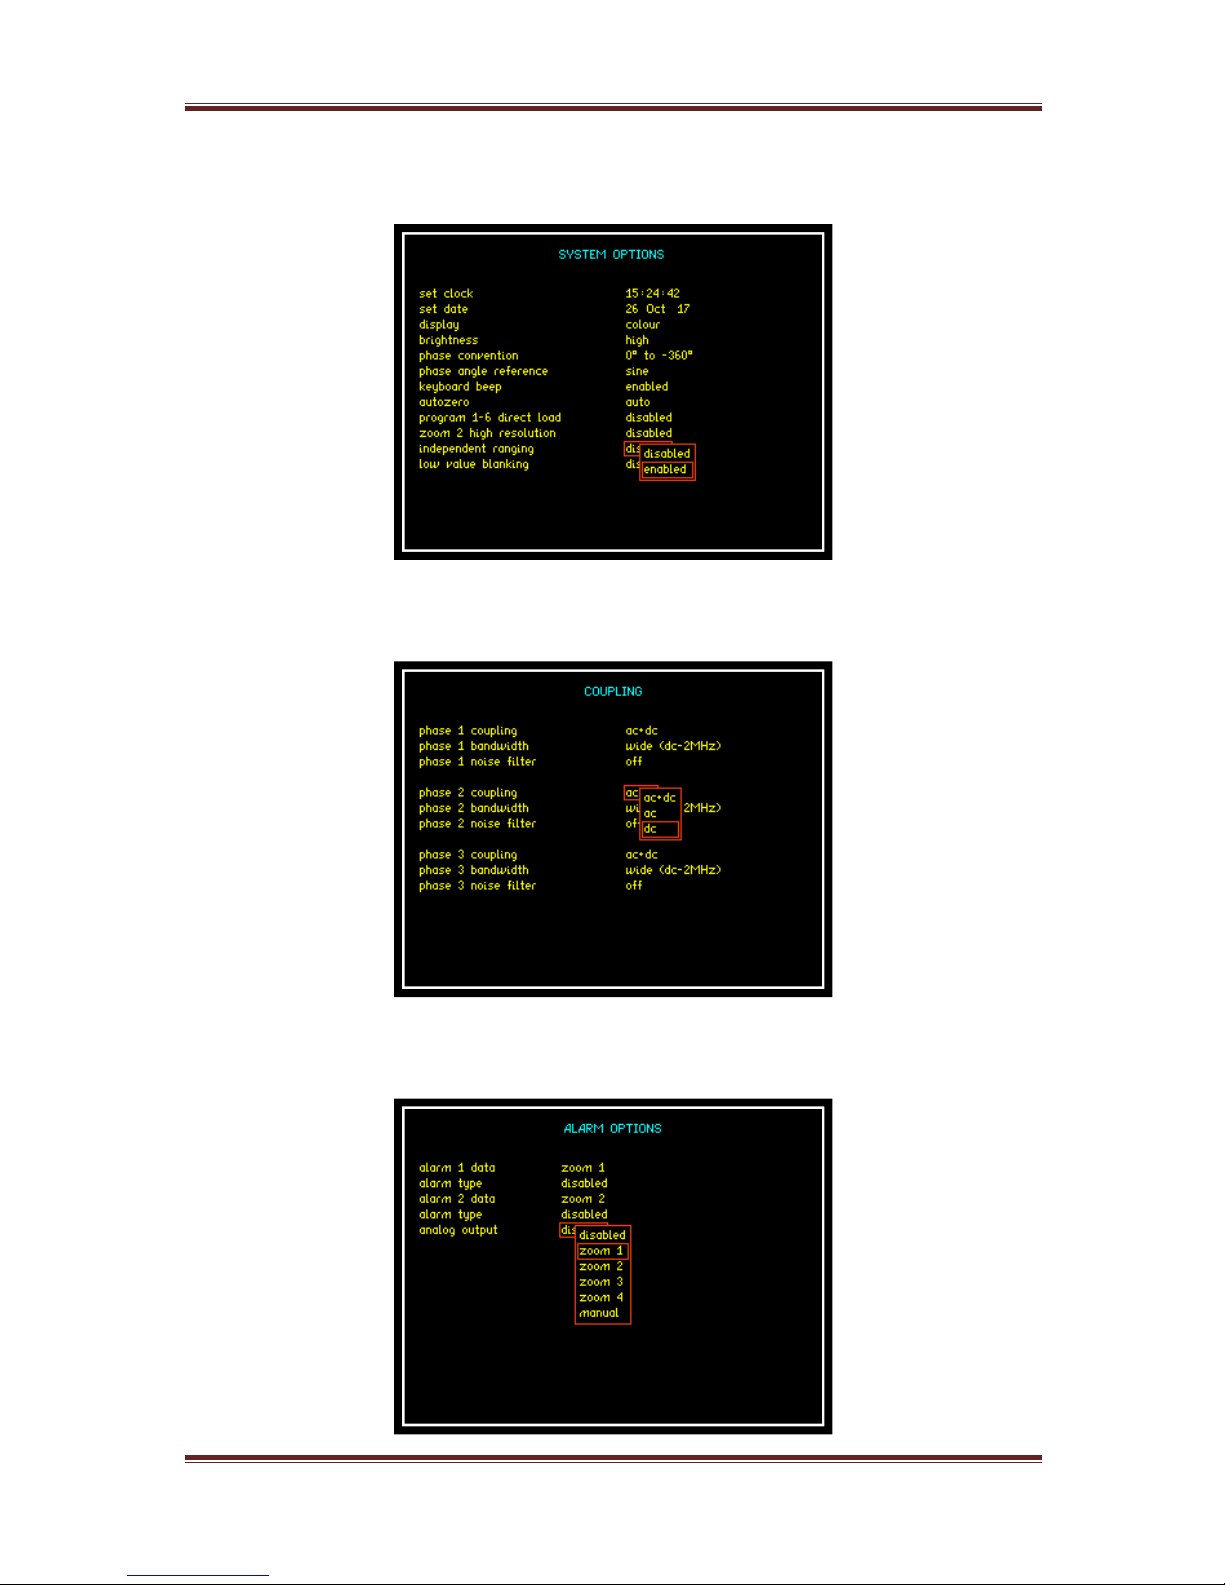
Press the SYS button and enable Independent Ranging.
Press the COUPLING button and set Phase 2 coupling to DC.
Press the ALARM button and set the “Analog output” option to ZOOM 1.
Page 43
PPA45xx Quick User Guide
Page 42
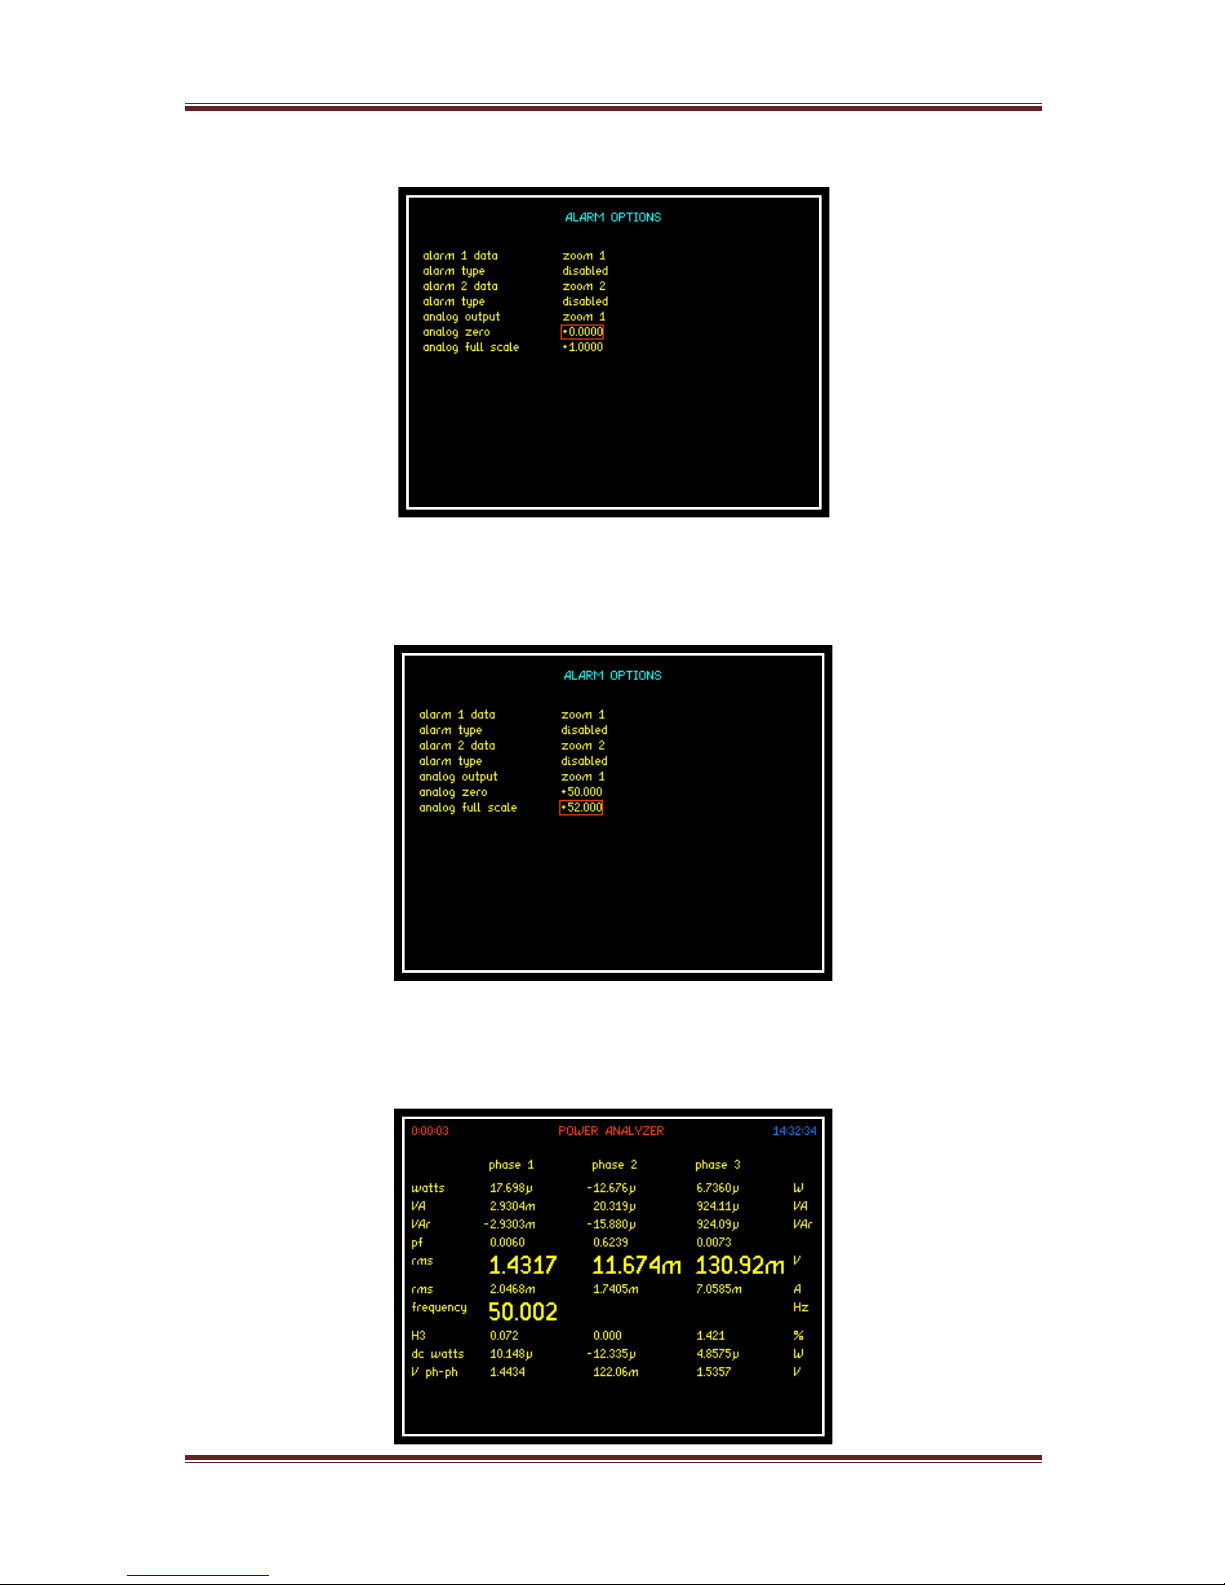
This will display the Analogue Output settings.
Enter a value of 50 for Analogue Zero.
Enter a value of 52 for Analogue Full Scale.
Press the HOME/ESC button to return to the Power Analyzer display.
Press the ENTER / NEXT button 4 times to display all phases at the same time.
Page 44

PPA45xx Quick User Guide
Page 43
Results
Phase 1 on the PPA display indicates the Frequency and RMS voltage levels of
the signal being monitored.
Phase 2 indicates the voltage present on the Analogue Output connector on the
rear of the PPA.
Phase 3 is not used.
Example 1.
The Input signal frequency was set to 50.5Hz.
The frequency displayed on the PPA was 50.512Hz.
Analogue Output = 10V x (measured – zero) / (full scale – zero)
Analogue Output = 10V x (50.512 – 50) / (52-50) = 2.56V
Example 2.
The Input signal frequency was set to 51.5Hz.
The frequency displayed on the PPA was 51.508Hz.
Analogue Output = 10V x (measured – zero) / (full scale – zero)
Analogue Output = 10V x (51.508 – 50) / (52-50) = 7.54V
Page 45
PPA45xx Quick User Guide
Page 44
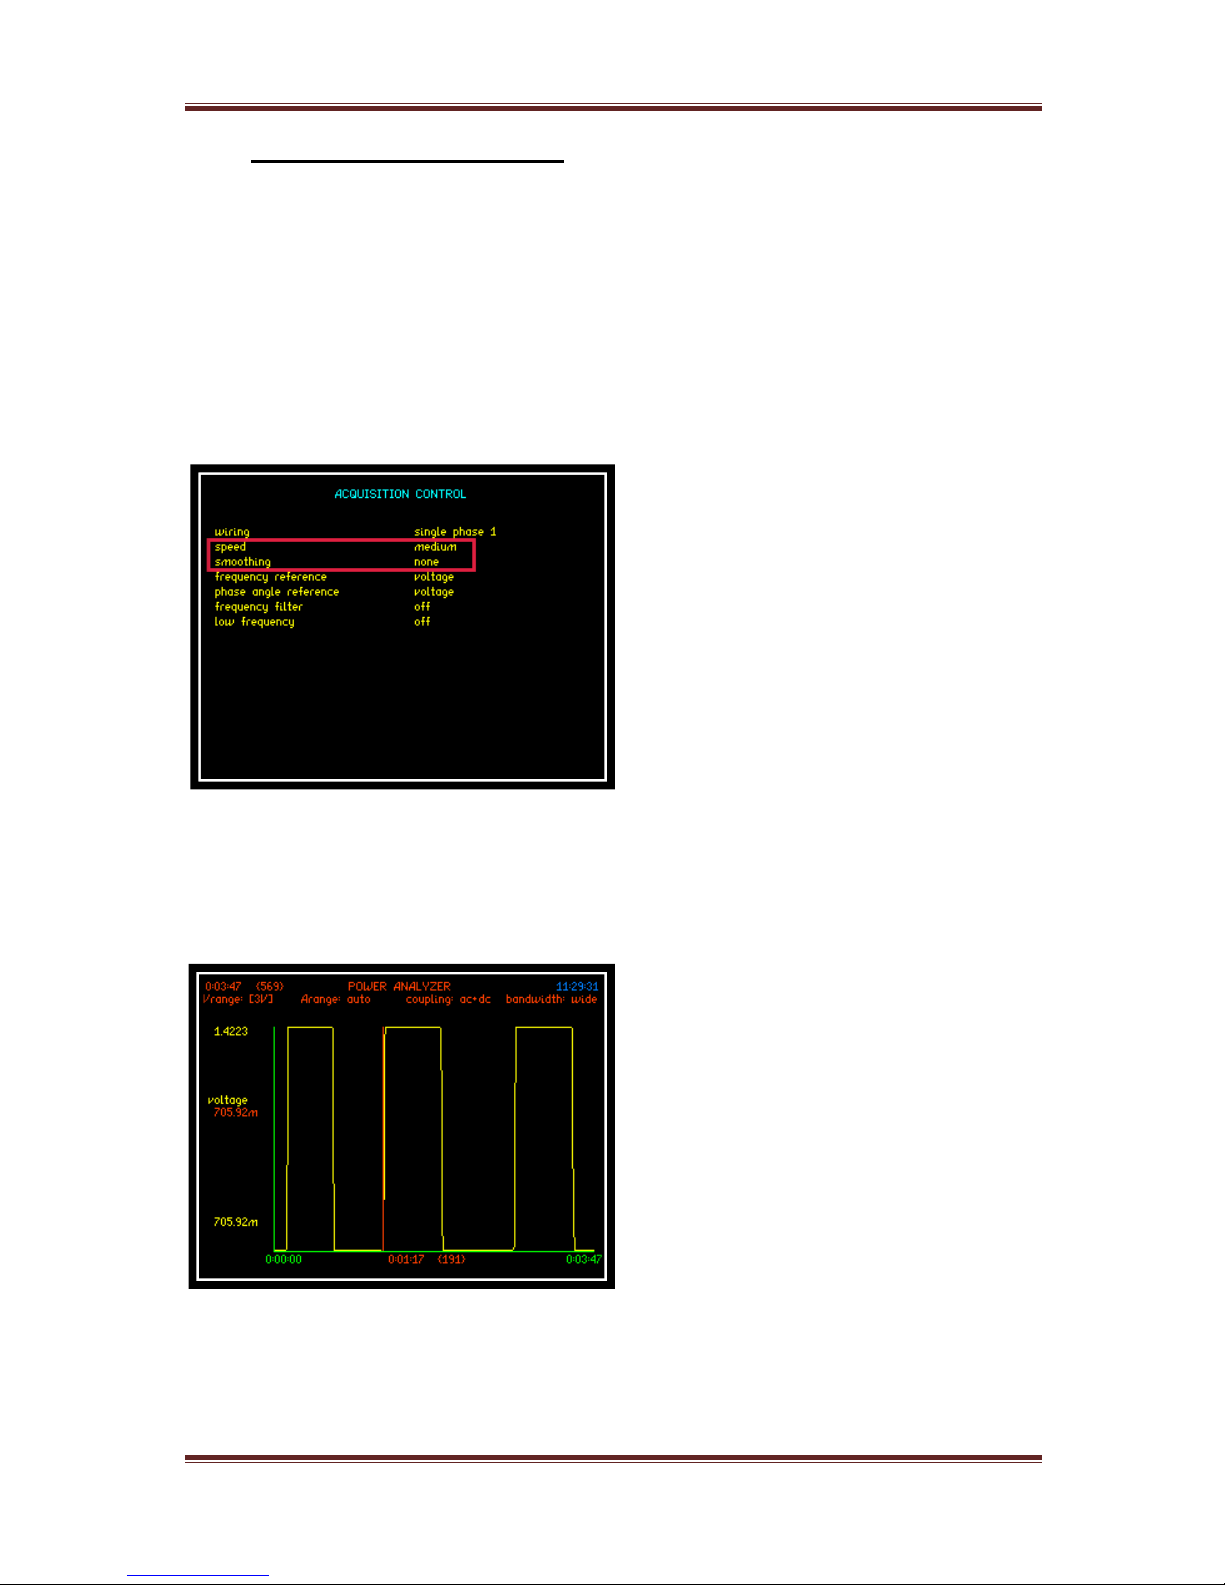
6.4 SPEED AND SMOOTHING
Within this section we will look at how the speed and smoothing parameters set
within the Acquisition menu affect the measurement results
NOTE: All measurement windows must have an integral number of cycles within
it to calculate correct RMS and Harmonics
Input = 50Hz Sine Wave
Amplitude = 1Vpk & 2Vpk range
The first sets of results are from a
Datalog conducted with NO
smoothing selected thus the data
update will be dictated by the speed
parameter only
Speed set to medium = 3 updates
per second
50Hz input signal = 50 cycles worth of data points per second recorded,
analyzed, adjusted and displayed within 3 update windows
Displayed left is the graph showing
the Datalog results with no
smoothing present and the input
amplitude switching between 1Vpk
and 2Vpk from this graph it is clear
that as soon as the amplitude is
increased or decreased then the next
available update will show this
change
Page 46
PPA45xx Quick User Guide
Page 45
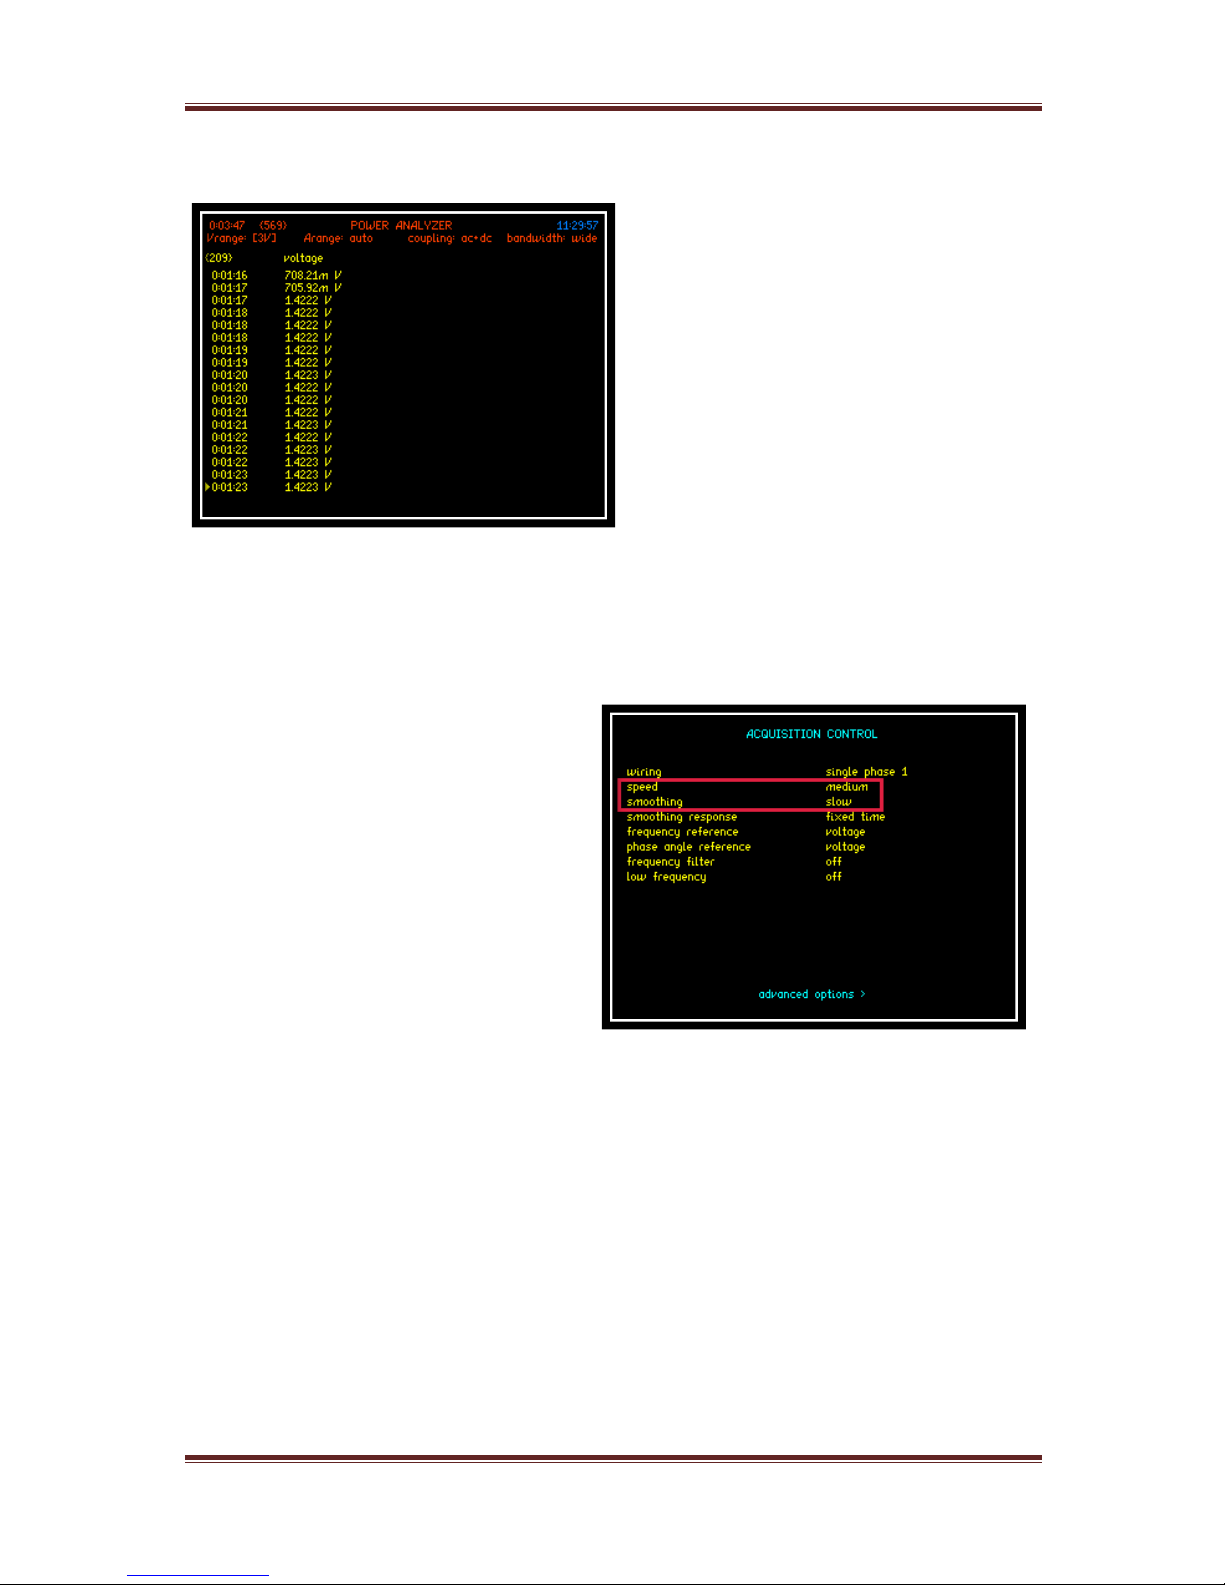
The table of results displayed are in
relation to the previous graph; and we
can see that the voltage step is
immediately recorded after 0:01:17
The next sets of screenshots are for the same set up but with smoothing
activated
Selecting smoothing will take the
data and apply the equivalent of a
single pole low pass filter with an RC
time constant relative to the selection
mode dependent upon the speed
selected
We have selected “SLOW” smoothing
with a medium speed giving us a
sliding window of 48 seconds
Smoothing response can be set to “Auto Reset” where the instrument will reset
the filtering in response to any significant change in data
“Fixed Time” can be selected to correspond with the speed and smoothing
parameters and will override auto-reset so that the smoothing is not reset when
the frequency changes etc
Page 47
PPA45xx Quick User Guide
Page 46
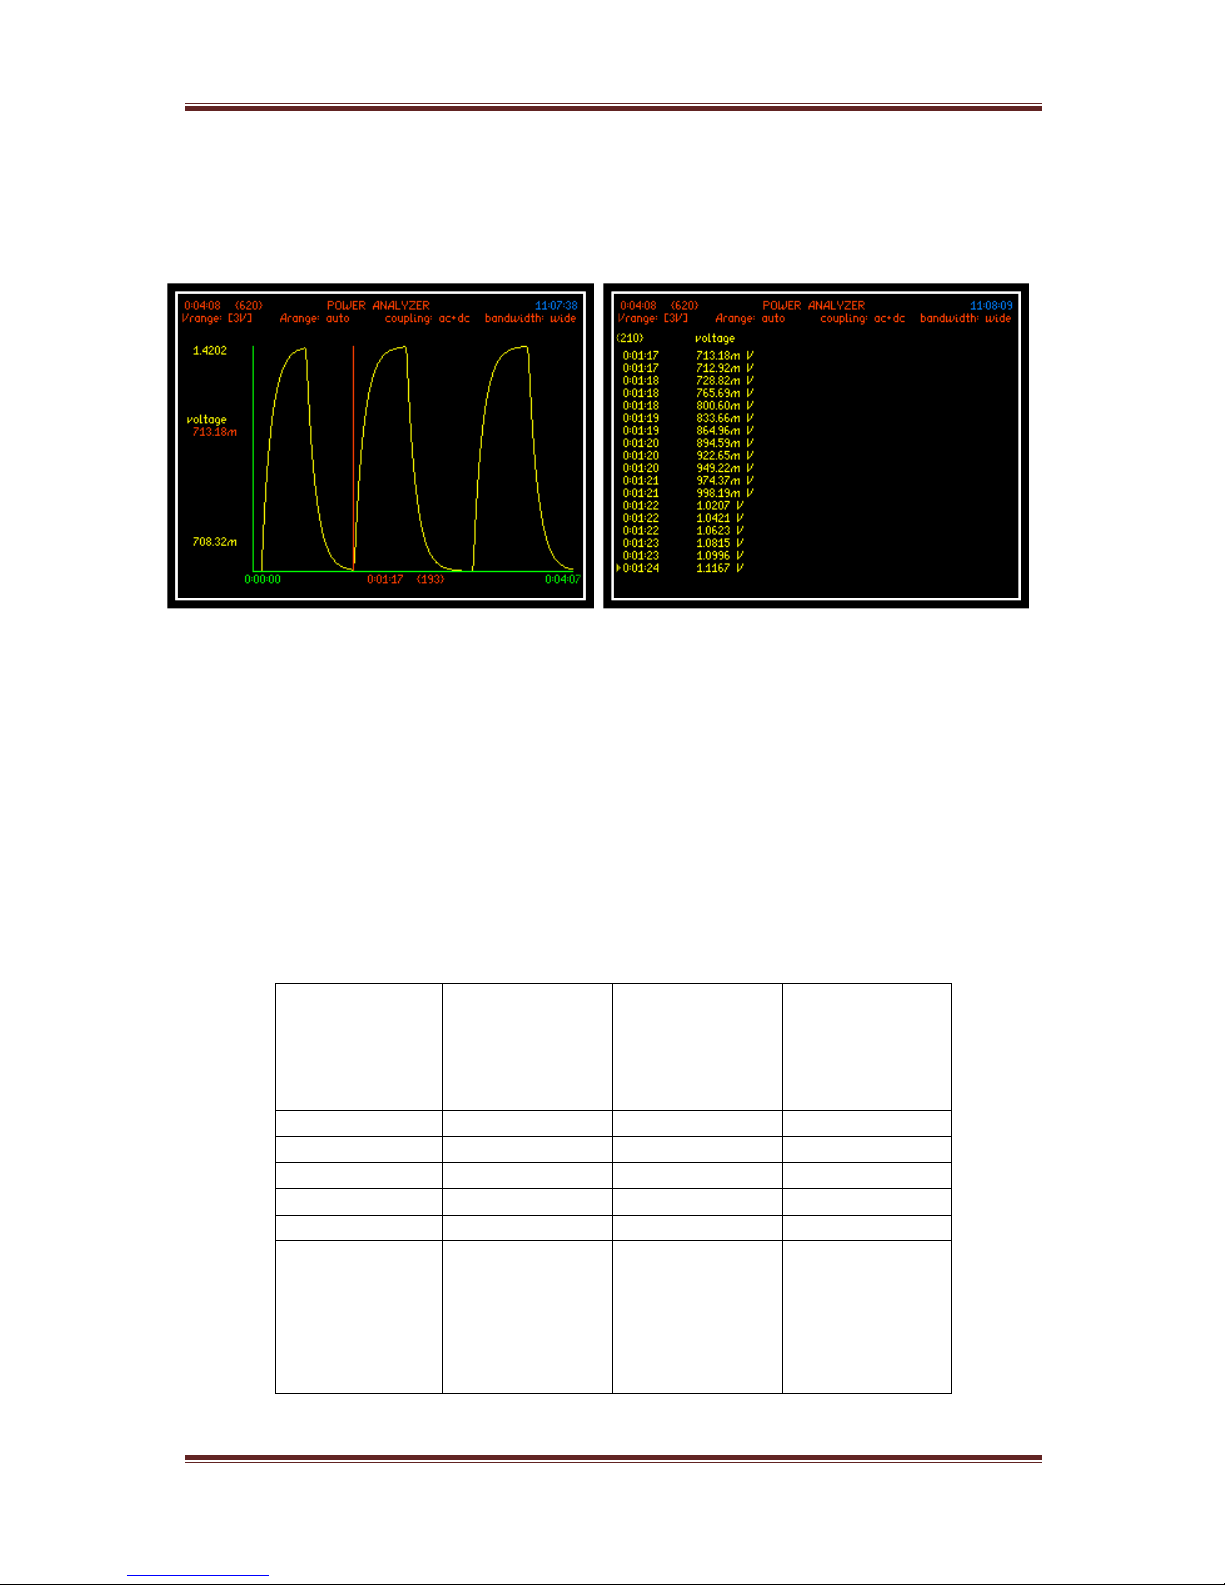
The resulting graph and results table with smoothing applied are displayed
below;
The displays above show how with smoothing applied, the data is smoothed out
over the resultant timescale and displaying an intermediate value for every
update window during the step between the two peak voltage values
Note: each speed parameter has its own time constant for smoothing and data
updates as shown in the table below
Speed
Update
Rate:
(speed only)
Normal
Smoothing:
applicable to
relevant
speed
Slow
Smoothing:
applicable to
relevant
speed
Very Slow
10s
48s
196s
Slow
2.5s
12s
48s
Medium
0.333s
1.5s
6s
Fast
0.05s
0.2s
0.8s
Very Fast
0.0125s
0.05s
0.2s
Window
Manually
Input speed
setting
different to 5
pre selected
one’s above
Page 48
PPA45xx Quick User Guide
Page 47
6.4.1 EFFICIENCY
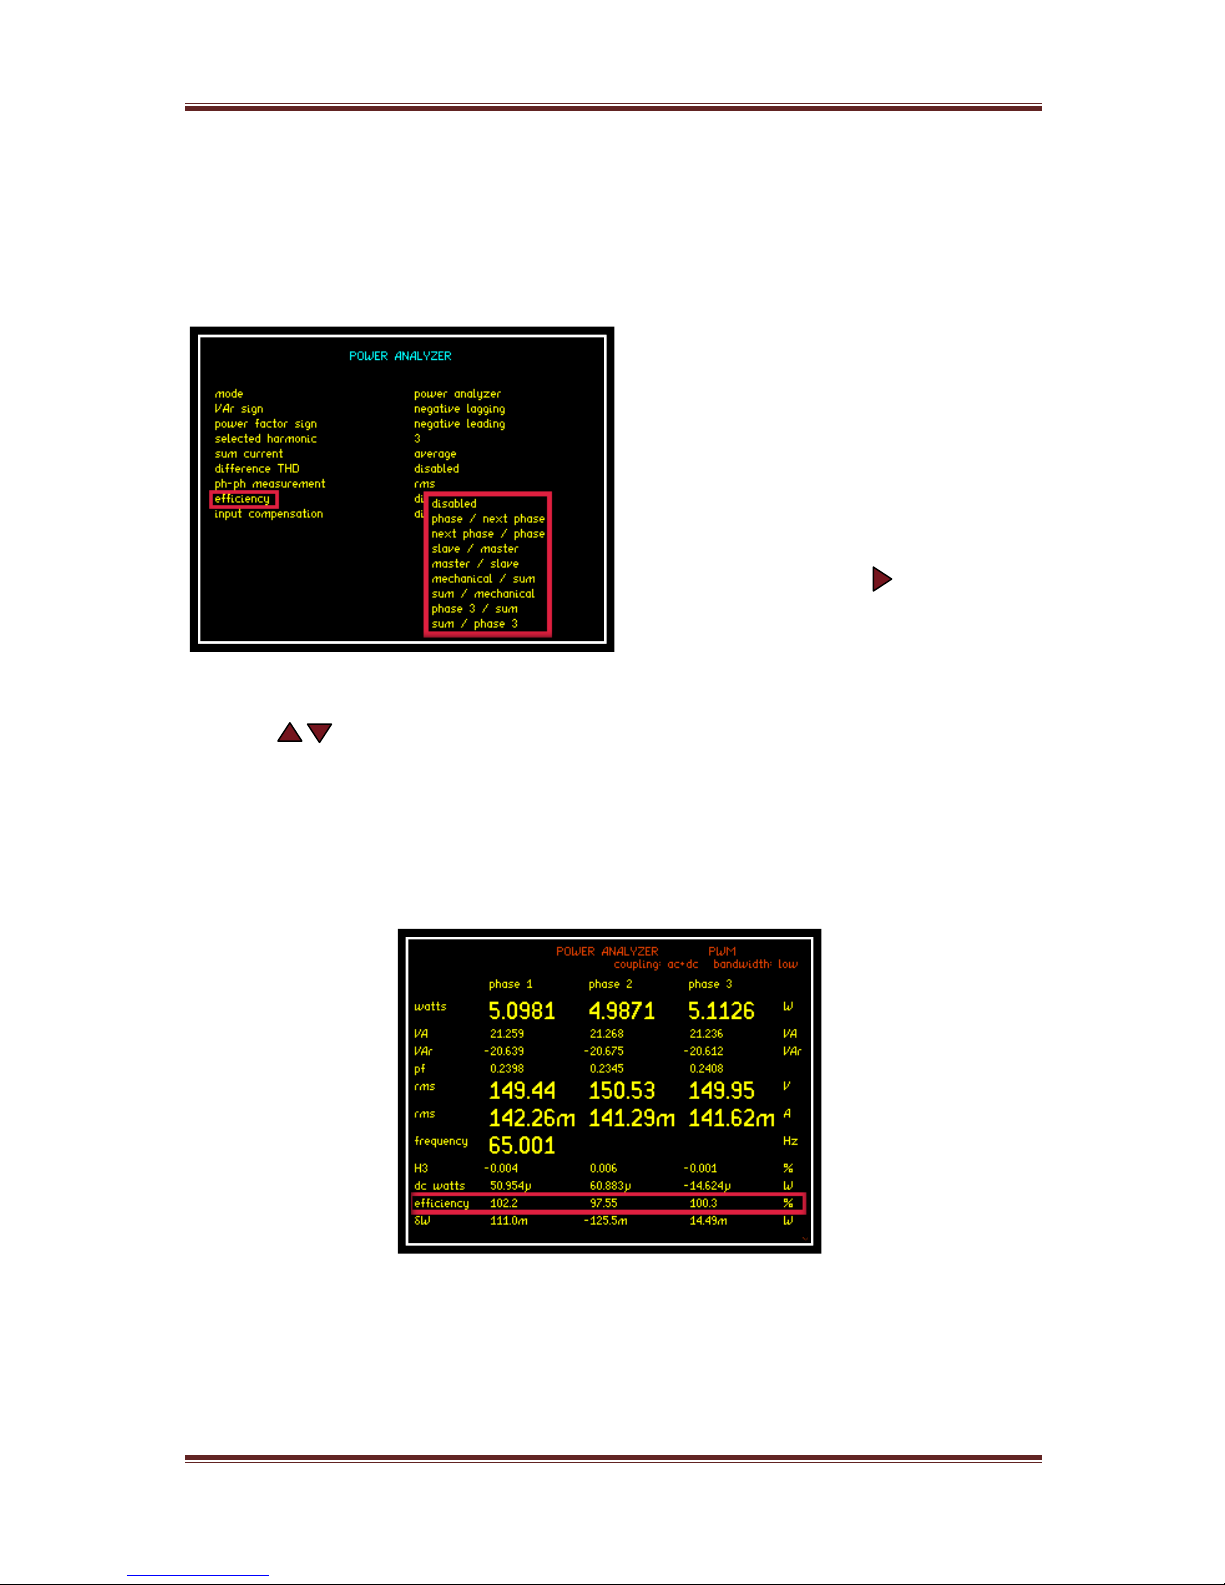
The “Efficiency” mode will compute and compare the data results from any of the
configurations shown within the screenshot below
To select the “Efficiency” parameter
from any application mode.
Access the Power Analyzer home
screen and press “POWER” this will
take you into a sub menu.
Scroll down to the efficiency
parameter and press this will open
up all available configurations as
shown
Use the buttons to move through the configurations and press “ENTER” to
select and confirm
Press “HOME” to return to the Power Analyzer display screen
The results will then be displayed at the end of the Power Analyzer home screen
as shown
Page 49
PPA45xx Quick User Guide
Page 48
6.5 APPLICATION MODES
Within this section we will look at all the different application modes selectable
from within the PPA45xx APP MENU, with the aid of screenshots and instructions.
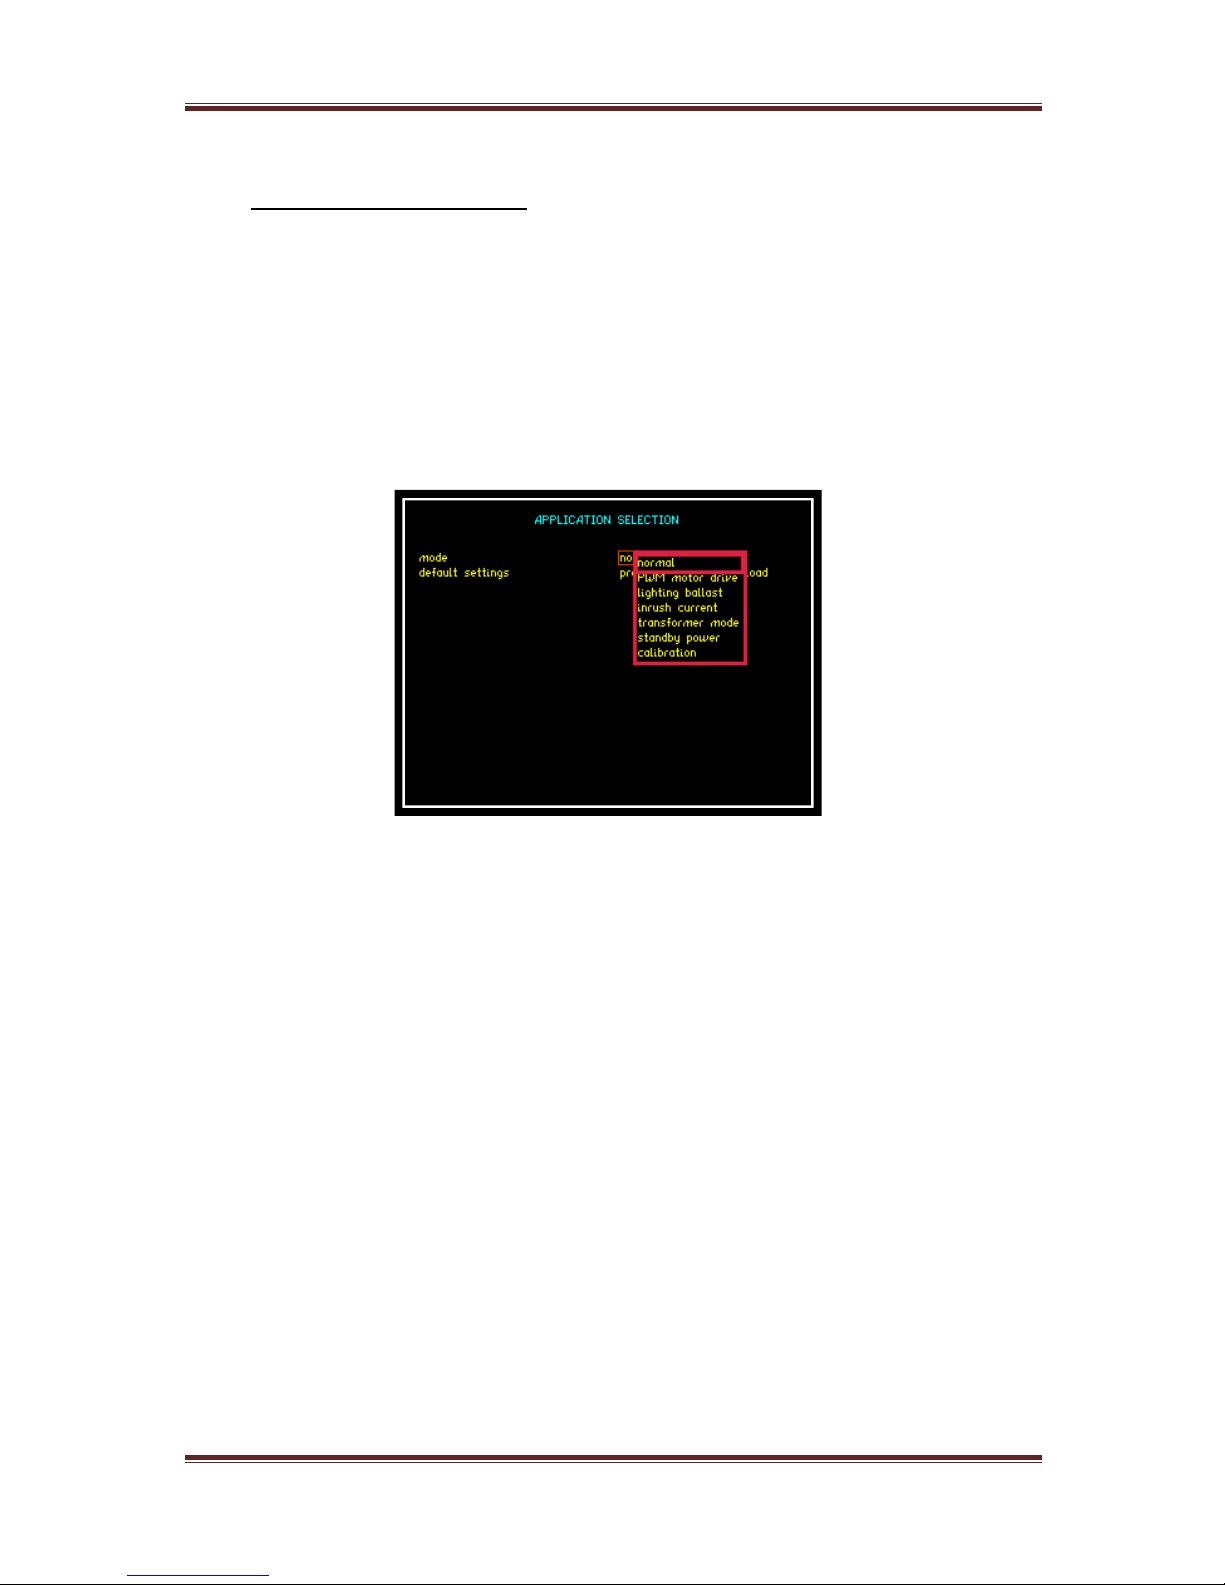
To select your measurement application you will need to activate the “APP”
button. Use the down arrow to select mode / function then press the right arrow
to open up the drop down menu
In the following sub sections we will look into and describe how each application
mode is set up and configured to enable the user to get the maximum benefit
from the PPA45xx
Page 50
PPA45xx Quick User Guide
Page 49
6.5.1 PWM MOTOR DRIVE MODE
The nature of the waveforms produced in a PWM motor drive application makes
measurement of the fundamental frequency difficult. In this section we will look
at the switching and fundamental frequencies and how frequency lock and filters
will allow the correct measurements to be displayed on such a complex
waveform
Test device: 1 x Inverter/Motor test unit (set at 65Hz)
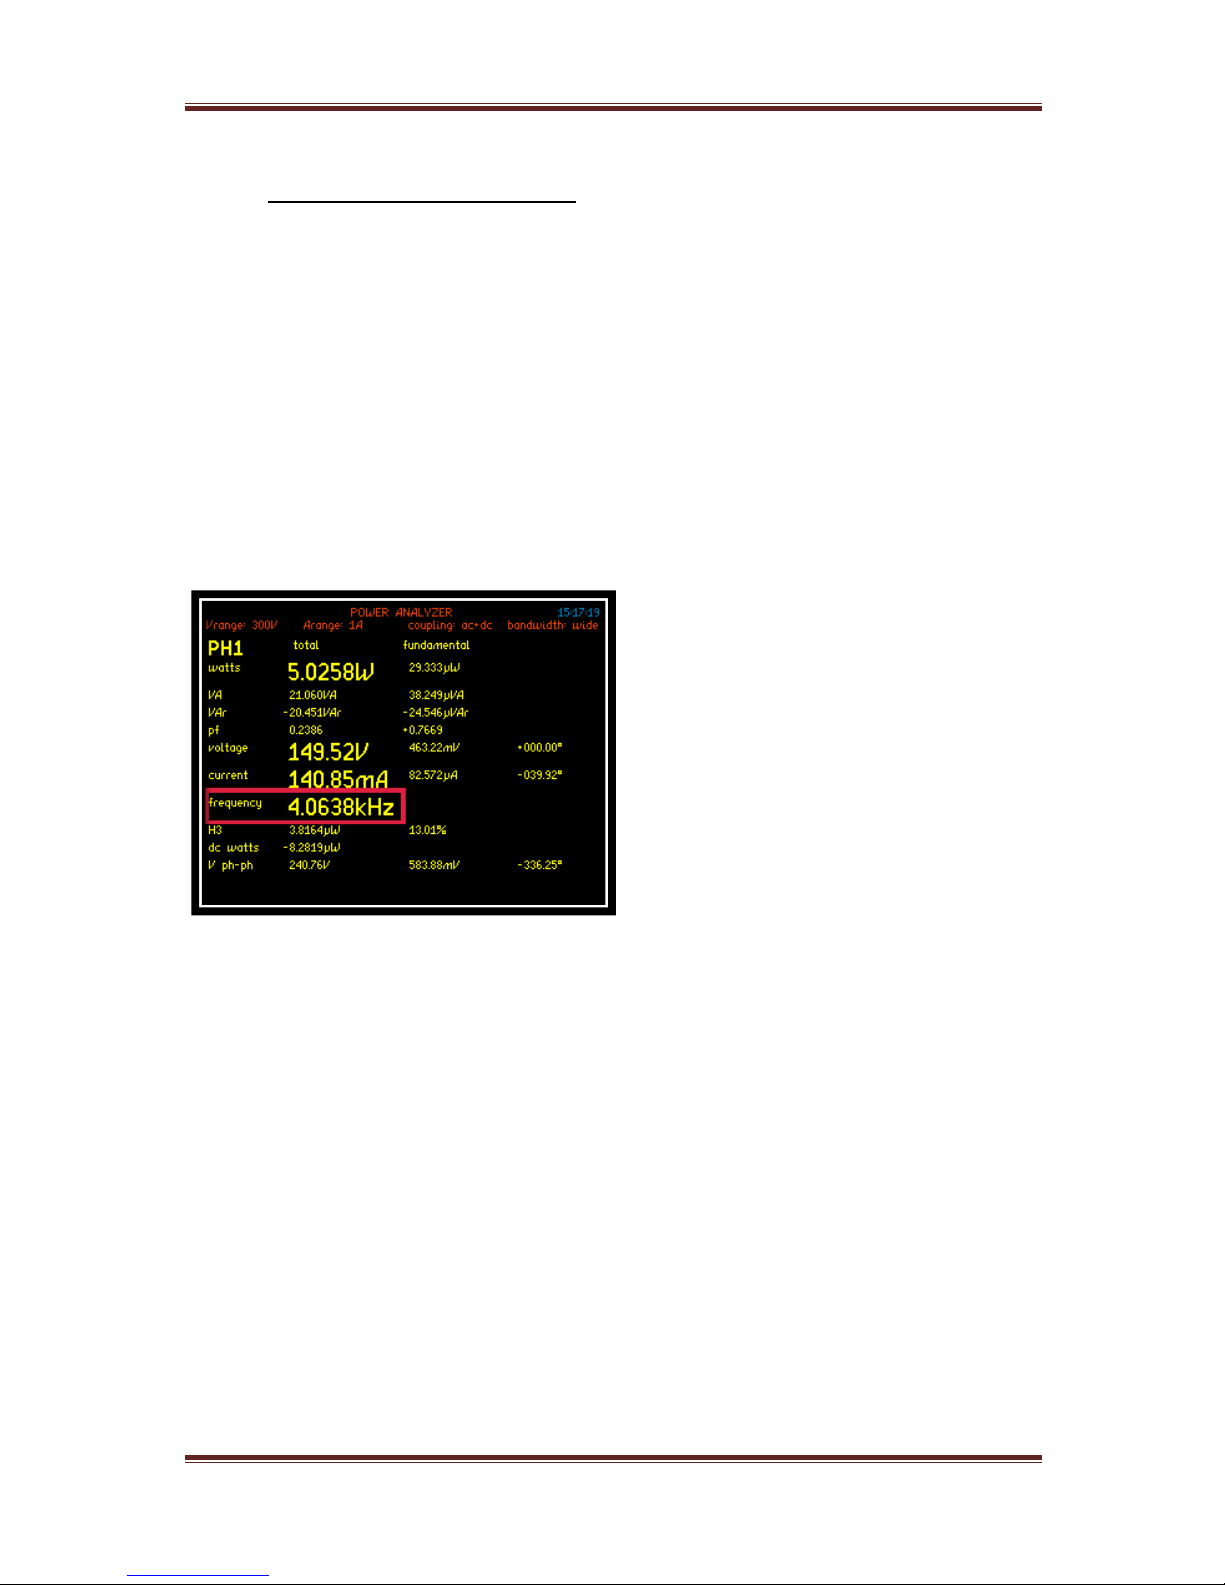
Leaving the PPA45xx in “normal” app mode take note of the frequency
measurement
In “normal” app mode the PPA45xx is
locking onto a switching frequency /
high frequency noise of 4 KHz with no
filtering applied. This can be used as
a guide when selecting a frequency
filter from within the PWM motor
drive application
Page 51
PPA45xx Quick User Guide
Page 50
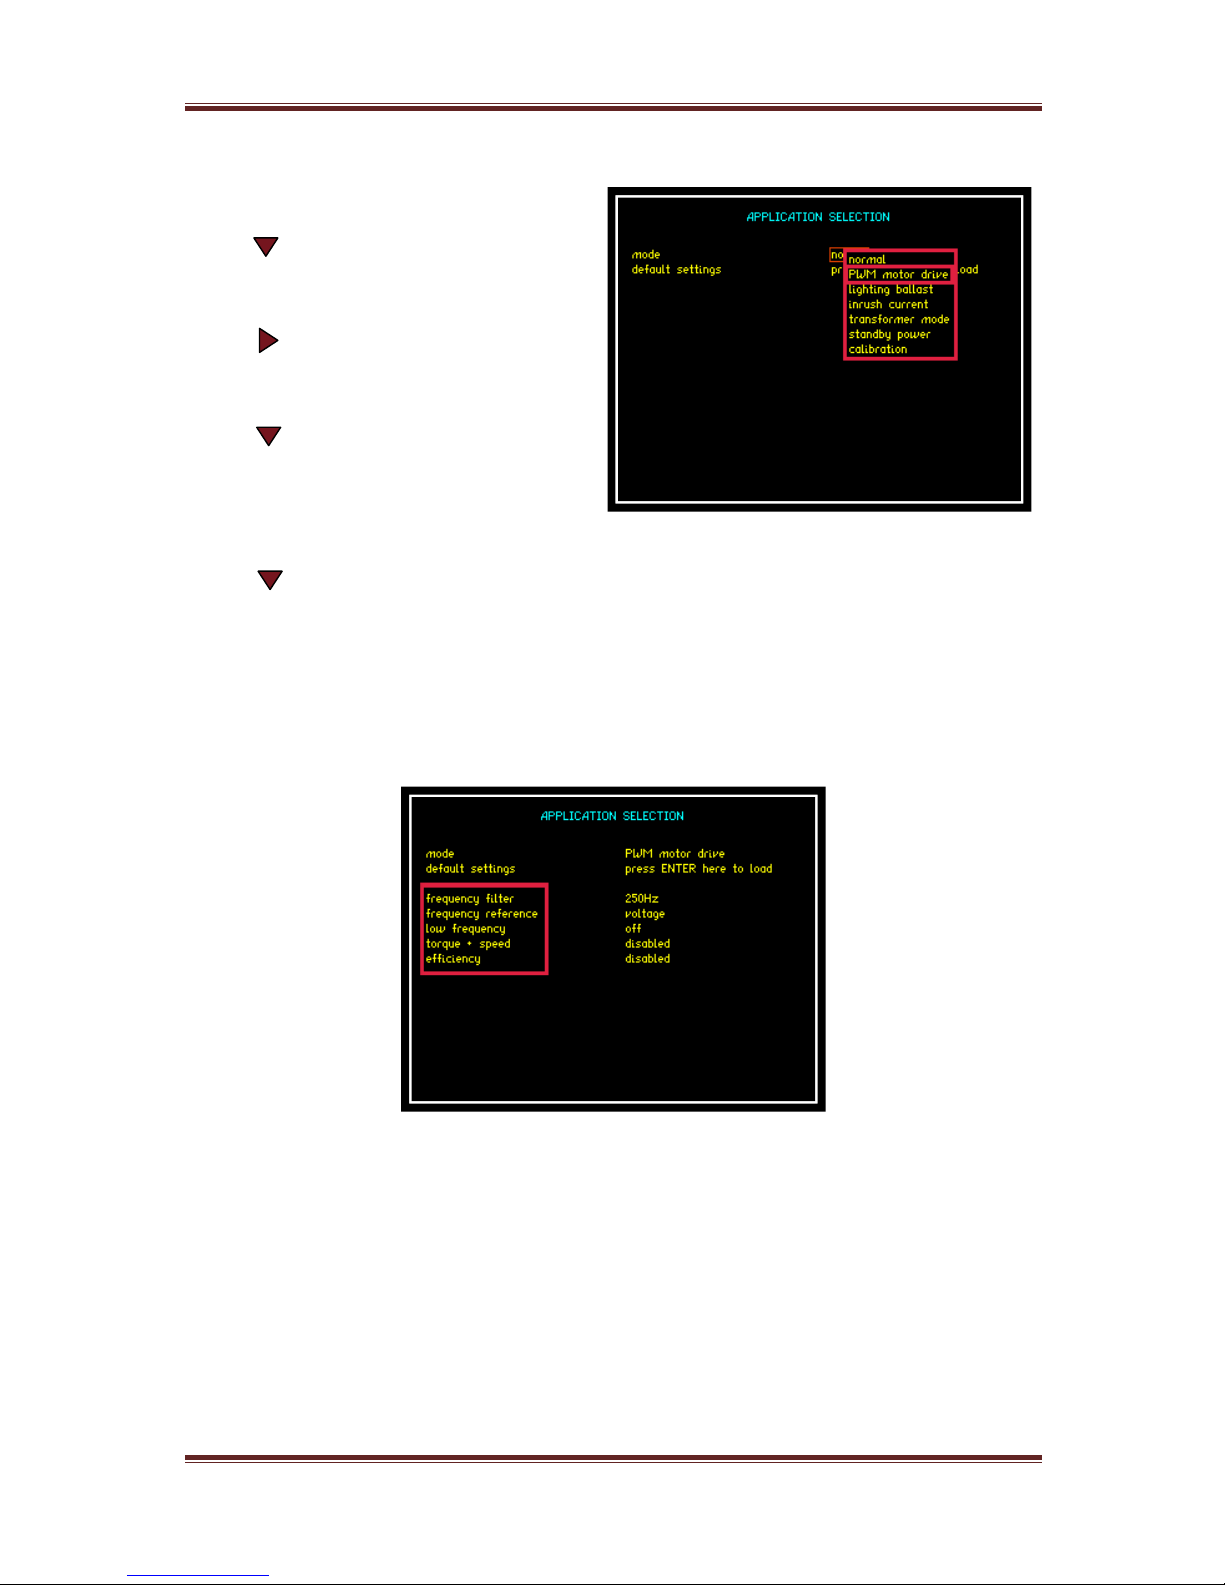
To access PWM motor drive mode:
Press “APP” button
Press Key
Red Box will surround “Mode”
Press Key. This will open
the drop down menu selections
Press Key until red box
surrounds PWM motor drive
Press “ENTER” this will now set the mode
Press Key
Red Box will now surround “Default Settings”
Press “ENTER”
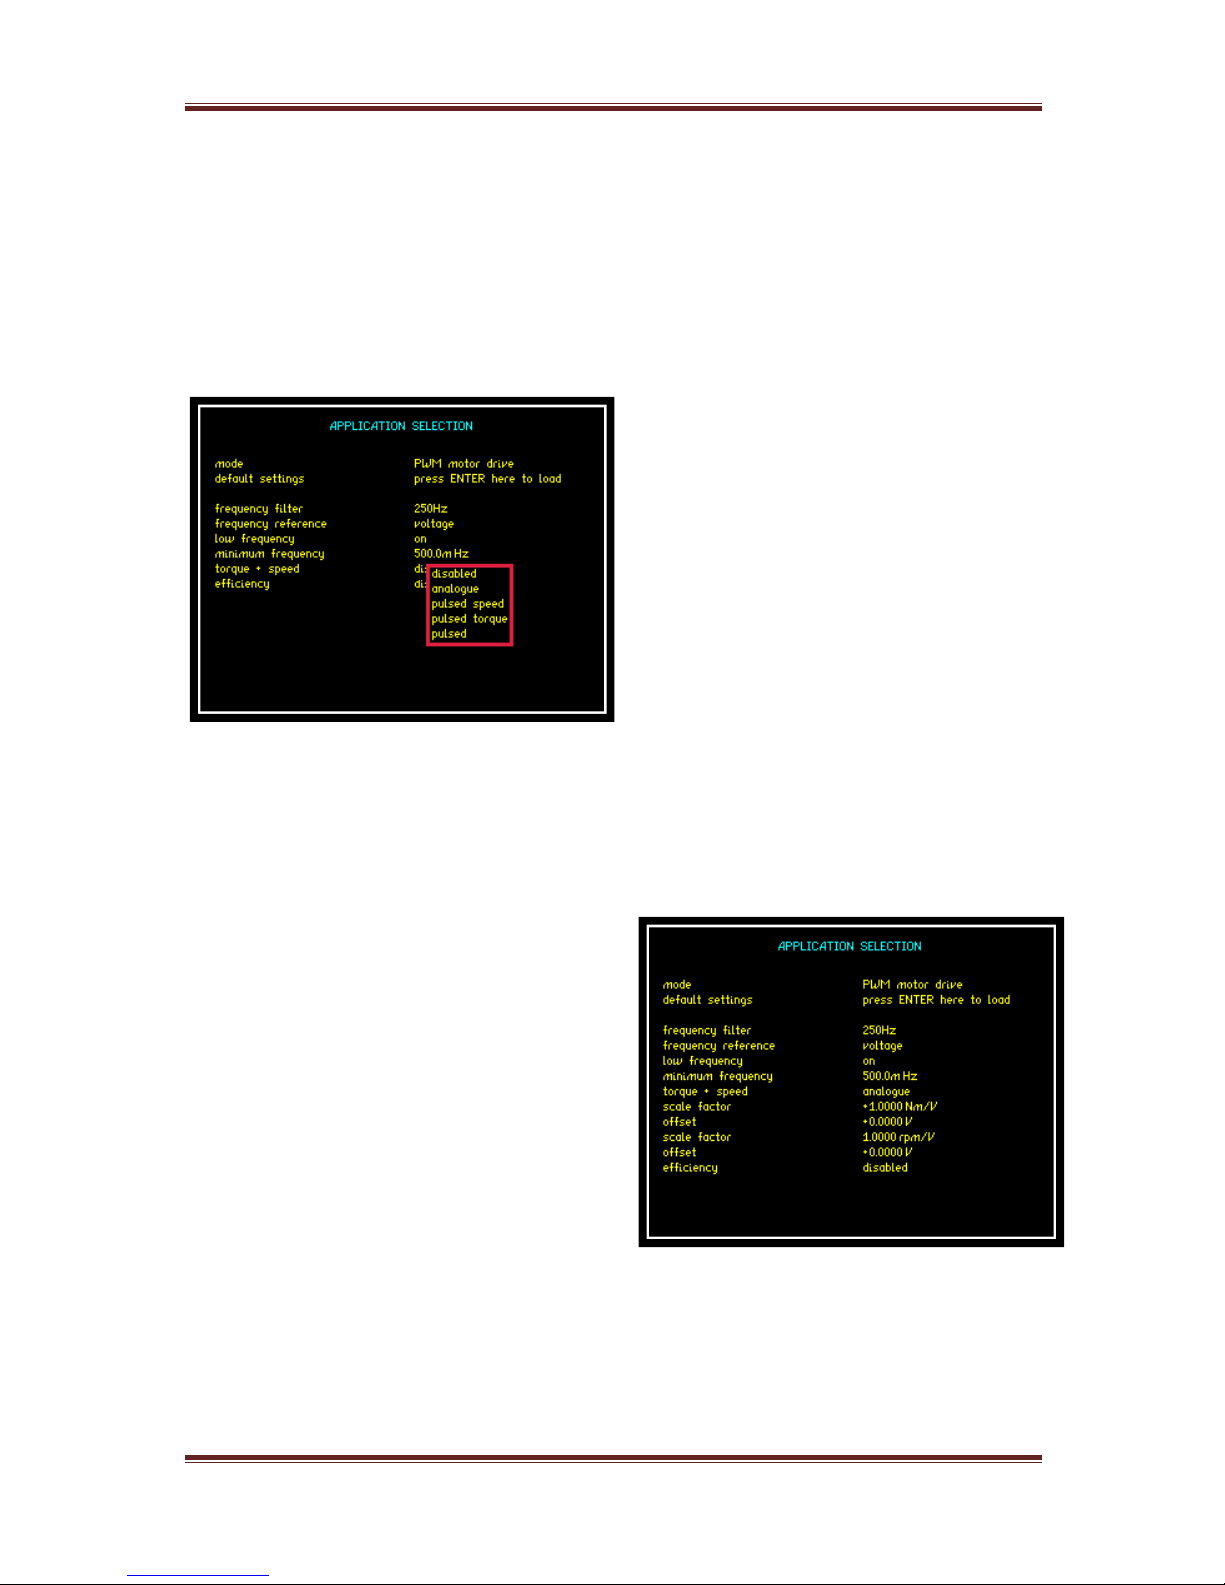
When default settings have been activated it will allow 5 further parameters to
be configured as shown
Frequency filter:
Selectable filter from drop down menu. Select a frequency whose range is
between the Fundamental Frequency and the Switching Frequency but closer to
the fundamental. In this test we have set the inverter to a fundamental
frequency of 65Hz so we will select a frequency filter of 250Hz
Note: Do not select a filter too close to the fundamental frequency this may
result in the frequency measurement reading 0Hz
Page 52
PPA45xx Quick User Guide
Page 51
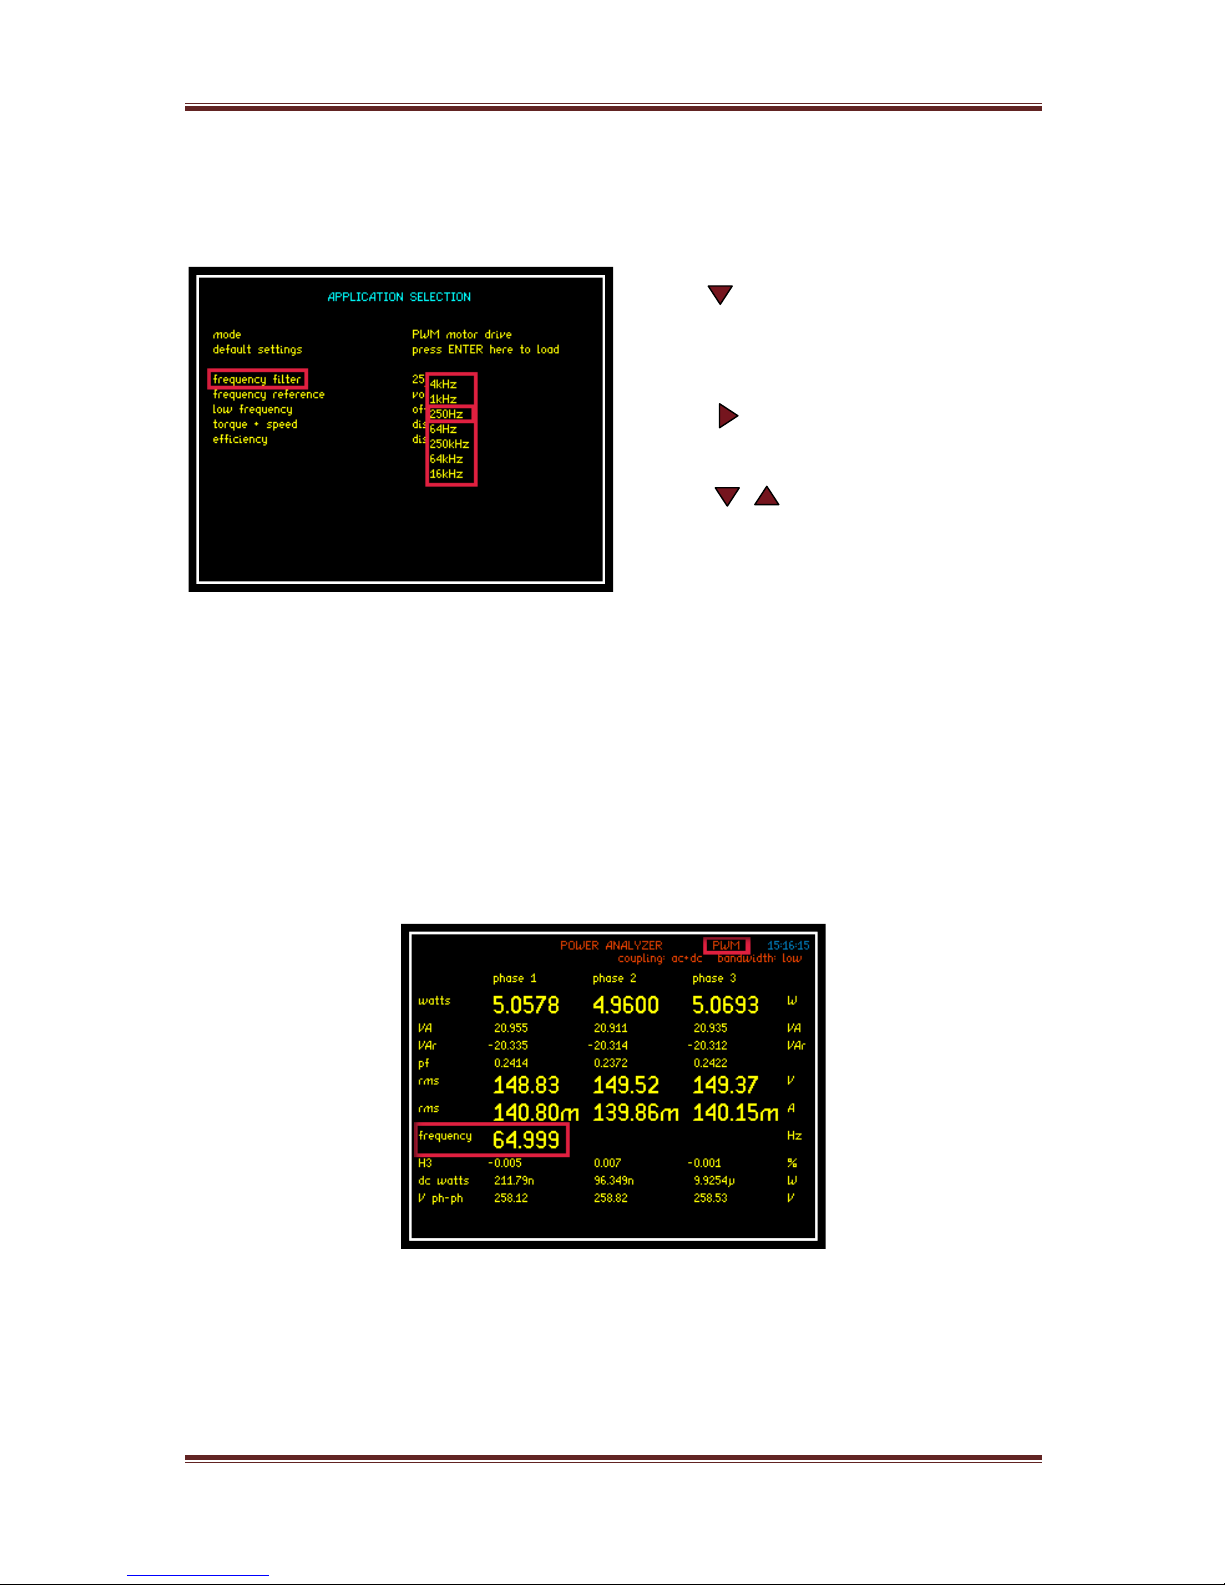
Setting the frequency filter:
Press 2 times
Frequency filter parameter will be
selected
Press Drop down box will open
with all available frequency ranges
Press arrows to select
frequency filter parameter required
Press “ENTER” to confirm selection
By applying a 250Hz filter within PWM mode we can now see that the instrument
is locking onto the fundamental frequency this is required for correct signal
processing of the waveform
Page 53
PPA45xx Quick User Guide
Page 52
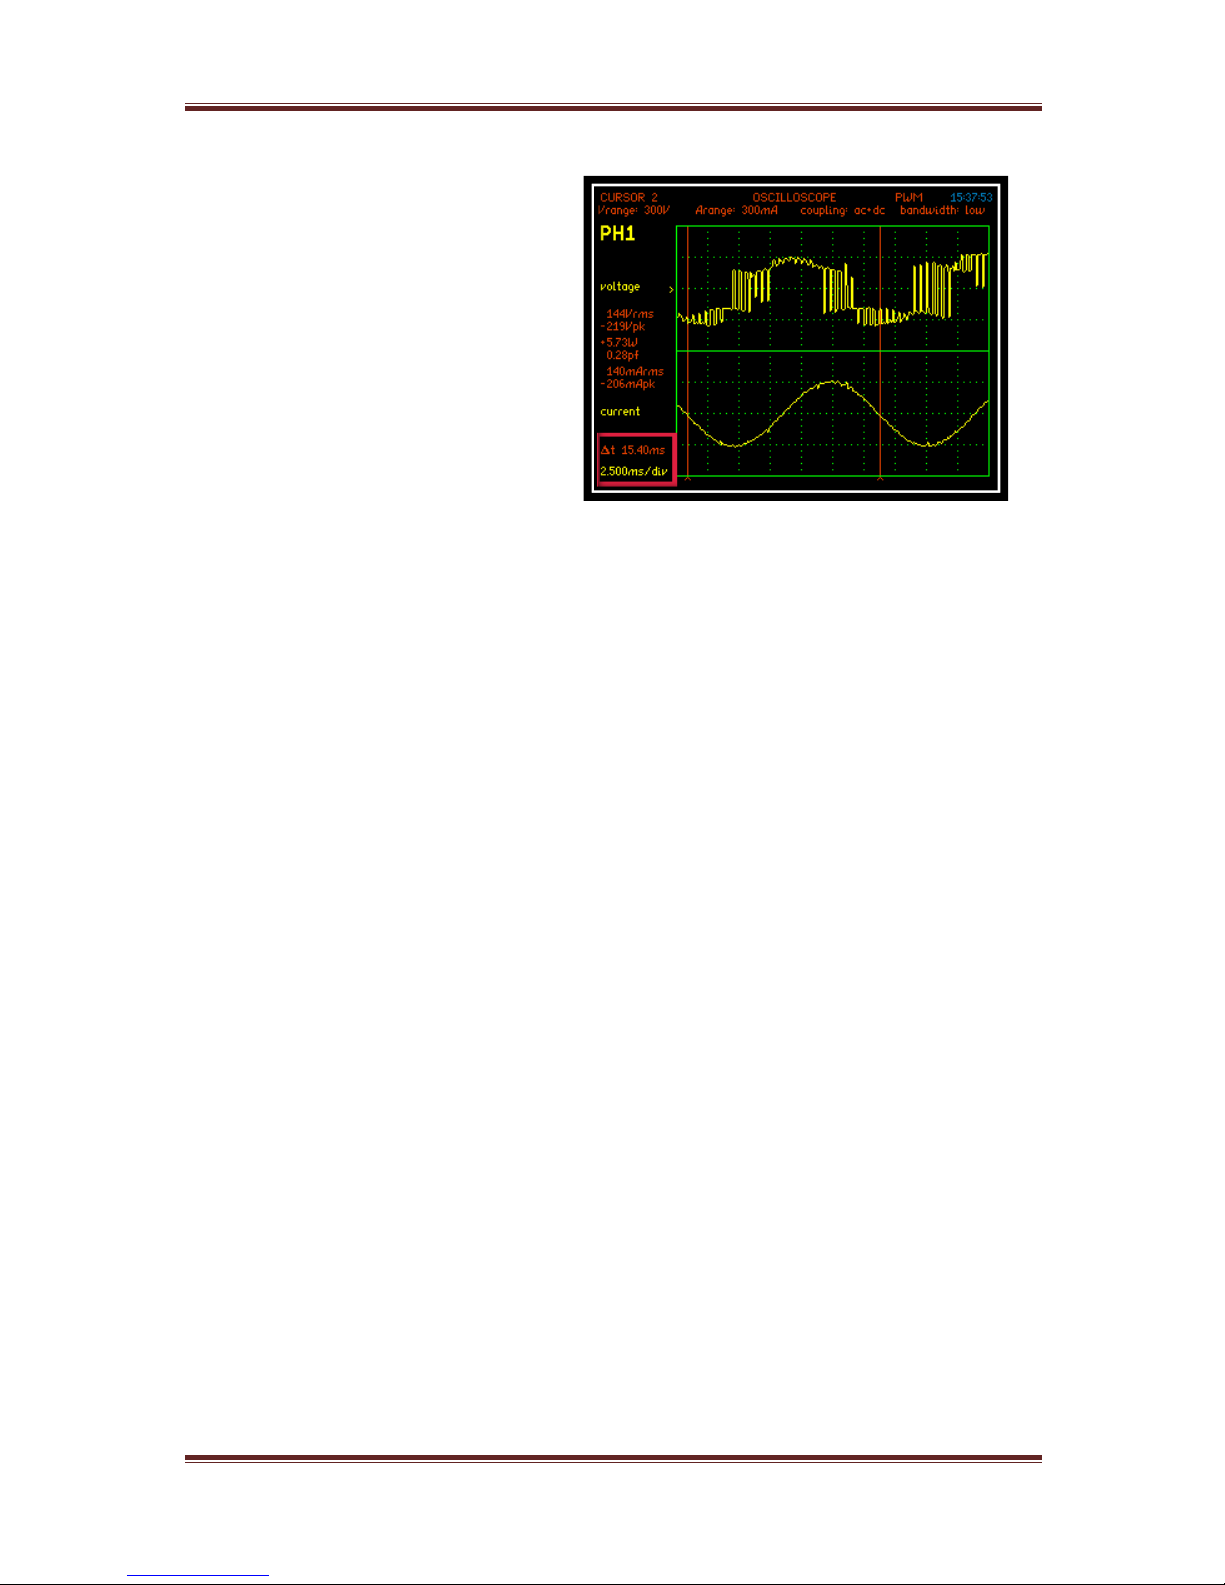
By viewing the waveforms in the
Oscilloscope mode we can see the
switching frequency of the Voltage
and a smoother sine wave Current
waveform
The Current waveform shows the
time for 1 cycle approximately
15.40ms
Therefore 1s ÷ (15.40x
) =
64.9Hz Fundamental Frequency
Frequency reference:
Select from the drop down menu which waveform the fundamental frequency is
to be synchronised with Voltage or Current
Low Frequency:
Set this parameter to ON, switching on will open up the minimum frequency
parameter
Minimum Frequency:
Manually input a value to allow the results window to extend automatically if the
fundamental frequency time period is longer than the time period of the data
window. This is recommended
Page 54
PPA45xx Quick User Guide
Page 53
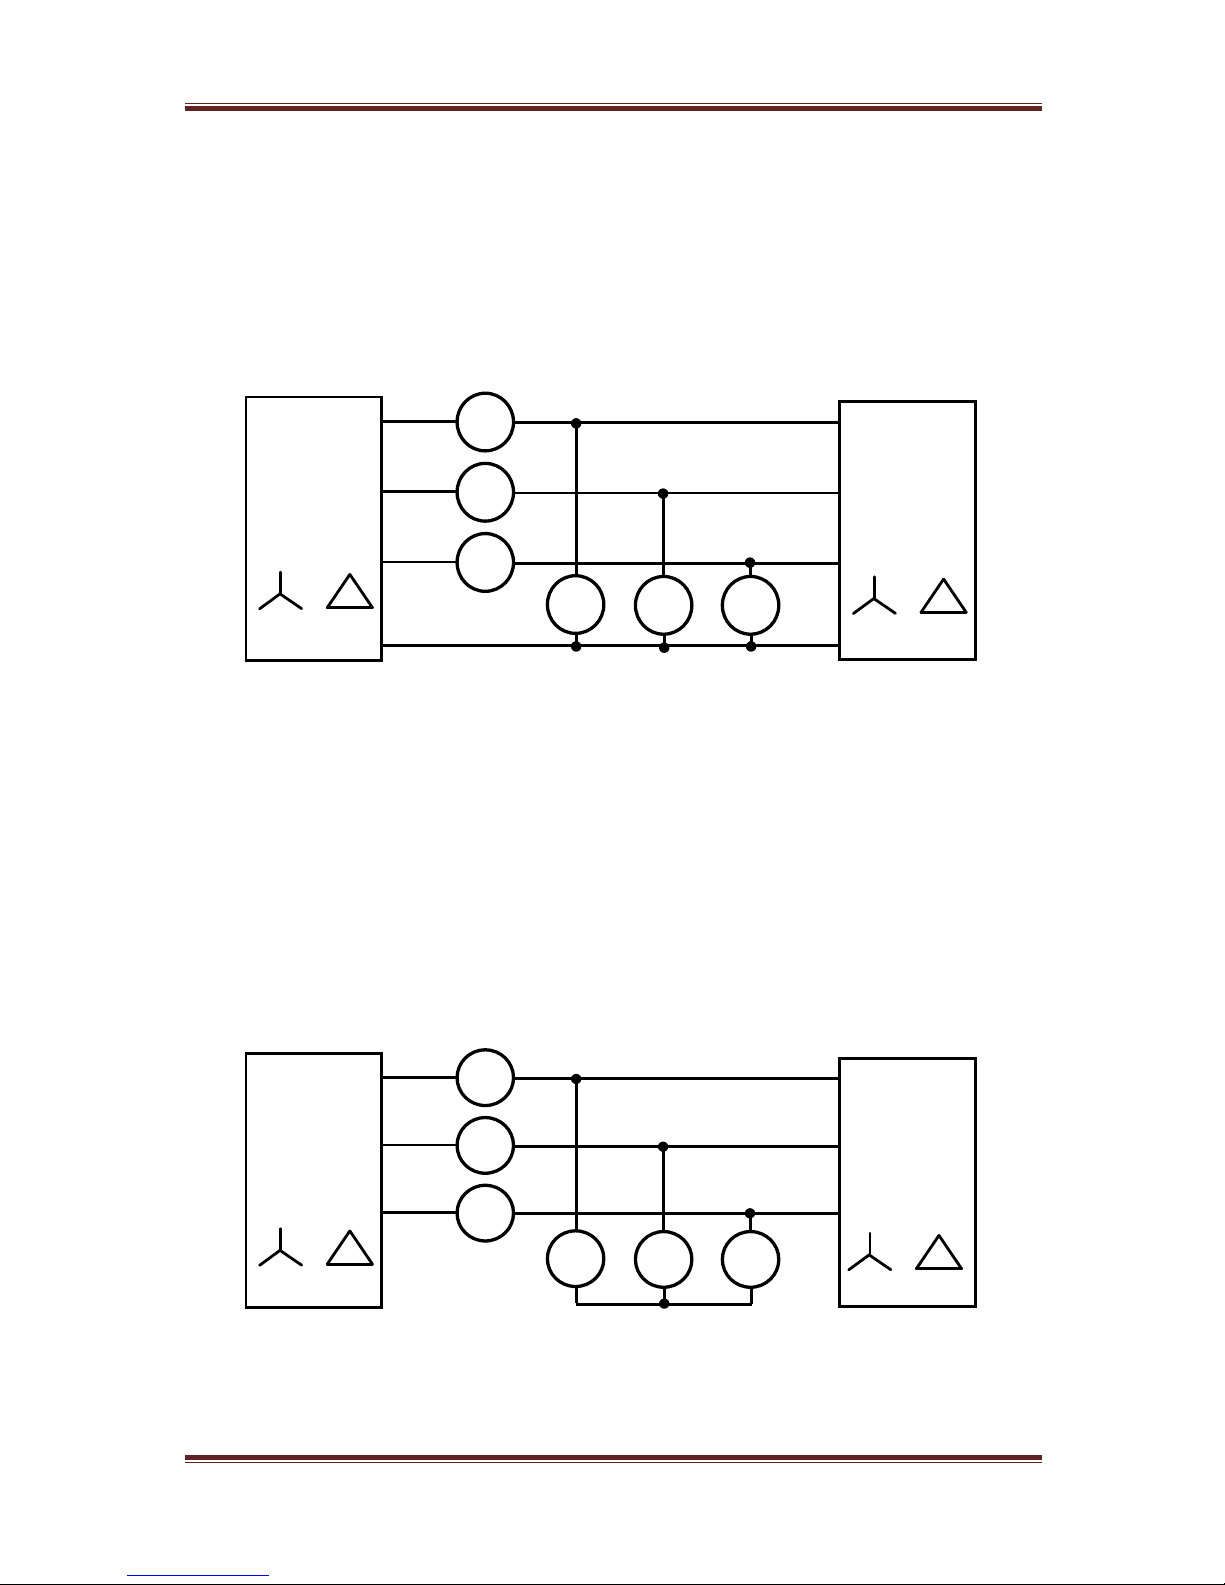
Using the PPA4530 to measure 3 phase power with PWM drives
If there is access to the neutral point (star point) of a star wired load, then
accurate measurements can easily be made by connecting the measurement
channels in star configuration:
In this configuration, the data including rms voltage will be correct for each
phase, and the phase to phase voltage rms can be derived (set conversion to
“phase to phase rms”).
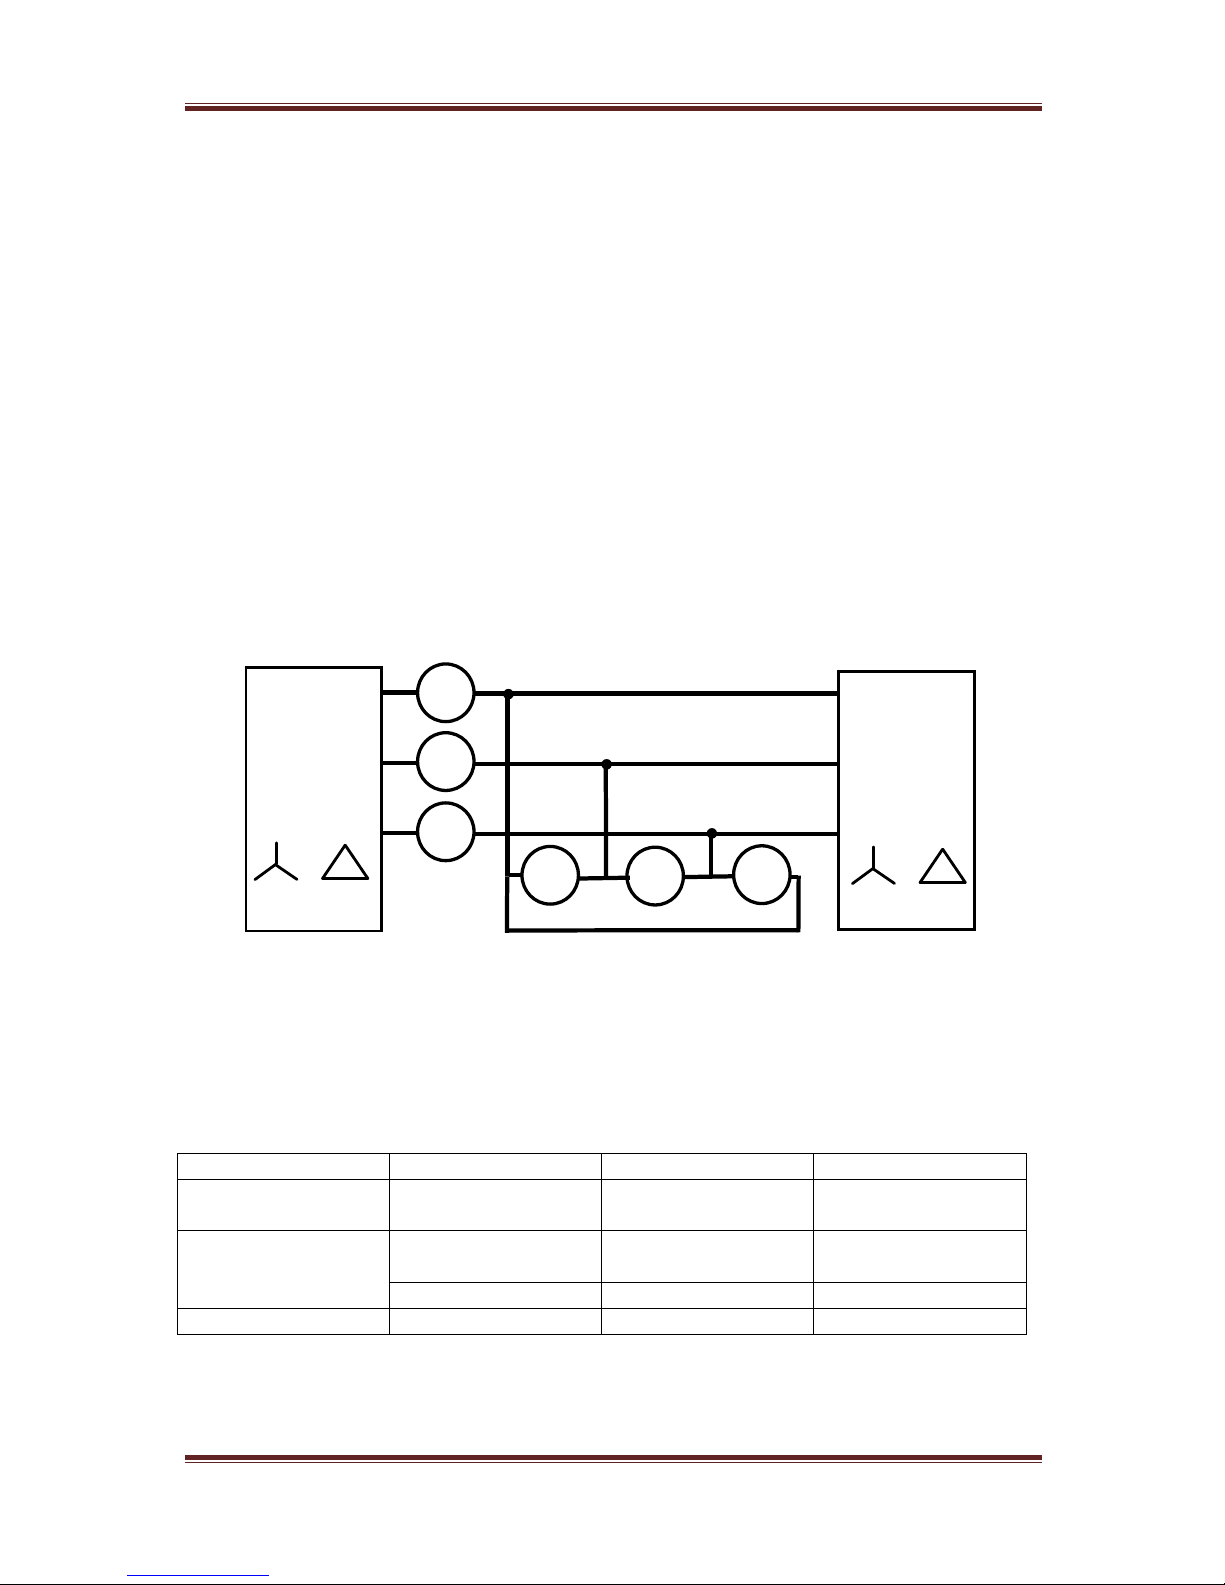
If, however, the neutral point is not available, then the measurement of the
voltage rms is more difficult. The options are to use a synthesised neutral or to
connect in delta configuration and derive the phase measurements.
Consider the synthesised neutral configuration:
Three
Phase
Source
or
ACH1
ACH2
ACH3
Three
Phase
Load
or
VCH1
VCH2
VCH3
LO
LO
LO
HI
HI
HI
HI
HI
HI
Ph1
Ph1
Ph2
Ph2
Ph3
Ph3
LO
LO
LO
Three
Phase
Source
or
ACH1
ACH2
ACH3
Three
Phase
Load
or
VCH1
VCH2
VCH3
HI
HI
HI
HI
HI
HI
LO
LO
LO
Ph1
Ph1
Ph2
Ph3
Ph3
Ph2 N N
LO
LO
LO
Page 55
PPA45xx Quick User Guide
Page 54
When using synthesised neutral, the elementary measurement of the voltage
rms will usually be higher than that measured with a true neutral. For this case,
there is a conversion option “star to delta” which accurately computes the phase
to phase voltages, then derives a phase to neutral value from the computed
phase to phase values. This gives a phase to neutral value which is much closer
to that measured with a real neutral. The phase to phase (or “delta”) value,
Vd(t) is derived from the instantaneous “star” voltage values, Vs(t) (eg. Vd1(t)
= Vs1(t) – Vs3(t)) so the voltage present on the synthesised neutral has no
effect.
Consider the delta wired configuration:
In this case the phase to phase voltages are measured directly and the phase to
neutral values are derived (set conversion to “delta to star”). The power
measurements are also adjusted to show the individual “star” phase powers. The
delta/star conversion assumes that the impedance of the load is equal on all
three phases.
Wiring
conversion
Phase rms voltage
Phase power
Star with neutral
Phase to phase
rms
Measured
Measured
Star without
neutral
Phase to phase
rms
Slightly high
Measured
Star to delta
Derived
Measured
Delta
Delta to star
Derived
Derived
or
ACH1
ACH2
ACH3
or
VCH1
VCH2
VCH3
HI
HI
HI
HI
HI
HI
LO
LO
LO
Ph1
Ph1
Ph2
Ph3
Ph3
Ph2
LO
LO
LO
Three
Phase Source
Three
Phase Load
Page 56
PPA45xx Quick User Guide
Page 55
Torque & Speed:
Set the Torque and Speed parameters to measure the Mechanical Power (Nm)
and Speed (RPM) via the Torque and Speed BNC connectors on the rear of the
instrument
Open up the torque and speed drop
down box to select which type of test
is to be configured
Once a configuration has been selected
you will be required to input a scale
factor relating to both the Mechanical
Power (Nm) and Speed (RPM), both
parameters will then be calculated
against the selected source
Page 57
PPA45xx Quick User Guide
Page 56
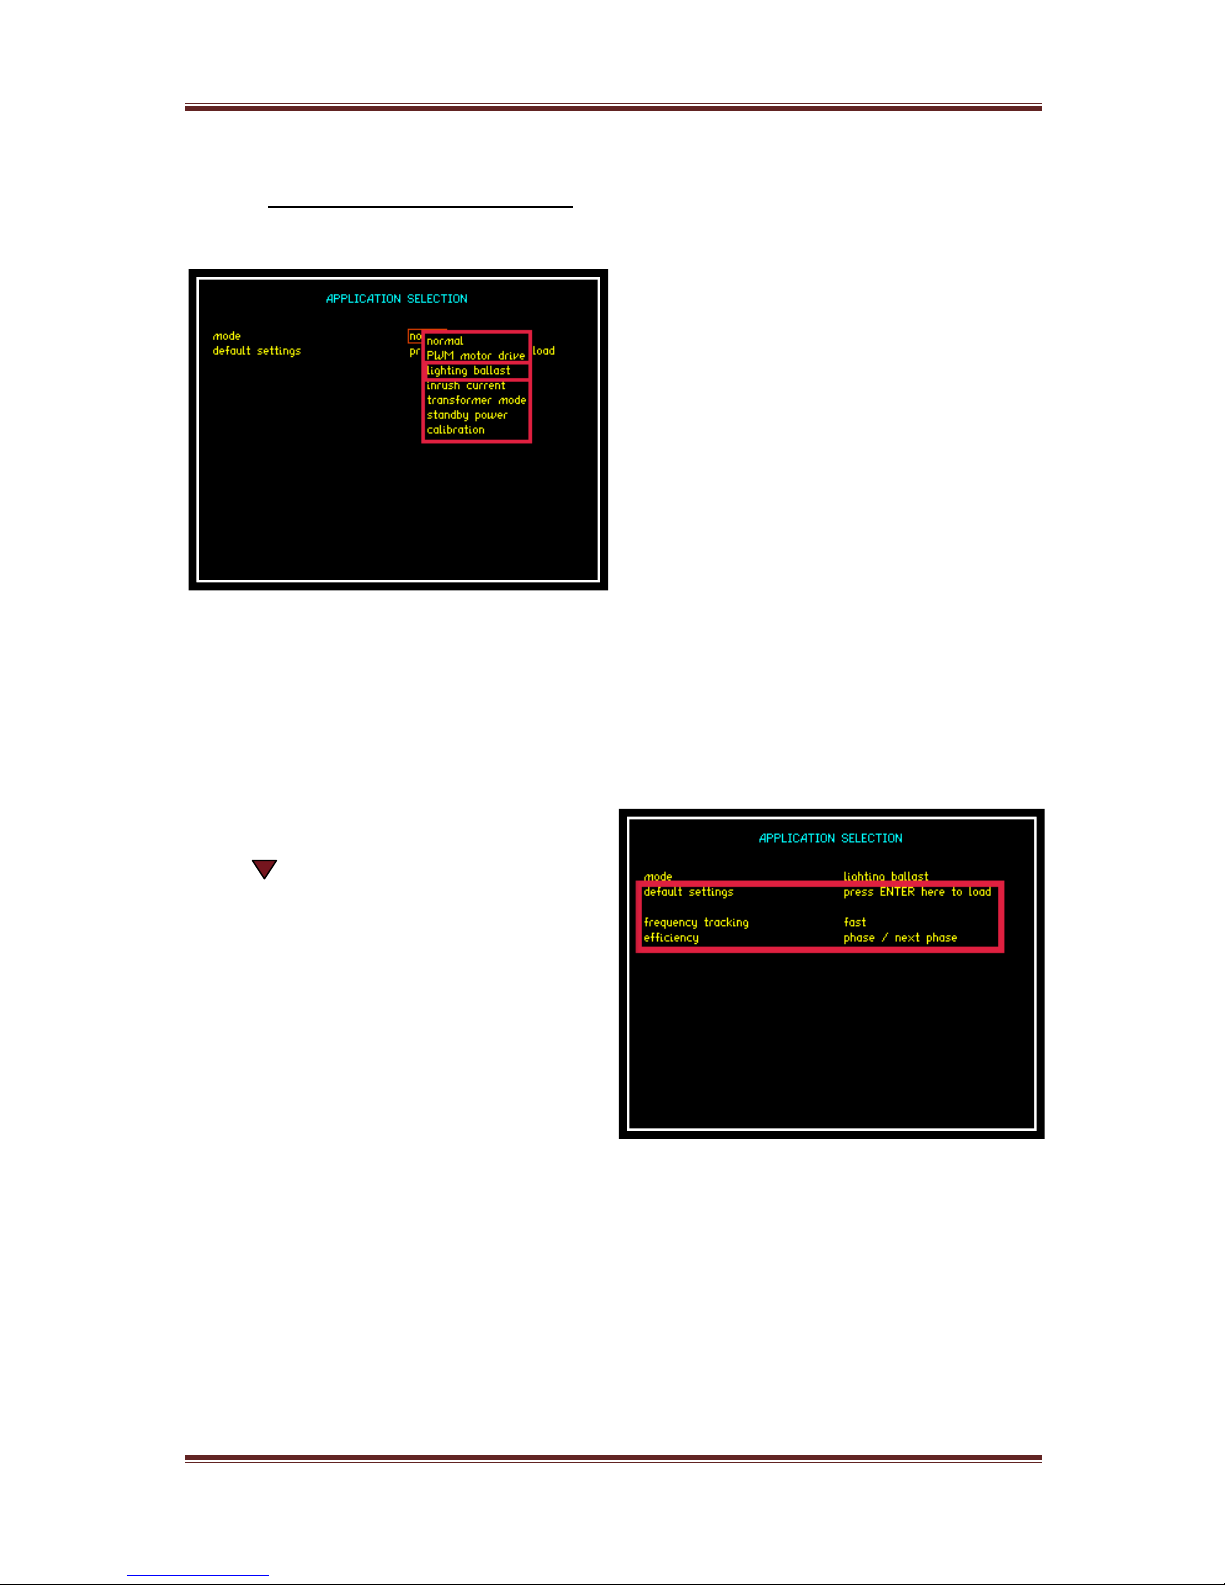
6.5.2 LIGHTING BALLAST MODE
Select Lighting Ballast mode from the
Application Menu as in previous
applications
Press to default settings. Press
“ENTER” to load
Once selected you now have the
option to select the frequency
tracking speed and the efficiency
calculation
Page 58
PPA45xx Quick User Guide
Page 57
6.5.3 Inrush Current Mode
Measurement of inrush current (surge) requires very fast sampling to catch the
highest instantaneous value. Measurements must be made under conditions of
manual ranging and with the voltage applied to the instrument. Then when the
load is switched on the highest peak value can be detected. In inrush mode the
PPA45xx samples and analyses every sample at the full sample rate in excess of
2Msamples/s to catch even very fast peaks.
Set Up
Instrument Used: PPA4530-Std (30Arms)
Test Device: 230v, 50Hz Ventilation Fan (Imax 0.8A)
Accessories: 1 x Break Out Box
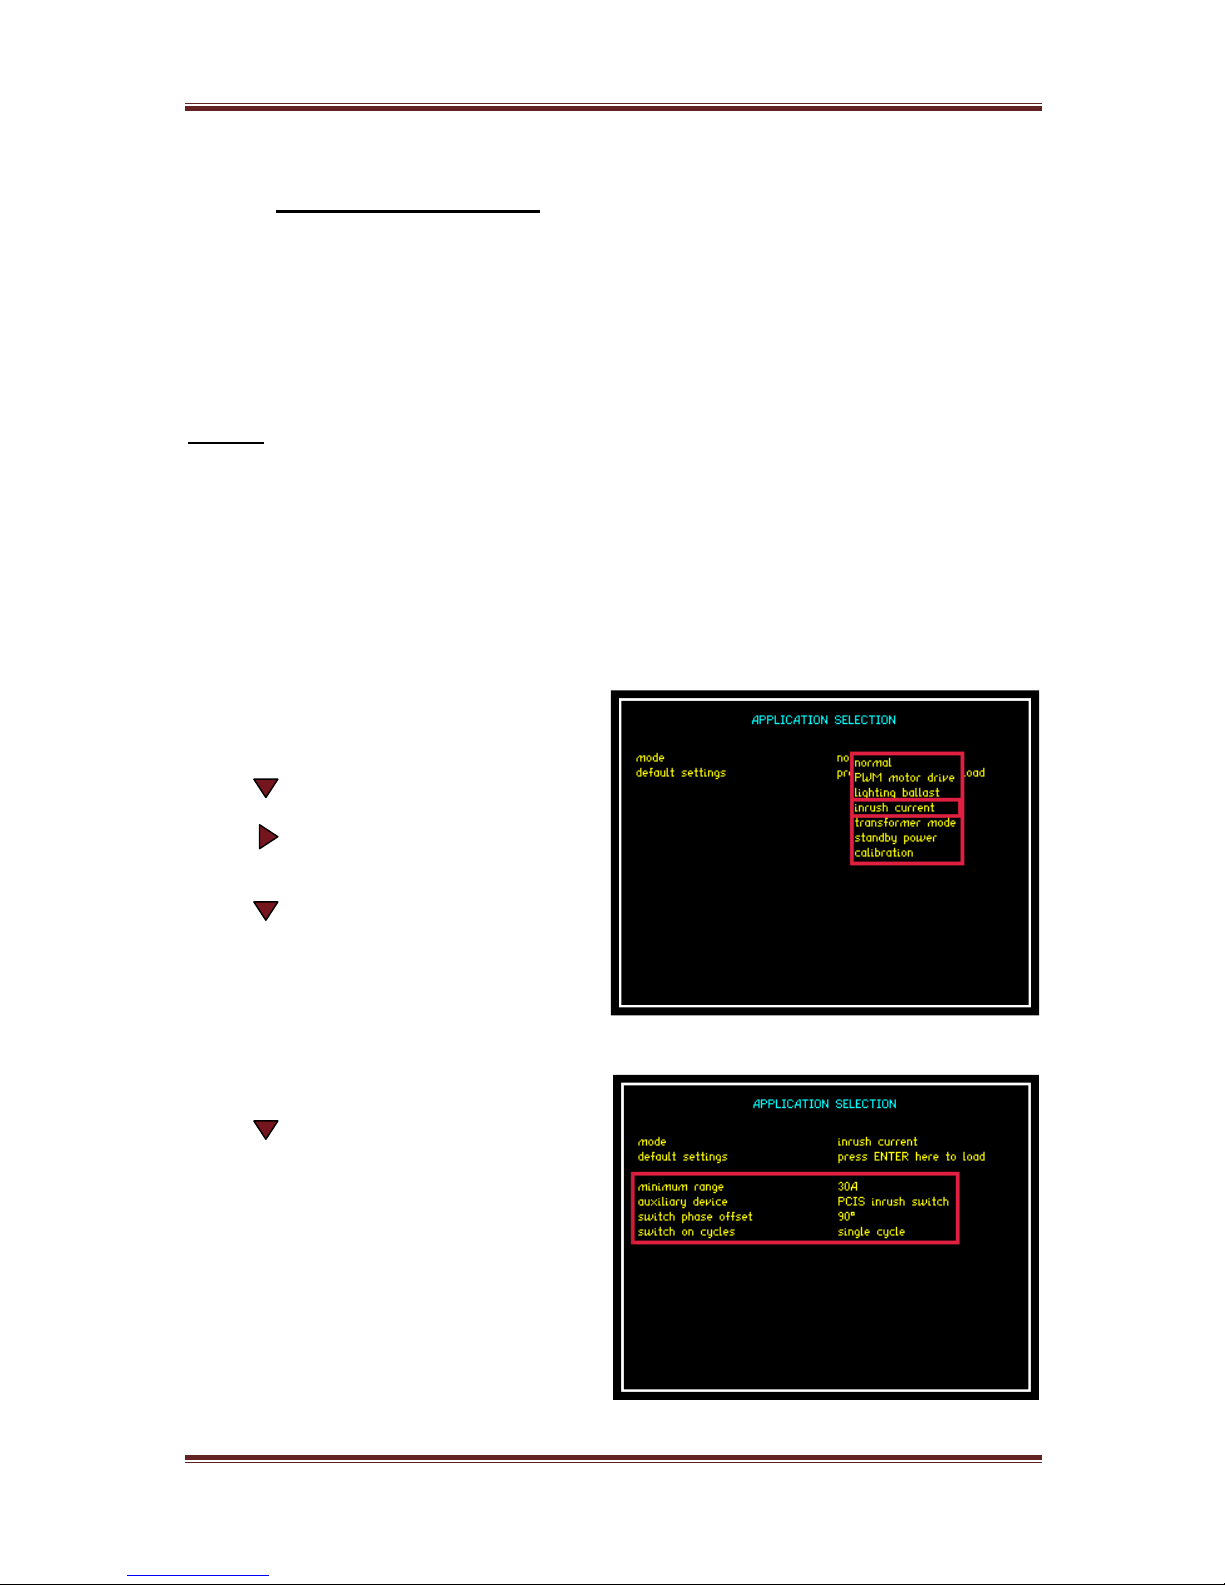
To access Inrush Current:
Press “APP” button
Press button
Press button. This will open
the drop down menu selections
Press 3 times until red box
surrounds inrush current
Press “ENTER” this will now set the
mode
Press button.
Press “ENTER” this will now set the
default settings mode for inrush
current and allow further
parameters to be configured
Page 59
PPA45xx Quick User Guide
Page 58
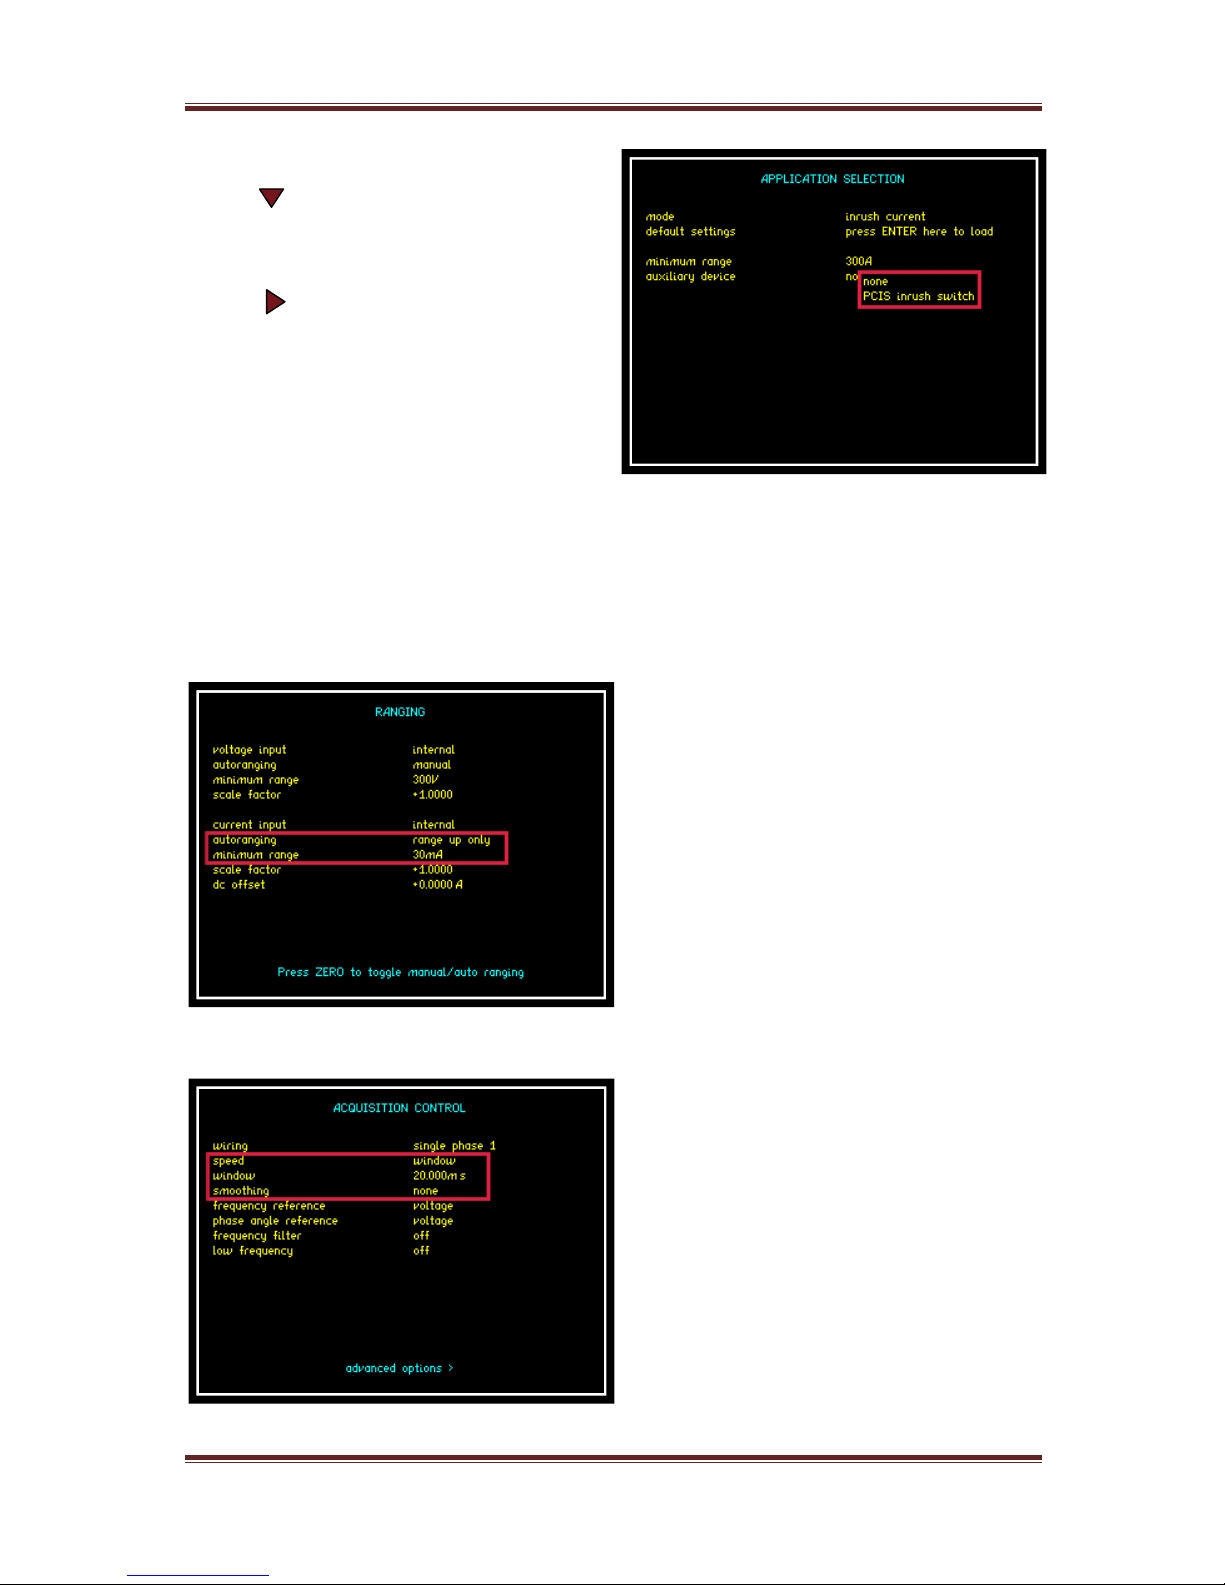
Press 2 times until the red box
surrounds “auxiliary device”
parameter
Press select the auxiliary
device to be “none” and press
“ENTER”
Setting the range parameter
This is best configured if the user has prior knowledge of the peak current
measurement expected from the DUT. If this is not available then the user
should set the current settings as follows.
Set the autoranging parameter to
“range up only” and the minimum
range to the 30mA range this will
allow the test being carried out to
find the highest range via peak
detection and hold on this range
Setting the Speed and Smoothing
For this application a mains input
signal of 50Hz was used, therefore
we are able to set the speed to
window and 20.00ms this will enable
us to capture cycle by cycle data over
the whole waveform, to get the
instantaneous cycle by cycle power
the smoothing parameter is best set
to none as shown
Page 60
PPA45xx Quick User Guide
Page 59
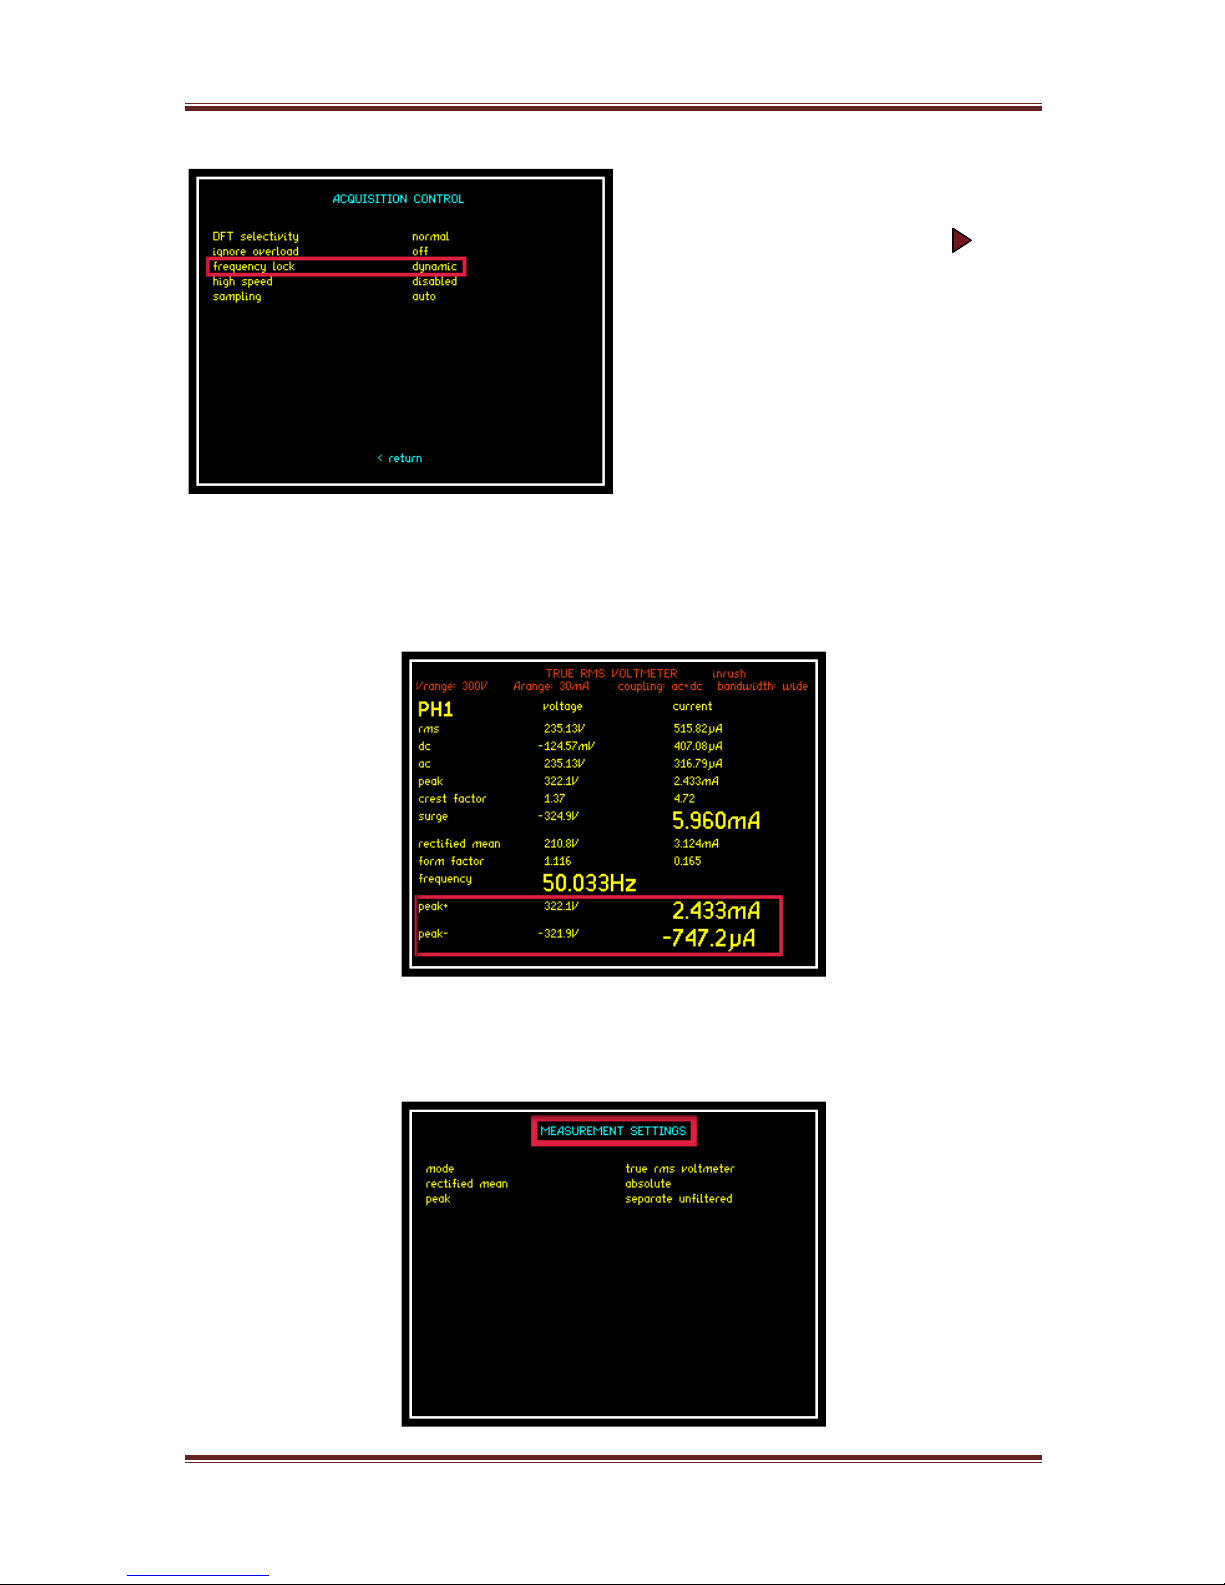
Upon completion of the speed and
smoothing settings press the arrow
to take you to the advanced settings
screen. If undertaking cycle by cycle
measurements on the input signal
then set the frequency lock to
“Dynamic”
Setting Peak Measurement Parameters
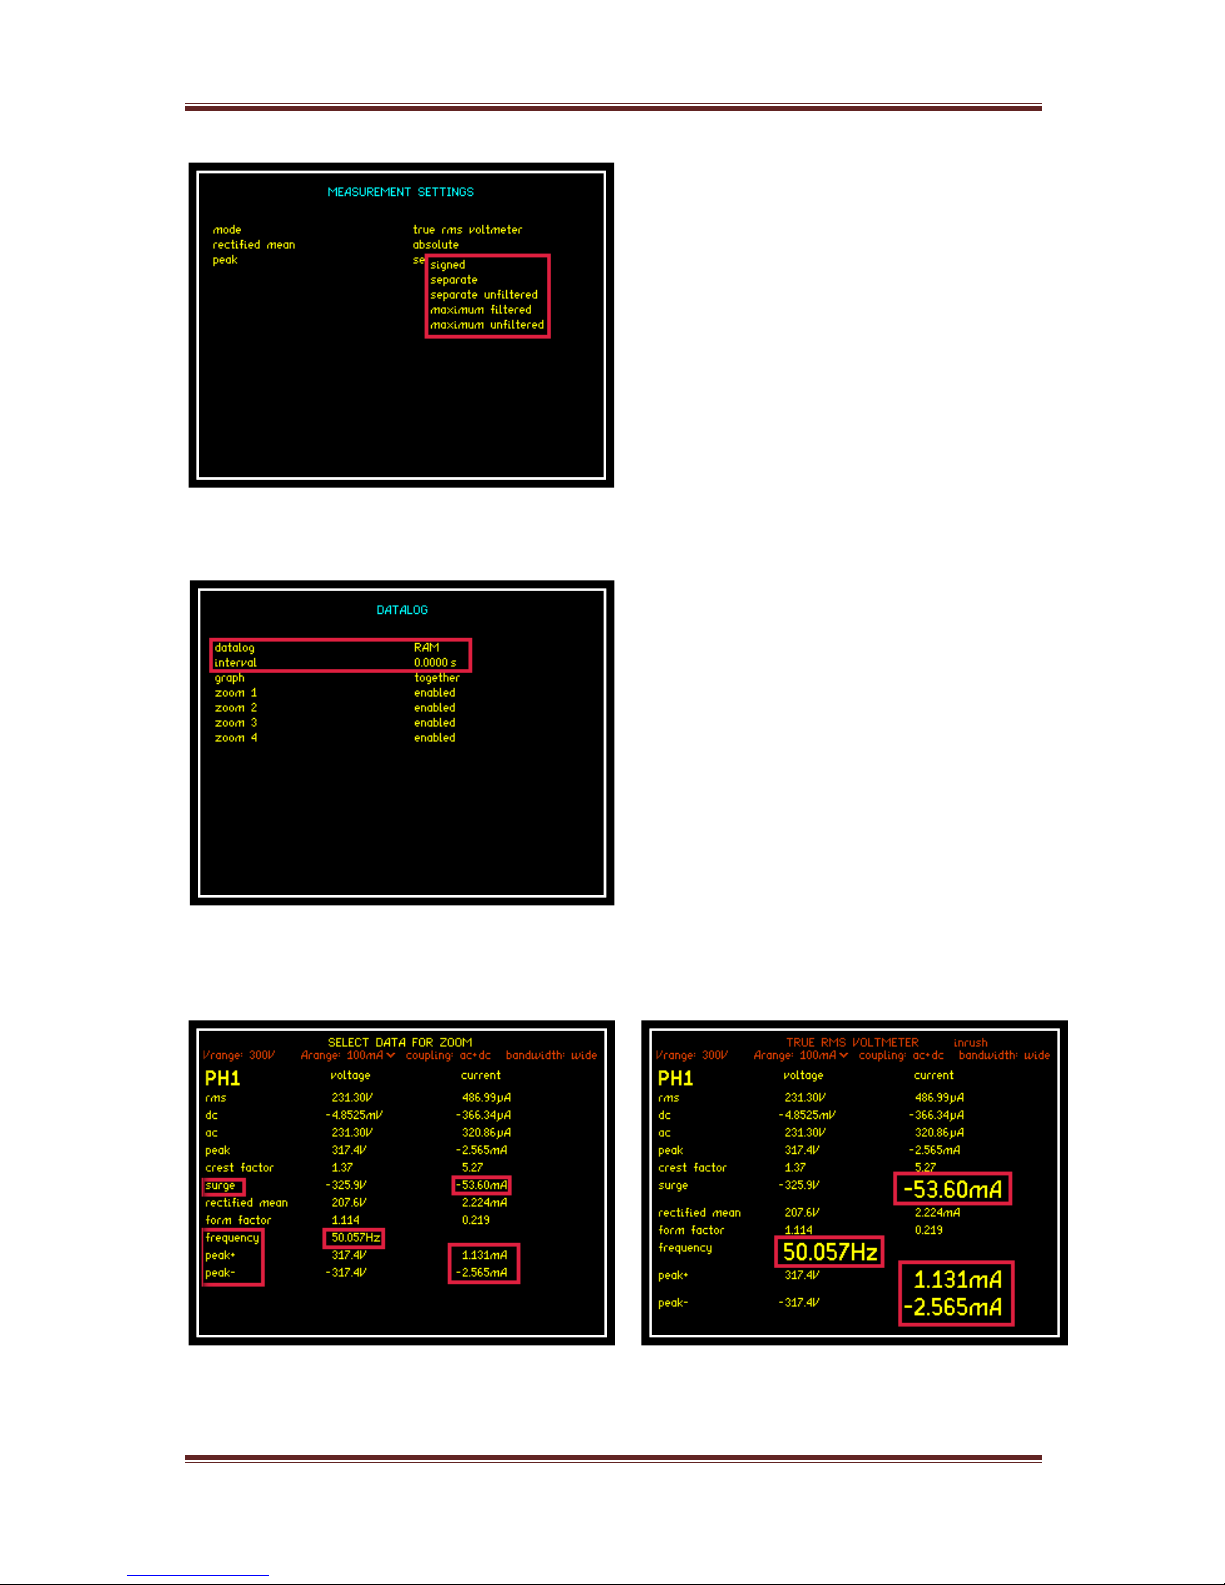
If required you can display the Peak+ and Peak- measurements within the RMS
Voltmeter mode screen
These parameters can be configured within the True RMS Voltmeter mode button
Press the “RMS” mode button until the measurement settings screen is displayed
Page 61
PPA45xx Quick User Guide
Page 60
For this demonstration we selected
“separate unfiltered” this then gave
us the unfiltered Peak + and Peak –
measurement parameters as
displayed earlier for both Voltage and
Current
Data logging to Internal Memory
Set the Datalog to be performed to the
internal RAM memory this will offer the
user the fastest performance
Set the interval time to 0.00s to enable
the Datalog to capture every cycle of
the fundamental frequency
Reconfigure zoom parameters within real time display as described within section
6.3
Zoomed parameters can now be used to capture the Inrush Current (Surge) data
within a Datalog
Page 62
PPA45xx Quick User Guide
Page 61
DataLog Results
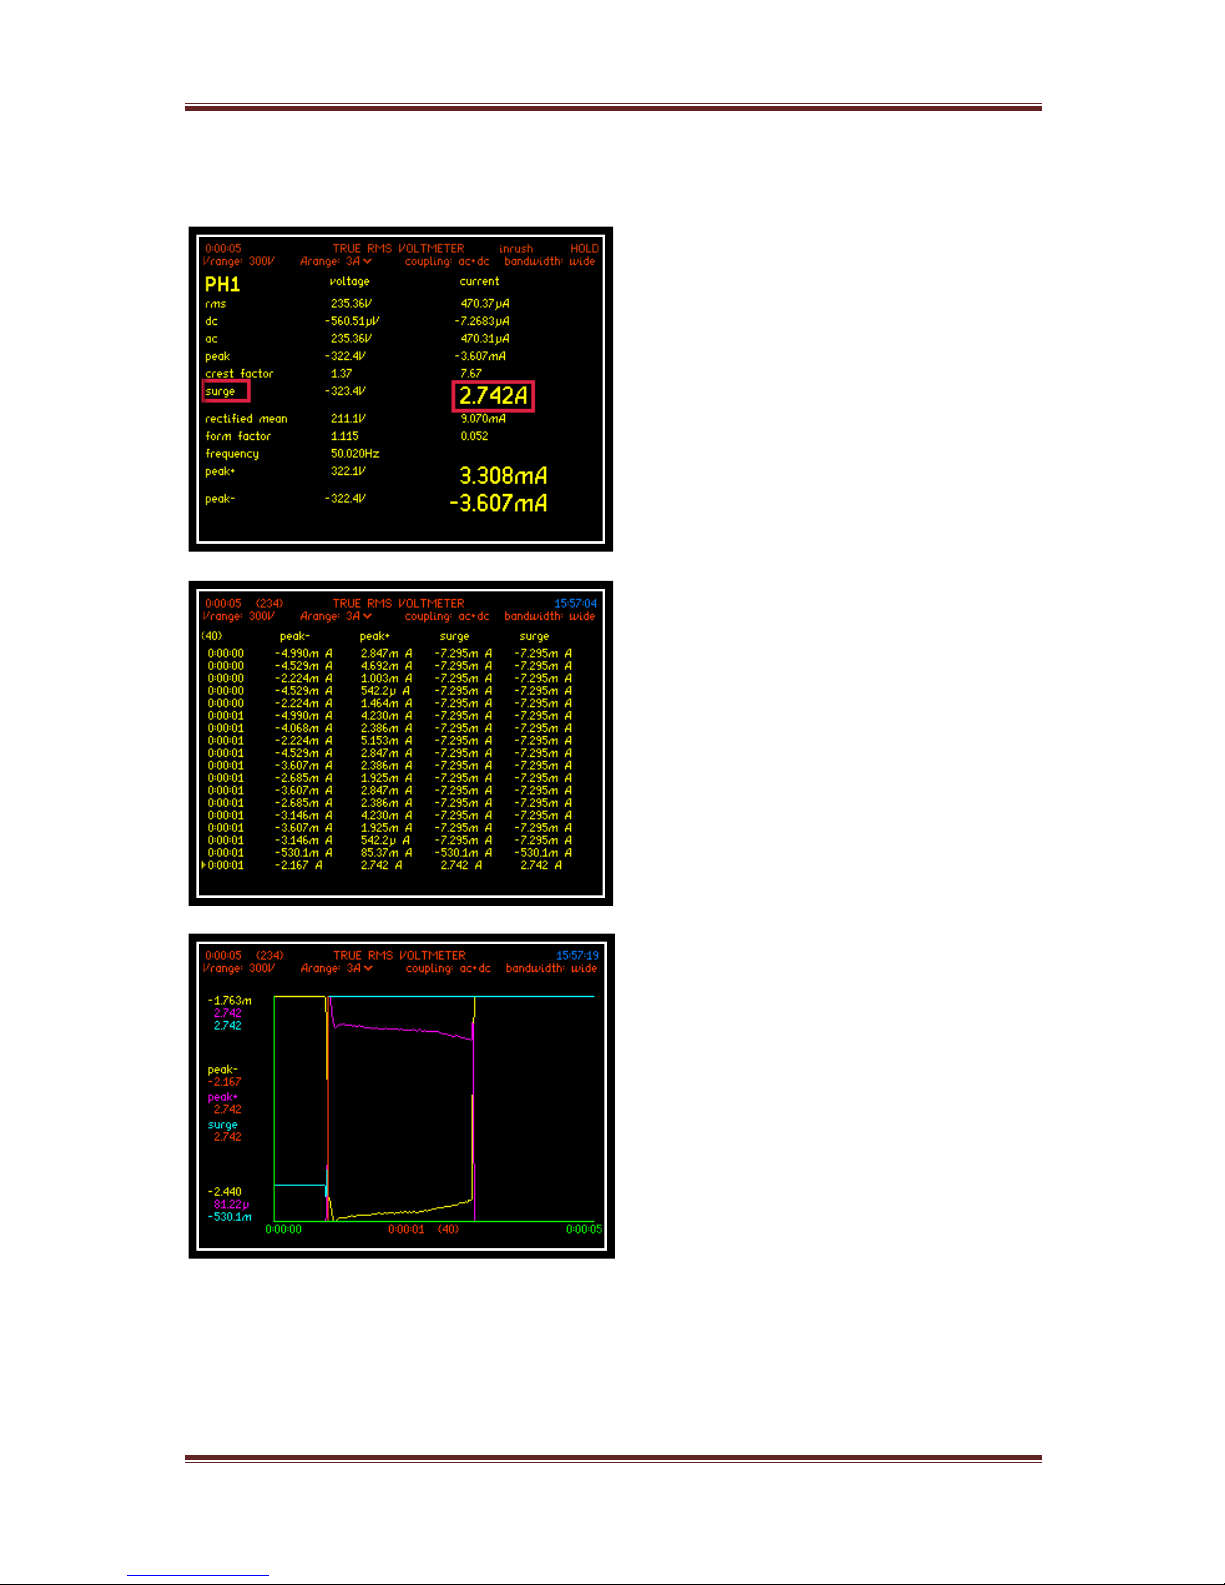
From the Real Time display the surge
measurement at the moment the DUT
was switched on is recorded as
2.742A
Pressing the “TABLE” button will now
display all the data points taken from
the associated DataLog and you will
notice that the Inrush Current
(Surge) is displayed as being 2.742A
Pressing the “GRAPH” button will
display in a graphical format all the
data points from the associated
DataLog displayed within the previous
screenshot it is clear that the surge
displayed within the tabular display
corresponds with the graphical
display
Page 63
PPA45xx Quick User Guide
Page 62
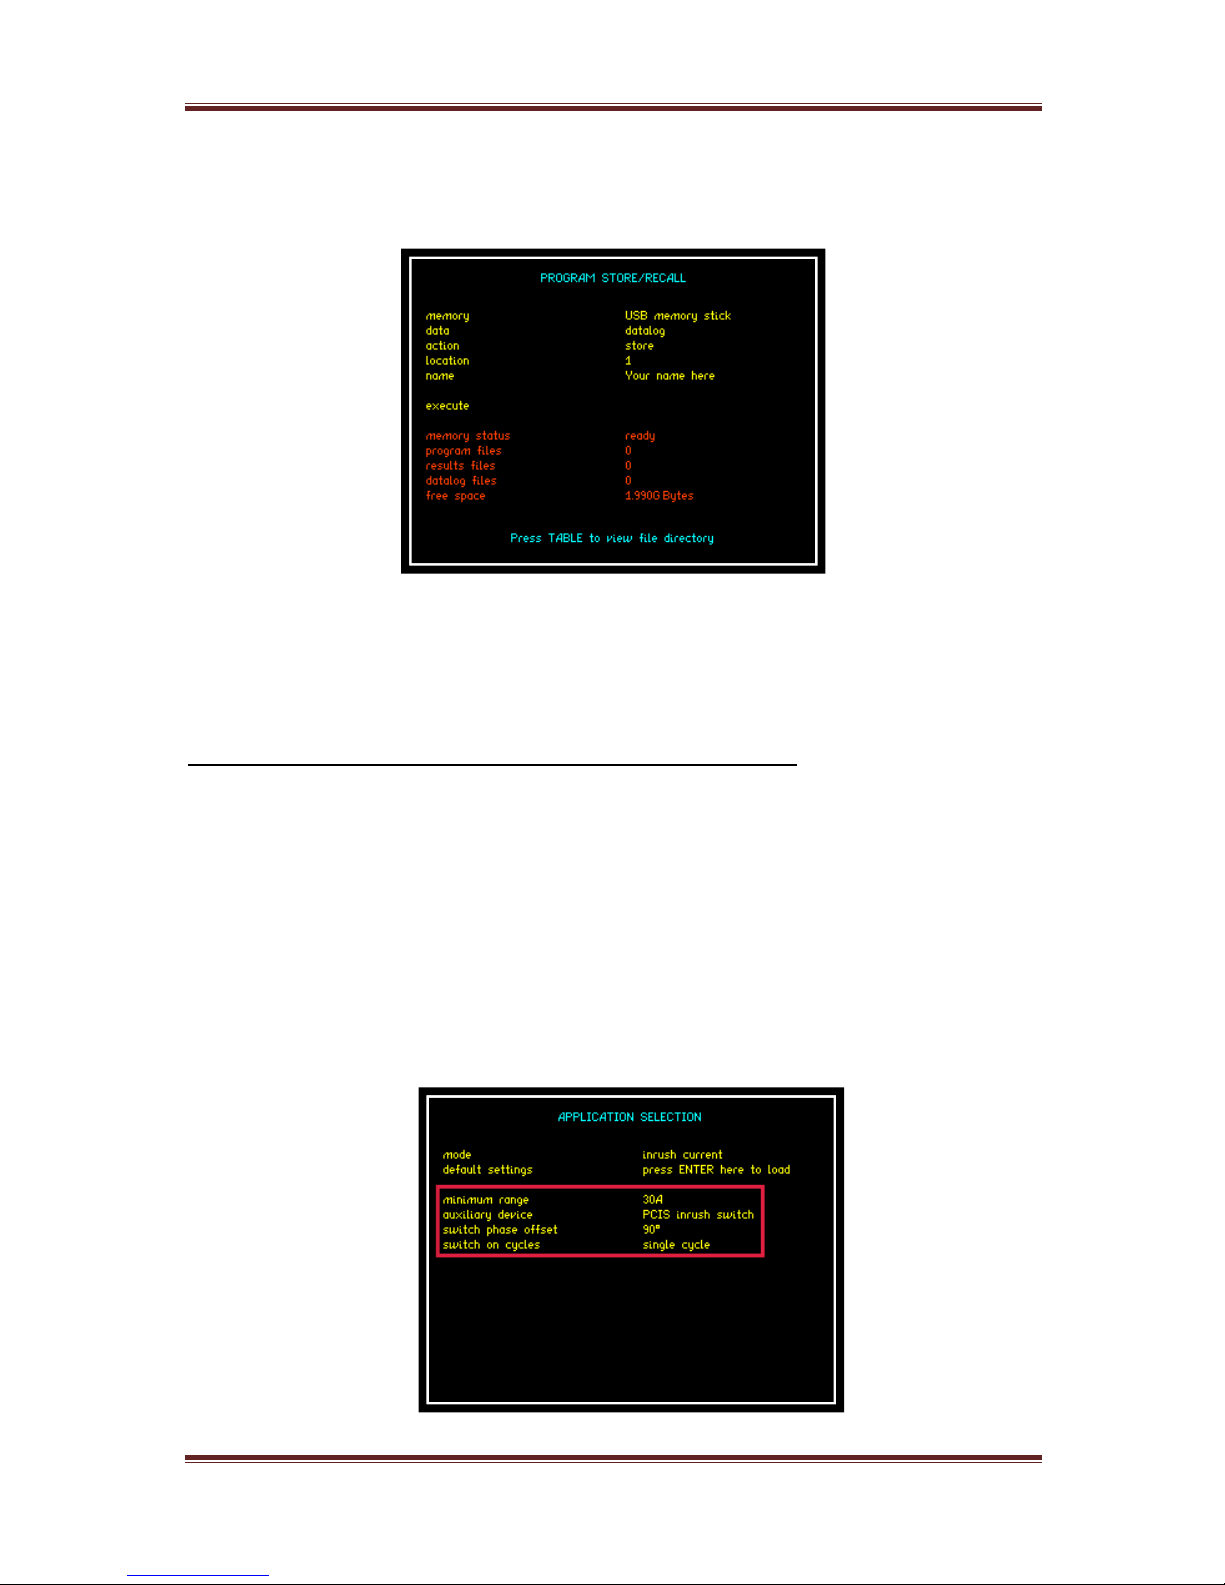
Upon completion you are now able to save / recall or delete your test results
taken from your DataLog within the “ PROG” mode button
Transferring the Datalog from the RAM memory onto a USB memory stick will
allow the user to export the .txt file into an .xls file if desired; more details can
be found relating to the transfer of data within section 7.1
Inrush Current Mode using the N4L PCIS Switch
For the worst case inrush current the input to the device under test must be
switched on at the worst point in the cycle (90˚ or 270˚ for a capacitive load, 0˚
or 180˚ for an inductive load). The Phase Controlled Inrush Switch, or PCIS,
available as an accessory for the PPA45xx, controls the switch on of the power to
the DUT from 0˚to 315˚ in steps of 45˚ from the Instruments front panel.
Set up is the same as before but you will need to enter the PCIS switch as the
auxiliary device and then set the switch phase offset and switch on cycles
parameters as described below
Page 64
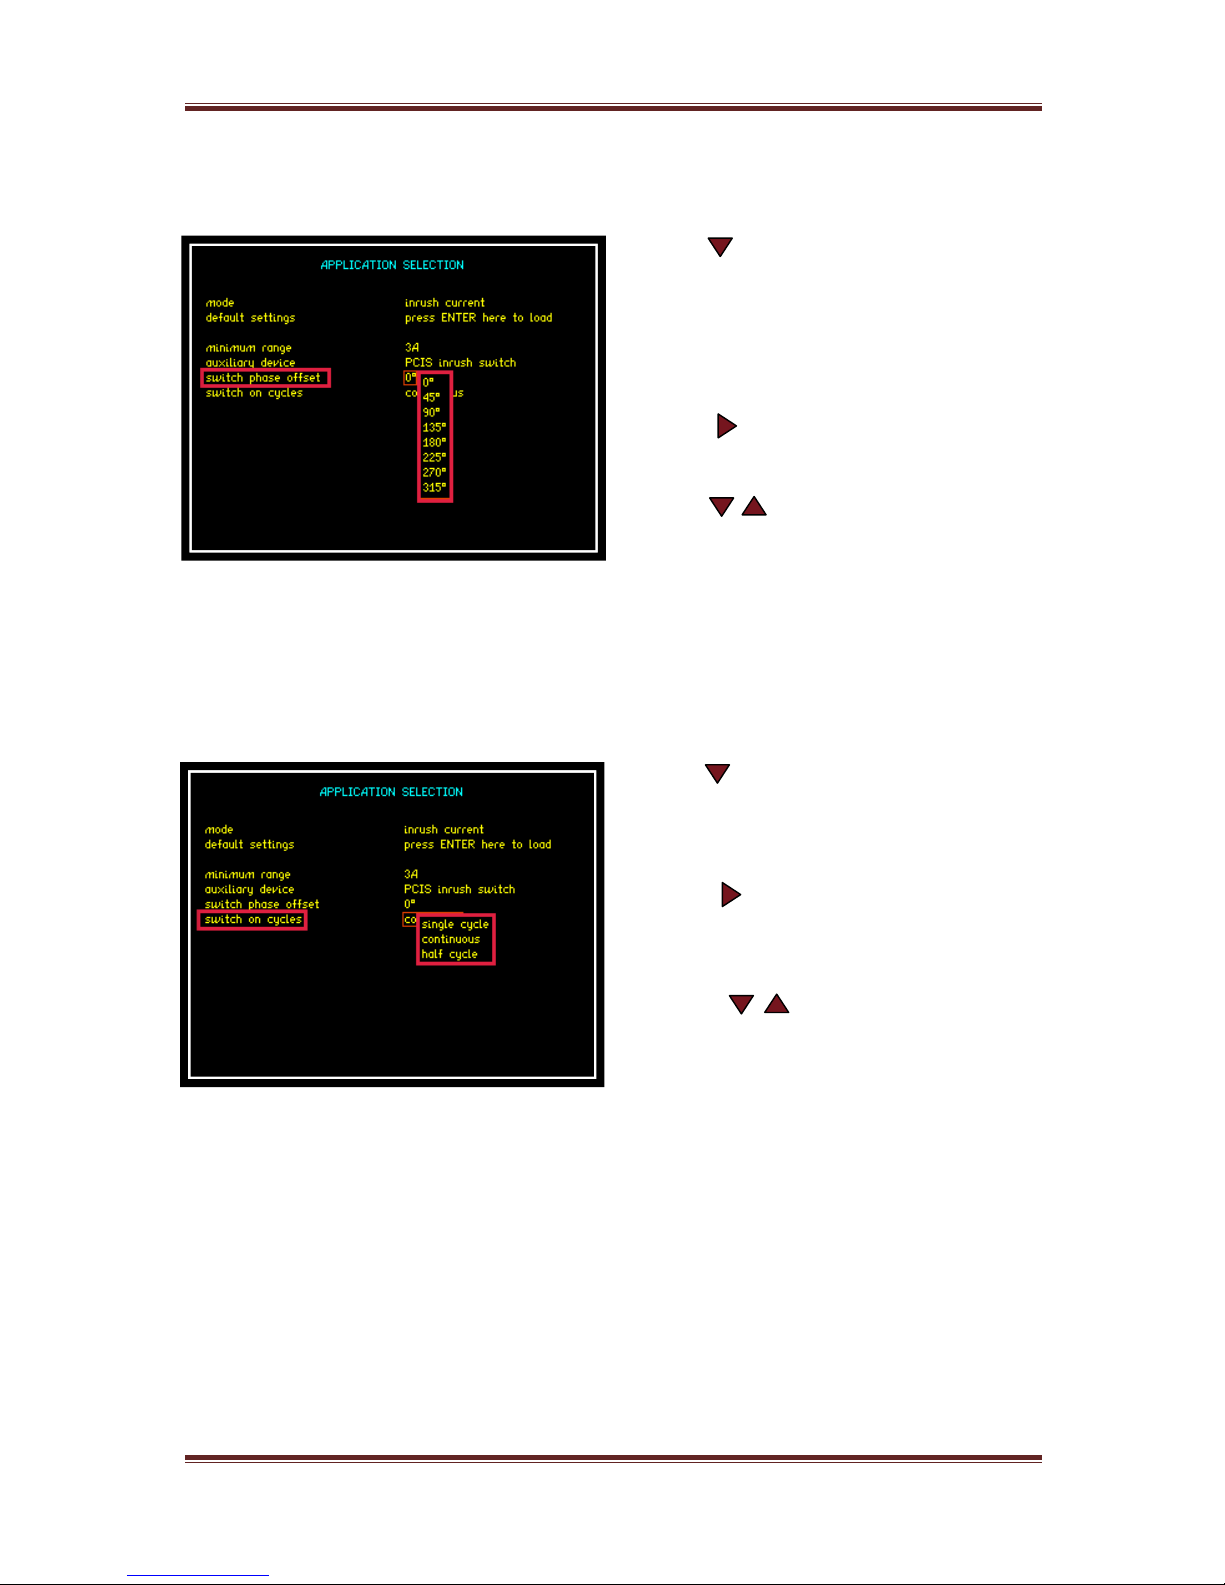
PPA45xx Quick User Guide
Page 63
Switch Phase Offset:
Press Key
Switch Phase Offset parameter will be
selected (controls the switch on of
the power to the DUT from 0 to
315 in steps of 45 )
Press Drop down box will open
with all available angular ranges
Press arrows to select angular
parameter required
Press “ENTER” to confirm selection
Switch on Cycles:
Press Key
Switch on Cycles parameter will be
selected
Press Drop down box will open
with all available waveform cycle
ranges
Press arrows to select
waveform cycle parameter required
Press “ENTER” to confirm selection
Page 65
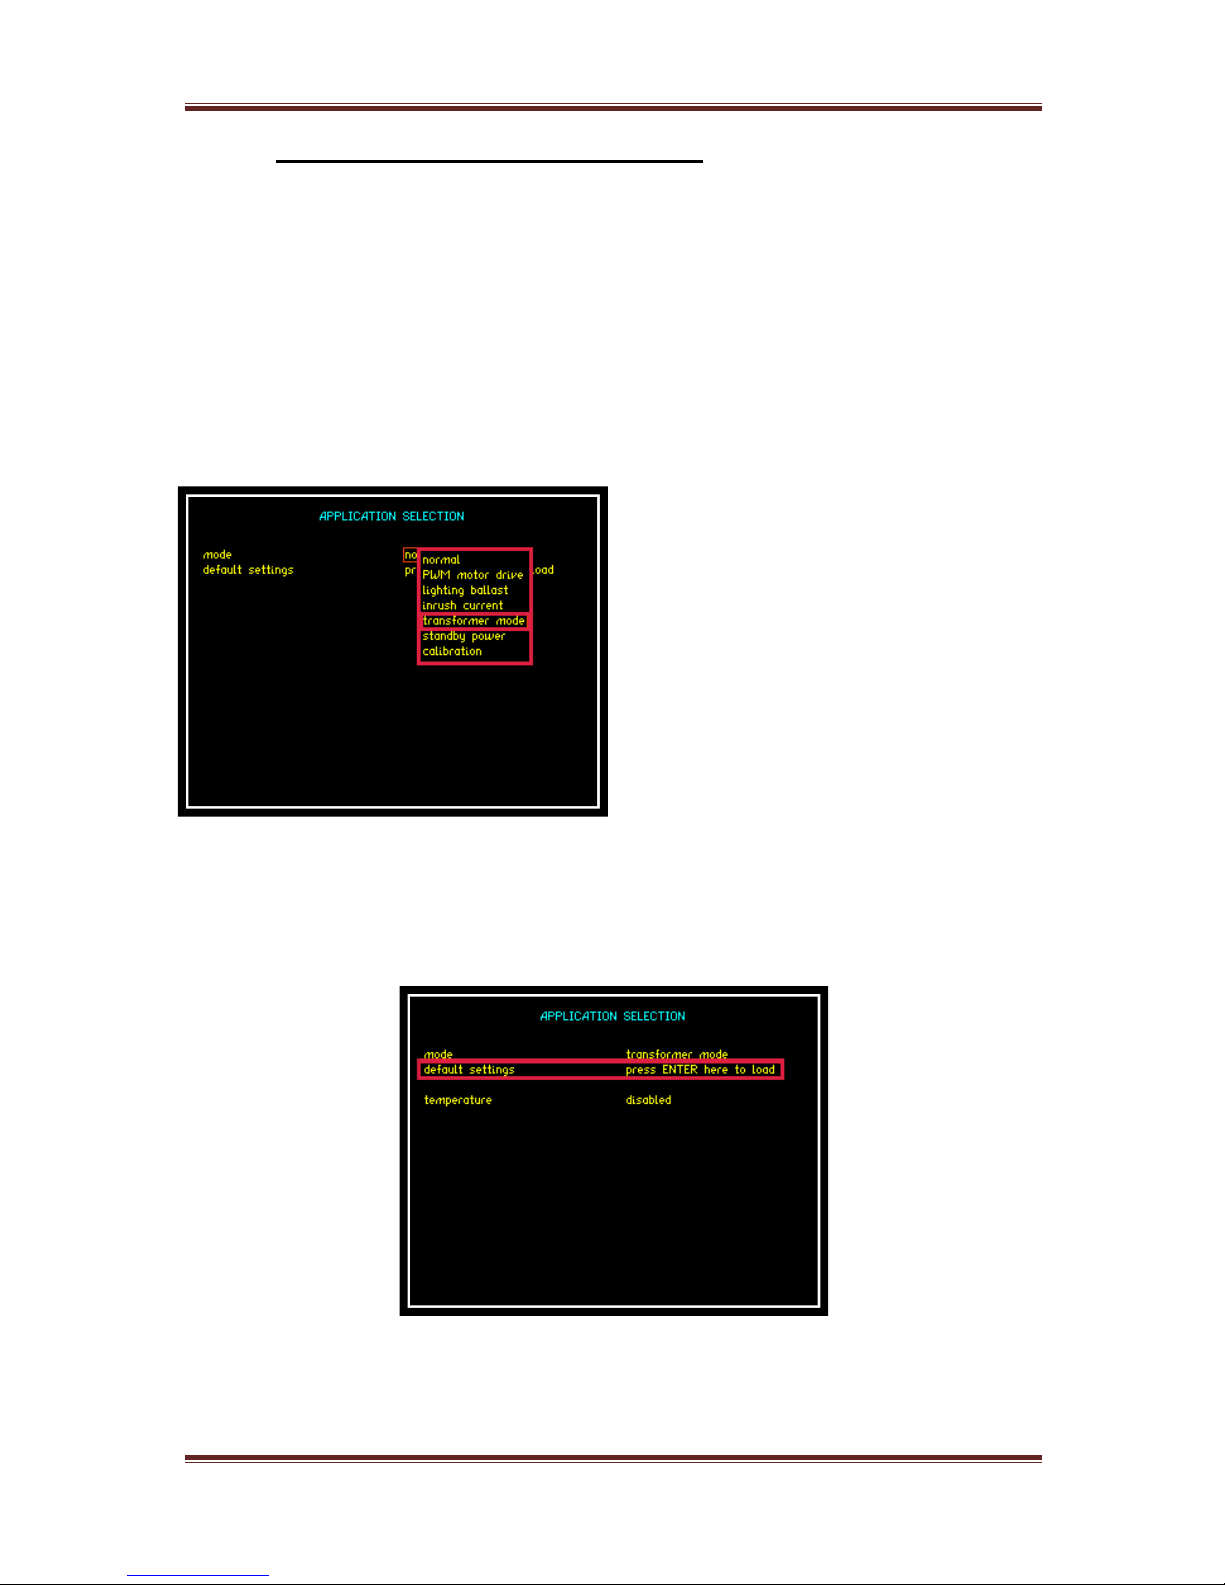
PPA45xx Quick User Guide
Page 64
6.5.4 Transformer Mode (Single Phase)
The Transformer mode in the PPA is ideal for both single phase and three phase
transformer analysis, we will first describe general operation with a single phase
device and then move on to describe three phase measurements. For both single
and three phase the Corrected power (Pcorr) and K-factor values are displayed
in the results window.
Test device: 1 x Single Phase Transformer, ratio (1:1)
Accessories: 1 x Break out Box
Transformer Mode will allow the user
to assess and view characteristics
applicable to the transformer field
under test conditions
To access transformer mode from the
drop down menu, press the down
arrow 4 times and press “ENTER” as
displayed, transformer mode will now
be selected
Press the down arrow 1 more time to highlight default settings mode and press
“ENTER” this will set the instrument into its default settings for transformer
mode
Pressing the “HOME” button twice will take you back to power analyzer home
screen
Page 66
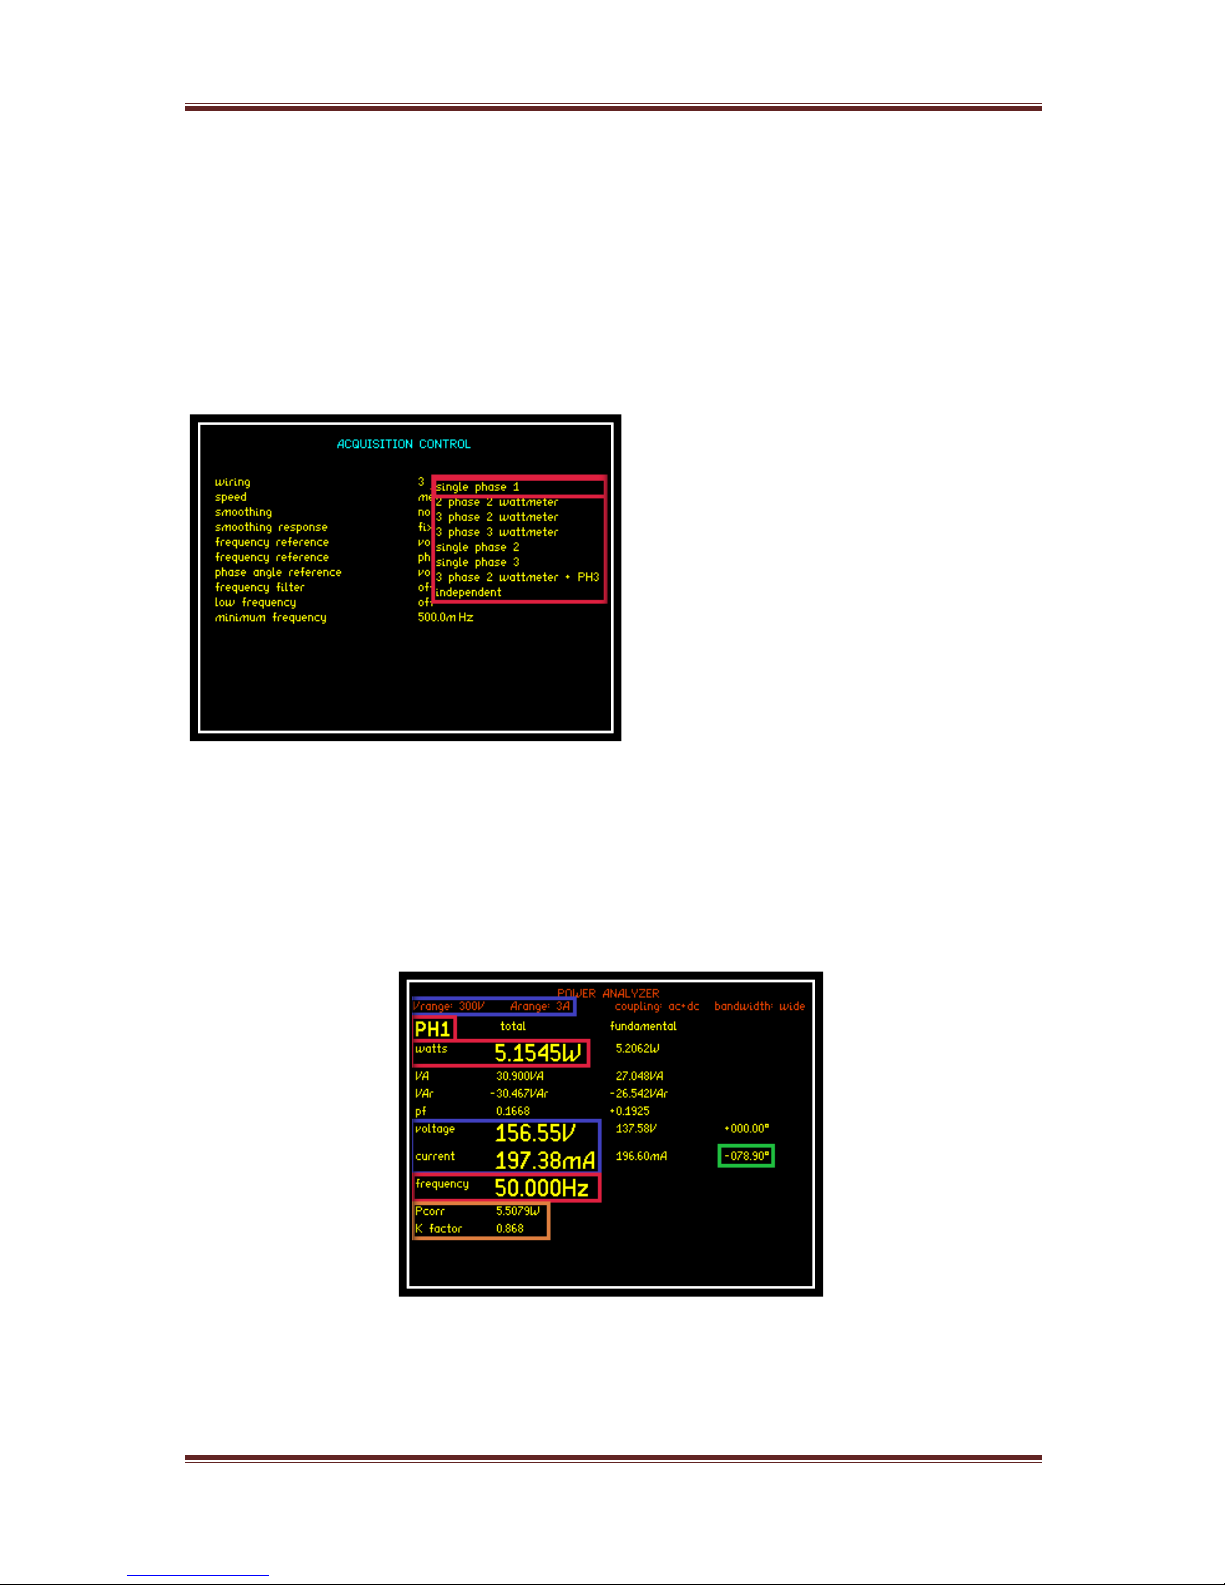
PPA45xx Quick User Guide
Page 65
You are now required to set the wiring configuration for the transformer.
Press “ACQU” button which will bring up the “ACQUISITION CONTROL” screen.
Press the down arrow once so the red box flashes around the wiring selection;
press the right arrow to open up the drop down menu as seen within the
screenshot below
Use the up and down arrows to
select which wiring configuration
you require. For this manual, single
phase 1 was selected to reflect the
transformer being used. Press
“ENTER” to confirm selection then
“HOME” twice to return to the power
analyzer home screen
The “Power Analyzer” home screen will now display the data measurements
collected from your transformer under test
With the transformer plugged into a Break out Box and no load attached, the
following measurements are displayed
The Voltage and Current measurements displayed within the Blue Box above
reflect the auto ranging configured by selecting the default settings within the
instruments application home set up screen
Page 67
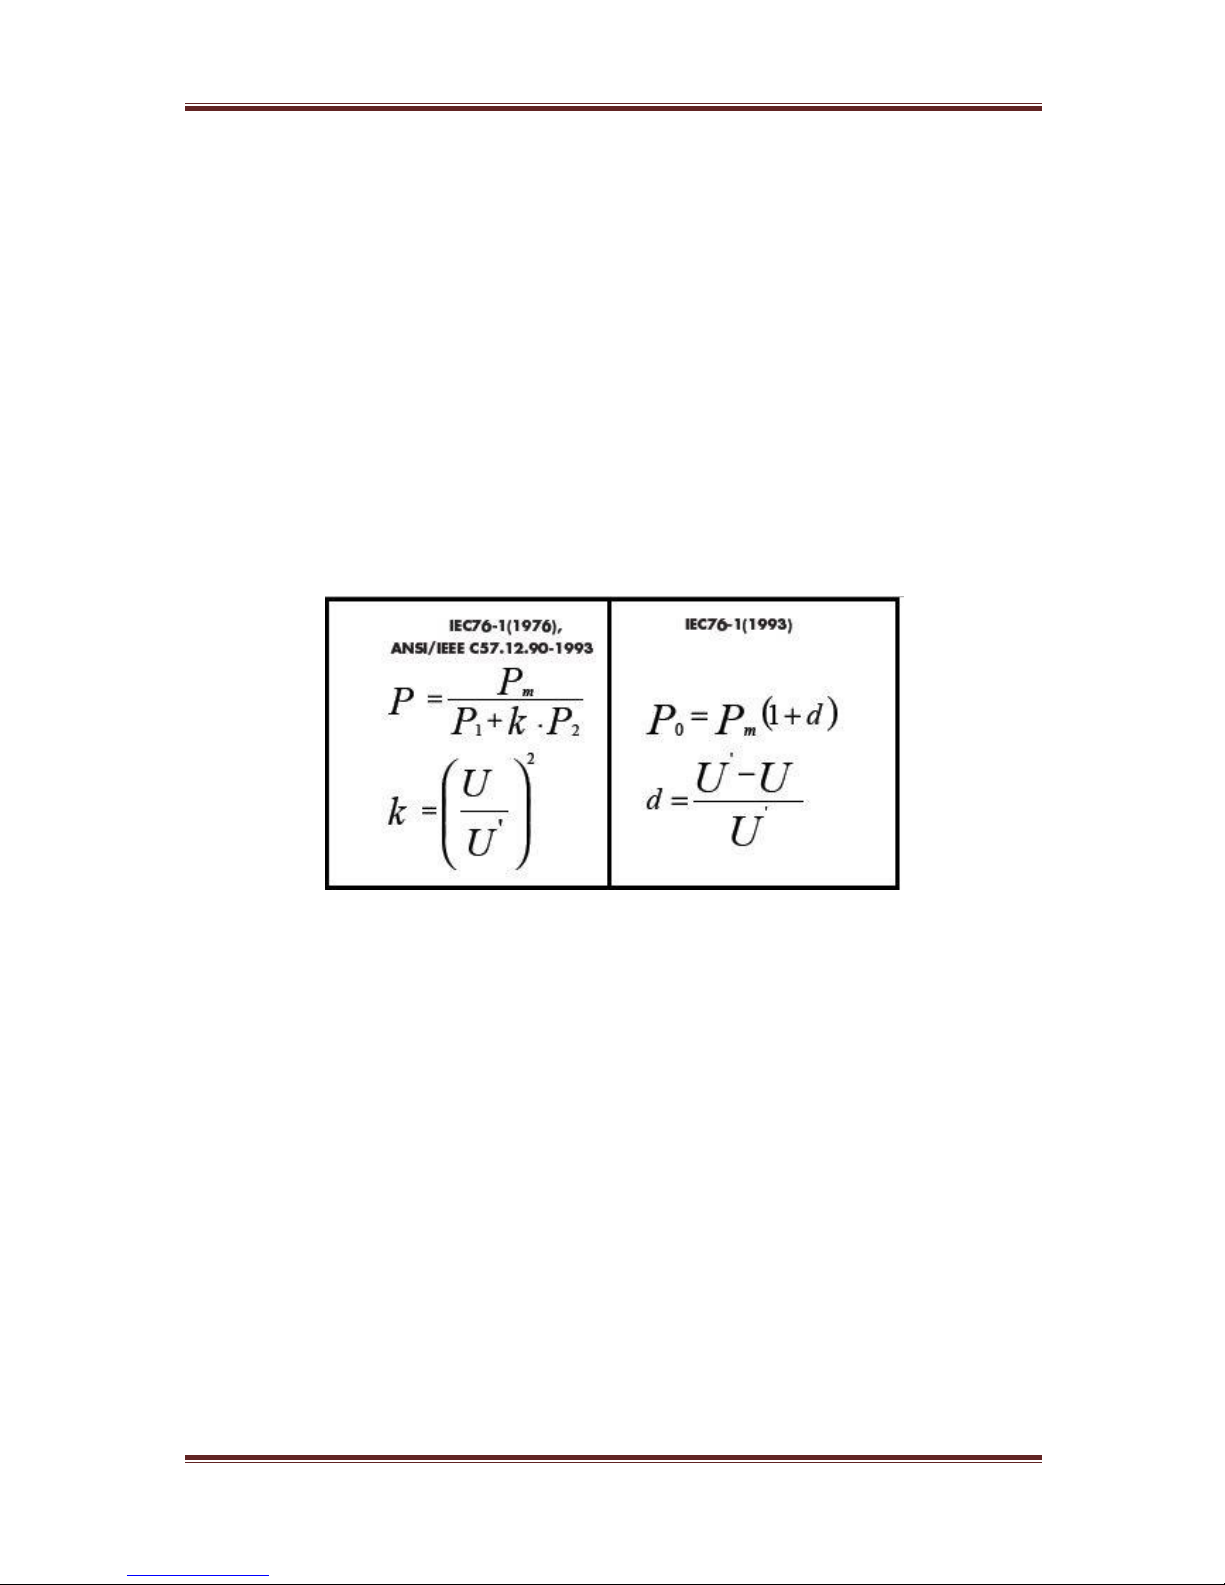
PPA45xx Quick User Guide
Page 66
Viewing the data (Green Box) the phase angle of the fundamental is shown as
78.90 . A perfect transformer would display a phase angle of 90 . From this
data we can confirm that there must be parasitic elements within the makeup of
the transformer causing these results, such as a series resistance.
The Pcorr (Corrected Power) and K factor values displayed within the
Orange Box (see previous page) are computed in transformer mode. In
transformer mode there is usually very little distortion. The equations used to
calculate these values are:
The K factor equation is the lower one in the left hand column.
The Corrected power (P0) equation is the top one in the right hand column.
Where
P or P0 = corrected power
Pm = measured power
P1 = ratio of hysteresis loss to total iron losses
P2 = ratio of eddy current losses to total iron losses.
U’ = Normalised mean value of voltage
U = rms value of voltage
Page 68
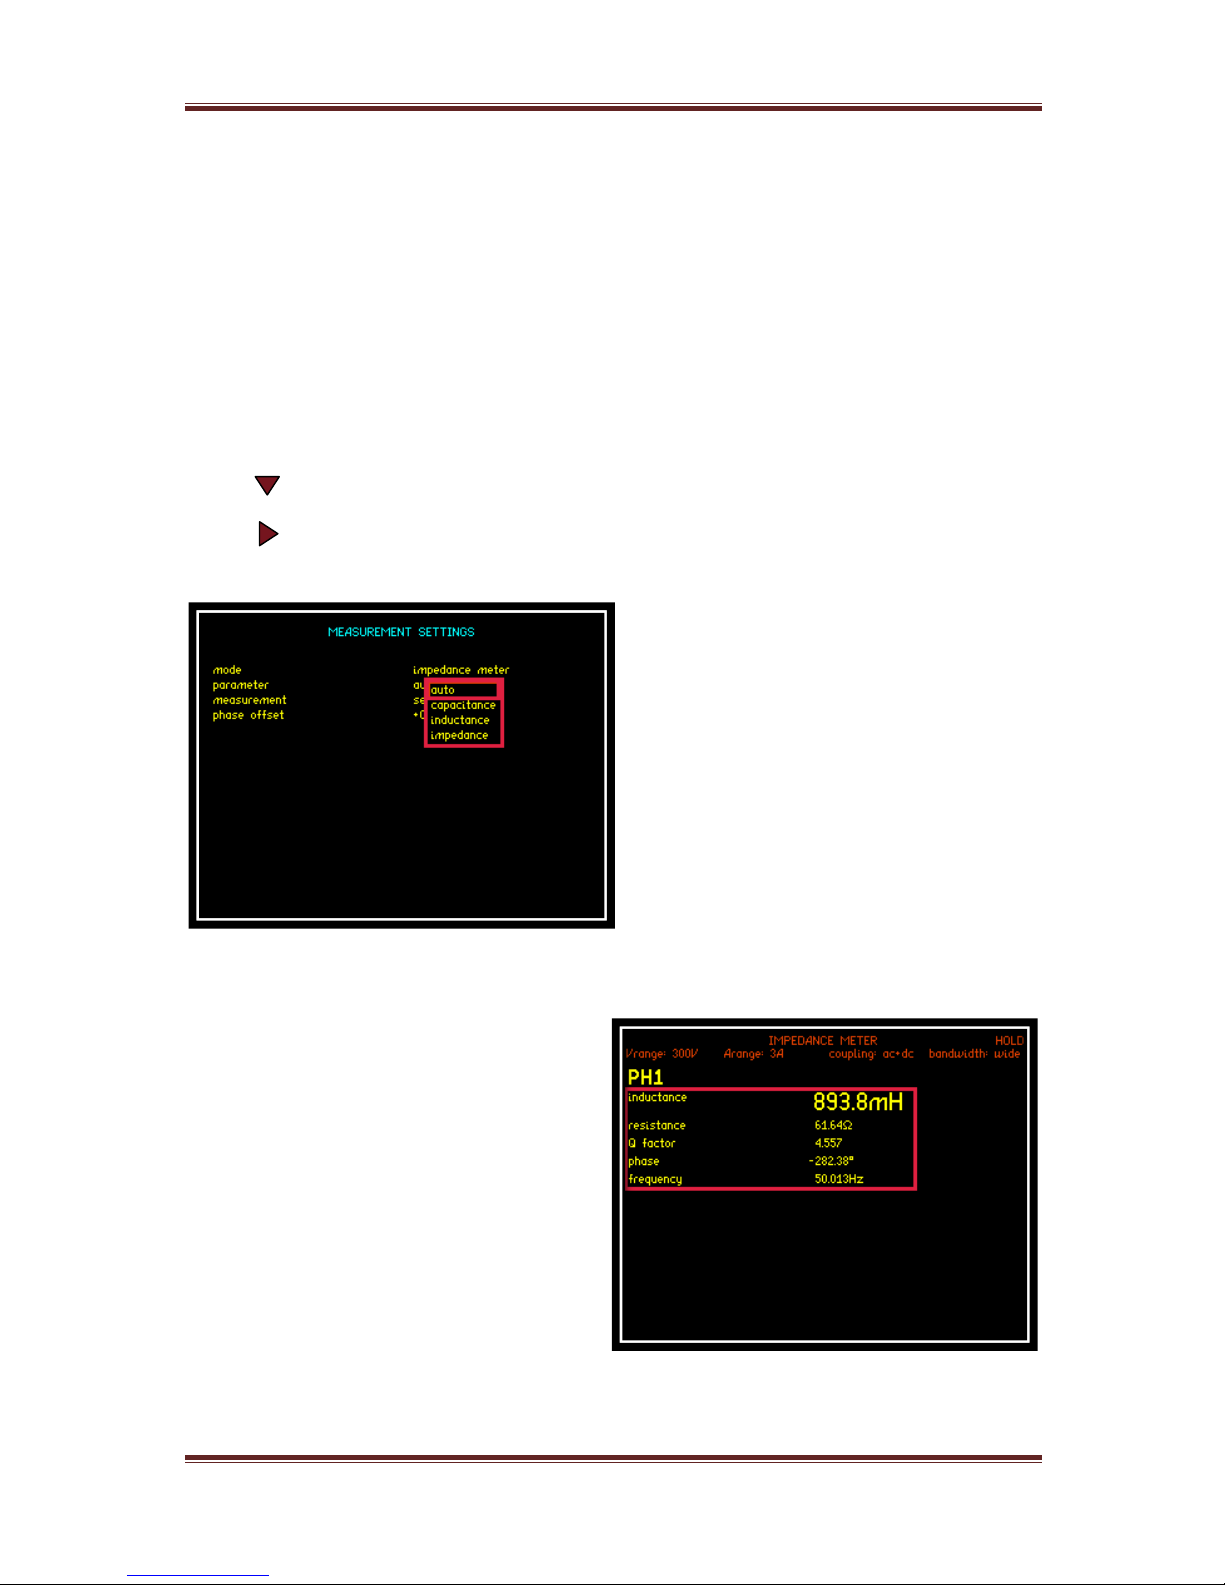
PPA45xx Quick User Guide
Page 67
Within the measurement screen the display shows that with “NO” load connected
the transformer is consuming 5.15W of power at a Frequency of 50Hz. If you
now press the “IMP” button you will enter the Impedance Meter screen, within
this application mode you will be able to view all the individual data values
collected that make up the total Impedance measurement attributed to the DUT.
(Both real and imaginary)
In the next set of screen shots we will be able to view this data
Press “IMP” button to enter the Impedance Meter screen
Press “IMP” button again to enter Measurement Settings screen
Press button 2 times, red box surrounds parameter settings
Press button to open up the drop down menu
From the drop down menu you will
now be able to view all parameters as
shown or alternatively by selecting
“auto” the display will show the
appropriate parameters values
attributed to the DUT
Press “ENTER” to confirm selection
Press “ENTER” to return to home
screen and view measurements
From the “auto” screen you can now
see that we have a Resistive
component affecting the purity of the
transformer
From the Inductance and Resistance
readings the instrument will calculate
the total impedance of the
transformer winding at the selected
frequency
Page 69
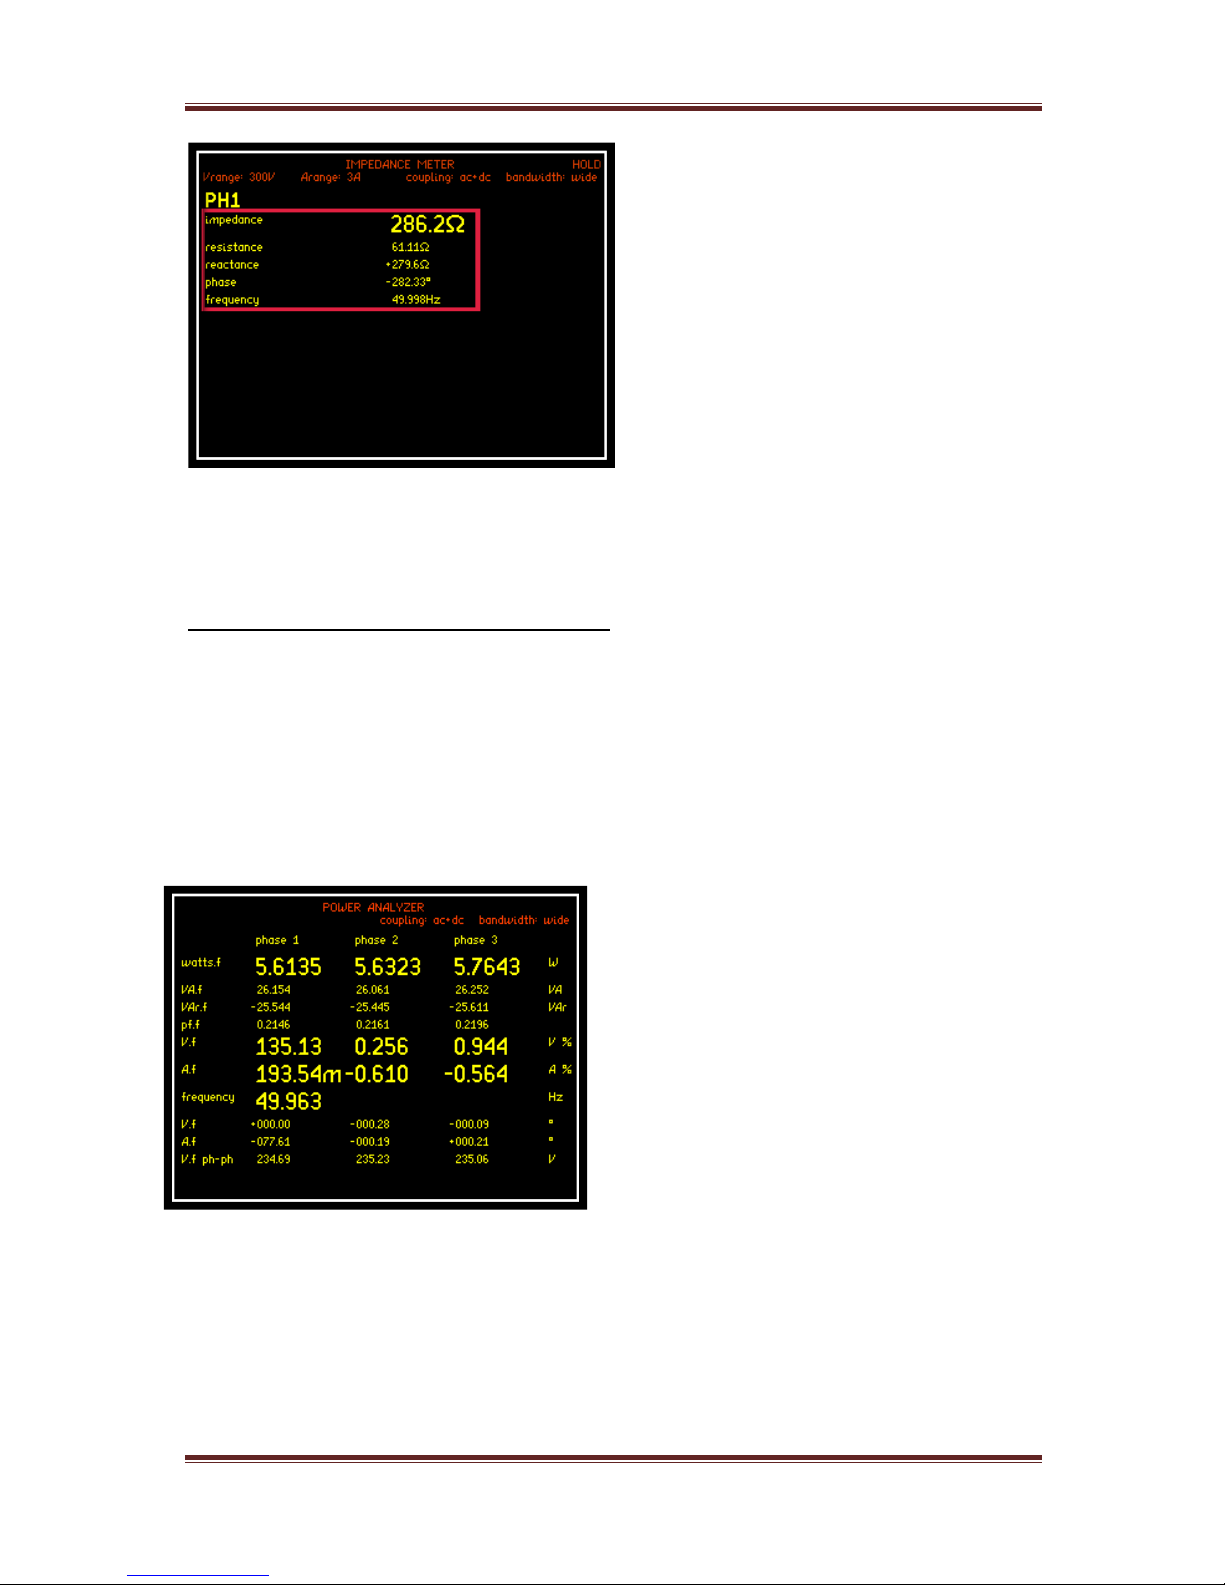
PPA45xx Quick User Guide
Page 68
To view the total Impedance
calculated you will need to change
the display screen back from “Auto”
to “Impedance” as shown
Transformer Mode (Three Phase)
When performing analysis of a 3 Phase load, transformer mode is extremely
useful. The PPA will display phase balance information in an intuitive manner
without the requirement for a vector display, this has the advantage of
maintaining 5 digit resolution which is not possible whilst attempting to visually
interpret phase balance on a conventional vector display.
As illustrated, the PPA is able to
display 3 phase power
simultaneously, along with this the
Voltage % and Current % deviation
from the phase 1 readings displayed.
The phase reference is taken from
phase 1 Voltage and we can see that
phase 2 and 3 are (120-0.28) deg
and (240-0.09) deg respectively.
Page 70
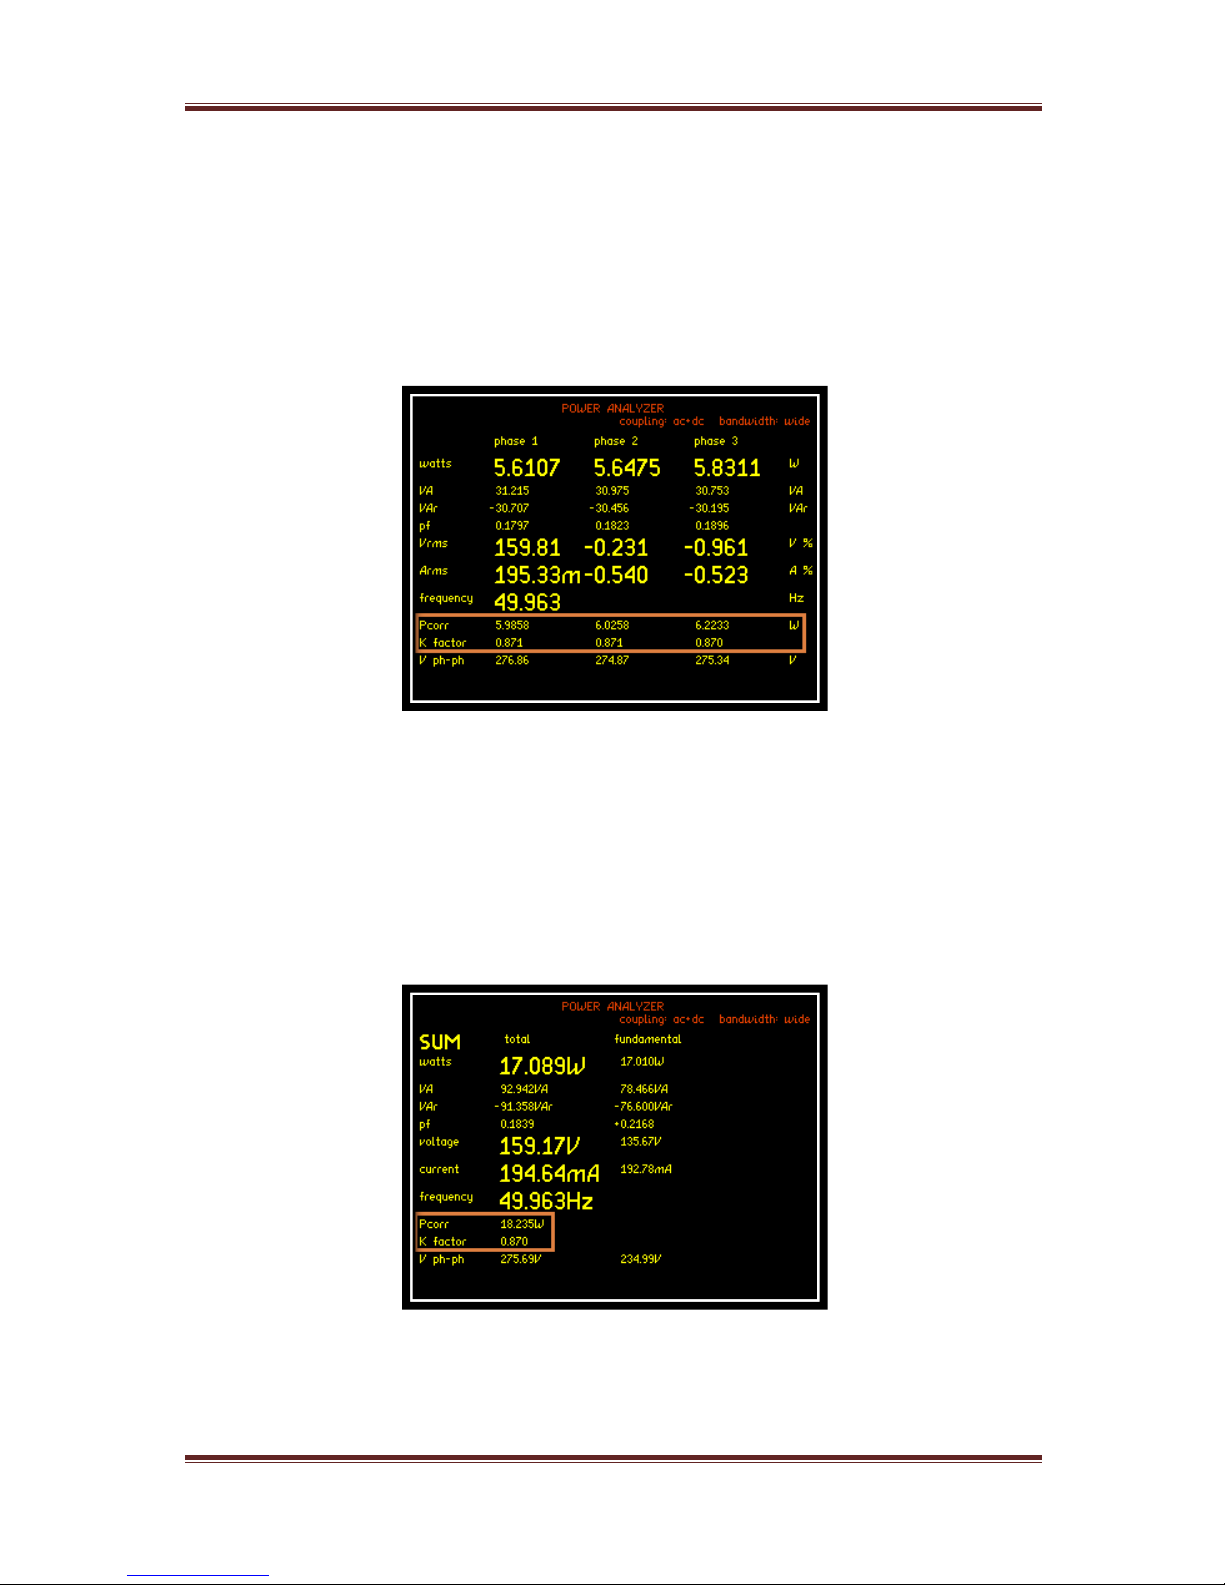
PPA45xx Quick User Guide
Page 69
Pcorr (Corrected Power) and K factor values are also displayed in Three
Phase Transformer mode.
The calculated values for Pcorr and K factor are displayed for each phase; this
can be seen in the Orange box below:
On the SUM screen the displayed Pcorr value is the sum of the Pcorr values for
each of the three phases.
The K factor displayed on the Sum screen is the average of the K factor values
for each of the three phases.
Page 71
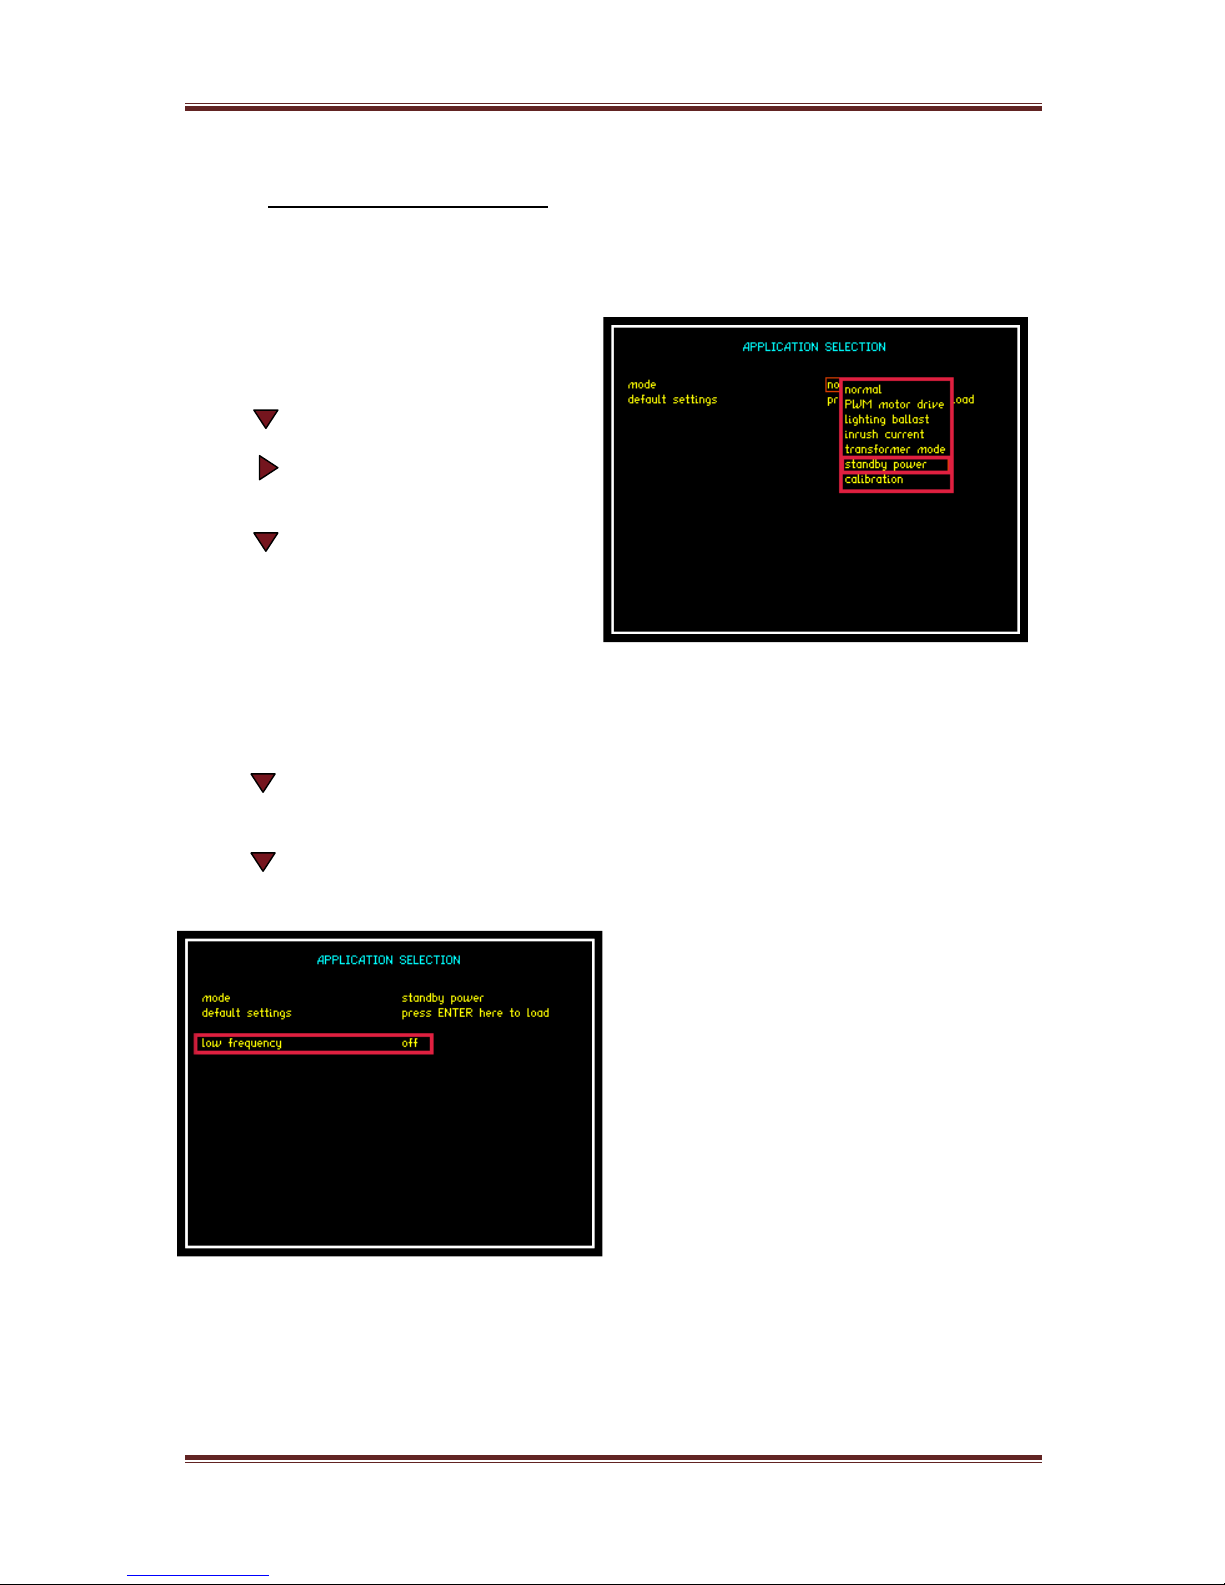
PPA45xx Quick User Guide
Page 70
6.5.5 STANDBY POWER MODE
Power Standby mode will show all power measurements from a device
which is in standby mode
To access standby mode:
Press “APP” button
Press button
Press button. This will open
the drop down menu selections
Press 5 times until red box
surrounds standby power
Press “ENTER” this will now set the
mode
Press to move to default settings and press “ENTER”. The instrument
will now set the voltage and current measurement parameters
Press to move the cursor to low frequency mode
Pressing “ENTER” to load the
applications default settings will
automatically set the low frequency
parameter to “OFF”
You can now return to the Power Analyzer screen
Page 72
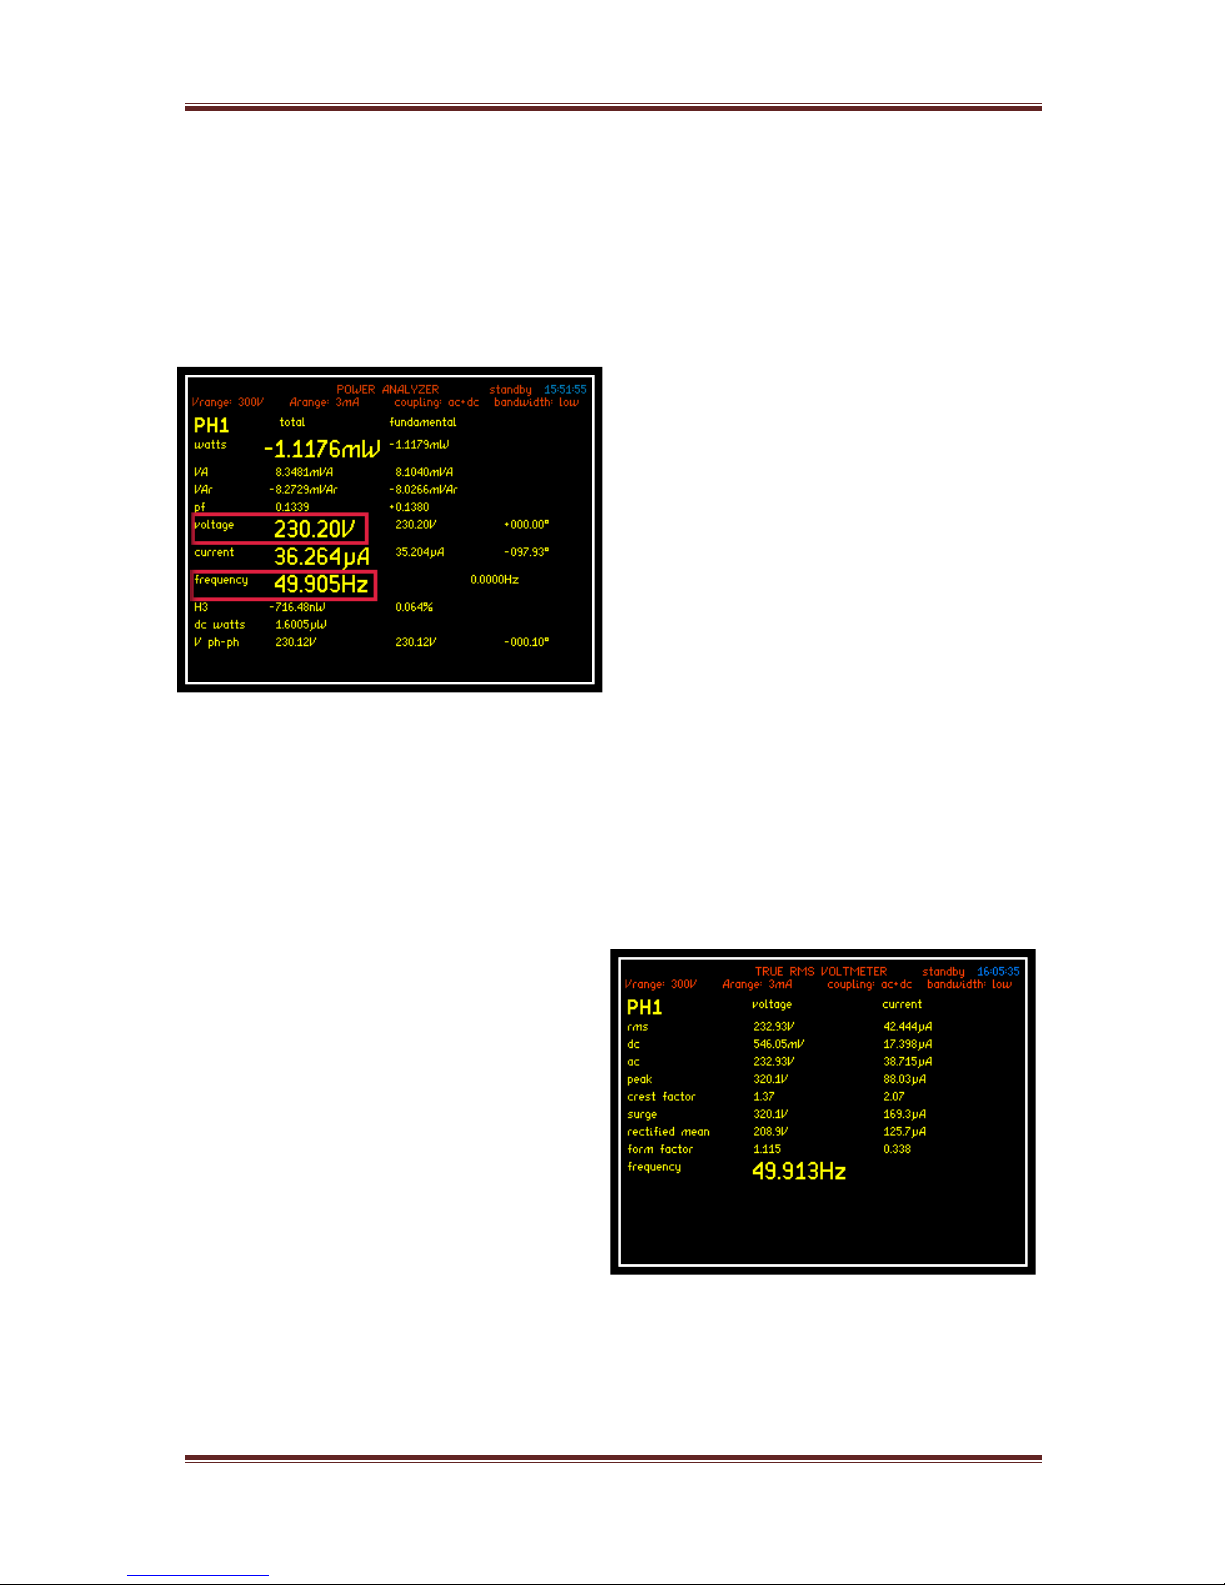
PPA45xx Quick User Guide
Page 71
Test device: 1 x Stand alone Heater
Accessories: 1 x Break Out Box
The real time display shows a
screenshot from the Power
Analyzer home screen with
the test device in standby
mode
Reverting to the “RMS” screen you
can see all the subsequent voltage
measurements from each phase
associated with the test unit in
Standby Mode
Page 73
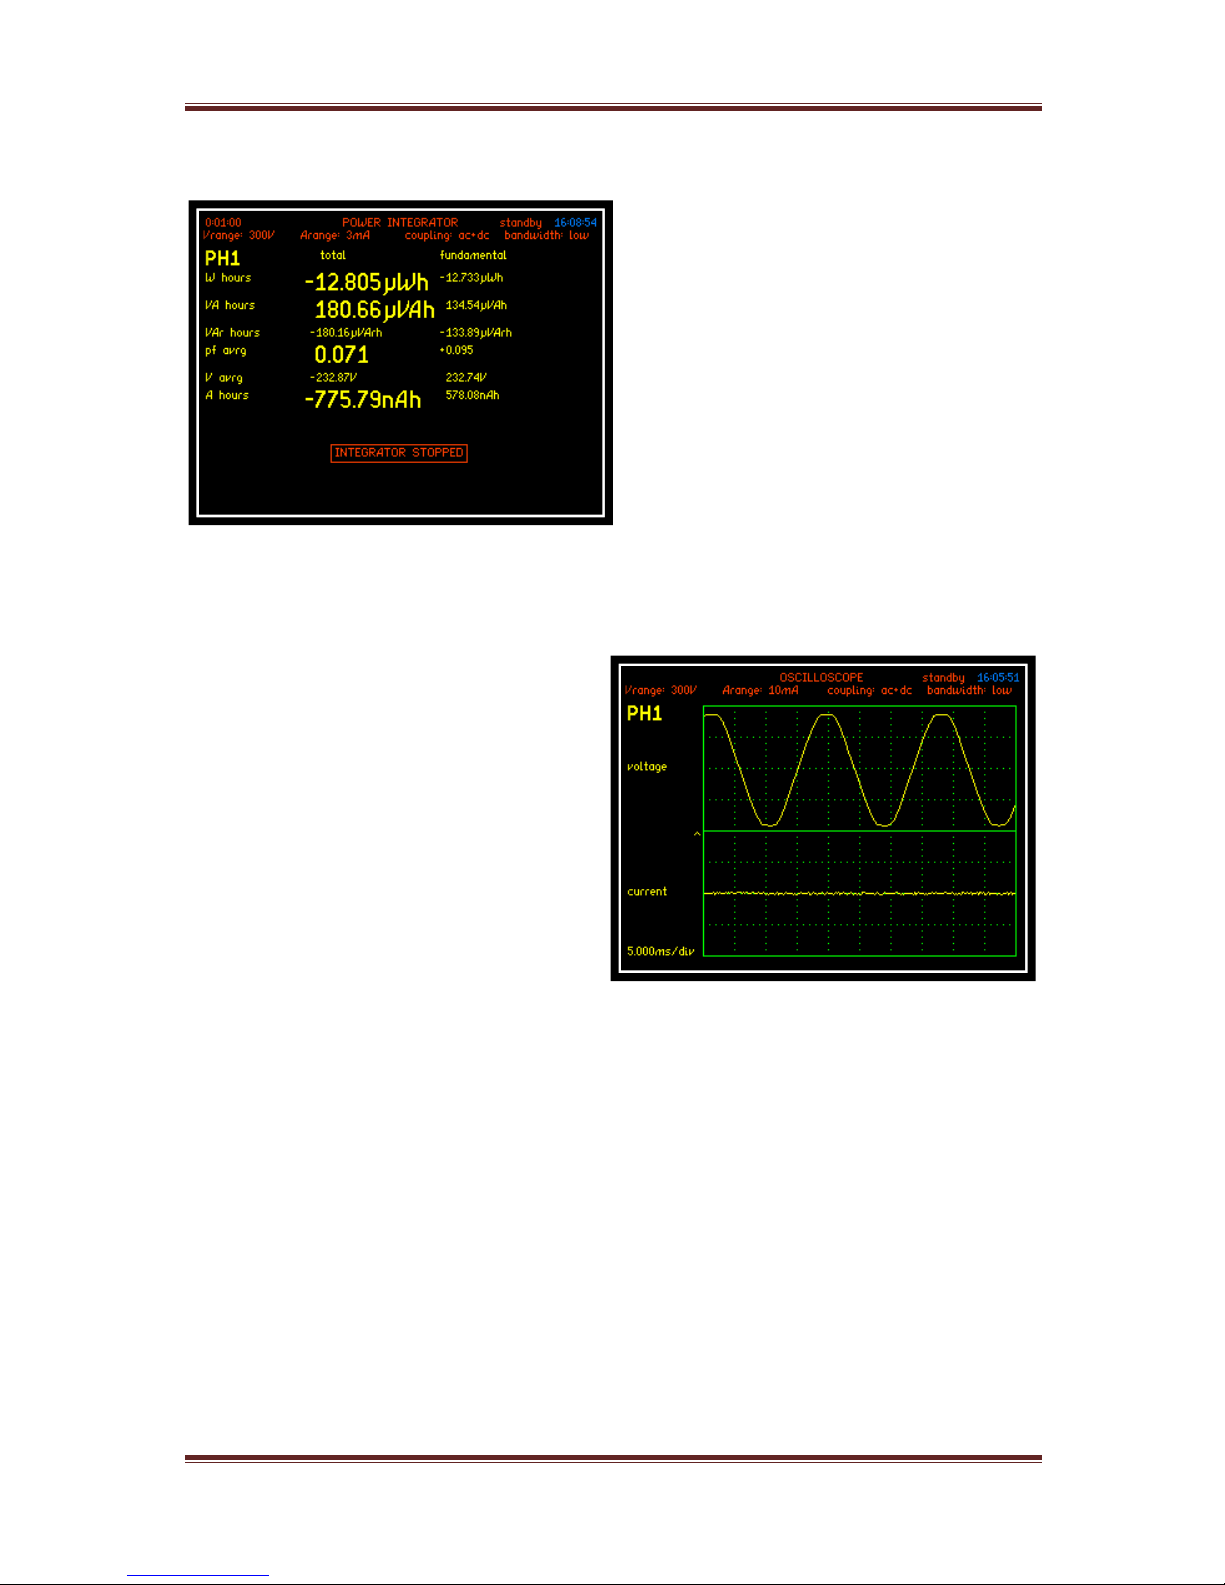
PPA45xx Quick User Guide
Page 72
Left is a display taken from the power
integrator screen “INTEG”, displaying
a 1 minute integration of the power
being consumed
Press “SCOPE” button to view the
Voltage and Current waveforms
being produced by the device
under test.
Page 74

PPA45xx Quick User Guide
Page 73
6.5.6 CALIBRATION MODE
Calibration Mode is to be used in combination with N4LCal (N4L Calibration
software) which facilitates performing manual calibration with an external
source. This software is supplied with a detailed manual describing the
calibration process, for more information contact N4L on the following email;
Page 75
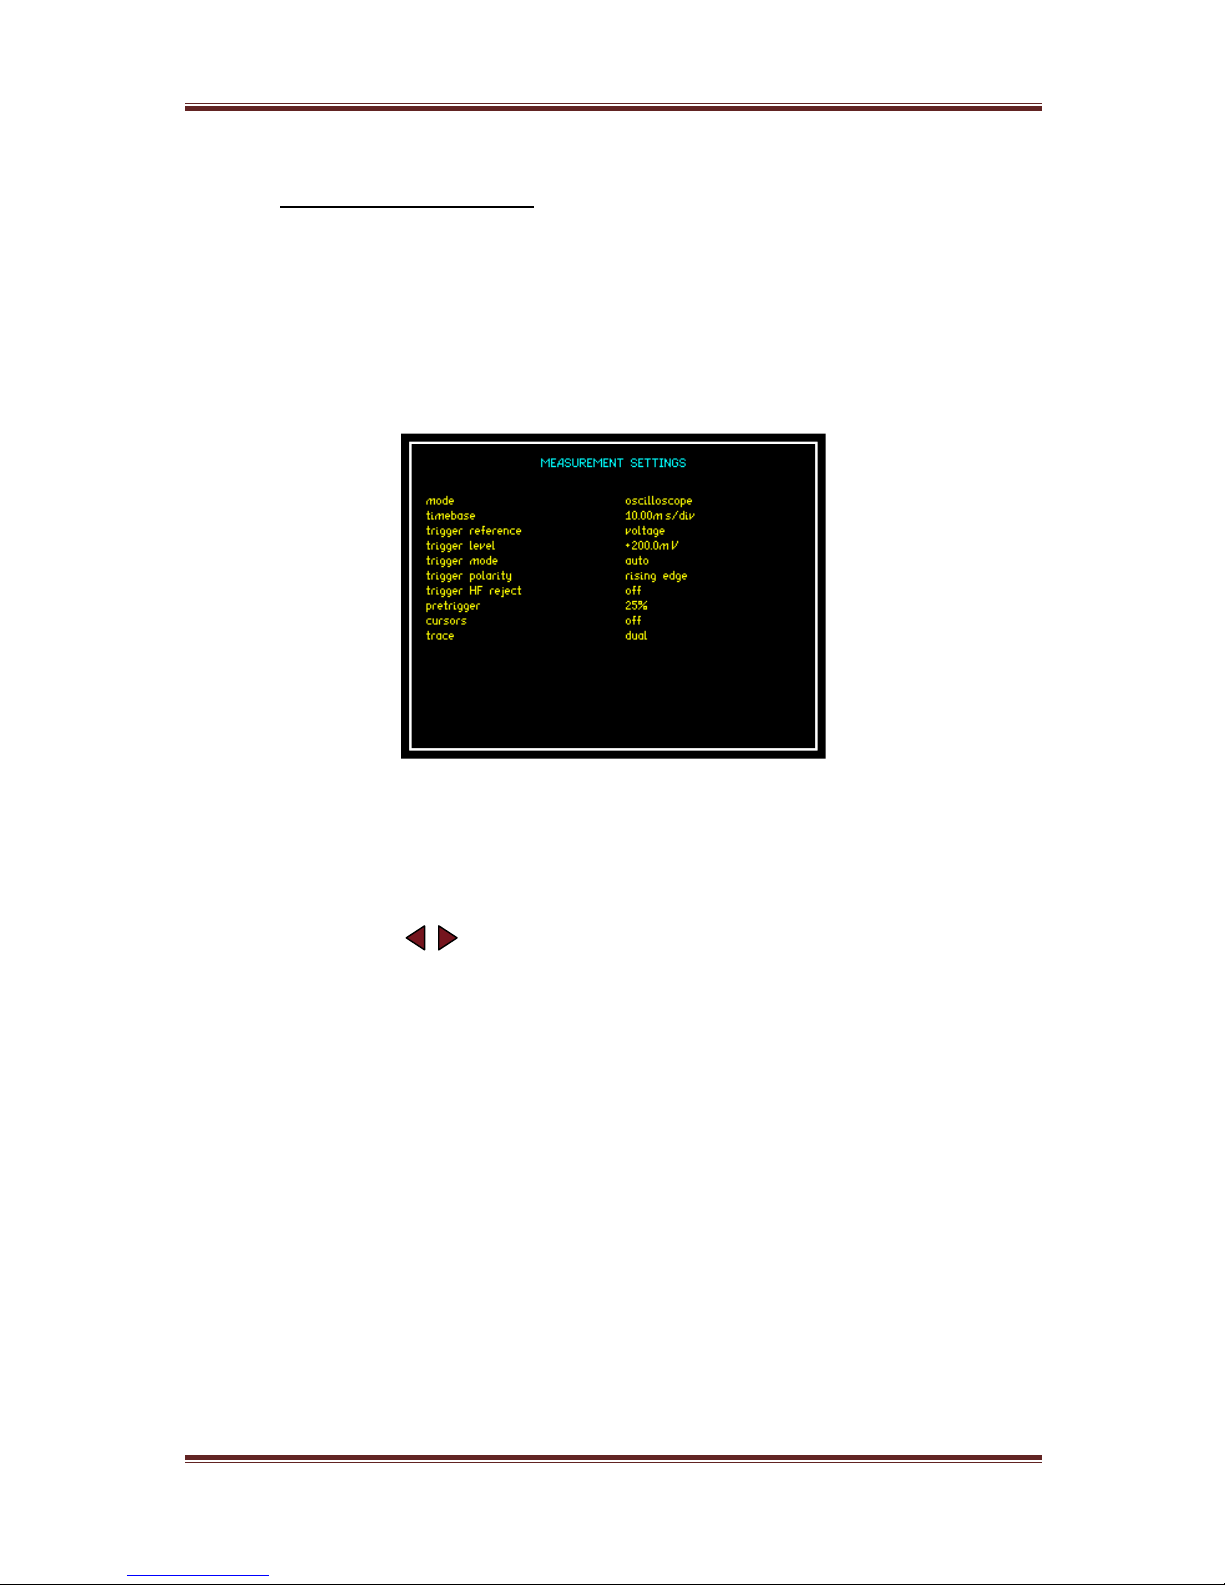
PPA45xx Quick User Guide
Page 74
6.5.7 OSCILLOSCOPE MODE
The PPA45xx provides a digital storage oscilloscope function in order to view the
waveforms being measured.
The settings for the oscilloscope are configured by pressing the “SCOPE” button
twice
Upon entering the “SCOPE” menu, the following screenshot will be displayed
Timebase: The display for the oscilloscope is divided into 10 divisions along the
time axis with the selected timebase displayed in the bottom left hand corner of
the display. The timebase may be set to any real value between 15μs/div to
5s/div. Pressing the arrows on the main panel will adjust the timebase by
a factor of 2
Trigger Reference: The data source for the trigger can be selected to be
either Voltage or Current. On a multiphase instrument, any of the phases may
be selected for the trigger source.
Trigger Level: The trigger level is set directly in Volts or Amps in relation to
the trigger reference settings and does not change if the range is changed. The
trigger level is displayed by a small > on the extreme left hand edge of the
display. If the trigger is set to a value above or below the range of the input
channel then a small carat ^ is shown at the top or inverted at the bottom of the
display as appropriate
Page 76
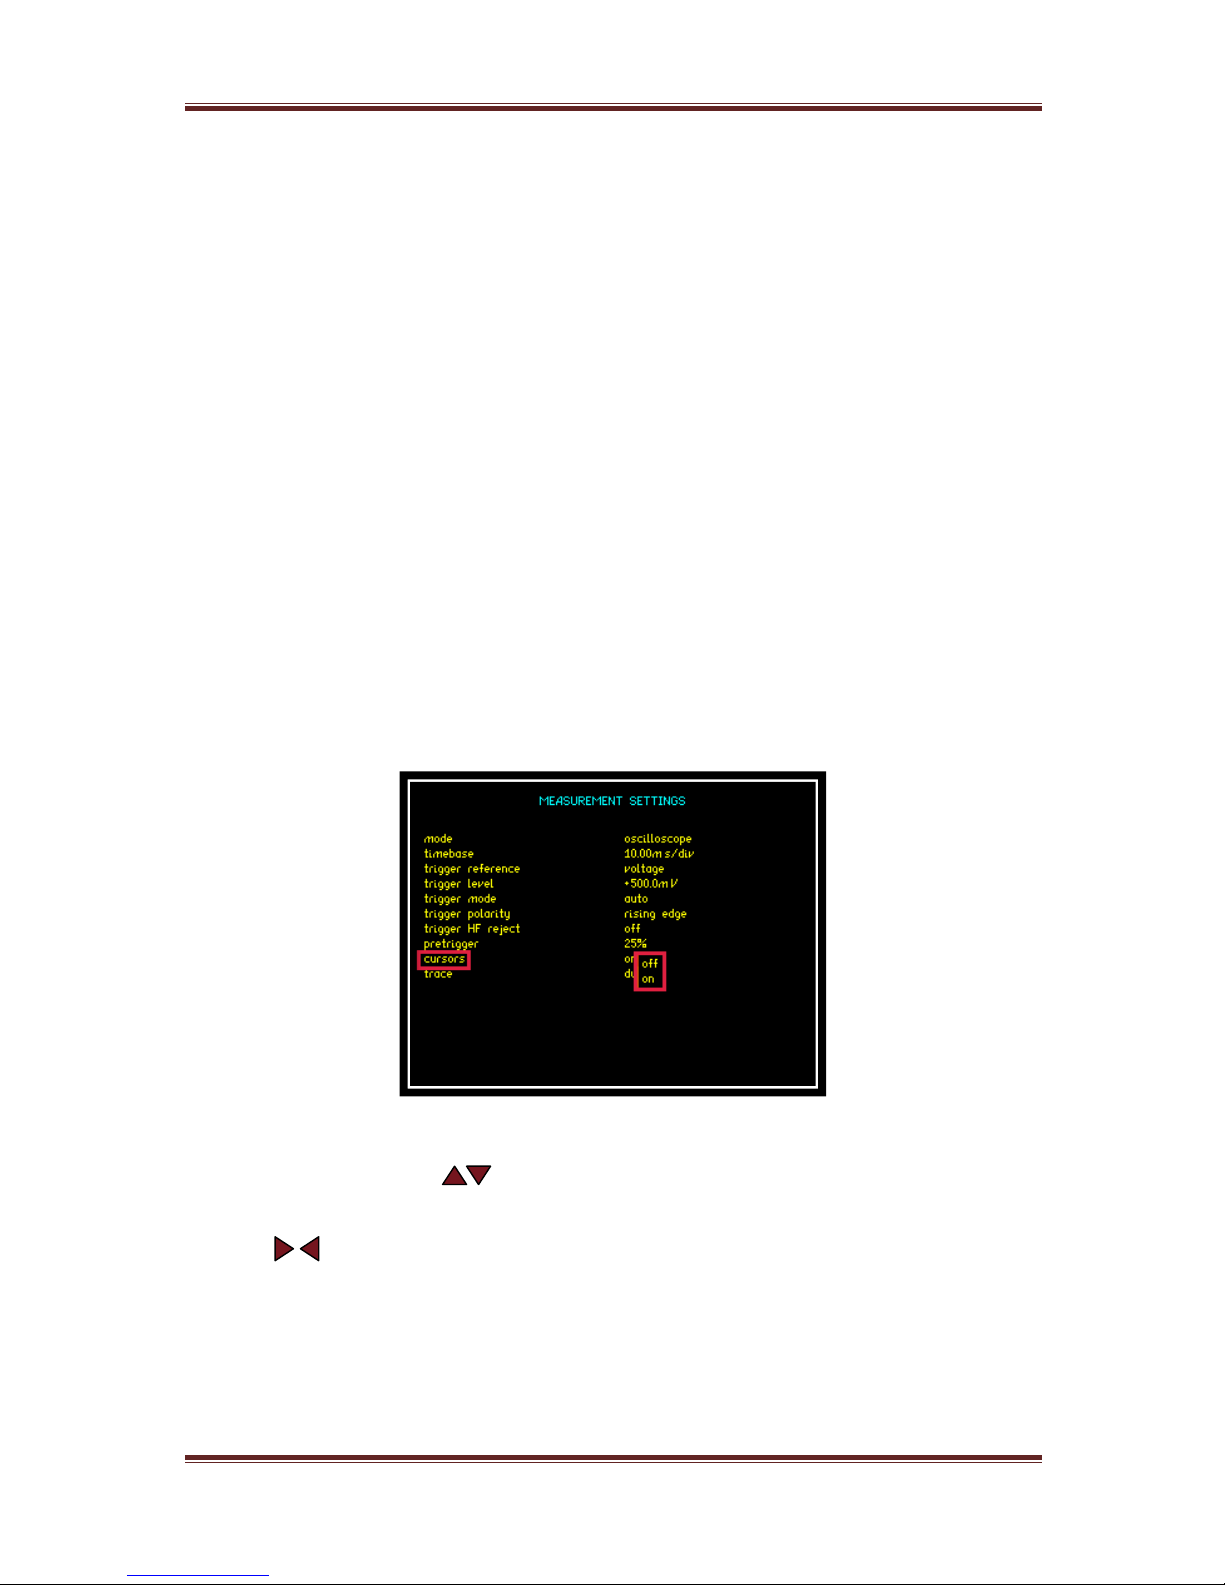
PPA45xx Quick User Guide
Page 75
Trigger Mode: The trigger mode may be set to be;
Auto (trigger if possible but do not wait)
Normal (wait indefinitely for trigger)
Single shot (wait for trigger then hold)
The single shot option is reset using the “TRIGGER” key
Trigger Polarity: The trigger polarity may be set to rising edge or falling edge
Trigger HF Reject: Select to be either “ON” or “OFF”. When set to “ON” a low
pass filter is applied to the trigger data to stabilise the trace with noisy signals.
The filter only influences the trigger detection and does not change the data
displayed.
Pretrigger: The pretrigger may be set to none, 25%, 50% or 75% using the
drop down menu
Cursors: Two cursors can be enabled on the display as per the screenshot
below
When enabled use the keys to enable and switch between Cursor 1 and
Cursor 2.
Use the keys to move the selected cursor along the timescale
NOTE:
When the cursors are enabled then the “LEFT” and “RIGHT” arrows no longer
adjust the timebase
Page 77
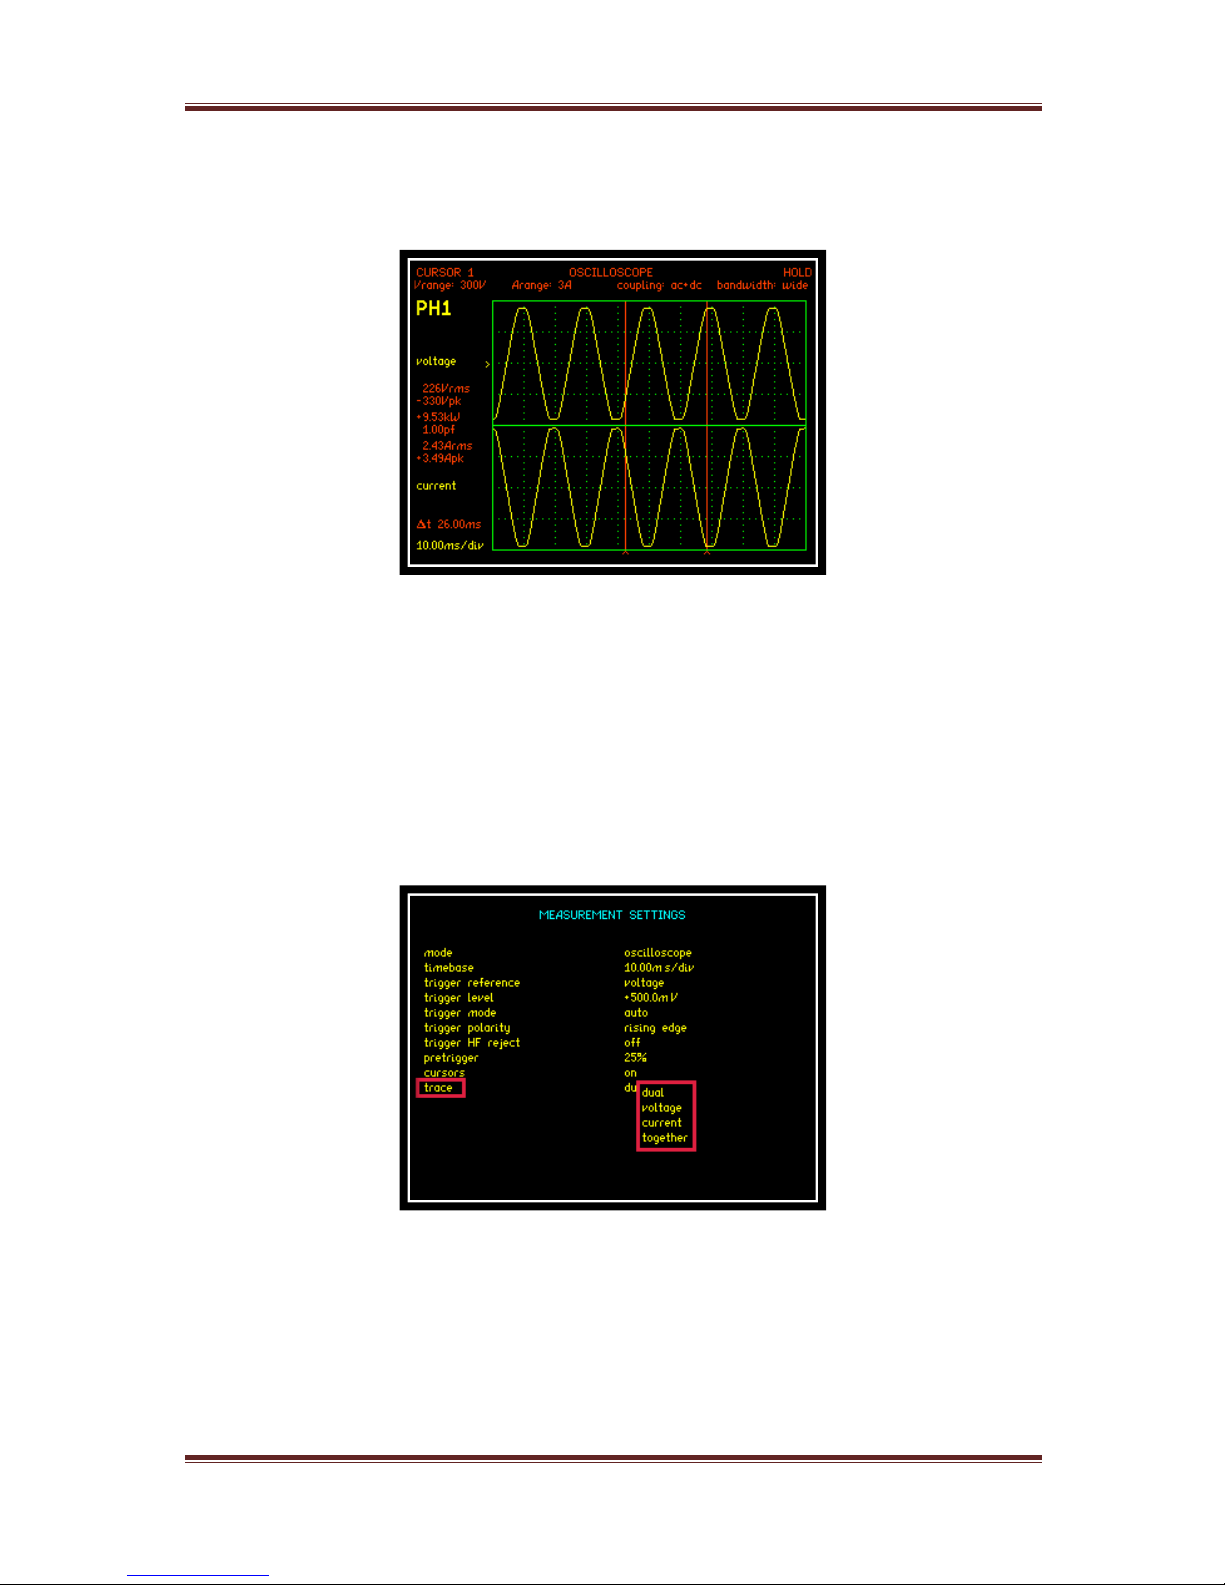
PPA45xx Quick User Guide
Page 76
Screenshot from Scope display with “Dual” cursors configured
From the screenshot above the display shows all fundamental measurements
from the position of cursor 1. Also displayed is the time difference between the 2
cursors, “delta t” = 26.00ms with the timebase set to 10ms/div
Trace: Set which waveform the user wishes to be displayed at any one time
from the 4 options within the drop down menu
Page 78
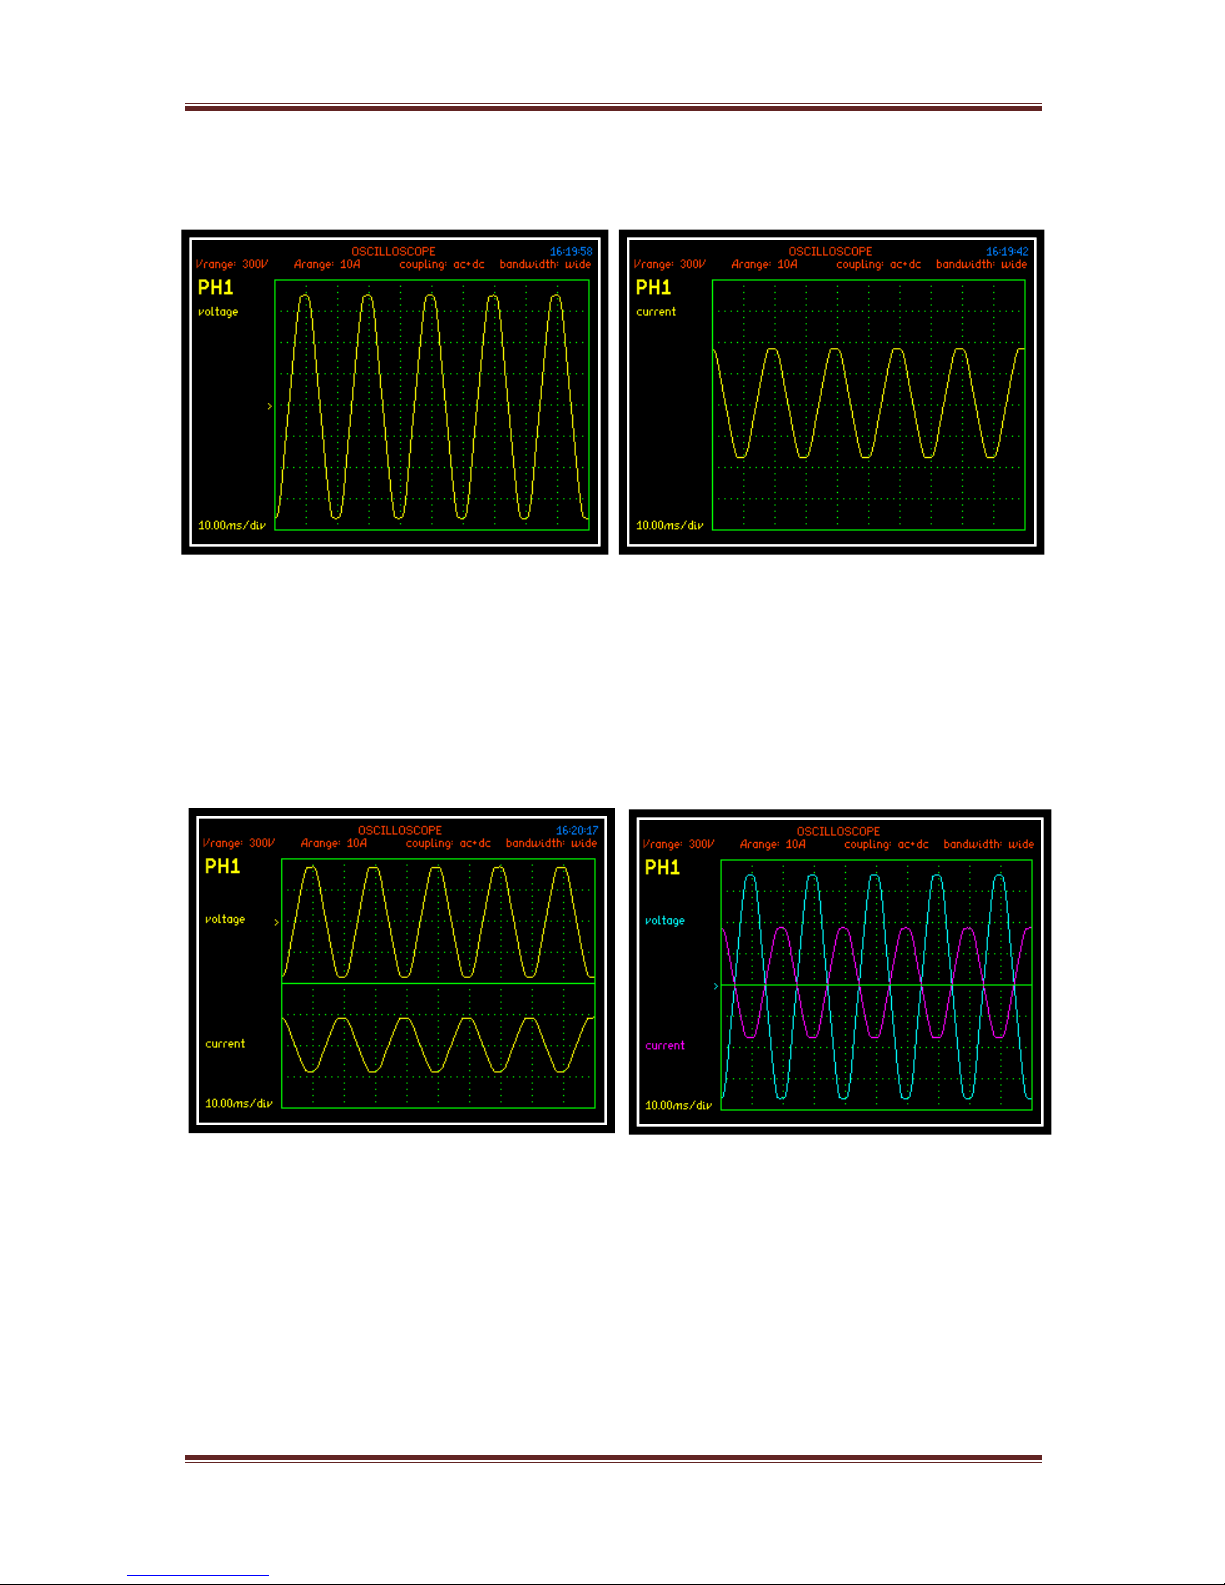
PPA45xx Quick User Guide
Page 77
Trace set to Voltage: Trace set to Current:
Trace set to Dual: Trace set to Together:
Page 79
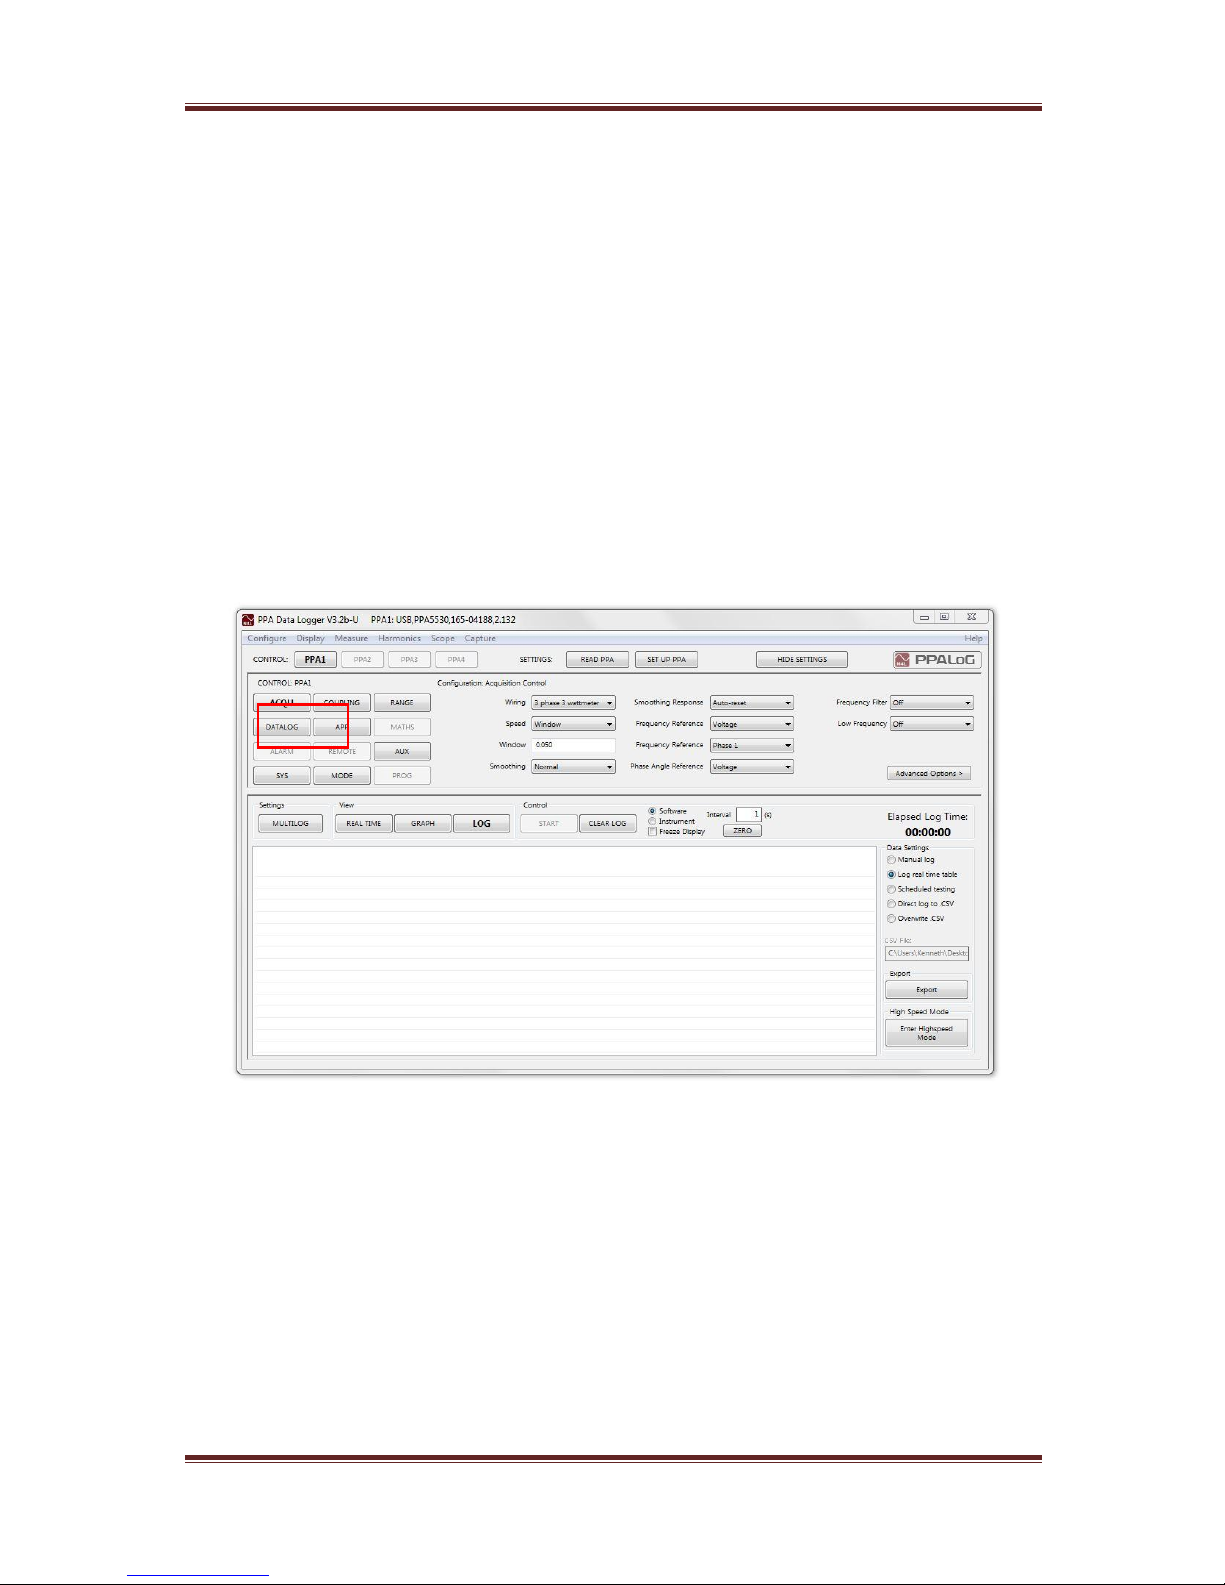
PPA45xx Quick User Guide
Page 78
6.5.8 Interharmonic Sweeps
Interharmonic voltages and currents can be measured and displayed in an
Excel report using PPA Datalogger software.
Connect the PPA5500 to PPA Datalogger version v3.1b or above.
Set up the software according to the following steps:
Step 1. (Optional)
Click on ACQU.
Set Speed to the required setting. If “Window” is selected enter the speed.
Page 80
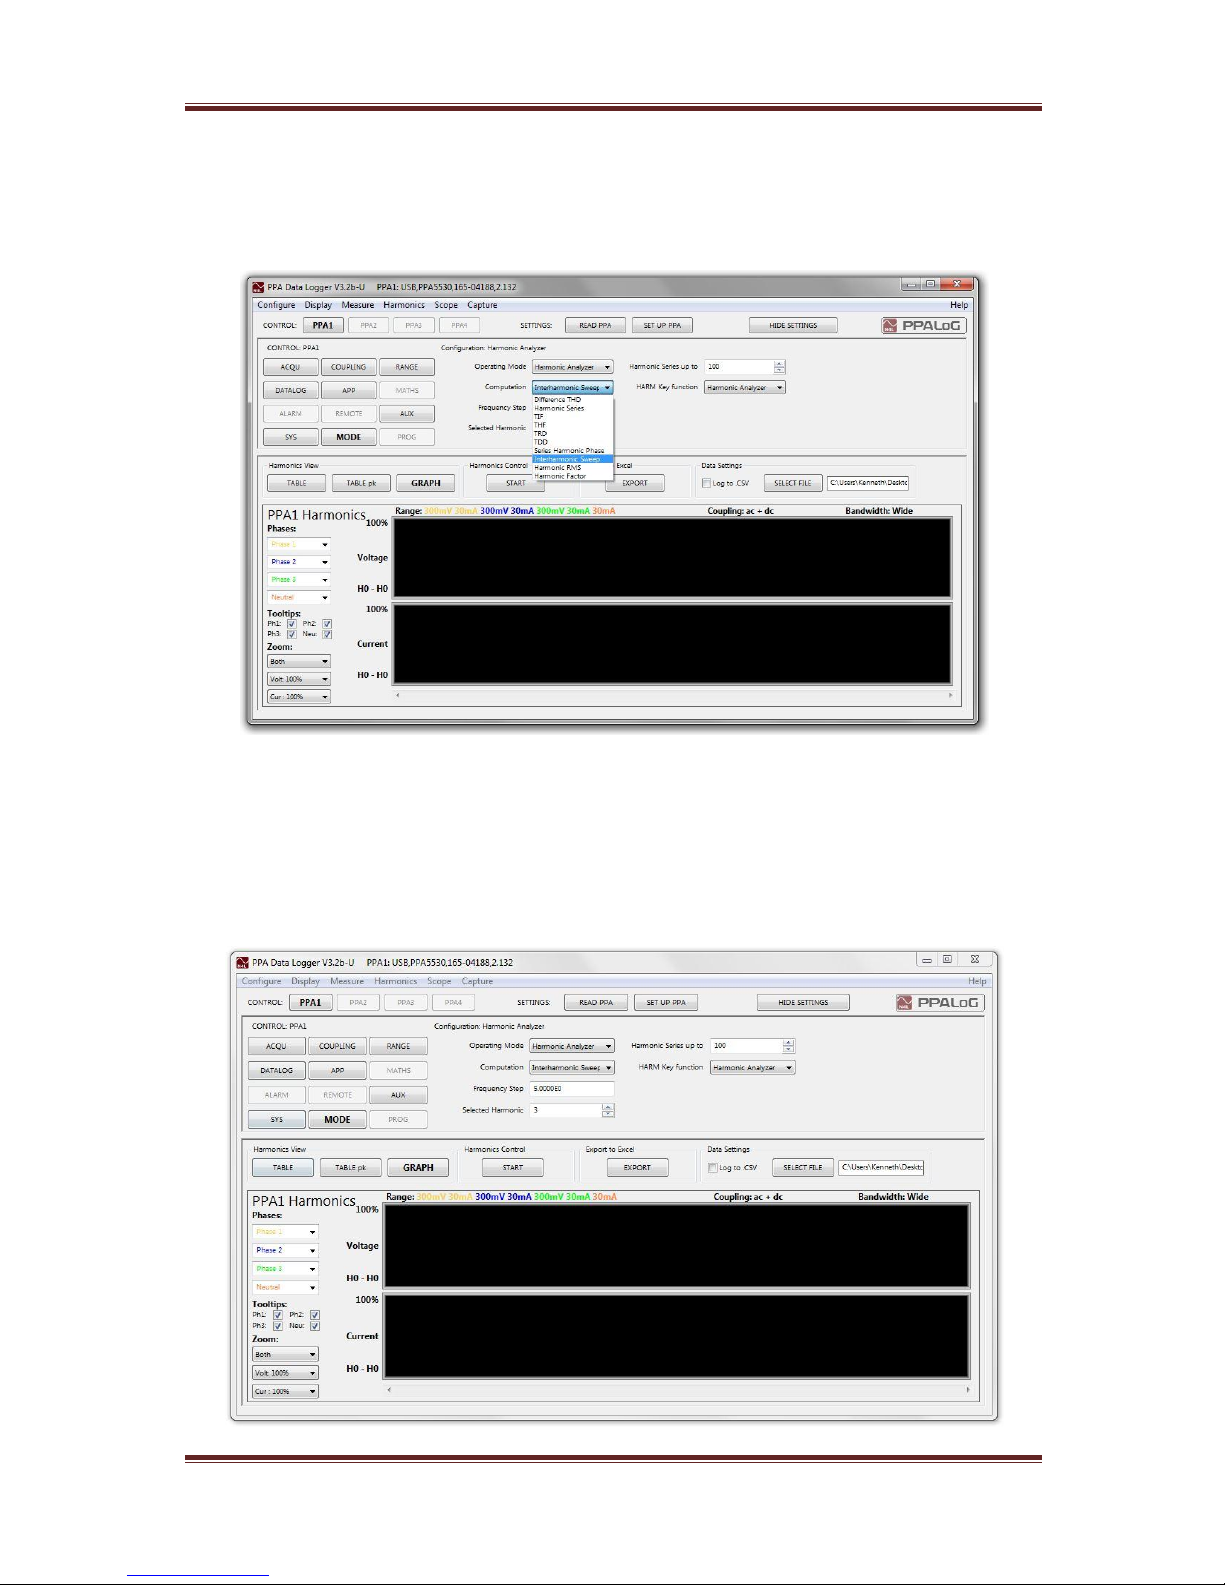
PPA45xx Quick User Guide
Page 79
Step 2.
Enter the Harmonics mode and select;
Computation: Interharmonic Sweep
Step 3.
Frequency Step: Enter the required frequency
Selected Harmonic: Enter the harmonic
Harmonic Series Up To: Enter the number of harmonics to be included in the
sweep.
Page 81
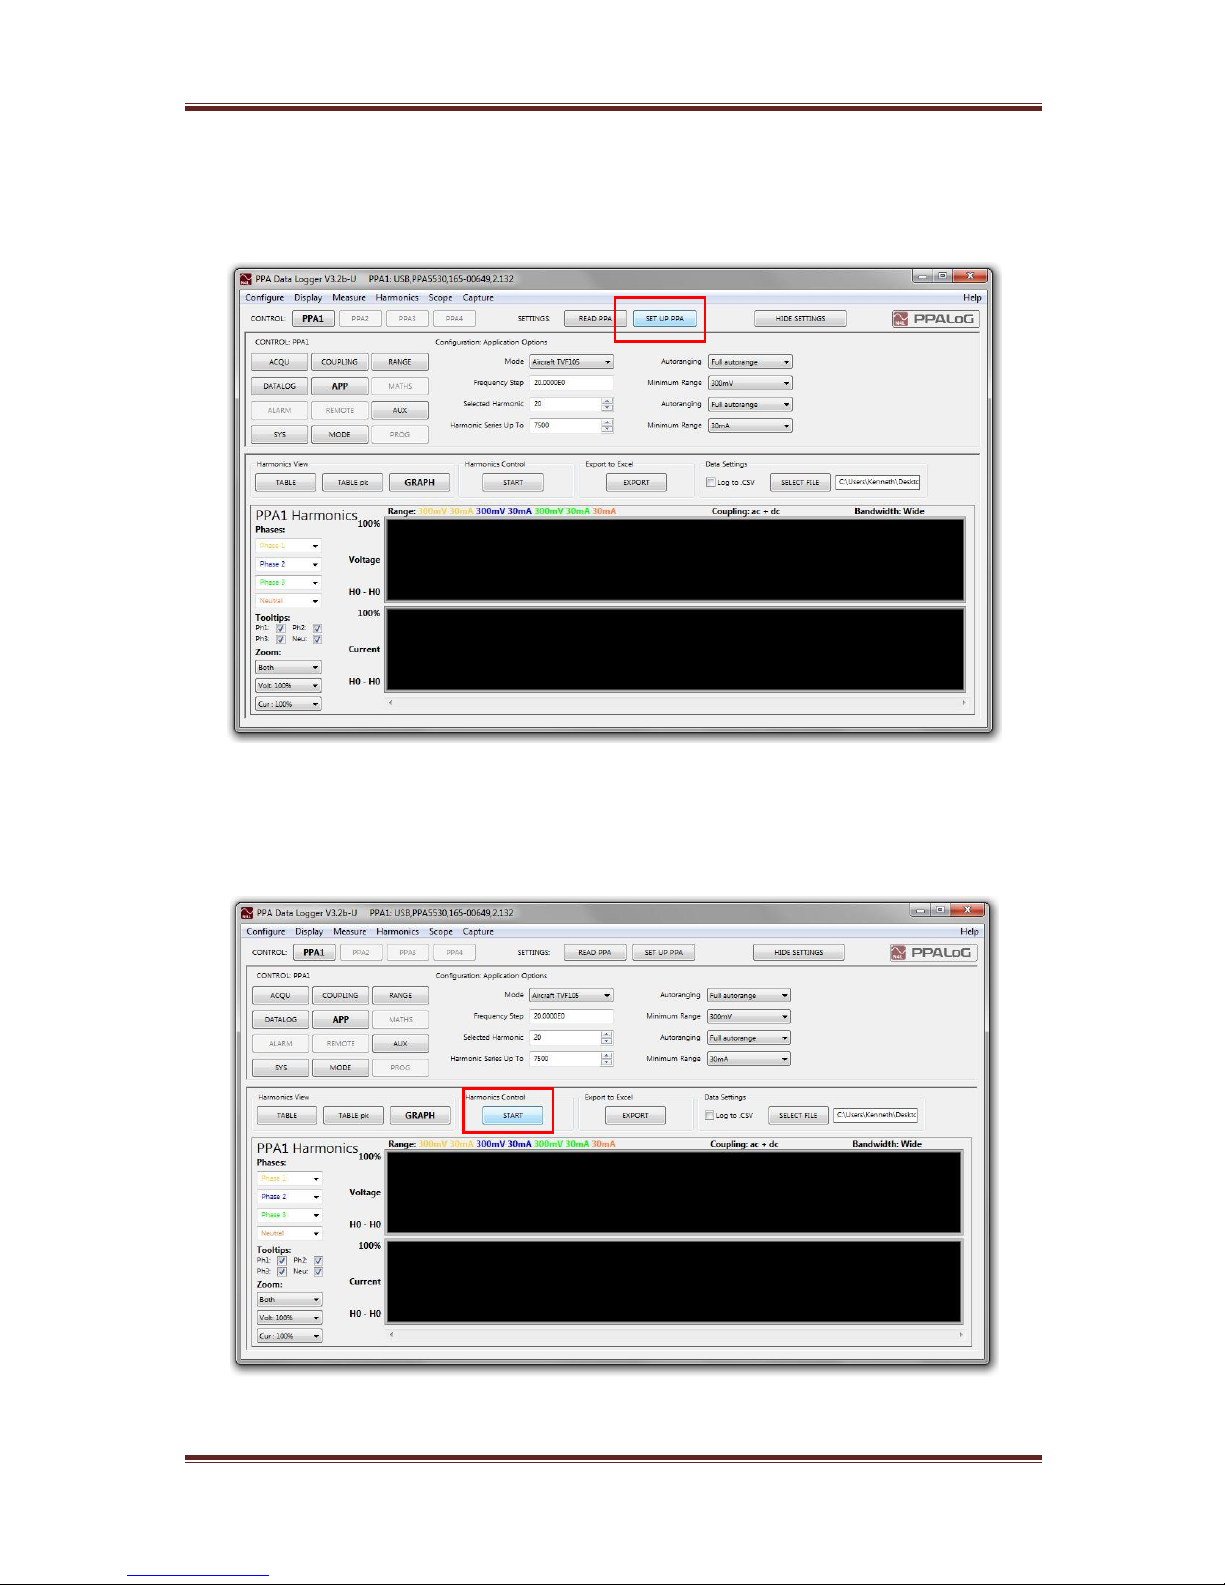
PPA45xx Quick User Guide
Page 80
Step 4.
Click the “Set up PPA” button
Step 5.
Click the “Start” button
Page 82
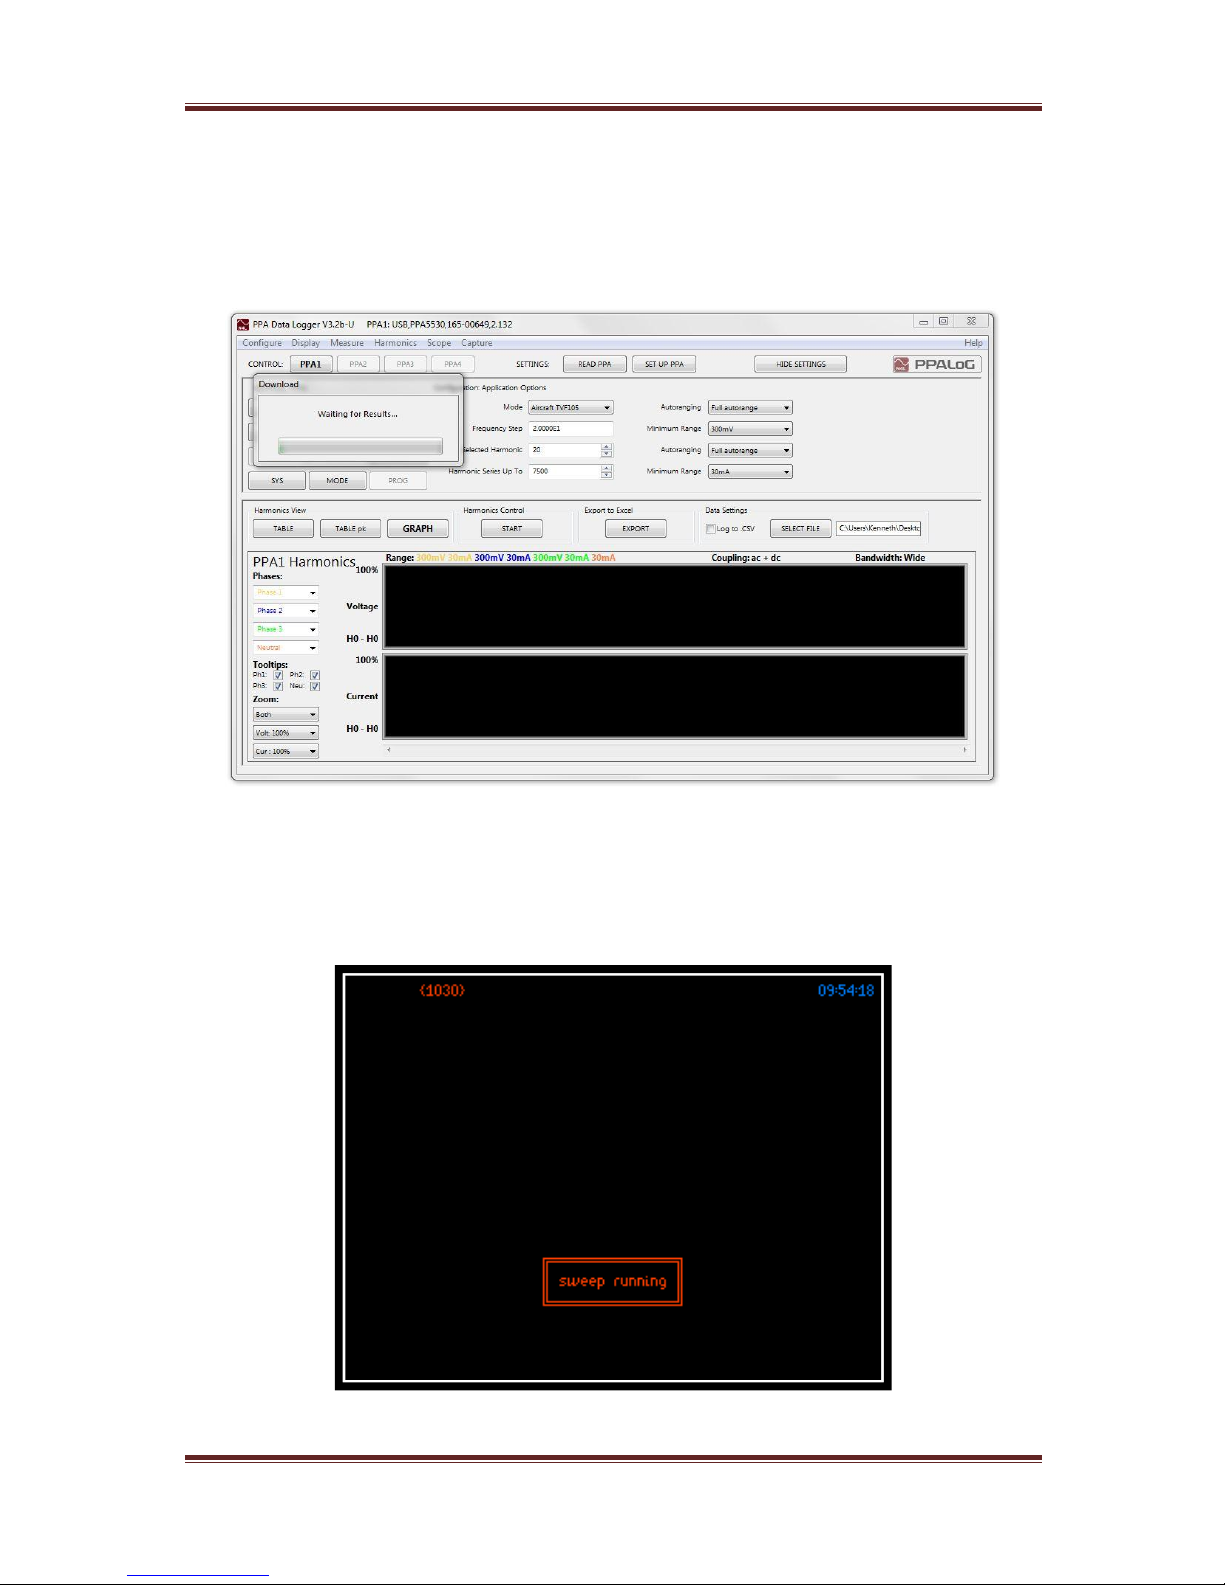
PPA45xx Quick User Guide
Page 81
Step 6.
Wait for test to complete (depends on the PPA speed setting and the number of
harmonics included in the sweep)
The software will display a message: “Waiting for Results”
Depending on the settings selected, a flashing message may be displayed on the
PPA: “Sweep Running”
For all settings entered, the test number will be seen to be incrementing in the
top left hand corner of the display.
Page 83
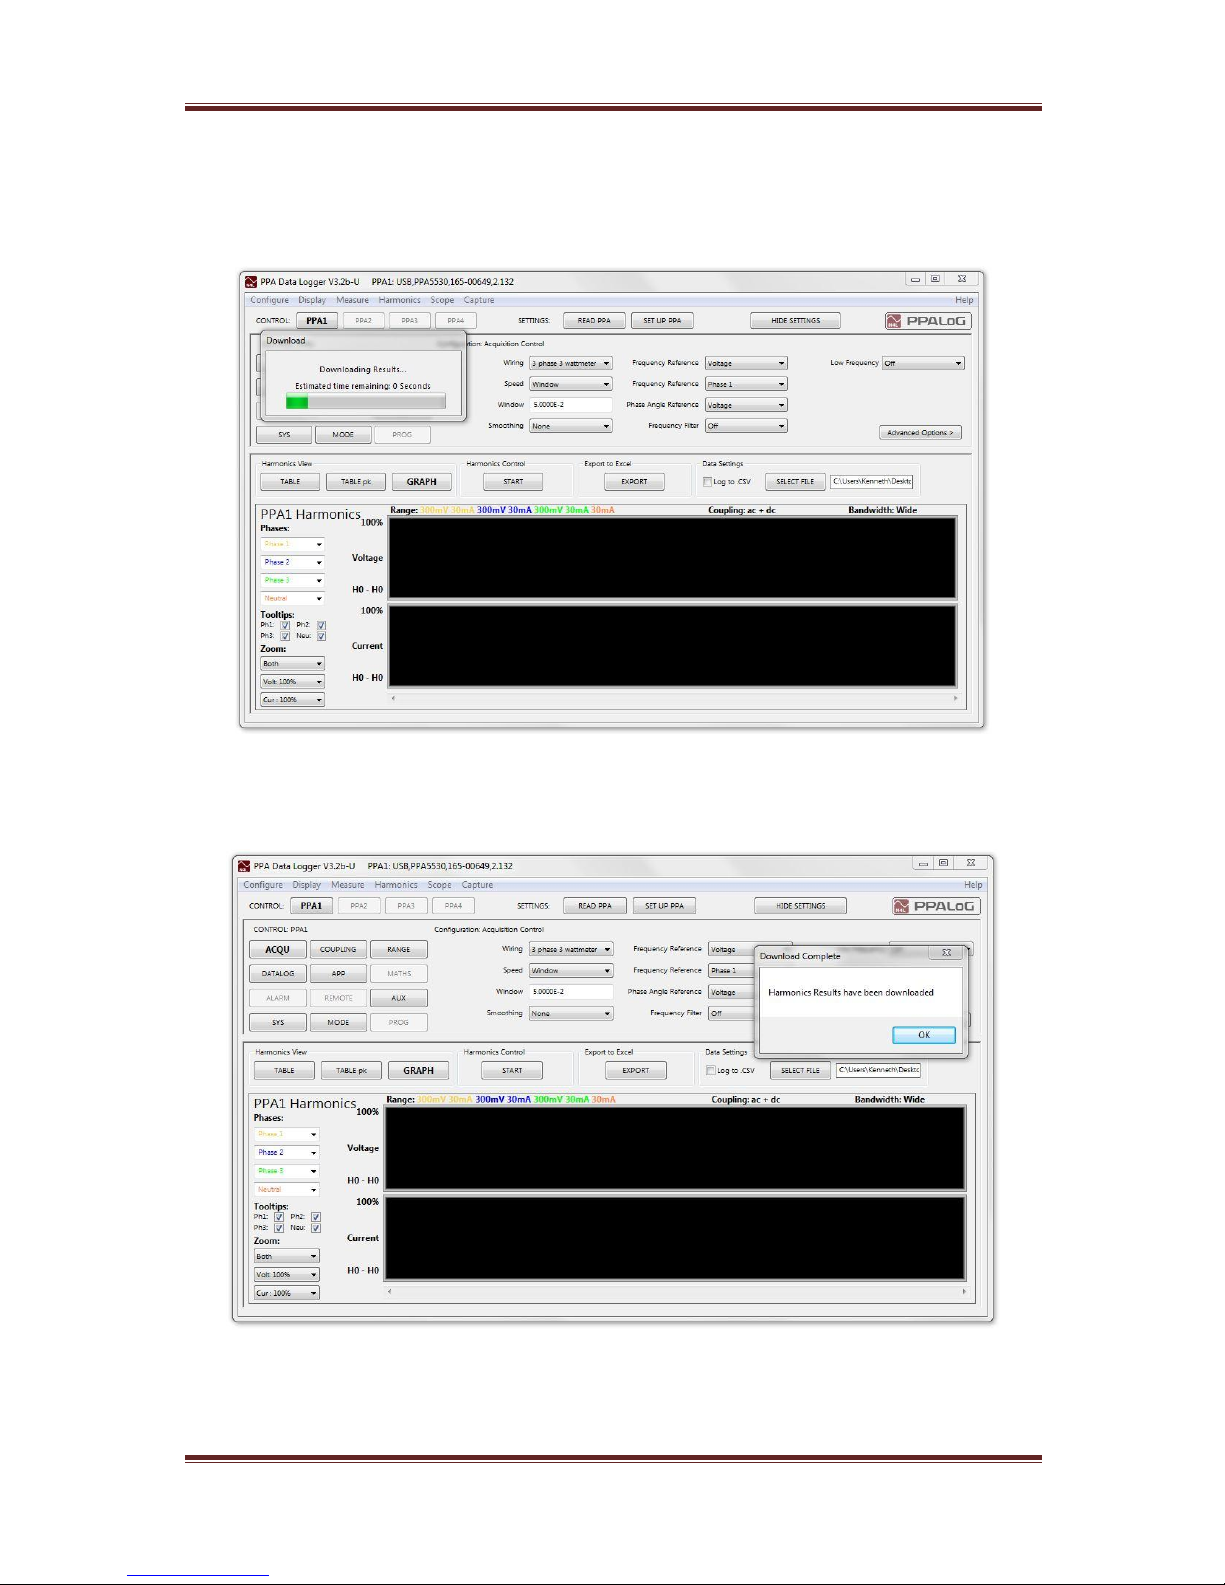
PPA45xx Quick User Guide
Page 82
Step 7.
On completion of the tests the software will start to download the results from
the instrument.
The message is updated once the results have been downloaded.
Page 84
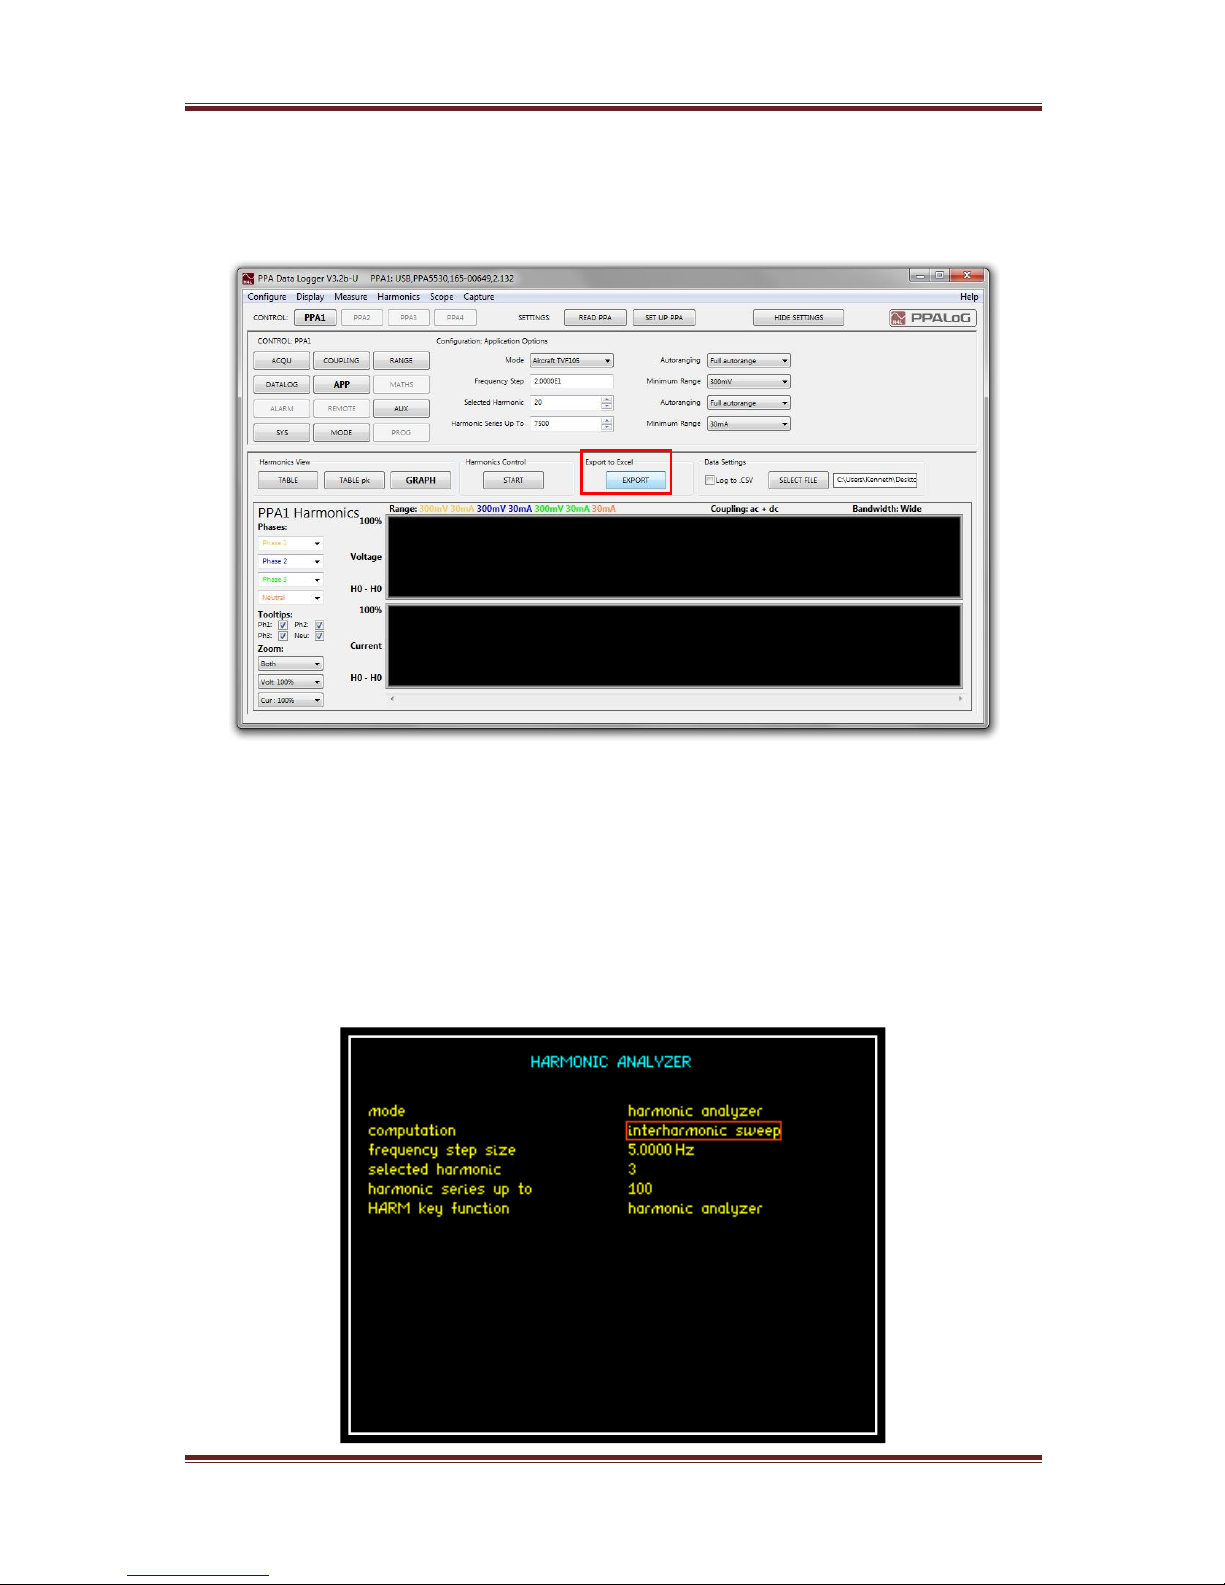
PPA45xx Quick User Guide
Page 83
Step 8.
An Excel results document can be created by clicking on the Export button in the
software.
Note:
Rather than performing steps 1-4 above the settings can instead be entered on
the PPA. Press the ACQU button and entered the required speed setting.
Press the MODE button and select Harmonic Analyzer mode and Interharmonic
sweep. Enter the required values for “Frequency step size”, “Selected harmonic”
and “Harmonic series up to”. Finally click on the “Read PPA” button in the
software to transfer the settings from the PPA into the software. Ensure the
software is displaying the Harmonic test window and then proceed from step 5
above.
Page 85
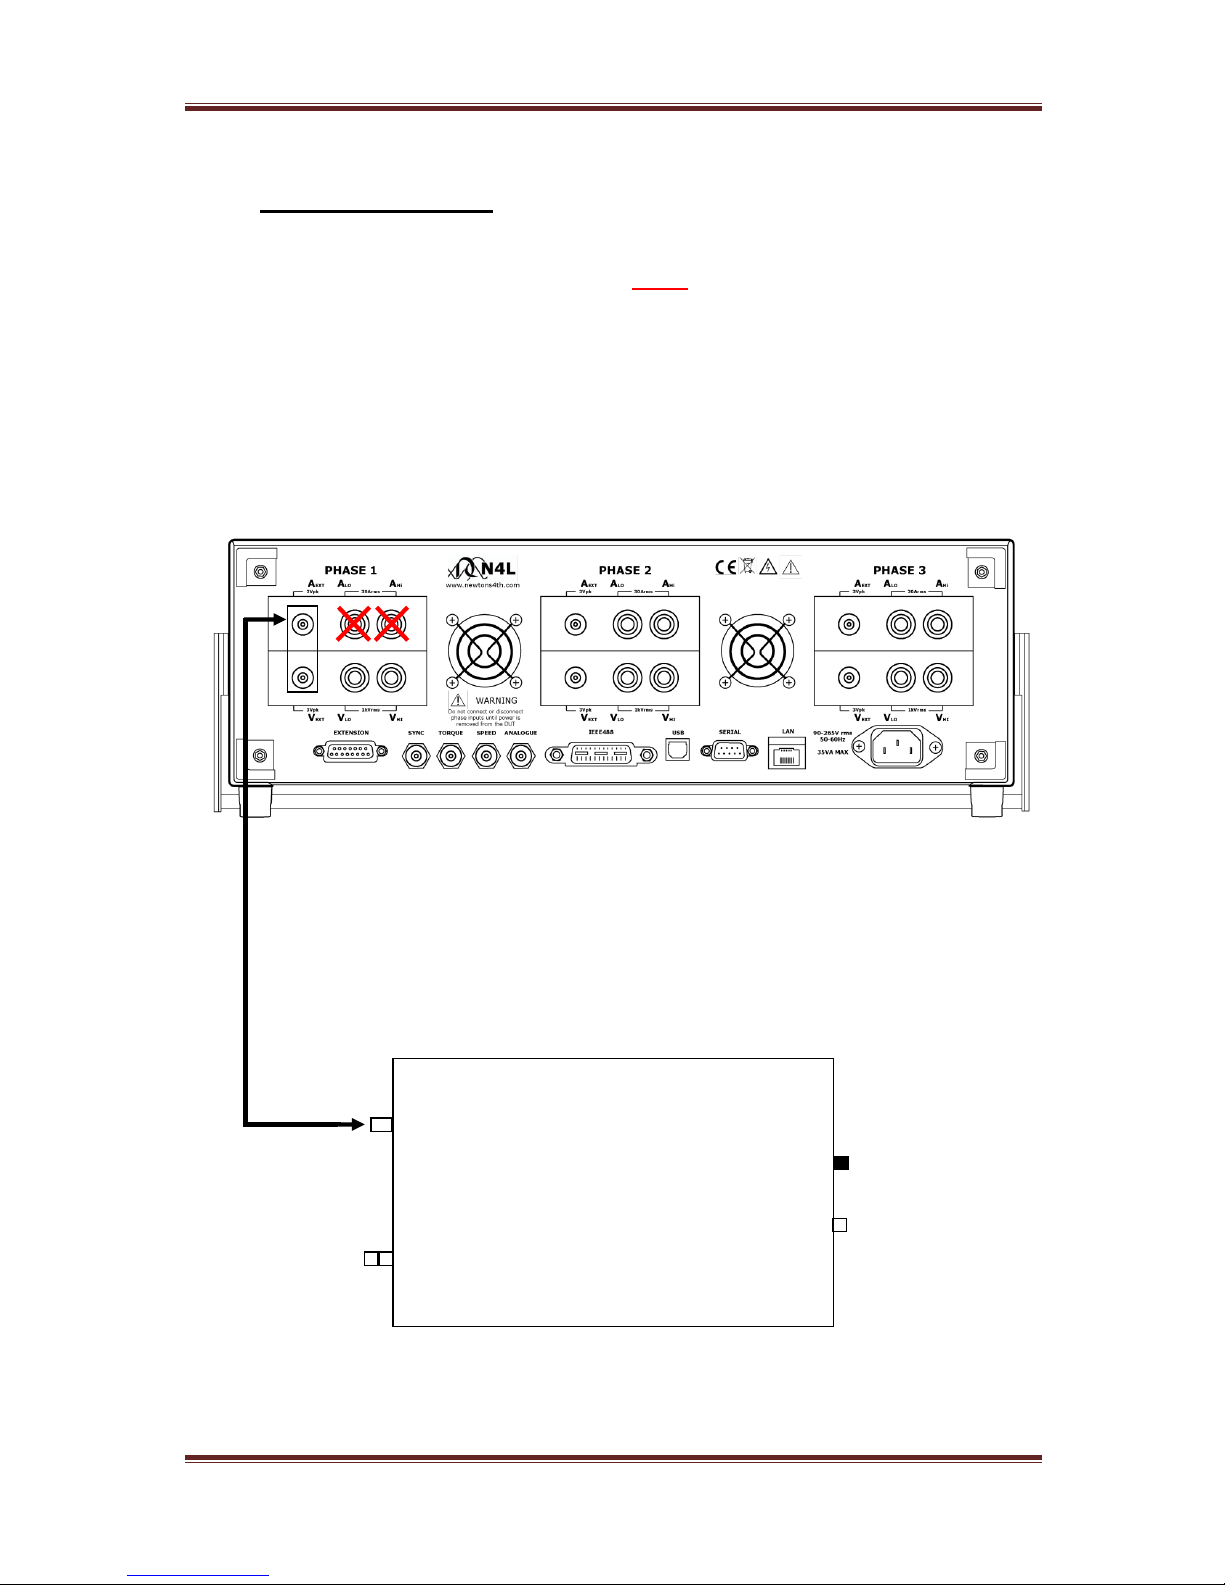
PPA45xx Quick User Guide
Page 84
6.5.9 HF Current Shunts
External current shunts can be used as an alternative to the instruments internal
shunt as a fixed value Impedance circuit. Note do not use both shunts together
Test equipment for demonstration:
1 x Inverter/Motor test unit (single phase)
1 x HF 003 Current Shunt (shunt resistance = 470mΩ)
Wiring Configuration:
Connect BNC safety lead between the “A EXT” BNC on the
rear of the PPA45xx and the BNC connector on the HF shunt
*Remember disconnect all leads to appropriate channels internal current shunt*
Set up PPA to read the external current shunt:
HF003 Current Shunt
A Low
A High
BNC
Earth
Stud
Connect Yellow
4mm lead from
source
Connect Black
4mm lead from
Load
Shunt Resistance = 470mΩ
Continuous Current = 3A rms
Max
Page 86
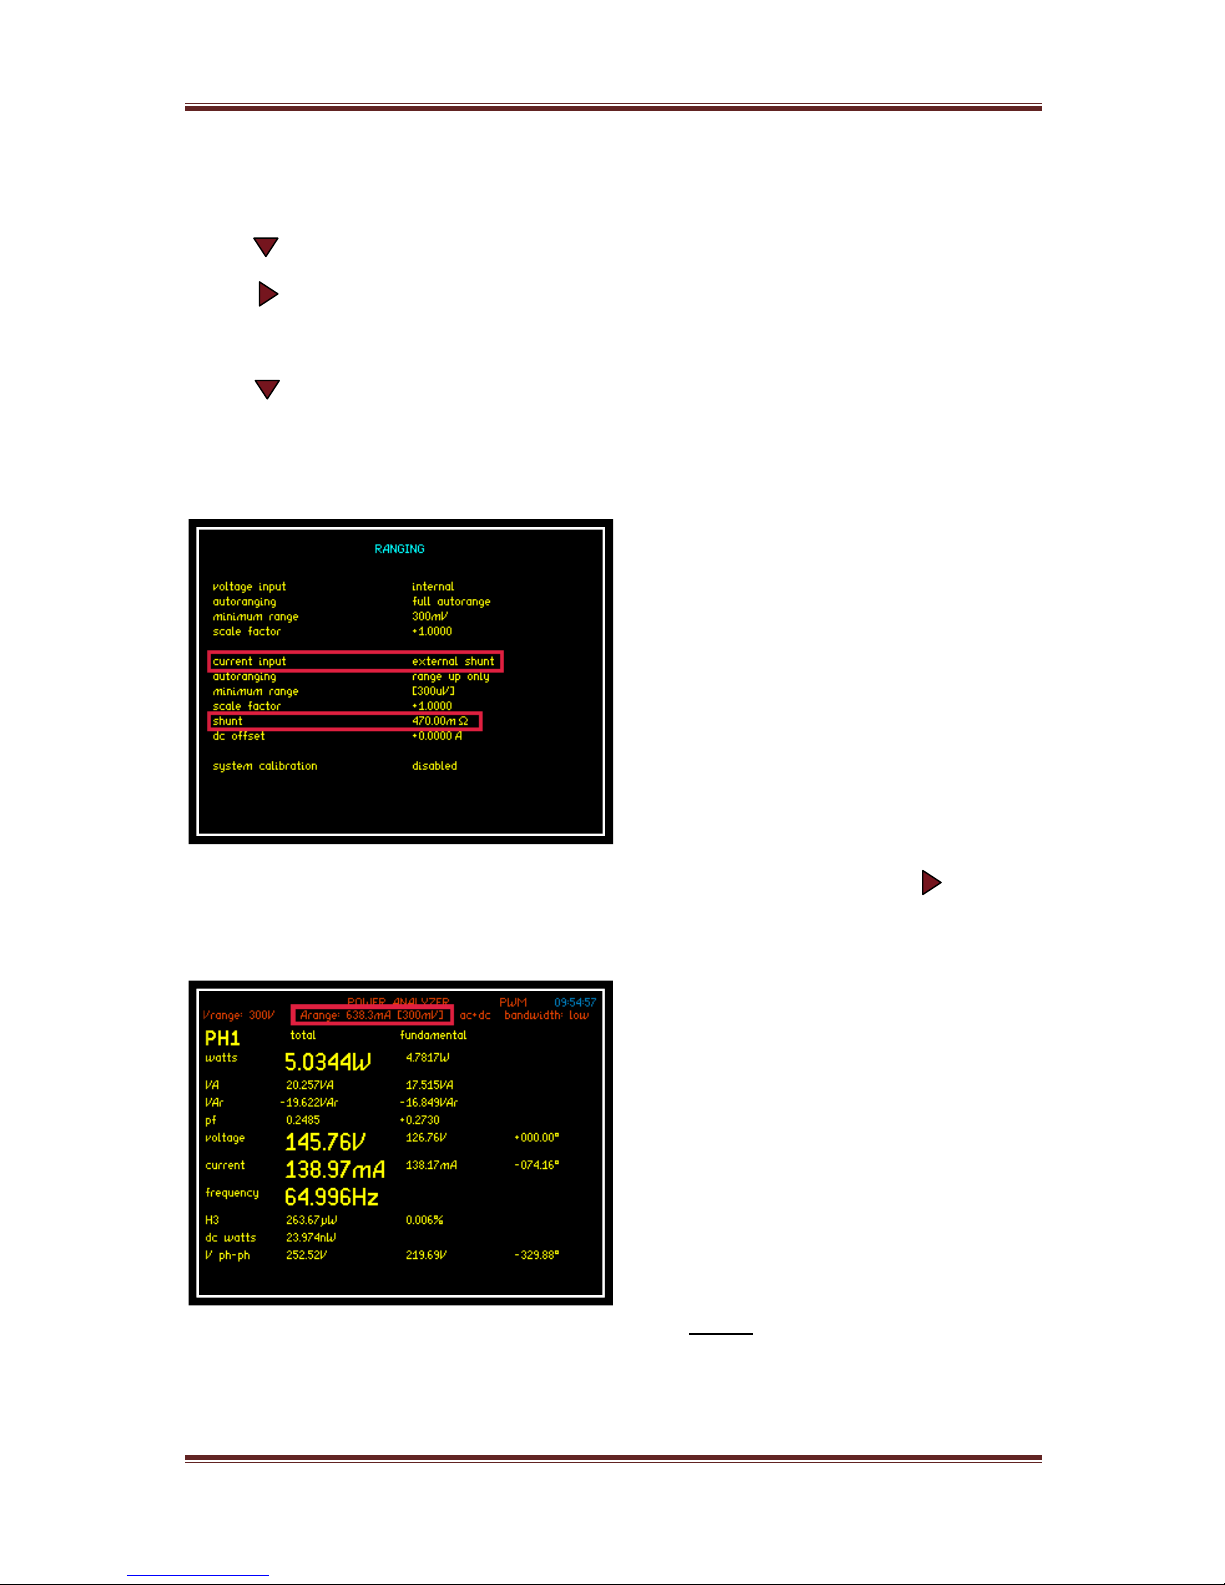
PPA45xx Quick User Guide
Page 85
Press “RANGE” button
Press arrow until black box surrounds the current input parameter
Press arrow and select “external shunt”
Press “ENTER”, external shunt will now be selected
Press arrow until black box surrounds the shunt parameter
Manually input the shunt resistance value
Press “ENTER”, external shunt value will now be selected
If connecting the external shunt to a different channel then use the arrow to
select the correct channel configurations screen as prompted at the bottom of
the “RANGE” home screen
Now going back to the real time
display screen the range selected by
the analyzer is the (300mV) range.
This range is a peak range and the
analyzer will convert this voltage to
the equivalent current range,
dependent upon the shunt value
entered in the “RANGE” menu. In this
case the shunt value is 470mΩ;
therefore the analyzer will display
638.3mA for the 300mV range
I =
As the instrument ranges up and down the Arange value will change respectively
Page 87
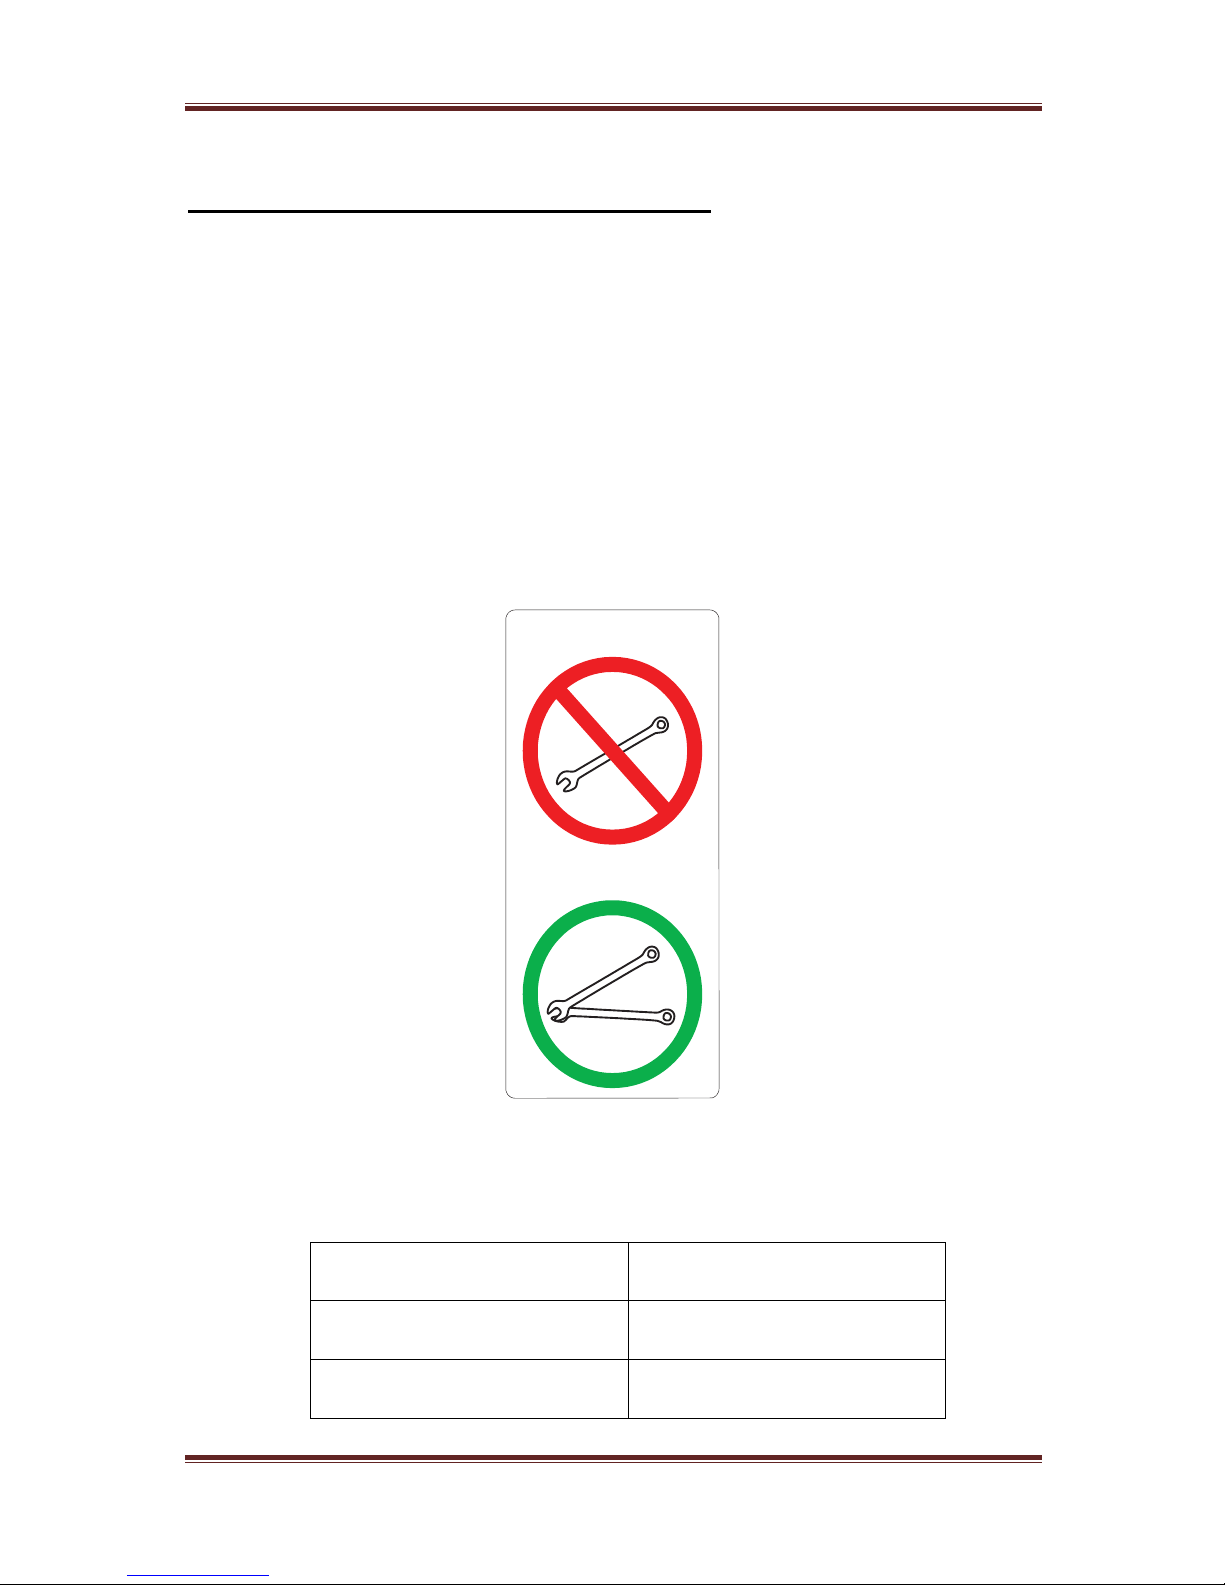
PPA45xx Quick User Guide
Page 86
HF100, HF200 and HF500 Current Shunts
Connection to these instruments is made via a stud and bolt and great care must
be taken when connecting heavy duty ring terminals to the appropriately sized
stud or alternatively, to an “L” bracket on the HF500 shunt.
It is essential that 2 correctly sized spanners are used at all times (see table
below) so that adequate torque can be applied to the bolt without transferring
excessive turning force to the stud
Any damage caused to the fixing stud will be irreparable
Current Shunt Model
Spanner Size
HF100 + HF200
17mm
HF500
24mm
Damage to the shunt will
occur when using only 1
spanner
Always use 2 spanners to
limit torque stress on the
shunt stud
Page 88
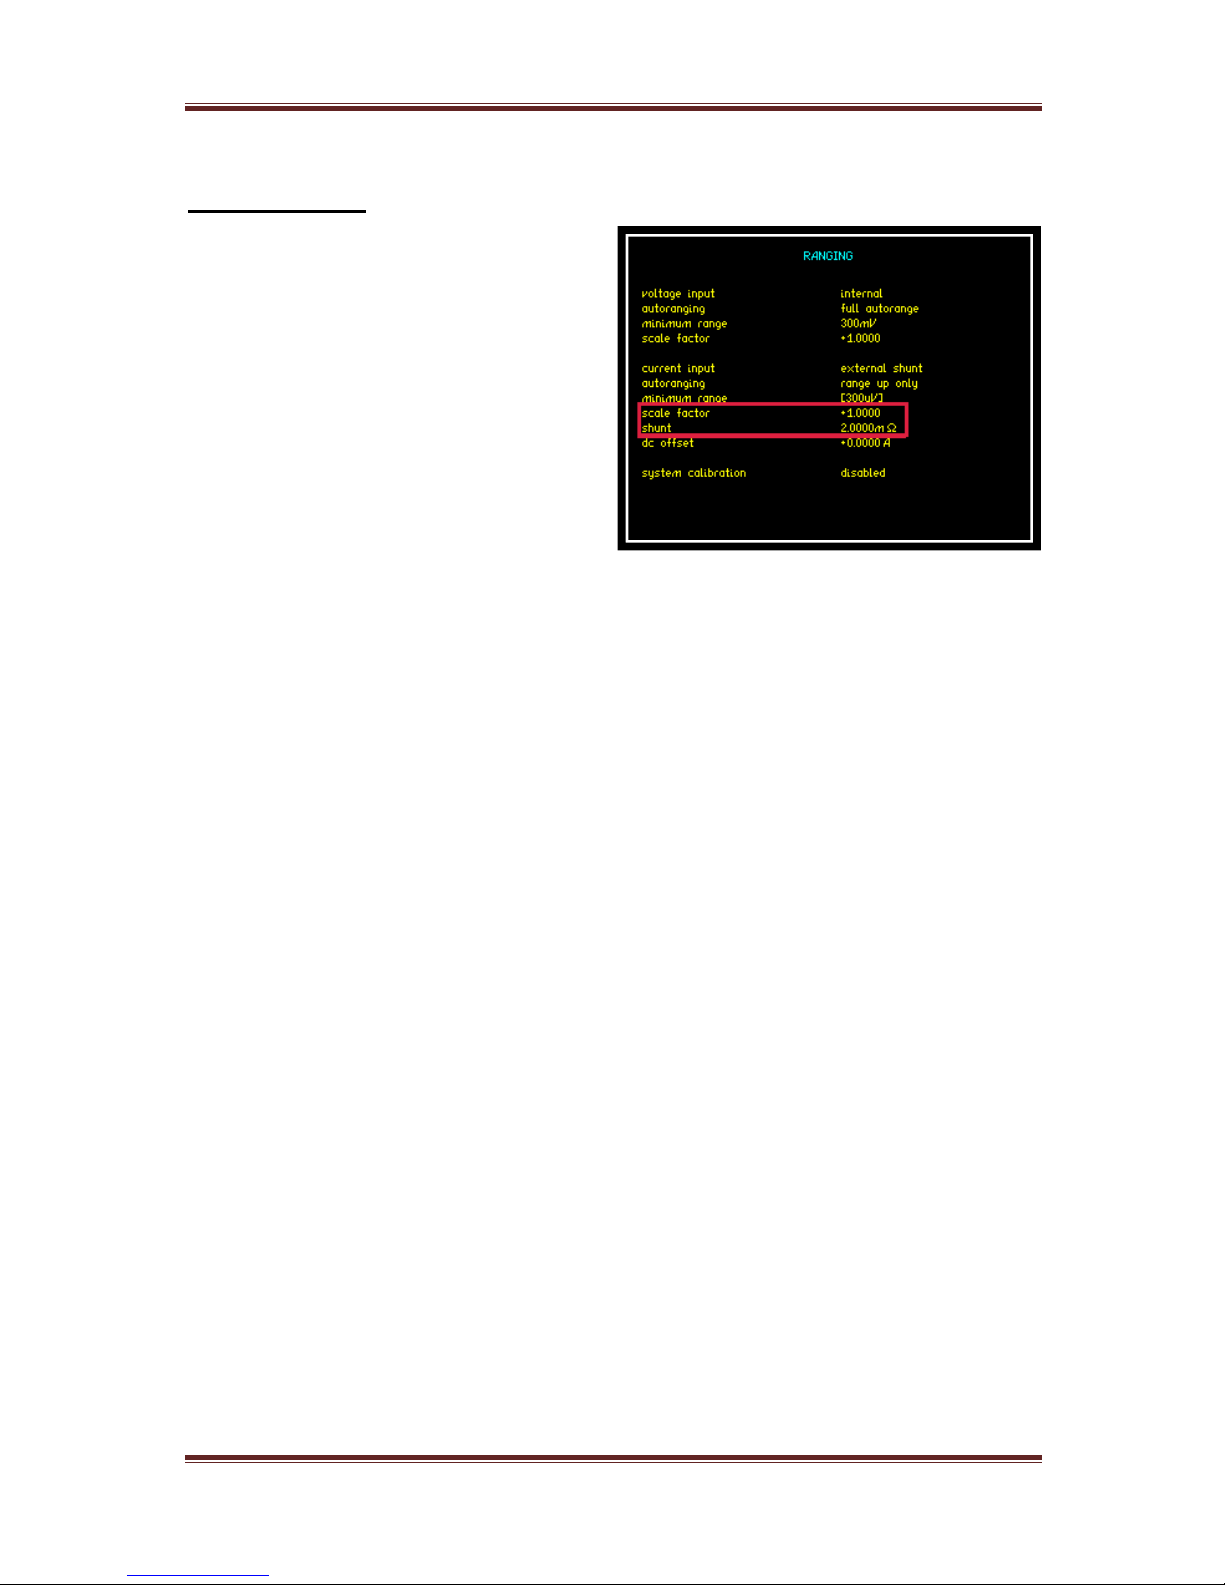
PPA45xx Quick User Guide
Page 87
Rogowski Coil
Set the range value of the PPA45xx to
the selected channel the Rogowski Coil
is connected to,
Input the correct shunt value
corresponding to the switch value on
the Rogowski Transducer
The shunt value is set to 2mΩ to
reflect the switch position being set to
1KA (2mV per A) and a scale factor of 1:1
We set 2mΩ as a 2mΩ shunt would also produce the same 2mV/A
Connection should be made as per the following diagrams
Page 89
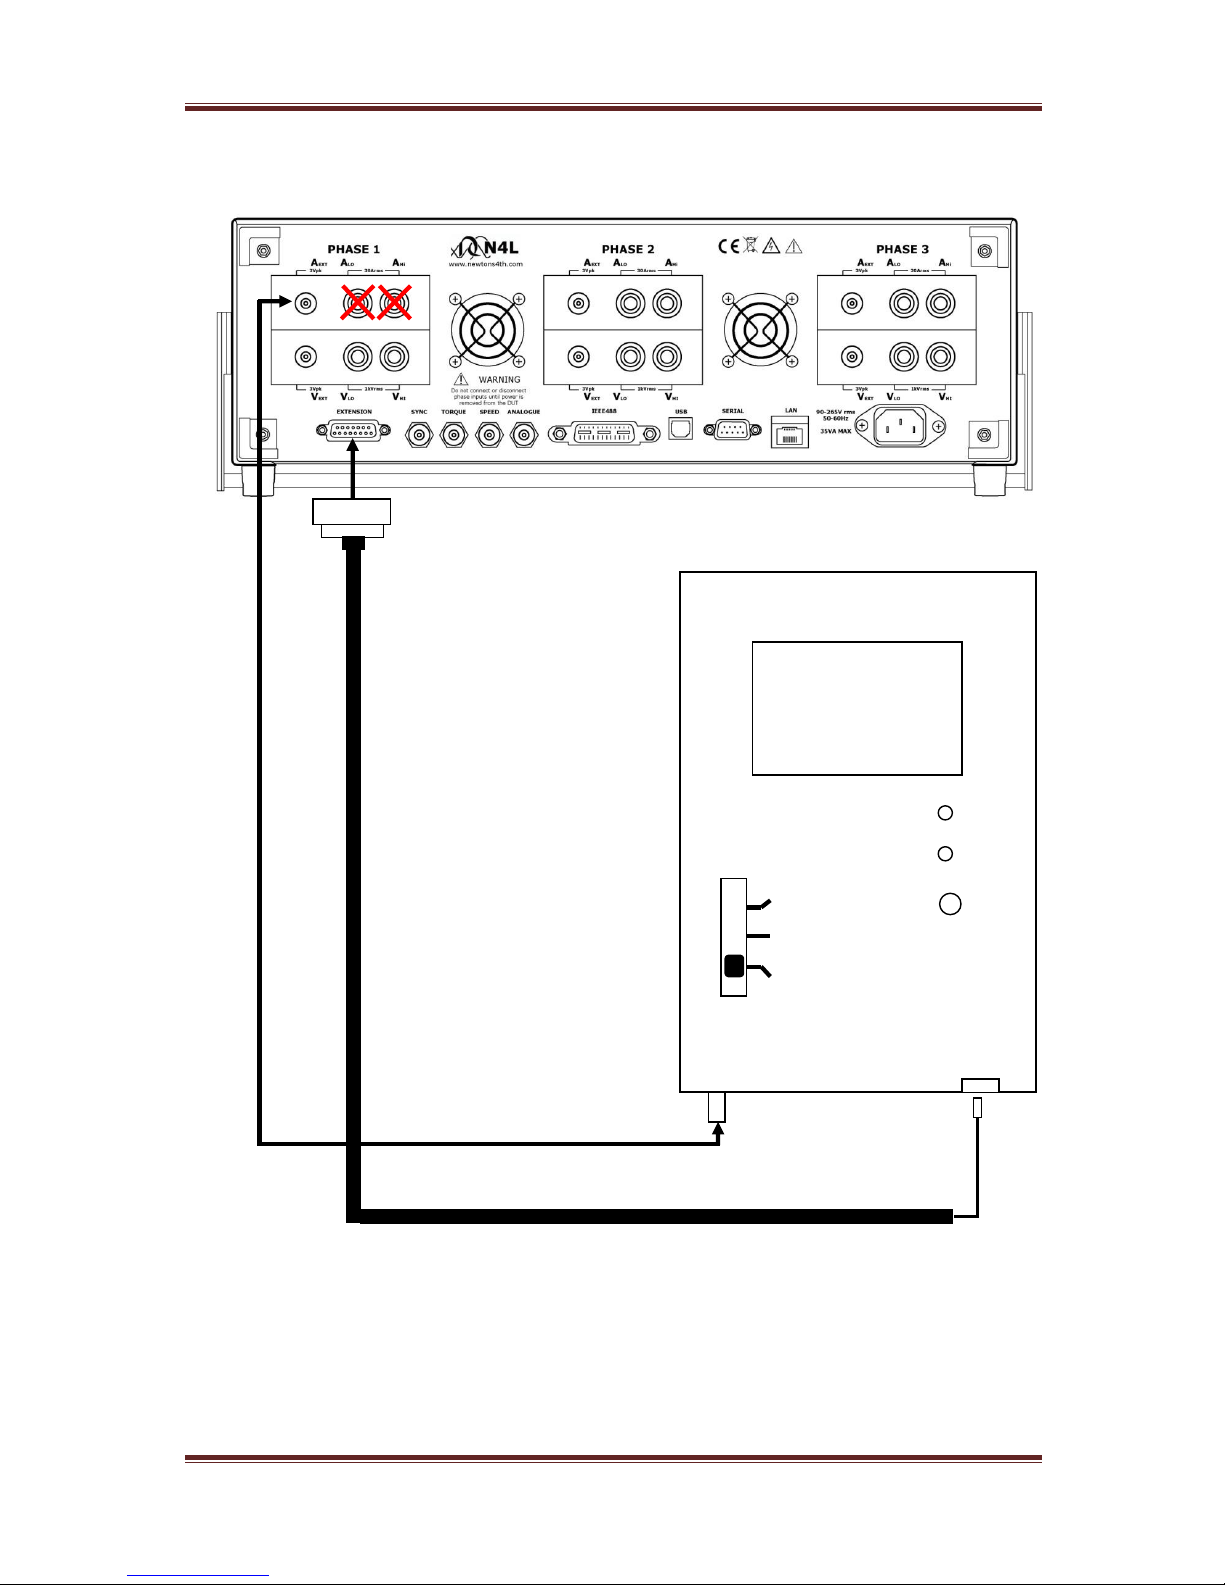
PPA45xx Quick User Guide
Page 88
*WARNING: Remember to connect either the Internal or External shunt
only to the PPA45xx*
WR5000
Wideband Rogowski
Transducer
On
Fault
OFF
5KA (0.4mv/a)
1KA (2.0mv/a)
BNC
DC Input
15 Way Connector
BNC – BNC safety lead
Page 90
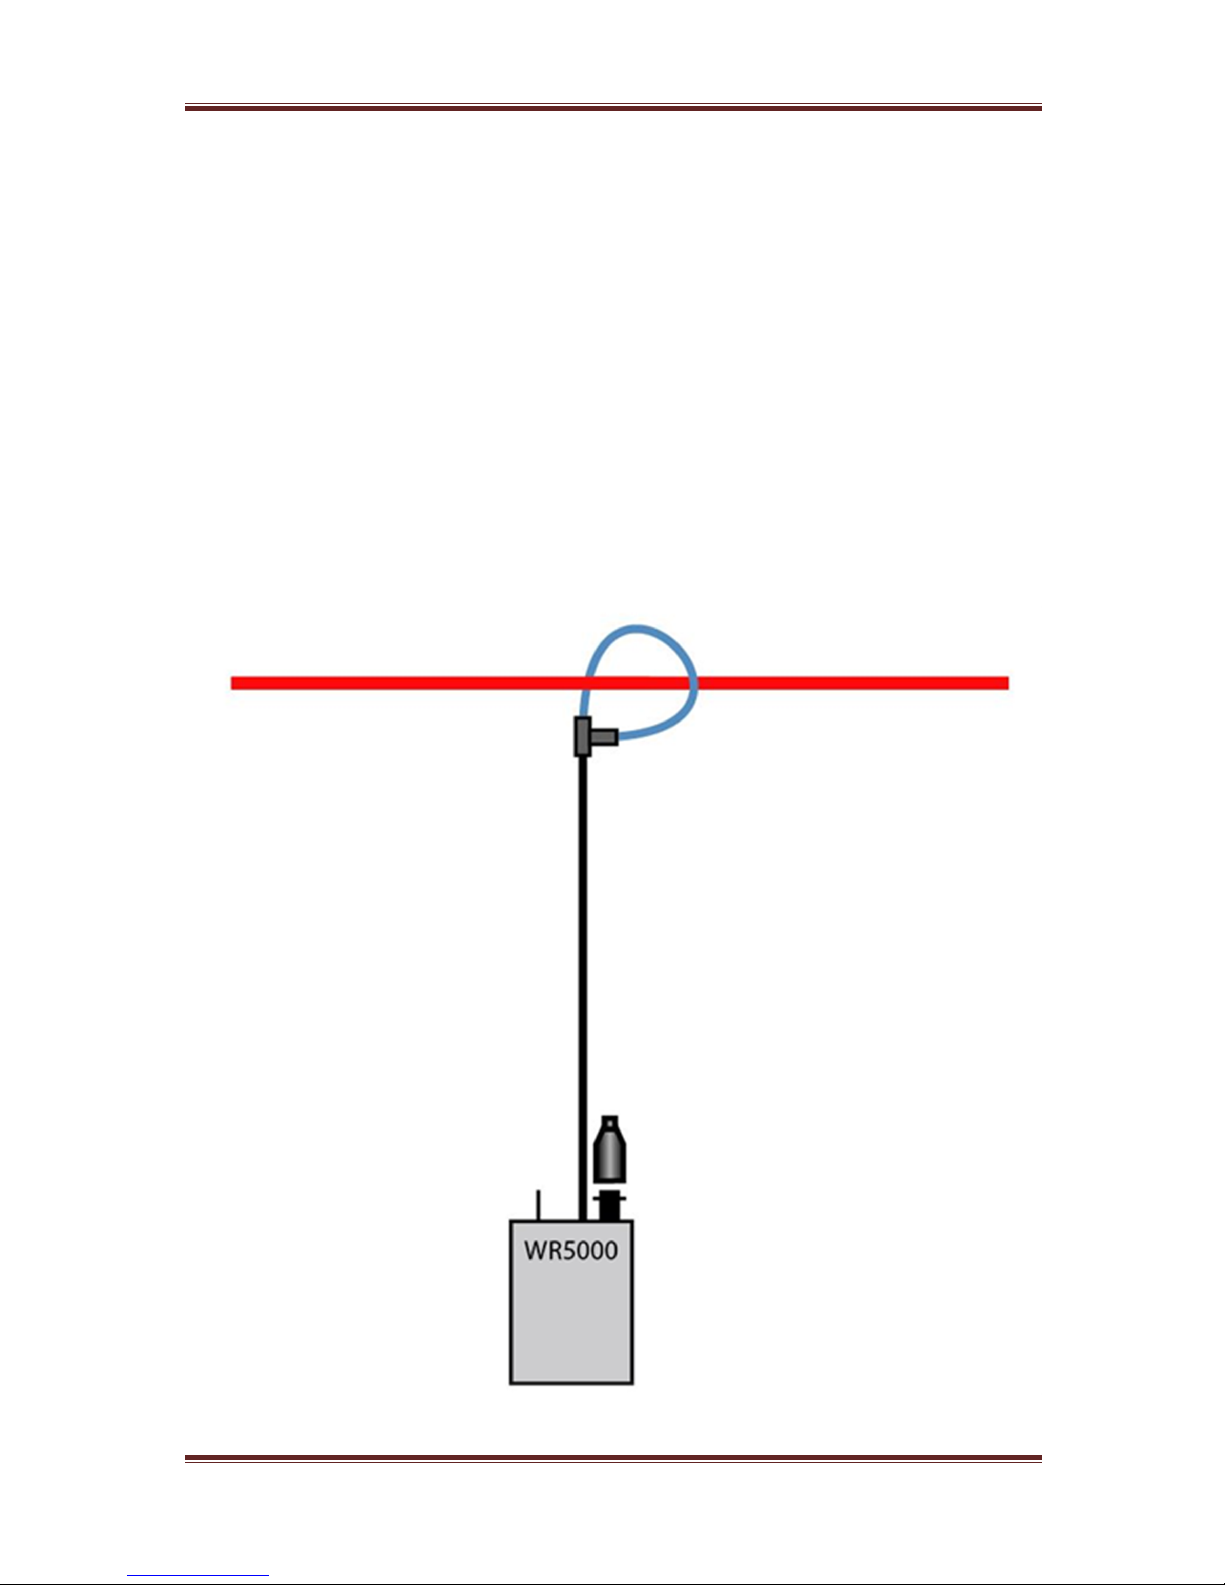
PPA45xx Quick User Guide
Page 89
Connect up the Rogowski Coil as shown, wrap the clear plastic tube around the
conductor and slot into the “T”piece connector, tighten the connector nut to
secure the lead into position
A single coil wrapped around the conductor will result in voltage measurement
equal to the 2mV/A detail on the WR5000 as set on previous page
If the coil is double wrapped around the conductor then the voltage value will
double accordingly
BNC – BNC safety lead
DC Input
Conductor passing through
Rogowski Coil
Page 91
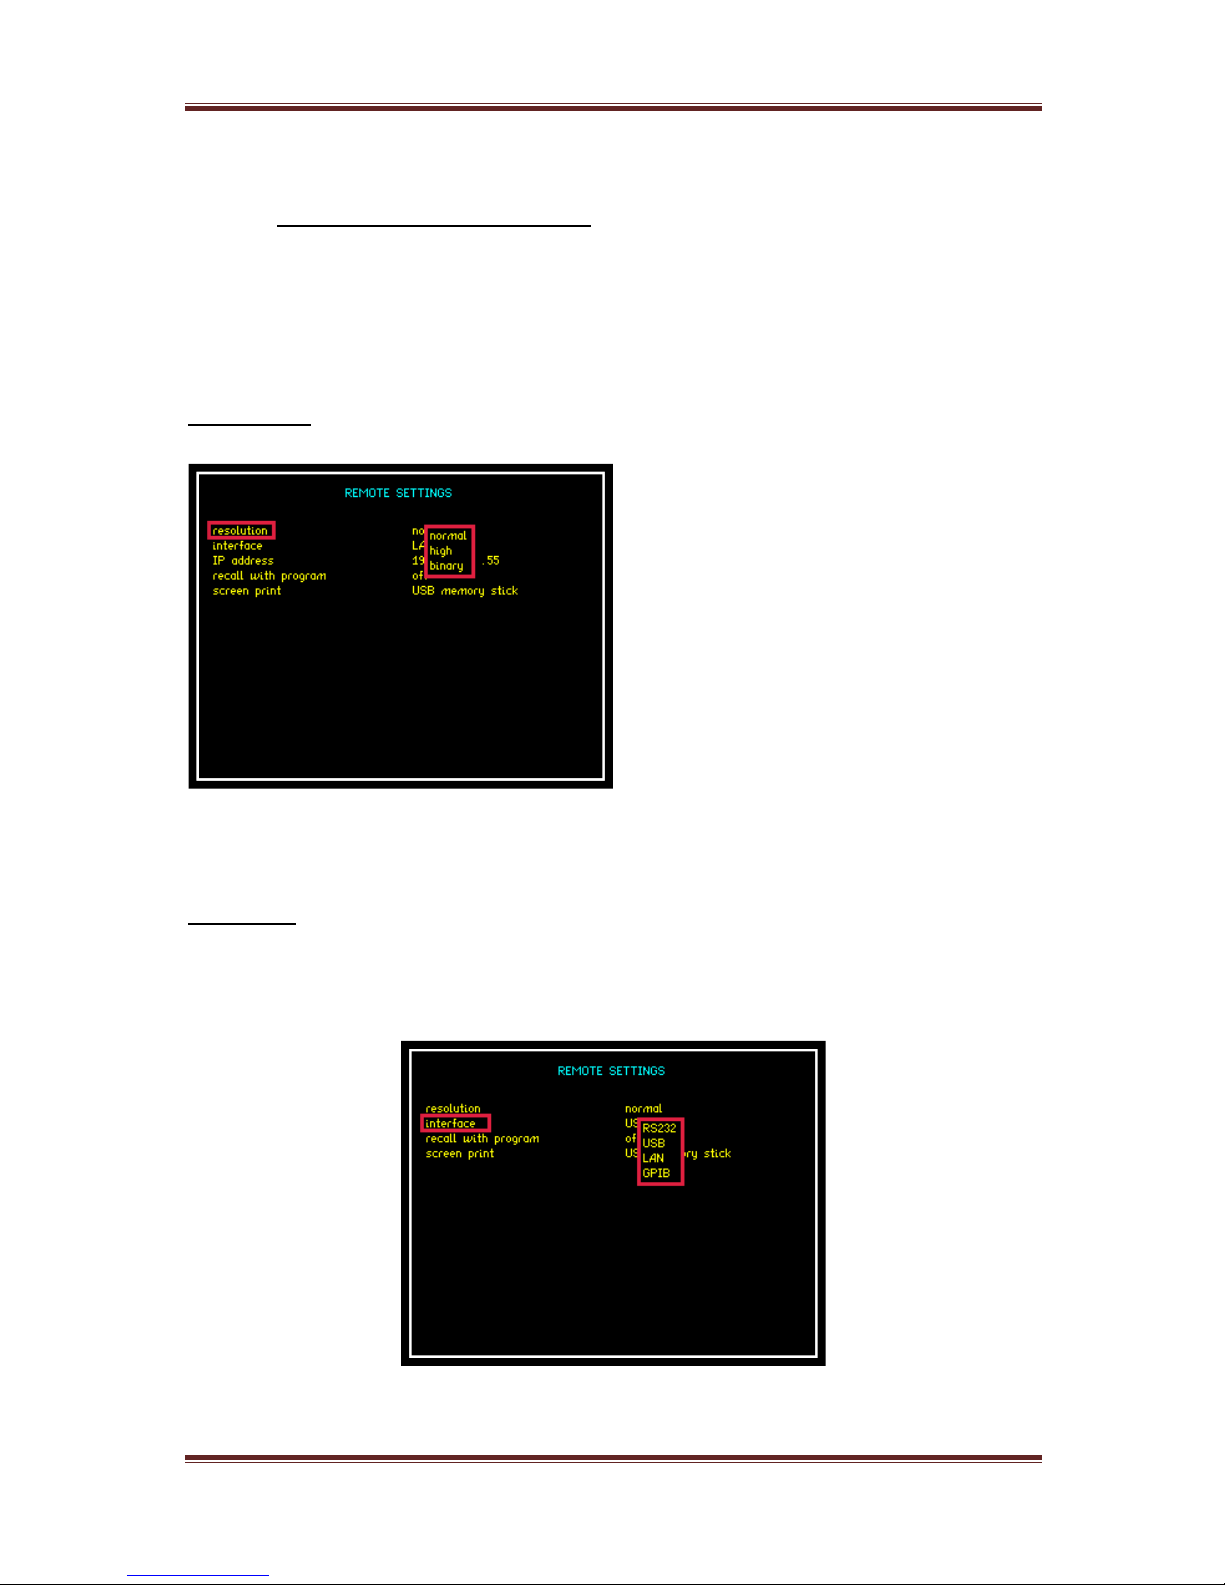
PPA45xx Quick User Guide
Page 90
7 Remote Settings
The Remote Settings menu provides an interface for the user to set the method
of connection and the ability to configure the ports as required
Resolution
The default resolution setting for the
PPA45xx is “Normal” this will set the
Data Resolution to 5 decimal points
plus any exponent e.g.:
+1.2345+E00
Selecting “High” will set the Data
Resolution to 6 decimal points plus
any exponent e.g.: +1.23456+E00
For higher speed transfer a
proprietary binary format can be
selected which compresses the data
into 4 bytes
Interface
The PPA45xx is fitted as standard with an RS232 serial communications port and
USB, LAN and IEEE488 (Optional) Interfaces for communication purposes
between the
instrument and PC
Page 92
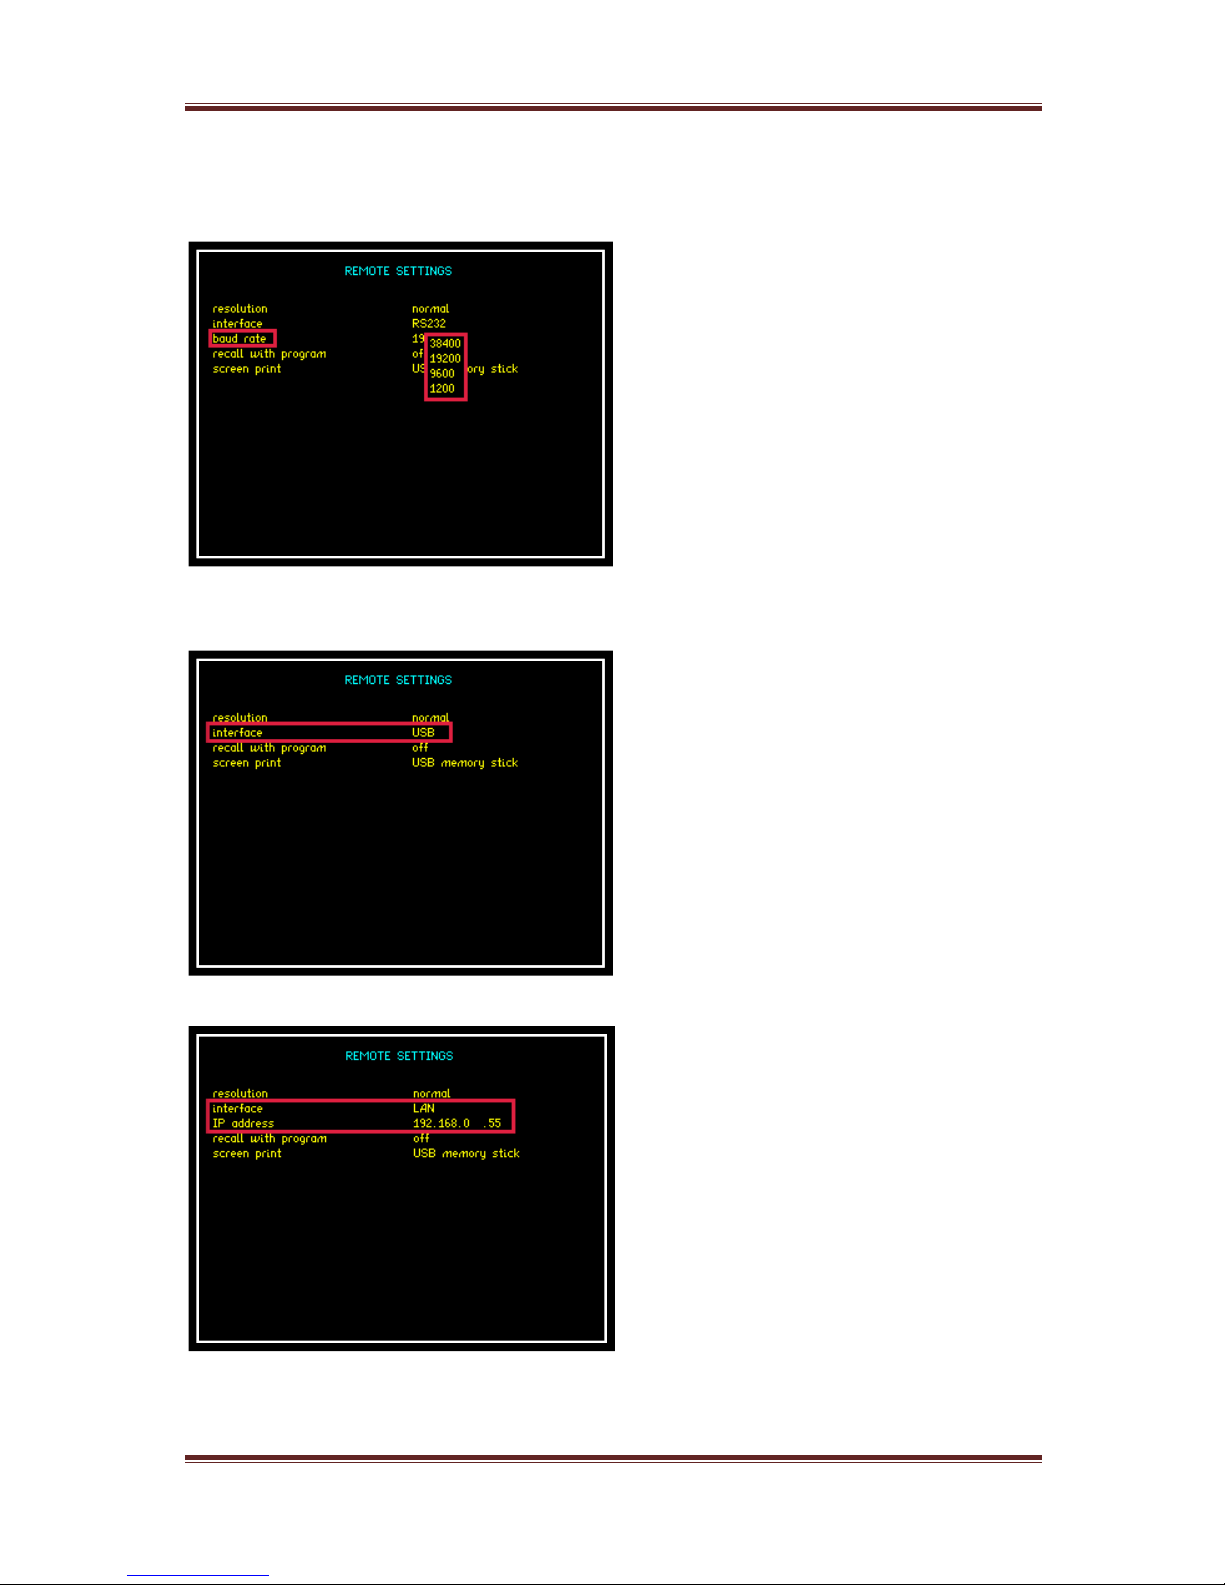
PPA45xx Quick User Guide
Page 91
Selection is made via the interface parameter within the remote settings
Selecting RS232 will then open up the
“Baud Rate” option. Select an
applicable data speed rate from the 4
options given in the drop down menu
(Default Setting is 19200)
To use a USB lead to connect, set the
interface parameter to read “USB”
Configuring the interface to LAN will
then display the IP address applicable
to your instrument. This address will
be required upon connection to any
software to enable correct connection
to the instrument, this is changed
using the numerical keypad
Page 93
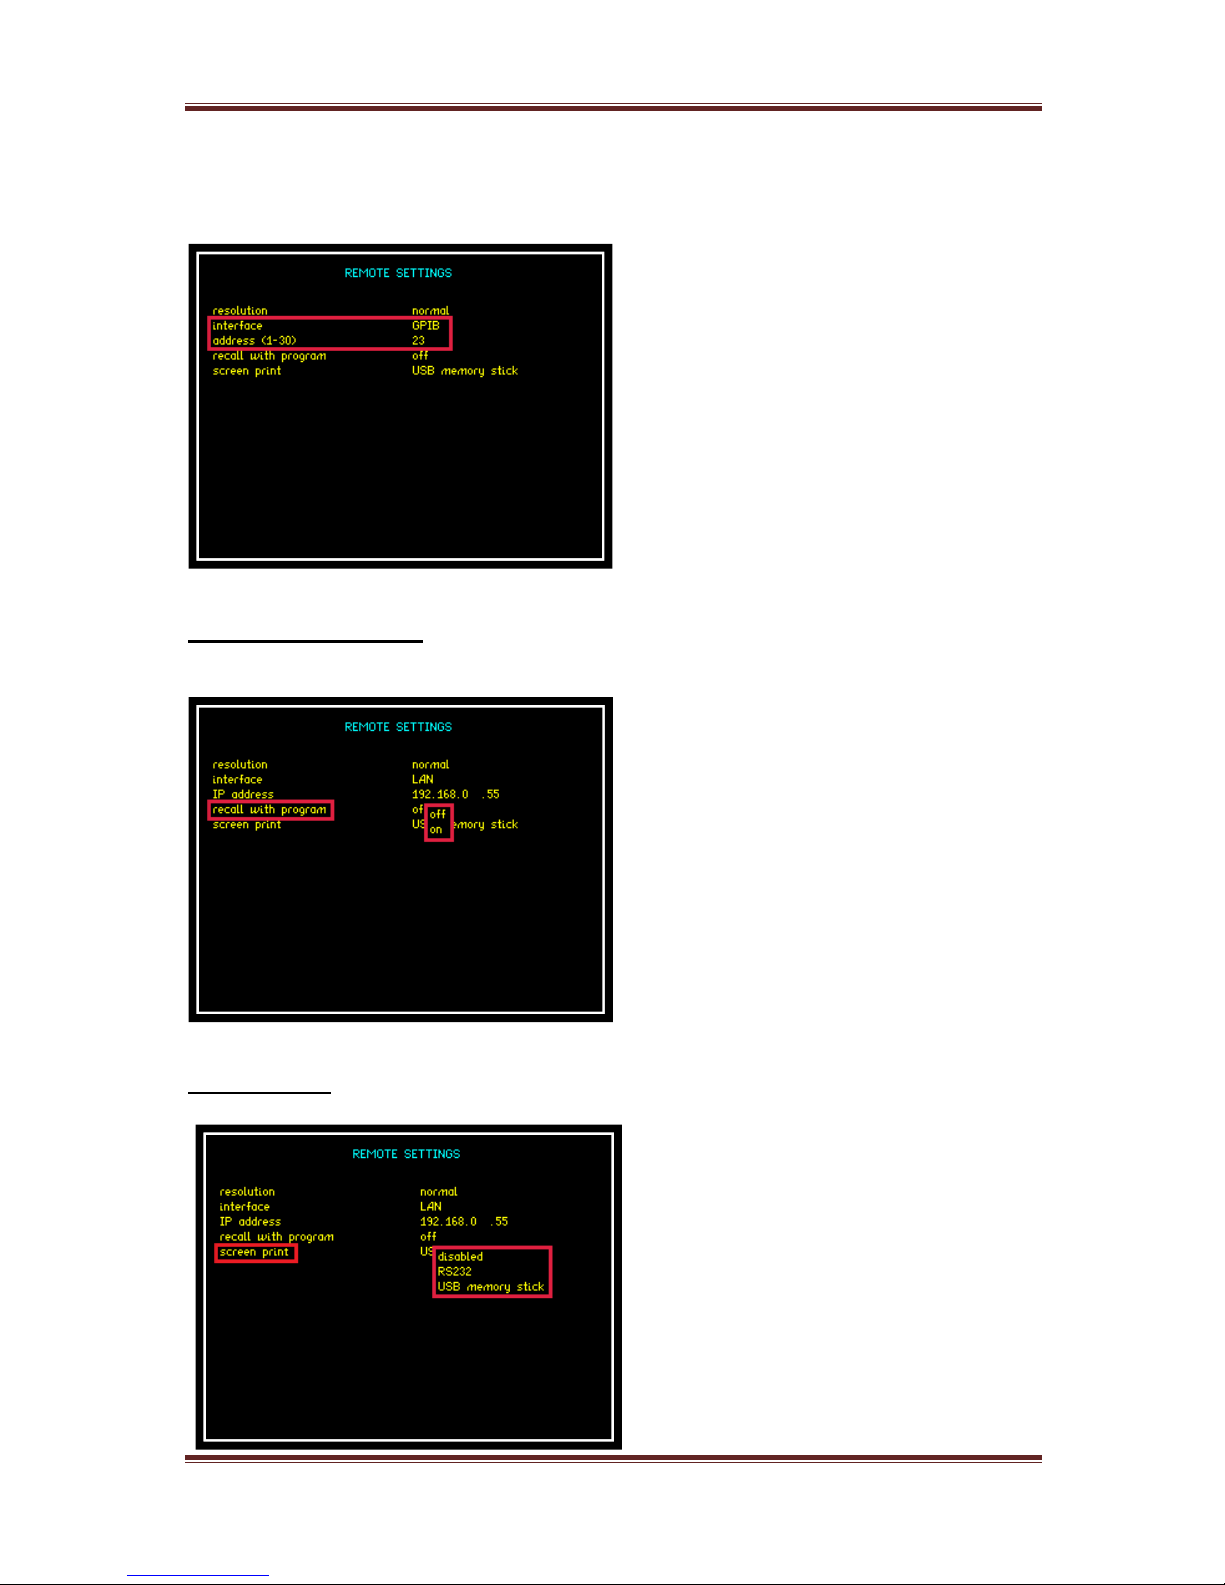
PPA45xx Quick User Guide
Page 92
Configuring the instruments interface
to GPIB will automatically set the
IEEE address to 23 this can be
changed within the address
parameter in the range 0 to 30 (31
total possible addresses available)
Recall with Program
The recall with program parameter
will allow any pre set Comms
configuration to be recalled if saved
along with a nominated program
within the “PROG” settings. To recall
a Comms configuration set the recall
option to “ON” then recall the
appropriate program (Remember to
set this first before recalling your
saved program)
Screen Print
The Screen Print option will allow any
screen display on the PPA45xx to be
copied either to an RS232 printer or
USB memory stick. Select the
appropriate transfer method required
or alternatively this parameter can be
disabled
Page 94
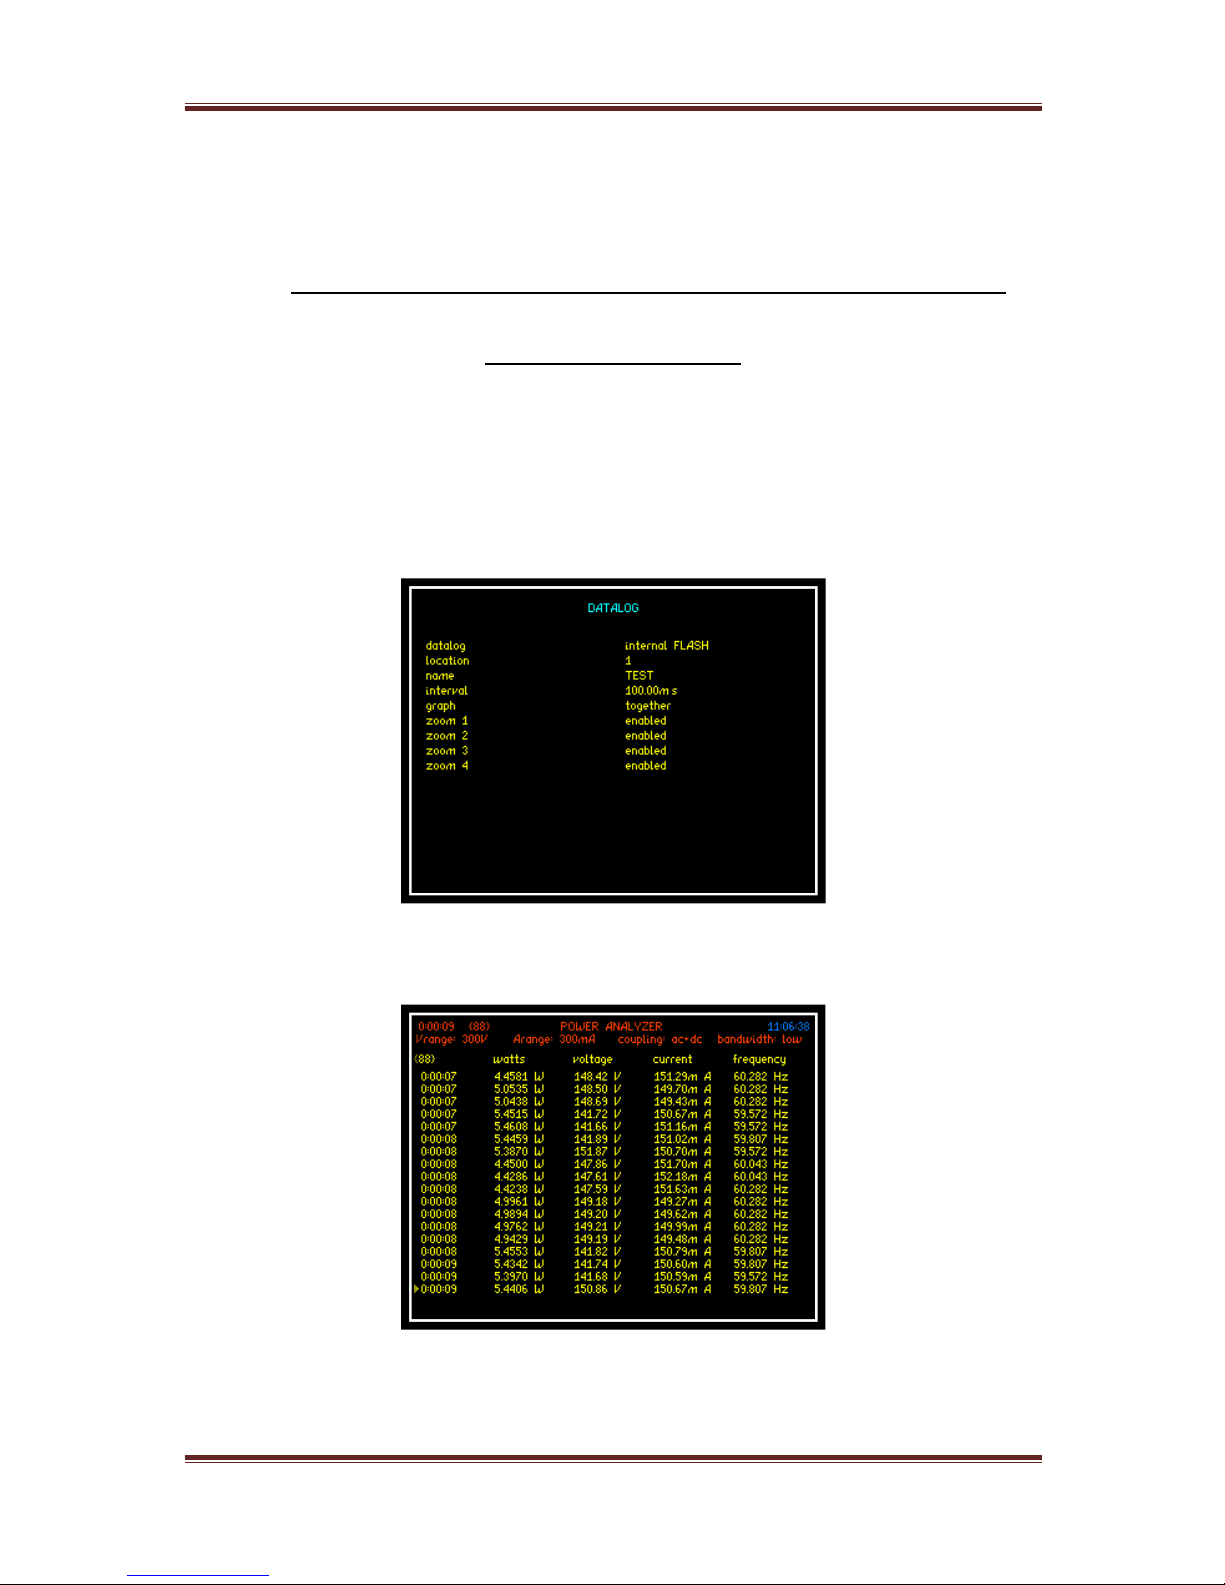
PPA45xx Quick User Guide
Page 93
7.1 Transferring Internal Datalogs to USB
memory stick
The following section explains the procedure for storing a datalog to internal
memory and exporting the data to a USB memory Stick
1. Setup Datalog (DATALOG MENU)
2. Press START to commence Datalog
Page 95
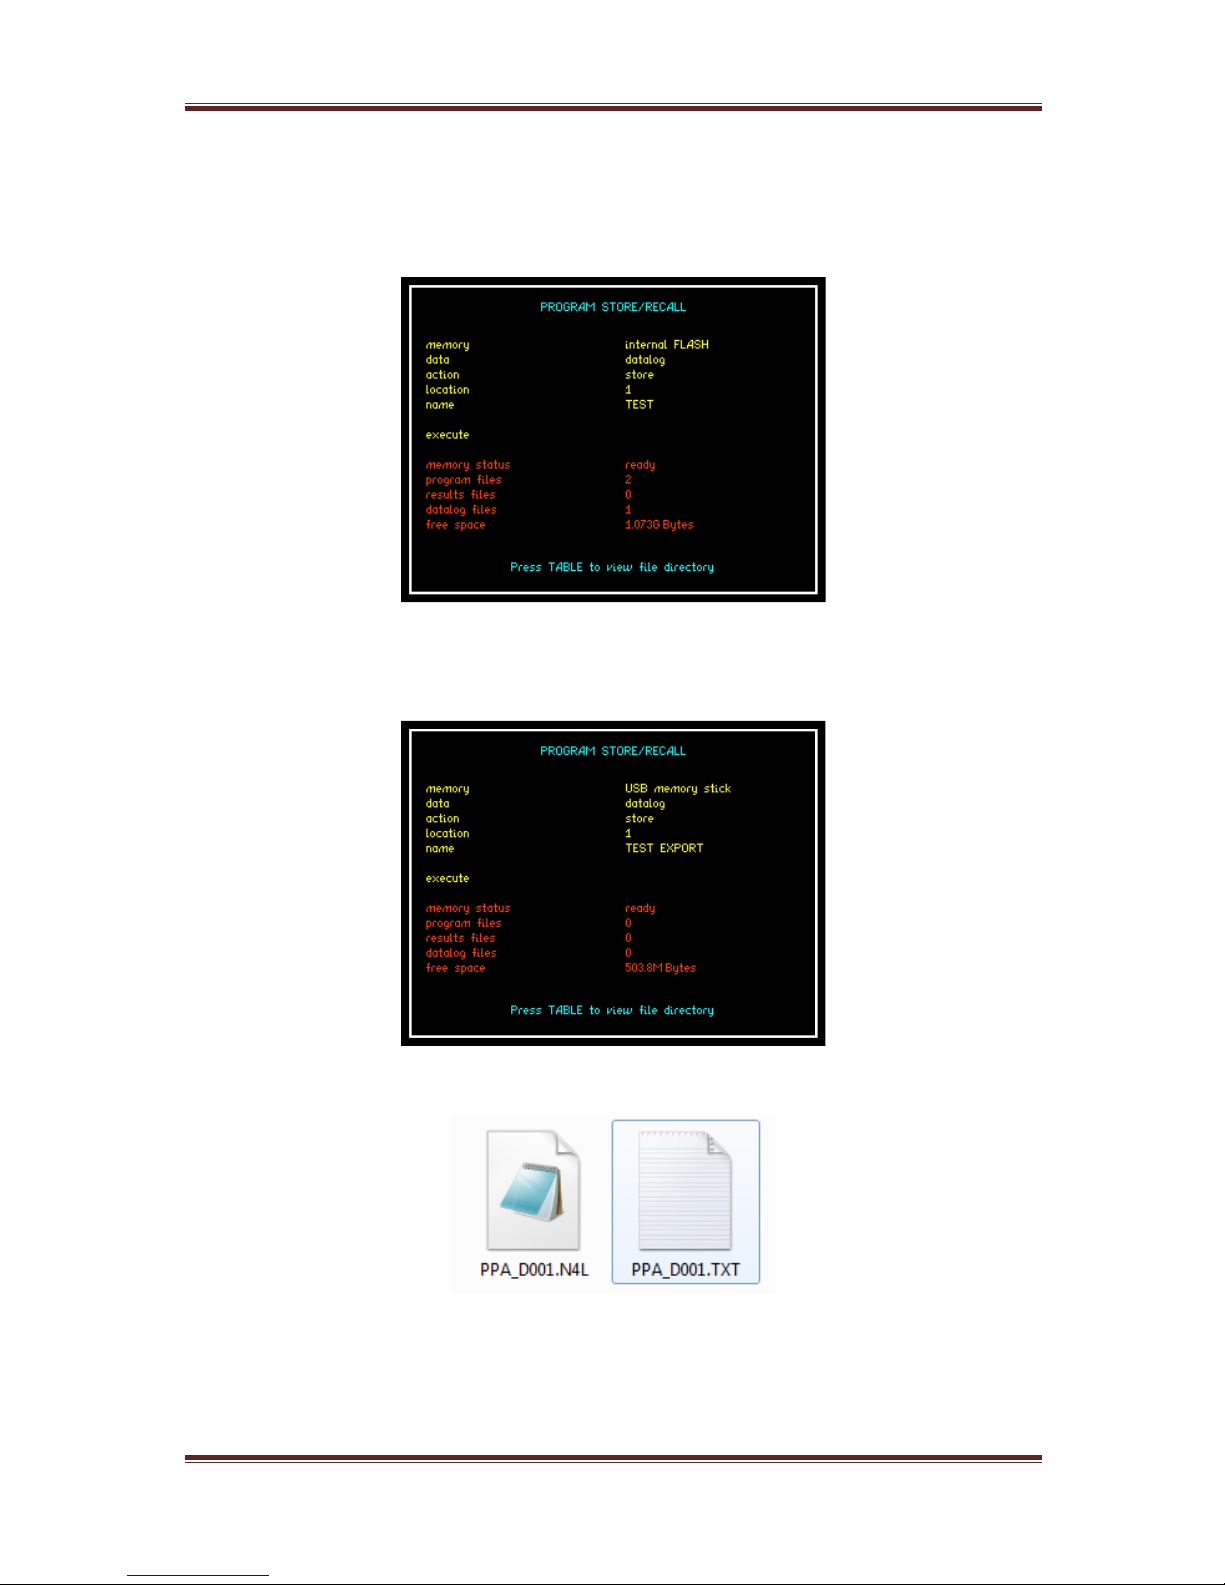
PPA45xx Quick User Guide
Page 94
3. Store Datalog to Internal memory
4. Store Datalog to External USB Memory Stick
5. Locate file on memory stick, the file format will have a .txt extension
D001 represents “location 1” as specified above.
6. NOTE: Data presented within the .txt file for time will be displayed as a
fraction of an hour, to convert this data back into real time the user will
need to multiply the data by 3600 (seconds within an hour)
Page 96
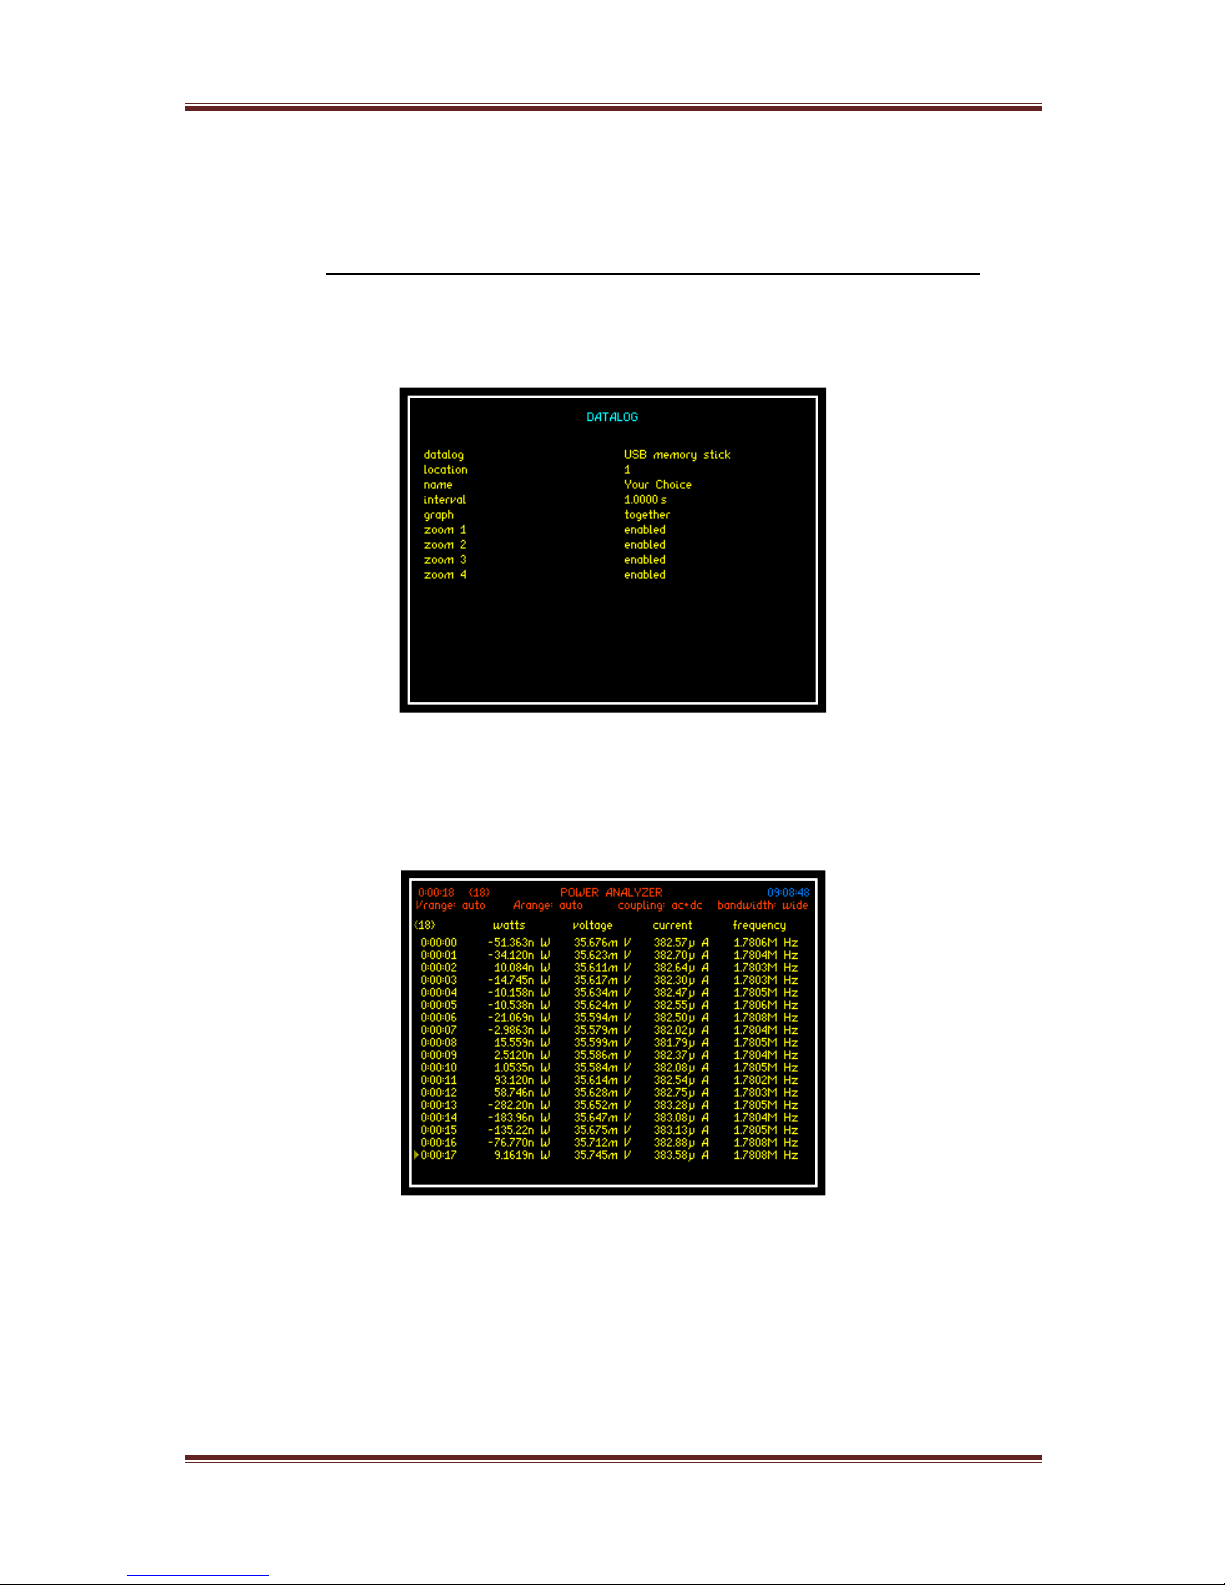
PPA45xx Quick User Guide
Page 95
7.1.1 Data logging to USB memory stick
1. Setup Datalog (DATALOG MENU)
2. Press START to commence Datalog
3. Press STOP to terminate Datalog, results will now be stored upon USB
memory stick
Page 97
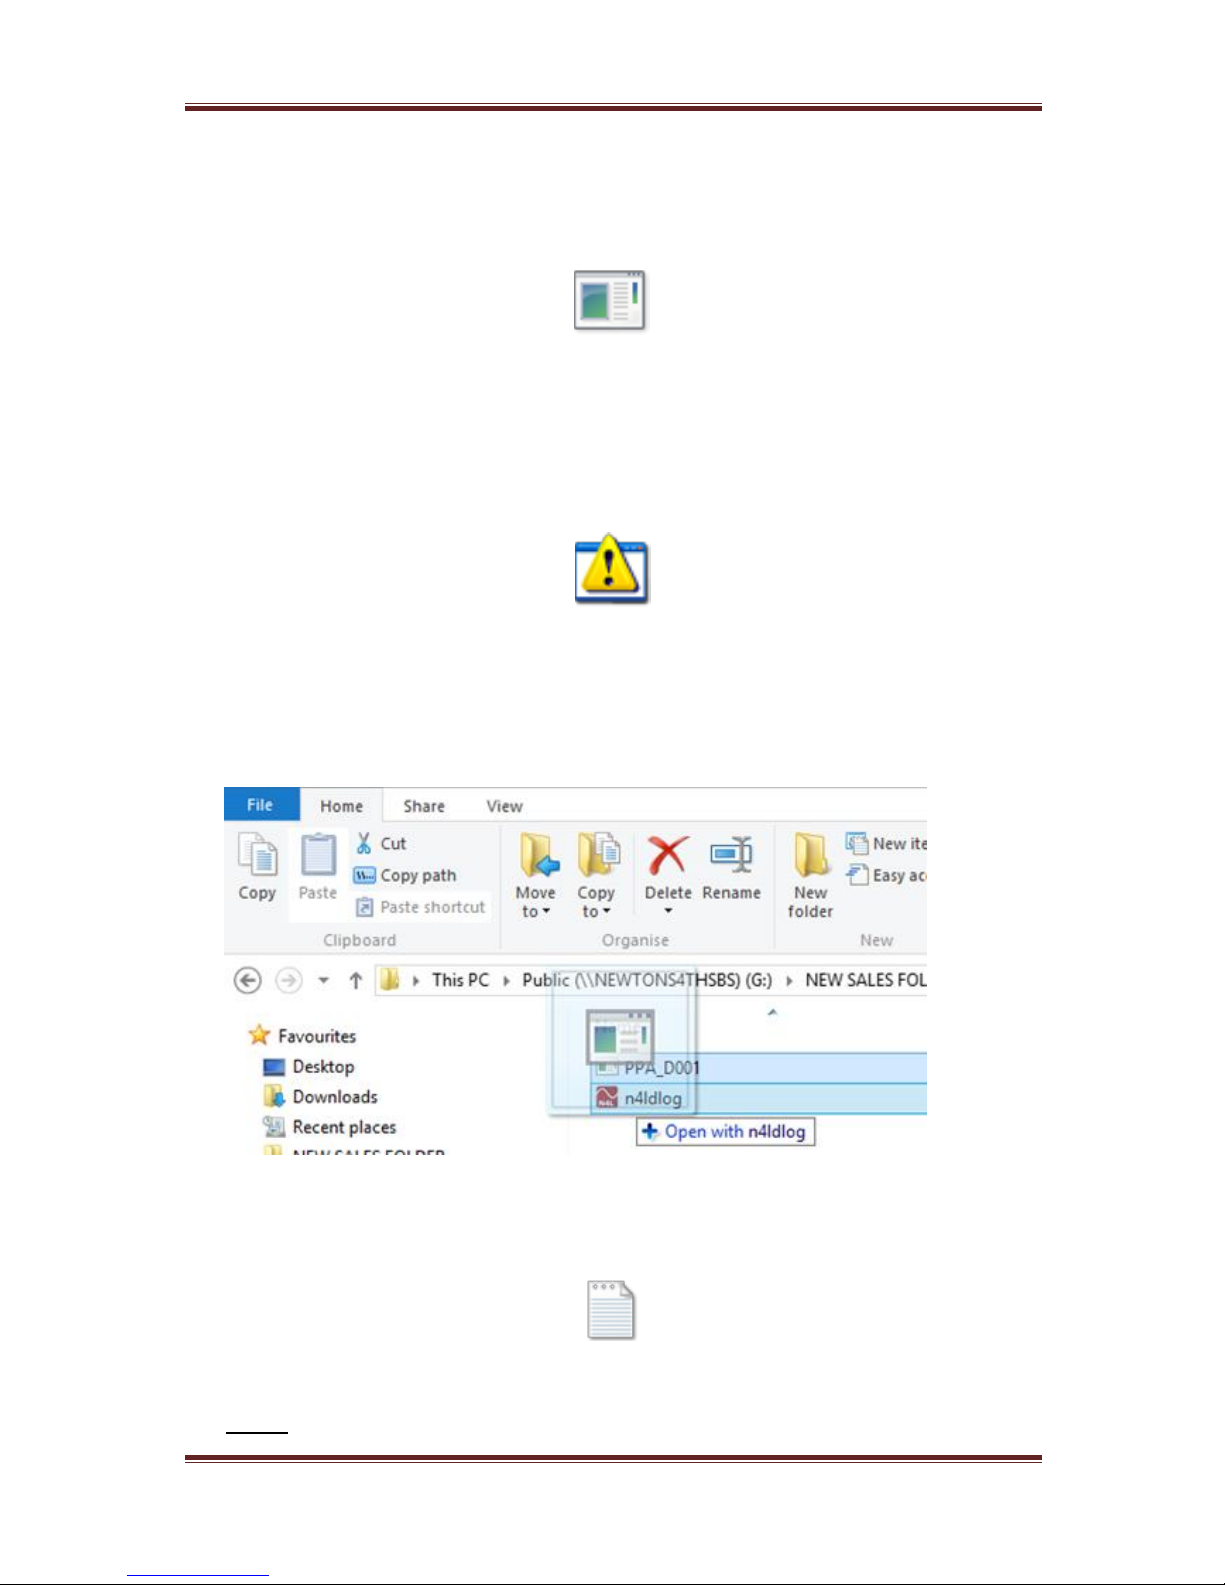
PPA45xx Quick User Guide
Page 96
4. Locate file on memory stick, the file format will have a .N4L extension and
save to a location on your PC
PPA_D001.N4L
5. Converting the .N4L to a .txt file will require the user to download free of
charge from the N4L website; software application “n4ldlog”
n4ldlog.exe
6. Upon downloading the n4ldlog software then drag and drop the .N4L file
on top of the n4ldlog.exe as shown below
7. Following this procedure a .txt file will be created as shown
PPA_D001.txt
D001 represents “location 1” as specified within the Datalog home screen
Page 98
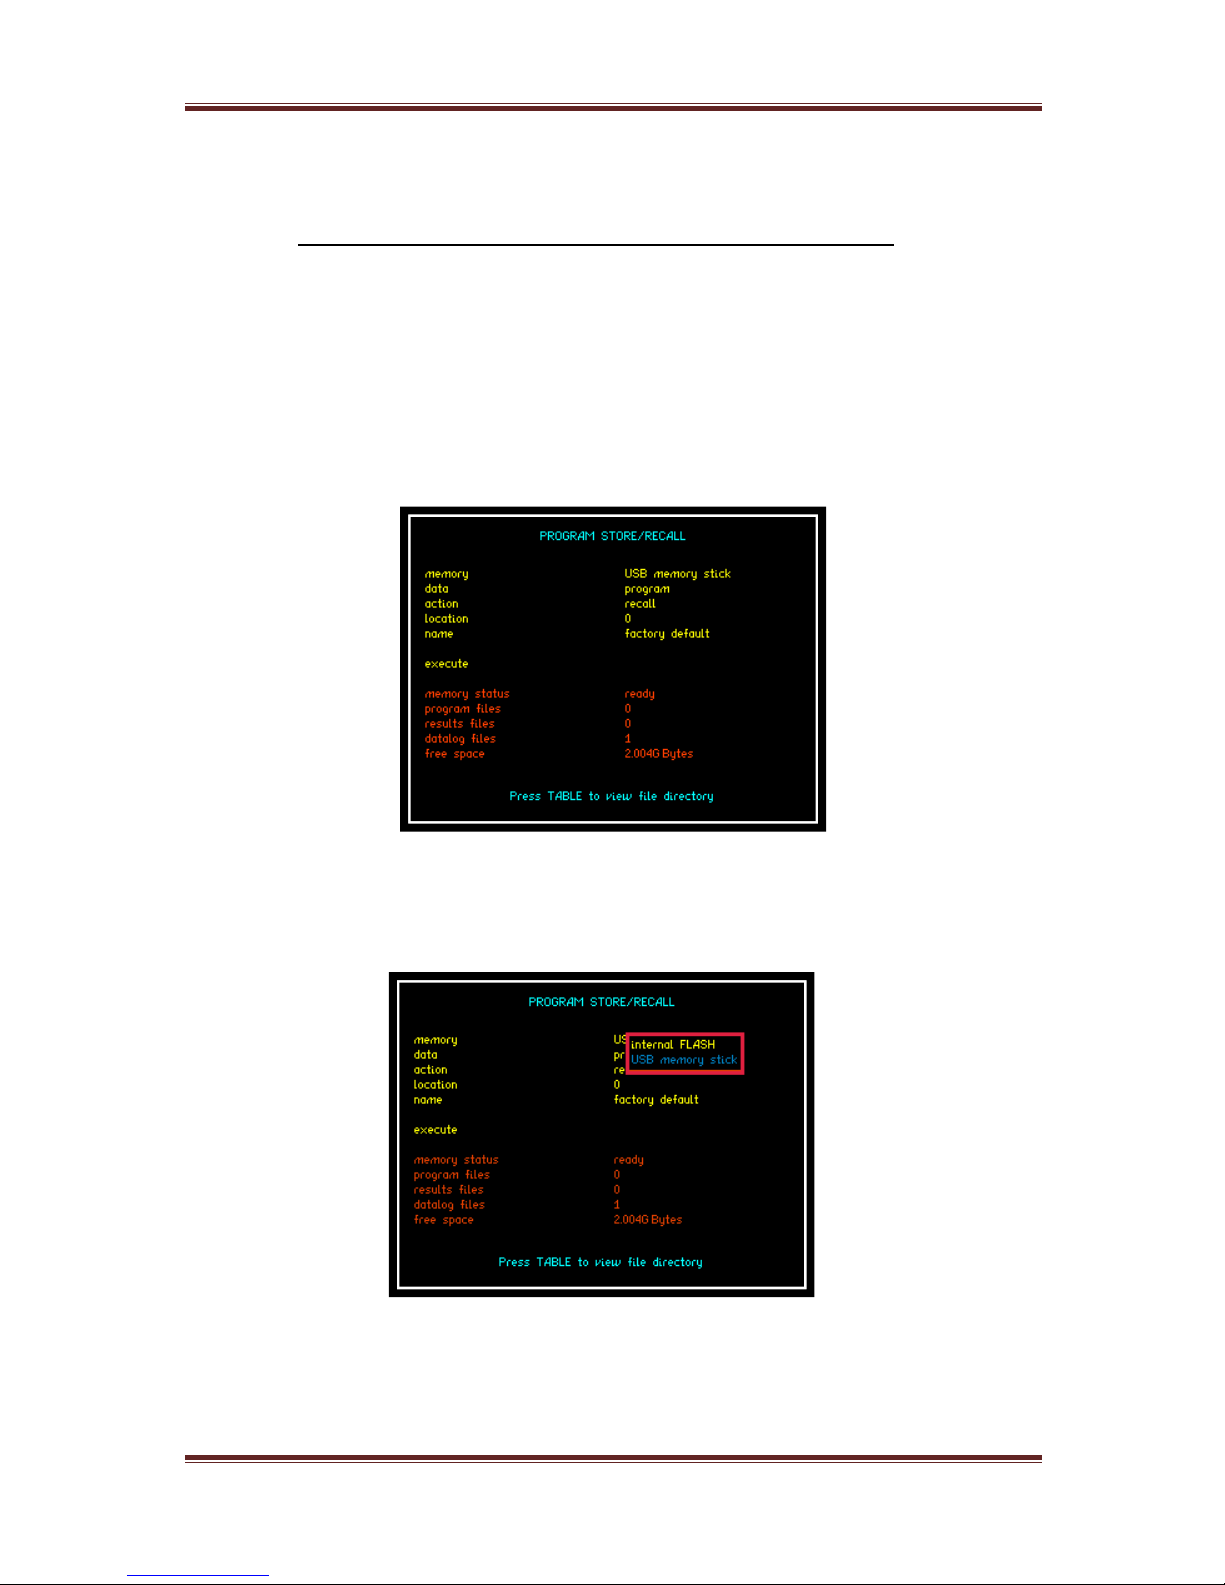
PPA45xx Quick User Guide
Page 97
7.2 Program Store / Recall / Delete
The following section explains the procedure for storing / recalling or deleting a
program to or from the instruments internal memory or USB memory Stick
1. Press “PROG” button to open up program store / recall mode
2. Select memory type to be used for action from the dropdown menu
Page 99
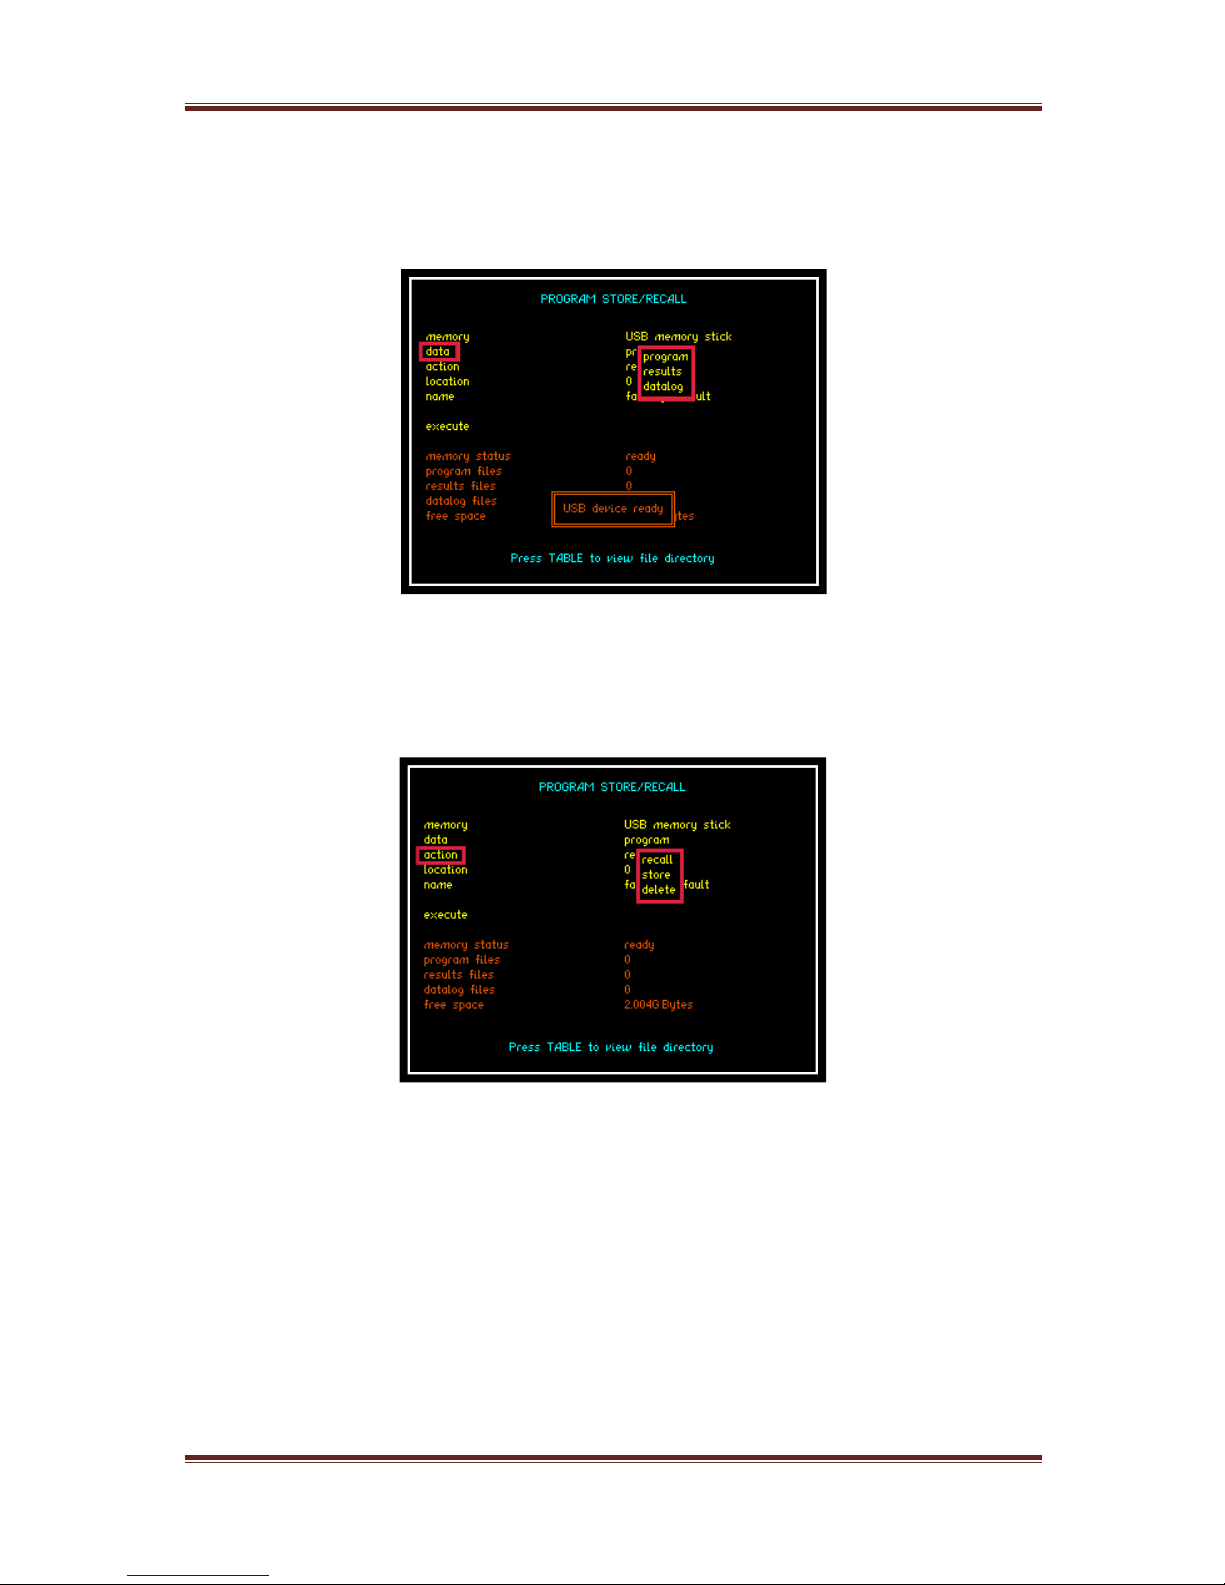
PPA45xx Quick User Guide
Page 98
3. Select which data type you require to be actioned from the list shown
4. Select the action to be taken in association with the data selected
Page 100
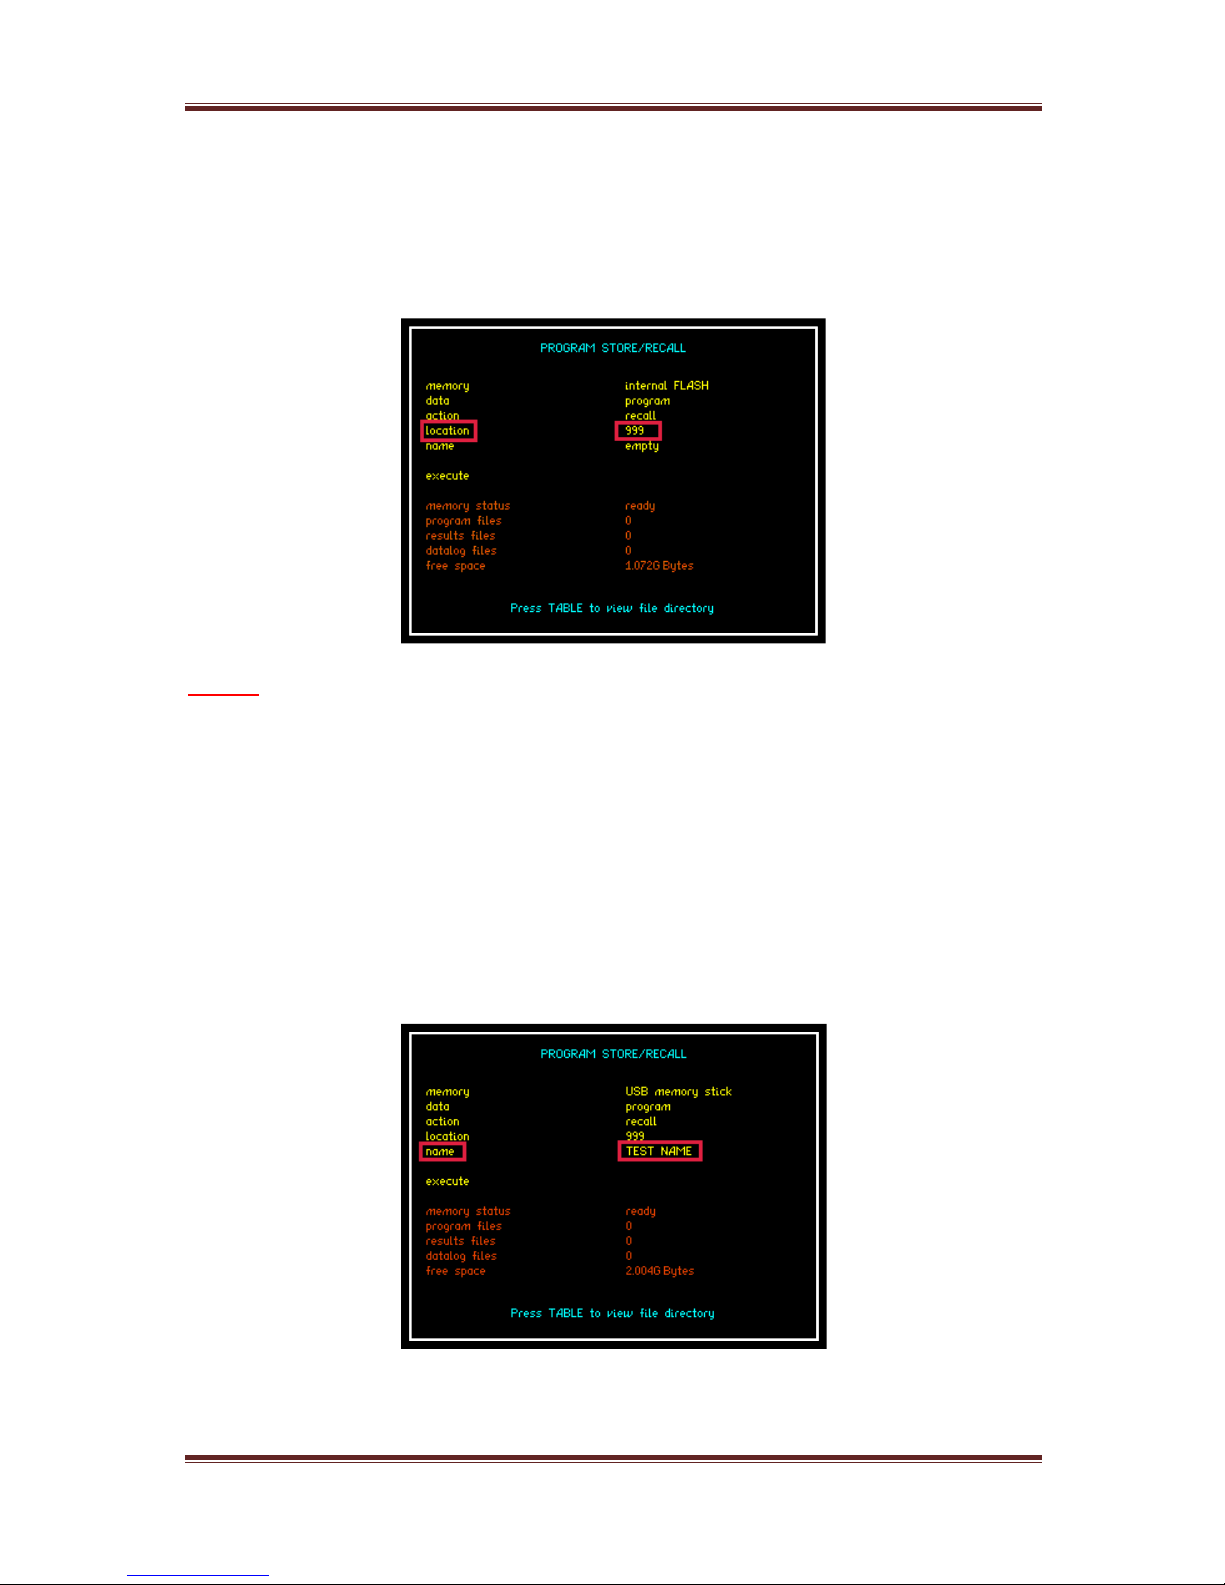
PPA45xx Quick User Guide
Page 99
5. Select the location that the associated action is to be recalled from, stored
to or deleted from, there are 999 locations available
NOTE:
Location 0 = FACTORY DEFAULT and cannot be changed
Location 1 = Upon start up should any program be stored within program 1 then
the PPA will automatically recall this program
6. Enter a name within this parameter to aid the user in relation to storing /
recalling a program to / from memory for future reference. To enter a
name, use the Alpha / Numerical keypad on the instruments front panel.
 Loading...