

Page 1

Model 1936-R/2936-R Series
Single and Dual-Channel Optical Meters
User’s Manual
Page 2

2 Preface
Page 3

3 Preface 3
EU Declaration of Conformity
We declare that the accompanying product, identified with the mark,
complies with the requirements of the Electromagnetic Compatibility
Directive, 2004/108/EC and the Low Voltage Directive 73/23/EEC.
Model Number: 1936-R, 2936-R
Year mark affixed: 2008
Type of Equipment: Electrical equipment for measurement, control and
laboratory use in industrial locations.
Manufacturer: Newport Corporation
1791 Deere Avenue
Irvine, CA 92606
Standards Applied:
Compliance was demonstrated to the following standards to the extent
applicable:
BS EN61326-1: 2006 “Electrical equipment for measurement, control and
laboratory use – EMC requirements”
This equipment meets the CISPR 11:2006+A2 Class A Group 1 radiated and
conducted emission limits.
BS EN 61010-1:2001, 2nd Edition “Safety requirements for electrical
equipment for measurement, control and laboratory use”
Bruno Rety Daniel Cabbell
Group Director of PPT Instrument and Motion Europe Director of Operational Excellence
Zone Industrielle 1791 Deere Avenue
45340 Beaune-la-Rolande, France Irvine, Ca. USA
Page 4

4 Preface
Dear Customer,
In an effort to keep the 1936/2936 Series Optical Meters
optimized for your applications, Newport will on occasion
update existing, and add new features to this instrument.
To utilize this new functionality will require an update to the
instrument's firmware, which can be easily accomplished by
the user, as described in this operator manual. As required,
Newport will also generate a new version of this user
manual, reflecting updates to the instrument.
Please check the Newport website (www.Newport.com)
for newer versions of the firmware and the operator manual,
which can be downloaded as a PDF file. Call your local
Newport application specialist if you need support with
locating or downloading these files.
Enjoy your new instrument!
Manual Updates
Page 5

5 Preface 5
Warranty
Newport Corporation warrants that this product will be free from defects in
material and workmanship and will comply with Newport’s published
specifications at the time of sale for a period of one year from date of
shipment. If found to be defective during the warranty period, the product
will either be repaired or replaced at Newport's option.
To exercise this warranty, write or call your local Newport office or
representative, or contact Newport headquarters in Irvine, California. You
will be given prompt assistance and return instructions. Send the product,
freight prepaid, to the indicated service facility. Repairs will be made and the
instrument returned freight prepaid. Repaired products are warranted for the
remainder of the original warranty period or 90 days, whichever first occurs.
Limitation of Warranty
The above warranties do not apply to products which have been repaired or
modified without Newport’s written approval, or products subjected to
unusual physical, thermal or electrical stress, improper installation, misuse,
abuse, accident or negligence in use, storage, transportation or handling. This
warranty also does not apply to fuses, batteries, or damage from battery
leakage.
THIS WARRANTY IS IN LIEU OF ALL OTHER WARRANTIES,
EXPRESSED OR IMPLIED, INCLUDING ANY IMPLIED WARRANTY
OF MERCHANTABILITY OR FITNESS FOR A PARTICULAR USE.
NEWPORT CORPORATION SHALL NOT BE LIABLE FOR ANY
INDIRECT, SPECIAL, OR CONSEQUENTIAL DAMAGES RESULTING
FROM THE PURCHASE OR USE OF ITS PRODUCTS.
First printing 2008
© 2008 by Newport Corporation, Irvine, CA. All rights reserved. No part of
this manual may be reproduced or copied without the prior written approval
of Newport Corporation.
This manual has been provided for information only and product
specifications are subject to change without notice. Any change will be
reflected in future printings.
Newport Corporation
1791 Deere Avenue
Irvine, CA, 92606
USA
Part No. 90039770 rev B
Page 6

6 Preface
Confidentiality & Proprietary Rights
Reservation of Title:
The Newport programs and all materials furnished or produced in connection
with them ("Related Materials") contain trade secrets of Newport and are for
use only in the manner expressly permitted. Newport claims and reserves all
rights and benefits afforded under law in the Programs provided by Newport
Corporation.
Newport shall retain full ownership of Intellectual Property Rights in and to
all development, process, align or assembly technologies developed and other
derivative work that may be developed by Newport. Customer shall not
challenge, or cause any third party to challenge the rights of Newport.
Preservation of Secrecy and Confidentiality and Restrictions to Access:
Customer shall protect the Newport Programs and Related Materials as trade
secrets of Newport, and shall devote its best efforts to ensure that all its
personnel protect the Newport Programs as trade secrets of Newport
Corporation. Customer shall not at any time disclose Newport's trade secrets
to any other person, firm, organization, or employee that does not need
(consistent with Customer's right of use hereunder) to obtain access to the
Newport Programs and Related Materials. These restrictions shall not apply
to information (1) generally known to the public or obtainable from public
sources; (2) readily apparent from the keyboard operations, visual display, or
output reports of the Programs; 3) previously in the possession of Customer
or subsequently developed or acquired without reliance on the Newport
Programs; or (4) approved by Newport for release without restriction.
Service Information
This section contains information regarding factory service for the source.
The user should not attempt any maintenance or service of the system or
optional equipment beyond the procedures outlined in this manual. Any
problem that cannot be resolved should be referred to Newport Corporation.
Copyright and Trademark Information
WINDOWSTM is a registered Trademark of Microsoft Corporation
LabVIEW is a registered Trademark of National Instruments INC.
Visual Basic is a registered Trademark of Microsoft Corporation.
Visual C++ is a registered Trademark of Microsoft Corporation.
Page 7

7 Preface 7
North America & Asia
Europe
Newport Corporation Service Dept.
1791 Deere Ave. Irvine, CA 92606
Telephone: (949) 253-1694
Telephone: (800) 222-6440 x31694
Newport/MICRO-CONTROLE S.A.
Zone Industrielle
45340 Beaune la Rolande, FRANCE
Telephone: (33) 02 38 40 51 56
Asia
Newport Opto-Electronics
Technologies (Wuxi) Co.
No. 36, 38 Xikun Road, WSIP, Wuxi,
Jiangsu, 214028 China
Telephone: +86-510-8018-3000
Fax: +86-510-8018-3289
Technical Support Contacts
Newport Corporation Calling Procedure
If there are any defects in material or workmanship or a failure to meet
specifications, promptly notify Newport's Returns Department by calling 1-800-2226440 or by visiting our website at www.newport.com/returns within the warranty
period to obtain a Return Material Authorization Number (RMA#). Return the
product to Newport Corporation, freight prepaid, clearly marked with the RMA# and
we will either repair or replace it at our discretion. Newport is not responsible for
damage occurring in transit and is not obligated to accept products returned without
an RMA#.
E-mail: rma.service@newport.com
When calling Newport Corporation, please provide the customer care representative
with the following information:
To help our Technical Support Representatives diagnose your problem, please note
the following conditions:
Your Contact Information
Serial number or original order number
Description of problem (i.e., hardware or software)
Is the system used for manufacturing or research and development?
What was the state of the system right before the problem?
Have you seen this problem before? If so, how often?
Can the system continue to operate with this problem? Or is the system non-
operational?
Can you identify anything that was different before this problem occurred?
Page 8

8 Preface
Before plugging the instrument into a PC via a USB communication port, please
make sure that the USB Drivers are installed. Run Setup.exe from the Software CD
that came with your product. The installation program will configure the PC with the
1936/2936 Series USB drivers.
IMPORTANT NOTE
Page 9

9 Preface 9
Table of Contents
EU Declaration of Conformity ............................................................... 3
Warranty ................................................................................................. 5
Technical Support Contacts ................................................................... 7
Table of Contents ................................................................................... 9
List of Figures ...................................................................................... 16
List of Tables........................................................................................ 17
1 Safety Precautions 19
1.1 Definitions and Symbols ............................................................ 19
1.1.1 General Warning or Caution ...........................................19
1.1.2 Electric Shock ..................................................................19
1.1.3 Protective Conductor Terminal .......................................19
1.1.4 European Union CE Mark ...............................................20
1.1.5 Alternating voltage symbol .............................................20
1.1.6 On ....................................................................................20
1.1.7 Off ....................................................................................20
1.1.8 Fuses ................................................................................21
1.1.9 Frame or Chassis .............................................................21
1.1.10 USB Connector Symbol ..................................................21
1.1.11 Waste Electrical and Electronic Equipment (WEEE) .....21
1.1.12 Control of Hazardous Substances ....................................22
1.2 Warnings and Cautions ............................................................... 22
1.2.1 General Warnings ............................................................22
1.2.2 General Cautions .............................................................24
1.3 Location of Warnings ................................................................. 25
1.3.1 Rear Panel ........................................................................25
2 General Information 26
2.1 Introduction ................................................................................ 26
2.2 Optical Meter Functionality ....................................................... 27
2.3 Model 1936-R ............................................................................. 27
2.4 Model 2936-R ............................................................................. 27
2.5 Calibration .................................................................................. 27
2.6 Specifications ............................................................................. 27
2.6.1 Physical Specifications: ...................................................27
2.6.2 Electrical Specifications ..................................................28
2.7 Unpacking and Handling ............................................................ 30
2.8 Inspection for Damage ............................................................... 30
2.9 Available Options and Accessories ............................................ 31
2.10 Parts List ..................................................................................... 31
2.11 Choosing and Preparing a Suitable Work Surface ..................... 31
2.12 Electrical Requirements .............................................................. 31
2.13 Power Supplies ........................................................................... 32
3 System Overview 34
Page 10

10 Preface
3.1 Startup Procedure ....................................................................... 34
3.2 Front Panel Layout ..................................................................... 34
3.3 Rear Panel Layout ...................................................................... 35
3.4 Rack Mounting the 1936/2936 Series ........................................ 39
4 System Operation 42
4.1 Front Panel Keys ........................................................................ 42
4.2 Measurement Settings ................................................................ 49
4.3 Trigger Setup .............................................................................. 52
4.4 Wavelength Setting .................................................................... 53
4.5 Display Color .............................................................................. 54
3.2.1 Front Panel Elements .......................................................35
3.2.2 Understanding the Main Screen ......................................35
3.3.1 Elements That Vary by Model (on back panel) ...............35
3.3.2 Panel Layout ....................................................................36
3.3.3 Changing Voltage Settings ..............................................38
4.1.1 Power Switch ...................................................................42
4.1.2 Setup/Enter Key ...............................................................43
4.1.3 Esc Key ............................................................................44
4.1.4 Navigation and Selection Keys .......................................44
4.1.4.1 Channel Swapping ................................................ 44
4.1.4.2 Navigation ............................................................. 45
4.1.5 Soft Keys .........................................................................45
4.1.6 Dedicated Keys ................................................................45
4.1.6.1 Range .................................................................... 46
4.1.6.2 Mode ..................................................................... 47
4.1.6.3 Hold....................................................................... 47
4.1.6.4 Filter ...................................................................... 47
4.1.6.5 Lambda (λ) Key .................................................... 48
4.1.6.6 Set Zero Offset (Zero Key) ................................... 49
4.2.1 Changing the Measurement Settings ...............................49
4.2.1.1 Wavelength Selection ........................................... 49
4.2.1.2 Range Selection and Range Type (Rng. type) ...... 49
4.2.1.3 Attenuator On/Off ................................................. 50
4.2.1.4 Analog and Digital Filter Selection ...................... 50
4.2.1.5 Units Selection ...................................................... 50
4.2.1.6 Mode Selection ..................................................... 51
4.2.1.7 Spot Size ............................................................... 51
4.2.1.8 Number of Digits Setting ...................................... 51
4.2.1.9 Offset Field ........................................................... 51
4.2.2 Detector Information .......................................................51
4.3.1 Trigger Delay ...................................................................52
4.3.2 Trigger Start .....................................................................52
4.3.3 Trigger Stop .....................................................................53
Page 11

11 Preface 11
4.6 USB Address and RS232 Parameters ......................................... 55
4.7 Statistics ...................................................................................... 55
4.7.1 Graph ...............................................................................56
4.8 Math Functions ........................................................................... 57
4.9 Measurement Correction Settings .............................................. 58
4.10 59
4.11 Display Modes ............................................................................ 59
4.11.1 Numeric Display ..............................................................59
4.11.2 Analog Bar .......................................................................59
4.11.3 Analog Needle .................................................................61
4.11.4 Vertical Chart ..................................................................61
4.12 Firmware Upgrade Procedure ..................................................... 62
5 Performing Basic Measurements 64
5.1 Introduction ................................................................................ 64
5.2 Measurement Modes and Units .................................................. 64
5.3 CW Measurements ( with 918D or 818P Detectors ) ................. 65
5.4 Peak-to-Peak Power Measurements (918D Detectors) .............. 66
5.5 Power Ratio and Power Reference Measurements ..................... 66
5.6 Pulse Energy Measurements (818E Detectors) .......................... 67
5.7 Signal Integration Measurements (918D or 818P Detectors) ..... 68
5.8 Measuring Laser Pulse Energy with an 818P Thermopile
Detector (Single Shot) .............................................................. 68
5.9 Frequency Measurements (918D or 818E Detectors) ................ 70
5.10 RMS Measurements ................................................................... 71
6 Software Application 72
6.1 Overview .................................................................................... 72
6.2 Connection .................................................................................. 72
6.3 General Usage ............................................................................ 73
6.4 Menu Structure ........................................................................... 73
7 Computer Interfacing 75
7.1 General Guidelines ..................................................................... 75
7.2 Computer Interface Terminology ............................................... 75
7.2.1 <…> Delimiting Punctuation ..........................................75
7.2.2 <CR> Carriage Return .....................................................75
7.2.3 <LF> Line Feed ...............................................................75
7.2.4 (;) Semicolons ..................................................................75
7.2.5 <number> Numerical Types ............................................76
7.2.6 <string> String Types ......................................................76
7.2.7 Command Termination ....................................................76
7.2.8 Response Termination .....................................................76
7.3 RS-232C Communication .......................................................... 76
7.3.1 Setting Echo Mode From the Keypad .............................77
7.3.2 Setting Echo Mode via Remote Interface ........................77
7.3.3 Setting the USB Address .................................................77
Page 12

12 Preface
7.4 USB Communication .................................................................. 77
8 Communication Command Reference 79
8.1 Model 1936/2936 Series Remote Interface Commands ............. 79
8.2 Command Overview ................................................................... 79
8.3 Command Description ................................................................ 80
8.2.1 Activate a Specific Channel ............................................80
8.3.1 Command Glossary .........................................................80
8.3.2 Display Commands .........................................................82
8.3.2.1 DISP:BRIGHT ...................................................... 82
8.3.2.2 DISP:BRIGHT? .................................................... 83
8.3.3 Power Meter Commands .................................................83
8.3.3.1 *IDN? .................................................................... 83
8.3.3.2 *RCL ..................................................................... 83
8.3.3.3 *SAV..................................................................... 84
8.3.3.4 ADDRess .............................................................. 84
8.3.3.5 ADDRess?............................................................. 85
8.3.3.6 BEEP ..................................................................... 85
8.3.3.7 BEEP? ................................................................... 85
8.3.3.8 ECHO .................................................................... 85
8.3.3.9 ECHO? .................................................................. 86
8.3.3.10 ERRors? ................................................................ 86
8.3.3.11 ERRSTR? .............................................................. 86
8.3.3.12 PM:ANALOGFILTER ......................................... 87
8.3.3.13 PM: ANALOGFILTER? ...................................... 87
8.3.3.14 PM:ANALOG:IMP............................................... 87
8.3.3.15 PM:ANALOG:IMP? ............................................. 88
8.3.3.16 PM:ANALOG:OUT ............................................. 88
8.3.3.17 PM:ANALOG:OUT? ............................................ 88
8.3.3.18 PM:ATT ................................................................ 89
8.3.3.19 PM:ATT? .............................................................. 89
8.3.3.20 PM:ATTSN? ......................................................... 89
8.3.3.21 PM:AUTO............................................................. 89
8.3.3.22 PM:AUTO? ........................................................... 90
8.3.3.23 PM:CALDATE? ................................................... 90
8.3.3.24 PM:CALTEMP? ................................................... 90
8.3.3.25 PM:CHANnel ....................................................... 91
8.3.3.26 PM:CHANnel? ...................................................... 91
8.3.3.27 PM:CORR ............................................................. 91
8.3.3.28 PM:CORR? ........................................................... 92
8.3.3.29 PM:DETMODEL? ................................................ 92
Page 13

13 Preface 13
8.3.3.30 PM:DETSIZE? ...................................................... 92
8.3.3.31 PM:DETSN? ......................................................... 92
8.3.3.32 PM:DIGITALFILTER .......................................... 93
8.3.3.33 PM:DIGITALFILTER? ........................................ 93
8.3.3.34 PM:DPower? ......................................................... 93
8.3.3.35 PM:DS:BUFfer ..................................................... 94
8.3.3.36 PM:DS:BUFfer? ................................................... 94
8.3.3.37 PM:DS:CLear ....................................................... 94
8.3.3.38 PM:DS: Count? ..................................................... 94
8.3.3.39 PM:DS:ENable ..................................................... 95
8.3.3.40 PM:DS:ENable? .................................................... 95
8.3.3.41 PM:DS:GET? ........................................................ 95
8.3.3.42 PM:DS:INTerval ................................................... 96
8.3.3.43 PM:DS:INTerval? ................................................. 96
8.3.3.44 PM:DS:SAVEBUFFER ........................................ 96
8.3.3.45 PM:DS:SIZE ......................................................... 97
8.3.3.46 PM:DS:SIZE? ....................................................... 97
8.3.3.47 PM:DS:UNITs?..................................................... 97
8.3.3.48 PM:FILTer ............................................................ 98
8.3.3.49 PM:FILTer? .......................................................... 98
8.3.3.50 PM:FREQuency? .................................................. 98
8.3.3.51 PM:Lambda........................................................... 99
8.3.3.52 PM:Lambda? ......................................................... 99
8.3.3.53 PM:MAX:Lambda? .............................................. 99
8.3.3.54 PM:MAX:Power? ............................................... 100
8.3.3.55 PM:MIN:Lambda? .............................................. 100
8.3.3.56 PM:MIN:Power? ................................................. 100
8.3.3.57 PM:MEAS:TIMEOUT ....................................... 100
8.3.3.58 PM:MEAS:TIMEOUT? ...................................... 101
8.3.3.59 PM:MODE .......................................................... 101
8.3.3.60 PM:MODE? ........................................................ 102
8.3.3.61 PM:Power? .......................................................... 102
8.3.3.62 PM:PWS? ............................................................ 102
8.3.3.63 PM:RANge ......................................................... 103
8.3.3.64 PM:RANge? ........................................................ 103
8.3.3.65 PM:REF:VALue ................................................. 103
8.3.3.66 PM:REF:VALue? ............................................... 104
8.3.3.67 PM:REF:STOre................................................... 104
8.3.3.68 PM:RESPonsivity? ............................................. 104
Page 14

14 Preface
8.3.3.69 PM:RUN ............................................................. 105
8.3.3.70 PM:RUN? ........................................................... 105
8.3.3.71 PM:SATLEVEL ................................................. 105
8.3.3.72 PM:SATLEVEL? ................................................ 105
8.3.3.73 PM:SPOTSIZE ................................................... 106
8.3.3.74 PM:SPOTSIZE? .................................................. 106
8.3.3.75 PM:STAT:MAX? ............................................... 106
8.3.3.76 PM:STAT:MEAN? ............................................. 107
8.3.3.77 PM:STAT:MIN? ................................................. 107
8.3.3.78 PM:STAT:MAXMIN? ........................................ 107
8.3.3.79 PM:STAT:SDEViation? ..................................... 107
8.3.3.80 PM:Temp?........................................................... 108
8.3.3.81 PM:Temppoll ...................................................... 108
8.3.3.82 PM:Temppoll? .................................................... 108
8.3.3.83 PM:THERM:PREDICT ...................................... 108
8.3.3.84 PM:THERM:PREDICT? .................................... 109
8.3.3.85 PM:TRIG:EXTernal ........................................... 109
8.3.3.86 PM:TRIG:EXTernal? .......................................... 109
8.3.3.87 PM:TRIG:EDGE................................................. 110
8.3.3.88 PM:TRIG:EDGE? ............................................... 110
8.3.3.89 PM:TRIG:HOLDoff ........................................... 110
8.3.3.90 PM:TRIG:HOLDoff? .......................................... 111
8.3.3.91 PM:TRIG:START............................................... 111
8.3.3.92 PM:TRIG:START? ............................................. 111
8.3.3.93 PM:TRIG:STOP ................................................. 112
8.3.3.94 PM:TRIG:STOP? ................................................ 112
8.3.3.95 PM:TRIG:STATE ............................................... 112
8.3.3.96 PM:TRIG:STATE? ............................................. 113
8.3.3.97 PM:TRIG:VALUE .............................................. 113
8.3.3.98 PM:TRIG:VALUE? ............................................ 113
8.3.3.99 PM:TRIG:TIME ................................................. 114
8.3.3.100 PM:TRIG:TIME? ............................................. 114
8.3.3.101 PM:UNITs........................................................ 114
8.3.3.102 PM:UNITs? ...................................................... 115
8.3.3.103 PM:ZEROSTOre.............................................. 115
8.3.3.104 PM:ZEROVALue ............................................ 115
8.3.3.105 PM:ZEROVALue? .......................................... 115
9 Principles of Operation 117
Page 15

15 Preface 15
9.1 Introduction .............................................................................. 117
9.2 Analog Signal Flow .................................................................. 117
9.3 Digitized Signal Flow ............................................................... 118
9.4 Typical Detector Signals .......................................................... 119
9.5 Thermopile Detector Signals .................................................... 120
9.6 Pulse Energy Detector Signals ................................................. 120
9.7 Peak-to-Peak (Photodiode) Detector Signals ........................... 121
9.8 Integration of Detector Signals ................................................. 122
9.9 Analog Output .......................................................................... 123
9.10 Measurement Considerations ................................................... 124
9.10.1 Detector Calibration and Accuracy ...............................124
9.10.2 Quantum Detector Temperature Effects ........................124
9.10.3 Thermopile Detector Temperature Effects ....................125
9.10.4 Energy Detector Temperature Effects ...........................126
9.10.5 Ambient and Stray Light ...............................................126
9.10.6 Signal Filtering ..............................................................127
9.11 Common Measurement Errors ................................................. 128
10 Maintenance and Service 130
10.1 Enclosure Cleaning ................................................................... 130
10.2 Fuse Replacement ..................................................................... 130
10.3 Obtaining Service ..................................................................... 131
10.4 Service Form ............................................................................ 132
11 Appendix A – Syntax and Definitions 134
11.1 Definition of <string> ............................................................... 134
11.2 Definition of <number> ............................................................ 135
12 Appendix B – Error Messages 138
12.1 Introduction .............................................................................. 138
12.2 Command Errors ...................................................................... 138
12.3 Execution Errors ....................................................................... 139
12.4 Device Errors ............................................................................ 140
13 Appendix C - Legacy Commands Reference 142
14 Appendix D – Sample Programs 144
14.1 Programming Samples .............................................................. 144
14.2 LabVIEW ................................................................................. 144
14.3 Microsoft® Visual Basic .......................................................... 144
14.4 Microsoft Visual C++ ............................................................... 144
14.5 Microsoft .NET ......................................................................... 144
15 Appendix E – Disassembly Instructions 146
15.1 Disassembly instructions .......................................................... 146
Page 16

16 Preface
List of Figures
Figure 1 General Warning or Caution Symbol ............................................. 19
Figure 2 Electrical Shock Symbol ................................................................ 19
Figure 3 Protective Conductor Terminal Symbol ........................................ 19
Figure 4 CE Mark ......................................................................................... 20
Figure 5 Alternating Voltage Symbol .......................................................... 20
Figure 6 On Symbol ..................................................................................... 20
Figure 7 Off Symbol ..................................................................................... 20
Figure 8 Fuse Symbol ................................................................................... 21
Figure 9 Frame or Chassis Terminal Symbol ............................................... 21
Figure 10 USB connector Symbol .................................................................. 21
Figure 11 WEEE Directive Symbol ............................................................... 21
Figure 12 RoHS Compliant Symbol ............................................................... 22
Figure 13 AC Receptacle Warning Label....................................................... 24
Figure 14 Locations of warnings on the rear panel ........................................ 25
Figure 15 Front Panel Layout ......................................................................... 34
Figure 16 1936-R Rear Panel Layout ............................................................. 36
Figure 17 2936-R Rear Panel Layout ............................................................. 37
Figure 18 PM1 –RACK mounting kit ............................................................ 39
Figure 19 PM2 –RACK mounting kit ............................................................ 40
Figure 20 Mounting details for the PM1 –RACK mounting kit .................... 41
Figure 21 Front Panel keys ............................................................................. 42
Figure 22 Power Switch ................................................................................. 42
Figure 23 Navigation/Selection and Setup/Enter keys ................................... 43
Figure 24 Main screen .................................................................................... 43
Figure 25 Measurement Settings screen ......................................................... 44
Figure 26 Channel A primary ......................................................................... 44
Figure 27 Channel B primary ......................................................................... 44
Figure 28 Soft keys ......................................................................................... 45
Figure 29 Dedicated keys ............................................................................... 45
Figure 30 Manual Range mode ...................................................................... 46
Figure 31 Auto Range mode ........................................................................... 46
Figure 32 This screen is displayed after pressing the Config soft key ........... 46
Figure 33 Mode selection screen .................................................................... 47
Figure 34 Measurement is on hold ................................................................. 47
Figure 35 Filter selection screen ..................................................................... 47
Figure 36 Filter configuration screen ............................................................. 48
Figure 37 Digital Filter editing ....................................................................... 48
Figure 38 Wavelengths screen ........................................................................ 48
Figure 39 Zero Selection ................................................................................ 49
Figure 40 Measurement Settings screen ......................................................... 49
Figure 41 Accessing the Trigger Setup screen ............................................... 52
Figure 42 Trigger Delay waveforms .............................................................. 52
Figure 43 Predefined color schemes ............................................................... 54
Page 17

17 Preface 17
Figure 44 Setup screen ................................................................................... 54
Figure 45 System Settings screen ................................................................... 54
Figure 46 About screen................................................................................... 55
Figure 47 Statistics screen .............................................................................. 55
Figure 48 Graph screen................................................................................... 56
Figure 49 Math field ....................................................................................... 57
Figure 50 Math configuration screen.............................................................. 57
Figure 51 Measurement Settings .................................................................... 58
Figure 52 Correction Settings ......................................................................... 58
Figure 53 Mode selection screen .................................................................... 59
Figure 54 The Numeric display ...................................................................... 59
Figure 55 Analog Bar ..................................................................................... 59
Figure 56 Auto Zoom ..................................................................................... 60
Figure 57 Analog Needle display ................................................................... 61
Figure 58 Vertical chart with 3 measurements per line .................................. 61
Figure 59 Vertical chart with 1 measurement per line ................................... 61
Figure 60 Measuring Laser Pulse Energy via a Thermopile in CW Integrate
Mode .............................................................................................. 69
Figure 61 Application front panel .................................................................. 72
Figure 62 Application Advanced Options (Configuration Tab) ..................... 73
Figure 63 RS-232 9 Pin to 9-Pin Cable Connections. Cable terminators (RS-
232) ................................................................................................ 77
Figure 64 Model 1936/2936 Series Analog Signal Flow Diagram .............. 117
Figure 65 Thermopile Signals exhibit 1 to 10 second time constants. ......... 120
Figure 66 Typical Newport Energy Detector Signal Waveform .................. 121
Figure 67 Negative Baseline Voltage. .......................................................... 121
Figure 68 Time Varying Signal Measurements. ........................................... 122
Figure 69 Integrated Energy Via a Trapezoid Approximation. .................... 122
Figure 70 Measuring Laser Pulse Energy with a Thermopile. ..................... 123
Figure 71 Fuse Replacement ........................................................................ 130
Figure 72 Disassembled 1936/2936 model .................................................. 147
List of Tables
Table 1 Available Measurement Modes and Valid Units. .......................... 65
Table 2 Root level Commands/Queries Summary ...................................... 80
Table 3 Tree Level Commands/Queries Summary ..................................... 82
Table 4 Analog Signal Flow Paths. ........................................................... 118
Table 5 Analog Output Range Table......................................................... 123
Table 6 Common Measurement Errors ..................................................... 128
Table 7 Legacy Commands Reference...................................................... 143
Page 18

18 Preface
This page is intentionally left blank
Page 19
1 Safety Precautions
1.1 Definitions and Symbols
The following terms and symbols are used in this documentation and also
appear on the Models 1936/2936 Series Optical Power Meters where safetyrelated issues occur.
1.1.1 General Warning or Caution
Figure 1 General Warning or Caution Symbol
The Exclamation Symbol in the figure above appears in Warning and Caution
tables throughout this document. This symbol designates an area where
personal injury or damage to the equipment is possible.
1.1.2 Electric Shock
Figure 2 Electrical Shock Symbol
The Electrical Shock Symbol in the figure above appears throughout this
manual. This symbol indicates a hazard arising from dangerous voltage.
Any mishandling could result in irreparable damage to the equipment, and
personal injury or death.
1.1.3 Protective Conductor Terminal
Figure 3 Protective Conductor Terminal Symbol
The protective conductor terminal symbol in the above figure identifies the
location of the bonding terminal, which is bonded to conductive accessible
parts of the enclosure for safety purposes.
Page 20

20 Safety Precautions
1.1.4 European Union CE Mark
The presence of the CE Mark on Newport Corporation equipment means that
it has been designed, tested and certified as complying with all applicable
European Union (CE) regulations and recommendations.
1.1.5 Alternating voltage symbol
Figure 5 Alternating Voltage Symbol
Figure 4 CE Mark
This international symbol implies an alternating voltage or current.
1.1.6 On
The On Symbol in the figure above represents a power switch position on the
1936/2936 Series Optical Power Meters. This symbol represents a Power On
condition.
1.1.7 Off
The Off Symbol in the figure above represents a power switch position on the
1936/2936 Series Optical Power Meters. This symbol represents a Power Off
condition.
Figure 6 On Symbol
Figure 7 Off Symbol
Page 21
Safety Precautions 21
1.1.8 Fuses
Figure 8 Fuse Symbol
The fuse symbol in the figure above identifies the fuse location on the
Models 1936/2936 Series Optical Power Meters.
1.1.9 Frame or Chassis
Figure 9 Frame or Chassis Terminal Symbol
The symbol in the figure above appears on the 1936/2936 Series Optical
Power Meters. This symbol identifies the frame or chassis terminal
1.1.10 USB Connector Symbol
Figure 10 USB connector Symbol
The USB connector symbol in the above figure identifies the location of the
USB communications connector.
1.1.11 Waste Electrical and Electronic Equipment (WEEE)
Figure 11 WEEE Directive Symbol
This symbol on the product or on its packaging indicates that this product
must not be disposed of with regular waste. Instead, it is the user
responsibility to dispose of waste equipment according to the local laws. The
separate collection and recycling of the waste equipment at the time of
Page 22
22 Safety Precautions
WARNING
Situation has the potential to cause bodily harm or death.
CAUTION
Situation has the potential to cause damage to property or
equipment.
disposal will help to conserve natural resources and ensure that it is recycled
in a manner that protects human health and the environment. For information
about where the user can drop off the waste equipment for recycling, please
contact your local Newport Corporation representative. See Section 15 for
instructions on how to disassemble the equipment for recycling purposes.
1.1.12 Control of Hazardous Substances
Figure 12 RoHS Compliant Symbol
This label indicates the products comply with the EU Directive 2002/95/EC
that restricts the content of six hazardous chemicals.
1.2 Warnings and Cautions
The following are definitions of the Warnings, Cautions and Notes that are
used throughout this manual to call your attention to important information
regarding your safety, the safety and preservation of your equipment or an
important tip.
Additional information the user or operator should consider.
1.2.1 General Warnings
NOTE
Observe these general warnings when operating or servicing this
equipment:
Heed all warnings on the unit and in the operating instructions.
Do not use this equipment in or near water.
Page 23

Safety Precautions 23
This equipment is grounded through the grounding conductor of the
power cord.
Route power cords and other cables so they are not likely to be
damaged.
Disconnect power before cleaning the equipment. Do not use liquid or
aerosol cleaners; use only a damp lint-free cloth.
Lockout all electrical power sources before servicing the equipment.
To avoid fire hazard, use only the specified fuse(s) with the correct type
number, voltage and current ratings as referenced in the appropriate
locations in the service instructions or on the equipment. Only qualified
service personnel should replace fuses.
To avoid explosion, do not operate this equipment in an explosive
atmosphere.
Qualified service personnel should perform safety checks after any
service.
Page 24

24 Safety Precautions
1.2.2 General Cautions
Observe these cautions when operating or servicing this equipment:
Before applying power, carefully read the warning label placed over the
AC power input receptacle in back of the instrument.
If this equipment is used in a manner not specified in this manual, the
protection provided by this equipment may be impaired.
Figure 13 AC Receptacle Warning Label
To prevent damage to equipment when replacing fuses, locate and
correct the problem that caused the fuse to blow before re-applying
power.
Do not block ventilation openings.
Do not position this product in such a manner that would make it
difficult to disconnect the power cord.
Use only the specified replacement parts.
Follow precautions for static sensitive devices when handling this
equipment.
This product should only be powered as described in the manual.
There are no user-serviceable parts inside the 1936/2936 Series Optical
Power Meters.
To prevent damage to the equipment, read the instructions in the
equipment manual for proper input voltage.
Adhere to good laser safety practices when using this equipment.
Page 25
Safety Precautions 25
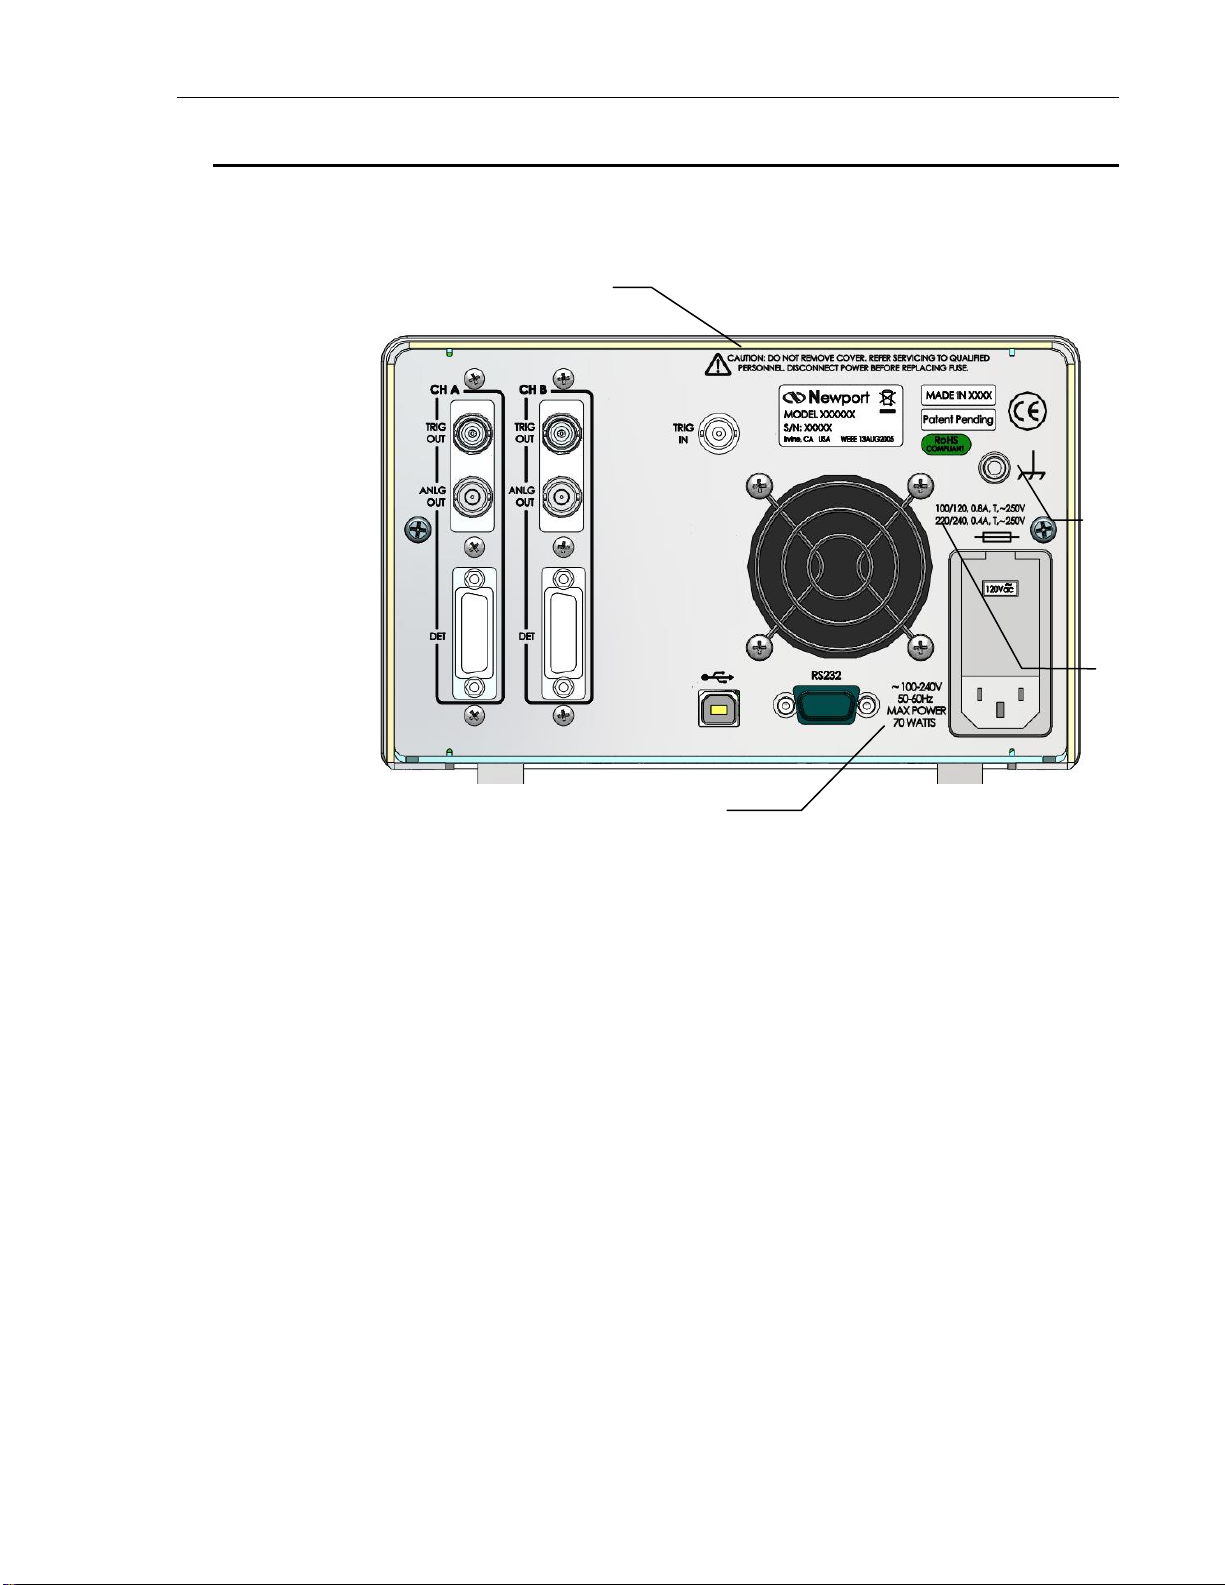
Frame or
Chassis
Terminal
Fuse info
MAX Power
(1936-R Shown)
Electrical Hazard
1.3 Location of Warnings
1.3.1 Rear Panel
Figure 14 Locations of warnings on the rear panel
Page 26

2 General Information
2.1 Introduction
The 1936/2936 Series Optical Meters are designed to provide a powerful
combination of features to measure optical power and energy of nearmonochromatic or monochromatic sources. Use of the extensive
measurement modes and features have been simplified with an intuitive menu
driven structure that provides quick access to all modes, features and settings.
Some of the prominent specifications and features that will simplify your
calibrated measurement applications are:
Compatibility with Photodiode, Thermopile and Pyroelectric detectors.
(Low-Power (Semiconductor) Family, High-Power (Thermopile)
Family, Energy (Pyroelectric) Family, InGaAs Cooled, Photometric,
PMT, GaN, PbS, PbSe, and HgCdZnTe)
Measurement rate up to 10 kHz with internal signal sampling rate of
250 kHz.
Multiple measurement modes for power and energy measurements:
Single, Continuous, Integrated, Peak-to-Peak and Frequency.
Software suite, including LabVIEW drivers and Windows application.
250,000 internal data point storage.
Triggering features to synchronize measurements with external events.
USB and RS-232 Interfaces
Rack Mountable in Single or Dual Set Configurations
The full color TFT 5.6” LCD renders excellent visibility both with the naked
eye and laser goggles for single screen rendering of plotted and enumerate
results. Measurements can be displayed in Watts, Joules, Amps, Volts, Hertz,
dBm, dB, Sun or relative units, either directly or as relative ratio
measurements from present or stored values. Statistical capabilities include
the computation of Min, Max, Max-Min, Mean and Standard Deviation.
Additional features such as digital and analog filtering, and data storage of up
to 250,000 readings per channel are also offered.
Newport’s experience with calibration, together with N.I.S.T. calibration
traceability and high precision optical power meters provide users with
accurate measurements and exceptional inter-instrument correlation. In R&D,
QA/QC, and manufacturing environments, the 1936/2936 Series power
meters enable users to benefit from high correlation between multiple
Page 27

General Information 27
locations at a price-to-performance ratio second to none. Among all the other
practical tools provided, remote controlling with a computer and
synchronization to other instruments are simplified with the inclusion of
LabVIEW drivers, tools to develop in the .NET environment and a highspeed software utility that fully utilized the optical meter’s ability to sample
at 250 kHz and transfer data via a Full-Speed USB interface (11 Mbps).
2.2 Optical Meter Functionality
Optical meters in the 1936/2936 Series product line are designed to provide
continuous wave (CW) and pulsed source measurements that support the testing
and production needs of free space beams and fiber optics based sources. These
optical meters come in one or two channel configurations. They require
detectors having a 15-pin D-Sub type Male connector.
2.3 Model 1936-R
The model 1936-R optical meter is a 1-channel input optical meter
compatible with all Newport detectors having a 15-pin D-sub type connector.
All product features and capabilities described herein are included in this
model, except a second detector channel.
2.4 Model 2936-R
The model 2936-R optical meter is a 2-channel input optical meter
compatible with all Newport detectors having a 15-pin D-sub type
connectors. All product features and capabilities described herein are
included in this model.
2.5 Calibration
Calibration of the power meter is done at the factory by defining a slope and
offset, for all ranges as determined for each detector type.
Newport recommends annual factory re-calibration to ensure the continued
accuracy of power meter measurements.
Please refer to the “Maintenance and Troubleshooting” section for contact
information for re-calibration of your power meter.
2.6 Specifications
2.6.1 Physical Specifications:
Dimensions: 5.25 x 12.11 x 8.50 in (133 x 308 x 216 mm)
Weight: max. 12.4 lb
Enclosure: Metal case, painted
Connectors: Optical Detector 15-Pin D-Sub, BNC Analog
Output, Trigger Output, Trigger Input, 9-Pin D-Sub
RS-232, USB Host, USB Device
Page 28

28 General Information
Signal Range
2,3
0 1 2 3 4 5 6
7
Full-Scale Current
2.5 nA
25 nA
250 nA
2.50 µA
25.0 µA
250 µA
2.50 mA
25 mA
Resolution
76 fA
763 fA
7.63 pA
76.3 pA
763 pA
7.63 nA
76.3 nA
763 nA
Accuracy
1.0%
1.0%
1.0%
1.0%
1.0%
1.0%
1.0%
1.0%
Bandwidth8
1.2 Hz
4.8 Hz
48 Hz
480 Hz
4 kHz
43 kHz
170 kHz
400 kHz
Maximum Pulse Repetition
Rate4
1.2 Hz
4.8 Hz
48 Hz
480 Hz
4 kHz
20 kHz
20 kHz
20 kHz
Frequency Measurement7
─
─
30 Hz –
1kHz
20 Hz –
1 kHz
20 Hz –
8 kHz
20 Hz –
80 kHz
20 Hz –
160 kHz
20 Hz –
130 kHz
Frequency Measurement
Accuracy7
─ ─ 1.0%
1.0%
1.0%
1.0%
1.0%
1.0%
Signal Range
2,3
0 1 2 3 4
5
6
7
Full-Scale Current
2.5 nA
25 nA
250 nA
2.50 µA
25.0 µA
250 µA
2.50 mA
25 mA
Resolution1
10 fA
100 fA
1 pA
10 pA
100 pA
1 nA
10 nA
100 nA
Bandwidth8 (Unfiltered)
1.2 Hz
4.8 Hz
48 Hz
480 Hz
4 kHz
43 kHz
170 kHz
400 kHz
Accuracy (Filtered)1
0.2%
0.2%
0.2%
0.2%
0.2%
0.2%
0.2%
0.2%
Accuracy (Maximum
Measurement Rate=10kHz)
1.0%
1.0%
1.0%
1.0%
1.0%
1.0%
1.0%
1.0%
Signal to Noise Ratio1
100 dB
100 dB
100 dB
100 dB
100 dB
100 dB
100 dB
100 dB
Frequency Measurement
(Square Wave Signal)7
─
─
30 Hz –
250 Hz
0.5 Hz –
8 kHz
0.5 Hz –
8 kHz
0.5 Hz –
80 kHz
0.5 Hz –
200 kHz
0.5 Hz –
200 kHz
Frequency Measurement
(Sine Wave Signal)7
─
─
30 Hz –
250 kHz
20 Hz –
2 kHz
20 Hz –
8 kHz
20 Hz –
80 kHz
20 Hz –
200 kHz
20 Hz –
200 kHz
Frequency Measurement
Accuracy7
─ ─ 1.0%
1.0%
1.0%
1.0%
1.0%
1.0%
Power: 100/120/220/240VAC 10%, 50/60 Hz, 70 Watts
Display: Graphical LCD ¼ VGA, 5.6 in diagonal, TFT color
Display Update Rate: ≥ 20 Hz
Operating Environment: 5C to 40C; 70% RH non-condensing
Storage Environment: -20C to 60C; 90% RH non-condensing
Altitude 3000m
Installation Category II
Pollution Degree 2
Use Location Indoor use only
2.6.2 Electrical Specifications
DC Current Measurement (Low-Power, Semiconductor Photodiode)
Peak-Peak Current Measurement (Low-Power, Semiconductor Photodiode)
Page 29

General Information 29
Signal Range
2,3
0 1 2 3 4
5
Full-Scale Voltage
2.5mV
25.0 mV
250 mV
2.50 V
25.0 V
130 V
Resolution
76.3 nV
763 nV
7.63 µV
76.3 µV
763 μV
3.96 mV
Accuracy
(Filtered)1
0.3%
0.3%
0.3%
0.3%
0.3%
0.3%
Accuracy (Maximum
Measurement Rate=10kHz)
1.0%
1.0%
1.0%
1.0%
1.0%
1.0%
Frequency Measurement
(Square Wave Signal)7
130 Hz –
200 kHz
20 Hz –
220 kHz
0.5 Hz –
220 kHz
0.5 Hz –
250 kHz
0.5 Hz – 220
kHz
0.5 Hz – 200
kHz
Frequency Measurement
(Sine Wave Signal)7
130 Hz –
200 kHz
20 Hz –
220 kHz
20 Hz –
220 kHz
20 Hz –
220 kHz
20 Hz – 220
kHz
20 Hz – 200
kHz
Frequency Measurement
Accuracy7
1.0%
1.0%
1.0%
1.0%
1.0%
1.0%
Bandwidth8
640 kHz
1600 kHz
1600 kHz
1900 kHz
640 kHz
1900 kHz
Signal to Noise Ratio1 (typ)
80dB
90dB
108dB
108dB
108dB
108dB
Signal Range
2,3
0 1 2 3 4
5
Full-Scale Current
2.5mV
25.0 mV
250 mV
2.50 V
25.0 V
130 V
Resolution
76.3 nV
763 nV
7.63 µV
76.3 µV
763 μV
3.96 mV
Accuracy
1.0%
1.0%
1.0%
1.0%
1.0%
1.0%
Frequency
Measurement
(Pulsed Signal)7
130 Hz –
200 kHz
20 Hz –
220 kHz
0.5 Hz –
220 kHz
0.5 Hz –
250 kHz
0.5 Hz – 220
kHz
0.5 Hz – 200
kHz
Frequency
Measurement
Accuracy7
1.0%
1.0%
1.0%
1.0%
1.0%
1.0%
Bandwidth8
640 kHz
1600 kHz
1600 kHz
1900 kHz
640 kHz
1900 kHz
Maximum Pulse
Repetition Rate5
10 kHz
10 kHz
10 kHz
10 kHz
10 kHz
10 kHz
Maximum Pulse Repetition Rate
2 kHz
10 kHz
Accuracy
1.0 %
2.0 %
D.C. Voltage Measurement (Thermopile)
Pulse Voltage Measurement (Energy, Pyroelectric)
RMS Measurement
Page 30

30 General Information
Output Range
0 1 2
3
Full Scale Voltage
(Load > 100 kΩ)
1 V
2 V
5 V
10 V
Full Scale Voltage
(Load = 50 Ω)
0.5 V
1 V
2.5 V
-
Accuracy
1.0 %
1.0 %
1.0 %
1.0 %
Linearity
0.3%
0.3%
0.3%
0.3%
Programmable Level
0…100 % Full Scale
Resolution
0.39 % Full Scale
Analog Output
Trigger Level
1
With 5Hz filter on.
2
Listed signal ranges specify meter capability. Available signal ranges are detector dependent.
3
Maximum measurable signal is detector dependent.
4
While the maximum repetition range may equal the bandwidth, it really depends on the signal duty-cycle or the
signal shape.
5
The Maximum Repetition Rate refers to the meter pulse-by-pulse measuring capability. Due to its high
bandwidth, the 1936/2936 can take in signals with higher repetitive rates and outputs them undistorted at the
Analog Output.
6
The Temperature Range is detector dependent.
7
The Frequency Measurement min/max values are signal shape dependent. The specified frequency
measurement range and accuracy are defined for an amplitude of half full scale.
8
The instrument bandwidth is determined by the detector used. Please refer to Newport Corporation’s complete
offering on detector type. The specified bandwidth is measured from the instrument input (detector) to the Analog
Output BNC.
2.7 Unpacking and Handling
It is recommended that the Models 1936/2936 Series Optical Power Meters
be unpacked in a lab environment or work site. Unpack the system carefully;
small parts and cables are included with the instrument. Inspect the box
carefully for loose parts before disposing of the packaging. You are urged to
save the packaging material in case you need to ship your equipment in the
future.
2.8 Inspection for Damage
The Models 1936/2936 Series Optical Power Meters are carefully packaged
at the factory to minimize the possibility of damage during shipping. Inspect
the box for external signs of damage or mishandling. Inspect the contents for
damage. If there is visible damage to the instrument upon receipt, inform the
shipping company and Newport Corporation immediately.
Page 31

General Information 31
WARNING
Do not attempt to operate this equipment if there is evidence of
shipping damage or you suspect the unit is damaged. Damaged
equipment may present additional hazards to you. Contact
Newport technical support for advice before attempting to plug
in and operate damaged equipment.
WARNING
To avoid electric shock, connect the instrument to properly
earth-grounded, 3-prong receptacles only. Failure to observe
this precaution can result in severe injury.
2.9 Available Options and Accessories
Newport Corporation also supplies temperature controlled mounts, lenses,
and other accessories. Please consult with your representative for additional
information.
2.10 Parts List
The following is a list of parts included with the 1936/2936 Series Optical
Power Meters:
User’s Manual (Hardcopy or CD)
Software Drivers and Utilities (CD)
Power cord
Two fuses
If you are missing any hardware or have questions about the hardware you
have received, please contact Newport Corporation.
2.11 Choosing and Preparing a Suitable Work Surface
The Models 1936/2936 Series Optical Power Meters may be placed on any
reasonably firm table or bench during operation. The front legs of the unit
can be pulled out to tilt the unit at an angle, if desired.
Provide adequate distance between the 1936/2936 Series Optical Power
Meters and adjacent walls for ventilation purposes. Approximately 2-inch
spacing for all surfaces is adequate.
2.12 Electrical Requirements
Before attempting to power up the unit for the first time, the following
precautions must be followed:
Have a qualified electrician verify the wall socket that will be used is
properly polarized and properly grounded.
Page 32

32 General Information
CAUTION
Permanent damage will occur to the power meter if the input
power connector settings are at either 100 or 120VAC and
applied power is above 180VAC RMS
Set the mains selector tumbler to the voltage that matches the power
outlet AC voltage.
Verify the correct rated fuses are installed according to the fuse marking
on the rear panel.
2.13 Power Supplies
AC power is supplied through the rear panel input power connector that
provides in-line transient protection and RF filtering. The input power
connector contains the fuses and the switch to select series or parallel
connection of the transformer primaries for operation at 100VAC, 120VAC,
220VAC or 240VAC. The product is shipped with the setting on 110V.
Please make sure you select the right setting according to your AC voltage
level. Also, please make sure you insert the right fuses. The product is
shipped with a spare of fuses for the 220 VAC/240VAC settings.
Page 33

General Information 33
This page is intentionally left blank
Page 34

WARNING
To avoid electrical shock hazard, connect the instrument to
properly earth-grounded, 3-prong receptacles only. Failure to
observe this precaution can result in severe injury.
3 System Overview
3.1 Startup Procedure
Provided that the power meter has been installed in an appropriate
environment and its power cord is connected to a working electrical outlet,
power-up the power meter by pressing the power button on the lower left
corner of the front panel.
For precise accuracy, 1936/2936 Series power meters should be allowed to
warm up for one hour before being used for measurements.
3.2 Front Panel Layout
The front panel layout is the same for both the 1936 and 2936 products.
Figure 15 Front Panel Layout
Page 35

System Overview 35
3.2.1 Front Panel Elements
On the front panel of the 1936/2936 Series there are the following elements:
A faceplate with an active color liquid crystal display
USB A connector
Power switch
Setup/Enter, and Esc keys
Rubberized horizontal (left/right) and vertical (up/down) arrow keys
Four rubberized blank keys below the display (referred to as “soft keys”
later in the manual, as their function depends on the text on the screen
above the key.)
Six rubberized buttons with dedicated functions – Range, Mode, Hold,
Filter, Lambda (λ), Zero.
3.2.2 Understanding the Main Screen
The main screen is displayed after startup (Figure 15). The middle portion of
the main screen is a real-time display of power measured in last used units, and
the lower half of the main screen is a row of four labels for actions that the
keys below them will activate. The top of this screen has the channel settings
for the focus channel and a smaller reading for the non-focus channel (B in the
figure). Note that the screen will display “Saturated” message either when the
amount of power surpasses the detector saturation specification, or when the
detector spot size and/or detector saturation specifications are missing in the
calibration module.
When an annunciator label is visible, its function is enabled. If the
annunciator appears on the display as an unlabeled key, the function it
represents is currently disabled. Annunciators loosely correspond to keypad
keys, which are used either alone or in combination with the navigation and
selection keys to control annunciator functions.
3.3 Rear Panel Layout
3.3.1 Elements That Vary by Model (on back panel)
Single-channel power meters have the processing electronics installed on
CH A, while dual-channel power meters have both CH A and CH B installed.
Input Connectors
The input connectors are on the rear panel. 1936-R and 2936-R power meter
models support input from external detectors through DB15 detector
connectors. Input channels on dual-channel power meters are labeled “CH A”
and “CH B”.
A Trigger input offers the possibility of synchronizing the power meter
measurements with external events.
Page 36

36 System Overview
Figure 16 1936-R Rear Panel Layout
Output Connectors
Power meters in the 1936/2936-R series support one analog output for each
channel. Analog output enables direct monitoring of a detector through an
oscilloscope or voltmeter.
On the rear panel there are also trigger outputs, one for each channel. The
user can use these outputs to synchronize external equipment with events
related to the power meter measurements.
3.3.2 Panel Layout
The rear panel is a brushed aluminum plate with input and output connectors
for the following cable types (Figure 16):
15-Pin D-Sub Optical Detector Input, Channel A (1936-R/2936-R)
BNC Analog Output, Channel A (1936-R/2936-R)
BNC Trigger Output, Channel A (1936-R/2936-R)
15-Pin D-Sub Optical Detector Input, Channel B (2936-R)
BNC Analog Output, Channel B (2936-R)
BNC Trigger Output, Channel B (2936-R)
BNC Trigger Input
USB (Universal Serial Bus) Device
9-Pin D-Sub RS-232
Page 37

System Overview 37
Figure 17 2936-R Rear Panel Layout
CAUTION
Change the voltage settings switch to the proper AC voltage
supply. Do not operate with a line voltage that is not within
10% of the line setting. Too low of an input voltage may cause
excessive ripple on the DC supplies. Too high of an input
voltage will cause excessive heating.
CAUTION
There are no user-serviceable parts inside the power meter.
Work performed inside the power meter by persons not
authorized by Newport may void the warranty.
The rear panel also has an AC input power connector (IPC) with a standard
three-prong socket and voltage setting switch.
The unit can also be grounded with a circular metal shell connector.
Markings on the rear panel identify electrical requirements for the Optical
Power Meter and potential hazards associated with using it.
NOTE
For the listed optional connectors some units may have a cover in place of the nonfunctional connector.
Page 38

38 System Overview
WARNING
To avoid electrical shock hazard, connect the instrument to
properly earth-grounded, 3-prong receptacles only. Failure to
observe this precaution can result in severe injury.
CAUTION
Do not rotate the voltage selector drum while the drum is
inserted in its location. By doing so, you may bend the contacts
behind the drum, making the unit inoperable.
CAUTION
Match the voltage setting to fuse sizing. Failure to do so may
result in damage to the power meter. Do not exceed 250VAC on
the line input.
3.3.3 Changing Voltage Settings
The 1936/2936-R Series can operate at several different supply voltages.
Before powering up the unit, check the facility AC voltage supply, and select
the appropriate setting according to the procedure below.
Use the following procedure to change the 1936/2936 Series voltage setting:
1. Ensure that the 1936/2936 Series is turned OFF and disconnected from
the AC power source.
2. Disconnect the power cord from the AC power input connector on the
back of the 1936/2936 Series.
3. Using a small screwdriver, insert and press down into the notch at the top
of the power entry module to pry the door open.
4. Carefully remove the voltage selector drum.
5. Rotate the voltage selector until the appropriate voltage will be viewed
through the voltage window.
6. Reinsert the voltage selector drum.
7. If necessary, change the fuses according to the procedure found in
Section 10.2 Replacing Fuses.
8. Close the power entry module.
9. Verify the correct voltage is displayed through the voltage window.
10. Connect the AC power input cord to the AC power input connector on the
back of the 1936/2936 Series.
Page 39

System Overview 39
3.4 Rack Mounting the 1936/2936 Series
Newport Corporation offers two rack mounting kits for the 1936/2936 Series:
PM1-RACK (Figure 18) and PM2-RACK (Figure 19)
The PM1-RACK can house one unit from the 1936/2936 Series. In the
PM2-RACK two units, either Model 1936 or Model 2936 or one of each,
may be mounted side by side. PM1-RACK and PM2-RACK kits will only fit
into 19” EIA style racks.
Figure 18 PM1 –RACK mounting kit
Page 40

40 System Overview
Figure 19 PM2 –RACK mounting kit
To mount the units in these racks the user needs to remove the four feet at the
bottom of the instrument. With the hardware supplied with the rack mount
kits, the bottom of the unit(s) is secured to the bracket using all four original
feet mounting positions (Figure 20). After tightening the screws the unit(s)
may be slid into a 19" rack and secured to the side rails.
Page 41

System Overview 41
Figure 20 Mounting details for the PM1 –RACK mounting kit
Page 42

Navigation Keys
Dedicated Keys
Reconfigurable (Soft) Keys
USB Connector
Power Switch
Escape Key
Setup/Enter
Key
4 System Operation
4.1 Front Panel Keys
The front panel keys are organized in four groups (see Figure 21).
Navigation Keys
Reconfigurable (also called Soft) Keys
Dedicated Keys
Escape (ESC) Key
Besides these keys, the front panel has a Power switch and a USB connector
at the lower left corner of the instrument.
4.1.1 Power Switch
Figure 21 Front Panel keys
Figure 22 Power Switch
The power switch is a push button on the lower left corner of the chassis that
turns the unit ON or OFF. The power switch is distinguished from other keys
Page 43

System Operation 43
This symbol represents the IN
position of the power ON/OFF push
button switch
This represents the OUT position of
the power ON/OFF push button
switch
on the front panel by its circular shape. The power to the unit is OFF when
the push button is fully extended and ON when latched.
4.1.2 Setup/Enter Key
The Setup/Enter key is placed to the right of the display (Figure 23). This key
has dual functionality. From the main screen (Figure 24) press this key to
display the Measurement Settings screen (Figure 25). Also, use this key while
any secondary menu is displayed to complete entering data, or to exit the
current secondary screen.
Figure 23 Navigation/Selection and Setup/Enter keys
Figure 24 Main screen
Page 44

44 System Operation
Figure 26 Channel A primary
Figure 27 Channel B primary
Refer to Section 4.2 for more information about the measurement settings.
4.1.3 Esc Key
The Esc key (Figure 21 and Figure 23) is used to cancel the current action.
When in a secondary screen or menu, it will close the current screen or menu
and the instrument will return to the main screen (Figure 24).
Figure 25 Measurement Settings screen
4.1.4 Navigation and Selection Keys
Navigation through and selection of data in the display is done with the top
right group of four arrows keys and with the Setup/Enter key (Figure 21 and
Figure 23).
Left and Right keys have dual functionality: Channel Swapping and
Navigation.
4.1.4.1 Channel Swapping
When the instrument displays the main screen, pressing the Left or Right
keys will cause the displayed channels A and B to be swapped.
If the meter displays channel A as primary channel and B as secondary, the
top left corner shows “A” and the main numeric field in the middle of the
screen shows the measurement in progress on channel A. The secondary
channel, B in this case, is displayed in the upper right corner (Figure 26).
Page 45

System Operation 45
Pressing the Left or Right key of the Navigation and Selection group will
make channel B primary and channel A secondary as in Figure 27.
4.1.4.2 Navigation
If the instrument is in Setup mode or in any configuration screens, pressing
the arrow keys will select different setup modes as displayed by the current
screen.
NOTE
When a channel is selected as primary, the main screen shows the primary channel
and all the function keys whether dedicated or soft keys apply to the primary
channel.
4.1.5 Soft Keys
Below the screen are a group of four keys. Their function varies, depending
on the measurement mode or the setup screen. They are designed to provide
context sensitive functionality to the user. The label displayed above each
key indicates their function.
4.1.6 Dedicated Keys
Six dedicated function keys are at the bottom right portion of the front panel.
Each of these keys can be used for quick access to the given function.
Figure 28 Soft keys
Figure 29 Dedicated keys
Page 46

46 System Operation
Pressing this key reconfigures the
Soft keys at the bottom of the
screen as in Figure 30.
From this screen the user has two
options.
One is to toggle Auto/Manual
Range mode. This is accomplished
by pressing the left-most Soft key.
If the meter current configuration
is Manual mode the left-most Soft
key is labeled Auto to allow the
user to change the Range selection
in Auto Range Mode. This can be
seen in Figure 30, where the range
is 1.000 W indicating a manual
mode.
If the instrument is in Auto Range
Mode, the left most key is labeled
Manual (Figure 31). The user may
return to the main screen by
pressing the ESC key.
Figure 30 Manual Range mode
Figure 31 Auto Range mode
The other option is to press the
right-most Soft key, which is
labeled Config. This action
displays the Range Configuration
screen (Figure 32). Here the user
can select a certain range or even
Auto Range with the
Navigation/Enter keys. Once a
range is selected the instrument
returns to the main screen. While
in Range Configuration screen,
the user may cancel the selection
by hitting the ESC key.
Figure 32 This screen is displayed after
pressing the Config soft key
4.1.6.1 Range
Page 47

System Operation 47
The Mode key displays a screen as
in Figure 33. Using
Navigation/Enter keys, the user can
select different measurement modes
or display modes according to his
application. The ESC key cancels
the selection and brings the
instrument back to the main screen.
Figure 33 Mode selection screen
The Hold key toggles between
holding the current measurement or
running freely. When in Hold mode
the numeric display freezes and the
upper left corner of the display
reads Hold (see Figure 34).
Figure 34 Measurement is on hold
The Filter key allows the user to
apply Analog or Digital Filters or
both to the detector signal. This key
brings a screen as in Figure 35. The
Soft keys are reconfigured for the
filter selection. Counting from left to
right, the first key applies only the
Analog filter to the detector signal,
the second applies only the Digital
Filter, and the third applies both
filters. When the filters are selected,
the corresponding label above the
soft key has a highlighted
background and the filter name is
displayed in the upper left corner.
Figure 35 Filter selection screen
4.1.6.2 Mode
4.1.6.3 Hold
4.1.6.4 Filter
Page 48

48 System Operation
The fourth Soft key is used for filter
configuration. When selected, a
screen as in Figure 36 is displayed.
Using the Navigation/Enter keys the
user can select the filter of choice. If
the Enter key is not pressed, the ESC
key cancels the selection and brings
the instrument back to the main
screen. If the Enter key is pressed, a
selection is made, and the instrument
goes back to the main screen.
Figure 36 Filter configuration screen
The digital filter values can be edited.
When one of the digital filter values is
selected, the right most soft key
becomes Edit Value. Pressing this Soft
key displays a cursor on top of the
first digit of the edited filter value.
The Navigation Up/Down keys
modify the digit, while the Left/Right
keys move the cursor to the next digit.
When finished, press the Enter key to
store the new digital filter value and
press Enter again to select the new
value and exit the Filter configuration
screen.
Figure 37 Digital Filter editing
The Lambda (λ) key brings the
Default and Custom Wavelengths
screen. This screen allows the user to
choose a default wavelength for the
measurement in progress, or to
choose a custom wavelength. See
Section 4.4 for more details.
Figure 38 Wavelengths screen
4.1.6.5 Lambda (λ) Key
Page 49

System Operation 49
The Zero Offset key, or short, Zero
key is used to temporarily zero the
instrument for the measurement in
progress. When the user presses this
key, the instrument takes the displayed
numeric value as offset and subtracts
it from all the subsequent
measurements. When the instrument is
zeroed the offset value is displayed on
the main screen above the numeric
value (see Figure 39).
The Zero key toggles the offset on or
off. The ESC key has no effect on the
Zero function.
Figure 39 Zero Selection
The Measurement Settings screen has
dual functionality:
One is the convenience the user has
to change all the measurement
settings within one screen.
The other is information presented
to the user about the detector used.
From the default screen, when pressing
the Setup/Enter key, the 1936/2936
Series displays the Measurement
Settings screen as in Figure 40.
Figure 40 Measurement Settings
screen
4.1.6.6 Set Zero Offset (Zero Key)
4.2 Measurement Settings
4.2.1 Changing the Measurement Settings
Within the Measurement Settings screen the user can select the Wavelength,
Range, Range Type, Beam Attenuator, Analog Filter selection, Digital Filter
selection, Measurement Units, Measurement Mode, Spot Size and the
Number of Digits displayed.
4.2.1.1 Wavelength Selection
With the Navigation/Selection keys bring the cursor on top of the wavelength
field. Hit the Enter key. A drop-down menu appears with the custom
wavelength values (see Section 4.4 for more information about the
wavelength custom values). Select the desired wavelength and hit Enter.
4.2.1.2 Range Selection and Range Type (Rng. type)
The Range field has dual functionality:
One is to display the current selected range whether it was selected by the
user, in Manual Range Mode, or by the system, in Auto Range Mode.
Page 50

50 System Operation
The other is to allow the user to change the range.
With the Navigation/Selection keys bring the cursor on top of the Range
field. Hit the Enter key. A drop-down menu appears with the available ranges
in the selected units. Select the desired range and hit Enter.
If the unit was in Auto Range mode, once a range is selected here, it will
switch the system to Manual Range Mode. To bring it back to Auto Range
Mode, navigate to Range Type (Rng. type) and change the range to Auto
Range Mode. Also, the user has another option to bring the back into the
Auto Range Mode. This can be done from the default screen where the user
can change the Range to Auto Range Mode with the Range Dedicated key
(see Section 4.1.6).
The Auto Range Mode is enabled for Pulse Energy Measurements
(818E Detectors).
4.2.1.3 Attenuator On/Off
If the detector is equipped with an integrated attenuator (e.g. 918D Series),
the 1936/2936 Series detects its status (ON or OFF) and displays it in the
Attenuator field.
NOTE
The user has the option to manually set the attenuator to ON or OFF for
detectors that have attenuators that can be manually mounted on the detector
(e.g. 818 Series).
NOTE
The attenuator selection in the power meter is disabled (and not supported) for 818P
or 818E detector. The diffuser/attenuator for 818E is sold separately.
To change the attenuator status bring the cursor on top of the Attenuator
field. Hit the Enter key. A drop-down menu appears with the ON/OFF option.
Select the setting and hit Enter.
4.2.1.4 Analog and Digital Filter Selection
With the Navigation/Selection keys bring the cursor on top of the Analog or
Digital field. Hit the Enter key. A drop-down menu appears with the
available filter settings. Select the desired filter and hit Enter.
The Analog and Digital filter configuration can be accessed any time with the
Filter dedicated key. Refer to Section 4.1.6 for details.
4.2.1.5 Units Selection
With the Navigation/Selection keys bring the cursor on top of the Units field.
Hit the Enter key. A drop-down menu appears with the available units. Select
the desired units and hit Enter.
Page 51

System Operation 51
4.2.1.6 Mode Selection
This setting allows the user to change the measurement mode. The available
modes are as follows:
Continuous Wave Continuous Run (CW Cont.)
Continuous Wave Single Shot (CW Single)
Continuous Wave Integral (CW Integ.)
Peak-to-Peak Continuous Run (Pk-Pk Cont.)
Peak-to-Peak Single Shot (Pk-Pk Single)
Pulse Mode Continuous Run (Pulse Cont.)
Pulse Mode Single Shot (Pulse Single)
RMS Measurements (RMS)
Refer to Section 5, Performing Basic Measurements, for detailed information
regarding these modes.
4.2.1.7 Spot Size
This setting allows users to change the spot size. The default spot size is set
to be same as the detector size. The spot size can be modified by navigating
the cursor to this setting, and pressing the Setup/Enter key. The value then
becomes editable; each digit in the value can be changed by pressing
Up/Down arrow keys, and different digits can be selected by pressing
Left/Right arrow keys. The desired value can be accepted by pressing
Setup/Enter key.
4.2.1.8 Number of Digits Setting
The 1936/2936 Series displays a default 4 number of digits. To change these
settings bring the cursor on top of the Num. Digits field. Hit the Enter key. A
drop-down menu appears with the option of 3, 4 or 5 digits. Select the desired
number of digits and hit Enter.
4.2.1.9 Offset Field
On the right column of the Measurement Settings the unit displays the Offset
stored when the user hit the Zero dedicated key. This value can be cleared or
updated if the unit is in the default screen and Zero is pressed (see Section
4.1.6 for more information).
4.2.2 Detector Information
The Measurement Settings screen displays information about the detector
used based on the data available in the detector calibration module or detector
internal memory.
The available data are the detector model number (Detector), the detector
serial number (S/N), the detector temperature (Det. temp.) if the detector has
an internal temperature sensor, and the detector responsivity (Responsivity).
Page 52

52 System Operation
The Trigger Setup screen can be
accessed from the Measurement
Settings (Figure 41). Pressing the
Trigger soft key gives the user a few
choices to setup the trigger according
to the measurement needs.
The user has the option to send a
trigger pulse at the Trigger Out BNC
connector based on the Trigger In
signal. Trigger Out can be delayed
relative to the trigger input with
Trigger Delay.
Figure 41 Accessing the Trigger Setup
screen
The 1936/2936 Series has an advanced Trigger set that allows the user to
synchronize measurements with external events. Synchronization can be
achieved with Trigger Start and Trigger Stop which can be set both from the
trigger setup screen or with external commands.
The Trigger Delay refers to the time
delay between an event at the trigger
input (e.g. rising edge) and
corresponding event at the Trigger
Output. The user has the possibility to
change the delay between 150 ns and
210 seconds.
Besides the setup screen the user has
the option to change the delay with an
external command
PM:TRIG:HOLDoff (Section 8.3.3).
Figure 42 Trigger Delay waveforms
4.3 Trigger Setup
4.3.1 Trigger Delay
4.3.2 Trigger Start
The Trigger Start is an event that tells the system when to take a
measurement or a group of measurements. It can be set in different ways.
Continuous. The system is always triggered
External Trigger (TTL Signal). The system is triggered when an external
TTL signal is connected to the Trigger In BNC. The edge choice is set with
an external command, PM:TRIG:EDGE (Section 8.3.3).
Soft Key. The system can be triggered with a Soft Key that appears in the
main screen.
Command. The system is triggered with an external command,
PM:TRIG:STATE (Section 8.3.3).
The Trigger Start can also be set with an external command
PM:TRIG:START (Section 8.3.3).
Page 53

System Operation 53
4.3.3 Trigger Stop
The Trigger Stop is an event that tells the system when to stop taking
measurements. In the case of a single measurement, a trigger stop event
arms the system for the next measurement. It can be set in different ways.
Never Stop. The system measures continuously.
External Trigger (TTL Signal). The measurement stops when an external
TTL signal is connected to the Trigger In BNC. The edge choice is set with
an external command, PM:TRIG:EDGE (Section 8.3.3).
Soft Key. The system stops measuring when a Soft Key is pressed. This key
appears on the main screen.
Command. The system stops measuring when an external command,
PM:TRIG:STOP (Section 8.3.3) is sent via USB or RS232.
Value. The system stops measuring when the measured signal crosses a user
programmed value.
Time. The system stops measuring when a user programmed time passed
between the Start event and the current measurement.
Number of Samples. The system stops measuring when a user programmed
number of measurements passed between the Start event and the current
measurement.
The Trigger Stop can also be set with an external command PM:TRIG:STOP
(Section 8.3.3).
4.4 Wavelength Setting
Newport detectors have a calibration module or internal memory which
stores the Responsivity versus Wavelength Table. If the Lambda key is
pressed, a wavelength screen is displayed with the most common values in
nanometers (nm) (see Figure 38 on page 48).
The screen has two columns. The left column displays the common
wavelength values used in the industry, while the right column has custom
values.
When the user selects one of the predefined wavelengths in the left column,
the 1936/2936 Series looks up the wavelength in the responsivity table in the
detector calibration module. If that exact value is found, the system will use
the corresponding responsivity for that particular wavelength. If the value is
not found, the system will calculate the responsivity using interpolation.
The right column in the Wavelength screen gives the user the option to set
custom wavelengths. To do so, with the Navigation keys bring the cursor on
top of one of the numbers. The rightmost Soft key becomes Edit Value. Hit
this key to edit the custom number. A white cursor appears on the first digit.
Press the Up/Down navigation keys to change the number and the Left/Right
keys to move to the next digit. When finished, hit Enter. The new custom
wavelength will be stored. Press Esc to return to the main screen
Page 54

54 System Operation
a. Negative black and white
screen
b. Positive black and white
screen
c. Red screen
d. Green screen
e. Blue screen
f. Color/Blue screen
To change the display colors first
press the Enter/Setup key. This will
bring the Setup screen and
reconfigure the Soft keys (Figure 44).
Figure 44 Setup screen
Pressing the System soft key will
bring a secondary setup screen.
Navigate to the Color Selection to
change the screen color (Figure 45).
Also, navigate to the Brightness field
and hit Enter to change the screen
brightness. The default value is 80%.
Press the Measure soft key to go
back to the Measurement Settings
screen, or press ESC to go back to
the main screen.
Figure 45 System Settings screen
4.5 Display Color
In a laboratory environment, and especially when one uses protective
eyewear, it may be desirable to change the meter display color to
accommodate the eyewear color. The instrument has predefined color
schemes that can be changed any time (Figure 43).
Figure 43 Predefined color schemes
Page 55

System Operation 55
Pressing the About soft key will
bring a another screen with
information about the unit Firmware
version, serial number, calibration
date. In addition, the attached
detectors data is diplayed (Figure
46). From here, one can navigate
back to the Measurement Settings or
back to the System Settings.
Figure 46 About screen
The 1936/2936 Series can display
statistics for the measurement in
progress. From the main screen
press the Soft key labeled
Statistics. The Statistics screen is
displayed as in Figure 47.
The left column shows the
statistics current setup. The
Statistics function has two modes:
Fixed and Continuous.
Figure 47 Statistics screen
When in Fixed mode the Statistics engine calculates the minimum (Min),
maximum (Max), Range, Mean, Standard Deviation (Std. Dev.) for a
fixed number of samples and displays them in the right column.
The number of samples is displayed in the left column on the Samples
line. As Figure 47 shows, the number of samples is 10000 with a time
interval between samples of 100 µs. This means that the statistics values
are calculated over 1 second interval.
If the Mode is Fixed, at the end of the 10000 samples, the statistics values
are cleared and the calculation starts again with the next measurement.
The user can change the Mode with the Navigation keys. When the Enter
key is pressed a drop-down menu allows the user to select Fixed or
Continuous Mode. By using the Up and Down navigation keys followed by
Enter, the user can change the Mode to Continuous.
In Continuous mode, the unit does not disable data collection when the
number of samples specified is collected. Instead, it continues to collect
4.6 USB Address and RS232 Parameters
The USB Address can be changed in the System Settings screen (Figure 45).
Navigate to the USB Address and hit Enter. In the drop-down menu select the
desired USB address. The RS232 Parameters are fixed at Baud Rate 38400,
Data Bits 8, Stop Bits 1, Parity None, Xon/Xoff Xoff.
4.7 Statistics
Page 56

56 System Operation
data and place them in a data buffer on a first-in-first-out (FIFO) basis. The
statistics shown are representative of data collected since the time Clear
Stats was last pressed. As in Fixed mode, the Clear Stats soft key can be
pressed at any time to restart the whole process again.
The Soft keys offer the user the option to clear the statistics at any time,
with Clear Stats soft key.
The Graph soft key (Section 4.7.1) can be used for the visualization of the
measured values on a time graph.
The Statistics screen displays also the current measured value at the top of
the right column. At the bottom of the same column the system displays the
primary channel signal frequency. Section 5.9 gives a more in depth
description of the Frequency measurement.
This screen also provides users access to all the samples collected if
statistics are performed in Fixed mode. In this mode, a “Save” soft key
becomes visible (not shown in figure above) after all the samples requested
have been collected. Pressing this soft key will cause the power meter to
save the collected data to a flash drive connected in the front-panel of
power meter.
The Graph soft key displays the last
10000 measurements on a time graph
(Figure 48). Due to the sample time
interval of 100μs, the graph duration
is 1 second. The graph width is 270
pixels and, because of that, the
system has to decimate the 10000
samples to fit them in this fixed
number of pixels. Therefore, the
graph might look choppy if the graph
zoom is set on 1.
Figure 48 Graph screen
The user can zoom into the graph with the Soft keys +Zoom and –Zoom. As
the zoom changes the graph displays a finer picture of the measurements.
The zoom value is retained at the top of the screen. Pressing the +Zoom soft
key will zoom in the graph 2 times the previous zoom value. Pressing the –
Zoom soft key will zoom out ½ times the previous zoom value.
The maximum graph value is displayed in the upper left corner of the
display. If the Cursor soft key is pressed, a vertical line (cursor) is
displayed. The user can direct the cursor left or right with the Navigation
Keys to read the measured values on the graph. The current value is
displayed in the upper right corner and marked on the screen with a red dot.
4.7.1 Graph
Page 57

System Operation 57
The Math function is displayed on
the math field, at the upper right
side, just below the secondary
channel field (Figure 49). To
display the Math field the user
selects the soft key labeled Math in
the main screen. This in turn
displays the math configuration
screen
The Math function can be used to
add, subtract, multiply or divide
channels A and B in real time.
Once in the Math configuration
screen the user can use the
Navigation keys to build the
mathematical expression. From the
first column the user can select the
first variable in the expression, from
the second column, the operator, and
from the third column, the second
variable. When the selection was
made, the system returns to the main
screen after the Enter key was
pressed. A sample list of operators is
shown in adjacent figure; please
review this screen on your power
meter for the actual choice of
operators available.
Figure 49 Math field
Figure 50 Math configuration screen
The same mathematical operations can be performed between either channel
A or B current display and a stored value called Ref. A or Ref. B.
Ref. A and Ref. B are assigned a default value of 1 when the system is first
turned on. The reference values are stored and displayed in the selected
units. The user can change the reference values with a remote command
PM:REF:VAL value
as described in Section 8.3.
If the displayed units change, then the user needs to update the stored
reference value so that the system will store the new units in the reference.
The Math field can be turned off from the math configurations screen. The
second Soft key is labeled Display OFF. If this key is pressed the system
returns to the default screen and the Math field disappears.
4.8 Math Functions
Page 58

58 System Operation
The 1936/2936 Series power meters provide users the capability to correct
actual measurements taken by it through a “Correction Settings” screen.
This screen can be accessed by pressing the “Correction” soft-key in
“Measurement Settings” screen (Figure 51). The “Measurement Settings”
screen, as described earlier, can be accessed by pressing the Setup key
from main measurement screen.
The Correction Settings screen
(Figure 52) allows users to enter
two (2) multiplier values, labeled
“Multiplier 1” (M1) and
“Multiplier 2” (M2), besides an
“Offset” value. The corrected
measurement is arrived at using the
formula shown below:
Corrected measurement = [(Actual
measurement * M1) – Offset] *
M2.
Note that these settings are channel
specific, and apply to the primary
channel viewed on the main
measurement screen.
The default value for the two
multipliers is 1.0, and the offset is
0.0. If any one of these three
parameters are changed from their
default values, the main
measurement screen shows the
corrected measurement. A new field
called “Detector:” appears at the
bottom of the main screen that
displays
Figure 51 Measurement Settings
Figure 52 Correction Settings
4.9 Measurement Correction Settings
Page 59

System Operation 59
The selection of various display modes
can be done from the default screen,
by pressing the Mode soft key. When
the Mode selection screen is displayed
(Figure 53), the display mode can be
selected from the second column.
Figure 53 Mode selection screen
The numeric display is the default
display of the 1936/2936 Series. The
numeric display shows the current
measured value of the primary
channel.
Figure 54 The Numeric display
The Analog Bar display mode brings
a bar graph below the numeric
display. The bar graph is white and
follows the value showed by the
numeric display. The minimum and
maximum labels displayed just below
the bar graph represent the input
range the unit is currently set on. For
example, if the unit is set on
109.99 μW range, then the bar graph
shows the same range of 0 to
109.99 μW. In the middle of the bar
graph the displayed number is the
middle of the range.
Figure 55 Analog Bar
4.10
4.11 Display Modes
4.11.1 Numeric Display
4.11.2 Analog Bar
Page 60

60 System Operation
The major ticks represent 10% of the range, and the minor ticks represent
5% of the range.
If the Soft key labeled Show Max is selected, the maximum value is retained
and displayed in the bar graph with red color. The red bar is updated with
each measurement, if the current measured value is larger than the largest of
the previous measurements. Besides the maximum value being displayed
with a red bar, the actual value is displayed above the bar graph where
“Max=” shows the value. If the Soft key labeled Show Min is selected, the
minimum value is retained and displayed in the bar graph with green color.
The green bar is updated with each measurement, if the current measured
value is smaller than the smallest of the previous measurements. Besides the
minimum value being displayed with a green bar, the actual value is
displayed above the bar graph where “Min=” shows the value.
The maximum and minimum bars can be reset with the Reset m/M soft key.
For users who would like to fine
adjust a maximum or a minimum, the
1936/2936 offer the Auto Zoom
function. When the Auto Zoom soft
key is pressed another bar appears
above the Analog Bar. The bar length
is 2% of the Analog Bar. It is a display
of the region around the end of the
analog bar.
Figure 56 Auto Zoom
The Auto Zoom bar displays with white the current measured value, as the
Analog Bar does. However its trip is more sensitive, because the maximum
trip is +/-1% of the Analog Bar. If the Show Max or Show Min soft keys are
pressed, the system behaves the same as with the Analog Bar, displaying
with red the maximum value and with green the minimum value. As an
example, as Figure 56 shows, the red bar in the Analog Bar is very small, so
with the Analog Zoom this bar is extended giving the user the convenience to
see better small signal variations.
Pressing the Reset m/M soft key, clears the minimum and maximum bars
from both the Analog Bar and the Auto zoom graphs.
Page 61

System Operation 61
The Analog Needle displays a vertical
marker that moves with the displayed
numeric value. It is useful for users
who look for a maximum or a
minimum when adjusting the optical
power.
Figure 57 Analog Needle display
When the Vertical Chart is selected
the numeric display is moved in the
upper right corner, just below the
secondary channel display. The
vertical chart scrolls down,
representing a snapshot of the last
measurements. The chart can be
cleared with the Clear soft key. The
maximum peak value of the chart is
the maximum measurement of the
entire chart, since the last clear.
Below the chart, there is a line with
the chart maximum and minimum in
major units. On the same line in the
middle, there is information about
the chart zoom level, e.g. 1x, and the
number of samples processed per
chart line, e.g. 3 Avg (Figure 58).
The chart has 100 lines, each line
having a white and red color. When
the system fills up a line, it looks at
a number of samples defined by the
number displayed below the chart.
Figure 58 Vertical chart with 3
measurements per line
Figure 59 Vertical chart with 1
measurement per line
Figure 58 shows 1x -- 3 Avg, which means that, while painting a line, the
system looks at the previous 3 measurements. It displays with white the
minimum value in the 3-measurement list and with red the maximum value
in the same list.
4.11.3 Analog Needle
4.11.4 Vertical Chart
Page 62

62 System Operation
The user can change the number of measurements by selecting the Average
soft key and then pressing the Right or Left Navigation keys, to increase,
respectively decrease the number of measurements. If one measurement is
selected, the chart color is white, because the maximum and minimum per
line are the same (Figure 59). Due to one measurement display per line, the
chart speed increases.
If the Zoom soft key is pressed the user can zoom into the chart with the Up
and Down Navigation keys
4.12 Firmware Upgrade Procedure
Firmware Upgrade is an easy, straight-forward process. Simply copy
firmware files (PM293xAPP.EXE and XMLFILEx.XML) to a WinCE
compatible USB Flash Drive and then plug it into the USB connector on the
front of the instrument. Then wait a few seconds for the instrument to
recognize the USB Flash Drive. The power meter will detect the new
firmware files and will ask if you want to download the files. Press the “Yes”
softkey to start the upgrade process. The power meter will instruct you to
restart once the upgrade is successful. Restart the power meter by turning it
OFF and back ON. The power meter will restart running the new firmware.
NOTE
Only use a WinCE compatible USB Flash Drive when connecting to USB connector
on instrument front panel.
Press the <SETUP/ENTER> key and then Softkeys <SYSTEM> and
<ABOUT> to verify that the power meter is running the appropriate
firmware version. For example, the firmware for the 1936-R could be 1.1.5.1.
Note that these versions may not be the latest at the time you are performing
a firmware upgrade.
New firmware files may be available either through the Newport web site
(http://www.newport.com) at the product page or through your local Newport
application specialist.
Page 63

System Operation 63
This page is intentionally left blank
Page 64

5 Performing Basic Measurements
5.1 Introduction
Many different types of optical measurements are possible using the
1936/2936 Series of Power Meters. Most of these possible measurements are
selected from within the MODE menu. This chapter discusses these
measurements.
5.2 Measurement Modes and Units
The Model 1936/2936 provides a number of measurement modes for acquiring
data. At power on, the meter checks the detector’s calibration EEPROM to
determine the available measurement modes supported by the detector.
Measurements can be displayed in various units. The detector type and the
measurement mode determine the set of units available at any given time.
Table 1 illustrates the measurement modes and units available for each detector
family. The measurement modes are grouped naturally into three categories:
CW, Peak-to-Peak (Pk-Pk), and Pulsed. Each will be discussed in the sections
below.
The 1936/2936 Series sets the measurement to a detector specific default mode
depending on the detector used. All Newport detectors have internal logic or
calibration modules. Based on the data stored in detectors, the instrument
knows to auto configure itself and sets up the mode, range, filter, rate, etc.
The user, in the setup screen, can change the detector specific default mode.
The basic measurement techniques for using the 1936/2936 Series are
covered in the following sections. Refer to Table 1 for a review of the
1936/2936’s functions and measurement capabilities.
Page 65

Performing Basic Measurements 65 65
Detector
Family
Mode
V A W
W/cm
2
J
J/cm
2
Hz
dBm
dB
REL(%)
Sun
Low-
Power
(918DSeries)
CW
Continuous
X X X
X X X
CW Single
X X X
X X X
CW
Integrate
X
X X X X
Pk-Pk
Continuous
X X X
X X X X
Pk-Pk
Single
X X X
X X X
RMS
X X X
High-
Power
(818PSeries)
CW
Continuous
X X
X
X X X
X
CW Single
X X
X
X X X
X
CW
Integrate
X
X
X X
Energy
(818ESeries)
Pulse
Continuous
X
X X X X X
Pulse
Single
X
X
X
X X
Table 1 Available Measurement Modes and Valid Units.
The following instructions assume familiarity with the meter’s functions.
They also include steps to incorporate background correction and assume that
the experimental setup under-fills and does not saturate or damage the
detector.
5.3 CW Measurements ( with 918D or 818P Detectors )
This section describes the procedure for making basic optical power
measurements while properly removing the influence of ambient light and
other drift effects.
With a 918D (also 818-XX low power detectors with proper adapters) or
818P-Series Detector connected to the meter, turn the meter on. Press the
Mode key and then select CW Continuous with the Navigation keys. Use the
ESC key to return to the Main screen. Set Range to Auto. Then press the
Lambda (λ) key to set the measurement wavelength to the desired value.
Cover or otherwise block the light source being measured and then press the
Zero key to turn the Offset on. This effectively removes any background
signal from subsequent measurements.
Uncover the source so that it illuminates the detector and note the displayed
value. This reading is the optical power observed by the detector due to the
source.
Page 66

66 Performing Basic Measurements
This process assumes that the ambient signal is not changing between the
time when the Zero key is pressed and when the measurement is made. The
user should remember that, if he/she can see the detector active area as he/she
moves around, then the detector registers this as a changing ambient DC
signal.
For the 918D series detectors (also 818-XX low power detectors with proper
adapters) you can decide whether to use the attenuator for your measurement
or deactivate (or physically remove on 818 low power series) the attenuator.
For very low power measurements, pW to µW range in various ambient light
environments, you can elect to use the detector with no physical attenuator in
the optical path. This will increase the sensitivity and hence accuracy of the
measurement.
In case of higher power measurement with the 918D (or 818-XX) detector,
the attenuator should be used to avoid damage or saturation of the detector.
The attenuator use is recommended in mW to low Wattage range incident
power. Please refer to the specifications of the particular detector to make
sure you do not exceed the saturation levels of the detector.
For the 918D series detectors with integrated (non-removable) attenuators,
there is a switch built into the detector head, sensing the position of the
attenuator. The power meter will then automatically use proper calibration
data for presence or absence of the attenuator in front of the photo diode. For
models such as 818 low power series detectors which have a removable
attenuator, there is no switch built into the detector head, hence the user will
have to manually select attenuator option status on the meter to obtain the
proper power or signal readings.
5.4 Peak-to-Peak Power Measurements (918D Detectors)
This section describes the procedure for making basic optical peak-to-peak
power measurements.
With a 918D Low Power Detector connected to the meter, turn the meter on.
Set the Mode to Pk-Pk Continuous. Set Range to Auto and press the Lambda
(λ) key to set the measurement wavelength to the desired value.
Illuminate the detector and note the displayed value. This reading is the peakto-peak optical power observed by the detector.
Accurate peak-to-peak power measurements can be made for pulse repetition
rates up to 20 kHz.
5.5 Power Ratio and Power Reference Measurements
This section describes how to use the mathematical functions in the power
meter to obtain dB, Power or signal comparison, or ratio measurements.
Page 67

Performing Basic Measurements 67 67
For single detector, you can obtain a ration, dB or other comparison in
reference to a previously saved value. Refer to Section 4.8 for information on
setting the reference values.
For dual detectors, you can obtain a live ratio or other comparison of the two
channels displayed.
1. Use soft key labeled “Math” to enter the math function screen.
2. Select the channels and the functions by using the up, down, right and left
arrow keys. Use the Menu/Enter key only after all your selections are
made.
Example 1 – In order to select dB ratio of channel A to channel B:
1. While in the Math function screen, select channel A by using the up or
down arrow keys. There will remain a black border around the
highlighted/selected channel as you leave the column for the next
selection.
2. Move to the next column by using the right arrow key, and select “/(dB)”
option.
3. Move to the last column by using the right arrow key and use the up or
down keys to select channel B.
4. Press the Menu/Enter key to accept the selections and exit the Math
function screen.
5. The result of A/B in units of dB will appear in the designated window on
the screen.
Example 2 – In order to get the difference between channels A and B:
1. From the main screen of the meter, select soft key labeled “Math” to enter
the math function screen. If you cannot see the label “Math”, press the
“ESC” key.
2. Use the direction keys to highlight channel A in the first column
3. Using the direction keys, navigate to the “-“ sign in the center column.
4. Using the direction key, move the final column such that “Ch. B” is
highlighted.
5. Press the Menu/Enter key to retain the settings and exit the screen at the
same time.
6. The result of A-B will be displayed in the designated window of the main
display screen.
5.6 Pulse Energy Measurements (818E Detectors)
This section describes the procedure for making basic optical pulse energy
measurements.
With an 818E Energy Detector connected to the meter, turn the meter on. Set
the Mode to Pulse Continuous. Press the Lambda (λ) key to set the
measurement wavelength to the desired value.
Illuminate the detector and note the displayed value as the meter measures
each laser pulse. These readings represent the energies of the incident laser
Page 68

68 Performing Basic Measurements
pulses. The meter will display the last pulse energy measured until a new
pulse arrives.
Accurate measurements can be made for pulse repetition rates up to 10 kHz,
depending on the limitation of the specific detector in use, of course.
5.7 Signal Integration Measurements (918D or 818P
Detectors)
This section describes the procedure for making a basic signal integration
measurement while properly removing the influence of ambient light and
other drift effects. The 1936/2936 Series begins and ends the signal
integration every second.
With a 918D or 818P Detector connected to the meter, turn the meter on. Set
the Mode to CW Continuous. Set the Range to Auto and press the Lambda
(λ) key to set the measurement wavelength to the desired value.
Cover or otherwise block the light source being measured, turn Zero on and
then set the Mode to CW Integrate. Immediately upon entering the
integration mode, the meter will begin to acquire and integrate data. The
display value may reflect the integration of noise due to ambient temperature
fluctuations (when using the 818P detectors) or light fluctuations (when using
the 918D detectors).
Uncover or trigger the source. The displayed value should now reflect the
detector signal integration value.
NOTE
This process assumes that ambient signals are not changing between the moments
when the user zeros the display and when the measurement is made.
5.8 Measuring Laser Pulse Energy with an 818P Thermopile
Detector (Single Shot)
This application makes use of the 1936/2936 Series’ CW Integrate mode (see
Section 5.7 above). When an optical pulse with energy E(λ) is incident on a
thermopile (818P Series), a voltage signal is generated at the detector input as
the heat pulse flows out to the cooling fins. The sum of a series of integrated
signals (each one second long) resulting from this heat pulse is a measure of
the optical pulse energy, see Figure 60.
Page 69

Performing Basic Measurements 69 69
Figure 60 Measuring Laser Pulse Energy via a Thermopile in CW Integrate Mode
A recommended procedure is:
With an 818P High Power Detector connected to the meter, turn the meter on.
Set the Mode to CW Continuous. Set the Range to Auto and press the
Lambda (λ) key to set the measurement wavelength to the desired value. Set
Zero on and then change Mode to CW Integrate.
Before the optical pulse arrives, the display may reflect the integral of
detector noise due to ambient temperature fluctuations.
Trigger the laser pulse. The display will display a new integrated energy
measurement every second. The readings will start decreasing rapidly after
the first couple of measurements due to the decline in heat flow from the
relatively slow thermopile detector.
When the displayed reading drops again to the point of essentially displaying
the detector’s noise component, the individual stored readings may be
retrieved via the USB interface. Summing these readings will yield the pulse
energy.
NOTE
This method works best if the integrated result of the pulse signal is much larger
than the integral of the detector’s noise component. If the integrated result of the
pulse is not much larger, then error in the measurement will arise due to the
uncertainty generated by integration of the noise component terms.
NOTE
The time constant of a thermopile detector determines the amount of time that one
should expect to wait when making an integrated energy measurement of an optical
pulse. Typically, an accurate value will be arrived at 5 time constants after the arrival
of the optical pulse. Refer to the detector’s manual for the proper time constant.
Page 70

70 Performing Basic Measurements
5.9 Frequency Measurements (918D or 818E Detectors)
The Frequency Measurement in the 1936/2936 Series is a background task.
It runs all the time and the user can access it via the Statistics screen
(see Section 4.7). Because of this advanced way of measuring the
frequency, the user has the convenience to “take a look” at the signal
frequency as needed, just by pressing a key. By doing so, the user does not
need to change the current optical power measurement in progress, just to
know what the repetition rate is. Moreover, as explained in Section 4.7,
when using the Statistics screen, the user has an instant view of the input
signal regarding Frequency, instant measured value, Minimum, Maximum,
Mean, Standard Deviation, Signal Range.
The 1936/2936 Optical Meters have the capability of measuring the
modulation frequency, or repetition rate, of the incoming optical signal with
frequencies as low as 0.5 Hz on most ranges and up to 200 kHz. Below
0.5 Hz the measurement error will increase, and in some cases the
measurement will freeze. Frequencies below 0.5 Hz cannot be measured.
Refer to the Specifications table (Section 2.6) for the actual frequency limits
depending on range and mode of operation.
In order to perform an accurate frequency measurement, the AC signal
amplitude must be higher than 5 % of the full-scale of the range the meter is
set on. For example, if the DC value of the incoming signal is 1.25 V and the
modulating AC signal amplitude is 50 mV, the frequency measurement error
might increase or the measurement might freeze. This is due to the fact that,
for a DC signal of 1.25 V, the meter sets the range at 2.5 V and the AC
amplitude of 50 mV is 2% of the full-scale range of 2.5 V. The frequency
measurement is based on the transitions the system “sees” in the input signal.
If there is high noise in the input signal, the measurement might be
inadvertently affected because the noise transitions would appear as being
valid transitions. Also, as the input signal transitions become “softer”, i.e. the
modulation signal is not a square but a sine wave, as the frequency decreases
below 50 Hz, the system might consider that the input signal is DC and the
measurement stops.
The frequency measurement is always available and a value is displayed at
all times independent of the Mode. This being the case, it is up to the user to
assess whether the frequency measurement makes sense or not for that
particular measurement.
For example: in CW Continuous Mode, with the 5 Hz filter on, the AC signal
will be negligible. However, the meter might see some small transitions
coming from noise and will display a value for the frequency. Obviously this
displayed value should be ignored for this case.
Below the specified minimum frequency value the measurement might skip
or even freeze. This is normal, because the input signal approaches a
frequency that can be perceived as DC by the system.
Page 71

Performing Basic Measurements 71 71
n
x
y
n
i
i
0
2
5.10 RMS Measurements
This section describes the procedure for making a basic signal RMS (Root
Mean Square) measurement while properly removing the influence of
ambient light and other drift effects. The 1936/2936 Series begins and ends
the signal RMS every second.
With a 918D or 818P Detector connected to the meter, turn the meter on. Set
the Mode to RMS. Set the Range to Auto and press the Lambda (λ) key to set
the measurement wavelength to the desired value.
Cover or otherwise block the light source being measured, turn Zero on.
Immediately upon entering the RMS mode, the meter will begin to acquire
and calculate RMS value of the data. The display value may reflect the RMS
of noise due to ambient temperature fluctuations (when using the 818P
detectors) or light fluctuations (when using the 918D detectors).
Uncover or trigger the source. The displayed value should now reflect the
detector signal RMS value.
The RMS value is calculated based on data acquired over a one second time
period. The formula used to calculate the RMS value is given below:
Where xi is the signal measured, n is the number of samples acquired over a
one second period, and y is the RMS value.
NOTE
This process assumes that ambient signals are not changing between the moments
when the user zeros the display and when the measurement is made.
Page 72

Connect Button /
Indicator
6 Software Application
6.1 Overview
The 1936/2936 Series have a USB connector on the back of the unit that is
used to connect to a computer for use with this application. (RS-232
connection for this application is not supported.)
Provided on the CD that comes with the unit is an installation for this software
application, it communicates with the 1936/2936 Series using the USB port.
The installation installs the USB drivers that are required to use USB
communication.
The design of the software is to allow the user to remotely control basic
functions of the instrument.
6.2 Connection
Start the application, which will detect and connect the attached power meter.
Figure 61 Application front panel
Page 73

Software Application 73 73
6.3 General Usage
This software application allows the user to setup and monitor the instrument
remotely.
The controls on the instrument are available in the software in a very easy to
read and change format.
Figure 62 Application Advanced Options (Configuration Tab)
The application is designed to have menus similar to standard Windows
applications like MS Word, to ease usability.
6.4 Menu Structure
To Exit the application go to the File menu and select Exit.
The Edit/Advanced Options menu has additional property settings, including
channel settings and data logging options.
The Help/About will show information about the application, including
firmware version when an instrument is connected and communicating.
Page 74

Page 75

7 Computer Interfacing
7.1 General Guidelines
The 1936/2936-R Series power meters have two computer interface ports:
USB and RS-232. These communication interfaces can be used to send
commands to the power meter from a host PC. The commands supported by
the power meter can be divided into the following two categories: commands
that cause the power meter to take a desired action, and commands (queries)
that return a stored value or state of the power meter.
Query commands are always terminated by a question mark (?). It is
recommended that when a query command is sent, the response to that
command from the power meter be read before issuing any other command.
Set commands, on the other hand, are used to configure/setup the power
meter for a desired mode of operation. These commands take at least one
parameter. The subsequent sections in this chapter detail the RS-232 and
USB communication protocols supported by the power meter.
7.2 Computer Interface Terminology
Listed below are the key abbreviations and concepts used in the command
reference section (Section 8) of this manual.
7.2.1 <…> Delimiting Punctuation
For the purposes of this manual, any string enclosed by <…> is considered to
be a command, a string or numerical argument. The punctuation <…> is
used to symbolize the typographic limits of the command, string or argument
in question.
7.2.2 <CR> Carriage Return
The ASCII encoded byte 13 in decimal. (0D hex)
7.2.3 <LF> Line Feed
The ASCII encoded byte 10 in decimal. (0A hex)
7.2.4 (;) Semicolons
Semicolons are used to separate commands within a single transmission
(concatenation).
Page 76

76 Computer Interfacing
7.2.5 <number> Numerical Types
Numerical parameters are passed and returned as the actual ASCII characters
in the string representation of the number. See section 11.2 for more detailed
information.
7.2.6 <string> String Types
See the section 11.1 for a detailed description of <string>.
7.2.7 Command Termination
When the power meter receives a command from the RS-232 port, it
interprets a <CR> in the command string as the command terminator. USB
does not need a termination character.
7.2.8 Response Termination
RS-232 responses from the power meter are terminated by a <CR><LF>
sequence.
7.3 RS-232C Communication
Before communicating with the 1936/2936-R series power meters through
the RS-232 port, proper cable connections must be made. Figure 32 shows
the cable connection for communicating with the power meter over RS-232
interface. (Straight-through cable)
Once cable connections are made, the baud rate and echo mode need to be
set. The baud rate, parity, data bit, and stop bits are fixed at:
Baud rate: 38400 bits/sec
Parity: No parity
Data bits: 8 data bits
Stop bits: 1 stop bit
RS-232 communication with the 1936/2936-R series power meters can be
performed with either echo ON or OFF. When the echo mode is enabled, the
power meter generates a ‘>’ prompt for every new line and all characters sent
to the power meter are echoed back over the interface. As the user is entering
commands the line may be edited by using the backspace key (sending an
ASCII decimal 08 code). This mode is especially useful when a simple
terminal application is used to communicate with the power meter.
When echo mode is disabled (normal mode) the power meter does not
generate a prompt or echo character back over the interface. This is the
default state of the echo mode.
Page 77

Computer Interfacing 77 77
TO
TO
Figure 63 RS-232 9 Pin to 9-Pin Cable Connections. Cable terminators (RS-232)
7.3.1 Setting Echo Mode From the Keypad
The echo mode can be turned ON/OFF from within the menu structure.
7.3.2 Setting Echo Mode via Remote Interface
To set the echo mode use the “ECHO” command. Use the “ECHO?” to see if
the echo mode is enabled or disabled.
7.3.3 Setting the USB Address
The USB Address can be set remotely with the “ADDRess” command.
7.4 USB Communication
The instrument is designed to communicate with standard USB interfaces.
Before connecting the instrument to the USB interface the user should install
the application included in the software CD that accompanies the Optical
Meter. The application automatically installs the right USB drivers.
Communication can be done through this interface by using the application
contained in the CD or by developing software in the user’s preferred
programming language. The software CD contains drivers and example
programs in the following programming languages: LabVIEW, Visual Basic,
and Visual C++.
Page 78

78 Computer Interfacing
This page is intentionally left blank
Page 79

8 Communication Command
Reference
8.1 Model 1936/2936 Series Remote Interface Commands
A complete listing of the commands supported by 1936/2936-R series power
meters is provided below.
8.2 Command Overview
There are two types of commands: commands that cause the power meter to
take a desired action, and queries that return a stored value or state of the
power meter. Queries must end with a question mark (?), while commands
may require parameter(s) to follow:
PM:Lambda 810
For example, the value “810” in the command PM:Lambda 810 sets the
wavelength for the currently selected channel to 810. The table below
summarizes all the commands and queries supported by the 1936/2936-R
series power meters. The command/query MUST contain all of the letters,
which are shown in upper case in this table. The lower case letters shown
with the commands are optional, and may be used for clarity. If any of the
optional letters are used, then all of the optional letters are now required for
the current command.
The commands may be sent to the instrument in either upper or lower case or
in any combination. For example, the following commands are equal:
PM:Lambda 810
PM:L 810
pm:L 810
Pm:L 810
COMMAND EXECUTION:
The controller interprets the commands in the order they are received and
execute them sequentially. If a set of commands have to be executed closer
to each other, these commands can be sent to the controller simultaneously
by creating a command string with semicolon (;) used as a command
separator. The command string length should not exceed 50 characters. In
the example shown below, a command string was created with semicolon
Page 80

80 Communication Command Reference
Name
Number of
Parameters
Function
Page
No.
*IDN?
NONE
Identification query
83
*RCL
1
Recall configuration settings
83
*SAV
1
Save configuration settings
84
ADDRess
1
Sets the instrument’s USB address
84
ADDRess?
NONE
Returns the instrument’s USB address
85
BEEP
1
Turns the beeper on or off, or beeps once.
85
BEEP?
NONE
Returns the status of the beeper.
85
ECHO
1
Sets the echo on or off
85
ECHO?
NONE
Returns the status of echo
86
ERRors?
NONE
Returns errors generated since the last query.
86
ERRSTR?
NONE
Returns errors and their corresponding error text generated since the last
query.
86
separating 5 queries. The controller responds to this command string with a
response that has 5 values using a comma (,) as a separator.
COMMAND STRING:
PM:P?;PM:ATT?;PM:L?;ERR?
INSTRUMENT RESPONSE:
1.2450,1,810,0
8.2.1 Activate a Specific Channel
The command set of the power meter, by default, operates on channel A. In
case of 2936-R power meter where there are 2 channels, the users can send
commands for channel B after selecting this channel through
“PM:CHANnel” command. Once a desired channel is selected using this
command, all subsequent commands sent to the power meter will be
addressed to that channel until it is changed again. The power meter defaults
to channel “A” following a reset.
Note that the channel selected is specific to the communication interface over
which the PM:CHANnel command was issued. For instance, if
“PM:CHANnel 1” command was issued over RS-232 interface and
“PM:CHANnel 2” command was issued over USB interface, all subsequent
commands issued through RS-232 and USB interfaces will be addressed to
channels A and B respectively.
Some commands do not apply to a particular channel, such as “BEEP”. The
behavior of these commands is independent of the channel currently selected.
8.3 Command Description
8.3.1 Command Glossary
Root level Commands/Queries Summary
Table 2 Root level Commands/Queries Summary
Page 81

Communication Command Reference 81 81
Name
Number of
Parameters
Function
Page
No.
DISP:BRIGHT
1
Sets the backlight level of the display and the keypad
82
DISP:BRIGHT?
NONE
Returns the backlight level of the display and the keypad
83
PM:ANALOGFILTER
1
Sets the analog filter to desired value
87
PM: ANALOGFILTER?
NONE
Returns the analog filter setting
87
PM:ANALOG:IMP
1
Sets the analog output impedance to desired value
87
PM:ANALOG:IMP?
NONE
Returns the analog output impedance value
88
PM:ANALOG:OUT
1
Sets the analog output range to the desired level
88
PM:ANALOG:OUT?
NONE
Returns the analog output range
88
PM:ATT
1
Selects if the attenuator's calibration data is included for power
calculation.
89
PM:ATT?
NONE
Returns setting if attenuator data should or should not be used
when calibrating the power meter.
89
PM:ATTSN?
NONE
Gets the attenuator serial number.
89
PM:AUTO
1
Sets the power meter ranging to manual or automatic.
89
PM:AUTO?
NONE
Returns 1 if automatic power meter ranging is selected.
90
PM:CALDATE?
NONE
Returns the calibration date of the detector.
90
PM:CALTEMP?
NONE
Returns the temperature at which the calibration was
performed.
90
PM:CHANnel
1
Selects the power meter channel to display and control.
91
PM:CHANnel?
NONE
Returns the power meter channel currently selected.
91
PM:CORR
3
Sets the power measurement correction settings.
91
PM:CORR?
NONE
Power measurement correction settings query
92
PM:DETMODEL?
NONE
Returns the model number of the detector.
92
PM:DETSIZE?
NONE
Returns the detector surface area
92
PM:DETSN?
NONE
Returns the serial number of the detector.
92
PM:DIGITALFILTER
1
Sets the digital filter to desired value
93
PM: DIGITALFILTER?
NONE
Returns the digital filter setting
93
PM:DPower?
NONE
Detector Power query
93
PM:DS:BUFfer
1
Set data store behavior select.
94
PM:DS:BUFfer?
NONE
Returns data store behavior select.
94
PM:DS:CLear
NONE
Clear data store.
94
PM:DS:Count?
NONE
Returns data store count of items stored.
94
PM:DS:ENable
1
Set data store enable.
95
PM:DS:ENable?
NONE
Returns data store enable.
95
PM:DS:GET?
1
Returns data store data. {1,1-10,-5,+5} – value, range, oldest 5,
newest 5
95
PM:DS:INTerval
1
Set data store interval.
96
PM:DS:INTerval?
NONE
Returns data store interval.
96
PM:DS:SAVEBUFER
1
Saves the data store buffer to a WinCE compatible USB flash
disk
96
PM:DS:SIZE
1
Sets the size of the Data Store buffer
97
PM:DS:SIZE?
NONE
Returns the sizes of the Data Store buffer
97
PM:DS:UNITs?
NONE
Returns data store units.
97
PM:FILTer
1
Selects the filtering operation: no filtering, analog filter, digital
filter, or analog and digital.
98
PM:FILTer?
NONE
Returns the filtering operation: no filtering, analog filter,
digital filter, or analog and digital.
98
PM: FREQuency?
NONE
Returns the measured frequency value
98
PM:Lambda
1
Sets the wavelength for use when calculating power.
99
PM:Lambda?
NONE
Gets the selected wavelength in nanometers.
99
PM:MAX:Lambda?
NONE
Returns the longest calibrated wavelength in nanometers.
99
PM:MAX:Power?
NONE
Returns the maximum readable power in present range
100
PM:MIN:Lambda?
NONE
Returns the shortest calibrated wavelength in nanometers.
100
PM:MIN:Power?
NONE
Returns the minimum readable power in present range
100
PM:MEAS:TIMEOUT
1
Sets the measurement timeout period
100
PM:MEAS:TIMEOUT?
NONE
Returns the measurement timeout period
101
Tree Level Commands/Queries Summary
Page 82

82 Communication Command Reference
Name
Number of
Parameters
Function
Page
No.
PM:MODE
1
Acquisition mode select
101
PM:MODE?
NONE
Returns the currently selected acquisition mode.
102
PM:Power?
NONE
Returns the power in the selected units.
102
PM:PWS?
NONE
Returns the power with status.
102
PM:RANge
1
Selects the gain stage when making readings with the detector
head within a range from 0 to 7 (with zero being the highest
gain).
103
PM:RANge?
NONE
Returns an integer indicating the current range.
103
PM:REF:VALue
1
Sets the user reference value for use in relative or dB readings.
103
PM:REF:VALue?
NONE
Returns the user reference value.
104
PM:REF:STOre
NONE
Sets the user reference value for use in relative or dB readings
as the present reading.
104
PM:RESPonsivity?
NONE
Gets the responsivity currently used for making power
calculations.
104
PM:RUN
1
Disables or enables the acquisition of data.
105
PM:RUN?
NONE
Returns the present acquisition mode.
105
PM:SATLEVEL
1
Set saturation current density or power level
105
PM:SATLEVEL?
NONE
Query saturation current density or power level
105
PM:SPOTSIZE
1
Sets the detector spot size
106
PM:SPOTSIZE?
NONE
Returns the detector spot size
106
PM:STAT:MAX?
NONE
Returns statistics buffer maximum value.
106
PM:STAT:MEAN?
NONE
Returns statistics buffer mean value.
107
PM:STAT:MIN?
NONE
Returns statistics buffer minimum value.
107
PM:STAT:MAXMIN?
NONE
Returns statistics buffer maximum-minimum value.
107
PM:STAT:SDEViation?
NONE
Returns statistics buffer standard deviation value.
107
PM:Temp?
NONE
Returns the 918 detector's temperature in degrees Celsius.
108
PM:THERM:PREDICT
1
Disables or enables thermopile prediction algorithm
108
PM:THERM:PREDICT?
NONE
Returns the present thermopile prediction algorithm state
109
PM:TRIG:EXTernal
1
Set external trigger enable.
109
PM:TRIG:EXTernal?
NONE
Returns external trigger enable.
109
PM:TRIG:EDGE
1
Set external trigger edge select.
110
PM:TRIG:EDGE?
NONE
Returns external trigger edge select.
110
PM:TRIG:HOLDoff
1
Set external trigger hold off time.
110
PM:TRIG:HOLDoff?
NONE
Returns external trigger hold off time.
111
PM:TRIG:START
1
Set the optional start event
111
PM:TRIG:START?
NONE
Returns optional start event
111
PM:TRIG:STOP
1
Set the optional stop event
112
PM:TRIG:STOP?
NONE
Returns optional start event
112
PM:TRIG:STATE
1
Set the trigger state
112
PM:TRIG:STATE?
NONE
Returns the trigger state
113
PM:TRIG:VALUE
1
Set the measurement level for trigger stop condition
113
PM:TRIG:VALUE?
NONE
Returns the measurement set level for trigger stop condition
113
PM:TRIG:TIME
1
Set the time duration for trigger stop condition
114
PM:TRIG:TIME?
NONE
Returns the time duration for trigger stop condition
114
PM:UNITs
1
Selects the units for readings.
114
PM:UNITs?
NONE
Returns an integer indicating the selected units.
115
PM:ZEROSTOre
NONE
Sets the zeroing value with the present reading.
115
PM:ZEROVALue
1
Sets the zeroing value.
115
PM:ZEROVALue?
NONE
Gets the zeroing value.
115
8.3.2 Display Commands
8.3.2.1 DISP:BRIGHT
Description Display brightness command
Table 3 Tree Level Commands/Queries Summary
Page 83

Communication Command Reference 83 83
Model
name
Firmware
version #
Firmware
date
Controller
Serial #
Syntax BRIGHT brightness
Remarks The BRIGHT command controls the brightness of the
instrument display.
Argument Type Description
Brightness int Brightness, in levels from 0 to 7
Related Commands: DISP:BRIGHT?
8.3.2.2 DISP:BRIGHT?
Description Display brightness query
Syntax DISP:BRIGHT?
Remarks The BRIGHT? query returns the display brightness setting.
Response Type Description
Brightness int Display brightness, in levels from 0 to 7
Related Commands: DISP:BRIGHT
8.3.3 Power Meter Commands
8.3.3.1 *IDN?
Description Identification Query
Syntax *IDN?
Parameters None
Function
Remarks This query will cause the power meter to return an identification string.
NEWPORT XXXX vYYY mm/dd/yy SNZZZZ
Examples:
NEWPORT 1936-R v1.0.0 12/12/05 SN0001
NEWPORT 2936-R v1.0.0 12/12/05 SN0001
8.3.3.2 *RCL
Description Recall Configuration Settings
Syntax *RCL bin
Remarks The *RCL command restores the power meter to the setup
state saved in its non-volatile flash memory.
Argument Value Description
Page 84

84 Communication Command Reference
bin 0 Reserved
1 to 5 Valid configuration settings
Related Commands: *SAV
8.3.3.3 *SAV
Description Save Configuration Settings
Syntax *SAV bin
Remarks The *SAV command saves the present state of the power
meter in its non-volatile flash memory. A particular state is
then recalled using the *RCL command. If any one of
these parameters are changed, the present state of the power
meter will automatically be saved in configuration setting
#1. When the power meter is reset, the state of the meter
defaults to configuration setting #1. The setup parameters
saved include:
Display brightness level
USB address
Color scheme
Measurement display mode
Custom wavelengths
Argument Value Description
bin 0 Reserved
1 to 5 Valid configuration settings
Related Commands: *RCL
8.3.3.4 ADDRess
Description USB address command.
Syntax ADDRess value
Remarks The ADDRess command sets the power meter USB
address. After changing USB address, the communication
with the power meter has to be re-initialized.
Argument Value Description
Value 0 Reserved
1 to 31 Valid USB address range
Related Commands: ADDRess?
Page 85

Communication Command Reference 85 85
8.3.3.5 ADDRess?
Description USB address query.
Syntax ADDRess?
Remarks The ADDRess query returns the power meter’s USB
address.
Response Value Description
address 0 Reserved
1 to 31 Valid USB address range
Related Commands: ADDRess
8.3.3.6 BEEP
Description Beep command
Syntax BEEP beep set
Remarks The BEEP command controls the power meter’s beeper.
The beeper can be used to signal error or warning
conditions.
Response Value Description
beep set 0 Disable beeper
Note: The beeper is enabled at power on.
Related Commands: BEEP?
8.3.3.7 BEEP?
Description Beep query
Syntax BEEP?
Remarks The BEEP? query returns the enable status of the power meter’s
Response Value Description
beep set 0 Beeper disabled
Related Commands: BEEP
1 Enable beeper
2 Beep for 100 ms
beeper.
1 Beeper enabled
8.3.3.8 ECHO
Description Echo command
Syntax ECHO echo set
Page 86

86 Communication Command Reference
Remarks The ECHO command is used to turn ON or OFF the
echoing of commands sent to the power meter over RS-232
communication interface. By default, the echo is turned
ON.
Response Value Description
echo set 0 Echo OFF
1 Echo ON
Related Commands: ECHO?
8.3.3.9 ECHO?
Description Echo query
Syntax ECHO?
Remarks The ECHO? query returns the echo status of the power
meter.
Response Value Description
status 0 Echo OFF
Related Commands: ECHO
8.3.3.10 ERRors?
Description Error query
Syntax ERRors?
Remarks The ERRors? query returns a single error number that has
Response Type Description
Error code int Error code number per Appendix B, 0 if no
Related Commands: ERRSTR?
1 Echo ON
occurred since the last query. This error is indicated by a
number that corresponds to the type of error that occurred.
This command also clears the read error from the Error
buffer.
errors
8.3.3.11 ERRSTR?
Description Error string query
Syntax ERRSTR?
Remarks The ERRSTR? query returns a single error number
along with the corresponding error text string that have
occurred since the last error query.
Page 87

Communication Command Reference 87 87
Response Type Description
Error code, string Error code number and text for error code
as"text"per Appendix B, 0 if no errors
Related Commands: ERRors?
8.3.3.12 PM:ANALOGFILTER
Description Analog filter select command
Syntax PM:ANALOGFILTER value
Remarks The PM:ANALOGFILTER command selects the analog
filter setting.
Argument Value Analog Filter
Value 0 None
1 250 kHz
2 12.5 kHz
3 1 kHz
4 5 Hz
Related Commands: PM:ANALOGFILTER?
8.3.3.13 PM: ANALOGFILTER?
Description Analog filter query
Syntax PM:ANALOGFILTER?
Remarks The PM:ANALOGFILTER? query returns an integer
indicating the present analog filter setting.
Argument Value Analog Filter
Value 0 None
1 250 kHz
2 12.5 kHz
3 1 kHz
4 5 Hz
Related Commands: PM:ANALOGFILTER
8.3.3.14 PM:ANALOG:IMP
Description Analog output impedance select command
Syntax PM:ANALOG:IMP value
Remarks The PM:ANALOG:IMP command selects the analog
output impedance.
Argument Value Output Impedance
Value 0 50 Ω
1 100 kΩ
Page 88

88 Communication Command Reference
2 1 MΩ
Related Commands: PM:ANALOG:IMP?
8.3.3.15 PM:ANALOG:IMP?
Description Analog output impedance query
Syntax PM:ANALOG:IMP?
Remarks The PM:ANALOG:IMP? query returns an integer
indicating the present analog output impedance.
Argument Value Output Impedance
Value 0 50 Ω
1 100 kΩ
2 1 MΩ
Related Commands: PM:ANALOG:IMP
8.3.3.16 PM:ANALOG:OUT
Description Analog output range select command
Syntax PM:ANALOG:OUT range
Remarks The PM:ANALOG:OUT command selects the analog
output range.
Argument Value Max. Output
Range 0 1 V
1 2 V
2 5 V
3 10 V
Related Commands: PM:ANALOG:OUT?
8.3.3.17 PM:ANALOG:OUT?
Description Analog output range query
Syntax PM:ANALOG:OUT?
Remarks The PM:ANALOG:OUT? query returns an integer
indicating the present analog output range.
Response Value Max. Output
Range 0 1 V
1 2 V
2 5 V
3 10 V
Related Commands: PM:ANALOG:OUT
Page 89

Communication Command Reference 89 89
8.3.3.18 PM:ATT
Description Attenuator enable command
Syntax PM:ATT enable
Remarks Indicates whether or not the attenuator for the 818 Series
power detector is on the detector.
Argument Type Description
Enable int Enable use of detector responsivity with
attenuator available in the calibration
module for 818 detectors.
Related Commands: PM:ATT?
8.3.3.19 PM:ATT?
Description Attenuator enable query
Syntax PM:ATT?
Remarks The PM:ATT? query returns 1 when using attenuator
Response Value Description
attenuator 0 Calibrating power without attenuator
Related Commands: PM:ATT
8.3.3.20 PM:ATTSN?
Description Attenuator serial number query
Syntax PM:ATTSN?
Remarks The PM:ATTSN? query returns the serial number of the
Response Type Description
serial number string Serial number of the attenuator
Related Commands: PM:DETMODEL?, PM:DETSN?
calibration, 0 when calculating power without attenuator
data.
1 Calibrating power using attenuator
attenuator. When no detector is found the power meter
responds with "no detector".
8.3.3.21 PM:AUTO
Description Auto range enable command
Syntax PM:AUTO mode
Remarks The PM:AUTO command sets the power ranging to either
manual or automatic.
Page 90

90 Communication Command Reference
Argument Value Description
mode 0 Manual power meter ranging
1 Automatic power meter ranging
Related Commands: PM:AUTO?, PM:RANge
8.3.3.22 PM:AUTO?
Description Auto range mode query
Syntax PM:AUTO?
Remarks The PM:AUTO? query returns a value to indicate if auto
ranging is enabled or not.
Response Value Description
mode 0 Manual power meter ranging
1 Automatic power meter ranging
Related Commands: PM:AUTO, PM:RANG
8.3.3.23 PM:CALDATE?
Description Detector calibration date query
Syntax PM:CALDATE?
Remarks The PM:CALDATE? query returns the calibration date of
For example: 21JUN1999.
Response Type Description
Date string DDMMMYYYYY
8.3.3.24 PM:CALTEMP?
Description Temperature at which detector was calibrated query
Syntax PM:CALTEMP?
Remarks The PM:CALTEMP? query returns the temperature
Response Type Description
the detector.
(degrees Celsius) at which the detector was calibrated.
When no detector is present, "no detector" is returned.
temperature float Returns the temperature at which the
detector was calibrated.
Page 91

Communication Command Reference 91 91
8.3.3.25 PM:CHANnel
Description Select power meter channel
Syntax PM:CHAN channel
Remarks The PM:CHAN command selects the power meter channel
for control.
Argument Type Description
Channel int Power meter channel
Related Commands: PM:CHAN?
8.3.3.26 PM:CHANnel?
Description Power meter channel query
Syntax PM:CHAN?
Remarks The PM:CHAN? query returns the power meter channel
currently selected.
Response Value Description
channel int Currently selected power meter channel
Related Commands: PM:CHAN
8.3.3.27 PM:CORR
Description Power measurement correction settings
Syntax PM:CORR value1, value2, value3
Remarks The PM:CORR command sets the power measurement
Argument Type Description
value1 float Multiplier 1 (default = 1.000)
l
correction settings. These settings are used by the power
meter to correct the actual power measurement. The
corrected power is calculated using the formula provided
below:
Corrected Measurement =
((Actual Measurement * value1) + value2) * value3
value2 float Offset (default = 0.000)
value3 float Multiplier 2 (default = 1.000)
Related Commands: PM:CORR?, PM:Power?, PM:DPower?
Page 92

92 Communication Command Reference
8.3.3.28 PM:CORR?
Description Power measurement correction settings query
Syntax PM:CORR?
Remarks The PM:CORR? command returns the power
measurement correction settings. These settings are used by
the power meter to correct the actual power measurement.
The corrected power is calculated using the formula
provided below:
Corrected Measurement =
((Actual Measurement * value1) + value2) * value3
Response Type Description
value1 float Multiplier 1 (default = 1.000)
value2 float Offset (default = 0.000)
value3 float Multiplier 2 (default = 1.000)
Related Commands: PM:CORR, PM:Power?, PM:DPower?
8.3.3.29 PM:DETMODEL?
Description Detector model query
Syntax PM:DETMODEL?
Remarks The PM:DETMODEL? query returns the model number
of the detector.
For example: 818-SL.
Response Type Description
model string Detector model number
8.3.3.30 PM:DETSIZE?
Description Detector surface area
Syntax PM:DETSIZE?
Remarks The PM:DETSIZE? query returns the surface area of the
detector in cm2.
Response Type Description
Area float Detector surface area
8.3.3.31 PM:DETSN?
Description Detector serial number query
Syntax PM:DETSN?
Page 93

Communication Command Reference 93 93
Remarks The PM:DETSN? query returns the serial number of the
detector.
For example: 0001
Response Type Description
serial number string Detector serial number
8.3.3.32 PM:DIGITALFILTER
Description Digital filter select command
Syntax PM:DIGITALFILTER value
Remarks The PM:DIGITALFILTER command specifies the digital
filter setting.
Argument Type Description
Value int digital filter size between 0 and 10000
Related Commands: PM:DIGITALFILTER?
8.3.3.33 PM:DIGITALFILTER?
Description Digital filter query
Syntax PM:DIGITALFILTER?
Remarks The PM:DIGITALFILTER? query returns the present
digital filter setting.
Argument Type Description
Value int digital filter size between 0 and 10000
Related Commands: PM:DIGITALFILTER
8.3.3.34 PM:DPower?
Description Detector power query
Syntax PM:DPower?
Remarks The PM:DPower? returns the actual power measurement.
This measurement does not include any correction settings
specified using “PM:CORR” command. When the
correction settings are set to default values, the power
measurement returned by this command is same as the
measurement returned by “PM:P?” command.
Response Type Description
Power float Power in Watts
Related Commands: PM:Power?
Page 94

94 Communication Command Reference
8.3.3.35 PM:DS:BUFfer
Description Data Store buffer behavior selection
Syntax PM:DS:BUFfer behavior
Remarks The PM:DS:BUFfer command selects the behavior mode
for control of the Data Store buffer.
Argument Value Description
Mode 0 Fixed Size
1 Ring Buffer
The behavior of the ring buffer is to allow continual data collection after the
buffer is full where the oldest values will be overwritten when new
measurements are taken.
Related Commands: PM:DS:BUFfer?
8.3.3.36 PM:DS:BUFfer?
Description Data Store buffer behavior selection query
Syntax PM:DS:BUFfer?
Remarks The PM:DS:BUFfer? query returns the value of the Data
Argument Type Description
Behavior int See PM:DS:BUFfer for a definition of
8.3.3.37 PM:DS:CLear
Description Clear the Data Store of all data
Syntax PM:DS:CLear
Remarks The PM:DS:CLear command resets the data store to be
Argument Type Description
none -
8.3.3.38 PM:DS: Count?
Description Data Store data item count query
Store buffer behavior.
the behavior status.
empty with no values.
Syntax PM:DS:Count?
Remarks The PM:DS:Count? query returns the number of
measurements that have been collected in the Data Store.
Page 95

Communication Command Reference 95 95
Argument Type Description
count int The number of measurements that have been
collected.
8.3.3.39 PM:DS:ENable
Description Enable Data Store Collection
Syntax PM:DS:ENable enable
Remarks The PM:DS:ENable enables or disables the collection of
measurements in the Data Store.
Argument Value Description
enable 0 Disabled
1 Enabled
Data will be collected after the PM:DS:ENable command has been called
with a parameter of 1. Data collection will stop when the PM:DS:ENable
command has been called with a parameter of 0 or when a fixed size data
buffer is full.
Related Commands: PM:DS:ENable?
8.3.3.40 PM:DS:ENable?
Description Enable Data Store Collection query
Syntax PM:DS:ENable?
Remarks The PM:DS:ENable? query returns the enabled status of
Argument Type Description
enable int See PM:DS:Enable for a description of the
8.3.3.41 PM:DS:GET?
Description Retrieve Data Store data query
Syntax PM:DS:GET? num
Remarks The PM:DS:GET? command returns a number of
Argument Type Description
the Data Store.
enable argument
measurements that have been collected in the Data Store.
selection string “1” – returns the single value specified
“1-10” – returns values in the range from 1-10
“-5” – returns the oldest 5 values (same as 1-5)
“+5” – returns the newest 5 values
Page 96

96 Communication Command Reference
Note: depending on the number of data points requested, there may be several
read operations required on the USB or RS-232 computer interfaces.
8.3.3.42 PM:DS:INTerval
Description Data Store Interval Select
Syntax PM:DS:INTerval <interval>
Parameters
The parameter <interval>is of type <number>that is an integer. The
parameter represents the rate at which measurements are put in the data
buffer.
Function
An interval value of 1 causes the power meter to put all measurements taken
in the data store buffer; a value of 2 causes every other measurement to be
put in the data buffer and so on.
If the measurement mode is “CW Continuous”, an interval setting of 1
translates to putting measurements at the rate of 0.1ms in the data buffer.
If the measurement mode is “Peak-Peak Continuous”, an interval setting of 1
translates to putting measurements at a rate dictated by measurement timeout
duration. Refer “PM:MEAS:TIMEOUT” command for details.
If the measurement mode is “Pulse Continuous”, an interval setting of 1
translates to putting every pulse measurement in the data buffer. Here, the
rate of data storage depends upon the pulse repetition rate.
The total time taken to fill up the data buffer depends upon various factors
such as the interval, data store size and measurement mode.
Related Commands: PM:DS:SIZE,PM:DS:SIZE?,PM:DS:INTerval?
8.3.3.43 PM:DS:INTerval?
Description Data Store Interval Query
Syntax PM:DS:INTerval?
Parameters None
Function
This query returns the interval in milliseconds currently used for data storing.
Related Commands: PM:DS:SIZE,PM:DS:SIZE?,PM:DS:INTerval
8.3.3.44 PM:DS:SAVEBUFFER
Description Save the current Data Store data to a file
Syntax PM:DS:SAVEBUFFER
Page 97

Communication Command Reference 97 97
Remarks The PM:DS:SAVEBUFFER command saves the current
user Data Store for the current channel to a file named
PM2936xxx.dat on the WinCE compatible USB Flash Disk
plugged into the USB Host port on the front of the Power
Meter.
8.3.3.45 PM:DS:SIZE
Description Size of the Data Store query
Syntax PM:DS:SIZE <size>
Parameters
The parameter <size>is of type <integer> in the range 1 to 250000.The
parameter represents the size of the data buffer to be used for data storing.
Function
This command sets the size of the buffer for the currently selected channel
used for data storing.
The data buffer is cleared automatically when this command is used and all
previously stored data will be gone.
Related Commands: PM:DS:SIZE?,PM:DS:INTerval,PM:DS:INTerval?
8.3.3.46 PM:DS:SIZE?
Description Data Store Buffer Size Query
Syntax PM:DS:SIZE?
Parameters None
Function This query returns the data store buffer size for the
Returns <size> is of type <number>and represents an integer of the
Related Commands: PM:DS:SIZE,PM:DS:INTerval,PM:DS:INTerval?
NOTE
currently selected channel.
range 1 to 250000.
8.3.3.47 PM:DS:UNITs?
Description Data store units query
Syntax PM:DS:UNITS?
Remarks The PM:DS:UNITS? query returns an integer indicating
the units selected.
Page 98

98 Communication Command Reference
Response Value Description
units 0 Amps
1 Volts
2 Watts
3 Watts/cm2
4 Joules
5 Joules/cm2
6 dBm
7-10 Reserved
11 Sun
Related Commands: PM:UNITS,PM:UNITS?
8.3.3.48 PM:FILTer
Description Filter select command
Syntax PM:FILT filter type
Remarks The PM:FILT command select the filtering operation to be
performed on power readings.
Argument Value Description
Filter type 0 No filtering
Related Commands: PM:FILT?
8.3.3.49 PM:FILTer?
Description Filter type query
Syntax PM:FILT?
Remarks The PM:FILT? query returns an integer indicating the
Response Value Description
Filter type 0 No filtering
Related Commands: PM:FILT
1 Analog filter
2 Digital filter
3 Analog and Digital filter
present filter mode.
1 Analog filter
2 Digital filter
3 Analog and Digital filter
8.3.3.50 PM:FREQuency?
Description Measured frequency query
Page 99

Communication Command Reference 99 99
Syntax PM:FREQuency?
Remarks The PM:FREQuency? query returns a value indicating the
present measured frequency in Hertz.
8.3.3.51 PM:Lambda
Description Wavelength set command
Syntax PM:Lambda value
Remarks The PM:Lambda command selects the wavelength to use
when calculating power. The value must fall within the
calibrated wavelength of the detector.
Argument Type Description
Value int Wavelength in nanometers (nm)
Related Commands: PM:Lambda?, PM:MAX:Lambda?,
PM:MIN:Lambda?
8.3.3.52 PM:Lambda?
Description Wavelength query
Syntax PM:Lambda?
Remarks The PM:Lambda? query returns the selected wavelength
in nanometers. This is the wavelength used to look up the
responsivity from the calibration data.
Response Type Description
Wavelength int Wavelength in nanometers (nm)
Related Commands: PM:Lambda, PM:MAX:Lambda?,
PM:MIN:Lambda?
8.3.3.53 PM:MAX:Lambda?
Description Maximum wavelength query
Syntax PM:MAX:Lambda?
Remarks The PM:MAX:Lambda? query returns the longest
calibrated wavelength in nanometers. If no detector is
preset, the max lambda for the last read detector is returned.
Response Type Description
Wavelength int Wavelength in nanometers (nm)
Related Commands: PM:MIN:Lambda?
Page 100

100 Communication Command Reference
8.3.3.54 PM:MAX:Power?
Description Maximum power query
Syntax PM:MAX:Power?
Remarks The PM:MAX: Power? returns current range’s maximum
readable power.
Response Type Description
Power float Power in Watts
8.3.3.55 PM:MIN:Lambda?
Description Minimum wavelength query
Syntax PM:MIN:Lambda?
Remarks The PM:MIN:Lambda? query returns the shortest
calibrated wavelength in nanometers. If no detector is
preset,min lambda for the last read detector is returned.
Response Type Description
Wavelength int Wavelength in nanometers (nm)
Related Commands: PM:MAX:Lambda?
8.3.3.56 PM:MIN:Power?
Description Minimum power query
Syntax PM:MIN:Power?
Remarks The PM:MIN: Power? returns current range’s minimum
readable power.
Response Type Description
Power float Power in Watts
Related Commands: PM:MAX:Power?
8.3.3.57 PM:MEAS:TIMEOUT
Description Measurement timeout set command
Syntax PM:MEAS:TIMEOUT value
Remarks This command sets the measurement timeout period. This
value is used for making the following measurements:
1. Peak-to-peak measurements: These measurements are
updated once every timeout period when the power meter is
in Peak-Peak Continuous mode.
 Loading...