

Page 1
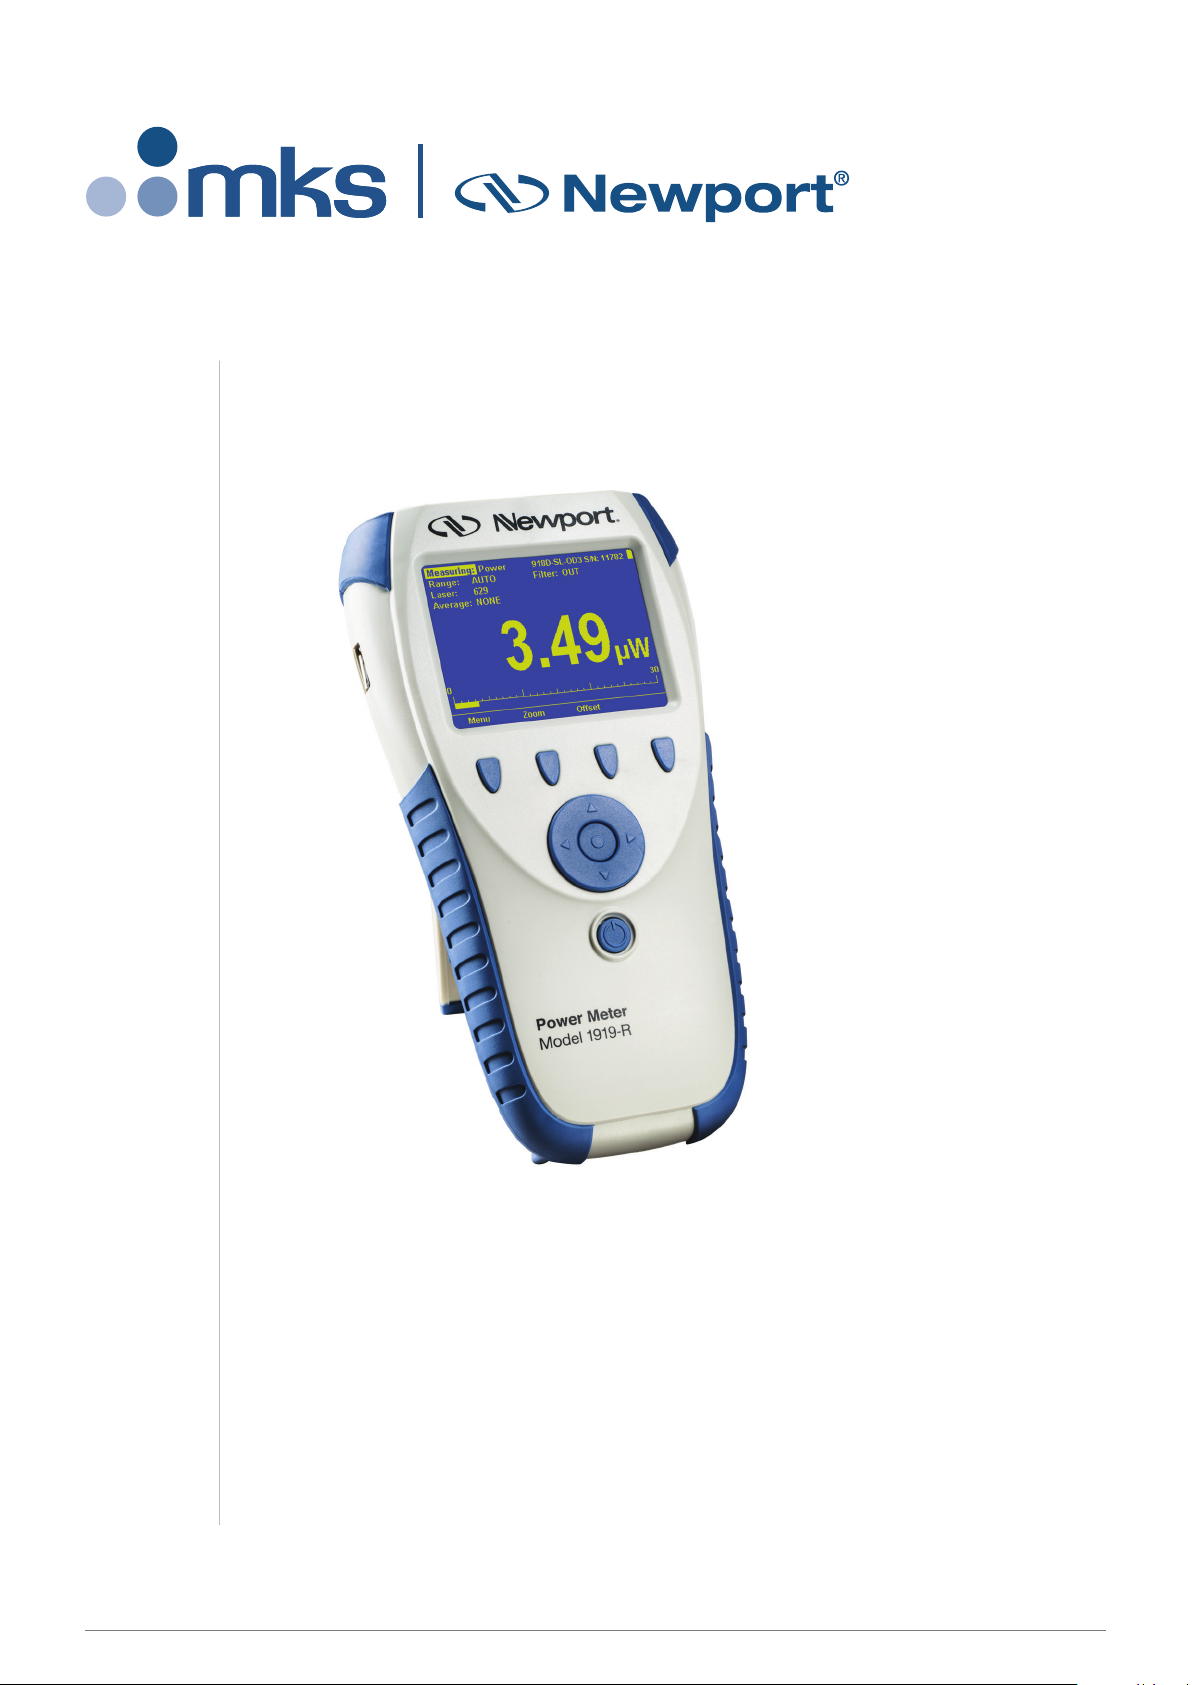
1919-R
1919-R
Laser Power/Energy Meter
1919 - R
User Manual
Newport Corporation
www.newport.com
Page 2

Table of Contents
1 Introduction ................................................................................................................... 5
1.1 This Document ............................................................................................................... 5
1.2 Related Documentation ................................................................................................ 5
1.3 Support .......................................................................................................................... 6
2 Quick Reference ............................................................................................................. 7
2.1 Getting Started .............................................................................................................. 7
2.2 Thermopile Sensors ....................................................................................................... 8
2.2.1 Using 1919-R with Thermopile Type Sensors .................................................... 8
2.2.2 Using 1919-R to Measure Laser Power.............................................................. 8
2.2.3 Using 1919-R to Measure Single Shot Energy ................................................... 8
2.3 Photodiode Sensors ....................................................................................................... 8
2.3.1 Using 1919-R with Photodiode Type Sensors .................................................... 8
2.3.2 Setting the Measurement Parameters .............................................................. 9
2.3.3 Measuring Average Power or Exposure ............................................................ 9
2.4 Pyroelectric or Photodiode Energy Sensors .................................................................. 9
2.4.1 Using 1919-R with Energy Sensors .................................................................... 9
2.4.2 Zeroing Instrument against Sensor .................................................................. 10
2.4.3 Setting the Measurement Parameters ............................................................ 10
2.4.4 Measuring Energy, Average Power, or Exposure ............................................ 11
2.5 Graphical Displays ....................................................................................................... 11
2.6 Math Functions ............................................................................................................ 13
2.7 Logging Data to a File for Upload to PC ....................................................................... 13
3 Using the 1919-R Display Unit ....................................................................................... 14
3.1 General Description ..................................................................................................... 14
3.2 1919-R Display Unit Components ................................................................................ 15
3.3 1919-R Hardware Components/Interfaces ................................................................. 16
3.3.1 Sensor Input ..................................................................................................... 16
3.3.2 LCD Display and Backlight ................................................................................ 17
3.3.3 Soft Keys .......................................................................................................... 17
3.3.4 Navigation Keys ............................................................................................... 17
3.3.5 On-Off Switch/Backlight Control ..................................................................... 17
3.3.6 Charger Input ................................................................................................... 18
3.3.7 Analog Output ................................................................................................. 19
3.3.8 RS232 and USB Outputs ................................................................................... 20
3.4 1919-R Functions – Independent of Sensor Type ....................................................... 20
3.4.1 Instrument Settings ......................................................................................... 20
3.4.2 Field Upgrade – Updating the 1919-R Firmware ............................................. 23
3.4.3 Clock Settings ................................................................................................... 23
3.4.4 Zero Adjustments ............................................................................................ 24
3.4.5 Line Frequency ................................................................................................. 25
3.4.6 Language .......................................................................................................... 25
3.4.7 Measurement Screens (Graph Types) ............................................................. 26
3.4.8 Color Scheme ................................................................................................... 27
3.5 1919-R Screen Layout .................................................................................................. 29
1919-R User Manual 1
Page 3

4 Points to Consider ........................................................................................................ 30
5 Thermopile Sensors ...................................................................................................... 31
5.1 Operation of 1919-R with Thermopile Absorber Sensors ........................................... 32
5.2 Measuring Laser Power with Thermopile Sensors ...................................................... 32
5.3 Measuring Laser Energy with Thermopile Sensors ..................................................... 33
5.3.1 Measuring Pulses of Very Low Energy ............................................................. 34
5.3.2 Measuring Energy of Rapidly Repeating Pulses ............................................... 35
5.4 Measuring Laser Pulsed Power with Thermopile Sensors .......................................... 35
5.4.1 Pulsed Power Limitations ................................................................................ 36
5.5 Supported Models ....................................................................................................... 36
6 Photodiode Sensors...................................................................................................... 37
6.1 Operation of 1919-R with Photodiode Sensors ........................................................... 38
6.2 Measuring Laser Power with Photodiode Sensors ...................................................... 38
6.3 Averaging and Measuring Very Low Power Measurements ....................................... 40
6.4 Measuring Total Exposure ........................................................................................... 40
6.4.1 Exposure Limitations ....................................................................................... 41
7 Pyroelectric and Photodiode Energy Sensors ................................................................. 42
7.1 Pyroelectric Sensors – Method of Operation .............................................................. 42
7.2 Photodiode Energy Sensors – Method of Operation .................................................. 42
7.3 Measuring Pulses of High Energy Density ................................................................... 43
7.4 Operation of 1919-R with Pyroelectric and Photodiode Energy Sensors.................... 43
7.4.1 Zeroing the Energy Sensor Against the 1919-R Meter .................................... 44
7.4.2 Setting Measurement Parameters When Using Energy Sensors .................... 44
7.4.3 Energy, Average Power, or Exposure Measurement ....................................... 46
7.4.4 Measuring Laser Energy................................................................................... 46
7.4.5 Measuring Average Power............................................................................... 47
7.4.6 Measuring Total Energy Exposure ................................................................... 47
8 Graphical Displays ........................................................................................................ 49
8.1 Display Settings............................................................................................................ 50
8.2 Bargraph ...................................................................................................................... 51
8.2.1 Modes .............................................................................................................. 51
8.2.2 Zoom ................................................................................................................ 52
8.2.3 Offset ............................................................................................................... 52
8.2.4 Measuring Loss Using the dB Offset Function ................................................. 53
8.2.5 Bargraph Style .................................................................................................. 54
8.3 Analog Needle ............................................................................................................. 56
8.3.1 Modes .............................................................................................................. 57
8.3.2 Persist .............................................................................................................. 57
8.4 Line Graph ................................................................................................................... 58
8.4.1 Modes .............................................................................................................. 58
8.4.2 Percentage Range (Y-Axis Scale) ...................................................................... 59
8.4.3 Horizontal Sweep Time (X-Axis Scale) ............................................................. 59
8.4.4 Reset ................................................................................................................ 60
8.5 Statistics ....................................................................................................................... 60
8.5.1 Modes .............................................................................................................. 61
1919-R User Manual 2
Page 4

8.6 Pass/Fail ....................................................................................................................... 61
8.6.1 Modes .............................................................................................................. 62
8.6.2 Upper/Lower Limits ......................................................................................... 62
8.7 Exposure (for Pyroelectric Sensors)............................................................................. 63
8.7.1 Modes .............................................................................................................. 64
8.7.2 Manual/Timeout/Pulses .................................................................................. 64
8.7.3 Exposure for Photodiode Sensors ................................................................... 64
8.8 Pulse Chart ................................................................................................................... 65
8.8.1 Modes .............................................................................................................. 66
8.9 Other Display Settings ................................................................................................. 66
8.9.1 Show/Hide Settings ......................................................................................... 67
8.9.2 Color Scheme ................................................................................................... 67
9 Math Functions ............................................................................................................ 70
9.1 Display on Main Measurement Screen ....................................................................... 70
9.2 Functions Screen ......................................................................................................... 71
9.3 Average ........................................................................................................................ 71
9.4 Fixed Offset .................................................................................................................. 72
9.5 Scale Factor.................................................................................................................. 72
9.6 Normalize .................................................................................................................... 74
9.7 Density ......................................................................................................................... 75
9.8 Function Limitations .................................................................................................... 76
10 Logging Data to a File for Upload to PC ......................................................................... 77
10.1 Launching the Log Setup ............................................................................................. 77
10.2 Setting Logging Parameters for the Various Stop Modes ........................................... 78
10.2.1 Manual Mode .................................................................................................. 79
10.2.2 After Timeout .................................................................................................. 80
10.2.3 After Measurements ........................................................................................ 82
10.3 Start Logging ................................................................................................................ 83
10.4 Displaying Logged Data ............................................................................................... 84
10.5 Viewing the Log File on Your Computer ...................................................................... 87
11 Circuit Description ........................................................................................................ 88
11.1 Analog Module ............................................................................................................ 88
11.1.1 Analog Circuit ................................................................................................... 88
11.1.2 Fast Analog Input ............................................................................................. 88
11.1.3 Analog Output ................................................................................................. 88
11.2 Processor Board ........................................................................................................... 88
11.2.1 Power Supply ................................................................................................... 88
11.2.2 EMI Protection ................................................................................................. 89
12 Calibration, Maintenance, and Troubleshooting ............................................................ 90
12.1 Updating Sensor Calibration Factors ........................................................................... 91
12.2 Calibration of Thermopile Sensors .............................................................................. 91
12.2.1 Surface Absorbers ............................................................................................ 91
12.2.2 Volume Absorbers ........................................................................................... 92
12.2.3 Linearity and Accuracy of Newport Thermopile Sensors ................................ 92
12.2.4 Updating Thermopile Sensor Calibration Factors ............................................ 93
1919-R User Manual 3
Page 5

Introduction
12.3 Calibration of Photodiode Sensors .............................................................................. 98
12.3.1 Method of Factory Calibration ........................................................................ 98
12.3.2 Accuracy of Calibration .................................................................................... 98
12.3.3 Updating Photodiode Sensor Calibration Factors ........................................... 99
12.4 Calibration of Pyroelectric Sensors............................................................................ 100
12.4.1 Absorber Types Used in Newport Pyroelectric Measuring Sensors .............. 100
12.4.2 Calibration ..................................................................................................... 101
12.4.3 Accuracy of Calibration .................................................................................. 101
12.4.4 Updating Pyroelectric Sensor Calibration Factors ......................................... 102
12.5 Error Messages .......................................................................................................... 104
12.6 Troubleshooting ........................................................................................................ 104
12.6.1 1919-R Meter ................................................................................................. 104
12.6.2 Thermopile Sensors, Energy Measurements ................................................. 104
12.6.3 Thermopile Sensors, Power ........................................................................... 105
12.6.4 Pyroelectric Sensors....................................................................................... 105
12.7 Maintenance .............................................................................................................. 106
12.7.1 Maintenance of Thermopile Sensors ............................................................. 106
12.7.2 Battery Replacement ..................................................................................... 106
13 1919-R Specifications .................................................................................................. 107
13.1 System/Meter Specifications..................................................................................... 107
13.2 Sensor Specifications ................................................................................................. 109
1919-R User Manual 4
Page 6

1 Introduction
The Newport 1919-R is a microprocessor-based Laser Power/Energy Meter that provides a broad
range of measurements, displays, and data handling options. It operates with Thermopile,
Pyroelectric, and Photodiode sensors. Taking advantage of smart connector technology, it is easyto-use—simply connecting the sensor configures and calibrates the 1919-R to operate with that
sensor. The sensor configuration and calibration information is stored in an EEROM in the sensor
connector plug. This means that when the sensor is plugged in, 1919-R automatically identifies the
sensor type, calibration, and configuration. The user does not have to adjust anything.
The 1919-R’s 320x240 full color screen enhances measurement readouts in ways that simple
monochrome displays cannot. The 1919-R can graph power or energy versus time. It displays
power measurements in both digital and analog form simultaneously and also has a needle type
display. It will also autorange, so you do not have to set scales; or it can manual range if you wish.
It will remember what mode you were using before you turned it off and will return to that mode
when turned on. You can zoom in on the present reading, or subtract background. Although the
calibration information is stored in the smart connector, you can recalibrate from the screen and
store the new calibration in the sensor. You can also zero the 1919-R at the touch of a button.
1919-R is capable of logging data onto a USB Flash Drive (Disk On Key), as well as real-time
reporting of data via USB to Newport’s PMManager application to display and process the
information. 1919-R has RS232 capabilities as well. 1919-R also has the infrastructure for field
upgrading of the embedded software, should the need arise.
Above all, the 1919-R has advanced circuitry and digital signal processing for excellent sensitivity,
signal to noise ratio, accuracy, and response time. It also has special circuitry to reject
electromagnetic interference.
1919-R’s User Interface is intuitive. The keypad functionality is context-sensitive and functions
according to the needs of the present screen. Where necessary, on-screen help is provided as well,
so you should not have to refer to this manual very often.
1.1 This Document
This document covers everything you need to know to make full use of the 1919-R for all your
laser measurement needs. It includes a Quick Reference (Chapter 2) to allow you to perform basic
measurements immediately, without reading the whole manual.
1.2 Related Documentation
Newport takes pride in the wealth of laser measurement information that we provide including
FAQ’s, Catalogs, Spec Sheets, and more. Go to https://www.newport.com/Optical-
Meters/6770532/1033/section.aspx.
1919-R User Manual 5
Page 7

Introduction
North America
Europe
Asia
Newport Corporation Service
Dept.
1791 Deere Ave. Irvine, CA 92606
Telephone: (949) 253-1694
Telephone: (800) 222-6440 x31694
Newport/MICRO-CONTROLE S.A.
Zone Industrielle
45340 Beaune la Rolande, FRANCE
Telephone: (33) 02 38 40 51 56
Newport Opto-Electronics
Technologies (Wuxi) Co., Ltd
理波光电科技(无锡)有限公司
江苏省无锡市新区出口加工区
J3-8厂房 204028
Lot J3-8, Wuxi Export Processing
Zone, New District,
Jiangsu China 204028
Telephone: +86-510-8113 2999
Fax: +86-510-8526 9050
1.3 Support
If you have a question or require further assistance, contact Newport customer support:
1919-R User Manual 6
Page 8

2 Quick Reference
This section provides a quick reference for performing basic measurements with the 1919-R Laser
Power/Energy Meter.
2.1 Getting Started
The 1919-R is equipped with "soft keys." That is, the functions of the keys change as indicated by
the legend above each key. It is also equipped with 4 navigation keys and a round Enter key in the
center.
To connect sensor to the 1919-R meter:
Insert the 15 pin D type connector of the measuring sensor cable into the socket
marked Sensor Input on the rear panel of the 1919-R meter.
To switch the 1919-R on:
1. To switch on, briefly press the On/Off/Backlight switch. The unit will switch on, and the display
will appear.
2. The backlight for the 1919-R’s LCD can be configured to toggle between full, half, and low
illumination. This toggling will be performed by briefly pressing the On/Off switch after the
1919-R has been switched on.
3. To switch the 1919-R off, press the On/Off switch and hold it for ~ 2 seconds until the display
blanks.
To set general instrument settings:
1. Disconnect the sensor. Use the Navigation keys to select the parameter to change and press
the Enter key. Change the setting with the Navigation keys. Press the Enter key to save.
2. RS232 Baud: Set baud rate for PC communication through its COM port.
3. Max An. Output: Set desired max analog output.
4. Language: Set to desired language.
5. Line Frequency: Set to 50Hz or 60Hz, depending on the electrical power grid of the area that
you are in.
6. Date and Time: Set to correct date and time.
The 1919-R automatically saves the current settings for next power up.
To zero the instrument:
1. Disconnect the sensor.
2. Make sure the instrument is not in an electrically noisy environment and is undisturbed.
3. Press Zero and Start. Zeroing takes about 30 seconds. Wait until “Zeroing completed
successfully” appears.
1919-R User Manual 7
Page 9

Quick Reference
2.2 Thermopile Sensors
2.2.1 Using 1919-R with Thermopile Type Sensors
1. Plug in the Thermopile sensor. 1919-R will reconfigure itself to work with the attached sensor.
2. All of the sensor’s measurement parameters are shown on the main screen. Use the
Navigation keys to select and change the parameters.
3. Use the Navigation keys to select the parameter to change and press the Enter key. Change
the setting with the Navigation keys. Press the Enter key to save.
4. 1919-R saves the changes automatically for next startup of the instrument.
Warning: Do not exceed maximum sensor limits for power, energy, power density, and energy
density as listed in Sensor Specifications. Otherwise, there is a risk of damaging the absorber.
2.2.2 Using 1919-R to Measure Laser Power
1. Set Mode to Power.
2. Set Range to AUTO or one of the manual ranges. The correct manual range is the lowest one
that is larger than the expected maximum power of the laser.
3. Set Laser to the appropriate laser setting.
4. Set Average to the period you wish to average power over or set to NONE to disable.
2.2.3 Using 1919-R to Measure Single Shot Energy
1. Set Mode to Energy.
2. Set Range to the appropriate manual range. (In Energy mode, there is no autoranging.) The
correct range is the lowest one that is larger than the expected maximum pulse energy of the
laser.
3. Set Laser to the appropriate laser setting.
4. Set Threshold if you wish to change the energy threshold.
5. When the 1919-R screen flashes READY on and off, fire the laser.
2.3 Photodiode Sensors
2.3.1 Using 1919-R with Photodiode Type Sensors
1. Plug in the Photodiode sensor. 1919-R will reconfigure itself to work with the attached sensor.
2. All of the sensor’s measurement parameters are shown on the main screen. Use the
Navigation keys to select and change the parameters.
3. Use the Navigation keys to select the parameter to change and press the Enter key. Change
the setting with the Navigation keys. Press the Enter key to save.
4. 1919-R saves the changes automatically for next startup of the instrument.
Warning: Do not exceed maximum sensor limits for power, energy, power density, and energy
density as listed in Sensor Specifications. Otherwise, there is a risk of damaging the absorber.
1919-R User Manual 8
Page 10

Quick Reference
2.3.2 Setting the Measurement Parameters
1. Set Range to the appropriate manual range, AUTO, or dBm (logarithmic scale). Note that
when selecting a manual range, the correct range is the lowest one that is larger than the
expected maximum power of the laser.
2. Set Laser to the appropriate laser setting. If the wavelength you want is not among the
wavelengths listed, select one and press the arrow key that is next to it to open the Modify
screen. Using the up/down Navigation keys to change each number and the right/left keys to
move to the next number, key in the wavelength you want. When finished, press the Enter
key.
3. Set Filter to IN or OUT as physically configured on the sensor. Not necessary for sensors with
built-in filter state detection.
4. Set Average to the period you wish to average power over or set to NONE to disable.
2.3.3 Measuring Average Power or Exposure
To measure average power:
1. Set Mode to Power.
2. Set measurement parameters as described above.
To measure exposure:
1. Set Mode to Exposure.
2. Set measurement parameters as described above.
3. Set Stop Mode to Manual or Timeout period.
4. Accumulated energy exposure will be displayed on the screen, as well as the elapsed time.
2.4 Pyroelectric or Photodiode Energy Sensors
2.4.1 Using 1919-R with Energy Sensors
1. Plug in the Pyroelectric/Photodiode energy sensor. 1919-R will reconfigure itself to work with
the attached sensor.
2. All of the sensor’s measurement parameters are shown on the main screen. Use the
Navigation keys to select and change the parameters.
3. Use the Navigation keys to select the parameter to change and press the Enter key. Change
the setting with the Navigation keys. Press the Enter key to save.
4. 1919-R saves the changes automatically for next startup of the instrument.
Warning: Do not exceed maximum sensor limits for power, energy, power density, and energy
density as listed in Sensor Specifications. Otherwise, there is a risk of damaging the absorber.
1919-R User Manual 9
Page 11

Quick Reference
2.4.2 Zeroing Instrument against Sensor
For most accurate calibration, you should zero the energy sensor against the 1919-R it is being
used with:
1. Make sure the sensor is in a quiet environment and not subject to pulsed radiation.
2. Press Menu and select Instrument.
3. Press Zero and Start. Wait until “Zeroing completed successfully” appears.
2.4.3 Setting the Measurement Parameters
1. Set Range to the lowest one that is larger than the expected maximum pulse energy of the
laser.
2. Set Laser to the appropriate laser setting. If this sensor is a metallic type and if the wavelength
you want is not among the wavelengths listed, select one and press the arrow key that is next
to it to open the Modify screen. Using the up/down keys to change each number and the
right/left keys to move to the next number, key in the wavelength you want. When finished,
press the Enter key.
3. Set Pulse Length to the shortest time that is longer than the expected pulse length.
Warning: Incorrect readings will result if pulse length is not set up correctly.
4. For sensors with the diffuser option, set Diffuser to IN or OUT as physically set on the sensor.
5. Set Threshold as necessary to screen out false triggers due to noise.
6. Set Average to the period you wish to average power over, or set to NONE to disable.
1919-R User Manual 10
Page 12

Quick Reference
2.4.4 Measuring Energy, Average Power, or Exposure
With the Pyroelectric sensor, you have been supplied a test slide with the same coating as on your
Pyroelectric detector. You can also obtain this slide from your dealer. You should use this slide to
test the damage threshold with your laser pulses. If the slide is damaged, then either enlarge your
beam, or lower the laser energy until damage is no longer seen.
To measure energy:
1. Set Mode to Energy.
2. Set measurement parameters as described above.
3. Energy will be displayed on the screen as well as the laser’s frequency.
To measure average power:
1. Set Mode to Power.
2. Set measurement parameters as described above.
3. Average power will be displayed as a function of “Energy x Frequency” on the screen as well as
the laser’s frequency.
To measure exposure:
1. Set Mode to Exposure.
2. Set measurement parameters as described above.
3. Set Stop Mode to Manual, Timeout period, or Pulse count.
4. Accumulated energy exposure will be displayed on the screen, as well as elapsed time and
number of pulses measured.
2.5 Graphical Displays
To present measurements on a graduated scale (bargraph):
1. In Power or Energy mode, press Menu and enter Display.
2. Go to Graph Type and select Bargraph. Return to the main display screen.
3. To expand the bargraph scale ±5x of the present reading, press the Zoom button. Press Zoom
again to return the bargraph to full scale.
4. To subtract the background and set the current reading to zero, press the Offset button. Press
Offset again to cancel.
To simulate an analog needle:
1. In Power or Energy mode, press Menu and enter Display.
2. Go to Graph Type and select Needle. Return to the main display screen.
3. To expand the needle graph ±5x of the present reading, press Zoom. Press Zoom again to
return the needle range to full scale.
1919-R User Manual 11
Page 13

Quick Reference
4. To subtract the background and set the current reading to zero, press the Offset button. Press
Offset again to cancel.
5. Press Persist to keep older measurements on the screen and to display numerically the Min
and Max values measured. Press Persist again to cancel.
To graph laser output over time:
1. In Power or Energy mode, press Menu and enter Display.
2. Go to Graph Type and select Line. Return to the main display screen.
3. Set the percentage range of the scale to be displayed to the desired setting.
4. Set the horizontal sweep time as necessary.
5. Press Reset to clear the Min/Max tracking and to restart the graph.
6. This is especially useful to fine-tune the laser power.
To display real-time statistics:
1. In Power or Energy mode, press Menu and enter Display.
2. Go to Graph Type and select Statistics. Return to the main display screen.
3. Displays Maximum, Minimum, Average, Standard Deviation, Total Readings, and Number
Overrange.
4. To subtract the background and set the current reading to zero, press the Offset button. Press
Offset again to cancel.
5. Press Reset to clear the statistics.
To set pass/fail tracking:
1. In Power or Energy mode, press Menu and enter Display.
2. Go to Graph Type and select Pass/Fail. Return to the main display screen.
3. Press the Upper and Lower buttons to set tolerance limits. If reading is out of range, an
appropriate warning will be displayed on the screen.
To display readings as bars with lengths proportional to the measurement:
1. In Power or Energy mode, press Menu and enter Display.
2. Go to Graph Type and select Pulse Chart. Return to the main display screen.
3. Set the percentage range of the scale to be displayed to the desired setting.
4. Set the number of readings to display as necessary.
5. Press Reset to clear the Min/Max tracking and to restart the graph.
6. This is especially useful when measuring pulses of low frequency lasers.
1919-R User Manual 12
Page 14

Quick Reference
2.6 Math Functions
To apply a fixed offset to measurements:
1. Press Menu and enter Functions. Go to Fixed Offset.
2. Set the value to subtract from all subsequent measurements.
To apply a Scale Factor to measurements:
1. Press Menu and enter Functions. Go to Scale Factor.
2. Set to value by which to multiply all subsequent measurements.
3. Useful when working with beam splitters.
To normalize against a reference measurement:
1. Press Menu and enter Functions. Go to Normalize.
2. Set to reference value by which to normalize all subsequent measurements.
To display as power/energy density:
1. Press Menu and enter Functions. Go to Density.
2. Select beam shape and size.
3. Measurements will be shown as cm².
2.7 Logging Data to a File for Upload to PC
You can log your measurement data to a file for upload to PC by connecting an external storage
device to the USB port of the 1919-R meter. For details, see Logging Data to a File for Upload to
PC.
1919-R User Manual 13
Page 15

3 Using the 1919-R Display Unit
This section describes the 1919-R display unit, its components, its functions independent of sensor
type, hardware functions, GUI, and keypad settings.
Topics include:
General Description
1919-R Display Unit Components
1919-R Hardware Components/Interfaces
1919-R Functions – Independent of Sensor Type
1919-R Screen Layout
3.1 General Description
The Newport 1919-R is a microprocessor-based Laser Power/Energy Meter that provides a broad
range of measurements, displays, and data handling options. It operates with Thermopile,
Pyroelectric, and Photodiode sensors. Taking advantage of smart connector technology, it is easyto-use—simply connecting the sensor configures and calibrates the 1919-R to operate with that
sensor. The sensor configuration and calibration information is stored in an EEROM in the sensor
connector plug. This means that when the sensor is plugged in, 1919-R automatically identifies the
sensor type, calibration, and configuration. You do not have to adjust anything. Sensors are hot
swappable. Even after the meter is switched on, you can remove one sensor and insert a different
one. 1919-R will recognize the switch and reconfigure itself according to the settings of the new
sensor.
The 1919-R’s 320x240 full-color screen enhances measurement readouts in ways that simple
monochrome displays cannot. The 1919-R can graph power or energy versus time. It displays
power measurements in both digital and analog form simultaneously and also has a needle type
display. It will also autorange, so you do not have to set scales; or it can manual range if you wish.
It will remember what mode you were using before you turned it off and will return to that mode
when turned on. You can zoom in on the present reading, or subtract the background. Although
the calibration information is stored in the smart connector, you can recalibrate from the screen
and store the new calibration in the sensor. You can also zero the 1919-R at the touch of a button.
1919-R is capable of logging data onto a USB Flash Drive (Disk On Key), as well as real-time
reporting of data via USB to Newport’s PMManager application to display and process the
information. 1919-R has RS232 capabilities as well. 1919-R also has the infrastructure for field
upgrading of the embedded software, should the need arise.
Above all, the 1919-R has advanced circuitry and digital signal processing for excellent sensitivity,
signal-to-noise ratio, accuracy, and response time. It also has special circuitry to reject
electromagnetic interference.
1919-R’s User Interface is intuitive. The keypad functionality is context-sensitive and functions
according to the needs of the present screen. Where necessary, on-screen help is provided as well,
so you should not have to refer to this manual very often.
1919-R User Manual 14
Page 16
Using the 1919-R Display Unit
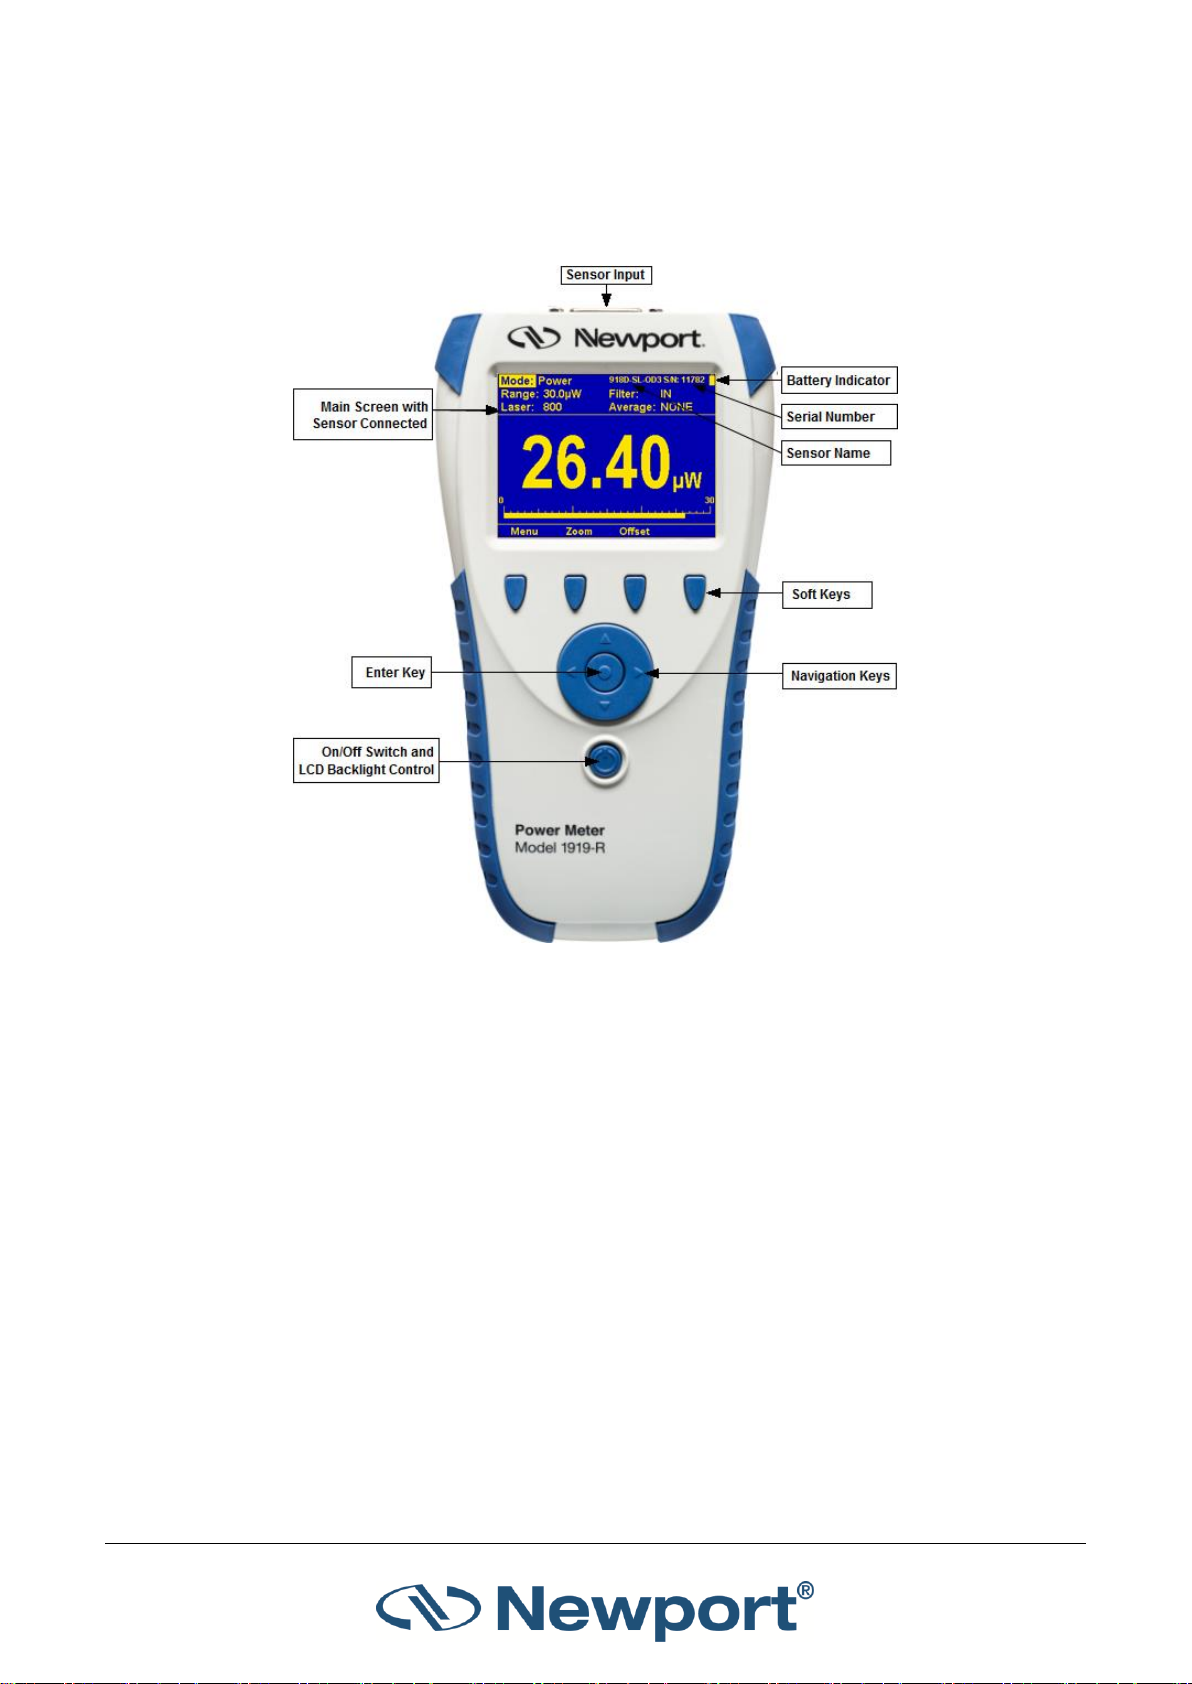
3.2 1919-R Display Unit Components
Figure 3-1 below displays the 1919-R display unit, displaying the main screen with some sample
measurements.
Figure 3-1 1919-R Meter/Display Unit – Front View
The 1919-R is equipped with:
LCD Display screen
Soft keys (under the display screen): The functions of the keys change as indicated by the
legend above each key. (The Menu key enables you to access Sensor, Display, Functions,
Instrument, Log, and Calibration settings. For sensor-specific details, see Thermopile Sensors,
Photodiode Sensors, Pyroelectric and Photodiode Energy Sensors.)
4 Navigation Keys and round Enter Key (under the soft keys, in the center of the unit)
Power On/Off/Backlight button
1919-R User Manual 15
Page 17
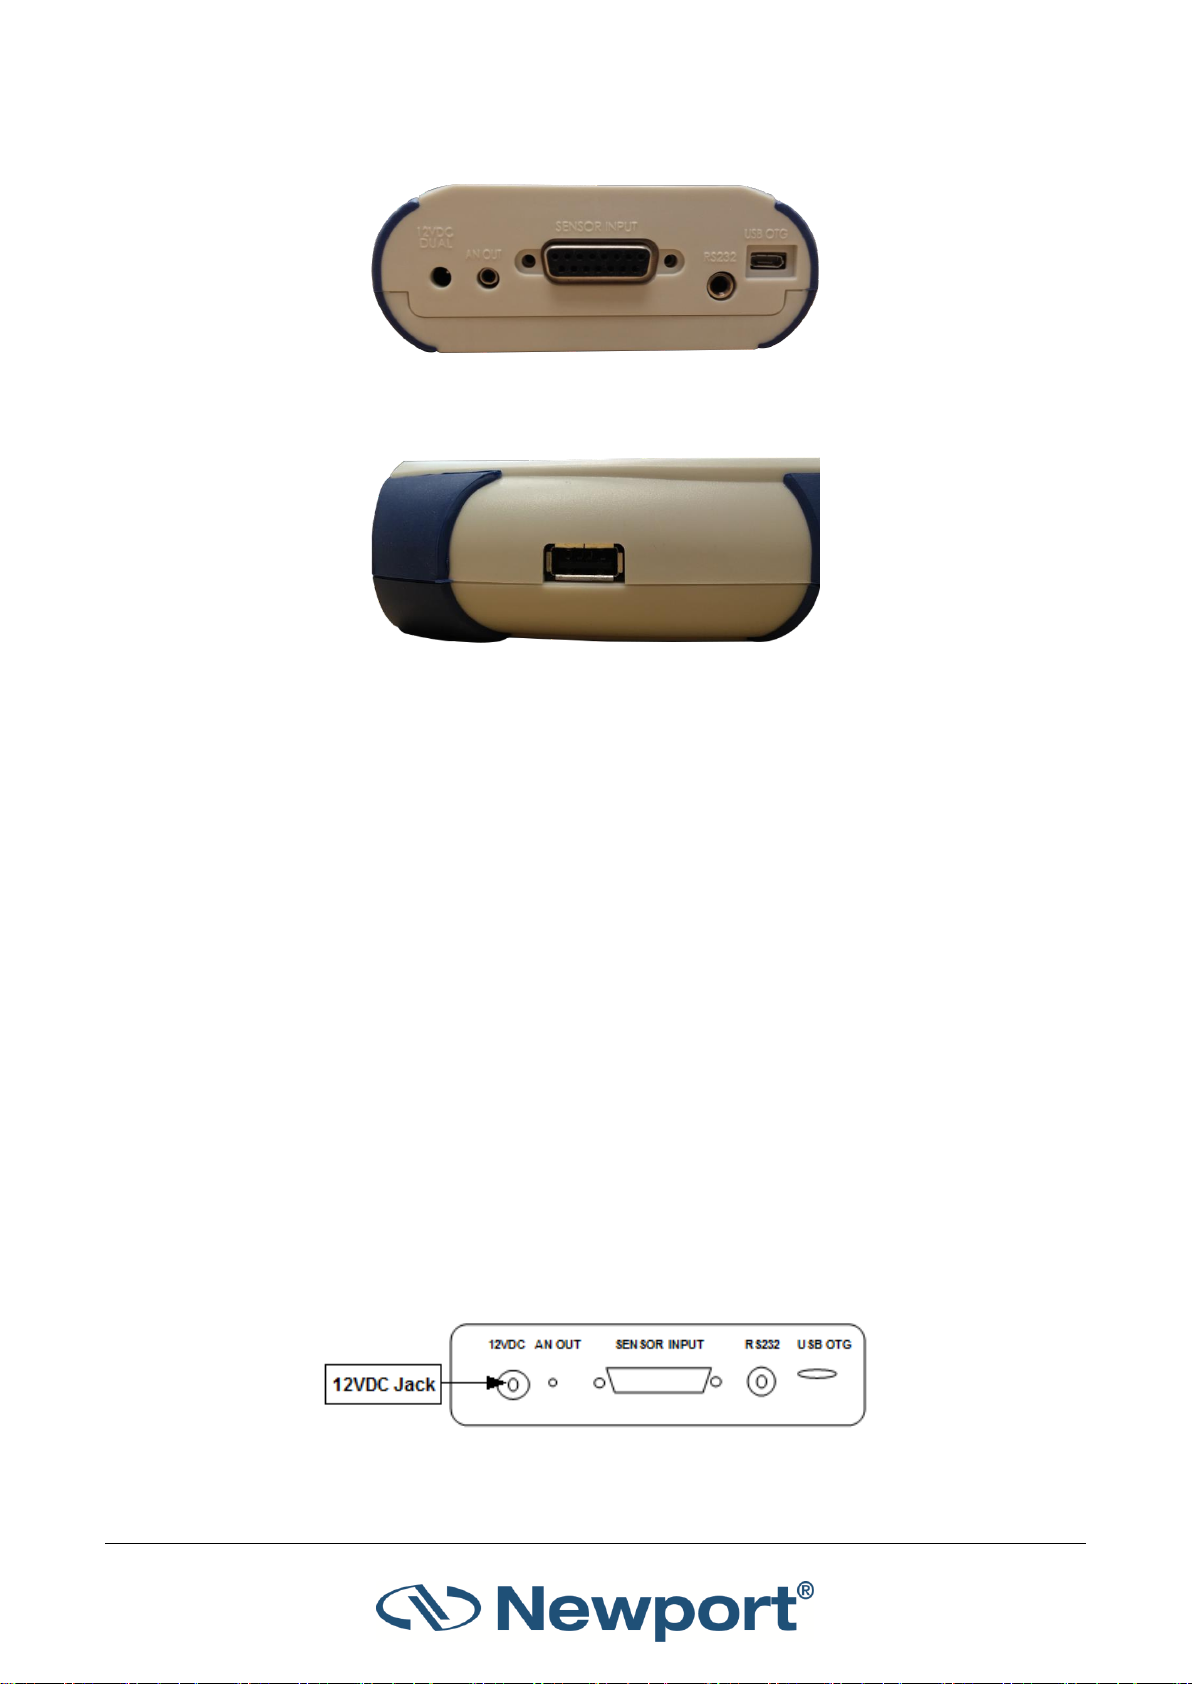
Using the 1919-R Display Unit
Rear Panel with the following sockets: 12VDC, AN OUT, Sensor Input, RS232, USB OTG
Figure 3-2 1919-R Rear Panel
USB Port (on left side of the 1919-R meter)
Figure 3-3 USB Port (on Left Side) of 1919-R Meter
3.3 1919-R Hardware Components/Interfaces
This section describes the 1919-R hardware components and interfaces.
Topics include:
Sensor Input
LCD Display and Backlight
Soft Keys
Navigation Keys
On-Off Switch/Backlight Control
Charger Input
Analog Output
RS232 and USB Outputs
3.3.1 Sensor Input
The Sensor Input, located in the center of the 1919-R real panel, is the socket where you insert the
15 pin D type connector of the measuring sensor cable in order to connect the sensor to the
meter, as shown in Figure 3-4 below.
Figure 3-4 1919-R Rear Panel View
1919-R User Manual 16
Page 18
Using the 1919-R Display Unit
3.3.2 LCD Display and Backlight
The 1919-R screen is a QVGA 320x240 pixel color TFT LCD. It can be driven in one of two full color
modes or in one.
The LCD backlight is actually a set of LEDs that illuminate the display from behind. Because the
1919-R uses a TFT color display, the backlight must be constantly on. It can be operated at full
intensity for full illumination; or at low or half-level to conserve power consumption
(recommended). The backlight level is toggled by a short press on the On/Off switch.
The 1919-R backlight consumes considerably less power than competing instruments, and
therefore it can operate from the battery even when the charger is not plugged in. Nevertheless,
since it does shorten the time between charges, it is recommended to set the backlight to less
than full intensity when the instrument is operated without the charger. (For further details, see
On-Off Switch/Backlight Control.)
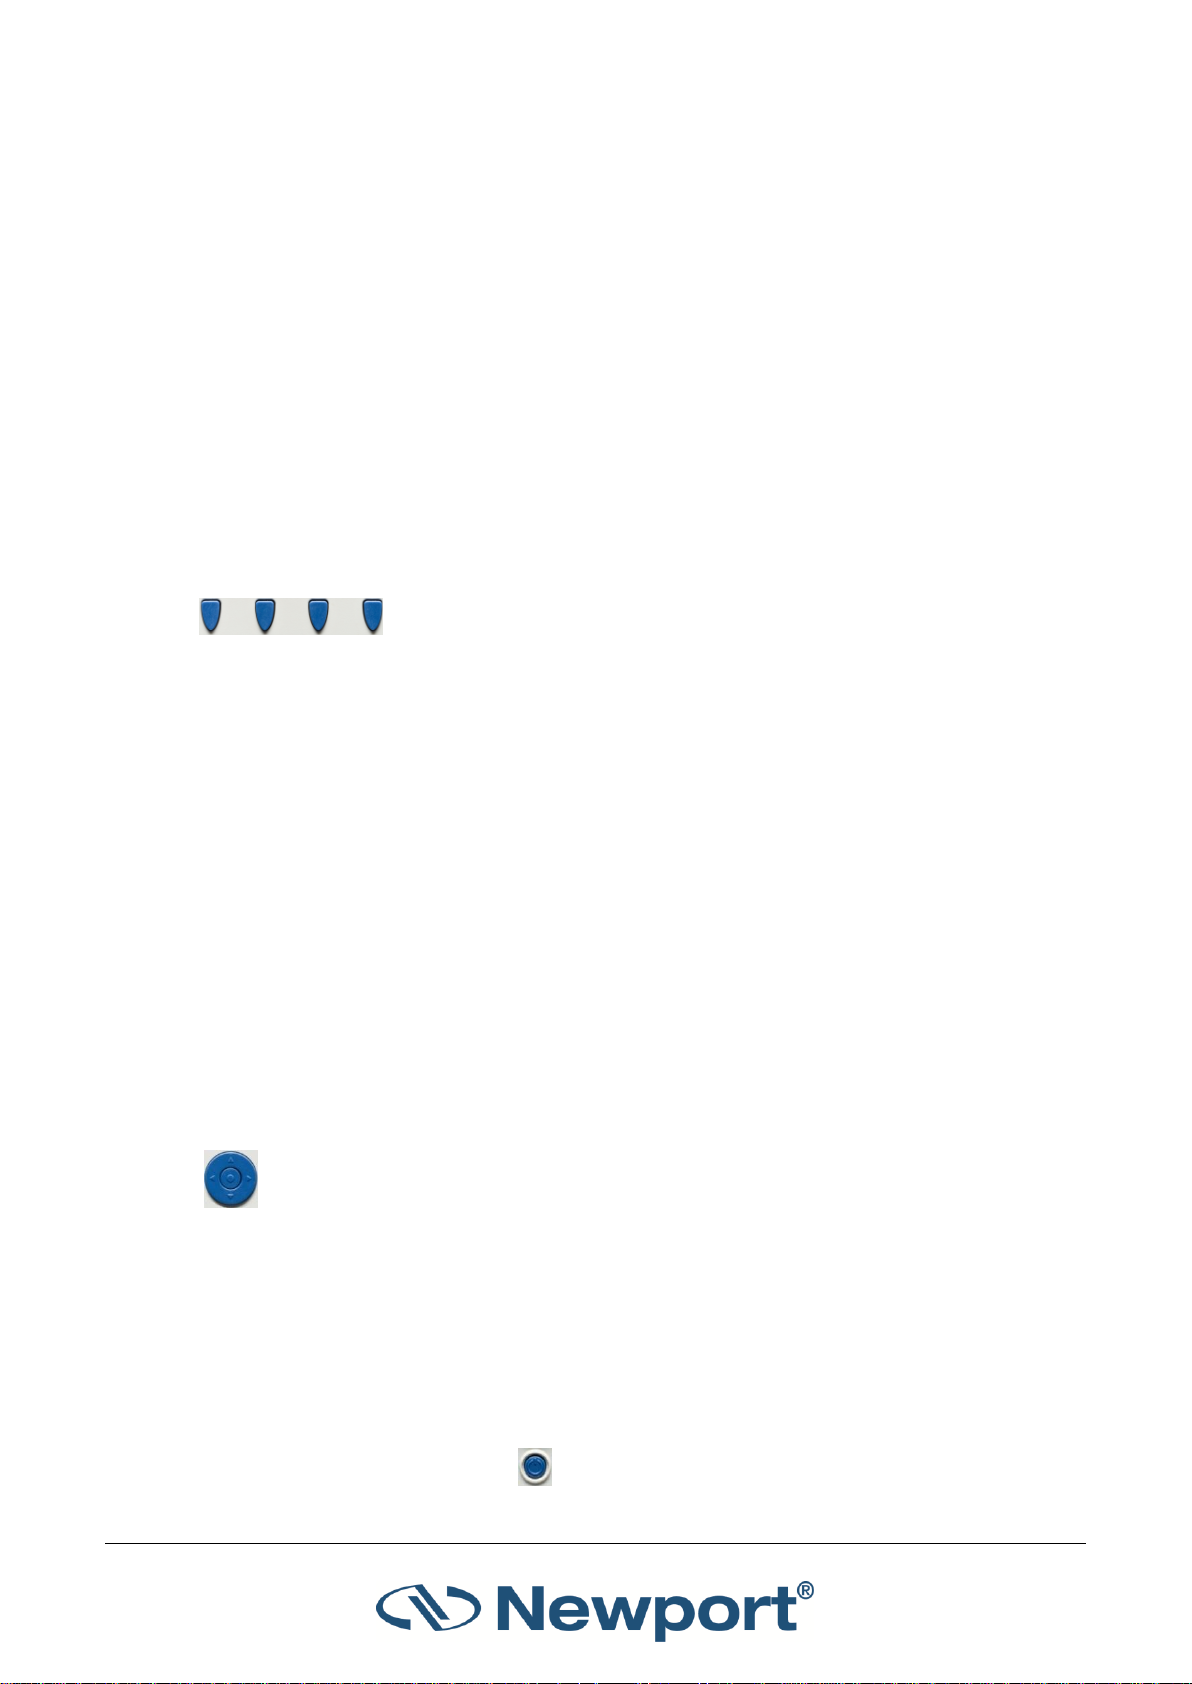
3.3.3 Soft Keys
The Soft keys, located under the 1919-R screen, have functions defined by
the legend above each key. The legend usually indicates what will happen
when pressing the key. For example, if "Zoom" appears above a key, pressing that key will display
a zoom view of the screen. Some functions operate when the key is pressed and are canceled
when the key is pressed again. Those keys show reverse highlighting when operational. Pressing
the same key again cancels the operation and the highlighting.
Key Functions
The 1919-R has certain conventions as to the meaning of standard key strokes, including:
Highlighted item: The item that is presently active.
Menu: Provides access to Sensor, Display, Functions, Instrument, Log, and Calibration settings.
Start: Launches the active item.
Exit: Returns to the previous screen.
Cancel: Cancels the selection and returns to the previous screen, leaving the settings
unchanged.
3.3.4 Navigation Keys
The Navigation keys move to the next active item—left, right, up, and down. The round
button in the center is an Enter key to enter the screen of the item selected or when
finished, to leave that screen. Pressing the Enter key to leave the screen will save the
newly selected value for immediate use and will also save the change permanently.
3.3.5 On-Off Switch/Backlight Control
This section describes how to switch on/off the 1919-R and how to toggle the state of the
backlight.
To turn the 1919-R on:
Briefly press the On/Off switch (located under the Navigation keys, at the bottom
of the front panel). See Figure 3-1 above.
1919-R User Manual 17
Page 19
Using the 1919-R Display Unit
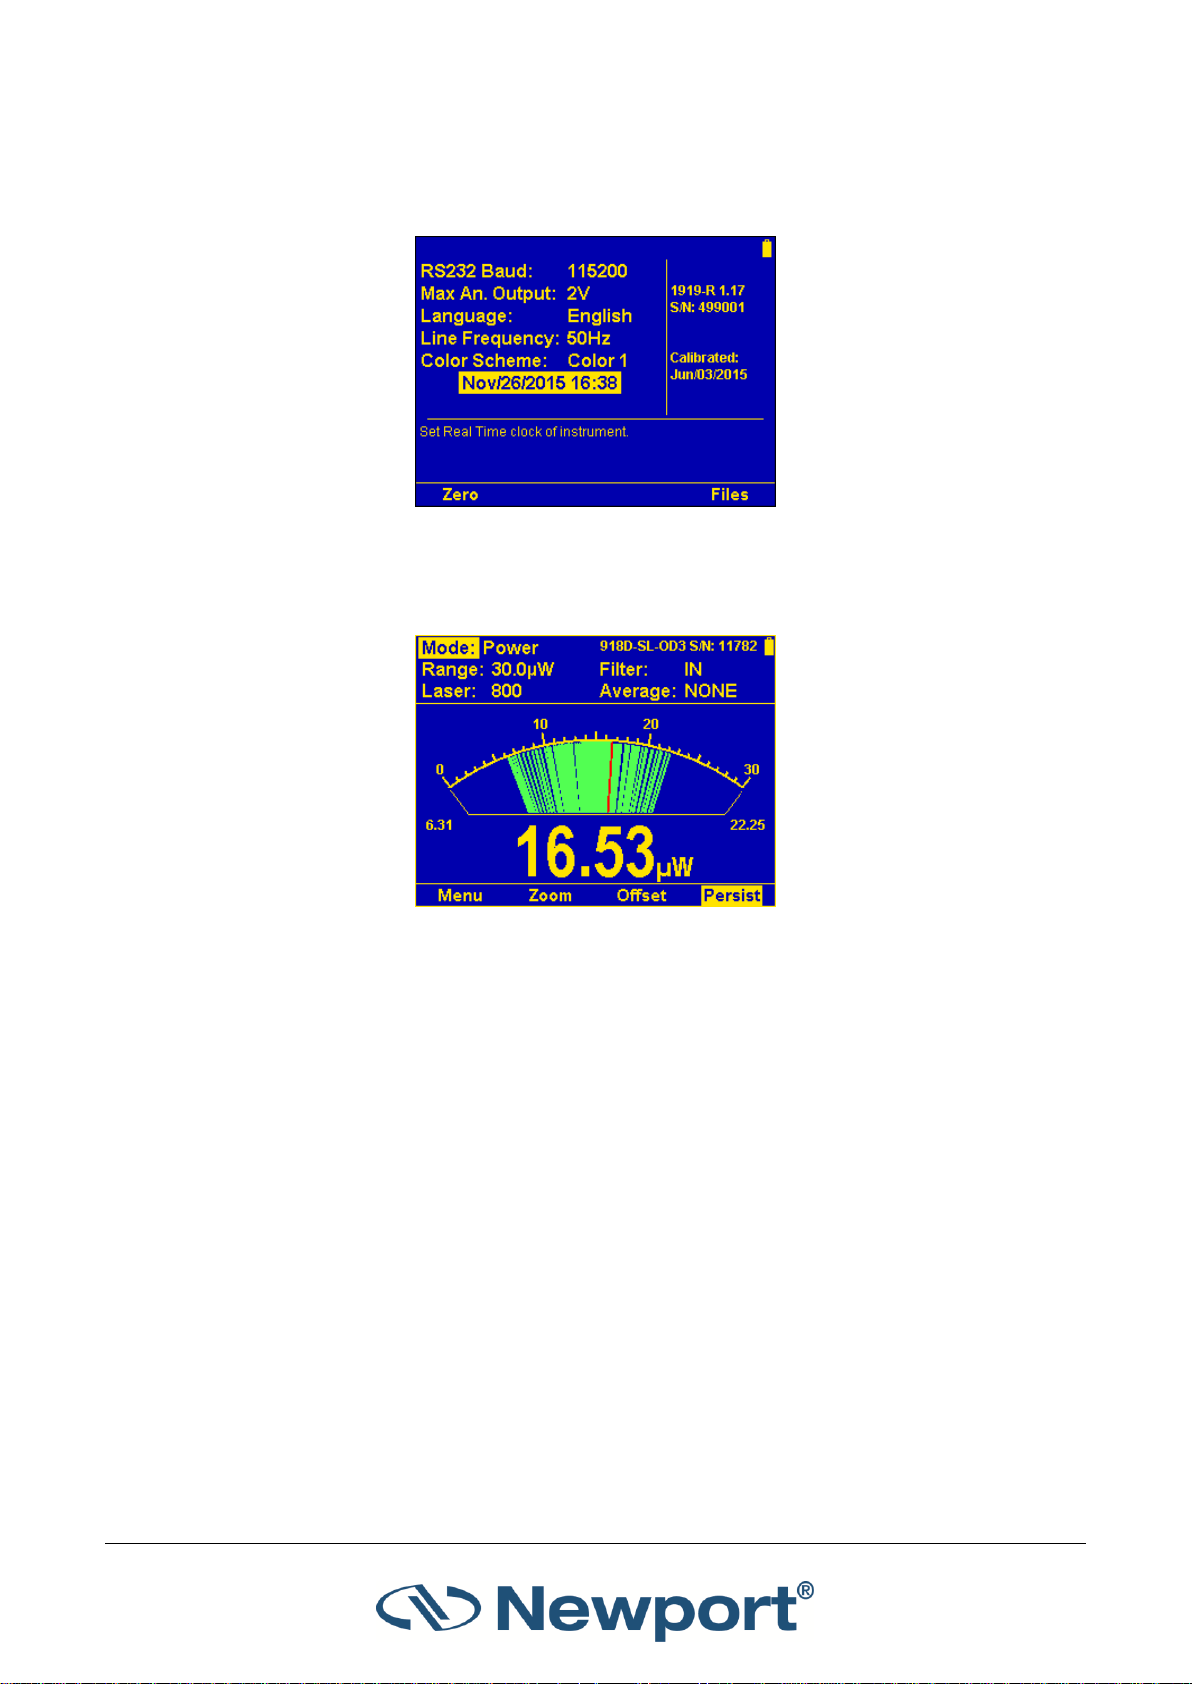
The unit switches on, and the display appears. If no sensor is connected, the Instrument
Settings screen appears, displaying the configurations saved from the previous session (see
Instrument Settings). For example:
Figure 3-5 Instrument Settings Screen
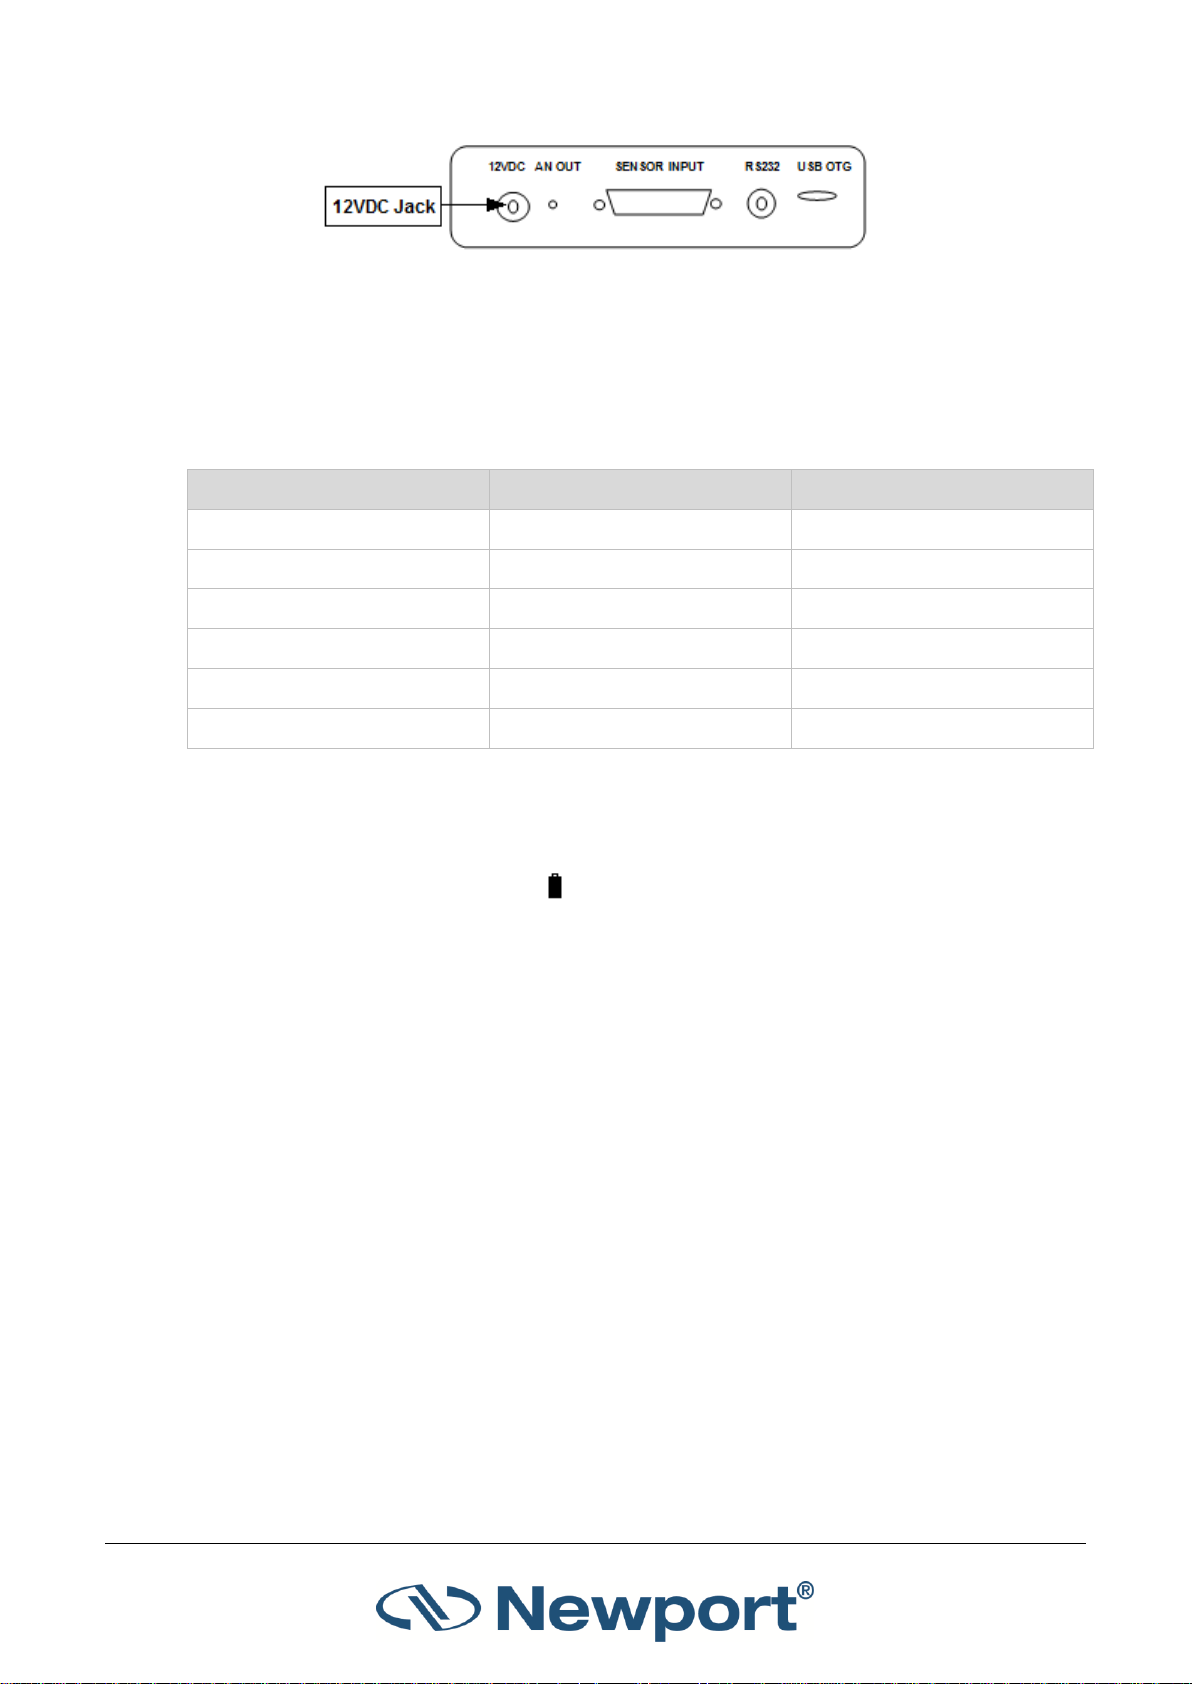
If a sensor is connected, the appropriate default measurement screen will appear. For
example:
Figure 3-6 Needle Display with Persistence Enabled
To switch the 1919-R off:
Press the On/Off switch and hold it for ~ 3 seconds until the display blanks.
To toggle the state of the backlight of the 1919-R’s LCD:
Briefly press the On/Off switch after the 1919-R has been switched on. You can toggle
the backlight between full, half, and low illumination.
3.3.6 Charger Input
The 1919-R can be operated either by the internal battery or from an AC source with the charger
plugged in all the time. Plug the charger into the jack labeled "12VDC" on the rear panel (see
Figure 3-7 below). The battery will be charged at the same rate whether the 1919-R is switched on
or off, and whatever the backlight level. The battery will fully recharge in around 4-5 hours.
1919-R User Manual 18
Page 20
Using the 1919-R Display Unit
Sensor Type
Backlight Level
Time Between Charges
Thermopile and Photodiode
Low
19 hours
Thermopile and Photodiode
Half
17 hours
Thermopile and Photodiode
Full
15 hours
Pyroelectric
Low
16 hours
Pyroelectric
Half
15 hours
Pyroelectric
Full
13 hours
Figure 3-7 1919-R Rear Panel View
Note: The charger circuit of the 1919-R is designed to allow the charger to be plugged in for an
extended period without causing damage to the battery.
The approximate time between charges is given in Table 3-1 below for various configurations:
Table 3-1 Sensor Charging Times
Note: Battery charge will be depleted faster if a USB Flash Drive (Disk on Key) is left plugged into
the 1919-R meter.
The battery charge is indicated by the icon. The battery charge is shown approximately by each
segment of the icon, for example, when 2 segments are shown, the battery is ½ full. When the
battery is charging, the segments turn on in sequence. When the battery is low, the charger should
be plugged in. While the unit will charge even while on and even with the backlight on, it will
charge fastest if the charger is left in while the unit is off.
3.3.7 Analog Output
The 1919-R provides an analog voltage output via the 2.5mm mono jack socket on the rear panel
marked “AN OUT” (see Figure 3-7 above). The 1919-R is supplied with the mating adapter plug
that connects to this socket. The analog output is useful for driving chart recorders and other
analog devices. The voltage is proportional to the reading on the display and scaled such that full
scale equals 1, 2, 5, or 10 volts as selected during setup.
To set the analog output voltage:
1. Use the up (↑) /down (↓) Navigation keys to select Max An. Output and press the Enter key.
2. Select the relevant voltage setting (1V, 2V, 5V, 10V).
3. Press the Enter key to exit this selection screen and save the new setting.
The analog output is driven through an impedance of 100ohm. For best accuracy, is recommended
to limit the external load to 100K (or larger). A smaller load (down to 1K) is possible, but may
result in loss of accuracy.
1919-R User Manual 19
Page 21

Using the 1919-R Display Unit
For Thermopile and Photodiode sensors in power mode, the analog output is continually updated
15 times per second with the latest power measurement. For Thermopile sensors in single shot
energy mode, the analog output is held until the next pulse is measured. For Pyroelectric sensors,
the analog output is updated at up to 10 times per second with the latest pulse energy.
3.3.8 RS232 and USB Outputs
The 1919-R is equipped for either RS232 or USB communications with PC. The Unit is supplied with
a standard cable for USB communications and a custom cable for RS232 (see Figure 3-7 above).
You can change the RS232 baud rate with or without the sensor connected.
To set the RS232 baud rate for RS232 PC communication:
1. Disconnect the sensor and change the setting in the Instrument Settings screen.
Alternatively, when the sensor is connected to 1919-R, the RS232 Baud Rate can be configured
in the Instrument Settings screen, accessed by pressing the Menu button and selecting
Instrument.
2. Use the Navigation keys to select RS232 Baud Rate and press the Enter key to display the
options (115200, 57600, 38400, 19200).
3. Change the setting with the up (↑) /down (↓) Navigation keys and press the Enter key to
save.
3.4 1919-R Functions – Independent of Sensor Type
This section describes the functions available when no sensor is connected to the 1919-R.
Topics include:
Instrument Settings
Field Upgrade
Clock Settings
Zero Adjustments
Line Frequency
Language
Measurement Screens (Graph Types)
Color Scheme
3.4.1 Instrument Settings
When no sensor is connected, the 1919-R Instrument Settings screen is displayed. This gives you
the opportunity to change instrument settings including the RS232 baud rate, maximum analog
output, language, line frequency, color scheme, and date and time of the real time clock. The
Instrument Settings screen also shows the firmware version, serial number of the instrument, and
last calibration date. You can also re-zero the instrument. (Click the links to view more details.)
1919-R User Manual 20
Page 22
Using the 1919-R Display Unit
To configure the instrument settings:
1. Disconnect the sensor.
The Instrument Settings screen is displayed.
Figure 3-8 Instrument Settings Screen
2. Use the up (↑) /down (↓) Navigation keys to select the parameter to change and press the
Enter key to display the options, as described in Table 3-2 below. (These instrument settings
are also available when a sensor is connected, and you press the Menu button and select
Instrument.)
3. Change the setting with the up (↑) /down (↓) Navigation keys and press the Enter key to
save.
The 1919-R automatically saves the current settings for the next power up.
1919-R User Manual 21
Page 23

Using the 1919-R Display Unit
Parameter
Description
RS232 Baud
Set the baud rate for RS232 PC communication. Options
include:
115200
57600
38400
19200
Max An. Output
Select the voltage of analog output for full scale measurement.
Options include:
1V
2V
5V
10V
Language
Set desired instrument startup language. Options include:
English
Japanese
Russian
Chinese
Line Frequency
Set local line frequency to screen out electrical noise from the
mains supply (to prevent any impact on the measurements).
Options include:
50Hz
60 Hz
Color Scheme
Set to full color functionality or to color pair that best matches
the protective goggles in use. Options include:
Black/White
Blue/Black
Red/Black
Green/Black
Color 1
Color 2
Date and Time
Set the real-time clock of the instrument, in date/time format:
MM/DD/YYYY H:mm.
Table 3-2 1919-R Instrument Settings
1919-R User Manual 22
Page 24
Using the 1919-R Display Unit
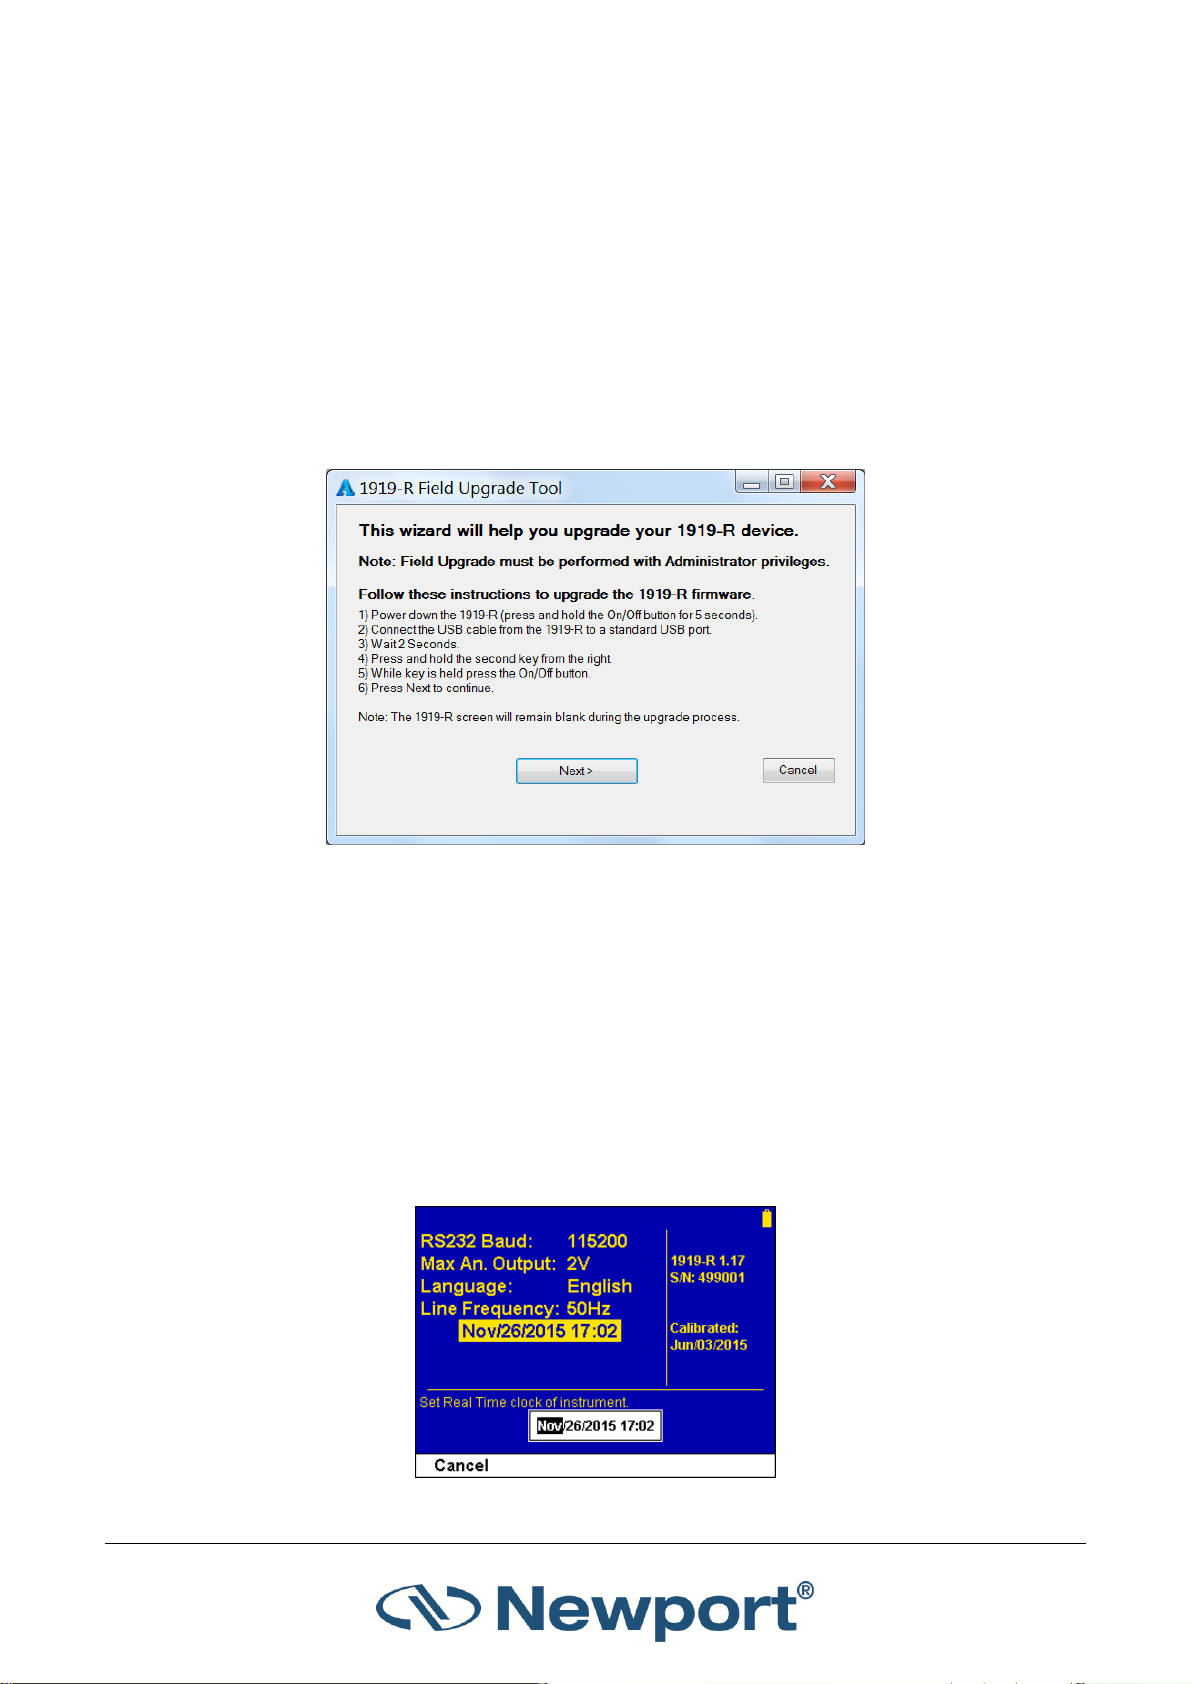
3.4.2 Field Upgrade – Updating the 1919-R Firmware
1919-R has all of the necessary infrastructure for field upgrading of the embedded software,
should the need arise. This is done through the USB OTG port that is found on the rear panel of
the instrument (see Figure 3-7 above).
To update the 1919-R firmware:
1. Download the latest 1919-R firmware upgrade package from the Newport website:
http://www.newport.com/Handheld-Power-and-Energy-Meters/6770602/1033/category.aspx
and copy it to your target directory.
2. Run the upgrade executable and follow the on-screen instructions.
3.4.3 Clock Settings
The 1919-R is equipped with a real time clock which shows the date and time. This clock also
allows the 1919-R to query the sensor attached and notify you if the sensor is due for calibration.
You can change the date and time.
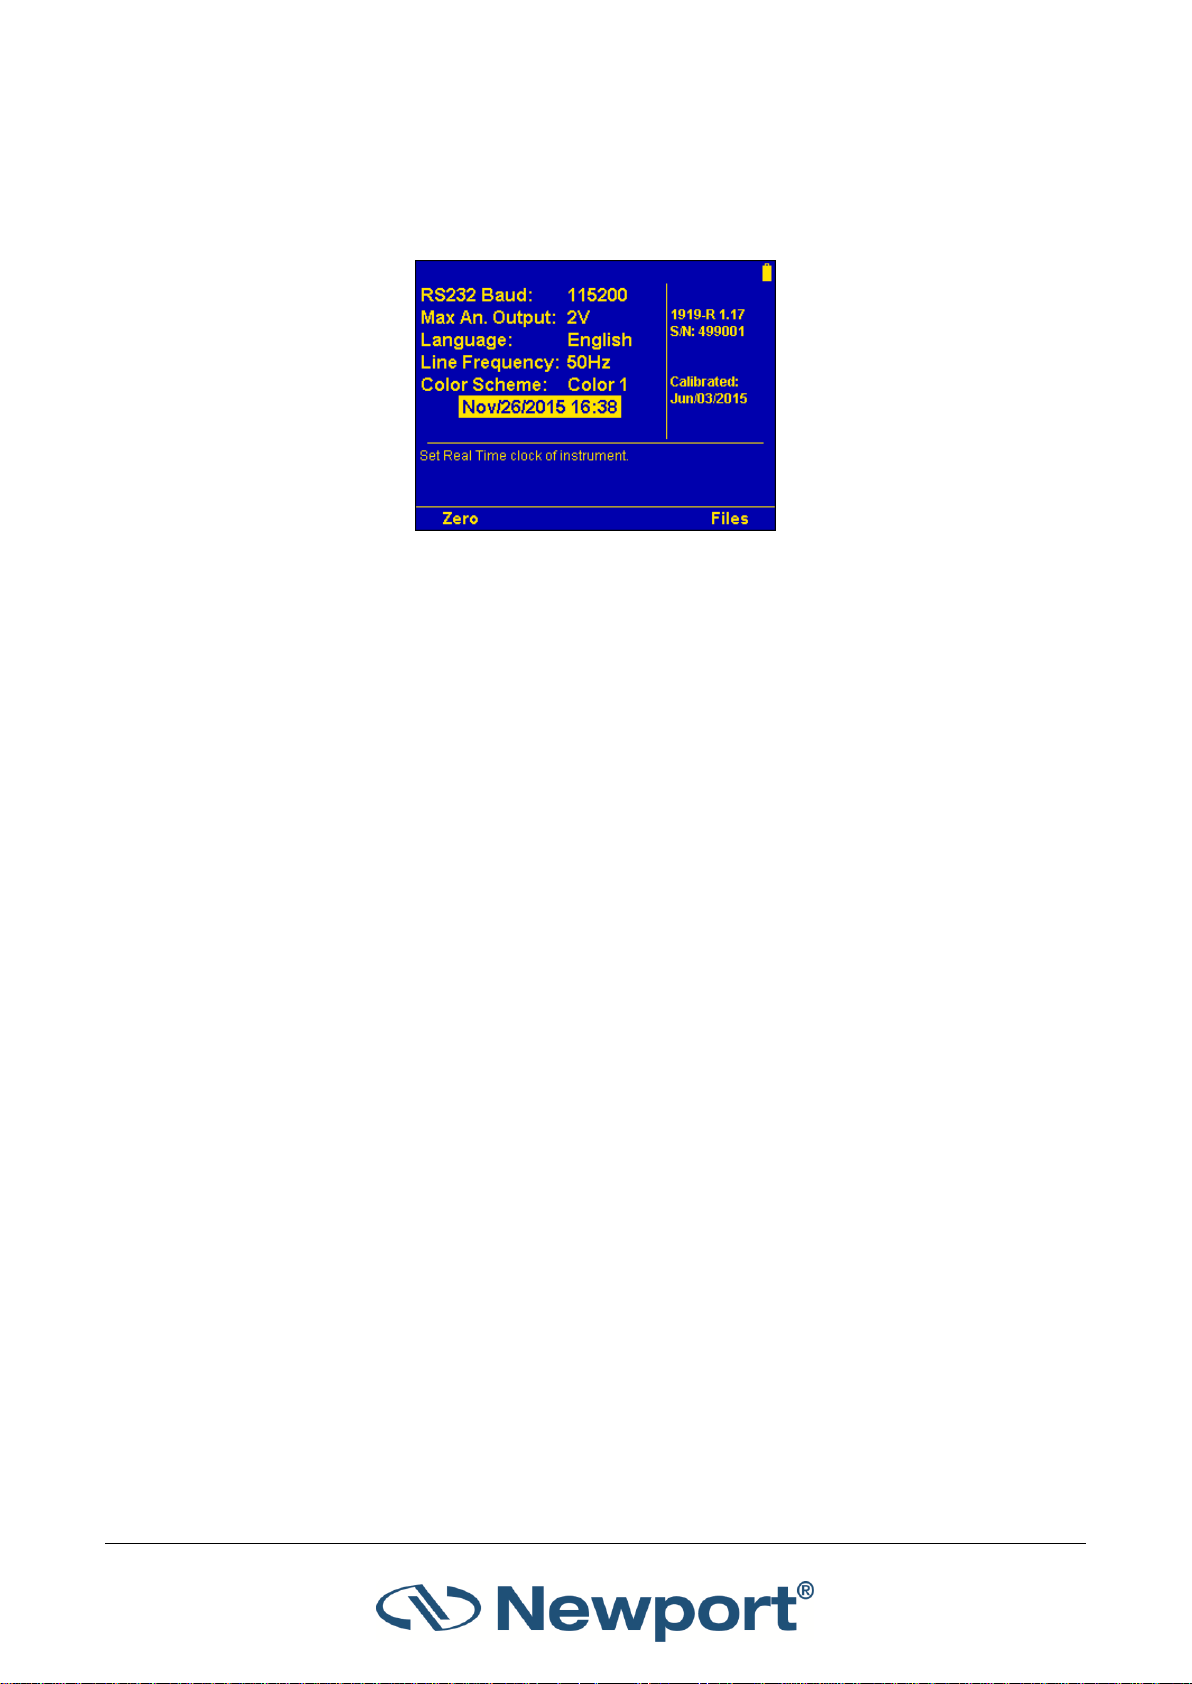
To set the real-time clock of the instrument:
1. Disconnect the sensor.
2. Use the up (↑) /down (↓) Navigation keys to select/highlight the Date and Time parameter
and press the Enter key.
Figure 3-9 1919-R Field Upgrade Wizard
Figure 3-10 Real Time Clock Settings
1919-R User Manual 23
Page 25

Using the 1919-R Display Unit
3. Use the left (←)/right (→) Navigation keys to scroll through and select/highlight each of the
Month, Day, Year, Hours, and Minutes fields (MM/DD/YYYY H:mm).
4. Change the setting with the up (↑) /down (↓) Navigation keys and press the Enter key to
save.
3.4.4 Zero Adjustments
In the 1919-R, all adjustments, including zeroing internal circuits, are done from the software. This
ensures simple and accurate realignment. It is recommended to re-zero the 1919-R every 2
months for best performance.
To zero the instrument:
1. Disconnect the sensor, turn the instrument off and then back on again, so the 1919-R can
identify that no sensor is connected. An "Initializing" message will be displayed.
2. Let the 1919-R run for at least 30 seconds before performing zero adjustment. Make sure the
sensor is in a quiet environment (without electrical noise) and not subject to pulsed radiation.
3. Press Zero and Start. Wait until “Zeroing completed successfully” appears.
4. Press Save to save the new zero values to the instrument.
5. Press Exit to return to the main screen.
For Thermopile Sensors only:
For best results with Thermopile sensors, it may be necessary to do the procedure once with the
sensor disconnected, then afterwards again with the sensor connected.
To zero the instrument against Thermopile sensors:
1. After completing steps 1-4 above, connect the sensor and make sure it is at room temperature
and well shielded from any stray thermal power. It is recommended to lay the sensor with the
absorber face down on the table.
2. Switch the instrument off then on again with the sensor connected.
3. Press Menu and select Instrument. Press Zero and Start. Wait until “Zeroing completed
successfully” appears.
4. Press Save to save the new zero values to the instrument.
5. Press Exit to exit this screen and return to the previous one.
For Pyroelectric and Photodiode Energy Sensors:
In addition to zeroing the meter, as described previously, it is important to zero the meter against
the sensor you are using the first time. After you have done zeroing, you do not have to do it again
when used with the same type of meter. If you have zeroed it against a different type of meter,
then a different value has been saved and therefore when used with this 1919-R, you should zero
it again.
1919-R User Manual 24
Page 26

Using the 1919-R Display Unit
3.4.5 Line Frequency
Setting Line Frequency correctly removes electrical noise that may impact the measurements.
To set line frequency:
1. In the main screen, use the Down (↓) Navigation key to select Line Frequency and press the
Enter key.
2. Set to 50Hz or 60Hz, depending on the electrical power grid of the area that you are in.
3. Press the Enter key to save the new setting.
3.4.6 Language
The 1919-R display can be configured to one of several languages (English, Japanese, Russian, or
Chinese).
To set the user interface language for the instrument:
1. In the main screen, use the Down (↓) Navigation key to select Language and press the Enter
key.
2. Set to English, Japanese, Russian, or Chinese.
3. Press the Enter key to save the new setting.
Note: If you mistakenly save the Japanese (or any foreign) language as the 1919-R startup
language, you can revert to English.
To revert to English (from a foreign language):
1. Disconnect the sensor from 1919-R.
2. Turn the 1919-R off and on again. The Instrument Settings screen appears (titled “head
disconnected” in Japanese).
3. Press the Down (↓) Navigation key 2 times to select/highlight the “Language” option.
4. Press the Enter key and select English (at the top of the language list).
Press the Enter key to save English as the startup language.
Note: The current settings are automatically saved for the next time 1919-R is turned on.
1919-R User Manual 25
Page 27
Using the 1919-R Display Unit
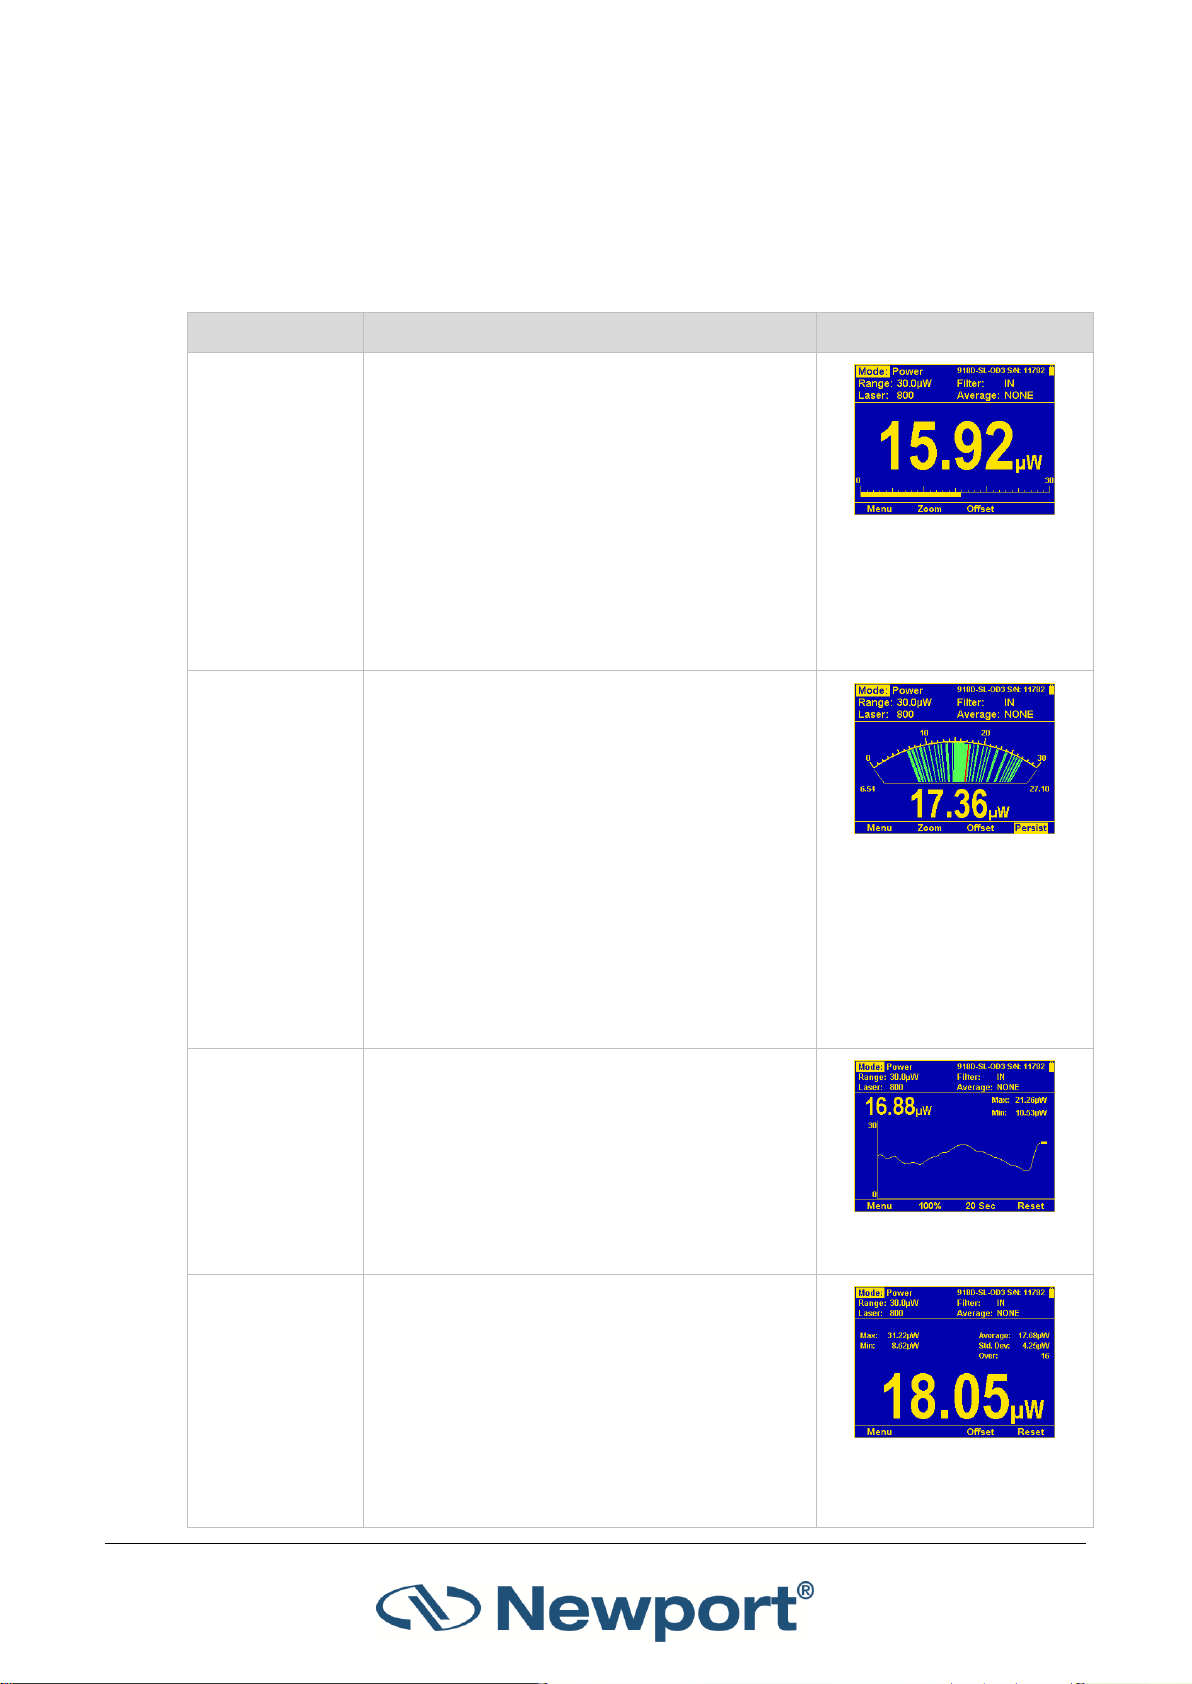
Graph Type
Description
Sample Figure
Bargraph
Ruler-like display in which the graph is filled
proportionally to the reading’s being a
percentage of full scale. Presents measurement
on a graduated scale. Available when measuring
laser power or energy.
Press the Zoom key to zoom in on a
smaller section of the range when
readings are fluctuating slightly.
If you notice that noise has impacted the
measurement, you can press the Offset
key to remove it from the measurement.
Figure 3-11 Bargraph
Needle
Simulates an analog display, similar to the style
of an analog voltmeter or a car’s speedometer.
Available when measuring power or energy.
Press the Zoom key to zoom in on a
smaller section of the range when
readings are fluctuating slightly.
If you notice that noise has impacted the
measurement, you can press the Offset
key to remove it from the measurement.
Press the Persist key to continue to
display previous readings as well as to
show the minimum and maximum
measurements.
Figure 3-12 Needle with
Persistence Enabled
Line
Graph laser output as a function of time. Useful
for technicians performing laser alignment that
want to see the results of their experimenting
graphically as well as to be shown the maximum
laser power attained.
Figure 3-13 Line Graph
Statistics
Large numeric readout with statistics displayed
as well.
Figure 3-14 Statistics
Display
3.4.7 Measurement Screens (Graph Types)
The 1919-R measurement screens are available in a variety of graphical displays, as described in
Table 3-3 below (click the links to view more details):
Table 3-3 1919-R Measurement Screens (Graph Types)
1919-R User Manual 26
Page 28

Using the 1919-R Display Unit
Graph Type
Description
Sample Figure
Pass/Fail
Test for measurements outside the user-defined
range of acceptable readings. Configurable
upper and lower limits. Useful for final
inspection testing, other aspects of Production
Q/A, or field inspection of equipment.
If the measurement is out of range, OVER or
UNDER will be displayed on the screen. If the
Color Scheme has been set to one of the full
color options, then this will be displayed in RED,
along with the reading itself. When within range,
the display will be normal, with the results
shown in GREEN, if one of the color options has
been selected.
Figure 3-15 Pass/Fail
Display
Exposure
Sum of the total energy of a series of
measurements over a given time period or
number of pulses (pulse count is relevant for
energy sensors only). This gives the total energy
"exposure" over that time period. For example,
if the laser is pulsing at 30 times/sec at 1mJ per
pulse and you measure the exposure over 20
seconds, then the total exposure is 30 x 1 x 20 =
600mJ.
Figure 3-16 Exposure
Measurement
Pulse Chart
Displays a graph of pulses as they occur. Displays
the readings as bars with lengths proportional to
the measurement. Not time based and is most
applicable when the data flow is not necessarily
periodic. Ideal when measuring low frequency
lasers.
Figure 3-17 Pulse Chart
Figure 3-18 Thermopile Sensor
(Monochrome)
Figure 3-19 Photodiode Sensor
(Monochrome)
Figure 3-20 Pyroelectric Sensor
(Full Color)
3.4.8 Color Scheme
You can configure the 1919-R for full color or monochrome functionality. Choose full color to make
use of special color enhancements. Choose one of the monochrome schemes for use with
protective goggles that filter out visible wavelengths.
Screen captures of the 1919-R in this manual are shown in the various color schemes. For example,
the following sensor displays:
1919-R User Manual 27
Page 29

Using the 1919-R Display Unit
Full Color
To set the color scheme of the main measurement displays to full color:
1. Connect the relevant sensor.
2. Press the Menu button, and use the Navigation keys to select Display and press the Enter key.
3. Use the Navigation keys to select Color Scheme and press the Enter key.
4. Select the relevant full color scheme option:
Color 1: Yellow text on dark blue background
Color 2: Black text on sky blue background
5. Press the Enter key to save the setting.
For both of these full color schemes, warnings will be displayed in red, selection windows (for
example, range, average, laser) will be pink, and modification windows will be white.
Figure 3-21 Sample Full Color Scheme Display with Pink “Range” Selections
Monochrome
Monochrome schemes are for use with lasers that demand protective glasses that filter out colors
in the visible part of the wavelength spectrum. These color schemes apply to all of the screens. All
color-enhanced features of the 1919-R will not be functional in any of the monochrome screens.
Follow the procedure above to set the color scheme and choose one of the following
monochrome schemes:
Black/White: Black text on white background
1919-R User Manual 28
Page 30

Using the 1919-R Display Unit
Blue/Black: Sky blue text on black background
Red/Black: Red text on black background
Green/Black: Green text on black background
See Figure 3-18, Figure 3-19, and Figure 3-20 above which show the sensors in monochrome and
full color displays.
3.5 1919-R Screen Layout
The 1919-R screen display is carefully designed to provide easy reading of the laser measurement,
quick access to configuration parameters, as well as the ability to set up for more advanced work.
Figure 3-22 below displays the layout of a typical 1919-R measurement screen.
Figure 3-22 1919-R Measurement Screen Layout
The 1919-R measurement screen comprises:
Configuration parameters for laser measurements (at the top), including “Mode” (on upper
left) for setting the measurement mode (for example, Power, Energy, and so on). The
configuration settings are sensor specific and saved in the sensor’s memory.
Measurement display area (in the middle), varies per the selected display type (for example,
large numeric readout with real-time statistics).
Sensor name and serial number (upper right).
Soft keys (on the bottom) for additional display functionality. (For example, press the Menu
key to access additional 1919-R functions including logging, pass/fail inspection, and math
processing. Press Offset to remove background noise from the measurement. Press Reset to
clear the statistics and start over.)
1919-R User Manual 29
Page 31

4 Points to Consider
Before using the 1919-R Laser Power/Energy Meter, consider the following points:
What is the specific laser you need to measure? Which sensor is suitable for this laser? Do you
need to measure laser power or laser energy?
What range and other measurement parameters do you need to set for your particular laser
(for example, laser setting, energy threshold, pulse length, and so on)?
What other instrument settings do you need to configure? Do you use the analog output and if
so, is it configured correctly for your needs?
How would you like to display the measurement data, as a bargraph, analog needle, or some
other format? Do you need real-time statistics or pass/fail tracking?
1919-R will help you implement the answers to these questions. The following chapters describe
the measurement functionality of the various sensor types, the graphical displays of the 1919-R
meter, as well as the data logging and math processing capabilities that make the 1919-R meter
the complete answer to your measurement needs.
1919-R User Manual 30
Page 32

Sensor Type
Liters per Minute at Full Power
Min Pressure Bar
US Gallons per Minute
919P-5KW-50
4.5
0.8
1.2
5 Thermopile Sensors
For a list of the available Thermopile Sensor models that can be used with 1919-R, see Sensor
Specifications.
Warning: Before using the Thermopile sensor for power or energy measurement, check that your
laser power, energy, and energy density do not exceed the sensor ratings. See Sensor
Specifications.
If the sensor is a water-cooled type, ensure that the cooling water is flowing at an adequate rate
(see Table 5-1 below). Also, note that the reflectance from the absorber could be as much as 10%
and with CO2 lasers, the reflected beam can be quite specular, so it is advisable to provide a beam
stop for the reflected beam with the highest power lasers.
Table 5-1 Minimum Flow Rates for Water-Cooled Sensors
When a radiant heat source, such as a laser, is directed at the absorber sensor aperture, a
temperature gradient is created across the Thermopile of the enclosed detector disc. This
generates a voltage proportional to the incident power.
The display unit amplifies this signal and indicates the power level received by the sensor. At the
same time, signal processing software causes the display unit to respond faster than the thermal
rise time of the detector disc, thus reducing the response time of the 1919-R. Energy of a single
pulse is measured on the 1919-R by digitally integrating the pulse power over time.
Most Thermopile sensors have somewhat different absorption at different wavelengths. To
compensate for this, each sensor has been calibrated by the laser at several wavelengths. When
you choose the correct laser setting, the correction factor for that wavelength is automatically
introduced. Note that the laser setting selected is displayed in the upper left section of the display.
The 1919-R can be set to various settings while operating. In addition, the 1919-R automatically
saves the settings for the next power up. This way the 1919-R will be in the desired configuration
when turned on the next time.
On power up, the 1919-R meter checks its own memory as well as the sensor’s to decide on the
measurement configuration. For example, if in the last session, the sensor was used to measure
power in the Bargraph screen in autoranging with a YAG laser and averaging for 10 seconds, this
will be the setup used the next time the system is powered up. These settings can all be easily
changed, as will be described fully in the following sections.
Topics include:
Operation of 1919-R with Thermopile Absorber Sensors
Measuring Laser Power with Thermopile Sensors
Measuring Laser Energy with Thermopile Sensors
Measuring Laser Pulsed Power with Thermopile Sensors
Supported Models
1919-R User Manual 31
Page 33

Thermopile Sensors
5.1 Operation of 1919-R with Thermopile Absorber Sensors
To use 1919-R with Thermopile sensors:
1. Connect the Thermopile sensor to the 1919-R meter: Insert the 15 pin D type connector of the
measuring sensor cable into the socket marked Sensor Input on the rear panel of the 1919-R
meter. 1919-R will reconfigure itself to work with the attached sensor.
2. All of the sensor’s measurement parameters are shown on the main screen. (These are also
available when you press the Menu button and select Sensor). Use the Navigation keys to
navigate to the parameter you want to change.
3. Use the up (↑) /down (↓) Navigation keys to select the parameter to change and press the
Enter key. Change the setting with the Navigation keys.
4. Press the Enter key to save the settings.
Note: The 1919-R automatically saves the current settings for the next power up.
Warning: Do not exceed maximum sensor limits for power, energy, power density, and energy
density as listed in Sensor Specifications. Otherwise, there is a risk of damaging the absorber.
5.2 Measuring Laser Power with Thermopile Sensors
When measuring laser power, center the laser beam carefully on the absorber surface and read
the power.
Power measurements can be displayed in Bargraph, Needle, Line, Statistics, or Pass/Fail graphical
formats (by pressing Menu > Display and choosing the Graph Type). Updating measurement
parameters is performed in the main measurement screen. A sample is shown in Figure 5-2 below
at the end of this procedure.
To measure laser power when using Thermopile sensors:
1. Set Mode to Power. The measuring mode is set to Power, and you can specify the expected
laser Range, Laser setting, and Average power period. (The power is measured 15 times per
second.)
Figure 5-1 Setting the Measurement Mode to Power
2. Set Range to AUTO or to one of the manual ranges, as follows:
AUTO: Select autoranging when the laser power is unknown or varies widely. In autorange,
you do not have to change scales. When the reading of the meter or bar is more than
100% of full scale, the range goes to the next higher one. The ranges are arranged in
factors of 1, 10, 100, and so on. When the reading falls below 9% of full scale, the range
changes to one range lower. This change only occurs after a few seconds delay. This
provides overlap (hysteresis) to keep the 1919-R from flipping back and forth when
reading close to the end of the scale.
Manual range: The correct manual range is the lowest one that is larger than the expected
maximum power of the laser. There are certain disadvantages to autorange, since it
changes scale even if you do not want it to do so. If you want to measure in the same
range all the time, it is better to use a manual range.
1919-R User Manual 32
Page 34

Thermopile Sensors
3. Set Laser to the appropriate laser setting.
4. Set Average to the period you wish to average power over or set to NONE to disable. This
feature is especially useful for lasers with unsteady output. (The Average can also be
configured in the Functions screen.)
Figure 5-2 below shows a sample bargraph showing laser power measurements.
Figure 5-2 Thermopile Power in Bargraph Display
Note: The soft key legend options such as Zoom, Offset, Persist, Reset vary per Graph Type.
5.3 Measuring Laser Energy with Thermopile Sensors
In addition to power, Thermopile sensors can be used to measure single shot energy as well,
where they integrate the power flowing through the disc over time and thus measure energy.
Since the typical time it takes for the disc to heat up and cool down is several seconds, these
Thermopile sensors can only measure one pulse every several seconds at most. Thus they are
suitable for what is called “single shot” measurement. Although the response time of the sensor
discs is slow, there is no limit to how short the pulses measured are since the measurement is of
the heat flowing through the disc as a result of the pulse.
Energy measurements can be displayed in Bargraph, Needle, Line, Statistics, or Pass/Fail graphical
formats (by pressing Menu > Display and choosing the Graph Type). Updating measurement
parameters is performed in the main measurement screen. A sample is shown in Figure 5-3 below
at the end of this procedure.
To measure single shot energy when using Thermopile sensors:
1. Set Mode to Energy. The measuring mode is set to Energy, and you can specify the expected
laser Range, Laser setting, and Threshold.
2. Set Range to the appropriate manual range. (In Energy mode, there is no autoranging.) The
correct range is the lowest one that is larger than the expected maximum pulse energy of the
laser.
3. Set Laser to the appropriate laser setting.
4. Set Threshold to change the energy threshold to LOW, MED, or HIGH to set the hardware
threshold in the sensor to screen out noise that would otherwise be seen as energy pulses.
(This screens out false triggers.) The factory setting of the energy threshold is Med for
medium. If the unit triggers on noise, set the threshold to High. If you are measuring small
energies and the unit does not trigger, set the threshold to Low.
If the 1919-R is used in a noisy environment or where there is a high level of background
thermal radiation, the instrument may trigger spuriously on the noise or background radiation.
1919-R User Manual 33
Page 35

Thermopile Sensors
It would then fail to measure the intended pulse. Since there is always some degree of noise
or background radiation, the instrument is designed not to respond to pulses below some
preset minimum size. This "Minimum Energy Threshold" is typically set to 0.3% of full scale of
the selected range. If this level is found to be too sensitive for the user's particular
environment, it may be altered by the user. The threshold should not, however, be raised
higher than necessary. This will cause a degradation in the accuracy of energy measurements
of pulses below about 4 times the threshold level.
5. When the 1919-R screen flashes READY on and off, fire the laser. The display will go blank
while the energy is being integrated. After about 2-4 seconds (depending on the sensor), the
correct energy will be displayed.
6. Return to Step 1 for the next measurement.
Figure 5-3 below shows a sample analog Needle display showing laser energy measurement
data with options for Zoom, Offset, and Persistence. (Click the above links for more details.)
Figure 5-3 Thermopile Energy in Needle Display
Note: The soft key legend options such as Zoom, Offset, Persist, Reset vary per Graph Type.
5.3.1 Measuring Pulses of Very Low Energy
When it is necessary to measure pulses of very low energy, i.e., less than 0.5% of the maximum
range of the instrument, the following two alternative methods allow greater accuracy to be
obtained.
A continuous train of pulses may be fired, and the average power measured using Power
mode. The energy per pulse can be calculated by:
Average Energy per pulse = Average power / Pulse Repetition Rate
A train of a known number of pulses may be fired, and the total energy measured in Energy
mode. This train should not exceed 5 seconds duration. The energy per pulse can be calculated
by:
Average Energy per pulse = Total Energy / Number of Pulses
In both of the above methods, the pulse repetition rate must exceed 3Hz. Higher rates will
generally give improved accuracy, but care should be taken not to exceed maximum power
ratings.
1919-R User Manual 34
Page 36

Thermopile Sensors
5.3.2 Measuring Energy of Rapidly Repeating Pulses
With a typical Thermopile sensor, 1919-R will only measure individual pulses every 5 seconds or
so. You can also calculate the average energy of rapidly repeating pulses by measuring average
power on the power setting and using the formula:
Average Energy per Pulse = Average Power / Pulse Repetition Rate
For rapidly repeating pulses, you can use one of the Newport Pyroelectric sensors, as long as the
pulse energies do not exceed the ratings of the Pyroelectric absorbers. The Pyroelectric sensors
are compatible with 1919-R and just have to be plugged in to be used.
5.4 Measuring Laser Pulsed Power with Thermopile Sensors
Thermopile Energy Sensor models are capable of measuring “Pulsed Power” in order to display
instantaneous power of a laser pulse. Power can be calculated from energy if you know the length
of the pulse.
Note: Accuracy of measurement will be dependent on your setting the pulse width correctly.
To measure laser pulsed power when using Thermopile sensors:
1. Set Mode to Pulsed Power. The measuring mode is set to Pulsed Power, and you can specify
the expected energy Range, Laser setting, and Threshold.
2. Set Range to the appropriate manual range. (In Energy mode, there is no autoranging.) The
correct range is the lowest one that is larger than the expected maximum pulse energy of the
laser.
3. Set Laser to the appropriate laser setting.
4. Set Pulse Length to the correct pulse length. Using the up/down Navigation keys to change
each number and the right/left keys to move to the next number, key in the pulse length you
want. (The range is 0.1 to 10 seconds in increments of 0.1. The default is 1.0 seconds.) When
finished, press the Enter key.
5. Set Threshold to change the energy threshold to LOW, MED, or HIGH to set the hardware
threshold in the sensor to screen out noise that would otherwise be seen as energy pulses.
(This screens out false triggers.) The factory setting of the energy threshold is Med for
medium. If the unit triggers on noise, set the threshold to High. If you are measuring small
energies and the unit does not trigger, set the threshold to Low.
If the 1919-R is used in a noisy environment or where there is a high level of background
thermal radiation, the instrument may trigger spuriously on the noise or background radiation.
It would then fail to measure the intended pulse. Since there is always some degree of noise
or background radiation, the instrument is designed not to respond to pulses below some
preset minimum size. This "Minimum Energy Threshold" is typically set to 0.3% of full scale of
the selected range. If this level is found to be too sensitive for the user's particular
environment, it may be altered by the user. The threshold should not, however, be raised
higher than necessary. This will cause a degradation in the accuracy of energy measurements
of pulses below about 4 times the threshold level.
1919-R User Manual 35
Page 37

Thermopile Sensors
6. When the 1919-R screen flashes READY on and off, fire the laser. The display will go blank
while the energy is being integrated. After about 2-4 seconds (depending on the sensor), the
correct energy will be displayed.
7. Return to Step 1 for the next measurement.
The measurement is displayed in watts (energy/pulse length).
Figure 5-4 Thermopile Pulsed Power
Note: It is possible to record log files of Pulsed Power measurements. The format type is the same
type that is recognized by StarLab.
5.4.1 Pulsed Power Limitations
Screen Limitations
The measurement mode cannot be Pulsed Power when in the Calibration screens. Calibration
screens will force the user to select between Power and Energy.
Function Limitations
Functions are in terms of Watts (even though the ranges in use are energy ranges).
When measuring pulsed power, the following functions are enabled/disabled:
All functions except Average are enabled (because we are really measuring single-shot
energy).
Average is grayed out (disabled).
Offset and Reference are cleared.
Scale Factor and Density are accessible (enabled).
5.5 Supported Models
The 843-R Power Meter is compatible with Newport’s new line of 919P Thermopile Sensors. Older
models of thermopile sensors are not compatible.
1919-R User Manual 36
Page 38

6 Photodiode Sensors
For a list of the available Photodiode Sensor models, see Sensor Specifications.
Warning: Before using the Photodiode sensor for power measurement, check that your laser
power, energy, and energy density do not exceed the sensor ratings. See Sensor Specifications.
When a photon source, such as laser, is directed at one of the 918D, 818DB, or 819C/D integrating
sphere series Photodiode detectors, a current is created proportional to the light intensity and
dependent on the wavelength.
The 1919-R display unit amplifies this signal and indicates the power level received by the sensor.
Due to the superior circuitry of the 1919-R, the noise level is very low. As such, Newport sensors
with the 1919-R display have a large dynamic range from nanowatts to hundreds of milliwatts.
Newport’s 818 and 918D series Photodiode sensors come with attenuation filters, while the 818xx-L-FC/DB series low-cost fiber optic detectors do not. Some of the 819C/D series integrating
sphere detectors utilize the 918D series detector, which has an integrated filter. Refer to their user
manuals and websites for the specifications. A general guideline is to use the filter when the
power level of the source is more than a few mW to avoid sensor saturation. When saturated, the
legend "OVER" will appear on the screen.
Newport Photodiode sensors have built-in wavelength correction curves for measurements either
with the removable filter installed (filter-in) or removed (filter-out). These curves are stored in the
sensor EEROM. The correction curves, with a resolution of 1nm, ensure that the power reading is
correct at all laser settings.
To simplify changing from one laser setting to another, the user can program up to 6 different
wavelengths to be available from the screen menu. Use the procedure below to set the sensor to
your laser settings.
Topics include:
Operation of 1919-R with Photodiode Sensors
Measuring Laser Power with Photodiode Sensors
Averaging and Measuring Very Low Power Measurements
Measuring Total Exposure
1919-R User Manual 37
Page 39

Photodiode Sensors
6.1 Operation of 1919-R with Photodiode Sensors
To use 1919-R with Photodiode sensors:
1. Connect the Photodiode sensor to the 1919-R meter: Insert the 15 pin D type connector of the
measuring sensor cable into the socket marked Sensor Input on the rear panel of the 1919-R
meter. 1919-R will reconfigure itself to work with the attached sensor.
2. All of the sensor’s measurement parameters are shown on the main screen. (These are also
available when you press the Menu button and select Sensor). Use the Navigation keys to
navigate to the parameter you want to change.
3. Use the up (↑) /down (↓) Navigation keys to select the parameter to change and press the
Enter key. Change the setting with the Navigation keys.
4. Press the Enter key to save the settings.
Note: The 1919-R automatically saves the current settings for the next power up.
Warning: Do not exceed maximum sensor limits for power, energy, power density, and energy
density as listed in Sensor Specifications. Otherwise, there is a risk of damaging the absorber.
6.2 Measuring Laser Power with Photodiode Sensors
The following procedure describes how to use Photodiode Sensors to measure laser power. (The
power is measured 15 times per second.) You can specify the expected laser Range, Laser setting,
whether the Filter is IN or OUT as physically configured on the sensor, and the Average power
period.
Photodiode sensors have a different sensitivity at different wavelengths. Moreover, the filters
used in the sensor have a different transmission at different wavelengths. In order to compensate,
each sensor has a built in calibration curve (with 1nm resolution) over the entire measurement
range.
When you choose the correct laser setting, the correction factor for that wavelength is
automatically introduced. Note that the laser setting presently corrected for is displayed in the
upper left portion of the display.
Photodiode sensors can measure a maximum power of about 10mW, depending on the model.
Many models are equipped with filters that extend the range by 10x, 100x, or 1000x, depending
on the filter type in use. The 918D series photodetectors have a built-in optical attenuator, which
can be manually switched into or out of the optical path using a thumb-wheel located on top of
the detector housing. Attenuator ‘ON’ and ‘OFF’ markings indicate the turning direction. A built-in
sensor automatically detects the attenuator position, signaling the instrument to use the
appropriate responsivity for the detector/attenuator combination.
Depending on what powers you wish to measure, choose whether to work with the removable
filter installed or not. For this purpose, the 1919-R has a "filter" setting and uses the proper
correction curve depending on whether the filter is installed.
To set measurement parameters for laser power when using Photodiode sensors:
1. The measuring mode is Power.
2. Set Range to dBm, AUTO, or to one of the manual ranges, as follows:
dBm: Logarithmic scale, where dBm units are defined as: 10 x log (reading in mW). At 1mW
the reading will be 0 dBm, at 100mW it will be 20 dBm, and so on.
1919-R User Manual 38
Page 40

Photodiode Sensors
AUTO: Select autoranging when the laser power is unknown or varies widely. In autorange,
you do not have to change scales. (The reading is displayed in watts.) This change only
occurs after a few seconds delay. This provides overlap (hysteresis) to keep the 1919-R
from flipping back and forth when reading close to the end of the scale.
Manual range: The correct manual range is the lowest one that is larger than the expected
maximum power of the laser. There are certain disadvantages to autorange, since it
changes scale even if you do not want it to do so. If you want to measure in the same
range all the time, it is better to use a manual range.
3. Set Laser to the appropriate laser setting. If the wavelength you want is not among the
wavelengths listed, select one and press the arrow key that is next to it to open the Modify
screen. Using the up/down Navigation keys to change each number and the right/left keys to
move to the next number, key in the wavelength you want. When finished, press the Enter
key.
Figure 6-1 Modifying the Laser Setting – Photodiode Sensor
4. Set the removable Filter setting to IN to measure higher power or to OUT for more accuracy
and a wider wavelength range—as physically configured on the sensor. Make sure to
physically insert/remove the Filter before continuing measurements. For sensors with built-in
filter state detection, only the present state of the filter will be shown to the user. It will be
updated in the event that the filter state is physically changed, thereby causing the sensor to
report the new filter state to the meter.
Warning: If the sensor is used in the "Filter IN" setting and the filter is not installed, or vice
versa, the readings will be completely incorrect. If the power of your laser exceeds the
maximum for filter in, you can purchase a Thermopile or integrating sphere sensor for that
wavelength. Consult your Newport agent for details.
5. Set Average to the period you wish to average power over or set to NONE to disable. This
feature is especially useful for lasers with unsteady output. (The Average can also be
configured in the Functions screen.)
Note: The Average function does not work with autorange or dBm scales.
1919-R User Manual 39
Page 41

Photodiode Sensors
Figure 6-2 below shows a sample Bargraph showing laser power measurements, including
range, wavelength, filter, and average values. In this display, you can press Zoom and Offset.
(Click the above links for more details.)
Figure 6-2 Photodiode Bargraph
6.3 Averaging and Measuring Very Low Power Measurements
If the laser power is fluctuating, the 1919-R can display the average power readings with averaging
periods varying from 1s to 1 hour. When measuring very low powers, such as picowatt
measurements, there will be a rather large zero offset coming from the detector as well as a
considerable noise fluctuation. Nevertheless, you can measure these low values by using the
average function and pressing offset to eliminate the detector zero offset.
To measure very low powers:
1. Press Menu and select Functions. Choose the appropriate value you want to Average over,
save it, and then Exit.
2. Block the power source you wish to measure, wait for a few measurement periods and press
Offset to subtract the zero offset.
3. Unblock the power source and measure.
For a detailed description of the average function, see Average.
Note: The Average function does not work with autorange or dBm scales.
6.4 Measuring Total Exposure
For Photodiode sensors, measuring total exposure is based on summing Photodiode power
measurements over time.
In Exposure mode, 1919-R measures 15 times per second, updating the exposure displayed on the
screen 5 times per second.
1919-R User Manual 40
Page 42

Photodiode Sensors
To measure total exposure:
1. Set Mode to Exposure.
2. Set measurement parameters as described above.
3. Set Stop Mode to Manual or Timeout period.
Accumulated laser power exposure will be displayed on the screen, as well as elapsed time.
4. To stop exposure measurement before the chosen period, press Stop.
5. To reset the reading to zero before another reading, press Reset.
6. To return to the main power measurement screen, set Mode to Power.
Figure 6-3 Photodiode Exposure Measurement
6.4.1 Exposure Limitations
Screen Limitations
The measurement mode cannot be Exposure when in the Calibration screens. Calibration screens
will force the user into Power measurement.
Function Limitations
When measuring exposure, the following functions are enabled/disabled:
Average, Offset, Reference, and Density are grayed out (disabled).
Scale Factor is accessible (enabled).
It is also not be possible to record log files of Exposure measurements.
1919-R User Manual 41
Page 43

7 Pyroelectric and Photodiode Energy Sensors
1919-R supports the new 919E series of sensors. Older energy sensors are not compatible.
For a list of all the available Pyroelectric and Photodiode Energy Sensor models that can be used
with 1919-R, see Sensor Specifications.
Warning: Before using the energy sensor for power or energy measurement, check that your laser
power, energy, and energy density do not exceed the sensor ratings. See Sensor Specifications.
Topics include:
Pyroelectric Sensors – Method of Operation
Photodiode Energy Sensors – Method of Operation
Measuring Pulses of High Energy Density
Operation of 1919-R with Pyroelectric and Photodiode Energy Sensors
7.1 Pyroelectric Sensors – Method of Operation
When a pulsed heat source, such as a laser, is directed at the detector sensor, a temperature
gradient is created across the Pyroelectric crystal mounted in the sensor. An electric charge is
produced which is proportional to the energy absorbed. The detector sensor has sophisticated
circuitry unique to Newport (patented) that determines the baseline before the pulse is received,
measures the voltage after a predetermined interval, amplifies it and holds it for a predetermined
time.
Due to this innovative circuitry, Newport Pyroelectric sensors can measure very long pulses as well
as short ones. They can measure low energies as well as high. They can also measure at higher
repetition rates than was possible before.
The 1919-R meter amplifies this signal and indicates the energy received by the sensor as well as
the frequency at which the laser is pulsing. Using the energy and frequency information, 1919-R is
also able to display average power.
7.2 Photodiode Energy Sensors – Method of Operation
The 919E-20U-10-20K operates in a similar fashion to the Pyroelectric-based sensors except it has
a Photodiode detector instead of Pyroelectric. Because of its great sensitivity, it can operate down
to about 1nJ of energy. It has complete wavelength correction over its entire measurement range
of 200 - 1100nm.
1919-R User Manual 42
Page 44

Pyroelectric and Photodiode Energy Sensors
7.3 Measuring Pulses of High Energy Density
Due to the nature of their construction, Pyroelectric sensors are restricted in the energy density
they can withstand, particularly for short pulses on the order of nanoseconds. If the energy density
of your laser exceeds the rating of the Pyroelectric absorber, there are several options available:
You can enlarge your laser beam using a negative lens until the energy density is below
damage threshold. You should test this using the test slide that is supplied with the sensor.
You can use a beam splitter, splitting off typically 8 -10% of the light. If you use this method,
note that there may be polarization effects.
Newport has sensors specifically designed for high energy density pulses. Some of these
sensors can measure energy densities up to several Joules/cm². Contact your Newport dealer
for details.
7.4 Operation of 1919-R with Pyroelectric and Photodiode
Energy Sensors
On power up, the 1919-R meter checks its own memory as well as the sensor’s to decide on the
measurement configuration. For example, if in the last session, the sensor was used to measure
energy in the Bargraph screen in the 200uJ range with a 1064 laser with no averaging, this will be
the setup used the next time the system is powered up.
These settings can all be easily changed, as described in the following procedures.
To use 1919-R with Pyroelectric and Photodiode energy sensors:
1. Connect the Pyroelectric (or Photodiode) energy sensor to the 1919-R meter: Insert the 15 pin
D type connector of the measuring sensor cable into the socket marked Sensor Input on the
rear panel of the 1919-R meter. 1919-R will reconfigure itself to work with the attached
sensor.
2. All of the sensor’s measurement parameters are shown on the main screen. (These are also
available when you press the Menu button and select Sensor). Use the Navigation keys to
navigate to the parameter you want to change.
3. Use the up (↑) /down (↓) Navigation keys to select the parameter to change and press the
Enter key. Change the setting with the Navigation keys.
4. Press the Enter key to save the settings.
Note: The 1919-R automatically saves the current settings for the next power up.
The following procedures explain how to configure measurements for laser power or energy:
Zeroing the Energy Sensor Against the 1919-R Meter
Setting Measurement Parameters When Using Energy Sensors
Energy, Average Power, or Exposure Measurement
Measuring Laser Energy
Measuring Average Power
Measuring Total Energy Exposure
1919-R User Manual 43
Page 45

Pyroelectric and Photodiode Energy Sensors
Warning: Do not exceed maximum sensor limits for power, energy, power density, and energy
density as listed in Sensor Specifications. Otherwise, there is a risk of damaging the absorber.
7.4.1 Zeroing the Energy Sensor Against the 1919-R Meter
For most accurate calibration, you should zero the Pyroelectric energy sensor against the 1919-R it
is being used with. This is important since there is a slight variation of Pyroelectric reading from
meter to meter. After this is done, the sensor is “conditioned” to work with the particular 1919-R
the zeroing was done against. It is not necessary to do this procedure again unless the 1919-R is
used with a different sensor. If the procedure is not done, errors of 2% or so can occur.
To zero the instrument against the energy sensor:
1. Make sure the sensor is in a quiet environment and not subject to pulsed radiation.
2. Press Menu and select Instrument.
3. Press Zero and Start. Wait until “Zeroing completed successfully” appears.
Figure 7-1 Pyroelectric Zeroing
4. Press Exit to return to previous screen.
After you have done zeroing, you do not have to do it again when used with the same type of
meter. If you have zeroed it against a different type of meter, then a different value has been
saved and when used with a 1919-R again, you should zero it again.
7.4.2 Setting Measurement Parameters When Using Energy Sensors
To set measurement parameters when using energy sensors:
1. Set Range to the correct manual range that is the lowest one that is larger than the expected
maximum pulse energy of the laser.
Warning: While measuring pulsing lasers, erroneous energy readings will result if the energy
range is not set up correctly.
1919-R User Manual 44
Page 46

Pyroelectric and Photodiode Energy Sensors
2. Set Laser to the appropriate laser setting. If this sensor is a metallic type and if the wavelength
you want is not among the wavelengths listed, select one and press Modify. Using the
up/down keys to change each number and the right/left keys to move to the next number, key
in the wavelength you want. When finished, press the Enter key.
Figure 7-2 Modifying the Laser Setting – Pyroelectric Sensor
3. Set Pulse Length to the shortest time that is longer than the expected pulse length. Select a
shorter pulse length setting for higher frequency lasers. Set a longer pulse length setting for
higher energy lasers.
Note: Some sensors have only the one pulse length setting for all pulse lengths. In that case
N/A appears.
Warning: Incorrect readings will result if pulse length is not set up correctly.
4. Set Diffuser to IN or OUT as physically set on the sensor (relevant for sensors with the Diffuser
option). Make sure to physically insert/remove the Diffuser before continuing measurements.
5. Set Threshold as necessary to screen out false triggers due to noise. Set the hardware
threshold in the sensor to screen out noise that would otherwise be seen as energy pulses. If
the sensor triggers from ambient vibration or noise without a laser signal, raise the Threshold
level as follows: Use the up/down buttons, raise the threshold until the false triggering stops.
If the sensor does not read the pulses at all on the lowest range, try to lower the threshold to
minimum.
6. Set Average to the period you wish to average power over, or set to NONE to disable.
Figure 7-3 Pyroelectric Energy Needle with Average Selection Open
1919-R User Manual 45
Page 47

Pyroelectric and Photodiode Energy Sensors
7.4.3 Energy, Average Power, or Exposure Measurement
With the Pyroelectric sensor, you have been supplied a test slide with the same coating as on your
Pyroelectric detector. You can also obtain this slide from your dealer. You should use this slide to
test the damage threshold with your laser pulses. If the slide is damaged, then either enlarge your
beam, or lower the laser energy until damage is no longer seen.
The Pyroelectric sensor is capable of measuring pulses up to very high repetition rates on the
order of kilohertz or higher. The 1919-R meter will sample pulses at up to 25,000 pulses depending
on the sensor. However, the display can only display at rates up to 10Hz.
Note: High-sensitivity Pyroelectric sensors (919E-200U-8-25K, 919E-0.1-12-25K) are very sensitive
to vibration, and therefore might read a false trigger when operating in an acoustically non-stable
environment. Set the threshold to a high enough value that false triggering does not occur.
7.4.4 Measuring Laser Energy
To measure Pyroelectric energies properly, it is important that the sensor is not grounded to the
optical bench. Make sure that the sensor is isolated electrically from the ground. The PE sensor
has been supplied with an insulating mounting post for this purpose.
To measure laser energy:
1. Set Mode to Energy.
2. Set measurement parameters as described above.
“Energy” is displayed on the screen as well as the laser’s frequency, and the units are mJ, µJ,
and so on.
Figure 7-4 Pyroelectric Energy Needle with Persistence
1919-R User Manual 46
Page 48

Pyroelectric and Photodiode Energy Sensors
7.4.5 Measuring Average Power
Although the Pyroelectric sensors are designed for energy measurement, they can be used to
measure average power as well using the formula:
Average Power = Average Energy X Frequency
where the energy and frequency of the pulses have been measured by 1919-R.
Note: 1919-R use when measuring power is the same as when measuring energy and has been
described in full in section Operation of 1919-R with Pyroelectric and Photodiode Energy Sensors.
To measure average power:
1. Set Mode to Power.
2. Set measurement parameters as described above.
Average power will be displayed as a function of “Energy x Frequency” on the screen as well as
the laser’s frequency.
Figure 7-5 Pyroelectric Power Bargraph
7.4.6 Measuring Total Energy Exposure
For Pyroelectric sensors, measuring total energy exposure is implemented as the summing of
energy measurements of laser pulses until a predetermined stop condition is reached.
1919-R User Manual 47
Page 49

Pyroelectric and Photodiode Energy Sensors
To measure total energy exposure:
1. Set Mode to Exposure.
2. Set measurement parameters as described above.
3. Set Stop Mode to Manual, Timeout period, or Pulse count.
Accumulated laser energy exposure will be displayed on the screen, as well as elapsed time
and number of pulses measured.
4. To stop exposure measurement before the chosen period, press Stop.
5. To reset the reading to zero before another reading, press Reset.
6. To return to the main energy measurement screen, set Mode to Energy.
Figure 7-6 Pyroelectric Exposure Measurement
1919-R User Manual 48
Page 50

8 Graphical Displays
The 1919-R has a robust variety of customizable graphical displays for measuring, presenting, and
reading data.
The 1919-R can operate in the standard power/energy measurement screen or needle type display
or can display the information in specialized forms: an attenuation screen, a tune/exposure
screen, a power/energy density screen, a screen normalized to some value or a screen with limits.
You can choose to show or hide measurement parameters, and you can customize the color
scheme and bargraph style.
This section describes the graphical displays available for presenting 1919-R measurement data,
how to use and customize them, and related functionality. (For a quick introduction, see
Table 3-3.)
Topics include:
Display Settings
Graph Types:
Power and Energy mode graphs include:
Bargraph
Analog Needle
Line Graph
Statistics
Pass/Fail
Pulse Chart
Exposure mode graphs include:
Exposure
Other Display Settings:
Show/Hide Settings
Color Scheme
1919-R User Manual 49
Page 51

Graphical Displays
Parameter
Description
Graph Type
Bargraph: Ruler-like display that presents measurements on a graduated
scale.
Needle: Simulated analog needle.
Line: Graphs laser output as a function of time.
Statistics: Large, numeric display with statistics.
Pass/Fail: Tests for measurements outside the user-defined range of
acceptable readings.
Exposure: Sum of the total energy of a series of measurements. For
sensors in exposure mode only.
Pulse Chart: Displays readings as bars with lengths proportional to the
measurement. Not time based.
Show Settings
Set to Yes to show the measurement parameters while measuring. Set to No to
hide them.
Color Scheme
Set to full color functionality or to the monochrome color pair that best
matches the protective goggles in use.
Bargraph Style,
Levels
For enhanced functionality when in full color mode. When set to Changing, the
color of the bargraph and the digital readout changes per the Level percentage
settings for LOW, MED, HIGH.
8.1 Display Settings
Figure 8-1 below shows the Display settings screen, where you can set the display of the main
1919-R measurement screen to present the data in a variety of graphical formats when connected
to a particular sensor. You can access this screen by pressing Menu > Display.
Figure 8-1 Display Settings
Table 8-1 below describes the settings (click the links to view more details).
Table 8-1 Display Settings
1919-R User Manual 50
Page 52

Graphical Displays
8.2 Bargraph
The Bargraph is a ruler-like display in which the graph is filled proportionally to the reading’s being
a percentage of full scale. It presents measurements on a graduated scale, and is available when
measuring laser power or energy.
Figure 8-2 Pyroelectric Power Bargraph
The Bargraph display comprises the following components:
Parameter settings, the sensor’s name and serial number, and battery status indicator at the
top of the screen.
Large numeric display shown prominently in the middle of the screen.
Bargraph displayed close to the bottom.
Soft key legends at the bottom of the screen.
To present measurements on a graduated scale (bargraph):
1. In Power or Energy mode, press Menu and enter Display.
2. Go to Graph Type and select Bargraph. Return to the main display screen.
3. To expand the bargraph scale ±5x of the present reading, press the Zoom key. Press Zoom
again to return the bargraph to full scale. For more details, see Zoom.
4. To subtract the background and set the current reading to zero, press the Offset key. Press
Offset again to cancel. For more details, see Offset. See also Measuring Loss Using the dB
Offset Function.
8.2.1 Modes
The Modes that a Bargraph can be used with include:
Power
Energy
Pulsed Power
1919-R User Manual 51
Page 53

Figure 8-3 Pyroelectric Power Bargraph
Figure 8-4 Pyroelectric Power Bargraph with Zoom
8.2.2 Zoom
The Zoom function can be useful for laser power tuning and peaking. Small fluctuations in energy
are more easily seen in this mode.
Press the Zoom soft key to focus the Bargraph on the present reading. The Bargraph will show 20%
of the full scale centered on the present reading. Thus, if the full scale of the Bargraph is 20 Joules,
and your reading is 15 Joules, pressing Zoom will make the Bargraph scale range between
approximately 13 and 17 Joules.
The legend is highlighted when Zoom is active (see Figure 8-4 on the right below). Note that the
fiducial marks of the Bargraph are further apart, indicating that Zoom is engaged.
Press the Zoom key again to return to the unexpanded Bargraph display.
8.2.3 Offset
The Offset function can be used to subtract the background and set the current reading to zero.
For Thermopile and Photodiode Sensors Measuring Power
Sometimes the measurement environment can introduce errors into the measurement. For
example, stray light may affect measurements made with a Photodiode sensor. Ambient thermal
background can affect power measurements with Thermopile sensors. The Offset function can be
used to remove this “background signal” to ensure a more accurate measurement. For example,
the 1919-R display reads 0.1mW when the laser is blocked and 20.5 mW with laser power applied.
In this case, the true power is 20.5 - 0.1 = 20.4 mW. To subtract the background, press Offset while
the laser is blocked. The 1919-R will now read zero (0.0), and the 0.1 mW background will be
subtracted from all subsequent readings. The laser power reading will thus be 20.4 mW.
1919-R User Manual 52
Page 54

Graphical Displays
Figure 8-5 Photodiode Bargraph
Figure 8-6 Photodiode Bargraph with Offset
For Photodiode Sensors Measuring Exposure
Background noise that affects power measurement will affect exposure as well. To overcome this,
perform the following steps:
1. Enter Power mode.
2. Block the laser/light source under measurement and press the Offset key. This will activate the
offset feature. When active, the Offset key is reverse highlighted and the offset that is being
subtracted is shown in the upper right part of the screen.
3. Set the Mode to Exposure.
4. The Offset stored in the Power screen will be subtracted in order to provide accurate Exposure
measurements.
The legend is highlighted when Offset is active (see Figure 8-6 on the right below). The offset that
is being subtracted is shown on the upper left part of the screen (right above the numeric display).
To deactivate, press Offset again. If the Offset is engaged, and you wish to subtract a new value of
the background, press Offset twice. The first press will cancel the old value, and the second will
activate a new value.
If you suspect that 1919-R has a permanent zero offset, the instrument’s internal zero should be
reset. See Zero Adjustments.
For Thermopile Sensors Measuring Single-Shot Energy and for Energy
Sensors
Unlike power, offset subtraction is not necessary to achieve accurate energy measurements.
However, Offset can be used to facilitate comparison between readings. For example, the first
laser pulse is 1 Joule. To subtract this from future readings, press the Offset key. If the next pulse
is actually 3 Joules, 2 Joules will be displayed on the screen, thereby indicating the difference
between the two laser pulses.
8.2.4 Measuring Loss Using the dB Offset Function
Since dBm is a logarithmic measurement, the ratio between two measurements will be the
difference between the dBm measurements. For instance, if you want to measure the loss in a
fiber optic cable where the measurement before the cable is 1mW = 0dBm and the measurement
after the cable is 0.1mW = -10dBm. The ratio is then 1:10 = 0.1 and the dB loss is 0 – (-10) = 10dB.
The dB offset function allows you to easily measure this.
1919-R User Manual 53
Page 55

Graphical Displays
To measure loss using the dB Offset function:
1. When measuring the reference value, press the “dB Offset” key.
2. Now make your second measurement and the value of the difference in dB = ratio in
numerical units will be shown.
Note: If there is a zero offset in the reference value, you cannot subtract this using the dB offset
function. Instead, before the start of the measurement, press Offset and subtract the zero offset.
Then follow steps 1 and 2 above. The zero offset subtracted when Offset was pressed will be
saved in the dBm scale and you can now use the dB Offset setting to measure true ratio without
zero offset problems.
8.2.5 Bargraph Style
In addition to the large digital readout, on the main power screen of the 1919-R there is a
bargraph that graphically displays what percentage the present reading is of full scale. This
bargraph can be given enhanced functionality when in full color mode (for example, when the
Color Scheme is set to Color 1 or Color 2). When the bargraph style is set to “Changing”, then the
color of the bargraph and the digital readout changes as a function of percentage of full scale. For
example, if the reading is less than 30% of full scale, it will be displayed green. Between 30% and
60% it will be displayed black or white. Between 60% and 90% it will be displayed yellow and
above 90% of full scale it will be displayed red. These are the default cutoff values. They are fully
configurable, thereby allowing you to use the colors of the bargraph display as a type of pass/fail
mechanism. (You can also set the bargraph style to “Standard” for a simple bargraph.)
The following topics describe how to set the Bargraph Style options:
Changing
Standard
Changing
Set the Bargraph Style to Changing for a bargraph with color that changes according to the
present reading as percentage of full scale. You can modify the levels. (The default levels are
LOW=30%, MED=60%, High=90%.)
To set the bargraph style to Changing:
1. Press Menu and enter Display. (When Color Scheme is set to full color (Color 1 or Color 2),
then the Bargraph Style option is enabled for editing.
2. Go to Bargraph Style and select Changing.
Figure 8-7 Bargraph Style Set to Changing
1919-R User Manual 54
Page 56

Graphical Displays
Figure 8-9 Bargraph
Green < 30% Full Scale
Figure 8-10 Bargraph
White 30% to 60%
Figure 8-11 Bargraph
Yellow 60% to 90%
Figure 8-12 Bargraph
Red > 90%
3. Set the Levels as needed. Select each LOW, MED, HIGH, press the Enter key to display the
relevant window in which you can change the percentage using the up/down Navigation keys.
(The default levels are LOW=30%, MED=60%, High=90%.) For example, see the “Low” window
in Figure 8-8 below:
Figure 8-8 Changing Low to 40%
4. Press the Enter key to save the setting. Figure 8-9, Figure 8-10, Figure 8-11, and Figure 8-12
below show sample colored bargraph power readings, indicating:
Green: less than 30% full scale
White: 30% to 60% full scale
Yellow: 60% to 90% full scale
Red: greater than 90% full scale
Standard
You can set the Bargraph Style to Standard for a simple bargraph in full scale, using the procedure
above. Select Standard instead of Changing. (The Levels options are disabled.)
1919-R User Manual 55
Figure 8-13 Bargraph Style Set to Standard
Page 57

Graphical Displays
Figure 8-14 below shows “Standard” display results.
Figure 8-14 Standard Display Results
8.3 Analog Needle
The Needle graph simulates an analog display, similar to the style of an analog voltmeter or a car’s
speedometer. By making use of the persistence feature, you can know what the full range of
measurements actually is, including the maximum and minimum readings of the present set of
measurements.
Figure 8-15 Pyroelectric Energy Needle Display
The Needle graph display comprises the following components:
Parameter settings, the sensor’s name and serial number, and battery status indicator at the
top of the screen.
Needle graph displayed prominently in the middle of the screen.
Large numeric display.
Soft key legends at the bottom of the screen (for example, Menu, Zoom, Offset, Persist).
1919-R User Manual 56
Page 58

Graphical Displays
To simulate an analog needle:
1. In Power, Energy, or Pulsed Power mode, press Menu and enter Display.
2. Go to Graph Type and select Needle. Return to the main display screen.
3. To expand the needle graph ±5x of the present reading, press Zoom. Press Zoom again to
return the needle range to full scale.
4. To subtract the background and set the current reading to zero, press Offset. Press Offset
again to cancel. For further details, see Offset.
5. Press Persist to keep older measurements on the screen and to display numerically the Min
and Max values measured. Press Persist again to cancel.
8.3.1 Modes
The Modes that Needle displays can be used with include:
Power
Energy
Pulsed Power
8.3.2 Persist
The persistence feature enables you to identify what the full range of measurements actually is,
including the maximum and minimum readings of the present set of measurements.
Press the Persist key to continue to display previous readings as well as to show the minimum and
maximum measurements.
Figure 8-16 Pyroelectric Energy Needle with Persistence
1919-R User Manual 57
Page 59

Graphical Displays
8.4 Line Graph
The Line graph displays the laser output as a function of time. This is useful for technicians
performing laser alignment (laser tuning) that want to see the results of their experimenting
graphically as well as to be shown the maximum laser power attained. This graph is time-based
and most applicable when there is a continuous stream of data. The Line graph can be used with
any sensor that measures power or energy.
Figure 8-17 Photodiode Power Line Graph
The Line graph display comprises the following components:
Parameter settings, the sensor’s name and serial number, and battery status indicator at the
top of the screen.
Max and Min values on upper right above the Line graph.
Large numeric display above the Line graph.
Line graph displayed prominently in the middle of the screen. The cursor at the tip of the
graphical measurement stream shows where the next reading will be displayed
Soft key legends at the bottom of the screen (for example, Menu, Percentage Range (Y-Axis),
Horizontal Sweep Time (X-Axis), Reset.
To graph laser output over time:
1. In Power, Energy, or Pulsed Power mode, press Menu and enter Display.
2. Go to Graph Type and select Line. Return to the main display screen.
3. Set the percentage range of the scale Line to be displayed to the desired setting.
4. Set the horizontal sweep (X-Axis) time as necessary.
5. Press Reset to clear the Min/Max tracking and to restart the graph.
8.4.1 Modes
The Modes that Line graphs can be used with include:
Power
Energy
Pulsed Power
1919-R User Manual 58
Page 60

Graphical Displays
8.4.2 Percentage Range (Y-Axis Scale)
Adjusting the Y-axis scale allows you to set the focus of the graph. For example, if the laser is
changing radically set the scale to 100%, if barely changing, set the scale to 10%.
Press the percentage key to set the Y-Axis Scale to one of the following:
±10%, ±50%: The initial reading is displayed halfway up the graph’s height. The scale of the
graph will be 90% - 110%, or 50% - 150% of the initial reading. If the reading goes out of that
range, then the graph will be rescaled around the present reading.
100%: Graph is scaled to the measurement range.
Figure 8-18 Percent Settings on Line Graph
8.4.3 Horizontal Sweep Time (X-Axis Scale)
Adjusting the X-axis (horizontal sweep time) allows you to select how much data is displayed on
the screen before it wraps around to the beginning.
Press the time key to set the Y-Axis Scale to the desired setting.
Figure 8-19 Time Settings on Line Graph
1919-R User Manual 59
Page 61

Graphical Displays
8.4.4 Reset
Press Reset to clear the Min/Max tracking and to restart the graph.
Figure 8-20 Resetting the Line Graph
8.5 Statistics
The Statistics display is ideal for users that want a large numeric display without any graphics that
may be seen as cluttering the display. Measurement statistics are also displayed. Statistics displays
are available when measuring power or energy.
Figure 8-21 Photodiode Power Statistics
The Statistics display comprises the following components:
Parameter settings, the sensor’s name and serial number, and battery status indicator at the
top of the screen.
Max, Min, Average, Standard Deviation, and Over values on upper left and right above graph.
Large numeric display.
Soft key legends at the bottom of the screen (for example, Menu, Offset, Reset).
1919-R User Manual 60
Page 62

Graphical Displays
Figure 8-22 Photodiode
Pass/Fail Under
Figure 8-23 Photodiode
Pass/Fail in Range
Figure 8-24 Photodiode
Pass/Fail Over
To display real-time statistics:
1. In Power, Energy, or Pulsed Power mode, press Menu and enter Display.
2. Go to Graph Type and select Statistics. Return to the main display screen.
3. Displays Maximum, Minimum, Average, Standard Deviation, Total readings, and number
Over range.
4. To subtract the background and set the current reading to zero, press the Offset button. Press
Offset again to cancel. For further details, see Offset.
5. Press Reset to clear the statistics.
8.5.1 Modes
The Modes that Statistics displays can be used with include:
Power
Energy
Pulsed Power
8.6 Pass/Fail
The Pass/Fail graph tests for measurements outside the user-defined range of acceptable
readings. It has configurable upper and lower limits. This graph is useful for final inspection testing,
other aspects of Production Q/A, or field inspection of equipment.
If the measurement is out of range, “OVER” or “UNDER” will be displayed on the screen. If the
Color Scheme has been set to one of the full color options, then this will be displayed in Red, along
with the reading itself. When the measurements are within range, the display will be normal, with
the results shown in Green (as shown in the middle Figure 8-23 below).
The Pass/Fail display comprises the following components:
Parameter settings, the sensor’s name and serial number, and battery status indicator at the
Upper limit, Lower Limit on upper left above the graph.
Out-of-range warning (OVER/UNDER) on upper right above the graph.
Large numeric display.
Soft key legends at the bottom of the screen (for example, Menu, Upper, Lower).
1919-R User Manual 61
top of the screen.
Page 63

Graphical Displays
To set pass/fail tracking:
1. In Power, Energy, or Pulsed Power mode, press Menu and enter Display.
2. Go to Graph Type and select Pass/Fail. Return to the main display screen.
3. Press the Upper and Lower buttons to set tolerance limits. If reading is out of range, an
appropriate warning will be displayed on the screen.
8.6.1 Modes
The Modes that Pass/Fail displays can be used with include:
Power
Energy
Pulsed Power
8.6.2 Upper/Lower Limits
You can set the Upper and Lower Limits for passing measurements. The initial default Upper Limit
is the maximum of the present range, and the initial default Lower Limit is 0 (until the first time
both values are set to something else).
To set the Upper and Lower Limits:
1. Press the Upper or Lower key. The respective Modify Upper/Lower Limit window opens (see
Figure 8-25 below).
2. User the right and left Navigation keys to select the digit to update, including the exponent
(E+00).
3. Use the up/down Navigation keys to set the select digit to the desired value. (The limits can be
set from -9999 to 9999 E -15 to E +12.)
If the measurement is out of range, “OVER” or “UNDER” will be displayed on the screen. If the
Color Scheme has been set to one of the full color options, then this will be displayed in RED,
along with the reading itself (as shown in Figure 8-25 below).
Figure 8-25 Photodiode Pass/Fail - Modify Upper Limit
1919-R User Manual 62
Page 64

Graphical Displays
8.7 Exposure (for Pyroelectric Sensors)
The Exposure display shows the sum of the total energy of a series of pulses over a given time
period or number of pulses. This gives the total energy "exposure" over that time period. For
example, if the laser is pulsing at 30 times/sec at 1mJ per pulse and you measure the exposure
over 20 seconds, then the total exposure is 30 x 1 x 20 = 600mJ. The Exposure graph is available
when measuring exposure with Pyroelectric sensors.
Note: When switching measurement mode out of Exposure, the graphic display will be changed
automatically to the previously defined graphical display.
Figure 8-26 below shows a sample Pyroelectric Sensor Exposure graph, where you can configure
Mode, Range, Laser setting, Pulse Length, Diffuser, and Threshold settings, as described in Setting
Measurement Parameters When Using Energy Sensors and Measuring Total Energy Exposure. See
also Manual/Timeout/Pulses.
Figure 8-26 Pyroelectric Exposure Measurements
The Exposure display comprises the following components:
Parameter settings, the sensor’s name and serial number, and battery status indicator at the
top of the screen.
Total exposure (large numeric display) displayed prominently in center of screen.
Elapsed time on lower left.
Pulses received on lower right.
Soft key legends at the bottom of the screen (for example, Menu, Start/Stop, Manual, Reset).
To set total energy exposure over a given time period or number of pulses:
1. When using a Pyroelectric sensor, in Exposure mode, the graph type is “Exposure" (no need to
set it).
2. Configure the settings, as described in Measuring Total Energy Exposure.
3. Press Start/Stop to manually start or stop the exposure measurement.
4. Press Manual (the rightmost soft key) and use the Navigation keys to select the options to end
the exposure measurement (see Manual, Timeout, Pulses).
5. Press Reset to stop the exposure measurement and reset the total, pulse counter, and elapsed
time to 0.
1919-R User Manual 63
Page 65

Graphical Displays
Option
Description
Sample Figure
Manual
Stops exposure measurement by the
user pressing the Stop key.
Figure 8-27 Manual Option Selected
Timeout
Stops after the specified time has
elapsed (as shown on the key legend).
You can select: 1 second, 3 seconds, 10
seconds, 30 seconds, 1 minute, 3
minutes, 10 minutes, 30 minutes, or 1
hour. Will also stop by the user pressing
the Stop key.
Figure 8-28 Timeout Options
Pulses
Stops after the specified number of
pulses has arrived (as shown on the key
legend). You can select: 1, 2, 5, 10, 20,
50, 100, 200, 500, 1000, 2000, or 5000.
Will also stop by the user pressing the
Stop key.
Figure 8-29 Pulse Options
8.7.1 Modes
The only Mode that Exposure displays can be used with is:
Exposure
8.7.2 Manual/Timeout/Pulses
Press Manual (the rightmost soft key) to display the Exposure End menu. Use the up ↑ /down ↓
and left ← /right → Navigation keys to select the options to end the exposure measurement:
8.7.3 Exposure for Photodiode Sensors
Exposure can be measured with Photodiode sensors as well. The following are the differences
between measuring Exposure with Pyroelectric Energy Sensors and Photodiode Sensors:
Photodiode sensors actually measure power and sum the results into energy.
1919-R User Manual 64
There is no After Pulses option with Photodiode Sensors.
Page 66

Graphical Displays
8.8 Pulse Chart
The Pulse Chart displays a graph of pulses as they occur, whereby it shows the number of pulses
on the screen. The readings are shown as bars with lengths proportional to the measurement. This
is useful for technicians performing laser alignment (laser tuning) that want to see the results of
their experimenting graphically as well as to be shown the maximum laser power attained. This
graph is not time-based and most applicable when the data flow is not necessarily periodic. This
display is deal when measuring low frequency lasers. The Pulse Chart can be used with any sensor
that measures power or energy.
Figure 8-30 Photodiode Pulse Chart
The Pulse Chart display comprises the following components:
Parameter settings, the sensor’s name and serial number, and battery status indicator at the
top of the screen.
Max and Min values on upper right above the Pulse Chart.
Large numeric display above the Pulse Chart.
Pulse Chart displayed prominently in the middle of the screen. Displays a graph of pulses as
they occur (shows the number of pulses). When the graph reaches the end of the screen, it
continues at the last point shifting previous readings to the left and no longer showing the
least recent measurement. The readings are shown as bars with lengths proportional to the
measurement.
Soft key legends at the bottom of the screen (for example, Menu, Percentage Range (Y-Axis),
Number of Pulses, Reset).
1919-R User Manual 65
Page 67

Graphical Displays
To graph laser output in pulse chart form:
1. In Power, Energy, or Pulsed Power mode, press Menu and enter Display.
2. Go to Graph Type and select Pulse Chart. Return to the main display screen.
3. Set the percentage range of the Y-scale to be displayed to the desired setting. (For more
details, see Percentage Range (Y-Axis Scale).)
4. Set the number of pulses as required.
5. Press Reset to clear the Min/Max tracking and to restart the graph. (For more details, see
Reset).
8.8.1 Modes
The Modes that Pulse Charts can be used with include:
Power
Energy
Pulsed Power
8.9 Other Display Settings
Additional display settings include:
Show/Hide Settings
Color Scheme
1919-R User Manual 66
Page 68

Graphical Displays
Figure 8-32 Show Sensor Settings
Figure 8-33 Hide Sensor Settings
8.9.1 Show/Hide Settings
You can choose whether to show or hide the sensor settings that are displayed at the top of the
measurement screens.
Figure 8-31 Show Settings
To show/hide sensor measurement parameters:
1. Connect the sensor.
2. Press the Menu button, and use the Navigation keys to select Display and press the Enter key.
3. Use the Navigation keys to select Show Settings and press the Enter key.
4. Select Yes to show the settings, or select No to hide them.
5. Press the Enter key to save the settings.
8.9.2 Color Scheme
You can select the color scheme of the 1919-R display. This is especially useful for operation when
wearing protective goggles that filter out visible wavelengths.
You can configure the 1919-R for full color or monochrome functionality. Choose full color to make
use of special color enhancements. Choose one of the monochrome schemes for use with
protective goggles that filter out visible wavelengths.
1919-R User Manual 67
Page 69

Graphical Displays
Figure 8-34 Thermopile Sensor
(Monochrome)
Figure 8-35 Photodiode Sensor
(Monochrome)
Figure 8-36 Pyroelectric Sensor
(Full Color)
Screen captures of the 1919-R in this manual are shown in the various color schemes. For example,
the following sensor displays:
Full Color
To set the color scheme of the main measurement displays to full color:
1. Connect the sensor.
2. Press the Menu button, and use the Navigation keys to select Display and press the Enter key.
3. Use the Navigation keys to select Color Scheme and press the Enter key.
4. Select the relevant full color scheme option:
Color 1: Yellow text on dark blue background
Color 2: Black text on sky blue background
5. Press the Enter key to save the setting.
For both of these full color schemes, warnings will be displayed in red, selection windows (for
example, range, average, laser) will be pink, and modification windows will be white.
Figure 8-37 Sample Full Color Scheme Display with Pink “Range” Selections
1919-R User Manual 68
Page 70

Graphical Displays
Monochrome
Monochrome schemes are for use with lasers that demand protective glasses that filter out colors
in the visible part of the wavelength spectrum. These color schemes apply to all of the screens. All
color-enhanced features of the 1919-R will not be functional in any of the monochrome screens.
Follow the procedure above to set the color scheme and choose one of the following
monochrome schemes:
Black/White: Black text on white background
Blue/Black: Sky blue text on black background
Red/Black: Red text on black background
Green/Black: Green text on black background
See Figure 8-34, Figure 8-35, and Figure 8-36 above which show the sensors in monochrome and
full color displays.
1919-R User Manual 69
Page 71

Figure 9-1 Main Measurement Screen Functions
Figure 9-2 Function Settings
9 Math Functions
This section describes how to define and apply math functions to the laser measurements.
Topics include:
Display on Main Measurement Screen
Functions Screen
Average
Fixed Offset
Scale Factor
Normalize
Density
Function Limitations
9.1 Display on Main Measurement Screen
If any functions or pass/fail limits are enabled, then they will all be displayed at the top of the
screen. Arrow icons will appear at the top of the display to inform that there is more to be seen. A
Right Arrow (on the upper right) indicates additional functions are available. Pressing the →
Navigation key displays the Function and Pass/Fail settings. And subsequently the Left Arrow
allows you to return to the previous parameters (by pressing the ← Navigation key).
Figure 9-1 on the left below shows the main measurement screen, while Figure 9-2 on the right
shows the Function and Pass/Fail settings (displayed after the Right Arrow has been pressed).
1919-R User Manual 70
Page 72

Math Functions
9.2 Functions Screen
The Functions screen is where you can set up different post processing parameters in order to
display the measurement in the way most fitting for your application. All of these settings can be
set individually. Also, many of them can be combined. For example, to see the power density of a
laser beam after it has gone through a beam splitter. (In 1919-R, these factors can be kept and
applied in the graphical displays as well.)
Figure 9-3 Functions Screen
The Functions screen comprises the following components:
Top left of screen displays the power/energy measurement without applying any of the
functions.
Top right of screen displays the power/energy measurement with applying all of the functions
that have been enabled.
Middle third displays all of the functions and their present status.
Bottom of screen displays context sensitive help describing the currently selected function.
Soft key legends that vary per the currently selected function.
This section describes the available math functions:
Average: how to set the time period for average power readings.
Fixed Offset: how to apply a fixed offset to measurements.
Scale Factor: how to apply a scale factor to measurements.
Normalize: how to normalize against a reference measurement.
Density: how to display power/energy density.
9.3 Average
You can set a period over which to average readings. Moving average is applied to numeric results
only. This feature is especially useful for lasers with unsteady output. (The average can also be set
in the main measurement screen.)
1919-R User Manual 71
Page 73

Math Functions
To set a time period for average power readings:
1. Press Menu and enter Functions.
2. Go to Average and select an option to set the Average to the period you wish to average
power over or set to NONE to disable. (This can also be set in the main measurement screen.)
Figure 9-4 Setting the Average
9.4 Fixed Offset
You can define a constant value to subtract from all subsequent power/energy readings.
Note: The Offset value can be set to positive or negative.
To apply a fixed offset to measurements:
1. Press Menu and enter Functions.
2. Go to Fixed Offset.
3. Set the value to subtract from all subsequent measurements.
4. Press Apply to set the present value as Fixed Offset or press the Enter key to define a different
value. (Click Clear to zero the value.)
Figure 9-5 Modifying Fixed Offset
9.5 Scale Factor
You can set the factor by which to multiply further measurements. Use this to factor up the value
that the sensor has measured. This is very useful when working with beam splitters with sensitive
1919-R User Manual 72
Page 74

Math Functions
sensors. A typical beam splitter allows about 5% of the laser beam to get through. In such a case,
the user would set the Scale Factor to 20 to get the actual output of the laser.
To apply a Scale Factor to measurements:
1. Press Menu and enter Functions.
2. Go to Scale Factor.
3. Set to value by which to multiply all subsequent measurements. Press the Enter key. The Scale
Factor can be between 0.00001 and 9999 only positive. (Click Clear to zero the value.)
Figure 9-6 Modifying Scale Factor
1919-R User Manual 73
Page 75

Math Functions
9.6 Normalize
You can define a baseline against which to compare further power/energy readings.
Note: The Normalize option is grayed out if the present range is dBm, or if Density has been set.
To normalize against a reference measurement:
1. Press Menu and enter Functions.
2. Go to Normalize.
3. Set to reference value by which to normalize all subsequent measurements. The reference
value can only be positive.
4. Press Apply to set the present value as the Normalize reference value or press the Enter key to
define a different value. When Normalize is applied, measurements are displayed
dimensionless; that is to say, without the W or J symbols. They are shown as the result of the
present reading/reference value.
Figure 9-7 Modifying Reference
1919-R User Manual 74
Page 76

Math Functions
9.7 Density
You can display power/energy as measured by the sent as W/ cm² based on user-defined laser
spot shape and size.
Note: The Density option is grayed out in any of the following conditions: if the present range is
dBm, if Normalize has been set, or if Exposure is the current mode.
To display as power/energy density:
1. Press Menu and enter Functions.
2. Go to Density. Press the Enter key.
3. Select the beam shape (Disabled, Rectangle, Circle). Selecting Rectangle enables the Height
and Width parameters for modifying the spot height. Selecting Circle enables the Diameter
parameter for modifying the spot diameter.
Figure 9-8 Modifying Density – Circular Beam and Spot Diameter
4. After the shape (Rectangle or Circle), select the size (Height and Width, or Diameter). Size
parameters can range from 0.1mm to 100.0mm.
The measurements will be shown as cm² on the graphical display on the main measurement
screen.
Figure 9-9 Measurement of Power Density in nW/cm2
1919-R User Manual 75
Page 77

Math Functions
9.8 Function Limitations
For Thermopile sensors in Single-Shot Energy mode, Average is disabled.
For sensors in Exposure mode, Average, Normalize, and Density are disabled.
If Normalize is active, then Density is disabled. If Density is active, then Normalize is disabled.
If the present Power Range is dBm, then Normalize is disabled.
1919-R User Manual 76
Page 78

10 Logging Data to a File for Upload to PC
In addition to displaying the results visually on the screen, you may need to gather a larger amount
of data and analyze it in a more thorough fashion. 1919-R provides the ability to store the data and
review it with Newport’s PMManager application, Excel, or another application that better fits
your needs.
This section describes how to log laser measurement data to a file stored on an external storage
device for later upload to a PC.
Topics include:
Launching the Log Setup
Setting Logging Parameters for the Various Stop Modes
Start Logging
Displaying Logged Data
Viewing the Log File on Your Computer
10.1 Launching the Log Setup
To activate the Log function, you need to first connect an external storage device to the 1919-R
meter. Once connected, the Log Setup screen is displayed, where you can configure the logging
parameters and start the logging process.
To launch the Log Setup:
1. Insert an external storage device Disk on Key into the USB port located on the left side of the
1919-R meter.
2. Press Menu and select Log.
Upon pressing Log in the Menu screen, 1919-R will search for a Disk on Key. If none is
attached, it will display an error message, “External storage device not available.”
If a Disk on Key is found, 1919-R will look for a directory called “Log Files” in the root directory
of the Disk on Key, and if not found, 1919-R will create it. 1919-R will then set “Log Files” as
the active directory. 1919-R will not allow browsing of any other directories on the Disk on
Key.
Figure 10-1 Log Files Directory on Disk On Key
1919-R User Manual 77
Page 79

Logging Data to a File for Upload to PC
After this initial check for the Disk on Key, the Log Setup Screen is displayed, as shown in
Figure 10-2 below.
Figure 10-2 Log Setup Screen
The Log Setup Screen is divided into 3 main sections and comprises the following components:
The sensor’s measurement parameters (disabled) at the top of the screen.
Logging Parameters (in the middle) for configuring the data-logging, as needed.
Context Sensitive Help (in the lower area) for the selected parameter.
Soft key legends (at the bottom of the screen):
Start: Start logging based on selected sensor and log parameters.
Files: Enter the Log Files screen.
Exit: Exit to the main menu screen.
10.2 Setting Logging Parameters for the Various Stop Modes
You begin the logging process by configuring the Stop mode parameters to set logging to stop
after a predetermined period of time, number of measurements, or manually.
Figure 10-3 Stop Mode Options
To set the logging parameters for the various Stop modes:
1. In the Log Setup screen, go to Stop Mode and select an option (click the links for more
details):
Manual: to manually stop logging.
After Timeout: to stop logging after a predetermined period of time.
After Measurements: to stop logging after a specified number of measurements.
1919-R User Manual 78
Page 80

Logging Data to a File for Upload to PC
The available parameters vary per the selected Stop mode option.
2. Proceed to configure the selected Stop mode parameters, as described in the following
sections.
10.2.1 Manual Mode
Logging does not terminate at a predefined condition. Rather, it continues until the user presses
the Stop key.
To set the Stop Mode to Manual:
1. In the Log Setup screen, set the Stop Mode to Manual. The Log Setup screen displays the
following parameters:
Figure 10-4 Manual - Stop Mode
2. Go to each parameter and set the relevant options, as required:
Sample Rate: Enables you to control the number of readings that will be added to the log.
Options include:
Every Reading
1 of 3 Readings
1 of 10 Readings
1 of 30 Readings
1 of 100 Readings
1 of 300 Readings
1 of 1000 Readings
1919-R User Manual 79
Page 81

Logging Data to a File for Upload to PC
Store By: Determines the quality of the data that is stored. Set logging to store the
average of several readings or only one of the group. (If Sample Rate is set to Every
Reading, then this parameter is disabled and grayed out.)
Figure 10-5 Store By Options
Options include:
Sample: Logs only the last reading that was measured.
Average: Stores the average of all of readings that have been measured since the
previous data has been added to the log.
10.2.2 After Timeout
Logging continues until the Stop key is pressed or until the user-defined log duration has elapsed.
To set the Stop Mode to After Timeout:
1. In the Log Setup screen, set the Stop Mode to After Timeout. The Log Setup screen displays
the following parameters:
Figure 10-6 After Timeout - Stop Mode
1919-R User Manual 80
Page 82

Logging Data to a File for Upload to PC
2. Go to each parameter and set the relevant options, as required:
Duration: User defined period of time. After this time passes, the log stops automatically.
The default duration is 1 minute (0000:01:00).
Figure 10-7 Setting the Duration
Interval: Time to wait between storing readings (i.e. before a new measurement is added
to the log file). The default interval is 0000:00:00. (i.e. log each reading)
Figure 10-8 Setting the Interval
Store By: Determines the quality of the data that is stored. Set logging to store the
average of several readings or only one of the group. (If Interval is set to 00:00:00, then
this parameter is disabled and grayed out.) Options include:
Sample: Logs only the last reading that was measured.
Average: Stores the average of all of readings that have been measured since the
previous data has been added to the log.
1919-R User Manual 81
Page 83

Logging Data to a File for Upload to PC
10.2.3 After Measurements
Logging continues until the Stop key is pressed or until the user-defined number of readings has
been measured.
To set the Stop Mode to After Measurements:
1. In the Log Setup screen, set the Stop Mode to After Measurements. The Log Setup screen
displays the following parameters:
Figure 10-9 After Measurement- Stop Mode
2. Go to each parameter and set the relevant options, as required:
Log Size: Number of readings that you want to store in the log file, after which logging will
stop automatically.
Figure 10-10 Setting the Log Size
Sample Rate. Enables you to control the number of readings that will be added to the log.
Options include:
Every Reading
1 of 3 Readings
1 of 10 Readings
1 of 30 Readings
1 of 100 Readings
1 of 300 Readings
1 of 1000 Readings
1919-R User Manual 82
Page 84

Logging Data to a File for Upload to PC
Store By: Determines the quality of the data that is stored. Set logging to store the
average of several readings or only one of the group. (If Sample Rate is set to Every
Reading, then this parameter is disabled and grayed out.) Options include:
Sample: Logs only the last reading that was measured. (Reduces log file size by storing
only one of several measurements.)
Average: Stores the average of all of the readings that have been measured since the
previous data has been added to the log.
10.3 Start Logging
You activate logging by pressing the Start key in the Log Setup screen.
To start logging:
1. In the Log Setup screen, press the Start key. The main measurement screen displays the graph
type that was previously selected in the Display menu, and the following additional
parameters at the top of the screen:
Elapsed: Time that has elapsed since starting the present log session (in the example
below, 3 minutes).
Readings: Number of measurements logged to the file since the start of the present log
session (in the example below, 906).
Stop: Condition for ending the present log session (in the example below, after storing
20000 readings).
Figure 10-11 Started Logging
2. While logging is active, to stop the log manually, press Stop. This stops the logging
immediately and saves the date. (Press Abort to abort the log, exit the logging screen, and
revert back to the Log Setup Screen.)
3. When the log is completed, the display will stop updating and a Log Summary appears. The
following will be displayed in a message box in the display area:
Log file name
Total readings
Number of overrange
Maximum
Minimum
Average
1919-R User Manual 83
Page 85

Logging Data to a File for Upload to PC
Standard Deviation
The log file name is set to the sensor serial number _00.txt (like in PMManager). If there are
already log files for this sensor, the appended _00 counter will be auto incremented to the
next available value.
Figure 10-12 Log Summary
Note: 1919-R does not provide the user with the ability to add notes to a log file.
4. Press any key to return to the active logging screen. The Start and Exit keys are displayed. The
display will be inactive and will be as it was when the log completed.
Figure 10-13 Active Logging Screen
5. When Start is pressed, the logging counters will be reset, the display will be cleared and
activated. The Stop and Abort keys will be displayed.
10.4 Displaying Logged Data
You can access a list of log files to view information about a specific log file by pressing the Files
key in the Log Setup screen and selecting the relevant file.
Pressing the Files key in the Log Setup screen will open the Log File Selection screen. 1919-R will
open the “Log Files” directory on the Disk On Key and list all files of the format
serial_number_xx.txt.
The following procedure guides you through the relevant steps for log file selection.
1919-R User Manual 84
Page 86

Logging Data to a File for Upload to PC
To display logged data:
1. In the Log Setup screen, press the Files key.
Figure 10-14 Files Key on Log Setup Screen
The File Selection screen opens, displaying the number of files found (at the top of the screen)
following by the names of the files found (for example, 711578_01.txt). There will be 2 or 3
columns of file names shown. At the bottom of the screen will be displayed general
information of the currently highlighted file. This includes the date and time of the log file
(hh:mm:ss), duration, number of logged readings, number of overrange, and statistics. (If the
log file is longer than 1000 hours, the seconds will not be displayed.)
Figure 10-15 File Selection Screen
2. Use the right and left arrows to scroll through the columns of file names. Use the up and down
arrows to scroll through the files of the present column. When reaching the bottom of the
column, scrolling down will return to the top of the column.
1919-R User Manual 85
Page 87

Logging Data to a File for Upload to PC
Figure 10-16 Log Results without Functions
Figure 10-17 Log Results with Functions Applied
3. Press the Enter key to enter the Log File Display screen for the currently selected log file. The
number of Readings appears as the header at the top of the page. Column labels will be
according to what was measured (“Power”, “Energy”, and so on). The first column of data will
be running counter of the reading number. After that the timestamp, readings, and function
results (if any). Function results will be displayed in last column, if at all, as shown in
Figure 10-17 on the right below.
Note: When functions are applied, the statistics stored in the log file will be based on the
functions data, not on the original readings.
4. Use the up/down keys to scroll up/down one page. Use the right/left keys to jump to the
first/last page.
5. Press Exit to exit the Log Setup screen.
How the Various Types of Average Affect Logged Data
Average that is selected in the Functions screen is a Moving Average. If enabled then there will
be two columns in the log file; the first is raw measurements (without any functions applied)
and the second includes the moving window average (as well as any other functions).
If sample-by-average is turned on in logging, it will apply to each column separately; in the
second column it is applied after any functions (including moving window average).
The statistics in the log file are based on the actual measurements written to the log file, the
second column if there are two columns.
This means that the average in the statistics in the log file may be three averages calculated on top
of each other, moving average then periodic average then full average. Make sure that what you
configure is sensible.
1919-R User Manual 86
Page 88

Logging Data to a File for Upload to PC
10.5 Viewing the Log File on Your Computer
In addition to reviewing the logged data on 1919-R, you can also upload the data for review at
your workstation.
To view the log file on your computer:
1. Remove the Disk on Key from 1919-R and attach it to your PC.
2. Start the PMManager application and select the Logging Menu.
3. Select Open Log File, and select the Log file from the Disk on Key.
PMManager will open the file for visual and textual review as if it were logged in PMManager
itself.
Figure 10-18 Log File in PMManager
1919-R User Manual 87
Page 89

11 Circuit Description
The 1919-R meter has two circuit boards: the Analog Module with the analog signal processing
circuitry, and the Processor Board with the power supplies and user interface components.
Topics include:
Analog Module
Processor Board
11.1 Analog Module
11.1.1 Analog Circuit
The signal from the detector sensor enters the analog circuit and passes through EMI protection
components to a differential trans-impedance preamplifier. From there it is further amplified by a
programmable gain voltage amplifier and passes to an Analog-to-Digital (A/D) converter. All
calibration data for the analog circuit is stored in a memory chip on the main board. There are no
mechanical adjustable components (trimmers, and so on) in the 1919-R. The Analog Module’s on
board digital processor receives data from the A/D converter and translates it into a measurement
of current in Amps. When used with Thermopile sensors, the data is then processed by a
sophisticated digital filter that speeds up the effective response time of the sensor and rejects
noise.
11.1.2 Fast Analog Input
In addition to the above basic analog circuit, the 1919-R contains a second fast analog input. This
supports certain Newport sensors that read energy pulses at higher rates than can be supported
by the basic analog circuit, but provides less overall accuracy than the above circuit. The fast
analog input consists of an EMI filtered voltage input that is passed to a first stage of mild voltage
attenuation. This is then passed to a fast A/D converter. Calibration data is stored on the same
memory chip mentioned above. The Analog Module’s on board digital processor receives data
from the fast A/D converter and translates it into a measurement that can be processed as
necessary.
11.1.3 Analog Output
The analog output is driven through an impedance of 100 ohms and provided as a means of
integrating the 1919-R meter with other instruments (such as an oscilloscope).
11.2 Processor Board
The Processor Board is built around a Freescale i.MX283 ARM9 application processor. The digital
circuit includes an upgradeable FLASH chip that can be programmed in.
11.2.1 Power Supply
The power supply provides the internal DC supply voltages for both the Processor Board and the
Analog Module. It also contains the battery charging circuit and the AC supply for the backlight.
The power supply circuits consist of high efficiency switch-mode designs.
1919-R User Manual 88
Page 90

Circuit Description
11.2.2 EMI Protection
The digital processor circuit and the whole 1919-R instrument are protected by EMI protection
component on all signals that pass in and out of the box. In addition, EMI protection is added
internally to prevent disturbances to the normal functioning of the instrument. The instrument
meets the requirements of the European Community with respect to electromagnetic
compatibility and has the “CE” mark.
1919-R User Manual 89
Page 91

12 Calibration, Maintenance, and Troubleshooting
This section describes calibration, maintenance, and troubleshooting related to using 1919-R.
The following calibration capabilities are supported:
Photodiode Power
Pyroelectric Energy for sensors with a Discrete set of wavelengths
Pyroelectric Energy for sensors with a Continuous set of wavelengths
Thermopile Power
Thermopile Energy
Thermopile Response Time
Note: All calibration factors are dependent on the currently active set of configuration
parameters.
In addition to NIST traceable factory calibration, Newport sensors can be field calibrated by the
user.
Note: Modifying calibration factors will affect the sensor’s performance and should be performed
by qualified personnel only.
Topics include:
Updating Sensor Calibration Factors
Calibration of Thermopile Sensors
Calibration of Photodiode Sensors
Calibration of Pyroelectric Sensors
Error Messages
Troubleshooting
Maintenance
1919-R User Manual 90
Page 92

Calibration, Maintenance, and Troubleshooting
12.1 Updating Sensor Calibration Factors
The following procedure describes the general steps for updating sensor calibration factors. For
sensor-specific calibration, see Calibration of Thermopile Sensors, Calibration of Photodiode
Sensors, and Calibration of Pyroelectric Sensors.
To update sensor calibration factors:
1. Press Menu and select Calibration.
2. Press Continue twice to activate calibration. The information screens vary per sensor.
3. The main Measurement screen appears, displaying the Calibration Factor value (on the left).
4. Press Modify. The screen displays the Original (current) reading and factor (on the left side of
the screen), and Updated factor and its effect on the reading (on the right). The Updated box
is highlighted, indicating it is modifiable.
5. In the Updated area, use the Right/Left arrows to select the digit to update. Use the Up/Down
arrows to change the value of the selected digit.
6. Press Save to save the settings and return to the main Measurement screen, which now
displays the updated Calibration Factor.
7. Press Exit to return to the Menu screen.
12.2 Calibration of Thermopile Sensors
Two types of absorber surfaces are used in Newport Thermopile sensors:
Surface Absorbers
Volume Absorbers
12.2.1 Surface Absorbers
BB (Broadband) Absorber
On standard, high power density, broadband Newport power monitor sensors, a special refractory
coating is used to provide high absorptivity from the UV through the IR. This coating can withstand
very high power densities, up to 28 kW/cm², without changing calibration. The absorption of this
coating is above 85% for most of its range, as shown in Figure 12-1 below.
1919-R User Manual 91
Page 93

Calibration, Maintenance, and Troubleshooting
12.2.2 Volume Absorbers
PF (High Energy High Average Power) Absorber
The newest PF type absorber has a high damage threshold for short pulses and can stand relatively
high average power density as well. In addition, it is able to be deposited on large areas, so it is the
absorber of choice for many applications.
Figure 12-1 Absorption vs. Wavelength of Various Thermopile Sensor Absorbers
Newport power/energy meters with the BB or PF type absorbers are individually calibrated by
laser at several wavelengths against a NIST calibrated standard meter. The meter can be switched
to give the exact calibration at the various wavelengths (532, 1064, and, where applicable, CO2).
Since the sensitivity changes little with wavelength, the user can use the settings closest to the
calibration wavelength with little error.
12.2.3 Linearity and Accuracy of Newport Thermopile Sensors
Linearity
The linearity of most Newport Thermopile detectors is specified to be 1% over the specified power
range of each particular instrument and is tested by Newport from time to time. The linearity is
generally tested against another sensor that has been NIST tested for linearity. For those models
for which the linearity is not tested over their entire range, randomly chosen sample models are
tested periodically over their entire range. The test is performed with a high power laser that can
cover the entire detector range using a beam splitter and lower power sensor that has previously
been tested for linearity for comparison. Thus, in all cases, the linearity of the detectors is
traceable to NIST measurements.
Method of Calibration
The absorption of the various Newport Thermopile absorbers can vary from disc to disc.
Therefore, all Newport absorbers are individually calibrated against NIST traceable standards.
1919-R User Manual 92
Page 94

Calibration, Maintenance, and Troubleshooting
12.2.4 Updating Thermopile Sensor Calibration Factors
To update Thermopile sensor calibration factors:
1. Press Menu and select Calibration. The screen displays the following general message:
Figure 12-2 General Calibration Information Screen
2. Press Continue. The Select Calibration Factor screen displays the following calibration factors:
Sensitivity, Energy, and Response. Click the links for more details.
Figure 12-3 Select Calibration Factor Screen for Thermopile Sensors
3. Select (highlight) a Calibration Factor (Sensitivity, Energy, or Response) and press Continue to
activate calibration based on the selected factor. The main Measurement screen appears,
displaying the relevant Factor values (on the left) based on the selected calibration factor. For
more details, see Sensitivity, Energy, and Response.
4. Press Modify. The screen displays the Original (current) reading and factor (on the left side of
the screen), and Updated factor and its effect on the reading (on the right). The Updated box
on the right is highlighted, indicating it is modifiable. For more details, see Sensitivity, Energy,
and Response.
5. In the Updated area, use the Right/Left arrows to select the digit to update. Use the Up/Down
arrows to change the value of the selected digit.
6. Press Save to save the settings and return to the main Measurement screen, which now
displays the updated calibration factor values.
7. Press Exit to return to the Menu screen.
1919-R User Manual 93
Page 95

Calibration, Maintenance, and Troubleshooting
Figure 12-4 Calibrating per Sensitivity
Figure 12-5 Modifying Overall
Sensitivity Calibration Factor
Figure 12-6 Updated Sensitivity
Calibration Factor in Main Screen
Figure 12-7 Calibrating per Energy
Figure 12-8 Modifying Energy
Calibration Factor
Figure 12-9 Updated Energy
Calibration Factor in Main Screen
Sensitivity
Available for all Thermopile sensors. Modify overall sensitivity of the sensor. This will affect power
and energy readings for all laser settings. When this is selected, the main screen will display
Sensitivity and Calibration Factor values on the left.
Energy
Not applicable for 919P-5KW-50 and similar sensors that do not measure energy and will not be
offered as an option for them. Modify energy readings for all laser settings. Affects energy
readings only.
Response
Available for all Thermopile sensors. Optimize Thermopile response time of the sensor. Use to
attain accurate readings as quickly as possible and to minimize overshoot (erroneous power
readings above 100% full scale). Affects power and energy readings.
Thermopile sensors are slow in their response to a laser hitting them. 1919-R contains software
that algorithmically “speeds up” the response. Response tweaking is a feature that Newport
provides for users to tailor this to their application. It allows the user to find the optimum setting
to speed up the response, prevent overshoot (erroneous readings that are above the actual
power), and remove undershoot (not quite reaching and/or dipping back below the correct
reading).
Response configuration is provided as a multi-step wizard with on screen guidance for each step.
The basic workflow includes:
Scaling the graph to the power level expected when reading stabilizes. See steps 1 and 2
below.
1919-R User Manual 94
Page 96

Calibration, Maintenance, and Troubleshooting
Changing the Response, tweaking and testing the results. Response tweaking works by the
user seeing how long it takes to rise from 0 to the expected power and if there is overshoot or
undershoot. See steps 3, 4, and 5 below.
Accepting the results. The graph is drawn with two dotted lines; one at 100% of the expected
measurement at one at 90%. 100% is drawn at about 75% of the full height of the graph to
allow the user to see the overshoot, if there is any.
The following procedure guides you through the specific steps.
To set calibration per Response factor:
1. In the Select Calibration Factor screen, select Response, and press Continue. The main
Measurement screen displays the Response Factor on the left.
Figure 12-10 Calibrating per Response
2. Wait for stable power and press Next. Scaling begins. The graph is scaled to the power level
expected when the reading stabilizes. At this point, the measurement parameters cannot be
changed anymore. Response tweaking works by the user seeing how long it takes to rise from
0 to the expected power and if there is overshoot or undershoot.
The screen displays Scaling in progress.
Figure 12-11 Scaling Begins
1919-R User Manual 95
Page 97

Calibration, Maintenance, and Troubleshooting
After the scaling is completed, the screen displays “Block laser until power is close to 0”.
Figure 12-12 Scaling Completed
3. Press Next.
Figure 12-13 Response Calibration Factor
4. Adjust the Response Factor and press Next.
Figure 12-14 Modifying the Response Calibration Factor
1919-R User Manual 96
Page 98

Calibration, Maintenance, and Troubleshooting
5. Press Next and then unblock the laser.
Figure 12-15 Updated Response Calibration Factor in Main Screen
6. Press Next. The calibration is updated in the main Measurement screen.
Initially, the screen displays the updated Scaled, Present, and Response Factor values.
Figure 12-16 Scaled, Present, and Response Factor Values Updated
Then, the screen displays the final Response Factor value.
Figure 12-17 Final Response Calibration Factor Value
The graph (as shown above) is drawn with two dotted lines; one at 100% of the expected
measurement at one at 90%. 100% is drawn at about 75% of the full height of the graph to
allow the user to see the overshoot, if there is any.
7. Press Finish to save the Response factor.
8. Press Back to change and test again. (Repeat steps 5-7 above.)
1919-R User Manual 97
Page 99

Calibration, Maintenance, and Troubleshooting
Model
918-UV-OD3R
818-UV/DB
918D-SL-OD3R
818-SL/DB
918D-IR-OD3R
818-IR/DB
918D-IG-OD3R
818-IG/DB
Calibration
Uncertainty
Without
Attenuator
4%@200-219nm
2%@220-349nm
1%@350-949nm
4%@950-1100nm
1%@400-940nm
4%@941-1100nm
2%@780-910nm
2%@911-1700nm
4%@1701-1800nm
2%@800-900nm
2%@901-1650nm
Calibration
Uncertainty With
Attenuator
8%@200-219nm
2%@220-349nm
1%@350-949nm
4%@950-1100nm
1%@400-940nm
4%@941-1100nm
5%@780-910nm
2%@911-1700nm
4%@1701-1800nm
5%@800-900nm
2%@901-1650nm
12.3 Calibration of Photodiode Sensors
12.3.1 Method of Factory Calibration
The sensitivity of various Newport Photodiode sensors can vary from one to another as well as
with wavelengths. Therefore, Newport Photodiode detectors are individually calibrated against
NIST traceable standards over the entire operating range of wavelengths for both filter out and
filter in. The calibration curve is normalized to the correct absolute calibration at 632.8 nm using a
HeNe laser against a reference meter traceable to NIST.
The spectral sensitivity curve of the detector, as well as the spectral transmission curve of the
filters, is fed into the sensor EEROM, and this information is used to set the gain to the proper
value at wavelengths other than the wavelength the instrument was calibrated. When the user
selects his wavelength on the 1919-R, the correction factor for that wavelength is applied.
12.3.2 Accuracy of Calibration
Since the instruments are calibrated against NIST standards, the accuracy is generally ±2% at the
wavelength the calibration has been performed. The maximum error in measurement will be less
than the sum of the calibration accuracy, linearity, inaccuracy due to errors in the wavelength
curve and variations in gain with temperature. The linearity of the Photodiode detector is
extremely high, and errors due to this factor can be ignored. The maximum error due to the above
factors is listed in Table 12-1 below.
Table 12-1 Maximum Error as a Function of Wavelength and Filter
1919-R User Manual 98
Page 100

Calibration, Maintenance, and Troubleshooting
12.3.3 Updating Photodiode Sensor Calibration Factors
Photodiode sensors only have an overall power calibration factor. Changes to this factor at one
wavelength will affect readings at all other wavelengths proportionately.
Note: Sensors equipped with a removable filter have two factors, one for each setting. Changing
the factor for one setting has no effect on power readings in the other settings.
To update Photodiode sensor calibration factors:
1. Press Menu and select Calibration. The screen displays the following general message:
Figure 12-18 General Calibration Information Screen
2. Press Continue. The screen displays the following Photodiode sensor-specific message:
Figure 12-19 Information Screen for Photodiode Sensors
3. Press Continue to activate calibration. The main Measurement screen appears, displaying the
Calibration Factor value (on the left).
Figure 12-20 Calibration Activated on Main Measurement Screen
1919-R User Manual 99
 Loading...