

Page 1
O
PERATOR’S
M
ANUAL
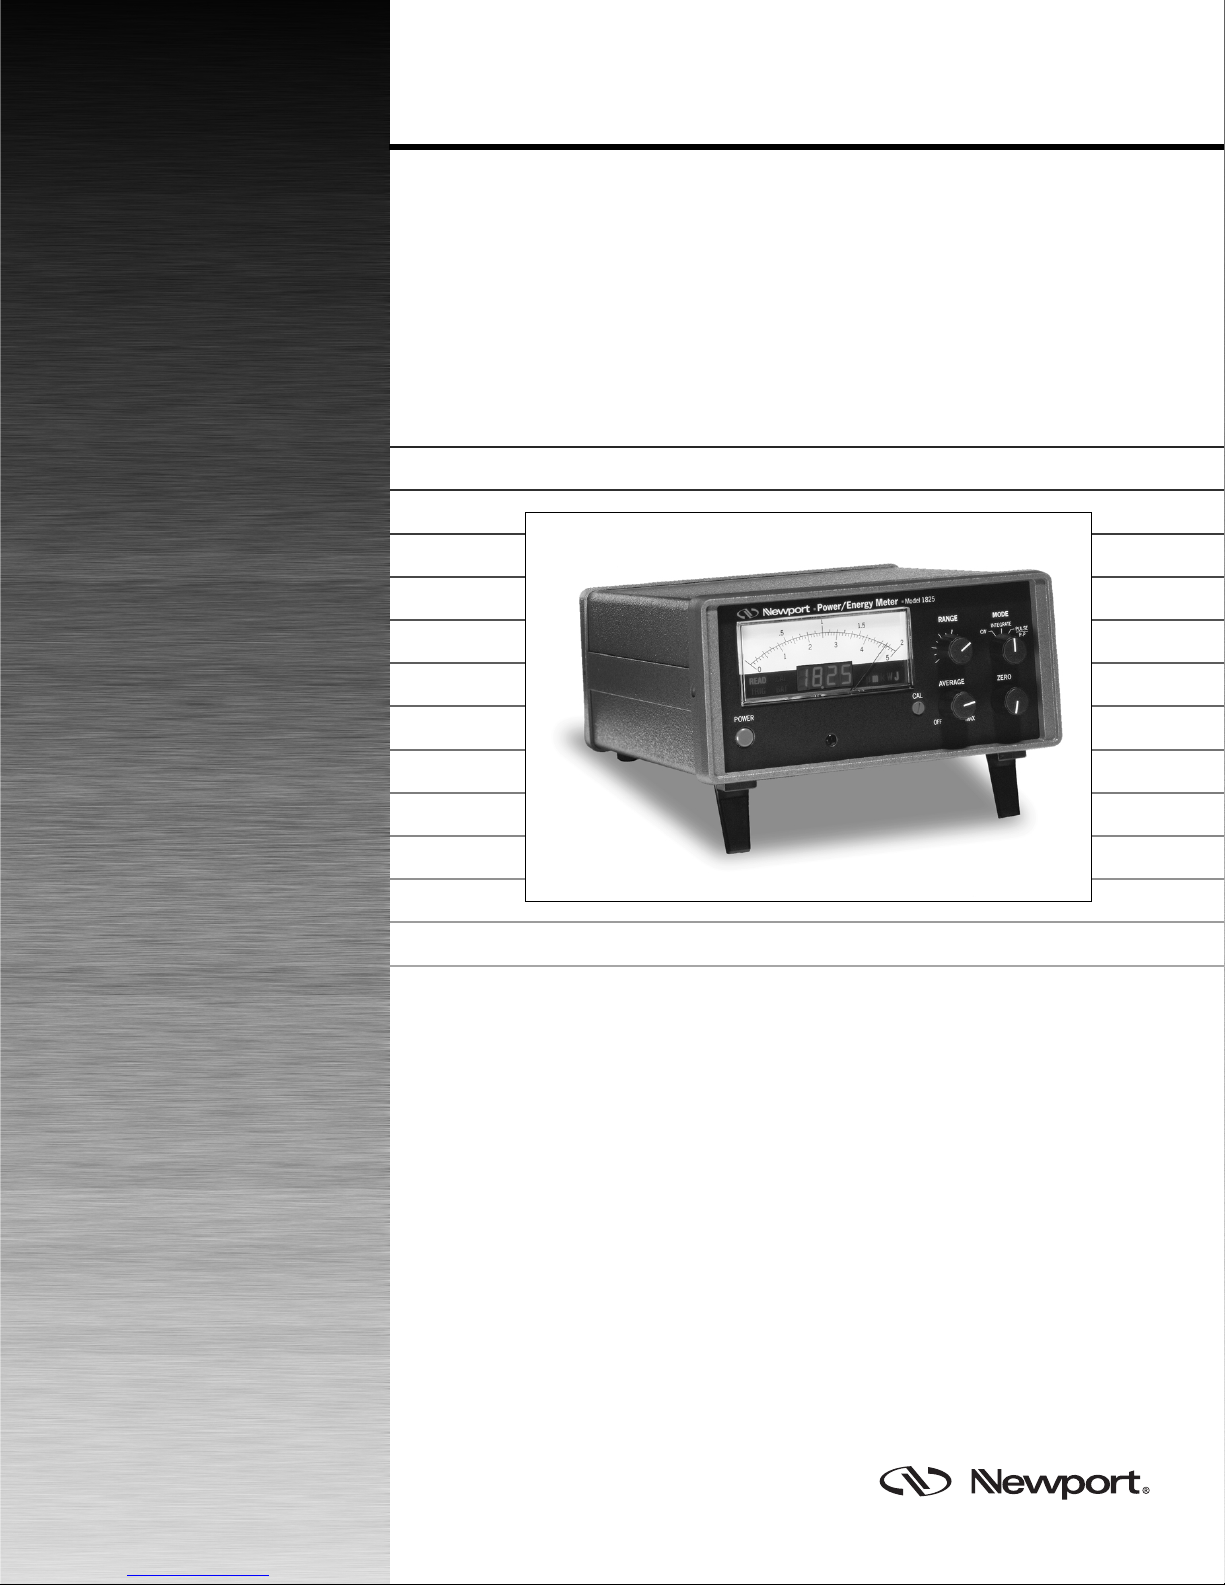
Model 1825-C
Power/Energy Meter
Page 2

Model 1825-C
Power/Energy Meter
Page 3

Warranty
Newport Corporation warrants this product to be free from defects in material
and workmanship for a period of 1 year from the date of shipment. If found to
be defective during the warranty period, the product will either be repaired or
replaced at Newport’s option.
To exercise this warranty, write or call your local Newport representative, or
contact Newport headquarters in Irvine, California. You will be given prompt
assistance and return instructions. Send the instrument, transportation
prepaid, to the indicated service facility. Repairs will be made and the instrument returned, transportation prepaid. Repaired products are warranted for
the balance of the original warranty period, or at least 90 days.
Limitation of Warranty
This warranty does not apply to defects resulting from modification or misuse
of any product or part. This warranty also does not apply to fuses, batteries,
or damage from battery leakage.
This warranty is in lieu of all other warranties, expressed or implied, including any implied warranty of merchantability or fitness for a particular use.
Newport Corporation shall not be liable for any indirect, special, or consequential damages.
Statement of Calibration
This instrument has been inspected and tested in accordance with specifications published by Newport Corporation.
The accuracy and calibration of this instrument and photodetector (where
applicable) is traceable to the National Institute for Standards and Technology
through equipment which is calibrated at planned intervals by comparison to
the certified standards maintained at Newport Corporation.
Copyright 1997, Newport Corporation
Part No. 19572-01, Rev. F
IN-04925 (07-97)
ii
Page 4

EC DECLARATION OF CONFORMITY
Active Isolation Module Set Series
We declare that the accompanying product, identified with the
" " mark, meets the intent of the Electromagnetic Compatability
Directive, 89/336/EEC and Low Voltage Directive 73/23/EEC.
Compliance was demonstrated to the following specifications:
EN50081-1 EMISSIONS:
Radiated and conducted emissions per EN55011, Group 1,
Class A
EN50082-1 IMMUNITY:
Electrostatic Discharge per IEC 1000-4-2, severity level 3
Radiated Emission Immunity per IEC 1000-4-3, severity level 2
Fast Burst Transients per IEC 1000-4-4, severity level 3
Surge Immunity per IEC 1000 4-5, severity level 3
IEC SAFETY:
Safety requirements for electrical equipment specified in
IEC 1010-1.
Model 1825-C
Alain Danielo Jeff Cannon
VP European Operations General Manager-Precision Systems
Zone Industrielle 1791 Deere Avenue
45340 Beaune-la-Rolande, France Irvine, Ca. USA
iii
Page 5

Table of Contents
Warranty ...........................................................................................................ii
EC Declaration of Conformity ........................................................................ iii
List of Figures .................................................................................................. vi
List of Tables ................................................................................................... vi
Safety Symbols and Terms ............................................................................ vii
General Warnings and Cautions ................................................................... vii
Abbreviations ................................................................................................ viii
Specifications................................................................................................... ix
Section 1 – General Information
1.1 System Overview ................................................................................... 1
1.2 Scope of this manual ............................................................................. 1
1.3 Unpacking and Inspection .................................................................... 2
1.4 Preparation for Use ............................................................................... 2
1.5 Optional Accessories and Services ..................................................... 2
Section 2 – System Operation
2.1 Introduction ........................................................................................... 3
2.2 Display .................................................................................................... 3
2.3 Front and Rear Panel Controls ............................................................. 4
2.3.1 RANGE ........................................................................................... 5
2.3.2 ZERO ............................................................................................. 5
2.3.3 AVERAGE ...................................................................................... 6
2.3.4 MODE ............................................................................................ 6
2.3.5 CAL Slide Switch .......................................................................... 6
2.3.6 SETUP Dip Switches .................................................................... 7
2.3.7 EXP. ADJ. Rotary Dip................................................................... 7
2.4 Using the System ................................................................................... 7
2.4.1 Battery Charging ......................................................................... 7
2.4.2 Power Up ...................................................................................... 8
2.4.3 Detector Connection and Setup ................................................ 8
2.4.4 Setting the Detector Calibration Factor ................................... 8
2.4.4.1 Calibration Factor Mantissa Entry ................................... 9
2.4.4.2 Calibration Factor Exponent Entry................................... 9
2.4.5 Signal Averaging .......................................................................... 9
2.4.6 Signal Integration ...................................................................... 10
2.4.7 Peak-to-Peak Power Measurement .......................................... 11
2.4.8 Pulse Energy Measurement...................................................... 11
2.4.9 Detector Acceleration Time Constant .................................... 12
2.4.10 Analog Output ............................................................................ 13
Page
iv
Page 6

Section 3 – Principles of Operation
3.1 Introduction ......................................................................................... 14
3.2 Functional Description ........................................................................ 14
3.3 Measurement Considerations ............................................................ 15
3.3.1 Detector Calibration and Accuracy ........................................ 15
3.3.2 Quantum Detector Temperature Effects ................................ 16
3.3.3 Thermopile Detector Temperature Effects ............................ 16
3.3.4 Energy Detector Temperature Effects .................................... 16
3.3.5 Ambient and Stray Light ........................................................... 16
3.4 Performing Basic Measurements ....................................................... 17
3.4.1 Making a CW Power Measurement ......................................... 17
3.4.2 Making a Signal Integration Measurement ............................. 18
3.4.3 Making a Pulse Energy Measurement ..................................... 18
3.4.4 Common Measurement Errors ................................................ 19
3.5 System Accuracy ................................................................................. 19
Section 4 – Test, Maintenance and Troubleshooting
4.1 Maintenance Procedures .................................................................... 20
4.2 Troubleshooting Guide ....................................................................... 20
Section 5 – Factory Service
5.1 Introduction ......................................................................................... 21
5.2 Obtaining Service................................................................................. 21
5.3 Service Form......................................................................................... 23
v
Page 7

List of Figures
Figure 1 Model 1825-C and Accessories.......................................................... 1
Figure 2 Model 1825-C Display ......................................................................... 4
Figure 3 Model 1825-C Front Panel Detail ....................................................... 5
Figure 4 Model 1825-C Rear Panel Detail ........................................................ 5
Figure 5 Detector Setup Table.......................................................................... 8
Figure 6 Integrated Energy from Exposure to an Optical Power ............... 10
Figure 7 Integrated Energy from a Pulse Energy Optical Source ............... 10
Figure 8 Peak-to-Peak and Other Signal Types............................................. 11
Figure 9 Pulse Signal Detection ...................................................................... 12
Figure 10 Detector Time Constant ACCEL. ADJ. Setting ............................... 13
Figure 11 Simplified Model 1825-C Functional Block Diagram ..................... 14
Figure 12 Typical Energy Detector Signal Waveform .................................... 15
List of Tables
Table 1 Model 1825-C Display Annunciators ................................................. 3
Table 2 Model 1825-C Front Panel Controls .................................................. 4
Table 3 MODE Switch Position and Detector Compatibility ....................... 6
Table 4 CAL Slide Switch Functions ............................................................... 6
Table 5 SETUP Dip Switch Functions ............................................................. 7
Table 6 EXP. ADJ. Rotary Dip Switch Settings .............................................. 9
Table 7 Common Measurement Errors ........................................................ 19
Table 8 Symptom/Fault Troubleshooting Guide ........................................ 20
vi
Page 8

Safety Symbols and Terms
The following safety terms are used in this manual:
The Warning heading in this manual explains dangers that could result
in personal injury or death.
The Caution heading in this manual explains hazards that could damage
the instrument.
In addition, a Note heading gives information to the user that may be
beneficial in the use of this instrument.
General Warnings and Cautions
The following general warnings and cautions are applicable to this instrument:
Warning
This instrument is intended for use by qualified personnel who
recognize shock hazards or laser hazards and are familiar with
safety precautions required to avoid possible injury. Read the
instruction manual thoroughly before using, to become familiar
with the instrument’s operations and capabilities.
Warning
The American National Safety Institute (ANSI) states that a shock
hazard exists when probes or sensors are exposed to voltage levels
greater then 42VDC or 42V peak AC. Do not exceed 42V between
any portion of the Model 1825-C (or any attached detector or
probe) and earth ground or a shock hazard will result.
Caution
There are no user serviceable parts inside the Model 1825-C. Work
performed by persons not authorized by Newport may void the
warranty. For instructions on obtaining warranty repair or service
please refer to section 5 of this manual. Do not operate this unit via
its AC Adaptor without the included rechargeable battery pack
installed. Use only the AC Adapter provided with the Model 1825C by Newport.
vii
Page 9

Abbreviations
A amps
AC alternating current
ADC analog-to-digital converter
BAT battery
BIC biconic fiber connector
BNC standard coaxial connector type
°C degrees Centigrade
DC direct current
°F degrees Fahrenheit
Hz hertz (cycles per second)
I-V current-to-voltage converter
kHz kilohertz
kΩ kiloOhms
LSD least significant digit
mA milliamps
mV millivolts
nA nanoamps
nF nanofarads
nm nanometers
P-P peak-to-peak
RH relative humidity
S/N serial number
µA microamps
µs microseconds
V volts
W watts
viii
Page 10

Specifications
Physical Specifications
Dimensions: 3.75 × 7.5 × 9.25 in. (95 × 191 × 235 mm)
Weight: 5 lb (2.3 kg)
Enclosure: Metal case, painted
Connectors: Signal Input BNC; Signal Output BNC;
Power 2.5 mm Phone Jack
Power: 12 VDC, 200 mA unregulated
Battery Life: 20 hours
Battery Type: Lead acid rechargeable, 1000 cycles
Display: 3.5 digit annunciated LED and analog
meter
Reading Rate: 12 Hz Max.
Range Switch: 12 position, 6 decades of gain
Operating Environment: <90 % RH Noncondensing. 5 to 40°C
Storage Environment: <90 % RH Noncondensing. -25 to 60°C
Compatible Detectors: Low-Power Detectors; Except 818-F-SL and
818-F-IR
High-Power Detectors
Energy Detectors; Except 818J-S10
ix
Page 11

Electrical Specifications:
(0)
Position 7
Position 8
Position 9
Position 10
Position 11
Position 12
Position 5
Position 4
Position 3
Position 2
Position 1
Position 6
Range Knob Positions
Range Switch Position 1 & 2 3 & 4 5 & 6 7 & 8 9 & 10 11 & 12
Full scale measurement (divide value by calibration factor mantissa)
Semiconductor 200nA 2µA 20µA 200µA 2mA 20mA
Thermopile 2mV
(2)
2mV 20mV 200mV 2V 20V
Pyroelectric 20mV 200mV 2V 20V 200V 2kV
(1)
(3)
(4)
Relative noise factor (peak-to-peak, measured relative to full scale)
Semiconductor 0.2% 0.02% 0.1% 0.01% 0.01% 0.01%
Thermopile 0.03% 0.03% 0.2% 0.02% 0.02% 0.01%
Pyroelectric 0.3% 0.09% 0.2% 0.02% 0.01% 0.01%
Analog Output Bandwidth
(7)
Semiconductor 150Hz 150Hz 25kHz 25kHz 150kHz 150kHz
Thermopile 5Hz 5Hz 20kHz 20kHz 100kHz 100kHz
Pyroelectric 75kHz 75kHz 75kHz 75kHz 200kHz 200kHz
Full scale analog output ................ 2V
Analog output drift ........................ <0-2% / 1 hour at constant temperature
Analog output offset ...................... <10mV
(5)
Analog output noise
Calibration accuracy ..................... <0.1% + 1% / calibration factor mantissa
.................. <0.1% + relative noise factor × calibration factor
mantissa
(6)
(6)
DC accuracy .................................... <0.2% + calibration accuracy
Analog output accuracy................ <0.3% + DC accuracy
Peak-to-Peak accuracy .................. <0.5% + DC accuracy + analog output noise / 2
Pulse accuracy ............................... <0.5% + DC accuracy + analog output noise / 2
Integration accuracy ..................... <0.7% + DC accuracy + analog output noise / 2
Display resolution.......................... full scale measurement / 2000
Minimum pulse slope .................... 10V / sec
Allowed detector responsivity limits:
2
Semiconductor .......................... 1 × 10
Thermopile ................................ 1 × 10
A/W to 1 × 10⁻⁸ A/W
5
V/W to 1 × 10⁻⁵ V/W
Pyroelectric ............................... 1 × 10⁷ V/J to 1 × 10⁻³ V/J
(0)
Guaranteed after 30 min. warm up period.
(1)
Maximum measurable current is 10mA.
(2)
In Thermopile mode, ranges 1 & 2 are identical to 3 & 4.
(3)
Maximum measurable voltage in Thermopile mode is 2V.
(4)
Maximum measurable voltage in Pyroelectric is 200V.
(5)
Measured with 818-SL, 818T-10 or 818J-25 detector, respectively.
(6)
Calibration factor mantissa range is 1 to 10.
(7)
Amplifier bandwidths are higher internally.
x
Page 12
Section 1
General Information
System Overview
1.1
The Model 1825-C is an accurate and flexible optical power and energy measuring instrument that provides features typically found only on advanced
single purpose optical meters: Simple front panel controls, annunciated digital
and analog displays, and compatibility with Newport’s full line of detector
families allow the Model 1825-C to meet almost any DC, AC peak-to-peak,
pulsed or integrated exposure measurement requirement with minimum fuss.
Compatible with Newport’s Low-Power, High-Power, and Energy detector
families, the Model 1825-C provides the features you need without the expense
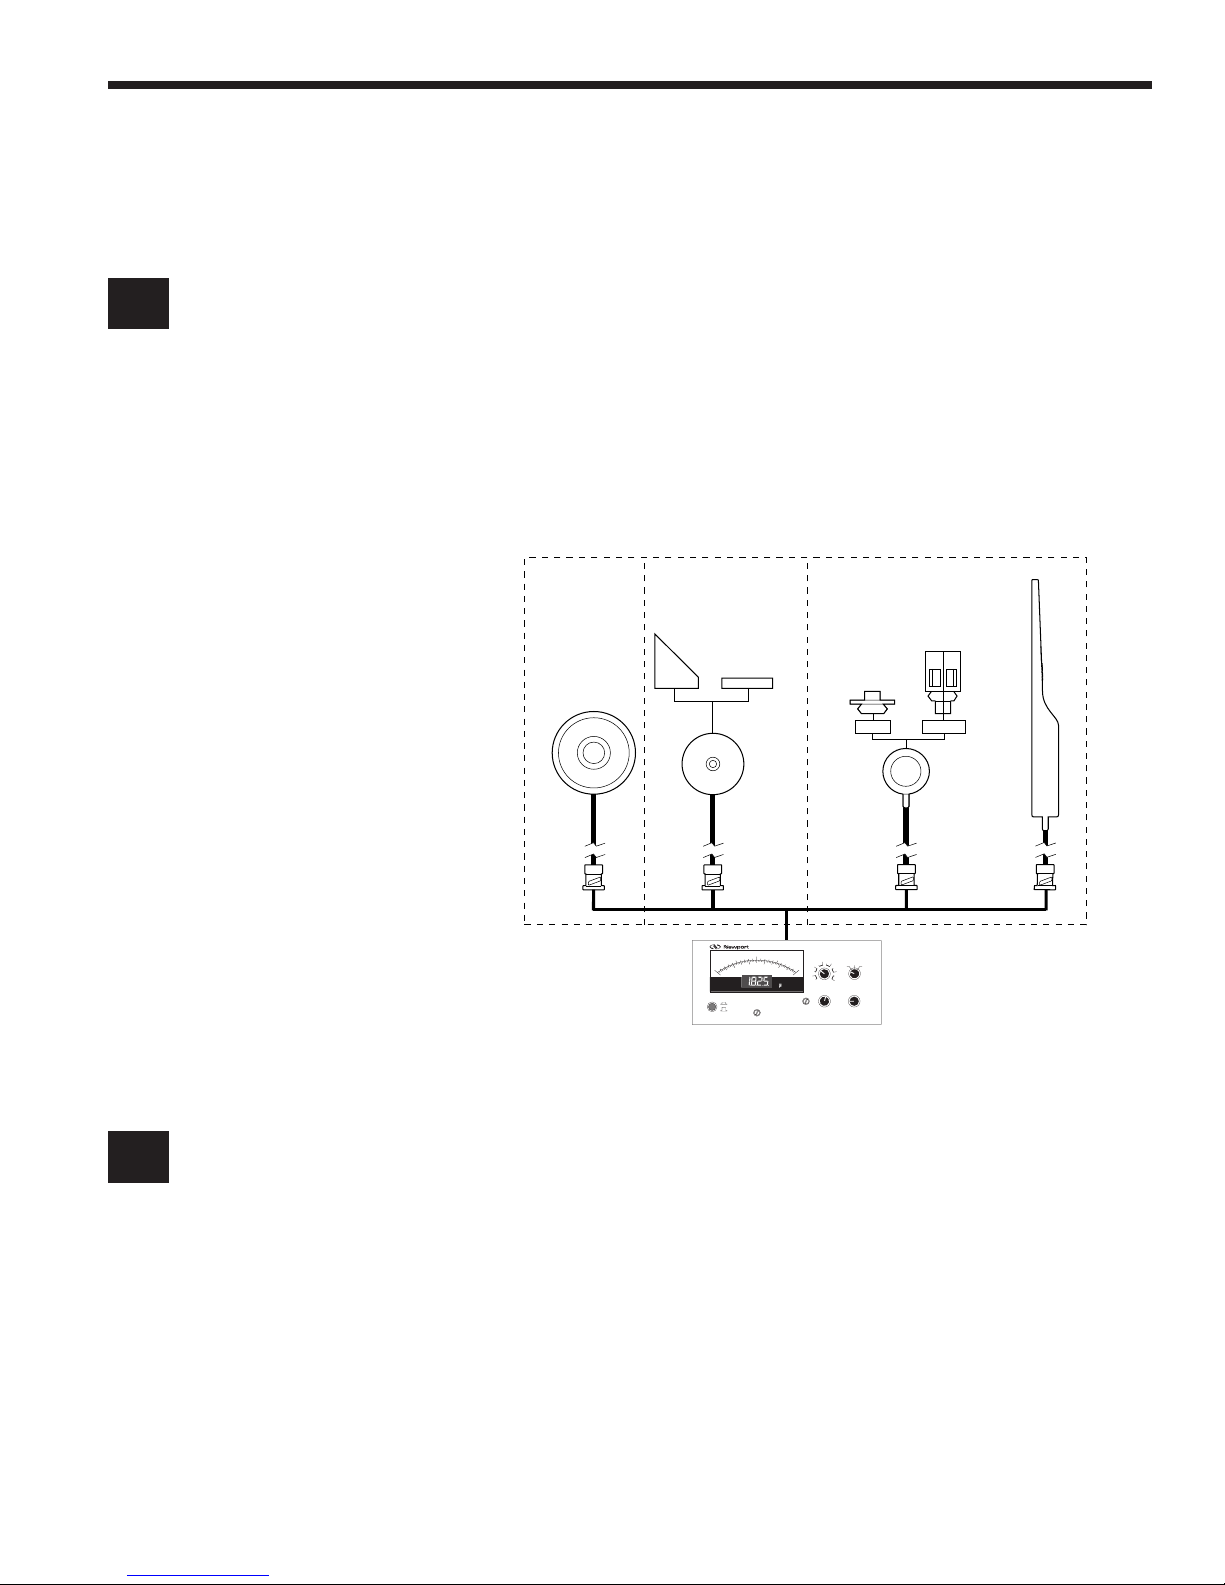
of purchasing multiple single purpose optical meters. The Model 1825-C
Power/Energy Meter and its accessories are presented in Figure 1. Section 1.5
of this manual presents a brief description of compatible Newport detectors.
HIGH-POWER
818T-10
818T-10V
818T-30
818T-30V
818T-150
818T-150X
818T-300
ENERGY
818J-25Q
818J-50Q
818JA-YAG25
818JA-YAG50
818JA-NG254
818JA-NG504
818JA-NG251
818JA-NG504
818JA-9Q
818J-09
818J-09B
818J-25
818J-25B
818J-50
818J-50B
LOW-POWER
FP3-CA1
FP3-CA2
FP3-CA3
FP3-CA4
FP3-CA5
FP3-CA6
818-FA 818-
818-UV
818-SL
818-IR
FP3-FH1
FA2
818-ST
Scope of this manual
1.2
Needle Acc.±2% FS
Figure 1 — Model 1825-C and Accessories
Please carefully read this instruction manual before using the Model 1825-C
Power/Energy Meter. Be especially careful to observe the warnings and
cautions throughout this manual. If any operating instructions are not clear,
contact Newport Corporation.
This instruction manual contains the necessary information for operation and
maintenance of the Newport Model 1825-C Power/Energy Meter as well as
information for troubleshooting and obtaining service if necessary. This
information is divided into the following sections:
• Section 1 provides general information about this manual and the
Model 1825-C.
• Section 2 explains System Operation procedures for the Model 1825-C
and accessories.
1
Page 13

• Section 3 discusses the Principles of Operation of the Model 1825-C.
• Section 4 provides for Test, Maintenance and Adjustment of the Model
1825-C.
• Section 5 provides instructions for obtaining factory service.
Unpacking and
1.3
Inspection
Preparation for Use
1.4
Optional Accessories
1.5
and Services
All Model 1825-C Power/Energy Meters are carefully assembled, tested and
inspected before shipment. Upon receiving this instrument, check for any
obvious signs of physical damage that might have occurred during shipment.
Report any such damage to the shipping agent immediately. Retain the
original packing materials in case reshipment becomes necessary.
The Model 1825-C Power/Energy Meter should have some operations performed before measurements are made. These include:
• Charging the batteries (Section 2.4.1)
• Connection and calibration of the detector (Section 2.4.4)
Many detectors and detector accessories are available for use with the Model
1825-C Power/Energy Meter. In addition, detector accessories are available.
Refer to Figure 1 for the Model 1825-C Power/Energy Meter family tree. For
more information, please refer to the Newport Catalog.
2
Page 14

Section 2
System Operation
Introduction
2.1
Display
2.2
This section contains the information needed to prepare and operate the
Model 1825-C Power/Energy Meter. Operation consists of using the Model
1825-C to perform basic optical power or energy measurements using one of
Newport’s compatible detectors.
The Model 1825-C combines a fast response 3.5 inch analog display with a 3.5
digit annunciated LED display, see Figure 2. The full scale reading of the
analog display alternates between 2 and 5 as the RANGE knob is rotated so
that it can display signals below 2.00 with higher resolution. The analog
display matches the digital display (within ±1 division typ.) and the annunciators always indicate the current measurement units. The digital display is
more accurate than the analog display.
To facilitate measurements of integrated, AC peak-to-peak or pulsed signals,
both the analog and digital displays hold their last value for about 20 seconds
before falling back to zero. If a new signal arrives before the display has reset
itself to zero, the new signal is acquired and displayed.
The BAT annunciator lights when the battery voltage reaches 7 volts and
indicates that recharging is needed. See Section 2.4.1, Battery Charging. To
increase battery life, the digital display dims while the analog display backlight
brightens as ambient light levels decrease. Avoid prolonged operation when
the BAT annunciator is lit, measurement accuracy can degrade. The batteries
are protected from deep discharge damage and will automatically disconnect
when they are discharged below 6V.
If one needs to operate the meter even after the battery discharge protection
is activated, there is no need for waiting for batteries to be charged up. You
can operate the 1825-C as soon as the charger is plugged into it.
Table 1 — Model 1825-C Display Annunciators
Annunciator Comment
BAT Battery voltage has reached 7 volts
(approx. 10% battery life left).
CAL Indicates that the Calibration Factor decimal
number is being displayed
TRIG Indicates that a signal has crossed the
threshold that triggers the meter to take a
reading, (INTG, PULSE and peak-to-peak
modes).
READ Indicates that the meter is showing a valid
reading.
W, J Watt and Joule units annunciators,
respectively.
n, µ, m, k Exponent prefixes for the Watt and Joule
annunciators.
3
Page 15

1
.5
1.5
Front and Rear
2.3
Panel Controls
0
Needle Acc. ±2% FS
READ
1
CAL
2
BATTRIG
Figure 2 — Model 1825-C Display
Operating controls and settings for the Model 1825-C are found on both the
front and rear panels. For general operation, only the front panel controls are
used. The rear panel controls and settings are primarily used for meter/
detector setup. The front panels of the Model 1825-C are shown in Figure 3.
The following table gives a short description of each control:
Table 2 — Model 1825-C Controls
Control Description Comment
POWER Push Button Turns the Model 1825-C on and off
Meter Adjust 1 Turn Trim Pot Unlabeled. Calibrates the analog
CAL 10 Turn Pot Sets the Calibration Factor decimal
3
needle zero, (factory set).
number.
4
m
n
kWJ
2
5
ZERO 10 Turn Knob Zeros the display. Used to elimi-
nate ambient signals and electronic offsets.
AVERAGE 1 Turn Click-Off Knob Turns on and adjusts PULSE/P-P
averaging time.
RANGE 12 Position Knob Adjusts the meter’s signal gain, 12
positions, 6 decades.
MODE 3 Position Knob Sets the meters signal measure-
ment mode: CW, INTEGRATE or
PULSE/P-P.
CAL Slide Switch Selects between CAL, NORMAL
and BEEP operation.
SETUP 8 Switch Dip Bank Configures the meter to the type of
detector being used.
EXP. ADJ. Rotary Dip Switch Sets the Calibration Factor expo-
nent.
ACCEL. ADJ. 10 Turn Trim Pot Sets the thermopile acceleration
time constant.
4
Page 16

0
READ
POWER
1 0 0 0 0 0
0 0 1 1 0 0
0 0 1 0 1 1
0 1 1 0 1 1
O
N
1
0
1 2 3 4 5 6 7 8
■
.5
1
Needle Acc.±2% FS
Power/Energy Meter ■
1
2
1.5
3
4
Model 1825-C
2
5
CAL
BATTRIG
(I )
(O )ONOFF
nmkWJ
CAL
Figure 3 — Model 1825-C Front Panel Detail
- -
LOW-POWER, (SEMICONDUCTOR)
- -
HIGH-POWER, (THERMOPILE)
- -
ENERGY 1 M
- -
ENERGY 50
-
1
PROCESSED OUTPUT
-
0
UNPROCESSED OUTPUT
ACCELERATED
1
NOT ACCELERATED
0
INPUT
Ω
, (PYROELECTRIC)
Ω
, (PYROELECTRIC)
NORMAL
BEEP
CAL
OFF
BEEP
ON
ACCEL
ADJ
EXP
ADJ
RANGE
AVERAGE
OFF MAX
ANALOG
OUTPUT
MODE
INTEGRATE
CW
ZERO
—-
12–18V
- - -
PULSE
P-P
Figure 4 — Model 1825-C Rear Panel Detail
2.3.1 RANGE
The RANGE knob adjusts the signal gain of the Model 1825-C. It has twelve
positions covering 6 decades of signal gain. Intermediate gain positions only
change the full scale reading of the analog display and do not effect either the
digital display or the analog output. Turn the RANGE knob clockwise (counter
clockwise) to decrease (increase) signal gain. The RANGE positions 1 thru 12
with position 1 being the furthest CCW postion, are illustrated in the figure on
page ix.
2.3.2 ZERO
This knob will adjust the display and analog output values down to zero. It is
used to zero the display to remove the effects of ambient signals before
making a measurement. The ZERO function has the capability of offsetting
signals over a 5 decade range. Turn the ZERO knob CW to decrease the
negative (offsetting) signal that is injected.
Always use the ZERO knob to eliminate ambient and/or offset signals to insure
accurate readings.
5
Page 17

2.3.3 AVERAGE
This front panel knob adjusts the PULSE/P-P signal averaging of the Model
1825-C’s display and analog output between off and maximum averaging. Use
this knob to slow down the response of the display when observing noisy
signals. A soft detent indicates the signal averaging “off” position. Averaging
only works in INTEGRATE and PULSE/P-P modes.
2.3.4 MODE
The front panel MODE knob sets the method of signal acquisition that the
Model 1825-C will use with a given detector. Not every mode can be used with
every detector. Table 3, below, indicates which modes are compatible with
the various Newport detector types.
Table 3 — MODE Switch Position and Detector Compatibility
MODE Position Compatible Detectors Comment
CW Low-Power, High-Power Measures average optical
power.
INTEG Low-Power, High-Power Measures energy resulting
from integrated power.
†
P-P
†
PULSE
†
While P-P and PULSE are the same position on the MODE switch, the meter’s
operation will differ due to the settings of the SETUP dip switches for the
different detector types. See Section 2.3.6.
Low-Power Measures peak-to-peak
optical power.
Energy Measures pulse energy.
2.3.5 CAL Slide Switch
The rear panel CAL slide switch performs the functions described in the table
below:
Table 4 — CAL Slide Switch Functions
Switch Position Function
CAL Display the Calibration Factor mantissa.
NORMAL, BEEP OFF Take readings normally.
NORMAL, BEEP ON Take readings normally but beep with each
pulse triggering. (INTEGRATE & PULSE/P-P
modes only)
6
Page 18

2.3.6 SETUP Dip Switches
The rear panel SETUP dip switches configure the meter to the type of Newport
detector that the meter will be used with. The following table identifies the
function each SETUP switch position performs:
Table 5 — SETUP Dip Switch Functions
SETUP Switch Switch Position Function
O
N
1
0
1 2 3 4 5 6 7 8
1 Selects current amplification (1) other-
wise (0).
2 Selects voltage amplification (1) other-
wise (0).
3 Selects 50Ω (1) or 1 MΩ (0) voltage
input impedance for Energy detectors.
4 Selects for the type of detector; High-
Power (1) otherwise (0).
5&6 Selects for the type of detector; Energy
(11) otherwise (00).
7 Selects processed analog output (1) or
unprocessed output (0).
8 Selects accelerated voltage response (1)
or unaccelerated response (0).
2.3.7 EXP. ADJ. Rotary Dip
The rear panel EXP. ADJ. rotary dip adjusts the display annunciator units to
properly account for the sensitivity of a detector’s calibration factor exponent.
This allows the display to adjust between different detectors even when the
responsivities of the two detectors may differ by many decades.
Using the System
2.4
The Model 1825-C Power/Energy Meter does not have a microprocessor. It
relies on the user to properly install the calibration factor describing the
detector and wavelength in use. In order to assure that measurements are
accurately calibrated, please carefully read and follow the instructions regarding the Detector Calibration Factor. See Sections 2.4.4, 2.4.4.1 and 2.4.4.2.
2.4.1 Battery Charging
The lead-acid battery pack in the Model 1825-C is designed to provide many
years of reliable operation before any need of replacement. The battery pack
can be recharged by the AC Adaptor at any time and may be charged indefinitely without damage. The batteries will not discharge through the adaptor if
power is removed. With the meter off, a full charge will be reached after 15
hours. With the meter on, the wall mount power supply will trickle charge the
batteries. If you keep the Model 1825-C continuously connected to wall power,
then it will always have a full charge ready for any portable use measurements.
1. Turn the Model 1825-C off and insert the charging plug into the rear
panel 12V DC input.
2. Plug the AC adaptor into the wall. You may now turn the Model 1825-C
back on.
7
Page 19

NOTE
The battery pack is capable of 1000 to 2000 charge/discharge cycles
before factory replacement is needed. If the battery is continuously
charged, no charge/discharge cycles are accumulated.
NOTE
Prolonged operation after the BAT annunciator lights can cause
inaccurate measurements. Eventually the meter disconnects the
batteries to prevent deep discharge damage.
2.4.2 Power Up
Turn on the Model 1825-C by depressing the POWER button located on the
front of the meter. The digital display should light indicating that the meter is
operating. If the BAT annunciator is lit, operate the meter from the AC adaptor
so the batteries can recharge. See Section 2.4.1.
2.4.3 Detector Connection and Setup
Connect the detector to the INPUT BNC found on the rear of the Model 1825-C.
You may connect or disconnect any Newport Low-Power, High-Power or
Energy detector at any time without damage. Adjust the SETUP dip switches
to reflect the type of Newport detector that the Model 1825-C is being used
with. If you are not using a Newport detector, follow the figure below when
setting up the Model 1825-C. Information from this figure is reproduced on the
rear panel of the Model 1825-C, see Figure 4.
- -
1 0 0 0 0 0
0 0 1 1 0 0
0 0 1 0 1 1
0 1 1 0 1 1
LOW-POWER, (SEMICONDUCTOR)
- -
HIGH-POWER, (THERMOPILE)
- -
ENERGY 1 M
- -
ENERGY 50
-
1
PROCESSED OUTPUT
-
0
UNPROCESSED OUTPUT
ACCELERATED
1
NOT ACCELERATED
0
Ω
, (PYROELECTRIC)
Ω
, (PYROELECTRIC)
O
N
1
0
1 2 3 4 5 6 7 8
Figure 5 — Detector Setup Table
When using a Newport ENERGY ( or pyroelectric) detector check the detector
manual to determine if it should be operated with 50Ω or 1MΩ input impedance.
We recommend operating with UNPROCESSED OUTPUT and NOT ACCELERATED until you have read the manual sections explaining these features.
2.4.4 Setting the Detector Calibration Factor
The calibration factor tells the Model 1825-C how to account for a detector’s
responsivity at the measurement wavelength. Each Newport detector arrives
with a full spectrum calibration report with detector responsivities and
8
Page 20

calibration factors listed in 10 nm increments. A calibration factor is calculated from a responsivity by simply taking the inverse of the responsivity and
expressing it in scientific notation, i.e. “d.ddE±d”. Be sure to re-express the
responsivity value in units of A/W or V/W before calculating the inverse. See
Examples below.
Example 1: Responsivity R = 0.568 A/W thus the Calibration Factor =
1.76 E+0 W/A
Example 2: Responsivity R = 0.346 mV/W thus the Calibration Factor =
2.89 E+3 W/V
2.4.4.1 Calibration Factor Mantissa Entry
The calibration factor mantissa is the “d.dd” portion of the calibration factor
value “d.ddE±d”. The mantissa is the most frequent calibration adjustment
made when making measurements at various wavelengths. To set the mantissa, use the following procedure:
1. Slide the CAL switch to the CAL position.
2. Adjust the front panel CAL potentiometer until the display matches the
calibration factor mantissa.
Example: If the Calibration Factor = 2.89 E+3, then the display should
indicate 2.89.
3. Return the CAL switch to the NORMAL, BEEP OFF (or NORMAL, BEEP
ON) position.
2.4.4.2 Calibration Factor Exponent Entry
The calibration factor exponent is the ±d of the calibration factor value
d.ddE±d. The Model 1825-C accounts for this exponent through its EXP. ADJ.
rotary dip setting. The EXP. ADJ. rarely needs to be set more than once when
using the Model 1825-C with a particular detector. However, it is still wise to
check that the EXP. ADJ. does not need resetting when making measurements
at multiple wavelengths. To set the EXP. ADJ. rotary dip, use the following
lookup table:
Table 6 — EXP. ADJ Rotary Dip Switch Settings
Calibration Factor Exponent -7-6-5-4-3-2-101234567
Low Power Detectors –––––0123456789
High Power Detectors ––0123456789–––
EXP. ADJ.
Dip Setting
Energy Detectors 0123456789–––––
2.4.5 Signal Averaging
The Model 1825-C provides an adjustable low pass filter for signal averaging in
INTEG and PULSE/P-P modes. The effects of averaging cause the display to
slow down its response to changes in signal level. Average feature is disabled
in CW mode. It could be very useful when trying to observe noisy signals, or
signals whose value fluctuates when in PULSE or Peak-to-Peak mode. If
averaging is used in the INTEG mode, accuracy can be lost. We suggest
checking that the use of averaging does not effect the INTEG result in each
measurement situation.
9
Page 21

2.4.6 Signal Integration
The Model 1825-C provides a circuit which measures optical energy by
electronically integrating the signal from a power sensing detector. This mode
of operation is only compatible with Low-Power and High-Power detectors.
Signal integration is enabled when the MODE switch is set to INTEG.
The Model 1825-C uses a self-trigger-on-level method of integration. The TRIG
annunciator lights and remains lit for the length of the integration. After the
pulse integration is completed the READ annunciator lights indicate that the
display value now represents a final result. The display units will indicate
Joules as energy is the time integral of power:
t
EPdt
λλ
()=()
1
∫∫
t
0
Vt
t
()
1
=
t
0
R
λ
()
dt
where:
V(t) = detector signal
R(λ) = detector responsivity
One can measure the accumulated energy from exposure using the INTEG
mode. When a power, P(λ,t), is incident on a power detector, the integration
circuit behaves as is shown in Figure 6 below. The display then reflects the
total energy, E(λ), resulting from the detectors time exposure to the optical
power, P(λ,t).
Input Optical
Power
Signaa
Resultant Detector
Signal
Resultant Integrated
Signal = Energy
P (λ,t)
S (
λ
,t)
1
E (
λ
) = P (λ,t) dt
∫
λ
)
R (
Figure 6 — Integrated Energy from Exposure to an Optical Signal
When a pulse of energy, E(λ), is incident on a High-Power detector’s surface, the
detector responds with a voltage signal reflecting the thermal effects of the
much slower heat pulse that the energy generates. The integration circuit then
measures the energy in the pulse by integrating the voltage pulse, Figure 7.
Input Optical
Pulse Energg
Resultant Voltage
Pulse
Resultant Integrated
Voltage
E (λ)
V (t)
1
E (
λ
) =
R (
V (t) dt
∫
λ
)
Figure 7 — Integrated Energy from a Pulse Energy Optical Source
10
Page 22

2.4.7 Peak-to-Peak Power Measurement
The Model 1825-C allows one to measure AC Peak-to-Peak power when the
MODE switch is set to P-P, (compatible with Low-Power detectors only). Peakto-Peak detection only occurs when the detector signal slope exceeds a
threshold. The result of this is that the Model 1825-C can measure the peak-topeak amplitude of square waves down to DC but cannot detect sinewaves
below 100 Hz. Figure 8 below illustrates the nature of a peak-to-peak signal.
DC Average
AC Peak-to-Peak
DC + AC Peak
Figure 8 — Peak-to-Peak and Other Signal Types
If the CAL slide switch is set to BEEP ON while in the P-P mode, the Model
1825-C will give a short “click” with the arrival of each trigger. This is particularly useful for infrared wavelengths and for listening for changes in the pulse
repetition rate.
2.4.8 Pulse Energy Measurement
The Model 1825-C can measure pulse energies with an Energy detector when
the MODE switch is set to PULSE. (This MODE of operation is only compatible
with Newport Energy detectors.) The Model 1825-C’s PULSE mode automatically accounts for the baseline drift inherent in pyroelectric detectors when
exposed to a pulse train (see Figure 9). As pulse acquisition is slope threshold
triggered, adjustments to the RANGE knob must be made until the TRIG
annunciator lights as each energy pulse arrives. Note that PULSE detection
only occurs when the detectors signal slope exceeds a threshold.
At very low pulse repetition rates, the Model 1825-C will capture and display
each pulse for about 20 seconds before the display falls back to zero. During
this display hold time, the READ annunciator will light to indicate that the
display holds a real reading rather than a signal offset arising from the ZERO
adjustment. If a new pulse arrives before the display has fallen back to zero,
the display simply captures and displays the new pulse.
If the CAL slide switch is set to NORMAL, BEEP ON while in the PULSE mode.
The Model 1825-C will give a short “click” with the arrival of each pulse. This
is particularly useful for infrared wavelengths and for listening for changes in
the pulse repetition rate.
11
Page 23

1.0
0.8
0.6
VOLTS
0.4
0.2
0.0
0.0 0.2 0.4 0.6 0.8 1.0
V
peak
TIME (sec)
Figure 9 — Pulse Signal Detection
2.4.9 Detector Acceleration Time Constant
The Model 1825-C provides a circuit to electronically accelerate the risetime of
Newport’s High-Power thermopile detectors. Acceleration occurs when the
SETUP switch position 8 is set to “1”. A back panel potentiometer, ACCEL
ADJ., is used to adjust the time constant of the acceleration circuit to match
the time constant of the detector. Since most of Newport’s High-Power
detectors have a 1 sec. time constant, the ACCEL ADJ. potentiometer is tuned
at the factory for this time constant. Good results are generally obtained
without having to readjust the ACCEL ADJ.
NOTE
Rise time acceleration is only compatible with Newport High-Power
(thermopile) detectors.
You can set or fine tune the ACCEL ADJ. to your particular detector. This is
especially useful if you are monitoring the processed analog output on an
oscilloscope or other time based or data logging instrument. This adjustment
is required if you are using a High-Power detector that does not have a 1 sec.
time constant. When the ACCEL ADJ. setting does not match the actual time
constant of the attached detector, you will see some overshoot or undershoot
on the processed analog output signal (see Section 2.4.10). To fine tune the
ACCEL ADJ. potentiometer use the following procedure:
1. Set the SETUP dip switch to “0, 0, 1, 1, 0, 0, 1, 1”. Connect your HighPower detector to the Model 1825-C and monitor the analog output on
an oscilloscope.
2. Introduce a step function (or sub-hertz square wave) of optical power to
the High-Power detector. You should observe a signal trace similar to
Figure 10 below.
3. Adjust the ACCEL ADJ. potentiometer on the rear panel until the overshoot or undershoot of the analog output signal is eliminated.
12
Page 24

Input Optical Signal
Actual Thermopile
Detector Signal
Overshoot
Undershoot
Accelerated
Analog Output Signal
Correct
Figure 10 — Detector Time Constant ACCEL. ADJ. Setting
2.4.10 Analog Output
The Model 1825-C provides a 0 to 2 volt BNC analog output for signal monitoring. The analog output voltage reflects actual measurement by being equal to
the digital display’s digits and ignores the decimal point position. Thus, if the
digital display indicates 1.560, then the analog output voltage will be 1.560
volts. If the display indicates 156.0 then the analog signal will still be 1.560
volts.
The analog output can be configured in two ways: “PROCESSED” or “UNPROCESSED”. PROCESSED analog output reflects the cumulative effects of any
signal conditioning such as signal averaging, integration and acceleration.
UNPROCESSED analog output allows one to monitor the natural unconditioned
signal response of the detector. In general, one normally uses the analog
output in its PROCESSED state.
NOTE
The effects of any signal processing always show up on the display.
The PROCESSED or UNPROCESSED degree of freedom in the analog
output is independent of whether signal conditioning is occurring in
the displayed value. For example: Signal averaging can be on and
affecting noise level of the display while the analog output can be
UNPROCESSED and still show the unaveraged noisy detector signal.
13
Page 25

Section 3
Principles of Operation
Introduction
3.1
The Model 1825-C is a multiple function optical meter whose electronics can
adapt to a number of signal measurement tasks. The Model 1825-C can be
configured to measure DC current or voltage, AC peak-to-peak current or
voltage, integrate DC current or voltage, or to accelerate exponential signals to
their final values. This versatility is required to handle the various signals that
Newport’s Low-Power, High-Power and Energy detector families generate.
These detector families are based on semiconductor, thermopile and pyroelectric detectors respectively.
A block diagram of signal flow through the Model 1825-C is shown in Figure 11.
The actual flow through the diagram depends upon the MODE and SETUP
switch settings.
Signal
Accelerator
IN
Voltage
Preamplifier
I
Amplification
Configurable
V
Amplification
Power
Management
Amplifier
Zero
Adjust
Calibration
External
Power
Supply
Adjust
Accel.Not Accel.
Pulse/p-p
Detector
Integrator
Logic
Pulse/p-p
Average
Integration
Pulse/p-p/Integration
Processed Output
CW
Output
Unprocessed
Analog
Output
Amplifier
A/D
Converter
&
Display
Amplifier
Analog
Meter
OUT
3.2
Functional
Description
Figure 11 — Simplified Model 1825-C Functional Block Diagram
The Model 1825-C Power/Energy Meter is a configurable current or voltage
measuring instrument optimized for use with semiconductor photodiodes
(current measurement), disk thermopiles (voltage measurement) or pyroelectric (peak voltage measurement) detectors.
Detector signals are introduced to the Model 1825-C by way of a BNC input
connector. A bank of dip switches found on the back of the Model 1825-C
configures the amplifier as either a transimpedance current amplifier, a 1 MΩ
input impedance voltage amplifier or a 50 Ω or 1 MΩ input impedance peak
reading voltage amplifier. The amplified signal is then further processed via a
Calibration Factor compensation (adjustable signal attenuator) stage and, if
appropriate, a signal averaging circuit, and/or a signal integration circuit and/
or Peak Detector and/or a signal accelerator circuit. The resulting signal is
then sent to the A-D converter and displayed.
14
Page 26

The flexibility of the Model 1825-C is required in order that it may properly
measure the signals that various types of detectors make. Optical power or
energy is related to a detector signal, Sd, in the following way:
S
PEor
()
d
=
R
λ
For semiconductor photodiodes (Newport Low-Power Detectors), Sd, is a
current, Sd=Id. The 1825-C must be able to make sensitive low noise current
measurements to be compatible with these detectors. For thermopile detectors (Newport High-Power Detectors), Sd, is a small voltage, Sd=Vd. The 1825-C
must be able to sense microvolt levels with a 1 MΩ input impedance to be
compatible with these detectors. For pyroelectric pulse energy detectors
(Newport Energy Detectors), Sd, is a peak voltage Sd=Vpk. The Model 1825-C
must be able to capture 2 µsec rise time voltage spikes using either a 50Ω or
1MΩ input impedance to be compatible with these detectors. A typical energy
detector signal in response to a pulse train is shown below in Figure 12.
< 5 µs
Measurements
3.3
Considerations
>10 msec
Figure 12 — Typical Energy Detector Signal Waveform
This section describes detector and attenuator characteristics, optical and
electrical considerations, and environmental influences on optical measurements. In general, the accuracy of measurement with the Model 1825-C is
limited by the calibration accuracy of the detector calibration. Making accurate
measurements of optical power or energy is, however, also dependent upon
properly setting up the Model 1825-C, controlling temperature and illumination
conditions and understanding the factors that affect optical measurements.
3.3.1 Detector Calibration and Accuracy
Newport Corporation calibrates its detectors using secondary standards
directly traceable to the United States National Institute of Science and Technology (NIST) or to Great Britain’s National Physical Laboratory, (NPL). The
details and accuracy of the calibration procedure vary with each detector
model but a detailed description of the calibration results is supplied with
each individually calibrated detector.
In general, detector calibration accuracy varies from 2% to 5% in absolute
terms. Each detector will have some variation in the response to wavelength
and over different sections of its surface. Therefore, for the most reproducible
measurements, light should illuminate the detector as uniformly as possible
over as large an area as practical.
15
Page 27

CAUTION
Avoid focusing a light source onto the detector surface. Inaccurate
readings and possible detector damage may result. Consult the
detector manual for saturation or damage thresholds.
NIST traceability requires that detectors be recalibrated on one year intervals.
As individual detector responses change with time, especially in the ultraviolet, recalibration is necessary to assure confidence in the accuracy of the
measurement. For the most reproducible measurements, the same detector
should always be used for measurements which are to be directly compared.
3.3.2 Quantum Detector Temperature Effects
Semiconductor based photodiode detector characteristics (Newport Corporation Low-Power detectors) are affected by temperature. At longer wave-
lengths, quantum detectors typically lose sensitivity with increasing temperature. Of special note, the detector dark current increases exponentially with
temperature. For silicon detectors, dark current is generally on the order of a
few picoamps at room temperatures. With uncooled germanium detectors,
however, this dark current is on the order of a nanoamp, typically 1,000 to
10,000 times greater than silicon. These dark currents can be zeroed by the
Model 1825-C’s ZERO knob. Since dark currents drift with temperature, the
ZERO should be adjusted just prior to taking any measurements. The noise or
drift in the dark current sets a lower bound on the measurement resolution
which can be achieved with any given detector.
If the detector temperature is constant, sensitivity changes and dark current
drifts are significantly reduced. In addition, if the detector is cooled, the dark
current and dark current noise will decrease. For the most accurate measurements, particularly with germanium detectors, the user should cool the
detector to approximately 0 °C and control the temperature to within ± 1 °C.
3.3.3 Thermopile Detector Temperature Effects
Disk thermopile based detector characteristics (Newport Corporation HighPower detectors) are significantly affected by temperature fluctuations arising
from air flow disturbances. As the detector element is a heat measuring
device, air flow disturbances often set a practical lower limit on the power that
a detector can measure. In order to get the most out of any thermopile
detector, be careful to shield the detector from air flow disturbances. Common sources of disturbance are air conditioners and people walking past the
detector. At small signal levels, thermopiles will also observe people as
radiating infrared sources.
3.3.4 Energy Detector Temperature Effects
Newport Energy detectors are AC coupled devices and thus are not suscep-
tible to temperature induced DC signal offsets or noise floor changes.
3.3.5 Ambient and Stray Light
Ambient and stray light striking the detector will be measured by the Model
1825-C, and should be considered when making careful measurements.
Ambient light can be distinguished from dark current (or the detector/meter
noise floor) by either turning off or blocking the source and covering the
detector face with opaque material such as a piece of black metal. Using the
human hand to cover the detector is not advised because it emits a significant
16
Page 28

amount of infrared radiation. With the detector covered, a reading of the dark
current may be made. Next, remove the material which is covering the
detector and take another reading. The difference is the ambient light level.
NOTE
Changes in ambient light levels can occur from such factors as turning
room lights on or off, or by moving people or equipment. Remember,
if you can see your detector element, then your detector can see the
light bouncing off your shirt!
The effects of ambient light are greatly reduced when using a fiberconnectorized signal input to the detector. If free-space beam measurements
are desired, using an attenuator (Low-Power detectors have an OD3 attenuator included.) will reduce stray light and often improve the source signal to
ambient signal noise level. Wavelength-specific filters, such as optical cutoff,
bandpass, or spike filters can also be used if the signal wavelength spectrum
permits. Other techniques to reduce stray light include using apertures,
placing the detector in a box or other housing to shield the surface from light
(or air currents when using Newport’s High-Power disk thermopile detectors)
which is not coming from the source, and turning off room and other lights.
Performing Basic
3.4
Measurements
Basic measurement techniques for using the Model 1825-C are covered in the
following sections. Also included are methods of background correction and
common measurement errors. In general, the absolute measurement accuracy
is limited by the accuracy of the detector calibration and environmental
factors affecting the detector. See the appropriate detector manual for
specific information on a particular detector model.
3.4.1 Making a CW Power Measurement
The following process describes the procedure for making a basic optical
power measurement while properly removing influence of ambient light and
other drift effects.
1. Set up the meter to reflect the Newport Low-Power or High-Power
detector, the calibration factor at the wavelength of light you will be
making your power measurement at. See Sections 2.4.4 through 2.4.4.2.
Set the MODE knob to CW.
2. Cover or otherwise block the source that you will be measuring and
adjust the RANGE knob until the ambient signal is displayed to three
significant figures.
3. Use the ZERO knob to remove the ambient signal by zeroing the display.
Increase the gain (RANGE knob) and re-zero until the display reaches its
noise floor.
4. Uncover the source and adjust the RANGE knob until the source power
is displayed at least to three significant figures of accuracy.
5. Record the display value and the appropriate units from that RANGE
knobs position. This reading is your optical power.
The process as detailed assumes that the ambient signal is not changing
between when you zero the display (step 3) and when you make your measurement, (step 5). Remember, though, if you can see your detector as you
move around, then your detector can see you as a changing ambient signal!
17
Page 29

3.4.2 Making a Signal Integration Measurement
The following process describes the procedure for making a basic signal
integration measurement while properly removing influence of ambient light
and other drift effects. The Model 1825-C’s self-trigger-on-pulse method of
signal capture requires that the source signal turn on to start the integration
and turn off to stop the integration. This constrains the signal to be some sort
of “pulse”.
1. Set up the meter to reflect the Newport Low-Power or High-Power
detector, the calibration factor at the wavelength of light you will be
making your energy measurement at. See Sections 2.4.4 through 2.4.4.2.
Set the MODE knob to INTEG.
2. Cover or otherwise block the source that you will be measuring and
adjust the RANGE knob until the ambient signal is displayed to three
significant figures.
3. Use the ZERO knob to remove the ambient signal by zeroing the display.
Readjust the RANGE knob and re-zero until the display reaches its noise
floor on the lowest possible range.
4. Now “pulse” the source and adjust the RANGE knob until the TRIG
annunciator lights to indicate that the signal has exceeded the trigger
threshold. When the “pulse” is over, the READ annunciator will light to
indicate that the display contains a good final value. Continue “pulsing”
and adjusting the RANGE knob until the final value shows at least three
significant figures of accuracy.
5. Record the display value and the appropriate units. This reading is your
integrated signal “pulse” energy.
NOTE
The process as described above assumes that ambient “pulse” energy
signals are not changing between when you zero the display (step 3)
and when you make your measurement, (step 5). Fluorescent lamps
are a common source of ambient pulsed light.
3.4.3 Making a Pulse Energy Measurement
The following process describes the procedure for making a basic optical
pulse energy measurement while properly removing influence of ambient light
and other drift effects.
1. Set up the meter to reflect the Newport Energy Detector, the calibration
factor at the wavelength of light you will be making your energy measurement at. See Sections 2.4.4 through 2.4.4.2. Set the MODE knob to
PULSE.
2. Cover or otherwise block the source that you will be measuring and
adjust the RANGE knob until the ambient signal is displayed to three
significant figures.
18
Page 30

3. Use the ZERO knob to remove the ambient signal by zeroing the display.
Readjust the RANGE knob and re-zero until the display reaches its noise
floor at the lowest possible range.
4. Uncover the source and adjust the RANGE knob until the TRIG annunciator lights to indicate that the meter is capturing pulses. Continue
adjusting the RANGE knob until the source pulse energy is displayed to
at least three significant figures of accuracy.
5. Record the display value and the appropriate units from the RANGE
knobs position. This reading is your optical pulse energy.
NOTE
The process as described above assumes that ambient pulse energy
signals are not changing between when you zero the display (step 3)
and when you make your measurement, (step 5). Fluorescent lamps
are a common source of ambient pulsed light.
3.4.4 Common Measurement Errors
The most common sources of optical measurement error are listed in Table 8
below.
Table 7 — Common Measurement Errors
System Accuracy
3.5
Type of Error Type of Detector What should be done?
Radiometry Any Check that all of the light is
actually hitting the detector.
Ambient Light Any Check that any ambient light
was ZEROed before the measurement was made.
Wavelength
Calibration Any Check that the Calibration
Factor for the measurement
wavelength is properly set.
Low Battery Power Any Check that meter is not indicat-
ing low BAT.
Detector Saturation Low-Power Check that the optical power
density remains below the
detector’s saturation threshold.
Meter SETUP
Configuration Any Check that the SETUP dip
switch bank is properly set up
for the detector being used.
The system measurement accuracy of the Model 1825-C Power/Energy Meter
is primarily governed by the calibration accuracy of the attached detector.
The electronic accuracy of the Model 1825-C generally exceeds the calibration
uncertainties of a detector by a decade or more. However, as NIST calibration
capabilities improve, system accuracies will begin to experience the influence
of electronic accuracy uncertainties.
19
Page 31

Section 4
Test, Maintenance and Troubleshooting
Maintenance
4.1
Procedures
Troubleshooting
4.2
Guide
In cleaning the body of this instrument, use only a mild soap & water solution
on a damp cloth.
CAUTION
Do not use acetone or other organic solvents (other than alcohol)
on the Model 1825-C Power/Energy Meter. Organic solvents attack
the paint.
The following troubleshooting guide is intended to isolate and solve problems
with the power meter so that, to the greatest extent possible, the return of the
power meter/detector system to Newport will be unnecessary. For the
problems that cannot be resolved with information in this manual, or for other
situations that are not covered in this section, please see Section 5 for details
on returning your entire system to Newport for service.
Table 8 — Symptom/Fault Troubleshooting Guide
Symptom Possible Fault/Correction
Blank display. Power switch OFF. Turn switch ON.
Batteries drained. Recharge batteries per
Section 2.4.1.
BAT indicator lit. Batteries need charging. Recharge
batteries per Section 2.4.1.
Display value does not change. CAL slide switch set to CAL. Return
switch to center.
Display indicates – – – – Signal overflow. Adjust RANGE knob
clockwise.
Reading is different than expected. See Table 7 Common Measurement
Errors. Section 3.4.4.
20
Page 32

Section 5
Factory Service
Introduction
5.1
Obtaining Service
5.2
This section contains information regarding obtaining factory service for the
Model 1825-C Power/Energy Meter. The user should not attempt any maintenance or service of this instrument and/or accessories beyond the procedures
given in Section 4: Test, Maintenance and Troubleshooting. Any problems
which cannot be resolved using the guidelines listed in Section 4 should be
referred to Newport Corporation factory service personnel. Contact Newport
Corporation or your Newport representative for assistance.
The Model 1825-C contains no user serviceable parts. Its calibration accuracy
is warranted for a period of 1 year. After 1 year, the unit should be returned to
Newport Corporation for recalibration and NIST traceability recertification.
To obtain information concerning factory service, contact Newport Corporation or your Newport representative. Please have the following information
available:
1. Instrument model number (On front panel)
2. Instrument serial number (On rear panel)
3. Description of the problem.
If the instrument is to be returned to Newport Corporation, you will be given a
Return Number, which you should reference in your shipping documents.
Please fill out the service form, located on page 23, and have the information
ready when contacting Newport Corporation. Return the completed service
form with the instrument.
21
Page 33

22
Page 34

Service Form
5.3
Newport Corporation
U.S.A. Office: 949/863-3144
FAX: 949/253-1800
Name ____________________________________________________________________________________
Company ______________________________________________________________________________
Address ________________________________________________________________________________
Country ________________________________________________________________________________
P.O. Number _________________________________________________________________________
RETURN AUTHORIZATION # ______________________________
(Please obtain prior to return of item)
Date __________________________________________________________________
Phone Number __________________________________________________
FAX Number _____________________________________________________
Item(s) Being Returned:
Model # ________________________________________________________ Serial # __________________________________________________________________________________________
Description: _________________________________________________________________________________________________________________________________________________________
Reason for return of goods (please list any specific problems) ______________________________________________________________________________
____________________________________________________________________________________________________________________________________________________________________________
Please complete the below, as appropriate.
List all control settings and describe problem: ______________________________________________________________________________________________________
____________________________________________________________________________________________________________________________________________________________________________
____________________________________________________________________________________________________________________________________________________________________________
_______________________________________________________________________________________________________________ (Attach additional sheets as necessary).
Show a block diagram of your measurement system including all instruments connected (whether power is turned
on or not). Describe signal source. If source is a laser, describe output mode, peak power, pulse width, repetition
rate and energy density.
Where is the measurement being performed?
(factory, controlled laboratory, out-of-doors, etc.) ________________________________________________________________________________________________
What power line voltage is used? ______________________________________________ Variation? __________________________________________________________
Frequency? _____________________________________________________ Ambient Temperature? ________________________________________________________________
Variation? ________________________________________ °F. Rel. Humidity? __________________________________ Other? _________________________________________
Any additional information. (If special modifications have been made by the user, please describe below).
____________________________________________________________________________________________________________________________________________________________________________
____________________________________________________________________________________________________________________________________________________________________________
23
Page 35

24
Page 36

25
Page 37

Visit Newport Online at: www.newport.com
Newport Corporation, Irvine,
California, has been certified compliant with ISO 9001 by the British
Standards Institution.
P/N 19572-01, Rev. F
IN-04925 (04-01)
Printed in the USA
Newport Corporation
Worldwide Headquarters
1791 Deere Avenue
Irvine, CA 92606
(In U.S.): 800-222-6440
Tel: 949-863-3144
Fax: 949-253-1680
Internet: sales@newport.com
 Loading...