

Page 1

Observer User Manual Addendum
802.11b Wireless Installation & O peration
March 2002
Page 2

© 2002 byNetwork Instruments, LLC (Limited Liability Corporation). All rights reserved.
Network Instruments' Observer for use with Microsoft Windows 98/Me, Windows NT 4.x,
Windows2000,WindowsXP,orgreaterbasedcomputers.
“Observer”, “Network Instruments” and th e “N with a dot log o” are registered trademarks of
Network Instruments, LL C, and may be registered in certain jurisdictions.
ii Observer User Manual Addendum (Wireless)
Page 3

Contents
Hardware & Software Support .......................................................................... 1
Supported NICs ............................................................................................1
Supported Microsof t Windows Versions ....................................................1
Network Instruments Custom Driver Installation ............................................ 1
Configuring Observer for Wireless Operation ................................................ 6
New Features for Wireless Support ................................................................. 8
Wireless Access Point Statistics (New Mode)............................................ 8
Wireless Channel Scan Monitor (New Tool) ............................................10
Network (Wireless ) Vital Signs ....................................................................11
Top Talkers (Three New tabs) ....................................................................13
Wireless Types.......................................................................................13
Wireless Speeds.................................................................................... 14
Wireless Latest....................................................................................... 14
The Expert Analysis Wireless Events Button ..............................................15
New Filtering Enhancements ....................................................................17
Router Observer .........................................................................................17
Save Capture Buffer ..................................................................................17
Wireless Observer Troubleshooting .............................................................. 18
© Network Instruments,LLC iii
Page 4

iv Observer User Manual Addendum (Wireless)
Page 5

Observer®Software and Wireless LANs
An Addendum to the Network Instruments Observer User Manual
To use Observer in an 802.11b wireless environment, you mu st follow the instructions
for custom driver installation (see below) and Observer setup (see page 6 of this
manual).
Hardware & Software Support
Supported NICs
• Symbol Spectrum24 - 41x1 models
•Nortel41x1models
• Cisco Aironet 340-350 series models
• Intel 2011b models
Supported Microsoft Windows Versions
•2000
•XP
Network Instruments Custom Driver Installation
For Observer to properly analyze 802.11b wireless packets, the driver must pass
through all of the packets, not just those packets addressed to that NIC (i.e., it must
put the card in ‘promiscuous’ mode). Observer must also h ave access to the ‘raw’
802.11b w ireless packets.
Because standard wireless drivers do not support either raw or promiscuous mode,
NI has written a custom driver so that you can use Obs erver as a wireless protocol
analyzer.
Before you install the driver, you must:
• Verify that the NIC is operating correctly with the manufacturer-supplieddriver as
described in the manufacturer’s installation instructions.
• Install Observer. Refer to the Observer User Manual fo r details. Yo u must install
Observer so that you can update the NIC driver from the O bserver directory.
1
Page 6
Observer® Software and Wireless LANs
To update the driver, follow these steps:
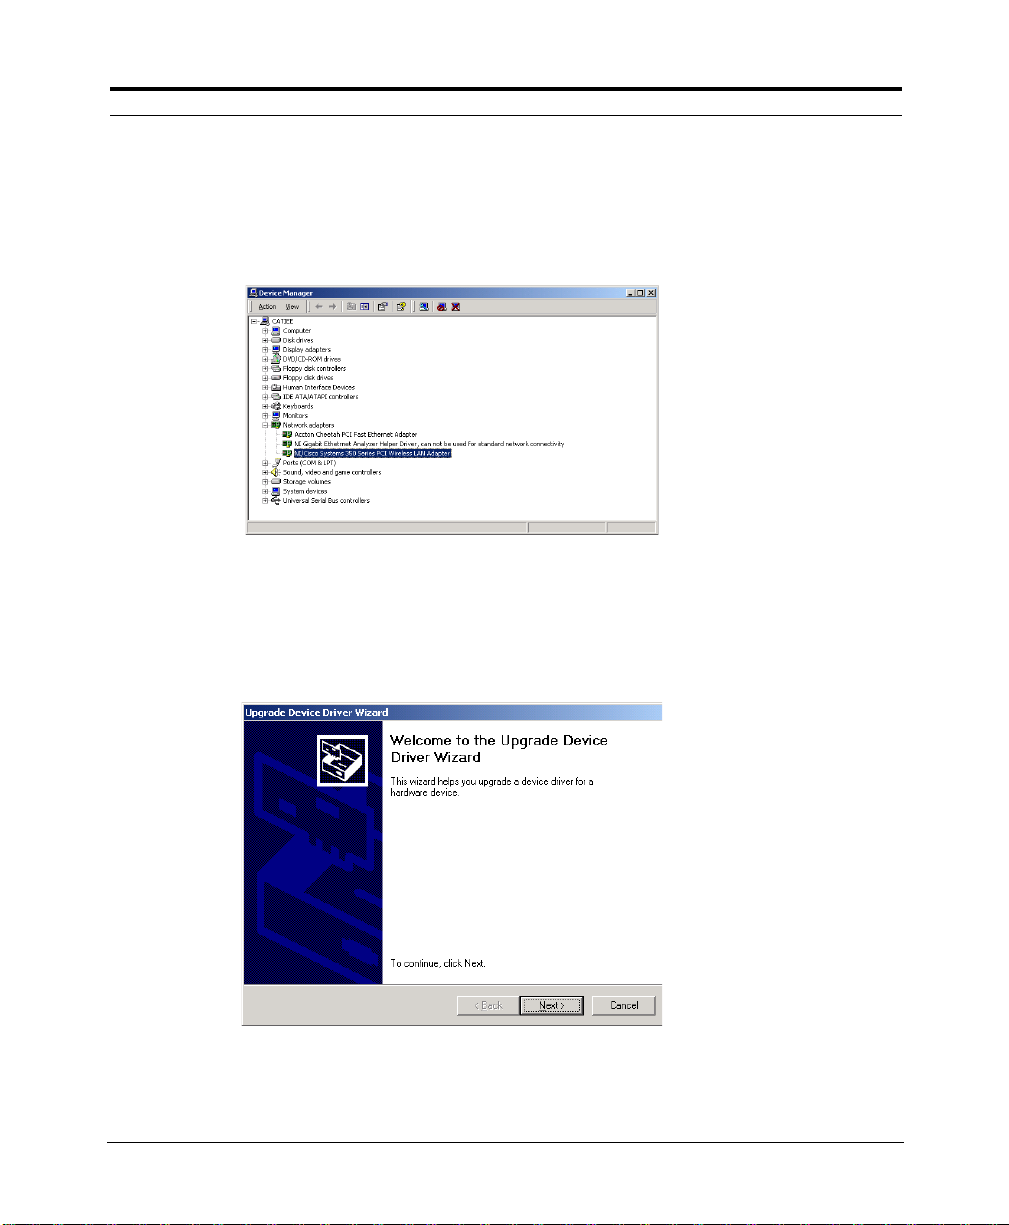
1. Right-click on the ‘My Computer’ icon and choose Properties.
2. Clickthe Hardwaretab and then the DeviceManager... button to display
the Device Manager:
3. Right-click o n the wireless driver (e.g. Nortel Networks e-mobility) and
choose Properties.
4. Click on the Drivertab and then click the Update Driver. .. button. This
starts the Up date HardwareWizard:
5. Click Next.
2 Observer User Manual Addendum(Wireless)
Page 7
Network Instruments Custom Driver Installation
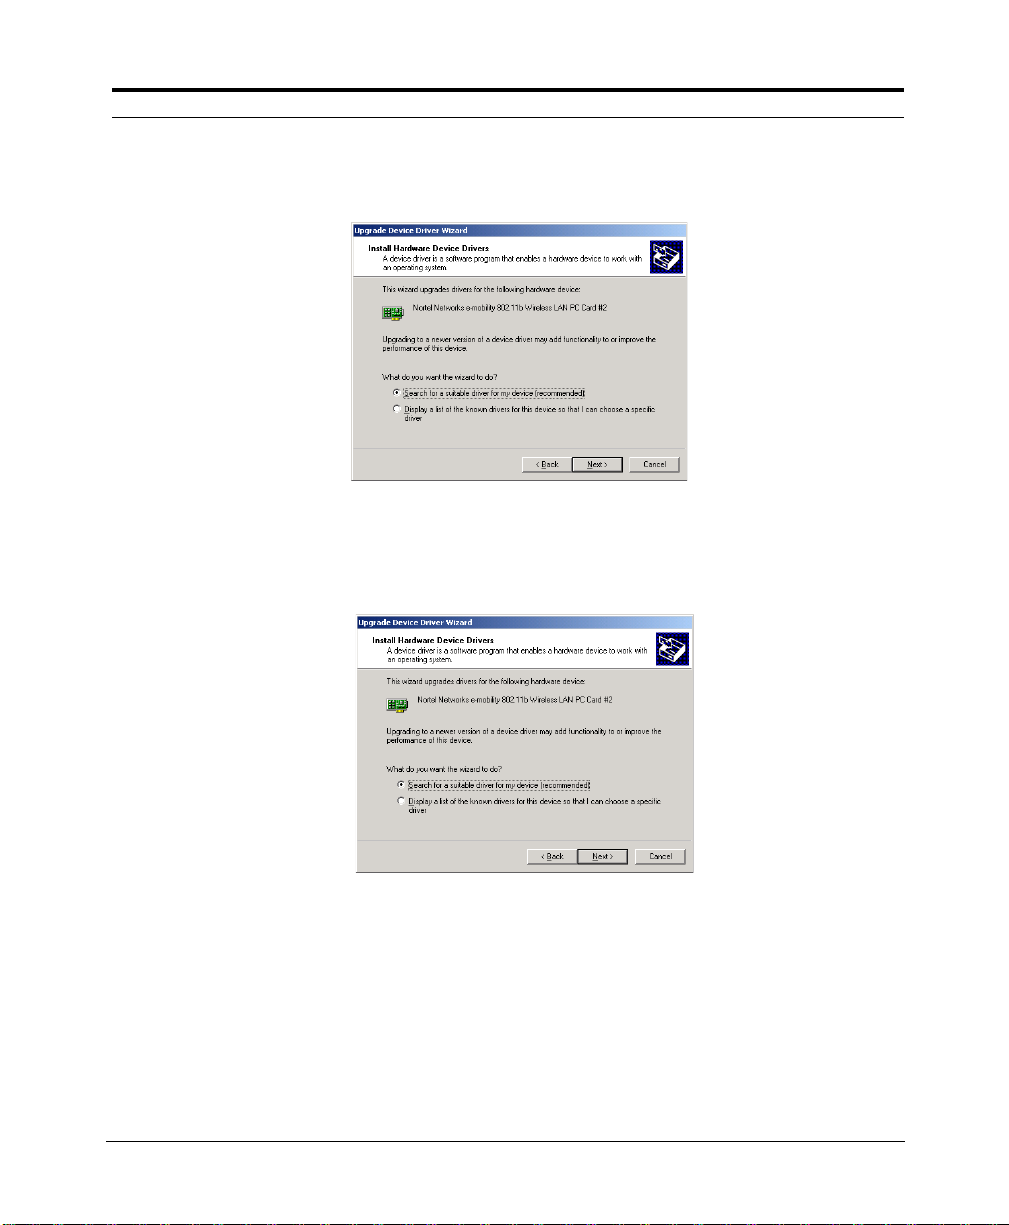
The Wizard asks you how you want to update the driver:
6. Choose“Search for a suitable driver for my device (recommended)”and
click Next. The Wizard asks where you want to search for the driver:
7. Choose“Specify a location” and click Next.
© Network Instruments, LLC
3
Page 8
Observer® Software and Wireless LANs
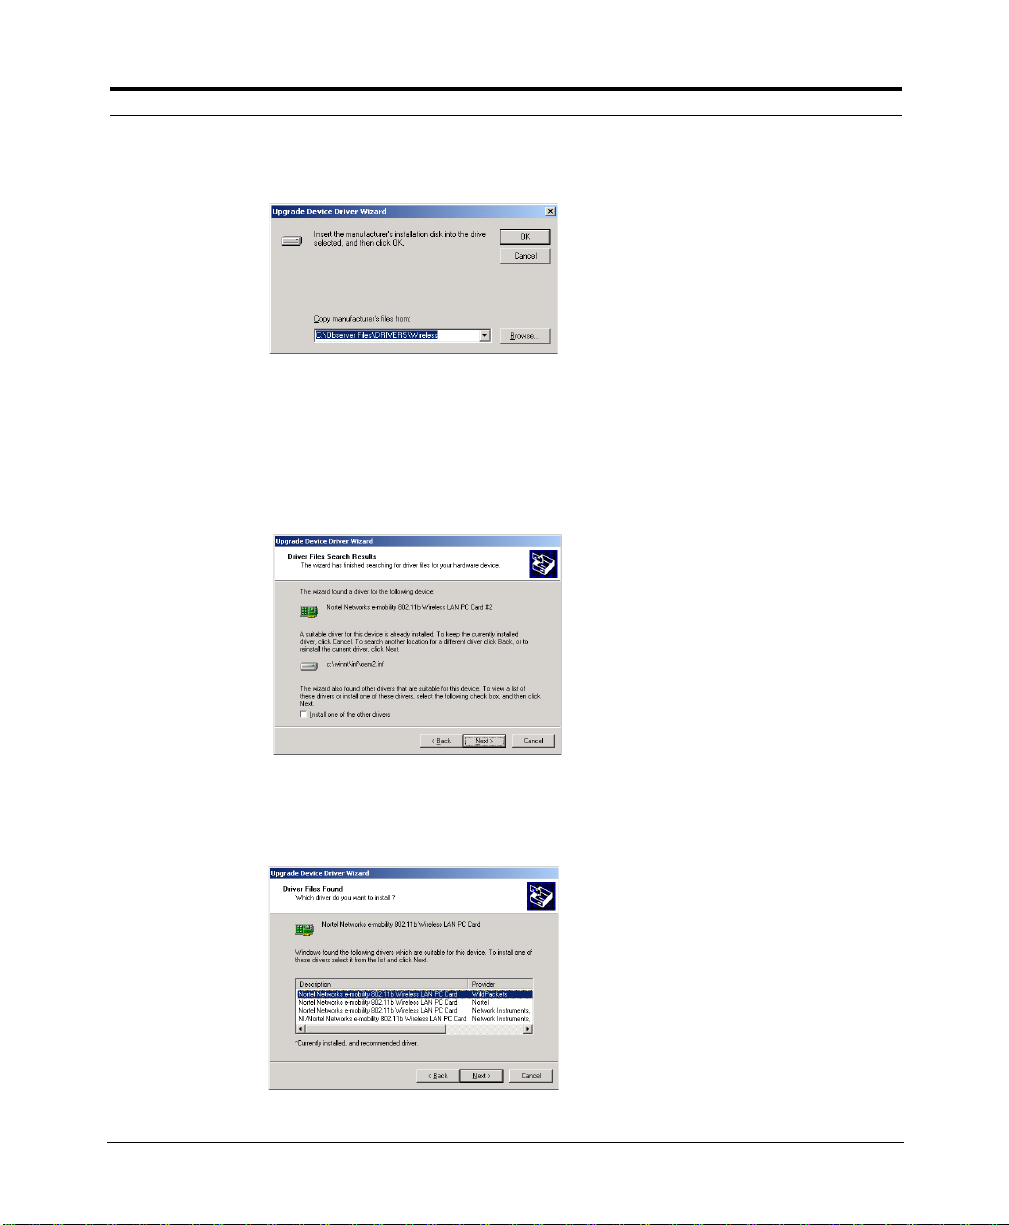
A file locator dialog is d isplayed:
8. Enter (or browse to) the following directory (assuming that C:\Observer
Files is your Observer directory):
C:\Observer Files\drivers\wireless
The Wizard displays the following:
9. Choose“Install one of the other drivers” and click Next.
The wizard displays a list of compatible drivers:
4 Observer User Manual Addendum(Wireless)
Page 9

Network Instruments Custom Driver Installation
10. Choose the appropriateanalyzer driver with the “NI” prefix(“NI/Nortel
Networks e-m obility 802.11b Wireless LAN PC Card,” for example) and
click Next.*
The Wizard infor ms you that the driver lacks a Microsoft digital
signature:
11. Click Yes. Network Instruments has tested the driver and verified that it
works with Windows and with Observ er. When the installation is
complete, click Finish to close the Wizard.
Note that you can switch wireless operation between analyzer (i.e.,
“promiscuous”) mode and standard NIC mode without re-installing the
driver.
*Thetablebelow shows what driver to select for each of the supported
wireless NICs:
NIC Analyzer Driver
Symbol Spectrum24 - 41x1 models
NI/Symbol LA-41x1 [or 41x3]
Spectrum24 Wireless LAN PCMCIA [or
PCI] Card Driver
Nortel 41x1 models
NI/Nortel Networks e- mobility 802.11b
Wireless LAN PC [or PCI] Card Driver
CiscoAironet340-350 series models
NI/Cisco Systems 340 [or 350] Series
PCMCIA [or PCI] Wireless LAN Adapter
Intel 2011b models
NI/Intel(R) PRO/Wireless [or PRO/ 11
Wireless] 2011 LAN PC [or PCI ] Card
Driver
© Network Instruments, LLC
5
Page 10

Observer® Software and Wireless LANs
Configuring Observer for Wireless Operation
Once you hav e installed the wireless NIC and Network Ins truments’ custom
driver, y ou will be able to see the wireless Probe in the Probe List. Check the
setup options before yo u begin capturing pac kets.
1. Start Observer. If the new wireless card is the only installed N IC in your
system, the wireless Probe will appear in the Probe List under the
Wireless Advanced Probes heading.
If the wireless card is installed along with other NICs, you may have to
Select a Different Network Adapter by choosing that option from the
Tools menu (or by clicking the NIC icon on the toolbar). Observer will
display the list of available cards. Select the NI Analyzer driver for your
wireless NIC.
2. Once the wireless Probe appears in the Probe list, right c lick on it and
chooseProbe or Device Properties…, which displays the Local Observer
Configuration dialog.
3. Click on the 802.11b tab to display w ireless properties:
4. Set the wireless configuration options to match your ne twork.
Notethat if your wireless network is configured for WEP,you must
activate WEP and enter the WEP key(s) in the Edit WEP Keys dialog in
Observer.
6 Observer User Manual Addendum(Wireless)
Page 11

Configuring Observer for Wireless Operation
The configuration options are described below:
Option Description
Site Profiles Site Profiles let mobile users save and retrieve wireless parameters,
rather than re-keying the parameters every time you change sites.
Monitor Traffic By Choosethe method to monitortraffic. The three available methods
WEP Encryption ChooseWirelessEquivalency Privacy encryptionsettings. To use
Antennatouse Specify the type of antenna connectedto your system:
are as f ollows (choose one):
Channel
BSSID
ESSID
Scan Channels
WEP,checkthe“UseWEPkeysto decryptwirelesstraff ic” checkbox
and click Edit WEP Keys... to enter the appropriate encryption keys.
Antenna
Diversity
Primary
Antenna
Only
Specify a channel to monitor.
Specify the Basic Service Set ID of the Access
Point you want to monitor.
Specify the ExtendedService Set ID of the networkyouwanttomonitor.
(Only available if you have chosen to monitor by
Channel) Scan the selectedchannels.To select
channels to scan, click Channel Map…
Use the stronger signal from the two antenna
ports. This is the recommended setting for the
standard snap-on antenna.
Ifyou are not usingthestandard snap on antenna,
choose this option if the antenna you are using is
connected to the primary antennaport (see your
NIC manual for details).
Secondary
Antenna
Only
Ifyou are not usingthestandard snap on antenna,
choose this option if the antenna you are using is
connected to the secondary antenna port (see
your NIC manual for details).
© Network Instruments, LLC
7
Page 12

Observer® Software and Wireless LANs
New Features for Wireless Support
In addition to decoding and analyzing 802.11b wireless LANs (W LANs),
Observer has updated a number o f statistical modes and added some new
ones. Thes e new and updated features are described in the sections that
follow.
Wireless Access Point Statistics (New Mode)
This mode is available on the
through a wireless device or Probe.
The Access Point Statistics mode shows traffic passing through any Access Points
(APs) visible to the Observer wireless N IC. This mode is an all-purpose tool for
maintaining performance and security on a W LAN that uses APs, show ing yo u:
• Wireless stations that are connected to an AP
• Non-wired stations that they communicate with
• Levels of signal strength, quality, data transfer r ates, an d non-data
transfer rates on each station on the access point
• AP traffic totals
For example,you can immediately see if there is a station connected to the
wrong AP, or if an unauthori zed AP has been installed. AP statistics will
display whether a station has a problem with quality or range of connection
based on the number of reassociations and retransmissions , or whe ther a
station is misconfigured based on station poll totals.
Statistics
menu whenever Observer is analyzing
The table below describes each statistic.
Notethat some columnsare turned off by default; right click on the
columnheading to set which statisticsyou want to display.
Statistic Description
Access Point The MAC address of the Access Point for this row of statistics.
Station The MAC address or alias of the station communicating with the AP.
Type The type of device connected to the AP: aa wireless station, a station
Avg Strength (%) The average strengthof the signal, expressed as a percentage of the
(unwired), or anotherAccessPoint.
optimumstrength.
8 Observer User Manual Addendum(Wireless)
Page 13

New Features for Wireless Support
Statistic Description
Avg Quality(%) The average signal-to-noise ratio of thesignal,expressed as a percent-
age of the optimum.
Avg Data Rate The average rate of data packets on the wireless network.
Avg Rate The average rate of all packets (data+control+management+beacon)
on the wireless network.
Packets The total number of packets seen.
Data pkts
(Directed)
Multicasts Thetotalnumberof multicast packetsseen.
Bytes The total number of bytes seen.
CRC Thetotalnumberof CRC errors reportedby the AP.
Retries The total number of transmission retries reportedby the AP.
Associations The number of associations (connection sessions) that have been
Station Polls The total number of poll requests by station; a high number means that
Min Quality The poorest quality signal seen, expressed as a percentage of the
Max Quality The best quality signal seen, expressed as a percentage of the
Latest Quality Thequalityof the signalas seen at the last poll.
Min Strength Thelowest strengthsignal seen,expressed as a percentage of the
Max Strength The highest strength signal seen, expressed as a percentage of the
The total number of data packets seen.
established with this AP.
a stationcannot connectto an AP. In the 802.11bprotocol,a station first
pollsfor an AP, then associateswith a respondingAP.
optimum.
optimum.
optimum.
optimum.
Latest Strength The strength of the signal seen at the last poll.
Min Data Rate The slowestdata rate seen,expressed in Mbits/sec.
Max Data Rate The fastest data rate seen, expressedin Mbits/sec.
Latest Data Rate The data rate seen at the last poll.
© Network Instruments, LLC
9
Page 14

Observer® Software and Wireless LANs
Statistic Description
Min Rate The slowest rate of total packet throughput seen, expressed in Mbits/
sec.
Max Rate The fastest rate of total packet throughput seen, expressed in Mbits/
sec.
Latest Rate The rate of total packet throughput seen at the last poll.
Wireless Channel Scan Monitor (New Tool)
The Wireless Channel Scan Monitor shows activity by channels on your
wireless network. This mode is available on the Toolsmenu.
Two things to note a bout the channel scan monitor:
• You must set the channels to scan in the Probe or Device Properties
dialog (see page 6 of this manual).
• When Observer is scanning channels, the other modes (such as Top
Talkers, Access Point Statitistics) will no longer be able to present
complete view of the networ k, as Observer’s data sample is limited to the
current channe l being s canned. Therefore, you should only use the
Channel Scan monitor by itself.
The table below describes each Channel Scan Monitor statistic in detail.
Note that some fields are hidden by default; to reconfigure the display,
right-click on the statistics column heading:
Statistic Description
Channel Channelbeingtrackedin this row of data.
Avg Strength (%) The average strengthof the signal, expressed as a percentage of
the optimum strength.
Avg Quality(%) The average signal-to-noise ratio of the signal, expressedas a per-
centage of the optimum.
Avg Data Rate The rate of data packets on the wireless network.
Avg Rate The rate of all packets (data+control+management+beacon) on the
CRC Total number of CRC errors reported on this channel.
wireless network.
10 ObserverUser Manual Addendum(Wireless)
Page 15

New Features for Wireless Support
Statistic Description
Packets Total number of packets(data+control+management+beacon) seen.
Data pkts
(directed)
Beacons T otal number of beacons seen.
Bytes Total number of bytes seen.
Retries T otal number of retries reported on this channel.
Min Quality The poorest quality signal seen, expressed as a percentage of the
Max Quality The best quality signal seen, expressedas a percentageof the opti-
Latest Quality Thequalityof the signalas seen at the last poll.
Min Strength Thelowest strengthsignal seen,expressed as a percentage of the
Max Strength The highest strength signal seen, expressed as a percentage of the
Latest Strength The strength of the signal seen at the last poll.
Min Data Rate The slowestdata rate seen,expressed in Mbits/sec.
Max Data Rate The fastest data rate seen, expressedin Mbits/sec.
Latest Data Rate The data rate seen at the last poll.
Min Rate The slowest rate of total throughputseen, expressed in Mbits/sec.
Total number of data packets (packets with a payload and an
address)seen.
optimum.
mum.
optimum.
optimum.
Max Rate
Latest Rate Therate of total packetthroughput seen at the last poll.
The fastest rate of total packet throughput seen, expressed in Mbits/sec.
Network (Wireless) Vital Signs
To start Vital Signs, select Statistics from the main menu, then Network Vital
Signs.
The Wireless Vital Signs mode show s current wireless activity mapped with
curren t wireless error conditions on your WLAN. The Vital Signs mode
displaysa comprehensive snapshot of error c onditions and of their criticality
in the context of current WLAN activity. To pin down aggregate problems
© Network Instruments, LLC
11
Page 16

Observer® Software and Wireless LANs
revealed by Wireless Vital Signs, go to Access Point Statistics, Top Talkers, an d
Errors by Station.
Another way to use this "at-a-glance" view of network health is to install
Observer on a wireless laptop and watch what happens to the vital signs as
you move the system around your office.
The display below shows the “dial view” of Wireless Vital Signs. Other views
are available b y clicking the different view buttons on the tool bar to the left of
the graph display:
In Dial View, vital s igns are plotted against 4 axes, each representing one of
the four 802.11b-defined bit rates: 1, 2, 5.5, and 11 Mbits/sec. This allows you
to see the relationships between:
• Data Packets (packets w ith a payload)
• Non-Data Packets (control, management, and beacon)
• Errors of all types, brokendown by type in the table to the right o f the graph
display .
12 ObserverUser Manual Addendum(Wireless)
Page 17

New Features for Wireless Support
This lets you immediately see each statistic in its proper context. For exa mple,
an error rate of 50% is insignificant if O bserver has only analyzed two
packets, but quite s ignificant if thousands of packets have been analyzed.
The b ar graphs to the right of the dial show current bandwidth utilization (U),
the average strength (S), and the average quality (Q) of the signal. These
metersalso indicate(with watermark“floats”)the minimum and maximum
values tha t Observer has seen since the last polling period.
Top Talkers (Three New tabs)
The Top Talkers statistical mode displays three tabs showing wireless data
when Observer is capturing packets via t he wireless N IC : Wireless Types,
Wireless Speeds, and Wirel ess Latest These tabs are described in d etail below.
Wireless Types
This display shows the type of each station sensed in the air: whether it is a
LAN station talking over the air to wireless stations, a wireless station, or an
AP. For stations, it shows which APs they are using. For APs, it displays the
Service S et Identifier (SSID) and whether WEP is enabled o n that AP. It also
displays Control, Data and M anagement totals per station. As with other
tabular displays in Observer, right-click on the column headings to configure
the column view.
Statistic Description
Alias Alias of the Top Talker system, if one is available.
Address Media Access Control (MAC) address, i.e., the “hardware address.”
Packets T he total number of packets sent by the system.
Management The number of managementpackets sent by the system.
Control The number of control packets sent by the system.
Data The number of data packets sent by the system.
Probe Request The number probe requests sent by the system.
Retries The number of transmission retriessent by the system.
Type The type of station: Wirelessor Access Point
AP Used The access point used by the system.
© Network Instruments, LLC
13
Page 18

Observer® Software and Wireless LANs
Wireless Speeds
This tab shows details of signal strength, quality, the overall rate and data
rate, as well as the packet d istributions for different rates. A s with all of the
statistical displays in Observer,you can configure the mode to display only
the statistics that you are currently interested in by right-clicking on the
column headers.
Statistic Description
Alias Alias of the TopTalker system, if one is available.
Address MediaAccessControl(MAC) address,i.e., the “hardware address.”
Packets The total number of packetssent by the system.
Avg Strength (%) The average strength of the signal, expressed as a percentage of
the optimum strength.
Avg Quality (%) The average signal-to-noise ratio of the signal, expressed as a per-
centage of the optimum.
Avg Data Rate The rate of data packets on the wireless network.
Avg speed The speed of all packets (data+control+management+beacon) on
Util % The percentage of bandwidth utilized.
Pkt 1 The number of packetscaptured at 1Mbit/sec.
Pkt 2 The number of packetscaptured at 2Mbit/sec.
Pkt 5.5 The number of packetscapturedat 5.5Mbit/sec.
Pkt 11 The number of packetscapturedat 11Mbit/sec.
the wireless network.
Wireless Latest
This tab shows the strength, quality, and speed of the wireless network, as
seen at the last poll, as opposed t o the other Top Talker displays, w hich
present running averages.
14 ObserverUser Manual Addendum(Wireless)
Page 19

New Features for Wireless Support
The Expert Analysis Wireless Events Button
Expert Mode can be used in both real time and post-capture:
• For real-time analysis, when capturing pack ets, select the View icon
from Packet Capture. Then select the Expert Analysis tab at the bottom of
thedecodedisplay.
• For post-capture analysis, open a (previously captured) buffer and select
the "Expert Analysis" tab at the bottom of the decode display.
The Expert Analysis tab includes a Wireless Events button on the toolbar
along the left of the display. O bserver tracks network conditions between
wireless stations and logs:
• The station sending and the station receiving the wireless event.
• A color-coded status indicator showing the criticality of the event (each
level of criticality can be configured by clicking the Expert Thresholds
icon to the left of the Expert Analysis window.
• The number of packets going in each direction for the event.
• The number of association attempts from the sending an d receiving
stations.
• Cyclical Re dundancy Check/Phys ical Layer Convergence Protocol
(CRC/PLCP) errors reported on t he sending and receiving stations.
• Equivalency Privacy (WEP) encryption/decryption errors reported on
the sending and receiving stations.
Expert Analysis also displays the following conditions: weak signal and low
signal quality per station, missed A CKs, failed associations, and whether
WEP is used on a particular AP or station.
© Network Instruments, LLC
15
Page 20

Observer® Software and Wireless LANs
The tracked Wireless Events are described below.
Event Description
Station 1->
<-Station 2
Status Displays a colored box indicatingthe status of the conversation.
Packets->
<-Packets
Associations->
<-Associations
CRC/PLCP Errors>
<-CRC/PLCP
Errors
WEP Decode
Errors->
<-WEP Decode
Errors
Showsthe wireless stationsendingand the wireless
station receiving. Where possible, the client is listed first and server
second.
Red indicates a critical event has occurred.
Yellow indicates a marginal event has occurred.
Green indicates that the conversation’s communication is within
acceptable event parameters.
A red or yellow status will display when any expert event for the pair
occurs. You can customize the criticality thresholds by clicking the
ExpertThresholdsicon to the left of the ExpertAnalysiswin-
dow.
Displays the number of packets in each direction of the pair’s communication.
The number of a ssociationattempts from the sending and receiving
stations.
Thenumber of cyclicalredundancy check/physical layerconvergence
errors reported on the sending and receiving stations.
The number of Wireless Equivalency Privacy encryption/decryption
errors reported on the sending and receiving stations.
Note also that the Expert Summary now displays w ireless events.
16 ObserverUser Manual Addendum(Wireless)
Page 21

New Features for Wireless Support
New Filtering Enhancements
You can now filter by the wireless access point hardware address in addition
to the standard MAC address and IP address filtering that has always been
available i n Observer. You can choose to either capture or exclude packets by
the AP.
Router Observer
Router Observer mode now shows statistics for wireless access points as well
as routers.
Save Capture Buffer
You can apply WEP decryption by supplying the key profiles in the Save
Capture Buffer dialog. These are the same key profiles configured in the
Device or Probe Properties dialog described on page 6 of this manual.
© Network Instruments, LLC
17
Page 22

Observer® Software and Wireless LANs
Wireless Observer Troubleshooting
Most problems with wireless analysis are the result of problems unrelated to
the Observer softw are or its configuration, such as unconfigured or
incorrectly configured W EP keys. Make sure that you have the wireless NIC
working with your network as described in the vendor supplied manuals
before you install Observer or the Network Instruments custom NIC driver.
The table below describes some problems t h at you might run into, their likely
causes, and the remedies to correct the problems.
Symptom Possible C ause Remedy
Observer does not display
any protocol or IP statistics.
Expert Analysis doesn’t
display anything.
Network drive becomes
disconnected after running
Observer.
Wireless NIC becomes disassociated after running
Observer
WEP not activated, or incorrect WEP key(s).
WEP not activated, or incorrect WEP key(s).
This can happenwhen you
reconfigure the driver (either
throughvendor utilities or
Windows) while Observer is
running.
This can happenwhen you
reconfigure the driver (either
throughvendor utilities or
Windows) while Observer is
running.
Configure the WEP key(s).
See
Configuring
Observer for Wireless
Operation on page 6
this manual.
Configure the WEP key(s).
See
Configuring
of
Observer for Wireless
Operation on page 6
this manual.
UseExplorertoreconnectto
the drive.
Re-install and configure the
Network Instruments wirelessanalyzerdriver.
of
18 ObserverUser Manual Addendum(Wireless)
Page 23

NOTES
© 2002 Network Instrument s, LLC 19
Page 24

8800 West Highway Seven, Fourth Floor, Minneapolis, MN 55426 USA
phone 952.932.9899 • fax 952.932.9545
info@net w ork in s tru ments.com
www.NETWORKINSTRUMENTS.com
© 2002 Network Instruments, LLC. Network Instruments, Observer, and
the "N with a dot" logo are registered trademarks of Network
Instruments, LLC, Minneapolis, MN USA.
 Loading...