

Page 1

GIGASTOR
™
rev. 1
1
Page 2

Page 3

GigaStor User Guide
rev. 1
3
Page 4

Trademark Notices
©2008 Network Instruments,® LLC. All rights reserved. Network Instruments, Observer® Gen2,TM and all associated logos are
trademarks or registered trademarks of Network Instruments, LLC.
Open Source Copyright Notices
Portions of this product include software developed by the OpenSSL Project for use in the OpenSSL Toolkit. (http://
www.openssl.org/), Copyright © 1998-2008 The OpenSSL Project. All rights reserved.
Portions of this product include software written by the University of Cambridge, Copyright © 1997-2008 University of
Cambridge All rights reserved. Redistribution and use in source and binary forms, with or without modification, are
permitted provided that the following conditions are met:
Redistributions of source code must retain the above copyright notice, this list of conditions and the following disclaimer.
Redistributions in binary form must reproduce the above copyright notice, this list of conditions and the following
disclaimer in the documentation and/or other materials provided with the distribution.
Neither the name of the University of Cambridge nor the name of Google Inc. nor the names of their contributors may be
used to endorse or promote products derived from this software without specific prior written permission.
THIS SOFTWARE IS PROVIDED BY THE COPYRIGHT HOLDERS AND CONTRIBUTORS “AS IS” AND ANY EXPRESS OR IMPLIED
WARRANTIES, INCLUDING, BUT NOT LIMITED TO, THE IMPLIED WARRANTIES OF MERCHANTABILITY AND FITNESS FOR A
PARTICULAR PURPOSE ARE DISCLAIMED. IN NO EVENT SHALL THE COPYRIGHT OWNER OR CONTRIBUTORS BE LIABLE FOR
ANY DIRECT, INDIRECT, INCIDENTAL, SPECIAL, EXEMPLARY, OR CONSEQUENTIAL DAMAGES (INCLUDING, BUT NOT LIMITED
TO, PROCUREMENT OF SUBSTITUTE GOODS OR SERVICES; LOSS OF USE, DATA, OR PROFITS; OR BUSINESS INTERRUPTION)
HOWEVER CAUSED AND ON ANY THEORY OF LIABILITY, WHETHER IN CONTRACT, STRICT LIABILITY, OR TORT (INCLUDING
NEGLIGENCE OR OTHERWISE) ARISING IN ANY WAY OUT OF THE USE OF THIS SOFTWARE, EVEN IF ADVISED OF THE
POSSIBILITY OF SUCH DAMAGE.
Limited Warranty—Hardware
Network Instruments, LLC. (“Network Instruments”) warrants this hardware product against defects in materials and
workmanship for a period of 90 days from the date of shipment of the product from Network Instruments, LLC. Warranty is
for depot service at Network Instruments corporate headquarters in Minneapolis, MN, or Network Instruments’ London, UK
office. Warranties and licenses may give you more coverage in certain local jurisdictions; Network Instruments also offers
extended warranties as part of its maintenance agreement program.
If a defect exists during the initial warranty period or prior to expiration of a pre-paid maintenance program, at its option
Network Instruments will (1) repair the product at no charge, using new or refurbished replacement parts, or (2) exchange
the product with a product that is new or which has been manufactured from new or serviceable used parts and is at least
functionally equivalent to the original product. A replacement product assumes the remaining warranty of the original
product or 60 days, whichever provides longer coverage for you. When a product or part is exchanged, any replacement
item becomes your property and the replaced item becomes Network Instruments' property.
The information in this manual is furnished for informational use only, is subject to change without notice, and should not
be construed as a commitment by Network Instruments, LLC. Network Instruments, LLC assumes no responsibility or liability
for any errors or inaccuracies that may appear in this manual. Network Instruments, LLC does not warrant that the hardware
will meet your requirements or that the operation of the hardware will be uninterrupted or that the hardware will be errorfree.
Network Instruments, LLC SPECIFICALLY DISCLAIMS ALL OTHER WARRANTIES, EXPRESSED OR IMPLIED, INCLUDING BUT NOT
LIMITED TO, IMPLIED WARRANTIES OF MERCHANTABILITY AND FITNESS FOR A PARTICULAR PURPOSE. IN NO EVENT SHALL
Network Instruments, LLC BE LIABLE FOR ANY LOSS OF PROFIT OR ANY OTHER COMMERCIAL DAMAGE, INCLUDING BUT NOT
LIMITED TO SPECIAL, INCIDENTAL, CONSEQUENTIAL, OR OTHER DAMAGES.
Network Instruments, LLC makes no other warranty, expressed or implied.
4
rev. 1
Page 5

Limited Warranty—Software
Network Instruments, LLC (“DEVELOPER”) warrants that for a period of sixty (60) days from the date of shipment from
DEVELOPER: (i) the media on which the SOFTWARE is furnished will be free of defects in materials and workmanship under
normal use; and (ii) the SOFTWARE substantially conforms to its published specifications. Except for the foregoing, the
SOFTWARE is provided AS IS. This limited warranty extends only to END-USER as the original licensee. END-USER's exclusive
remedy and the entire liability of DEVELOPER and its suppliers under this limited warranty will be, at DEVELOPER or its
service center's option, repair, replacement, or refund of the SOFTWARE if reported (or, upon request, returned) to the party
supplying the SOFTWARE to END-USER. DEVELOPER does not warrant that the software will meet END-USER requirements,
and in no event does DEVELOPER warrant that the SOFTWARE is error free or that END-USER will be able to operate the
SOFTWARE without problems or interruptions.
Should DEVELOPER release a newer version of the SOFTWARE within 60 days of shipment of the product, DEVELOPER will
update the copy of the SOFTWARE upon request, provided request is made by the licensed END-USER within the 60 day
period of shipment of the new version. This update may consist of a CD or a manual or both at the discretion of DEVELOPER.
END-USER may be charged a shipping fee for updates.
The information in the SOFTWARE manuals is furnished for informational use only, is subject to change without notice, and
should not be construed as a commitment by DEVELOPER. DEVELOPER assumes no responsibility or liability for any errors or
inaccuracies that may appear in any SOFTWARE manual.
This warranty does not apply if the software (a) has been altered, except by DEVELOPER, (b) has not been installed, operated,
repaired, or maintained in accordance with instructions supplied by DEVELOPER, (c) has been subjected to abnormal
physical or electrical stress, misuse, negligence, or accident, or (d) is used in ultrahazardous activities.
DISCLAIMER. EXCEPT AS SPECIFIED IN THIS WARRANTY, ALL EXPRESS OR IMPLIED CONDITIONS, REPRESENTATIONS, AND
WARRANTIES INCLUDING, WITHOUT LIMITATION, ANY IMPLIED WARRANTY OF MERCHANTABILITY, FITNESS FOR A
PARTICULAR PURPOSE, NONINFRINGEMENT OR ARISING FROM A COURSE OF DEALING, USAGE, OR TRADE PRACTICE, ARE
HEREBY EXCLUDED TO THE EXTENT ALLOWED BY APPLICABLE LAW.
The above warranty DOES NOT apply to any beta software, any software made available for testing or demonstration
purposes, any temporary software modules or any software for which DEVELOPER does not receive a license fee. All such
software products are provided AS IS without any warranty whatsoever.
This License is effective until terminated. END-USER may terminate this License at any time by destroying all copies of
SOFTWARE including any documentation. This License will terminate immediately without notice from DEVELOPER if ENDUSER fails to comply with any provision of this License. Upon termination, END-USER must destroy all copies of SOFTWARE.
DEVELOPER makes no other warranty, express or implied.
Liability
IN NO EVENT WILL DEVELOPER OR ITS SUPPLIERS BE LIABLE FOR ANY LOST REVENUE, PROFIT, OR DATA, OR FOR SPECIAL,
INDIRECT, CONSEQUENTIAL, INCIDENTAL, OR PUNITIVE DAMAGES HOWEVER CAUSED AND REGARDLESS OF THE THEORY OF
LIABILITY ARISING OUT OF THE USE OF OR INABILITY TO USE THE SOFTWARE EVEN IF DEVELOPER OR ITS SUPPLIERS HAVE
BEEN ADVISED OF THE POSSIBILITY OF SUCH DAMAGES.
DEVELOPER SHALL NOT BE LIABLE FOR MATERIAL, EQUIPMENT, DATA, OR TIME LOSS CAUSED DIRECTLY OR INDIRECTLY BY
PROPER OR IMPROPER USE OF THE SOFTWARE. IN CASES OF LOSS, DESTRUCTION, OR CORRUPTION OF DATA, DEVELOPER
SHALL NOT BE LIABLE. DEVELOPER DOES NOT TAKE ANY OTHER RESPONSIBILITY.
In no event shall DEVELOPER's or its suppliers' liability to END-USER, whether in contract, tort (including negligence), or
otherwise, exceed the price paid by END-USER. The foregoing limitations shall apply even if the above-stated warranty fails
of its essential purpose.
DEVELOPER SPECIFICALLY DISCLAIMS ALL OTHER WARRANTIES, EXPRESSED OR IMPLIED, INCLUDING BUT NOT LIMITED TO,
IMPLIED WARRANTIES OF MERCHANTABILITY AND FITNESS FOR A PARTICULAR PURPOSE. IN NO EVENT SHALL DEVELOPER
BE LIABLE FOR ANY LOSS OF PROFIT OR ANY OTHER COMMERCIAL DAMAGE, INCLUDING BUT NOT LIMITED TO SPECIAL,
INCIDENTAL, CONSEQUENTIAL, OR OTHER DAMAGES.
DEVELOPER’S liability to the END-USER under this agreement shall be limited to the amount actually paid to DEVELOPER by
END-USER for the SOFTWARE giving rise to the liability.
rev. 1
5
Page 6

Ownership and Confidentiality
END-USER agrees that Network Instruments, LLC owns all relevant copyrights, trade secrets and all intellectual property
related to the SOFTWARE.
End User License Agreement (EULA)
PLEASE READ THIS SOFTWARE LICENSE AGREEMENT CAREFULLY BEFORE DOWNLOADING OR USING THE SOFTWARE.
BY CLICKING ON THE “ACCEPT” BUTTON, OPENING THE PACKAGE, DOWNLOADING THE PRODUCT, OR USING THE
EQUIPMENT THAT CONTAINS THIS PRODUCT, YOU ARE CONSENTING TO BE BOUND BY THIS AGREEMENT. IF YOU DO NOT
AGREE TO ALL OF THE TERMS OF THIS AGREEMENT, CLICK THE “DO NOT ACCEPT” BUTTON AND THE INSTALLATION
PROCESS WILL NOT CONTINUE, RETURN THE PRODUCT TO THE PLACE OF PURCHASE FOR A FULL REFUND, OR DO NOT
DOWNLOAD THE PRODUCT.
The SOFTWARE is neither shareware nor freeware. The SOFTWARE is a commercial software package that is subject to
international copyright laws.
Single User License Grant: Network Instruments, LLC (“DEVELOPER”) and its suppliers grant to END-USER a nonexclusive and
nontransferable license to use the DEVELOPER software (“SOFTWARE”) in object code form solely on a single central
processing unit owned or leased by END-USER or otherwise embedded in equipment provided by DEVELOPER.
Multiple-Users License Grant: DEVELOPER and its suppliers grant to END-USER a nonexclusive and nontransferable license to
use the DEVELOPER SOFTWARE in object code form: (i) installed in a single location on a hard disk or other storage device of
up to the number of computers owned or leased by END-USER for which END-USER has paid individual license fees
purchased; or (ii) provided the SOFTWARE is configured for network use, installed on a single file server for use on a single
local area network for either (but not both) of the following purposes: (a) permanent installation onto a hard disk or other
storage device of up to the number of individual license fees purchased; or (b) use of the SOFTWARE over such network,
provided the number of computers connected to the server does not exceed the individual license fees purchased. ENDUSER may only use the programs contained in the SOFTWARE (i) for which END-USER has paid a license fee (or in the case of
an evaluation copy, those programs END-USER is authorized to evaluate) and (ii) for which END-USER has received a product
authorization keys (“PAK”). END-USER grants to DEVELOPER or its independent accountants the right to examine its books,
records and accounts during END-USER's normal business hours to verify compliance with the above provisions. In the event
such audit discloses that the Permitted Number of Computers is exceeded, END-USER shall promptly pay to DEVELOPER the
appropriate licensee fee for the additional computers or users. At DEVELOPER's option, DEVELOPER may terminate this
license for failure to pay the required license fee.
END-USER may make one (1) archival copy of the SOFTWARE provided END-USER affixes to such copy all copyright,
confidentiality, and proprietary notices that appear on the original.
EXCEPT AS EXPRESSLY AUTHORIZED ABOVE, END-USER SHALL NOT: COPY, IN WHOLE OR IN PART, SOFTWARE OR
DOCUMENTATION; MODIFY THE SOFTWARE; REVERSE COMPILE OR REVERSE ASSEMBLE ALL OR ANY PORTION OF THE
SOFTWARE; OR RENT, LEASE, DISTRIBUTE, SELL, OR CREATE DERIVATIVE WORKS OF THE SOFTWARE.
END-USER agrees that aspects of the licensed materials, including the specific design and structure of individual programs,
constitute trade secrets and/or copyrighted material of DEVELOPER. END-USER agrees not to disclose, provide, or otherwise
make available such trade secrets or copyrighted material in any form to any third party without the prior written consent of
DEVELOPER. END-USER agrees to implement reasonable security measures to protect such trade secrets and copyrighted
material. Title to SOFTWARE and documentation shall remain solely with DEVELOPER.
SOFTWARE, including technical data, is subject to U.S. export control laws, including the U.S. Export Administration Act and
its associated regulations, and may be subject to export or import regulations in other countries. END-USER agrees to
comply strictly with all such regulations and acknowledges that it has the responsibility to obtain licenses to export, reexport, or import SOFTWARE.
This License shall be governed by and construed in accordance with the laws of the State of Minnesota, United States of
America, as if performed wholly within the state and without giving effect to the principles of conflict of law. If any portion
hereof is found to be void or unenforceable, the remaining provisions of this License shall remain in full force and effect. This
License constitutes the entire License between the parties with respect to the use of the SOFTWARE.
Restricted Rights - DEVELOPER's software is provided to non-DOD agencies with RESTRICTED RIGHTS and its supporting
documentation is provided with LIMITED RIGHTS. Use, duplication, or disclosure by the Government is subject to the
restrictions as set forth in subparagraph “C” of the Commercial Computer SOFTWARE - Restricted Rights clause at FAR
52.227-19. In the event the sale is to a DOD agency, the government's rights in software, supporting documentation, and
technical data are governed by the restrictions in the Technical Data Commercial Items clause at DFARS 252.227-7015 and
DFARS 227.7202. Manufacturer is Network Instruments, 10701 Red Circle Drive, Minnetonka, MN 55343, USA.
6
rev. 1
Page 7

Technical Support
Network Instruments provides technical support by phone (depending on where you are located):
US & countries outside Europe at (952) 358-3800
UK and Europe at +44 (0) 1959 569880
By fax (depending on where you are located):
US & countries outside of Europe at (952) 358-3801
UK and Europe at +44 (0) 1959 569881
Or by e-mail at:
US & countries outside of Europe: support@networkinstruments.com
UK and Europe: support@networkinstruments.co.uk
Network Instruments provides technical support for a period of 90 days after the purchase of the product at no charge. After
the 90-day initial support period, support will only be provided to those customers who have purchased a maintenance
agreement.
Telephone technical support hours are between 9:00 am and 5:00 pm (local time for each office).
Suggestions are welcomed. Many of the improvements made to our products have originated as end user suggestions.
Please submit detailed suggestions in writing to: support@networkinstruments.com or by fax at: (952) 358-3801. Please
submit any corrections to or criticism of Network Instruments’ publications to: pubs@networkinstruments.com or by fax at
(952) 358-3801.
To subscribe to the Network Instruments e-mail newsletter (delivered in HTML format), send an e-mail to
listserver@networkinstruments.com
with the word “subscribe” in the subject line.
rev. 1
7
Page 8

8
rev. 1
Page 9

Contents
Chapter 1: About the GigaStor
GigaStor versions . . . . . . . . . . . . . . . . . . . . . . . . . . . . . . . . . . . . . . . . . . . . . . . . . . . . . . . . . . . . . . . . . . . . . . . . . 14
Chapter 2: Installing Your GigaStor
Unpacking and inspecting the parts . . . . . . . . . . . . . . . . . . . . . . . . . . . . . . . . . . . . . . . . . . . . . . . . . . . . . . . 18
Installing the GigaStor and connecting the cables . . . . . . . . . . . . . . . . . . . . . . . . . . . . . . . . . . . . . . . . . 19
Setting the GigaStor’s IP address . . . . . . . . . . . . . . . . . . . . . . . . . . . . . . . . . . . . . . . . . . . . . . . . . . . . . . . . . . 19
Connecting Observer to the GigaStor. . . . . . . . . . . . . . . . . . . . . . . . . . . . . . . . . . . . . . . . . . . . . . . . . . . . . . 22
Redirecting the GigaStor probe . . . . . . . . . . . . . . . . . . . . . . . . . . . . . . . . . . . . . . . . . . . . . . . . . . . . . . . 22
Probe administration . . . . . . . . . . . . . . . . . . . . . . . . . . . . . . . . . . . . . . . . . . . . . . . . . . . . . . . . . . . . . . . . . 24
GigaStor Capture Analysis . . . . . . . . . . . . . . . . . . . . . . . . . . . . . . . . . . . . . . . . . . . . . . . . . . . . . . . . . . . . 29
Configuring Observer for your Gigabit device. . . . . . . . . . . . . . . . . . . . . . . . . . . . . . . . . . . . . . . . . . . . . . 31
Jumbo Frame Support (Gigabit Ethernet) . . . . . . . . . . . . . . . . . . . . . . . . . . . . . . . . . . . . . . . . . . . . . 31
Configuring Terms of Service and Quality of Service settings . . . . . . . . . . . . . . . . . . . . . . . . . . 32
Configuring Observer for your WAN device . . . . . . . . . . . . . . . . . . . . . . . . . . . . . . . . . . . . . . . . . . . . . . . . 33
Digital DS3/E3/HSSI Probe Settings . . . . . . . . . . . . . . . . . . . . . . . . . . . . . . . . . . . . . . . . . . . . . . . . . . . 34
Digital T1/E1 Probe Settings . . . . . . . . . . . . . . . . . . . . . . . . . . . . . . . . . . . . . . . . . . . . . . . . . . . . . . . . . . 35
Serial T1/E1 Probe Settings . . . . . . . . . . . . . . . . . . . . . . . . . . . . . . . . . . . . . . . . . . . . . . . . . . . . . . . . . . . 36
Tapping an Ethernet or Fibre Channel connection . . . . . . . . . . . . . . . . . . . . . . . . . . . . . . . . . . . . . . . . . 37
10/100/1000, 10GbE Optical, and Fibre Channel . . . . . . . . . . . . . . . . . . . . . . . . . . . . . . . . . . . . . . . 37
Gigabit copper . . . . . . . . . . . . . . . . . . . . . . . . . . . . . . . . . . . . . . . . . . . . . . . . . . . . . . . . . . . . . . . . . . . . . . . 40
rev. 1
9
Page 10

Tapping a WAN connection . . . . . . . . . . . . . . . . . . . . . . . . . . . . . . . . . . . . . . . . . . . . . . . . . . . . . . . . . . . . . . . 42
T1/E1 . . . . . . . . . . . . . . . . . . . . . . . . . . . . . . . . . . . . . . . . . . . . . . . . . . . . . . . . . . . . . . . . . . . . . . . . . . . . . . . . 42
DS3/E3 . . . . . . . . . . . . . . . . . . . . . . . . . . . . . . . . . . . . . . . . . . . . . . . . . . . . . . . . . . . . . . . . . . . . . . . . . . . . . . . 46
Installing the drives in your GigaStor. . . . . . . . . . . . . . . . . . . . . . . . . . . . . . . . . . . . . . . . . . . . . . . . . . . . . . . 50
Connecting the GigaStor Expandable to the expansion units . . . . . . . . . . . . . . . . . . . . . . . . . . 52
Chapter 3: Packet Capture or GigaStor Capture
Capturing Packets with the GigaStor. . . . . . . . . . . . . . . . . . . . . . . . . . . . . . . . . . . . . . . . . . . . . . . . . . . . . . . 54
Packet capture buffer and statistics buffer . . . . . . . . . . . . . . . . . . . . . . . . . . . . . . . . . . . . . . . . . . . . . . . . . 54
Chapter 4: GigaStor Control Panel
Display Controls . . . . . . . . . . . . . . . . . . . . . . . . . . . . . . . . . . . . . . . . . . . . . . . . . . . . . . . . . . . . . . . . . . . . . . . . . . 59
Right-click menus . . . . . . . . . . . . . . . . . . . . . . . . . . . . . . . . . . . . . . . . . . . . . . . . . . . . . . . . . . . . . . . . . . . . . . . . . 60
Analyze button . . . . . . . . . . . . . . . . . . . . . . . . . . . . . . . . . . . . . . . . . . . . . . . . . . . . . . . . . . . . . . . . . . . . . . . . . . . 61
Configuring the GigaStor through the Control Panel . . . . . . . . . . . . . . . . . . . . . . . . . . . . . . . . . . . . . . . 63
GigaStor Options tab . . . . . . . . . . . . . . . . . . . . . . . . . . . . . . . . . . . . . . . . . . . . . . . . . . . . . . . . . . . . . . . . . 64
GigaStor Chart tab . . . . . . . . . . . . . . . . . . . . . . . . . . . . . . . . . . . . . . . . . . . . . . . . . . . . . . . . . . . . . . . . . . . 67
GigaStor Outline . . . . . . . . . . . . . . . . . . . . . . . . . . . . . . . . . . . . . . . . . . . . . . . . . . . . . . . . . . . . . . . . . . . . . 67
Capture Graph tab . . . . . . . . . . . . . . . . . . . . . . . . . . . . . . . . . . . . . . . . . . . . . . . . . . . . . . . . . . . . . . . . . . . 69
GigaStor Schedule tab . . . . . . . . . . . . . . . . . . . . . . . . . . . . . . . . . . . . . . . . . . . . . . . . . . . . . . . . . . . . . . . . 70
Statistics Lists tab . . . . . . . . . . . . . . . . . . . . . . . . . . . . . . . . . . . . . . . . . . . . . . . . . . . . . . . . . . . . . . . . . . . . 71
Subnet . . . . . . . . . . . . . . . . . . . . . . . . . . . . . . . . . . . . . . . . . . . . . . . . . . . . . . . . . . . . . . . . . . . . . . . . . . . . . . . 72
GigaStor reports . . . . . . . . . . . . . . . . . . . . . . . . . . . . . . . . . . . . . . . . . . . . . . . . . . . . . . . . . . . . . . . . . . . . . 75
Export . . . . . . . . . . . . . . . . . . . . . . . . . . . . . . . . . . . . . . . . . . . . . . . . . . . . . . . . . . . . . . . . . . . . . . . . . . . . . . . 77
Chapter 5: Using Observer with a WAN Probe
Discover Network Names. . . . . . . . . . . . . . . . . . . . . . . . . . . . . . . . . . . . . . . . . . . . . . . . . . . . . . . . . . . . . . . . . . 80
Setting the Committed Information Rate (CIR) for a DLCI . . . . . . . . . . . . . . . . . . . . . . . . . . . . . . 80
WAN Bandwidth Utilization . . . . . . . . . . . . . . . . . . . . . . . . . . . . . . . . . . . . . . . . . . . . . . . . . . . . . . . . . . . . . . . 82
WAN Vital Signs by DLCI. . . . . . . . . . . . . . . . . . . . . . . . . . . . . . . . . . . . . . . . . . . . . . . . . . . . . . . . . . . . . . . . . . . 83
WAN Load by DLCI . . . . . . . . . . . . . . . . . . . . . . . . . . . . . . . . . . . . . . . . . . . . . . . . . . . . . . . . . . . . . . . . . . . . . . . . 84
WAN Top Talkers. . . . . . . . . . . . . . . . . . . . . . . . . . . . . . . . . . . . . . . . . . . . . . . . . . . . . . . . . . . . . . . . . . . . . . . . . . 86
WAN Filtering. . . . . . . . . . . . . . . . . . . . . . . . . . . . . . . . . . . . . . . . . . . . . . . . . . . . . . . . . . . . . . . . . . . . . . . . . . . . . 87
Triggers and Alarms . . . . . . . . . . . . . . . . . . . . . . . . . . . . . . . . . . . . . . . . . . . . . . . . . . . . . . . . . . . . . . . . . . . . . . . 88
Chapter 6: Forensic Analysis using Snort
Starting Forensic Analysis using Snort rules . . . . . . . . . . . . . . . . . . . . . . . . . . . . . . . . . . . . . . . . . . . . . . . . 92
Creating a forensic analysis profile from the GigaStor control panel . . . . . . . . . . . . . . . . . . . . 94
About Forensic Analysis tab . . . . . . . . . . . . . . . . . . . . . . . . . . . . . . . . . . . . . . . . . . . . . . . . . . . . . . . . . . 98
About the Forensic Analysis Log tab . . . . . . . . . . . . . . . . . . . . . . . . . . . . . . . . . . . . . . . . . . . . . . . . . . 99
Forensic Analysis Profile field descriptions . . . . . . . . . . . . . . . . . . . . . . . . . . . . . . . . . . . . . . . . . . . . . . . 100
Forensic Analysis Profile Settings tab . . . . . . . . . . . . . . . . . . . . . . . . . . . . . . . . . . . . . . . . . . . . . . . . . 100
Rules tab . . . . . . . . . . . . . . . . . . . . . . . . . . . . . . . . . . . . . . . . . . . . . . . . . . . . . . . . . . . . . . . . . . . . . . . . . . . . 106
10
rev. 1
Page 11

Chapter 7: Observer on the GigaStor
Using the Observer console locally on the GigaStor . . . . . . . . . . . . . . . . . . . . . . . . . . . . . . . . . . . . . . . 108
Chapter 8: Probe Instances
What is a probe instance? . . . . . . . . . . . . . . . . . . . . . . . . . . . . . . . . . . . . . . . . . . . . . . . . . . . . . . . . . . . . . . . . 112
Chapter 9: Gen2 Capture Card
Swapping the Gen2 card’s SFP or XFP interfaces . . . . . . . . . . . . . . . . . . . . . . . . . . . . . . . . . . . . . . . . . . 116
Configuring virtual adapters on the Gen2 card . . . . . . . . . . . . . . . . . . . . . . . . . . . . . . . . . . . . . . . . . . . . 116
Viewing the Gen2 card’s properties and finding the board’s ID . . . . . . . . . . . . . . . . . . . . . . . . . . . . 120
Appendix A: TCP/IP ports, NAT, and VPN
TCP/IP ports . . . . . . . . . . . . . . . . . . . . . . . . . . . . . . . . . . . . . . . . . . . . . . . . . . . . . . . . . . . . . . . . . . . . . . . . . . . . . 124
NAT . . . . . . . . . . . . . . . . . . . . . . . . . . . . . . . . . . . . . . . . . . . . . . . . . . . . . . . . . . . . . . . . . . . . . . . . . . . . . . . . . . . . . 124
VPN . . . . . . . . . . . . . . . . . . . . . . . . . . . . . . . . . . . . . . . . . . . . . . . . . . . . . . . . . . . . . . . . . . . . . . . . . . . . . . . . . . . . . 125
Appendix B: GigaStor, GigaStor Expandable, and Expansion Unit Cases
GigaStor. . . . . . . . . . . . . . . . . . . . . . . . . . . . . . . . . . . . . . . . . . . . . . . . . . . . . . . . . . . . . . . . . . . . . . . . . . . . . . . . . 128
GigaStor Expandable . . . . . . . . . . . . . . . . . . . . . . . . . . . . . . . . . . . . . . . . . . . . . . . . . . . . . . . . . . . . . . . . . . . . 129
Controller unit . . . . . . . . . . . . . . . . . . . . . . . . . . . . . . . . . . . . . . . . . . . . . . . . . . . . . . . . . . . . . . . . . . . . . . 129
Expansion unit . . . . . . . . . . . . . . . . . . . . . . . . . . . . . . . . . . . . . . . . . . . . . . . . . . . . . . . . . . . . . . . . . . . . . . 130
Appendix C: GigaStor Portable
Running Observer passively . . . . . . . . . . . . . . . . . . . . . . . . . . . . . . . . . . . . . . . . . . . . . . . . . . . . . . . . . . . . . . 136
Using the portable GigaStor as a probe . . . . . . . . . . . . . . . . . . . . . . . . . . . . . . . . . . . . . . . . . . . . . . . . . . . 137
Index . . . . . . . . . . . . . . . . . . . . . . . . . . . . . . . . . . . . . . . . . . . . . . . . . . . . . . . . . . . . . . . . . . . . 139
rev. 1
11
Page 12

12
rev. 1
Page 13

C h a p t e r 1
About the GigaStor
rev. 1
13
Chapter 1 About the GigaStor
Page 14
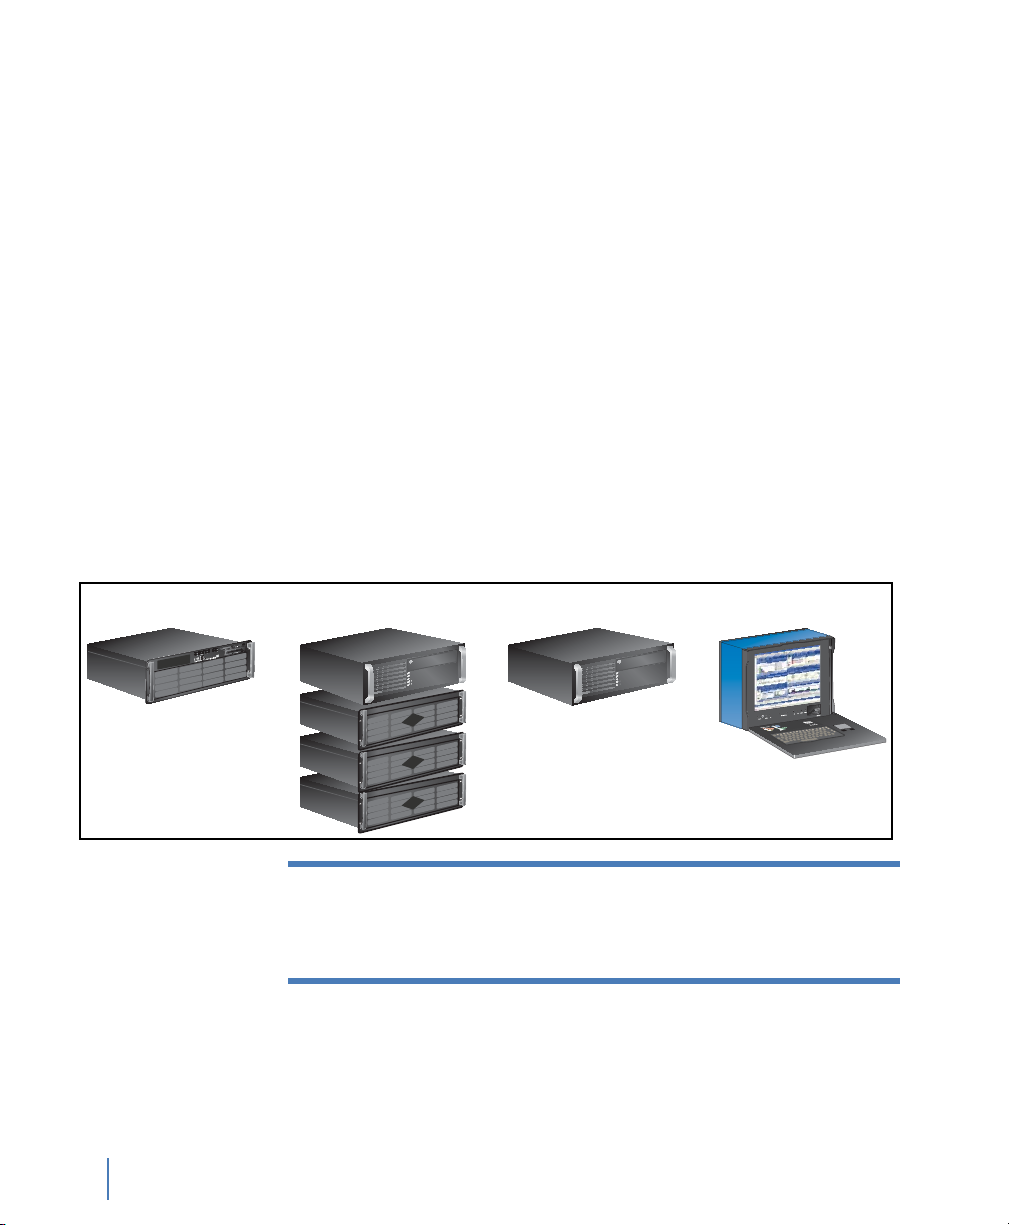
GigaStor versions
GigaStor GigaStor Expandable GigaStor SAN GigaStor Portable
The GigaStor is an enterprise-strength network probe appliance. The
GigaStor combines a multi-terabyte, high-performance Redundant
Array of Independent Disks (RAID) with a dedicated, high-speed
network capture card in a modular, easy-to-deploy appliance.
There are these versions of the GigaStor:
Q GigaStor
Q GigaStor Expandable: a controller PC along with one, two, or
three disk expansion units that can store up to a total of 288
terabytes of data.
Q GigaStor SAN: a controller PC that connects to your SAN to
write its data. It uses a fibre channel host bus adapter that can
operate at 1, 2, or 4 Gigabit speed for connectivity.
Q GigaStor Portable: a portable GigaStor
Figure 1 GigaStor models
N
OTE:
Unless specifically noted, all information in this manual
applies to all versions of the GigaStor: GigaStor, GigaStor
Expandable, GigaStor SAN, and GigaStor Portable.
If your GigaStor is configured to monitor Gigabit Ethernet, 10Gb
Ethernet, and Fibre Channel connections, the capture card is a Gen2
card with SFP (or XFP) modules. This allows you to hot-swap any
SFP-compliant connectors into the your appliance. This makes it
GigaStor versions
14
Chapter 1 About the GigaStor
rev. 1
Page 15

possible to use the same probe to monitor different types of links as
needed. For example, you can easily convert the capture card from
optical to copper, allowing you to connect the GigaStor to different
test access points (TAPs) or switch port analyzer (SPAN) or mirror
interfaces.
If your GigaStor is configured to monitor WAN (such as E1, T1, E3,
DS3, or HSSI) connections, your GigaStor has a specialized WAN
capture card. It does not have SFP or XFP connectors.
The GigaStor can be used with the Expert Observer console or
Observer Suite to troubleshoot your network. Alternatively, you can
run the probe in “local console” mode, allowing you to analyze
GigaStor-collected data locally.The local console on the GigaStor is
Observer Expert. However, we recommend that you use Observer on
a remote system to analyze the data.
rev. 1
GigaStor versions
Chapter 1 About the GigaStor
15
Page 16

GigaStor versions
16
Chapter 1 About the GigaStor
rev. 1
Page 17

C h a p t e r 2
Installing Your GigaStor
rev. 1
17
Chapter 2 Installing Your GigaStor
Page 18

The general steps to install your GigaStor are:
F “Unpacking and inspecting the parts” on page 18
F “Installing the GigaStor and connecting the cables” on page 19
F “Connecting Observer to the GigaStor” on page 22
Additional steps to complete the installation are:
F “Configuring Observer for your Gigabit device” on page 31
F “Configuring Observer for your WAN device” on page 33
F “Tapping an Ethernet or Fibre Channel connection” on
page 37
F “Tapping a WAN connection” on page 42
F “Installing the drives in your GigaStor” on page 50
Unpacking and inspecting the parts
Your GigaStor includes a number of components. Take a moment
after unpacking the kit to locate all of the parts.
F One rack-mountable GigaStor system with an installed 10/
100/1000 Ethernet network interface (management) card.
Unpacking and inspecting the parts
18
Chapter 2 Installing Your GigaStor
F Appropriate capture interface (Gen2 or WAN).
F The rack unit may also include a rail kit depending on
which model was purchased.
F Windows XP 64-bit operating system and a restore DVD
specific for your GigaStor.
F TAP kits for your topology (Ethernet, Fibre Channel, or
WAN), except for the GigaStor 2TE.
F Cables
F Ethernet cable for each 10/100/1000 interface in your
GigaStor.
F Connection cables to connect your GigaStor to a TAP or
switch.
rev. 1
Page 19

Installing the GigaStor and connecting the cables
1 Install the GigaStor and any expansion units into your rack using
the supplied rails. Instructions for installing the rail kits are
provided in the rail kit box.
2 Install the drives into the GigaStor and any expansion units. See
“Installing the drives in your GigaStor” on page 50.
3 Connect the GigaStor, TAP, and cables. See:
Q “Tapping an Ethernet or Fibre Channel connection” on
page 37 for details about optical and copper Gigabit Ethernet,
10 Gigabit Ethernet, and Fibre Channel connections.
Q “Tapping a WAN connection” on page 42 for details about
T1/E1 and DS3 connections.
Q “Connecting the GigaStor Expandable to the expansion units”
on page 52.
Q See the fibre channel host bus adapter (QLogic or other third
party) documentation included in the GigaStor packaging if
you are using a GigaStor SAN.
Setting the GigaStor’s IP address
rev. 1
At this point you have physically installed the hardware and
connected all the cables. Now, you must turn on the GigaStor and
configure the software.
1 Connect a monitor, keyboard, and mouse to the GigaStor and
ensure the GigaStor is plugged into a power outlet. These are only
needed temporarily to set the IP address. You can disconnect them
when you are finished. Alternatively, you can use Windows
Remote Desktop to connect to the GigaStor to make these
changes. The default IP address is 192.168.1.10.
2 If you are using a GigaStor Expandable, remember to start the
disk expansion units.
3 Turn on the system. On the back of the GigaStor ensure the
power switch is turned on. Then on the front of the GigaStor,
press the power button until the system starts to turn on.
Installing the GigaStor and connecting the cables
Chapter 2 Installing Your GigaStor
19
Page 20
4 Ensure that each drive’s power/activity light is lit. If a drive’s light
is not lit, it is likely that the drive is not seated properly. Turn off
the GigaStor and reseat the drives. For more information, see
“Installing the drives in your GigaStor” on page 50.
5 Log in using the Administrator account. The default
Administrator password is admin.
6 Click Start → Control Panel → Network and Internet Connections
→ Network Connections. Choose Local Area Connection and
right-click and choose Properties.
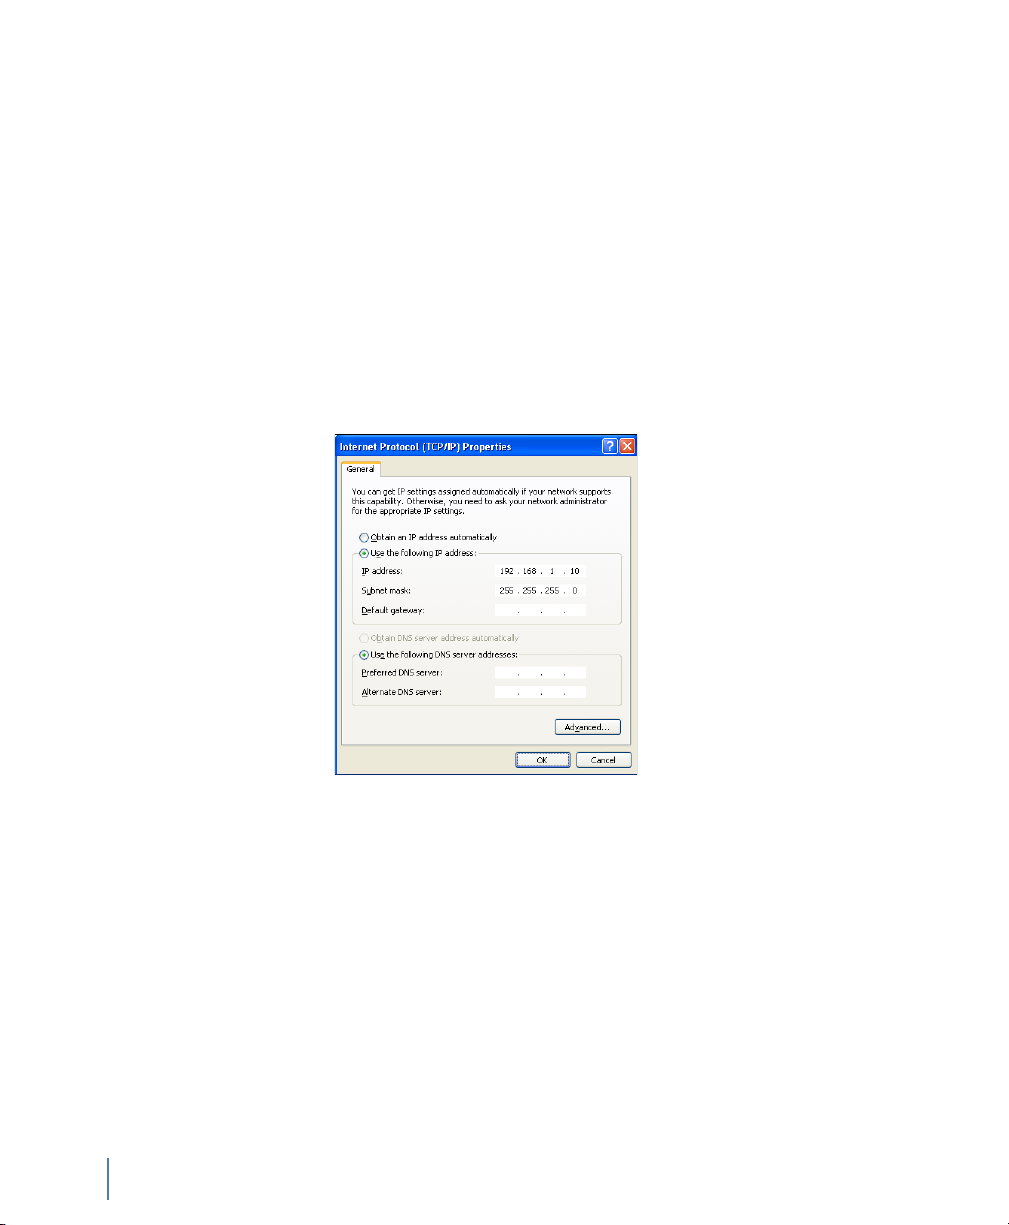
7 Select Internet Protocol (TCP/IP) from the list and click
Properties (Figure 2).
Figure 2 Default TCP/IP settings
Setting the GigaStor’s IP address
20
Chapter 2 Installing Your GigaStor
8 Set the IP address, subnet mask, gateway, and DNS server for your
environment and click OK. Click OK again to close the Local
Area Connection Properties dialog. Close the Network
Connections window.
9 Right-click the Probe Service Configuration Applet in the system
tray and choose Open Probe Configuration.
rev. 1
Page 21
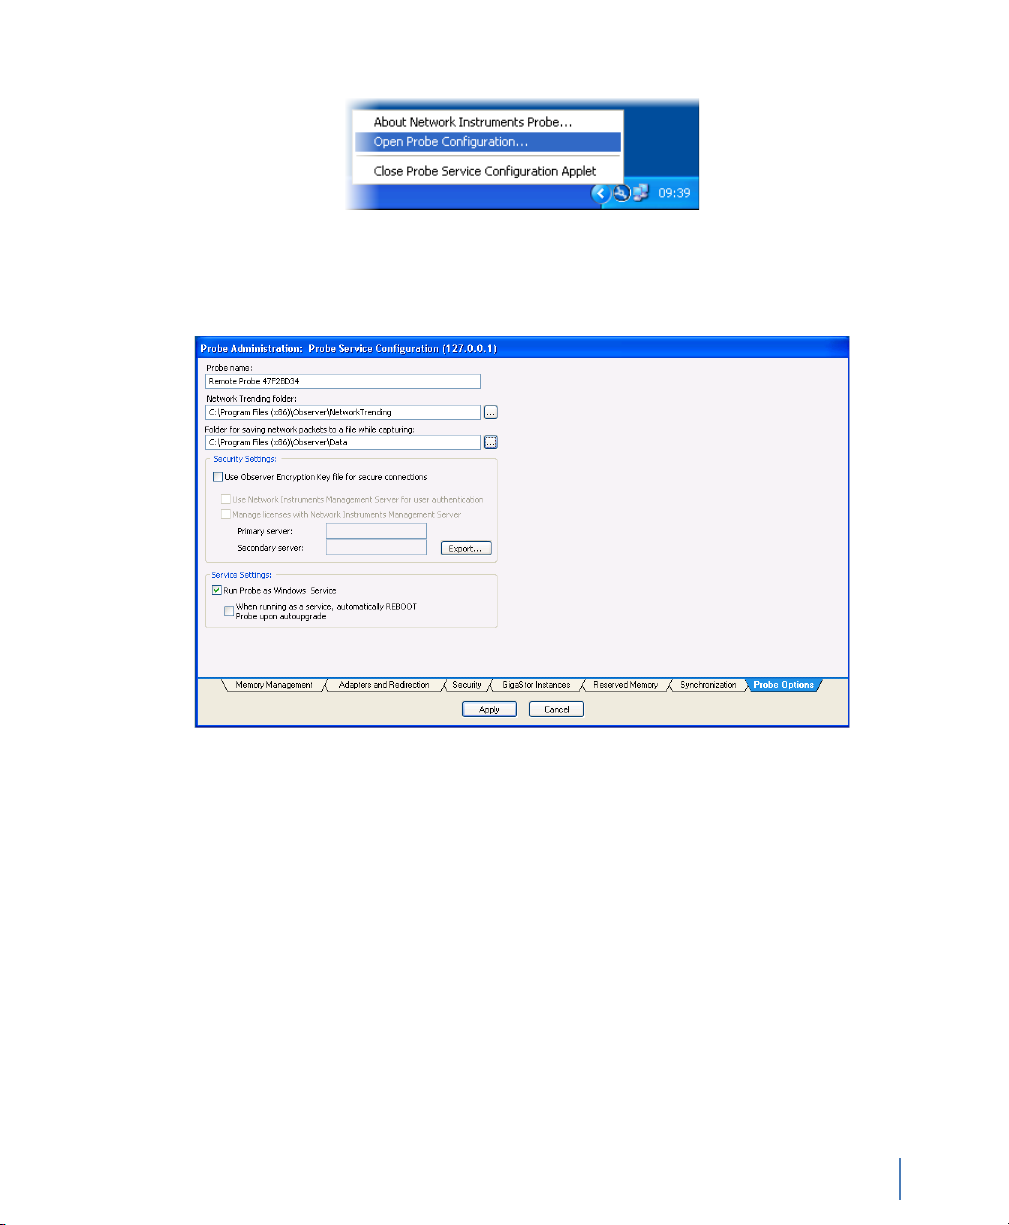
Figure 3 Probe Service Configuration Applet
10 The Probe Administration window opens. Click the Probe
Options tab (Figure 4).
Figure 4 Probe Options
rev. 1
11 Change the name of the probe to something meaningful to you.
The name might be the physical location of the probe. Click
Apply to save your changes and close the window.
By default the GigaStor runs the Expert Probe as a Windows
service and starts automatically at system startup. This prevents
you from using the Observer console on the GigaStor. You must
connect to the GigaStor using Observer on a different system. If
you want to use the Observer console locally, see “Using the
Observer console locally on the GigaStor” on page 108.
Setting the GigaStor’s IP address
Chapter 2 Installing Your GigaStor
21
Page 22
Connecting Observer to the GigaStor
This section assumes you have already installed Observer on your
desktop or laptop. If not, install the software. You can download from
the Network Instruments website.
There are three main tasks to connect Observer to your GigaStor
Q “Redirecting the GigaStor probe” on page 22
Q “Probe administration” on page 24
Q “GigaStor Capture Analysis” on page 29
Redirecting the GigaStor probe
1 Choose Start → All Programs → Observer → Observer. Observer
opens.
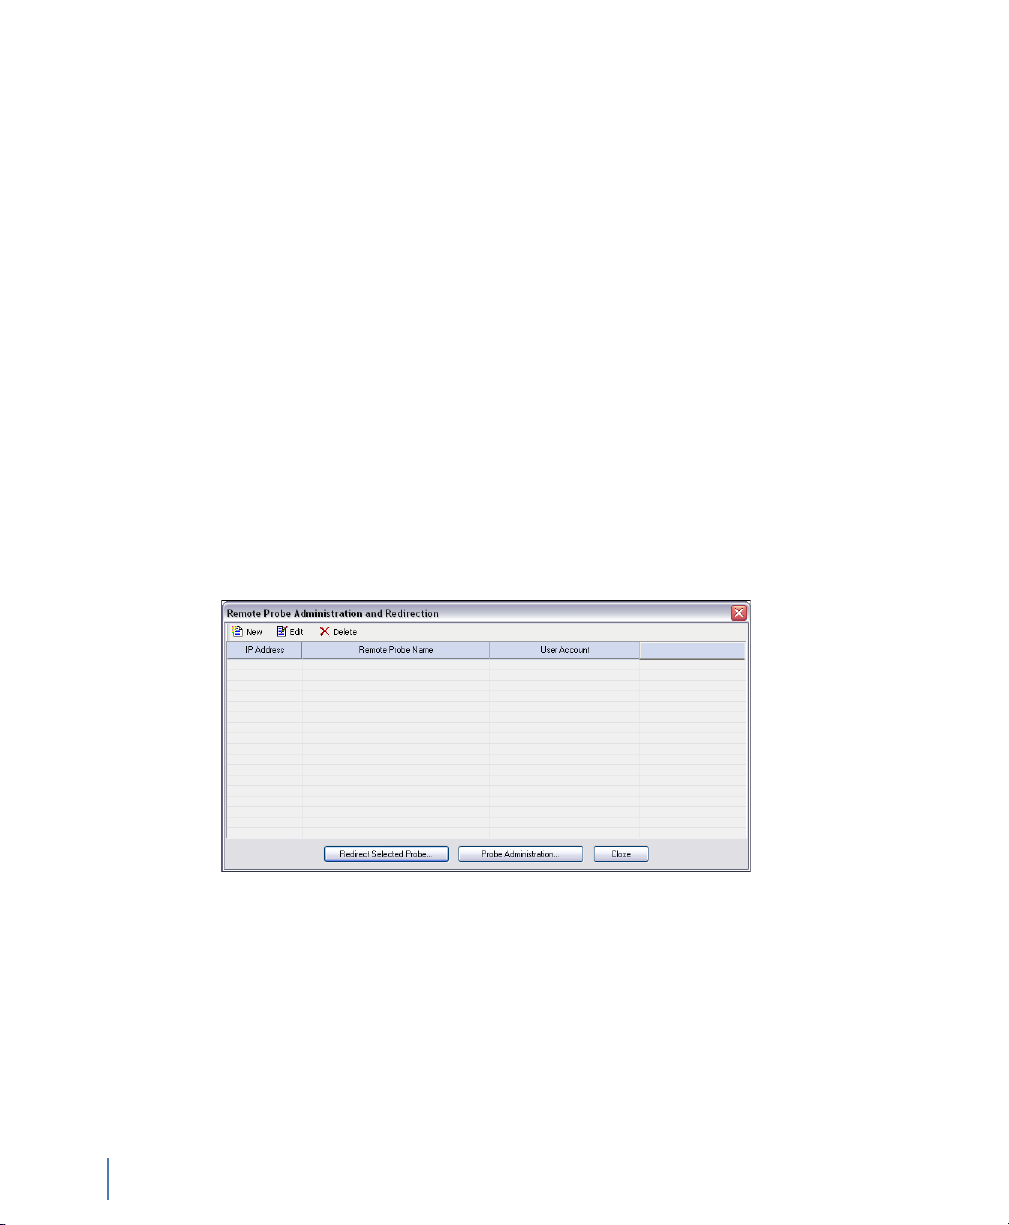
2 Select Actions → Redirect Probe (Figure 5).
Figure 5 Remote Probe Administration and Redirection
Connecting Observer to the GigaStor
22
Chapter 2 Installing Your GigaStor
3 Click New to add the GigaStor to the Probe Administration and
Redirection list. Figure 6 appears.
rev. 1
Page 23
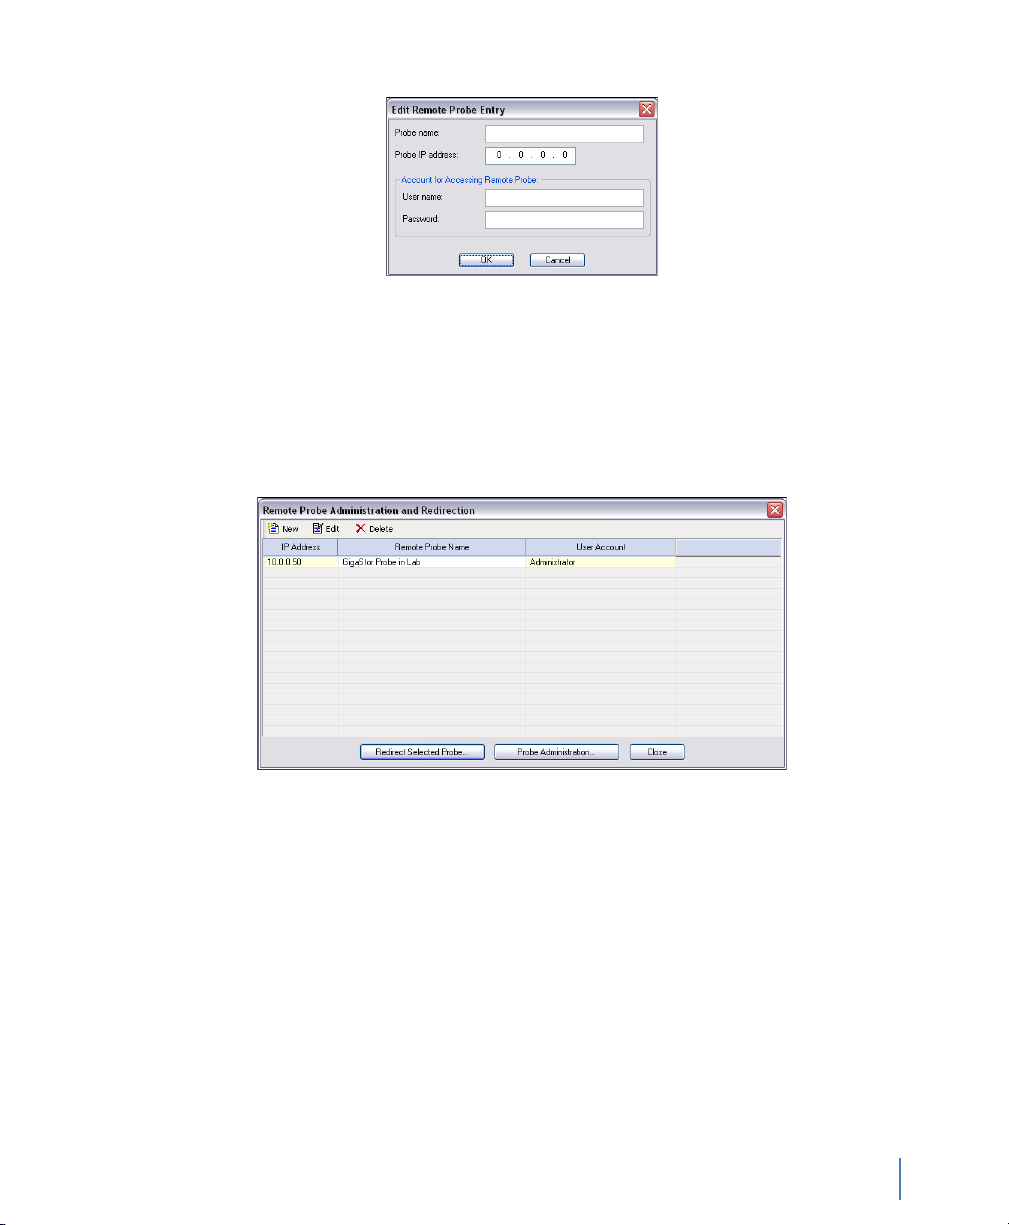
Figure 6 Edit Remote Probe Entry
4 Type the IP address that you assigned to the GigaStor in step 7 in
“Setting the GigaStor’s IP address” on page 19 and click OK. You
may leave the other fields blank. If you type a name, the name
will change after Observer connects to the remote probe. The
GigaStor appears in the list of probes available for redirection
(Figure 7).
Figure 7 Probe added to Remote Probe Administration and Redirection
rev. 1
5 Select the GigaStor probe and then click Redirect Selected Probe
(Figure 8).
Connecting Observer to the GigaStor
Chapter 2 Installing Your GigaStor
23
Page 24
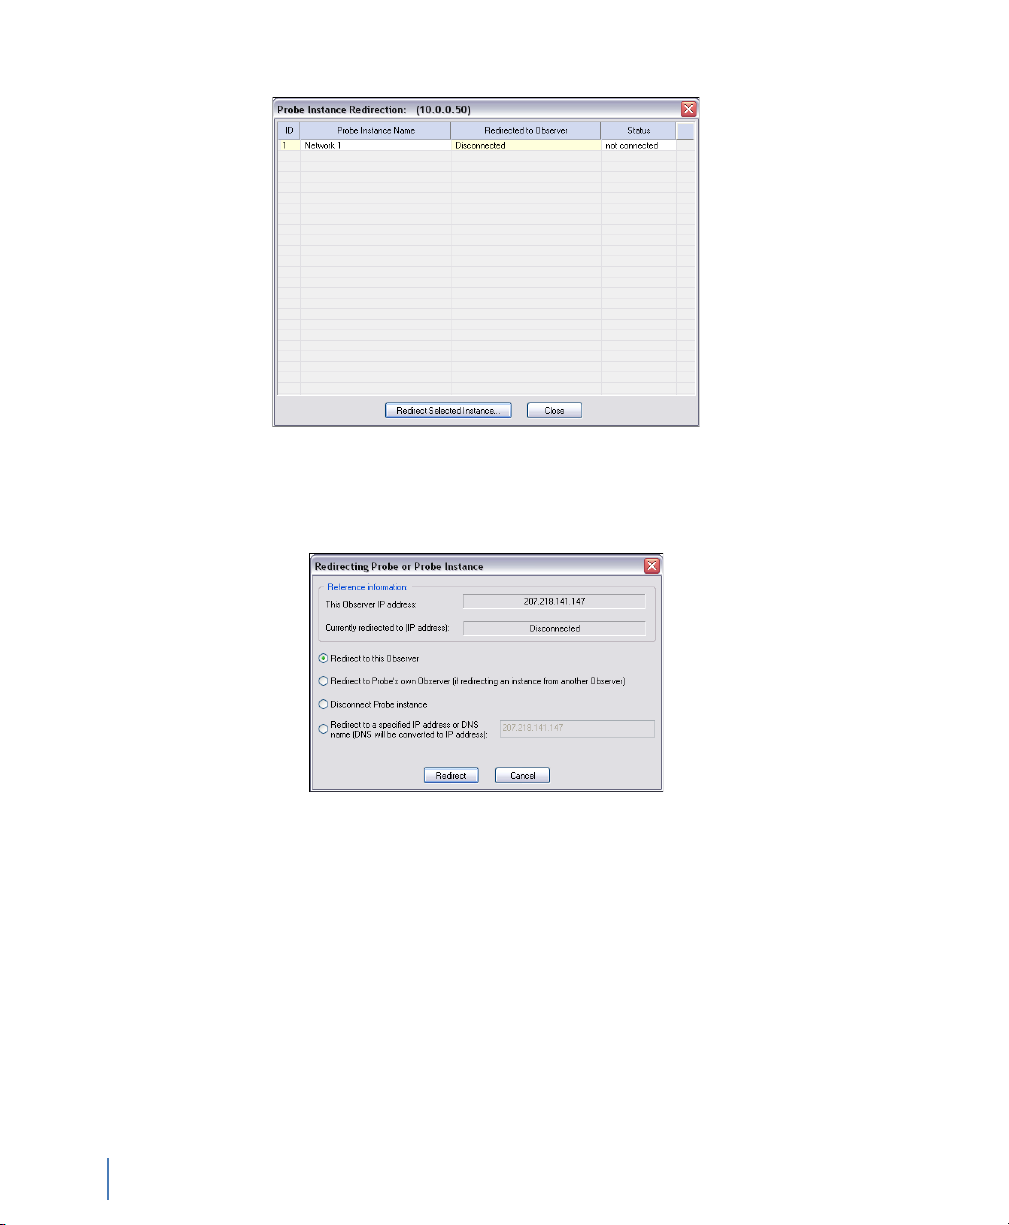
Figure 8 Probe Instance Redirection
6 Select the probe instance and click Redirect Selected Instance.
Figure 9 appears.
Figure 9 Redirecting Probe or Probe Instance
7 Choose the “Redirect to this Observer” option, then click the
8 Close the Probe Instance Redirection window.
Probe administration
Now that your GigaStor is connected to your Observer console, you
can administer it.
Connecting Observer to the GigaStor
24
Chapter 2 Installing Your GigaStor
Redirect button. Within 30 seconds the GigaStor will connect to
the local Observer. If you use NAT, see “NAT” on page 124.
rev. 1
Page 25
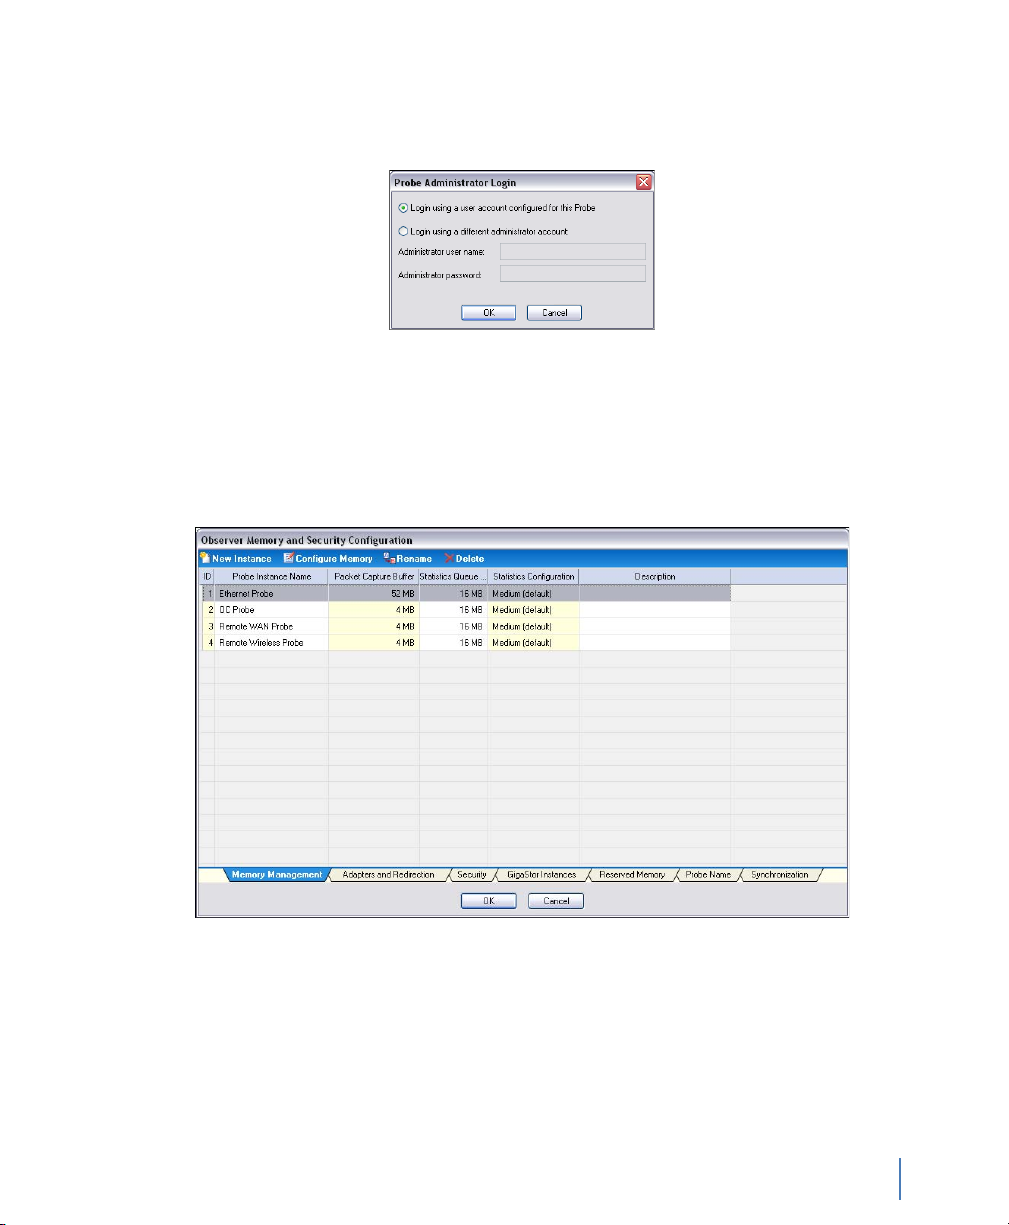
1 Click Probe Administration (see Figure 7). The Probe
Administration Login window opens.
Figure 10 Remote Probe Administration
2 Ensure “Login using a user account configured for this Probe” is
selected and click OK.
The Probe Administration window opens to the Memory
Management tab (Figure 11).
Figure 11 Memory Management tab
rev. 1
3 Select the Network 1 probe instance and click Rename. Choose a
name that is meaningful to you for the probe instance name and
click OK. By default, Network 1 is your active probe instance for
your GigaStor. For details about active and passive probe instance,
see “Probe Instances” on page 111.
Connecting Observer to the GigaStor
Chapter 2 Installing Your GigaStor
25
Page 26

By default all of the installed memory on the GigaStor is
dedicated for one probe instance. You must first release the
memory so that you can assign the freed memory to other probe
instances.
4 With the newly renamed probe instance still selected, click
Configure Memory (Figure 12) at the top of the window.
Figure 12 Edit Probe Instance: Capture Buffer Memory
Connecting Observer to the GigaStor
26
Chapter 2 Installing Your GigaStor
5 Use the arrows to release some memory. Free enough memory to
create your probe instances and click OK. At a minimum each
probe instance requires12 MB memory. It uses 4 MB for statistics
and 8 MB for packet capture. Don’t worry about freeing too
much memory. If you determine you released too much, you can
reallocate it later to the capture buffer or operating system.
Because Observer operates in real-time, its buffers must always
remain in RAM; if the buffers resided in standard Windows user
memory, nothing would prevent the buffer file from being
swapped out to disk and subsequent packet loss. For this reason,
the probe reserves its memory from Windows upon startup so
that no other applications can use it and cause the buffer to be
swapped out to disk.
For more information about buffers, see “Packet capture buffer
and statistics buffer” on page 54.
6 Click the GigaStor Instances tab (Figure 13).
rev. 1
Page 27
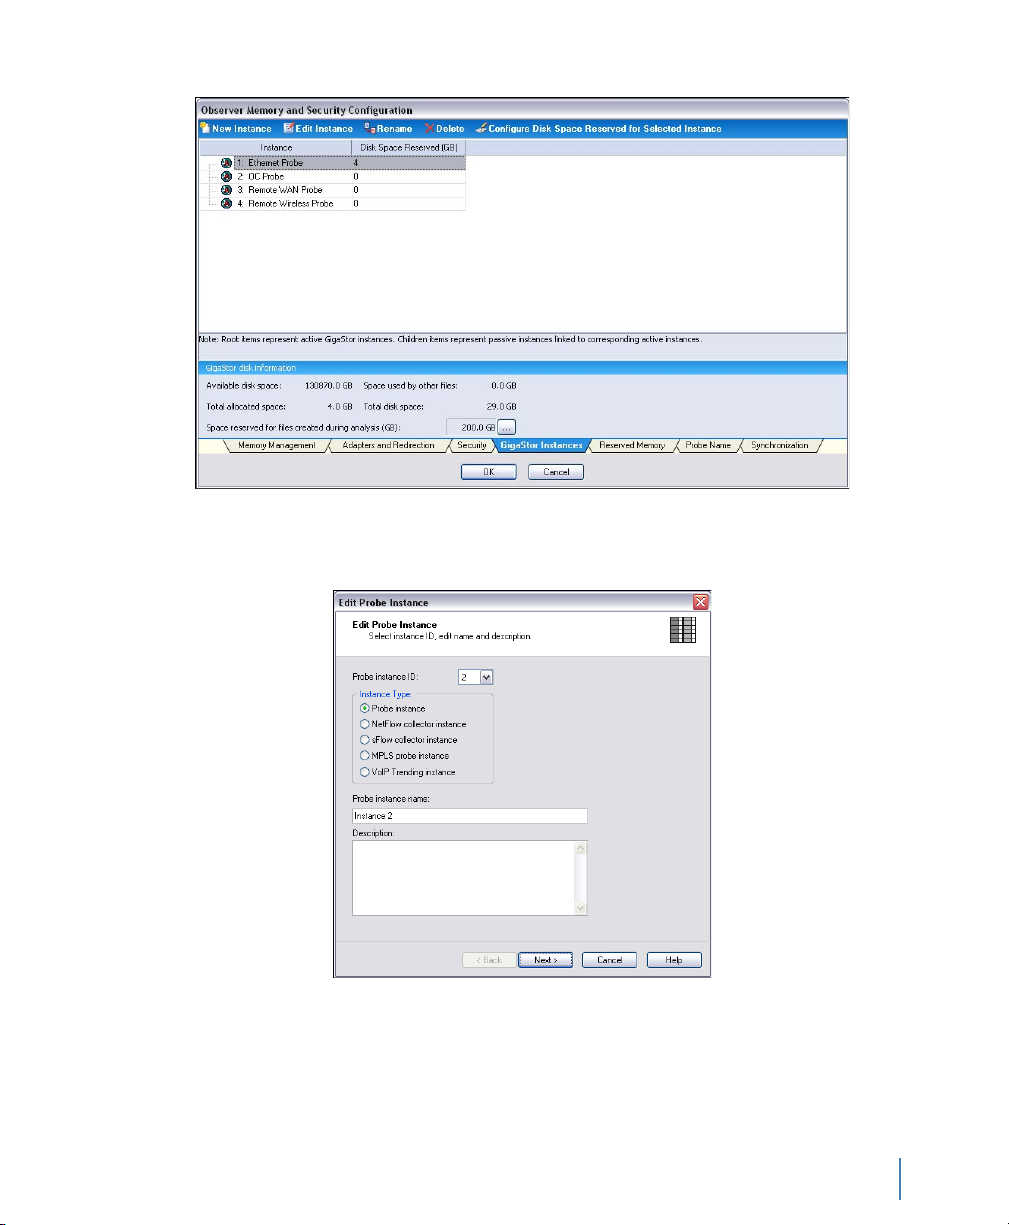
Figure 13 GigaStor Instances
7 Click New Instance. Figure 14 appears.
Figure 14 Edit Probe Instance: Name
rev. 1
8 You are configuring a GigaStor probe to capture data and write it
to the hard drive. Therefore ensure “Probe instance” is selected in
the Instance type. Type a name and description and click Next.
Connecting Observer to the GigaStor
Chapter 2 Installing Your GigaStor
27
Page 28
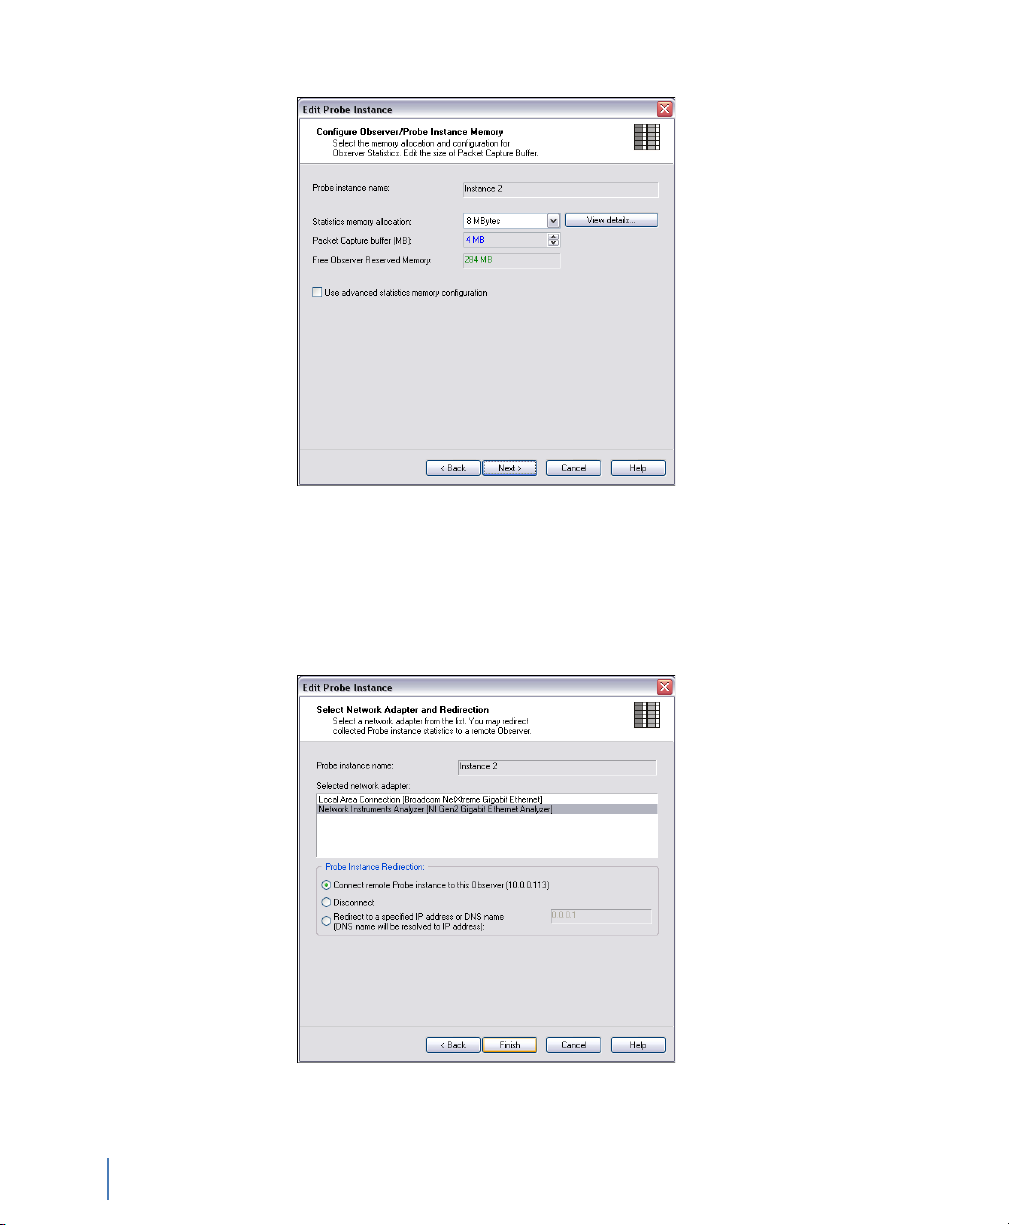
Figure 15 Edit Probe Instance: Configure Memory
9 From the RAM that you released earlier, assign some of it to this
probe instance and click Next.
10 Ensure the correct network adapter is selected and click Finish to
redirect the GigaStor to your local Observer console.
Figure 16 Edit Probe Instance: Connect to Console
Connecting Observer to the GigaStor
28
Chapter 2 Installing Your GigaStor
rev. 1
Page 29
11 Repeat step 7 through step 10 until you have created all of your
probe instances. Any unused memory should be reallocated to the
packet capture buffer of the active probe instance or to the
operating system.
12 Click OK to close the Probe administration windows. After a
moment the GigaStor probe and any probe instances appear in
the Observer Probe list found along the left side of the main
Observer window.
GigaStor Capture Analysis
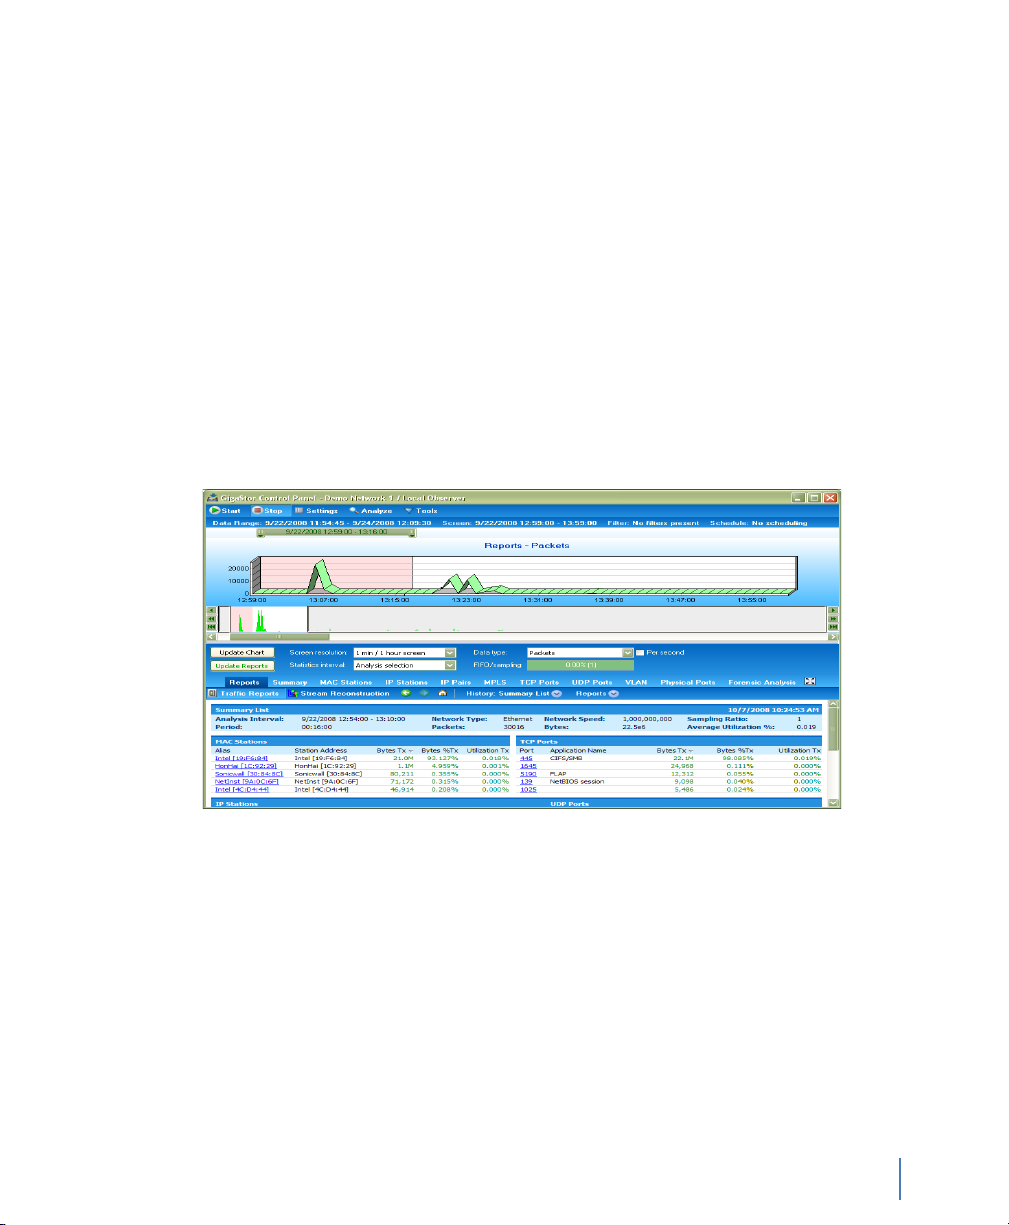
1 Click Capture → GigaStor Capture Analysis to begin viewing
network traffic that passes through the GigaStor probe. The
GigaStor Control Panel opens (Figure 17).
Figure 17 GigaStor Control Panel
rev. 1
At this point the data is not being written to disk unless you
manually click the Start button. With most GigaStor installations,
you want the GigaStor probe to always be writing its data to disk.
2 Click Settings in the middle of the top menu bar. The GigaStor
Settings window opens. Click the Schedule tab.
Connecting Observer to the GigaStor
Chapter 2 Installing Your GigaStor
29
Page 30
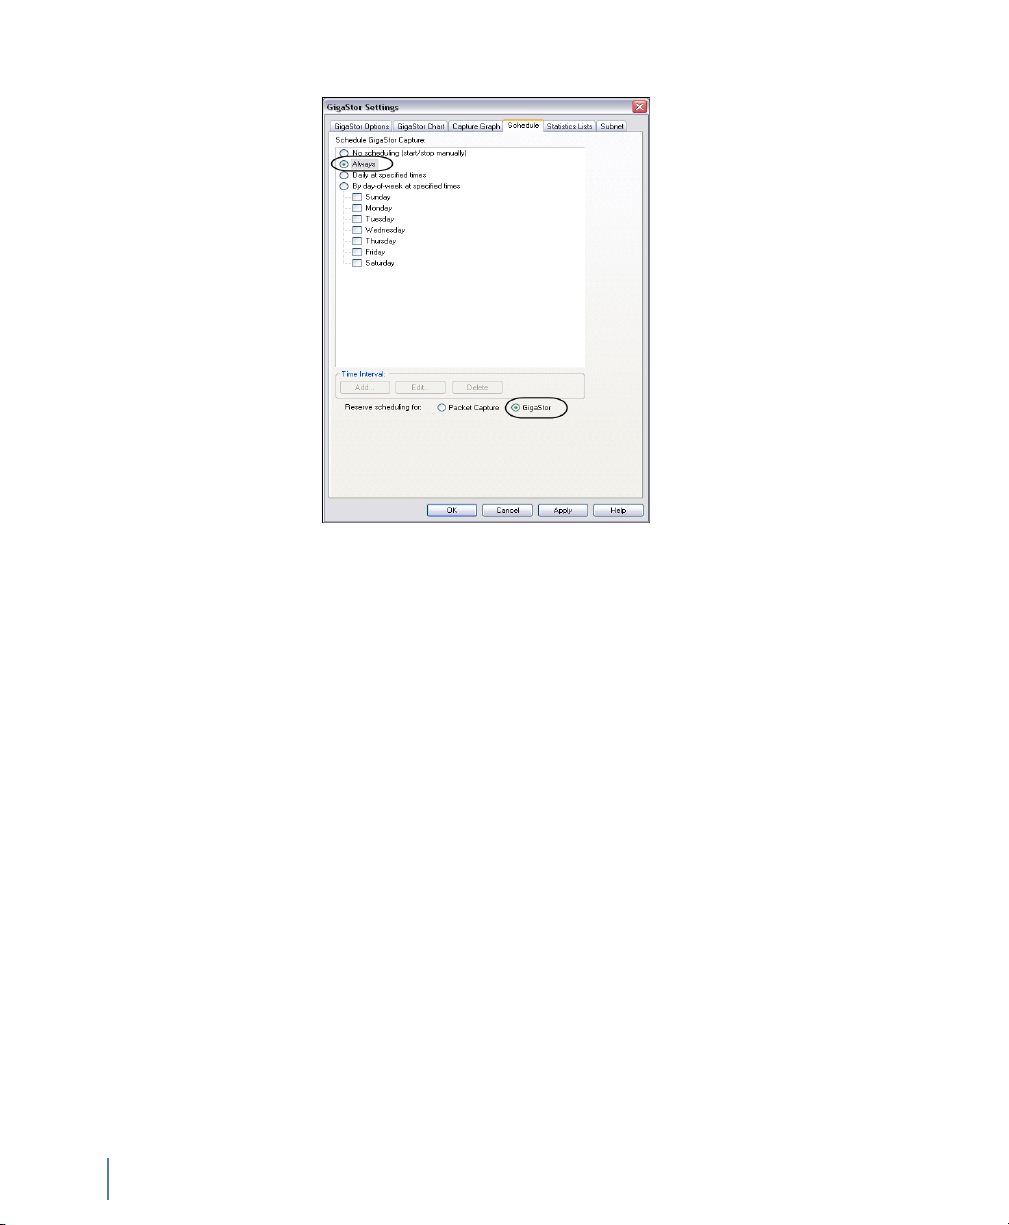
Figure 18 GigaStor Settings Schedule tab
3 In the Schedule GigaStor Capture section, select Always. For
more information about a packet capture vs. GigaStor capture, see
“Packet Capture or GigaStor Capture” on page 53.
4 In the Reserve scheduling for section, select GigaStor and click
OK. You may receive a notice about scheduling reservation. If you
do, click Yes to change the scheduling.
Connecting Observer to the GigaStor
30
Chapter 2 Installing Your GigaStor
You have installed your GigaStor! Now you must configure some
settings in Observer before getting the maximum results from your
new network analysis tool.
Q If you are monitoring a Gigabit connection, you must
configure the WAN device. See “Configuring Observer for
your Gigabit device” on page 31 for details.
Q If you are monitoring a WAN connection, you must configure
the WAN device. See “Configuring Observer for your WAN
device” on page 33 for details.
Q If you are monitoring any other connection, begin using
Observer to analyze the data. To get started, take use the
GigaStor Control Panel. It is described in “GigaStor Control
Panel” on page 57.
rev. 1
Page 31

Configuring Observer for your Gigabit device
Depending on your probe and your network, you may need to make
some changes from the factory defaults.
Q “Jumbo Frame Support (Gigabit Ethernet)” on page 31
Q “Configuring Terms of Service and Quality of Service settings”
on page 32
Jumbo Frame Support (Gigabit Ethernet)
When a Gigabit Ethernet GigaStor is the selected probe, Observer
displays an additional Gigabit tab on the Probe or Device Setup
dialog. This allows you to adjust the maximum frame size. The default
is 1514 bytes (excluding the frame checksum), which is appropriate
for standard Ethernet. If the network link you are analyzing is
configured to support jumbo frames (i.e., frames larger than 1514
bytes) you may want to change this setting to match the frame size of
the Gigabit network, up to a maximum size of 9014 bytes. Observer
will then discard frames that exceed this maximum frame size,
generating a “Frame too large” error.
1 Select the gigabit probe and right-click. A menu appears. Choose
Probe or Device Settings.
rev. 1
2 Click the Gigabit tab (Figure 19).
3 Change the frame size to suit your needs and click OK.
Configuring Observer for your Gigabit device
Chapter 2 Installing Your GigaStor
31
Page 32

Figure 19 Gigabit tab
Configuring Terms of Service and Quality of Service settings
The ToS/QoS settings are configured for each probe.
1 Select the gigabit probe and right-click. A menu appears. Choose
Probe or Device Settings.
2 Click the ToS/QoS tab (Figure 20).
3 Specify the IP precedence bits for the terms of service/quality of
service for your network.
Configuring Observer for your Gigabit device
32
Chapter 2 Installing Your GigaStor
rev. 1
Page 33

Figure 20 ToS/QoS tab
Configuring Observer for your WAN device
rev. 1
There are a number of setup options and statistical displays unique to
WAN Observer, which are described in the following subsections.
Before you can analyze the WAN link, you must set some device
options. You must also have the appropriate administrative privileges
to change WAN device settings.
Q “Digital DS3/E3/HSSI Probe Settings” on page 34
Q “Digital T1/E1 Probe Settings” on page 35
Q “Serial T1/E1 Probe Settings” on page 36
After configuring your connection, you should begin using Observer
to monitor your connections. To get started, use the information in
“Using Observer with a WAN Probe” on page 79.
Configuring Observer for your WAN device
Chapter 2 Installing Your GigaStor
33
Page 34

Digital DS3/E3/HSSI Probe Settings
To access the probe settings, select the probe, right-click and choose
Probe or Device Settings. Then click the DS3/E3/HSSI tab
(Figure 21).
Figure 21 DS3/E3/HSSI Probe Settings
Table 1 describes fields in Figure 21.
Table 1 DS3/E3/HSSI probe settings
Setting Explanation
WAN Type Choose DS3 (T3), E3 or HSSI to match the type of link you are analyzing, then
Encapsulation You must set this to match the settings on the frame relay CSU/DSU.
Subprotocol If ATM or LAPB is the selected encapsulation method, you must choose the sub-
Fractionalized Check if your link is configured for fractionalized operation. Fractionalized DS3
Bandwidth (HSSI) Set to match the bandwidth and channel settings of the fractionalized HSSI link
Configuring Observer for your WAN device
34
Chapter 2 Installing Your GigaStor
choose the frame check sequence (FCS) standard: CRC-16 (the default) or CRC-
32.
protocols on the link.
and E3 are not supported.
under analysis.
rev. 1
Page 35

Digital T1/E1 Probe Settings
To access the probe settings, select the probe, right-click and choose
Probe or Device Settings. Then click the T1/E1 tab (Figure 22).
Figure 22 T1/E1 WAN Probe Settings
Table 2 describes fields in Figure 22.
Table 2 T1/E1 WAN Probe Settings
Setting Explanation
WAN/Frame Relay Type Choose T1 or E1 to match the type of link you are analyzing.
Encapsulation You must set this to match the settings on the frame relay CSU/DSU.
Subprotocol If ATM or LAPB is the selected encapsulation method, you must choose the sub-
Link 1 and Link 2 Channel Settings (Note that for the link and settings to be activated, you must check the
On check box for that link).
Fractionalized Check if this link is configured for fractionalized operation.
Channel selector check
boxes
Include in Util.
Thermometer.
rev. 1
projects on the link.
Choose the channels you want to be included in the analysis.
Check if you want to include statistics from this link in the Bandwidth Utilization
Thermometer.
Configuring Observer for your WAN device
Chapter 2 Installing Your GigaStor
35
Page 36

Serial T1/E1 Probe Settings
Table 3 describes fields for a serial T1/E1 connection.
Table 3 Serial T1/E1 probe settings
Setting Explanation
WAN/Frame Relay Type Choose T1 or E1 to match the type of link you are analyzing.
Encapsulation You must set this to match the settings on the frame relay router.
Fractionalized Check if your link is configured for fractionalized operation.
Bandwidth Set to match the bandwidth setting of the link you are analyzing.
Configuring Observer for your WAN device
36
Chapter 2 Installing Your GigaStor
rev. 1
Page 37

Tapping an Ethernet or Fibre Channel connection
This section describes how to connect the cables for these
environments:
Q “10/100/1000, 10GbE Optical, and Fibre Channel” on
page 37
Q “Gigabit copper” on page 40
10/100/1000, 10GbE Optical, and Fibre Channel
The optical Ethernet kit includes:
Q Optical TAP
Q One, two, or four full duplex optical cables depending on
which Gen2 card you purchased.
Q One, two, or four optical Y-analyzer cables
To connect the TAP to the GigaStor:
1 Insert the supplied SFP connectors (XPF connectors for 10GbE)
into the open slots on the back of the Gen2 card(s).
rev. 1
2 If you have a GigaStor Expandable, see “Connecting the GigaStor
Expandable to the expansion units” on page 52 for details about
connecting the expansion units. After connecting them, continue
with step 3.
3 Connect the TX Data Circuit-terminating Equipment (DCE) or
SAN port to the Link A port on the nTAP .
4 Connect the TX port on the Gigabit switch (DCE) or Fibre
Channel Fabric to the Link B port on the nTA P.
5 Use the Y-analyzer cable to connect the nTAP t o th e G en 2
capture card in the GigaStor. If you have more than one nTAP ,
repeat for each additional nTA P.
Tapping an Ethernet or Fibre Channel connection
Chapter 2 Installing Your GigaStor
37
Page 38

N
DTE
DCE
DCE
1
2
DTE
4-port
DTE
DCE
DCE
1
2
DTE
DTE
DCE
DCE
3
4
DTE
8-port: mainboard
and daughter board
DCE
1
1
2
1
2
3
4
1
2
3
4
5
6
7
8
2
DTE
2-port
DCE
DTE
1
2-port
10 Gb
1
2
2
OTE: STRAIGHT-
THROUGH CABLE
Figure 23 Gen2 card port assignments
6 Use the supplied Ethernet cable to connect the network interface
card in the GigaStor to the network.
If you are using a switch’s SPAN/mirror port, no nTAP is
required. Simply plug any straight-through or Fibre cable
between the SPAN/mirror port and one of the ports on the
Gen2 capture card.
Fibre Channel has auto-negotiation disabled by default. You
must enabled it first, then connect it to the SPAN or mirror
port on your switch.
Now that you have physically connected the cables for the GigaStor,
you must now configure its software. See “Setting the GigaStor’s IP
address” on page 19.
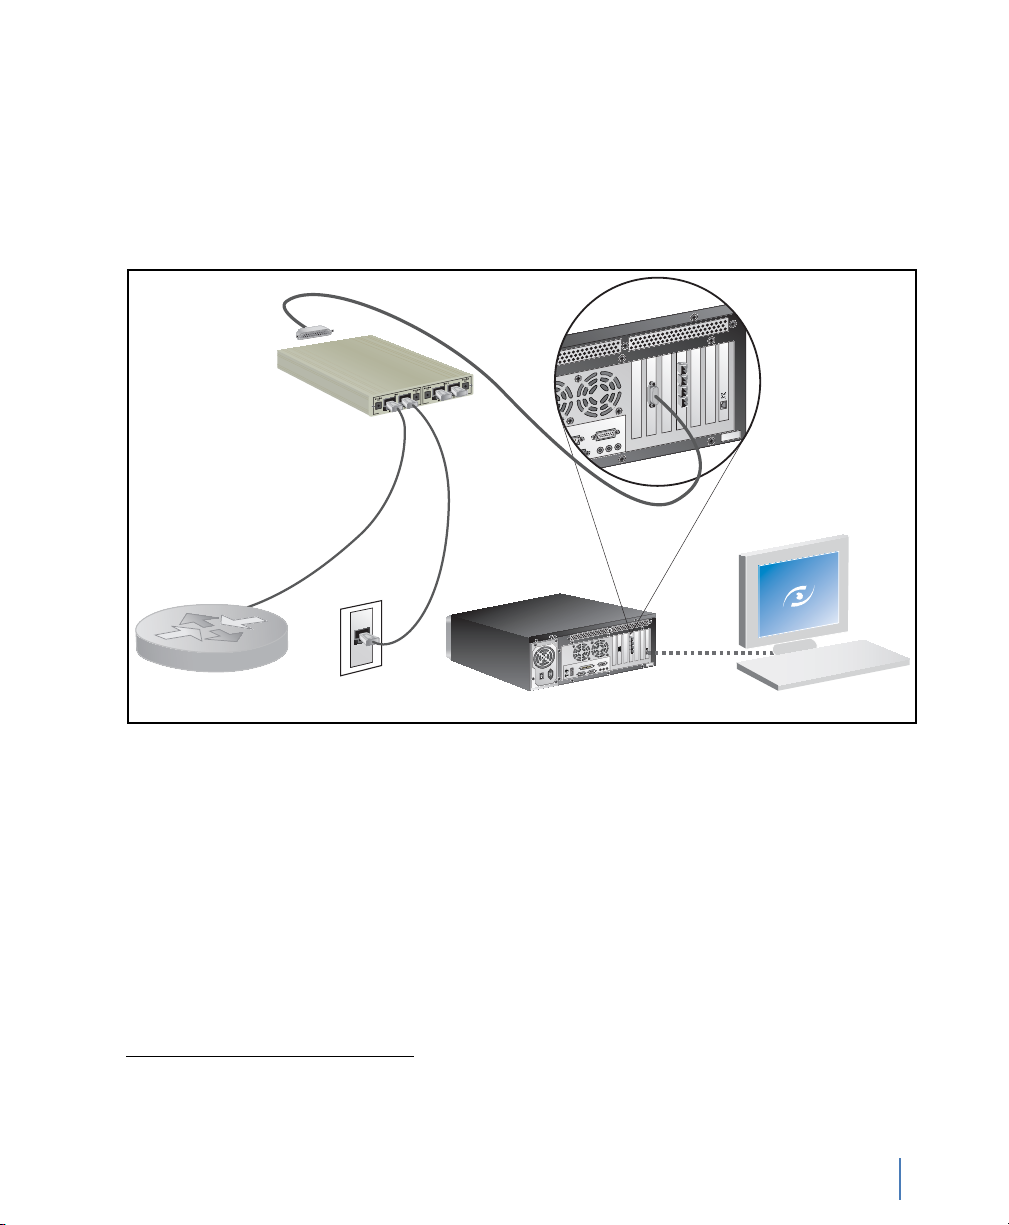
Figure 24 shows the GigaStor cabled to analyze a server. The TAP can
38
Tapping an Ethernet or Fibre Channel connection
Chapter 2 Installing Your GigaStor
replace the connection between any DCE (Data Circuit-terminating
Equipment) and DTE (Data Terminal Equipment) device or
connection.
rev. 1
Page 39

Figure 24 GigaStor with an optical nTAP
TX
RX
Gigabit Switch (DCE)Server (DTE)
10/100/1000
NIC for TCP/IP
Gen2
GigaStor or
GigaStor Expandable
Optical TAP
Observer Console
RX
TX
RX
rev. 1
Tapping an Ethernet or Fibre Channel connection
Chapter 2 Installing Your GigaStor
39
Page 40

Gigabit copper
DTE
DCE
DCE
1
2
DTE
4-port
DTE
DCE
DCE
1
2
DTE
DTE
DCE
DCE
3
4
DTE
8-port: mainboard
and daughter board
DCE
1
1
2
1
2
3
4
1
2
3
4
5
6
7
8
2
DTE
2-port
The Gigabit copper kit includes:
Q Copper nTA P
Q 1, 2, or 4 standard Ethernet cables
Q 2, 4, or 8 analyzer cables
To connect the TAP to the GigaStor:
1 Insert the supplied SFP connectors into the open slots on the back
of the Gen2 card(s).
2 If you have a GigaStor Expandable, see “Connecting the GigaStor
Expandable to the expansion units” on page 52 for details about
connecting them. After connecting them, continue with step 3.
3 Connect the TX Data Circuit-terminating Equipment (DCE) or
SAN port to the Link A port on the nTAP .
4 Connect the TX port Gigabit switch (DCE) to the Link B port on
the nTAP .
5 Use the two analyzer cables to connect the analyzer port on the
nTAP to the Gen2 capture card in the GigaStor. If you have more
than one nTAP, repeat for each additional nTA P.
Figure 25 8-port Gen2 card port assignments
40
Tapping an Ethernet or Fibre Channel connection
Chapter 2 Installing Your GigaStor
rev. 1
Page 41

N
Gigabit Switch (DCE)Server (DTE)
10/100/1000
NIC for TCP/IP
Gen2
GigaStor or
GigaStor Expandable
Gigabit
Copper TAP
Observer Console
OTE: PASS-THROUGH
CABLE
6 Use the supplied Ethernet cable to connect the network interface
card in the GigaStor to the network.
If you are using a switch’s SPAN/mirror port, no nTAP is
required. Simply plug any straight-through Ethernet cable
into the SPAN/mirror port on the switch and one of the ports
on the Gen2 capture card.
Now that you have physically connected the cables for the GigaStor,
you must now configure its software. See “Setting the GigaStor’s IP
address” on page 19.
Figure 26 shows the GigaStor as it would be cabled to analyze a
server. The TAP can replace the gigabit connection between any DCE
(Data Circuit-terminating Equipment) and DTE (Data Terminal
Equipment) device or connection.
Figure 26 GigaStor with a copper TAP
rev. 1
Tapping an Ethernet or Fibre Channel connection
41
Chapter 2 Installing Your GigaStor
Page 42

Tapping a WAN connection
This section describes how to connect the cables for these
environments:
Q “T1/E1” on page 42
Q “DS3/E3” on page 46
T1/E1
See “Digital” on page 42 or “Serial” on page 44 depending on your
needs.
Digital
The digital T1/E1 kit includes:
Q One T1/E1 dual link TAP
Q One T1/E1 WAN analyzer cable
Q Two T1/E1 Ethernet cables
1 If you have a GigaStor Expandable, see “Connecting the GigaStor
Expandable to the expansion units” on page 52 for details about
connecting them. After connecting them, continue with step 2.
Tapping a WAN connection
42
Chapter 2 Installing Your GigaStor
2 Connect the TAP to the GigaStor using the T1/E1 WAN analyzer
cable.
3 From your T1/E1 cable that connects the DCE to your CSU/
DSU, unplug the CSU/DSU end and plug it into the Link 1 IN
port on the TAP.
4 Using one of the supplied T1/E1 Ethernet cables, connect the
Link 1 OUT port of the TAP to the CSU/DSU.
5 If you have a second T1 you want to monitor, repeat step 3 and
step 4 using Link 2.
6 Use the supplied Ethernet cable to connect the network interface
card in the GigaStor to the network.
rev. 1
Page 43
Now that you have physically connected the cables for the GigaStor,
you must now configure its software. See “Setting the GigaStor’s IP
address” on page 19.
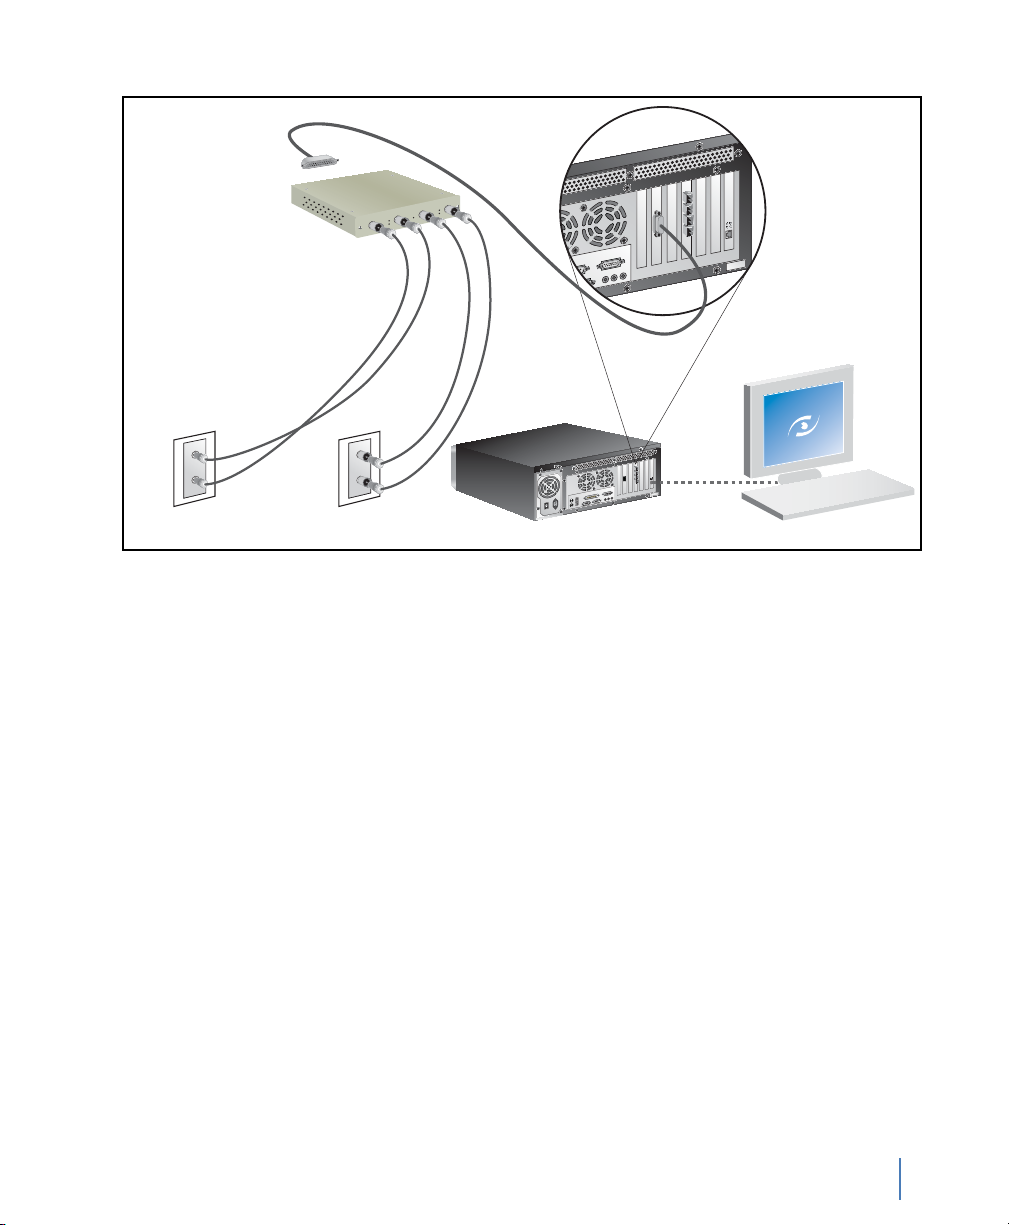
Figure 27 shows the GigaStor as it would be cabled to analyze T1/E1
link with a Channel Service Unit/Data Service Unit (CSU/DSU)
Figure 27 Digital T1/E1 Tap
Gen2
T1 TAP
10/100/1000
NIC for TCP/IP
1
.
Router or
CSU/DSU (DTE)
1. The 4-Port version of this system has an additional PC interface card and an additional TAP and cable kit. Connect
the second TAP kit as shown in the diagram.
rev. 1
T1 Line (DCE)
GigaStor or
GigaStor Expandable
Chapter 2 Installing Your GigaStor
Observer Console
Tapping a WAN connection
43
Page 44

Serial
The serial T1/E1 kit includes:
Q One serial T1/E1 WAN TAP
Q One serial Y cable
Q One serial T1 WAN cable
1 If you have a GigaStor Expandable, see “Connecting the GigaStor
Expandable to the expansion units” on page 52 for details about
connecting them. After connecting them, continue with step 2.
2 Connect the TAP to the GigaStor using the serial T1/E1 WAN
cable.
3 Using the serial Y cable, connect it to the TAP and then to your
CSU/DSU and your router.
4 Use the supplied Ethernet cable to connect the network interface
card in the GigaStor to the network.
Now that you have physically connected the cables for the GigaStor,
you must now configure its software. See “Setting the GigaStor’s IP
address” on page 19.
Tapping a WAN connection
44
Chapter 2 Installing Your GigaStor
rev. 1
Page 45
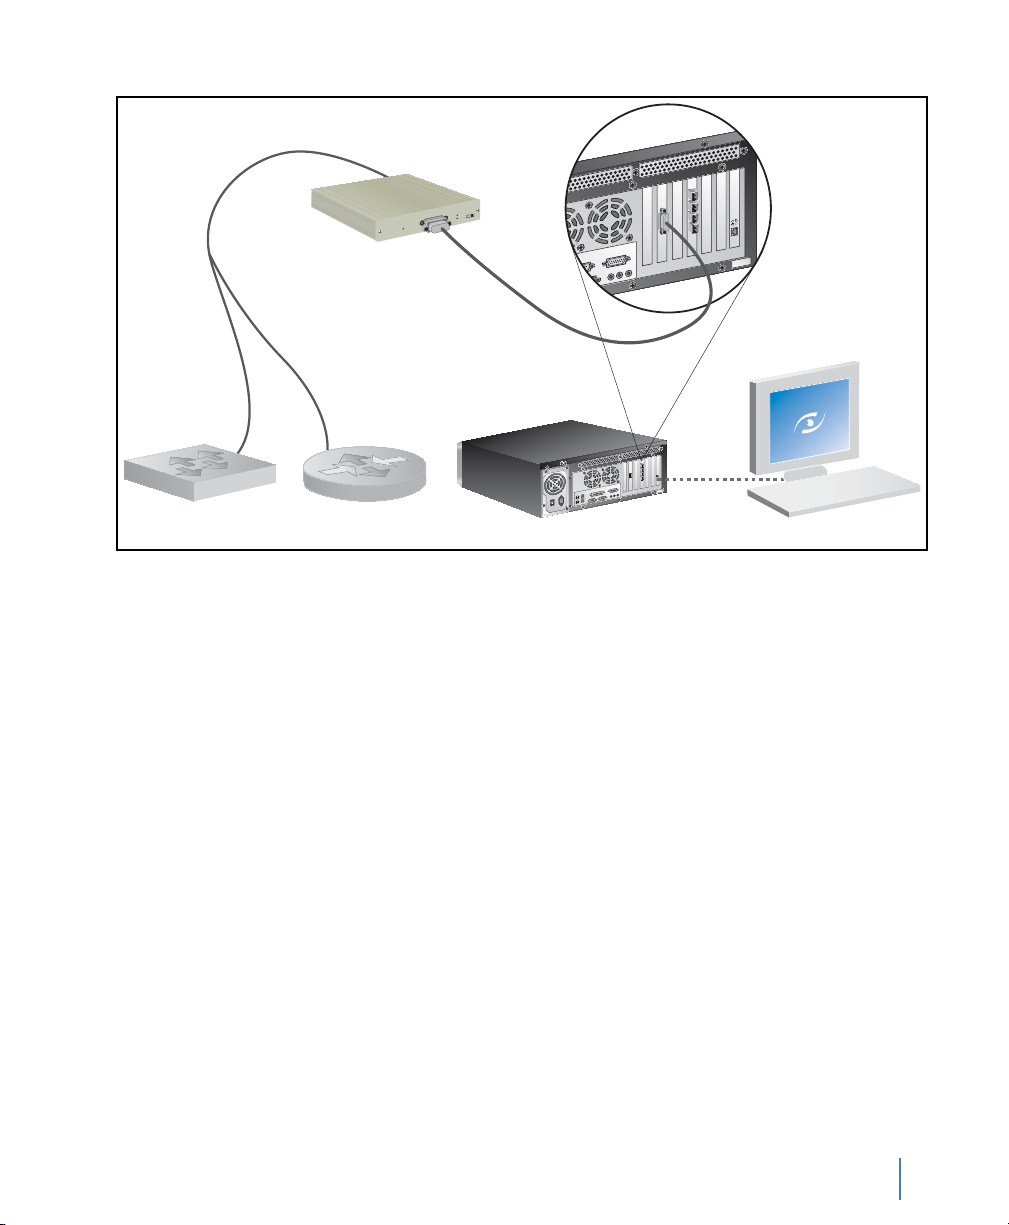
Figure 28 WAN Serial T1/E1 TAP
Router (DCE)CSU/DSU (DTE)
10/100/1000
NIC for TCP/IP
GigaStor or
GigaStor Expandable
Serial T1/E1 TAP
Observer Console
POWER
DTE
DCE
ACTIVE OUTPUT
MODE
AB
rev. 1
Tapping a WAN connection
Chapter 2 Installing Your GigaStor
45
Page 46

DS3/E3
See “Digital” on page 46 or “Serial/HSSI” on page 48 depending on
your needs.
Digital
The digital DS3/E3 kit includes:
Q One digital DS3/E3 TAP
Q One digital DS3/E3 WAN cable
Q Two full-duplex DS3/E3 coax cables
1 If you have a GigaStor Expandable, see “Connecting the GigaStor
Expandable to the expansion units” on page 52 for details about
connecting them. After connecting them, continue with step 2.
2 Connect the TAP to the GigaStor using the supplied digital DS3/
E3 WAN cable.
3 From your coax cables that connects the router to your CSU/
DSU, unplug the ends of both cables connected to the CSU/DSU
and plug them into the IN ports on the TAP.
Tapping a WAN connection
46
Chapter 2 Installing Your GigaStor
4 Using the supplied coax cables, connect them from the OUT
ports on the TAP to the CSU/DSU.
5 Use the supplied Ethernet cable to connect the network interface
card in the GigaStor to the network.
Now that you have physically connected the cables for the GigaStor,
you must now configure its software. See “Setting the GigaStor’s IP
address” on page 19.
rev. 1
Page 47
DS3 TAP
IN (RX)
OUT (TX)
TX
TX
Figure 29 DS3/E3 TAP
DCE
LOS
E3
DTE
OUT
LOS
LOF
POWER
IN
OUT
LOF
IN
RX
RX
OUT (TX)
IN (RX)
DS3 Line (DCE)CSU/DSU (DTE)
GigaStor or
GigaStor Expandable
10/100/1000
NIC for TCP/IP
Observer Console
rev. 1
Tapping a WAN connection
Chapter 2 Installing Your GigaStor
47
Page 48

Serial/HSSI
The serial DS3 kit includes:
Q One serial DS3/E3 TAP
Q One HSSI Y-cable
Q One HSSI cable
Q One Ethernet cable
1 If you have a GigaStor Expandable, see “Connecting the GigaStor
Expandable to the expansion units” on page 52 for details about
connecting them. After connecting them, continue with step 2.
2 Connect the TAP to the GigaStor using the supplied HSSI Y-
cable.
3 From your serial HSSI cable that connects the router to your
CSU/DSU, unplug the CSU/DSU end and plug it into the IN port
on the TAP.
4 Using the supplied HSSI cable, connect it to OUT port on the
TAP.
5 Use the supplied Ethernet cable to connect the network interface
card in the GigaStor to the network.
Tapping a WAN connection
48
Chapter 2 Installing Your GigaStor
Now that you have physically connected the cables for the GigaStor,
you must now configure its software. See “Setting the GigaStor’s IP
address” on page 19.
rev. 1
Page 49

Figure 30 WAN HSSI
Router (DCE)CSU/DSU (DTE)
10/100/1000
NIC for TCP/IP
GigaStor or
GigaStor Expandable
HSSI TAP
Observer Console
HSSI IN
HSSI OUT
rev. 1
Tapping a WAN connection
Chapter 2 Installing Your GigaStor
49
Page 50

Installing the drives in your GigaStor
CAUTION HANDLING
DRIVES
THE
Be especially careful when handling and installing the hard
drives. Proper handling is paramount to the longevity of the
unit. The internal mechanism of the hard drive can be
seriously damaged if the hard drive is subjected to forces
outside its environmental specifications.
When transporting the hard drive, always use the original
packaging in which the hard drive was delivered to you, and
avoid exposing the hard drive to extreme changes in
temperature to minimize the risk of condensation.
Q Never drop the unit. Handle it with care.
Q Never place the hard drive in the vicinity of equipment giving
off strong magnetic fields, such as CRT monitors, televisions,
or loudspeakers.
Q Always use an anti-static mat and wrist strap when handling
the hard drive. Hold the hard drive by the base and never
touch the components on the circuit board assembly.
Q If the temperature difference between the storage location
and installation location exceeds 50°F/10°C, for temperature
acclimation purposes, leave the hard drive in the new location
for at least two hours before turning it on.
Installing the drives in your GigaStor
50
Chapter 2 Installing Your GigaStor
Each drive for the GigaStor is packed in shock-resistant boxes. The
tray that holds each drive has two optical pipes that run along the
right side. These pipes are connected to the indicator lights on the
front of the tray and are prone to cracking or breaking if you squeeze
the sides of the tray too tightly.
Stickers on each drive identify which slot (and expansion unit) it
should be installed in. The drive labeled A1 must be installed in the
lower left slot. The disk expansion units for the GigaStor Expandable
are labeled A, B, or C on the back of the expansion unit’s case.
1 Open the locking latch by pushing the release tab until the tray
panel pops out.
2 Gently, but firmly, push the A1 drive into the appropriate slot
until you feel the pins engage and the latch closes slightly.
rev. 1
Page 51

Figure 31 shows how the drive numbers correspond to slot
A7
A5
A3
A1
A8
A6
A4
A2
A1
C13
C9
C5
C1
C16
C12
C8
C4
C14
C10
C6
C2
C15
C11
C7
C3
B13
B9
B5
B1
B16
B12
B8
B4
B14
B10
B6
B2
B15
B11
B7
B3
A13
A9
A5
A1
A16
A12
A8
A4
A14
A10
A6
A2
A15
A11
A7
A3
A13
A9
A5
A1
A16
A12
A8
A4
A14
A10
A6
A2
A15
A11
A7
A3
locations.
Figure 31 GigaStor drive locations
12
A13
A9
A5
A1
Drive ID sticker
13
14
15
16
9
10
11
12
5
6
7
8
1
2
3
4
A14
A10
A6
A2
A15
A11
A7
A3
!
12
!
A16
A12
A8
A4
GigaStor (8 drive)
GigaStor (16 drive)
GigaStor Expandable
expansion units
C
AUTION GIGASTOR
EXPANDABLE DRIVE
LOCATION
It is important that you install the drives in the correct drive
slot, and in correct expansion unit if you have a GigaStor
Expandable. Failure to install the drives in the proper order
will result in poor read/write performance or possibly RAID
array failure.
3 Push the latch in all the way until it clicks.
4 Repeat until all drives are in the chassis. For the GigaStor
Expandable continue with B1-B16 and C1-C16 as appropriate.
rev. 1
5 If you are installing a GigaStor Expandable, you must also connect
the cables. See “Connecting the GigaStor Expandable to the
expansion units” on page 52. Otherwise, continue with “Installing
the GigaStor and connecting the cables” on page 19.
Installing the drives in your GigaStor
Chapter 2 Installing Your GigaStor
51
Page 52

Connecting the GigaStor Expandable to the expansion units
A
1 2 3 4
C
1 2 3 4
B
1 2 3 4
After you have installed the drives Use the supplied cables to connect
the expansion units to the GigaStor Expandable. Figure 32 shows how
to cable the GigaStor Expandable to the expansion units.
Figure 32 Cable diagram for the GigaStor Expandable
A
1 2 3 4
B
1 234
C
1 234
B
1 2 3 4
C
1 2 3 4
N
OTE: GIGASTOR
52
EXPANDABLE
Installing the drives in your GigaStor
Chapter 2 Installing Your GigaStor
Otherwise, continue with “Installing the GigaStor and connecting the
cables” on page 19.
When turning the GigaStor Expandable components on and
off, follow this order to ensure proper drive recognition and
operation:
Start the disk expansion units before turning on the
capture/controller PC unit.
Shut down the capture/controller PC unit before turning
off the disk expansion units.
rev. 1
Page 53

C h a p t e r 3
Packet Capture or GigaStor Capture
rev. 1
53
Chapter 3 Packet Capture or GigaStor Capture
Page 54

Capturing Packets with the GigaStor
A GigaStor can accumulate terabytes of stored network traffic. To
manage the sheer volume of data, the GigaStor includes an
alternative, specialized capture and analysis control panel. The
GigaStor Control Panel manages the capture, indexing, and storage of
large numbers of packets over long periods of time. While the
GigaStor control panel is active, standard packets captures are
unavailable. You cannot run the two types of captures simultaneously.
While actively capturing packets, the GigaStor control tracks network
statistics and indexes them by time as it saves the packets to disk. This
allows you to quickly scan the traffic for interesting activity and create
filters to focus on specific traffic using the slider controls and
constraint options.
The GigaStor control panel also automates storage management by
deleting the oldest data before storage runs out. This maintains a
multi-terabyte “sliding windows” of time within which you can review
and decode traffic. It also allows for passive (in other words, virtual)
probe instances, which allow users to have their own instances (and
security credentials) without duplicating data collection or storage.
You can view the sliding window as a time line chart. Depending on
what constraint are in effect and your display options determine what
appears on the chart. By using time selection sliders and other options,
you can quickly acquire and analyze the packets by clicking the
Analyze button. This opens the standard packet decode and analysis
window. From there you can view packets, save them, and perform
further filtering if desired.
Packet capture buffer and statistics buffer
There are two kinds of buffers that a probe uses to store data in realtime: capture buffers and statistical buffers. The capture buffer stores
the raw data captured from the network while the statistical buffer
stores data entries that are snapshots of a given statistical data point.
Selecting an appropriate capture buffer size given system resources is
all most users need to worry about; the default settings for the
statistical buffers work perfectly fine in the vast majority of
circumstances.
Capturing Packets with the GigaStor
54
Chapter 3 Packet Capture or GigaStor Capture
rev. 1
Page 55

However, if you are pushing the limits of the system on which the
Network Speed × Average Throughput (MB/second) = Seconds of data storeable in RAM
probe is installed by creating many probe instances, you may be able
to avoid some performance problems by fine-tuning the memory
allocation for each probe instance.
For example, suppose you want to give a number of remote
administrators access to Top Talkers data from a given probe. You will
be able to add more probe instances within a given system’s memory
constraints if you set up the statistics buffers to only allocate memory
for tracking Top Talkers and to not allocate memory for statistics that
no one will be looking at.
Observer has no limitations on the amount of RAM that can be used
for a buffer.
You can allocate up to 4 gigabytes, limited only by the physical
memory installed on your Windows system. Note that when run on a
64-bit Windows, there is no 4 GB limitation for the capture buffer;
you are limited only by the amount of physical memory installed on
the probe.
In all cases, the actual buffer size (Max Buffer Size) is also reduced by
7% for memory management purposes. Should you try and exceed the
Max Buffer Size an error dialog will be displayed indicating the
minimum and maximum buffer size for your Observer (or probe)
buffer.
For passive probe instances, which are most often used for
troubleshooting, the default settings should be sufficient. If you are
creating an active probe instance (one that writes to disk and not just
reads from it), then you may want to use the following formula as a
rough guideline to determine how much RAM to reserve for the
probe instance when doing a packet capture. (This formula does not
apply when doing a GigaStor capture to disk. It is only for passive
probe instances doing packet captures.)
T
IP! CAPTURE
BUFFER
rev. 1
You want a buffer that will handle your largest, worst case
burst.
Packet capture buffer and statistics buffer
Chapter 3 Packet Capture or GigaStor Capture
55
Page 56

Packet capture buffer and statistics buffer
56
Chapter 3 Packet Capture or GigaStor Capture
rev. 1
Page 57

C h a p t e r 4
GigaStor Control Panel
rev. 1
57
Chapter 4 GigaStor Control Panel
Page 58
Once the GigaStor is up and running on the network, you can run
Expert Observer or Observer Suite to connect to the GigaStor
running as a probe to begin analyzing the network, or you can run the
GigaStor in Console mode via Windows Terminal Server (or a
monitor and keyboard that are physically attached). Observer works
with the GigaStor just as it does any other Network Instruments
probe, with some GigaStor-specific enhancements (described below).
The GigaStor Control Panel is available from the probe itself (when
running in Console Mode), and also from any Observer Expert or
Observer Suite console when it is connected to a GigaStor. In either
case, choose GigaStor Capture Analysis from Observer’s Capture
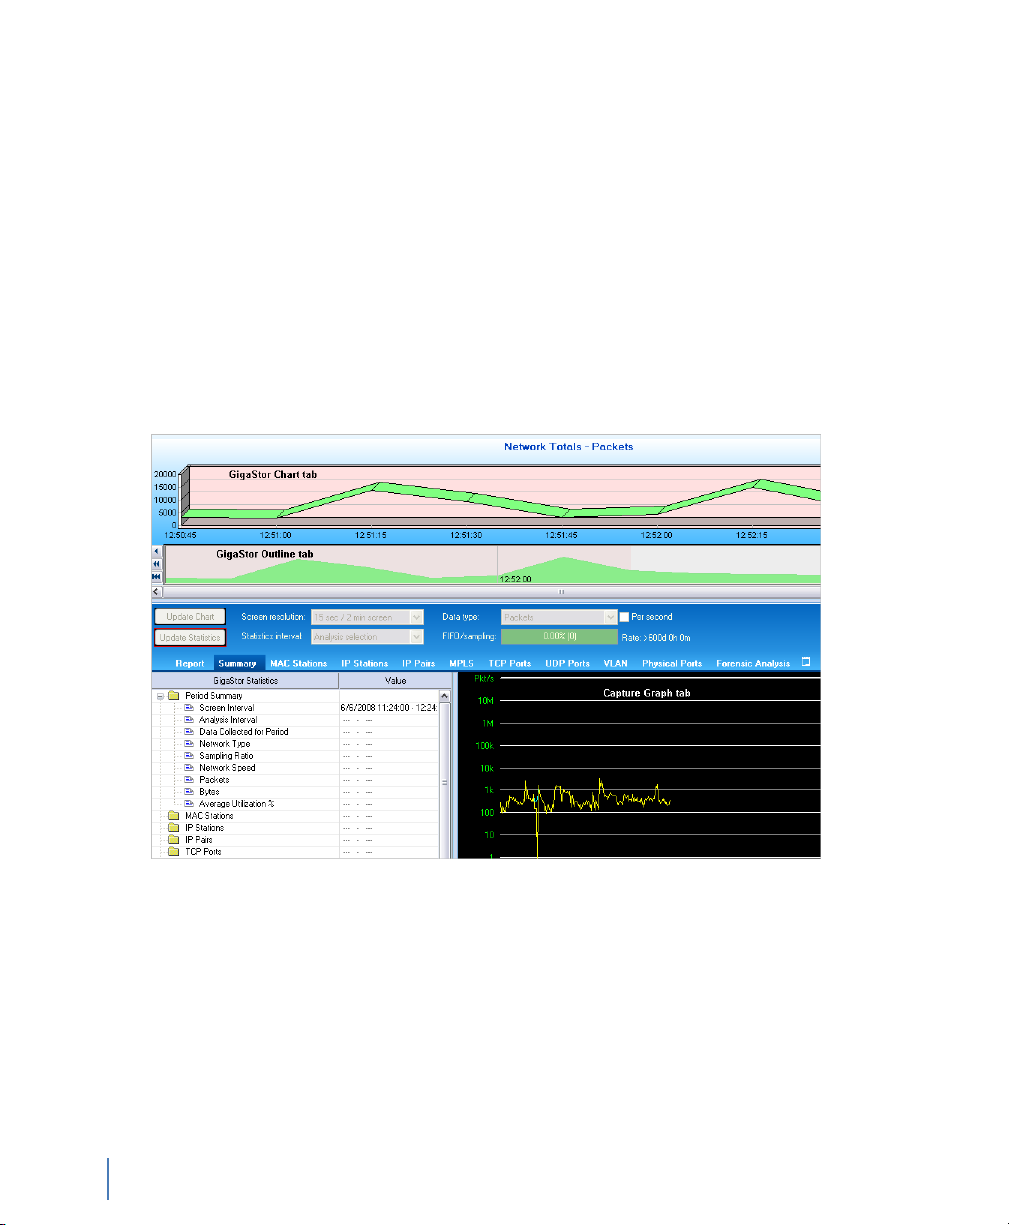
menu, and a screen like the following is displayed:
Figure 33 GigaStor Control Panel
58
Chapter 4 GigaStor Control Panel
The GigaStor Control Panel shows traffic on a time line graph,
allowing you to select packets for decoding, analysis, and display by
defining the time period you want to view, and the types of packets
you want to include.
Use the sliders at the top of the time line chart to select the time
period you are interested in analyzing. If desired, you can further
constrain the display of packets by MAC Stations, IP Stations, IP Pairs,
rev. 1
Page 59

etc., by clicking on the appropriate tab and selecting the items you
want to see on the time line chart.
Display Controls
Charts and statistical tables are refreshed only when you click the
Update Chart or Update Statistics button. The buttons will flash with
a red border when a refresh is necessary. You can also have the display
auto-update. For details, “GigaStor Options tab” on page 64.
You can change the Screen resolution (in other words, the time scale)
and which Data type (i.e., packets or bytes, either per second or
totals) to chart by using the drop-down controls and per second check
box. The Statistics interval control lets you display network statistics
based on the entire visible chart, or only show data derived from the
time interval you have selected to analyze.
The FIFO gauge on the right side of the control pane tracks how well
GigaStor’s disk hardware is keeping up with the current traffic load; if
the FIFO gauge shows 90% or greater, you should consider reducing
the load using one or more of the following methods:
Q Allocate more memory to the GigaStor instance. See the
instructions in “Probe administration” on page 24 for details
about allocating memory for the probe instance.
rev. 1
Q Activate dynamic sampling, or increase the fixed sampling
ratio. See details about packet capture in “Packet capture
buffer and statistics buffer” on page 54.
Q Activate partial packet capture or reduce the size of portion
captured. See details about partial packet capture in “Capture
partial packets” on page 65.
The Rate: field shows how much traffic the GigaStor will be able to
archive given the active instance’s current disk usage rate. It is updated
dynamically as the usage rates change. To increase the archivable time
window, activate partial packet capture and sampling as described
above, or apply pre-filtering.
Display Controls
Chapter 4 GigaStor Control Panel
59
Page 60
Right-click menus
As with other Observer displays, the charts and tables of the GigaStor
control panel offer many right-click shortcuts.
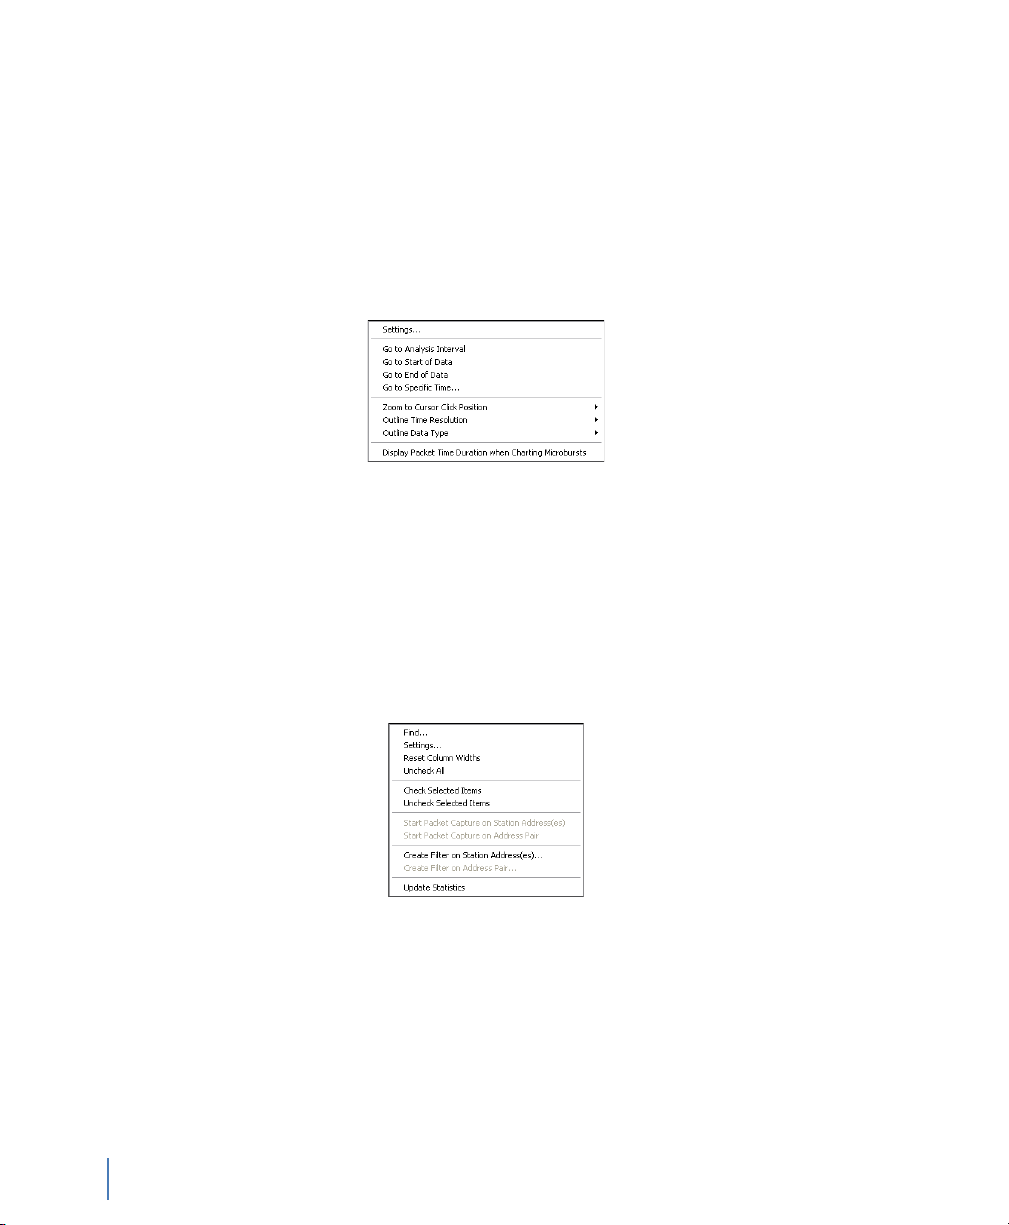
Q Right-clicking on the chart portion of the Control Panel
displays the following options for navigating and displaying
traffic data:
Figure 34 Chart right-click menu
Q Settings brings up GigaStor Control panel settings; the Zoom
to Cursor Click Position options let you select from different
chart resolutions, centering the display at the current cursor
position.
Q Right-clicking on any table (such as Summary, TCP, UDP,
etc.) presents a context-sensitive menu. The TCP right-click
menu is typical:
Right-click menus
60
Chapter 4 GigaStor Control Panel
Figure 35 TCP right-click menu
Q The options themselves are self-explanatory. Filtering options
displayed depend on which table you right-clicked on.
rev. 1
Page 61
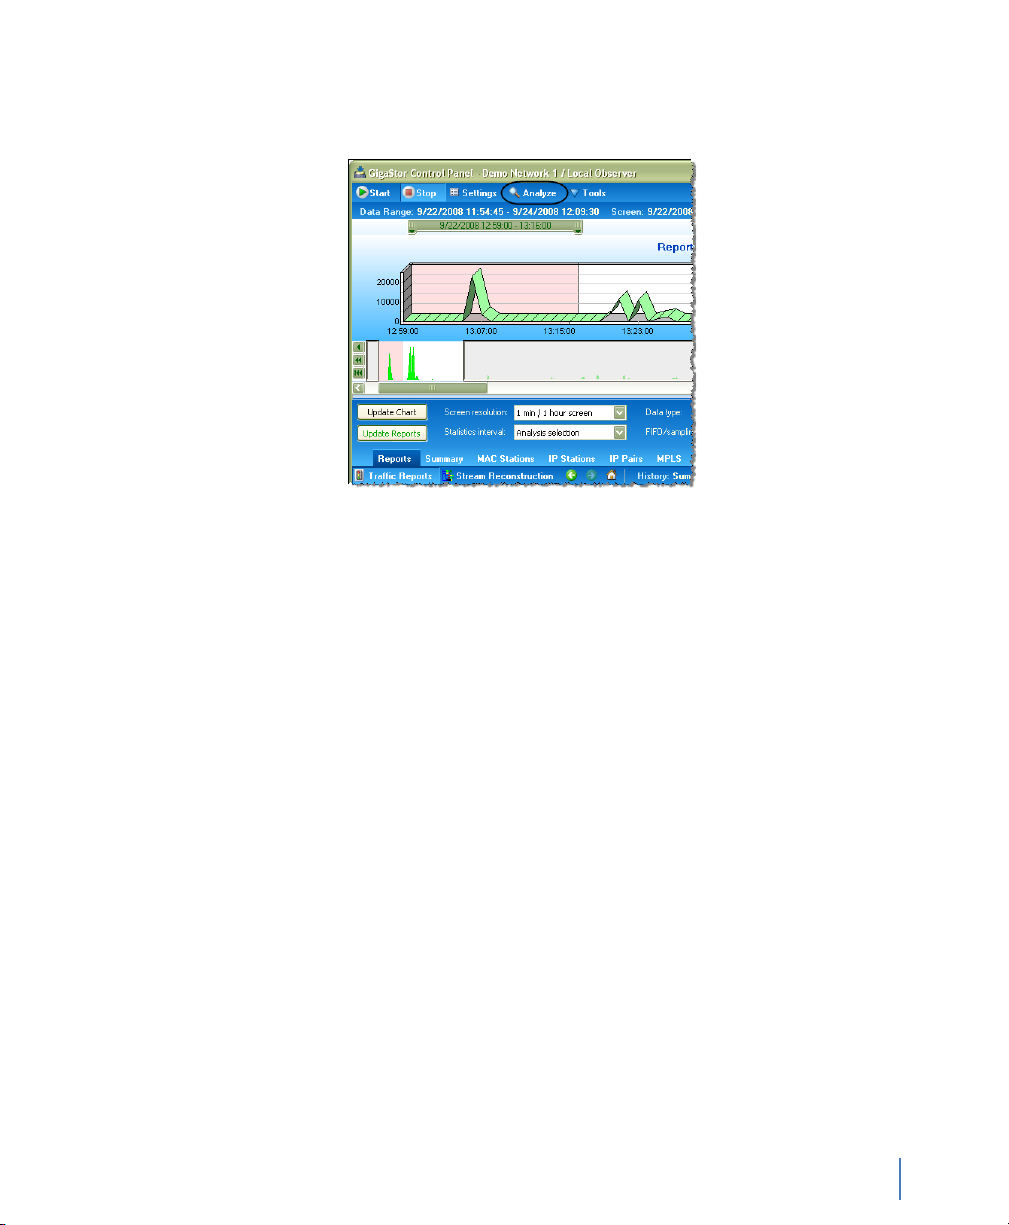
Analyze button
Figure 36 GigaStor Control Panel Analyze button
When you click the Analyze button to view the results, you are
prompted to select how to filter the packet capture for display
(Figure 37).
After you click OK, any filters you have chosen are applied, and a
standard decode window is displayed, unless you have checked the
“Display selected filter before starting analysis” option, in which case
the filter editor is displayed.
rev. 1
Analyze button
Chapter 4 GigaStor Control Panel
61
Page 62
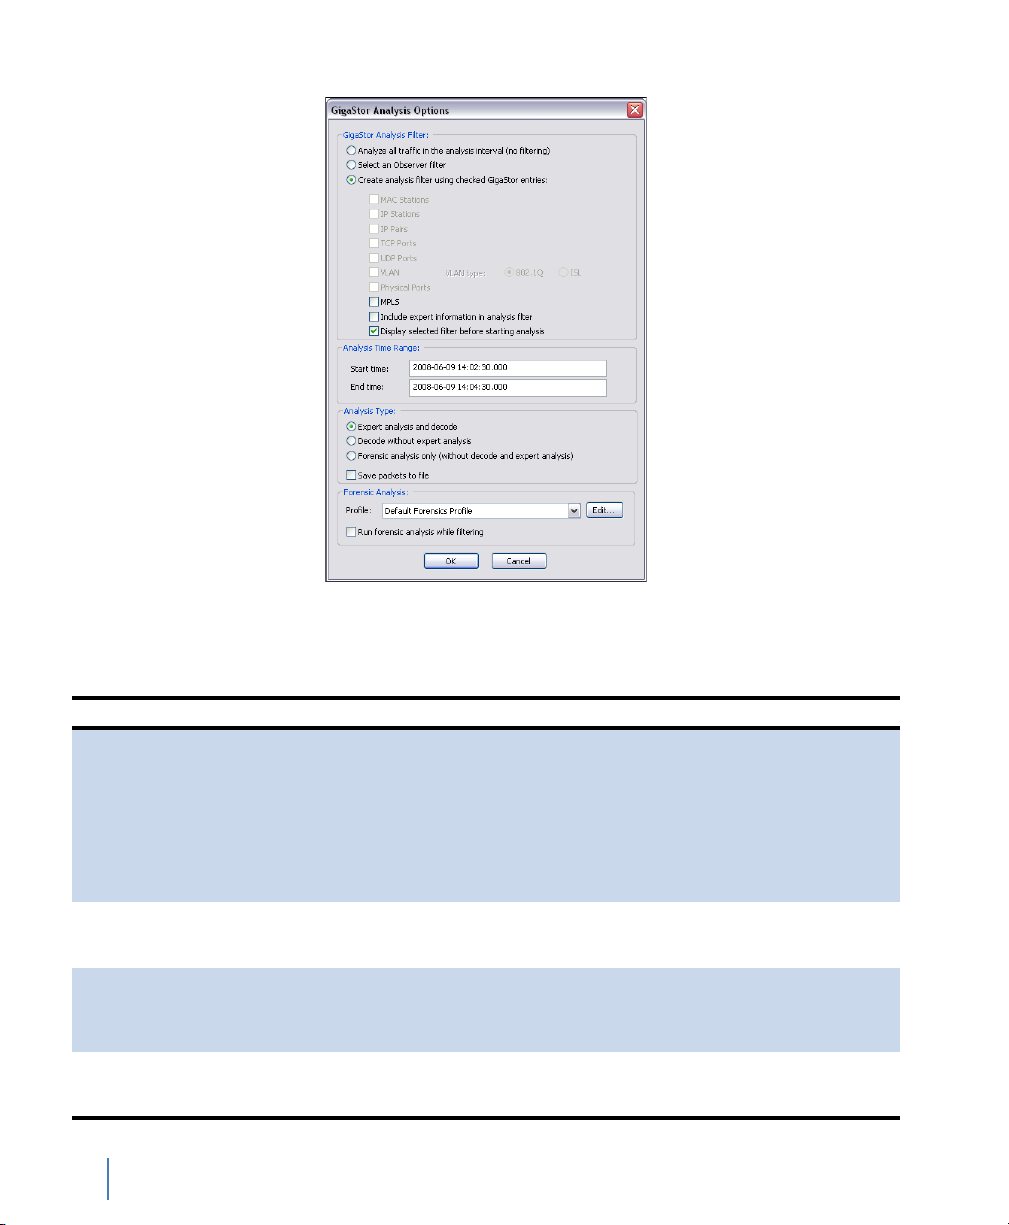
Figure 37 GigaStor Analysis Options window
Table 4 describes what the fields in the various sections control.
Table 4 GigaStor Analysis Options
Field section Description
GigaStor Analysis Filter Choose whether to Analyze all traffic in the analysis period, Select
Analysis Time Range Set the start and end time for analysis. The fields are pre-filled
Analysis Type Choose between Expert analysis and decode, Decode without
Forensic Analysis Select a Forensic Analysis profile. See “Starting Forensic Analysis
Analyze button
62
Chapter 4 GigaStor Control Panel
an Observer filter to apply before decoding, or Create an analysis
filter using checked GigaStor entries (in other words, based on the
constraints you have selected using the GigaStor control panel).
Subsequent check boxes let you choose which criteria from the
Control Panel selection to include in the analysis. The Include
expert information in analysis filter option should be checked if
you plan on using Observer’s Expert Analysis on the packet buffer;
otherwise leave it unchecked.
based on the time slider selections made from the GigaStor
Control Panel.
expert analysis, or Forensic analysis only. Load time is significantly
reduced (especially with large files) by bypassing analysis
processing for features you are not interested in.
using Snort rules” on page 92 for details on using this Snortcompatible feature.
rev. 1
Page 63
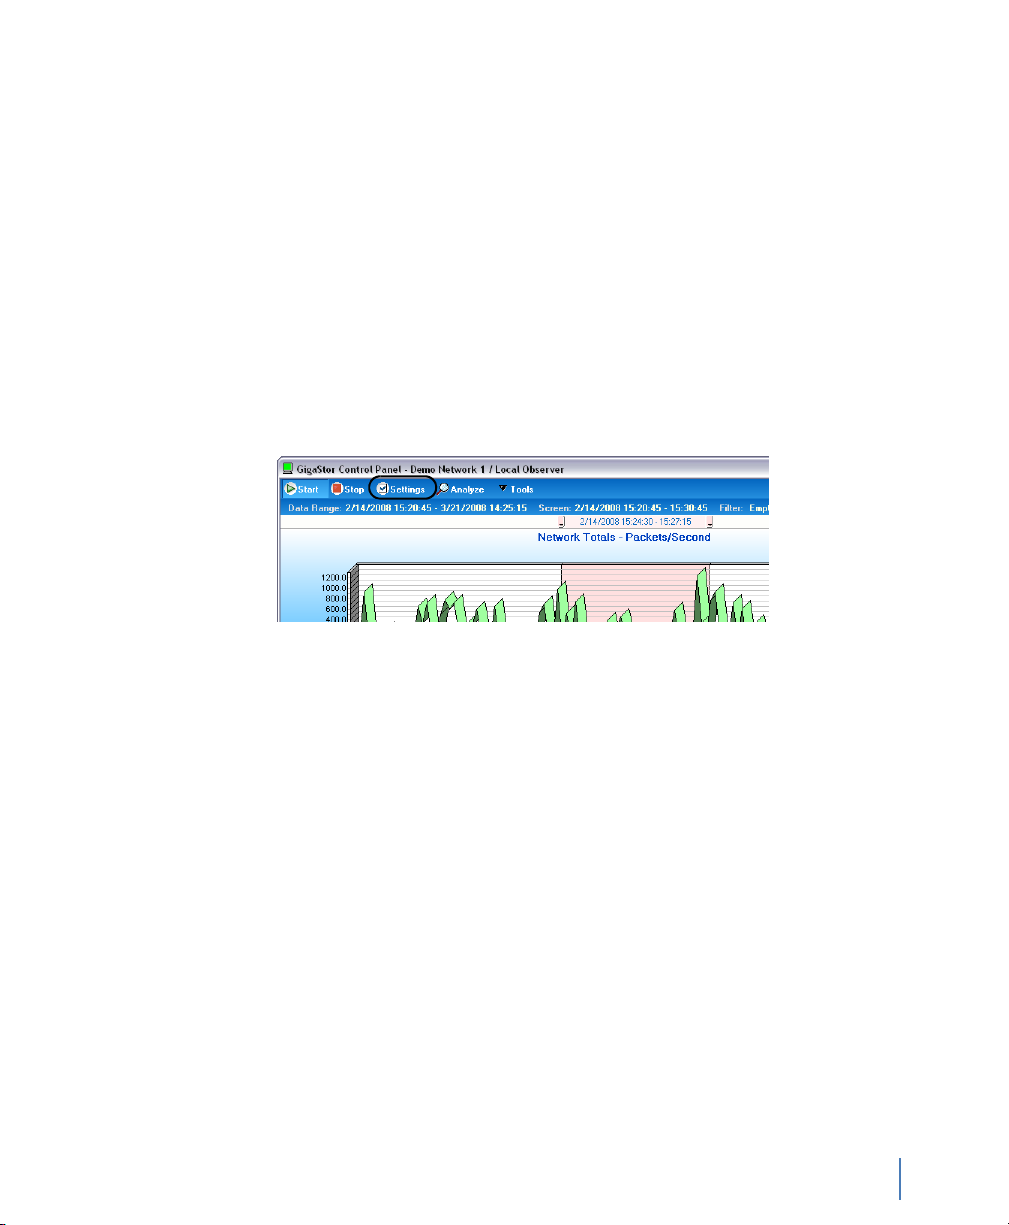
Configuring the GigaStor through the Control Panel
Just as with the standard Observer packet capture interface, you can
set the colors of the capture graph and schedule captures to be
automatically launched (or to run all the time). In addition, there are
a number of GigaStor-specific settings that allow you to fine-tune
performance based on your particular needs.
1 Open the GigaStor Control Panel (Capture →GigaStor Capture
Analysis).
2 Click the Settings button.
3 Click the tab for the settings you want to change.
Figure 38 GigaStor Control Panel Analyze button
These options and settings are described in
rev. 1
Q “GigaStor Options tab” on page 64
Q “GigaStor Chart tab” on page 67
Q “GigaStor Outline” on page 67
Q “Capture Graph tab” on page 69
Q “GigaStor Schedule tab” on page 70
Q “Statistics Lists tab” on page 71
Q “Subnet” on page 72
Q “GigaStor reports” on page 75
Q “Export” on page 77
Configuring the GigaStor through the Control Panel
Chapter 4 GigaStor Control Panel
63
Page 64

GigaStor Options tab
This tab lets you configure many options for the GigaStor. Follow the
instructions in “Configuring the GigaStor through the Control Panel”
on page 63 to open the GigaStor Options tab (Figure 39).
Figure 39 GigaStor Options tab
See Table 5 for a description of each field of the GigaStor Options tab.
Configuring the GigaStor through the Control Panel
64
Chapter 4 GigaStor Control Panel
rev. 1
Page 65

Table 5 GigaStor Options tab
Field Description
Capture Buffer size Allows you to set the amount of Windows memory that Observer
Do not include traffic from Observer/
Probe local MAC address
Capture partial packets By default, Observer will capture the entire packet. This option
Network Load When checked, Observer will not strip out the informational
will dedicate to the capture buffer cache for this instance. Values
are in megabytes. This configuration value has been pre-set for
optimum performance given a single GigaStor collection instance.
The factory settings also allow enough memory to set up a number
of passive or virtual instances, which will allow multiple users to
view the analysis results while avoiding redundant processing,
memory, and disk storage consumption.
If you wish to run multiple collection instances to monitor multiple
links or networks, you can decrease the capture buffer size
dedicated to GigaStor collection which will release some memory
for creating other probe collection instances, but be careful.
Inadequate memory allocation to GigaStor collection can affect
performance and result in dropped packets during high load
periods.
A GigaStor Instance can be as large as the physical memory
installed on your system after subtracting the memory dedicated
to Windows and other probe Instances.
To change the allocation for this probe instance, click the Configure
button, which will display the probe Instance, Memory and Security
Administration dialog.
In all cases, the actual buffer size (Max Buffer Size) is also reduced
by 7% for memory management purposes. Should you try to
exceed the Max Buffer Size an error dialog will be displayed
indicating the minimum and maximum buffer size for your
Observer (or probe) buffer.
Excludes packets sent and received from the station running
Observer or probe (the MAC address of the station from which you
are capturing packets).
allows you to define a specific amount of each packet to capture to
the buffer. For example, a setting of 64 bytes will result in Observer
only capturing the first 64 bytes of every packet.
Most of the pertinent information about the packet (as opposed to
the information contained in the packet) is at the beginning of the
packet, so this option allows you to collect more packets for a
specific buffer size by only collecting the first part of the packet. In
some forensic situations, a warrant may only allow an officer/agent
to collect, for example, e-mail headers.
Also, if the system is having trouble keeping up with bandwidth
spikes, collecting partial packets can resolve the issue. To change
the number of bytes captured in each packet, click the Change
Size...
Note that this setting affects all consoles that connect to this probe.
You cannot change this setting unless you have administrative
privileges to do so.
markers used by Expert Time Interval and What If analysis modes.
Leave this box unchecked unless you intend to use these modes.
rev. 1
Configuring the GigaStor through the Control Panel
Chapter 4 GigaStor Control Panel
65
Page 66

Table 5 GigaStor Options tab
Field Description
Start/Stop Packet Capture marker
frames
Wireless Channel Change When checked, saved packet capture buffers will include markers
Packet Sampling Packet sampling applies to the control panel statistical displays, not
Capture Indexing Information
Maximums
Display Indexing Information
Maximums
Collect and Show GigaStor indexing
information by
Track statistics information per
physical port
Use physical port selections to filter
statistics (requires per port tracking
information)
Stop capture when disk is full When activated, the GigaStor stops capturing packets when the
Auto-update GigaStor chart on
statistics tab or selection change
Keep focus on GigaStor when
running Forensic Analysis and
creating a decode
Update display during statistics
processing in 30 second intervals
When checked, saved packet capture buffers will include markers
that timestamp when packet captures were started and stopped.
that show what channel was currently being listened to. This is
useful if you are using Wireless Site Survey to scan channels.
saved packets. On probes connected to highly-saturated networks
(especially multi-port probes), sometimes it is desirable to adjust
the rate of statistical indexing to conserve probe processing and
storage resources. The default (and recommended) setting is for
Observer to automatically scale back the packets it uses to update
the console display based on system load. Alternatively, you can
specify a Fixed Sampling Ratio to consider when updating the
GigaStor Control Panel Charts and statistical displays.
Depending on what kinds of information you are interested in
tracking, you can conserve probe processing and espeically storage
resources by only indexing the information that is useful to you.
Of special note is the “Track statistics information per physical port”
option. When selected, causes the GigaStor to index the data it
collects by Gen2 capture card physical ports. You can then display
GigaStor Control Panel statistics by physical port (see the next
bullet item).
Depending on what kinds of information you are interested in
tracking, you can conserve probe processing and resources by only
indexing the information that is useful to you.
Depending on what kinds of information you are interested in
tracking, you can conserve probe processing and storage resources
by only indexing the information that is useful to you.
When selected, causes the GigaStor to index the data it collects by
Gen2 capture card physical ports. You can then display GigaStor
Control Panel statistics by physical port (see the next bullet item).
If the previous check box is selected, you can choose this option to
display, within the GigaStor Control Panel, statistics sorted by Gen2
Capture Card physical port. This is useful, for example, when you
want to troubleshoot the individual links without having to load
the capture buffer by clicking Analyze.
disk array is full. The default behavior is to use circular (i.e. FIFO)
disk writes, causing the oldest buffer files to be overwritten as
newer traffic is captured.
When selected, causes the listed actions to have the same effect as
clicking the Update Chart/Statistics buttons.
Keeps the focus in the GigaStor Control Panel instead of switching
to the decode pane.
When selected all charts will received updates in 30 second
intervals when processing statistics.
Configuring the GigaStor through the Control Panel
66
Chapter 4 GigaStor Control Panel
rev. 1
Page 67

GigaStor Chart tab
This tab lets you choose the appearance, colors, and scale of the
GigaStor Control Panel’s time line chart. Follow the instructions in
“Configuring the GigaStor through the Control Panel” on page 63 to
open the GigaStor Chart tab (Figure 40).
Figure 40 GigaStor Chart tab
GigaStor Outline
rev. 1
Click Settings and the GigaStor Outline tab to modify the display of
the GigaStor outline graph. See Figure 33 on page 58 for an example
of the GigaStor outline graph. Follow the instructions in “Configuring
the GigaStor through the Control Panel” on page 63 to open the
GigaStor Outline tab (Figure 41).
Configuring the GigaStor through the Control Panel
Chapter 4 GigaStor Control Panel
67
Page 68

Figure 41 GigaStor Outline
Configuring the GigaStor through the Control Panel
68
Chapter 4 GigaStor Control Panel
rev. 1
Page 69

Capture Graph tab
Click Settings and the tab for the type of graph or chart for which you
want to set the display properties. Follow the instructions in
“Configuring the GigaStor through the Control Panel” on page 63 to
open the Capture Graph tab (Figure 42).
Figure 42 Capture Graph tab
Table 6 Capture Graph fields
Field Description
Item allows you to select which item will be configured.
Item color allows you to select the color of the display item.
Item plot allows you to select the item to be displayed as Lines or Bars. This
Item line thickness allows you to select the thickness of the displayed item (in pixels).
Graph Time option buttons allows you to set how the “X” axis will be displayed. Clock time will
rev. 1
dropdown will only be active if “Lines” is selected in the “Item plot”
dropdown.
show times using a 24-hour clock (i.e., the current time). Relative
time will display times from the start of the activation of the mode.
Configuring the GigaStor through the Control Panel
Chapter 4 GigaStor Control Panel
69
Page 70

GigaStor Schedule tab
This tab lets you schedule GigaStor packet captures to occur at preset
times and days of the week. Although the dialog looks identical to the
standard Packet Capture schedule tab, the two types of schedules can
not be in effect at the same time. If you attempt to schedule GigaStor
packet captures when standard packet captures are already scheduled
(or the reverse), an error message is displayed.
Follow the instructions in “Configuring the GigaStor through the
Control Panel” on page 63 to open the Schedule tab (Figure 43).
Figure 43 Schedule tab
Q Choose No Scheduling to turn off any automatically
scheduled packet captures for the selected probe or probe
instance.
Q Choosing Always causes the selected probe or probe instance
to capture packets whenever the probe is running.
Configuring the GigaStor through the Control Panel
70
Chapter 4 GigaStor Control Panel
rev. 1
Page 71

Statistics Lists tab
Q Choose Daily at specified times or By day-of-week at
specified times to automatically schedule packet captures
during the specified time intervals (which you can add by
clicking the Add button at the bottom of the dialog; see
below).
Adding, Modifying, and Deleting Time Intervals
To add or modify a time interval to a schedule option, choose that
option (in other words, Daily or the day-of-week for which you want
to schedule a capture) and click the appropriate button. A time
interval specification dialog is displayed that allows you to set the time
period for the capture to be performed. To delete a time interval from
a schedule option, simply highlight the interval you wish to delete and
click the Delete button.
Time intervals include the last minute of the interval. All time periods
are specified in 24-hour (also known as military) time.
Observer tracks and makes many statistics available to you. You can
control how those statistics are displayed for your GigaStor. This tab
lets you customize how MAC address, IP address, IP Pair, and port
information are displayed in the various constraint tab statistical
listings. Follow the instructions in “Configuring the GigaStor through
the Control Panel” on page 63 to open the Statistics Lists tab
(Figure 44).
rev. 1
Configuring the GigaStor through the Control Panel
Chapter 4 GigaStor Control Panel
71
Page 72

Figure 44 Statistics Lists tab
Subnet
You can specify subnet properties for the GigaStor. Follow the
instructions in “Configuring the GigaStor through the Control Panel”
on page 63 to open the Subnet tab (Figure 45).
Use the Add, Delete, Modify, and Delete All buttons to configure the
subnet settings for the GigaStor. When you define subnets in the
GigaStor, Observer adds that subnet information to the index files.
All future data analyzed will have subnet filtering readily available as
well as statistical data. On the IP stations tab you see your subnets and
you can perform statistical analysis based on subnets.
When you analyze data from captures with index files without any
subnets defined, there will be no subnet available in the IP stations tab
even if the analyzed data includes some index files with the new
subnet information.
Configuring the GigaStor through the Control Panel
72
Chapter 4 GigaStor Control Panel
rev. 1
Page 73

Figure 45 GigaStor Subnet tab
rev. 1
Figure 46 shows how the subnet settings show up in the GigaStor
Control Panel. They appear on the IP Stations tab.
Configuring the GigaStor through the Control Panel
Chapter 4 GigaStor Control Panel
73
Page 74
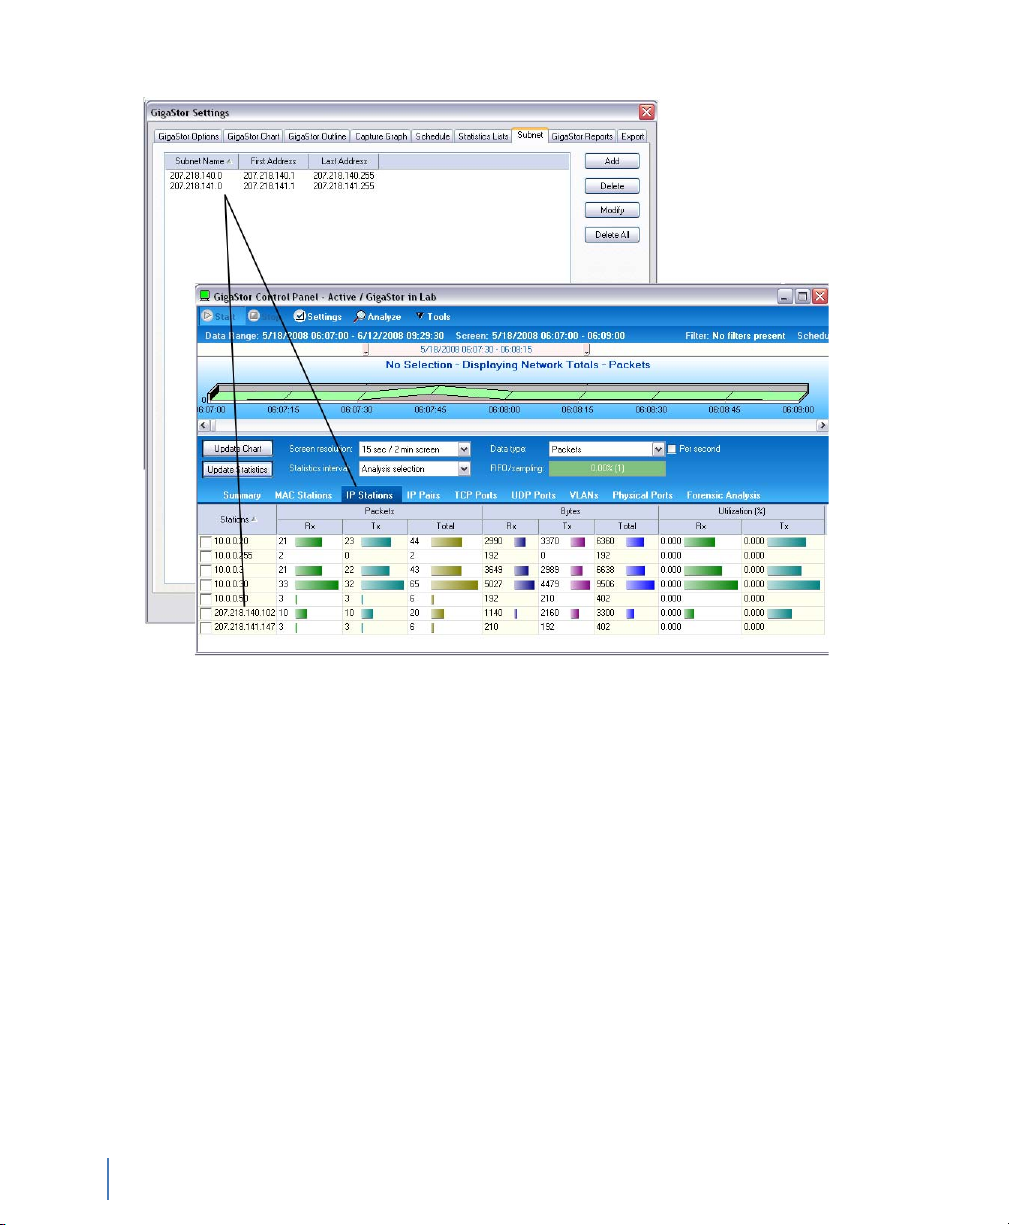
Figure 46 Subnet and IP Stations
Configuring the GigaStor through the Control Panel
74
Chapter 4 GigaStor Control Panel
rev. 1
Page 75
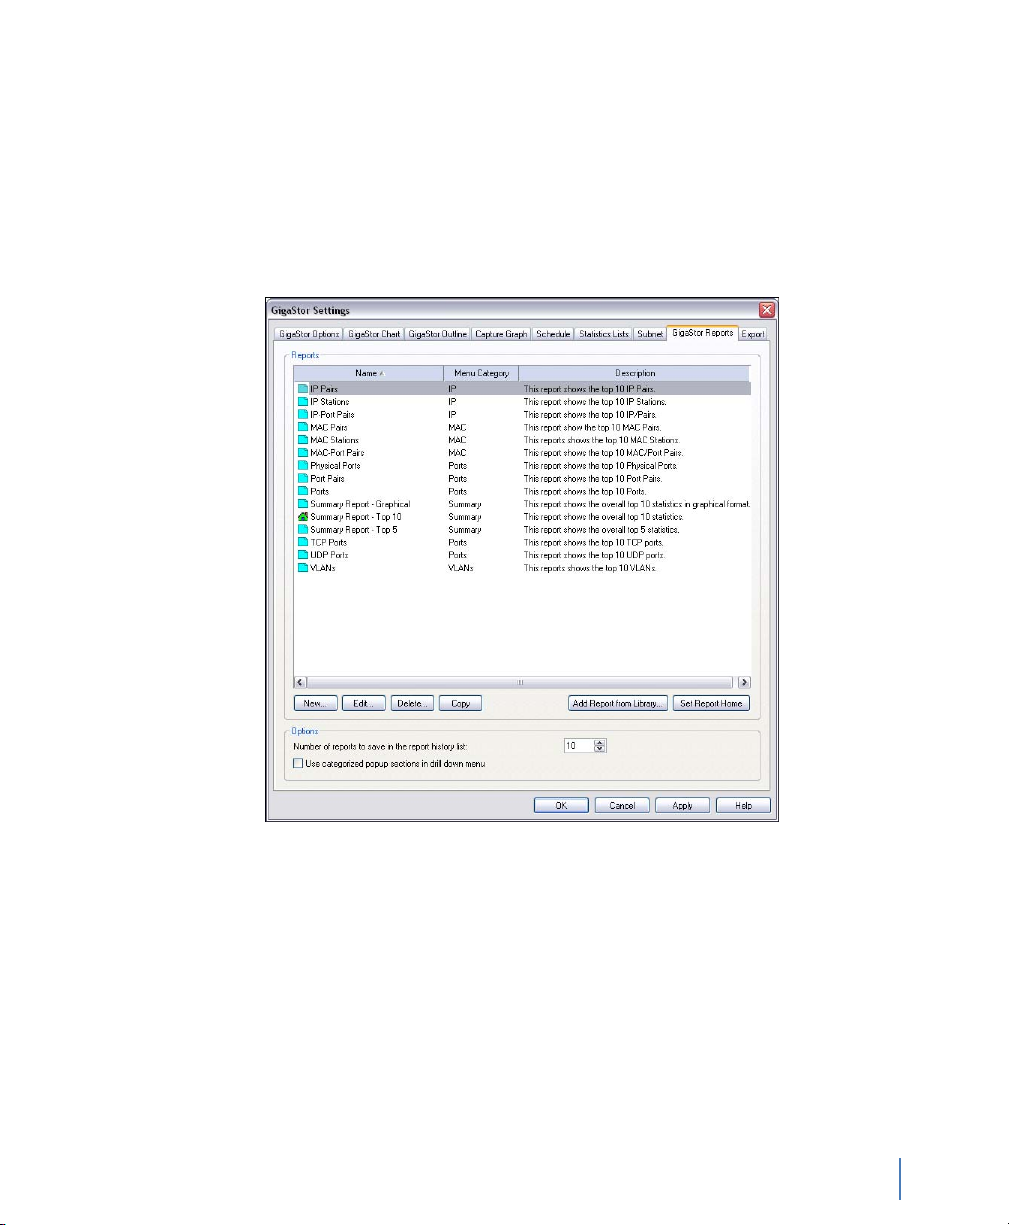
GigaStor reports
There are several default reports available for you.
1 Follow the instructions in “Configuring the GigaStor through the
Control Panel” on page 63 to open the GigaStor Reports tab
(Figure 47).
Figure 47 GigaStor Reports tab
rev. 1
2 Select a report name and click Edit to change the report’s
characteristics (Figure 48).
Configuring the GigaStor through the Control Panel
Chapter 4 GigaStor Control Panel
75
Page 76
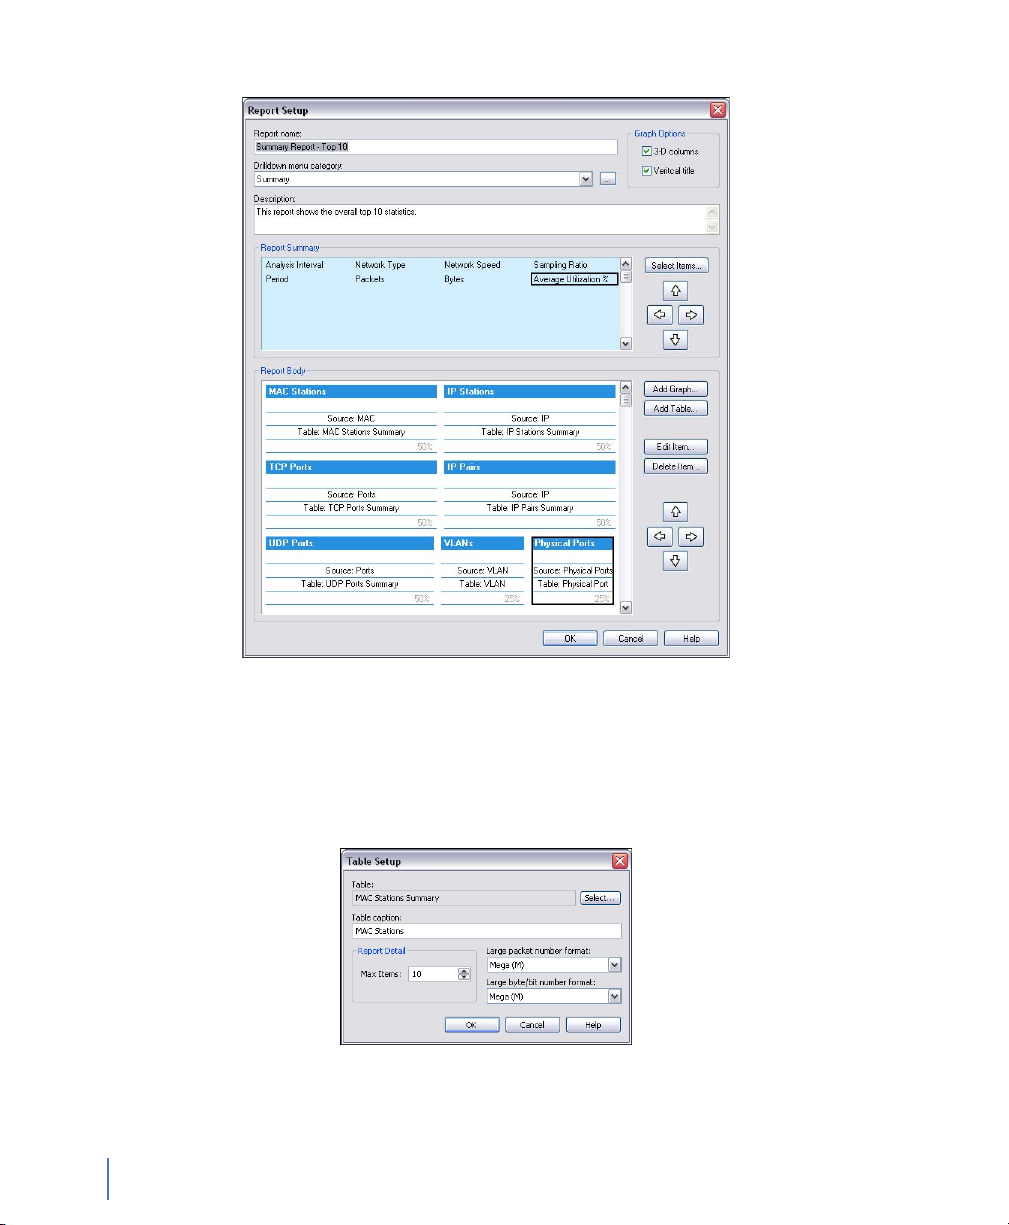
Figure 48 Report Setup
3 Use the arrow buttons to position graphs and tables on your
report.
4 Double-click a section of the report to modify its caption, detail,
and number format (Figure 48).
Configuring the GigaStor through the Control Panel
76
Chapter 4 GigaStor Control Panel
Figure 49 Table Setup
rev. 1
Page 77
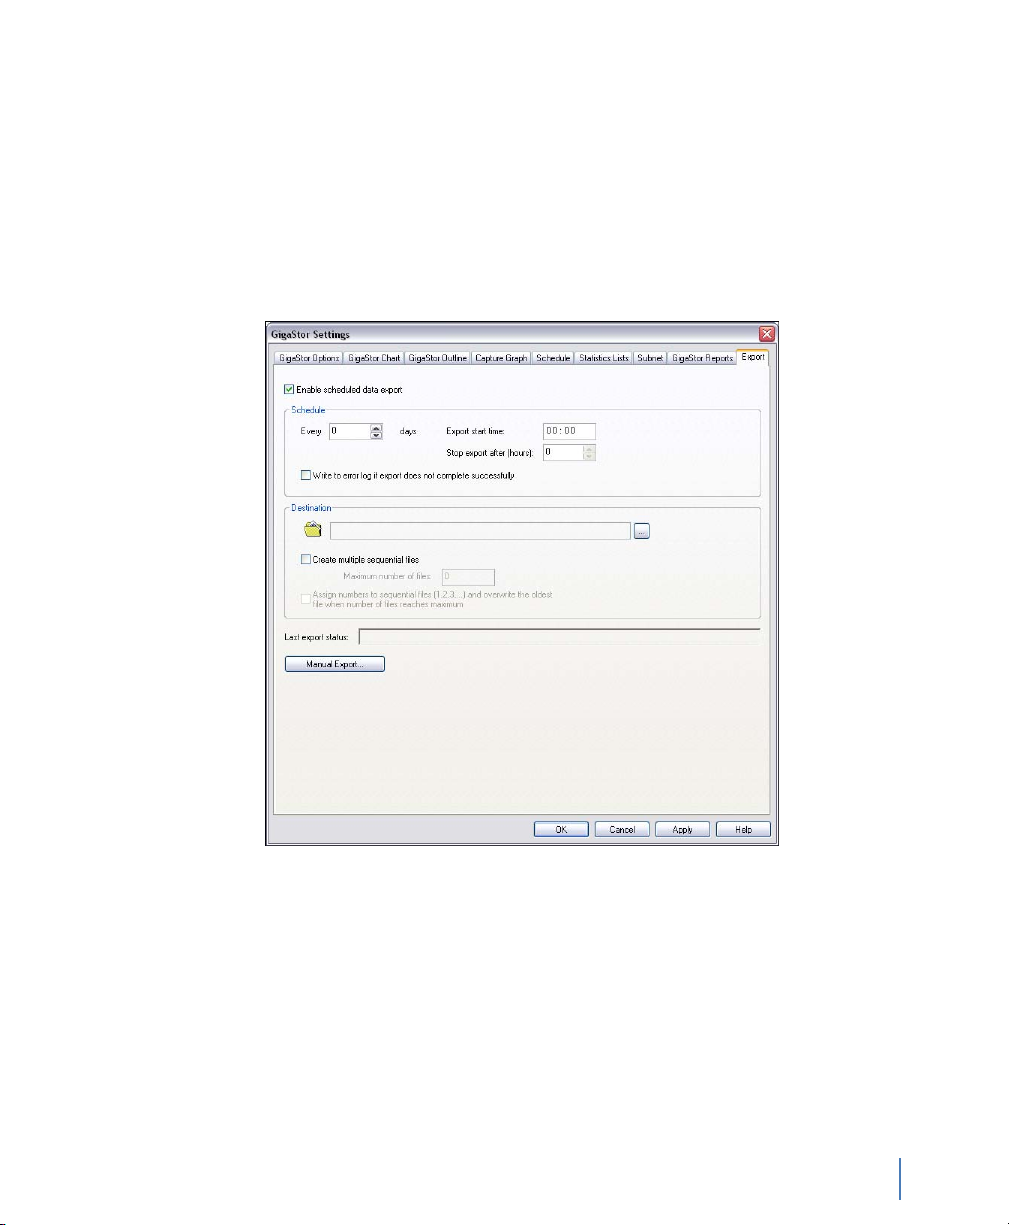
Export
You can export your GigaStor-collected data on a scheduled basis. Use
the Export tab to configure when and to where your data is saved or
to manually export your data.
Follow the instructions in “Configuring the GigaStor through the
Control Panel” on page 63 to open the Export tab (Figure 50).
Figure 50 Exports tab
rev. 1
Configuring the GigaStor through the Control Panel
Chapter 4 GigaStor Control Panel
77
Page 78

Configuring the GigaStor through the Control Panel
78
Chapter 4 GigaStor Control Panel
rev. 1
Page 79

C h a p t e r 5
Using Observer with a WAN Probe
rev. 1
79
Chapter 5 Using Observer with a WAN Probe
Page 80

In general, the WAN analysis works much like Ethernet analysis. One
difference is that, when appropriate, Observer identifies WAN links
by their Data Link Connection Identifier (DLCI) rather than by MAC
address as is done with standard protocol analysis. In addition, many
WAN statistical modes break out the data by DCE, DTE, and
summary to reflect the full-duplex nature of WAN links. Modes
unrelated to WAN analysis are greyed out and unavailable.
The following sections describe how the available Observer modes
operate to analyze a WAN link.
Q “Discover Network Names” on page 80
Q “WAN Bandwidth Utilization” on page 82
Q “WAN Vital Signs by DLCI” on page 83
Q “WAN Load by DLCI” on page 84
Q “WAN Top Talkers” on page 86
Q “WAN Filtering” on page 87
Q “Triggers and Alarms” on page 88
Discover Network Names
To access this mode, choose Tools → Discover Network Names
Discover Network Names mode will show DLCIs instead of MAC
addresses. You can also define the Committed Information Rate for
each DLCI you are monitoring with WAN Observer.
Setting the Committed Information Rate (CIR) for a DLCI
The Committed Information Rate defines the guaranteed bandwidth
for a WAN connection. If you want Observer’s WAN Vital Signs and
WAN Load by DLCI to monitor CIR compliance, you must specify
the CIR. A number of WAN triggers and alarms also use this
information, allowing you to be notified if the link is not performing
to the CIR.
For encapsulations that do not use DLCI (such as X.25), just use the
address scheme for your encapsulation.
Discover Network Names
80
Chapter 5 Using Observer with a WAN Probe
rev. 1
Page 81

To set the CIR for a DLCI or group of DLCIs
1 Choose Tools → Discover Network Names. The Discover
Network Names pane opens.
2 In the pane, click the edit DLCI CIR button on the Discover
Network Names mode window (Figure 51).
Figure 51 Edit DCLI
rev. 1
3 Click Add to add a new DLCI.
4 Type the CIR in Kbits/sec for the DLCI.
Figure 52 DLCI Configuration dialog
Chapter 5 Using Observer with a WAN Probe
Discover Network Names
81
Page 82

5 Click OK when you are done. For encapsulations that do not use
DLCI (such as X.25), the correct address value is shown even
though it is still labeled DLCI.
WAN Bandwidth Utilization
To see the percentages of bandwidth saturation on DCE, DTE and
DCE+DTE (Summary) for each configured link, choose Statistics →
Bandwidth Utilization. The mode starts automatically:
Figure 53 WAN bandwidth utilization
WAN links have two ports (DCE and DTE), so for a dual link T1, you
could display up to 5 charts (including the summary). The mode is
available in chart, pie, graph, and dial views. The display setup dialog
(click Settings to access), lets you choose what ports to display as well
as color and scale options.
N
OTE: BANDWIDTH
UTILIZATION AND
FILTERS
WAN Bandwidth Utilization
82
Chapter 5 Using Observer with a WAN Probe
The Bandwidth Utilization display is not subject to any filters
as it compares the actual activity on the network to the
network’s theoretical capacity.
rev. 1
Page 83

WAN Vital Signs by DLCI
In Observer, the Network Vital Signs display is replaced by the WAN
Vital Signs by DLCI mode. This mode provides a summary of the
errors occurring on a WAN link (E1/T1/DS3/E3).
Choose Statistics → WAN Vital Signs by DLCI.
You can choose what portion of traffic you wish to view from the list
box in the upper left corner of the window: DCE, DTE, DCE plus
DTE, and so forth.
Figure 54 WAN Vital Signs by DLCI pane
rev. 1
DTE (Data Terminal Equipment), in the context of a WAN link,
refers to the DSU/CSU. DCE (Data Circuit-terminating equipment)
refers to the WAN switch (which may reside remotely at the line
provider's site). Summary view shows a concatenation of traffic from
both ends of the link.
The following statistics are shown, broken down by DLCIs (which are
listed in the left most column). You can change the sort order by
clicking on any of the column headings:
WAN Vital Signs by DLCI
Chapter 5 Using Observer with a WAN Probe
83
Page 84

Table 7 WAN statistics
Column Description
DLCI Data Link Connection Identifier of the statistics that follow. For encapsulations
DCE KBits/s Max The maximum bit rate sensed so far from the DCE side of this DLCI, in Kbits per
DTE KBits/s Max The maximum bit rate sensed so far from the DTE side of this DLCI, in Kbits per
DCE Kbits/s Avg The average bit rate sensed on the DCE side of this DLCI, in Kbits per second.
DTE Kbits/s Avg The average bit rate sensed on the DTE side of this DLCI, in Kbits per second.
DCE FECN under CIR The number of packets seen on the DCE side of the link that had the Forward
DTE FECN under CIR The number of packets seen on the DTE side of the link that had the Forward
DCE BECN under CIR The number of packets seen on the DCE side of the link that had the Backward
DTE BECN under CIR The number of packets seen on the DTE side of the link that had the Backward
that do not use DLCI (such as X.25), the correct address value is shown even
though it is still labeled DLCI.
second.
second.
Explicit Congestion Notification bit set, even though the bandwidth usage was
within the Committed Information Rate (CIR). Normally this number should be
zero. If bandwidth usage exceeds CIR, congestion is expected.
Explicit Congestion Notification bit set, even though the bandwidth usage was
within the Committed Information Rate (CIR). Normally this number should be
zero. If bandwidth usage exceeds CIR, congestion is expected.
Explicit Congestion Notification bit set, even though the bandwidth usage was
within the Committed Information Rate (CIR). Normally this number should be
zero. If bandwidth usage exceeds CIR, congestion is expected.
Explicit Congestion Notification bit set, even though the bandwidth usage was
within the Committed Information Rate (CIR). Normally this number should be
zero. If bandwidth usage exceeds CIR, congestion is expected.
WAN Load by DLCI
In a WAN installation, Observer’s Network Activity Display is called
WAN Load by DLCI. This mode shows critical WAN transfer rate and
congestion statistics in a number of formats. This display can show
you the health of a WAN link at a glance and can warn of impending
slowdowns due to congestion or other error conditions.
1 Choose Statistics → WA N L o a d b y D L C I .
2 Press Start to begin capturing load data.
WAN Load by DLCI
84
Chapter 5 Using Observer with a WAN Probe
rev. 1
Page 85

Figure 55 WAN Load by DLCI
The WAN Load by DLCI mode can be viewed as a dial, graph, or list
display. Except for list view, there are no setup options for WAN Load
by DLCI mode. Every view includes a dropdown box that lets you
select which DLCI you want to monitor.
Figure 56 WAN Load by DLCI Dial View
rev. 1
The WAN Load by DLCI mode in dial view shows transfer rate, CRC
error rate, FECN/BECN frame rates graphed on dial meters.
For encapsulations that do not use DLCI (such as X.25), the correct
address value is shown even though it is still labeled DLCI.
WAN Load by DLCI
Chapter 5 Using Observer with a WAN Probe
85
Page 86

Figure 57 WAN Load by DLCI Graph View
The WAN Load display in graph view shows these same statistics
(transfer rate, CRC error rate, and FECN/BECN frame rates) as
superimposed spike meters. The Committed Information Rate (CIR)
is also shown, allowing you to view the network activity against the
baseline performance you have contracted to receive from your WAN
service provider
You can select line, point, or bar-style meter, and the colors for each
statistic by right-clicking on the chart. The dropdown menus at the
top of the display let you select what DLCIs to view, and how the
chart should be scaled (linearly, logarithmically, or auto-scale). For
linear scales, you can also set the CIR or the line rate as the maximum
value for the chart.
WAN Top Talkers
Just as in standard Observer, Top Talkers shows the IP and MAC
address of stations on your network sorted by volume of traffic
generated and received. In WAN Observer, the MAC Address tab
shows DLCIs sorted by volume of traffic. Also, the sorting and
charting statistical criteria (such as percentage of packets, packets per
WAN Top Talkers
86
Chapter 5 Using Observer with a WAN Probe
rev. 1
Page 87

second, etc.) that apply to WAN is a subset of those available for
standard network analysis. For encapsulations that do not use DLCI
(such as X.25), the correct address value is shown even though it is
still labeled DLCI.
1 Choose Statistics → Top Talk er s S ta t is ti c s.
2 Press Start to begin capturing load data.
Figure 58 WAN Top Talkers
T
IP!
If you are looking to identify additional top talkers beyond the
DLCI, using Ethernet Top Talkers may be more beneficial for
you.
WAN Filtering
rev. 1
In addition to the standard Observer packet filtering rules (station
address, pattern matching, etc.), there are two WAN-specific filtering
rules available for use with WAN probes:
Q DLCI Address, which lets you enter the number of the DLCI
address you wish to include or exclude.
Q WAN Conditions, which let you include or exclude frames
based on flow direction, forward and backward congestion,
and discard eligibility.
To create a WAN filter rule:
1 Choose Actions → Filter Setup for Selected Probe.
2 Select an existing filter or click New Filter to create your own.
See the filtering information in the Observer manual for full
details about creating a custom filter from scratch.
WAN Filtering
Chapter 5 Using Observer with a WAN Probe
87
Page 88
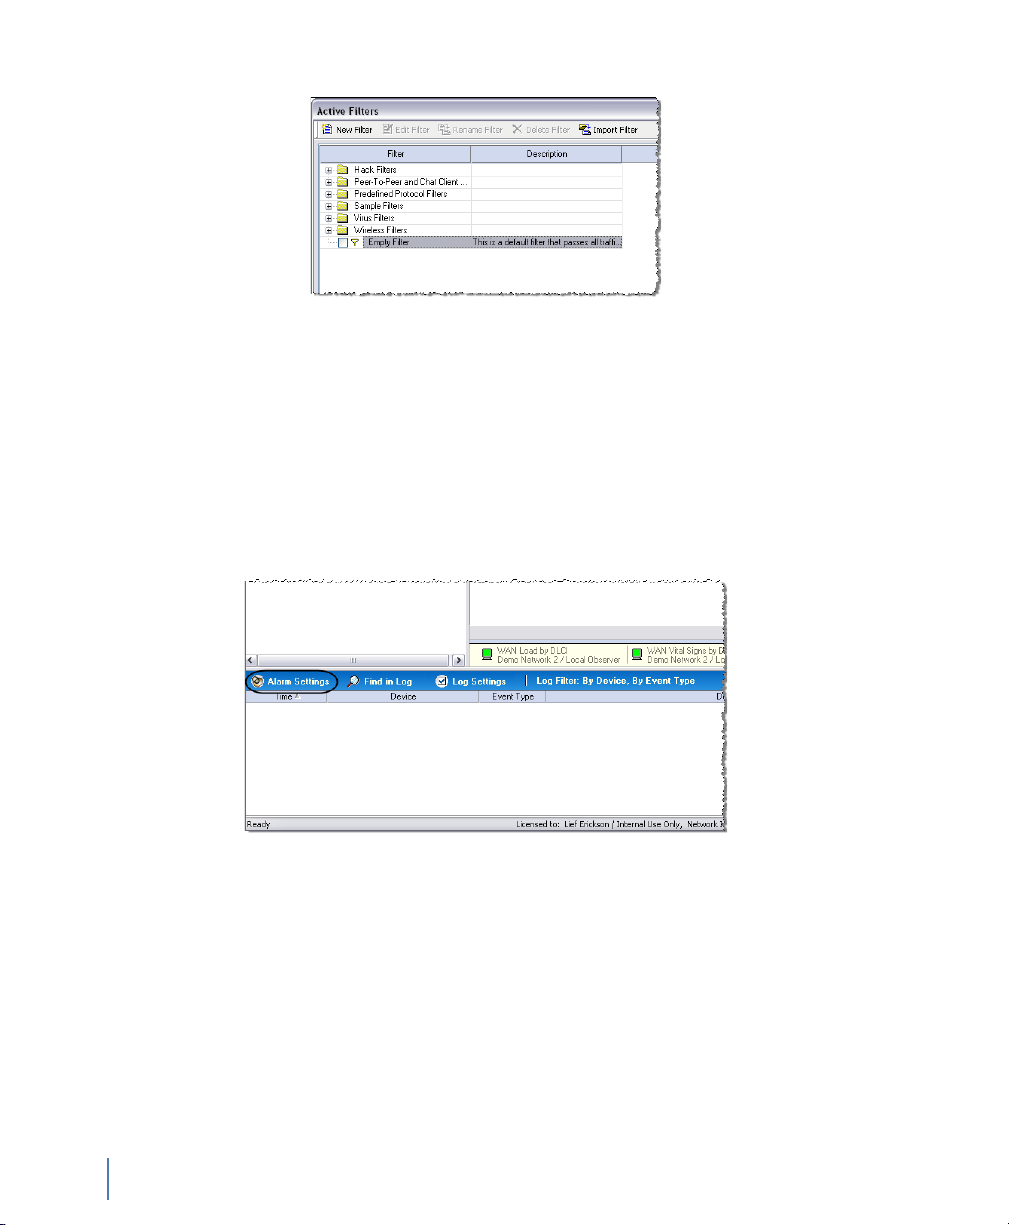
Triggers and Alarms
WAN Observer adds WAN-related criteria to the standard Triggers
and Alarms mode.
1 Click the Alarm Settings button located in the lower left corner of
Observer’s main window.
Figure 59 Active Filters
Figure 60 Alarm Settings
A dialog appears that allows you to select the probe or probes for
which you want to set alarms.
2 Check the probes you wish to set.
3 Select an probe for which you want to set alarms and then click
the Selected Instance Alarm Settings button. Figure 61 appears.
Triggers and Alarms
88
Chapter 5 Using Observer with a WAN Probe
rev. 1
Page 89

Figure 61 Probe Alarm Settings
4 Select the alarms you want set.
5 Click the Triggers tab to set the criteria by which the alarms will
be triggered.
rev. 1
Figure 62 Triggers tab
Chapter 5 Using Observer with a WAN Probe
Triggers and Alarms
89
Page 90

Most WAN alarms can be set on the DTE or DCE side or both.
The Committed Information Rate displayed is that which you set
in Discover Network Names mode. See “Setting the Committed
Information Rate (CIR) for a DLCI” on page 80.
6 Click the Actions tab to define actions to launch if an alarm is
triggered. You can log messages, send e-mail, or even send a pager
alarm.
Triggers and Alarms
90
Chapter 5 Using Observer with a WAN Probe
rev. 1
Page 91

C h a p t e r 6
Forensic Analysis using Snort
rev. 1
91
Chapter 6 Forensic Analysis using Snort
Page 92

N
OTE:
Forensic Analysis, exclusive to the GigaStor version of Observer, is a
powerful tool for scanning high-volume packet captures for intrusion
signatures and other traffic patterns that can be specified using the
familiar Snort rule syntax. You can obtain the rules from
www.snort.org, or, if you know the Snort rule syntax, you can write
your own rules.
Snort began as an open source network intrusion detection system
(NIDS). Snort’s rule definition language is the standard way to specify
packet filters aimed at sensing intrusion attempts.
Snort rules (or Snort-style rules) imported into Observer operate
much like Observer’s Expert conditions, telling Observer how to
examine each packet to determine whether it matches specified
criteria, triggering an alert when the criteria is met. They differ from
Expert conditions in that they only operate post-capture, and the rules
themselves are text files imported into Observer.
Only rules with alert actions are imported. Rules with log,
activate, dynamic, or any actions other than alert are simply
ignored. Except for RULE_PATH, variable declarations (Snort
var statements) are imported. Rule classifications (config
classification) are imported, but any other config statements
are ignored. Another difference is that Observer, unlike Snort,
supports IPv6 addressing.
After you import the rules into Observer you are able to enable and
disable rules and groups of rules by their classification as needed.
Starting Forensic Analysis using Snort rules
Forensics profiles provide a mechanism to define and load different
pairings of settings and rules profiles. Settings profiles define preprocessor settings that let you tune performance; rules profiles define
which forensic rules are to be processed during analysis.
Observer lets you configure preprocessor settings to tune
performance, and to perform specialized processing designed to catch
threats against particular target operating systems and web servers.
Because Observer performs signature matching on existing captures
rather than in real time, its preprocessor configuration differs from
Starting Forensic Analysis using Snort rules
92
Chapter 6 Forensic Analysis using Snort
rev. 1
Page 93
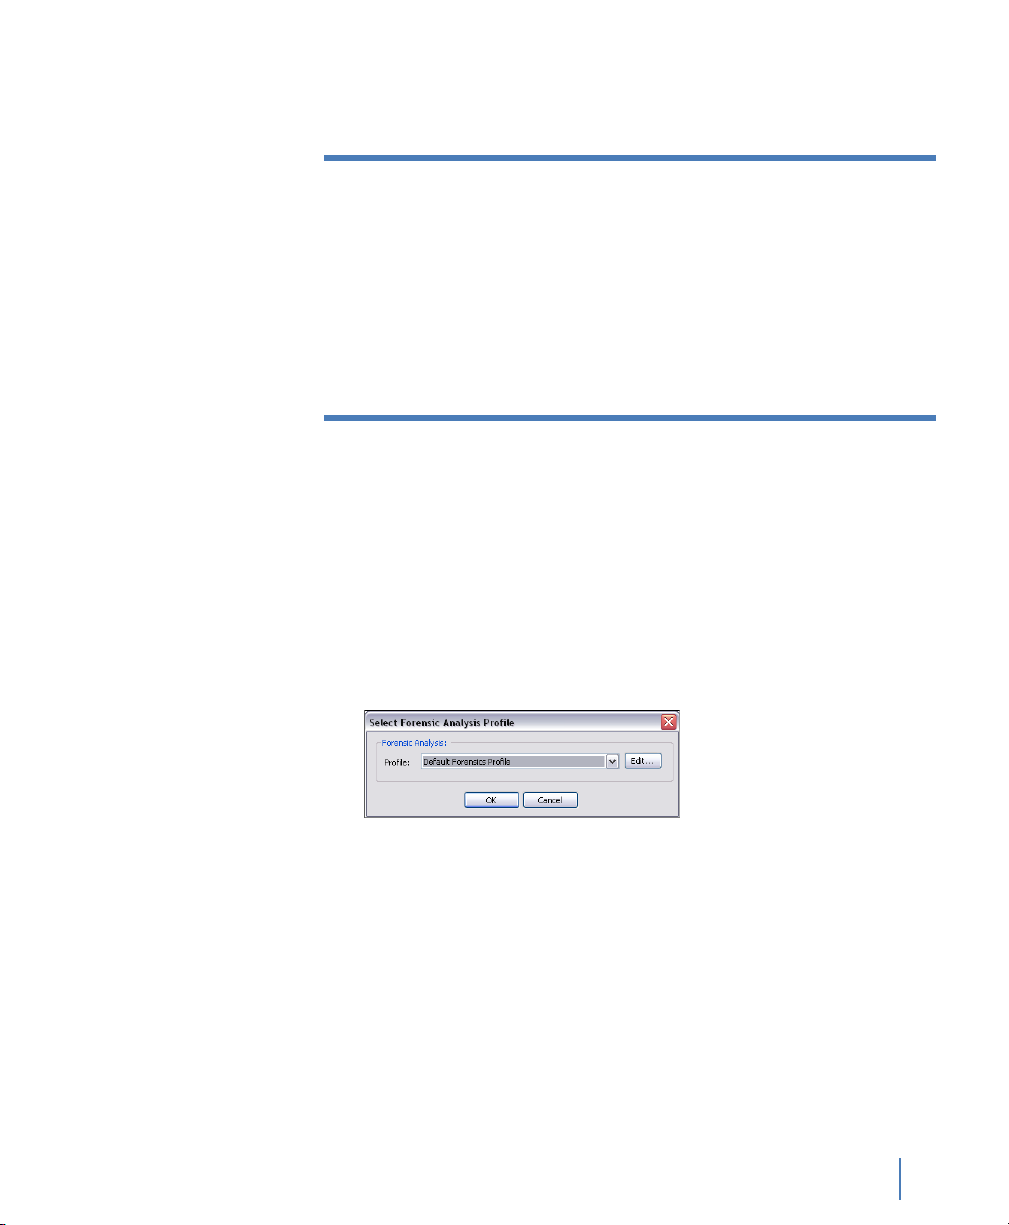
N
OTE:
that of native Snort. When you import a set of Snort rules that
includes configuration settings, Observer imports rules classifications,
but uses its own defaults for the preprocessor settings.
There is a difference between enabling the preprocessor and
enabling logs for the preprocessor. For example, you can
enable IP defragmentation with or without logging. Without
logging, IP fragments are simply reassembled; only time-out
or maximum limit reached messages are noted in the
Forensics Log and in the Forensic Analysis Summary window.
If logging is enabled, all reassembly activity is displayed in the
Forensics Log (but not displayed in the Forensic Analysis
Summary).
Forensics analysis is available from both the Decode/Analysis window
displayed when you load a saved capture buffer locally from GigaStor,
and also from the GigaStor control panel. In either case, if you have
not yet imported any rules, or if you wish to add or modify rules, click
Edit to display the Forensic Settings dialog.
Q From the Decode/Analysis Display: After loading a
previously-saved capture buffer, click the Forensics tab. The
Select Forensics Analysis dialog is displayed:
rev. 1
Figure 63 Select Forensic Analysis Profile dialog
Q From the GigaStor Control Panel: Select the time window
you wish to analyze, then click Analyze. At the bottom of the
GigaStor Analysis Options dialog you can select or edit a
Forensics profile. This is described in detail in “Creating a
forensic analysis profile from the GigaStor control panel” on
page 94.
Starting Forensic Analysis using Snort rules
Chapter 6 Forensic Analysis using Snort
93
Page 94
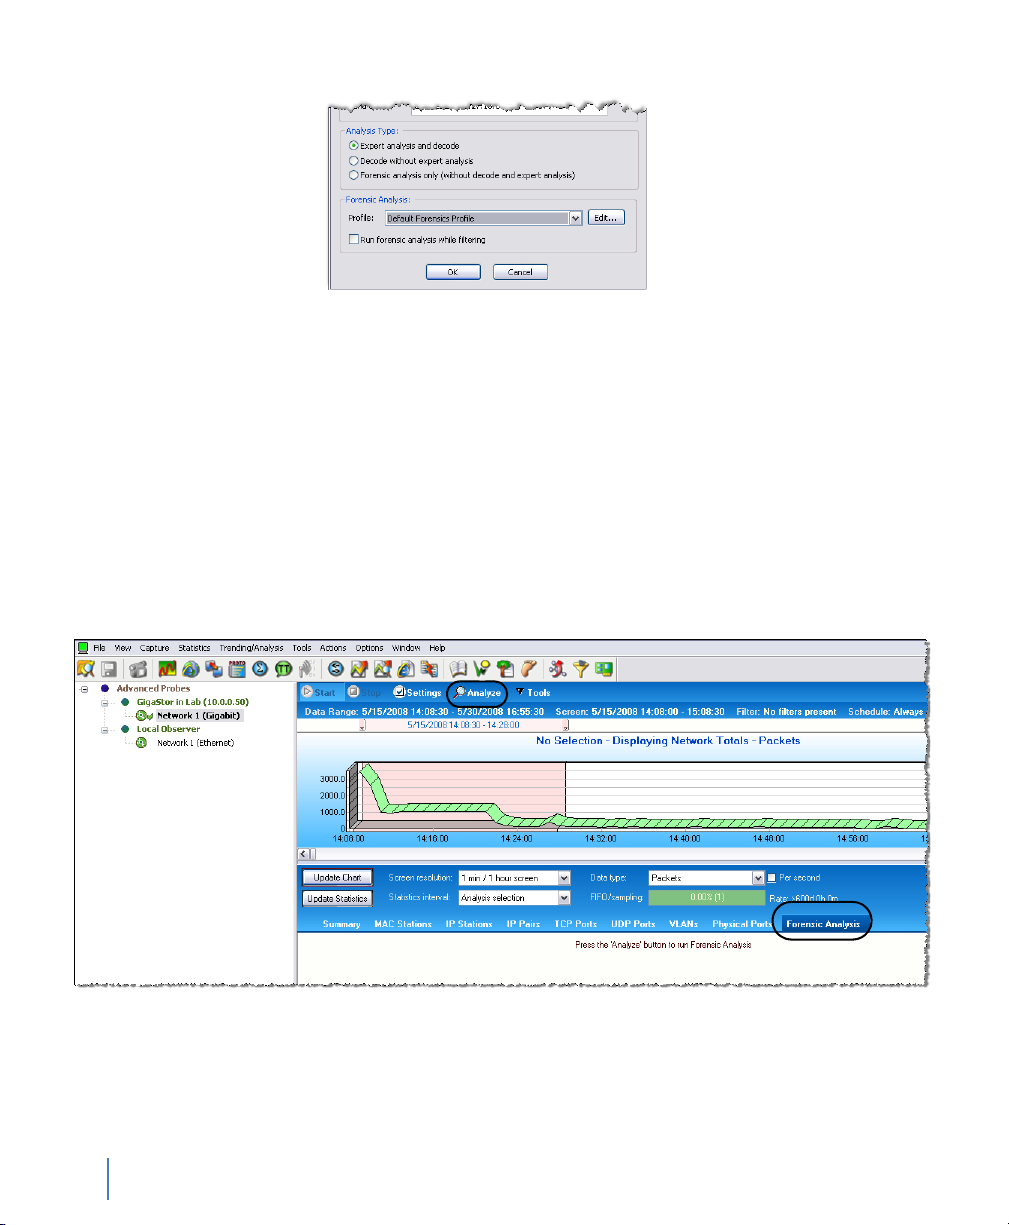
Figure 64 GigaStor Analysis Options - Forensic Analysis section
If you already have a forensic analysis profile, you choose the profile
from the Profile list (Figure 64) and click OK. For more information
about the analysis output, see:
Q “About Forensic Analysis tab” on page 98
Q “About the Forensic Analysis Log tab” on page 99
Creating a forensic analysis profile from the GigaStor control panel
1 Click the Forensics Analysis tab on the far right of the screen.
Figure 65 Forensic Analysis tab
2 Click the Analyze button at the top of the screen. The GigaStor
Starting Forensic Analysis using Snort rules
94
Chapter 6 Forensic Analysis using Snort
Analysis Options dialog opens.
rev. 1
Page 95
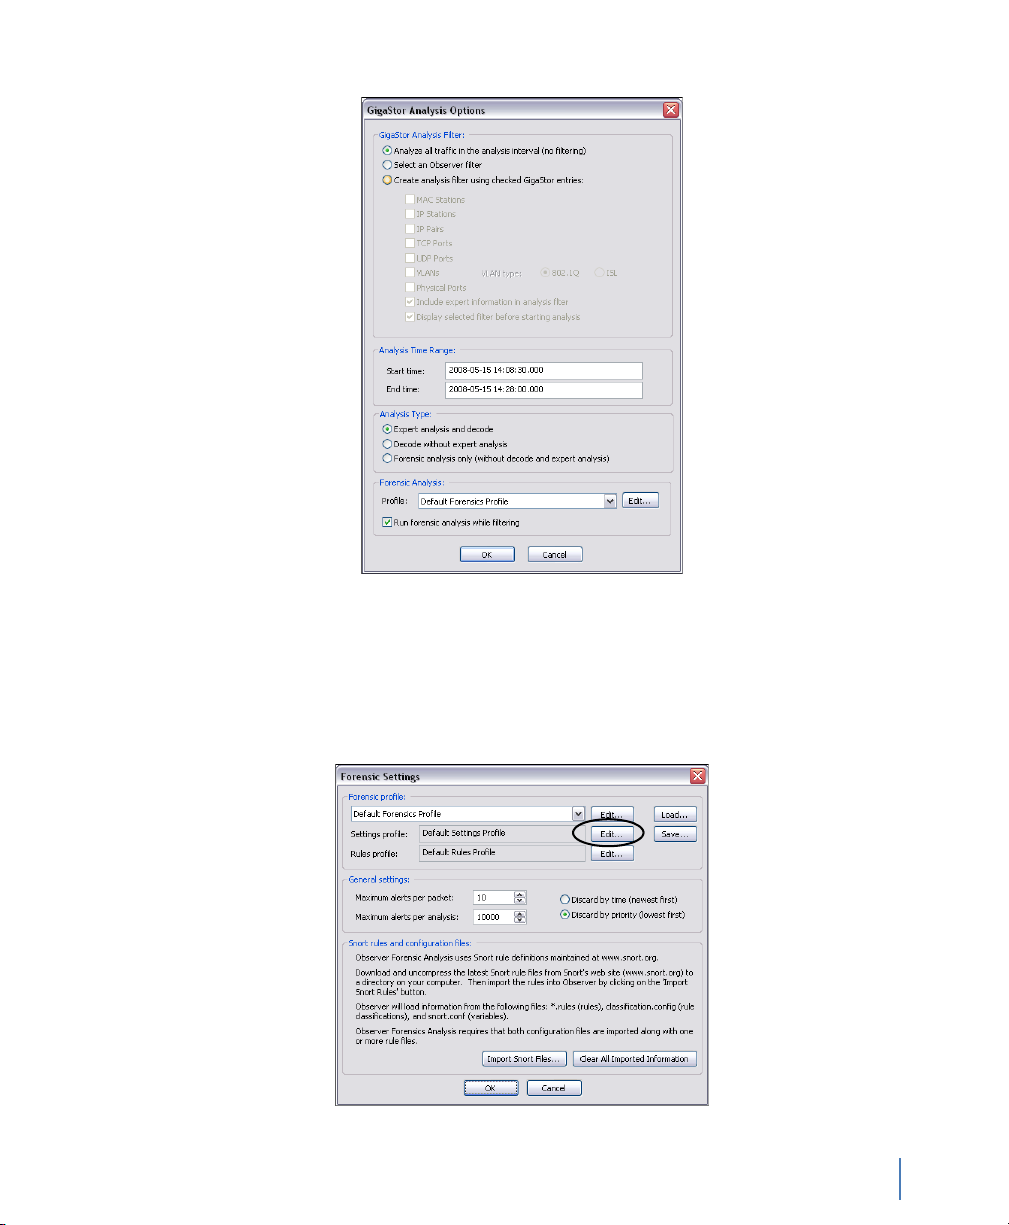
Figure 66 GigaStor Analysis Options
3 Select the profile that you want or click Edit.
4 Click the Settings Profile Edit button to view and define the fields
as you need. The fields are described in full in “Forensic Analysis
Profile Settings tab” on page 100.
rev. 1
Figure 67 Forensic Settings
Starting Forensic Analysis using Snort rules
95
Chapter 6 Forensic Analysis using Snort
Page 96

If this is the first time forensic analysis has been run, you must
import some rules.
5 Click the Import Snort Files button to display a file selection
dialog. Browse to the directory where the rules you wish to
import are located and select them. You can select multiple files
using either CTRL-clicks or by simply dragging the cursor across
the files you wish to select. If you do not yet have the Snort rules,
see “Rules tab” on page 106.
6 Click OK when you are done selecting files.
Observer displays a progress bar and then an import summary
showing the results of the import. Because Observer’s forensic
analysis omits support for rule types and options not relevant to a
post-capture system, the import summary will probably list a few
unrecognized options and rule types. This is normal, and unless
you are debugging rules that you wrote yourself, can be ignored.
7 Close the Import Summary Window.
8 Click the Edit button to the right of the Rules profile dropdown
menu.
Figure 68 Forensic Settings
Starting Forensic Analysis using Snort rules
96
Chapter 6 Forensic Analysis using Snort
The Rule Settings dialog is displayed (Figure 69). The top portion
of the window lists the rules that were imported, grouped in a
tree with branches that correspond to the files that were
imported.
rev. 1
Page 97

Figure 69 Rules tab
9 Select the boxes next to the rules you want to enable. The right-
click menu has options to enable/disable all rules, and to show the
actual Snort rule that was imported. It also lets you jump to webbased threat references such as bugtraq for further information
about the alert.
rev. 1
Rule classifications offer another level of control. Check the
“Rules must also match rule classifications” box to display a list of
defined rule classifications. Classifications are defined at import
time by parsing the Snort config classification statements
encountered in the rule set. Rules are assigned a classification in
the rule statement’s classtype option.
Select the rule classification(s) you want to enable. If classification
matching is enabled, a rule and its classification must both be
enabled for that rule to be processed. For example, suppose you
want to enable all policy violation rules: simply right-click on the
rule list, choose Enable all rules, and then enable the policy
violation classification.
Starting Forensic Analysis using Snort rules
Chapter 6 Forensic Analysis using Snort
97
Page 98

10 Click OK to close the Forensic Analysis Profile dialog. Click OK
again to close the Forensic Settings dialog. Click OK to close the
GigaStor Analysis Options dialog.
Observer applies the rules and filters to the capture data and
displays the results in the Forensics Summary tab. A new tab is
also opened that contains the decode. For details about the tabs,
see:
Q “About Forensic Analysis tab” on page 98
Q “About the Forensic Analysis Log tab” on page 99
About Forensic Analysis tab
This display summarizes alerts and preprocessor events in a navigable
tree.
Figure 70 Forensic Summary
T
IP! PREPROCESSOR
MAXIMUMS
Starting Forensic Analysis using Snort rules
98
Chapter 6 Forensic Analysis using Snort
It is important to examine the preprocessor results to ensure
that time-outs and other maximum value exceeded conditions
haven’t compromised the analysis. In Figure 70, both the IP
Flow and TCP Stream Reassembly preprocessors have timed
out on hundreds of flows and streams. If you see similar
rev. 1
Page 99

results, you may want to adjust preprocessor settings to
eliminate these conditions. Intruders often attempt to exceed
the limitations of forensic analysis to hide malicious content.
The right-click menu lets you examine the rule that triggered the alert
(if applicable). It also lets you jump to web-based threat references
such as bugtraq for further information about the alert. These
references must be coded into the Snort rule to be available from the
right-click menu.
About the Forensic Analysis Log tab
The Forensic Analysis Log comprehensively lists all rule alerts and
preprocessor events in a table, letting you sort individual occurrences
by priority, classification, rule ID, or any other column heading. Just
click on the column heading to sort the alerts by the given criteria.
Figure 71 Forensic Analysis Log tab
rev. 1
The right-click menu lets you examine the rule that triggered the alert
(if applicable). It also lets you jump to web-based threat references
such as bugtraq for further information about the alert. These
references must be coded into the Snort rule to be available from the
Starting Forensic Analysis using Snort rules
Chapter 6 Forensic Analysis using Snort
99
Page 100

right-click menu. You can also jump to the Decode display of the
packet that triggered the alert.
Forensic Analysis Profile field descriptions
This section describes in detail the fields on the Settings and Rules tab.
See:
Q “Forensic Analysis Profile Settings tab” on page 100
Q “Rules tab” on page 106
Forensic Analysis Profile Settings tab
Figure 72 Forensic Analysis Profile Settings tab
Table 8 describes the fields in the Forensic Analysis Profile Settings
tab.
Forensic Analysis Profile field descriptions
100
Chapter 6 Forensic Analysis using Snort
rev. 1
 Loading...