

Page 1

OneTouch™ AT G2
and OneTouch™ AT
Network Assistant
User Manual
Revised 01/2018 for Software Release v6.5.1
© 2018 NETSCOUT SYSTEMS, Inc. All Rights Reserved.
All product names are trademarks of their respective companies.
Page 2

LEGAL NOTIFICATION
Use of this product is subject to the End User License Agreement available at http://
www.netscout.com/legal/terms-and-conditions/ or which accompanies the product at
the time of shipment or, if applicable, the legal agreement executed by and between
NETSCOUT SYSTEMS, INC., and the purchaser of this product ("Agreement").
Government Use and Notice of Restricted Rights: In U.S. government ("Government")
contracts or subcontracts, Customer will provide that the Products and
Documentation, including any technical data (collectively "Materials"), sold or
delivered pursuant to this Agreement for Government use are commercial as defined
in Federal Acquisition Regulation ("FAR") 2.101and any supplement and further are
provided with RESTRICTED RIGHTS. All Materials were fully developed at private
expense. Use, duplication, release, modification, transfer, or disclosure ("Use") of the
Materials is restricted by the terms of this Agreement and further restricted in
accordance with FAR 52.227-14 for civilian Government agency purposes and 252.2277015 of the Defense Federal Acquisition Regulations Supplement ("DFARS") for
military Government agency purposes, or the similar acquisition regulations of other
applicable Government organizations, as applicable and amended. The Use of
Materials is restricted by the terms of this Agreement, and, in accordance with DFARS
Section 227.7202 and FAR Section 12.212, is further restricted in accordance with the
terms of NETSCOUT's commercial End User License Agreement. All other Use is
prohibited, except as described herein.
This Product may contain third-party technology. NETSCOUT may license such thirdparty technology and documentation ("Third-Party Materials") for use with the
Product only. In the event the Product contains Third-Party Materials, or in the event
you have the option to use the Product in conjunction with Third-Party Materials (as
identified by NETSCOUT in the applicable Documentation), then such third-party
materials are provided or accessible subject to the applicable third-party terms and
conditions contained in the "Read Me" or "About" file located on the Application CD
for this Product. To the extent the Product includes Third-Party Materials licensed to
NETSCOUT by third parties, those third parties are third-party beneficiaries of, and
may enforce, the applicable provisions of such third-party terms and conditions.
Open-Source Software Acknowledgment: This product may incorporate open-source
components that are governed by the GNU General Public License ("GPL") or licenses
that are compatible with the GPL license ("GPL Compatible License"). In accordance
with the terms of the GNU GPL, NETSCOUT will make available a complete, machinereadable copy of the source code components of this product covered by the GPL or
applicable GPL Compatible License, if any, upon receipt of a written request. Please
identify the product and send a request to:
NetScout Systems, Inc.
GNU GPL Source Code Request
310 Littleton Road
Westford, MA 01886
Attn: Legal Department
NETSCOUT SYSTEMS, INC. reserves the right, at its sole discretion, to make changes at
any time in its technical information, specifications, service, and support programs.
Page 3

Chapter 1: Get Acquainted
Overview of Features .......................................................1
Safety Information ........................................................... 3
Contact NETSCOUT ..........................................................6
Additional Resources .......................................................6
AC Adapter and Battery .................................................. 6
Charge the Battery ....................................................6
Switch the Power On ................................................7
Set the Language ......................................................7
Check the Battery Status ...........................................7
Extend Battery Operating Time ...............................7
Extend the Life of the Battery ..................................8
Install and Use the Strap ................................................. 9
OneTouch Platform .........................................................9
Remove and Install a Module .......................................10
Connectors, Keys, and LEDs ........................................... 11
Port A and Port B Connectors .................................15
Receive (Rx)/Link and Transmit (Tx) LEDs ...............17
The HOME Screen .......................................................... 19
Shortcut Bar .............................................................20
Test Tiers ........................................................................21
Touchscreen ................................................................... 24
Entering Text ..................................................................24
Entering Passwords and Other Hidden Text ..........25
URL Keyboard ..........................................................26
IPv4 Address Entry Keyboard ..................................27
IPv6 Address Entry Keyboard ..................................28
Set Preferences ...............................................................29
Language ................................................................. 29
Date/Time ................................................................ 29
Number Format ....................................................... 30
Units for Length Measurements ............................. 30
Timeout Periods (Power-Down and Backlight) .....30
Contents
ii
Page 4

OneTouch AT and OneTouch AT G2
User Manual
Power Line Frequency ............................................ 30
Chapter 2: Setup Wizard
Setup Wizard ................................................................. 33
Working with the Setup Wizard .................................. 33
To Start the Setup Wizard at a Later Time ............ 33
Connect to the Management Port ............................... 34
Handling Management Port Connection Problems 34
Setting up the Cloud Service ........................................ 36
Configuring the Analyzer’s Settings and Tests ............ 36
Setup Wizard Completion ...................................... 41
Chapter 3: Basic Operation
Adding User Tests ......................................................... 43
Add a TCP Test to the Home Screen ...................... 43
Connect to a Network ................................................... 47
Establish a Wired (Copper) Connection ................. 47
Establish a Fiber Connection .................................. 48
Establish a Wi-Fi Connection .................................. 48
Run AutoTest ................................................................. 52
Icons Indicate Test Status ....................................... 53
View the Test Results .................................................... 54
View Detailed Test Results ..................................... 55
Add More User Tests ..................................................... 56
Organize User Tests on the Test Tiers .......................... 57
Rename the Clouds ....................................................... 57
See Off-Screen Tests ...................................................... 58
Run a Single User Test Again ........................................ 58
Edit a User Test .............................................................. 58
Move, Copy, or Delete a User Test ............................... 59
More About AutoTest ................................................... 59
Next Steps ...................................................................... 60
View Other Test Results .......................................... 60
Run Path Analysis, Browse to, or Telnet/SSH to a Test’s
Target Server ........................................................... 60
Configure the OneTouch Analyzer to Use SNMP . 61
iii
Page 5

Store Your Test Setup in a Profile ..........................61
See Wi-Fi Analysis ....................................................61
See IPv6 Results .......................................................61
Generate a Report ...................................................62
Set Up Remote Control of the Analyzer ................62
Chapter 4: Network Infrastructure Tests
OneTouch Instrument ................................................. 63
Cable Test .................................................................... 69
Copper Cable Test ...................................................69
Fiber Cable Diagnostics ........................................... 74
Link Test ......................................................................75
PoE Test ....................................................................... 76
Wi-Fi Analysis .............................................................. 82
Nearest Switch Test .....................................................82
Wi-Fi Network Connect Test ...................................... 86
Gateway Test ...............................................................92
DHCP Server Test .........................................................95
DNS Server Test ........................................................... 99
Wired Analysis ...........................................................102
Contents
Chapter 5: User Tests
To Add a User Test .......................................................103
To Edit a User Test .......................................................104
Ping (ICMP) Test ........................................................ 105
Purpose .................................................................. 105
Configuration ........................................................105
How it Works .........................................................106
Results .................................................................... 107
Connect (TCP) Test .................................................... 109
Purpose .................................................................. 109
Configuration ........................................................109
Results .................................................................... 112
Web (HTTP) Test ........................................................114
Purpose .................................................................. 114
Configuration ........................................................114
iv
Page 6

OneTouch AT and OneTouch AT G2
User Manual
How it Works ........................................................ 116
Results .................................................................... 116
File (FTP) Test ............................................................ 119
Purpose .................................................................. 119
Configuration ........................................................ 119
How it Works ........................................................ 121
Results .................................................................... 122
Email (SMTP) Test ..................................................... 124
Purpose .................................................................. 124
Configuration ........................................................ 124
How it Works ........................................................ 125
Results .................................................................... 126
Wired Performance Test ........................................... 129
Purpose .................................................................. 129
Configuration ........................................................ 130
Run the Test .......................................................... 139
How it Works ........................................................ 139
Results .................................................................... 139
Wi-Fi Performance Test ............................................. 144
Purpose .................................................................. 144
Configuration ........................................................ 145
Run the Test .......................................................... 149
How it Works ........................................................ 149
Results .................................................................... 150
Multicast (IGMP) Test ............................................... 154
Purpose .................................................................. 154
Configuration ........................................................ 154
How it Works ........................................................ 155
Results .................................................................... 155
Video (RTSP) Test ...................................................... 156
Purpose .................................................................. 156
Configuration ........................................................ 157
How it Works ........................................................ 157
Results .................................................................... 158
Chapter 6: Profiles
Asterisk (*) After the Profile Name ............................ 162
v
Page 7

Open the Profiles Screen ............................................. 162
Save a Profile ................................................................162
Load a Profile ...............................................................163
Rename or Delete a Profile .........................................163
Export and Import Profiles ..........................................163
View a Profile File ........................................................ 165
Editing Profiles .............................................................165
Chapter 7: Wired Analysis
Wired Analysis ...........................................................167
Description ............................................................. 167
Configuration ........................................................168
SNMP ......................................................................169
Slow Discovery .......................................................169
How Wired Analysis Works ...................................169
Results .................................................................... 170
To Show Wired Device Details ..............................173
Wired Analysis Tools .................................................... 177
Add Test .................................................................177
Port Scan ................................................................178
Path Analysis ..........................................................179
MultiPort Statistics ................................................184
Web Browser ......................................................... 190
Telnet/SSH .............................................................. 190
Contents
Chapter 8: Wi-Fi Analysis
OneTouch AT G2 Additional Wi-Fi Features ........ 193
Enable Wi-Fi ................................................................. 193
Enable Connect Mode ...........................................194
Wi-Fi Icon on the HOME Screen ..................................194
Stopped .................................................................. 194
Linked and testing ................................................ 195
Linked but not actively testing .............................195
Scanning ................................................................ 195
Wi-Fi Analysis ............................................................... 196
Passive Wi-Fi Analysis ............................................196
vi
Page 8

OneTouch AT and OneTouch AT G2
User Manual
Active Wi-Fi Analysis ............................................. 196
Wi-Fi Analysis Screens ................................................. 196
Network Analysis ......................................................... 197
To Show Network Details ..................................... 200
Network Details .................................................... 202
Access Point Analysis ................................................... 203
To Show AP Details ............................................... 206
AP Details .............................................................. 207
Client Analysis ............................................................. 213
To Show Client Details .......................................... 216
Probing Client Details ........................................... 221
Channel Analysis ......................................................... 222
Channel Overview ................................................. 225
To Show Channel Details ...................................... 226
Interferer Analysis ....................................................... 228
To Show Interferer Details ................................... 231
Wi-Fi TOOLS ................................................................. 234
Name Tool ............................................................. 234
Authorization Status Tool and Default Setting .. 235
Connect Tool ......................................................... 238
Locate Tool ............................................................ 243
Chapter 9: Tools
Test Settings ................................................................ 248
Wired ..................................................................... 248
Wi-Fi ....................................................................... 252
Analysis .................................................................. 253
Link-Live Cloud Tools .................................................. 253
Claim Unit: ............................................................. 253
Cloud Proxy: .......................................................... 254
Port: ....................................................................... 254
Upload AutoTest Results: ..................................... 254
Periodic AutoTest .................................................. 254
Cloud Remote: ...................................................... 255
Unit Name: ............................................................ 255
Testing Tools ................................................................ 256
Capture .................................................................. 256
vii
Page 9

Contents
VoIP Analysis ..........................................................256
Wi-Fi Network Validation .....................................268
iPerf Test ................................................................280
Performance Peer ..................................................292
Browser .................................................................. 292
Telnet/SSH .............................................................. 294
Toner ...................................................................... 294
Flash Port ...............................................................295
FiberInspector/WebCam ........................................295
WebCam and Remote View ..................................298
File Tools .......................................................................299
Profiles ................................................................... 299
AP Authorization ..................................................299
Reports ................................................................... 300
Screens ................................................................... 306
Maintenance Tools ......................................................307
Version Information ..............................................307
Management Port .................................................308
Battery Status ........................................................ 312
Language ............................................................... 312
Date/Time .............................................................. 312
Number .................................................................. 312
Length .................................................................... 312
Timeout Period ......................................................313
Audible Tone .........................................................313
Power Line Frequency ........................................... 313
Display .................................................................... 313
Update Software ................................................... 314
Options .................................................................. 315
Export Logs ............................................................315
Factory Defaults (Erase Data) ...............................316
Chapter 10: Packet Capture
General Information about Capture Filters ...............319
Filters Perform a Logical AND Operation ...................320
Packet Capture Speed and Dropped Frames ..............321
SD Card ......................................................................... 321
viii
Page 10

OneTouch AT and OneTouch AT G2
User Manual
Wired Packet Capture Connection Options ............... 321
Port A Only (Single-ended Packet Capture) ........ 321
Ports A and B ......................................................... 322
Inline Packet Capture ........................................... 322
To Configure Wired Packet Capture .......................... 323
Port A Filter and Port B Filter ..................................... 324
MAC ....................................................................... 324
VLAN ...................................................................... 324
IP ............................................................................ 324
Port ........................................................................ 324
NOT ........................................................................ 324
IPv6 ........................................................................ 324
COPY FROM B and COPY FROM A Buttons ......... 325
Speed/Duplex ............................................................... 325
File Size Limit and Frame Slice Size ............................ 325
Frame Size Limit .................................................... 325
Frame Slice Size ..................................................... 325
Next Step ..................................................................... 325
Wi-Fi Packet Capture ................................................... 325
Enable Wi-Fi .......................................................... 326
Configure Wi-Fi Packet Filtering ................................ 327
To Manually Configure a Filter .................................. 327
Channel ................................................................. 328
Channel Mode ....................................................... 328
Device BSSID/MAC ................................................. 329
Control Frames ...................................................... 329
Data Frames .......................................................... 329
Management Frames ............................................ 330
Files Size Limit and Frame Slice Size .................... 330
File Format ............................................................ 330
Next Step ..................................................................... 330
To Automatically Configure a Filter ........................... 331
Open the Wi-Fi ANALYSIS Screen ............................... 331
Filter by AP ............................................................ 331
Filter by Client ....................................................... 333
Filter by Channel ................................................... 334
Start Packet Capture ................................................... 334
Stop Packet Capture .................................................... 336
AutoTest Capture ........................................................ 337
ix
Page 11

To Enable or Disable AutoTest Capture ...............337
To Save an AutoTest Capture ...............................337
Managing Capture Files .............................................. 338
Analyzing Capture Files ...............................................339
Chapter 11: Managing Files
Using the Built-in File Manager ..................................341
Remote User Interface and File Access .......................347
User Interface Remote Control .............................348
Remote File Access ................................................ 349
Other Remote Access Information .......................352
SD Card ......................................................................... 353
USB Flash Drive ............................................................353
Chapter 12: Maintenance
Maintenance ................................................................ 355
Clean the Analyzer ......................................................355
Extend the Life of the Battery .................................... 355
Store the Analyzer .......................................................356
Remove and Install the Battery ...................................356
Contents
Chapter 13: Link-Live Cloud Service
Overview ......................................................................359
Link-Live Cloud Service Support Page ..................359
Infrastructure and User Tests in the Cloud ..........359
Setting Up and Accessing the Cloud Service ..............360
Creating a Link-Live.com Account ........................360
Claiming Your Unit ...............................................360
Setting up Periodic AutoTest ................................361
Naming your OneTouch AT ..................................364
Remote Access from the Cloud ...................................365
Preparing Your Unit for Remote Access ..............365
x
Page 12

OneTouch AT and OneTouch AT G2
User Manual
Chapter 14: Specifications
Environmental and Regulatory Specifications .... 367
Cables .................................................................... 368
Network Ports ....................................................... 368
Supported Network Standards ............................ 368
SFP Adapters ......................................................... 369
Wi-Fi Antennas ...................................................... 369
Wi-Fi Adapter ........................................................ 369
Power ..................................................................... 372
Certifications and Compliance ............................. 372
Memory ................................................................. 373
Headset Jack .......................................................... 373
Dimensions ............................................................ 373
Weight ................................................................... 373
Display ................................................................... 373
Regulatory Information ........................................ 373
FCC and IC Interference Statement ..................... 374
Identification Numbers ......................................... 375
Exposure to RF Energy .......................................... 376
Regulatory Statements ............................................... 378
xi
Page 13

List of Figures
1 The OneTouch AT Network Assistant............................................... 2
2 Install and Use the Hang Strap ......................................................... 9
3 Remove and Install a Module ......................................................... 10
4 Features of the Main Unit............................................................... 11
5 Left Side View .................................................................................. 12
6 Right Side View................................................................................ 13
7 Insert the SD Card ............................................................................ 14
8 Top End View - Connectors ............................................................. 15
9 Top End View - LEDs ........................................................................ 16
10 Battery Compartment...................................................................... 18
11 Kensington Security Slot ................................................................. 18
12 The OneTouch AT Home Screen ..................................................... 19
13 Keyboards for Text Entry................................................................. 25
14 Keyboard for URL Entry................................................................... 26
15 Keyboard for IPv4 Address Entry .................................................... 27
16 Keyboard for IPv6 Address Entry .................................................... 28
17 Management Port Button in TOOLS Menu.................................... 35
18 Management Port IP Address ......................................................... 35
19 The Home Screen ............................................................................. 44
20 ADD TEST Screen.............................................................................. 45
21 Connect (TCP) Test Setup Screen .................................................... 45
22 URL Keyboard .................................................................................. 46
23 Wi-Fi Test Settings Screen ............................................................... 49
24 Signal Offsets Screen with Channel Selected................................. 51
25 Noise Offsets Screen with Bands Selected...................................... 52
26 HOME Screen After Running AutoTest .......................................... 54
27 Connect (TCP) Test Results Tab ....................................................... 55
28 Seeing Off-Screen Tests................................................................... 58
29 Wired OneTouch Results ................................................................. 65
30 Wi-Fi OneTouch Results................................................................... 68
31 Cable Connected to WireMapper #1.............................................. 71
32 Shielded Crossover Cable Connected to WireMapper #1.............. 71
33 Unterminated Cable Connected to Port A ..................................... 72
34 Unterminated Cable with Shorts and Opens ................................. 72
35 Cable Connected from Port A to Port B ......................................... 73
36 Cable With Only Two Pairs of Conductors ..................................... 73
37 No Cable Connected........................................................................ 74
xii
Page 14

OneTouch AT and OneTouch AT G2
User Manual
38 Fiber Cable Shown on HOME Screen .............................................. 74
39 HOME Screen - PoE Test Passed ......................................................78
40 Detailed PoE Test Results - Test Passed........................................... 79
41 HOME Screen - PoE Test Failed ....................................................... 80
42 Detailed PoE Test Results - Test Failed............................................ 81
43 Nearest Switch - PORT Tab .............................................................. 84
44 Nearest Switch - STATISTICS Tab ..................................................... 85
45 Wi-Fi Network Connect Test Results............................................... 88
46 Roaming Navigation Controls......................................................... 91
47 Gateway WIRED Tab ........................................................................ 94
48 Gateway Wi-Fi Tab........................................................................... 95
49 DHCP Test Results............................................................................. 97
50 DHCP Path Analysis.......................................................................... 99
51 DNS Test Results ............................................................................. 101
52 Add Test Screen..............................................................................103
53 Ping Test Results............................................................................. 107
54 TCP Test Results.............................................................................. 112
55 Web (HTTP) Test Results ................................................................ 117
56 FTP Test Results .............................................................................. 122
57 Email (SMTP) Test Results .............................................................. 126
58 Email Sent From IPv4 Wired Connection...................................... 128
59 Email Sent From IPv4 Wi-Fi Connection........................................ 128
60 Wired Performance Test - Performance Peer Screen ...................132
61 Wired Performance Test Setup Tab .............................................. 137
62 Wired Performance Test Results Using a Single Frame Size........ 140
63 Test Results: RFC 2544 Sweep, Tabular View................................ 141
64 Test Results: RFC 2544 Sweep, Graphical View ............................ 142
65 Wi-Fi Performance Setup Tab........................................................ 146
66 Wi-Fi Performance Test Results.....................................................151
67 Multicast (IGMP) Test Results ........................................................ 155
68 Video (RTSP) Test Results............................................................... 158
69 WIRED ANALYSIS Setup Screen..................................................... 168
70 WIRED ANALYSIS Screen ............................................................... 170
71 Displaying Wired Device Details ................................................... 173
72 Wired Device Details......................................................................174
73 Port Scan Results ............................................................................ 179
74 Wired Analysis Tools Menu ........................................................... 181
75 Path Analysis Results......................................................................182
76 Path Analysis - Detailed Results .................................................... 184
77 MultiPort Statistics Button on Wired Analysis Tools Menu......... 185
78 MultiPort Statistics Button on Path Analysis Tools Menu ...........186
79 MultiPort Statistics Summary Screen ............................................ 187
xiii
Page 15

Figures
80 MultiPort Statistics Details Screen ................................................ 189
81 MultiPort - Device on Port Details Screen .................................... 190
82 Wi-Fi Analysis Tabs......................................................................... 197
83 Wi-Fi Network Analysis Tab, Sorted by SSID ................................ 198
84 Displaying Wi-Fi Network Details ................................................. 201
85 Wi-Fi Network Details.................................................................... 202
86 AP Analysis Tab .............................................................................. 204
87 AP Details ....................................................................................... 208
88 Bonded Channel AP Details .......................................................... 211
89 Client Analysis Tab......................................................................... 214
90 Associated Client Details ............................................................... 217
91 Probing Client Detail ..................................................................... 221
92 Channel Analysis Tab..................................................................... 223
93 Channel Overview.......................................................................... 225
94 Wi-Fi Channel Details .................................................................... 226
95 Interferer Analysis Tab .................................................................. 229
96 Interferer Details............................................................................ 232
97 Wi-Fi AP Tools Screen .................................................................... 234
98 AP Authorization Status................................................................ 238
99 Multiple Choices for Connect tool................................................ 239
100 Network (left) and AP (right) Connect Tool Results .................... 240
101 Network (left) and AP (right) Connection Logs ........................... 242
102 Directional Antenna Holder.......................................................... 244
103 AP/Client LOCATE Screen .............................................................. 245
104 Interferer LOCATE Screen.............................................................. 246
105 Tools Screen ................................................................................... 247
106 Link-Live Cloud Tools..................................................................... 253
107 Testing Tools .................................................................................. 256
108 The VoIP Analysis Configuration Screen, SETUP Tab................... 258
109 The VoIP Analysis Results Screen, MONITOR Tab ........................ 259
110 The VoIP Analysis Results Screen, LOG Tab.................................. 261
111 The VoIP Analysis Configuration Screen ...................................... 263
112 The VoIP Analysis - Save VoIP Capture ......................................... 264
113 The Wi-Fi Network Validation Screen .......................................... 269
114 Wi-Fi Network Validation SSID Selection Screen ......................... 270
115 Manage Locations for Wi-Fi Network Validation........................ 271
116 Discovered BSSIDs for Wi-Fi Network Validation......................... 272
117 Wi-Fi Network Validation in Progress .......................................... 274
118 Wi-Fi Network Validation Results Tab.......................................... 275
119 iPerf Test Setup Screen .................................................................. 281
120 iPerf Server Screen ......................................................................... 282
121 UDP Protocol Parameters .............................................................. 284
xiv
Page 16

OneTouch AT and OneTouch AT G2
User Manual
122 Select BSSIDs for iPerf Test ............................................................ 285
123 Wired iPerf TCP Test Results.......................................................... 286
124 Wired iPerf UDP Test Results......................................................... 287
125 Wi-Fi iPerf UDP Test Results .......................................................... 289
126 FiberInspector Image of an Endface ............................................. 296
127 FiberInspector Image with Measurement Scales.......................... 297
128 File Tools......................................................................................... 299
129 Initial Available Report Options.................................................... 300
130 Save Report Screen—Possible Report Options ............................. 302
131 Report Content Options for AutoTest.......................................... 303
132 Report Content Options for Wired Analysis................................. 304
133 Report Content Options for Wi-Fi Analysis .................................. 305
134 Maintenance Tools......................................................................... 307
135 Management Port Screen Linked Wired ...................................... 309
136 Battery Status Screen ..................................................................... 312
137 Capture Filters - Logical AND Operation ......................................320
138 Single-Ended Packet Capture ........................................................321
139 Inline Packet Capture..................................................................... 322
140 The Wired CAPTURE Screen .......................................................... 323
141 Wi-Fi Test Settings Screen.............................................................. 326
142 Wi-Fi CAPTURE SETTINGS Screen ..................................................328
143 Wi-Fi CAPTURE Screen ................................................................... 332
144 CAPTURE SETTINGS Screen ............................................................ 333
145 Wired Capture Results ................................................................... 335
146 Wi-Fi Capture Results..................................................................... 336
147 The Four File Manager Screens ..................................................... 343
148 SAVE AS Screen .............................................................................. 344
149 Manage Profiles Screen ................................................................. 345
150 File Manager - Export File Tree.....................................................346
151 Browser Remote Access Login Credentials................................... 348
152 Remote Access OneTouch Home Screen....................................... 349
153 OneTouch Web Server Home........................................................ 350
154 OneTouch Remote File Access....................................................... 350
155 Remote Access icon located in Shortcut Bar ................................ 352
156 Management Port Status Dialog - Remote Control Disconnect.. 353
157 Remove and Install the Battery..................................................... 357
158 Periodic AutoTest Status Screen.................................................... 363
xv
Page 17

Chapter 1: Get Acquainted
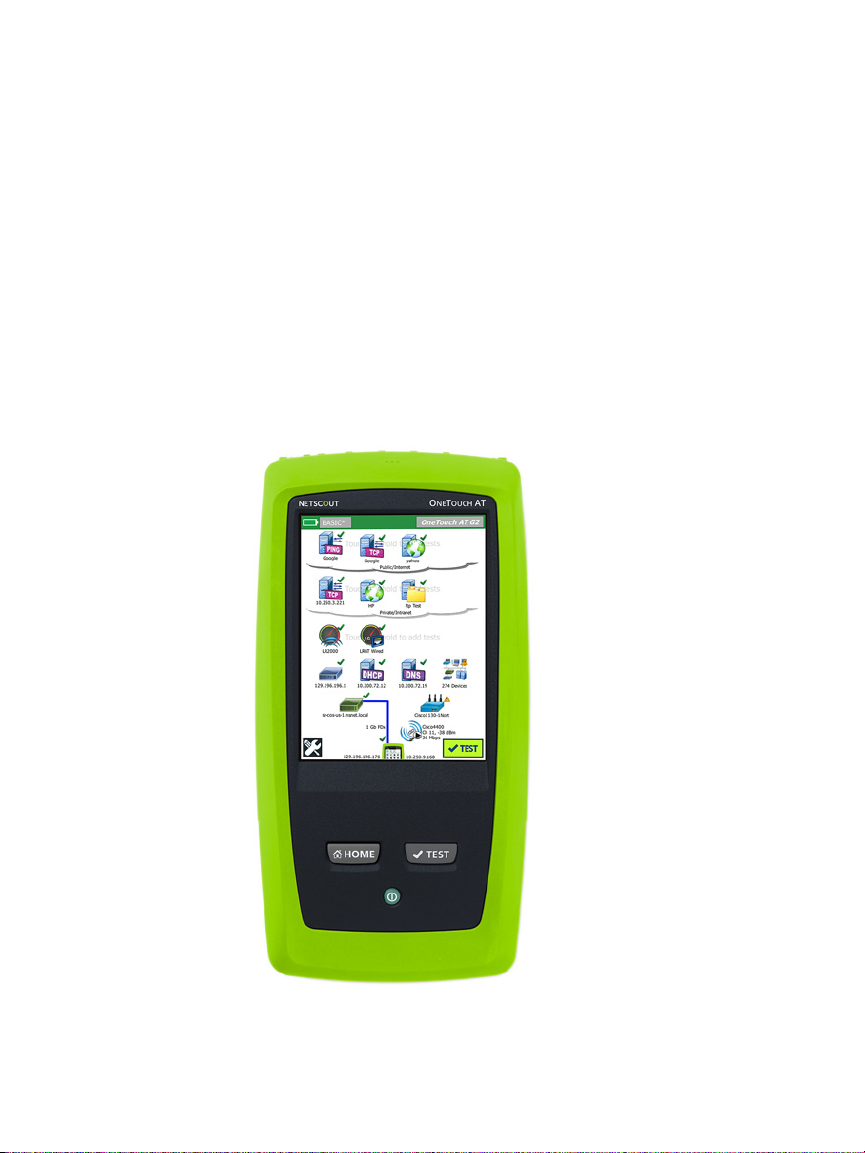
Overview of Features
The OneTouch™ AT Network Assistant is a rugged, easy to use,
hand-held network analyzer. The OneTouch analyzer can be used
to:
Test network connectivity and performance
Diagnose problems that impact network access and
performance
Troubleshoot problems when performing network move/
change/add tasks
The OneTouch analyzer answers questions such as:
Can I connect to the wired and Wi-Fi networks?
Are basic services such as DHCP and DNS operational?
Can I access the Internet from the network?
Are my email and FTP servers working?
Can I receive multicast video?
What is the performance of my wired/Wi-Fi network
infrastructure?
The analyzer features:
User-configurable tests
User-configurable Profiles
Complete L1/L2 measurements of any media type
Two copper/RJ45 and two Fiber/SFP Ethernet ports
One 802.11a/b/g/n/ac Wi-Fi interface
Network services measurements
USB Type A port
1
Page 18
OneTouch AT and OneTouch AT G2
User Manual
Wired Performance test using a Peer or Reflector
Wi-Fi Performance test with the option of using a Peer or
Reflector
Built-in 10/100 Mbps management port and optional USB Wi-
Fi management port adapter
Ethernet packet capture and Wi-Fi packet capture
The analyzer features a Setup Wizard that guides you through
configuring the analyzer for testing. See “Setup Wizard” on
page 33.
Figure 1. The OneTouch AT Network Assistant
2
Page 19

Chapter 1: Get Acquainted
Safety Information
Safety Information
Table 1 shows the international electrical symbols used on the
analyzer or in this manual.
Table 1. Symbols
Warning or Caution: Risk of damage or destruction to equipment
W
or software. See explanations in the manuals.
X
Warning: Risk of fire, electric shock, or personal injury.
Warning: Class 1 laser when an SFP module is installed. Risk of eye
*
damage from hazardous radiation.
This key turns on the OneTouch analyzer.
Do not put products containing circuit boards into the garbage.
~
Dispose of circuit boards in accordance with local regulations.
WWarning X
To prevent possible fire, electric shock, or personal
injury:
Remove the batteries if the Product is not used for
an extended period of time, or if stored in
temperatures above 50 °C. If the batteries are not
removed, battery leakage can damage the Product.
The battery door must be closed and locked before
you operate the Product.
Repair the Product before use if the battery leaks.
Replace the batteries when the low battery
indicator shows to prevent incorrect measurements.
Turn off the Product and disconnect all cables
before you replace the battery.
Be sure that the battery polarity is correct to
prevent battery leakage.
3
Page 20

OneTouch AT and OneTouch AT G2
User Manual
Do not disassemble or crush battery cells and
battery packs.
Do not put battery cells and battery packs near heat
or fire.
Do not put in sunlight.
Do not continuously charge battery packs when not
in use.
Do not expose battery pack to mechanical shock.
Do not open the battery pack. There are no user
serviceable parts inside.
Refer to the Product manual for proper instructions
on charging the battery pack.
Do not operate the Product with covers removed or
the case open. Hazardous voltage exposure is
possible.
Remove the input signals before you clean the
Product.
Have an approved technician repair the Product.
Do not put metal objects into connectors.
Do not short the battery terminals together.
For Products with rechargeable batteries, use only
AC adapters approved for use with the Product to
supply power to the Product and charge the
battery.
WWarning: Class 1 and Class 2 Laser Products
To Prevent eye damage and personal injury:
Do not look directly into optical connectors. Some
optical equipment emits invisible radiation that can
cause permanent damage to your eyes.
4
*
Page 21

Chapter 1: Get Acquainted
Safety Information
Do not look into the laser. Do not point laser directly
at persons or animals or indirectly off reflective
surfaces.
When you inspect fiber endfaces, use only
magnification devices that have the correct filters.
Use the Product only as specified or hazardous laser
radiation exposure can occur.
WCaution
To prevent damage to the Product, accessories, or
cables under test and to prevent data loss, read all
safety information given in all documentation
supplied with the Product.
Do not connect the Product to a telephone line or
ISDN line.
Use the correct cables and connectors when
connecting the Product to a network.
Do not block or restrict the Product’s air intake or
exhaust ports.
5
Page 22

OneTouch AT and OneTouch AT G2
User Manual
Contact NETSCOUT
For more contact information, go to our website.
http://enterprise.netscout.com
customercare@netscout.com
Toll free: +1-844-833-3713
International: 978-320-2150
Additional Resources
For OneTouch analyzer product information and accessories, see
http://enterprise.netscout.com.
For help in Link-Live Cloud Service, go to
https://app.link-live.com/support.
AC Adapter and Battery
You can use the AC adapter or the included lithium ion battery to
supply power to the analyzer. The AC adapter recharges the
battery.
Charge the Battery
Before you use the battery for the first time, charge the battery
for about 2 hours with the analyzer turned off.
A fully-charged battery operates for approximately 4 hours of
typical use. The battery typically takes approximately 4 hours to
recharge from 10% to 90% when the analyzer is turned off.
You do not need to fully discharge the battery before
you recharge it.
The battery will not charge if its temperature is
outside the range of 32°F to 104°F (0°C to 40°C).
6
Notes
Page 23

Chapter 1: Get Acquainted
AC Adapter and Battery
Switch the Power On
To turn on the analyzer, press the green power key +. The key
will illuminate and in a few seconds the HOME screen will appear.
Set the Language
1 On the HOME screen, tap the TOOLS icon (located in the
lower-left corner of the screen).
2 Scroll down to the Maintenance Tools section and tap
Language.
3 Select a language from the list.
4 Press the key to return to the HOME screen.
Check the Battery Status
The battery status icon is located in the upper-left corner of
the screen. The battery status icon is normally green. It turns red
when the battery’s charge drops below 20%. If the battery is not
installed in the analyzer, the icon is red.
When the AC adapter is connected to the analyzer, the AC Power
Indicator LED (see Figure 5) is red while the battery is charging;
green when fully charged. If the battery’s temperature is too high
or too low to permit charging, the AC Power Indicator turns
yellow.
To see more information about the battery status, tap the Tools
icon , then scroll down and tap the Battery Status button.
Extend Battery Operating Time
The display backlight consumes power. Decreasing the display
brightness will increase battery operating time.
You can make the backlight shut off after a period of inactivity.
You can also make the analyzer power down after a period of
inactivity. See “Timeout Periods (Power-Down and Backlight)” on
page 30.
7
Page 24

OneTouch AT and OneTouch AT G2
User Manual
Extend the Life of the Battery
Recharge the battery frequently. Do not let the battery
discharge completely.
Do not keep the battery at temperatures below -20
4
F) or above +50C (+122F) for periods longer than one
week.
Before you put a battery into storage, charge it to
approximately 50% of full charge.
C (-
8
Page 25
Chapter 1: Get Acquainted
Install and Use the Strap
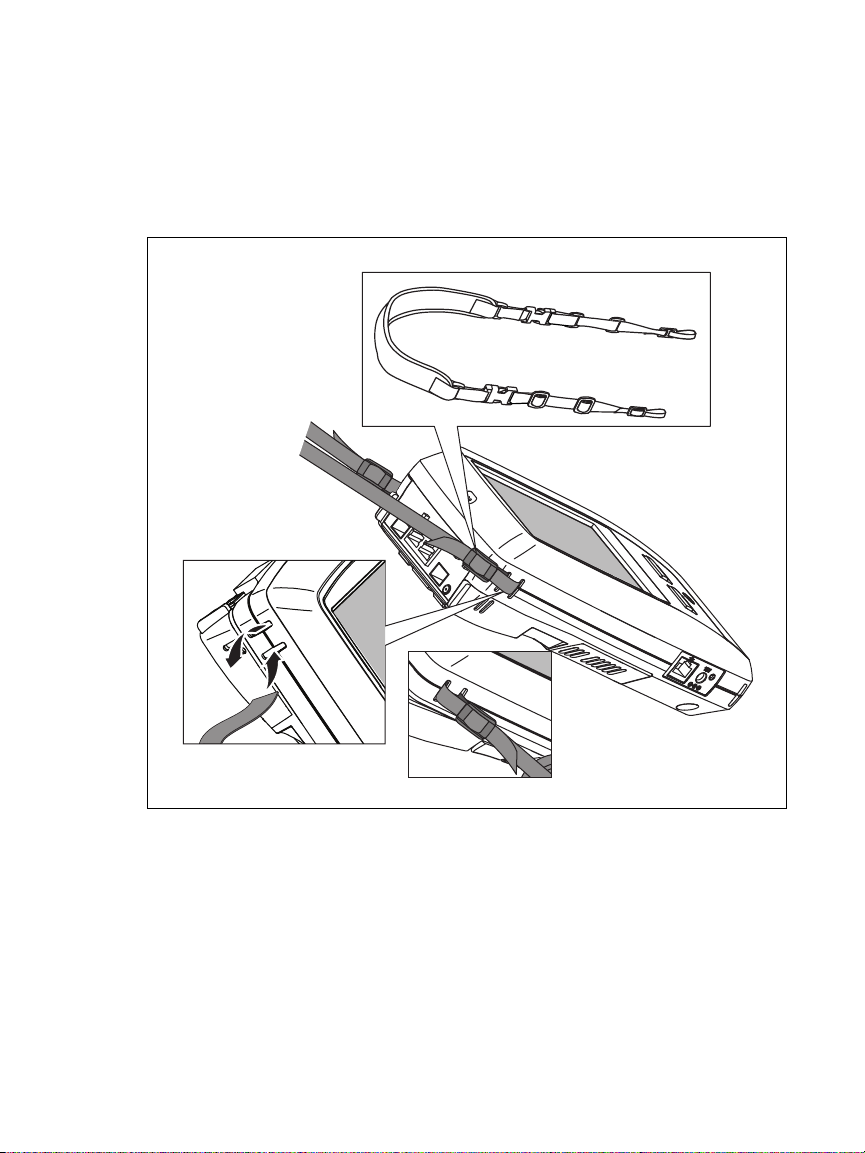
Install and Use the Strap
You can install the strap on any two of the four attachment
points on the analyzer.
Figure 2. Install and Use the Hang Strap
OneTouch Platform
The OneTouch platform is a handheld computer and display
platform that accepts modules like the OneTouch AT G2 module.
The modules attach to the system as shown.
GVO013.EPS
9
Page 26
OneTouch AT and OneTouch AT G2
User Manual
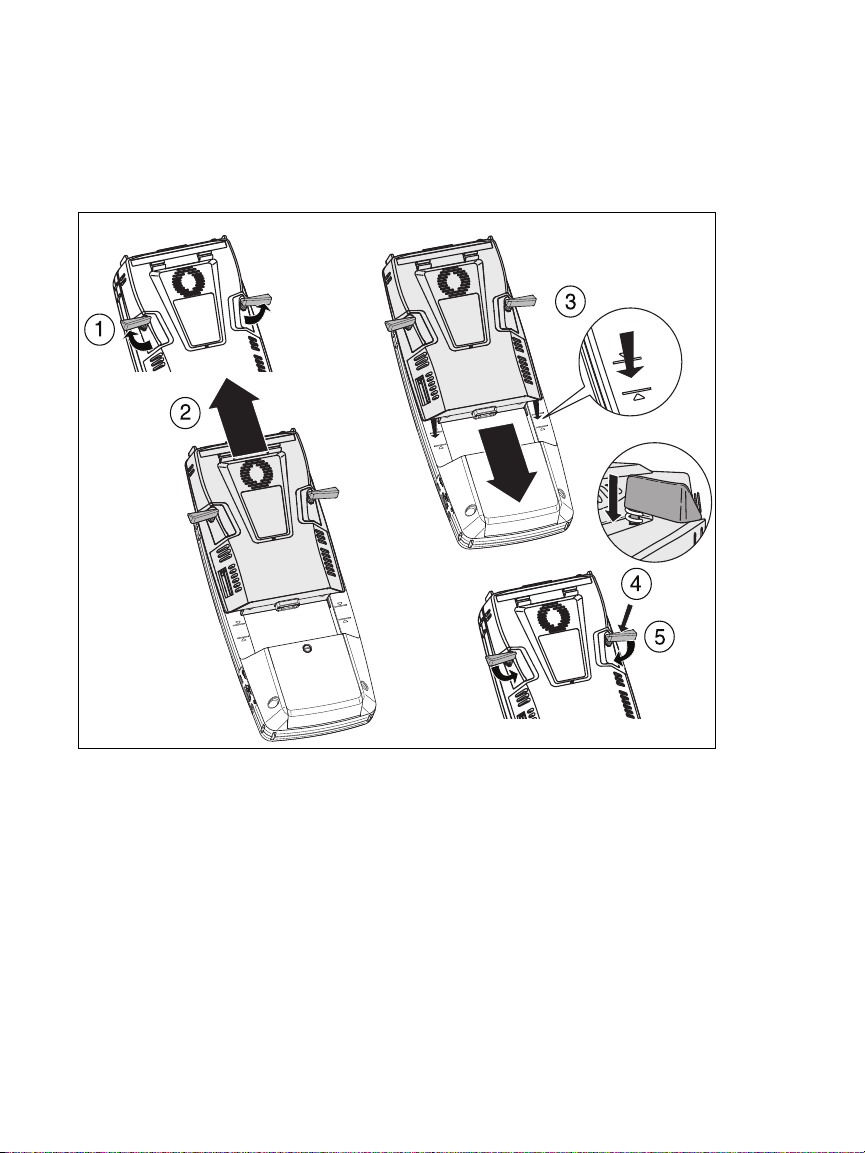
Remove and Install a Module
Switch off the analyzer’s power before removing the module.
10
Figure 3. Remove and Install a Module
GVO004.EPS
Page 27
Chapter 1: Get Acquainted
Connectors, Keys, and LEDs
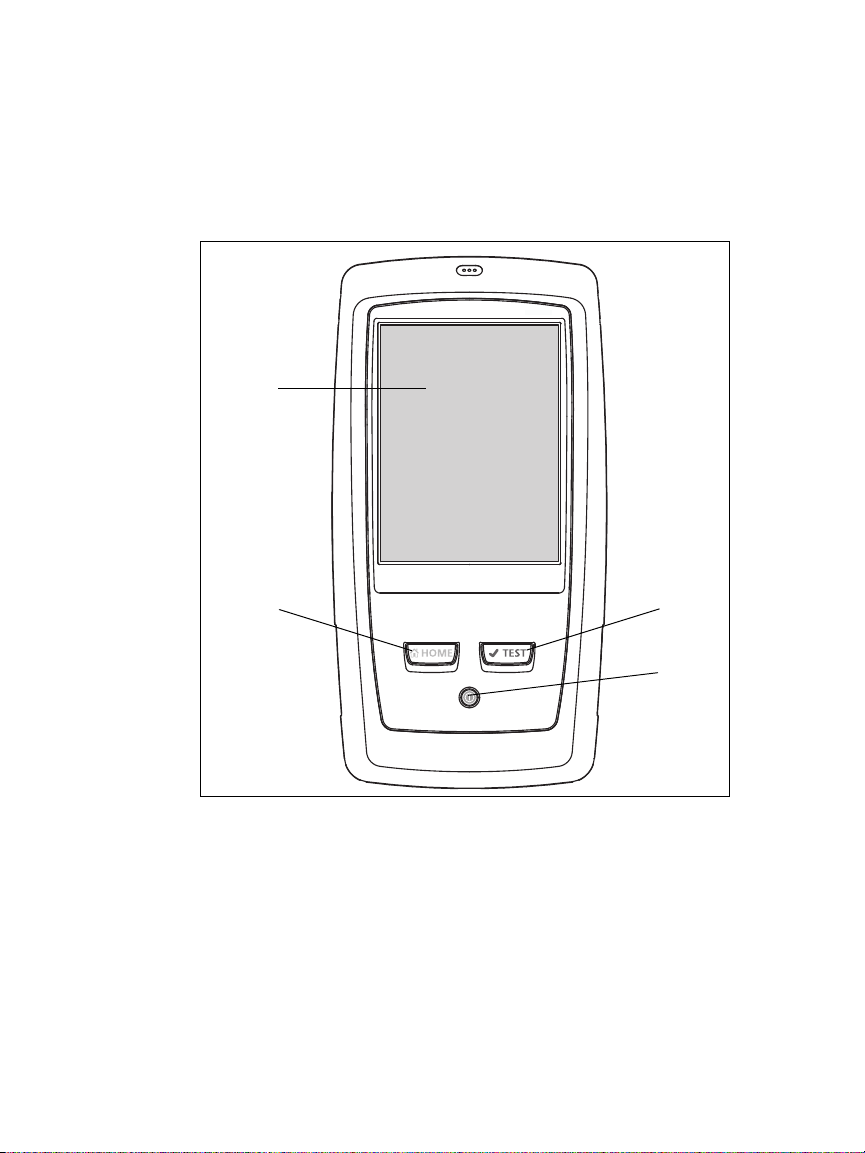
Connectors, Keys, and LEDs
This section describes the external characteristics of the OneTouch
AT hardware platform.
Figure 4. Features of the Main Unit
GVO005.EPS
LCD display with touch-screen - To change the brightness, tap
TOOLS > Display. See also: “Touchscreen” on page 24.
- Press this key to go to the Home screen. See “The HOME
Screen” on page 19.
11
Page 28
OneTouch AT and OneTouch AT G2
User Manual
AutoTest key - The analyzer is silent on the network
until you run AutoTest. AutoTest initiates link, infrastructure
test, and user test activity. This key performs the same function
as the AutoTest button that appears on the display.
Power Key - The Power Key illuminates when you switch the
power on. Press it again to switch the power off. See also: “AC
Adapter and Battery” on page 6.
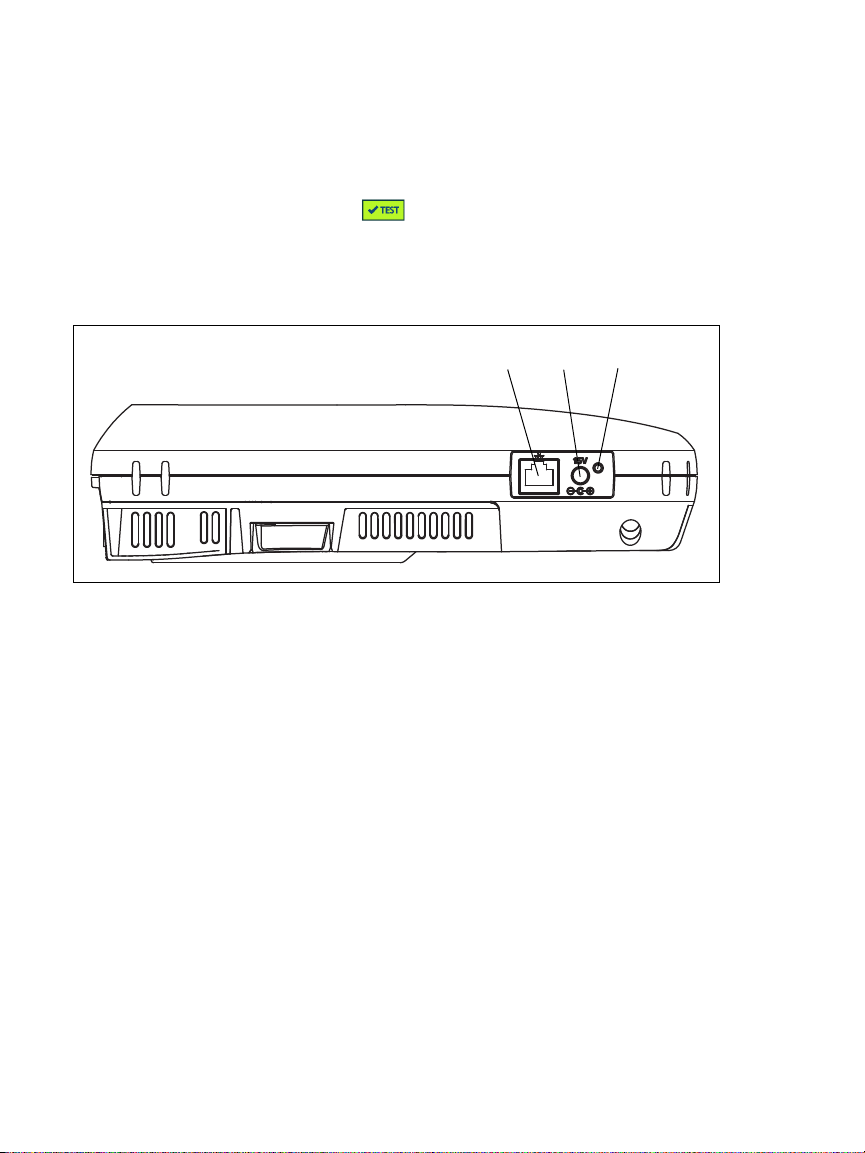
Figure 5. Left Side View
Management Port - Connect to the analyzer via this 10 Mbps/
100 Mbps RJ-45 Ethernet Port for:
Remote control of the analyzer
Copying files to or from the analyzer
Browsing the web from the analyzer
SSH or telnet to switches, etc. from the analyzer
12
GVO006.EPS
Page 29
Chapter 1: Get Acquainted
Connectors, Keys, and LEDs
Power Connector - Connect the supplied AC adapter to a power
source and to the OneTouch analyzer. See “AC Adapter and
Battery” on page 6.
AC Power Indicator - This LED is red while the battery is
charging; green when fully charged.
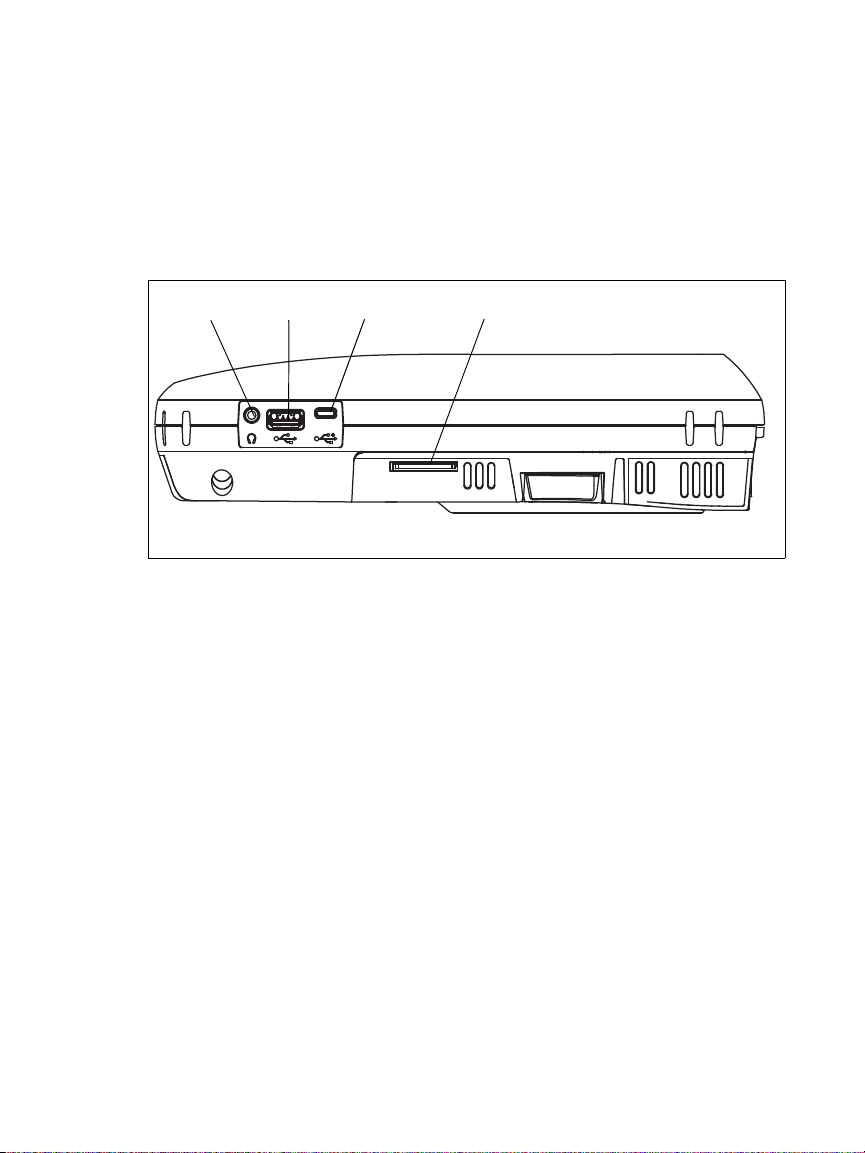
Headphone Jack - This 3.5 mm connector is provided so you can
use headphones when using the Wi-Fi locate feature.
USB-A Connector - This connector is for the Wi-Fi Management
Port feature and for managing files on a USB storage device
such as a flash drive. See Chapter 11: "Managing Files,"
beginning on page 341.
Many USB flash drives have an LED on the front. Note that the
USB flash drive is inserted into the OneTouch analyzer with the
back of the flash drive facing the front of the analyzer.
You do not need to software-eject a USB storage device before
removing it. Wait for the analyzer to stop writing to the device,
then physically remove it. USB keyboard operation is supported
on the port; mouse operation is not.
Micro-USB Connector - This connector is reserved for future use.
Figure 6. Right Side View
GVO007.EPS
13
Page 30
OneTouch AT and OneTouch AT G2
User Manual
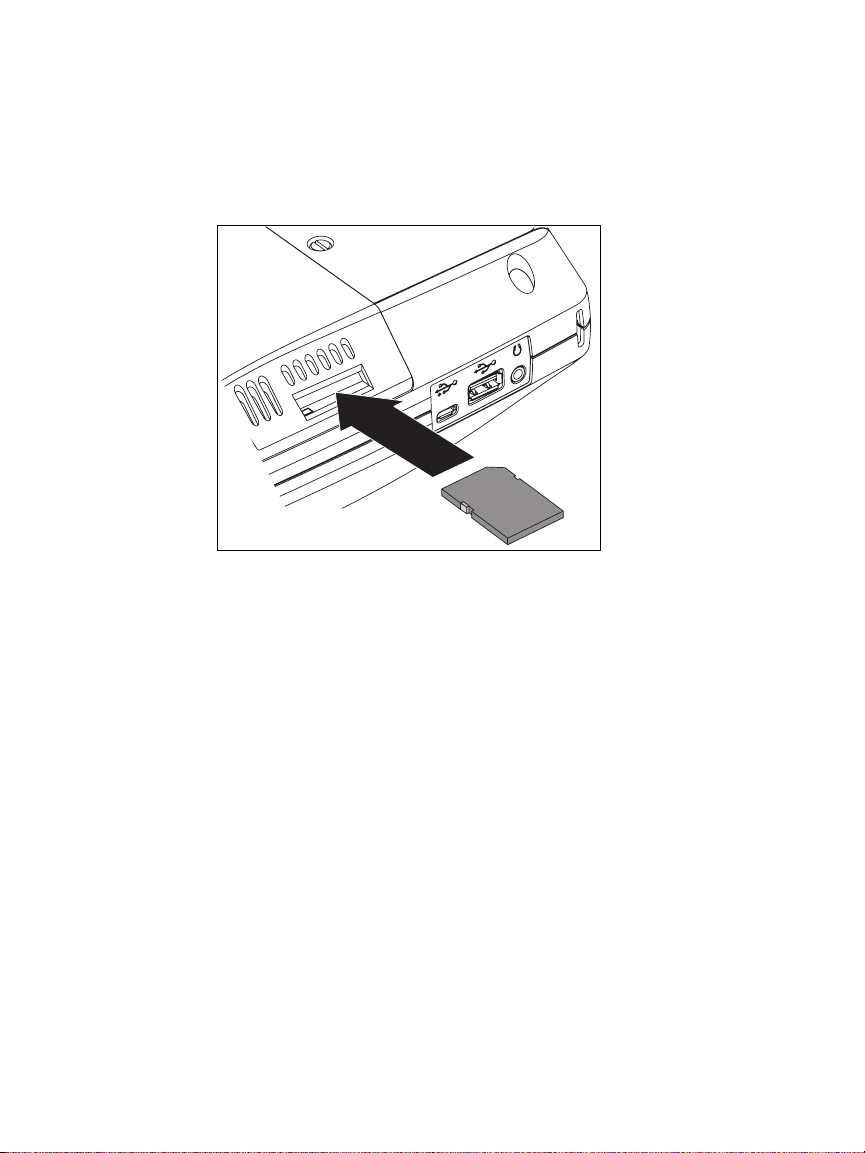
SD Card Slot - This is for inserting an SD card. You can manage
files on an SD card. See Chapter 11: "Managing Files,"
beginning on page 341.
Figure 7. Insert the SD Card
GVO015.EPS
You do not need to software-eject the SD card before removing
it. Wait for the analyzer to stop writing to the card. Then gently
push the card in until a soft click is heard. Release the card and
remove it.
14
Page 31

Chapter 1: Get Acquainted
Connectors, Keys, and LEDs
Figure 8. Top End View - Connectors
External Antenna Connector (see “Connect Tool” on page 238)
Fiber Port A (SFP receptacle)
Wired Ethernet Port A (RJ45 connector)
Wired Ethernet Port B (RJ45 connector)
Fiber Port B (SFP receptacle)
Port A and Port B Connectors
Port A and Port B each have two connectors:
10/100/1000 Mbps RJ45 Ethernet connector (for copper
connection)
100/1000 Mbps standard SFP socket (for fiber connection)
To connect to a network using a copper cable, make a connection
to the Port A RJ45 jack. Appropriate cable and fiber types are
listed in Chapter 14: "Specifications," beginning on page 367.
To connect to a network using optical fiber, insert the
appropriate SFP adapter into the OneTouch analyzer’s Port A SFP
socket. Then make a fiber connection from the network to the
SFP adapter. The OneTouch analyzer supports 100BASE-FX and
1000BASE-X SFP adapters.
GVO008.EPS
15
Page 32

OneTouch AT and OneTouch AT G2
User Manual
Port B is used for copper or fiber inline packet capture, packet
capture on ports A and B, and for copper cable test.
The analyzer links when you tap the AutoTest button or
press the AutoTest
If Ethernet connections are available at both the fiber and copper
network ports, the analyzer uses the fiber port.
key.
Figure 9. Top End View - LEDs
Wi-Fi Link/Scanning/Monitoring LED
Wi-Fi Activity LED
Port A Link LED
Port A Activity LED
Port B Link LED
Port B Activity LED
16
GVO008.EPS
Page 33

Chapter 1: Get Acquainted
Connectors, Keys, and LEDs
Receive (Rx)/Link and Transmit (Tx) LEDs
The Management Port and each Ethernet port (Port A, Port B, and
Wi-Fi) have two LEDs: “Link” and “Activity.”
Table 2. Link LED
LED State Meaning
Off The port is not linked.
Green Link is established on the port.
Yellow Wi-Fi scanning or monitoring
mode (Wi-Fi port only).
Table 3. Activity LED
LED State Meaning
Off No activity
Flashing
Green
Receive or transmit activity
17
Page 34

OneTouch AT and OneTouch AT G2
User Manual
Figure 10. Battery Compartment
GVO012.EPS
Battery Compartment - The battery pack can be replaced. See
“Remove and Install the Battery” on page 356.
Figure 11. Kensington Security Slot
GVO016.EPS
Kensington Security Slot - You can attach a Kensington security
cable to physically secure the analyzer. The Kensington security
slot is on the back of the analyzer.
18
Page 35

The HOME Screen
Battery Icon
Profile in Use
Asterisk indicates
changes not saved
Remote
connection
established
Tap to take
Screenshot
Shortcut Bar
Public Cloud
Private Cloud
Local Network
Wired
Analysis
Access Point
Wi-Fi
Analysis
AutoTest Button
Wi-Fi IP Address
Wired IP Address
Cable Test and PoE
OneTouch AT
Nearest
Switch
DNS Server
DHCP Server
Default
Gateway
Test
Tiers
TOOLS button
Press the key to display the Home screen.
Chapter 1: Get Acquainted
The HOME Screen
Figure 12. The OneTouch AT Home Screen
19
Page 36

OneTouch AT and OneTouch AT G2
User Manual
Shortcut Bar
Shortcut Bar: The shortcut bar’s background is black until
AutoTest completes. When AutoTest completes the shortcut
bar’s background turns green if all tests pass, or red if any test
fails.
Test warnings (indicated by a warning icon next to a test’s
icon on the HOME screen) do not affect the pass/fail status of
AutoTest.
Battery Status Indicator: Shows the battery’s approximate
charge. The indicator is green when the battery’s charge is
20% or more. The indicator turns red when the battery’s
charge falls below 20%. When the indicator turns red,
connect the ac adapter to avoid running out of power.
To see more information about the battery status, tap the
Tools icon , then scroll down and tap the Battery Status
button. See also: “AC Adapter and Battery” on page 6.
Profile Button: A Profile contains OneTouch analyzer setup and
test information. An asterisk (*) appears after the profile name
if changes have been made but have not been saved to the
named profile. For more information see “Asterisk (*) After the
Profile Name” on page 162.
Remote Connection Indicator: This icon appears when a remote
connection to the OneTouch analyzer is established.
OneTouch AT Button: Tap the OneTouch AT button to open a
menu that lets you capture a screen (take a screen shot), create
a report, or save an AutoTest capture file. For more
information see “Screens” on page 306, “Reports” on
page 300, and “To Save an AutoTest Capture” on page 337.
20
Page 37

Chapter 1: Get Acquainted
The HOME Screen
Test Tiers
You can use the three test tiers to organize your tests any way
you like.
Public Cloud Tier: This tier is generally used for tests of servers
that are in the public cloud (the internet).
Private Cloud Tier: This tier is generally used for tests of servers
that are in the private cloud (the corporate intranet).
Local Network Tier: This tier is generally used for tests of
servers that are in the local network (the premise).
Public/Internet Cloud: Touch the cloud to rename it. See
page 57.
Private/Intranet Cloud: Touch the cloud to rename it. See
page 57.
21
Page 38

OneTouch AT and OneTouch AT G2
User Manual
Network Services Tier
Default Gateway: This shows the default gateway for the
wired and/or Wi-Fi connection. Tap the icon for details of this
router. If a problem is detected, a red X appears on the icon.
See page 92.
DHCP Server: Tap the icon to show details of the DHCP test. If
the service is unavailable, a red X appears on the icon. See
page 95.
DNS Server: Tap the icon to show details of the DNS test. If the
service is unavailable, a red X appears on the icon. See
page 99.
Discovered Networks and Devices: The total number of
discovered devices is displayed beneath this icon. Tap the icon
to display the WIRED ANALYSIS screen. For more information
see “Wired Analysis” on page 167.
Network Access Tier
Nearest Switch: Tap the icon to show details of the nearest
switch. If a problem is detected, a red X appears on the icon.
See page 82.
Cable: Tap the link icon to view cable and PoE statistics. See
“Cable Test” on page 69 and “PoE Test” on page 76 for more
22
information.
Page 39

Chapter 1: Get Acquainted
The HOME Screen
Wi-Fi Access Point: Tap the icon for AP test results and
connection log. For more information see “Wi-Fi Network
Connect Test” on page 86.
Instrument Tier
TOOLS button: Tap this button to enter the TOOLS menu. See
Chapter 9: "Tools," beginning on page 247.
Cable: Tap the text to view cable, link, and PoE test results.
See “Cable Test” on page 69 and “PoE Test” on page 76 for
more information.
OneTouch Icon: Tap the icon to view a detailed list of wired
and Wi-Fi transmit and receive statistics, along with address
information. Note that the analyzer’s wired and Wi-Fi IP
addresses are shown to the left and right of the icon.
Wi-Fi Analysis: Tap the icon to open the Wi-Fi Analysis screen.
See Chapter 8: "Wi-Fi Analysis," beginning on page 193.
AutoTest Button: Tap the button to run all configured tests.
The analyzer does not link (on the wired or Wi-Fi ports) and
does not perform any infrastructure tests or user tests until
you tap the AutoTest button (or press the AutoTest key
).
Wired IP Address: This is the IP address of the Ethernet NUT
(Network Under Test) port.
Wi-Fi IP Address: This is the IP address of the Wi-Fi adapter.
23
Page 40

OneTouch AT and OneTouch AT G2
User Manual
Touchscreen
WCaution
For correct operation and to prevent damage to the
touchscreen, touch the screen only with your
fingers. Do not touch the screen with sharp objects.
You can use these gestures on the touchscreen:
Tap: To select an item on the screen, tap the item lightly.
Flick: To scroll a screen, touch the screen then move your
fingertip in the direction you want the screen to move.
Touch and Hold: To add a new test to a test tier, touch white
space between the tests on the HOME screen and hold your
finger in place. A menu will appear.
To move, copy, or delete a test, touch the test and hold your
finger in place. Choices will appear.
To clean the touchscreen, turn off the analyzer, then use a soft,
lint-free cloth that is damp with alcohol or a mild detergent
solution.
Entering Text
When you tap a panel to enter text, a keyboard is displayed on
the bottom half of the screen (Figure 13).
To enter characters, tap the characters on the keyboard.
To enter one upper-case letter, tap SHIFT, then tap the letter.
The keyboard goes back to lower-case mode after you enter
one character. Note: Accented letters are not available as
upper-case letters.
To enter multiple upper-case letters, tap SHIFT twice. The shift
key turns white when the keyboard is in upper-case mode. To
enter lower-case characters, tap SHIFT again.
To delete characters, tap BACK.
24
Page 41

Chapter 1: Get Acquainted
Standard
characters
Accented
characters
Entering Text
To enter accented characters, tap the çñßà key (at the lower-
left corner of the keyboard), then tap the letters on the
keyboard. To enter non-accented characters, tap çñßà again.
Figure 13. Keyboards for Text Entry
Entering Passwords and Other Hidden Text
When entering passwords, SNMP v1/v2 community strings, or
SNMP v3 credentials, the characters are shown as dots.
To show characters in plain text as you type them:
1 Clear all of the characters in the text box. The lock and unlock
icons will appear.
2 Select the unlock icon.
25
Page 42

OneTouch AT and OneTouch AT G2
User Manual
3 Enter the characters
When you have entered the characters and tapped the DONE
button, the characters can no longer be viewed as plain text.
The characters appear as a series of dots.
URL Keyboard
When entering a URL, the keyboard includes buttons for adding
“www.” to the beginning, or “.com,” “.net,” or “.org” to the
end. See Figure 14.
26
Figure 14. Keyboard for URL Entry
Page 43

Chapter 1: Get Acquainted
Entering Text
IPv4 Address Entry Keyboard
When entering an IPv4 address, the keyboard includes buttons for
entering common number combinations, and disallows entry of
alphabetic characters. See Figure 15.
Figure 15. Keyboard for IPv4 Address Entry
27
Page 44

OneTouch AT and OneTouch AT G2
User Manual
IPv6 Address Entry Keyboard
When entering an IPv6 address, the keyboard is customized with
buttons for common number combinations, the colon separator,
and hexadecimal digits. An IPv6 address is represented by 8
groups of 16-bit hexadecimal values separated by colons. Leading
zeros can be omitted. Groups of consecutive zeros can be
replaced by a double colon (::).
28
Figure 16. Keyboard for IPv6 Address Entry
Page 45

Chapter 1: Get Acquainted
Set Preferences
Set Preferences
Typically, you will set the following preferences once, and you
will not need to set them again.
Language
See “Set the Language” on page 7.
Date/Time
1 On the HOME screen, tap TOOLS .
2 Scroll down to the Maintenance Tools section and tap Date/
Time.
3 Tap the setting you want to change:
To set the date, tap Date. Tap <left arrow> or <right
arrow> to select a month and year for the calendar, then
select the correct date on the calendar. Tap DONE to save
your settings.
To set the time, tap Time. Tap <up arrow> or <down
arrow> to increase or decrease the setting for hours,
minutes, and seconds. Tap DONE to save your settings.
To set the date format, tap Date Format, then select a
format for the day (DD), month (MM), and year (YYYY).
Note that the date format used in file naming of reports,
screen shots, packet captures, etc. is based on the
language setting. See “Language” on page 29.
To set the time format, tap 12 hr or 24 hr to use a 12-hour
clock or a 24-hour clock.
Note
If you remove the battery and do not connect the AC
adapter, the clock keeps the current date and time for
a minimum of 24 hours.
29
Page 46

OneTouch AT and OneTouch AT G2
User Manual
Number Format
The analyzer can show decimal fractions with a decimal point
(0.00) or a comma (0,00).
1 On the HOME screen, tap TOOLS .
2 Scroll down to the Maintenance Tools section and tap 0.0 or
0,0 on the Number button.
Units for Length Measurements
1 On the HOME screen, tap TOOLS .
2 Scroll down to the Maintenance Tools section and tap ft for
feet or m for meters on the Length button.
Timeout Periods (Power-Down and Backlight)
To increase battery operating time, the analyzer can turn off the
backlight and/or automatically power down when you do not
press any keys for a specified period.
These settings only apply when the analyzer is operating on
battery power.
1 On the HOME screen, tap TOOLS .
2 Scroll down to the Maintenance Tools section, and tap
Timeout Period.
3 Tap Backlight or Power Down.
4 Select a time. To always keep the backlight or analyzer on, tap
Disabled.
Power Line Frequency
Set the power line frequency to the power frequency in the area
where you will use the analyzer. This setting helps prevent
external ac noise from affecting wiremap and resistance
measurements.
1 On the HOME screen, tap TOOLS .
30
Page 47

Chapter 1: Get Acquainted
Set Preferences
2 Scroll down to the Maintenance Tools section, and tap Power
Line Frequency.
3 Tap 50 Hz or 60 Hz, according to your AC power frequency.
31
Page 48

OneTouch AT and OneTouch AT G2
User Manual
32
Page 49

Chapter 2: Setup Wizard
WWarningX*
Before you use the analyzer, read the safety
information that starts on page 3.
This chapter helps you quickly begin using the OneTouch
analyzer.
Setup Wizard
The Setup Wizard, which appears when you initially power on the
OneTouch AT analyzer, guides you through these tasks:
Setting up the Link-Live Cloud Service, which extends the
analyzer’s network testing capability
Configuring the analyzer’s settings and tests, which
prepares the analyzer to run an informative AutoTest
Working with the Setup Wizard
If you want to skip the Setting Up the Cloud Service or Configuring
the Analyzer’s Settings and Tests task, select the “Don’t show me
this again” check box at the beginning of the section.
At the beginning of each section, a Yes/No toggle control
is displayed.
Keep the default selection (Yes), and tap the NEXT button
to complete the section.
Select No and tap the NEXT button to skip the section.
You can exit the Setup Wizard at any time by selecting the EXIT
button .
To Start the Setup Wizard at a Later Time
You can run the Setup Wizard again, at any time, to create
additional Profiles.
33
Page 50

OneTouch AT and OneTouch AT G2
User Manual
1 Tap the TOOLS icon on the HOME screen.
2 Tap the Setup Wizard button.
Connect to the Management Port
Connect a cable from your network to the RJ-45 Ethernet
connector at the lower left side of the analyzer, next to the
power connector. After making the connection, tap the NEXT
button.
Handling Management Port Connection Problems
If you get an error message stating that the OneTouch Internet
connection was not established, follow these steps to
troubleshoot the problem.
Proxy Server
If a network connection was established at the management port
but the analyzer could not reach the Link-Live Cloud site on the
Internet, the next screen displayed will give you the opportunity
to specify a proxy server.
Ensure that the management port received an IP address
1 Exit the Setup Wizard.
2 Tap the TOOLS icon on the HOME screen.
34
Page 51

Chapter 2: Setup Wizard
3 Scroll down to the Maintenance Tools section, and tap the
Management Port button.
Figure 17. Management Port Button in TOOLS Menu
4 Ensure that the management port has an IP address, as shown
below.
Figure 18. Management Port IP Address
35
Page 52

OneTouch AT and OneTouch AT G2
User Manual
If a static IP address is required
If your network requires you to assign a static IP address for the
OneTouch analyzer’s management port:
1 From the HOME screen, tap the TOOLS icon .
2 Scroll down to the Maintenance Tools section, and tap the
Management Port button.
3 Tap the Wired button.
4 Tap STATIC on the Address button and set the address.
Setting up the Cloud Service
Next, the Cloud Service Setup screen is displayed, and the
analyzer guides you through setting up the Cloud Service.
Follow the on-screen prompts.
For more information, see the following sections:
“Working with the Setup Wizard” on page 33
“Setting Up and Accessing the Cloud Service” on page 360
“Handling Management Port Connection Problems” on
page 34
Configuring the Analyzer’s Settings and Tests
Next, the Setup Wizard guides you through configuring network
settings and tests, and storing them in a Profile.
A Profile contains various test, network, and security settings that
are used when you run AutoTest.
Essentially, a profile is similar to a script that runs when you tap
the AutoTest button. Profiles are the foundation of consistent,
standardized testing.
You can create multiple Profiles for performing specific sets of
tests. For example, you may want to create Profiles to test
36
Page 53

Chapter 2: Setup Wizard
Configuring the Analyzer’s Settings and Tests
connectivity and performance for specific buildings on a site,
specific departments within a business, or specific clients.
The first three sections of the Setup Wizard guide you through
configuring the OneTouch AT analyzer to operate on your
network. The sections are:
Wired network settings
Wi-Fi network settings
SNMP configuration (Analysis)
The next sections let you set up network infrastructure/services
tests.
DHCP server response time limit
DNS server response time limit
The last sections of the Setup Wizard let you set up network
connectivity, infrastructure/network services, network
performance, and application and protocol performance tests.
These are referred to as User Tests, and they are shown as icons
on the Test Tiers (see page 21) on the HOME screen.
Ping (ICMP)
Connect (TCP)
Web (HTTP)
File (FTP)
Wired Performance
Wi-Fi Performance
Multicast (IGMP)
Video (RTSP)
Email (SMTP)
The entire configuration is stored in a Profile that you can easily
recall and use. See Chapter 6: "Profiles," beginning on page 161.
37
Page 54

OneTouch AT and OneTouch AT G2
User Manual
You can exit the Setup Wizard at any time before saving a Profile
by selecting the EXIT button . Partially completed Profiles
are not saved. You can re-start the Setup Wizard later, as
described on page 33.
Network Connectivity - Wired
The first configuration section of the Setup Wizard is Wired
Network Connectivity. Here you can configure your network
settings for a wired connection, e.g. speed/duplex, PoE, and
network address.
For more information about wired network configuration, see
“Analysis” on page 253.
To manually configure your wired network settings without using
the Setup Wizard:
1 Tap TOOLS at the bottom left corner of the HOME screen.
2 Select Wired from the list.
Network Connectivity - Wi-Fi
In the next section, you can configure your Wi-Fi network
settings, e.g. RF bands, SSID security, and network address. For
information about W-Fi network configuration, see “Establish a
Wi-Fi Connection” on page 48.
To manually configure Wi-Fi settings without using the Setup
Wizard:
1 Tap TOOLS at the bottom left corner of the HOME screen.
2 Select Wi-Fi from the list.
Infrastructure Analysis/Network Services
This portion of the Setup Wizard allows you to configure your
network’s SNMP community strings to allow in-depth network
analysis. For additional information about Network Analysis
configuration, see “Analysis” on page 253.
38
Page 55

Chapter 2: Setup Wizard
Configuring the Analyzer’s Settings and Tests
Note
Configuring SNMP community strings enables
additional network analysis and troubleshooting
tools. The additional information is included in device
configuration, system group information, and switch/
router multiport statistics.
To manually configure your network’s SNMP settings without
using the Setup Wizard:
1 Tap TOOLS at the bottom left corner of the HOME screen.
2 Select Analysis from the list.
Network Performance
This Setup Wizard section lets you:
Set the response time limit for your DHCP server test
Specify a name to look up and response time limit of your
DNS server test.
For information about the DHCP server test, see page 95, and for
DNS test details, see page 99.
To manually configure your network’s DHCP or DNS test settings
outside of the Setup Wizard:
1 On the HOME screen, tap the DHCP icon or the DNS
icon .
2 Select the SETUP tab.
Application and Protocol Performance
This section of the Setup Wizard lets you add User Tests to the
Profile. The list of User Tests is shown on page 37. User Tests can
verify performance of common applications and protocols
running on your network.
A brief description of each User Test is shown on-screen along
with its typical use. You can create multiple User Tests of each
type.
39
Page 56

OneTouch AT and OneTouch AT G2
User Manual
For
detailed
, step-by-step instructions for adding a User Test
without using the Setup Wizard, see “Adding User Tests” on
page 43.
For
general
instructions on adding user tests without using the
Setup Wizard, see Chapter 5: "User Tests," beginning on page
103.
40
Page 57

Chapter 2: Setup Wizard
Configuring the Analyzer’s Settings and Tests
Setup Wizard Completion
After completing the last configuration section, the Setup Wizard
asks you to save your new Profile. The new Profile is loaded and
ready to use on your OneTouch analyzer.
Now you are ready to run AutoTest and view the results.
Continue to the next chapter.
41
Page 58

OneTouch AT and OneTouch AT G2
User Manual
42
Page 59

Chapter 3: Basic Operation
WWarningX*
Before you use the analyzer, read the safety
information that starts on page 3.
This chapter provides instructions for:
Adding a User Test to the HOME screen (detailed instructions)
Connecting to a network
Running AutoTest and viewing the results
Using and customizing the HOME screen
Adding User Tests
User tests are tests that you create to test specific functionality of
your network.
The following example explains how to add a Connect (TCP) user
test to the HOME screen. Other user tests can be added by
performing similar steps.
You can also add user tests from a Wired Analysis screen as
described in “Wired Analysis Tools” on page 177.
Add a TCP Test to the Home Screen
You can add user tests to any of the three tiers on the HOME
screen. The tiers provide a framework for you to organize the
tests according to the network’s structure.
43
Page 60

OneTouch AT and OneTouch AT G2
Touch and hold
white space
User Tests are
on the three
Test Tiers
Network
Infrastructure
Tests
User Manual
The Connect (TCP) test performs a TCP port open to the selected
target to test for application port reachability using a TCP SYN/
ACK handshake.
1 To add a Connect (TCP) user test, touch and hold any white
space on a test tier of the Home screen. For this exercise,
touch and hold white space on the top tier.
44
Figure 19. The Home Screen
Page 61

Chapter 3: Basic Operation
The SETUP tab
is selected
Server
button
The ADD TEST screen is displayed.
Figure 20. ADD TEST Screen
2 Tap Connect (TCP). The test’s screen opens with the SETUP tab
selected.
Figure 21. Connect (TCP) Test Setup Screen
45
Page 62

OneTouch AT and OneTouch AT G2
User Manual
3 Tap the TCP Server button. A context sensitive keyboard is
displayed.
Figure 22. URL Keyboard
4 At the top of the screen, tap the URL button.
The keyboard changes based on the type of information
to be entered (e.g. IPv4 address, IPv6 address, URL).
Shortcut buttons (e.g. “www.” and “.com”) on the
keyboard help you to enter information quickly and
easily.
5 Tap the www. button.
6 Type enterprise.netscout using the keyboard keys.
7 Tap the .com button.
8 Tap the DONE button.
9 The Name button allows you to assign a custom name to a
test. The test’s name appears under the test’s icon on the
HOME screen and in OneTouch Reports. For your convenience,
the OneTouch analyzer automatically names the test based on
the URL or IP address. Tap the Name button if you want to
change the name.
46
Page 63

Chapter 3: Basic Operation
Connect to a Network
10 The Port button lets you specify the TCP port number on
which the connection will be established. For this test do not
change the port from the default, which is port 80 (HTTP).
11 The Time Limit button lets you choose the amount of time
allowed for the test to complete. If the test doesn’t complete
in the allowed time, it will fail. Set the time limit to 10
seconds.
12 Count specifies the number of three-way handshakes that will
be completed. Set Count to 1.
13 The Proxy control lets you specify a proxy server through
which the TCP requests can be routed. If your network uses a
proxy server, tap the Proxy button, tap On, and set the
server’s address and port. Otherwise, continue to the next
step.
14 Press the key to return to the HOME screen.
When you add a user test, an asterisk appears after the Profile
name to indicate that it has been changed, but not yet saved.
See also: Chapter 6: "Profiles," beginning on page 161.
Connect to a Network
You can connect the OneTouch analyzer to a network via
network Port A, or via the optional built-in Wi-Fi adapter. To
purchase options, contact NETSCOUT. See page 6 for contact
information.
If Ethernet connections are available at both the fiber and copper
network ports, the analyzer uses the fiber port.
Network Port B is used for VoIP analysis and the optional packet
capture feature.
Establish a Wired (Copper) Connection
Connect an appropriate cable from the OneTouch analyzer’s
network Port A to the network that you want to test.
47
Page 64

OneTouch AT and OneTouch AT G2
User Manual
If you need to change the default wired connection
configuration:
1 Tap the Tools icon .
2 Tap the Wired button.
3 Set appropriate parameters for your network. See your
network administrator for details. See also: “Wired” on
page 248.
Establish a Fiber Connection
Install or Remove the SFP Fiber Adapter
To install an SFP Fiber adapter, remove the protective cap from
the adapter and slide the adapter into SFP Port A. To remove,
gently pull the SFP’s bail. If the SFP has retention tabs, press and
hold the tabs on the sides of the adapter and pull it from the fiber
port.
The OneTouch analyzer supports 100BASE-FX and 1000BASE-X
SFP adapters.
Establish a Wi-Fi Connection
This section applies to OneTouch analyzers with the optional
Wi-Fi feature.
By default, the OneTouch analyzer scans for Wi-Fi networks, but it
does not connect to any network until it is configured to do so.
To connect to a Wi-Fi network:
1 Press the
2 Tap the TOOLS icon .
48
key on the front panel.
Page 65

Chapter 3: Basic Operation
3 Tap the Wi-Fi button under Test Settings.
Connect to a Network
Figure 23. Wi-Fi Test Settings Screen
4 Ensure that Enable Wi-Fi is On.
5 Using the Band button, select operation in the 2.4 GHz band,
the 5 GHz band, or both.
6 Set Enable Connect to On. When Enable Connect is set to Off,
the OneTouch analyzer will perform Wi-Fi analysis (as
described on page 193), but it will not connect to a Wi-Fi
network.
49
Page 66

OneTouch AT and OneTouch AT G2
User Manual
7 Tap the SSID button and select an SSID from the list. Or, if you
want to connect to a network that is hidden (not
broadcasting its SSID), tap the ADD SSID button.
8 Tap the back button .
9 Tap the Security button and enter the selections that are
appropriate for your network. TLS EAP types require a
certificate for authentication. For more information on EAP
security types and instructions for importing certificates, see
page 248. The process is the same for Wi-Fi and wired.
10 Tap the Address button if you want to enter a static IP
address, enable IPv6, or change the analyzer’s MAC. These
options are described on page 249. The options are the same
for the analyzer’s Wi-Fi and wired test ports.
11 For OneTouch AT G2 only: The Roaming Threshold determines
the signal level at which the driver begins searching for an
alternate access point with a better signal. Tap the left or
right toggle buttons to adjust the threshold for your needs.
The default is -75 dBm.
12 You do not need to tap the Authorization Default button at
this time. This feature is described in “Authorization Status
Tool and Default Setting” on page 235.
13 The Transmit Probes setting is on by default. If you want the
analyzer to be silent on Wi-Fi, set Transmit Probes to off. For
details, see “Wi-Fi Analysis” on page 196.
50
Page 67

Chapter 3: Basic Operation
Connect to a Network
14 The Signal Adjustment button allows you to customize the
OneTouch analyzer signal level by channel to meet the testing
needs of your specific Wi-Fi network and client environments.
Tap the Signal Adjustment button to open the Signal Offsets
screen.
Figure 24. Signal Offsets Screen with Channel Selected
15 If you want to change the signal offsets, use the toggle
button to select entire bands or individual channels to
configure, and then use the arrow buttons to set the dB as
needed.
16 Tap the back button .
51
Page 68

OneTouch AT and OneTouch AT G2
User Manual
17 The Noise Floor Adjustment button allows you to customize
the OneTouch analyzer noise floor by channel to meet the
testing needs of your specific Wi-Fi network and client
environments. Tap the Noise Floor Adjustment button to
open the Signal Offsets screen.
Figure 25. Noise Offsets Screen with Bands Selected
18 If you want to change the noise offsets, use the toggle button
to select entire bands or individual channels to configure, and
then use the arrow buttons to set the dB as needed.
19 Tap the back button .
20 Press the
key on the front panel.
Run AutoTest
AutoTest provides a comprehensive test of network
infrastructure, along with user-defined tests.
The OneTouch analyzer does not initiate any link, user test, or
infrastructure test activity until you run AutoTest.
Tap the AutoTest button (located at the lower-right corner
of the HOME screen) or press the AutoTest key
the front panel). The OneTouch analyzer will:
Link on active ports (wired and/or Wi-Fi ports)
52
(located on
Page 69

Chapter 3: Basic Operation
Run AutoTest
Obtain IP addresses
Run Network Infrastructure Tests (listed on page 69)
Run User Tests (including the Connect (TCP) user test that
you just created)
When multiple user tests are present, they are run
consecutively, starting with the lower-left test on the
bottom test tier and finishing with the upper-right test on
the top test tier.
You can capture traffic to and from the analyzer during AutoTest.
See “AutoTest Capture” on page 337.
Icons Indicate Test Status
When AutoTest begins, the AutoTest button changes to a
stop button . Tap the stop button if you want to stop AutoTest
before it completes. You can also stop AutoTest by pressing the
AutoTest key
As AutoTest runs, each user test icon changes to indicate its
status.
.
The test has not started. The icon is faded.
The test is in progress.
The test passed.
The test failed.
The Connect (TCP) test is complete when its icon is marked with
the green check mark to indicate it passed, or the red X to
indicate it failed.
53
Page 70

OneTouch AT and OneTouch AT G2
Shortcut Bar
Tap a test’s icon
to view detailed
test results.
User Manual
The shortcut bar’s background is black until AutoTest completes.
When AutoTest completes the shortcut bar’s background turns
green if all tests pass, or red if any test fails.
View the Test Results
On the HOME screen, each test’s icon indicates whether the test
passed or failed .
54
Figure 26. HOME Screen After Running AutoTest
Page 71

Chapter 3: Basic Operation
RESULTS
tab is
selected
View the Test Results
View Detailed Test Results
1 Tap the Connect (TCP) test’s icon. The enterprise.netscout.com
Connect (TCP) test screen is displayed with the RESULTS tab
selected.
Figure 27. Connect (TCP) Test Results Tab
Note
Results are shown with IPv6 enabled. To enable IPv6
testing see “Wired” on
A red X indicates a failure.
A pair of dashes indicates that results for a test were not
received.
DNS Lookup is the amount of time it took to resolve the optional
URL into an IP address.
Current shows the amount of time it took to complete the last
TCP connection.
SYN Sent shows the number of SYNs sent by the OneTouch
analyzer.
ACK Received shows the number SYN/ACKs received by the
OneTouch.
page 248
.
55
Page 72

OneTouch AT and OneTouch AT G2
User Manual
ACK Lost shows the number of SYNs for which a SYN/ACK was not
received within the selected time limit.
Minimum is the minimum amount of time it took to establish a
TCP connection.
Maximum is the maximum amount of time it took to establish a
TCP connection.
Average is the arithmetic mean time it took to establish a TCP
connection.
A ping test runs simultaneously with the TCP test. If the TCP test
finishes before the ICMP echo reply packet arrives, dashes will be
displayed for the ping test results. Ping results do not affect the
Pass/Fail status of the test.
Return Code specifies the end-of-test status or an error condition
if encountered.
Below the Return Code, the target servers’ IP and MAC addresses
are displayed. If you specified a target server’s URL, the IP
addresses are supplied by DNS servers.
At the bottom-left corner of the screen, an icon indicates the
test’s status:
A progress spinner indicates the test is in progress.
A green check mark indicates the test passed.
A red x indicates the test failed.
Tap the TOOLS button run path analysis to the target
server, launch a browser against the target server, or Telnet/SSH
to the server. Tap the TEST AGAIN button to re-run the
test.
Add More User Tests
You can add more user tests of any type to the HOME screen.
Touch and hold white space on any of the three user test tiers to
56
Page 73

Chapter 3: Basic Operation
Organize User Tests on the Test Tiers
display the ADD TEST screen. You can touch and hold white space
between existing test icons. Test tiers are shown on page 44.
You can also add user tests from a Wired Analysis screen as
described in “Wired Analysis Tools” on page 177.
Each user test is listed below. Select a test in the list to view its
instructions.
Ping (ICMP) Test (page 105)
Connect (TCP) Test (page 109)
Web (HTTP) Test (page 114)
File (FTP) Test (page 119)
Email (SMTP) Test (page 124)
Wired Performance Test (page 129)
Wi-Fi Performance Test (page 144)
Multicast (IGMP) Test (page 154)
Video (RTSP) Test (page 156)
Organize User Tests on the Test Tiers
User tests are performed starting with the left side of the bottom
tier, progressing from left to right on each tier, ending with the
right-most test on the top tier.
You can use the test tiers to logically group your tests in a way
that is meaningful to you. You can customize the test tier names
to match your logical test grouping.
Rename the Clouds
On the HOME screen, the user test tiers are separated by clouds.
By default, the cloud names are Public/Internet and Private/
Intranet. Tap a cloud to open the cloud’s SETUP and RESULTS
screen. The SETUP tab lets you rename the cloud. The RESULTS
tab provides a summary of the number of tests on the tier above
and the number of tests that failed when AutoTest was run.
57
Page 74

OneTouch AT and OneTouch AT G2
The number of
off-screen tests
is shown.
Tap the chevron to
scroll to the tests that are
currently off-screen.
A green check mark indicates all
off-screen tests passed.
A red x indicates that
one or more off-screen
tests failed.
User Manual
See Off-Screen Tests
1 On the HOME screen, a chevron at the end of a tier
indicates that one or more tests are off-screen.
Figure 28. Seeing Off-Screen Tests
Run a Single User Test Again
You can run or re-run a single test.
1 On the HOME screen, tap the test’s icon.
2 Tap the TEST AGAIN button .
Edit a User Test
To edit a test, tap its icon. Tap the test’s SETUP tab to edit the test
parameters.
After editing a test, if it has been run and results are displayed, an
asterisk (*) is displayed on the RESULTS tab to indicate that the
results are not current. Re-run the test to view current results.
58
Page 75

Chapter 3: Basic Operation
Move, Copy, or Delete a User Test
An asterisk is also displayed after the profile name at the top-left
corner of the HOME screen, to indicate that the test profile has
been changed. See Chapter 6: "Profiles," beginning on page 161.
Move, Copy, or Delete a User Test
Touch and hold the test’s icon on the HOME screen. Four icons
appear at the bottom of the screen.
Tap the stop button to cancel the operation.
Tap the trash can to delete the test.
Tap the copy icon to copy the test. The copied test appears to
the right of the original test.
Tap the move icon, then tap a highlighted destination to
move the test.
If you do not tap one of the Cancel, Delete, Copy, or Move
icons, you can tap a destination on one of the three user test
tiers to move the test.
More About AutoTest
AutoTest is the automatic test feature of the OneTouch AT
analyzer.
AutoTest provides a comprehensive test of network
infrastructure, followed by customizable user tests that you
define.
Network Infrastructure Tests are described on page 63.
User Tests are described on page 103.
When AutoTest runs, the HOME screen is displayed so you can
monitor the overall results. You can tap a test’s icon to view its
RESULTS screen.
59
Page 76

OneTouch AT and OneTouch AT G2
User Manual
When AutoTest completes, the OneTouch analyzer retains its
wired and Wi-Fi connections (link and IP address), and wired
analysis begins.
If “Enable Wi-Fi” is set to “Off,” the OneTouch analyzer will not
connect to an AP, and when AutoTest completes Wi-Fi analysis
(scanning) will begin.
When you run AutoTest again, the following actions occur.
The wired and Wi-Fi links are dropped.
Infrastructure test results, user test results, and wired
discovery results are cleared.
The wired link is re-established.
If the OneTouch analyzer is configured to connect to a Wi-Fi
network, the Wi-Fi link is re-established.
Wired and Wi-Fi IP addresses are requested.
All network infrastructure tests and user tests are re-run.
The shortcut bar (at the top of the screen) turns green to
indicate all tests passed, or red to indicate that one or more
tests failed.
Next Steps
View Other Test Results
To view the results of other tests, return to the HOME screen and
tap the test’s icon.
Run Path Analysis, Browse to, or Telnet/SSH to a Test’s Target Server
To run path analysis to a user test’s target server, launch a
browser against the target server, or Telnet/SSH to the server, tap
the TOOLS button on the test’s RESULTS screen.
The following tests offer these tools:
Gateway Test
60
Page 77

Chapter 3: Basic Operation
Nearest Switch Test
DNS Test
Ping (ICMP) Test
Connect (TCP) Test
Web (HTTP) Test
File (FTP) Test
Video (RTSP) Test
Email (SMTP) Test
See Also:
“Path Analysis” on page 179
“Browse to a Test Target from the HOME Screen” on page 293
“Telnet/SSH” on page 294
Configure the OneTouch Analyzer to Use SNMP
Add SNMP Community Strings/Credentials to allow display of
SNMP-enabled switch and gateway statistics, and enable crosslinking between wired and Wi-Fi device details via the Discovery
Button. See “SNMP” on page 169. See also: page 173 and
page 211 for an explanation of the Discovery Button.
Next Steps
Store Your Test Setup in a Profile
You can save OneTouch analyzer test configurations in Profiles.
See “Profiles” on page 161.
See Wi-Fi Analysis
To see Wi-Fi analysis, tap the Wi-Fi analysis icon . See Chapter
8, "Wi-Fi Analysis."
See IPv6 Results
To see IPv6 test results, enable IPv6 operation and run AutoTest
again. See “Address” on page 249.
61
Page 78

OneTouch AT and OneTouch AT G2
User Manual
Generate a Report
See “Reports” on page 300.
Set Up Remote Control of the Analyzer
See “Remote User Interface and File Access” on page 347.
62
Page 79

Chapter 4: Network Infrastructure
Tests
When you run AutoTest, the network infrastructure tests are
performed to check the overall health of the network. Network
infrastructure test icons are located on the lower half of the
HOME screen.
When the network infrastructure tests complete, your user tests
will run. See “User Tests” on page 103.
Each network infrastructure test is listed below. Select a test in
the list to view its instructions.
OneTouch Instrument, page 63
Cable Test, page 69
Link Test, page 75
PoE Test, page 76
Wi-Fi Analysis, page 82
Nearest Switch Test, page 82
Wi-Fi Network Connect Test, page 86
Gateway Test, page 92
DHCP Server Test, page 95
DNS Server Test, page 99
Wired Analysis, page 102
OneTouch Instrument
Description
Tap the OneTouch instrument icon (located at the bottom of the
HOME screen) to show details of the wired and Wi-Fi network
63
Page 80

OneTouch AT and OneTouch AT G2
User Manual
connections, including addresses, transmit and receive statistics,
errors, and SFP information.
Configuration
Connect the OneTouch analyzer to a wired network, a Wi-Fi
network, or both (see “Connect to a Network” on page 47) and
tap the AutoTest button .
How it Works
The OneTouch analyzer collects and displays connection
parameters such as IP addresses, and monitors and reports on
transmitted and received frames. Received frames with errors are
categorized based on the type of error, and error counts are
shown. If an SFP is installed, its manufacturer, model, type, serial
number, and revision code are shown.
Results
On the HOME screen, the wired IP address is shown to the left of
the OneTouch instrument icon and the Wi-Fi IP
address is shown on the right.
Tap the OneTouch instrument icon to view test results and
statistics gathered from the wired and Wi-Fi connections. The
ONETOUCH results screen has two tabs: one for the wired
connection and another for the Wi-Fi connection.
64
Page 81

WIRED Results Tab
Chapter 4: Network Infrastructure Tests
OneTouch Instrument
Figure 29. Wired OneTouch Results
Address - The details of the analyzer’s wired test port are shown.
The analyzer’s management port IP address is shown (if it is
linked) at the bottom of this section.
Transmit Statistics - The number of bytes, total packets, unicast
packets, multicast packets, and broadcast packets transmitted by
the OneTouch analyzer are shown.
Receive Statistics - The following information is displayed:
65
Page 82

OneTouch AT and OneTouch AT G2
User Manual
Bytes - The total number of bytes received
Packets - The total number of packets received
Unicasts - The total number of unicast packets received
Multicasts - The total number of multicast packets received
Broadcasts - The total number of broadcast packets received
The warning icon appears next to the instrument icon if any of
the following errors are seen.
FCS Errors - This counter increments for each frame received that
has an integral length (8-bit multiple) of 64-1518 bytes and
contains a frame check sequence error.
Undersize Frames - This counter increments each time a frame is
received that is less than 64 bytes in length, contains a valid FCS,
and was otherwise well formed. This count does not include
range or length errors.
Undersize frames may be caused by a faulty or corrupt LAN driver.
Oversize Frames - This counter increments each time a frame is
received that exceeds 1518 bytes (non-VLAN) or 1522 bytes (on a
VLAN), contains a valid FCS, and was otherwise well formed.
In general you should not see oversize frames, though their
presence is not a guarantee that the network is failing. Oversize
frames may be caused by a faulty or corrupt LAN driver.
Fragments - This counter increments for each frame received that
contains an invalid FCS and is less than 64 bytes in length. This
includes integral and non-integral lengths.
Jabbers - This counter increments for each frame that exceeds
1518 bytes in length (non-VLAN) or 1522 bytes (on a VLAN) and
contains an invalid FCS. This includes alignment errors.
Possible causes include a bad NIC or transceiver, faulty or corrupt
NIC driver, bad cabling, grounding problems, and nodes jamming
the network due to above normal collision rates.
66
Page 83

Chapter 4: Network Infrastructure Tests
OneTouch Instrument
A possible solution would be to identify the node(s) that are
sending out excessive errors and replace the defective hardware.
Dropped Frames - This counter increments for each frame that is
received but is later dropped due to a lack of system resources.
Control Frames - This counter increments for each MAC control
frame received (PAUSE and unsupported) from 64 bytes to 1518
bytes (non-VLAN) or 1522 bytes (on a VLAN) in length, with a
valid CRC.
PAUSE Frames - This counter increments each time a PAUSE MAC
control frame is received that is from 64 bytes to 1518 bytes (nonVLAN) or 1522 bytes (on a VLAN) in length, with a valid CRC.
Unknown OP codes - This counter increments each time a MAC
control frame is received that is from 64 bytes to 1518 bytes (nonVLAN) or 1522 bytes (on a VLAN) in length, and contains an
opcode other than PAUSE, but the frame has a valid CRC.
Alignment Errors - This counter increments for each frame
received that is from 64 bytes to 1518 bytes (non-VLAN) or 1522
bytes (on a VLAN) in length, contains an invalid FCS, and is not an
integral number of bytes.
Alignment errors may manifest as an inability to connect to the
network or as intermittent connectivity.
Frame Length Errors - This counter increments for each frame
received in which the 802.3 length field did not match the
number of data bytes actually received (46-1500 bytes). The
counter does not increment if the length field is not a valid 802.3
length, such as an Ethertype value.
Code Errors - This counter increments each time a valid carrier is
present and at least one invalid data symbol is detected.
Carrier Sense Errors - This counter shows the number of times that
the carrier sense condition was lost or was not asserted when
attempting to transmit frames. The count increments at most
once per transmission attempt, even if the carrier sense condition
fluctuates during a transmission attempt.
67
Page 84

OneTouch AT and OneTouch AT G2
User Manual
Wi-Fi Results Tab
Figure 30. Wi-Fi OneTouch Results
Figure 30 shows OneTouch instrument results on the Wi-Fi tab.
Details of the analyzer’s address are shown along with transmit
and receive statistics.
68
Page 85

Chapter 4: Network Infrastructure Tests
Cable Test
Description
This test verifies the integrity of a copper Ethernet cable
connected to the OneTouch analyzer. Additionally, optical power
measurement is available when a fiber cable is used with a DDMcapable SFP.
When you tap the AutoTest button , the OneTouch
analyzer attempts to establish link. If the OneTouch analyzer
cannot establish link, it performs cable test instead.
Copper Cable Test
Configuration and Capabilities
Connect an Ethernet cable to network Port A. The other end of
the cable can be:
Connected to a NETSCOUT WireView™ WireMapper.
This provides the most robust cable test. The OneTouch analyzer:
Determines length
Finds shorts and opens
Tests shield continuity
Finds splits (impedance mismatch, cross-pair short, mis-
wrapping (conductor wrapped to wrong pair))
Identifies a crossover cable
Cable Test
Unterminated (not connected to anything)
The OneTouch:
Determines length
Finds shorts
Finds opens if they are more than 2 m from the far end
69
Page 86

OneTouch AT and OneTouch AT G2
User Manual
Finds splits
Connected to the OneTouch analyzer’s network Port B
The OneTouch analyzer:
Finds shorts and opens
Finds splits
Identifies crossover cables
Attempts to link at 1 Gbps. If it can’t link at 1 Gbps it
attempts to link at 100 Mbps, then at 10 Mbps. Results are
reported on the CABLE Results screen.
Identifies normal or negative pair-wise polarity (e.g. pins
1,2 connected to pins 2,1.)
Results
Run AutoTest, then tap the cable icon on the home screen to view
test results.
The following figures show the results of various analyzer and
cable configurations.
70
Page 87

Chapter 4: Network Infrastructure Tests
HOME
Screen
icon
CABLE Results Screen
Unshielded
cable or
broken shield
HOME
Screen
icon
CABLE Results Screen
The warning icon
indicates that a
crossover cable was
detected.
Cable Test
:
Figure 31. Cable Connected to WireMapper #1
This shows a cable connected to a WireView WireMapper #1. The
broken “S” wire indicates an unshielded cable or a cable that has
a broken shield. The shield’s status does not affect the test’s pass/
fail result.
Figure 32. Shielded Crossover Cable Connected to WireMapper #1
71
Page 88

OneTouch AT and OneTouch AT G2
HOME
Screen
icon
CABLE Results Screen
HOME
Screen
icon
CABLE Results Screen
The results screen
shows which wires
are open or shorted
and the distance
from the OneTouch
analyzer to the cable
fault.
User Manual
Figure 33. Unterminated Cable Connected to Port A
Figure 34. Unterminated Cable with Shorts and Opens
This shows an unterminated cable with shorts and opens
connected to Port A.
72
Page 89

Chapter 4: Network Infrastructure Tests
HOME
Screen
icon
CABLE Results Screen
HOME
Screen
icon
CABLE Results Screen
Figure 35. Cable Connected from Port A to Port B
Cable Test
Figure 36. Cable With Only Two Pairs of Conductors
This shows a cable with only two pairs of conductors connected
from Port A to Port B.
73
Page 90

OneTouch AT and OneTouch AT G2
HOME
Screen
icon
When no cable
is connected,
the cable icon is
not displayed.
User Manual
Figure 37. No Cable Connected
Fiber Cable Diagnostics
The OneTouch analyzer works with fiber cables when connected
via a 100BASE-FX or 1000BASE-X SFP adapter. The fiber cable is
shown in orange on the HOME screen.
Figure 38. Fiber Cable Shown on HOME Screen
When a DDM (Digital Diagnostics Monitoring) capable SFP is
installed in the OneTouch analyzer, receive (Rx) power is
displayed on the HOME screen, along with link speed. Vendorspecific information is displayed on the OneTouch instrument
results screen.
74
Page 91

Chapter 4: Network Infrastructure Tests
Link Test
Description
The analyzer collects and reports link statistics when you run
AutoTest.
Configuration
The OneTouch analyzer automatically configures itself to work
with the port where it is connected.
How it Works
The link test runs when you tap the AutoTest button on
the touchscreen or the AutoTest key
Results
Link results are shown on the LINK tab of the CABLE/LINK/PoE
screen.
on the front panel.
Link Test
Advertised Speed indicates the speed(s) offered by the port where
the analyzer is connected.
Actual Speed is the speed that was negotiated when the analyzer
connected to the network.
Advertised Duplex is the duplex capability of the port.
Actual Duplex is the duplex that was negotiated when link was
established.
Rx Pair is the wire pair on which link negotiation was offered by
the port.
Level indicates whether the voltage level of the link negotiation
signal was normal or low. Communication might not be reliable if
the level is low. If the link level is low, the warning icon appears
next to the cable icon on the HOME screen.
75
Page 92

OneTouch AT and OneTouch AT G2
User Manual
Polarity indicates whether the wires of a pair are swapped. The
analyzer automatically compensates for this condition.
Receive Power indicates the strength of the received signal on the
fiber optic link.
PoE Test
Description
Power over Ethernet (PoE) is a system for supplying electrical
power, along with data, over Ethernet cabling. When connected
to PoE Power Sourcing Equipment (PSE), the OneTouch analyzer
can emulate a Powered Device (PD). The OneTouch analyzer
negotiates and reports the advertised class, unloaded and loaded
voltage, loaded power, and the pairs used to deliver power.
Configuration
To configure the PoE test:
1 Connect Port A of the OneTouch AT analyzer to the network.
2 Ensure that a PoE device is
3 On the HOME screen, tap TOOLS .
4 Tap the Wired button.
5 Tap the Power over Ethernet button.
Enable PoE - This button is used to enable or disable PoE
measurements.
Enable TruePower™ - This button enables or disables the
loaded voltage and power measurements.
Class: The OneTouch analyzer will attempt to negotiate to
the selected class.
76
not
connected to Port B.
Page 93

Chapter 4: Network Infrastructure Tests
PoE Test
When you select class 4 an option is available for
enabling LLDP Negotiation. Most PSE requires LLDP
negotiation for class 4.
How it Works
The PoE test runs when you tap the AutoTest button on the
touchscreen or the AutoTest key
on the front panel.
The OneTouch analyzer requests the selected class (0-4) from the
PSE. Negotiation is performed for the selected class. A PSE’s
power output can be measured up to the limit specified by the
negotiated class using the OneTouch analyzer’s TruePower
feature.
Results
If the voltage is below the PSE type’s minimum, or the delivered
power is below the class’s specified maximum deliverable power,
the test will fail. If the port meets the class’s voltage and power
requirements, the test will pass.
77
Page 94

OneTouch AT and OneTouch AT G2
Maximum
power received
from the PSE
Voltage
User Manual
When you set TruePower to On, the loaded voltage and available
power (up to the class’s maximum) will be displayed. If TruePower
is off, only the unloaded voltage is displayed.
Figure 39. HOME Screen - PoE Test Passed
Figure 39 shows the HOME screen after testing to Class 3 on a
switch port capable of supplying the specified power.
78
Page 95

Chapter 4: Network Infrastructure Tests
PoE Test
Tap the PoE test results on the HOME screen, then tap the PoE tab
to show detailed results.
Figure 40. Detailed PoE Test Results - Test Passed
79
Page 96

OneTouch AT and OneTouch AT G2
User Manual
Figure 41. HOME Screen - PoE Test Failed
Figure 41 shows the HOME screen after setting the OneTouch
analyzer to request Class 4 from a Type 1 switch port. A Type 1
switch cannot supply the power specified by Class 4.
80
Page 97

Chapter 4: Network Infrastructure Tests
PoE Test
Figure 42 shows the CABLE/LINK/PoE results screen after setting
the OneTouch analyzer to request Class 4 from a Type 1 switch
port. A Type 1 switch cannot supply the power specified by Class
4.
Figure 42. Detailed PoE Test Results - Test Failed
81
Page 98

OneTouch AT and OneTouch AT G2
User Manual
Wi-Fi Analysis
Tap the Wi-Fi Analysis icon to analyze 802.11 networks, access
points, clients, and channels. The analyzer can be used for
troubleshooting client connectivity and locating devices.
See Chapter 8: "Wi-Fi Analysis," beginning on page 193 for
details.
Nearest Switch Test
Description
Tap the switch to identify the switch name, model, port and VLAN
of the wired connection. If SNMP is enabled, parameters such as
location, description, contact and up time as well as port receive
and transmit statistics are reported.
Configuration
To display System Group information and Statistics, they must be
available on the network via SNMP and you must configure the
OneTouch analyzer for SNMP. See “SNMP” on page 169.
How it Works
Information is displayed based on its availability via Link Level
Discovery Protocol (LLDP), Cisco Discovery Protocol (CDP), Extreme
Discovery Protocol (EDP), Foundry Discovery Protocol (FDP), and
via SNMP. LLDP, CDP, EDP or FDP is used to identify the nearest
switch, the connected port, the switch’s address, and other
information when available. The OneTouch analyzer uses SNMP
to acquire system group information and packet statistics for the
port where the OneTouch analyzer is connected.
Results
On the HOME screen, a green check mark next to the Near-
82
Page 99

Chapter 4: Network Infrastructure Tests
Nearest Switch Test
est Switch icon indicates that the test passed. A warning icon
next to the Nearest Switch icon indicates that errors or discards were seen, but the test otherwise passed. A red X indicates that the test failed.
When the OneTouch analyzer is connected to an un-powered
switch, the un-powered switch icon is displayed.
In this condition test results vary. Apply power to the switch for
complete test results.
83
Page 100

OneTouch AT and OneTouch AT G2
User Manual
Run AutoTest, then tap the Nearest Switch icon to show the
results. There are two tabs: PORT and STATISTICS.
84
Figure 43. Nearest Switch - PORT Tab
 Loading...