

Page 1
User Guide
iTap 10 GigaBit Port Aggregator
Doc. 800-0058-001 (PUBIPASRXFPU) Rev B, 11/10
Page 2

PLEASE READ THESE LEGAL NOTICES CAREFULLY.
By using a Net Optics iTap 10 GigaBit Port Aggregator you agree to the terms and conditions of usage
set forth by Net Optics, Inc.
No licenses, express or implied, are granted with respect to any of the technology described in this
manual. Net Optics retains all intellectual property rights associated with the technology described in this
manual. This manual is intended to assist with installing Net Optics products into your network.
Trademarks and Copyrights
© 2010 by Net Optics, Inc. Net Optics® is a registered trademark of Net Optics, Inc. iTapTM is a trademark of Net Optics, Inc. Additional company and product names may be trademarks or registered trademarks of the individual companies and are respectfully acknowledged.
Additional Information
Net Optics, Inc. reserves the right to make changes in specications and other information contained
in this document without prior notice. Every effort has been made to ensure that the information in this
document is accurate.
Page 3

iTap 10 GigaBit Port Aggregator
Contents
Chapter 1
Introduction ..................................1
About this Guide ....................................................1
Features ...........................................................1
Support ...........................................................5
Chapter 2
Installing the iTap Port Aggregator ................. 7
Plan the Installation ..................................................7
Unpack and Inspect the iTap Port Aggregator .............................8
Install XFP Monitor Port Modules ......................................8
Rack Mount the iTap Port Aggregator (optional) ..........................9
Connect Power to the iTap Port Aggregator ...............................9
Connect the CLI Interface ............................................10
Congure the iTap Port Aggregator using the CLI .........................12
Connect the iTap Port Aggregator to the Network .........................17
Connect the Management Port to the Network ............................18
Connect a Monitoring Device to the Port Aggregator ......................20
Check the Installation ...............................................21
Chapter 3
Front Panel ..................................23
Display ..........................................................24
Utilization Alarm LEDs .............................................25
Link LEDs ........................................................25
Mode LEDs .......................................................25
Power LEDs ......................................................25
Reset Button ......................................................25
Page 4

iTap 10 GigaBit Port Aggregator
Chapter 4
Using Web Manager ...........................27
Access Web Manager ...............................................27
View System Status .................................................29
View iTap Trafc Statistics ...........................................30
Change iTap Port Aggregator System Conguration .......................31
Chapter 5
Using System Manager .........................35
Install System Manager ..............................................36
Explore System Manager ............................................37
Create a System Manager Group ......................................39
Delete a System Manager Group ......................................40
Add Devices to a System Manager Group ...............................40
Modify an iTap device Name or IP Address ..............................42
Delete an iTap device from System Manager .............................43
View iTap Port Aggregator Information .................................43
Congure an iTap Port Aggregator .....................................45
Appendix A
Specications and Models ......................49
Appendix B
Command Line Interface .......................53
Limitations on Warranty and Liability .............57
Page 5

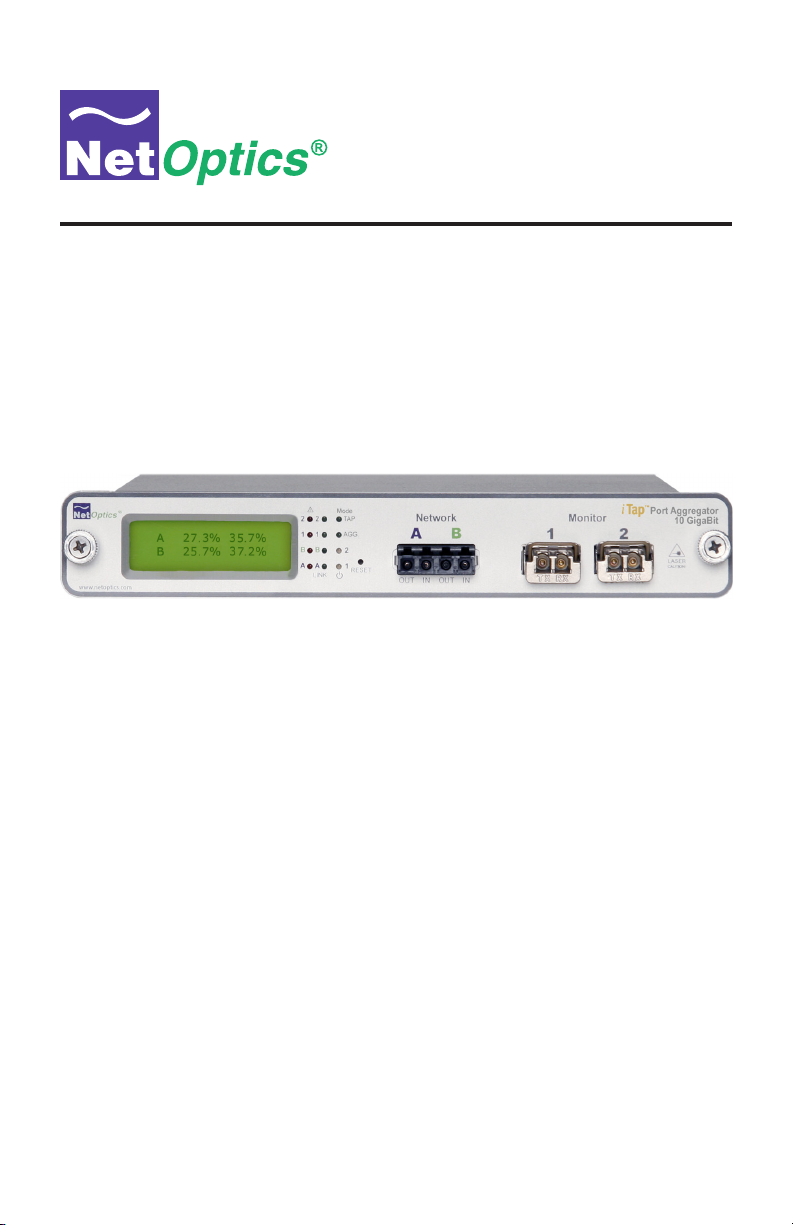
Thank you for purchasing the latest innovation in Tap technology, the iTap
10 GigaBit Port Aggregator (iTap Port Aggregator). This device provides
ultra‑efcient access to critical 10 Gigabit full‑duplex links using only one NIC on
each monitoring tool, and supports two tools simultaneously. In addition, the iTap
feature gives you a quick visual reference of link performance: Bandwidth utilization is monitored and displayed on the front panel and through remote interfaces so
you can see exactly what is happening on both sides of the network link. The iTap
Port Aggregator also features a Tap mode, timestamping, and packet slicing.
About this Guide
This guide describes the installation and use of the following models:
Part Number Description
IPA-SR5-XFP 10 Gig SR Multimode, 62.5µm, In-Line
IPA-50SR5-XFP 10 Gig SR Multimode, 50µm, In-Line
IPA-LR5-XFP 10 Gig LR Singlemode, 8.5µm, In-Line
IPA-ER5-XFP 10 Gig ER Singlemode, 8.5µm, In-Line
iTap 10 GigaBit Port Aggregator
Chapter 1
Introduction
Features
Front Panel Display
The front panel display and alarm LEDs provide a quick visual check that link
utilization levels are not exceeding the capacity of the monitoring device or a
pre-determined threshold. From the display, you can view the current bandwidth
utilization of each side of a full-duplex link, and the monitor ports, along with
the size and time of the peak utilization for each port. After taking action on a
utilization or peak event, you can reset the data from a recessed reset button on the
front panel or remotely. With iTap technology, you have the information and the
access points you need to respond quickly to network events.
1
Page 6

iTap 10 GigaBit Port Aggregator
Performance Aggregation
The iTap Port Aggregator combines and regenerates both directions of a full-duplex
stream, sending all aggregated trafc to two separate monitoring ports. Typically,
full-duplex monitoring with a network tap requires two network interface cards
(NICs) (or a dual channel NIC), one interface for each side of the full-duplex link.
Net Optics’ iTap Port Aggregator enables one or two devices to simultaneously
monitor a full-duplex link using only one NIC per device.
After the trafc has been aggregated to a single ow, it is difcult for the monitoring
tool to distinguish the utilization levels of each side of the bi-directional link. The
iTap Port Aggregator tracks the utilization levels before aggregation, keeping this
vital information easily accessible from its remote and command line interfaces.
Remote Access
The iTap Port Aggregator is accessible from remote interfaces that provide information
and control from anywhere in the network. Web Manager and System Manager
software communicate over the remote interfaces to enable you to remotely set
parameters, view status information, and monitor trafc statistical data. These tools
provide security and performance information including the number of packets
and bytes transferred, and the CRC error count. You can remotely set the alarm
thresholds, clear the trafc data counters, and turn on or off a Monitor Port using a
Web browser and the IP address of the Aggregator. The remote interfaces operate
through a dedicated Management Port that can be connected to the network or
isolated on a dedicated management VLAN for increased security.
Security, Visibility, and Reliability
A monitoring device connected to the iTap Port Aggregator sees all full‑duplex trafc
including Layer 1 and Layer 2 errors. Redundant power connections provide uptime
protection. You have the option of conguring the iTap Port Aggregator so that it will
not show data on the display. You can also turn off the Management Port, thereby
preventing the device from being accessed over the network. In addition, Monitor
Ports can be turned off to prevent unauthorized access to the network link.
Tap Mode
The iTap Port Aggregator can operate as a Port Aggregator (AGG mode) or as a
conventional network Tap (TAP mode). In Tap mode, the device bridges all trafc
between Network Ports A and B, while copying trafc from Network Port A to
Monitor Port 1, and Network Port B to Monitor Port 2.
2
Page 7

iTap 10 GigaBit Port Aggregator
User-dened Maximum Packet Size
The user can set a maximum packet size of 64 to 12,000 bytes for each network port.
If any oversized packets are received (the packet length exceeds the programmed
value), they are counted and discarded. This function enables the iTap Port Aggregator
to pass jumbo packets, but discard packets that are oversized as dened by the user.
Timestamping
When the timestamping feature is enabled, the iTap Port Aggregator replaces
each packet's CRC with a timestamp before it is sent to the monitoring tool. The
timestamp records the exact time that the packet arrived, and which Network Port
it arrived from, so events can be correlated with other data.
The timestamp is a 32-bit value. A 30-bit timer is contained in the lower part of the
timestamp. The timer increments every 6.4 nanoseconds (156 Mhz). The two most
signicant bits indicate the Network Port: 00 means Port A and 10 means Port B.
Optionally, a new CRC can be regenerated and appended to the packet so the
monitoring tool does not see CRC errors due to the changed eld. (See following
section, CRC Regeneration.)
Packet Slicing
Sometimes it is desirable for monitoring tools to see only packet headers and not the
packet payload. For example, when executing a lawful intercept, it may be illegal for
the monitoring tool to read the packet payload. Another reason for passing only the
packet headers is to reduce the bandwidth requirement on the monitor ports.
The iTap Port Aggregator supports this requirement by providing a packet slicing
function. When packet slicing is enabled, a user‑congurable number of bytes at the
beginning of each packet are copied to the monitor ports, and the rest of the packet
is discarded. (Of course, the full packets are always passed between Network Ports
A and B.) Optionally, a new CRC can be regenerated and appended to the packet so
the monitoring tool does not see CRC errors due to the truncated packets. (See
Regeneration
on the following page.)
3
CRC
Page 8

iTap 10 GigaBit Port Aggregator
CRC Sanitizing
The iTap Port Aggregator can be set to drop packets from the monitoring data stream
if they are received with CRC errors. This function can clean up the data being
sent to monitoring tools, or it can be left off so the monitoring tool can see the
packets that have CRC errors. In either case, packets received with CRC errors are
counted and reported in the Port Statistics. All packets are always passed between
Network Ports A and B regardless of CRC errors; this option only affects the trafc
sent out the Monitor Ports. CRC Sanitizing is activated by setting Drop Bad Packet
to ON.
CRC Regeneration
The iTap Port Aggregator can regenerate good CRC check bytes for packets as it
copies them to the Monitor Ports. The four bytes of regenerated CRC are appended
to the packet. For example, if packet slicing is set to 64 bytes, the resulting packet
with CRC Regeneration is 68 bytes at the Monitor Port.
Timestamping and packet slicing inherently create packets with bad CRCs, so use
CRC Regeneration if you don't want the monitoring tool to receive timestamped or
sliced packets with CRC errors.
However, note that CRC Regeneration also converts packets with CRC errors to
good packets before copying them to the monitoring tool. This situation should be
avoided because the monitoring tool won't know the packets were received with
CRC errors. Therefore, whenever CRC Regeneration is ON, it is advisable to turn
on CRC Sanitizing as well, to prevent packets received with CRC errors from going to the Monitor Ports at all.
SNMP Traps
The iTap Port Aggregator transmits SNMP traps for the following events:
• Utilization exceeds the threshold on any port
• Any port link status changes
• Either power supply state changes
4
Page 9

Ease of Use
• Display alternately shows link utilization, the peak utilization, and the time the
• LED indicators show redundant power, link status, Tap or Aggregation mode,
• XFP monitor ports provide increased exibility
• All necessary network and monitor cables are included
• Optional 19-inch rack frame holds up to two iTap Port Aggregators
• Compatible with all major manufacturers’ monitoring devices, including protocol
• Fully RoHS Compliant
Support
Net Optics offers technical support throughout the lifetime of your purchase. Our
technical support team is available from 8 a.m. to 5 p.m. Pacic Time, Monday
through Friday, at +1 (408) 737-7777 and via e-mail at ts-support@netoptics.com.
FAQs are also available on Net Optics web site at www.netoptics.com.
iTap 10 GigaBit Port Aggregator
peak utilization occurred, for all four ports
and utilization alarms
analyzers, probes, and intrusion detection/prevention systems
5
Page 10

Page 11

iTap 10 GigaBit Port Aggregator
Chapter 2
Installing the iTap Port Aggregator
This chapter describes how to install the iTap 10 GigaBit Port Aggregator.
The procedure follows these basic steps:
• Plan the installation
• Unpack and inspect the iTap Port Aggregator
• Install the XFP modules for the monitor ports
• Rack mount the iTap Port Aggregator (optional)
• Connect power to the iTap Port Aggregator
• Connect the command line interface (CLI) RS232 DB9 port
• Congure the iTap Port Aggregator parameters using the CLI
• Connect to network devices
• Connect the Management Port to the network
• Connect to monitoring devices
• Check the installation
After the iTap is installed, you can remotely monitor and control the iTap from
Web Manager or System Manager.
Plan the Installation
Before you begin the installation of your iTap, determine the following:
• IP address of the iTap Port Aggregator or, for multiple iTaps, a range of
IP addresses; Web Manager and System Manager connect at this address
• Net Mask for the iTaps
• IP address of the remote management console, if deployed over a WAN; this
address is used for SNMP traps
• Gateway to the remote management console, if deployed over a WAN
Also make sure you have a suitable location to install the iTap. For fault-tolerant
power redundancy, use two independent power sources.
7
Page 12
iTap 10 GigaBit Port Aggregator
Unpack and Inspect the iTap Port Aggregator
Unpack the iTap Port Aggregator and check for damaged or missing parts. The
iTap ships with the following:
• iTap 10 GigaBit Port Aggregator
• Two power supplies with cords
• iTap 10 GigaBit Port Aggregator Quick Install Guide (one sheet)
• iTap Software CD
• iTap 10 GigaBit Port Aggregator User Guide (this document, on the iTap Soft-
ware CD)
• Network and monitor cables
• RS232 DB9 cable for use with the CLI
• Extended Warranty if purchased
You may have also ordered rack unit panel for rack mounting the iTap. Carefully
check the packing slip against parts received. If any part is missing or damaged,
contact Net Optics' Customer Service immediately at +1 (408) 737-7777.
(Note: XFP modules are ordered and shipped separately.)
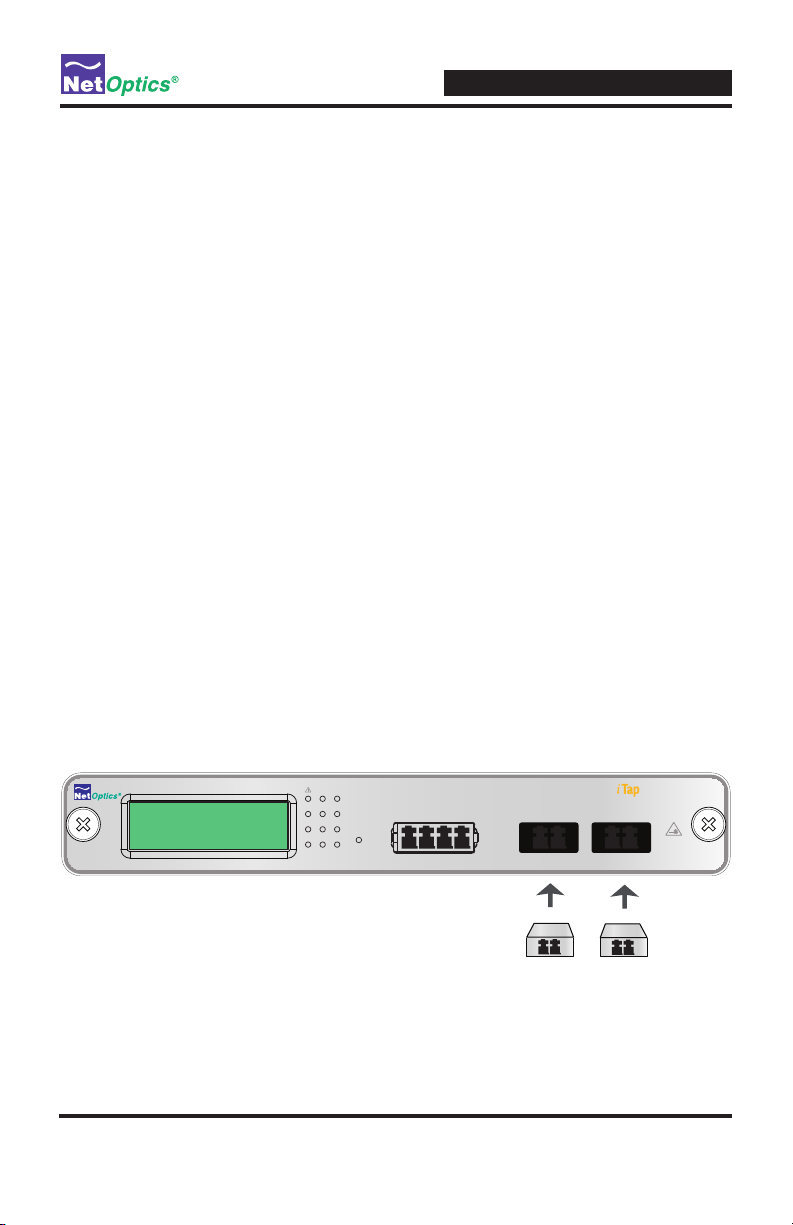
Install XFP Monitor Port Modules
XFP modules are shipped separately. Remove the temporary plugs from the iTap
Port Aggregator monitor slots and insert the XFP modules as shown below, until
they click into place. The photograph on the cover of this Guide shows properly
installed XFPs.
www.netoptics.com
Figure 1: Installing XFPs
Mode
TAP
2
2
AGG.
1
1
B
B
2
A
A
1
RESET
LINK
Network Monitor
A B 1 2
OUT OUTIN IN OUT IN OUT IN
TM
Port Aggregator
10 GigaBit
LASER
CAUTION!
8
Page 13
iTap 10 GigaBit Port Aggregator
Rack Mount the iTap Port Aggregator (optional)
The iTap is designed for rack mounting in a two-slot, 19-inch panel. The mounting
panel occupies one rack unit (1U).
To rack mount the iTap Port Aggregator:
1. Attach the two-slot panel to your rack using the attached thumbscrews.
2. Slide the iTap into one of the slots and secure with the attached thumbscrews.
3. Make sure that the rack is properly grounded.
The iTap can also be placed on a surface using the supplied pads.
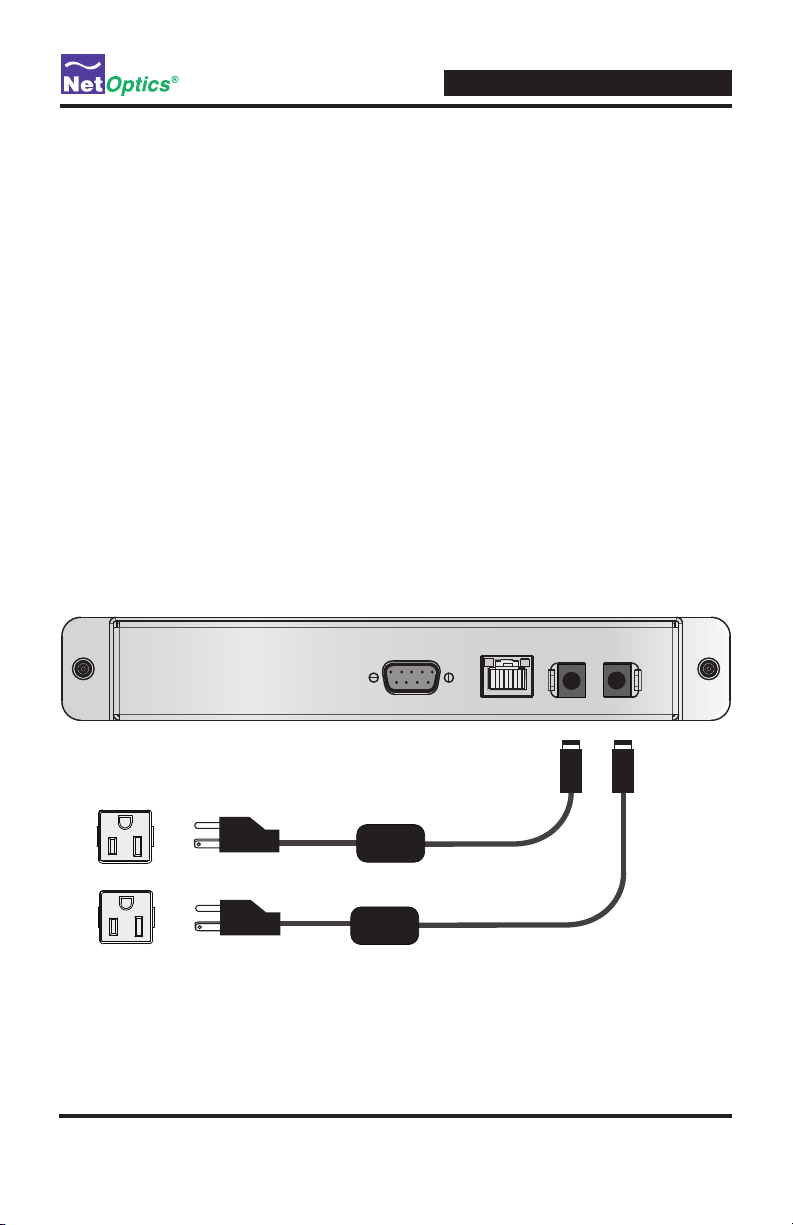
Connect Power to the iTap Port Aggregator
Connect the power supplies on the back of the unit. If you are using redundant
power, make sure that you connect the power supplies to two separate, independent power sources. One or both of the Power LEDs on the front panel should
illuminate, depending on whether you used one power supply or two.
Figure 2: Connecting Power
RS232
9
Management
Port
Page 14
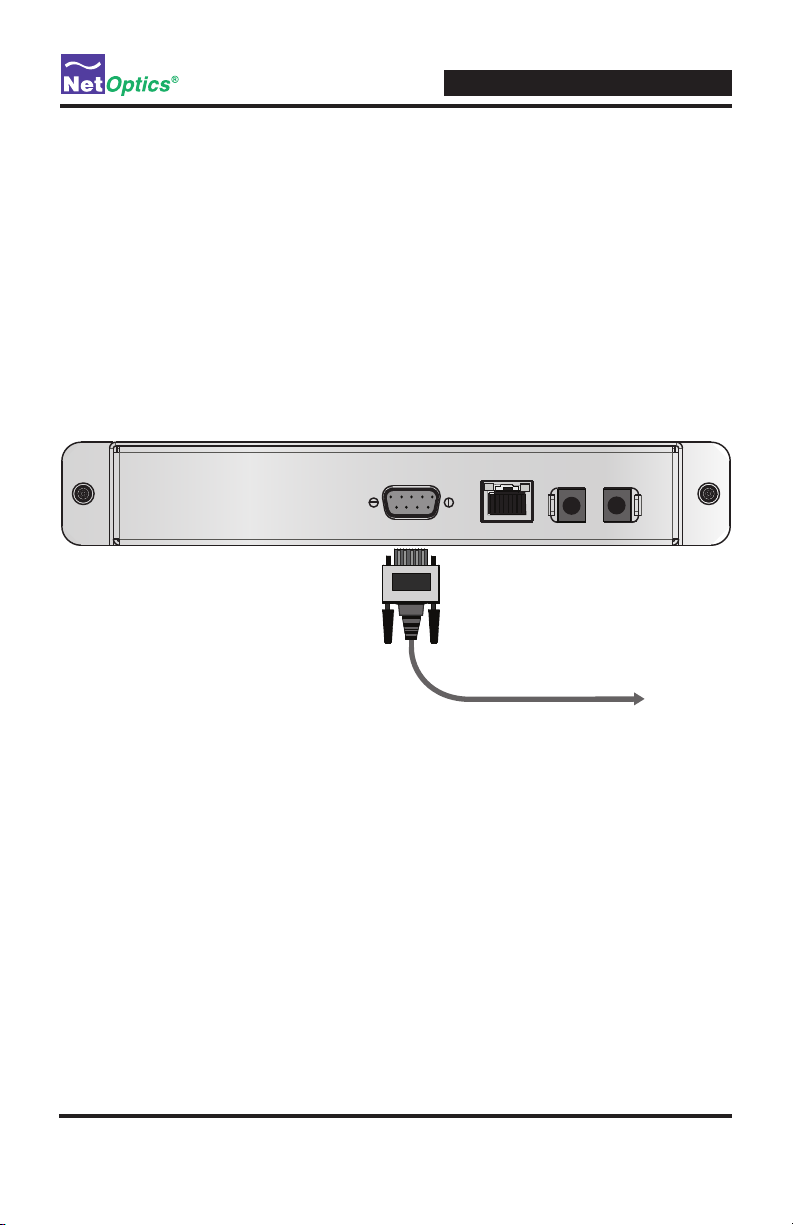
Connect the CLI Interface
All conguration options, status, and statistics can be accessed using the device's
Command Line Interface (CLI). To use the CLI, connect a DB9 cable from the
RS232 port on the back of the iTap to your computer.
Your computer needs to have terminal emulation software such as HyperTerminal to
access the iTap CLI over the RS232 cable.
To connect the CLI:
1. Connect a PC with terminal emulation software, such as HyperTerminal, to the
iTap using the RS232 DB9 cable supplied with the iTap.
iTap 10 GigaBit Port Aggregator
Figure 3: Connecting RS232 Cable to iTap
2. Launch terminal emulation software and set communication parameters to:
19200 baud
8 data bits
No parity
1 stop bit
No ow control
RS232
Management
Port
To computer with
terminal emulation software
10
Page 15

iTap 10 GigaBit Port Aggregator
3. The Net Optics CLI banner and login prompt appear in the Terminal Emulation
software (see following gure). Enter the username at the login prompt. The
default username is netoptics.
*************************************
* Net Optics Command Line Interface *
*************************************
login: netoptics
password:
Figure 4: CLI login prompt
4. Enter the password. The default password is netoptics. The "NetOptics:" prompt
is displayed.
*************************************
* Net Optics Command Line Interface *
*************************************
login: netoptics
password: netoptics
Password Accepted
NetOptics:
Figure 5: CLI default password and the "NetOptics:" prompt
11
Page 16

iTap 10 GigaBit Port Aggregator
Congure the iTap Port Aggregator using the CLI
You should be logged into the iTap Port Aggregator CLI. The factory-set default
values for this iTap Port Aggregator are:
Username: netoptics
Password: netoptics
IP Address: 192.168.1.2
Netmask: 255.0.0.0
Display: ON
Management Port: ON
RX Threshold A: 50%
RX Threshold B: 50%
TX Threshold 1: 50%
TX Threshold 2: 50%
Port 1 Mode: AGG
Port 2 Mode: AGG
Port 1 Enable: ON
Port 2 Enable: ON
Port 1 CRC Regen: OFF
Port 2 CRC Regen: OFF
Port A Max Packet Size: 1518
Port B Max Packet Size: 1518
Port A TimeStamps: OFF
Port B TimeStamps: OFF
Port A Drop Bad Packet: OFF
Port B Drop Bad Packet: OFF
Port A Packet Slice: OFF
Port B Packet Slice: OFF
Port A Slice Size: 64
Port B Slice Size: 64
12
Page 17

iTap 10 GigaBit Port Aggregator
For security reasons, some parameters can only be set with the CLI. A complete
list of CLI commands can be viewed by typing Help at the CLI prompt. It is also
provided in Appendix B. You will now use the CLI to:
• Change the login username and password
• Assign a new IP address
• Change utilization thresholds
• Set the date and time
• View the device settings
• Try out the CLI Help command
• Turn the Management Port off and on
• Turn the front panel display off and on
Your terminal emulator should be displaying the "NetOptics:" prompt as shown here:
NetOptics:
If you do not see the "NetOptics:" prompt, try typing Help followed by the Enter
key. If the prompt is still not displayed, repeat the instructions in the previous section
Connect the CLI Interface.
While the CLI can be used to change all of the device setting, you also can change
most of them later using the Web Manager or System Manager remote interfaces.
(See Chapters 4 and 5).
Change the iTap Port Aggregator Username and Password
To change the username and password:
1. Change the username by entering the following command:
set username <new username>
2. Change the password by entering the following command:
set password <new password>
3. Record the username and password in a secure location.
13
Page 18

iTap 10 GigaBit Port Aggregator
Assign a New iTap Port Aggregator IP Address
Be sure that you have the correct new IP address for the iTap Port Aggregator
before you change the IP address value from the default 192.168.1.2.
To assign a new IP address to the iTap Port Aggregator:
1. Type set ip <new ip address>.
2. Press Enter.
Example: Enter set ip 192.168.1.3 to set the iTap Port Aggregator IP address to
192.168.1.3. Web Manager and System Manager can access the device at this
address. Use set manager <new ip address> to set the address for SNMP traps.
Change Port Utilization Threshold Levels
To change the port utilization threshold levels:
1. Enter set threshold port a <new level> to set a percentage of available band-
width for Port A. Utilization exceeding this limit will trigger an alarm.
Example: Enter set threshold port a 30 to set the alarm threshold level for
trafc received on Port A to 30%.
2. Repeat Step 1 for ports B, 1, and 2.
Set the Current Date and Time
To change the current date and time:
• Enter set time <mm/dd/yyyy-hh:mm:ss> where mm is month, dd is day of the
month, yyyy is year, hh is hour, mm is minutes, and ss is seconds.
Time is based on the 24‑hour clock. This clock is used to record the time of trafc
peak utilization events.
14
Page 19

View Current Settings
To view the current settings:
• Enter show set 1 and show set 2. The CLI displays the current settings; it will
be similar to the example shown on the following page.
NetOptics: show set 1
Model: 10G 62.5um SR Inline
System Time: 05/08/2008 11:29:42
IP Address: 192.168.1.2
Netmask: 255.0.0.0
Manager: 192.168.0.1
Gateway: 10.0.0.1
Port 1 Enable: ON
Port 2 Enable: ON
Display: ON
Management Port: ON
RX Threshold A: 50
RX Threshold B: 50
TX Threshold 1: 50
TX Threshold 2: 50
NetOptics: show set 2
Port 1 Mode: AGG
Port 2 Mode: AGG
Port 1 CRC Regen: OFF
Port 2 CRC Regen: OFF
Port A Max Packet Size: 1518
Port B Max Packet Size: 1518
Port A TimeStamps: OFF
Port B TimeStamps: OFF
Port A Drop Bad Packet: OFF
Port B Drop Bad Packet: OFF
Port A Packet Slice: OFF
Port B Packet Slice: OFF
Port A Slice Size: 64
Port B Slice Size: 64
iTap 10 GigaBit Port Aggregator
Figure 6: Show Set command example
Tip! _____________________________________________________________________
Simply entering show set will display all of the settings at once; however, some of
the settings may scroll off your screen because the list is long.
__________________________________________________________________________
15
Page 20

iTap 10 GigaBit Port Aggregator
Using the CLI Help Command
To view CLI help information:
1. Enter Help at the "NetOptics:" prompt. The list of help topics is displayed.
NetOptics: help
*************************************
* Net Optics Command Line Interface *
*************************************
Usage: "help <variable>"
<variable>:
set - Congure various options.
reset - Reset options.
show - Show current congurations and status.
echo - Turn on or off echoing of characters.
help - This help screen.
NetOptics:
Figure 7: iTap Port Aggregator CLI Help Menu
2. To view the syntax for changing the iTap Port Aggregator conguration parameters, enter help set.
3. Repeat with the command of interest to view the syntax for all commands
available from the CLI. You can also enter a command and one of its
parameters.
Example: Enter help set threshold to see the usage of that command.
For a complete listing of CLI commands, see Appendix B.
Do not disconnect the DB9 cable from the RS232 port yet. You will use it again to
turn the iTap Port Aggregator front panel display on and off.
16
Page 21

iTap 10 GigaBit Port Aggregator
Connect the iTap Port Aggregator to the Network
To connect the iTap to the network:
1. Connect Network Port A to the appropriate network device using the cables
supplied with your iTap.
Mode
www.netoptics.com
To DCE network switch or router
TAP
2
2
AGG.
1
1
B
B
2
A
A
1
RESET
LINK
Network Monitor
A B 1 2
OUT OUTIN IN OUT IN OUT IN
Figure 8: Connecting Ports A and B to the Network
2. Connect Network Port B to the appropriate network device using the cables
supplied with your iTap.
3. Verify that the iTap Network Ports are cabled in-line between two devices.
To DTE network switch or router
TM
Port Aggregator
10 GigaBit
LASER
CAUTION!
17
Page 22

iTap 10 GigaBit Port Aggregator
Connect the Management Port to the Network
To use the remote interfaces you must connect the Management Port on the back
of the unit to the network. You may wish to connect the Management Port on a
dedicated management VLAN for increased security.
To connect the Management Port:
1. Connect a CAT5 or CAT5e cable to the Management Port as shown in the
following gure.
RS232
Figure 9: Connecting the Management Port
2. Connect the other end of the cable to a network switch or hub.
Management
Port
To network switch or hub
18
Page 23

Turn the Management Port Off and On
Check that the Management Port is functional by typing the iTap Port Aggregator
IP address in a Web browser. Net Optics Web Manager should display. If it
does not, check the Management Port cable connections and use the following
procedure to make sure the Management Port is ON.
To turn the Management Port off and on:
1. Enter show set 1 to view the current setting. Management Port should be ON.
Use Web Manager to verify that the Management Port is operational.
2. Enter set mgtport 2. The Management Port turns off.
3. Enter show set 1 to view the current setting. Management Port should be OFF.
Use Web Manager to verify that the Management Port is off; the browser cannot
refresh Web Manager because it cannot communicate with the iTap.
4. Enter set mgtport 1. The Management Port turns on.
5. Enter show set 1 to view the current setting. Management Port should be ON.
Use Web Manager to verify that the Management Port is operational.
Turn the Front Panel Display Off and On
iTap 10 GigaBit Port Aggregator
To turn the front panel display off and on:
1. Enter show set 1 to view the current setting. Display should be ON. Look at the
display to verify that it is on; port utilization statistics should be visible.
2. Enter set display 2. The display turns off.
3. Enter show set 1 to view the current setting. Display should be OFF. Look at
the display to verify that port utilization statistics are not visible. The display
shows "Net Optics, Inc." and the rmware compile date in OFF mode.
4. Enter set display 1. The display turns on.
5. Enter show set 1 to view the current setting. Display should be ON. Look at the
display to verify that port utilization statistics are again visible.
19
Page 24

iTap 10 GigaBit Port Aggregator
Connect a Monitoring Device to the Port Aggregator
The iTap Port Aggregator is delivered with two monitor cables for connecting to
monitoring tools.
To connect the cables to the monitoring devices:
1. Connect Monitor Port 1 to the appropriate monitoring device using the cables
supplied with your unit
2. Connect Monitor Port 2 to the appropriate monitoring device using the cables
supplied with your unit
Mode
TAP
2
2
AGG.
1
1
B
B
2
A
A
1
RESET
www.netoptics.com
LINK
OUT OUTIN IN OUT IN OUT IN
To monitoring device 1
To monitoring device 2
Figure 10: Connecting Two Monitoring Devices
Network Monitor
A B 1 2
TM
Port Aggregator
10 GigaBit
LASER
CAUTION!
20
Page 25

Check the Installation
You have connected the iTap Port Aggregator to the network, to the monitoring
device, and to power. It should now be functioning correctly. Check the status of the
following:
• Check that at least one power LED is illuminated.
• Check the link status LEDs located on the front panel to verify that the links are
connected.
• Check the display for utilization and peak information.
• Verify that the monitoring devices are receiving trafc from the iTap Port
Aggregator.
• Verify that the Management Port is functional by typing the iTap Port Aggregator's
IP address in a Web browser. Net Optics' Web Manager should appear.
iTap 10 GigaBit Port Aggregator
21
Page 26

Page 27

iTap 10 GigaBit Port Aggregator
Chapter 3
Front Panel
This chapter describes how to interpret and work with the front panel features of
the iTap Port Aggregator. The following topics are covered:
• Display
• LED indicators
• Reset Button
Utilization Alarms Mode
Mode
TAP
2
2
AGG.
1
1
B
B
2
A
A
1
RESET
www.netoptics.com
2x16 Character Display
LINK
Link
Power
Figure 11: iTap Port Aggregator Front Panel
The iTap front panel provides information in two ways. The display shows utilization and peak information and the LEDs show device mode, link status, and alarm
conditions. The front panel also has a recessed reset button to clear the peak data.
Reset
Network Monitor
A B 1 2
OUT OUTIN IN OUT IN OUT IN
TM
Port Aggregator
10 GigaBit
LASER
CAUTION!
23
Page 28

Display
iTap 10 GigaBit Port Aggregator
The front panel of the iTap provides port trafc information on a 2x16 character
LCD display. After a boot up message, the display scrolls through the following
four screens.
• Two screens show the Network and Monitor Port current and peak utilizations,
and are displayed for 10 seconds each.
• The other two screens show the times of the peak utilizations, and are displayed
for 5 seconds each.
• On each screen, the top line shows one port and the bottom line shows another.
Display Message Time Description
A XX.X% PP.P%
B XX.X% PP.P%
1 XX.X% PP.P%
2 XX.X% PP.P%
A@ hh:mm:ss
B@ hh:mm:ss
1@ hh:mm:ss
2@ hh:mm:ss
10 sec Percent of Network Port bandwidth being used by
incoming trafc
Line 1 is Port A; line 2 is Port B
XX.X% = Current utilization
PP.P% = Peak utilization
10 sec Percent of Monitor Port bandwidth being used by
outgoing trafc
Line 1 is Port 1; line 2 is Port 2
XX.X% = Current utilization
PP.P% = Peak utilization
5 sec Times of Network Port peak utilizations
Line 1 is Port A; line 2 is Port B
hh:mm:ss = Time in hours : minutes : seconds
5 sec Times of Monitor Port peak utilizations
Line 1 is Port 1; line 2 is Port 2
hh:mm:ss = Time in hours : minutes : seconds
Example: If several peaks occur, the iTap Port Aggregator provides information
(peak utilization and time of peak utilization) on the highest peak event. While
the front panel display shows only the time of the peak events, Web Manager and
System Manager provide dates as well.
If data is not displaying as expected, check the Network Port connectors for link
status and activity. Also check the status of the Display using the CLI. When the
display is in the OFF state, it shows "Net Optics, Inc." and the rmware compile date.
24
Page 29

Utilization Alarm LEDs
Four LEDs indicate that utilization levels have exceeded the threshold. Each LED
is the alarm for one port. For Network Ports, utilization is monitored on incoming
trafc; for Monitor Ports, the outgoing trafc is monitored. When a Utilization
Alarm LED is illuminated, it indicates that the threshold level was exceeded for that
port since the last reset. The LEDs remain illuminated until they are reset using the
reset button or remote interfaces.
Link LEDs
Four LEDs indicate link status. If a good link is established on a port, the LED
corresponding to that port illuminates. The Link LED blinks when trafc is passing
through the port; the intensity of the blinking increases with the utilization; it
becomes noticeable for utilizations of about 30 percent or greater.
Mode LEDs
If the device is in Tap mode, the TAP LED illuminates. If the device is in Aggregation mode, the AGG LED illuminates. (If both mode LEDs are illuminated or both
are off, check that the Mode bits are set to the same value for both Monitor Ports.)
Power LEDs
If the iTap Port Aggregator is deployed with both power supplies, both power
LEDs illuminate when connected to power. If a power LED is off, the corresponding power supply is disconnected or not functioning.
iTap 10 GigaBit Port Aggregator
Reset Button
Press the Reset button to reset the trafc peaks and times on the display, and the
Utilization Alarm LEDs. To prevent accidental resets, the Reset button is recessed
into the front panel. To push the Reset button, use a thin, rigid tool such as a paperclip.
The trafc peak and time can also be reset using the CLI or remote interfaces.
25
Page 30

Page 31

iTap 10 GigaBit Port Aggregator
Chapter 4
Using Web Manager
This chapter describes how to monitor and control individual iTap Port Aggregators
using Net Optics Web Manager software.
The iTap Port Aggregator has built-in support for remote control from any computer with an Internet browser and access to the iTap’s IP address. Web Manager
is a browser-based interface that enables you to change settings, view status, and
retrieve data remotely. Web Manager supports all common browsers.
In this chapter, you will learn to:
• Access Web Manager
• View iTap Port Aggregator System Status from Web Manager
• View iTap Trafc Statistics from Web Manager
• Change the iTap Port Aggregator System Conguration from Web Manager
Note: ____________________________________________________________________
To access Web Manager, the Web browser must have a path to the iTap Port
Aggregator Management Port. In addition, the Management Port option in the
CLI must be set to ON. For more information, see
Aggregator Using the CLI.
__________________________________________________________________________
Congure the iTap Port
Access Web Manager
To access Web Manager:
1. Open an Internet browser on your computer.
2. Enter the iTap’s IP address in the URL box and press Enter. The default IP
address is 192.168.1.2. The Web Manager page appears. (See the gure on the
following page.)
27
Page 32

iTap 10 GigaBit Port Aggregator
Figure 12: Web Manager for the iTap 10 GigaBit Port Aggregator
28
Page 33

iTap 10 GigaBit Port Aggregator
The tables in the following sections explain the elds in Web Manager. To save
any changes to the iTap, click Submit Changes at the bottom of the page.
View System Status
Web Manager displays status information about the iTap Port Aggregator and its
ports. System Status UP indicates the iTap is functioning correctly. If the System
Status is DOWN, there is an internal error. For more information, contact Net Optics
Technical Support.
In addition to the System Status, you can view the status of each iTap port and
power supply as shown in the following gure.
Figure 13: iTap System, Link, and Power Status (top part of Web Manager page)
The following table describes the status elds.
Field Name Value Description
System Status UP/DOWN DOWN indicates an internal error; call Net
System Model 10G 62.5um
Port A Link Status UP/DOWN Indicates the state of incoming trafc on Port A
Port B Link Status UP/DOWN Indicates the state of incoming trafc on Port B
Port 1 Link Status UP/DOWN Indicates the state of communication on Port 1
Port 2 Link Status UP/DOWN Indicates the state of communication on Port 2
Power Supply 1
Status
Power Supply 2
Status
SR Inline
ON/OFF Indicates whether the iTap Port Aggregator is
ON/OFF Indicates whether the iTap Port Aggregator is
Optics Customer Service for assistance
Identies the device model
receiving power from Power Supply 1
receiving power from Power Supply 2
29
Page 34

If a link is down, check the cables and power supplies, and make sure the device
on the other end of the link is functioning properly.
View iTap Trafc Statistics
Web Manager displays iTap trafc statistics for both Network Ports and both Monitor
Ports. The statistics for the Network Ports apply to trafc received into the port.
The statistics for the Monitor Ports apply to trafc transmitted out of the port.
iTap 10 GigaBit Port Aggregator
Figure 14: iTap Network and Monitor Port Statistics (middle part of Web Manager page)
The iTap Port Aggregator periodically sends updated statistics to Web Manager. The
statistics can also be updated by refreshing your browser. All counters reect counts
since the last statistics reset; they are 32-bit counters that roll over from their maximum
count (approximately 4.3 billion) to 0, which may happen frequently for the Total Bytes
count. The following table denes the trafc statistics available from Web Manager.
Field Name Description
Peak Rate (%) Highest utilization since last reset
Peak Date & Time When the peak occurred
Current Utilization Rate (%) Utilization level of the port bandwidth
Total Packets Total packets received
Total Bytes Total bytes received
CRC Errors Number of CRC errors
Oversize Packets Number of oversize packets
30
Page 35

iTap 10 GigaBit Port Aggregator
Change iTap Port Aggregator System Conguration
Web Manager has both read‑only and writable elds. Use the writable elds in
the Aggregator System Conguration section to set conguration parameters. To
change a parameter, type the new value into the eld or select it from the list, and
then click Submit Changes at the bottom of the page to send the changes to the
iTap Port Aggregator device.
Note: ____________________________________________________________________
If you receive a message saying that your browser needs to resend the information
when you try to refresh your browser, return to the main Web Browser page by
re-entering the iTap Port Aggregator IP address in the browser's address bar.
Otherwise, you may not see current data when you refresh the browser. This
condition occurs only if you are looking at the "index.zhtml" page (for instance,
http://192.168.1.2/index.zhtml) that comes up after you Submit Changes.
__________________________________________________________________________
Figure 15: iTap Conguration (bottom part of Web Manager page)
31
Page 36

iTap 10 GigaBit Port Aggregator
The following table describes each available conguration option.
Field Name Description
IP Address IP address of the iTap. The default IP address is
Net Mask Displays current Net Mask of the iTap. The default Net Mask
Manager IP Address IP Address of the system management computer running
Gateway IP Address Displays current IP Address of the current WAN Gateway.
Port 1 Enable Select ON to enable the laser for Monitor Port 1.
Port 2 Enable Select ON to enable the laser for Monitor Port 2.
Port A Utilization
Threshold (%)
Port B Utilization
Threshold (%)
Port 1 Utilization
Threshold (%)
Port 2 Utilization
Threshold (%)
Reset Port A Peak
Rate
Reset Port B Peak
Rate
Reset Port 1 Peak
Rate
Reset Port 2 Peak
Rate
Reset Port A
Statistics
Reset Port B
Statistics
192.168.1.2. Change the IP address by typing a new IP address in the text box. This is the address for Web Manager
and System Manager to communicate with the device.
is 255.0.0.0. Change the IP address by typing a new Net
Mask in the text box.
over a WAN. SNMP traps go to this address. Change the IP
address by typing a new IP address in the text box.
Change the Gateway by typing a new IP address in the text
box.
Enter the utilization level that will trigger a threshold alarm
for Port A.
Enter the utilization level that will trigger a threshold alarm
for Port B.
Enter the utilization level that will trigger a threshold alarm
for Port 1.
Enter the utilization level that will trigger a threshold alarm
for Port 2.
Select Yes to reset the Peak data for Port A.
Select Yes to reset the Peak data for Port B.
Select Yes to reset the Peak data for Port 1.
Select Yes to reset the Peak data for Port 2.
Select Yes to zero all counters for Port A.
Select Yes to zero all counters for Port B.
32
Page 37

iTap 10 GigaBit Port Aggregator
Field Name Description
Reset Port 1
Statistics
Reset Port 2
Statistics
Port 1 Mode Select AGG to set Port 1 to aggregation mode.
Port 2 Mode Select AGG to set Port 2 to aggregation mode.
Port 1 Regenerate
CRC
Port 2 Regenerate
CRC
Port A Timestamp Select ON to set Port A to timestamp packets.
Port B Timestamp Select ON to set Port B to timestamp packets.
Port A Drop Bad
Packet
Port B Drop Bad
Packet
Port A Maximum
Packet Size (Bytes)
Port B Maximum
Packet Size (Bytes)
Port A Packet Slicing Select ON to set Port A to packet slice.
Port B Packet Slicing Select ON to set Port B to packet slice.
Port A Sliced
Packet Size (Bytes)
Port B Sliced
Packet Size (Bytes)
Set Date and Time Click this button the view or change the date and time of the
Select Yes to zero all counters for Port 1.
Select Yes to zero all counters for Port 2.
Select TAP to set Port 1 to Tap mode.
Note: Both Monitor Ports must always be set to the same
mode or the device behavior will be undened.
Select TAP to set Port 2 to Tap mode.
Note: Both Monitor Ports must always be set to the same
mode or the device behavior will be undened.
Select ON to set Port 1 to append a regenerated CRC to
each packet.
Select ON to set Port 2 to append a regenerated CRC to
each packet.
Select ON to set Port A to drop packets with CRC errors.
Select ON to set Port B to drop packets with CRC errors.
Enter a value from 64 and 12000 to change the value of the
maximum packet size on Port A.
Enter a value from 64 and 12000 to change the value of the
maximum packet size on Port B.
Enter a value from 64 and 12000 to change the number of
bytes at which the packet received at Port A is sliced when
Port A packet slicing is ON.
Enter a value from 64 and 12000 to change the number of
bytes at which the packet received at Port B is sliced when
Port B packet slicing is ON.
iTap Port Aggregator clock. This clock is used to record the
time of trafc utilization peaks.
33
Page 38

Page 39

iTap 10 GigaBit Port Aggregator
Chapter 5
Using System Manager
This chapter describes how to install and use Net Optics' System Manager, a software tool that provides a central console to manage all the iTap-enabled Net Optics
devices on your network. Using System Manager, you can change settings, view
status, and retrieve data remotely from multiple Net Optics iTap devices.
System Manager is compatible with computers and workstations running Windows
XP, Windows 2000, and Windows 98. Windows Vista is not supported at this time.
In this chapter, you will learn to:
• Install System Manager
• Explore System Manager
• Create a System Manager Group
• Delete a System Manager Group
• Add iTap devices to a System Manager Group
• Modify an iTap device Name or IP Address
• Delete an iTap device
• View iTap Port Aggregator Information
• Congure an iTap Port Aggregator
35
Page 40

Install System Manager
The installation executable le for System Manager is on the CD included with the
iTap device.
To install System Manger:
1. Load the System Manager software CD in the computer's CD drive. The
License Agreement dialog box appears. (If the License Agreement dialog box
does not appear, locate Setup.exe on the CD and double click it.)
iTap 10 GigaBit Port Aggregator
Figure 16: Net Optics System Manager License Agreement
2. After reading the License Agreement, select I Agree and click Next to install
System Manager. The Setup Welcome screen appears.
3. Click Next. The Select Installation Folder dialog box appears.
4. To install in the default folder, make no changes to the path in the Folder: text
box. To install in a different location, either type the path in the Folder: text
box or click Browse to nd another location. To check the space available for
System Manager on the selected drive, click Disk Cost.
5. To limit access to System Manager to the current user of the PC, select Just
Me. To enable access to any user logged into the PC, select Everyone.
6. Click Next. The Conrm Installation dialog box appears.
36
Page 41

iTap 10 GigaBit Port Aggregator
7. To continue the installation, click Next. The Progress dialog box appears. When
the installation is complete, the Installation Complete dialog box appears.
8. Click Close.
System Manager is now installed on your computer and a Net Optics shortcut
icon appears on your desktop.
Explore System Manager
This section describes the features and functions of System Manager. With System
Manager you can:
• Create iTap device groups
• Add and delete iTap devices from the system
• Remotely congure iTap devices
• View trafc utilization and peaks
• View trafc statistics
NOTE: ___________________________________________________________________
To access the iTap Port Aggregator with System Manager, the System Manager
computer must have a path to the iTap Port Aggregator Management Port. In
addition, the Management Port option in the CLI must be set to ON. For more
information, see
__________________________________________________________________________
Congure the iTap Port Aggregator Using the CLI.
To access System Manager:
1. Double click the System Manager icon on your PC desktop. The Net Optics
System Manager login dialog box appears.
2. Enter the System Manager User Name and Password. Net Optics System
Manager opens. The default User Name is netoptics and the default Password
is netoptics.
Tip! _____________________________________________________________________
The System Manager User Name and Password may be different than the CLI
username and password.
__________________________________________________________________________
37
Page 42

iTap 10 GigaBit Port Aggregator
Figure 17: Initial System Manager window
The left side of the window is the System Frame. It displays iTap devices and iTap
Groups as you add them to the system. The right side is the Information Frame. It
displays Conguration and Status information for individual iTap devices.
Tip! _____________________________________________________________________
To use pop-up menu shortcuts, click your right mouse button in the System Frame.
__________________________________________________________________________
38
Page 43

Using the Toolbar
The following gure shows the System Manager toolbar.
Figure 18: System Manager Toolbar
The table below describes the icons found on the toolbar.
Tool Description
New Node Add iTap devices to a group
New Group Create an iTap group
Delete Delete an iTap device from the system
Modify Change the iTap device name, IP address, model, and notes
Refresh Refresh the data display
Admin Change the System Manager User Name and Password
Exit Close Net Optics System Manager
About View information about System Manager
iTap 10 GigaBit Port Aggregator
Create a System Manager Group
You can organize iTap devices into groups for quick access. You must create a
Group before you can add iTap devices to your system.
To create an iTap group:
1. Click New Group in the toolbar. A new group bar appears in the System Frame
as shown in the following gure.
Figure 19: New Group
2. Type the name of the new group and press Enter.
39
Page 44
iTap 10 GigaBit Port Aggregator
Delete a System Manager Group
You can delete groups you have created. However, be aware that all devices in that
group will also be deleted from System Manager.
To delete a Group:
1. Right-click on the group bar of the group you want to delete.
2. Select Delete from the menu. The group and all associated devices are deleted
from System Manager.
Add Devices to a System Manager Group
To view and control iTap Port Aggregators from System Manager, you must rst
add each one to a group. Once you have added an iTap device, you can congure,
modify, and delete it from System Manager.
To add an iTap device to the system:
1. Select the Group to which you want to add an iTap device by clicking the group
bar.
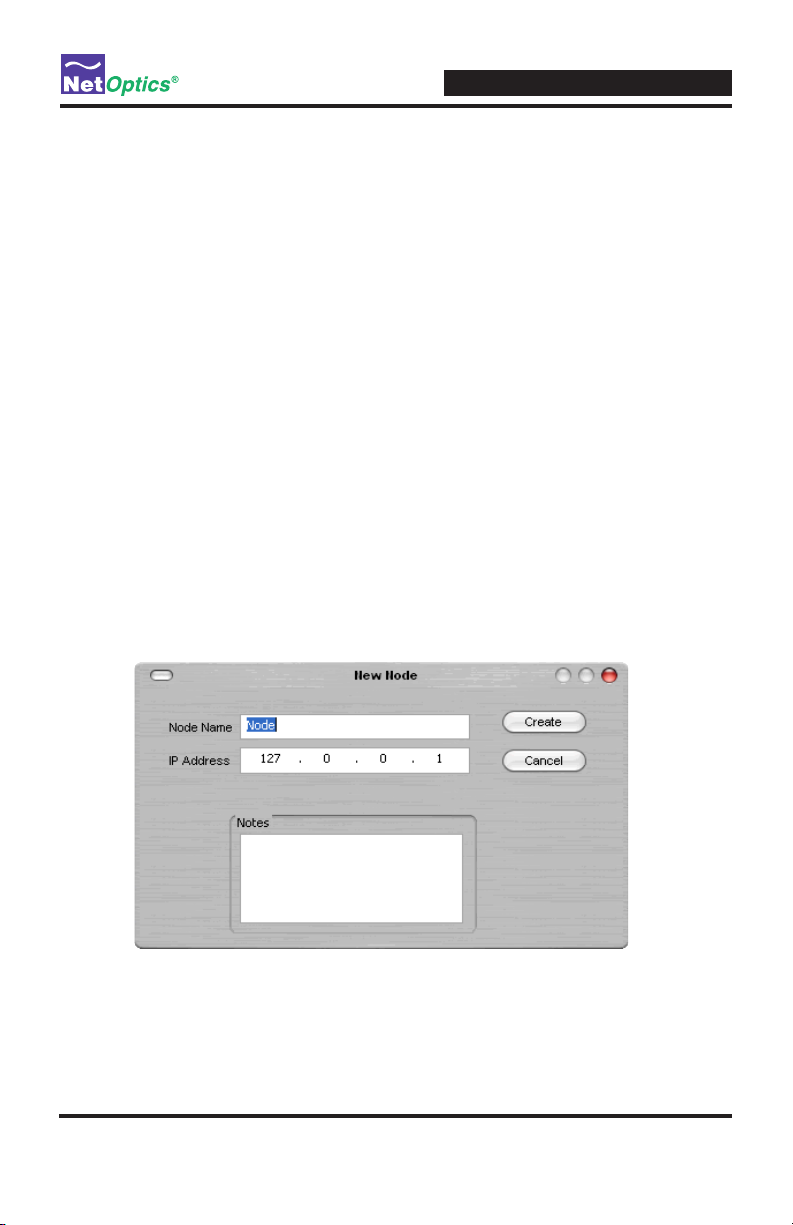
2. Click New Node in the toolbar. The New Node dialog box appears.
Figure 20: Adding a New Device
3. Enter a name for the device you are adding in the Node Name text box. Each
iTap device name in the system must be unique.
40
Page 45

iTap 10 GigaBit Port Aggregator
4. Enter the IP address of the iTap device in the IP Address text box. Be certain
that the IP address is unique on the network.
5. Enter any relevant information about the iTap device in the Notes text box.
6. Check your settings and click Create. The device appears in the System Manger
system frame.
Figure 21: Net Optics System Manager with a device
The indicator to the right of the iTap device picture blinks green when System
Manager is communicating with the iTap device. If the indicator blinks red for
more than a minute, check that the iTap device is connected to the network and
verify the conguration information.
Repeat this procedure for each iTap device you wish to add.
Tip! _____________________________________________________________________
To change the display order of iTap devices, click and drag them into the desired
order.
__________________________________________________________________________
41
Page 46

iTap 10 GigaBit Port Aggregator
Modify an iTap device Name or IP Address
You can change the iTap device name, IP address and Notes from the Modify iTap
dialog box.
To modify the iTap device conguration:
1. Select the device you want to modify by clicking its icon in the System Frame.
2. Click Modify in the toolbar. The Modify Node dialog box appears.
Figure 22: Modify iTap dialog box
3. Make the desired changes and click Save Change.
42
Page 47

iTap 10 GigaBit Port Aggregator
Delete an iTap device from System Manager
When you remove an iTap device from your network, you should delete the
device from System Manager. Otherwise, System Manager will continue to poll the
iTap device’s IP address for data, wasting system resources.
To delete an iTap device from System Manager:
1. Select the device you want to delete by clicking its icon in the System Frame.
2. Click Delete in the toolbar. A conrmation dialog box appears.
3. Click Yes to delete the iTap device from System Manager.
View iTap Port Aggregator Information
System Manager enables you to view the status of the iTap Port Aggregator, the
trafc statistics it collects, and its current device conguration information.
To view iTap Port Aggregator information:
• Select the device you want to view by clicking its icon in the System Frame. A
window similar to the gure on the follow page appears. The Status tab is the
default view.
The Status tab is a read-only list of information from the iTap device. Use the
scroll bar and arrows to view the entire list if it is not all visible on your screen.
43
Page 48

iTap 10 GigaBit Port Aggregator
Figure 23: iTap Port Aggregator Status Tab
TIP! _____________________________________________________________________
Fields that have been updated since the last refresh appear with a circle and arrow
to the left of the value eld. For example, see Power Supply 1 Status in Figure 23.
__________________________________________________________________________
44
Page 49

iTap 10 GigaBit Port Aggregator
The following table describes the status elds.
Field Name Value Description
System Status UP/DOWN DOWN indicates an internal error; call Net
System Model 10G 62.5um
Power Supply 1
Status
Power Supply 2
Status
Link Status UP/DOWN Indicates the state of the communication on the
Peak Rate (%) <number> Highest utilization since last reset
Peak Date & Time mm/dd/
Current Utilization
Rate (%)
Total Packets <number> Total packets received
Total Bytes <number> Total bytes received
CRC Errors <number> Number of CRC errors
Oversize Packets <number> Number of oversize packets
SR Inline
ON/OFF Indicates whether the iTap Port Aggregator is
ON/OFF Indicates whether the iTap Port Aggregator is
yyyy
hr:min:sec
<number> Utilization level of the port bandwidth (incoming
Optics Customer Service for assistance
Identies the device model
receiving power from Power Supply 1
receiving power from Power Supply 2
port
When the peak rate occurred
trafc on Network Ports, outgoing trafc on Monitor Ports)
Congure an iTap Port Aggregator
Use System Manager's Congure tab to set conguration parameters of an iTap
Port Aggregator.
To congure the iTap Port Aggregator:
1. Select the device you want to congure by clicking its icon in the System
Frame.
2. Click the Congure tab. The conguration information appears.
45
Page 50

iTap 10 GigaBit Port Aggregator
Figure 24: iTap Port Aggregator Congure tab
3. Click on the value corresponding to the parameter you wish to congure.
4. Select an option from the drop-down list, or enter a new value from your
keyboard, followed by the Enter key.
5. The new conguration parameters take effect the next time System Manager
polls the iTap Port Aggregator.
46
Page 51

iTap 10 GigaBit Port Aggregator
The following table describes each available conguration option.
Field Name Description
IP Address IP address of the iTap. The default IP address is 192.168.1.2.
Net Mask Displays current Net Mask of the iTap device. The default
Manager IP Address IP Address of the system management computer running
Gateway IP Address Displays current IP Address of the current WAN Gateway.
Port 1 Enable Select ON to enable the laser for Monitor Port 1.
Port 2 Enable Select ON to enable the laser for Monitor Port 2.
Port A Utilization
Threshold (%)
Port B Utilization
Threshold (%)
Port 1 Utilization
Threshold (%)
Port 2 Utilization
Threshold (%)
Reset Port A Peak
Rate
Reset Port B Peak
Rate
Reset Port 1 Peak
Rate
Reset Port 2 Peak
Rate
Reset Port A
Statistics
Reset Port B
Statistics
Change the IP address by typing a new IP address in the
text box. This is the address for Web Manager and System
Manager to communicate with the device.
Net Mask is 255.0.0.0. Change the IP address by typing a
new Net Mask in the text box.
over a WAN. SNMP traps go to this address. Change the IP
address by typing a new IP address in the text box.
Change the Gateway by typing a new IP address in the text
box.
Enter the utilization level that will trigger a threshold alarm
for Port A.
Enter the utilization level that will trigger a threshold alarm
for Port B.
Enter the utilization level that will trigger a threshold alarm
for Port 1.
Enter the utilization level that will trigger a threshold alarm
for Port 2.
Select Yes to reset the Peak data for Port A.
Select Yes to reset the Peak data for Port B.
Select Yes to reset the Peak data for Port 1.
Select Yes to reset the Peak data for Port 2.
Select Yes to zero all counters for Port A.
Select Yes to zero all counters for Port B.
47
Page 52

iTap 10 GigaBit Port Aggregator
Field Name Description
Reset Port 1
Statistics
Reset Port 2
Statistics
Current Date &
Time
Port 1 Mode Select AGG to set Port 1 to aggregation mode.
Port 2 Mode Select AGG to set Port 2 to aggregation mode.
Port 1 Regenerate
CRC
Port 2 Regenerate
CRC
Port A Timestamp Select ON to set Port A to timestamp packets.
Port B Timestamp Select ON to set Port B to timestamp packets.
Port A Drop Bad
Packet
Port B Drop Bad
Packet
Port A Maximum
Packet Size (Bytes)
Port B Maximum
Packet Size (Bytes)
Port A Packet Slicing Select ON to set Port A to packet slice.
Port B Packet Slicing Select ON to set Port B to packet slice.
Port A Sliced
Packet Size (Bytes)
Port B Sliced
Packet Size (Bytes)
Select Yes to zero all counters for Port 1.
Select Yes to zero all counters for Port 2.
The current system time. This clock is used to record the
time of trafc utilization peaks.
Select TAP to set Port 1 to Tap mode.
Note: Both Monitor Ports must always be set to the same
mode or the device behavior will be undened.
Select TAP to set Port 2 to Tap mode.
Note: Both Monitor Ports must always be set to the same
mode or the device behavior will be undened.
Select ON to set Port 1 to append a regenerated CRC to
each packet.
Select ON to set Port 2 to append a regenerated CRC to
each packet.
Select ON to set Port A to drop packets with CRC errors.
Select ON to set Port B to drop packets with CRC errors.
Enter a value from 64 and 12000 to change the value of the
maximum packet size on Port A.
Enter a value from 64 and 12000 to change the value of the
maximum packet size on Port B.
Enter a value from 64 and 12000 to change the number of
bytes at which the packet received at Port A is sliced when
Port A packet slicing is ON.
Enter a value from 64 and 12000 to change the number of
bytes at which the packet received at Port B is sliced when
Port B packet slicing is ON.
48
Page 53

Specications
Electrical
Power Supply Input
Power Supply Output
Environmental
Operating Temperature
Storage Temperature
Relative Humidity
Mechanical
Dimensions
Weight
Indicators
iTap 10 GigaBit Port Aggregator
Appendix A
Specications and Models
100-240VAC, 0.5A, 47-63Hz
12V, 5A
0˚C to 40˚C
‑10˚C to 70˚C
10% min, 95% max, non‑condensing
1.375” high x 11” deep x 8.5” wide
8 lbs (3.6 kg) maximum, bare unit
10 lbs (4.5 kg) maximum, shipping weight
(1) 2x16 Character LCD display
(4) Link LEDs
(4) Threshold Alarm LEDs
(2) Mode LEDS
(2) Power LEDS
49
Page 54

Optical Interface
SR Fiber Types
Corning Multimode 62.5/125μm, wavelength 850nm
Split Ratio Network Port Insertion Loss
50/50 ~ 3.3 dB
Corning Multimode 50/125μm, wavelength 850nm
Split Ratio Network Port Insertion Loss
50/50 ~ 3.3 dB
LR Fiber Type
Corning Singlemode 8.5/125μm, wavelength 1310nm
Split Ratio Network Port Insertion Loss
50/50 ~ 3.3 dB
ER Fiber Type
Corning Singlemode 8.5/125μm, wavelength 1550nm
Split Ratio Network Port Insertion Loss
50/50 ~ 3.3 dB
iTap 10 GigaBit Port Aggregator
Transceiver Specications
SR 850nm, VCSEL
LR 1310nm, laser
ER 1550nm, laser
Monitor Port Output Power (typical)
SR -5.0 dBm
LR -2.5 dBm
ER 0.5 dBm
Split Ratios
50/50
50
Page 55

Software
Command Line Interface
Any terminal emulation software
Net Optics Web Manager
Any browser
Net Optics System Manager
Windows XP, Windows 2000, Windows 98
Certications
Fully RoHS compliant
Models and Part Numbers
Part Number Description
IPA-SR5-XFP 10 Gig SR Multimode, 62.5µm, In-Line
IPA-50SR5-XFP 10 Gig SR Multimode, 50µm, In-Line
IPA-LR5-XFP 10 Gig LR Singlemode, 8.5µm, In-Line
IPA-ER5-XFP 10 Gig ER Singlemode, 8.5µm, In-Line
Note: Span models are also available. See www.netoptics.com.
iTap 10 GigaBit Port Aggregator
51
Page 56

Page 57

iTap 10 GigaBit Port Aggregator
Appendix B
Command Line Interface
Tip! _____________________________________________________________________
The command line interface (CLI) is not case sensitive.
__________________________________________________________________________
Command Sub-Command Syntax Description
Help Set help set Displays the set command
Reset help reset Displays the reset command
Show help show Displays the show command
Echo help echo Displays the echo command
Set IP set ip <address> Where <address> is the
Netmask set netmask
<address>
Gateway set gateway
<address>
Manager set manager
<address>
Threshold Port set threshold
<port ID>
<parameter>
Time set time
<date & time>
Display set display
<parameter>
options
options
options
options
IP address of the iTap for
Web Manager and System
Manager
Where <address> is the IP
address netmask
Where <address> is the IP
address of the gateway
Where <address> is the IP
address of the remote manager for SNMP traps
Where <port ID> is A, B, 1,
or 2 and <parameter> is
0 to 100% of available
bandwidth
Where <date & time> is
mm/dd/yyyy-hh:mm:ss
Where <parameter> is
1 = Front panel display on
2 = Front panel display off
(other values not applicable)
Note: In the OFF state, the
display shows "Net Optics,
Inc." and the rmware
compile date
53
Page 58

iTap 10 GigaBit Port Aggregator
Command Sub-Command Syntax Description
Set
(continued)
Username set username
<username>
Password set password
<password>
Mgtport set mgtport
<parameter>
Enable Port set enable port
<port ID>
<parameter>
Mode Port set mode port
<port ID>
<parameter>
CRCregen Port set crcregen port
<port ID>
<parameter>
Stamp Port set stamp port
<port ID>
<parameter>
Where <username> is the
authorized user's name,
32 characters or less
Where <password> is the
authorized user's password,
32 characters or less
Where <parameter> is
1 = Managment Port on
2 = Management Port off
(other values not applicable)
Where <port ID> is 1 or 2
and <parameter> is
1 = Monitor Port Laser Enabled
2 = Monitor Port Laser Disabled
(other values not applicable)
Where <port ID> is 1 or 2
and <parameter> is
1 = Tap mode
2 = Aggregation mode
(other values not applicable)
Note 1: Both Monitor Ports
must always be set to the
same mode or the device
behavior will be undened.
Note 2: When changing from
Tap to Aggregation mode,
you must change port 2
before you change port 1.
Where <port ID> is 1, or 2
and <parameter> is
1 = CRC regeneration on
2 = CRC regeneration off
(other values not applicable)
Note: CRC regeneration is
helpful to make sliced and
timestamped packets valid
Where <port ID> is A or B
and <parameter> is
1 = Timestamping on
2 = Timestamping off
(other values not applicable)
54
Page 59

iTap 10 GigaBit Port Aggregator
Command Sub-Command Syntax Description
Set
(continued)
Dropbad Port set dropbad port
<port ID>
<parameter>
Psize Port set psize port
<port ID>
<parameter>
Slice Port set slice port
<port ID>
<parameter>
Ssize Port set ssize port
<port ID>
<parameter>
Where <port ID> is A or B
and <parameter> is
1 = Drop packets with CRC
errors
2 = Pass packets with CRC
errors
(other values not applicable)
Note: Applies to CRC errors
as the packet is received at
the Monitor Port
Where <port ID> is A or B
and <parameter> is
64 to 12000
(other values not applicable)
Note: Sets the maximum
packet size; packets larger
than <psize> are discarded
and counted in the oversize
packet counter
Where <port ID> is 1 or 2
and <parameter> is
1 = Packet slicing on
2 = Packet slicing off
(other values not applicable)
Where <port ID> is 1 or 2
and <parameter> is
64 to 12000
(other values turn packet
slicing OFF)
Note: Sets the packet slicing
size; only <ssize> bytes are
passed when packet slicing
is enabled
55
Page 60

iTap 10 GigaBit Port Aggregator
Command Sub-Command Syntax Description
Reset Peak Port reset peak
<port ID>
Statistics Port reset statistics port
<port ID>
Default reset default Resets conguration back to
Show Set show set
<parameter>
Status show status Displays status of iTap
Statistics Port show statistics
port <port ID>
Power show power Displays power status
User show user Displays current user logged
Echo n/a echo <parameter> Where <parameter> is
Where <port ID> is A, B, 1
or 2
Where <port ID> is A, B, 1
or 2
factory defaults:
Port 1 & 2 Enable = ON
Management Port = ON
Port Modes = AGG
Max Packet Sizes = 1518
Port Slice Sizes = 64
All Set 2 features = OFF
Where <parameter> is
1 = Show page 1
2 = Show page 2
[null] = Show pages 1 & 2
Displays currents settings
system and ports
Where <port ID> is A, B, 1, or 2
into the CLI
on = Typed characters are
displayed on the screen
off = Typed characters are
not displayed on the screen
(other values not applicable)
56
Page 61

iTap 10 GigaBit Port Aggregator
Limitations on Warranty and Liability
Net Optics offers a limited warranty for all its products. IN NO EVENT SHALL NET OPTICS, INC.
BE LIABLE FOR ANY DAMAGES INCURRED BY THE USE OF THE PRODUCTS (INCLUDING
BOTH HARDWARE AND SOFTWARE) DESCRIBED IN THIS MANUAL, OR BY ANY DEFECT
OR INACCURACY IN THIS MANUAL ITSELF. THIS INCLUDES BUT IS NOT LIMITED TO LOST
PROFITS, LOST SAVINGS, AND ANY INCIDENTAL OR CONSEQUENTIAL DAMAGES ARISING
FROM THE USE OR INABILITY TO USE THIS PRODUCT, even if Net Optics has been advised of the
possibility of such damages. Some states do not allow the exclusion or limitation of implied warranties or
liability for incidental or consequential damages, so the above limitation or exclusion may not apply to you.
Net Optics, Inc. warrants this Tap to be in good working order for a period of ONE YEAR from the date
of purchase from Net Optics or an authorized Net Optics reseller.
Should the unit fail anytime during the said ONE YEAR period, Net Optics will, at its discretion, repair or
replace the product. This warranty is limited to defects in workmanship and materials and does not cover
damage from accident, disaster, misuse, abuse or unauthorized modications.
If you have a problem and require service, please call the number listed at the end of this section and speak
with our technical service personnel. They may provide you with an RMA number, which must accompany any returned product. Return the product in its original shipping container (or equivalent) insured
and with proof of purchase.
Additional Information
Net Optics, Inc. reserves the right to make changes in specications and other information contained in
this document without prior notice. Every effort has been made to ensure that the information in this document is accurate. Net Optics is not responsible for typographical errors.
THE WARRANTY AND REMEDIES SET FORTH ABOVE ARE EXCLUSIVE AND IN LIEU OF ALL
OTHERS, EXPRESS OR IMPLIED. No Net Optics reseller, agent, or employee is authorized to make any
modication, extension, or addition to this warranty.
Net Optics is always open to any comments or suggestions you may have about its products and/or this manual.
Send correspondence to
Net Optics, Inc.
5303 Betsy Ross Drive
Santa Clara, CA 95054 USA
Telephone: +1 (408) 737-7777
Fax: +1 (408) 745-7719
Email: info@netoptics.com / Internet: www.netoptics.com
All Rights Reserved. Printed in the U.S.A. No part of this publication may be reproduced, transmitted,
transcribed, stored in a retrieval system, or translated into any language or computer language, in any
form, by any means, without prior written consent of Net Optics, Inc., with the following exceptions:
Any person is authorized to store documentation on a single computer for personal use only and that the
documentation contains Net Optics’ copyright notice.
57
Page 62

Page 63

Notes:
iTap 10 GigaBit Port Aggregator
59
Page 64

www.netoptics.com
© 2010 by Net Optics, Inc. All Rights Reserved.
 Loading...