

Page 1

NEC Storage Manager
User’s Manual
IS004-13E
Page 2

© NEC Corporation 2001-2004
No part of the contents of this book may be reproduced or
transmitted in any form without permission of NEC Corporation.
The contents of this book may be modified without notice in the future.
Page 3

Preface
This manual describes the usage of NEC Storage Manager. NEC Storage Manager centrally operates/manages NEC
Storage disk array subsystems connected to server machines. To do so, it manages the configurations and statuses
of the NEC Storage disk array subsystems and issues alert messages according to performance and fault information.
Refer to the “NEC Storage Manager Manual Guide” (IS901) for the overview of NEC Storage and the related
manuals.
Remarks 1. This manual explains functions implemented by the following program products:
• NEC Storage Manager and NEC Storage BaseProduct
2. This manual is applicable to the program products of the following versions:
• NEC Storage Manager Ver3.3
• NEC Storage BaseProduct Ver3.3
3. The NEC Storage Manager is referred to as iSM or Storage Manager in the text of this manual. Also,
the NEC Storage series disk array subsystem is referred to as a disk array.
4. The following descriptions in the text of this manual refer to the corresponding products.
Description Corresponding Product
Storage Manager NEC Storage Manager
BaseProduct NEC Storage BaseProduct
AccessControl NEC Storage AccessControl
CachePartitioning NEC Storage CachePartitioning
DynamicDataReplication NEC Storage DynamicDataReplication
PerformanceMonitor NEC Storage PerformanceMonitor
PerformanceOptimizer NEC Storage PerformanceOptimizer
ReallocationControl NEC Storage ReallocationControl
RemoteDataReplication NEC Storage RemoteDataReplication
RemoteDataReplication/DisasterRecovery NEC Storage RemoteDataReplication/DisasterRecovery
ReplicationControl NEC Storage ReplicationControl
5. The following descriptions in the text of this manual refer to the corresponding manuals.
Description Corresponding Manual
Configuration Setting Tool User’s Manual
(GUI)
Messages Handbook NEC Storage Manager Messages Handbook (IS010)
Data Replication User's Manual (Function
Guide)
Data Replication User's Manual (Installation
and Operation Guide for Windows)
PerformanceMonitor User's Manual
Snapshot User’s Manual (Function Guide)
Manual Guide NEC Storage Manager Manual Guide (IS901)
NEC Storage Manager Configuration Setting Tool
User’s Manual (GUI) (IS007)
NEC Storage Manager Data Replication User's Manual
(Function Guide) (IS015)
NEC Storage Manager Data Replication User's Manual
(Installation and Operation Guide for Windows) (IS016)
NEC Storage PerformanceMonitor User's Manual
(IS025)
NEC Storage Manager Snapshot User’s Manual
(Function Guide) (IS030)
Page 4
6. Trademarks and registered trademarks
• Microsoft® and Windows® are trademarks or registered trademarks of Microsoft Corporation in the
United States and other countries.
• HP-UX is a registered trademark of Hewlett-Packard Co. in the United States.
• Solaris is a trademark or a registered trademark of Sun Microsystems, Inc. in the United States and
other countries.
• Linux is a trademark or a registered trademark of Mr. Linus Torvalds in the United States and other
countries.
Other product names and company names, etc. are trademarks or registered trademarks of the
associated companies.
7. In this document, matters to which careful attention needs to be paid will be described as follows:
Be sure to observe the contents.
If the indications are ignored and the system is improperly operated, settings which have been already
made might be affected.
Type of Indication
Type Description
Describes contents which require special attention during operation.
The First Edition in March 2001
The Thirteenth Edition in November 2004
Page 5

Contents
Part I Installation and Setting ..........................................................................................................................I-1
Chapter 1 Server Installation ..........................................................................................................................................I-2
1.1 Operating Environment ............................................................................................................................................I-2
1.2 Installation ................................................................................................................................................................ I-3
1.3 Environment Setting................................................................................................................................................. I-5
Chapter 2 Client Installation .........................................................................................................................................I-24
2.1 Operating Environment ..........................................................................................................................................I-24
2.2 Installation and Setting ........................................................................................................................................... I-25
2.3 Relationship between Server and Client Versions ................................................................................................. I-27
Part II Functions ..............................................................................................................................................II-1
Chapter 3 Basic Functions ............................................................................................................................................. II-2
3.1 Configuration Display .............................................................................................................................................II-2
3.2 State Monitoring....................................................................................................................................................II-44
3.3 Nickname Setting ..................................................................................................................................................II-49
3.4 Fault Monitoring....................................................................................................................................................II-55
3.5 Log Output ............................................................................................................................................................II-56
3.6 Event Link .............................................................................................................................................................II-62
3.7 ESMPRO Link.......................................................................................................................................................II-65
Chapter 4 Server Menu................................................................................................................................................ II-69
4.1 Operation Method.................................................................................................................................................. II-69
4.2 Functions ...............................................................................................................................................................II-70
Part III Operations...........................................................................................................................................III-1
Chapter 5 Normal Operation........................................................................................................................................III-2
5.1 Server Start/Stop.................................................................................................................................................... III-2
5.2 Client Start/Stop .................................................................................................................................................... III-3
5.3 Volume List Command (iSMvollist)................................................................................................................... III-10
5.4 Volume List Display............................................................................................................................................ III-26
5.5 Configuration Display Command (iSMview) ..................................................................................................... III-37
5.6 Configuration Information File Output Command (iSMcsv) .............................................................................. III-92
Chapter 6 Measures in Abnormalities .....................................................................................................................III-108
6.1 Measures for Server Fault ................................................................................................................................. III-108
6.2 Measures for Client Fault .................................................................................................................................. III-114
Appendix A Specifications..................................................................................................................................................1
A.1 Number of Monitored Disk Arrays .............................................................................................................................1
A.2 Number of Connected Clients .....................................................................................................................................1
A.3 Maximum Number of iSM Clients That Can Be Started Simultaneously ..................................................................1
Appendix B Environment Definition Language ..................................................................................................................2
B.1 Mail Header File..........................................................................................................................................................2
Appendix C Notes...................................................................................................................................................................3
C.1 Items about Server ....................................................................................................................................................... 3
C.2 Items about Client ....................................................................................................................................................... 4
Index .....................................................................................................................................................................................5
i
Page 6

This page is intentionally left blank.
ii
Page 7

P
a
r
t
I
I
n
s
t
a
l
l
a
t
i
o
n
a
n
d
S
e
t
t
i
n
g
P
a
r
t
I
I
n
s
t
a
l
l
a
t
i
o
n
a
n
d
S
e
t
t
P
a
r
t
I
I
n
s
t
a
l
l
a
t
i
o
n
a
n
d
S
e
i
t
t
i
n
n
g
g
Page 8
Chapter 1 Server Installation
Chapter 1 Server Installation
1
.
1
O
p
e
r
a
t
i
n
g
E
n
v
i
r
o
n
1
.
1
O
p
e
r
a
t
i
n
g
E
n
v
i
1
.
1
O
p
e
r
a
t
i
n
g
E
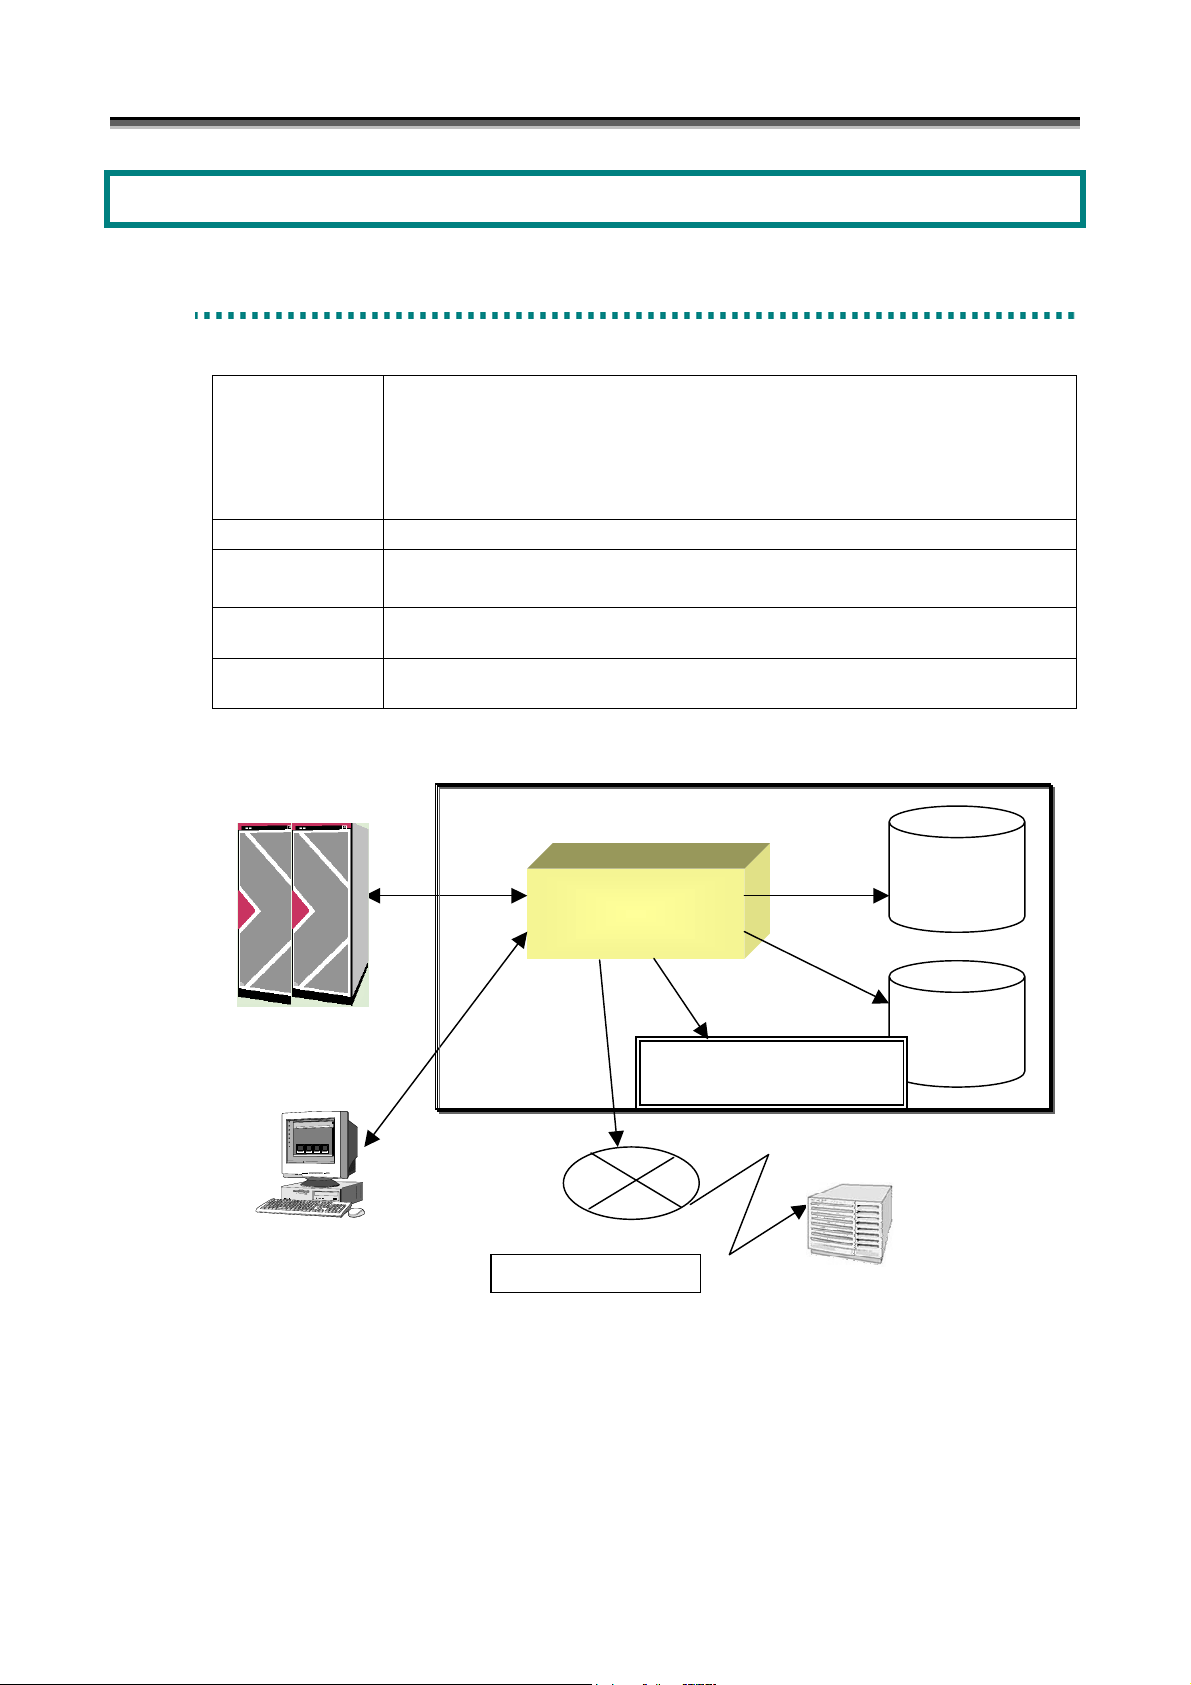
Table 1-1 Operating Environment
Operating systems Microsoft Windows 2000 Server (SP2 or later)
Microsoft Windows 2000 Advanced Server (SP2 or later)
Microsoft Windows Server 2003, Standard Edition
Microsoft Windows Server 2003, Enterprise Edition (64-bit)
Microsoft Windows Server 2003, Enterprise Edition
Memory OS required memory capacity + 50MB (+ 200MB for 64-bit) or more
Disk capacity Program capacity: 20MB
Required capacity for operation: 100MB or more
Recommended
software
Indispensable
hardware
IIS FTP Publishing Service
Storage series
n
v
r
i
r
o
o
n
n
m
m
m
e
e
e
n
n
n
t
t
t
Disk array
Client
When managing a disk array via FC, a fibre channel controller, a fibre channel cable and a driver of fibre channel
controller are necessary as peripheral equipments. And a fibre channel hub and a fibre channel switch should be
installed if necessary.
Event log
Storage Manager
Operation log
Executable file, batch file
starting
Mail server
Mail transmission
Figure 1-1 System Configuration Image
I-2
Page 9

Chapter 1 Server Installation
1
.
2
I
n
s
t
a
l
l
a
t
i
o
n
1
.
2
I
n
s
t
a
l
l
a
1
.
2
I
n
s
t
a
1
.
2
.
1
S
t
1
.
2
.
1
1
To install the iSM server, follow the procedure below.
1. To use the ESMPRO link function, install ESMPRO Agent ahead of the iSM server. If Alert Manager
2. When you install the iSM server to a server machine in which ESMPRO Manager is installed, a screen for
3. iSM server creates many files, while it is operating, in the folder where iSM itself is installed. If the
4. The target folder where Win.ini file is stored cannot be selected for a folder where the program is to be
.
2
.
1
Main Service has been started before the iSM server is installed, terminate this service once to register the
link function securely and then execute the following operations for installation.
confirming link with ESMPRO Alert Manager appears. Make setting as needed on the screen. For
details, refer to 3.7.4 “Link between ESMPRO Manager and ESMPRO Alert Manager”.
program is uninstalled, all files and subfolders, not including the iSM server setting file, in the folder where
the program is installed are deleted. Therefore, default folder setting is recommended to use for installing
the program. If you want to install the program into a folder other than the default folder, you have to
create a new folder or be sure to install into an existing folder where other files are not installed. In
addition, never save important files in the folder.
installed.
S
S
o
t
o
t
o
t
l
l
a
t
r
a
g
e
r
a
g
e
r
a
g
e
i
o
n
i
o
n
M
a
n
a
g
e
r
S
e
r
v
e
r
I
n
s
t
a
l
l
a
t
i
o
n
M
M
a
a
n
n
a
a
g
g
e
e
r
S
e
r
v
e
r
I
n
s
t
a
l
l
a
r
S
e
r
v
e
r
I
n
s
t
a
t
l
l
a
t
i
o
n
i
o
n
(1) Log on as the Administrator.
(2) Select the following installation program from [Add/Remove Programs] ([Add or Remove Programs] for
Windows Server 2003) in [Control Panel].
CD-ROM drive:\SERVER\WINDOWS\SETUP.EXE
(3) Follow the directions of the installer.
Perform environment setting in the install process. For the information of the environment setting, refer to 1.3
“Environment Setting”.
(4) Reboot the operating system.
To prevent iSM server from being automatically started during restart of the operating system, refer to 5.1
“Server Start/Stop”.
I-3
Page 10

Chapter 1 Server Installation
1
.
2
.
2
S
t
o
r
a
1
.
2
.
2
S
2
3
3
3
4
4
4
t
S
t
S
S
S
V
V
V
1
.
2
.
To uninstall the iSM server, follow the procedure below.
(1) Log on as the Administrator.
(2) Close [Services] and [Event Viewer].
(3) Remove “Storage Manager Server” by using [Add/Remove Programs] ([Add or Remove Programs] for Windows
Server 2003) in [Control Panel]. When the Storage Manager service is running, it will be automatically stopped.
Even after iSM has been uninstalled, the environment definition files, operation log files, performance statistical
information history files, performance statistical information summary files, performance optimization log files,
and license-related files are not deleted. All the other files and subfolders under the folder where the program is
installed are deleted when iSM is uninstalled.
1
.
2
.
1
.
2
.
1
.
2
.
To update iSM server, uninstall the existing iSM before installing the updated program.
Please refer to 1.2.1 “Storage Manager Server Installation” and 1.2.2 “Storage Manager Server Uninstallation” for the
procedures.
1
.
2
.
1
.
2
.
1
.
2
.
o
o
t
t
t
o
o
o
o
o
o
g
r
a
g
r
a
g
r
a
r
a
r
a
l
u
l
u
l
u
e
g
g
g
m
m
m
e
e
e
e
e
e
e
M
e
M
M
a
M
M
M
L
L
L
a
a
n
a
g
e
r
S
e
r
v
e
r
U
n
i
n
s
t
a
l
l
a
t
i
o
n
n
a
g
e
r
S
e
r
v
e
r
U
n
i
n
s
t
a
l
l
a
n
a
g
e
r
S
e
r
v
e
r
U
n
i
n
s
t
a
n
a
g
e
r
S
e
r
v
e
r
U
p
d
a
d
d
d
d
d
a
a
U
U
U
t
t
t
n
n
a
n
a
g
e
r
S
e
r
v
e
r
U
a
n
a
g
e
r
S
e
r
v
e
i
s
t
I
n
s
t
a
l
l
a
t
i
o
i
s
t
I
n
s
t
a
l
l
i
s
t
I
n
s
a
t
a
l
l
a
n
t
i
o
n
t
i
o
n
p
r
U
p
a
n
a
n
a
n
a
e
n
e
e
t
l
l
a
t
i
n
s
i
n
s
i
n
s
i
o
n
i
o
n
t
a
l
l
a
t
i
o
n
t
a
l
l
a
a
t
l
l
a
t
t
i
o
n
i
o
n
The iSMvollist command is a tool for reporting disk information such as the disk array name or logical disk name of a
disk array connected via the fibre channel (FC). This command can be operated independently even on a server
machine where iSM has not been installed.
To install iSMvollist, follow the procedure below.
When iSMvollist is already installed, uninstall it and then install it again.
(1) Log on as the Administrator.
(2) Select the following installation program from [Add/Remove Programs] ([Add or Remove Programs] for
Windows Server 2003) in [Control Panel].
CD-ROM drive:\VOLLIST\WINDOWS\SETUP.EXE
(3) Follow the directions of the installer.
To uninstall iSMvollist, follow the procedure below.
(1) Log on as the Administrator.
(2) If the iSMvollist command and/or [Volume List Display] have been started, terminate all. If [Event Viewer] is
open, close it.
(3) Remove “Storage Manager Volume List” by using [Add/Remove Programs] ([Add or Remove Programs] for
Windows Server 2003) in [Control Panel].
I-4
Page 11

Chapter 1 Server Installation
If you uninstall iSMvollist while iSMvollist and/or [Volume List Display] have been started, a message
prompting to restart the system may appear. In this case, follow the instruction and be sure to restart the
system.
1
.
3
E
n
v
i
r
o
n
m
e
n
t
S
e
t
t
i
n
g
1
.
3
E
n
v
i
r
o
n
m
e
n
t
S
e
t
1
.
3
E
n
v
i
r
o
n
m
e
n
t
Environment settings are required to start up the iSM server. This document describes how to perform environment
settings.
Perform environment settings when installing the iSM server or changing the settings because of the addition of the
disk arrays to be monitored or users after the installation.
1
.
3
.
1
S
e
t
t
i
n
g
D
i
s
k
A
r
1
.
3
.
1
S
e
t
t
i
n
g
D
i
s
1
.
3
.
1
S
e
t
t
i
n
g
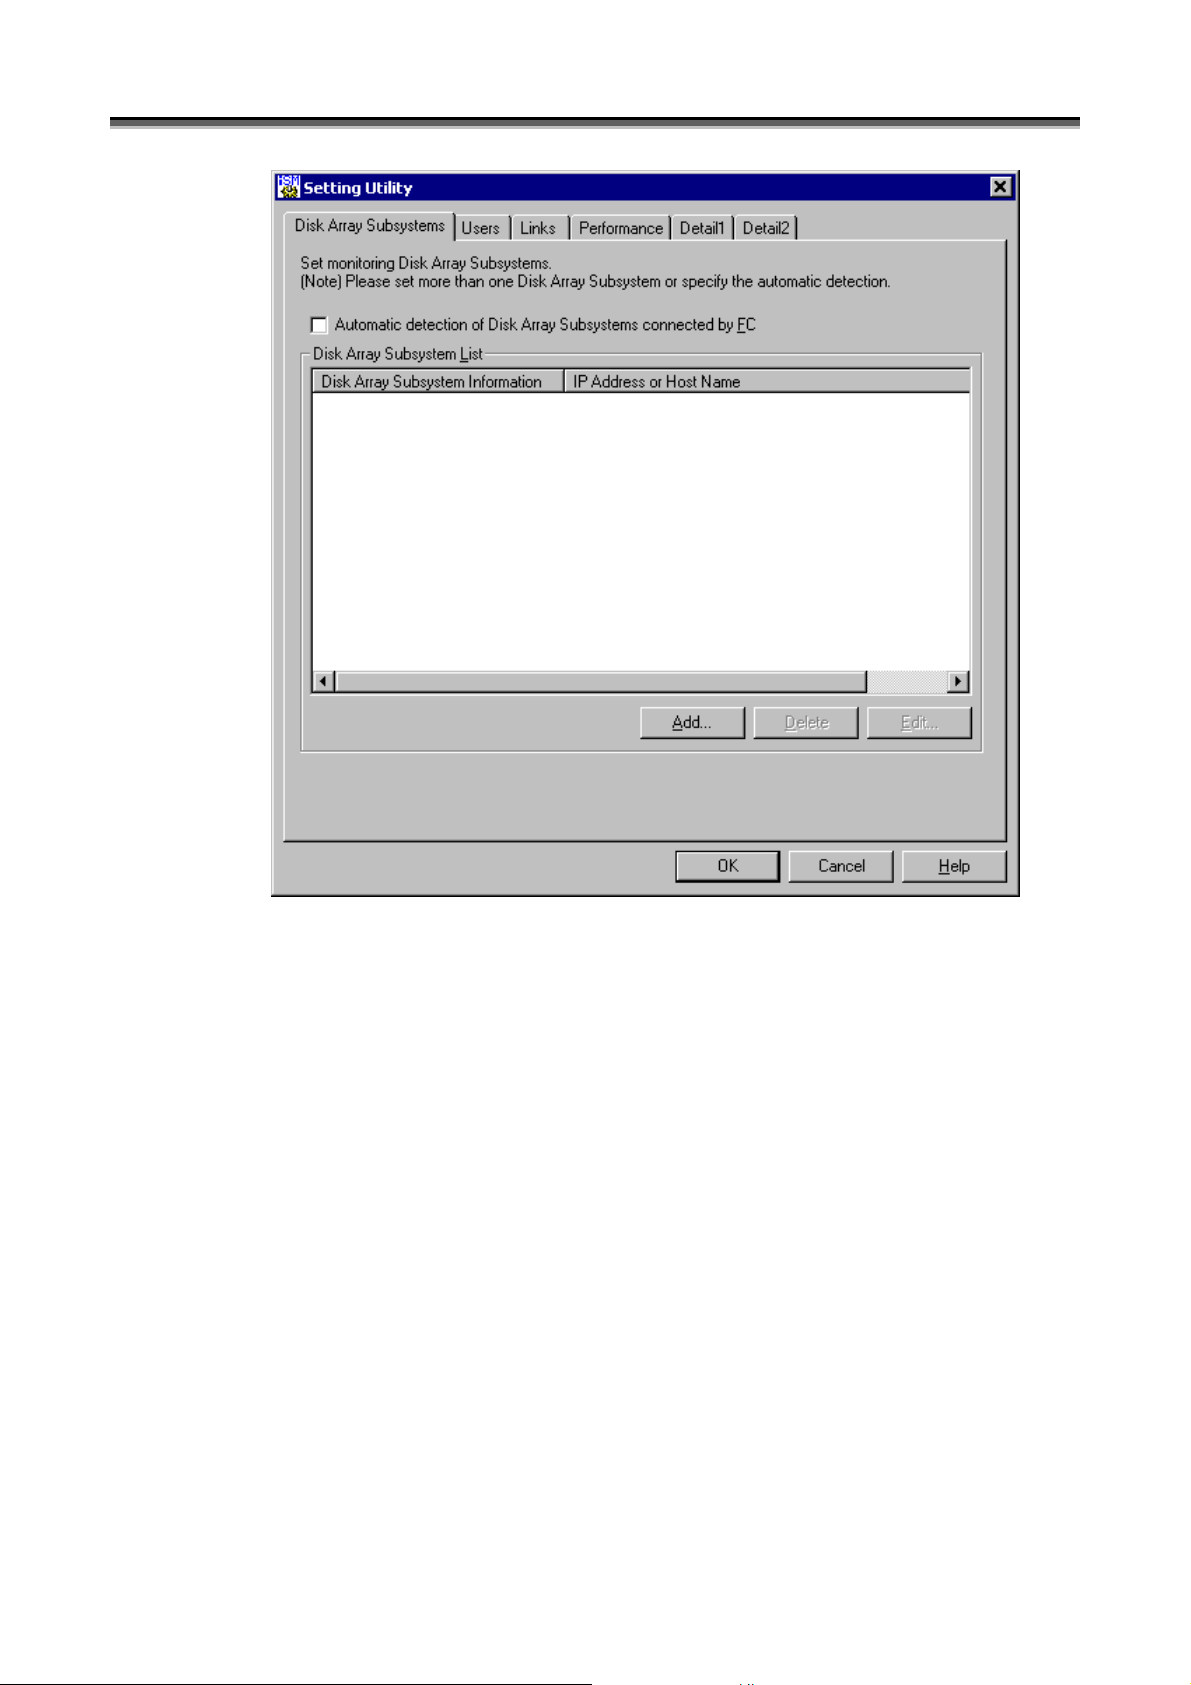
Disk array information is set in the following screen. Disk array information includes identification of disk arrays
monitored by the iSM server and how to connect disk arrays.
To start the Setting Utility screen, select [Start] → [Programs] ([All Programs] for Windows Server 2003) → [Storage
Manager Server] → [Setting Utility], or select [Server Menu] → [Setting Utility]. If having changed the
environment setting, restart the iSM server. Information set on each screen is saved by clicking the [OK] button.
When iSM server is installed before the connection of disk arrays or the IP address and/or disk number of a disk array
is unknown, first select [Automatic detection of Disk Array Subsystems connected by FC] and make other setting
(such as 1.3.2 “Setting User Information”). In such a case, change the setting with the IP address and disk number
determined.
D
k
i
s
k
r
A
r
r
A
r
r
S
a
a
a
e
y
y
y
t
t
t
I
n
I
n
I
i
i
n
n
n
f
f
g
g
o
r
m
a
t
i
o
n
o
r
m
a
m
a
t
t
f
o
r
i
o
n
i
o
n
I-5
Page 12
Chapter 1 Server Installation
(i)
(ii)
(iii) (iv) (v)
Figure 1-2 Disk Array Subsystem List Screen
(i) [Automatic detection of Disk Array Subsystems connected by FC]
When you select [Automatic detection of Disk Array Subsystems connected by FC], disk arrays with the FC
connection are automatically detected and monitored.
(ii) [Disk Array Subsystem List]
[Disk Array Subsystem List] displays the disk array information currently registered.
(When a disk array specified by the disk number is selected, the column heading [IP Address or Host Name] in
the figure above appears as [Disk].) Up to 32 disk arrays can be registered in the [Disk Array Subsystem List].
(iii) [Add] button
To add a disk array, use the [Add] button to open the Add screen.
(iv) [Delete] button
To delete a disk array, select a disk array you want to delete, and click the [Delete] button.
I-6
Page 13
Chapter 1 Server Installation
(v) [Edit] button
To modify a disk array, select a disk array you want to edit and click the [Edit] button, or double-click the disk
array and edit it on the Edit screen (Figures 1-4 and 1-5).
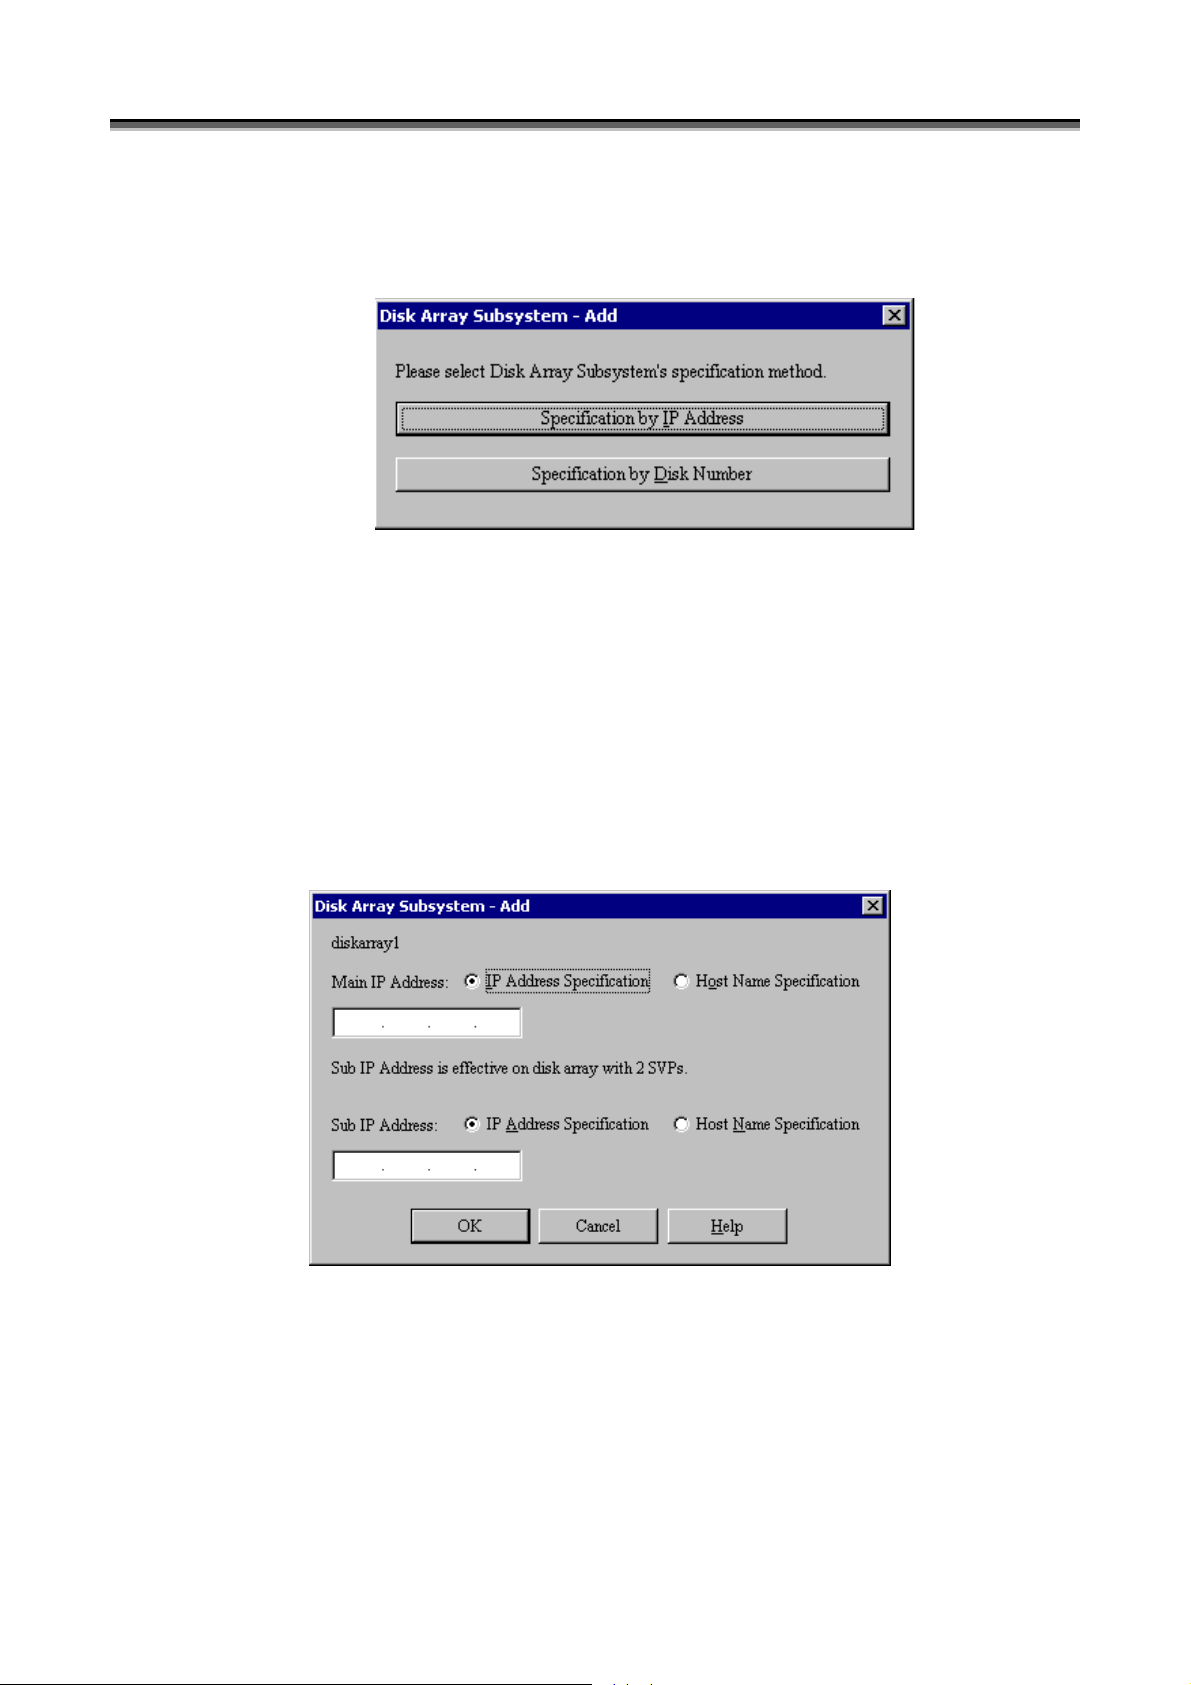
(vi)
(vii)
Figure 1-3 Disk Array Subsystem - Add Screen - 1
(vi) [Specification by IP Address]
To monitor a disk array in TCP/IP connection, select [Specification by IP Address] to display the IP address
addition screen (Figure 1-4).
(vii) [Specification by Disk Number]
To monitor a disk array in FC connection, select [Specification by Disk Number] to display the disk addition
screen (Figure 1-5). Disk number is a number assigned by Windows to manage logical disks. The setting is
generally not required since the disk arrays connected by FC are automatically detected by checking [Automatic
detection of Disk Array Subsystems connected by FC].
(viii)
(ix)
Figure 1-4 Disk Array Subsystem - Add Screen - 2
(viii) [Main IP Address]
In [Main IP Address], specify an IP address or host name. Up to 63 characters can be used for a host name.
Non-ASCII code characters, control characters, double quotation mark, and space cannot be used for a host
name.
iSM connects to the IP address or that specified for the host name (port number: 2730) to conduct monitoring.
I-7
Page 14
Chapter 1 Server Installation
(ix) [Sub IP Address]
In [Sub IP Address], up to two IP addresses can be specified for the disk arrays with two SVPs.
iSM connects to the IP address or that specified for the host name (port number: 2730) to conduct monitoring.
(x)
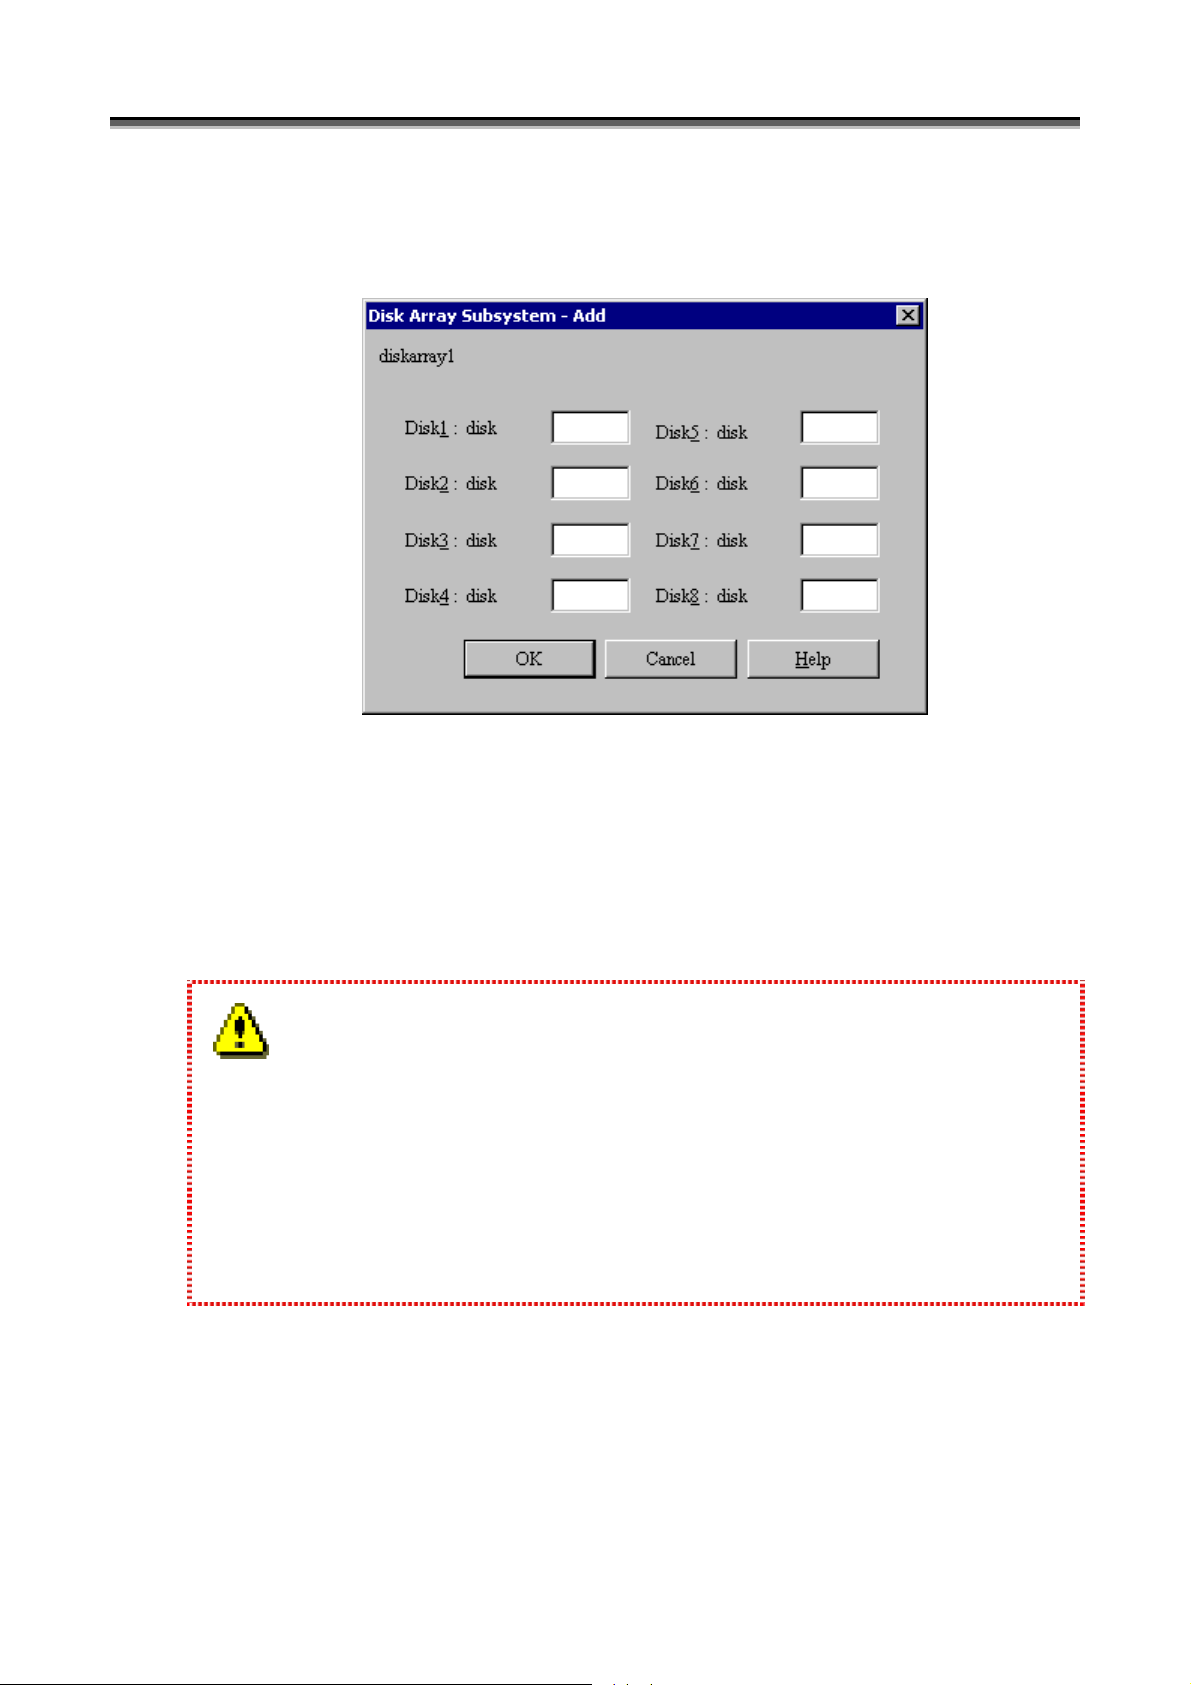
Figure 1-5 Disk Array Subsystem - Add Screen - 3
(x) Disk Number Entry field
In an entry field on the screen as shown in the figure above, specify a disk number. A value from 0 to 9999
can be specified for a disk number. Check the disk number of the disk array to be monitored, using the
Volume List (iSMvollist -dl) command in advance. For details, refer to 5.3 “Volume List Command
(iSMvollist)”.
1. Without any disk number being specified, disk arrays can be monitored via FC by specifying [Automatic
detection of Disk Array Subsystems connected by FC].
Specification of a disk number is not recommended because the disk number may change when the OS is
rebooted or an FC fault occurs.
2. For Windows Server 2003, disks in disk arrays may not be accessed when, for example, the access control
setting is changed. Therefore, it is strongly recommended that disk arrays be monitored through TCP/IP
connection when iSM server is installed and used under Windows Server 2003.
I-8
Page 15

Chapter 1 Server Installation
1
.
3
.
2
S
e
t
t
i
n
g
U
s
e
r
I
n
f
o
r
m
a
t
i
o
n
1
.
3
.
2
S
e
t
t
i
n
g
U
s
e
r
I
n
f
o
r
m
a
1
.
3
.
2
S
e
t
t
i
n
g
U
s
e
r
I
n
f
o
r
User information is set in the following screen. iSM server uses user information as an account. iSM server uses
this information in order to identify the user who connects by iSM client. This information is composed of user
names, passwords, and user levels (refer to explanation of the “User-Add” screen given later for details). As a
default, a user is registered having the user name of iSM, password of iSM and user level of L1 (only reference to the
information is allowed). Add, as required, users of the user level L3 who can change configuration of disk arrays.
For the iSM client, refer to 5.2 “Client Start/Stop”.
Set user information on the Setting Utility screen shown below.
To start the Setting Utility screen, select [Start] → [Programs] ([All Programs] for Windows Server 2003) → [Storage
Manager Server] → [Setting Utility], or select [Server Menu] → [Setting Utility]. If having changed the
environment setting, restart the iSM server. Information set on each screen is saved by clicking the [OK] button.
Setting of one or more pieces of user information is required. Note that user information of iSM set on this screen
is independent of the OS user or password.
m
a
t
t
i
o
n
i
o
n
(i)
(ii) (iii) (iv)
Figure 1-6 User List Screen
I-9
Page 16
Chapter 1 Server Installation
(i) [User List]
[User List] displays the list of users currently registered. This user name is used for obtaining authorization to
connect with an iSM server from an iSM client, and display and control the disk array information form the
iSM client. Up to 100 user names can be registered in the User List.
(ii) [Add] button
To add a user, use the [Add] button to open the Add screen (Figure 1-7).
(iii) [Delete] button
To delete a user, select a user you want to delete, and click the [Delete] button.
(iv) [Edit] button
To modify a user, select a user you want to edit and click the [Edit] button, or double-click the user and edit it
on the Edit screen (Figure 1-7).
(v)
(vi)
(vii)
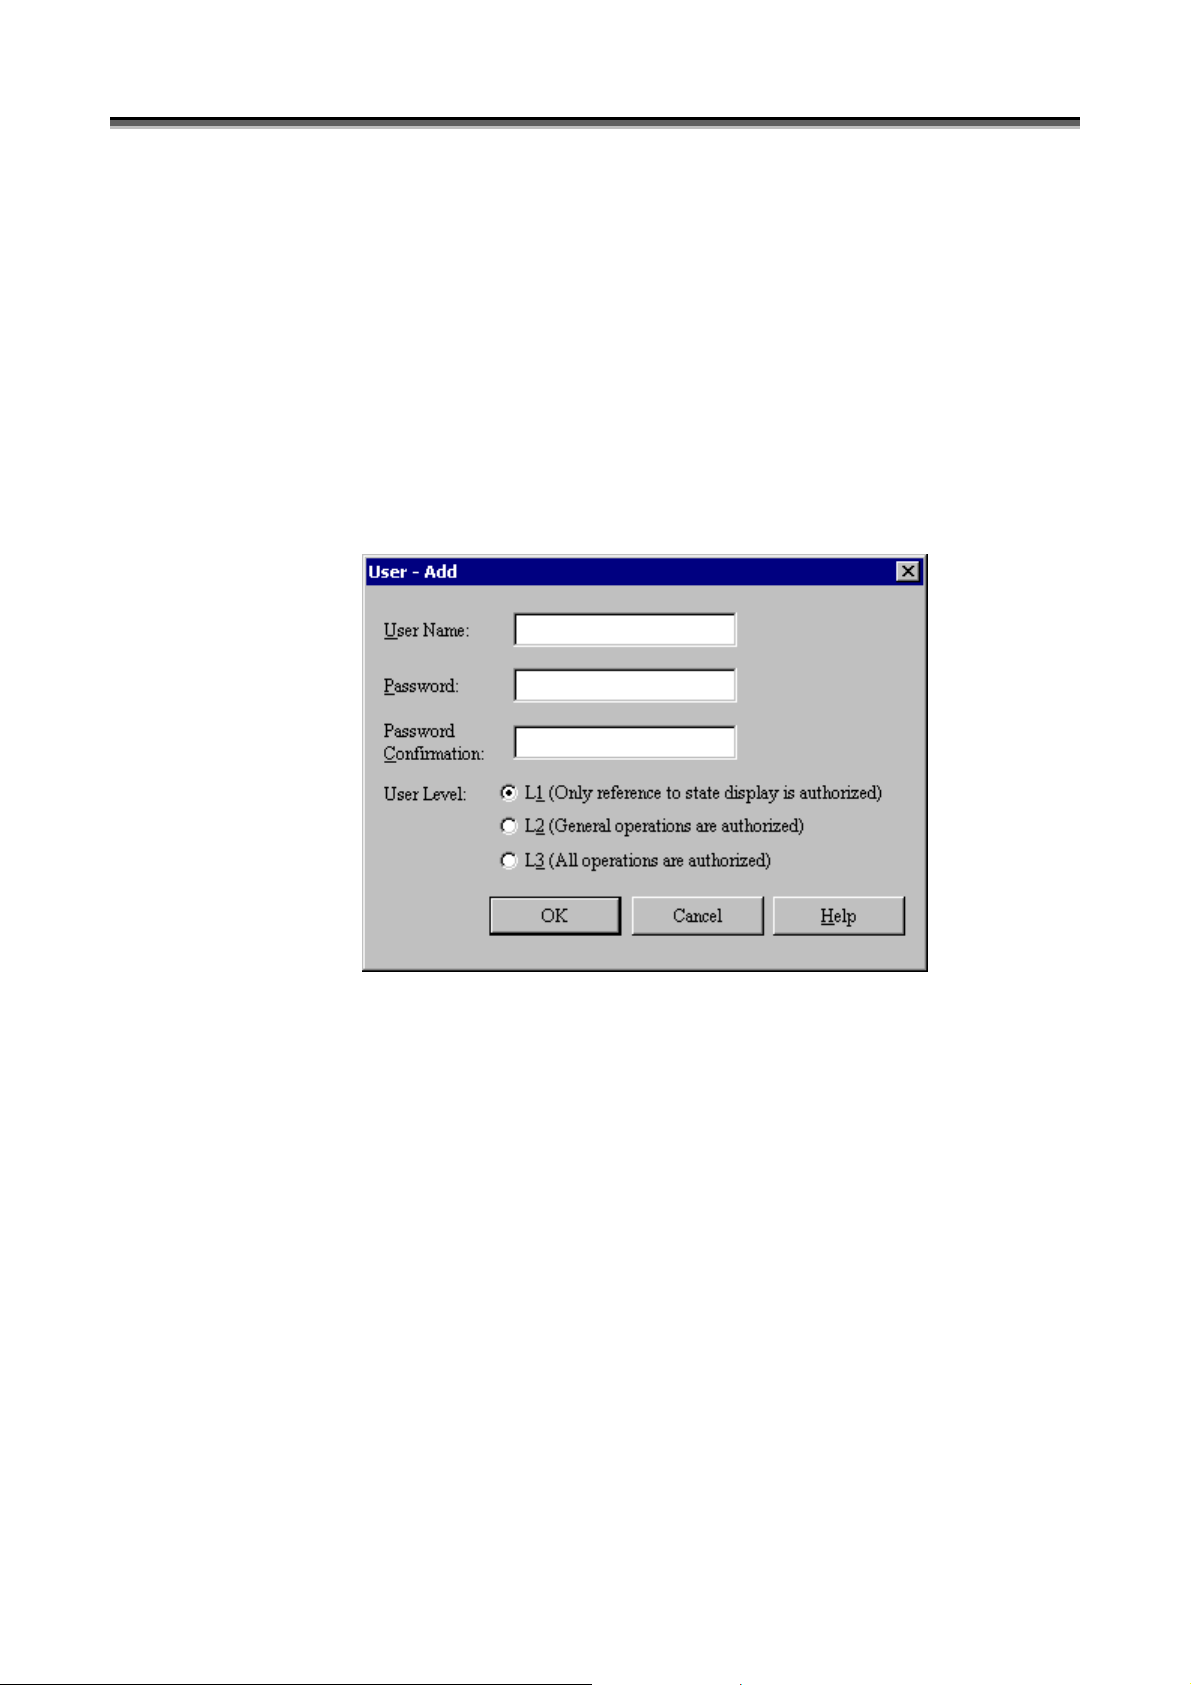
Figure 1-7 User - Add Screen
(v) [User Name]
In [User Name], specify a user name within 20 characters. User Name is case-sensitive. Non-ASCII code
characters, control characters, double quotation mark, and space cannot be used for a user name.
(vi) [Password]
In [Password], specify a password of the user within 14 characters. Password is case-sensitive. Enter the
same password in [Password Confirmation] for confirmation. The character you enter is displayed as a “*”.
Non-ASCII code characters, control characters, and double quotation mark cannot be used for a password. A
password cannot consist of all spaces.
(vii) [User Level]
In [User Level], specify the operation authorization level of the user. iSM defines the three kinds of user
levels that set/refer information of disk arrays by iSM client. An upper level (L3>L2>L1) allows all
operations of a lower level.
L1(Level 1): Only reference to state display is authorized.
L2(Level 2): Operations at the level of the replication, performance monitoring, performance optimization, and
snapshot functions are authorized.
L3(Level 3): All operations are authorized, such as changing the disk array configuration.
I-10
Page 17
Chapter 1 Server Installation
i
i
i
i
i
i
1
.
3
.
3
S
e
t
t
i
n
g
L
i
n
k
I
n
f
o
r
m
a
t
i
o
n
1
.
3
.
3
S
e
t
t
i
n
g
L
i
n
k
I
n
f
o
r
m
a
1
.
3
.
3
S
e
t
t
i
n
g
L
i
n
k
I
n
f
o
r
Set link information to use the event link function. For details on the event link function, refer to 3.6 “Event Link”.
Set link information on the Setting Utility screen shown below.
To start the Setting Utility screen, select [Start] → [Programs] ([All Programs] for Windows Server 2003) → [Storage
Manager Server] → [Setting Utility], or select [Server Menu] → [Setting Utility].
(1) Setting Utility screen
Even while the iSM server is operating, event link operation can be dynamically changed by clicking the
[Update Event Link Operation] button on the Setting Utility screen. At this time, information set on this screen
is saved. Restart the iSM server if not clicking the [Update Event Link Operation] button.
Information set on each screen is saved by clicking the [OK] button.
m
a
t
t
i
o
n
i
o
n
(i)
(ii)
(iv)
(v
)
(vii
(vii)
(ix)
)
(xi
(xvi)
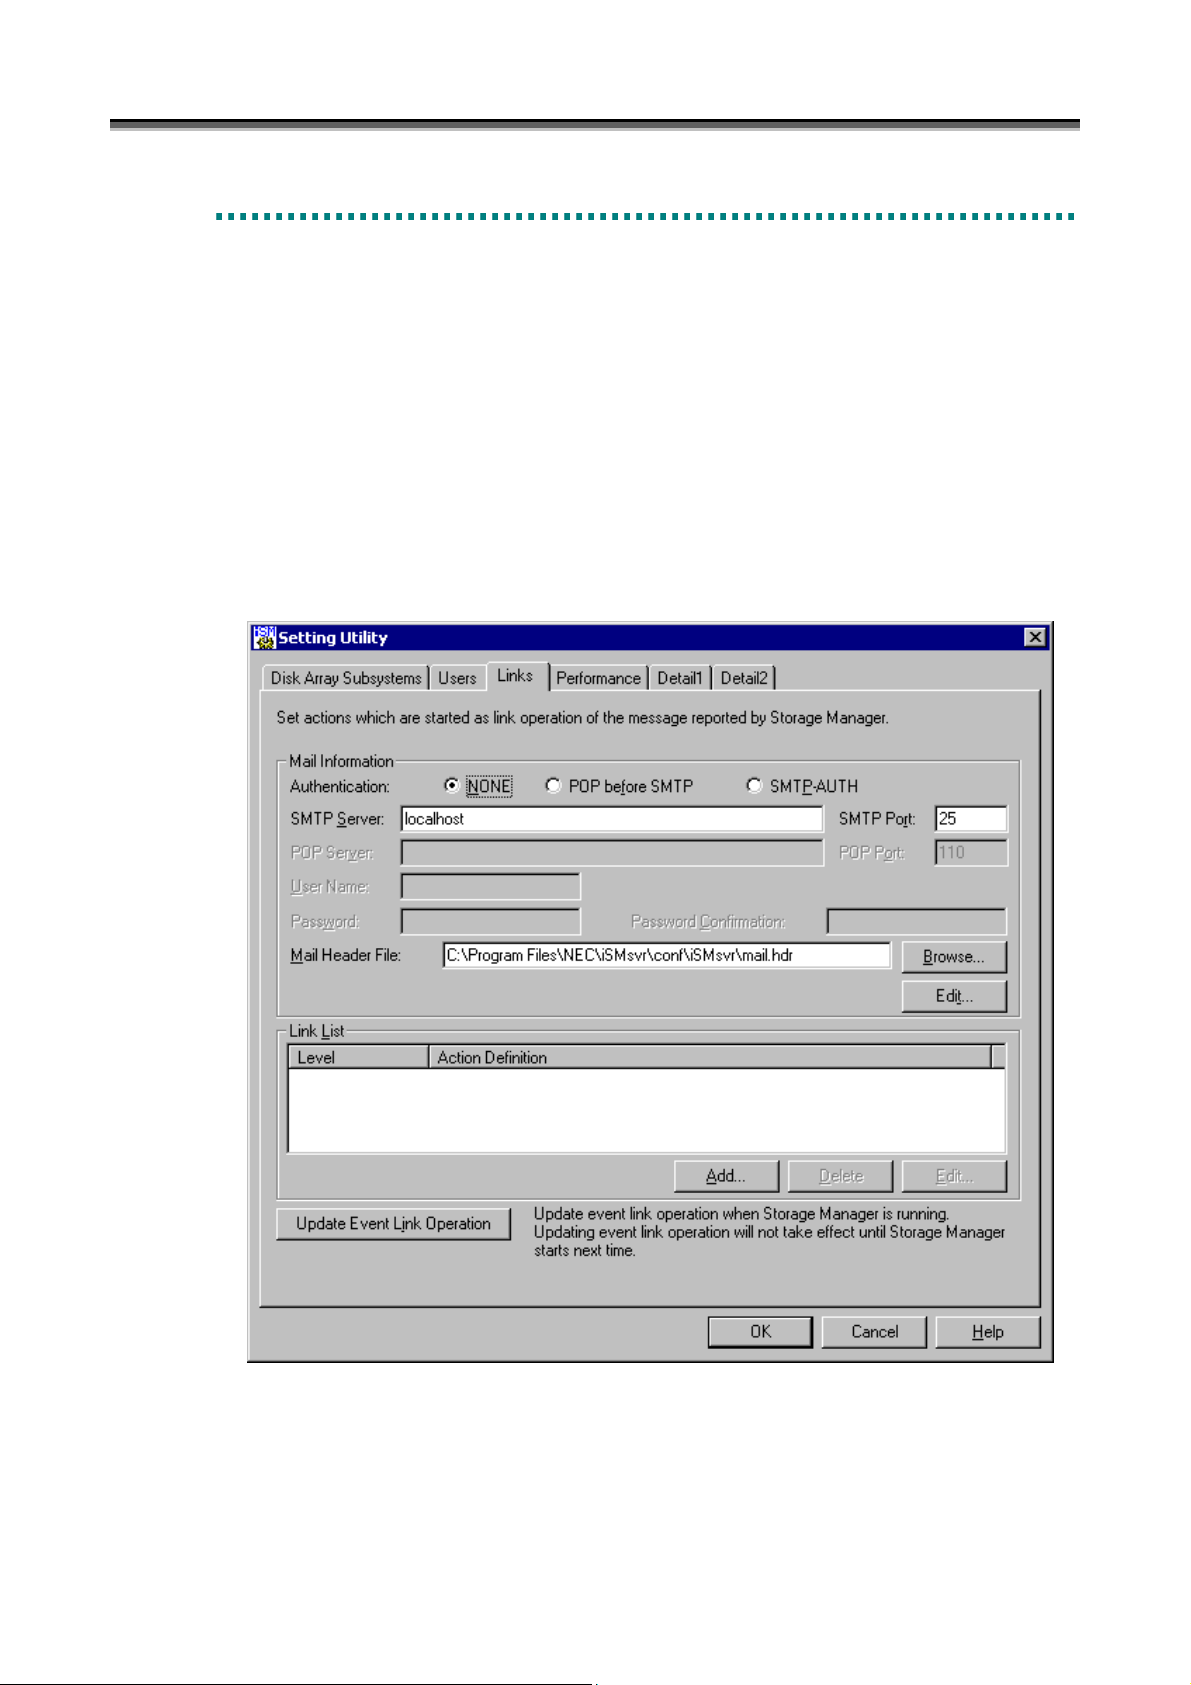
Figure 1-8 Screen for Setting Link Information
(i) Authentication
NONE: Does not perform user authentication.
POP before SMTP: Performs user authentication using POP before SMTP.
SMTP-AUTH: Performs user authentication using SMTP Authentication.
)
) (xiv) (xv)
(xii
(ii
(v)
)
(x)
)
(x
I-11
Page 18

Chapter 1 Server Installation
(ii) SMTP Server
In [SMTP Server], specify the SMTP server to which mails are sent within 235 characters.
(iii) SMTP Port
In [SMTP Port], specify the port number of the SMTP server to which mails are sent.
A value from 1 to 65535 can be specified. The default value is 25.
(iv) POP Server
In [POP Server], specify the POP server to access for authentication when sending mails within 235 characters.
This item is effective if you specify [POP before SMTP] for (i) [Authentication].
(v) POP Port
In [POP Port], specify the port number of the POP server to access for authentication when sending mails.
A value from 1 to 65535 can be specified. The default value is 110.
This item is effective if you specify [POP before SMTP] for (i) [Authentication].
(vi) User Name
In [User Name], specify the user name for authentication within 32 characters.
This item is effective if you specify either [POP before SMTP] or [SMTP-AUTH] for (i) [Authentication].
(vii) Password
In [Password], specify a password of the user name for authentication within 58 characters.
This item is effective if you specify either [POP before SMTP] or [SMTP-AUTH] for (i) [Authentication].
(viii) Password Confirmation
Enter the same password in [Password Confirmation] for confirmation.
This item is effective if you specify either [POP before SMTP] or [SMTP-AUTH] for (i) [Authentication].
(ix) Mail Header File
In [Mail Header File], specify the header file which is a template for sending a mail within 235 characters.
(x) [Browse] button
Displays the file selection screen on which you can specify an existing mail header file.
(xi) [Edit] button
Enables the creation of a new mail header file or the editing of an existing mail header file. Enter the path in
the [Mail Header File] field and click the [Edit] button. The Mail Header File Setting screen (Figure 1-9)
appears. Edit the contents and click the [Save] button or [Save as] button.
(xii) Link List
Displays the list of currently set link items.
(xiii) [Add] button
Displays the Link - Add screen (Figure 1-10) on which you can add link items.
(xiv) [Delete] button
To delete a link item, select the one you want to delete and click the [Delete] button.
(xv) [Edit] button
Select a link item and click the [Edit] button, or double-click the link item. The Link - Add screen (Figure
1-10) appears for changing link items.
(xvi) [Update Event Link Operation] button
A message is displayed asking if you want to apply new settings. If iSM is operating, selecting the [Yes]
button immediately applies the new settings. If iSM is not operating, only event link information is updated,
and the new settings become valid when iSM is started next time.
I-12
Page 19
(2) Mail Header File Setting screen
(i)
Chapter 1 Server Installation
(ii) (iii)
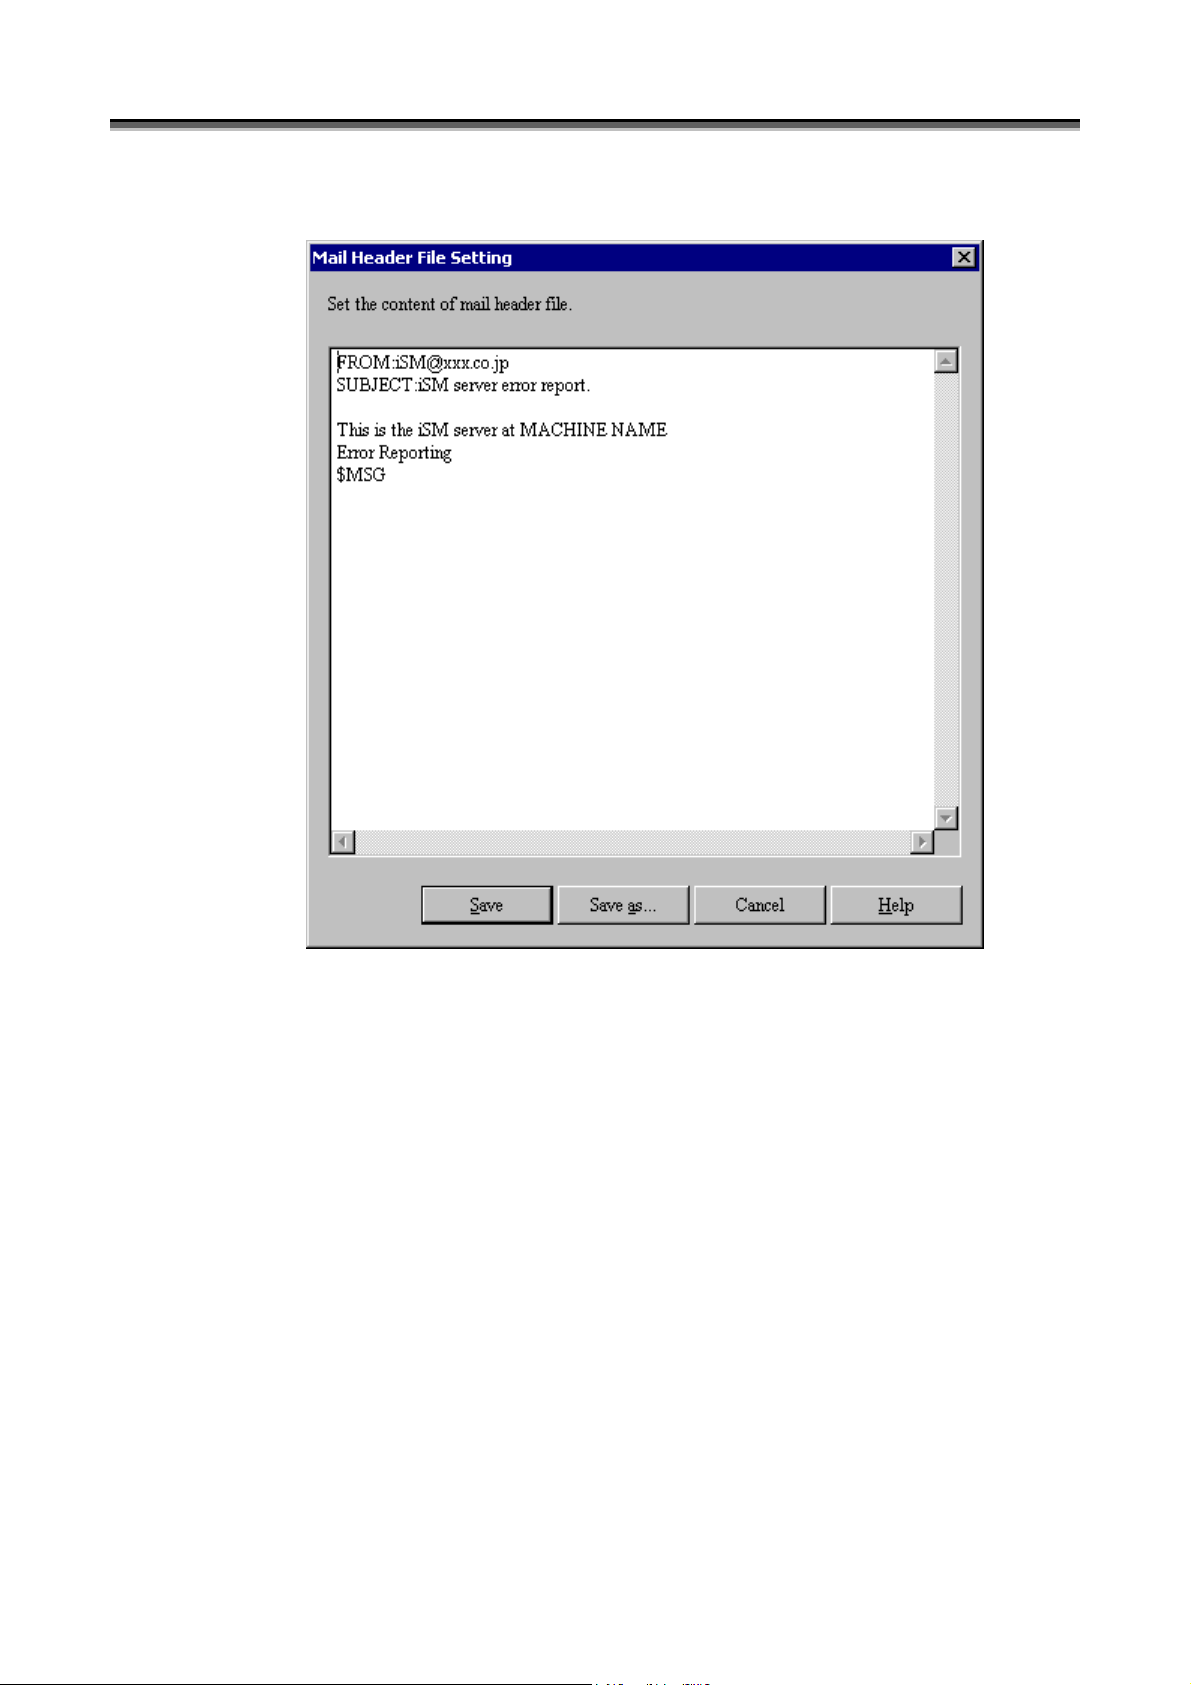
Figure 1-9 Mail Header File Setting Screen
(i) Mail header file contents
Write the mail header file contents. For details, refer to Appendix B “Environment Definition Language”.
(ii) [Save] button
Saves the mail header file with the displayed contents and returns to the Link Information Setting screen
(Figure 1-8).
(iii) [Save as] button
Newly saves the mail header file with the displayed contents, and returns to the Link Information Setting screen
(Figure 1-8). The path name of a newly created file is entered in the [Mail Header File] field.
I-13
Page 20
Chapter 1 Server Installation
(iv)
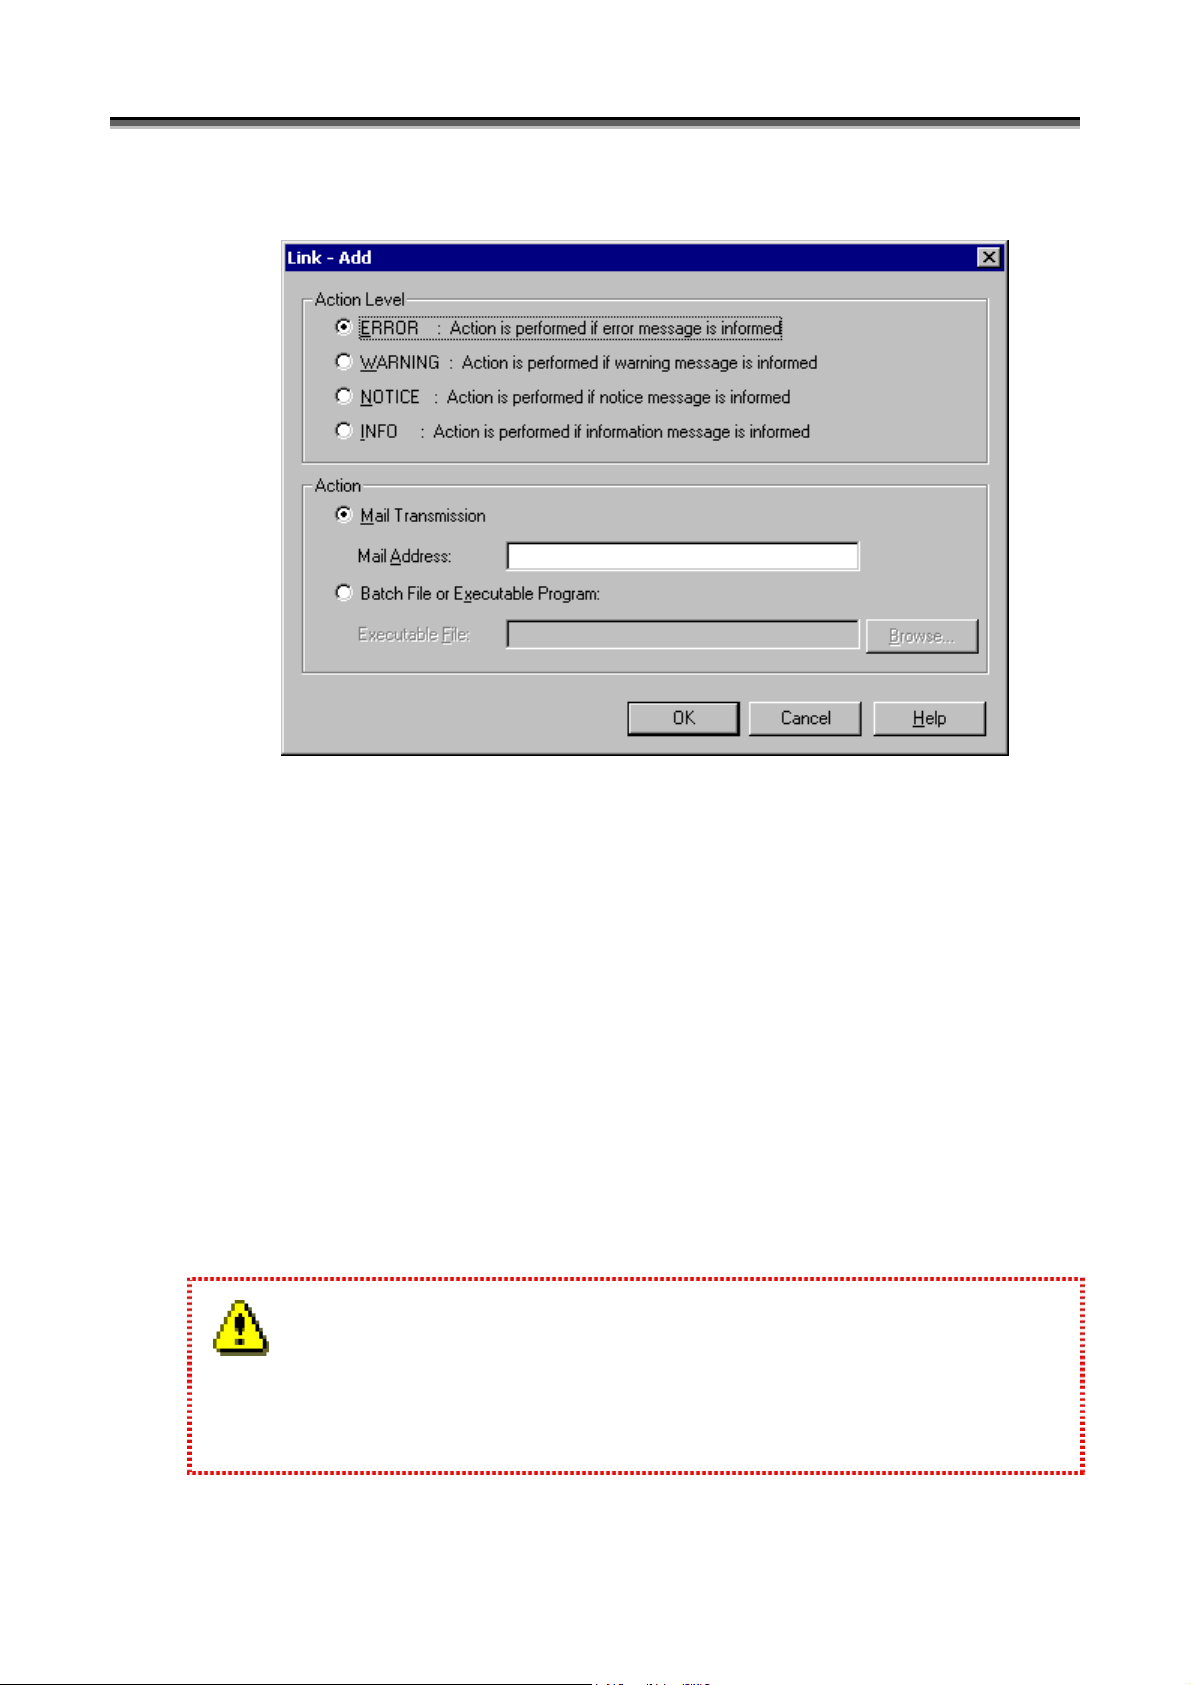
(3) Link-Add screen
(i)
(ii)
(iii)
Figure 1-10 Link Item Addition Screen
(i) Action Level
Select the execution level of the action performed for the message of iSM.
(ii) Action
Select the action (the sending of mail or the execution of a batch file or program) to be taken for the message of
iSM.
(iii) Mail Address
If [Mail Transmission] is selected, specify the mail address of the destination. Do not use parentheses in
specifying the mail address. The mail address can be specified with up to 235 characters.
(iv) Executable File
If [Batch File or Executable Program] is selected, click the [Browse] button and specify the path name of the
batch file or program. In this case, specify an executable file which does not require any interaction with the
screen. Do not use parentheses in specifying the executable file. The executable file can be specified with up
to 235 characters.
1. The [Browse] button is available only when [Batch File or Executable Program] is selected in the [Action]
field.
2. Do not register actions of the same contents repeatedly in the same action level.
I-14
Page 21
Chapter 1 Server Installation
1
.
3
.
4
S
e
t
t
i
n
g
P
e
r
f
o
r
m
a
n
c
e
I
n
f
o
r
m
a
t
i
o
n
1
.
3
.
4
S
e
t
t
i
n
g
P
e
r
f
o
r
m
a
n
c
e
I
n
f
o
r
m
a
1
.
3
.
4
S
e
t
t
i
n
g
P
e
r
f
o
r
m
a
n
c
e
I
n
f
o
r
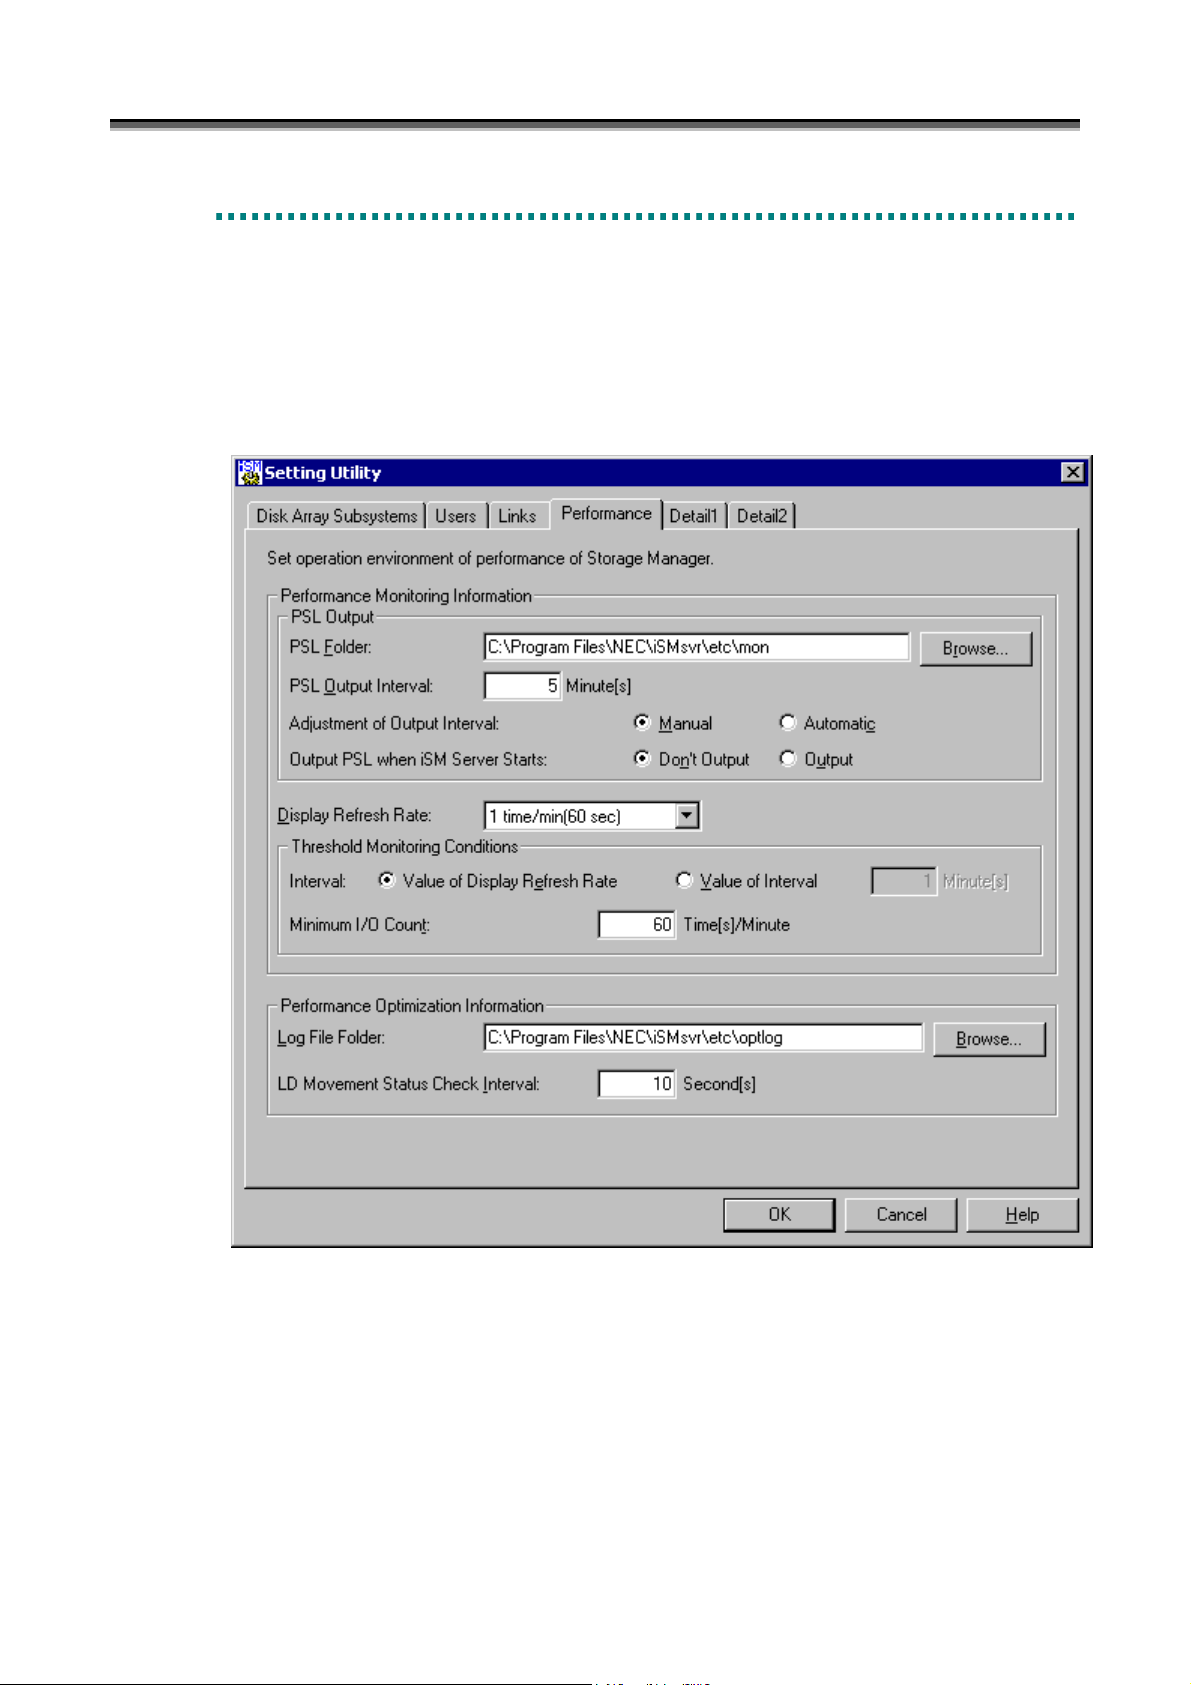
Set performance information on the Setting Utility screen shown below. Since the default values are recommended
for the information, it is not necessary to make any settings on this screen in ordinary operation.
To start the Setting Utility screen, select [Start] → [Programs] ([All Programs] for Windows Server 2003) → [Storage
Manager Server] → [Setting Utility], or select [Server Menu] → [Setting Utility]. If having changed the
environment setting, restart the iSM server. Information set on each screen is saved by clicking the [OK] button.
(i)
(ii)
m
a
t
t
i
o
n
i
o
n
(iii)
(iv)
(v)
(vi)
(vii)
(viii)
(ix)
Figure 1-11 Screen for Setting Performance Information
• In [Performance Monitoring Information], set information about the monitoring of disk array performance.
(i) PSL Folder
Specify the folder for containing the statistical information history file. The folder name can be specified with
up to 210 bytes.
For details, refer to the “PerformanceMonitor User’s Manual”.
The default folder is [installation destination folder]\etc\mon. If changing the folder, click the [Browse] button
and specify an existing folder.
I-15
Page 22

Chapter 1 Server Installation
(ii) PSL Output Interval
Specify the interval at which statistical information is collected and output to the statistical information history
file. The default interval is 5 minutes. If changing the interval, specify a value from 1 to 60.
(iii) Adjustment of Output Interval
Statistical information may not be output at the currently specified interval if there are too many disk array
components. Specify this item to determine whether to automatically change to an interval at which statistical
information can be output.
Manual: The currently specified interval is not changed automatically to an interval at which statistical
information can be output.
Automatic: The currently specified interval is changed automatically to an interval at which statistical
information can be output.
(iv) Output PSL when iSM Server Starts
Determine whether to automatically start the output of statistical information for all the disk arrays that can use
PerformanceMonitor when the iSM server starts.
Don’t Output: Statistical information output is not automatically started.
Output: Statistical information output is automatically started. However, statistical information output is not
automatically started for disk arrays for which statistical information output was stopped in the previous
operation, and the previous operation state is retained instead.
(v) Display Refresh Rate
Specify the number of times data updated per minute in the numeric value table and the time-series graph on the
performance monitoring screen. For details, refer to the “PerformanceMonitor User’s Manual”. The default
number of times is 1 per minute. If changing the number of times, specify a value from 1 to 6.
(vi) Interval
Specify the monitoring interval as a threshold monitoring condition.
A value 1 to 60 (minutes) can be specified. The default monitoring interval is identical to the display refresh
rate.
(vii) Minimum I/O Count
Specify the minimum number of I/O operations as a threshold monitoring condition.
A value 1 to 120 (the number of times/minute) can be specified. The default minimum I/O count is 60 (times
per minute).
• In [Performance Optimization Information], specify information about the performance optimization of disk arrays.
(viii) Log File Folder
Specify the folder for containing the performance optimization log file. The folder name can be specified with
up to 192 bytes.
The default folder is “[installation destination folder]\etc\optlog”. If changing the folder, click the [Browse]
button and specify an existing folder.
(ix) LD Movement Status Check Interval
Specify the interval at which the logical disk moving status is to be checked. The default interval is 10
seconds. If changing the interval, specify a value from 5 to 30.
I-16
Page 23
Chapter 1 Server Installation
1
.
3
.
5
S
e
t
t
i
n
g
D
e
t
a
i
l
e
d
I
n
f
o
r
m
a
t
i
o
n
1
.
3
.
5
S
e
t
t
i
n
g
D
e
t
a
i
l
e
d
I
n
f
o
r
m
a
1
.
3
.
5
S
e
t
t
i
n
g
D
e
t
a
i
l
e
d
I
n
f
o
r
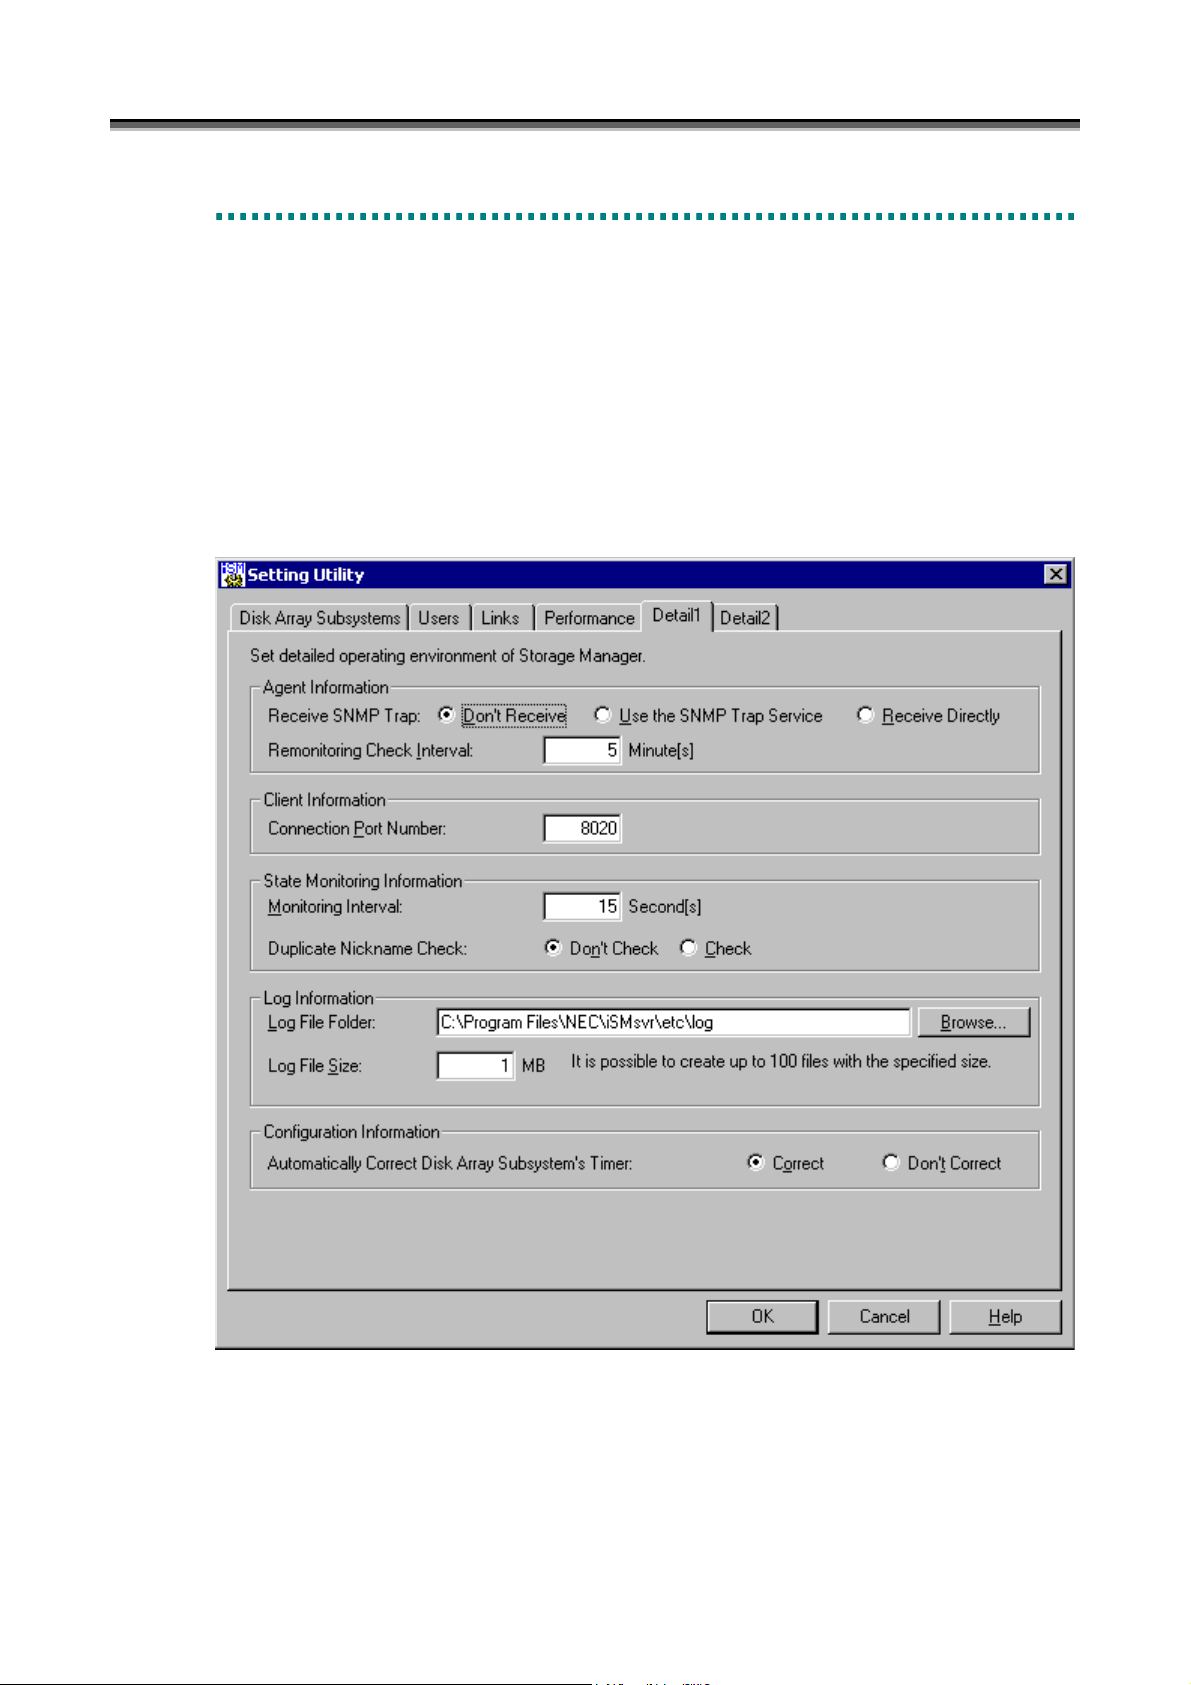
(1) Detailed information screen - 1
Set agent information, client information, state monitoring information, log information, and configuration
information on the Setting Utility screen shown below. Since the default values are recommended for the
information, there is no need to make any settings on this screen in ordinary operation.
To start the Setting Utility screen, select [Start] → [Programs] ([All Programs] for Windows Server 2003) →
[Storage Manager Server] → [Setting Utility], or select [Server Menu] → [Setting Utility]. If having changed
the environment setting, restart the iSM server. Information set on each screen is saved by clicking the [OK]
button.
m
a
t
t
i
o
n
i
o
n
(i)
(ii)
(iii)
(iv)
(v)
(vi)
(vii)
(viii)
Figure 1-12 Detailed Information Screen - 1
I-17
Page 24
Chapter 1 Server Installation
• In [Agent Information], set information regarding agent management
(i) Receive SNMP Trap
Select the receiving method in [Receive SNMP Trap]. SNMP trap is information sent from the disk array to
notify the iSM server of state transition of hardware, etc. It is enabled only for disk arrays monitored by
TCP/IP connection.
Don’t Receive: SNMP trap is not received.
Use the SNMP Trap Service: SNMP trap is received via the SNMP trap service.
Receive Directly: The iSM server receives it by using the port 162.
1. When you select [Use the SNMP Trap Service], SNMP Trap Service must be installed. When you select
[Receive Directly], a conflict with application collecting SNMP trap as SNMP Trap Service occurs. In
this case, don’t select [Receive Directly].
2. Disk arrays can be monitored even without SNMP trap being received. Performance may be degraded if
network security is compromised. Therefore, [Don’t Receive] should be selected.
(ii) Remonitoring Check Interval
When a trouble occurs in the connection between iSM server and the disk arrays, iSM server will stop the
monitoring of the disk arrays for a time, and later it will restart monitoring automatically.
In [Remonitoring Check Interval], specify an interval for checking whether the monitoring of disk arrays can be
restarted. The default value is 5 (minutes). A value from 1 to 60 can be specified.
• In [Client Information], specify information regarding the iSM client.
(iii) Connection Port Number
In [Connection Port Number], specify the port number of the iSM server to which the iSM client connects.
For the iSM client, refer to 5.2 “Client Start/Stop” in Part III “Operations”. The default value is 8020. A
value from 1 to 65535 can be specified.
• In [State Monitoring Information], specify information regarding the monitoring of the disk array status.
(iv) Monitoring Interval
In [Monitoring Interval], specify an interval for requesting status monitoring of disk arrays. The default value
is 15 (seconds). A value from 1 to 3600 can be specified.
For status monitoring, refer to 3.2 “State Monitoring” in Part II “Functions”.
(v) Duplicate Nickname Check
Determine whether to make a duplication check on identifiers that are assigned to components in the disk arrays
to be managed by iSM.
In [Duplicate Nickname Check], specify whether or not to execute the duplicated check for the identification
names of the components in the disk arrays that are targets of the iSM management.
Components to be checked in a duplicated manner are as follows:
y Disk Array Name
y Logical Disk Name
I-18
Page 25
Chapter 1 Server Installation
y Port Name
Don’t Check: does not execute duplicated check.
Check: executes duplicated check.
• In [Log Information] specify information regarding logs.
(vi) Log File Folder
In [Log File Folder], specify a folder that saves a file for outputting operation logs of iSM server. To change
the folder, use the [Browse] button to specify an existing folder. Specification uses up to 245 bytes.
For operation logs, refer to 3.5 “Log Output”.
(vii) Log File Size
In [Log File Size], specify the size (upper limit) of the file for outputting operation logs. The default value is 1
(MB). A value from 1 to 10 can be specified.
A serial number is assigned to each log file. Up to 100 files with the specified size are created.
• In [Configuration Information], specify the information about configuration setting function
(viii) Automatically Correct Disk Array Subsystem’s Timer
In [Automatically Correct Disk Array Subsystem’s Timer], specify whether or not to correct the time in the disk
array by using the server automatically.
Correct: corrects the time in the disk array automatically.
Don’t Correct: does not correct the time in the disk array automatically.
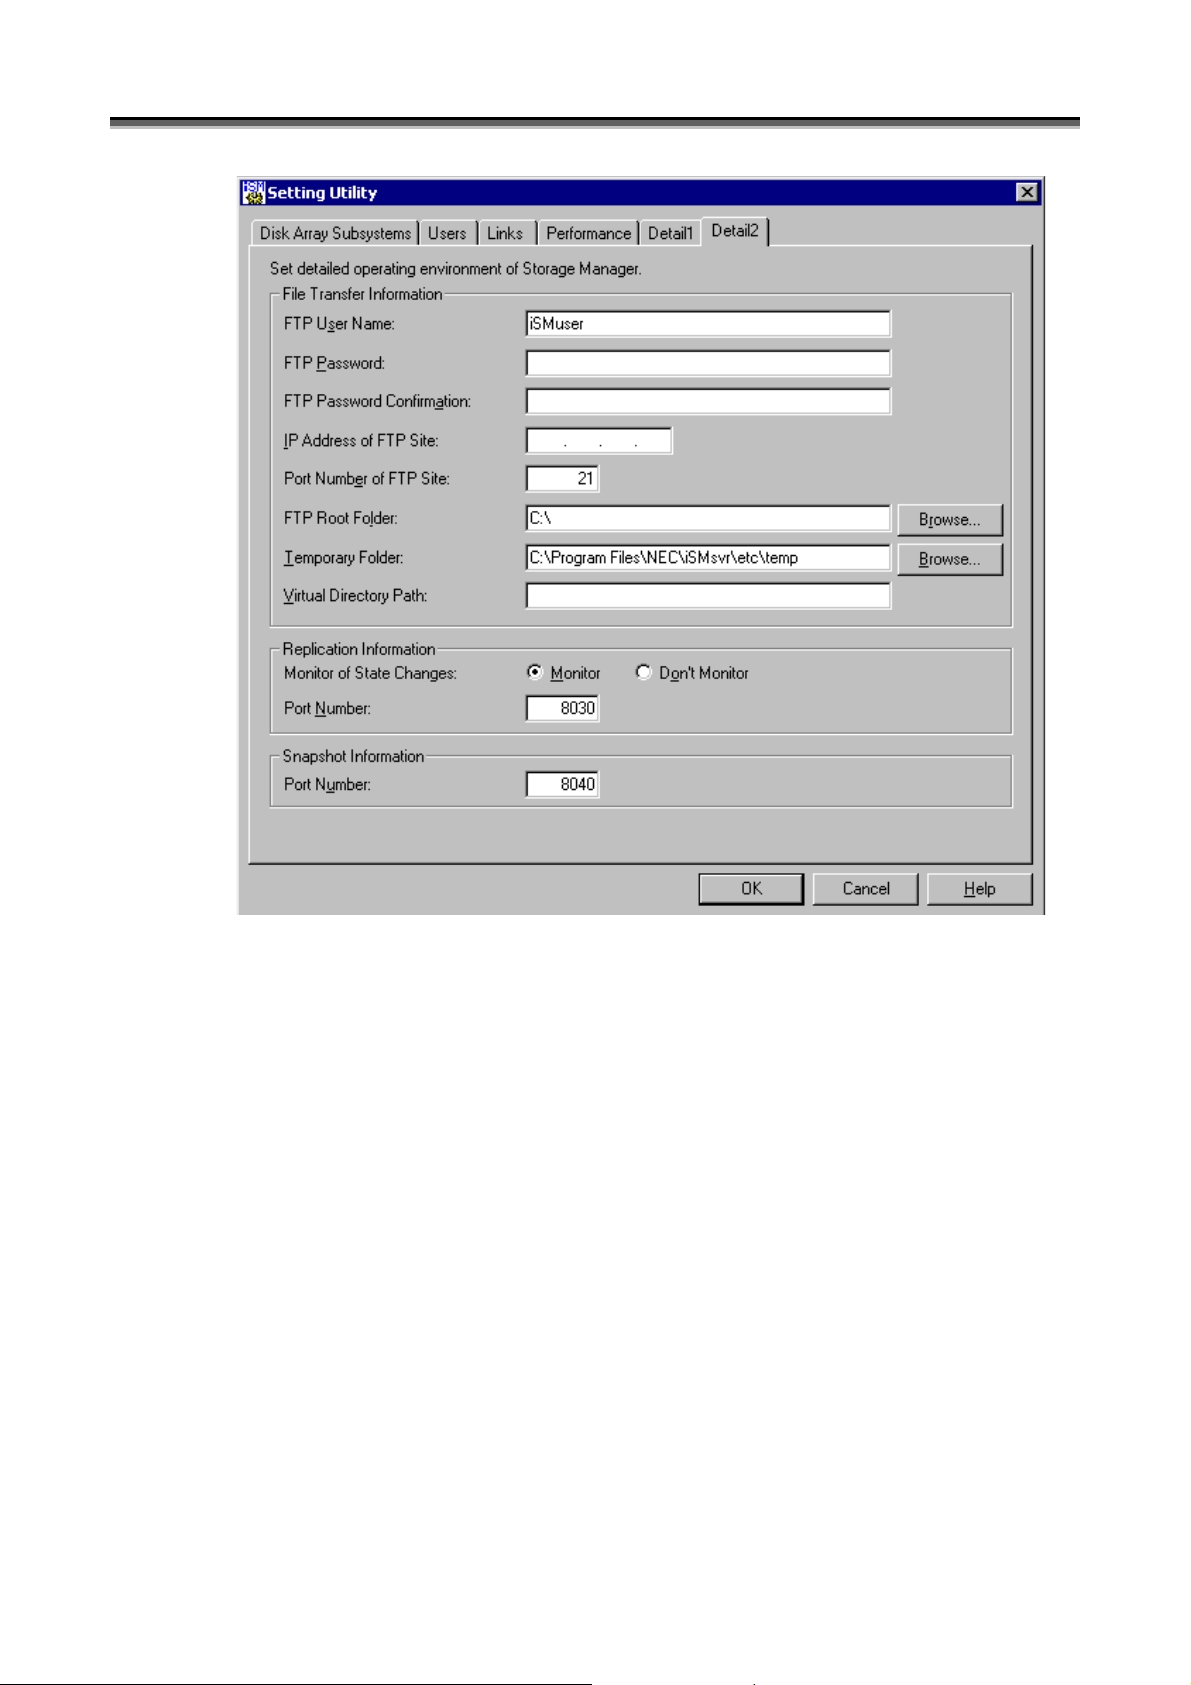
(2) Detailed information screen - 2
File transfer information, replication information, and snapshot information settings are set in the following
setting screen. To use the file transfer function, items in [File Transfer Information] must be specified. In
normal operation, no settings are required in this screen since these items are set to the recommended default
values.
I-19
Page 26
Chapter 1 Server Installation
(ix)
(x)
(xi)
(xii)
(xiii)
(xiv)
(xv)
(xvi)
(xvii)
(xviii)
(xix)
Figure 1-13 Detailed Information Screen - 2
• In [File Transfer Information], specify information regarding the file transfer function.
To transfer files between the iSM server and iSM client, the iSM internally uses the FTP through the following
operations of the iSM client.
Therefore, the FTP site environment (installation of IIS FTP Publishing Service and building of the FTP site) must
be built on the iSM server node before the iSM server is operated.
y Selecting [Get Configuration Setting Info.] on the configuration setting screen
y Selecting [Download Statistic Information files] on the performance screen
y Selecting [Busy Ratio Graph] and [Replacement Effect Prediction] on the performance optimization screen
y Selecting [Difficulty Information Gather] on the main screen (iSM client)
When these functions are not used, settings for file transfer are unnecessary.
(ix) FTP User Name
Specify the name of an FTP user who is to make FTP connection from the iSM client to the iSM server node.
You can specify only an FTP user who is permitted to use the FTP and authorized to read from and write to the
folder specified for [Temporary Folder].
The default user name is iSMuser. The FTP user name can be specified with up to 32 bytes.
I-20
Page 27

Chapter 1 Server Installation
(x) FTP Password
Specify the password of the user specified for [FTP User Name].
If using “anonymous” or “ftp” as the FTP user, specify the mail address. The FTP user password can be
specified with up to 58 bytes.
(xi) FTP Password Confirmation
For confirmation, enter the same value as for [FTP Password].
(xii) IP Address of FTP Site
Specify the IP address to be used as the FTP connection destination from the iSM client. If the IP address of
the FTP site is not specified, the system automatically gets the IP address of the iSM server node and uses it as
the FTP connection destination.
Set a suitable IP address in the following cases:
y An IP address is explicitly written in the specification of the IP address of the FTP site.
(Select [Properties] of the FTP site used by iSM → [FTP Site] → [Identification] → [IP Address], in which an
IP address has been specified.)
y The iSM server is used in cluster environment.
In particular, to operate the FTP service in cluster environment, place the iSM server and the FTP service in
the same failover group, and specify a floating (virtual) IP address. To operate the FTP service starting as a
service in cluster environment, specify the real IP address.
* Do not specify “127.0.0.1”, “0.0.0.0”, or “255.255.255.255” as an IP address.
(xiii) Port Number of FTP Site
Specify the port number of the FTP site to be used by iSM.
Select [Properties] of the FTP site used by iSM → [FTP Site] → [Identification] → [TCP Port], in which a port
number has been specified. The port number must be specified here. The default port number is 21.
(xiv) FTP Root Folder
Specify the root folder of the FTP site to be used by iSM.
Select [Properties] of the FTP site used by iSM → [Home Directory] → [FTP Site Directory] → [Local Path],
in which a path has been specified. The path must be specified here. The default root folder is the drive in
which the iSM server is installed. The root folder can be specified with up to 192 bytes.
* If not specifying a virtual directory path:
Select [Properties] of the FTP site used by iSM → [Home Directory] → [FTP Site Directory], in which check
permission for both read and write.
(xv) Temporary Folder
Specify the folder (the local directory of the computer on which the iSM server operates) that is to be used as a
temporary folder when the iSM uses the FTP. If a network resource or network directory is specified, the file
transfer function may not operate correctly.
This folder (drive) needs a free space of 300MB × the number of files concurrently transferred or more. If the
drive containing the iSM server does not have a free space large enough, specify the folder of a drive having a
free space large enough.
If not using the default folder, give the group administrators “Full Control” access authority to the specified
folder and the high-level folders.
Also authorize the user specified for [FTP User Name] to read from and write to the folder specified here.
The default folder is “installation destination folder\etc\temp”. The folder can be specified with up to 192
bytes.
I-21
Page 28

Chapter 1 Server Installation
* In particular, to operate the FTP service under cluster control in cluster environment, you should place the
iSM server and the FTP service in the same fail over group on the local disk.
(xvi) Virtual Directory Path
If using a virtual directory, specify the path for the user, specified for [FTP User Name], to access [Temporary
Folder] through the FTP. The path can be specified with up to 192 bytes.
If [FTP Root Folder] is at a higher level than [Temporary Folder] (or if the folders are identical), [Virtual
Directory Path] need not be specified. The following shows examples:
Example 1: FTP Root Folder: C:\
Temporary Folder: C:\Program Files\NEC\iSMsvr\etc\temp
In this case, the temporary folder can be accessed through the path “/Program
Files/NEC/iSMsvr/etc/temp” in the FTP. Thus, a virtual directory path need not be specified.
Example 2: FTP Root Folder: C:\Program Files\NEC\iSMsvr\etc\temp
Temporary Folder: C:\Program Files\NEC\iSMsvr\etc\temp
In this case, the temporary folder can be accessed through the path “/” that is to the temporary
folder. Thus, a virtual directory path need not be specified.
In other cases, a virtual directory needs to be created and a virtual directory path needs to be specified. The
following shows examples:
Example 3: FTP Root Folder: C:\InetPub\FTPRoot
Temporary Folder: C:\Program Files\NEC\iSMsvr\etc\temp
If a virtual directory is created under the conditions below, specify “/iSMftp” for [Virtual
Directory Path]. In this case, the temporary folder is accessed through the path “/iSMftp” in the
FTP.
Alias: “iSMftp”
Path: “C:\Program Files\NEC\iSMsvr\etc\temp”
Example 4: FTP Root Folder: C:\InetPub\FTPRoot
Temporary Folder: D:\iSM\temp
If a virtual directory is created under the conditions below, specify “/iSMftp2” for [Virtual
Directory Path]. In this case, the temporary folder is accessed through the path “/iSMftp2” in the
FTP.
Alias: “iSMftp2”
Path: “D:\iSM\temp”
Example 5: FTP Root Folder: C:\InetPub\FTPRoot
Temporary Folder: D:\iSM\temp
If a virtual directory is created under the conditions below, specify “/iSMftp3/temp” for [Virtual
Directory Path]. In this case, the temporary folder is accessed through the path “/iSMftp3/temp”
in the FTP.
Alias: “iSMftp3”
Path: “D:\iSM”
* For the path to be specified in creating a virtual directory, be sure to specify the local directory of the
computer on which the iSM server operates. If a network resource or network drive (or a directory under the
drive) is specified, the file transfer function may not operate correctly.
* If specifying a virtual directory path (using a virtual directory), give access permission for both read and write
during creation of the virtual directory.
I-22
Page 29

Chapter 1 Server Installation
The file transfer function of iSM is operated with FTP. An FTP command of Windows is used on the iSM client
side and an FTP server of each OS is used on the iSM server. In this case, only active mode (PORT mode) is used
as FTP data transfer function. Therefore, if there is a firewall or NAT in the network between the iSM client and
the iSM server, the file transfer function may not be available.
Before attempting to operate iSM, be sure to connect the FTP (and perform get and put processing) through the
command prompt on the computer on which the iSM client operates, and confirm that the items in [File Transfer
Information] are set correctly.
• In [Replication Information], specify information regarding the replication function.
(xvii) Monitor of State Changes
Determine whether to monitor the transition of the replication states.
Monitor: The replication state transition is monitored.
Don’t Monitor: The replication state transition is not monitored.
(xviii) Port Number
Specify the number of the port to be used when the ReplicationControl command is issued via iSM. A value
from 1 to 65535 can be specified. The default value is 8030.
• In [Snapshot Information], specify information regarding the snapshot function.
(xix) Port Number
Specify the port number to be used when the SnapControl command is issued via iSM. A value from 1 to
65535 can be specified. The default value is 8040.
I-23
Page 30

Chapter 2 Client Installation
Chapter 2 Client Installation
2
.
1
O
p
e
r
a
t
i
n
g
E
n
v
i
r
o
n
2
.
1
O
p
e
r
a
t
i
n
g
E
n
v
i
2
.
1
O
p
e
r
a
t
i
n
g
E
(1) Network Environment Setting
Because TCP/IP socket communication is used between the iSM server and iSM client, which are operated on the
PC, TCP/IP connection environment with the concerned server should be bound for network environment
definitions of personal computer.
(2) Operating environment
The iSM client operates on the personal computer that has Windows 2000 (SP2 or later)/Windows XP/Windows
Server 2003 operating system.
Table 2-1 Required Memory Capacity -1
Main screen 21 (41) MB or more
Configuration setting screen 13 (22) MB or more
Replication screen 16 (29) MB or more
Performance monitoring screen 9 (17) MB or more
Performance optimization screen 7 (15) MB or more
Fault information gathering screen 10 (16) MB or more
Snapshot screen 7 (15) MB or more
n
v
r
i
r
o
o
n
n
m
m
m
e
e
e
n
n
n
t
t
t
* Memory capacity in addition to those for main memory is required for displaying a screen other than main
screen. The memory capacity is required when operating iSM client.
A value enclosed in parentheses indicates the memory capacity required when the iSM client operates under the
64-bit version of the operating system.
Table 2-2 Required Memory Capacity -2
Performance analysis supporting
tool
* In addition to the memory capacity for operating the iSM client, the above memory capacity is necessary for
operating the performance analysis supporting tool.
A value enclosed in parentheses indicates the memory capacity required when the iSM client operates under the
64-bit version of the operating system.
Table 2-3 Required disk capacity
For only basic functions 21 MB or more
For basic+extended functions 37 MB or more
* The values above do not include file size for CSV output, etc.
9 (18) MB or more
I-24
Page 31

Chapter 2 Client Installation
2
.
2
I
n
s
t
a
l
l
a
t
i
o
n
a
n
d
S
e
t
t
i
n
g
2
.
2
I
n
s
t
a
l
l
a
t
i
o
n
a
n
d
S
e
t
2
.
2
I
n
s
t
a
l
l
a
t
i
o
n
a
n
d
2
.
2
.
1
i
S
M
C
l
i
e
n
t
I
n
s
t
a
l
l
2
.
2
.
1
i
S
M
C
l
i
e
n
t
I
n
2
.
2
.
1
i
S
M
C
l
i
e
n
The iSM client should be pre-installed on the personal computer. To install the iSM client, follow the procedure
below.
(1) Log on as the Administrator.
(2) Select an installation program by using [Add/Remove Programs] ([Add or Remove Programs] for Windows XP
or Windows Server 2003) in [Control Panel]. Installation programs are stored in the following location.
<If the client is to be installed on Windows 2000>
CD-ROM drive:\CLIENT\2000\
<If the client is to be installed on either Windows XP or Windows Server 2003>
CD-ROM drive:\CLIENT\XP\
(3) Follow the instruction of the installer.
The default destination of installation is “Program files\NEC\iSMClient” in the system drive.
(4) During installation, the Setup Type selection screen is displayed.
You can select the basic function (including configuration setting) or the basic+extended function (including
performance monitoring, replication, access control, LD Administrator, performance optimization, cache
partitioning, and snapshot) on this screen. Select either one that matches the server. (You can change the setup
type easily by reinstalling the client.)
s
t
I
n
s
a
t
a
l
l
a
t
a
l
l
a
S
t
t
t
t
e
t
t
i
o
n
i
o
n
i
o
n
i
n
g
i
n
g
Figure 2-1 Setup Type Selection Screen
I-25
Page 32

Chapter 2 Client Installation
(5) If the iSM client is installed in the environment in which ESMPRO Manager has been installed, a screen for
confirming link with ESMPRO Alert Manager appears. Make setting on the screen as needed. For details,
refer to 3.7.4 “Link between ESMPRO Manager and ESMPRO Alert Manager”.
(6) After installation, various settings are needed on the Environment Settings screen. For details, refer to 5.2.1
“Client Start” and Help of the iSM client. To register menus in the operation window of ESMPRO Manager,
install ESMPRO Manager first. Since this operation is executed automatically, you do not need to execute
specific operation.
Figure 2-2 Registered iSM Client Start Menu
Only a single iSM client can be installed in a PC. Multiple clients, however, can be activated simultaneously by
defining an environment for each iSM server to be connected. For details, refer to 5.2.1 “Client Start” and iSM
client help.
I-26
Page 33

Chapter 2 Client Installation
2
.
2
.
2
i
S
M
C
l
i
e
n
t
U
n
i
n
s
t
a
l
l
a
t
i
o
n
2
.
2
.
2
i
S
M
C
l
i
e
n
t
U
n
i
n
s
t
a
l
l
a
2
.
2
.
2
i
S
M
C
l
i
e
n
t
U
n
i
n
s
t
To uninstall the iSM client, follow the procedure below.
(1) Log on as the Administrator.
(2) Remove “Storage Manager Client” by using [Add/Remove Programs] ([Add or Remove Programs] for Windows
XP/Windows Server 2003) in [Control Panel]. Because setting information etc. is not deleted, reinstallation is
easy.
Uninstalling the iSM client deletes all of the icons on the desktop and the menu items. If you are to re-install the
iSM client after uninstalling it, copy the icon on the desktop to an appropriate folder before uninstalling it.
After re-installing it, copy the saved icon to the following folder on the system drive.
<Desktop icon>
\Documents and Settings\All Users\Desktop
<[Start] menu icon> * When the default value is the program folder
\Documents and Settings\All Users\Start Menu\Program\iSM Client
To restore the icon to the state where uninstallation was not made, copy it to the folder above.
Re-install the iSM client in the folder from which the client was uninstalled. Otherwise, the icon reference will be
nullified.
a
t
l
l
a
t
i
o
n
i
o
n
2
.
2
.
3
i
S
M
C
l
i
e
n
t
U
p
d
a
t
e
a
a
b
b
b
t
t
e
e
e
e
e
t
t
t
w
w
w
e
e
e
e
e
e
n
n
n
S
e
r
v
e
r
a
n
d
C
l
i
e
n
S
e
r
v
e
r
a
n
d
C
S
e
r
v
e
r
a
n
d
C
l
l
t
i
e
n
i
e
n
2
.
2
.
3
i
S
M
C
l
i
e
n
t
U
p
2
.
2
.
3
i
S
M
C
l
i
e
n
t
To update the iSM client, uninstall the software and then install it.
For details on the procedure, refer to 2.2.1 “iSM Client Installation” and 2.2.2 “iSM Client Uninstallation”.
2
.
3
R
e
l
a
t
i
o
n
2
.
3
R
e
l
a
2
.
3
R
V
V
V
In general, connecting the iSM client to the other version of iSM server is not allowed. (The value of x.y. of x.y.z. of
a version is compared here. z should be disregarded.)
However, during operations while waiting for subsystem and in other temporarily unavoidable circumstances, use it
temporarily in an environment where the version of the iSM client is newer than the version (V1.5 or later) of iSM
server. The functions which can be used are limited to the functional range of the version of the iSM server at this
time.
e
e
e
e
t
l
a
t
r
s
i
r
s
i
r
s
i
i
i
o
o
o
o
o
n
n
n
n
n
s
s
s
s
s
s
h
U
h
h
i
p
i
i
p
p
p
d
d
t
t
I-27
Page 34

Chapter 2 Client Installation
This page is intentionally left blank.
I-28
Page 35

P
a
r
t
I
I
F
u
n
c
t
i
o
n
s
P
a
r
t
I
I
F
u
n
c
t
i
P
a
r
t
I
I
F
u
n
c
o
t
i
o
n
n
s
s
Page 36

Chapter 3 Basic Functions
r
Chapter 3 Basic Functions
Chapter 3 explains the function that can be used when the iSM is introduced. The basic function provides the following function
necessary for disk array operations such as the display function of physical disk configuration in the disk array and logical disk
configuration that can be recognized from the business server.
• Configuration display: A function that displays the configuration information of physical and logical components (resources)
that configure the disk array.
• Status monitoring: A function that displays the status of components (resources) that configure the disk array.
• Configuration setting: A function that configures the disk array and implements logical components.
• Fault monitoring: A function that informs the fault information in the disk array in real time.
• Log output: A function that outputs the fault information and the operating information as the operation history for
system log file and exclusive log file.
• Event link: A function that executes the action on the notice to the operator and server upon the occurrence of
operating information and fault information.
The basic function is composed of the above-mentioned 6 functions, and the efficient operation of disk array is possible by using
these functions. The detail functions are described in the following section.
3
.
1
C
o
n
f
i
g
u
r
a
t
i
o
n
D
i
s
p
l
a
y
3
.
1
C
o
n
f
i
g
u
r
a
t
i
o
n
D
i
s
3
.
1
C
o
n
f
i
g
u
r
a
t
i
o
n
D
Configuration display function displays the physical resource configuration that configures the disk array and the logical
disk recognized from the business server. The configuration management of two or more disk arrays is possible in the
iSM. Two or more disk arrays can be centrally monitored on the same view from the iSM client.
Storage Manage
Disk array
Operation administrator
Controller (DAC)
Figure 3-1 Operation Image
p
i
s
p
l
a
y
l
a
y
Configuration display screens
Logical disks
Disk enclosure (DE)
Physical disks
II-2
Page 37

Chapter 3 Basic Functions
3
.
1
.
1
S
u
m
m
a
r
y
o
f
F
u
n
c
t
i
o
n
3
.
1
.
1
S
u
m
m
a
r
y
o
f
F
u
n
c
3
.
1
.
1
S
u
m
m
a
r
y
o
f
F
u
(1) Display Function
The display function shows the information of the disk array, physical resource configuration that configures the
disk array and the information of logical disk recognized by a business server through an iSM client. (Table 3-1)
Table 3-1 Display Information List
Section Display Information
Disk array related Disk Array Name
Pool related (*1) Pool Name
Logical disk related Logical disk name (including OS type)
Logical components
n
c
t
t
i
o
n
i
o
n
Monitoring state (by iSM/Server)
(Operating) Status
Operating status for each component
Product ID
Product FW REV
Serial Number
SAA (SubsystemAbsoluteAddress)
World Wide Name
Total capacity (data physical disk)
Control Path
Cross Call information
Cache partitioning function state
User system code
Revision of storage control software
Access Control information
Product status
Type
Pool Number
(Operating) Status
Expansion State
Progress Ratio
RAID type
Capacity
Used capacity
Snapshot capacity
Snapshot control capacity
Snapshot used capacity
Snapshot threshold
Snapshot reserve area list
Configuration logical disk list
Configuration physical disk list
Number
(Operating) status
RAID type
Capacity
RANK number (*2)
Pool Number (*1)
Pool Name (*1)
Existence of cache resident
Progress ratio (At Formatting/Rebuilding/Copy back/
Expanding)
RPL type
Snapshot type
Link
Logical disk information during link
Group
Purpose
Cache segment name
Ownership
Physical disk list
Access Control information
II-3
Page 38

Chapter 3 Basic Functions
Physical disk related Number (Group number - Position number)
Physical components
Controller related Component type (*3)
Disk enclosure related Component type (*5)
*1 Displayed if the disk array to be monitored is a disk array with pool.
*2 Displayed if the disk array to be monitored is other than a disk array with pool.
*3 Director, Cache module, Service processor, Power supply, Battery, Fan, Temperature, Backboard, Junction
box, Panel, Maintenance PC, Power control card
*4 The displayed contents vary depending on the component.
*5 Adapter, Power Supply, FAN, Temperature, Back Board, and EC Junction Box
(2) Configuration information Output Function
Section Display Information
(Operating) status
Capacity
Rotation speed
Product ID
Product Rev
Serial number
RANK number (*2)
Pool Number (*1)
Pool Name (*1)
Section
(Rebuilding) Progress ratio
Configuration logical disk list
(Operating) status
Information of each component (*4)
(Operating) status
Information of each component (*4)
Outputs the configuration information of the disk array to a CSV format file.
Select [File] → [CSV Output of Information List Display] from menu and specify the storage place and filename
from dialog.
3
.
1
.
2
S
c
r
e
e
n
c
o
m
p
o
s
i
t
i
o
n
o
f
i
S
M
m
a
i
n
w
i
n
d
o
3
.
1
.
2
S
c
r
e
e
n
c
o
m
p
o
s
i
t
i
o
n
o
f
i
S
M
m
a
i
n
w
i
3
.
1
.
2
S
c
r
e
e
n
c
o
m
p
o
s
i
t
i
o
n
o
f
i
S
M
m
a
i
n
This subsection describes about the screen composition of the main window in iSM client.
Figure 3-2 is a main window of iSM client displayed right after logging in to iSM server.
The iSM main window consists of the “configuration display area”, “information list display area”, and “message
display area”.
Refer to 5.2.1 “Client Start” for how to start the main window.
w
n
i
n
d
d
o
o
w
w
w
II-4
Page 39

Chapter 3 Basic Functions
Menu Bar
Configuration
Display Area
Title Bar
Information List
Display Area
Message Display Area
To ol b ar
Status Bar
(1) Title Bar
Displays the element name currently selected in the configuration display area, in the following format:
State - (element name)
If more than one connection is defined, the Title Bar displays the nickname of a connection and the element name
currently selected in the configuration display area, in the following format:
nickname : State - (element name)
(2) Menu Bar
Performs various operations by selecting necessary item from menu.
Refer to Help about the details.
(3) Toolbar
Includes the buttons which are used frequently among menu function such as [Connection], [Disconnection],
[Replication], [Performance], [Configuration], [Optimizer], [Snapshot] and [Stop Alarm]. The [Replication],
[Performance], [Optimizer] and [Snapshot] buttons are displayed when the iSM client is installed with “basic +
extended function”.
Refer to Help about the details.
(4) Status Bar
Figure 3-2 iSM Main Window
The Status bar in the lowest line is the area that displays the current status of the iSM client. During the
establishment of session, [Con.]/IP address or DNS name of server/port number of server/client name/user
level/Types of display components and number of display items are displayed.
II-5
Page 40

Chapter 3 Basic Functions
(5) Configuration display area
Displays the configuration (physical/logical) of the disk array as a management object in a configuration display
area. The disk array as a management object is a disk array that is defined inside the iSM server that the iSM
client connects to, and also displays the following configuration information of the disk array in a Tree View form
divided into “Disk array layer”, “Component layer“, and “Individual Component layer“ in the configuration
display area.
Disk array layer: Displays the disk arrays managed by the iSM
server.
Component layer: Displays the categories of resources that make up
Individual Component layer: Displays lists of physical disks and
Figure 3-3 Configuration Information Display in Tree View
The configuration display area displays the management target’s status, which is expressed by the shape and shade
(dark/light) of the icon.
Refer to the explanation of icons on each information list screen for details on the icons.
(a) Disk array layer
The disk array list and operating status/monitoring state that the iSM server manages are displayed through the
icons.
(b) Component layer
The category of resource that configures the disk array is classified and displayed into the following 5 categories.
- Pool: The assembly of pool bound in the disk array (*1)
- Logical disk: The assembly of logical disk bound in the disk array
- Physical disk: Physical disk filed in the disk array
- Controller: The assembly of control system resource in the disk array and composed of director, cache
module, adapter, power supply, fan, etc.
- Enclosure: A disk enclosure unit that stores physical disk and is composed of adapter, power supply, fan and
etc. Enclosure is not provided depending on your system configuration
the disk array.
logical disks that have been
bound/installed.
II-6
Page 41

Chapter 3 Basic Functions
The component layer displays a list of components and each component’s operating/monitoring state with the
icon.
*1 Pool-related information is displayed if the disk array to be monitored is a disk array with pool.
(c) Individual component layer
It displays the logical disk and physical disk list, and each operating status/monitoring state through icons.
Depending on the environmental setting, the logical disk number or logical disk name is indicated as the
identification information of logical disk. For details on the setting method, refer to 5.2 “Client Start/Stop”.
For the logical disk list, when the snapshot function is used, snapshot-volume (SV) and link-volume (LV) can be
set to non-display. For details on the setting method, refer to 5.2 “Client Start/Stop”.
To display the selected information of a component, right-click on the component and select [Properties].
(6) Information list display area
It displays information on components that is one class lower than the selected class (with left click) in the
configuration display area. If selecting the disk array in the configuration display area, it displays the resource
(“Pool” (*1), “Logical Disk”, “Physical Disk”, “Controller”, “Disk Enclosure”) information composed of the disk
array in the list, and if selecting the logical disk, it displays the information of logical disk in the list.
Displays the following screen according to selected component in the configuration display area.
- Disk Array Subsystem list screen: displays disk array name and operating status
- Component list screen: displays the operating status for each component
- Pool list screen: displays pool name, operating status, and various attribute information.
(*1)
- Logical Disk list screen: displays logical disk name, operating status, and various attribute
information
- Physical Disk list screen: displays operation state of physical disk and various attribute information
- Controller list screen: displays the operation state by component
- Disk Enclosure list screen: displays the operation state for each component
*1 Pool-related information is displayed if the disk array to be monitored is a disk array with pool.
(7) Message display area
Messages that indicate the fault and operating status of the disk array and iSM itself are displayed in this area.
Double-clicking on a message displays the Help information of the message. Refer to the “Messages Handbook”
for the contents of the messages.
II-7
Page 42

Chapter 3 Basic Functions
3
.
1
.
3
D
i
3
.
1
.
3
3
Disk array information is displayed in both “Disk Array Subsystem list screen” which is displayed in the configuration
display area and information list display areas, and “Disk Array Subsystem details information screen” which is
displayed as disk array property information.
In this section, each item displayed as disk array information is described.
(1) Disk Array Subsystem list screen
.
1
.
3
A screen (Figure 3-4) displayed in configuration display area when [iSM server] is selected and it displays the
disk array name and operating status.
D
D
s
i
s
i
s
k
k
k
A
A
A
r
r
a
y
I
n
f
o
r
m
a
t
i
o
n
D
i
s
p
l
a
y
r
r
a
y
I
n
f
o
r
m
a
t
i
o
n
D
i
s
r
r
a
y
I
n
f
o
r
m
a
t
i
o
n
D
p
i
s
p
l
a
y
l
a
y
Figure 3-4 Disk Array Subsystem List Screen
(i) Icon (operating state/monitoring state of the disk array)
It displays the integrated operating state of disk array component and monitoring state from iSM server to the
disk array by using the icon next to disk array name.
II-8
Page 43

Icon Status
l, etc.
, etc.
Chapter 3 Basic Functions
Table 3-2 Display Icons
These icons are monitoring state where all disk array components are in normal
status. The icon’s shape differs by disk array type.
This icon is a monitoring state where an event or fault (except critical fault)
that needs “maintenance” occurred in any disk array components. (Note 1
and 2)
This icon is a monitoring state where a critical fault occurred in any disk
array components. (Note 2)
This icon is a monitoring state where “threshold excess” occurred in any pool
for snapshot. (Note 3)
These icons show that the disk array is in monitoring stop status or under
configuration setting. The icon’s shape differs by disk array type.
This shows monitoring stop status or under configuration setting.
If this icon is displayed, an event or fault (except critical fault) that needs
“maintenance” occurred in any disk array components just before stopping
monitoring.
This shows monitoring stop status or under configuration setting.
If displaying this icon, a critical fault has occurred in any disk array
components just before stopping monitoring.
This shows monitoring stop status or under configuration setting.
Note 1 If an event or fault (except critical fault) that needs “maintenance” occurred, the disk array icon can be
switched between “ ” and “ ”. Switching is executed at [Display Maintenance State] in
environment setting dialog by selecting [File] → [Environment Settings] from the menu. Refer to 5.2
“Client Start/Stop” for details.
Note 2 Although a component fault is displayed by “ ”, whether this icon deserves the critical fault or not is
decided at a higher layer, and the icon according to the status is displayed. Please refer to 3.2.2
“Description of screen and operation” about the component status icon and display in higher layer.
Note 3 If a threshold excess occurred in pool for snapshot, the icon “ ” is displayed. If, however, the
integrated operating state of a disk array component is faulty or an event or fault (except critical fault)
that needs “maintenance” occurred, the icon displays the integrated operating state. For details on
actions to be taken when a threshold excess occurred, refer to the “Snapshot User's Manual (Function
Guide)” (IS030).
Note 4 The shade of icon indicates the monitoring state of target disk array. If icon is gray, the monitoring of
target disk array stops.
If displaying this icon, “threshold excess” has occurred in any pool for
snapshot just before stopping monitoring.
This icon indicates that disk array components are not being monitored.
If this icon is displayed, the SVP settings of the target disk array include an
incorrect IP address setting, or the target disk array could not be connected to
the iSM server.
II-9
Page 44

Chapter 3 Basic Functions
(ii) Disk Array Subsystem Name
Names for identifying disk arrays uniquely.
An optional name can be set to the disk array. Refer to 3.3 “Nickname Setting” for setting method.
(iii) State
Displays integrated operating state in the whole disk array at “State” column.
Ready: All disk array components are in normal operation.
Ready (Maintenance): An event that needs “maintenance” occurs in any disk array.
Fault: “Fault” occurs in any disk array component.
(iv) Monitoring State
Displays the monitoring state to the disk array at “Monitoring State” column.
Running: Status that monitoring is executing to the target disk array
Starting demand: Status that monitoring to the target disk array is starting
Configuration: Status that Configuration setting of the target disk array is under way
Stopping demand: Status that monitoring stop processing to the target disk array by user specification is
Stop: Status that monitoring to the target disk array by user specification is stopping
Stop(Maintenance): Status that monitoring to the target disk array is stopping because of maintenance
Stop(Fault): Status that monitoring to the target disk array is stopping because of fault detection
Wait Recovery: Status that monitoring on disk array was disabled due to disk array failure or control
Unknown: Status in which disk array components are not being monitored. This state includes
(v) SAA
Subsystem Absolute Address (56 hexadecimal digits) of the identification information of disk array is displayed
at the “SAA” column.
executing
operation such as configuration change
path failure, and therefore recovery of the monitoring on the disk array is waited for
that the SVP settings of the target disk array include an incorrect IP address setting,
or the target disk array could not be connected to the iSM server.
II-10
Page 45

Chapter 3 Basic Functions
(2) Disk Array Subsystem details information screen
These screens (Figures 3-5, 3-6, and 3-7) are displayed if selecting (click the left button) optional disk array and
selecting by right clicking → [Properties] (or [View]→ [Properties] from menu) in configuration display area and
information list display, displaying detailed information of the disk array.
Figure 3-5 Disk Array Subsystem Details Information-1
(i) Name
The identification information of disk array. The display contents are the same as (1) “Disk Array Subsystem list
screen”.
(ii) Monitoring State
The monitoring state for the disk array. The display contents are the same as (1) “Disk Array Subsystem list
screen”.
When monitoring is waiting for recovery or stopping (failure), unknown causes of the failure on monitoring on
disk array are classified and displayed into the following three.
- Control path failure: Failure caused by control path (network failure, etc.)
- Disk array failure: Internal failure in disk array
- Others: Failure caused by management server
* For details of failures, refer to messages of operation log, etc. output upon a failure.
(iii) State
The integrated operating state for the entire disk array and disk array component. The display contents are the
same as (1) “Disk Array Subsystem list screen”.
II-11
Page 46

Chapter 3 Basic Functions
(iv) Product ID
Displays the product model name (maximum of 16 characters) in the disk array.
(v) Product FW Rev
Displays the Product Revision (4 characters) in the disk array.
(vi) Serial Number
Displays the product number (16 characters) in the disk array.
(vii) SAA
The identification information of disk array. The display contents are the same as (1) “Disk Array Subsystem list
screen”
(viii) World Wide Name
Displays the WWNN (World Wide Node Name) of the disk array.
This item is not displayed if the iSM of the server is Ver1.5 or earlier.
(ix) Total Capacity
Displays the total capacity of physical disk (total capacity of data disk) of the disk array in Gigabyte units (1 G
byte=1,073,741,824 byte) and Terabyte units. (1 T byte = 1,024 G byte).
(x) Control Path
Displays the control path to the disk array in the iSM server by the IP Address (in the case of LAN connection) or
FC pathname (disk information). Displays the path currently controlled (upper layer) and the path for switching
on the fault (lower layer), and displays “
occurs in switching paths on the fault.
Example 1) LAN connection:
Control Path (1): 123.123.123.1
Control Path (2): 123.123.123.2
Example 2) FC-AL connection
Control Path (1): disk9 (Port6 Bus0 Target40 Lun4)
Control Path (2): disk10 (Port6 Bus0 Target40 Lun5)
If switching path on the fault does not exist, display “-” in Control Path (2).
(xi) Cross Call
Displays any of the following as setting information for Cross Call function.
ON: Cross Call is valid
OFF (Auto Assignment OFF): Cross Call is invalid and Auto Assignment function is invalid
OFF (Auto Assignment ON): Cross Call is invalid and Auto Assignment function is valid
-: Cross Call function is not supported
” which indicates a fault next to the control pathname when a fault
(xii) CachePartitioning Function
As information about CachePartitioning function, either of the status below is displayed. This column does not
appear when CachePartitioning is not purchased.
ON CachePartitioning function is applied
OFF CachePartitioning function is not applied
(xiii) User System Code
If the user has made a contract for the maintenance service, the 10-digit user system code is displayed. If not,
“0000000000” is displayed.
II-12
Page 47

Chapter 3 Basic Functions
Even if a user has made a contract for the maintenance service, “0000000000” may be displayed depending on the
combination of iSM and the disk array.
(xiv) Revision of Storage Control Software
Displays the revision of storage control software.
Figure 3-6 Disk Array Subsystem Details Information-2
(xv) Access Control information
Displays information on Access Control of the disk array. Displayed information includes Access Control
ON/OFF, information on port, and information on LD.
For details, refer to the “Configuration Setting Tool User’s Manual (GUI)”.
II-13
Page 48

Chapter 3 Basic Functions
Figure 3-7 Disk Array Subsystem Details Information-3
(xvi) Product state
Displays the product information of the disk array.
II-14
Page 49

Chapter 3 Basic Functions
3
.
1
.
4
C
o
m
p
o
n
e
n
t
I
n
f
o
r
m
a
t
i
o
n
D
i
s
p
l
a
y
3
.
1
.
4
C
o
m
p
o
n
e
n
t
I
n
f
o
r
m
a
t
i
o
n
D
i
s
3
.
1
.
4
C
o
m
p
o
n
e
n
t
I
n
f
o
r
m
a
t
i
o
n
When selecting (click the left button) the disk array in configuration display area, the screen (dashed line in Figure 3-8)
is displayed and the operating state in each component is displayed.
D
p
i
s
p
l
a
y
l
a
y
Figure 3-8 Component List Screen
(i) Icon (operating state/monitoring state of disk array component)
Displays the operating state/monitoring state in each component with the icon next to component (pool
(*1)/logical disk/physical disk/controller/disk enclosure). (Enclosure is not provided depending on your system
configuration.)
II-15
Page 50

Chapter 3 Basic Functions
Icon Status
Table 3-3 Display Icons
etc.
Component (pool) is in normal operation (*1)
Component (logical disk) is in normal operation
Component (physical disk) is in normal operation
Component (controller) is in normal operation
Component (disk enclosure) is in normal operation
The event or fault (except critical fault) that needs “maintenance” in any component
occurs (Note 1 and Note 2)
“Critical fault” occurs in any component (Note 2)
This shows that “threshold excess” occurred in any pool for snapshot (Note 3).
These icons show that the disk array is in monitoring stop status or under configuration
setting.
This shows monitoring stop status or under configuration setting.
If this icon is displayed, an event or fault (except critical fault) that needs “maintenance”
occurred in any component just before stopping monitoring.
This shows monitoring stop status or under configuration setting.
If displaying this icon, a critical fault has occurred in any component just before stopping
monitoring.
This shows monitoring stop status or under configuration setting.
If this icon is displayed, “threshold excess” has occurred in any pool for snapshot just
before stopping monitoring.
Note 1. When the event or fault (except critical fault) that needs “maintenance” in any component occurs, whether
icon displays as “ ” or not, is based on the environment setting of the client. Switch in “Display
Maintenance State” in the environment setting dialog by selecting [File] → [Environment Settings] from
menu. Refer to 5.2 “Client Start/Stop” for details.
Note 2. Although a fault is displayed in “ ”, whether it deserves the critical fault is according to the
determination by the higher layer, and the specified icon is displayed. Refer to 3.2.2 “Description of Screen
and Operation” for status icon of component and display in the higher layer.
Note 3. If a threshold excess occurred in pool for snapshot, the icon “ ” is displayed. If, however, the integrated
operating state of pool is faulty or an event or fault (except critical fault) that needs “maintenance”
occurred, the icon displays the integrated operating state. For details on actions to be taken when a
threshold excess occurred, refer to the “Snapshot User's Manual (Function Guide)”.
Note 4. The shades of gray of icon indicate the monitoring status of a target disk array. When an icon is dimmed,
the monitoring of the corresponding disk array stops.
II-16
Page 51

Chapter 3 Basic Functions
(ii) Type
Displays the disk array component such as “Pool (*1)”, “Logical Disk”, “Physical Disk”, “Controller” and
“Enclosure” at “Type” column.
(iii) State
Displays the integrated operating state by the disk array component in “State” column.
Ready: Entire disk array component is in normal operation.
Ready (Maintenance): An event whereby “maintenance” is needed occurs in any disk array component.
Fault: “Fault” occurs in any disk array component.
(iv) Number of Elements
Displays the number of components included by type.
For the number of logical disk components, the number of all logical disks is always displayed regardless of
display setting of snapshot-volume (SV) and link-volume (LV) on the Environment Setting screen. For details
on the setting method, refer to 5.2 “Client Start/Stop”.
*1 Pool-related information is displayed if the disk array to be monitored is a disk array with pool.
3
.
1
.
5
P
o
o
l
I
n
f
o
r
m
a
t
i
o
n
D
i
s
p
l
a
y
3
3
.
1
.
5
P
o
o
l
I
n
f
o
r
m
a
t
i
o
n
D
i
s
.
1
.
5
P
o
o
l
I
n
f
o
r
m
a
t
i
o
n
D
p
i
s
p
l
a
y
l
a
y
If the disk array to be monitored is a disk array with pool, pool information is displayed in “pool list screen” which is
displayed in the configuration display area and information list display area, and “pool details information screen”
which is displayed as pool property information.
In this section, each item indicated as pool information is described.
(1) Pool list screen
A screen (dashed line in Figure 3-9) displayed by selecting (click the left button) [Pool] in configuration display
area. It displays various attribute information such as pool name, operating state, and capacity.
II-17
Page 52

Chapter 3 Basic Functions
Figure 3-9 Pool List Screen
(i) Icon (Pool Operating state/Monitoring state)
Displays the operating state/monitoring state of pool with the icon next to pool number.
Table 3-4 Display Icons
Icon Status
Pool is in normal operation
An event whereby “caution” is needed occurs in pool
“Fault” occurs in pool
This shows that “threshold excess” occurred in pool.
This icon shows that the disk array is in monitoring stop status or under configuration
setting.
This shows monitoring stop status or under configuration setting.
If this icon is displayed, an event that needs “caution” occurred in any pool just
before stopping monitoring.
This shows monitoring stop status or under configuration setting.
If displaying this icon, a fault has occurred in any pool just before stopping
monitoring.
This shows monitoring stop status or under configuration setting.
If this icon is displayed, “threshold excess” has occurred in pool just before stopping
monitoring.
II-18
Page 53

Chapter 3 Basic Functions
If a threshold excess occurred in pool for snapshot, the icon “ ” is displayed. If, however, the integrated operating
state of pool is faulty or an event or fault (except critical fault) that needs “maintenance” occurred, the icon displays
the integrated operating state. For details on actions to be taken when a threshold excess occurred, refer to the
“Snapshot User's Manual (Function Guide)” (IS030).
(ii) Pool Number
Displays pool number (4 hexadecimal digits).
(iii) Pool Name
Displays pool name (maximum of 32 characters). The optional name for pool name can be set. Refer to the
“Configuration Setting Tool User’s Manual (GUI)” for setting method.
(iv) State
Displays the operating state of pool and occurrence of event in any of the following at “State” column.
Ready: Pool is in normal operation.
Attn.(reduce): Reduction (RAID configuration redundancy disappears.)
Attn.(rebuilding): While rebuilding (while rebuilding data within pool)
Attn.(preventive copy): While copying data to spare disk (redundancy maintained by RAID configuration)
Attn.(copy back): While writing back from the spare disk (redundancy maintained by RAID
configuration)
Fault: “Fault” occurs in pool.
(v) Expansion State
Displays the expansion state of pool in any of the following at “Expansion State” column.
(blank): Pool expansion is not in progress or expansion terminated normally.
Expanding: During pool expansion.
Expand-Fail: Fails in pool expansion.
(vi) RAID
Displays RAID type of pool in any of the following at “RAID” column.
“0”: RAID 0
“1”: RAID 1
“5”: RAID 5
“6”: RAID 6
“10”: RAID 10
“50”: RAID 50
(vii) Capacity
Displays the capacity of pool in Gigabyte units (1 G byte=1,073,741,824 bytes) to 1 decimal place. (Truncate it
at the second decimal place. However, displays 1 byte to 100 Megabytes as 0.1.)
(viii) Used Capacity
Displays the used capacity of pool in Gigabyte units (1 G byte=1,073,741,824 bytes) to 1 decimal place.
(Truncate it at the second decimal place. However, displays 1 byte to 100 Megabytes as 0.1.)
II-19
Page 54

Chapter 3 Basic Functions
(ix) Snapshot Capacity
Displays the capacity of the snapshot reserve area in Gigabyte units (1 G byte=1,073,741,824 bytes) to 1 decimal
place. (Truncate it at the second decimal place. However, displays 1 byte to 100 Megabytes as 0.1.)
(x) Snapshot Used Capacity
Displays the used capacity of the snapshot reserve area in Gigabyte units (1 G byte=1,073,741,824 bytes) to 1
decimal place. (Truncate it at the second decimal place. However, displays 1 byte to 100 Megabytes as 0.1.)
If a threshold excess has occurred, “ * ” is displayed at the left of snapshot used capacity.
(xi) Snapshot Threshold
Displays the snapshot threshold in Gigabyte units (1 G byte=1,073,741,824 bytes) to 1 decimal place. (Truncate
it at the second decimal place. However, displays 1 byte to 100 Megabytes as 0.1.)
(2) Pool details information screen
This screen (Figure 3-10) is displayed if selecting (click the left button) optional pool and selecting by right
clicking → [Properties] (or [View]→[Properties] from menu) in configuration display area or information list
display area, displaying detailed information of the pool.
Figure 3-10 Pool Details Information
II-20
Page 55

Chapter 3 Basic Functions
(i) Name
Displays the pool name.
The display contents are the same as (1) “Pool list screen”.
(ii) Pool Number
Displays the pool number.
The display contents are the same as (1) “Pool list screen”.
(iii) Pool Type
Displays the pool type.
Basic: Basic pool
Dynamic: Dynamic pool
(iv) State
Displays the operating state of pool.
The display contents are the same as (1) “Pool list screen”.
(v) Expansion State
Displays the expansion state of pool.
The display contents are the same as (1) “Pool list screen”.
(vi) Progress Ratio
Displays the progress ratio during pool capacity expansion.
(vii) RAID
Displays the RAID type of pool.
The display contents are the same as (1) “Pool list screen”.
For a dynamic pool, displays the configuration ratio of the data disk and the parity disk after the RAID type, like
“6(4+PQ)”.
(viii) Capacity
Displays the capacity of pool.
The display contents are the same as (1) “Pool list screen”.
(ix) Used Capacity
Displays the used capacity of pool.
The display contents are the same as (1) “Pool list screen”.
(x) Logical Disk List
Displays information on the logical disks contained in the target pool (logical disk number, form, logical disk
name, and status).
When the snapshot function is used, snapshot-volume (SV) and link-volume (LV) can be set to non-display.
For details on the setting method, refer to 5.2 “Client Start/Stop”.
Example:
Logic Disk Number OS Type Logical Disk Name State
0000h NX LDNX00000 Ready
0001h A4 LDA400000 Fault
II-21
Page 56

Chapter 3 Basic Functions
(xi) Physical Disk List
Displays information on the physical disks making up the target pool (physical disk number “PD group number
(2 digits in hexadecimal) - physical disk number (2 digits in hexadecimal)” and state).
If the expansion state of the pool is either Expanding or Expand-Fail, the physical disks subject to expansion are
not displayed on the list.
Example:
00h - 01h Ready
00h - 02h Fault
Physical Disk Number State
Figure 3-11 Pool Details Information-2
This screen displays information related to snapshot.
* If you do not buy snapshot (DynamicSnapVolume), the [Snapshot] tab is not displayed.
II-22
Page 57

Chapter 3 Basic Functions
(xii) Snapshot Capacity
Displays the total snapshot capacity.
The display contents are the same as (1) “Pool list screen”.
(xiii) Snapshot Used Capacity
Displays the used snapshot capacity.
The display contents are the same as (1) “Pool list screen”.
(xiv) Snapshot Threshold
Displays the snapshot threshold.
The display contents are the same as (1) “Pool list screen”.
(xv) Control Capacity of Snapshot
Displays the snapshot control capacity.
(xvi) Snapshot Reserve Area List
Lists the information (logical disk number, logical disk name, and capacity) on snapshot reserve area in the target
pool.
Example:
Logical Disk Number Logical Disk Name Capacity
0000h POOL001_SDV_0001 10.0
0001h POOL001_SDV_0002 20.0
II-23
Page 58

Chapter 3 Basic Functions
3
.
1
.
6
L
3
.
1
.
6
3
.
1
.
6
The logical disk information is displayed in “logical disk list screen” which is displayed in the configuration display
area and information list display area, and “logical disk details information screen” which is displayed as logical disk
property information.
In this section, each item indicated as logical disk information is described.
(1) Logical Disk list screen
A screen (Figure 3-11) displayed by selecting (click the left button) [Logical Disk] in configuration display area
displaying various attribute information such as logical disk name, operating state and capacity.
If selecting (click the left button) optional logical disk in the configuration display area, it also displays RAID
configuration physical disk list (part of related information) composed of applicable logical disk.
o
L
o
L
o
g
g
g
i
c
a
l
D
i
s
k
I
n
f
o
r
m
a
t
i
o
n
D
i
s
p
l
a
y
i
c
a
l
D
i
s
k
I
n
f
o
r
m
a
t
i
o
n
D
i
s
i
c
a
l
D
i
s
k
I
n
f
o
r
m
a
t
i
o
n
D
p
i
s
p
l
a
y
l
a
y
Figure 3-12 Logical Disk list screen
II-24
Page 59

Chapter 3 Basic Functions
(i) Icon (Operating state/Monitoring state of logical disk)
Displays the operating state/monitoring state of logical disk with the icon next to logical disk number.
Table 3-5 Display Icons
Icon Status
Logical disk is in normal operation
An event whereby “Caution” is needed occurs in logical disk
“Fault” occurs in logical disk
These icons show that the disk array is in monitoring stop status or under configuration
setting.
This shows monitoring stop status or under configuration setting.
If this icon is displayed, an event that needs “caution” occurred in any logical disk just
before stopping monitoring.
This shows monitoring stop status or under configuration setting.
If displaying this icon, a fault has occurred in any logical disk just before stopping
monitoring.
(ii) Logical Disk Number
Displays logical disk number (4 hexadecimal digits).
(iii) OS Type/Logical Disk Name
Displays logical disk name (maximum of 24 characters) and OS type. The optional name for logical disk name
can be set. Refer to 3.3 “Nickname Setting” for setting method.
For (ii) Logical Disk Number and (iii) OS Type/Logical Disk Name, the order in which the columns are
displayed changes depending on the environment settings.
Number order display: Order of [Number], [OS Type], [Logical Disk Name], [State] ...
Name order display: Order of [OS Type], [Logical Disk Name], [Number, [State] ...
Refer to 5.2 “Client Start/Stop” for setting method.
(iv) State
Displays the operating state of logical disk and occurrence of event in any of the following at “State” column.
Ready: Logical disk is in normal operation.
Ready (formatting): During logic formatting
* The logical disk is available, but there may occur I/O response delay until logic
formatting is completed.
Attn.(reduce): Reduction (RAID configuration redundancy disappears)
Attn.(rebuilding): While rebuilding (while rebuilding data within RANK)
Attn.(preventive copy): While copying data to spare disk (redundancy maintained by RAID configuration)
Attn.(copy back): While writing back from the spare disk
(redundancy maintained by RAID configuration)
Attn.(unformatted): Not logic formatting
Attn.(formatting): During logic formatting
* The logical disk is not available until logic formatting is completed.
Attn.(format fail): Fails in logic formatting
Attn.(expanding): During RANK expansion
II-25
Page 60

Chapter 3 Basic Functions
Attn.(expand-fail): Fails in RANK expansion
Fault: “Fault” occurs in logical disk
Fault (media error): “Media fault” occurs in logical disk
(v) RAID
Displays RAID type of logical disk in any of the following at “RAID” column.
“0”: RAID 0
“1”: RAID 1
“5”: RAID 5
“6”: RAID 6
“10”: RAID 10
“50”: RAID 50
(vi) Capacity
Displays the capacity of logical disk in Gigabyte units (1G byte=1,073,741,824 bytes) to 1 decimal place.
(Truncate less than 2 decimal places. However, displays 0 byte to 100 Megabyte in 0.1).
(vii) RPL Type
Displays the replication type of logical disk in any of the following at “RPL Type” column. This column does
not appear when none of DynamicDataReplication and RemoteDataReplication is purchased.
IV: Not used as a replication volume
MV: Used as a replication source volume
RV: Used as a replication destination volume
RV/MV: Used as both RV and MV
(Blank): Cannot be used as a replication volume
(viii) Snapshot Type
Displays the snapshot type.
If you do not buy DynamicSnapVolume, this is not displayed.
Blank: Volume not used by snapshot
BV: Base volume (original volume from which copies are made)
SV: Snapshot volume (volume as the snapshot generation)
LV: Link volume (virtual volume establishing connection with BV or SV and implementing indirect access)
SDV: Snapshot data volume (logical disk configuring snapshot reserve area (SRA))
SV*: A type of snapshot volumes (volume that is not the snapshot generation)
* SV* may exist due to an iSM abnormal end and the like, however it cannot be reused. Therefore, free it
immediately by “Freeing Logical Disk” of configuration setting.
(ix) Link
Displays the connection state between BV-LV or SV-LV.
If you do not buy DynamicSnapVolume, this is not displayed.
(x) Group
Displays the group to which a logical disk belongs in any of the following at “Group” column. This column does
not appear when AccessControl and ReallocationControl are not purchased.
Preserve: Preserve group
Reserve: Reserve group
(Blank): Already assigned to the LD Set
II-26
Page 61

Chapter 3 Basic Functions
(xi) Purpose
Displays the purpose of a logical disk in any of the following at “Purpose” column. This column does not appear
when ReallocationControl is not purchased.
RPL: Logical disk to which only a pair for replication is set
Snapshot: Logical disk to which only snapshot is set (BV)
Link Volume: Logical disk that is a link-volume (LV)
RPL/Snapshot: Logical disk to which a pair for replication and snapshot setting have already been set
Optimization: Work disk for performance optimization
(Blank): General logical disk to which no specific purpose is set
(xii) RANK/Pool Number
Displays RANK and pool numbers that contain the logical disk. RANK numbers are displayed in “PD group
number (2 digits in hexadecimal) - RANK number (2 digits in hexadecimal)”. A maximum of four RANK
numbers are displayed. Numbers exceeding four are indicated by “...” at the end of line.
* The pool number (4 digits in hexadecimal) is displayed only for the disk arrays with pool.
(xiii) Pool Name
Displays the name of the pool to which the logical disk belongs.
* The name is displayed only for the disk arrays with pool.
(xiv) Cache Resident
Displays cache resident status of logical disk in “resident” column.
Resident: Cache resident
(Blank): Cache non-resident
(xv) Progress Ratio
Displays the progress ratio in logical disk where “formatting”, “rebuilding”, “copy back”, “expanding” and
“preventive copy” events occur.
For the disk arrays with pool, the progress ratio is displayed only if a “formatting” event occurs, and not
displayed if other events occur.
(xvi) LD Set Name
Displays up to four LD Set Names to which the logical disk belongs (in case four names are exceeded, displayed
“…” at the end of the names).
(xvii) Cache Segment Name
Displays the cache segment name to which a logical disk belongs. This column does not appear when
CachePartitioning is not purchased.
(xviii) Access Control
Displays port information (Port number, Port name) and LD Set information of host director owned by disk array
inside the “Access Control” list box.
By selecting an arbitrary LD Set name from the list box, only the information of logical disk included in the LD
Set is displayed in information list display area. When an arbitrary port is selected, only the information of
logical disk that can be accessed from the applicable port is displayed in information list display area. If “ALL”
is specified from list box, the information of all logical disk in selected disk array is displayed in the information
list display area.
II-27
Page 62

Chapter 3 Basic Functions
(2) Logical Disk details information screen
These screens (Figures 3-13, 3-14, and 3-15) are displayed if selecting (click the left button) optional logical disk
and selecting by right clicking → [Properties] (or [View]→[Properties] from menu) in configuration display area
or information list display area, displaying detailed information of the logical disk.
Figure 3-13 Logical Disk Details Information-1
(i) Name
Displays the logical disk name. The display contents are the same as (1) “Logical Disk list screen”.
(ii) Number
Displays the logical disk number. The display contents are the same as (1) “Logical Disk list screen”.
(iii) OS Type
Displays the form of logical disk. The display contents are the same as (1) “Logical Disk list screen”.
(iv) State
Displays the operating state of logical disk. The display contents are the same as (1) “Logical Disk list screen”.
II-28
Page 63

Chapter 3 Basic Functions
(v) RAID
Displays the RAID type of logical disk. The display contents are the same as (1) “Logical Disk list screen”.
If the pool to which the target logical disk belongs is a dynamic pool, displays the configuration ratio of the data
disk and the parity disk after the RAID type, like “6(4+PQ)”.
(vi) Capacity
Displays the capacity of logical disk.
(vii) RANK/Pool Number
Displays the RANK and pool numbers
The display contents are the same as (1) “Logical Disk list screen”.
(viii) Pool Name
Displays the name of the pool to which the logical disk belongs.
The display contents are the same as (1) “Logical Disk list screen”.
(ix) Cache Resident
Displays the cache resident status of logical disk. The display contents are the same as (1) “Logical Disk list
screen”.
(x) Progress Ratio
Displays the progress ratio in logical disk where the event of “formatting”, “rebuilding”, “copy back”,
“expanding” or “preventive copy” occurs. The display contents are the same as (1) “Logical Disk list screen”.
For the disk arrays with pool, the progress ratio is displayed only if a “formatting” event occurs, and not
displayed if other events occur.
(xi) RPL Type
Displays the replication type of logical disk. The display contents are the same as (1) “Logical Disk list screen”.
This column does not appear when none of DynamicDataReplication and RemoteDataReplication is purchased.
(xii) Group
Displays the group to which a logical disk belongs. The display contents are the same as (1) “Logical Disk list
screen”. This column does not appear when AccessControl and ReallocationControl are not purchased.
(xiii) Purpose
Displays the purpose of a logical disk. The display contents are the same as (1) “Logical Disk list screen”. This
column does not appear when CachePartitioning is not purchased.
(xiv) Cache Segment Name
Displays the cache segment name to which a logical disk belongs. This column does not appear when
CachePartitioning is not purchased.
(xv) Ownership
Displays the controller information (ownership: current, default) where authority to control logical disks is
assigned during an invalid Cross Call mode. Then, when the Cross Call function is not supported or Cross Call
mode is valid, displays “-”.
Example: Current Owner controller 0
Default Owner controller 1
II-29
Page 64

Chapter 3 Basic Functions
(xvi) Physical Disk List
The physical disk number “PD group number (2 hexadecimal digits) - physical disk number (2 hexadecimal
digits)”, which configures target logical disk, and the status are displayed.
For the disk arrays with pool, displays information on the physical disks contained in the pool to which the
target logical disk belongs.
Example:
00h - 01h Ready
00h - 02h Fault
Physical Disk Number State
Figure 3-14 Logical Disk Details Information-2
(i) Port
1
Displays the port information (port number, port name, status*
disk.
This item is not displayed for disk array to which the AccessControl license has been applied.
Ports only for a host are displayed.
*1 Director state when the port is installed
Example:
00h - 01h DB_server1 Ready
00h - 02h DB_server2 Fault
Port Number Port Name State
) where access authority is possessed to logical
II-30
Page 65

(ii) LD Set
Displays the LD Set where the specified logical disk is bound.
Chapter 3 Basic Functions
Figure 3-15 Logical Disk Details Information-3
The information related to snapshot is displayed.
* The [Snapshot] tab is not displayed, if you do not buy snapshot (DynamicSnapVolume) or the selected logical disk
is not a volume related to snapshot (a snapshot related volume is a volume of which snapshot type is BV, SV, LV,
SDV, or SV*).
(i) Snapshot Type
Displays the snapshot type.
The display contents are the same as (1) “Logical Disk list screen”.
(ii) Link
Displays the connection state.
The display contents are the same as (1) “Logical Disk list screen”.
(iii) Number
Displays the number of the connecting logical disk (4 digits in hexadecimal).
(iv) OS Type
Displays the (OS) type of the connecting logical disk.
The display contents are the same as (1) “Logical Disk list screen”.
II-31
Page 66

Chapter 3 Basic Functions
(v) Logical Disk Name
Displays the logical disk name (up to 24 characters) of the connecting logical disk.
(vi) Snapshot Type
Displays the snapshot type of the connecting logical disk.
The display contents are the same as (1) “Logical Disk list screen”.
II-32
Page 67

Chapter 3 Basic Functions
3
.
1
.
7
P
h
y
s
i
c
a
l
D
i
s
k
I
n
f
o
r
m
a
t
i
o
n
D
i
s
p
l
a
y
3
.
1
.
7
P
h
y
s
i
c
a
l
D
i
s
k
I
n
f
o
r
m
a
t
i
o
n
D
i
s
3
.
1
.
7
P
h
y
s
i
c
a
l
D
i
s
k
I
n
f
o
r
m
a
t
i
o
n
Physical disk information is displayed in “Physical Disk list screen” displayed in the configuration display area and
information list display areas, and in “Physical Disk detailed information screen” displayed as physical disk property
information.
In this section, each item shown as physical disk information is described.
(1) Physical Disk list screen
The screen (dashed line in Figure 3-16) displayed when [Physical Disk] is selected (click the left button) in
configuration display area and displays various attribute information such as operating state of physical disk and
capacity.
When an optional physical disk is selected (click the left button) in the configuration display area, the information
of logical disk (a part of related information) configured by applicable physical disk in RAID is also displayed in
the list.
D
p
i
s
p
l
a
y
l
a
y
Figure 3-16 Physical Disk List Screen
II-33
Page 68

Chapter 3 Basic Functions
(i) Icon (Operating state/Monitoring state of Physical Disk)
Displays the operating state of physical disk with the icon next to the physical disk number.
Icon Status
Table 3-6 Display Icons
Physical disk is in normal operation
The event whereby “Preventive maintenance” is needed occurred in physical disk.
This shows one alternative physical disk failed and the other alternative physical disk is
used.
The event whereby “Attn” is needed occurred in physical disk
“Fault” occurred in physical disk
These icons show that the disk array is in monitoring stop status or under configuration
setting.
This shows monitoring stop status or under configuration setting.
If this icon is displayed, an event that needs “Preventive maintenance” occurred in any
physical disk just before stopping monitoring.
This shows monitoring stop status or under configuration setting.
If this icon is displayed, an event that needs “Attn” occurred in any physical disk just
before stopping monitoring.
This shows monitoring stop status or under configuration setting.
If displaying this icon, a fault has occurred in any physical disk just before stopping
monitoring.
(ii) Number
Displays the physical disk number in “PD group number (2 hexadecimal digits) - PD number (2 hexadecimal
digits)” at “Number” column.
(iii) State
Displays the operating state of physical disk and the occurrence of event at “State” column in any of the
following.
Ready: Physical disk is in operation
Info (inactive): “Preventive maintenance” occurred in physical disk
Attn.(rebuilding): While re-building the data
Attn.(powering up):While starting up the physical disk
Attn.(formatting): While formatting physically
Fault: “Fault” occurred in physical disk
Offline: Physical disk is separated or does not exist.
(iv) Capacity
Displays the physical disk capacity to one decimal place at most in Gigabyte unit (1G byte=1,073,741,824 byte)
at “Capacity” column. (Truncate less than 2 decimal places. But, 0 byte to 100Megabyte is displayed by 0.1).
(v) RANK/Pool Number
Displays RANK and pool numbers whereby physical disk belongs in “PD group number (2 hexadecimal digits) -
RANK number (2 hexadecimal digits)” at “RANK” column.
* The pool number is displayed only for the disk arrays with pool.
II-34
Page 69

Chapter 3 Basic Functions
(vi) Pool Name
Displays the name of the pool to which the physical disk belongs.
* The name is displayed only for the disk arrays with pool.
(vii) Classification
Displays the classification of target physical disk in any of following at “Classification” column.
Data: Physical disk that can be used as data area
Spare: Replacement of physical disk at the fault occurrence
No Setting: Physical disk that is not specified as data/spare
* For the disk arrays with pool, the classification of the physical disk subject to pool expansion is displayed as
data.
(viii) Progress Ratio
If the disk array to be monitored is that with pool, displays the progress ratio in the physical disk in which a
rebuilding event occurred.
(2) Physical Disk detailed information screen
This screen (Figures 3-17) is displayed if selecting (click the left button) optional physical disk and selecting by
right clicking → [Properties] (or [View]→[Properties] from menu) in configuration display area or information
list display area, displaying detailed information of the physical disk.
Figure 3-17 Physical Disk Detailed Information
II-35
Page 70

Chapter 3 Basic Functions
(i) Number
Displays the physical disk number. The display contents are the same as (1) “Physical Disk list screen”.
(ii) State
Displays the operating state of physical disk and the occurrence of event. The display contents are the same as
(1) “Physical Disk list screen”.
(iii) Capacity
Displays the capacity of physical disk.
(iv) Rotation Speed
Displays the number of rotation (unit: rpm) of target physical disk.
(v) Product ID
Displays the product model name (maximum of 16 characters) information of target physical disk.
(vi) Product Rev
Displays the Product Revision (4 characters) information of target physical disk.
(vii) Serial Number
Displays the product serial number (20 characters) of target physical disk.
(viii) RANK Number/Pool Number
Displays the RANK and pool numbers of physical disk. The display contents are the same as (1) “Physical Disk
list screen”.
* The pool number is displayed only for the disk arrays with pool.
(ix) Pool Name
Displays the name of the pool to which the physical disk belongs.
The display contents are the same as (1) “Physical Disk list screen”.
* The name is displayed only for the disk arrays with pool.
(x) Classification
Displays the classification of physical disk. The display contents are the same as (1) “Physical Disk list screen”.
(xi) Progress Ratio
If the disk array to be monitored is a disk array with pool, displays the progress ratio in the physical disk in which
a rebuilding event occurred.
The display contents are the same as (1) “Physical Disk list screen”.
(xii) Logical Disk List
Displays the logical disk number, form, logical disk name and status which are configured by target physical disk.
For the disk arrays with pool, displays the logical disk number, form, logical disk name, and status of each of the
logical disks contained in the pool to which the target physical disk belongs.
When the snapshot function is used, snapshot-volume (SV) and link-volume (LV) can be set to non-display.
For details on the setting method, refer to 5.2 “Client Start/Stop”.
Example:
0000h WN KAIKEI Ready
0001h NX KEIRI Fault
Logical Disk Number OS Type Logical Disk Name State
II-36
Page 71

Chapter 3 Basic Functions
3
.
1
.
8
C
o
n
t
r
o
l
l
e
r
I
n
f
o
r
m
a
t
i
o
n
D
i
s
p
l
a
y
3
.
1
.
8
C
o
n
t
r
o
l
l
e
r
I
n
f
o
r
m
a
t
i
o
n
D
i
s
3
.
1
.
8
C
o
n
t
r
o
l
l
e
r
I
n
f
o
r
m
a
t
i
o
n
The information of a controller is displayed on the following screens:
y Controller list screen that is displayed in the information list display area
y Controller detail information screen that is displayed as the information of controller’s properties
This section explains items displayed as controller information.
(1) Controller list screen
Controller list screen (Figure 3-18) displayed when [Controller] is selected (click the left button) in the
configuration display area, displaying the operating state in each component of controller relation.
D
p
i
s
p
l
a
y
l
a
y
Figure 3-18 Controller List Screen
(i) Icon (operating state/monitoring state related to controller)
Displays the operating state/monitoring state of component related to controller with the icon next to “Type”
column.
II-37
Page 72

Chapter 3 Basic Functions
Icon Status
Table 3-7 Display Icons
etc. (Ready)
(Offline)
(Fault)
etc. (Ready)
(Offline)
(Fault)
(ii) Type
Displays the type information as component related to controller at “Type” column in the Table 3-8.
Host Director HD
Component is in normal operation
An event whereby “Attn” is needed occurred in component.
“Fault” occurred in component (If component type is Temperature Alarm, it
indicates abnormal temperatures.)
These icons show that the disk array is in monitoring stop status or under
configuration setting.
This shows monitoring stop status or configuration setting.
If this icon is displayed, any component is disconnected or absent just before
stopping monitoring.
This shows monitoring stop status or configuration setting.
If this icon is displayed, a “fault” has occurred in any component just before
stopping monitoring. (If the component type is Temperature Alarm,
temperature abnormalities are indicated.)
Table 3-8 Controller Component List
Type Abbreviation
Replication Director RD
Disk Director DD
Cache Module CHE
Service Processor SVP
Power Supply DAC_PS
Battery Backup Unit DAC_BBU
Fan DAC_FANU
DAC_FANL
Temperature Alarm DAC_TEMP_ALM
Back Board DAC_BB
BC Junction Box BC_JB
Panel PANEL
Maintenance PC MAINTE_PC
Power Control Card PCC
(iii) Abbreviated Name (number)
Displays the abbreviation and component number of component related to controller at “Abbreviation Name
(number)” column (Table 3-8).
II-38
Page 73

Chapter 3 Basic Functions
(iv) State
Displays the operating state in component related to controller in any of following at “State” column.
Ready: Component of controller is in normal operation
Attn.(nolicense): The program product “BaseProduct” has not been installed.
(Displayed only for the Host Director)
Attn.(rebuilding): Component of controller is in the data rebuilding state
(Displayed only for Cache Module)
Attn.(charge): Component of controller is being charged
(Displayed only for Battery Backup Unit)
Offline: Component of controller is separated or does not exist
Fault: “Fault” occurred in component of controller
(If component type is Temperature Alarm, indicates the abnormal temperature)
(v) Others
Displays supplement information in each component at “Others” column optionally. Displays the cache module
capacity, port number and protocol information in controller information.
• Cache module capacity
If component type is “Cache Module”, the cache module capacity is displayed at “Others” column.
• Port number
If component type is “Host Director”, “Replication Director”, or “Disk Director”, port number (2 hexadecimal
digits) that applicable director possesses is displayed at “Others” column.
• Protocol information
If component type is “Host Director”, the protocol information of the target director is displayed following the
port number at “Others” column.
II-39
Page 74

Chapter 3 Basic Functions
(2) Controller detail information screen
Select (left-click on) an arbitrary controller in the information list display area, right-click on it, and select
[Properties] (or [View] on the menu bar → [Properties]). The Controller properties screen (Figure 3-19) appears
displaying the detailed information of the selected controller.
Figure 3-19 Controller Detail Information Screen
The information to be displayed varies depending on the selected component.
(In the above screen sample, the host director is selected.)
II-40
Page 75

Chapter 3 Basic Functions
3
.
1
.
9
D
i
s
k
E
n
c
l
o
s
u
r
e
I
n
f
o
r
m
a
t
i
o
n
D
i
s
p
l
a
y
3
.
1
.
9
D
i
s
k
E
n
c
l
o
s
u
r
e
I
n
f
o
r
m
a
t
i
o
n
D
i
s
3
.
1
.
9
D
i
s
k
E
n
c
l
o
s
u
r
e
I
n
f
o
r
m
a
t
i
o
n
The information of a disk enclosure is displayed on the following screens:
y Disk enclosure list screen that is displayed in the information list display area
y Disk Enclosure properties screen that is displayed as the information of disk enclosure’s properties
This section explains items displayed as disk enclosure information.
(1) Disk Enclosure list screen
Disk Enclosure list screen is a screen (dashed line in Figure 3-20) displayed by selecting (click the left button)
[Enclosure] in the configuration display area, and displays the operating state in each component relation to disk
enclosure. [Enclosure] is not provided depending on your system configuration.
D
p
i
s
p
l
a
y
l
a
y
Figure 3-20 Disk Enclosure List Screen
(i) Icon (operating state/monitoring state related to disk enclosure)
Displays the operating state/monitoring state in component related to disk enclosure with the icon next to “Type”
column.
II-41
Page 76

Chapter 3 Basic Functions
Icon Status
Table 3-9 Display Icons
(Ready)
(Offline)
(Fault)
(Ready)
(Offline)
(Fault)
(ii) Type
Displays the following type information as the component related to disk enclosure at “Type” column.
Table 3-10 List of Components Related to Disk Enclosure
Adapter Card DE_ADP
Component (disk enclosure) is in normal operation.
Component is separated or does not exist
“Fault” occurred in component (If component type is Temperature Alarm, it
indicates temperature abnormalities or sensor fault.)
These icons show that the disk array is in monitoring stop status or under
configuration setting.
This shows monitoring stop status or configuration setting.
If this icon is displayed, any component is disconnected or absent just before
stopping monitoring.
This shows monitoring stop status or configuration setting.
If this icon is displayed, a “Fault” has occurred in any component just before
stopping monitoring. (If the component type is Temperature Alarm,
temperature abnormalities are indicated.)
Type Abbreviation
Power Supply DE_PS
Fan DE_FAN
Temperature Alarm DE_TEMP_ALM
Back Board DE_BB
EC Junction Box EC_JB
(iii) Abbreviated Name (number)
Displays the abbreviation and component number of component related to disk enclosure at “Abbreviated Name
(number)” column. (Table 3-10)
(iv) State
Displays the operating state in any of the following in component related to disk enclosure at “Status” column.
Ready: Component of disk enclosure is in normal operation.
Offline: Component of disk enclosure is separated or does not exist.
Fault: “Fault” occurred in component of disk enclosure.
(If component type is Temperature Alarm, it indicates temperature abnormalities or sensor fault.)
II-42
Page 77

Chapter 3 Basic Functions
(2) Disk Enclosure properties screen
Select (left-click on) an arbitrary disk enclosure in the information list display area, right-click on it, and select
[Properties] (or [View] on the menu bar → [Properties]). The Disk Enclosure properties screen (Figure 3-21)
appears displaying the detailed information of the selected disk enclosure.
Figure 3-21 Disk Enclosure Properties Screen
The information to be displayed varies depending on the selected component.
(In the above screen sample, the EC Junction Box is selected.)
II-43
Page 78

Chapter 3 Basic Functions
r
)
3
.
2
S
t
3
.
2
3
.
2
The state monitoring function monitors the generation of the following events in the disk array which is an object of
iSM.
<Event>
• Generation of status transition in the components
• Existence of change of a disk array name, a logical disk name and a port name
• Generation of configuration change
• Occurrence of a threshold excess of the quantity used of snapshot
iSM supports the polling mode to acquire the monitoring information in the fixed interval. When the above event is
detected, iSM not only reflects the detected event on the configuration control screen of an iSM client but also outputs
the message to various logs (event log, operation log). Besides, it can perform link processing such as maintenance, as
started by the event detection. For log output and link function, refer to sections 3.5 “Log Output” and 3.6 “Event
Link” in this manual.
a
S
t
a
S
t
a
Storage Manager
t
e
M
o
t
e
t
e
n
M
o
n
M
o
n
Operation administrato
i
t
o
r
i
n
g
i
t
o
r
i
t
o
r
i
n
g
i
n
g
Displays the occurrence
of a failure.
Configuration
display screens
Disk array
Polling/Trap
Controller (DAC
Figure 3-22 Operation Image
Disk enclosure (DE)
Logical disks
Physical disk
Occurrence of failure
II-44
Page 79

Chapter 3 Basic Functions
3
.
2
.
1
F
u
n
c
t
i
o
n
O
u
t
l
i
n
e
3
.
2
.
1
F
u
n
c
t
i
o
n
O
u
t
3
.
2
.
1
F
u
n
c
t
i
o
n
(1) Monitoring Events
Status monitoring function provides a function which monitors generation / transition of event indicated in Table
3-11 for the components of disk array which is an object of control.
Section Component Element Event Level
Physical Disk
Controller
(Disk)
Enclosure
Status
Transition
Logical Disk
Control Path stop(control path fail) error
Pool
Disk Array Disk Array Name renamed info
Name Change
Configuration
Change
Controller Port Name renamed info
Logical Disk Logical Disk Name renamed info
Logical Disk
Physical Disk Physical Disk config changed notice
Controller Access Control config changed notice
l
O
u
t
Table 3-11 Monitoring Event List
HD/RD/DD
CHE/SVP
PS/BBU, etc
ADP/PS
FAN/BB
TEMP_ALM, etc
Logical Disk config changed notice
Cache Disk config changed notice
i
n
e
l
i
n
e
ready info
Info(inactive) info
fault error
attn.(rebuilding) notice
attn.(powering up) notice
attn.(formatting) notice
offline error
ready info
fault error
offline error
ready info
fault error
offline error
ready info
ready(formatting) info
fault error
fault(media error) error
attn.(reduce) error
attn.(rebuilding) notice
attn.(preventive copy) notice
attn.(copy back) notice
attn.(unformatted) notice
attn.(formatting) notice
attn.(format-fail) notice
attn.(expanding) notice
attn.(expand-fail) notice
ready info
fault error
attn.(reduce) error
attn.(rebuilding) notice
attn.(preventive copy) notice
attn.(copy back) notice
II-45
Page 80

Chapter 3 Basic Functions
3
.
2
.
2
D
3
.
2
.
2
3
.
2
.
2
This section describes the instructions of status monitoring information display image and monitoring control operation
in the iSM client.
(1) Monitoring information display
Information monitored by the iSM server is displayed as “Message Output” and “Status Value Reflection” via
iSM client.
(a) Message Output
e
D
e
D
e
When the status transition, name change, or configuration change is detected, messages corresponding to
such events are output in the message display area.
Example of message output at fault detection
Sat Jan 6 02:08:44 2001 0000017917 Info iSMrmond
iSM07102:State of PD(28h) has become fault. (Storage4100/07 ProductID=S4100 Disk Array
SN=3000000000000002 No=00h-01h RankNo=00h-00h) ... (i)
(i) indicates that a fault occurred in the physical disk (with a resource type of 28h, product ID of S4100 Disk
Array, serial number of 3000000000000002, number of 00h-01h, and Rank number of 00h-00h) of the disk
array (whose disk array name is “Storage4100/07”).
Example of message output at name change
Sat Jan 6 02:08:44 2001 0000017917 Info iSMrmond iSM07201:Disk Array, named
Storage4100/07, has renamed to Storage4100/dwh1 (SN=3000000000000003 )
s
s
s
c
c
c
r
i
p
t
i
o
n
o
f
S
c
r
e
e
n
a
n
d
O
p
e
r
a
t
i
o
n
r
i
p
t
i
o
n
o
f
S
c
r
e
e
n
a
n
d
O
p
e
r
a
r
i
p
t
i
o
n
o
f
S
c
r
e
e
n
a
n
d
O
p
e
t
r
a
t
i
o
n
i
o
n
The message indicates that the disk array (whose name is “Storage4100/07” and serial number is
“3000000000000003”) has been renamed “Storage4100/dwh1”.
For details, refer to the “Messages Handbook”.
(b) State Value Reflection
Due to the detection of status transition, name change, or configuration change, respective status of changed
elements is shown in the configuration display area on iSM client.
When events such as fault, caution, and offline occur in each component, status value of the object element
for individual element layer is changed and the corresponding icons are also changed. Status of element
layer or disk array layer change depends on the status change of individual element layer. For example, if
attention event occurs in PD, PD of the upper element layer and disk array layer change to normal status
(maintenance). (Table 3-12)
Furthermore, when two types of event at different fault level simultaneously occur in the individual element
layer, an event with higher fault level is always reflected on the upper layer.
For contents of display, refer to 3.1 “Configuration Display” in this manual.
II-46
Page 81

Chapter 3 Basic Functions
Table 3-12 Fault Status Reflection
Disk Array Layer Component Layer Individual Component Layer
or
Serious Fault
Ready
(Maintenance)
Ready
or
or
or
or
or
or
or
or
Fault
Ready
(Maintenance)
Ready
or
etc.
Pool
LD
PD
Controller
Enclosure
Pool
LD
PD
Controller
Enclosure
Pool
LD
PD
Controller
Fault
Attention/Offline/I
nfo
Ready
* Pool-related information is displayed if the disk array to be monitored is a disk array with pool.
1. Displaying of the icon, , in the ready (maintenance) status can be selected by environment setting for the
iSM client. Select [File] → [Environment Settings] from the Menu and check [Display Maintenance State]
from Environment Setting Dialog.
2. If the states of the disk array layer and the component layer (pool) are Ready or Ready (Maintenance) at the
occurrence of threshold excess, the threshold excess icon is displayed. If, however, [Display Maintenance
State] is checked, an icon indicating the resource state is given precedence and displayed.
3. Shape or color tone of the disk array icon varies depending on the type of disk array and the monitoring state.
For further detailed information on the disk array icon, refer to 3.1.3 “Disk Array Information Display” in this
manual.
etc.
Enclosure
II-47
Page 82

Chapter 3 Basic Functions
(2) Monitoring Start/Stop
In the iSM server, monitoring is automatically carried out for the disk array specified by the Environment
Definition File (iSMsvr.conf) when the server starts-up. When you wish to temporarily stop/resume monitoring
for the specific disk array due to maintenance or configuration changes, the following operation should be
executed. In order to utilize this function, user level should be L3.
(i) Select [Operation]→[Start/Stop Monitoring] from the Menu to display monitoring control dialog.
(ii) From [Disk Array Subsystem Name] on Monitoring Control Dialog, select (click) a disk array that you wish
to start or stop monitoring.
If you wish to monitor the disk array: Click [Start] button.
If you wish to stop monitoring: Click [Stop] button.
If you wish to stop monitoring start process during preparation of monitoring, or wish to stop recovery
process during waiting for monitoring recovery: Click [Break] button.
Figure 3-23 Monitoring Control Dialog
II-48
Page 83

Chapter 3 Basic Functions
A
A
A
A
A
r
r
A
3
.
3
N
i
c
k
n
a
m
e
S
e
t
t
i
n
g
3
.
3
N
i
c
k
n
a
m
e
S
e
t
t
3
.
3
N
i
c
k
n
a
m
e
S
Nickname setting function is used via iSM client to set disk array name, logical disk name (and disk OS Type), and
port name for the disk array which is the object of iSM monitoring. By setting these names so that they match to the
identification information of the individual daily work processing systems that use the disk arrays, efficient control of
the disk array can be achieved. Once information is set, it can be acquired regardless of iSM rebooting because the
preset name is recorded inside the disk array.
Operation administrato
e
i
t
t
i
n
n
g
g
ccounting/ARRAY1/MS00
ccounting/ARRAY1/MS01
Storage Manage
ccounting
operation
SAN
ccounting
Port
RRAY2
Disk array
3
.
3
.
3
.
3
3
.
3
Nickname Setting Function is a function which sets an optional identification name (disk array name) for the object
disk array of iSM monitoring, an arbitrary identification name (logical disk name + OS type) for the logical disk bound
inside the disk array, and an arbitrary identification name (port name) for the port. In order to set the identification
name, user level must be L3.
[Setting Items]
• Disk Array Name
• Logical Disk Name (+ OS type)
• Port Name
RRAY1
Figure 3-24 Operation Image
1
F
u
n
c
t
i
o
n
O
u
t
l
i
n
.
1
F
u
n
c
t
i
o
n
O
.
1
F
u
n
c
t
i
o
n
O
u
u
e
t
l
i
n
t
l
i
n
MS00 MS01 MS02 MS03
MS04 MS05 MS06 MS07
e
e
Configuration display screen
Logical disks
II-49
Page 84

Chapter 3 Basic Functions
3
.
3
.
2
D
3
.
3
.
2
3
.
3
.
2
This section explains the image of set information in the iSM client and the operation for setting information.
(1) Disk Array Name Setting
Disk array name can be set with the following procedure.
(i) Select (left-click on) the disk array (for which you want to set a name) in the configuration information display
area (or the information list display area), right-click on it, and select [Settings] (or [Operation] on the menu bar
→ [Disk Array Subsystem Name Settings]). The Disk Array Subsystem Name /Port Name Setting dialog box
(Figure 3-25) appears.
e
D
e
D
e
s
s
s
c
c
c
r
i
p
t
i
o
n
o
f
S
c
r
e
e
n
a
n
d
O
p
e
r
a
t
i
o
n
r
i
p
t
i
o
n
o
f
S
c
r
e
e
n
a
n
d
O
p
e
r
a
r
i
p
t
i
o
n
o
f
S
c
r
e
e
n
a
n
d
O
p
e
t
r
a
t
i
o
n
i
o
n
Figure 3-25 Disk Array Subsystem Name/Port Name Setting Dialog
(ii) Input the disk array name in the [New Disk Array Subsystem Name] edit box, following the rule indicated in (2)
“Disk Array Setting Condition and Naming Rule”, and click [Apply] button.
(iii) As an execution result of the setting, the following information is displayed in the dialog.
Table 3-13 Execution Result Dialog
Message State
“Setting has been completed” Execution result is normal.
“Setting information is incorrect” Parameter Error
“Same name exits” Same name exits.
“Access error occurred to Disk Array Subsystem” Access error occurred.
“Cannot execute the demand during the suspension of
the object Disk Array Subsystem monitoring”
“Cannot execute the demand during the configuration
setting”
“Demanded process has already been executed” Already executed
“Setting Failed (nn)” Other errors (nn is a decimal detail code.)
Setting is unavailable due to monitoring stop.
Setting is unavailable due to under configuration
setting.
II-50
Page 85

Chapter 3 Basic Functions
* Other Errors *
When “Setting Failed (nn)” is displayed for setting process of disk array name, it is considered that the errors
are detected after completion of I/O for disk array. Check by the browser whether the disk array setting has
been executed, and set again if necessary.
(2) Disk Array Setting Condition and Naming Rule
(a) Setting Condition
Disk array name should be set under the following conditions. (Settings other than the followings are treated as
parameter errors.)
• 1-byte alphanumeric characters including uppercase and lowercase characters. (When configuring a name with
plural information, “/”or “_” can be input)
• Maximum number of characters: 32.
(b) Naming Rule
A disk array used from the ACOS-4 system must have its name identified by the ACOS host, especially when
DynamicDataReplication or RemoteDataReplication are used. Therefore, to determine the disk array where the
object logical disk exists, an identification name for the disk array should be set. Make a disk array name in
combination of alphanumeric characters including uppercase characters and “_” (under bar), within 32 bytes.
Definition Example: CABINET01,CABINET02
In addition, when operating a disk array through other systems, it is recommended to set a disk array name that
matches with identification information from the system, along with logical disk name and port name.
In addition, when disk array name is not set, “16 characters peculiar to a disk array” is set as default value at the
time of shipment.
(3) OS type/logical disk name setting
OS type/logical disk name is set using the following procedure.
(a) Select (left-click on) the logical disk (for which you want to set an OS type and name) in the configuration
information display area (or the information list display area), right-click on it, and select [Settings] (or
[Operation] on the menu bar → [Logical Disk Name Settings]). The Setup of Logical Disk OS Type/Name
dialog box (Figure 3-26) appears.
Figure 3-26 Setup of Logical Disk OS Type/Name Dialog
II-51
Page 86

Chapter 3 Basic Functions
(b) In [New OS Type] or [New Name] Edit Box, input a logical disk name following the rules defined in (4) “OS
Type/Logical Disk Name Setting Conditions and Naming Rules” and click [OK] button.
(c) As a result of the setting, the following information is displayed in the dialog.
“Setting has been completed” Execution result is normal.
“Setting information (OS Type/Name) is incorrect” Parameter Error
“Same name exits” Same name exits.
“Error occurred in the access to the Disk Array
Subsystem”
“As for Logical Disk with replication setting, OS Type
cannot be changed”
“Cannot execute the demand during the suspension of the
object Disk Array Subsystem monitoring”
“Cannot execute the demand during the configuration
setting”
“Demanded process has already been executed” Already executed
“Failed in setting (nn)” Other errors (nn is a decimal detail code.)
Table 3-14 Execution Result Dialog
Message State
Access error occurred.
OS Type of logical disk whose replication pair is set
is changed.
Setting is unavailable due to monitoring stop.
Setting is unavailable due to under configuration
setting.
* Other Errors *
When “Setting Failed (nnh)” is displayed for setting process of logical disk name, it is considered that the errors
are detected after completion of I/O for disk array. Check by the browser whether the disk array setting has been
executed, and set again if necessary.
(4) OS Type/Logical Disk Name Setting Conditions and Naming Rules
(a) OS Type setting conditions
Select an OS Type from the Table 3-15 below according to a system to operate a logical disk.
Especially, you must set a correct OS type when using DynamicDataReplication or RemoteDataReplication in
the following systems:
• Logical volume used in ACOS-4 system
• Logical volume used in ACOS-2 system
• Logical volume used in Windows system
Table 3-15 OS Type List
OS Type Description
A2 Logical disk operated by the ACOS-2 system
A4 Logical disk operated by the ACOS-4 system
(For instructions on setting this type, contact the maintenance
engineer.)
AX Logical disk operated by the AIX system
CX Logical disk operated by the Solaris system
LX Logical disk operated by the Linux system
NX Logical disk operated by the HP-UX system
WN Logical disk operated by the Windows system
For instructions on setting the ACOS-4 type, also refer to Appendix in the “Configuration Setting Tool User’s
Manual (GUI)”.
II-52
Page 87

Chapter 3 Basic Functions
If the logical disk to be set is a snapshot related volume (of which snapshot type is BV, SV, LV, SV*, or SDV), the
OS type cannot be changed.
The [New OS Type] edit box is grayed.
(b) Setting Conditions
A logical disk name should be set according to the conditions below. (Settings other than those listed below are
processed as parameter errors.)
• 1-byte alphanumeric characters including upper- and lowercase characters. (When configuring a name with
plural information, “/”or “_” can be input)
• Maximum number of characters: 24
(c) Naming Rules
A logical disk used by the ACOS-4 system must have its logical disk name that can be identified by the ACOS
host, especially when DynamicDataReplication or RemoteDataReplication are used. Therefore a logical name
should be set according to the rules below.
Logical disk name = [/system name/] + device identification name
System name: Generic system name. An identifier is composed of the combination of
uppercase alphanumeric characters and “_” (under bar) within 18 bytes.
It may be omitted.
Device Identifier: Name of device defined in ACOS-4 system
Example of definition: MS01,/SYSTEM01/MS01
Moreover, when operating a logical disk by other systems, it is recommended to set a logical disk name that
matches with identification information of the system, along with disk array name and port name.
In addition, when OS type and logical disk name are not set, blank for the OS Type, “the 16 characters peculiar to
disk array + 4 characters of logical disk number” for the logical disk name are set as default value at the time of
shipment.
(5) Port name setting
Port name should be set according to the procedures below.
(i) Select (left-click on) the disk array system having the port (for which you want to set a name) in the
configuration information display area (or the information list display area), right-click on it, and select [Settings]
(or [Operation] on the menu bar → [Disk Array Subsystem Name Settings]). The Disk Array Subsystem Name/
Port Name Setting dialog box (Figure 3-25) appears.
(ii) Select a port number (port name) from the [Port Number] list and input port name in the [New Port Name] edit
box, following the rules defined in (6) “Port Name Setting Conditions and Naming Rules” and click [Apply]
button.
II-53
Page 88

Chapter 3 Basic Functions
(iii) As a result of the setting, the following information is displayed in the dialog.
“Setting has been completed” Execution result is in normal
“Setting information is incorrect” Parameter Error
“Same name exists” Same name exists
“Error occurred in the access to the Disk Array
Subsystem”
“Cannot execute the demand during the suspension
of the object Disk Array Subsystem monitoring”
“Cannot execute the demand during configuration
setting”
“Demanded process has already been executed” Already executed.
“Setting failed (nn)” Other errors (nn is a decimal Detail Code.)
*Other Errors*
When “Setting Failed (nnh)” is displayed for setting process of logical disk name, it is considered that
the errors are detected after completion of I/O for disk array. Check by the browser whether the disk
array setting has been executed, and set again if necessary.
Table 3-16 Execution Result Dialog
Message State
Access error occurred.
Setting is unavailable due to monitoring stop
Setting is unavailable due to under
configuration setting
(6) Port Name Setting Conditions and Naming Rules
(a) Setting conditions
Port name should be set with the following conditions. (Settings other than those listed below are processed as
parameter error.)
• 1-byte alphanumeric characters including upper- and lowercase characters. (When configure a name with plural
information, “/”or “_” can be input)
• Maximum number of characters: 32
(b) Naming rules
As well as the disk array name and the logical disk name, it is recommended to set a port name that matches with
the identification information for the system being operated.
In addition, when port name is not set, “16 characters peculiar to disk array + 2 characters of director number + 2
characters of port number” for the port name is set as default value at the time of shipment.
You can set a name to a port only for a host. In the [Disk Array Subsystem Name/Port Name Setting] dialog box,
only the number of the port for a host is displayed.
II-54
Page 89

Chapter 3 Basic Functions
3
.
4
F
a
u
l
t
M
o
n
i
t
o
r
i
n
g
3
.
4
F
a
u
l
t
M
o
n
i
t
o
i
n
n
n
O
O
O
r
t
o
r
o
f
o
f
o
f
u
t
u
t
u
t
3
.
4
F
a
u
l
t
M
o
n
All messages of iSM are outputted on the message display area of client screen during the client connection. These are
the fault monitoring functions for each client disk array.
This fault monitoring function is described below.
3
.
4
.
1
D
e
s
c
r
i
p
t
i
3
.
4
.
1
D
e
s
c
3
.
4
.
1
D
The fault monitoring functions of iSM are the following.
(1) It outputs all messages which are connected in the message display area of the iSM client.
(2) It saves display message in the text file of PC on which the iSM client is installed. (log collection)
(3) The user notification function according to the message level.
3
.
4
.
2
3
3
.
4
.
.
4
O
2
2
O
O
.
e
p
p
p
s
e
e
e
c
r
r
r
r
a
a
a
r
o
i
p
t
i
o
i
p
t
i
o
t
i
o
n
t
i
o
n
t
i
o
n
i
n
g
i
n
g
t
h
e
F
u
n
c
t
i
o
n
t
h
e
F
u
n
c
t
h
e
F
u
l
i
n
e
l
i
n
e
l
i
n
e
n
c
t
t
i
o
n
i
o
n
The same contents with operation log are displayed in the message display area by the fault monitoring function. The
display shows clearly the importance of the messages by adding an icon of each message level at the start of the
message. The message which has already been displayed once also extracts to individual log file on the PC side.
Whatever display status iSM client may be on screen according to the message level, it has function for noticing the
fault occurrence to the user.
(1) Output to the message display area
The same operation log that is extracted on the iSM server side is displayed in the message display area.
However, it displays only what is outputted during iSM client connection.
The message which shows connection/disconnection between iSM client and server is also displayed as an
individual message. After determining the message level, add the proper icon (
(Notice, Info)) at the start of line.
(2) Log collection
The message which is displayed in the message display area is outputted in the individual log file on the PC side.
Up to 1MB data can be stored in one log file. If it exceeds 1MB, it is renamed to an iSM old file and a new iSM
log file is created. Because two files, OLDiSM.log and iSM.log are used one after the other, a maximum of 2MB
file can be saved and more capacity is not needed.
(3) User notification function
(Err) / (Warning) /
Because the iSM client is not always displayed in the foreground, there is a function which notifies faults to the
user at each message level.
When the message level is (Err) / (Warning), the task tray blinks and the notification button changes from
to .
The notification, the notification is stopped by pushing down the notification button
notification button returns from
to .
II-55
or menu. Then the
Page 90

Chapter 3 Basic Functions
N
p
N
3
.
5
L
o
3
.
5
3
.
5
A message of iSM is output to operation log and event log. The details of a log output are explained below.
3
.
5
.
1
3
3
Log output function of iSM is as follows.
(1) Outputs messages to operation log.
(2) Outputs important messages to event log.
(3) Changes the output file when the size of an operation log exceeds the maximum.
3
3
3
.
5
.
1
.
5
.
1
.
5
.
2
.
5
.
2
.
5
.
2
L
L
D
D
D
O
O
O
o
o
e
e
e
u
u
g
u
g
g
s
s
s
t
t
O
u
t
p
u
t
O
u
O
c
c
i
i
i
r
r
n
n
n
t
u
t
i
p
t
i
p
t
r
i
p
t
e
o
e
o
e
o
c
l
l
t
l
p
p
i
i
i
o
o
o
f
f
f
u
u
n
n
n
O
O
O
t
t
o
f
F
u
n
c
t
i
o
n
o
o
p
p
p
f
e
e
e
F
u
n
c
f
F
u
r
a
r
a
r
a
t
n
c
t
t
i
o
n
t
i
o
n
t
i
o
n
i
o
n
i
o
n
Operation log is composed of an outputting log file, its generation file (backup file) and a generation management file
saving the management information of generation file. An operation log is created on the log file saving directory
(installation directory\etc\log). A generation file has a structure that holds backup of a log file one by one and it is
created to a maximum of 99 files. However, if the number of generation files exceeds the maximum, the oldest file will
be overwritten.
These file changes and name changes are performed automatically, and the user does not need to pay attention.
Example: When 17 generation files have been created by the operation log.
(i) Name of the generation file being
dated
u
(ii) Name of the latest generation
ame of the oldest generation file
(iii) Name of the generation
management file
Generation management file
iSM_Log.log
iSM_Log17.log
iSM_Log01.log
iSM_Log.cnt
17
Currently editing
Generation files
17
16
01
ew
Old
II-56
Page 91

Chapter 3 Basic Functions
(1) Log file
One message output by iSM server is saved as one record into the outputting log file. When the log file exceeds
the specified size, it is initialized after copying to a generation file.
File size: 1 to 10 (MB) Default is 1MB; can be specified by environment setting.
File name: “iSM_Log” + .log
(2) Generation file
A generation file is a backup file of the log file, and is created with maximum of 99 files. The generation file
shows the backed up order by the generation number in its file name, and the larger the number is, the newer the
file is. However, the file with the largest number is not necessarily the newest one because overwriting is made
from the file of the generation number 1 and subsequent files when the number of created files exceeds the
maximum. To identify the newest file correctly, refer to (3) “Generation management file”.
File name: “iSM_Log” + nn + .log
Generation number: 01 to 99
(3) Generation management file
A generation management file is a file that shows the latest information on the generation file numbers, and saves
the information with 2-digit generation number (2 bytes). When the generation number of generation
management file is 99, the next generation number will be assigned to 01. When a generation management file
does not exist right after the installation of iSM, or a number other than 01 to 99 is accidentally specified, the
following processing should be done.
(i) Set the generation number to “01” for the next file to be processed.
(ii) After backing up the information to a generation file, re-create the generation management file
File name: “iSM_Log” + .cnt
Example 1: File change processing when generation files are not created up to 99
[Before file change processing] [After file change processing]
03
02
01
03
Log file being output Generation management file
May 15 21 …
Thu May 15 21 …
Thu
:
Thu May 15 45 …
Generation management file
04
04
03
02
Log file being output
[ EOF ]
Log file is initialized
Newly
01
created
Generation files
Generation files
II-57
Page 92

Chapter 3 Basic Functions
Example 2: File change processing when generation files are created up to 99
[Before file change processing] [After file change processing]
Generation management file
16
99
Log file being output
Thu May 15 21 …
Generation management file
17
99
Log file being output
[ EOF ]
Log file is initialized
01
17
Thu May 15 45 …
17
01
Updated
Generation files
Example 3: File change processing when a generation management file does not exist (including default setting)
[Before file change processing] [After file change processing]
Generation files
Generation management file
Log file being output
Generation management file
Log file being output
Thu May 15 21 …
Thu May 15 45 …
01
01
[ EOF ]
Log file is initialized
Newly created
II-58
Page 93

Chapter 3 Basic Functions
3
.
5
.
3
R
e
c
o
r
d
F
o
r
m
a
t
g
g
g
a
a
t
t
Blank
Process
name
Data format: Time format obtained from ctime( )
LOG_ERR ........ “Err “
LOG_WARNING .... “Warning”
LOG_NOTICE ...... “Notice “
LOG_INFO . ....... “Info “
Variable length: a maximum of 501 bytes of character
string (terminated by \n)
Blank “iSM”
Message
number
“:”
3
.
5
.
3
R
e
c
o
r
d
F
o
r
3
.
5
.
3
R
e
c
o
r
d
3
.
5
.
3
.
1
O
p
e
r
a
t
i
3
.
5
.
3
.
1
O
p
3
.
5
.
3
.
1
(1) Record format of operation log
0 24 25 35 36 43 44 54 55 58 63 64
Generating
time
ch(24) ch(1) ch(10) ch(1) ch(7) ch(1) ch(10) ch(1) ch(3) ch(5) ch(1)
Blank
Size Data Type Contents Contents Details
24 char Generation time Date, time and year
1 char Blank (space)
10 char Process ID Process number of message output origin
1 char Blank (space)
7 char Message Classification Message Classification
1 char Blank (space)
10 char Process name Process name of message output origin
1 char Blank (space)
3 char “iSM”
5 char Message number Message serial number
1 char “:”
n ≤ 501 char Text
O
p
Process
ID
e
e
r
a
r
t
a
t
Blank
Text
ch(n)
o
i
o
i
o
m
F
o
r
m
n
L
o
n
L
o
n
L
o
Message
Classifi-
cation
Table 3-17 Record Format (Operation Log)
II-59
Page 94

Chapter 3 Basic Functions
(2) Output image to operation log
(Log File)
Thu May 15 17:30:29 2000 0000003258 Info iSMlogd iSM00000: This is example msg
Thu May 15 17:30:29 2000 0000016305 Info iSMlogd iSM04030 : Last message repeated 2 times
When the same message is continuously outputted for 3 times or more, a summarized record that shows the first
message and number of times the message is outputted. When the same message is continuously outputted over
the fixed time range (for 2 minutes and 30 seconds), a message outputted within the fixed time range and a
message after the fixed time range are treated as different messages.
For the event link function, only the original message is sent as is not being processed by this procedure.
Example: When the same message is received every 15 seconds for 3 minutes 15 seconds (14 times in total).
[Received Message]
Thu May 15 17:00:00 ……This is example msg. Thu May 15 17:00:00 …… This is example msg. ·····*
Thu May 15 17:00:15 ……This is example msg.
Thu May 15 17:00:30…… This is example msg. Thu May 15 17:00:40 …… Last msg repeated 2 times
Thu May 15 17:00:45 ……This is example msg. Thu May 15 17:00:45 …… This is example msg.
Thu May 15 17:01:00 ……This is example msg.
Thu May 15 17:01:15 ……This is example msg.
Thu May 15 17:01:30 ……This is example msg.
Thu May 15 17:01:45 ……This is example msg.
Thu May 15 17:02:00 ……This is example msg.
Thu May 15 17:02:15 ……This is example msg.
Thu May 15 17:02:30 ……This is example msg.
Thu May 15 17:02:45 ……This is example msg.
Thu May 15 17:03:00 ……This is example msg. Thu May 15 17:03:10 …… Last msg repeated 9 times.
Thu May 15 17:03:15 ……This is example msg. Thu May 15 17:03:15 …… This is example msg
2 ‘ 30” interval
[Operation Log]
* Received messages may be outputted repeatedly for 2 minutes and 30 seconds for the first time since the
timer is not based on the receiving time of the message.
II-60
Page 95

Chapter 3 Basic Functions
3
.
5
.
3
.
2
E
v
e
n
t
L
o
g
3
.
5
.
3
.
2
E
v
e
n
t
3
.
5
.
3
.
2
E
v
(1) Record format of event log: Format 1
Event
Classification
ch(m) ch(15) ch(1) ch(6) ch(10) ch(1) ch(7) ch(1) ch(10)
Blank “iSM” Message
ch(1) ch(3) ch(5) ch(1) ch(n)
Generating
time
Size Data Model Content Content Details
m=11
or m=13
or m=17
15 char Generating time Date and time
1 char Blank (space)
6 char “iSM : “
10 char Process ID Process number of message output origin
1 char Blank (space)
7 char Message Classification Classification of Message
1 char Blank (space)
10 char Process name Process name of message output origin
1 char Blank (space)
3 char “iSM”
5 char Message number Message serial number
1 char “:”
n ≤ 500 char Text
Blank “iSM : “ Process ID Blank Message
number
char Event Classification Classification of Event
e
n
t
L
o
g
L
o
g
Classification
“:” Text
Table 3-18 Record Format (Event Log)
Error ...... “error: <11>“
Warning ...... “warning: <12>“
Information ...... “information: <14>“
(Example) Jun 20 11:30:17
“iSM∆:∆“ (∆: blank)
Error ....... “Err “
Warning ........ “Warning”
Information........ “Notice “
Information........ “Info “
Variable length :a maximum of 500 bytes of
character string
Blank Process
name
(2) Output image of event log
Important messages of iSM server are output to event log.
error: <11>Jan 03 11:29:52 iSM : 0000001048 Err iSMmaind iSM00000:This is example msg
warning: <12>Jan 03 11:29:46 iSM : 0000001048 Warning iSMmaind iSM00000:This is example msg
information: <14>Jan 03 11:29:47 iSM : 0000001048 Notice iSMmaind iSM00000:This is example msg
II-61
Page 96

Chapter 3 Basic Functions
3
.
6
E
v
3
.
6
3
.
6
Event link function is one of the iSM functions. With this function, mails that report events, or execution files or batch
files are started up on the monitoring server, according to the specified definitions, based on messages informed by iSM.
3
.
6
.
1
3
3
The event link function of iSM is as follows.
(1) The mail address of a destination can be specified for each message level, so that mail notification can be made
(2) Execution or batch files can be specified for each message level, so that link processing is possible.
(3) Definitions can be changed dynamically on the Setting Utility screen, without the need to restart the iSM server.
Storage Manager
Trouble
occurred
Figure 3-21 Event Link
.
6
.
1
.
6
.
1
to any mail address.
(For details, refer to 1.3 “Environment Setting”.)
e
E
v
e
E
v
e
D
e
D
e
D
e
Disk array
n
t
L
i
n
k
n
t
L
n
t
L
s
c
r
i
s
s
p
c
r
i
p
c
r
i
p
Operation administrator
Local site
i
n
k
i
n
k
t
i
o
n
t
i
o
n
t
i
o
n
Program start
o
f
t
h
e
o
f
o
f
processing can be
Figure 3-27 Event Link
t
h
e
Original report
t
h
e
set.
F
F
F
u
n
c
t
i
o
n
u
n
c
n
c
t
t
u
i
o
n
i
o
n
Operation administrator
on remote site
Remote site
Report can be
sent anywhere.
3
.
6
.
2
O
u
t
l
i
n
e
o
f
l
i
n
k
d
e
f
i
n
i
t
i
o
n
a
n
d
p
r
o
c
e
s
s
i
3
.
6
.
2
O
u
t
l
i
n
e
o
f
l
i
n
k
d
e
f
i
n
i
t
i
o
n
a
n
d
p
r
o
c
3
.
6
.
2
O
u
t
l
i
n
e
o
f
l
i
n
k
d
e
f
i
n
i
t
i
o
n
a
n
d
p
When a message is generated, a certain action is started as a link operation. To define this, please refer to 1.3
“Environment Setting”.
II-62
e
r
o
c
e
s
s
s
s
n
i
n
i
n
g
g
g
Page 97

Chapter 3 Basic Functions
r
3
.
6
.
3
O
u
t
l
i
n
e
o
f
O
p
e
r
a
t
i
o
n
3
.
6
.
3
O
u
t
l
i
n
e
o
f
O
p
e
r
a
3
.
6
.
3
O
u
t
l
i
n
e
o
f
O
p
If the definition for the message level of a message that has arrived is registered with environment settings, the defined
actions are executed. As actions for message levels, starting a batch file or program take precedence over mail
transmission. If, during the execution of an action, the next message is received, the actions for the next message will
be executed after the actions to be executed for the message currently being handled are completed.
In batch file or program starting, full path of the temporary file that stored the message body (installation folder
\etc\msgdrv\nnnn.txt) is sent as the first parameter. For batch file, program, or programs that are started up by these
files, read the temporary file if necessary and receive the message.
For mails, mail header files are sent as mails to the defined SMTP server.
If the sending of mails to the SMTP server does not end within 30 seconds, the sending is interrupted due to a time-out
error. Timeout, SMTP error and starting failure of execution files or batch files are notified via message so that they
can be checked on the operation log.
Because multiple link operations cannot be performed at the same time, up to 30 messages generated during a link
operation will be stored in a buffer. If more messages are generated, the excess messages will be discarded.
A loop may be formed if an error event with the event link function arrives at the event link function again and,
therefore, the messages output by the event link function itself will not be subject to linking.
In addition, when starting a batch file through the event link function, “Administrator” must be set to the account of
“Storage Manager”.
e
t
r
a
t
i
o
n
i
o
n
3
.
6
.
4
S
p
e
c
i
f
i
c
a
t
i
o
n
o
f
D
e
f
i
n
i
t
i
o
n
F
i
l
e
3
.
6
.
4
S
p
e
c
i
f
i
c
a
t
i
o
n
o
f
D
e
f
i
n
i
t
i
o
n
3
.
6
.
4
S
p
e
c
i
f
i
c
a
t
i
o
n
o
f
D
e
f
i
n
i
t
i
(1) Header File
The header file is the form of the actual mail to transmit, and mainly describes the header part of the mail. Input
“FROM:” on the first line, and write the mail sender’s name. If mail transmission fails in SMTP server due to
wrong target mail address, etc., an error message from SMTP server may send to a sender’s mail address. The
contents of the mail text after the second line are sent as it is, the part above the blank line is the header, and
subsequent part is the body of the mail. A message including “$MSG” in body is converted into a message that is
output to an operation log triggered by “$MSG” for linkage.
FROM: iSMserver@xxx.co.jp
SUBJECT: iSMserver error report.
← blank line
This is the iSMserver at XXXX(domain name etc.)
Error Reporting.
$MSG → A message output to operation log that triggered object linkage is described in this line.
Describe sender’s mail address.
Heade
o
n
F
F
i
l
e
i
l
e
Body
II-63
Page 98

Chapter 3 Basic Functions
1. Mail address to input on the “FROM:” line must be a complete one that includes domain name.
2. Various header lines in accordance with RFC822 can be written in the header part.
3. Any contents can be described in the body part.
4. The size of the whole header file must be less than 1KB. Also, one line must be less than 256 bytes (including
blank / tab / carriage return).
5. When a part of “$MSG” of a certain line is replaced into the message content, the “$MSG” which appears first
can be replaced. So even if two or more “$MSG”s are described in one line, only the first “$MSG” is
replaced. However, if the “$MSG”s are described in each line, they are replaced by the same contents.
3
.
6
.
5
D
3
.
6
.
5
3
.
6
.
5
Header file (Installation directory \conf\iSMsvr\mail.header )
FROM: iSMmsgdrv@xxx.co.jp ← Temporary sender address (any address can be specified)
SUBJECT: iSMserver error report. ← Title (any)
← blank line
This is the iSMserver at iSMsystem.xxx.co.jp. ← Mail text (any)
Error Reporting. ← Mail text (Number of lines is not restricted, however, must be 1KB or less
$MSG ← The actual contents of the message are inserted in this line, and are
If you get this mail, please be careful. ← Mail text.
e
D
e
D
e
f
i
n
i
t
i
o
n
E
x
a
m
p
l
e
f
i
n
i
t
i
o
n
E
x
a
f
i
n
i
t
i
o
n
E
m
x
a
m
on the whole)
transmitted as mail.
p
p
l
e
l
e
II-64
Page 99

Chapter 3 Basic Functions
3
.
7
E
S
M
P
R
O
L
i
n
k
3
.
7
E
S
M
P
R
O
e
e
O
w
w
w
L
L
o
f
o
o
3
.
7
E
S
M
P
R
iSM has a function for linking with ESMPRO as described below. ESMPRO Agent needs to be installed in advance to
a server where iSM operates.
3
.
7
.
1
O
v
e
r
v
i
3
.
7
.
1
O
v
3
.
7
.
1
The ESMPRO link functions of iSM are as follows:
(1) Alert report to ESMPRO Manager
(2) Call of the iSM client function from ESMPRO Manager
(3) Fault report to the maintenance engineer at a disk array fault (Note)
(4) Report of an iSM message on ESMPRO Manager using ESMPRO Alert Manager
O
v
e
e
e
r
v
i
r
v
i
i
n
k
i
n
k
t
h
e
F
u
n
c
t
i
o
n
f
t
h
e
F
u
n
c
f
t
h
e
F
u
n
c
t
t
i
o
n
i
o
n
If a modem is connected and fault report is made through the modem, fault report by ESMPRO link cannot be made.
3
.
7
.
2
R
e
l
a
t
i
o
n
s
h
i
p
w
i
t
h
E
S
M
P
R
O
M
a
n
a
g
e
r
3
.
7
.
2
R
e
l
a
t
i
o
n
s
h
i
p
w
i
t
h
E
S
M
P
R
O
M
a
n
3
.
7
.
2
R
e
l
a
t
i
o
n
s
h
i
p
w
i
t
h
E
S
M
P
R
O
M
When an iSM server has been installed, reports to ESMPRO Manager are defined automatically if ESMPRO Agent is
installed in advance to the server to run. Likewise, when an iSM client is installed, the iSM client is registered
automatically to the operation window as an operation monitoring tool if ESMPRO Manager is installed in advance.
This enables ESMPRO to perform integrated monitoring including business servers and storage.
(1) Alert report to ESMPRO Manager
When an iSM server is installed on the server machine where ESMPRO Agent has been installed, the ESMPRO
report function is set to allow reporting a disk array fault or iSM fault to ESMPRO Manager.
a
n
a
a
g
g
e
e
r
r
II-65
Page 100

Chapter 3 Basic Functions
(2) Call of the client functions of iSM from ESMPRO Manager
Figure 3-28 Alert Report Screen
When an iSM client is installed on the machine where ESMPRO Manager has been installed, an iSM client is
registered to the ESMPRO operation window as an operation monitoring tool. This enables ESMPRO to perform
integrated monitoring including business servers and storage.
Figure 3-29 Start Menu of the Registered iSM Client
II-66
 Loading...