

Navionics Raychart 425 Owner's Manual

Raychart 425
Chartplotter
Owner’s Handbook
Document # 81172_2
Date: January 2001

Raychart 425 Chartplotter iii
Raychart 425 Chartplotter
Owner’s Handbook
SAFETY NOTICES
CAUTION: HIGH VOLTAGE
The display unit contains high voltages. Adjustments r equire
specialized service procedures and tools available only to qualified
service technicians – there are no user serviceable parts or
adjustments. The operator shou ld never remove the disp lay unit
cover or attempt to service the equipment.
CAUTION: NAVIGATIONAL AID
This device is only an aid to navigation. Its accuracy can be affected
by many factors, including equipment failure or defects,
environmental conditions and improper handling or use.
Note: It is the us er’s responsibility to exercise common prudence and
navigational judgement. This device, therefore, should not be relied upon
as a substitute for such prudence and judgement.
The Raychart 425 Chartplotter is designed to use Navionics N av-Chart
chart cards which provide cartography in seamless v ector format.
THE LEADER IN ELECTRONIC CHARTS

iv
Preface
This handbook covers the Raychart 425 manufactured by Raytheon
Marine Company .
It contains important information on t he installation and operation of
your new equipment. In order to obtain t he best results in operation and
performance, please read this handbook thorough ly.
Raytheon’ s Product Support representatives, or your authorized dealer,
will be available to answer any questions you may have.
Warranty
T o register your Raychart 425 ownership, please take a few minut es to
fill out the W arranty registration card. It is very important that you
complete the owner information and return the card to the factory in order
to receive full warranty benefits.
EMC Conformance
All Raytheon equipment and accessories are designed to the best industry
standards for use in the recreational marine environ ment.
The design and manufacture of Raytheon equipment and accessories
conform to the appropriate Electromagnetic Compatibility (EMC)
standards, but correct installation is required to ensure that performance
is not compromised.
Technical Accuracy
The technical and graphical information contained in this h andbook, to
the best of our knowledge, was correct as it went to press. However , the
Raytheon policy of continuous product improvement may change
product specifications without prior not ice. As a result, unavoidable
differences between the product and handboo k may occur from time to
time, for which liability cannot be accepted by Raytheon.
Raytheon is a registered trademark of Raytheon Co mpany .
Copyright © Raytheon Marine Company 2000

v
Contents - Raychart 425 Chartplotter
SAFETY NOTICES................................................................. iii
W arranty................................................................................... iv
EMC Conformance.................................................................. iv
T echnical Accuracy.................................................................. iv
Chapter 1: Overview .................................................................................. 1-1
1.1 Introduction..............................................................................1-1
How this Handbook is Organized ............................................1-1
1.2 Satellite Differential System....................................................1-2
How it W orks ...........................................................................1-3
A vailability of the W AAS System in North America ..............1-4
Coverage Outside of North America .......................................1-4
Accuracy and Continuation of Broadcast Coverage ...............1-4
1.3 The Chartplotter.......................................................................1-4
Display Functions ....................................................................1-4
Operating Controls ..................................................................1-5
Chapter 2: Getting Started ....................................................................... 2-1
2.1 Introduction..............................................................................2-1
Conventions Used ...................................................................2-1
Simulator ................................................................................. 2-1
2.2 Switching On/Off.....................................................................2-2
Changing the Lighting and Contrast ........................................2-2
2.3 Chart Simulator........................................................................2-3
2.4 Controlling the Display............................................................2-4
Selecting the Display Mode ....................................................2-4
Moving Around the Chart ....................... ................................2-6
2.5 Using Navionics Nav-chart Cards............................................2-9
Inserting a Nav-Chart Card .....................................................2-9
Removing a Nav-Chart card ..................................................2-10
Displaying the Chart Data ....................... ..............................2-10
Chapter 3: Operation ................................................................................. 3-1
3.1 Introduction..............................................................................3-1
Safety .......................................................................................3-1
3.2 W orking with W a ypoints..........................................................3-1
Introduction .............................................................................3-1
Placing a W aypoint ..................................................................3-2
Selecting a W aypoint ...............................................................3-4
W aypoint Data Display ...........................................................3-5
Editing W aypoint Details ........................................................3-5
Erasing W aypoints ...................................................................3-7

vi
Moving W aypoints ..................................................................3-8
3.3 W orking with Routes................................................................3-8
Creating a New Route ............................................................3-10
Saving the Current Route ......................................................3-11
Clearing the Current Route from the Screen ..........................3-12
Retrieving a Route from the Database ...................................3-12
Displaying Route Leg and W aypoint Information ................3-13
Erasing or (re)Naming a Route ..............................................3-14
Editing a Route ......................................................................3-14
3.4 Following Routes and Going to T arget Points........................3-16
Follow a Route .......................................................................3-17
Reverse a Route .....................................................................3-17
T arget Point Arrival ...............................................................3-18
Alter a Route ..........................................................................3-18
Going to an Individual T arget ................................................3-20
Stop Follow or Stop Goto ......................................................3-23
3.5 Changing the Display Mode...................................................3-23
CDI Display ...........................................................................3-24
BDI Display ...........................................................................3-25
W aypoint Data .......................................................................3-26
Navigation Data .....................................................................3-27
Time/Date Data .....................................................................3-28
3.6 T ransferring W aypoints and Routes.......................................3-30
Displayed W aypoints .............................................................3-30
3.7 Using T racks ..........................................................................3-32
Setting up a Track ..................................................................3-33
Clearing the Current Track ....................................................3-34
SmartRoute ............................................................................3-35
3.8 Displaying Chart Information................................................3-35
Port Services ..........................................................................3-35
Tide Information ....................................................................3-36
3.9 Man Overboard (MOB) .........................................................3-42
3.10Alarms....................................................................................3-43
Chapter 4: Setting Up .................................................................................4-1
4.1 Introduction..............................................................................4-1
4.2 System Set Up Parameters .............................. .........................4-1
Bearing Mode ..........................................................................4-3
Key Beep .................................................................................4-3
Units ........................................................................................4-3
Variation ..................................................................................4-3
Date Format .............................................................................4-4
Time Of fset ..............................................................................4-4

vii
Language ................................................................................. 4-4
Simulator ................................................................................. 4-4
Simulated SOG ........................................................................4-4
Simulated COG .......................................................................4-5
4.3 Chart Set Up Parameters..........................................................4-5
Orientation ...............................................................................4-7
Plotter Mode ............................................................................4-7
Show W aypoints ......................................................................4-7
W aypoint Symbol ....................................................................4-8
Autozoom ................................................................................4-8
Screen Amplifier .....................................................................4-8
COG V ector .............................................................................4-8
Arrival Circle ...........................................................................4-8
Anchor Alarm ..........................................................................4-8
XTE Alarm ..............................................................................4-9
Chart T ext ................................................................................4-9
Chart Boundaries .....................................................................4-9
Depth Contours <5M ...............................................................4-9
Depth Contours 10M ...............................................................4-9
Depth Contours >20M .............................................................4-9
Position Calibration .................................................................4-9
4.4 GPS Setup..............................................................................4-10
Chapter 5: Installation .............................................................................. 5-1
5.1 Introduction..............................................................................5-1
EMC Installation Guidelines ...................................................5-1
Suppression Ferrites ................................................................5-2
Connections to Other Equipment ............................................5-2
5.2 Unpacking and Inspecting the Components ............................5-2
Items Missing? ........................................ ................................5-3
Registering this Product ..........................................................5-3
GPS Receiver Installation .......................................................5-3
5.3 Installing the Chartplotter ........................................................5-6
Trunnion (yok e) Mounting ......................................................5-8
Panel Mounting .......................................................................5-9
5.4 Cable Running .......................................................................5-10
Introduction ...........................................................................5-10
Connectors .............................................................................5-11
5.5 System Check and Initial Switch On......................................5-13
EMC Conformance ...............................................................5-13
System Check ........................................................................5-13
Initial Switch On ....................................................................5-13
Checking Chartplotter Operation ..........................................5-14

viii
Chapter 6: Maintenance & Fault Finding .................................................6-1
6.1 Maintenance.............................................................................6-1
Routine Checks .......................................................................6-1
Servicing and Safety ................................................................6-1
6.2 Resetting the System................................................................6-2
6.3 Problem Solving.......................................................................6-2
Fault Finding ...........................................................................6-3
6.4 W orldwide Support..................................................................6-3
Appendix A: Raychart 425 Specification ................................................ A-1
Appendix B: Raystar 120 Specification ...................................................B-1
Appendix C: NMEA Data ............................................................................C-1
Appendix D: List of Abbreviations ......................................................... D-1
GPS Receiver Mounting Template ............................................................ T-1
Raychart 425 Mounting Template ............................................................ T-3

Chapter 1: Overview 1-1
Chapter 1: Overview
1.1 Introduction
This handbook describes the Raychart 425 Chartplot ter and its
associated Raystar 120 GPS Receiver. The Raystar 120 utilizes Satellite
Differential (SD) signals for enhanced navigational accuracy over
conventional shore based differential GPS sys tems (dGPS).
The Raychart 425 Chartplotter is waterproof and can be inst alled either
above or below deck. The equipment comprises:
• 6 in LCD display with Chart holder compartment for a Navionics
®
Nav-Chart electronic chart card
• Raystar 120 GPS Receiver
The Raychart 425 Chartplotter can out put GPS and W aypoint data to
operate with other equipment, eg. an autopilot or repeater instrument
connected via the NMEA 0183 interface
1
.
How this Handbook is Organized
The handbook is organized as fol lows:
Chapter 1: Overview (this chapter) provides an overview of the features
and functions of the Raychart 425 and associated Rayst ar 120. Please
read this chapter to familiarize yourself with the Chartplotter and
Satellite Differential system.
Chapter 2: Getting Started provides an overview of the controls and how
to star t using th e chartpl otter .
Chapter 3: Operation provides detailed operating pro cedures for the
main chartplotter functions - plotting waypo ints and routes, navigation
functions, Track handl ing, Port and Tide information, Man Overboard
and Alarm functions.
Chapter 4: Setting Up provides instructions for setting up the
chartplotter system and charting preferences.
Chapter 5: Installation provides planning consid erations and detailed
instructions for installing the Chartplotter and GPS Receiver o n your
vessel.
Chapter 6: Maintenance & Fault Finding provides information on user
maintenance and what to do if you experience problems.
1. National Marine Electronics Association (NMEA) 0183 interconnection standard, Version 2.3
April 1998.

1-2 Raychart 425 Chartplotter
Appendix A details the T echnical Specification for the Chartplotter.
Appendix B details the T echnical Specification for the GPS Receiver.
Appendix C defines the NMEA data received/transmitted by the
Chartplotter.
Appendix D provides a list of abbreviations used in t his handbook.
Installation Templates for the Raychart 425 and its associated
Raystar 120 GPS Receiver are included at the end of this handbook.
1.2 Satellite Differential System
The Raystar 120 GPS Receiver utilizes a new satellite differential
correction system to improve the accuracy and integrity of the basic GPS
signals. Three separate compatible systems currently exist or are being
developed:
1. Wide Area Augment ation System (W AAS). Developed by th e Federal A viation Administration (F AA) in the USA.
2. European Geostationary Navigation Overlay System
(EGNOS). This system is being devel oped by a European consortium.
3. The MTSA T Satellite-Based Augmentation System (MSAS). Being
developed by the Japan Civil A v iation Bureau (JCAB) for civil aviation use.
The area coverage of the W AAS system is the furthest advanced so far
and includes the entire United States of America but also covers large
areas outside of this as shown in Figure 1-1.
Figure 1-1: WAAS Coverage Map
D4910-1
0˚
15˚N
30˚N
45˚N
60˚N
75˚N
15˚S
0˚15˚W30˚W45˚W60˚W90˚W 75˚W105˚W120˚W135˚W150˚W165˚W 15˚E135˚E 150˚E 165˚E 180˚
Chapter 1: Overview 1-3
The combination of the W AAS, EGNOS and MSAS systems will
provide global satellite based different ial GPS augmentation into the
future.
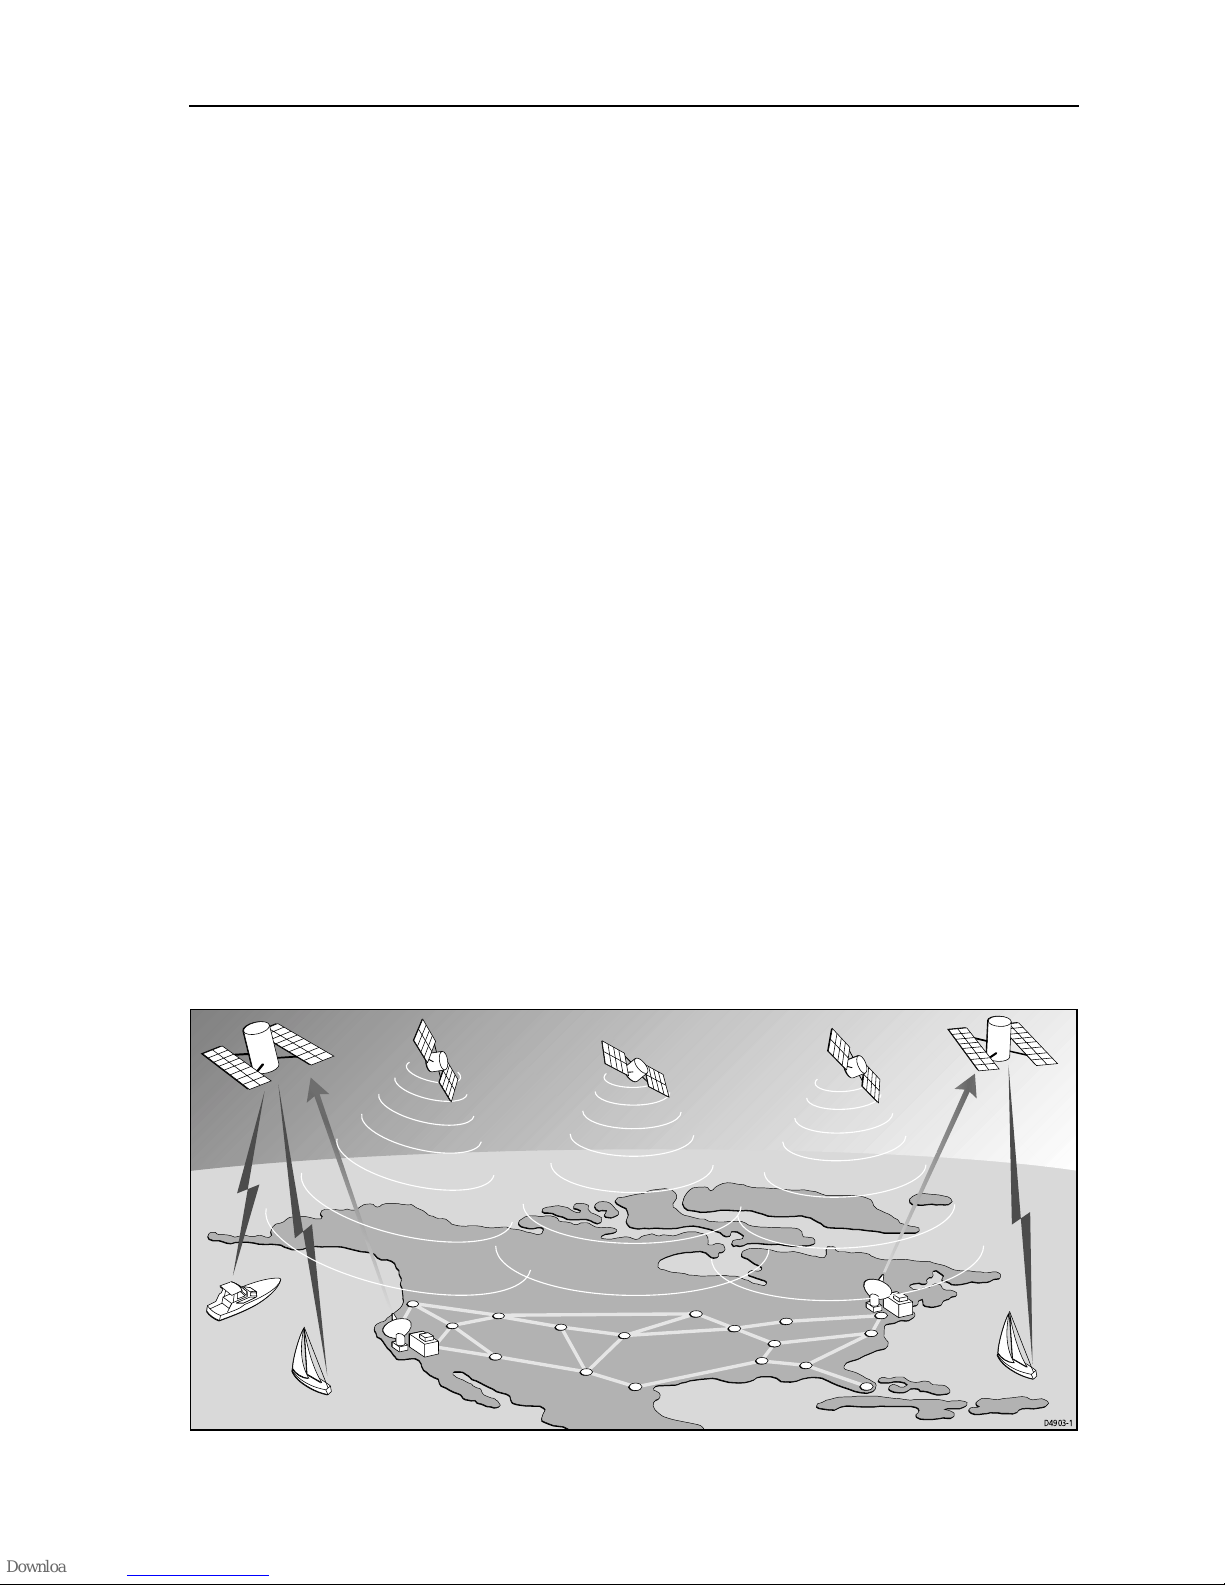
How it Works
The following description is based on WAAS, but the principles apply
equally to the EGNOS and MSAS systems.
W AAS comprises the following components:
• Ground Reference Stations across the USA
• Master Stations located at East Coast and W est Coast
• Geostationary Satellites located above the equator
The Ground Reference Stations are located at known positions and
receive data continuously from GPS. The Ground Reference Stations
send their data to the Master Stations which calculate the error of the
GPS-received positions and generate correctional data.
The corrected ‘differential’ signa ls are then sent to the two
Geosta tionar y Satelli tes wh ich broadcast the corrected data on the
standard GPS frequency , making it available to the user’s R aystar 120
GPS Receiver.
The Raystar 120 GPS Receiver uses the correctional data transmitted by
the Geostationary Satellites to refine the GPS positional data for greater
accuracy.
W AAS is s hown pictorially in Figure 1-2.
Figure 1-2: The WAAS System
D4903-1

1-4 Raychart 425 Chartplotter
Availability of the WAAS System in North America
The W AAS system is presently broadcasting and being tested for
aviation use. It is expected to be certified by the F AA in 2002. During this
testing and certification period, continuous service is expected, however,
brief signal outages may occur as refinements and upgrades are made to
the system. The status of W AAS and planned outages are available online at Raytheon’s website http://wwws.raytheontands.com/waas
or http://www.raymarine.com
Coverage Outside of North America
EGNOS is currently in the early testing and qualification phases and
signal outages may occur at any time. The status of EGNOS and any
planned outages are available on-line at Raytheon’s website
http://www.raymarine.com
Use of Satellite Differential is currently disabled outside of the W AAS
reception area. When EGNOS is qualified for navigational use, a
procedure will be published on our websi te which will enable EGNOS
operation. See http://www.raymarine.com
for latest information.
Accuracy and Continuation of Broadcast Coverage
The navigational accuracy of equipment using these satellite broadcast
SD signals during the testi ng and qualification phases is not guaranteed
by Raytheon Marine Company or Raytheon Corporat ion, nor is the
continuation of the broadcast SD signals the respon sibility of Raytheon
Marine Company or Raytheon Corporation.
1.3 The Chartplotter
Display Functions
The Raychart 425 Chartplotter includes the following functions:
• Create, Place, Move, Edit or Erase a W aypoint.
• GoT o W aypoint, Port, Facili ty or Cursor .
• Display T ide Heights, Ti de Currents, Sun and Moon data.
• Create, Save, Name, Edit or Follow a Route.
• Review Route and W aypoint Li sts.
• Display vessel’s track on-screen.
• Convert a track to a route (SmartRoute).
• Set Up Alarms and Timers.
• Man OverBoard (MOB) to navigate back to a missing person or
object.

Chapter 1: Overview 1-5
• Satellite acquisition data.
• Uses positional information from Satellite Differential GPS to dis-
play vessel’s positi on.
• The display and keys can be illuminated for night-time use.
• Detailed navigation information is displa yed when a Navionics
®
Nav-Chart card is installed.
• The vessel’s position is shown as a boat symbol p ointing in its current
direction.
At the top of the chartplotter screen a status bar displays chart scale,
cursor position plus range and bear ing or the vessel’s position, Speed
Over Ground (SOG) and Course Over Ground (COG). When i n
Simulator mode, a flashing
SIM indication is displayed in inverse video in
the top left hand corner with corresponding N orth Up (
NU), Head Up
(
HU)or Course Up (CU) information. If in Overzoom mode, this is
indicated by
OV.
W aypoints previously placed are displayed and the current route is
shown. Data can be viewed for current route or chart object.
The chartplotter screen can also show additional information, depending
on your currently selected options, set up sele ctions and data available
from other equipment.
An example chart display in its default configuration, with a chart card
install ed, is shown in Figure 1-3 .
Several functions are available to control the display as follows:
• Zoom in /out.
• Pan the Display.
• Centre the Chart around the Vessel.
Operation of these functions is described in Chapter 2.
Display Options
Display options are selected in System Set Up and Chart Set Up as
described in Chapter 4.
Operating Controls
The chartplotter is operated by means of the follow ing controls:
• A trackpad.
• Six dedicated push-button (label led) keys.
• On-screen pop-up menus from which options are sel ected.
• On-screen database lists which enable the editing of items.
The controls are shown in Figure 1-3; they are back-lit for night-time use.
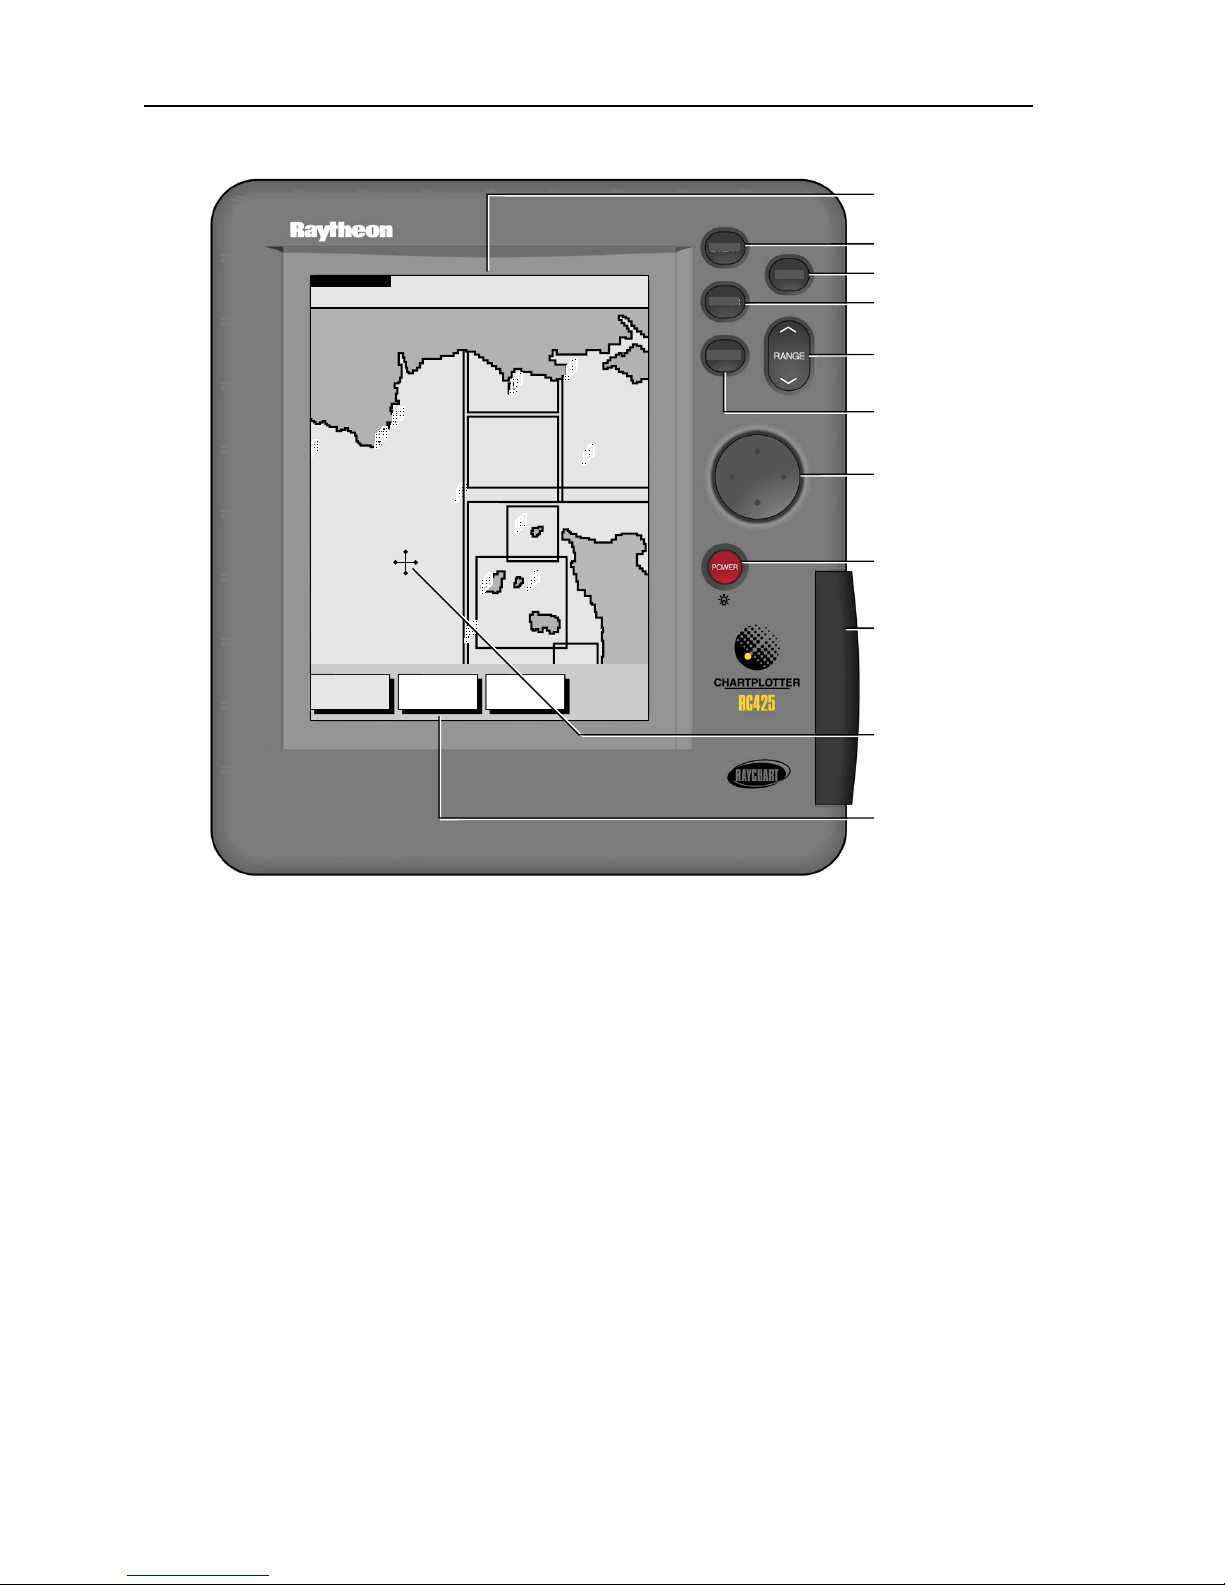
1-6 Raychart 425 Chartplotter
Figure 1-3: Raychart 425 Chartplotter Operating Controls
Trackpad and Cursor
The trackpad is used to move the cursor horizontally , vertically or
diagonally . The cursor is the cross-hair symb ol (+) which is used to select
a position or item on the chart.
The longer that the edge of the trackpad is pressed, the faster the cursor
moves. The current cursor position is shown i n the status bar at the top of
the screen.
The cursor is context-sensitive. Some items on the screen, such as
waypoints and chart objects have information ass ociated with them.
When the cursor is placed over such objects, their information is
displayed in the status bar . In addition, a function bar is dis played for
certain items. For example, when the cursor is placed over a waypoint,
the waypoint data is displayed in the status bar and the waypoint options
function is displayed.
PAG E
GOTO
MOB
CLEAR
ENTER
TOPSHAM
EXETER
TEIGNMOUTH
EXMOUTH
TORQUAY
DARTMOUTH
PLYMOUTH
ENPORT
SALCOMBE
PORTLAND
HARBOUR
ISLE O
CAP DE
LA HAGUE
ALDERNEY
GUERNSEY
JERSEY
PORTB
CSR 48°30.367'N
POS 1°35.636'W
128 nm
FIND SHIP ROUTES WAYPOINTS
BRG 231°T
RNG 40.91nm
SIM OV NU
GOTO key
PAGE key
CLEAR key
RANGE key
ENTER key
Trackpad
POWER key
Navionics
®
Nav-Chart
compartment
Cursor
Primary
Function Bar
Status Bar
D4982_2

Chapter 1: Overview 1-7
Note: Duri ng many operations the cursor cannot be moved around the
screen, eg. whilst a function bar is displayed, the cursor is used exclusively for selection. In such cases, three rapid beeps indicate invalid action.
Dedicated Keys
These keys have fixed functions. Some keys can be used in either of two
ways:
• Press: Press the key momentarily and then release it. This method is
used for most key operations.
• Press a nd hold: Press the key , keep it pressed for the period of time
stated (eg. 3 seconds), then release it.
When a dedicated key is pressed, one of the following occu rs:
1. The associated operation is actioned, eg. change chart scale (
RANGE
key).
2. A pop-up menu is displayed, prov iding further options.
3. A set of functions is disp layed.
As a key is pressed, a single audio beep confirms the key action. If t he
key-press is not valid for the current screen or mode, three rapid beeps
sound to indicate that no response is available. If required, the key beeps
can be turned off as part of your set up procedure (see Chapter 4).
Function Bar
The Function Bar at the bottom of the screen contains a number of
functions which change according to the current operation. The functions
are grouped into related sets and subsets pro viding access to the various
functions. The primary function bar is disp layed when the
ENTER key is
pressed.
The currently selected function is highlighted by means o f a gray
background.
When a function is invoked, one of the following o ccurs:
1. The associated operation is actioned, eg.
GOTO WAYPOINT.
2. A sub-set of functions is di splayed.
3. A pop-up menu is displayed, prov iding further options.
4. The appropriate database list (Rout e or W aypoint) is displayed.
As with dedicated keys, when the action is invoked, a single audio beep
confirms the action. If the selection is not valid, three rapid beeps indicate
invalid action. Key beeps can be deactivated as part of the set up
parameters (see Chapter 4).

1-8 Raychart 425 Chartplotter
Pop-Up Menus
Pop-up menus usually provide vari ous options. When a pop-up menu is
on-screen, a set of associated functions is also displayed.
Use the trackpad to select an option from the menu, then use the
appropriate function to set the opti on, eg. the radius of the waypoint
arrival alarm can be specified and the selected navigation data can be set
on/off.
Database Lists
The waypoints and routes created on the chartplotter are stored in
database lists. These lists can be viewed and items selected for editing.
As with pop-up menus, when a database list is on-scr een, a set of
associated soft keys is also displayed; use the trackpad to select an item
from the list, then use the appropriate function to edit the item, eg. a
W aypoint or a Route can be erased.

Chapter 2: Getting Started 2-1
Chapter 2: Getting Started
2.1 Introduction
This chapter provides information and ins tructions to allow you to
practice using the Raychart 425 Chartplotter . It is intended to help you
become familiar with the controls before you start using the chartplotter
for routine navigation.
Note: Ther e is often more than one method of perf orming a particular
task. Normal operating procedures are detailed in Chapter 3. When you
become familiar with the system you can adapt t hese procedures to suit
your method of operation.
Conventions Used
Throughout this handbook, the dedicated (labelled) keys are shown in
bold capitals; for example,
ENTER. The functions and options are shown
in normal capitals, eg.
LIGHT.
Operating procedures, which may consist of a single key-press , or a
sequence of numbered steps, are indicated by a
➤ symbol in the margin.
When textual data is displayed on screen, any unavai lable data is shown
as dashes, one per character .
Where procedures refer to Select, this im plies usin g the trackpa d to
highlight a function, then pressing the
ENTER key to action that function.
Simulator
The Chartplotter display unit includes a Simulator mode, which allows
you to practice operating your chartplotter without data from a GPS
system. Y ou will need to use the set up options to switch the display to
Simulator mode, as described in Secti on 2.2, Switching On/Off. Y ou can
use it in either of two ways:
• Before the chartplotter has been installed on your vessel. In this case,
you only need to connect the Chartplotter displ ay unit to a 12VDC
power supply , fused at 1A, connecting the red core from the power
lead to positive (+) and the black core to negative (-); see Chapter 5 for
full details.
• After the chartplotter has been installed on your vessel and while in a
marina or otherwise at anchor .

2-2 Raychart 425 Chartplotter
2.2 Switching On/Off
➤ T o turn the chartplotter display unit on, press the POWER key. The keys
illuminate, the display unit beeps and the Raychart logo i s displayed,
followed by the following warning:
WARNING
THE ELECTRONIC CHART IS AN AID TO
NAVIGATION DESIGNED TO FACILITATE
THE USE OF AUTHORISED GOVERNMENT
CHARTS, NOT TO REPLACE THEM. ONLY
OFFICIAL GOVERNMENT CHARTS AND
NOTICES TO MARINERS CONTAIN ALL
INFORMATION NEEDED FOR THE SAFETY
OF NAVIGATION AND, AS ALWAYS, THE
CAPTAIN IS RESPONSIBLE FOR THEIR
PROPER USE.
Press “ENTER” to continue.
When you have read and understood the warning, press t he ENTER key.
The chart is displayed.
If this is the first time that the chartplotter has been switched on, and no
chart card is installed, the display show s the background world map at
Lat 0°/Lon 0°. Otherwise, the display shows the selected chart area and
any data that were displayed when the unit was last used.
➤ T o turn the display unit of f, press and hold the POWER key for at least
3 seconds. A countdown timer is displayed; when it reaches zero the
display and key back-lights ext inguish.
Changing the Lighting and Contrast
Y ou can change the level of backlighting and cont rast for the screen. The
key backlighting remains on to enable the keys to b e seen at all times.
➤ T o change the lighting and contrast:
1. Press the
POWER key to display the lighting controls (Figure 2-1).

Chapter 2: Getting Started 2-3
Figure 2-1: Lighting Controls
The last-used control is highlighted in inverse video.
2. Press the trackpad left/right to select the LIGHTS function.
3. Press the trackpad top/bott om to increase or decrease the lighting to
one of four levels. Y ou can pres s and hold the trackpad to change the
setting more rapidly . The lighting level is adjusted as y ou change the
setting.
4. Press the trackpad right to select the contrast control. There are 16 con-
trast levels. Adjust the setting as for lighting to select the best viewing
level.
5. Press
CLEAR to return to the chart screen, with the new lighting and
contrast levels retained.
When the display unit is switched on, screen lighting is restored to
ON if
it was
ON previously . Whilst the unit is switched on, the chosen lighting
level is retained until you reset it. The new contrast level is retained until
you reset it, even after power-of f, unless you set the control very low or
very high; in this case, the contrast will be restored on pow er-up as
follows:
• Contrast set < 30% restored to 30%
• Contrast set > 70% restored to 70%
2.3 Chart Simulator
When simulator mode is started, your initial simulated position is
wherever the cursor was last positioned. To practice using the
chartplotter in a particular chart area, use the trackpad to pan to that area,
then swit ch simulator
ON.
Note: If re al position data is available and the simul ator is active, simulated data takes precedence. On power-up the simulator defaults to its
previous setting on power- down. Care should be taken to determine de-

2-4 Raychart 425 Chartplotter
sired mode on power-up. Simulated data should never be used for navigational purp oses.
➤ T o view a chart image using simulated data:
1. Press the
PAGE key to display t he SET UP function bar (Figure 2-2):
Figure 2-2: Set Up Function Bar
2. Press trackpad left /right to highlight SYSTEM SET UP and press ENTER
to display the System Set Up menu.
3. Use trackpad up/down to highl ight the
SIMULATOR option.
4. Use trackpad le ft/right to select
ON.
5. If necessary , use trackpad up/down to highlight, in turn, the
SIMU-
LATED SOG
and COG op tions and trackpad left/right to set as required.
These set Speed in 1Kt intervals and Course in 1° intervals, respectively.
6. Press
CLEAR twice to return to the chart screen.
7. A flashing
SIM indicator appears in inverse video in the status bar at
the top of the chart screen.
2.4 Controlling the Display
This section describes how to:
• Change the display mode.
• Move around the chart by panning the display , changing the chart cen-
tre and changing the chart scale.
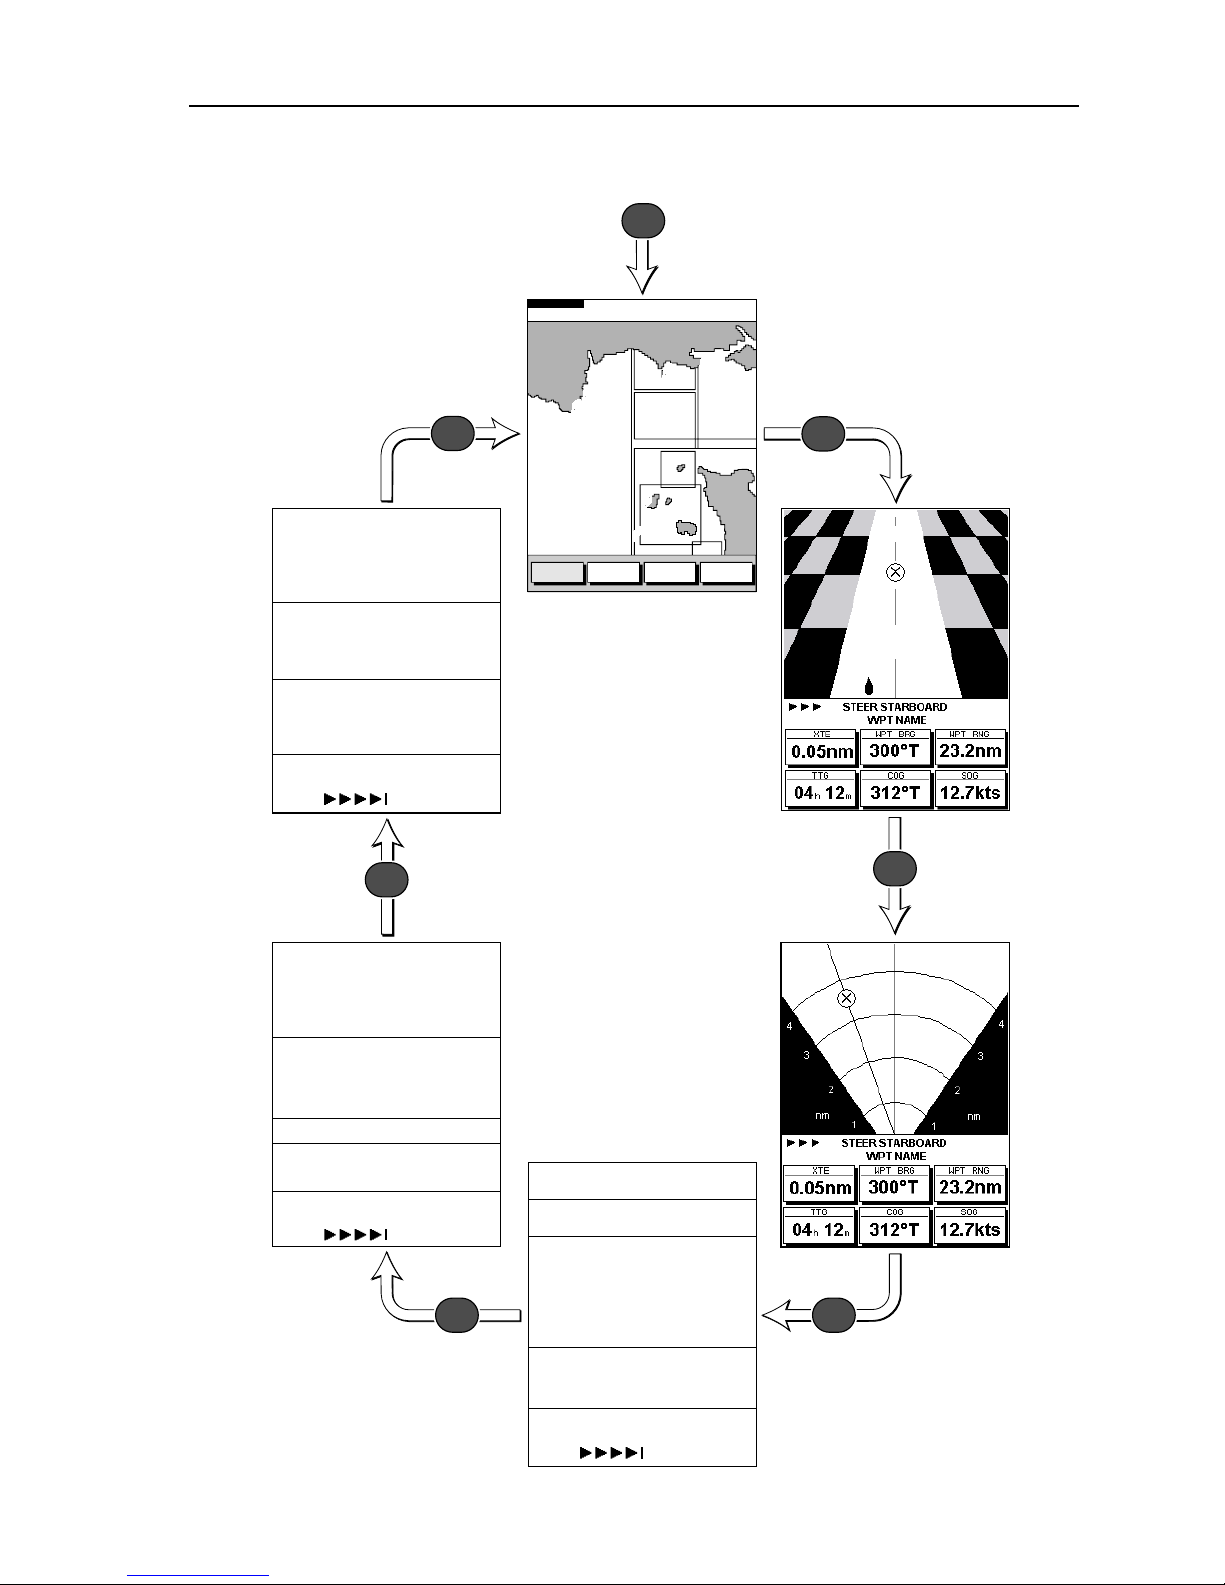
Selecting the Display Mode
Use the PAGE key to select the display mode. Select the following modes
by repeat presses of the
PAGE key as listed below and shown in
Figure 2-3:
• Set Up functions (see Chapter 4)
• Course Deviation Indicator (CDI)
• Bearing & Distance Indication (BDI)
• W aypoint data
• Navigation data
• Time/Date data
• Return to Set Up functions
Note: Press
GOTO to return to normal Chart display at any time.
D4694_1
Chapter 2: Getting Started 2-5
Figure 2-3: Display Modes
50°45.000 N
001°06.000 W(c)
COG 230° T
SOG 6.8 Kts
WAYPOINT 001
POSITION
STEER STARBOARD
BRG 234° T GPS FIX
RNG 2.4 nm TIME 14:32 12/12/99
TIME 12:34
DATE 26/01/99
ETA (WAYPOINT) 13:37 26/01/99
TTG (WAYPOINT) 01:03
ETA (ROUTE) 14:32 27/01/99
TTG (ROUTE) 34:03
STEER STARBOARD
SUNRISE 06.23
SUNSET 21.34 TODAY
AT POSITION (USER SELECTED)
50°45 .000 N
001°06 .000 W (c)
COG 230° T TIME 13:29 12/12/99
SOG 6.8 Kts TTG 01:03
XTE 0.5 nm ETA 14:32 12/12/99
BRG 234° T
RNG 12.4 nm
ROUTE
ROUTE 01
WPT 001 TO WPT 002
WAYPOINT
STEER STARBOARD
PAGE
PAGE
PAGE
PAGE
PAGE
PAGEPAGE
From Chart Display
Press PAGE to display Set Up functions
Press
to display CDI
Press
to display
Waypoint Data
Press
to display
Navigation Data
Press
to return to
Chart display
Press to display
Time/Date
information
Press to display
BDI
TOPSHAM
EXETER
TEIGNMOUTH
EXMOUTH
TORQUAY
DARTMOUTH
PLYMOUTH
ENPORT
SALCOMBE
PORTLAND
HARBOUR
ISLE O
CAP DE
LA HAGUE
ALDERNEY
GUERNSEY
JERSEY
PORTB
CSR 48°30.367'N
POS 1°35.636'W
128 nm
BRG 231°T
RNG 40.91nm
SYSTEM
SETUP
CHART
SETUP
TRACK
SETUP
GPS
SETUP
D4724_2
Note: In any display mode,
press GOTO to return
to chart display
SIM OV NU

2-6 Raychart 425 Chartplotter
Moving Around the Chart
Y ou will normally operate the chartplotter with the chart showing your
vessel’s current location.
In the default North-Up orientation (shown in the status box at the top of
the display), the vessel moves in relation to the screen. Y ou will need to
reposition the chart if your vessel moves o ut of the area currently
displayed, or if you wish to examine or place waypoints in another area.
Alternatively, you can home the cursor onto the vessel using the
FIND
SHIP
function. ‘homing’ locks the vessel to the cursor and updates the
display such that the chart is re-drawn so as to ensure that the vessel is
always on screen, see Using
FIND SHIP below.
There are three ways in which you can reposition the chart:
• Use the trackpad to mo ve the cursor to the edge of the chart; the chart
pans across. This method is useful if the area you wish to see is just off
screen.
• Automatically re-centre the vessel using the
FIND SHIP function.
• Change the chart scale using the
RANGE key to zoom out and in to a
new area. This method is useful if the area you wish to see is some distance away.
Using FIND SHIP
FIND SHIP is used to re-draw the chart with the vessel normally at its
centre and the cursor homed on the vessel.
➤ T o centre the vessel:
1. From chart mode, press
ENTER; the primary function bar is displayed
(Figure 2- 4):
Figure 2-4: Primary Function Bar
2. Select FIND SHIP; the following actions are performed:
• The chart is re-drawn with the vessel’s position in th e centre.
• The cursor is homed onto the vessel position and moves with it.
• When the vessel moves near the edge of the chart window, the chart
is redrawn with the vessel at the centre and the cursor homed on the
vessel.
• Whilst homed, the status bar indicates vessel posi tion,
SOG and
COG.
Chapter 2: Getting Started 2-7
• If Screen Amplifier is enabled, the vessel is positioned so as to
increase screen forward visibility, see Chapter 4 : Setting Up.
3. T o release the cursor from homed mode press the trackpad to move the
cursor away from the vessel’s current position. The status bar shows
the cursor position, range and bearing.
Changing the Chart Scale
The RANGE key changes the chart scale so that a smaller or larger area is
shown on the available cartography .
Plotter mode is available to allow you to zoom into a smaller area, even
when no chart data is available for that scale. To enable plotter mode, see
Chapter 4: Setting Up.
Y ou can change the chart scale for two purposes:
• T o see either more detail (of a smaller area) or a larger area (in less
detail).
• T o move the display to another area of the chart, by zooming ou t to a
small scale chart, then zooming in on another posi tion.
Each time you press the
RANGE key , the chart scale changes to the next
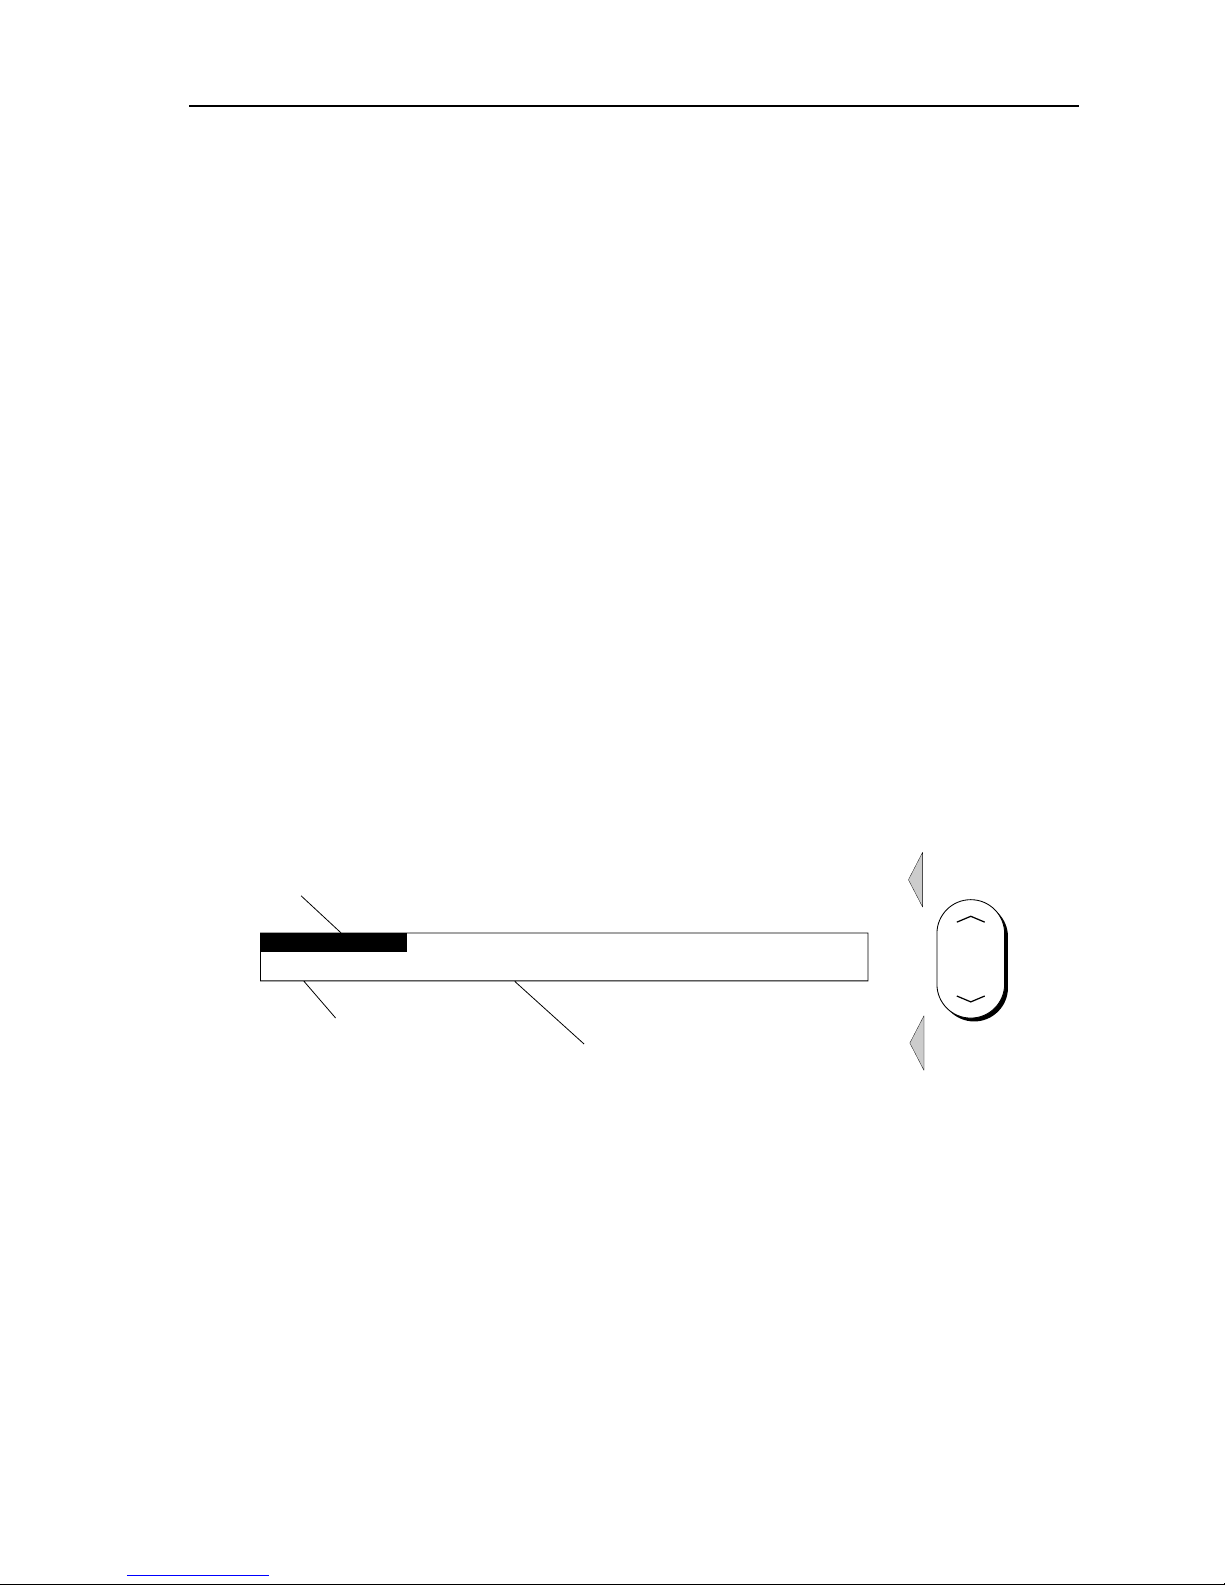
available setting. The Status Bar at the top of the screen indicates the
distance, from top to bottom of the display , in nautical miles (Figure 2-5).
Figure 2-5: Status Bar Indication
➤ For rapid scale change, press and hold the required arrow on the RANGE
key .
The distance indicator at the left-hand end of the status bar is updated
whenever you change the chart scale.
➤ T o zoom in to a more d etailed ch art:
1. Use the trackpad to position the cursor in t he area you wish to see in
more detail and press the bottom of the
RANGE key to zoom in.
The section of the chart around the cursor is enlarged to fill the screen
with the chart showing more detail. The cursor is now positioned in
the centre of the screen.
The distance indicated at the top left of the screen is updated.
RANGE
D4990_1
Increases the
chart range
Decreases the
chart range
Vertical distance
displayed on chart
Status Bar
BRG 231°T
RNG 40.91nm
128nm
SIM OV NU
Simulator
indication
CSR 48°30.367'N
POS 1°35.636'W
2-8 Raychart 425 Chartplotter
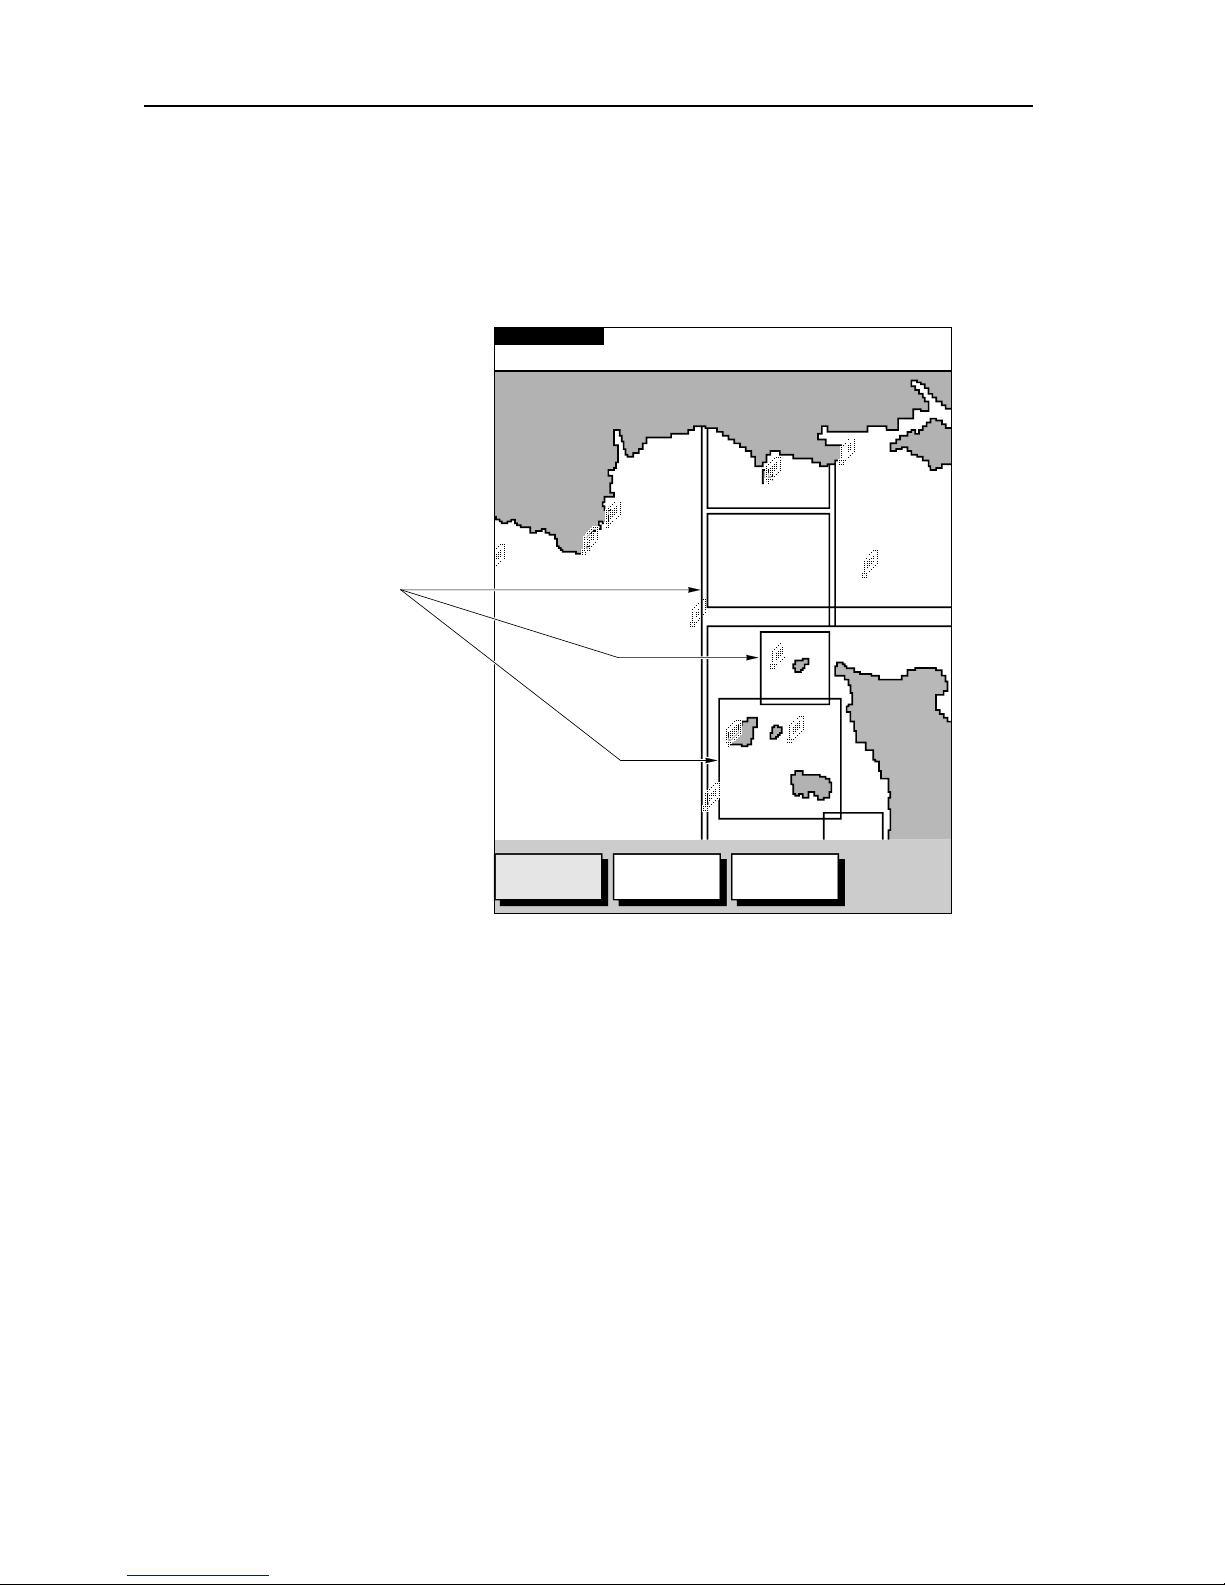
2. If further chart enlargement is available using the current chart card
you can press the bottom of the
RANGE key to zoom in again, reposi-
tioning the cursor first if required.
An area of further chart detail is indicated by a box around the area as
shown in Figure 2-6.
Figure 2-6: Chart Detail Boundaries
3. If no further chart detail is available then, when the bottom of the
RANGE key is pressed, the result depends up on whether Plotter Mode
is on or off:
• If Plotter Mode is Off, the chart scale remains unchang ed, indicat-
ing that the greatest detail is displayed.
• If Plotter Mode is On, the scale is decreased but, as there is no fur-
ther detail, the vessel, waypoints, routes and t racklines are displayed without cartography .
The chart information is restored when you return to a chart scale for
which the information is available.
➤ T o zoom out to a less detailed chart, press the top of the RANGE key as
many times as required.
TOPSHAM
EXETER
TEIGNMOUTH
EXMOUTH
TORQUAY
DARTMOUTH
PLYMOUTH
ENPORT
SALCOMBE
PORTLAND
HARBOUR
ISLE O
CAP DE
LA HAGUE
ALDERNEY
GUERNSEY
JERSEY
PORTB
CSR 48°30.367'N
POS 1°35.636'W
128 nm
FIND SHIP ROUTES WAYPOINTS
BRG 231°T
RNG 40.91nm
D4988_1
SIM OV NU
Chart Boundary -
Indicates further
detail is available inside.
Shown when using
Navionics
®
Nav-Chart
card.

Chapter 2: Getting Started 2-9
2.5 Using Navionics Nav-Chart Cards
The chartplotter has a built-in world map that can be used for rout e
planning. Most areas (these are shown with chart box boundaries) are
covered at a range of approximately 512nm as shown on the S tatus Bar at
the top o f the scr een.
T o use the chartplotter as a navigation aid, charts with detailed
information for the area you wish to navigate are required. The charts are
available on Navionics Nav-Chart cards, each of which can store up to 20
charts in an electronic format, depending upon its memo ry storage
capacity.
A Nav-Chart card provides an appropriate level of detail f or a given
geographic area and scale; this data can be displayed down to a range of
1
/8 nm on the screen (height) if the data is available.
T o obtain Navionics Nav-Chart cards, contact your local dealer or v isit
www.navi oni cs.com
or www.navionics.it to find t he dealer nearest you.
Call Navionics toll-free from anywhere in North America on:
1-800-848-5896.
Outside of North America, contact your local dealer or:
Navionics S.p.A.
T el: (+39) 0584 9616 96
Fax: (+39) 0584 961309
Inserting a Nav-Chart Card
CAUTION:
T o prevent the ingress of water and consequent damage to the unit,
always ensure that the cartridge cover is fully and properly inserted,
whether or not a N av-Chart card is insert ed.
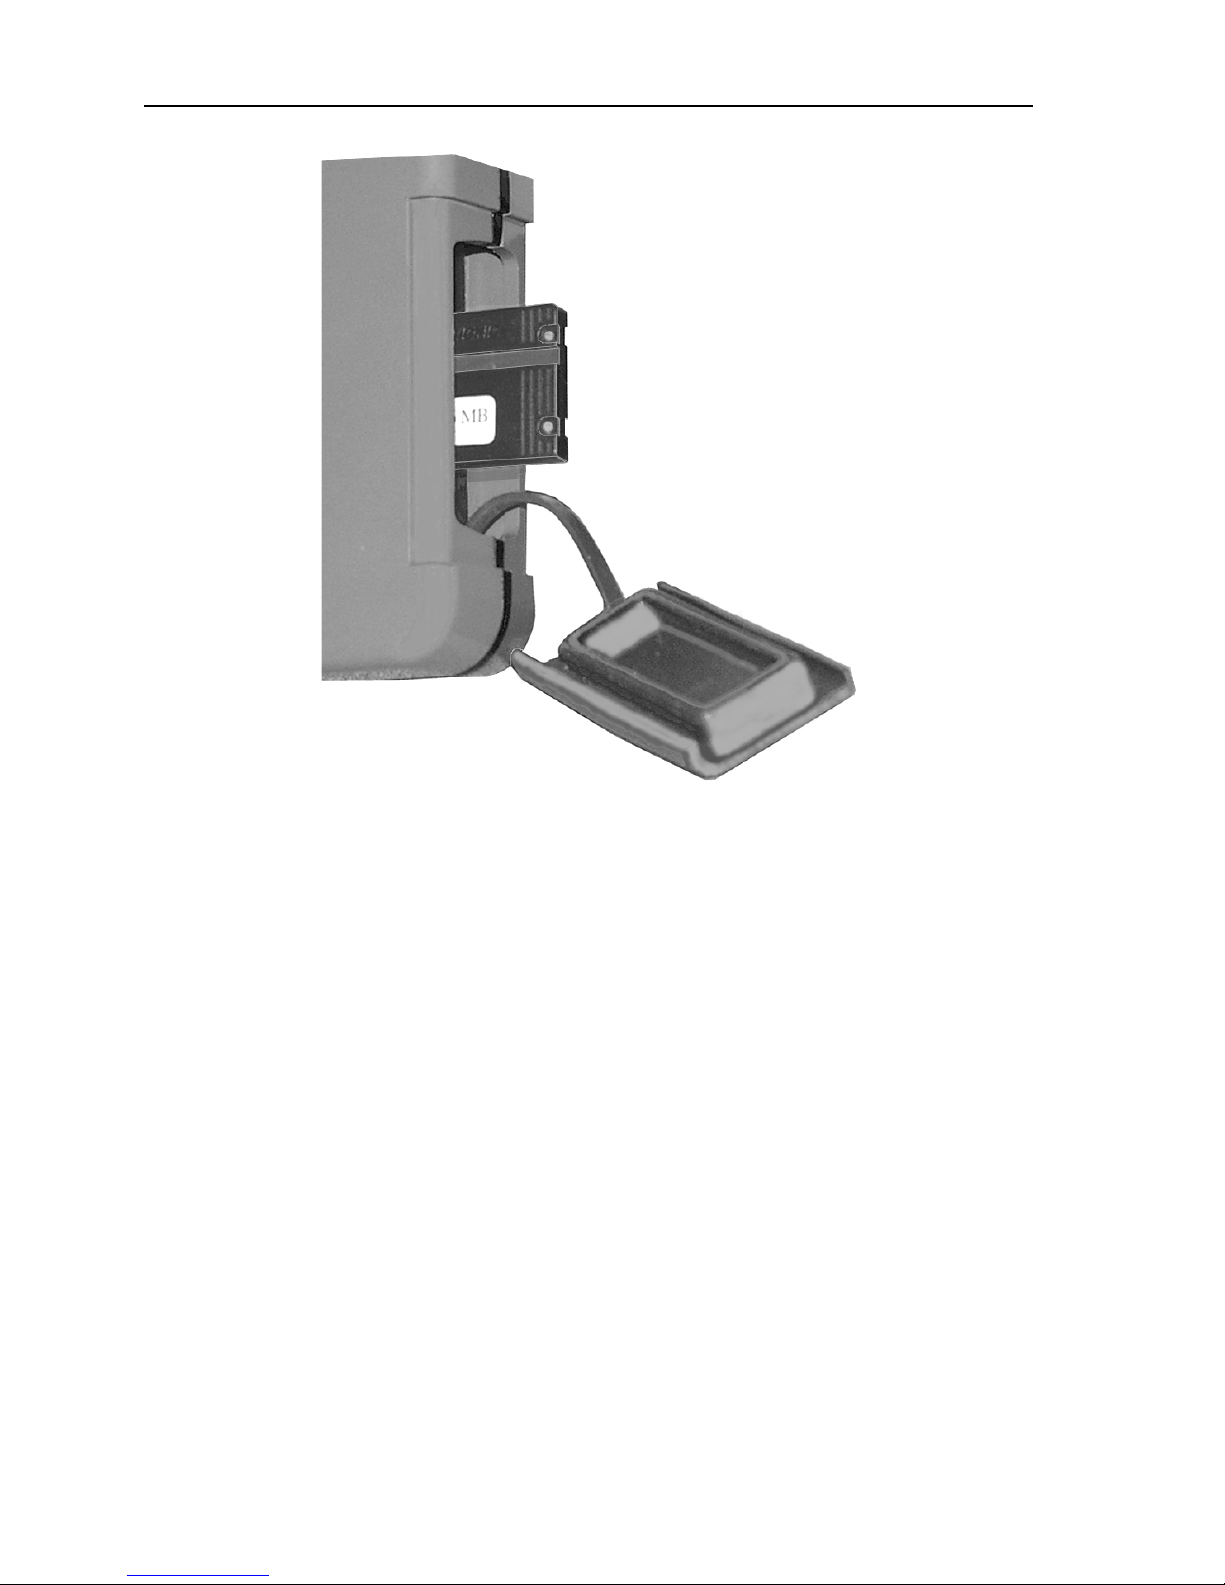
➤ To insert a Nav-Chart card, refer to Figure 2-7:
1. Check that you are using the correct Nav-Ch art card for the required
area.
2. Pull out the cartridge cover at the right hand s ide of the unit.
3. Hold the card with the t itle label and keyway slot towards you and the
two circular holes outermost, as shown belo w. Gentl y push the card
into its slot until it clicks into position. It will onl y fit in the correct orientation.
4. T o prevent the ingress of water , replace the cartridge cover.
2-10 Raychart 425 Chartplotter
Figure 2-7: Nav-Chart Card Insertion/Removal
Removing a Nav-Chart card
CAUTION:
DO NOT use a metallic instrument, eg. a screwdriver or pliers, to aid
removal, as doing so can cause irre parable damage.
➤ T o remove a Nav-Chart card, refer to Figur e 2-7:
1. Pull out the cartridge cover at the right hand si de of the unit.
2. Grip the card firmly and pull to remove it f rom its slot.
3. T o prevent the ingress of water, replace the cartridge cover .
Note: If difficulty is experienced in removing the card, a short length of
cord can be secured between the two circular holes in the card to ease its
removal, making sure that fitting o f the cartridge cover is not impeded.
Displaying the Chart Data
The new chart data will be displayed when you move the curso r into an
area covered by the new chart When a chart cartridge is inserted, the chart
is automatically redrawn.
The boundary of each chart digitized in the current card is defined by a
box or rectangle. (Y ou can swi tch off the chart boundaries display as part
of the chartplotter set up described in Chapter 4).
D4706_2

Chapter 3: Operation 3-1
Chapter 3: Operation
3.1 Introduction
This chapter explains how to use the chart functions to navigate wi th the
Raychart 425.
Safety
The Raychart 425 makes it very easy to mark a waypoint and travel
towards it. However, always check first that the route is safe. If using the
chartpl otter in c ombinat ion with an autopil ot connec ted via NM EA, the
autopilot will normally prompt for confirmation before it steers the vessel
towards the waypo int.
If a route has been entered using a less detailed chart, zo om in for more
detail to check for hazards, such as small shoals, that may not be show n
on the less detailed charts.
Note: Until you are familiar with interpreting the chart display, you
should take every opportunity to compare the displayed objects with visual targets, such as buoys and coas tal structures. You should practice
harbour and coastal navigat ion during daylight and in clear weather
conditions. The equipment sh ould not be used as a substitute for good
navigational practice.
3.2 Working with Waypoints
Introduction
The Raychart 425 enables up to 500 waypoints to be placed. A waypoint
is a position entered on a chart as a reference or destination point. All
waypoints placed on the chartplotter are stored in a waypoint database list
which includes symbol, position, bearing, rang e, date and time.
All waypoints in the database are displayed on screen, unl ess the
SHOW
WAYPOINTS
is set to OFF in the Chart Set Up menu, as described in
Chapter 4. A waypoint can be selected, either on-screen or from the list,
for editing.
The waypoint is usually placed at the cursor posi tion and can be part of a
route; A waypoint can also be placed at the vessel’s current position.
W aypoints can be placed before the chartplotter is installe d on your
vessel.
When a new waypoint is placed, it is displayed using either the default
symbol of a cross or an alternative symbol available from the Chart Set
3-2 Raychart 425 Chartplotter
Up menu, as described in Chapter 4. The waypoint is added to the
waypoint list and named with the next available number . The edit
functions can be used to change the symbol and name. When the cursor is
positioned over a waypoint, the waypoint bearin g and range are
displayed.
W aypoints can also be transferred between the chartplotter, other NMEA
connected instruments or a PC, usi ng the W aypoint T ransfer functions.
This section explains how to perform the fol lowing tasks using the
on-screen cursor and the waypoint list:
• Placing a W aypoint
• Selecting a W aypoint
• Displaying W aypoi nt data
• Editing a W aypoint (symbo l, name & position)
• Erasing a W aypoint
• Moving a W aypoint
Placing a Waypoint
Note: It is not possible to place multiple waypoints at the same position.
➤ T o place a new waypoint:
1. From chart mode, press
ENTER; the primary function bar is displayed
(Figure 3-1):
Figure 3-1: Primary Function Bar
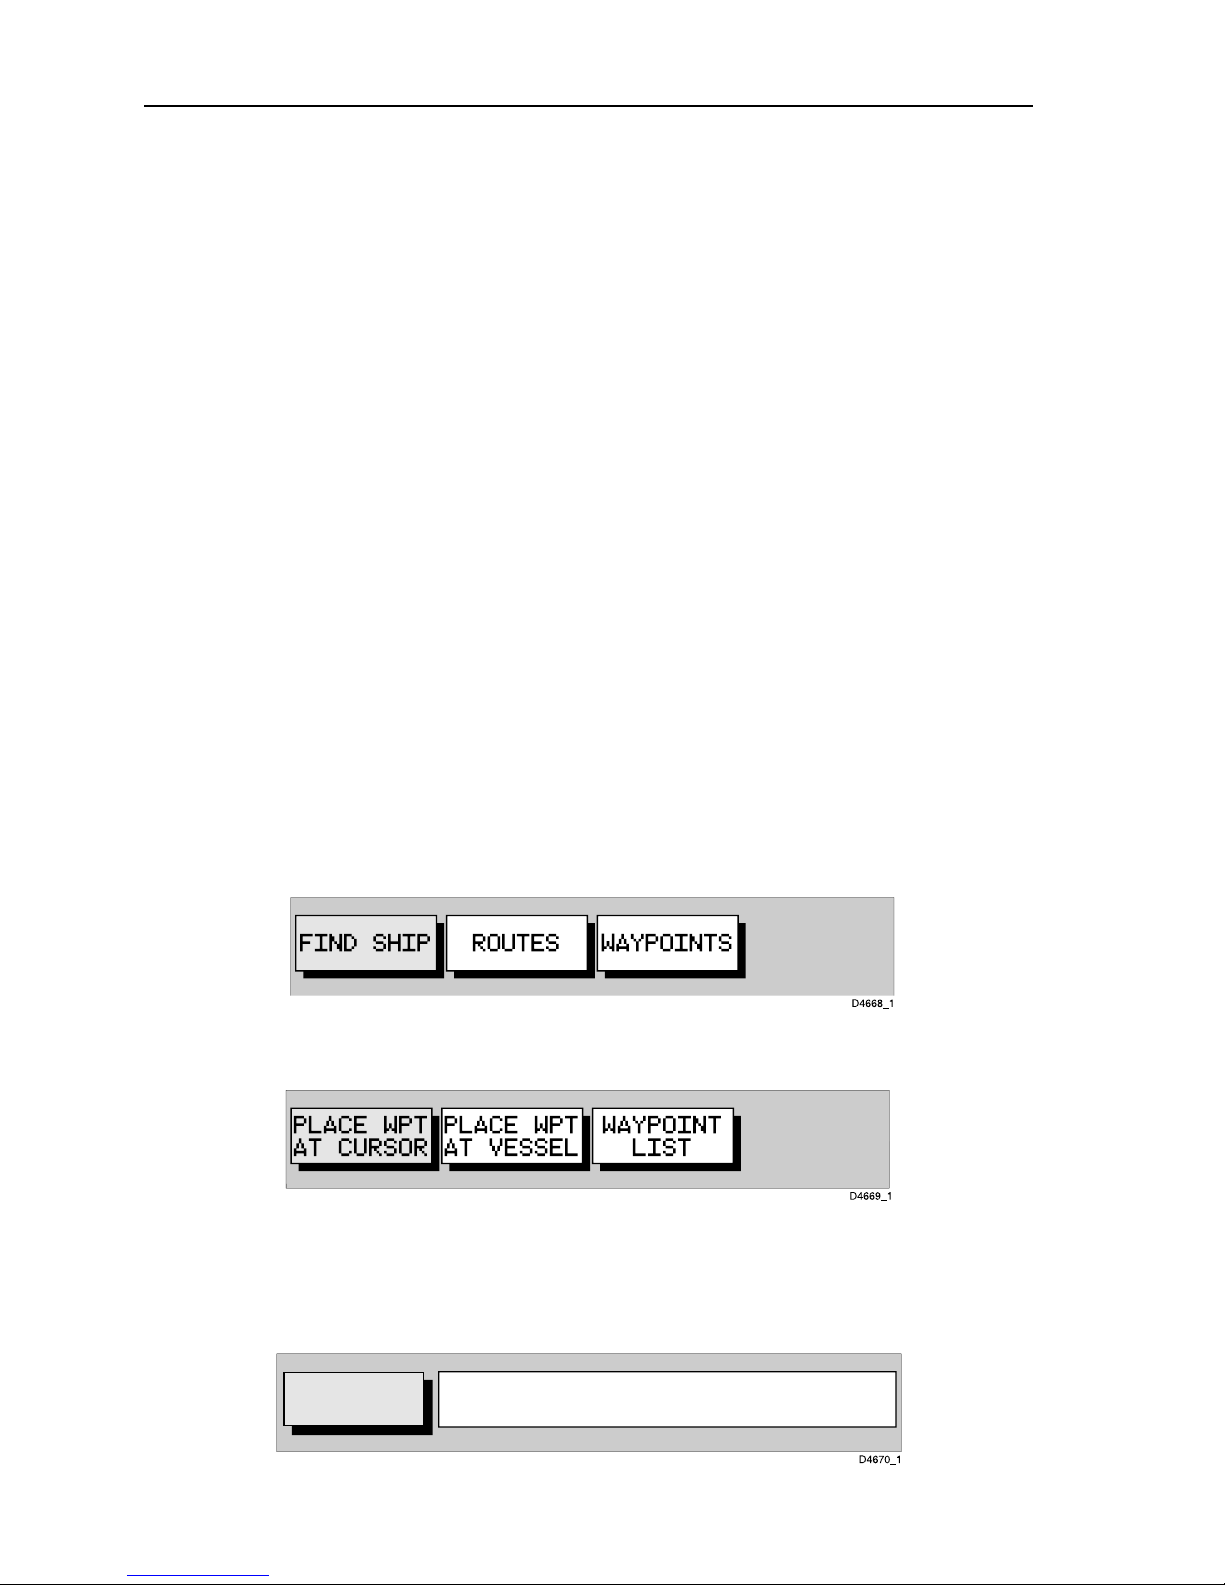
2. Using trackpad left/right, select WAYPOINTS (Figure 3-2).
Figure 3-2: Waypoints Soft Keys
3. T o place a waypoint at the cursor position:
i. Select
PLACE WPT AT CURSOR. The s elected function now has help
text appended to it (Figure 3-3):
Figure 3-3: Place Waypoint Function
PLACE
WAYPOINT
MOVE CURSOR, "ENTER"TO PLACE
WAYPOINT, "CLEAR" TO QUIT
Chapter 3: Operation 3-3
ii. Place the cursor in the required position on the chart and press
ENTER to place the waypoint. The waypoint is added to the way-
point list and named using the next available number .
The waypoint functions remain displayed s o that further waypoints can be placed.
If required, use
EDIT WAYPOINT to name the waypoint as described
in Edi ting W aypoint Details on page 3 -5.
iii.When finished placing waypoints, pr ess
CLEAR.
4. T o place a waypoint at the vessel’s position:
Select
PLACE WPT AT VESSEL. A new waypoint is placed at the ves-
sel’s current position.
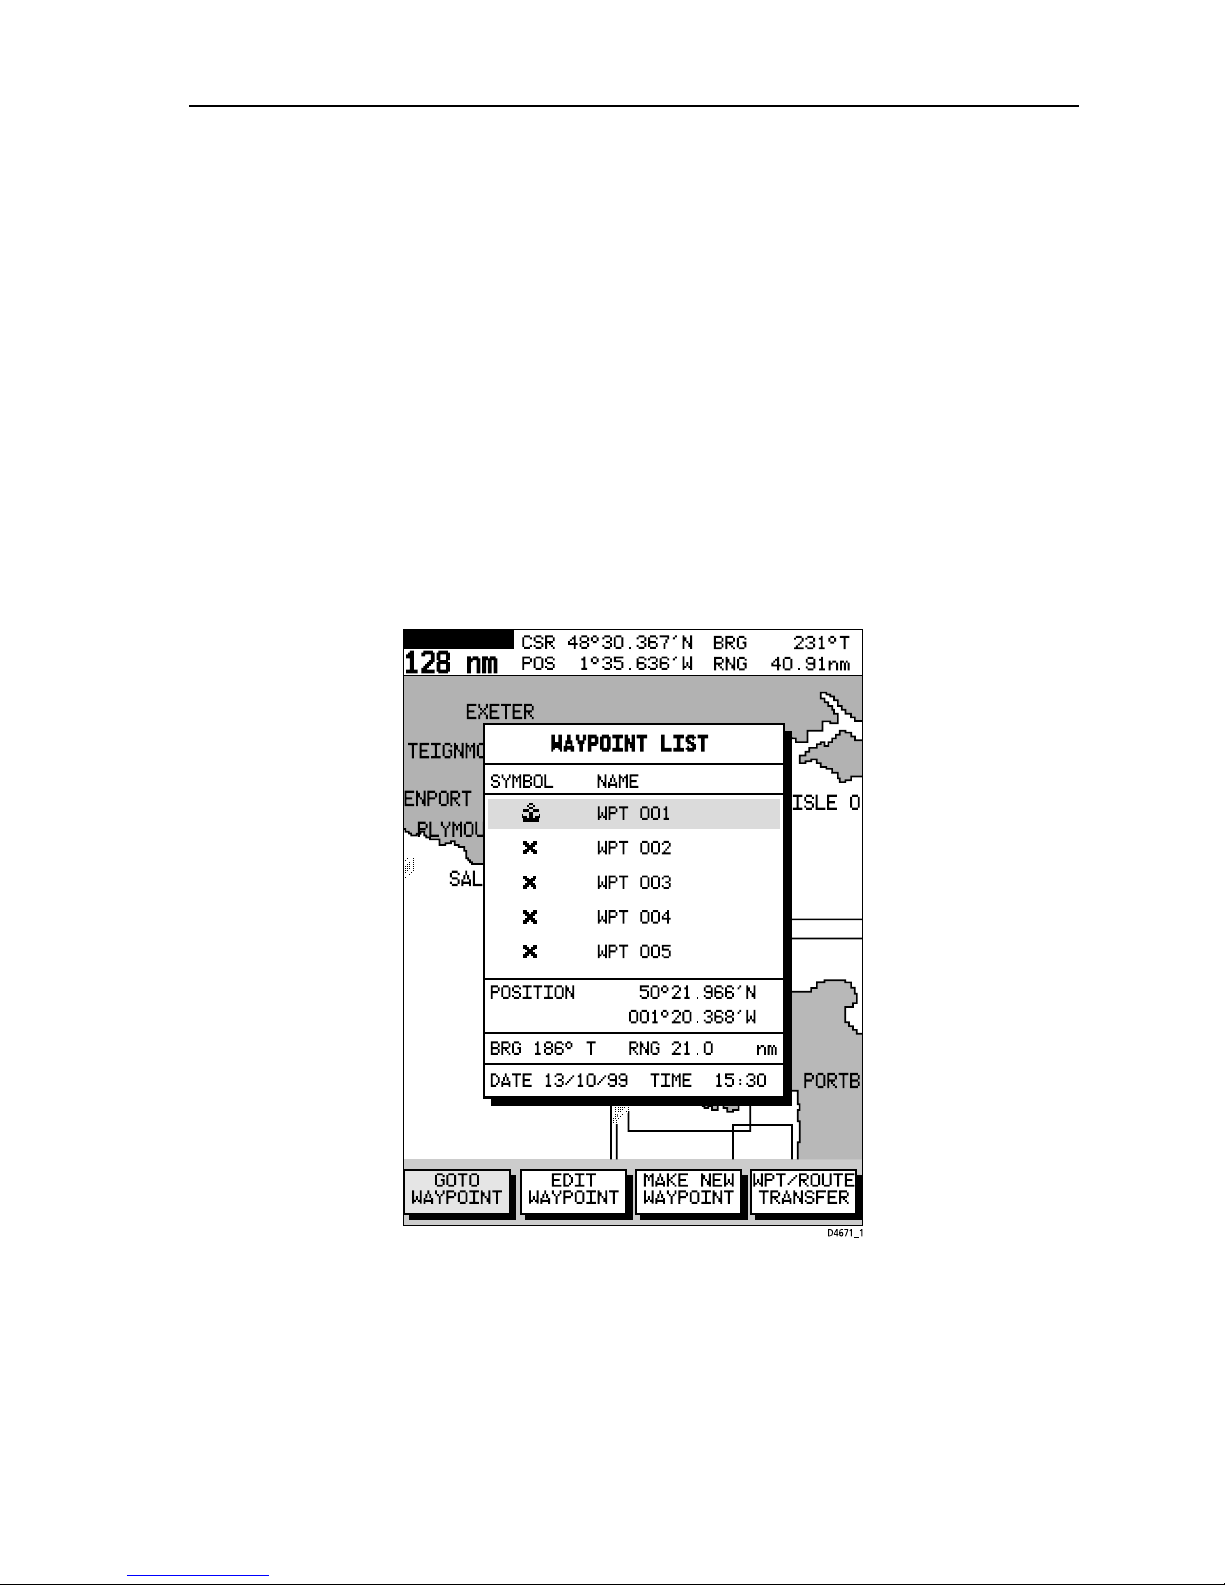
5. T o place a waypoint using the W aypoint List:
Select
WAYPOINT LIST. The Waypoint List and associated function
Soft Keys are displayed (Figure 3-4):
Figure 3-4: Waypoint List Display
6. Select MAKE NEW WAYPOINT.
The waypoint is placed at the current vessel position or, if a GPS fix is
not available, the cursor position. The new waypoint is added to the
W aypoint List and named with th e next available number.
T o return to chart mode, press
CLEAR twice.
SIM OV NU
3-4 Raychart 425 Chartplotter
Selecting a Waypoint
Positioning the cursor over a waypoint selects that waypoint and accesses
the
WAYPOINT OPTIONS function bar . This enables you to GOTO
(described in Section 3.4), edit (symbol, name, position), erase or move
the waypoint.
Selecting a waypoint from the W aypoint List allows you to
GOTO and edit
(symbol, name, position, erase) the waypoint. The Waypoint List also
provides options to make a n ew waypoint and transfer waypoints.
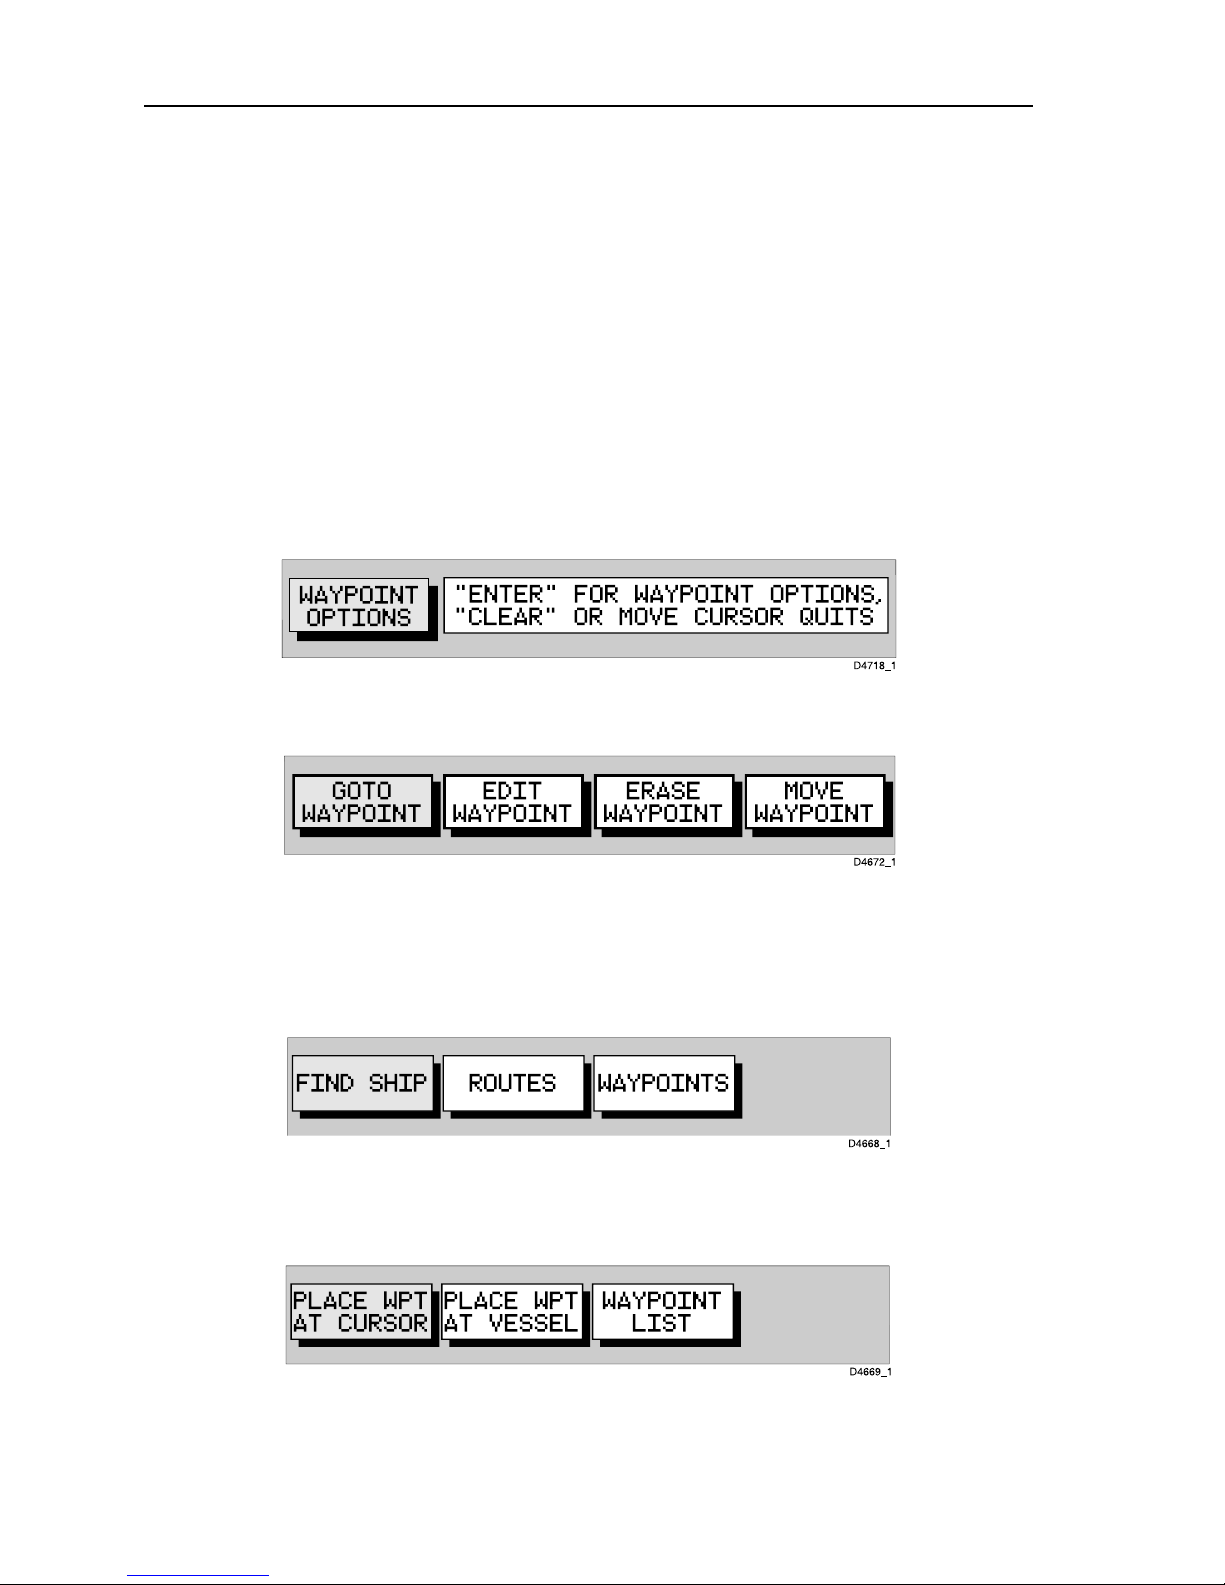
➤ T o select a waypoint using the cursor:
1. Move the cursor over the waypoint; the
WAYPOINT OPTIONS function
bar, together with help text, is displayed (Figure 3-5):
Figure 3-5: Waypoint Options
2. Press ENTER to select the waypoint function bar (Figure 3-6):
Figure 3-6: Waypoint Function Bar
The selected waypoint can be edited via these functions.
➤ T o select a waypoint using the W ayp oint List:
1. Press
ENTER to display the primary functi on bar (Figure 3-7):
Figure 3-7: Primary Function Bar
2. Select WAYPOINTS and press ENTER to display the waypoint function
bar (Figure 3-8):
Figure 3-8: Waypoint Function Bar
3. Select WAYPOINT LIST and press ENTER to display the W aypoint List.
The W aypoint List and associated functi on bar are displayed (see
Figure 3-4).
 Loading...