

查询LMX2314供应商
March 1995
LMX2314/LMX2315 PLLatinum 1.2 GHz Frequency
Synthesizer for RF Personal Communications
LMX2314/LMX2315 PLLatinum
TM
1.2 GHz Frequency Synthesizer
for RF Personal Communications
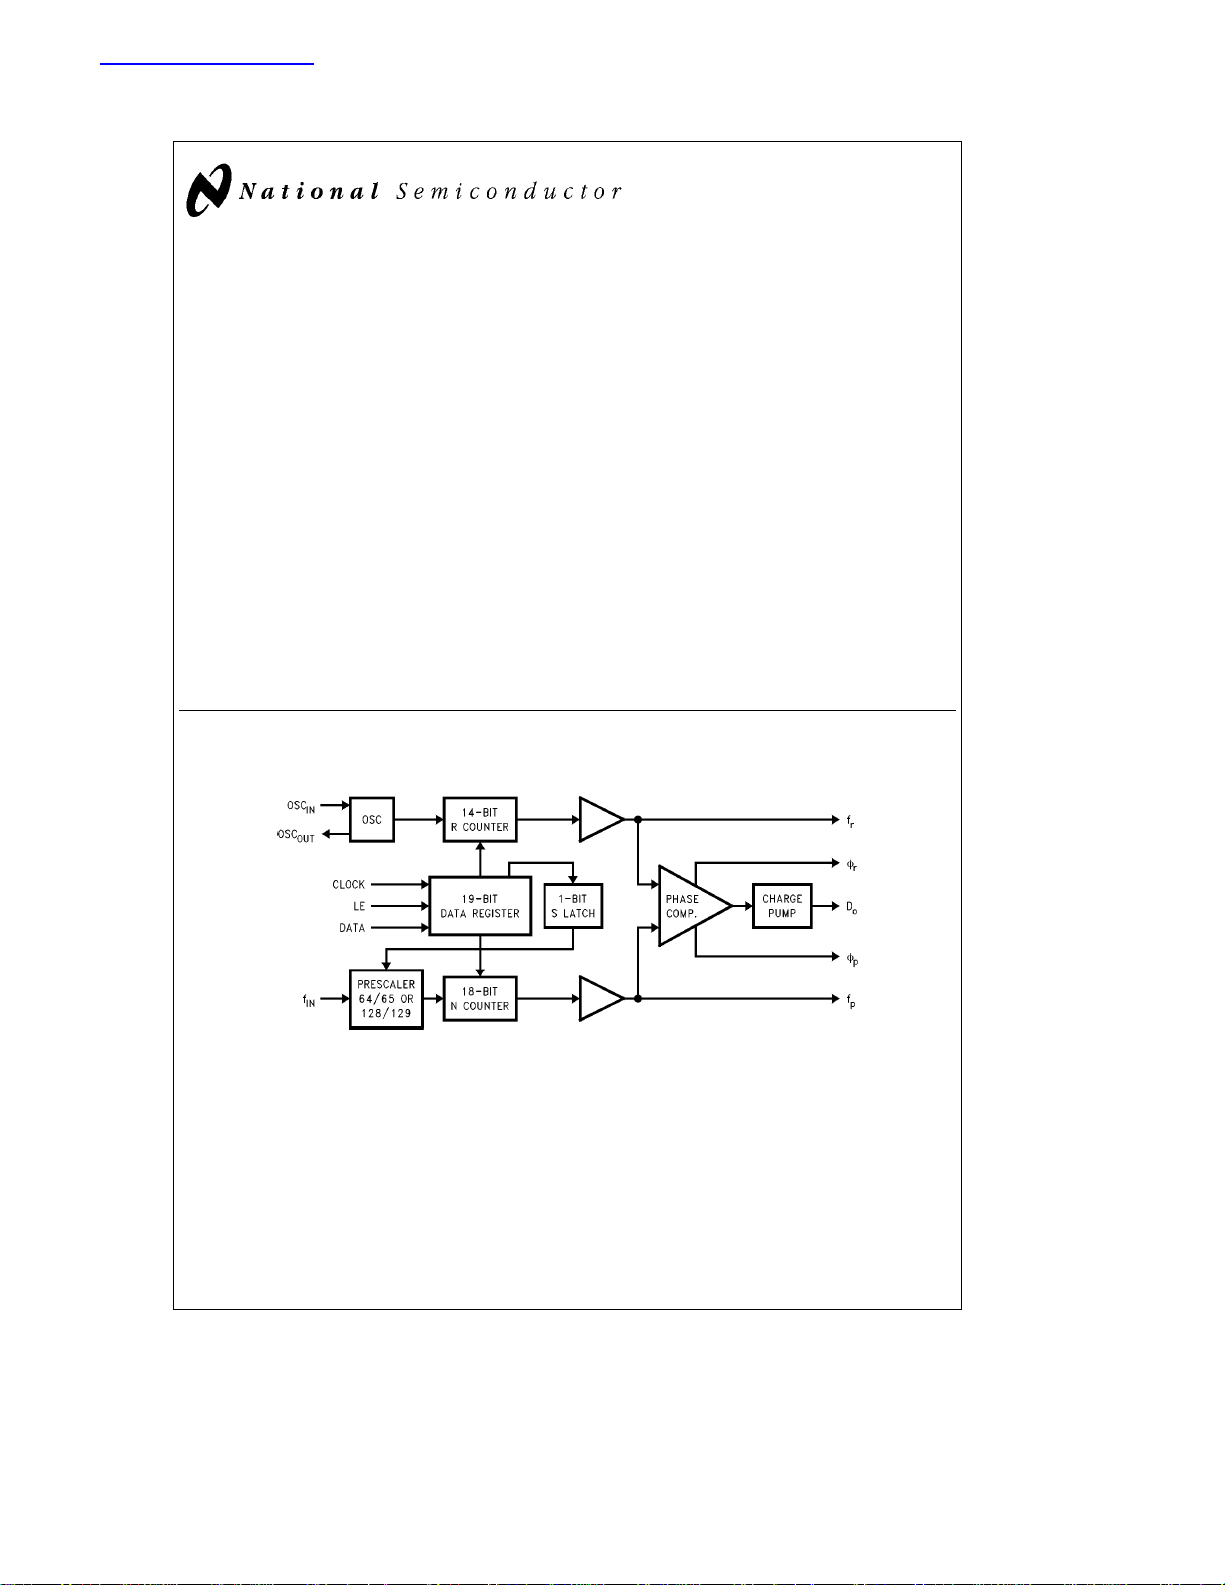
General Description
The LMX2314 and the LMX2315 are high performance frequency synthesizers with integrated prescalers designed for
RF operation up to 1.2 GHz. They are fabricated using National’s ABiC IV BiCMOS process.
The LMX2314 and the LMX2315 contain dual modulus prescalers which can select either a 64/65 or a 128/129 divide
ratio at input frequencies of up to 1.2 GHz. Using a proprietary digital phase locked loop technique, the LMX2314/15’s
linear phase detector characteristics can generate very stable, low noise local oscillator signals.
Serial data is transferred into the LMX2314 and the
LMX2315 via a three line MICROWIRE
TM
interface (Data,
Enable, Clock). Supply voltage can range from 2.7V to 5.5V.
The LMX2314 and the LMX2315 feature very low current
consumption, typically 6 mA at 3V.
The LMX2314 is available in a JEDEC 16-pin surface mount
plastic package. The LMX2315 is available in a TSSOP
20-pin surface mount plastic package.
Block Diagram
Features
Y
RF operation up to 1.2 GHz
Y
2.7V to 5.5V operation
Y
Low current consumption:
I
CC
Y
Dual modulus prescaler: 64/65 or 128/129
Y
Internal balanced, low leakage charge pump
Y
Power down feature for sleep mode:
I
CC
Y
Small-outline, plastic, surface mount JEDEC, 0.150
wide, (2314) or TSSOP, 0.173×wide, (2315) package
Applications
Y
Cellular telephone systems
(GSM, IS-54, IS-95, RCR-27)
Y
Portable wireless communications
(DECT, ISM902-928 CT-2)
Y
Other wireless communication systems
e
6 mA (typ) at V
e
30 mA (typ) at V
CC
CC
e
3V
e
3V
×
TL/W/11766– 1
TRI-STATEÉis a registered trademark of National Semiconductor Corporation.
TM
MICROWIRE
C
1995 National Semiconductor Corporation RRD-B30M115/Printed in U. S. A.
and PLLatinumTMare trademarks of National Semiconductor Corporation.
TL/W/11766
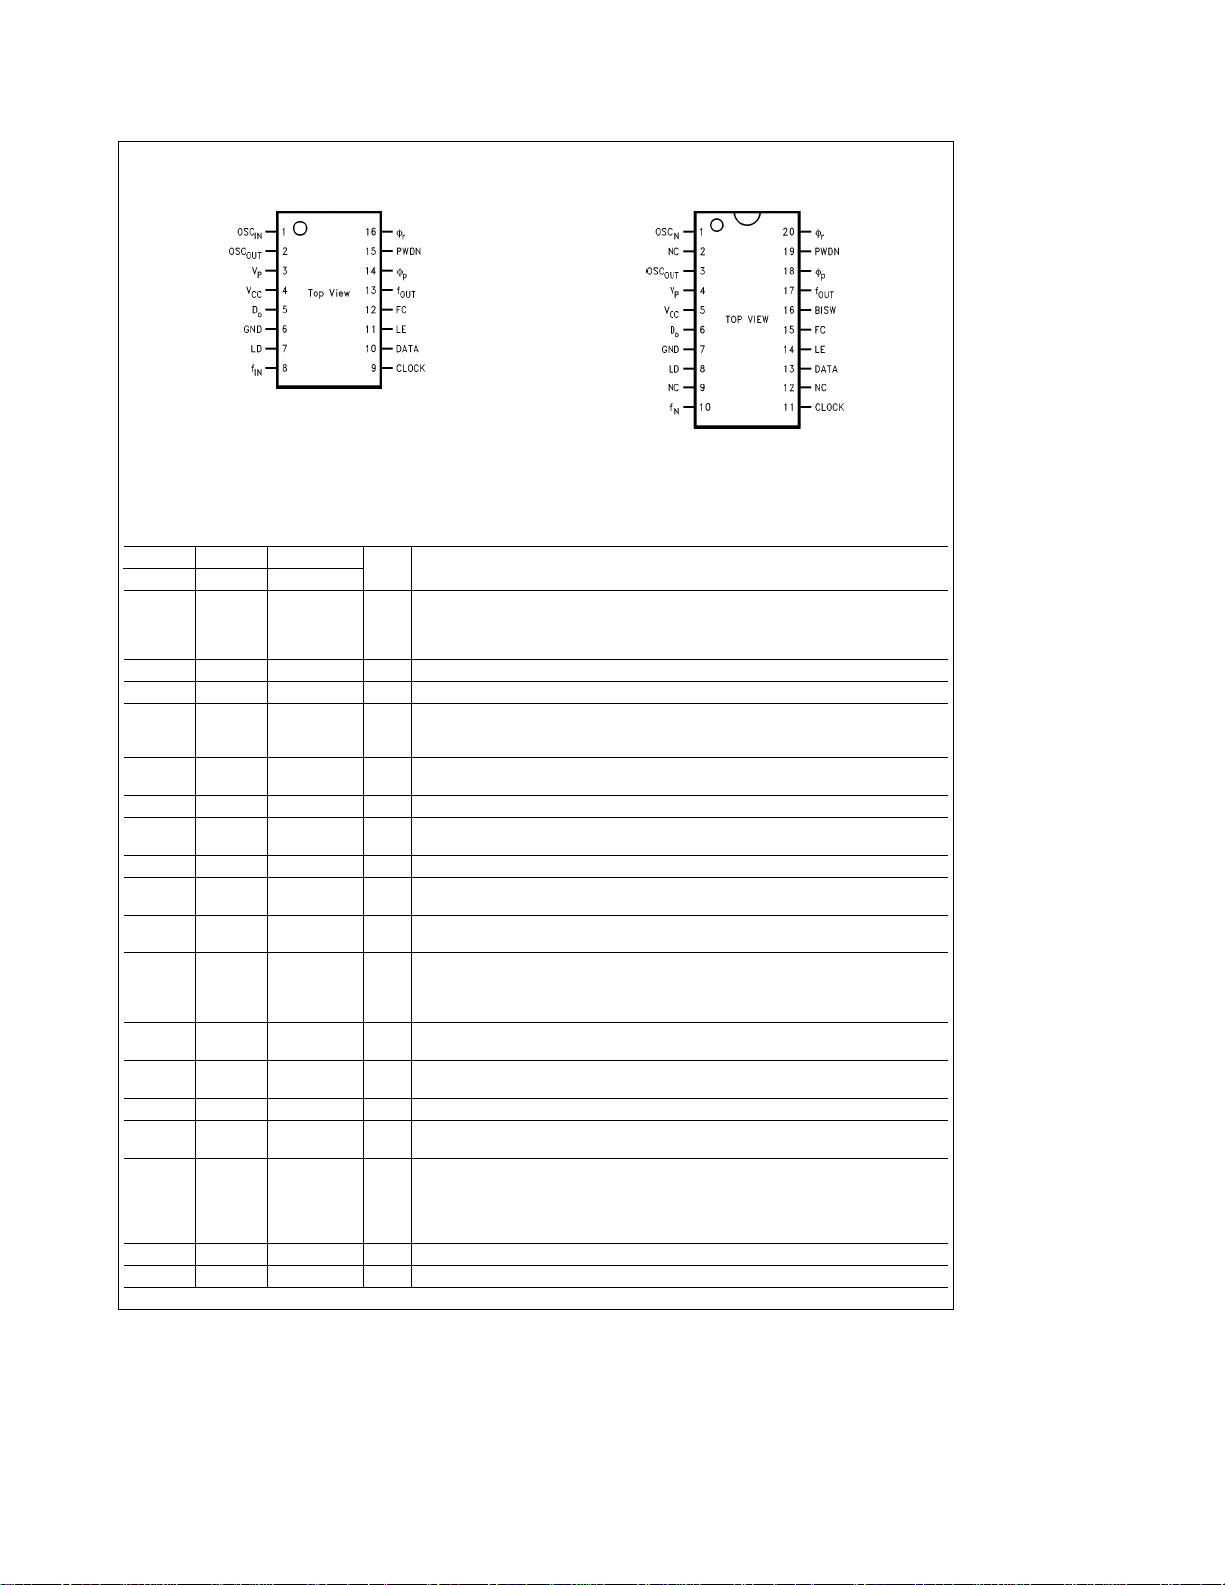
Connection Diagrams
LMX2314
LMX2315
JEDEC 16-Lead (0.150×Wide) Small
TL/W/11766– 2
Outline Molded Package (M)
Order Number LMX2314M or LMX2314MX
See NS Package Number M16A
20-Lead (0.173×Wide) Thin Shrink
Small Outline Package (TM)
TL/W/11766– 3
Order Number LMX2315TM or LMX2315TMX
See NS Package Number MTC20
Pin Descriptions
Pin No. Pin No. Pin Name
2314 2315 2314/2315
1 1 OSC
2 3 OSC
34V
45V
56D
IN
OUT
P
CC
o
6 7 GND Ground.
7 8 LD O Lock detect. Output provided to indicate when the VCO frequency is in ‘‘lock’’.
810f
IN
9 11 CLOCK I High impedance CMOS Clock input. Data is clocked in on the rising edge, into the
10 13 DATA I Binary serial data input. Data entered MSB first. LSB is control bit. High impedance
11 14 LE I Load enable input (with internal pull-up resistor). When LE transitions HIGH, data
12 15 FC I Phase control select (with internal pull-up resistor). When FC is LOW, the polarity of
X 16 BISW O Analog switch output. When LE is HIGH, the analog switch is ON, routing the
13 17 f
14 18 w
OUT
p
15 19 PWDN I Power Down (with internal pull-up resistor).
16 20 w
r
X 2,9,12 NC No connect.
I/O Description
I Oscillator input. A CMOS inverting gate input intended for connection to a crystal
resonator for operation as an oscillator. The input has a V
can be driven from an external CMOS or TTL logic gate. May also be used as a
buffer for an externally provided reference oscillator.
/2 input threshold and
CC
O Oscillator output.
Power supply for charge pump. Must betVCC.
Power supply voltage input. Input may range from 2.7V to 5.5V. Bypass capacitors
should be placed as close as possible to this pin and be connected directly to the
ground plane.
O Internal charge pump output. For connection to a loop filter for driving the input of
an external VCO.
When the loop is locked, the pin’s output is HIGH with narrow low pulses.
I Prescaler input. Small signal input from the VCO.
various counters and registers.
CMOS input.
stored in the shift registers is loaded into the appropriate latch (control bit
dependent). Clock must be low when LE toggles high or low. See Serial Data Input
Timing Diagram.
the phase comparator and charge pump combination is reversed.
internal charge pump output through BISW (as well as through D
).
o
O Monitor pin of phase comparator input. CMOS output.
O Output for external charge pump. wpis an open drain N-channel transistor and
requires a pull-up resistor.
e
PWDN
PWDN
Power down function is gated by the return of the charge pump to a TRI-STATE
condition.
HIGH for normal operation.
e
LOW for power saving.
O Output for external charge pump. wris a CMOS logic output.
2
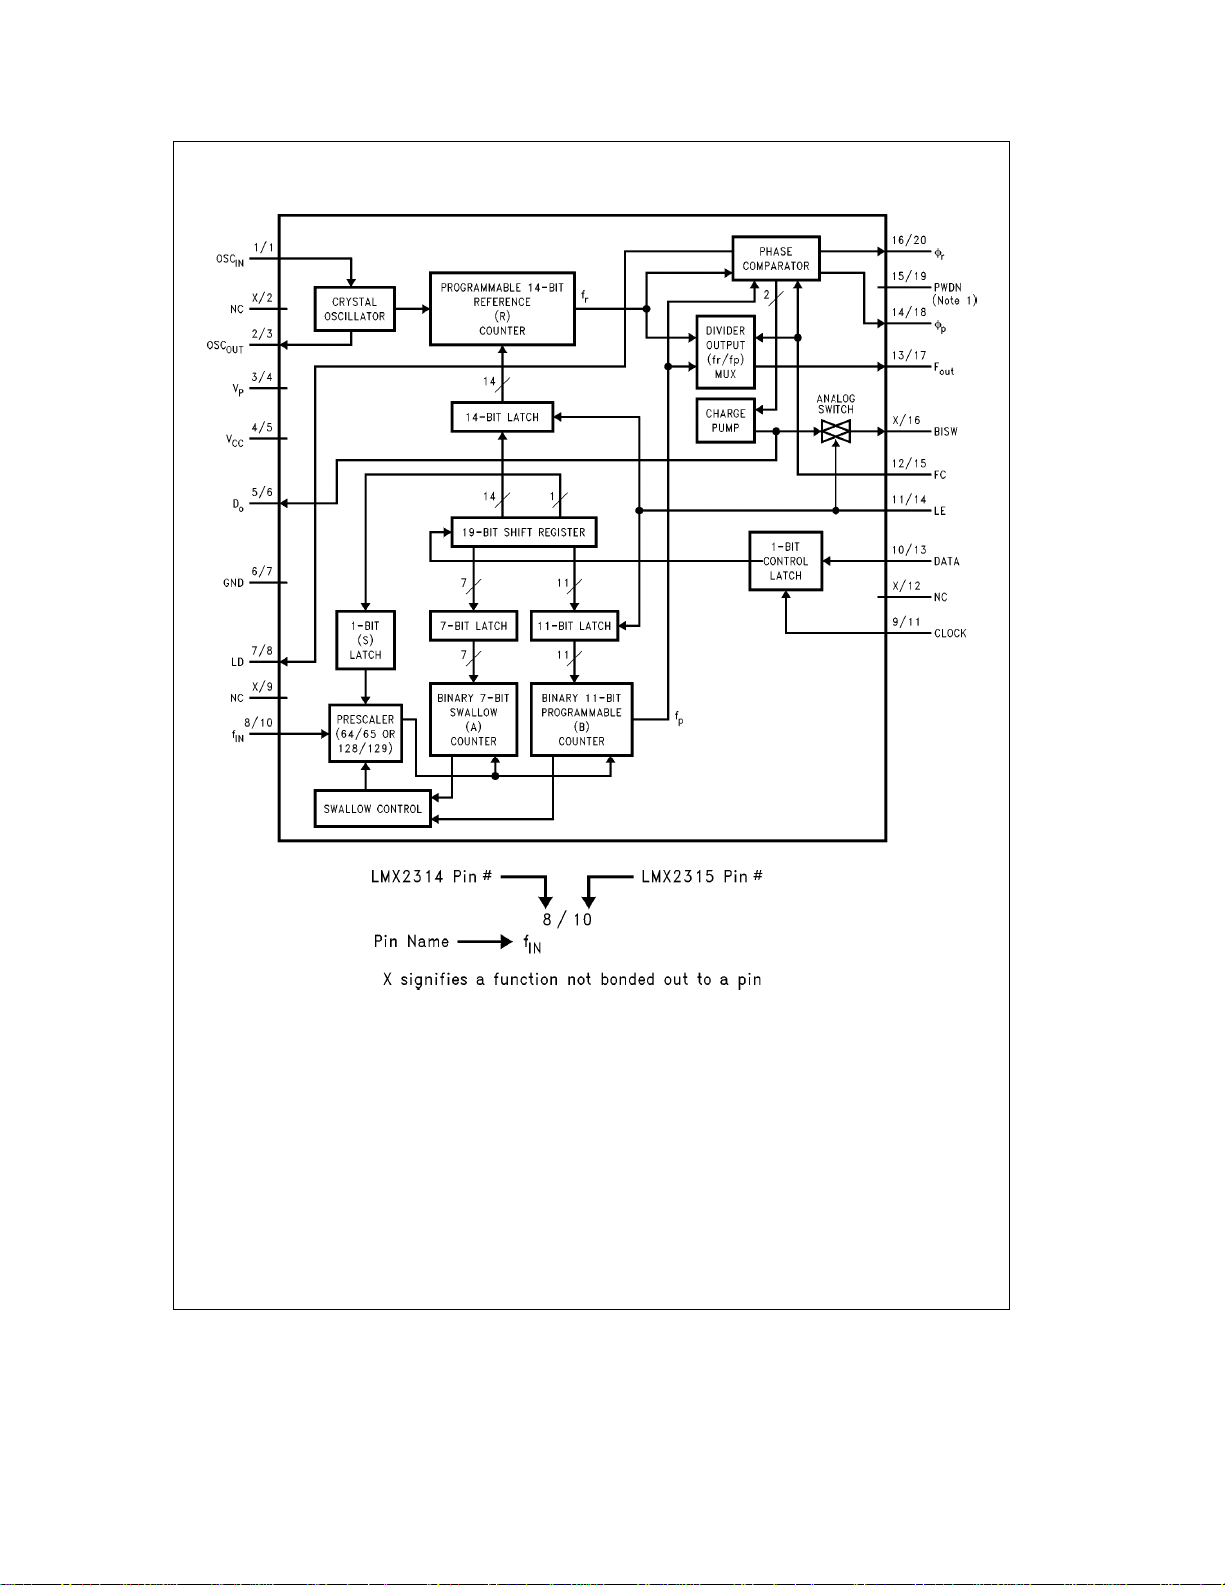
Functional Block Diagram
Note 1: The power down function is gated by the charge pump to prevent any unwanted frequency jumps. Once the power down pin is brought low the part will go
into power down mode when the charge pump reaches a TRI-STATE condition.
TL/W/11766– 4
3
Absolute Maximum Ratings (Note 1)
If Military/Aerospace specified devices are required,
please contact the National Semiconductor Sales
Office/Distributors for availability and specifications.
Power Supply Voltage
V
CC
V
P
Voltage on Any Pin
with GND
e
0V (VI)
Storage Temperature Range (TS)
Lead Temperature (TL) (solder, 4 sec.)
b
0.3V toa6.5V
b
0.3V toa6.5V
b
0.3V toa6.5V
b
65§Ctoa150§C
a
260§C
Recommended Operating
Conditions
Power Supply Voltage
V
CC
V
P
Operating Temperature (TA)
Note 1: Absolute Maximum Ratings indicate limits beyond which damage to
the device may occur. Operating Ratings indicate conditions for which the
device is intended to be functional, but do not guarantee specific performance limits. For guaranteed specifications and test conditions, see the Electrical Characteristics. The guaranteed specifications apply only for the test
conditions listed.
2.7V to 5.5V
VCCtoa5.5V
b
40§Ctoa85§C
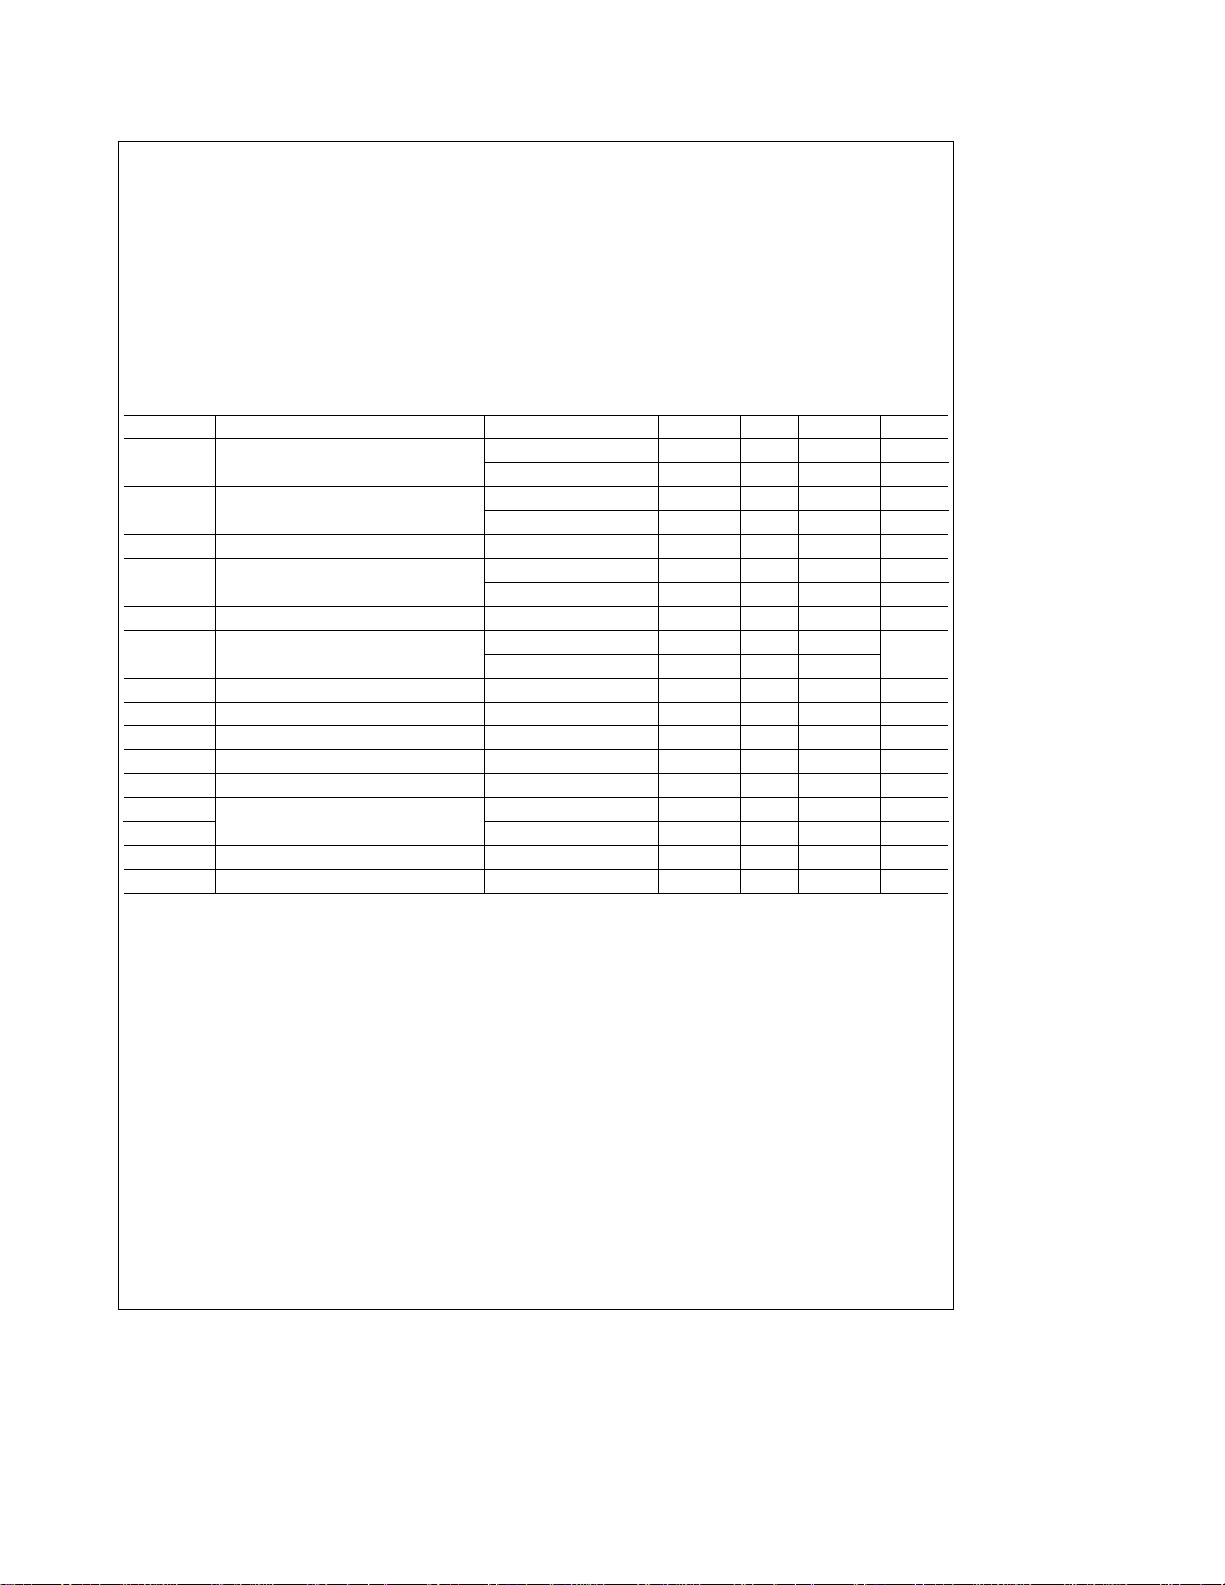
Electrical Characteristics V
CC
e
5.0V, V
e
5.0V;b40§CkT
P
k
85§C, except as specified
A
Symbol Parameter Conditions Min Typ Max Units
I
CC
I
CC-PWDN
f
IN
f
OSC
Power Supply Current V
Power Down Current V
Maximum Operating Frequency 1.2 GHz
Maximum Oscillator Frequency 20 MHz
e
3.0V 6.0 8.0 mA
CC
e
V
5.0V 6.5 8.5 mA
CC
e
3.0V 30 180 mA
CC
e
V
5.0V 60 350 mA
CC
No Load on OSC Out 40 MHz
f
w
Pf
IN
V
OSC
V
IH
V
IL
I
IH
I
IL
I
IH
I
IL
I
IH
I
IL
*Except fINand OSC
Maximum Phase Detector Frequency 10 MHz
Input Sensitivity V
Oscillator Sensitivity OSC
CC
V
CC
e
2.7V to 3.3V
e
3.3V to 5.5V
IN
High-Level Input Voltage * 0.7 V
Low-Level Input Voltage * 0.3 V
e
High-Level Input Current (Clock, Data) V
Low-Level Input Current (Clock, Data) V
Oscillator Input Current V
High-Level Input Current (LE, FC) V
Low-Level Input Current (LE, FC) V
IN
IH
IL
IH
V
IL
IH
IL
e
V
5.5V
CC
e
e
e
e
e
e
0V, V
V
0V, V
V
0V, V
5.5V
CC
e
5.5V 100 mA
CC
e
5.5V
CC
e
5.5V
CC
e
5.5V
CC
b
15
b
10
a
6
a
6
0.5 V
CC
b
1.0 1.0 mA
b
1.0 1.0 mA
b
100 mA
b
1.0 1.0 mA
b
100 1.0 mA
CC
dBm
PP
V
V
4
Electrical Characteristics V
CC
e
5.0V, V
e
5.0V;b40§CkT
P
k
85§C, except as specified (Continued)
A
Symbol Parameter Conditions Min Typ Max Units
I
Do-source
I
Do-sink
I
Do-Tri
I
vs V
D
o
Charge Pump Output Current V
Charge Pump TRI-STATEÉCurrent 0.5VsV
Charge Pump Output Current 0.5VsV
D
o
Magnitude Variation vs Voltage Te25§C15%
e
VP/2
D
o
e
V
VP/2 5.0 mA
D
o
s
b
V
D
o
e
T
85§C
D
o
0.5V
P
s
b
V
0.5V
P
b
2.5 2.5 nA
b
5.0 mA
(Note 1)
I
vs Charge Pump Output Current V
Do-sink
I
Do-source
I
vs T Charge Pump Output Current
D
o
Sink vs Source Mismatch Te25§C10%
(Note 2)
Magnitude Variation vs Temperature V
(Note 3)
V
OH
V
OL
V
OH
V
OL
I
OL
I
OH
R
ON
t
CS
t
CH
t
CWH
t
CWL
t
ES
t
EW
**Except OSC
Notes 1, 2, 3: See related equations in Charge Pump Current Specification Definitions
High-Level Output Voltage I
Low-Level Output Voltage I
High-Level Output Voltage (OSC
Low-Level Output Voltage (OSC
)I
OUT
)I
OUT
Open Drain Output Current (wp)V
Open Drain Output Current (wp)V
Analog Switch ON Resistance (2315) 100 X
Data to Clock Set Up Time See Data Input Timing 50 ns
Data to Clock Hold Time See Data Input Timing 10 ns
Clock Pulse Width High See Data Input Timing 50 ns
Clock Pulse Width Low See Data Input Timing 50 ns
Clock to Enable Set Up Time See Data Input Timing 50 ns
Enable Pulse Width See Data Input Timing 50 ns
OUT
e
VP/2
D
o
b
40§CkTk85§C
e
VP/2 10 %
D
o
eb
1.0 mA** V
OH
e
1.0 mA** 0.4 V
OL
eb
200 mAV
OH
e
200 mA 0.4 V
OL
e
5.0V, V
CC
e
5.5V 100 mA
OH
e
0.4V 1.0 mA
OL
b
0.8 V
CC
b
0.8 V
CC
5
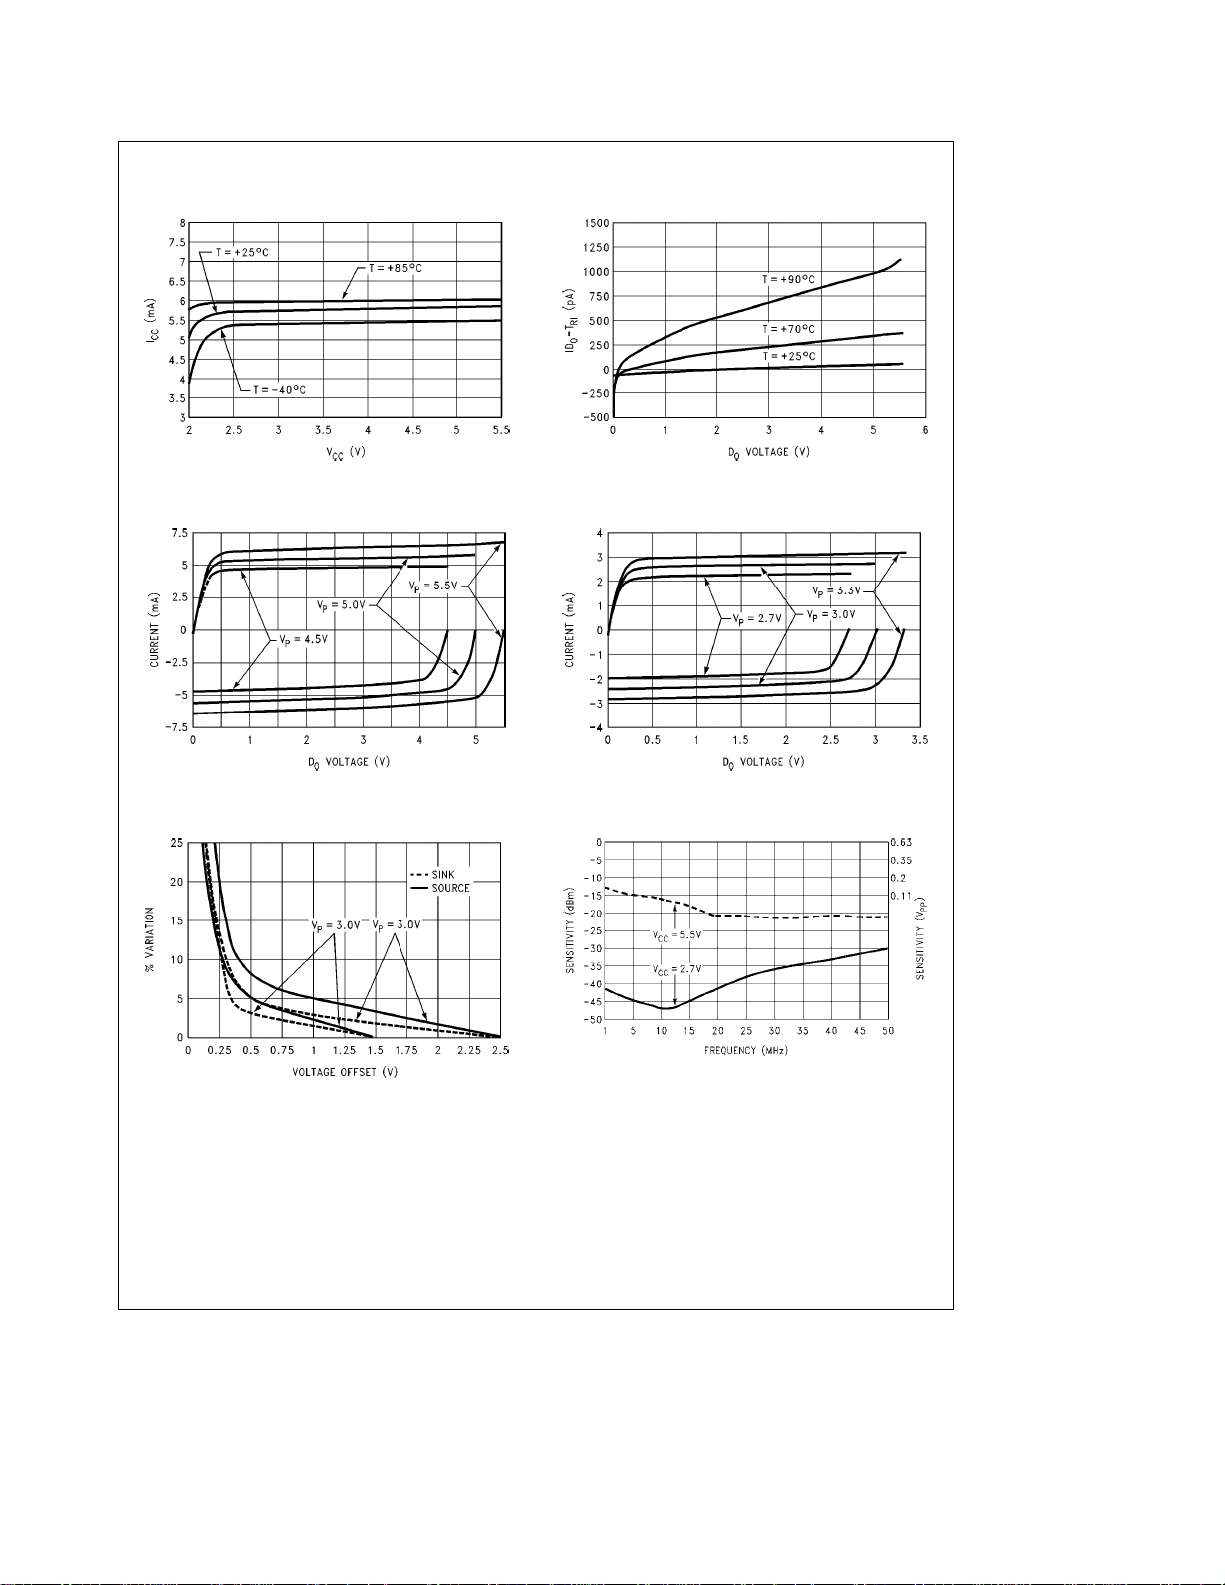
Typical Performance Characteristics
ICCvs V
CC
I
TRI-STATE vs DoVoltage
D
o
Charge Pump Current vs DoVoltage
Charge Pump Current Variation
TL/W/11766– 29
TL/W/11766– 31
TL/W/11766– 30
Charge Pump Current vs DoVoltage
TL/W/11766– 32
Oscillator Input Sensitivity
TL/W/11766– 33
TL/W/11766– 34
6

Typical Performance Characteristics (Continued)
Input Sensitivity vs Frequency
Input Sensitivity vs Frequency
Input Sensitivity at Temperature
Variation, V
LMX2314 Input Impedance vs Frequency
e
V
2.7V to 5.5V, f
CC
CC
e
5V
e
100 MHz to 1,600 MHz
IN
TL/W/11766– 35
TL/W/11766– 37
Input Sensitivity at Temperature
Variation, V
LMX2315 Input Impedance vs Frequency
e
V
2.7V to 5.5V, f
CC
CC
e
3V
e
100 MHz to 1,600 MHz
IN
TL/W/11766– 36
TL/W/11766– 38
Marker 1e500 MHz, Reale67, Imag.eb317
e
Marker 2
Marker 3
Marker 4
900 MHz, Reale24, Imag.eb150
e
1 GHz, Reale19, Imag.eb126
e
1,500 MHz, Reale9, Imag.eb63
TL/W/11766– 40
Marker 1e500 MHz, Reale69, Imag.eb330
e
Marker 2
Marker 3
Marker 4
900 MHz, Reale36, Imag.eb193
e
1 GHz, Reale35, Imag.eb172
e
1,500 MHz, Reale30, Imag.eb106
7
TL/W/11766– 39

Charge Pump Current Specification Definitions
e
I1eCP sink current at V
e
I2
CP sink current at V
e
I3
CP sink current at V
e
DV
Voltage offset from positive and negative rails. Dependent on VCO tuning range relative to VCCand ground. Typical values are between 0.5V and 1.0V.
e
vs V
1. I
2. I
3. I
4. Kw
D
o
[
(/2 *
D
o-sink
[
lI2lblI5l
D
o
[
I2@temp
l
(/2 *
Charge Pump Output Current magnitude variation vs Voltage
D
o
]/[
(/2 *
D
o-source
À
]/[
(/2 *
e
Charge Pump Output Current magnitude variation vs Temperature
I2@25§C
lbl
Phase detector/charge pump gain constant
Ó
vs T
e
À
lI1lblI3l
vs I
A
lI2lalI5l
b
V
D
D
D
e
lI2lalI5l
DV
P
o
e
VP/2
o
e
DV
o
À
Ó
]
lI1lalI3l
Charge Pump Output Current Sink vs Source Mismatch
* 100% and[(/2 *
Ó
]
* 100%
]
I2@25§Cl* 100% and
/
l
l
lI4lblI6l
[
I5@temp
l
e
]/[
lbl
e
(/2 *
I5@25§C
e
CP source current at V
I4
e
I5
CP source current at V
e
I6
CP source current at V
À
lI4lalI6l
e
e
]
/
l
l
Ó
]
* 100%
I5@25§Cl* 100%
e
b
V
D
D
D
DV
P
o
e
VP/2
o
e
DV
o
RF Sensitivity Test Block Diagram
TL/W/11766– 41
Note 1: Ne10,000 Re50 Pe64
Note 2: Sensitivity limit is reached when the error of the divided RF output, f
, is greater than or equal to 1 Hz.
OUT
8
TL/W/11766– 42

Functional Description
The simplified block diagram below shows the 19-bit data register, the 14-bit R Counter and the S Latch, and the 18-bit
N Counter (intermediate latches are not shown). The data stream is clocked (on the rising edge) into the DATA input, MSB first.
If the Control Bit (last bit input) is HIGH, the DATA is transferred into the R Counter (programmable reference divider) and the
S Latch (prescaler select: 64/65 or 128/129). If the Control Bit (LSB) is LOW, the DATA is transferred into the N Counter
(programmable divider).
TL/W/11766– 5
PROGRAMMABLE REFERENCE DIVIDER (R COUNTER) AND PRESCALER SELECT (S LATCH)
If the Control Bit (last bit shifted into the Data Register) is HIGH, data is transferred from the 19-bit shift register into a 14-bit
latch (which sets the 14-bit R Counter) and the 1-bit S Latch (S15, which sets the prescaler: 64/65 or 128/129). Serial data
format is shown below.
14-BIT PROGRAMMABLE REFERENCE DIVIDER RATIO
(R COUNTER)
Divide
Ratio
R
14S13S12S11S10
SS9S8S7S6S5S4S3S2S
3 00000000000011
4 00000000000100
# ##############
16383 1 1111111111111
Notes: Divide ratios less than 3 are prohibited.
Divide ratio: 3 to 16383
S1 to S14: These bits select the divide ratio of the programmable
reference divider.
C: Control bit (set to HIGH level to load R counter and S Latch)
Data is shifted in MSB first.
9
1
TL/W/11766– 6
1-BIT PRESCALER SELECT
(S LATCH)
Prescaler
Select
P
S
15
128/129 0
64/65 1

Functional Description (Continued)
PROGRAMMABLE DIVIDER (N COUNTER)
The N counter consists of the 7-bit swallow counter (A counter) and the 11-bit programmable counter (B counter). If the Control
Bit (last bit shifted into the Data Register) is LOW, data is transferred from the 19-bit shift register into a 7-bit latch (which sets
the 7-bit Swallow (A) Counter) and an 11-bit latch (which sets the 11-bit programmable (B) Counter). Serial data format is shown
below.
Note: S8 to S18: Programmable counter divide ratio control bits (3 to 2047)
7-BIT SWALLOW COUNTER DIVIDE RATIO
(A COUNTER)
Divide
S7S6S5S4S3S2S
Ratio
A
1
0 0000000
1 0000001
# #######
127 1111111
Note: Divide ratio: 0 to 127
t
B
A
TL/W/11766– 7
11-BIT PROGRAMMABLE COUNTER DIVIDE RATIO
(B COUNTER)
Divide
Ratio
18S17S16S15S14S13S12S11S10
B
SS9S
3 00000000011
4 00000000100
# ###########
2047 1 1 1 1 1 1 1 1 1 1 1
Note: Divide ratio: 3 to 2047 (Divide ratios less than 3 are prohibited)
t
B
A
PULSE SWALLOW FUNCTION
e
c
[
(P
f
VCO
f
: Output frequency of external voltage controlled oscil-
VCO
lator (VCO)
B: Preset divide ratio of binary 11-bit programmable
counter (3 to 2047)
A: Preset divide ratio of binary 7-bit swallow counter
sAs
(0
f
: Output frequency of the external reference frequency
OSC
oscillator
R: Preset divide ratio of binary 14-bit programmable ref-
erence counter (3 to 16383)
P: Preset modulus of dual moduIus prescaler (64 or
128)
B)aA
127, AsB)
c
]
f
/R
OSC
8
10

Functional Description (Continued)
SERIAL DATA INPUT TIMING
Notes: Parenthesis data indicates programmable reference divider data.
Data shifted into register on clock rising edge.
Data is shifted in MSB first.
Test Conditions: The Serial Data Input Timing is tested using a symmetrical waveform around V
amplitudes of 2.2V
@
V
CC
e
2.7V and 2.6V@V
e
5.5V.
CC
Phase Characteristics
In normal operation, the FC pin is used to reverse the polarity of the phase detector. Both the internal and any external
charge pump are affected.
Depending upon VCO characteristics, FC pin should be set
accordingly:
When VCO characteristics are like (1), FC should be set
HIGH or OPEN CIRCUIT;
When VCO characteristics are like (2), FC should be set
LOW.
When FC is set HIGH or OPEN CIRCUIT, the monitor pin of
the phase comparator input, f
divider output, f
programmable divider output, f
. When FC is set LOW, f
r
PHASE COMPARATOR AND INTERNAL CHARGE PUMP CHARACTERISTICS
, is set to the reference
out
.
p
is set to the
out
TL/W/11766– 8
/2. The test waveform has an edge rate of 0.6 V/ns with
CC
VCO Characteristics
TL/W/11766– 9
Notes: Phase difference detection range:b2q toa2q
The minimum width pump up and pump down current pulses occur at the Dopin when the loop is locked.
e
FC
HIGH
11
TL/W/11766– 10

Analog Switch (2315 only)
The analog switch is useful for radio systems that utilize a frequency scanning mode and a narrow band mode. The purpose of
the analog switch is to decrease the loop filter time constant, allowing the VCO to adjust to its new frequency in a shorter
amount of time. This is achieved by adding another filter stage in parallel. The output of the charge pump is normally through the
D
pin, but when LE is set HIGH, the charge pump output also becomes available at BISW. A typical circuit is shown below. The
o
second filter stage (LPF-2) is effective only when the switch is closed (in the scanning mode).
TL/W/11766– 11
Typical Crystal Oscillator Circuit
A typical circuit which can be used to implement a crystal
oscillator is shown below.
TL/W/11766– 12
Typical Lock Detect Circuit
A lock detect circuit is needed in order to provide a steady
LOW signal when the PLL is in the locked state. A typical
circuit is shown below.
TL/W/11766– 13
12

Typical Application Example
Operational Notes:
* VCO is assumed AC coupled.
** R
increases impedance so that VCO output power is provided to the load rather than the PLL. Typical values are 10X to 200X depending on the VCO power
IN
level. f
RF impedance ranges from 40X to 100 X.
IN
*** 50X termination is often used on test boards to allow use of external reference oscillator. For most typical products a CMOS clock is used and no terminating
resistor is required. OSC
Proper use of grounds and bypass capacitors is essential to achieve a high level of performance.
Crosstalk between pins can be reduced by careful board layout.
This is a static sensitive device. It should be handled only at static free work stations.
may be AC or DC coupled. AC coupling is recommended because the input circuit provides its own bias. (See
IN
TL/W/11766– 15
TL/W/11766– 14
Figure
below)
13

Application Information
LOOP FILTER DESIGN
A block diagram of the basic phase locked loop is shown.
FIGURE 1. Basic Charge Pump Phase Locked Loop
An example of a passive loop filter configuration, including
the transfer function of the loop filter, is shown in
Z(s)
e
s (C2#R2)a1
s2(C1#C2#R2)asC1asC2
Figure 2
TL/W/11766– 17
FIGURE 2. 2nd Order Passive Filter
Define the time constants which determine the pole and
zero frequencies of the filter transfer function by letting
e
R2#C2 (1a)
T2
and
C1#C2
e
R2
T1
#
C1aC2 (1b)
The PLL linear model control circuit is shown along with the
open loop transfer function in
detector and VCO gain constants[Kw and K
loop filter transfer function[Z(s)], the open loop Bode plot
Figure 3
. Using the phase
]
and the
VCO
can be calculated. The loop bandwidth is shown on the
Bode plot (
is shown to be the difference between the phase at the unity
gain point and
Open Loop Gaineii/i
Closed Loop Gaineio/i
0p) as the point of unity gain. The phase margin
b
180§.
e
H(s) G(s)
e
Kw Z(s) K
VCO
/Ns
e
e
G(s)/[1aH(s) G(s)
i
TL/W/11766– 18
]
.
FIGURE 3. Open Loop Transfer Function
Thus we can calculate the 3rd order PLL Open Loop Gain in
terms of frequency
G(s)
#
H(s)
l
sej
Kw#K
e
0
#
2
0
(1aj0#T2)
VCO
C1#N(1aj0#T1)
b
From equation 2 we can see that the phase term will be
dependent on the single pole and zero such that
b
1
e
w(
0)
tan
(0#T2)btan
b
1
(0#T1)a180§(3)
By setting
dw
d0
e
1a(0#T2)
T2
2
b
1a(0#T1)
T1
we find the frequency point corresponding to the phase inflection point in terms of the filter time constants T1 and T2.
This relationship is given in equation 5.
e
0
1/0T2#T1 (5)
For the loop to be stable the unity gain point must occur
before the phase reaches
p
b
180 degrees. We therefore
want the phase margin to be at a maximum when the magnitude of the open loop gain equals 1. Equation 2 then gives
C1
e
Kw#K
0
p
2
VCO
#N#
#
T2
T1
(1aj0
(1aj0
Ó
2
T2)
#
p
T1)
#
p
TL/W/11766– 16
TL/W/11766– 19
T1
#
T2 (2)
e
0
Ó
(4)
(6)
14

Application Information (Continued)
0
Ð0
c
p
p
(1
2
T2)
#
T1)
#
a
1
a
T12)(1
#
, and the
p
2
2
opt/fref
(T1aT3)
[
tanw
2
0
T22)
#
c
a
(7)
(9)
(10)
#
0
Therefore, if we specify the loop bandwidth,
phase margin, w
late the two time constants, T1 and T2, as shown in equations 7 and 8. A common rule of thumb is to begin your
design with a 45
From the time constants T1, and T2, and the loop bandwidth,
0
equations 9 to 11.
K
(MHz/V) Voltage Controlled Oscillator (VCO)
VCO
Kw (mA) Phase detector/charge pump gain
N Main divider ratio. Equal to RF
RF
(MHz) Radio Frequency output of the VCO at
opt
f
(kHz) Frequency of the phase detector in-
ref
T2
0
C1
, Equations 1 through 6 allow us to calcu-
p
phase margin.
§
T1
, the values for C1, R2, and C2 are obtained in
p
T1
Kw#K
e
C1
#
T2
e
C2
Tuning Voltage constant. The frequency vs voltage tuning ratio.
constant. The ratio of the current output to the input phase differential.
which the loop filter is optimized.
puts. Usually equivalent to the RF
channel spacing.
e
e
c
e
1
2
0
(T1aT3) (15)
#
c
tanw#(T1aT3)
a
[
(T1
T3)
T1
Kw#K
#
T2
0
c
b
secw
tanw
p
e
0
p
1
e
T2
2
0
T1 (8)
#
p
1a(0
VCO
2
0
N
1a(0
#
0
p
T2
C1
R2
2
2
#
b
1
#
T1
#
T2
e
C2 (11)
T1#T3
#
(1
Ð
#
]
a
0
a
VCO
N
p
J
2
a
T1#T3
(T1aT3)
2
T32)
#
c
In choosing the loop filter components a trade off must be
made between lock time, noise, stability, and reference
spurs. The greater the loop bandwidth the faster the lock
time will be, but a large loop bandwidth could result in higher
reference spurs. Wider loop bandwidths generally improve
close in phase noise but may increase integrated phase
noise depending on the reference input, VCO and division
ratios used. The reference spurs can be reduced by reducing the loop bandwidth or by adding more low pass filter
stages but the lock time will increase and stability will decrease as a result.
THIRD ORDER FILTER
A low pass filter section may be needed for some applications that require additional rejection of the reference sidebands, or spurs. This configuration is given in
order to compensate for the added low pass section, the
component values are recalculated using the new open
loop unity gain frequency. The degradation of phase margin
caused by the added low pass is then mitigated by slightly
increasing C1 and C2 while slightly decreasing R2.
The added attenuation from the low pass filter is:
Defining the additional time constant as
Then in terms of the attenuation of the reference spurs added by the low pass pole we have
We then use the calculated value for loop bandwidth
equation 11, to determine the loop filter component values
in equations 15 –17.
the frequency jump lock time will increase.
b
2
]
(/2
ATTEN
1
(
e
20 log[(2qf
T3eR3#C3 (13)
e
T3
0
0
c
#R3#
ref
ATTEN/20
10
(2q#f
)
ref
is slightly less than 0p, therefore
Figure 4
2
a
C3)
1](12)
b
1
2
0
(
.In
(14)
c
(16)
(17)
in
15

Application Information (Continued)
Consider the following application example:
Ý
Example
K
VCO
Kw
RF
F
ref
NeRF
0
p
w
p
ATTENe20 dB
if we choose R3
Converting to standard component values gives the following filter values, which are shown in
C1
R2
C2
R3
C3
Note 1: See related equation for K w in Charge Pump Current Specification
1
e
20 MHz/V
e
5 mA (Note 1)
e
900 MHz
opt
e
200 kHz
e
e
e
e
c
e
e
e
e
e
e
4500
b
secw
p
0
(20/20)
10
0
(2q#200e3)
b6a
[
(3.29e
a
1
#
Ð0
7.045e4
(7.045e4)
3.29eb6
3.549eb5
1.085 nF
1.085 nF
3.55eb5
10.6eb9
e
22k; then C3
tanw
p
e
p
3.29eb6
b
1
e
2.387eb6
2
(3.29eb6a2.387eb6)
2.387eb6)
(3.29eb6a2.387eb6)
2
(3.29eb6a2.387eb6)
#
(5e
(7.045e4)
3.55eb5
#
3.29eb6
#
e
3.35 kX;
1
b
3)#20e6
e
[
(3.29e
2
4500
#
b
2.34eb6
2
a
1
J
22e3
Figure 4
e
5.0V. The value of Kw can then
P
o
e
(5 mA/2q rad), but in this
to (rad/V) multiplying by 2q.
VCO
3.29eb6#2.387eb6
2
b6a
#
[
1
Ð
e
10.6 nF;
e
.
Voltage. The units for
opt/fref
e
2q * 20 kHze1.256e5
e
45
§
T1
T3
0
T2
C1
C2
R2
e
1000 pF
e
3.3 kX
e
10 nF
e
22 kX
e
100 pF
Definitions. For this example V
be approximated using the curves in the Typical Peformance Characteristics for Charge Pump Current vs. D
Kw are in mA. You may also use Kw
case you must convert K
a
3.29eb6#2.387eb6
2.387eb6)
e
3.549eb5
a
(7.045e4)
106 pF.
]
2
]
a
[
1
2
(3.29eb6)
#
(7.045e4)
b
1
(
2
(3.549eb5)
#
2
a
][
1
FIGURE 4.E20 kHz Loop Filter
(7.045e4)
2
]
2
(2.387eb6)
#
2
]
(
(/2
TL/W/11766– 20
16

Application Information (Continued)
MEASUREMENT RESULTS
FIGURE 5. PLL Reference Spurs
TL/W/11766– 21
k
The reference spurious level is
b
74 dBc, due to the loop
filter attenuation and the low spurious noise level of the
LMX2315.
FIGURE 6. PLL Phase Noise 10 kHz Offset
TL/W/11766– 23
b
The phase noise level at 10 kHz offset is
80 dBc/Hz.
FIGURE 7. PLL Phase Noise@1 kHz Offset
TL/W/11766– 22
The phase noise level at 1 kHz offset isb79.5 dBc/Hz.
FIGURE 8. Frequency Jump Lock Time
TL/W/11766– 24
Of concern in any PLL loop filter design is the time it takes
to lock in to a new frequency when switching channels.
ure 8
shows the switching waveforms for a frequency jump
Fig-
of 865 MHz to 915 MHz. By narrowing the frequency span
of the HP53310A Modulation Domain Analyzer enables
evaluation of the frequency lock time to within
g
500 Hz.
The lock time is seen to be less than 500 ms for a frequency
jump of 50 MHz.
17

Application Information (Continued)
EXTERNAL CHARGE PUMP
The LMX PLLatimum series of frequency synthesizers are
equipped with an internal balanced charge pump as well as
outputs for driving an external charge pump. Although the
superior performance of NSC’s on board charge pump eliminates the need for an external charge pump in most applications, certain system requirements are more stringent. In
these cases, using an external charge pump allows the designer to take direct control of such parameters as charge
pump voltage swing, current magnitude, TRI-STATE leakage, and temperature compensation.
One possible architecture for an external charge pump current source is shown in
the diagram, correspond to the phase detector outputs of
the LMX2314/2315 frequency synthesizers. These logic
signals are converted into current pulses, using the circuitry
shown in
Figure 9
of the loop filter components to control the output frequency
of the PLL.
Referring to
Figure 9
current which is relatively constant to within 5V of the power
supply rail. To accomplish this, it is important to establish as
large of a voltage drop across R5, R8 as possible without
saturating Q2, Q4. A voltage of approximately 300 mV provides a good compromise. This allows the current source
reference being generated to be relatively repeatable in the
absence of good Q1, Q2/Q3, Q4 matching. (Matched transistor pairs is recommended.) The wp and wr outputs are
rated for a maximum output load current of 1 mA while 5 mA
current sources are desired. The voltages developed across
R4, 9 will consequently be approximately 258 mV, or
k
42 mV
À
0.026*1n (5 mA/1 mA)Óthrough the Q1, Q2/Q3, Q4 pairs.
R8, 5, due to the current density differences
In order to calculate the value of R7 it is necessary to first
estimate the forward base to emitter voltage drop (Vfn,p) of
the transistors used, the V
of wr’s under 1 mA loads. (wp’s V
k
V
0.1V.)
OH
Knowing these parameters along with the desired current
allow us to design a simple external charge pump. Separating the pump up and pump down circuits facilitates the nodal analysis and give the following equations.
b
V
R5
e
R
4
b
V
R8
e
R
9
V
e
R
5
i
p max
V
R8
e
R
8
i
#
r max
b
(V
p
e
R
6
b
(V
P
e
R
7
Figure 9
. The signals wpand wrin
, to enable either charging or discharging
, the design goal is to generatea5mA
drop of wp, and the VOHdrop
V
V
R5
(b
#
#
(b
V
VOLwp
V
VOHwr
#
T
i
source
#
T
i
sink
#
p
(b
n
ln
#
ln
#
(b
p
a1)b
a
n
a
1) i
)b(V
i
p max
)b(V
i
max
i
source
i
p max
i
sink
i
n max
a
1)
sink
OL
1)
J
J
i
source
R5
R8
k
0.1V and wr’s
OL
a
Vfp)
a
Vfn)
EXAMPLE
Typical Device Parameters b
Typical System Parameters V
Design Parameters I
FIGURE 9
Therefore select
0.3Vb0.026#1n(5.0 mA/1.0 mA)
e
e
R
R
4
9
0.3V#(50a1)
e
R
5
1.0 mA#(50a1)b5.0 mA
0.3V#(100b1)
e
R
8
1.0 mA#(100a1)b5.0 mA
(5Vb0.1V)b(0.3Va0.8V)
e
e
R
R
6
7
1.0 mA
n
P
V
cntl
V
wp
SINK
V
fn
I
rmax
V
R8
V
OLwp
5mA
e
100, b
e
5.0V;
e
0.5Vb4.5V;
e
0.0V; V
e
I
e
V
fp
e
I
e
V
e
e
e
p
SOURCE
e
0.8V
pmax
e
R5
V
OHwr
332X
315.6X
e
50
e
5.0V
wr
e
5.0 mA;
e
1mA
0.3V
e
100 mV
TL/W/11766– 43
e
e
3.8 kX
51.6X
18

Physical Dimensions inches (millimeters)
JEDEC 16-Lead (0.150×Wide) Small Outline Molded Package (M)
For Tape and Reel Order Number LMX2314MX (2500 Units per Reel)
Order Number LMX2314M
NS Package Number M16A
19

Physical Dimensions millimeters (Continued)
Synthesizer for RF Personal Communications
LMX2314/LMX2315 PLLatinum 1.2 GHz Frequency
20-Lead (0.173
For Tape and Reel Order Number LMX2315TMX (2500 Units per Reel)
LIFE SUPPORT POLICY
NATIONAL’S PRODUCTS ARE NOT AUTHORIZED FOR USE AS CRITICAL COMPONENTS IN LIFE SUPPORT
DEVICES OR SYSTEMS WITHOUT THE EXPRESS WRITTEN APPROVAL OF THE PRESIDENT OF NATIONAL
SEMICONDUCTOR CORPORATION. As used herein:
1. Life support devices or systems are devices or 2. A critical component is any component of a life
systems which, (a) are intended for surgical implant support device or system whose failure to perform can
into the body, or (b) support or sustain life, and whose be reasonably expected to cause the failure of the life
failure to perform, when properly used in accordance support device or system, or to affect its safety or
with instructions for use provided in the labeling, can effectiveness.
be reasonably expected to result in a significant injury
to the user.
National Semiconductor National Semiconductor National Semiconductor National Semiconductor
Corporation Europe Hong Kong Ltd. Japan Ltd.
1111 West Bardin Road Fax: (
Arlington, TX 76017 Email: cnjwge@tevm2.nsc.com Ocean Centre, 5 Canton Rd. Fax: 81-043-299-2408
Tel: 1(800) 272-9959 Deutsch Tel: (
Fax: 1(800) 737-7018 English Tel: (
National does not assume any responsibility for use of any circuitry described, no circuit patent licenses are implied and National reserves the right at any time without notice to change said circuitry and specifications.
Fran3ais Tel: (
Italiano Tel: (
NS Package Number MTC20
Wide) Thin Shrink Small Outline Package (TM)
×
Order Number LMX2315TM
a
49) 0-180-530 85 86 13th Floor, Straight Block, Tel: 81-043-299-2309
a
49) 0-180-530 85 85 Tsimshatsui, Kowloon
a
49) 0-180-532 78 32 Hong Kong
a
49) 0-180-532 93 58 Tel: (852) 2737-1600
a
49) 0-180-534 16 80 Fax: (852) 2736-9960
 Loading...