

Page 1

Fieldbus
NI-FBUSTM Monitor User Manual
NI-FBUS Monitor User Manual
June 2004 Edition
Part Number 371171A-01
Page 2

Support
Worldwide Technical Support and Product Information
ni.com
National Instruments Corporate Headquarters
11500 North Mopac Expressway Austin, Texas 78759-3504 USA Tel: 512 683 0100
Worldwide Offices
Australia 1800 300 800, Austria 43 0 662 45 79 90 0, Belgium 32 0 2 757 00 20, Brazil 55 11 3262 3599,
Canada (Calgary) 403 274 9391, Canada (Ottawa) 613 233 5949, Canada (Québec) 450 510 3055,
Canada (Toronto) 905 785 0085, Canada (Vancouver) 604 685 7530, China 86 21 6555 7838,
Czech Republic 420 224 235 774, Denmark 45 45 76 26 00, Finland 385 0 9 725 725 11,
France 33 0 1 48 14 24 24, Germany 49 0 89 741 31 30, India 91 80 51190000, Israel 972 0 3 6393737,
Italy 39 02 413091, Japan 81 3 5472 2970, Korea 82 02 3451 3400, Malaysia 603 9131 0918,
Mexico 01 800 010 0793, Netherlands 31 0 348 433 466, New Zealand 0800 553 322, Norway 47 0 66 90 76 60,
Poland 48 22 3390150, Portugal 351 210 311 210, Russia 7 095 783 68 51, Singapore 65 6226 5886,
Slovenia 386 3 425 4200, South Africa 27 0 11 805 8197, Spain 34 91 640 0085, Sweden 46 0 8 587 895 00,
Switzerland 41 56 200 51 51, Taiwan 886 2 2528 7227, Thailand 662 992 7519,
United Kingdom 44 0 1635 523545
For further support information, refer to the Technical Support and Professional Services appendix. To comment
on the documentation, send email to techpubs@ni.com.
© 1995–2004 National Instruments Corporation. All rights reserved.
Page 3

Important Information
Warranty
The AT-FBUS and PCMCIA-FBUS are warranted against defects in materials and workmanship for a period of one year from the date of
shipment, as evidenced by receipts or other documentation. National Instruments will, at its option, repair or replace equipment that proves to
be defective during the warranty period. This warranty includes parts and labor.
The media on which you receive National Instruments software are warranted not to fail to execute programming instructions, due to defects
in materials and workmanship, for a period of 90 days from date of shipment, as evidenced by receipts or other documentation. National
Instruments will, at its option, repair or replace software media that do not execute programming instructions if National Instruments receives
notice of such defects during the warranty period. National Instruments does not warrant that the operation of the software shall be
uninterrupted or error free.
A Return Material Authorization (RMA) number must be obtained from the factory and clearly marked on the outside of the package before
any equipment will be accepted for warranty work. National Instruments will pay the shipping costs of returning to the owner parts which are
covered by warranty.
National Instruments believes that the information in this document is accurate. The document has been carefully reviewed for technical
accuracy. In the event that technical or typographical errors exist, National Instruments reserves the right to make changes to subsequent
editions of this document without prior notice to holders of this edition. The reader should consult National Instruments if errors are suspected.
In no event shall National Instruments be liable for any damages arising out of or related to this document or the information contained in it.
XCEPT AS SPECIFIED HEREIN, NATIONAL INSTRUMENTS MAKES NO WARRANTIES, EXPRESS OR IMPLIED, AND SPECIFICALLY DISCLAIMS ANY WAR RANTY OF
E
MERCHANTABILITY OR FITNESS FOR A PARTICULAR PURPOSE . CUSTOMER’S RIGHT TO RECOVER DAMAGES CAUSED BY FAULT OR NEGLIGENCE ON THE PART OF
N
ATIONAL INSTRUMENTS SHALL BE LIMITED TO THE AMOUNT THERETOFORE PAID BY THE CUSTOMER. NATIONAL INSTRUMENTS WILL NOT BE LIABLE FOR
DAMAGES RESULTING FROM LOSS OF DATA, PROFITS, USE OF PRODUCTS, OR INCIDENTAL OR CONSEQUENTIAL DAMAGES, EVEN IF ADVISED OF THE PO SSIBILITY
THEREOF. This limitation of the liability of National Instruments will apply regardless of the form of action, whether in contract or tort, including
negligence. Any action against National Instruments must be brought within one year after the cause of action accrues. National Instruments
shall not be liable for any delay in performance due to causes beyond its reasonable control. The warranty provided herein does not cover
damages, defects, malfunctions, or service failures caused by owner’s failure to follow the National Instruments installation, operation, or
maintenance instructions; owner’s modification of the product; owner’s abuse, misuse, or negligent acts; and power failure or surges, fire,
flood, accident, actions of third parties, or other events outside reasonable control.
Copyright
Under the copyright laws, this publication may not be reproduced or transmitted in any form, electronic or mechanical, including photocopying,
recording, storing in an information retrieval system, or translating, in whole or in part, without the prior written consent of National
Instruments Corporation.
Trademarks
National Instruments™, NI™, ni.com™, and NI-FBUS™ are trademarks of National Instruments Corporation.
Product and company names mentioned herein are trademarks or trade names of their respective companies.
Patents
For patents covering National Instruments products, refer to the appropriate location: Help»Patents in your software, the patents.txt file
on your CD, or
ni.com/patents.
WARNING REGARDING USE OF NATIONAL INSTRUMENTS PRODUCTS
(1) NATIONAL INSTRUMENTS PRODUCTS ARE NOT DESIGNED WITH COMPONENTS AND TESTING FOR A LEVEL OF
RELIABILITY SUITABLE FOR USE IN OR IN CONNECTION WITH SURGICAL IMPLANTS OR AS CRITICAL COMPONENTS IN
ANY LIFE SUPPORT SYSTEMS WHOSE FAILURE TO PERFORM CAN REASONABLY BE EXPECTED TO CAUSE SIGNIFICANT
INJURY TO A HUMAN.
(2) IN ANY APPLICATION, INCLUDING THE ABOVE, RELIABILITY OF OPERATION OF THE SOFTWARE PRODUCTS CAN BE
IMPAIRED BY ADVERSE FACTORS, INCLUDING BUT NOT LIMITED TO FLUCTUATIONS IN ELECTRICAL POWER SUPPLY,
COMPUTER HARDWARE MALFUNCTIONS, COMPUTER OPERATING SYSTEM SOFTWARE FITNESS, FITNESS OF COMPILERS
AND DEVELOPMENT SOFTWARE USED TO DEVELOP AN APPLICATION, INSTALLATION ERRORS, SOFTWARE AND
HARDWARE COMPATIBILITY PROBLEMS, MALFUNCTIONS OR FAILURES OF ELECTRONIC MONITORING OR CONTROL
DEVICES, TRANSIENT FAILURES OF ELECTRONIC SYSTEMS (HARDWARE AND/OR SOFTWARE), UNANTICIPATED USES OR
MISUSES, OR ERRORS ON THE PART OF THE USER OR APPLICATIONS DESIGNER (ADVERSE FACTORS SUCH AS THESE ARE
HEREAFTER COLLECTIVELY TERMED “SYSTEM FAILURES”). ANY APPLICATION WHERE A SYSTEM FAILURE WOULD
CREATE A RISK OF HARM TO PROPERTY OR PERSONS (INCLUDING THE RISK OF BODILY INJURY AND DEATH) SHOULD
NOT BE RELIANT SOLELY UPON ONE FORM OF ELECTRONIC SYSTEM DUE TO THE RISK OF SYSTEM FAILURE. TO AVOID
DAMAGE, INJURY, OR DEATH, THE USER OR APPLICATION DESIGNER MUST TAKE REASONABLY PRUDENT STEPS TO
PROTECT AGAINST SYSTEM FAILURES, INCLUDING BUT NOT LIMITED TO BACK-UP OR SHUT DOWN MECHANISMS.
BECAUSE EACH END-USER SYSTEM IS CUSTOMIZED AND DIFFERS FROM NATIONAL INSTRUMENTS' TESTING
PLATFORMS AND BECAUSE A USER OR APPLICATION DESIGNER MAY USE NATIONAL INSTRUMENTS PRODUCTS IN
COMBINATION WITH OTHER PRODUCTS IN A MANNER NOT EVALUATED OR CONTEMPLATED BY NATIONAL
INSTRUMENTS, THE USER OR APPLICATION DESIGNER IS ULTIMATELY RESPONSIBLE FOR VERIFYING AND VALIDATING
THE SUITABILITY OF NATIONAL INSTRUMENTS PRODUCTS WHENEVER NATIONAL INSTRUMENTS PRODUCTS ARE
INCORPORATED IN A SYSTEM OR APPLICATION, INCLUDING, WITHOUT LIMITATION, THE APPROPRIATE DESIGN,
PROCESS AND SAFETY LEVEL OF SUCH SYSTEM OR APPLICATION.
Page 4

Compliance
Compliance with FCC/Canada Radio Frequency Interference
Regulations
Determining FCC Class
The Federal Communications Commission (FCC) has rules to protect wireless communications from interference. The FCC
places digital electronics into two classes. These classes are known as Class A (for use in industrial-commercial locations only)
or Class B (for use in residential or commercial locations). All National Instruments (NI) products are FCC Class A products.
Depending on where it is operated, this Class A product could be subject to restrictions in the FCC rules. (In Canada, the
Department of Communications (DOC), of Industry Canada, regulates wireless interference in much the same way.) Digital
electronics emit weak signals during normal operation that can affect radio, television, or other wireless products.
All Class A products display a simple warning statement of one paragraph in length regarding interference and undesired
operation. The FCC rules have restrictions regarding the locations where FCC Class A products can be operated.
Consult the FCC Web site at
FCC/DOC Warnings
This equipment generates and uses radio frequency energy and, if not installed and used in strict accordance with the instructions
in this manual and the CE marking Declaration of Conformity*, may cause interference to radio and television reception.
Classification requirements are the same for the Federal Communications Commission (FCC) and the Canadian Department
of Communications (DOC).
Changes or modifications not expressly approved by NI could void the user’s authority to operate the equipment under the
FCC Rules.
Class A
Federal Communications Commission
This equipment has been tested and found to comply with the limits for a Class A digital device, pursuant to part 15 of the FCC
Rules. These limits are designed to provide reasonable protection against harmful interference when the equipment is operated
in a commercial environment. This equipment generates, uses, and can radiate radio frequency energy and, if not installed and
used in accordance with the instruction manual, may cause harmful interference to radio communications. Operation of this
equipment in a residential area is likely to cause harmful interference in which case the user is required to correct the interference
at their own expense.
www.fcc.gov for more information.
Canadian Department of Communications
This Class A digital apparatus meets all requirements of the Canadian Interference-Causing Equipment Regulations.
Cet appareil numérique de la classe A respecte toutes les exigences du Règlement sur le matériel brouilleur du Canada.
Compliance with EU Directives
Users in the European Union (EU) should refer to the Declaration of Conformity (DoC) for information* pertaining to the
CE marking. Refer to the Declaration of Conformity (DoC) for this product for any additional regulatory compliance
information. To obtain the DoC for this product, visit
and click the appropriate link in the Certification column.
* The CE marking Declaration of Conformity contains important supplementary information and instructions for the user or
installer.
ni.com/hardref.nsf, search by model number or product line,
Page 5

Contents
About This Manual
Conventions ...................................................................................................................ix
Related Documentation..................................................................................................x
Chapter 1
Introduction
NI-FBUS Monitor Overview .........................................................................................1-1
Windows of the NI-FBUS Monitor ...............................................................................1-1
Recommended Minimum Platform ...............................................................................1-1
Chapter 2
Installation and Configuration
Installing the Software ...................................................................................................2-1
Installing the Hardware..................................................................................................2-1
Configuring the Software...............................................................................................2-2
Configuration Steps for Windows 2000/NT/XP .............................................2-2
Interface Port Configuration............................................................................2-2
Starting the NI-FBUS Monitor Driver (Win NT 4.0 Only) ...........................................2-2
Chapter 3
Windows and Menus
List of Windows.............................................................................................................3-1
About the NI-FBUS Monitor Interface..........................................................................3-2
Main Window ................................................................................................................3-3
Menus and the Standard Toolbar ...................................................................................3-4
Standard Toolbar .............................................................................................3-5
Main Menu Bar................................................................................................3-6
File Menu ..........................................................................................3-6
Capture Menu....................................................................................3-7
View Menu........................................................................................3-8
Packet Menu......................................................................................3-8
Statistics Menu..................................................................................3-8
Window Menu...................................................................................3-8
Toolbars Menu ..................................................................................3-8
Help Menu.........................................................................................3-9
© National Instruments Corporation v NI-FBUS Monitor User Manual
Page 6

Contents
Filter Window................................................................................................................ 3-9
Packet View .................................................................................................... 3-10
Packet Display Formats .................................................................... 3-10
Packet View Toolbar ........................................................................ 3-11
Statistics View................................................................................................. 3-13
Statistics View Toolbar .................................................................... 3-14
Live List View ................................................................................................ 3-15
Schedule View ................................................................................................ 3-15
Filters............................................................................................................................. 3-15
Filter Operation During Capture ..................................................................... 3-15
Filter Operation After Capture ........................................................................ 3-15
Basic Filter Logic............................................................................................ 3-16
Filter Dialog Box ............................................................................................ 3-16
FDL Filter Tab.................................................................................. 3-17
FMS Filter Tab ................................................................................. 3-18
Filter by Address Tab ....................................................................... 3-19
Settings Dialog Box....................................................................................................... 3-19
Capture Settings Tab....................................................................................... 3-19
Display Settings Tab ....................................................................................... 3-21
Toolbar Settings Tab....................................................................................... 3-22
Chapter 4
How To Use the NI-FBUS Monitor
Starting the NI-FBUS Monitor...................................................................................... 4-1
Starting Capture............................................................................................................. 4-1
Stopping Capture ...........................................................................................................4-2
Saving Data ................................................................................................................... 4-2
Finding Data .................................................................................................................. 4-2
Viewing Data................................................................................................................. 4-3
Improving Performance................................................................................................. 4-4
Conserve Memory........................................................................................... 4-4
Turn Live Updates Off.................................................................................... 4-4
Filter Only for Needed Data............................................................................ 4-4
No Split Windows........................................................................................... 4-4
Appendix A
Pinout Information
Appendix B
Technical Support and Professional Services
NI-FBUS Monitor User Manual vi ni.com
Page 7

Glossary
Index
Contents
© National Instruments Corporation vii NI-FBUS Monitor User Manual
Page 8

About This Manual
This manual describes the NI-FBUS Monitor utility, its features,
and how to install and use it.
The NI-FBUS Monitor utility is intended for use with
Windows 2000/NT/XP.
Conventions
The following conventions appear in this manual:
» The » symbol leads you through nested menu items and dialog box options
to a final action. The sequence File»Page Setup»Options directs you to
pull down the File menu, select the Page Setup item, and select Options
from the last dialog box.
This icon denotes a note, which alerts you to important information.
This icon denotes a caution, which advises you of precautions to take to
avoid injury, data loss, or a system crash.
When symbol is marked on a product, it denotes a warning advising you to
take precautions to avoid electrical shock.
When symbol is marked on a product, it denotes a component that may be
hot. Touching this component may result in bodily injury.
bold Bold text denotes items that you must select or click in the software, such
as menu items and dialog box options. Bold text also denotes parameter
names.
italic Italic text denotes variables, emphasis, a cross reference, or an introduction
to a key concept. This font also denotes text that is a placeholder for a word
or value that you must supply.
monospace Text in this font denotes text or characters that you should enter from the
keyboard, sections of code, programming examples, and syntax examples.
This font is also used for the proper names of disk drives, paths, directories,
programs, subprograms, subroutines, device names, functions, operations,
variables, filenames, and extensions.
© National Instruments Corporation ix NI-FBUS Monitor User Manual
Page 9

About This Manual
monospace bold Bold text in this font denotes the messages and responses that the computer
automatically prints to the screen. This font also emphasizes lines of code
that are different from the other examples.
monospace italic
NI-FBUS In this manual, the term NI-FBUS, when used alone, refers to the NI-FBUS
Italic text in this font denotes text that is a placeholder for a word or value
that you must supply.
Communications Manager.
Related Documentation
The following documents contain information that you might find helpful
as you read this manual:
• Fieldbus Standard for Use in Industrial Control Systems, Part 2,
ISA-S50.02.1992
• AT-FBUS Getting Started Manual
• PCI-FBUS Getting Started Manual
• PCMCIA-FBUS Getting Started Manual
NI-FBUS Monitor User Manual x ni.com
Page 10

Introduction
This chapter contains an overview of the NI-FBUS Monitor.
NI-FBUS Monitor Overview
The NI-FBUS Monitor is a Win32 application used to monitor, debug,
and analyze fieldbus data packets. The NI-FBUS Monitor detects
communication on the bus, capturing data packets that are passed between
fieldbus devices. These packets are time-stamped and displayed in real
time in active packet view of the NI-FBUS Monitor. The NI-FBUS
Monitor can display data packets in decoded format or in hexadecimal
format. The NI-FBUS Monitor can filter out unwanted data packets at three
levels: the Fieldbus Data Link layer (FDL), the Fieldbus Messaging
Specification layer (FMS), and by fieldbus addresses.
Windows of the NI-FBUS Monitor
The NI-FBUS Monitor has a Multiple Document Interface (MDI). An MDI
window contains many smaller windows open concurrently that display
data from different sources. These smaller windows are called filter
windows. In the NI-FBUS Monitor, some filter windows might contain
previously-captured data, while other filter windows might capture new
data from different buses or the same bus.
1
Chapter 3, Windows and Menus, lists and describes the windows of the
NI-FBUS Monitor.
Recommended Minimum Platform
The recommended minimum platform for the NI-FBUS Monitor is a
66 MHz 486 processor with 8 MB of RAM. If you want to run the
NI-FBUS Monitor on a slower platform, refer to the Improving
Performance section of Chapter 4, How To Use the NI-FBUS Monitor.
© National Instruments Corporation 1-1 NI-FBUS Monitor User Manual
Page 11

Installation and Configuration
This chapter contains instructions for installing and configuring your
NI-FBUS Monitor software and your fieldbus interface.
Installing the Software
Caution If you are installing the NI-FBUS software over an existing version, write down
your card configuration and any port configuration parameters you changed from their
defaults. Reinstalling may cause you to lose any existing card and port configuration
information.
Complete the following steps to run the software installation program.
1. Login as Administrator or as a user with Administrator privileges.
2. Insert your NI-FBUS Monitor CD.
The
autorun utility should launch the NI-FBUS Monitor installer
wizard. If it does not launch the installer wizard, complete the
following steps.
a. From the Start menu, select Run.
b. In the Run dialog box, type the following:
x
:\setup
where x is the letter of the drive containing the distribution disk.
The interactive setup program takes you through the necessary
steps to install the software.
2
Installing the Hardware
To install the AT-FBUS hardware, refer to the AT-FBUS Getting Started
Manual, which is included in PDF-format on the NI-FBUS
Communications Manager CD.
To install the PCMCIA-FBUS and PCI-FBUS hardware, refer to the
PCMCIA-FBUS Getting Started Manual and the PCI-FBUS Getting
© National Instruments Corporation 2-1 NI-FBUS Monitor User Manual
Page 12

Chapter 2 Installation and Configuration
Started Manual, both of which are included in PDF-format on the NI-FBUS
Communications Manager CD.
Configuring the Software
If you are installing an AT-FBUS board, the physical settings on the board
must match the software settings you configure. To read your IRQ line
from your board, look at the number printed on the board under the jumper.
Configuration Steps for Windows 2000/NT/XP
1. Select Start»Programming Files»National Instruments»
NI-FBUS»Interface Configuration Utility to start the NI-FBUS
Interface Configuration Utility.
2. To configure the software, refer to the Interface Configuration
Utility Help.
Interface Port Configuration
1. Start the NI-FBUS Interface Configuration Utility.
2. In the configuration window, select the port you want to configure and
click the Edit button.
3. Select Monitor for the Usage.
4. Click the OK button.
Your software is configured.
Starting the NI-FBUS Monitor Driver (Win NT 4.0 Only)
The nifb kernel-mode driver is launched automatically under
Windows 2000/XP. Under Windows NT, the driver must be started
manually, as follows. The installation program defines the
for the driver as
1. After you configure your installation, restart Windows. You must
restart your computer before you can use the NI-FBUS software.
2. Start the kernel-mode device driver
command at the command prompt:
net start nifb
You can also start nifb by selecting Start»Settings»Control
Panel»System»Device Manager»NIFB»Start.
NI-FBUS Monitor User Manual 2-2 ni.com
Manual.
nifb by entering the following
StartupType
Page 13

Chapter 2 Installation and Configuration
If the process and the driver start up successfully under Windows NT,
you can configure the
StartupType for the nifb driver to Automatic through the Devices
nifb driver to load at system startup. Change the
window in the Control Panel. If you are using Windows NT, you can also
move the NIFB shortcut to the StartUp folder to make it start up
automatically when your computer boots or restarts.
© National Instruments Corporation 2-3 NI-FBUS Monitor User Manual
Page 14

Windows and Menus
This chapter describes each of the menus and windows in the NI-FBUS
Monitor utility.
List of Windows
Main Window Multiple Document Interface (MDI)
Filter Window Displays data packets and statistical
Filter Dialog box you can use to select which
3
window that contains all the other
windows and toolbars.
information. Each filter window has its
own packet filter.
data packets to capture. The options are as
follows:
FDL Filter—Filters packets by the
Fieldbus Data Link (FDL) layer.
FMS Filter—Filters packets by the
Fieldbus Messaging Specification (FMS)
layer.
Filter by Address—Filters packets by
address.
Settings Dialog box you can use to set the
following NI-FBUS Monitor options:
Capture Settings—Capture options.
Display Settings—Color and font
options.
Toolbar Settings—Toolbar options.
© National Instruments Corporation 3-1 NI-FBUS Monitor User Manual
Page 15

Chapter 3 Windows and Menus
Packet View Toolbar Gives access to view options for the
packet view.
Statistics View Toolbar Gives access to view options for the
statistics view.
Standard Toolbar Gives access to commonly used functions
in a toolbar format.
About the NI-FBUS Monitor Interface
The NI-FBUS Monitor consists of windows and data objects. The main
window is the large desktop window that contains all other windows of the
NI-FBUS Monitor. It has a menu bar and various toolbars. The smaller
windows inside the main window are filter windows. Each filter window
uses a single filter to determine what data the NI-FBUS Monitor captures.
The main data object that stores these captured data packets on a disk and
holds the data in memory is called the capture document. You can use the
filter window to view the data in the capture document. You can attach
several filter windows with the corresponding filters to the capture
document.
When you select New from the File menu, the NI-FBUS Monitor creates
a new capture document and a corresponding filter window. The filter
window displays data from the capture document. Each filter window has
an exclusive filter attached to it that you can view as a dialog box. To
display the filter, select Filter Settings from the Capture menu. You can
use the filter to determine what data the NI-FBUS Monitor displays in the
filter window and what data it saves to the capture document. To add a new
filter window to the document, select New Filter Window from the
Capture menu. Adding a new filter window attaches a new filter window
and filter to the document. You can use the new filter to filter different data.
NI-FBUS Monitor User Manual 3-2 ni.com
Page 16
Chapter 3 Windows and Menus
Figure 3-1 is a graphical example of the relationships between the windows
and the document. The gray area represents the graphical area that appears
on the desktop. The documents on the left are data objects invisible on the
desktop.
Note Even if a window is split using the Split Filter Window function, the filter window
still has only one filter attached to it.
Figure 3-1. Relationship of Windows to Capture Documents
Main Window
The main window contains all the windows of the NI-FBUS Monitor. The
frame of the main window contains a menu bar and a status bar. The frame
can also have toolbars on it. Figure 3-2 shows the main window.
© National Instruments Corporation 3-3 NI-FBUS Monitor User Manual
Page 17

Chapter 3 Windows and Menus
Figure 3-2. Main Window
When you start the NI-FBUS Monitor, it opens a new filter window and
a new capture document. The capture document contains the actual data
packets that are captured from the bus. The filter window is a graphical
representation of the data stored in the capture document. The filter
window is minimized in Figure 3-2. By default, the NI-FBUS Monitor
opens the standard toolbar at the top and the Packet View toolbar on the
left of the main window’s frame.
Menus and the Standard Toolbar
To see help for the NI-FBUS Monitor controls, browse through the menus
or pause the cursor over the standard toolbar, shown in Figure 3-3. To see
a short description of a menu or toolbar function, pause your cursor over
the item. The NI-FBUS Monitor displays the description in the status bar,
which is located at the very bottom of the main window. Pause your cursor
over an item in the toolbar to see a short description of the item in a yellow
rectangle near the cursor.
NI-FBUS Monitor User Manual 3-4 ni.com
Page 18

Standard Toolbar
Chapter 3 Windows and Menus
Figure 3-3 shows the standard NI-FBUS Monitor toolbar.
Figure 3-3. Standard Monitor Toolbar
Following are descriptions of the standard toolbar buttons:
New Capture creates a new capture document.
Open Capture opens an existing capture document.
Save Capture saves the current capture document.
Cut removes a selected capture document.
Copy duplicates a capture document to Clipboard for pasting.
Paste pastes a capture document to a different location.
Find Data finds data in the current window.
Start Capture starts a capture on the selected board.
Stop Capture stops the capture on the selected board.
Reset Capture deletes all captured packets
Live Updates Off turns off automatic screen updates during a capture.
Updating the screen constantly can be a problem if you have a slow
computer.
Capture Settings sets your capture, display, and toolbar settings.
© National Instruments Corporation 3-5 NI-FBUS Monitor User Manual
Page 19

Chapter 3 Windows and Menus
Main Menu Bar
Filter Settings shows the filter settings for the current filter window.
Add Filter Window creates a new filter window and filter for the current
capture document.
Split Filter Window splits the filter window into a multi-paned filter
window.
Cascade Window arranges the open documents in a diagonal order.
Tile Window arranges two filter windows in vertical order.
Help opens the NI-FBUS online help utility.
The main menu bar is at the top of the main window and lists all of the
operations that you can perform in the NI-FBUS Monitor. When you select
an item in the menu, a short help message describing the option appears in
the Status Bar at the bottom of the main window.
File Menu
The File menu allows you to open, save, print, and create new documents.
Following are descriptions of the File menu selections:
New Creates a new capture document.
Open Opens an existing capture document in
*.mon format. A text editor is included in
the NI-FBUS Monitor for opening
files.
Close Closes the current capture document.
Save Saves the current capture document.
Two save formats are allowed:
which saves captured and filtered data
to a binary file, and
captured and filtered data as a text file.
NI-FBUS Monitor User Manual 3-6 ni.com
*.txt, which saves
*.txt
*.mon,
Page 20

Chapter 3 Windows and Menus
Save As Saves the current capture document with
a new name.
Print Prints the current capture document.
Print Setup Sets up the printer and printer options.
Recent File List the most recently saved files.
Exit Exits the NI-FBUS Monitor.
Capture Menu
The Capture menu allows you to control the capture. To view this menu,
click the Capture option at the top of the main window, or right-click in
the filter window. The standard toolbar has a button for most of the items
in the Capture menu.
Following are descriptions of the Capture menu selections:
Settings Sets your capture, display and toolbar
settings.
Filter Settings Shows the filter settings for the current
filter window.
Start Capture Starts a capture on the selected board.
Stop Capture Stops capture on the selected board.
Reset Capture Deletes all captured packets.
Find Data Finds data in the current window.
Hexadecimal Data Displays hexadecimal data.
Verbose Data Displays detailed data.
High Priority Updates Enhances live updates.
Live Updates Turns off real-time updates. This is a
useful feature if your computer is slow.
Smooth Live Updates Shows flicker-free updates, but is slower.
Scrolling Live Updates Scrolls data during capture, but is slower.
© National Instruments Corporation 3-7 NI-FBUS Monitor User Manual
Page 21

Chapter 3 Windows and Menus
View Menu
You can use the View menu instead of the toolbars to configure the active
filter window views.
Packet Menu
The Packet menu has the same options as the packet view toolbar. Refer to
the Packet View Toolbar section for a description of each option.
Statistics Menu
The Statistics menu has the same options as the statistics view toolbar.
Refer to the Statistics View Toolbar section for a description of each option.
The Live List View shows the devices on the fieldbus that are active and
functioning (alive).
Window Menu
You can use the Window menu to control the layout of windows contained
in the main window.
Following are descriptions of the Window menu selections:
Add Filter Window Creates a new filter window and filter for
the current document.
Split Filter Window Splits the filter window into a
multi-paned filter window.
Cascade Cascades the open windows.
Tile Tiles the open windows.
Arrange Icons Arranges the icons.
Window List Lists the open windows.
Toolbars Menu
You can use the Toolbars menu to show or hide the toolbars of the
NI-FBUS Monitor.
Following are descriptions of the Toolbars menu selections:
Standard Toolbar Shows the standard toolbar.
Packet Toolbar Shows the Packet View toolbar.
NI-FBUS Monitor User Manual 3-8 ni.com
Page 22

Filter Window
Chapter 3 Windows and Menus
Statistics Toolbar Shows the Statistics View toolbar.
Status Bar Shows the status bar.
Help Menu
You can use the Help menu to display information about the NI-FBUS
Monitor.
The filter window displays the data in a capture document, and can display
this data in different formats. The filter window has three tabs located in the
bottom left of the window that you can use to switch between statistics view
and packet view. Both the statistics view and the packet view have toolbars
that allow you to choose what each view shows. Figure 3-4 shows an
example of a filter window.
Figure 3-4. Filter Window
© National Instruments Corporation 3-9 NI-FBUS Monitor User Manual
Page 23

Chapter 3 Windows and Menus
Packet View
You can use the packet view to display and manipulate data packets.
This view is the main medium of interaction between you and the capture
document. To select the packet view, click the Packets tab at the bottom
left of the filter window, or select Packet View from the View menu.
Figure 3-5 shows the filter window in packet view.
Figure 3-5. Filter Window and Captured Data in Packet View
Packet Display Formats
Packet data can be in one of three formats: simple, decode, or hex.
All formats have the same header, which follows:
(*/#)PACKET_NUMBER - TIME(HH:MM:SS.US) LENGTH - SIZE
An asterisk (*) next to a packet indicates that a packet prior to that packet
is missing. The asterisk indicates that, after several attempts, the monitor
on the fieldbus interface could not pass the packet to the host application
(the NI-FBUS Monitor). This problem might happen on slow PCs. If you
NI-FBUS Monitor User Manual 3-10 ni.com
Page 24

Chapter 3 Windows and Menus
see an asterisk, refer to the Improving Performance section of Chapter 4,
How To Use the NI-FBUS Monitor.
A pound sign (#) next to a packet number means that the NI-FBUS Monitor
received the packet that arrived right before the indicated packet.
The format of the time measurement is as follows:
Hours:Minutes:Seconds.Microseconds
The Simple format is a condensed version of the Decode format, and
shows only the type of Protocol Data Units (PDUs) of the FDL, FMS, and
FAS (Fieldbus Access Sublayer) layers in the packet. The Decode format
fully decodes the data packet and formats the data according to the PDU
sections of the packet. The Hex format performs a hexadecimal dump of
the data in the PDU sections of the packet.
Packet View Toolbar
The Packet View toolbar is on the left of the main window in the
Figure 3-5. The Packet View toolbar controls how the filter window
displays data. To move the Packet View toolbar, click it and drag it. Pause
the cursor over a toolbar control to see the tool tips. Figure 3-6 shows the
Packet View toolbar.
Figure 3-6. Packet View Toolbar
© National Instruments Corporation 3-11 NI-FBUS Monitor User Manual
Page 25

Chapter 3 Windows and Menus
Following are descriptions of the buttons, checkboxes, and drop-down lists
on the Packet View toolbar:
Radio Buttons
Simple Displays a short view of the data in a
packet.
Decode Fully decodes the data in a packet.
Hex Displays a hexadecimal dump of the data
in a packet.
Checkboxes
Time Displays the time stamp of a packet.
LAS\TM Displays the LAS and Time Master
information of a packet.
FDL Displays the FDL portion of a packet.
FAS\SM Displays the FAS portion of a packet.
FMS Displays the FMS portion of a packet.
Hex Displays decoded numeric data in
hexadecimal format. The drop-down list
to the right is the width in bytes that the
data occupies on the screen.
Verbose Displays more information about the
packet.
Graphic Buttons
Horizontal Packets displays FDL, FAS, and FMS horizontally on the
screen.
Vertical Packets displays FDL, FAS, and FMS vertically, from top to
bottom, on the screen.
NI-FBUS Monitor User Manual 3-12 ni.com
Page 26

Chapter 3 Windows and Menus
Drop-Down List
Time Measured Allows you to select the time calculation
to perform on the packet. The options are
as follows:
Absolute—Shows the absolute time
relative to the start of the NI-FBUS
Monitor utility.
Idle—Shows the idle time between
packets.
From Start—Shows the time from the
start of one packet to the start of the next
packet.
From End—Shows the time from the
end of one packet to the end of the next
packet.
Transmission—Shows the time it took to
transmit a packet.
Statistics View
The statistics view shows the volume of the types of fieldbus packets
passed over the bus, and the bus time (or bandwidth) that these packets
consume. To select this view, click the Statistics tab at the bottom left of
the filter window, or select Statistics View from the View menu. The most
useful statistics chart is the Bandwidth chart. It is a pie chart showing the
relative use of bandwidth for the FMS, FAS, and FDL packets as a fraction
of the whole bus time. The FMS Services chart displays the volume of the
different types of services transmitted from the FMS layers of the bus
devices. The FMS Services chart is a breakdown of the FMS PDU section
of the Bandwidth chart. The FDL PDUs chart shows the volume of the
FDL PDUs transmitted over the bus. The FDL PDUs chart is a breakdown
of the FDL PDU section of the Bandwidth chart. Figure 3-7 shows the
statistics view.
© National Instruments Corporation 3-13 NI-FBUS Monitor User Manual
Page 27

Chapter 3 Windows and Menus
Figure 3-7. Filter Window Showing Statistics View
Statistics View Toolbar
The Statistics View toolbar allows you to select which graphs you would
like to see. This toolbar is not visible by default. You can view this toolbar
by selecting Statistics Toolbar from the Toolbars menu. Deselecting the
box for a chart removes the corresponding chart from the view, and
checking the box for a chart displays the chart. Figure 3-8 shows the
Statistics View toolbar.
Figure 3-8. Statistics View Toolbar
NI-FBUS Monitor User Manual 3-14 ni.com
Page 28

Live List View
Schedule View
Chapter 3 Windows and Menus
Following are descriptions of the checkboxes on the Statistics View
toolbar:
Bandwidth Displays the relative bandwidth between
FDL, FAS, and FMS packets.
FMS Displays the FMS Service volume.
FDL Displays the FDL PDU volume.
Verbose Displays detailed statistics and spells out
parameter names.
The Live List View shows what devices on the fieldbus are active. This
view lists active devices as alive and inactive devices as dead. The Live
List View is active only during data capture.
The Schedule View shows the function block schedule packet information
on the bus. An associated schedule file should be assigned in Capture
Settings before a capture is started.
Filters
The filter is a tool you can use interactively at capture time or after capture.
Filter Operation During Capture
During capture the filter is valid, and the NI-FBUS Monitor discards all
data not matching the filter. However, if there are multiple filter windows,
the NI-FBUS Monitor checks each filter to make sure that it retains the
desired data. If you make changes to the filter, the NI-FBUS Monitor
instantly downloads the changes to the fieldbus, so the changes take effect
immediately.
Filter Operation After Capture
After capture, you can filter out more undesired data (postfilter) by
selecting only the packets you want to view. Changes to the filter forces the
NI-FBUS Monitor to refilter the data, so that only the selected packets are
visible. The NI-FBUS Monitor retains all of the original captured data. To
© National Instruments Corporation 3-15 NI-FBUS Monitor User Manual
Page 29

Chapter 3 Windows and Menus
Basic Filter Logic
refilter the data and display the desired packets, click on the packet types
that you want to view again. The data filtered out during capture is not
accessible. For example, after capture, you cannot recover Pass Token (PT)
FDL packets if they were not enabled during capture.
A filter behaves differently depending on whether you select addresses on
the Filter by Address tab. If no addresses are selected, the filter uses all
addresses and combines the FDL Filter and FMS Filter choices, and
captures the types of packets checked in those dialog boxes. If any
addresses are selected on the Filter by Address tab, incoming packets
are first screened for their address. If the address is one of the selected
addresses, it is then compared to the FDL filter and the FMS filter.
Pseudocode for the filter follows:
If no addresses are selected in the Filter by Address tab:
Packets Captured = FDL Filter + FMS Filter
If addresses are selected in the Filter by Address tab:
Packets Captured = Address(es) * (FDL Filter + FMS Filter)
Where + stands for or and * stands for and.
Filter Dialog Box
To view the Filter dialog box for a filter window, right-click the mouse to
bring up the Capture menu and select Filter Settings, or you can click the
Filter Settings toolbar button. The title bar of a filter displays the name of
the filter window to which it is attached. The filter appears as a dialog box
with three tabs—FDL Filter, FMS Filter, and Filter by Address. You can
open the Filter dialog box any time before, during, and after capture, or you
can hide it from view.
The following sections describe the tabs on the Filter dialog box.
NI-FBUS Monitor User Manual 3-16 ni.com
Page 30

Chapter 3 Windows and Menus
FDL Filter Tab
The FDL Filter tab filters packets at the FDL layer and lists all of the FDL
PDU types for easy selection. Select the checkbox by an FDL type to
capture that type of packet. The Show Transfer Errors checkbox enables
the display of data-transfer errors. A data-transfer error can occur if a
packet does not have the proper checksum attached to it, which can be
caused by bus noise. The NI-FBUS Monitor displays protocol errors along
with the packets. Figure 3-9 shows the FDL Filter tab.
Figure 3-9. FDL Filter Tab
© National Instruments Corporation 3-17 NI-FBUS Monitor User Manual
Page 31

Chapter 3 Windows and Menus
FMS Filter Tab
The FMS Filter tab filters packets by FMS service and lists all the FMS
Services available. Select the FMS PDU Type using the radio buttons on
the left of the dialog box to view the services corresponding to that PDU
type in the FMS Services box. Select a checkbox to enable capture of the
corresponding packet type. Figure 3-10 shows the FMS Filter tab.
Figure 3-10. FMS Filter Tab
NI-FBUS Monitor User Manual 3-18 ni.com
Page 32

Chapter 3 Windows and Menus
Filter by Address Tab
The Filter by Address tab filters data for a specific address or addresses.
The NI-FBUS Monitor detects and lists all the currently detected addresses
in the Detected Addresses box of the Filter by Address tab. The
NI-FBUS Monitor captures data only for the selected addresses, and no
other addresses. If you want to capture data for all addresses, click the
Clear All button to ensure that no other addresses are selected. If you want
to configure the filter before capture, use the User Defined field to insert
addresses into the address list. Select the Hex Addresses checkbox to view
the addresses in the Detected Addresses box in hexadecimal format. The
User Defined field interprets data entered as hexadecimal data.
Figure 3-11 shows the Filter by Address tab.
Figure 3-11. Filter by Address Tab
Settings Dialog Box
This dialog box contains optional settings for capturing data, displaying
data, and changing the toolbar. To bring up the Settings dialog box, select
Settings from the Capture menu.
Capture Settings Tab
The Capture Settings tab allows you to select the board to use, and to
specify what you want the NI-FBUS Monitor to do after it receives the
number of packets in the Max num of packets field. Figure 3-12 shows the
Capture Settings tab.
© National Instruments Corporation 3-19 NI-FBUS Monitor User Manual
Page 33

Chapter 3 Windows and Menus
Figure 3-12. Capture Settings Tab
Following are descriptions of the options on the Capture Settings tab:
Bus Name Allows you to select a fieldbus interface
board.
Schedule Allows you to select a fieldbus schedule
configuration file.
Max num of packets Allows you to enter the maximum
number of packets you want the
NI-FBUS Monitor to capture.
Stop capture when max Stops capture of data after the NI-FBUS
reached Monitor receives the Max num of
packets.
Continuous capture when Continues capture after the NI-FBUS
max reached Monitor receives the Max num of
packets by dumping the oldest packet
from the captured data, and saving the
newest packet.
Stop on packet decoding Stops continuous capture when a packet
error (SW) error occurs. Improper packet decoding
format causes decoding errors.
NI-FBUS Monitor User Manual 3-20 ni.com
Page 34

Stop packet on reception Stops continuous capture when a
error (HW) reception error occurs.
Write to file Writes captured data directly to the file
Display Settings Tab
The Display Settings tab allows you to select the colors of packet portions
and the font the NI-FBUS Monitor uses to display data. To change a color,
click the color next to the field name. To change the font, click the Fonts
button. To reset the colors and fonts to the NI-FBUS Monitor defaults, click
the Default Colors and Default Font buttons. Figure 3-13 shows the
Display Settings tab.
Chapter 3 Windows and Menus
specified in the field. If you select
Continuous capture when max
reached, the NI-FBUS Monitor writes
data to the file until you stop the capture.
During a continuous capture, the number
of packets retained in memory does not
exceed the value in the Max num of
packets field.
Figure 3-13. Display Settings Tab
© National Instruments Corporation 3-21 NI-FBUS Monitor User Manual
Page 35

Chapter 3 Windows and Menus
Toolbar Settings Tab
The Toolbar Settings tab allows you to select which toolbars the NI-FBUS
Monitor displays. Select the Show Tool Tips checkbox to activate the tool
tip help for most controls. To view the tips, pause your cursor over a
control. Figure 3-14 shows the Toolbar Settings tab.
Figure 3-14. Toolbar Settings Tab
NI-FBUS Monitor User Manual 3-22 ni.com
Page 36

How To Use the NI-FBUS
Monitor
This chapter describes how to perform basic tasks with the NI-FBUS
Monitor.
Starting the NI-FBUS Monitor
To launch the NI-FBUS Monitor application, double-click the Fieldbus
Monitor icon in the Fieldbus Software program group.
Starting Capture
To start capture, complete the following steps:
1. (Optional) Before starting a capture, you might want to open the filter
to select specific packets to capture. To open the filter, select Filter
Settings from the Capture menu or click the Filter Settings button on
the standard toolbar. The filter appears as a dialog box that allows you
to select which packets you want to capture. You do not have to
configure the filter at the start of capture; you can configure the filter
any time during the capture.
2. (Optional) To select a board to capture from, select Capture»Settings
and select the Capture Settings tab from the Settings dialog box.
3. To capture data, select Start Capture from the Capture menu or click
the Start Capture button on the standard toolbar.
4
© National Instruments Corporation 4-1 NI-FBUS Monitor User Manual
Page 37

Chapter 4 How To Use the NI-FBUS Monitor
Stopping Capture
You can stop data capture in one of two ways:
• Select Stop Capture from the Capture menu or click the Stop
Capture button on the standard toolbar.
• Select Capture»Settings and click the Capture Settings tab in the
Settings dialog box. Click the Stop capture when max reached
button to stop capture after the NI-FBUS Monitor receives the number
of packets specified by Max num of packets.
Saving Data
To save the captured data, select Save from the File menu or click the Save
Capture button on the standard toolbar. The NI-FBUS Monitor places the
saved data in the current window. During the save operation, the NI-FBUS
Monitor prompts you to save all of the captured data or just the filtered data,
if there was any filtering after capture.
You can save data in two formats:
•
*.mon, a binary format that the NI-FBUS Monitor can reload and
refilter
•
*.txt, an ASCII format that text editors can load
Finding Data
To find data, select Find Data from the Capture menu or click the Find
Data button on the standard toolbar. The Find dialog box, as shown in
Figure 4-1, appears. If the NI-FBUS Monitor finds the data, it places an
elliptical mark by the packet in which the data appears.
Figure 4-1. Find Dialog Box
NI-FBUS Monitor User Manual 4-2 ni.com
Page 38

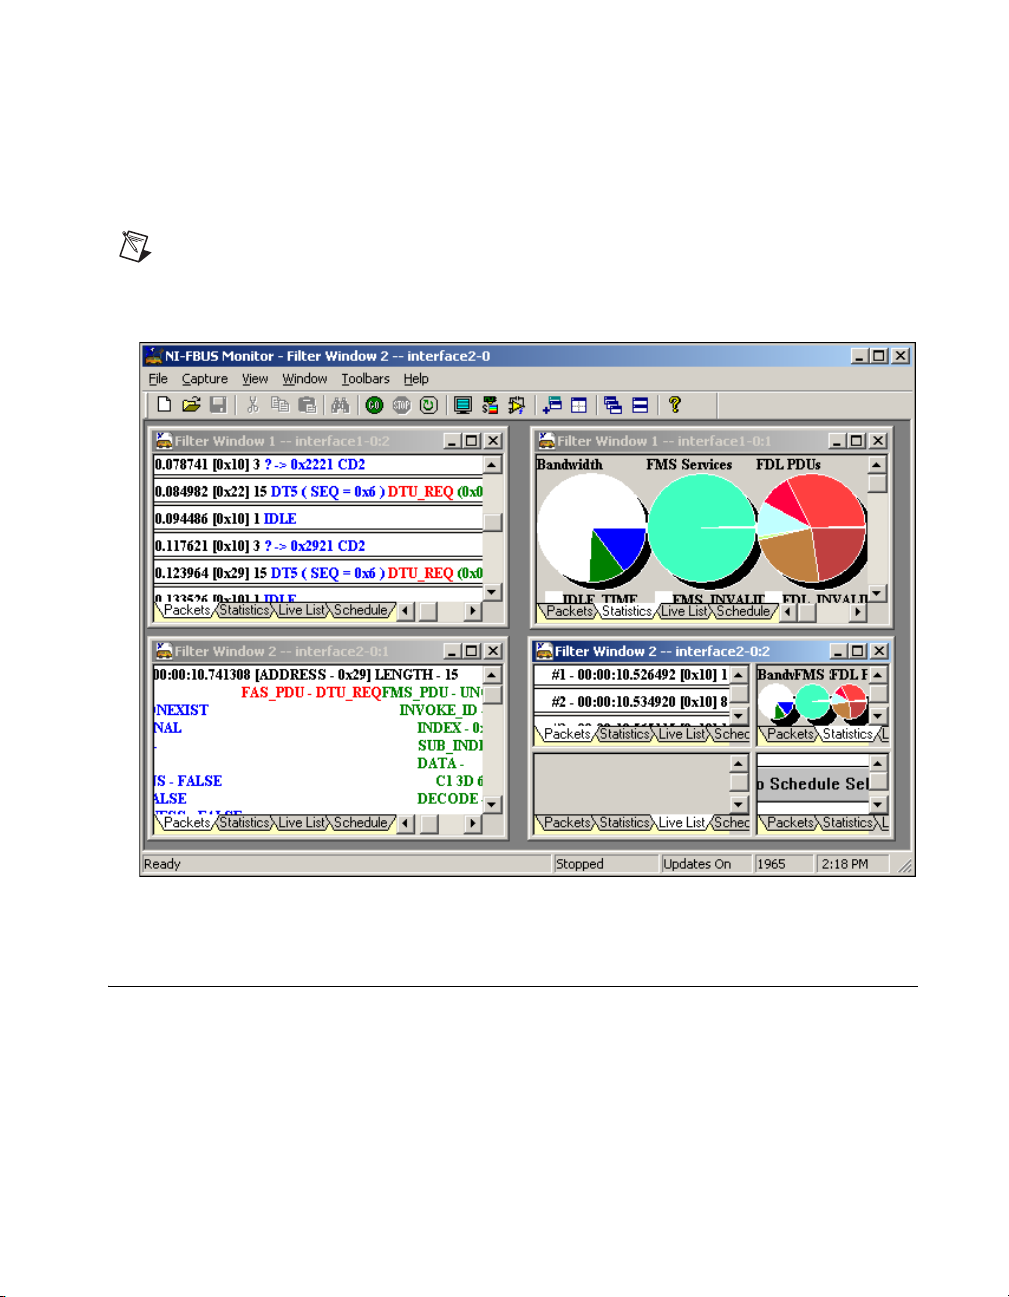
Viewing Data
Chapter 4 How To Use the NI-FBUS Monitor
You can view data in a filter window, and switch between tabs to view
all the information, or you can split the window and view all tabs
simultaneously.
To split the current Filter window into four panes, select Window»Split
Filter Window or click the Split Filter Window button on the standard
toolbar. The split window allows you to look at different parts of the capture
at the same time. Figure 4-2 shows an example Filter window screen split
into four panes that display the data for this filter.
Figure 4-2. Example Filter Window Session
In Figure 4-2, the upper left pane displays statistical information about the
packets on the bus, and the other three panes display the packets in the
simple, decode, and hex modes, respectively. The toolbar affects the
currently active view, so be sure to select a view by clicking in the view
area before selecting the toolbar options.
© National Instruments Corporation 4-3 NI-FBUS Monitor User Manual
Page 39

Chapter 4 How To Use the NI-FBUS Monitor
Improving Performance
This section contains hints for improving the performance of the NI-FBUS
Monitor on systems slower than the platform recommended mentioned in
the Recommended Minimum Platform section of Chapter 1, Introduction.
Conserve Memory
Close unnecessary applications, and set Max num of packets on the
Capture Settings tab to a low value (less than 500). To see the Capture
Settings tab, select Capture»Settings or click the Capture Settings
button on the standard toolbar.
Turn Live Updates Off
To prevent the NI-FBUS Monitor from updating its windows, deselect
Live Updates on the Capture menu. On a slow computer, it can take a
relatively long time (more than one second) to update the graphics in
windows. During this time, you can lose many data packets. Lost packets
are denoted by an asterisk (*) before the packet in the capture.
Filter Only for Needed Data
Pass Token (PT), Time Distribution (TD), Return Token (RT), Probe
Node (PN), Probe Response (PR), and Compel Data (CD) packets occur
frequently. You might not want to collect all of these, particularly the Probe
Node (PN) packets.
No Split Windows
In general, the fewer open windows the NI-FBUS Monitor has to update,
the faster the NI-FBUS Monitor performs.
NI-FBUS Monitor User Manual 4-4 ni.com
Page 40

Pinout Information
This appendix contains information about the pinout of the fieldbus
connectors.
One cable for either the PCMCIA-FBUS or AT-FBUS is included in your
kit. The following figures show the pinout of the fieldbus connectors so you
can make your own cable if you need a longer cable than the one in your kit.
Figure A-1 shows the fieldbus connector pinout for both the AT-FBUS and
PCMCIA-FBUS.
No Connection
No Connection
No Connection
No Connection
No Connection
A
Power –
Power +
789
Data –
6
1 2345
Data +
Figure A-1. Fieldbus Connector Pinout
The pinout of the fieldbus connector uses pins 6 and 7 of the J1 connector
for the fieldbus signals, as specified in the Fieldbus Standard for Use in
Industrial Control Systems, Part 2, ISA-S50.02.1992.
© National Instruments Corporation A-1 NI-FBUS Monitor User Manual
Page 41

Appendix A Pinout Information
Figure A-2 shows the PCMCIA-FBUS cable. An arrow on the cable points
to pin 1 of the screw terminal block.
PCMCIA-FBUS, PORT 1
V-
D-
SH
D+
J2
V+
J1
Figure A-2. PCMCIA-FBUS Cable
Figure A-3 shows J2, the screw terminal block pinout for the
PCMCIA-FBUS cable.
1
2
3
4
5
Power
Data
–
Shield
Data +
Power +
–
Figure A-3. Screw Terminal Block Pinout
All of the signals on the screw terminal block provide a direct connection
to the 9-pin DSUB. Pins 2 and 4 of the J2 screw terminal block provide an
alternate connection to the fieldbus. The screw terminal block is not a
second, independent link. National Instruments provides the Power+ and
Power– connections as passive connections from the DSUB to the screw
terminal. The PCMCIA-FBUS itself does not supply power to or draw
power from these pins.
NI-FBUS Monitor User Manual A-2 ni.com
Page 42

Technical Support and
Professional Services
Visit the following sections of the National Instruments Web site at
ni.com for technical support and professional services:
• Support—Online technical support resources at
include the following:
– Self-Help Resources—For immediate answers and solutions,
visit the award-winning National Instruments Web site for
software drivers and updates, a searchable KnowledgeBase,
product manuals, step-by-step troubleshooting wizards, thousands
of example programs, tutorials, application notes, instrument
drivers, and so on.
– Free Technical Support—All registered users receive free Basic
Service, which includes access to hundreds of Application
Engineers worldwide in the NI Developer Exchange at
ni.com/exchange. National Instruments Application Engineers
make sure every question receives an answer.
• Training and Certification—Visit
self-paced training, eLearning virtual classrooms, interactive CDs,
and Certification program information. You also can register for
instructor-led, hands-on courses at locations around the world.
• System Integration—If you have time constraints, limited in-house
technical resources, or other project challenges, NI Alliance Program
members can help. To learn more, call your local NI office or visit
ni.com/alliance.
• Declaration of Conformity (DoC)—A DoC is our claim of
compliance with the Council of the European Communities using
the manufacturer’s declaration of conformity. This system affords
the user protection for electronic compatibility (EMC) and product
safety. You can obtain the DoC for your product by visiting
ni.com/certification.
B
ni.com/support
ni.com/training for
© National Instruments Corporation B-1 NI-FBUS Monitor User Manual
Page 43

Appendix B Technical Support and Professional Services
If you searched ni.com and could not find the answers you need, contact
your local office or NI corporate headquarters. Phone numbers for our
worldwide offices are listed at the front of this manual. You also can visit
the Worldwide Offices section of
office Web sites, which provide up-to-date contact information, support
phone numbers, email addresses, and current events.
ni.com/niglobal to access the branch
NI-FBUS Monitor User Manual B-2 ni.com
Page 44

Glossary
Symbol Prefix Value
ppico10
nnano10
µ micro 10
m milli 10
k kilo 10
Mmega10
Ggiga10
Ttera10
A
alive Active and functioning on the fieldbus.
–12
–9
–6
–3
3
6
9
12
ASCII American Standard Code for Information Interchange.
asynchronous Communication that occurs at times which are not predetermined.
AT-compatible Compatible with the 16-bit Industry Standard Architecture.
B
BBytes
bandwidth The capacity of a bus to transmit data.
binary format A file format composed of ones and zeroes for computer use.
bus A pathway for data between devices.
bus noise Imperfections in data transfer caused by cable length or interference from
external factors.
© National Instruments Corporation G-1 NI-FBUS Monitor User Manual
Page 45

Glossary
C
capture document An NI-FBUS monitor document in memory that contains all the settings
and data of your capture.
CD Compel Data.
channel A pin or wire lead to which you apply or from which you read the analog
or digital signal.
checksum A method used to ensure that data is transmitted correctly.
Communication Stack The hierarchy of layers in a layered communications model that performs
the services required to interface the User Application to the Physical Layer
of the fieldbus.
CPU Central processing unit.
D
data packet A unit of data of a certain size.
dead Inactive or not functioning on the fieldbus.
DMA Direct Memory Access.
DRAM Dynamic Random Access Memory. Memory that requires electricity and
refreshing to hold data.
F
FAS See Fieldbus Access Sublayer.
FDL See Fieldbus Data Link layer.
fieldbus An all-digital, two-way communication system that connects control
systems to instrumentation.
Fieldbus Access
Sublayer
fieldbus address Location of a board or device on the fieldbus; the fieldbus node address.
NI-FBUS Monitor User Manual G-2 ni.com
The layer of the communication stack that provides an interface between
the DLL and layer 7 of the OSI model. The FAS provides communication
services such as client/server, publisher/subscriber, and event distribution.
Page 46

Glossary
Fieldbus Data Link
layer
Fieldbus Messaging
Specification layer
filter A software screening device you configure to make the NI-FBUS Monitor
Filter window A window inside the main window of the NI-FBUS Monitor that shows
FMS See Fieldbus Messaging Specification layer.
The second lowest layer of the fieldbus communications stack.
The layer of the communication stack that defines a model for applications
to interact over the fieldbus. The services FMS provides allow you to
read and write information about the OD, read and write the data
variables described in the OD, and perform other activities such as
uploading/downloading data, and invoking programs inside a device.
capture only certain types of data that move across the fieldbus.
captured data with selected data filtered out.
H
hex Hexadecimal.
Hz Hertz.
I
I/O Input/output.
IRQ Interrupt request.
ISA Industry Standard Architecture..
L
layer See Communication Stack.
M
MDI See Multiple Document Interface.
Multiple Document
Interface
© National Instruments Corporation G-3 NI-FBUS Monitor User Manual
A software interface that contains many smaller windows open
concurrently that display data from different sources.
Page 47

Glossary
P
PC Personal Computer.
PDU Protocol Data Unit.
PN Probe Node.
PR Probe Response.
processor The central controlling and computing part of a computer.
protocol error An error in data transfer that has to do with the way the data is sent.
PT Pass Token.
R
RAM Random Access Memory.
RT Re turn Token.
T
TD Time Distribution.
NI-FBUS Monitor User Manual G-4 ni.com
Page 48

Index
C
capture document, 3-2
relationship to window (figure), 3-3
capture menu
filter settings, 3-7
find data, 3-7
finding data, 4-2
hexadecimal data, 3-7
high priority updates, 3-7
live updates, 3-7
reset capture, 3-7
saving data, 4-2
scrolling live updates, 3-7
settings, 3-7
smooth live updates, 3-7
start capture, 3-7
starting capture, 4-1
stop capture, 3-7
stopping capture, 4-2
verbose data, 3-7
viewing data, 4-3
capture settings tab
layout (figure), 3-20
options, 3-20
overview, 3-19
configuration
interface port, 2-2
NI-FBUS driver in NT, 2-2
NI-FBUS software, 2-2
conventions used in the manual, ix
D
Declaration of Conformity (NI resources), B-1
diagnostic tools (NI resources), B-1
display settings tab
layout (figure), 3-21
overview, 3-21
documentation
conventions used in manual, ix
NI resources, B-1
related documentation, x
drivers (NI resources), B-1
E
examples (NI resources), B-1
F
FBUS connector pinout, A-1
FDL filter tab
layout (figure), 3-17
overview, 3-17
fieldbus data link layer (FDL), 1-1
fieldbus messaging specification layer
(FMS), 1-1
file menu options, 3-6
filter by address tab
layout (figure), 3-19
overview, 3-19
filter dialog box
description, 3-1
FDL tab, overview, 3-17
filter by address tab, overview, 3-19
FMS tab, overview, 3-18
functional overview, 3-15
options, 3-1
overview, 3-16
© National Instruments Corporation I-1 NI-FBUS Monitor User Manual
Page 49

Index
filter window
description, 3-1
functional overview, 3-9
layout (figure), 3-9
live list view, 3-15
packet view, 3-10
packet display formats, 3-10
schedule view, 3-15
statistics view, 3-13
layout (figure), 3-14
filters
basic logic, 3-16
filter dialog box, 3-16
filter operation after capture, 3-15
filter operation during capture, 3-15
overview, 3-15
FMS filter tab
layout (figure), 3-18
overview, 3-18
H
help, technical support, B-1
help menu, 3-9
I
installation
NI-FBUS hardware, 2-1
NI-FBUS software, 2-1
NI-FBUS software re-installation
(caution), 2-1
instrument drivers (NI resources), B-1
interface configuration utility, 2-2
interface port, 2-2
interface port configuration, 2-2
K
KnowledgeBase, B-1
M
main menu bar
capture menu, 3-7
file menu, 3-6
help menu, 3-9
overview, 3-6
packet menu, 3-8
statistics menu, 3-8
toolbar menu, 3-8
view menu, 3-8
window menu, 3-8
main window
description, 3-1
functional overview, 3-3
layout (figure), 3-4
menus and standard toolbar, 3-4
monitor interface overview, 3-2
multiple document interface (MDI), 1-1
N
National Instruments support and
services, B-1
nifb kernel-mode driver, instructions for
NT only, 2-2
NI-FBUS monitor
description, 1-1
filter dialog box, 3-1
filter window, 3-1
hardware installation, 2-1
improving performance, 4-4
interface configuration utility, 2-2
interface port configuration, 2-2
list of utility windows, 3-1
main window, 3-1
minimum platform recommended, 1-1
packet view toolbar, 3-2
procedural overview, 3-2
settings dialog box, 3-1
software installation, 2-1
NI-FBUS Monitor User Manual I-2 ni.com
Page 50

Index
software re-installation (caution), 2-1
standard toolbar, 3-2
start driver in NT, 2-2
starting the monitor, 4-1
statistics view toolbar, 3-2
window overview, 1-1
P
packet display formats
decode, 3-11
hex, 3-11
simple, 3-11
packet menu options, 3-8
packet view, filter window and data
(figure), 3-10
packet view toolbar
checkboxes, 3-12
FAS/SM button, 3-12
FDL button, 3-12
FMS button, 3-12
hex button, 3-12
LAS/TM button, 3-12
time button, 3-12
verbose button, 3-12
description, 3-2
drop-down list options, 3-13
functional overview, 3-11
graphic buttons
horizontal packets button, 3-12
vertical packets button, 3-12
layout (figure), 3-11
radio buttons, 3-12
decode button, 3-12
hex button, 3-12
simple button, 3-12
PCMCIA-FBUS cable, A-2
pinout information, A-1
programming examples (NI resources), B-1
R
related documentation, x
S
screw terminal block pinout, A-2
settings dialog box
capture settings tab, 3-19
description, 3-1
display settings tab, 3-21
functional overview, 3-19
options, 3-1
overview, 3-19
toolbar settings tab, 3-22
single filter, 3-2
software (NI resources), B-1
split filter window
button, 4-3
capture menu, 4-3
example view (figure), 4-3
standard toolbar
add filter window button, 3-6
button functions, 3-5
capture settings button, 3-5
cascade window button, 3-6
copy button, 3-5
cut button, 3-5
description, 3-2
filter settings button, 3-6
find data button, 3-5
find data dialog box (figure), 4-2
help button, 3-6
layout (figure), 3-5
live updates off button, 3-5
new capture button, 3-5
open capture button, 3-5
paste button, 3-5
reset capture button, 3-5
© National Instruments Corporation I-3 NI-FBUS Monitor User Manual
Page 51

Index
save capture button, 3-5
split filter window button, 3-6, 4-3
start capture button, 3-5
stop capture button, 3-5
tile window button, 3-6
statistics menu
live list view, 3-8
options, 3-8
statistics view toolbar
checkboxes
bandwidth, 3-15
FDL, 3-15
FMS, 3-15
verbose, 3-15
description, 3-2
functional overview, 3-14
layout (figure), 3-14
support, technical, B-1
T
technical support, B-1
toolbar menu
packet, 3-8
standard, 3-8
statistics, 3-9
status bar, 3-9
toolbar menu options, 3-8
toolbar settings tab
layout (figure), 3-22
overview, 3-22
training and certification (NI resources), B-1
troubleshooting (NI resources), B-1
V
view menu options, 3-8
W
Web resources, B-1
window menu
add filter window, 3-8
arrange icons, 3-8
cascade, 3-8
options, 3-8
split filter window, 3-8, 4-3
tile, 3-8
window list, 3-8
NI-FBUS Monitor User Manual I-4 ni.com
 Loading...