

Page 1

Measurement StudioTM
Measurement Computing
User Manual
Measurement Studio for MCC User Manual
TM
Edition
March 2006
374318A-01
Page 2

Worldwide Technical Support and Product Information
ni.com
National Instruments Corporate Headquarters
11500 North Mopac Expressway Austin, Texas 78759-3504 USA Tel: 512 683 0100
Worldwide Offices
Australia 1800 300 800, Austria 43 0 662 45 79 90 0, Belgium 32 0 2 757 00 20, Brazil 55 11 3262 3599,
Canada 800 433 3488, China 86 21 6555 7838, Czech Republic 420 224 235 774, Denmark 45 45 76 26 00,
Finland 385 0 9 725 725 11, France 33 0 1 48 14 24 24, Germany 49 0 89 741 31 30, India 91 80 41190000,
Israel 972 0 3 6393737, Italy 39 02 413091, Japan 81 3 5472 2970, Korea 82 02 3451 3400,
Lebanon 961 0 1 33 28 28, Malaysia 1800 887710, Mexico 01 800 010 0793, Netherlands 31 0 348 433 466,
New Zealand 0800 553 322, Norway 47 0 66 90 76 60, Poland 48 22 3390150, Portugal 351 210 311 210,
Russia 7 095 783 68 51, Singapore 1800 226 5886, Slovenia 386 3 425 4200, South Africa 27 0 11 805 8197,
Spain 34 91 640 0085, Sweden 46 0 8 587 895 00, Switzerland 41 56 200 51 51, Taiwan 886 02 2377 2222,
Thailand 662 278 6777, United Kingdom 44 0 1635 523545
For further support information, refer to the Contacting Measurement Computing Corp. appendix. To comment
on National Instruments documentation, refer to the National Instruments Web site at
the info code
feedback.
ni.com/info and enter
© 2006 National Instruments Corporation. All rights reserved.
Page 3

Important Information
Warranty
The media on which you receive National Instruments software are warranted not to fail to execute programming instructions, due to defects
in materials and workmanship, for a period of 90 days from date of shipment, as evidenced by receipts or other documentation. National
Instruments will, at its option, repair or replace software media that do not execute programming instructions if National Instruments receives
notice of such defects during the warranty period. National Instruments does not warrant that the operation of the software shall be
uninterrupted or error free.
A Return Material Authorization (RMA) number must be obtained from the factory and clearly marked on the outside of the package before any
equipment will be accepted for warranty work. National Instruments will pay the shipping costs of returning to the owner parts which are covered by
warranty.
National Instruments believes that the information in this document is accurate. The document has been carefully reviewed for technical accuracy. In
the event that technical or typographical errors exist, National Instruments reserves the right to make changes to subsequent editions of this document
without prior notice to holders of this edition. The reader should consult National Instruments if errors are suspected. In no event shall National
Instruments be liable for any damages arising out of or related to this document or the information contained in it.
E
XCEPT AS SPECIFIED HEREIN, NATIONAL INSTRUMENTS MAKES NO WARRANTIES, EXPRESS OR IMPLIED, AND SPECIFICALLY DISCLAIMS ANY WARRANTY OF
MERCHANTABILITY OR FITNESS FOR A PARTICULAR PURPOSE. CUSTOMER’S RIGHT TO RECOVER DAMAGES CAUSED BY FAULT OR NEGLIGENCE ON THE PART OF NATIONAL
I
NSTRUMENTS SHALL BE LIMITED TO THE AMOUNT THERETOFORE PAID BY THE CUSTOMER. NATIONAL INSTRUMENTS WILL NOT BE LIABLE FOR DAMAGES RESULTING
FROM LOSS OF DATA, PROFITS, USE OF PRODUCTS, OR INCIDENTAL OR CONSEQUENTIAL DAMAGES, EVEN IF ADVISED OF THE POSSIBILITY THEREOF. This limitation of
the liability of National Instruments will apply regardless of the form of action, whether in contract or tort, including negligence. Any action against
National Instruments must be brought within one year after the cause of action accrues. National Instruments shall not be liable for any delay in
performance due to causes beyond its reasonable control. The warranty provided herein does not cover damages, defects, malfunctions, or service
failures caused by owner’s failure to follow the National Instruments installation, operation, or maintenance instructions; owner’s modification of the
product; owner’s abuse, misuse, or negligent acts; and power failure or surges, fire, flood, accident, actions of third parties, or other events outside
reasonable control.
Copyright
Under the copyright laws, this publication may not be reproduced or transmitted in any form, electronic or mechanical, including photocopying,
recording, storing in an information retrieval system, or translating, in whole or in part, without the prior written consent of National
Instruments Corporation.
National Instruments respects the intellectual property of others, and we ask our users to do the same. NI software is protected by copyright and other
intellectual property laws. Where NI software may be used to reproduce software or other materials belonging to others, you may use NI software only
to reproduce materials that you may reproduce in accordance with the terms of any applicable license or other legal restriction.
Trademarks
National Instruments, NI, ni.com, and LabVIEW are trademarks of National Instruments Corporation. Refer to the Terms of Use section
on ni.com/legal for more information about National Instruments trademarks.
Universal Library and Measurement Computing are trademarks of Measurement Computing Corporation. Other product and company names
mentioned herein are trademarks or trade names of their respective companies.
Patents
For patents covering National Instruments products, refer to the appropriate location: Help»Patents in your software, the patents.txt file
on your CD, or ni.com/patents.
WARNING REGARDING USE OF NATIONAL INSTRUMENTS PRODUCTS
(1) NATIONAL INSTRUMENTS PRODUCTS ARE NOT DESIGNED WITH COMPONENTS AND TESTING FOR A LEVEL OF
RELIABILITY SUITABLE FOR USE IN OR IN CONNECTION WITH SURGICAL IMPLANTS OR AS CRITICAL COMPONENTS IN
ANY LIFE SUPPORT SYSTEMS WHOSE FAILURE TO PERFORM CAN REASONABLY BE EXPECTED TO CAUSE SIGNIFICANT
INJURY TO A HUMAN.
(2) IN ANY APPLICATION, INCLUDING THE ABOVE, RELIABILITY OF OPERATION OF THE SOFTWARE PRODUCTS CAN BE
IMPAIRED BY ADVERSE FACTORS, INCLUDING BUT NOT LIMITED TO FLUCTUATIONS IN ELECTRICAL POWER SUPPLY,
COMPUTER HARDWARE MALFUNCTIONS, COMPUTER OPERATING SYSTEM SOFTWARE FITNESS, FITNESS OF COMPILERS
AND DEVELOPMENT SOFTWARE USED TO DEVELOP AN APPLICATION, INSTALLATION ERRORS, SOFTWARE AND HARDWARE
COMPATIBILITY PROBLEMS, MALFUNCTIONS OR FAILURES OF ELECTRONIC MONITORING OR CONTROL DEVICES,
TRANSIENT FAILURES OF ELECTRONIC SYSTEMS (HARDWARE AND/OR SOFTWARE), UNANTICIPATED USES OR MISUSES, OR
ERRORS ON THE PART OF THE USER OR APPLICATIONS DESIGNER (ADVERSE FACTORS SUCH AS THESE ARE HEREAFTER
COLLECTIVELY TERMED “SYSTEM FAILURES”). ANY APPLICATION WHERE A SYSTEM FAILURE WOULD CREATE A RISK OF
HARM TO PROPERTY OR PERSONS (INCLUDING THE RISK OF BODILY INJURY AND DEATH) SHOULD NOT BE RELIANT SOLELY
UPON ONE FORM OF ELECTRONIC SYSTEM DUE TO THE RISK OF SYSTEM FAILURE. TO AVOID DAMAGE, INJURY, OR DEATH,
THE USER OR APPLICATION DESIGNER MUST TAKE REASONABLY PRUDENT STEPS TO PROTECT AGAINST SYSTEM FAILURES,
INCLUDING BUT NOT LIMITED TO BACK-UP OR SHUT DOWN MECHANISMS. BECAUSE EACH END-USER SYSTEM IS
CUSTOMIZED AND DIFFERS FROM NATIONAL INSTRUMENTS' TESTING PLATFORMS AND BECAUSE A USER OR APPLICATION
DESIGNER MAY USE NATIONAL INSTRUMENTS PRODUCTS IN COMBINATION WITH OTHER PRODUCTS IN A MANNER NOT
EVALUATED OR CONTEMPLATED BY NATIONAL INSTRUMENTS, THE USER OR APPLICATION DESIGNER IS ULTIMATELY
RESPONSIBLE FOR VERIFYING AND VALIDATING THE SUITABILITY OF NATIONAL INSTRUMENTS PRODUCTS WHENEVER
NATIONAL INSTRUMENTS PRODUCTS ARE INCORPORATED IN A SYSTEM OR APPLICATION, INCLUDING, WITHOUT
LIMITATION, THE APPROPRIATE DESIGN, PROCESS AND SAFETY LEVEL OF SUCH SYSTEM OR APPLICATION.
Page 4

WARNING REGARDING USE OF MEASUREMENT COMPUTING CORPORATION PRODUCTS
MEASUREMENT COMPUTING CORPORATION DOES NOT AUTHORIZE ANY MEASUREMENT COMPUTING CORPORATION
PRODUCT FOR USE IN LIFE SUPPORT SYSTEMS AND/OR DEVICES WITHOUT WRITTEN APPROVAL OF THE CEO OF
MEASUREMENT COMPUTING CORPORATION. LIFE SUPPORT DEVICES/SYSTEMS ARE DEVICES OR SYSTEMS WHICH,
A)ARE INTENDED FOR SURGICAL IMPLANTATION INTO THE BODY, OR B)SUPPORT OR SUSTAIN LIFE AND WHOSE
FAILURE TO PERFORM CAN BE REASONABLY EXPECTED TO RESULT IN INJURY. MEASUREMENT COMPUTING
CORPORATION PRODUCTS ARE NOT DESIGNED WITH THE COMPONENTS REQUIRED, AND ARE NOT SUBJECT TO THE
TESTING REQUIRED TO ENSURE A LEVEL OF RELIABILITY SUITABLE FOR THE TREATMENT AND DIAGNOSIS OF PEOPLE.
Page 5

Contents
About This Manual
How To Use this Manual ...............................................................................................ix
Conventions ...................................................................................................................x
Chapter 1
Introduction to Measurement Studio Measurement Computing Edition
Installation Requirements ..............................................................................................1-1
Deployment Requirements ............................................................................................1-2
Installing Measurement Studio ......................................................................................1-2
Measurement Studio Features........................................................................................1-4
Measurement Studio Resources.....................................................................................1-4
Chapter 2
Measurement Studio Measurement Computing Edition .NET Class
Libraries
Measurement Studio Support for Visual Studio .NET 2003
Class Library Overview ..............................................................................................2-1
Analysis .........................................................................................................................2-2
Measurements..................................................................................................2-2
Signal Generation ............................................................................................2-2
Windowing ......................................................................................................2-3
Filters...............................................................................................................2-3
Signal Processing.............................................................................................2-4
Linear Algebra.................................................................................................2-4
Array and Numeric Operations .......................................................................2-5
Curve Fitting....................................................................................................2-5
Statistics...........................................................................................................2-6
Common.........................................................................................................................2-6
MCC-488.2 ....................................................................................................................2-7
Universal Library...........................................................................................................2-7
MccDaq Scan Components............................................................................................2-7
User Interface.................................................................................................................2-8
Windows Forms Controls ..............................................................................................2-9
Waveform Graph and Scatter Graph Controls ................................................2-10
Digital Waveform Graph Control....................................................................2-12
Complex Graph Control ..................................................................................2-13
Legend Control................................................................................................2-15
Numeric Controls ............................................................................................2-15
© National Instruments Corporation v Measurement Studio for MCC User Manual
Page 6

Contents
Numeric Edit Control...................................................................................... 2-17
Switch and LED Controls ...............................................................................2-18
Property Editor Control................................................................................... 2-19
Measurement Studio Support for Visual Studio 2005 Class Library Overview ........... 2-20
Windows Forms Array Controls ................................................................................... 2-20
Switch and LED Array Controls ..................................................................... 2-21
Numeric Edit Array Control ........................................................................... 2-22
ASP.NET Web Forms Controls .................................................................................... 2-23
Waveform Graph and Scatter Graph Controls................................................ 2-24
Digital Waveform Graph Control ................................................................... 2-26
Complex Graph Control.................................................................................. 2-28
Legend Control ............................................................................................... 2-29
Numeric Controls............................................................................................ 2-29
Numeric Edit Control...................................................................................... 2-32
Switch and LED Controls ...............................................................................2-33
AutoRefresh Control ....................................................................................... 2-33
Chapter 3
Measurement Studio Integrated Tools and Features
Measurement Studio Menu............................................................................................ 3-1
Creating a Measurement Studio Project........................................................................ 3-2
Adding or Removing Measurement Studio Class Libraries.......................................... 3-3
Chapter 4
Getting Started with Measurement Studio
Measurement Studio Walkthroughs for Visual Studio .NET 2003............................... 4-1
Walkthrough: Creating a Measurement Studio Application with
Windows Forms Controls and Analysis in Visual Studio .NET 2003 ....................... 4-2
Walkthrough: Creating a Measurement Studio Measurement
Computing DAQ Application in Visual Studio .NET 2003 ....................................... 4-10
Walkthrough: Creating a Measurement Studio MCCDaq Scan
Components Application in Visual Studio .NET 2003 .............................................. 4-16
Walkthrough: Creating a Measurement Studio MCC-488.2
Application in Visual Studio .NET 2003.................................................................... 4-23
Measurement Studio Walkthroughs for Visual Studio 2005......................................... 4-28
Walkthrough: Creating a Measurement Studio Application with
Windows Forms Controls and Analysis in Visual Studio 2005 ................................. 4-29
Walkthrough: Creating a Measurement Studio Application with
Web Forms Controls and Analysis in Visual Studio 2005......................................... 4-39
Measurement Studio for MCC User Manual vi ni.com
Page 7

Appendix A
Contacting Measurement Computing Corp.
Glossary
Index
Contents
© National Instruments Corporation vii Measurement Studio for MCC User Manual
Page 8

About This Manual
The Measurement Studio Measurement Computing Edition User Manual
introduces the concepts associated with the Measurement Studio class
libraries and development tools. This manual assumes that you have a
general working knowledge of Microsoft Visual Studio, including .NET
Windows and ASP.NET.
How To Use this Manual
Measurement Studio 8.0.1 includes one CD with support for both Visual
Studio .NET 2003 and Visual Studio 2005. This manual documents the
Measurement Studio for Visual Studio 2003/2005 CD. The Measurement
Studio support for Visual Studio .NET 2003 and Visual Studio 2005 CD
includes separate, parallel sets of class libraries, integration features, and
support documentation for developing with Visual Studio .NET 2003 and
Visual Studio 2005.
The Measurement Studio Measurement Computing Edition User Manual is
organized into four chapters. Chapter 1, Introduction to Measurement
Studio Measurement Computing Edition, is an overview of Measurement
Studio Measurement Computing Edition. This chapter includes installation
and deployment requirements, installation instructions, and a list of
Measurement Studio resources. Chapter 2, Measurement Studio
Measurement Computing Edition .NET Class Libraries, includes
information about the .NET class libraries. Chapter 3, Measurement Studio
Integrated Tools and Features, includes information on using
Measurement Studio Measurement Computing Edition tools and features
integrated into the Visual Studio environment. Chapter 4, Getting Started
with Measurement Studio, includes walkthroughs that guide you through
step-by-step instructions on how to develop with Measurement Studio
features.
Use this manual as a starting point to learn about Measurement Studio.
Refer to the NI Measurement Studio Help within the Visual Studio
environment for function reference and detailed information about the
Measurement Studio class libraries, wizards, assistants, and other features.
© National Instruments Corporation ix Measurement Studio for MCC User Manual
Page 9
About This Manual
Conventions
The following conventions appear in this manual:
<> Text enclosed in angle brackets represents directory names and parts of
paths that may vary on different computers, such as <
» The » symbol leads you through nested menu items and dialog box options
to a final action. The sequence File»Page Setup»Options directs you to
pull down the File menu, select the Page Setup item, and select Options
from the last dialog box.
This icon denotes a tip, which alerts you to advisory information.
This icon denotes a note, which alerts you to important information.
bold Bold text denotes items that you must select or click on in the software,
such as menu items and dialog box options. Bold text also denotes class
library member names or emphasis.
italic Italic text denotes parameters, variables, cross-references, or an
introduction to a key concept. Italic text also denotes text that is a
placeholder for a word or value that you must supply.
Windows\System>.
monospace Text in this font denotes text or characters that you enter from the keyboard,
sections of code, programming examples, and syntax examples. This font
also is used for the proper names of disk drives, paths, directories,
programs, device names, filenames and extensions, and code excerpts.
Measurement Studio for MCC User Manual x ni.com
Page 10

Introduction to Measurement
Studio Measurement Computing
Edition
Measurement Studio Measurement Computing Edition is an integrated
suite of tools and class libraries that are designed for developers using .NET
Windows and ASP.NET to develop measurement and automation
applications.
Measurement Studio Measurement Computing Edition dramatically
reduces application development time through object-oriented
measurement hardware interfaces, advanced analysis libraries, scientific
user interface controls for Windows and Web applications, wizards,
interactive code designers, and highly extensible .NET classes. You can use
Measurement Studio Measurement Computing Edition to develop a
complete measurement and automation application that includes data
acquisition, analysis, and presentation functionalities.
1
The Measurement Studio Measurement Computing Edition package
includes two CDs—one with Measurement Studio 8.0.1 and the other with
Measurement Computing device drivers. This manual documents the
Measurement Studio Measurement Computing Edition CD, which includes
separate, parallel sets of Measurement Studio class libraries and support
documentation for developing with Visual Studio .NET 2003 and Visual
Studio 2005.
Installation Requirements
To install Measurement Studio, your computer must have the following:
• Microsoft Windows 2000/XP
• Microsoft .NET Framework 1.1 for Visual Studio .NET 2003 or
Microsoft .NET Framework 2.0 for Visual Studio 2005
• Standard, Professional, Enterprise Developer, Enterprise Architect, or
Academic edition of Microsoft Visual Studio .NET 2003 and
Microsoft Visual Studio 2005 (required to use the Measurement Studio
© National Instruments Corporation 1-1 Measurement Studio for MCC User Manual
Page 11
Chapter 1 Introduction to Measurement Studio Measurement Computing Edition
integrated tools) or Visual C#, Visual Basic, or Visual C++ Express
Editions of Microsoft Visual Studio 2005
Measurement Studio integration tools are not supported in the Visual
Studio 2005 Express Editions.
• Intel Pentium II class processor, 733 MHz or higher
• Video display—800 × 600, 256 colors (16-bit color recommended for
user interface controls)
• Minimum of 256 MB of RAM (512 MB or higher recommended)
• Minimum of 405 MB of free hard disk space for Visual Studio .NET
2003 support and minimum of 385 MB of free hard disk space for
Visual Studio 2005 support
• Microsoft-compatible mouse
• Microsoft Internet Explorer 6.0 or later
Optional Installation—In order for links from Measurement Studio help
topics to .NET Framework help topics to work, you must install the
Microsoft .NET Framework SDK 1.1 for Visual Studio .NET 2003 or
Microsoft .NET Framework SDK 2.0 for Visual Studio 2005.
Deployment Requirements
To deploy an application built with Measurement Studio .NET class
libraries, the target computer must have a Windows 2000/XP operating
system and the .NET Framework version 1.1 for Visual Studio .NET 2003
or the .NET Framework version 2.0 for Visual Studio 2005.
Installing Measurement Studio
Complete the following steps to install Measurement Studio. These steps
describe a typical installation. Please carefully review all additional
licensing and warning dialog boxes.
Note There are separate installers for Measurement Studio support for Visual Studio
.NET 2003 and Measurement Studio support for Visual Studio 2005. Repeat the
installation instructions to install support for both.
1. Insert the Measurement Studio CD into the CD drive.
automatically starts. If it does not automatically start, double-click the
autorun.exe icon.
Measurement Studio for MCC User Manual 1-2 ni.com
autorun.exe
Page 12
Chapter 1 Introduction to Measurement Studio Measurement Computing Edition
2. Click Install NI Measurement Studio for Visual Studio .NET 2003
or click Install NI Measurement Studio for Visual Studio 2005.
3. Click Next to install all NI software to the default installation
directory, or click Browse to select a different installation directory.
You must install Measurement Studio to a local drive. Click Next.
Note The option to browse for an installation location is valid only if you have not already
installed any Measurement Studio features. If you have any Measurement Studio features
installed, then Measurement Studio installs to the same root directory to which you
installed other Measurement Studio features.
4. From the feature tree, select the features you want to install. To change
the Measurement Studio installation directory, select the first feature in
the list and click Browse. Click Next.
5. Review the license agreement and select I accept the License
Agreement(s). Click Next.
6. In the Installation Summary dialog box, review the features you
selected. Click Next.
Note Step 8 starts the installation of Measurement Studio. Be aware that when the installer
indicates that it is removing backup files, this is a normal operation. The installer may take
several minutes to complete this step.
7. If prompted, insert the Device Drivers CD and select Rescan Drive.
If not prompted, go to step 13 on this list.
8. From the feature tree, select the Device Drivers components you want
to install. To change a driver installation directory, select the driver and
click Browse. Click Next.
9. In the Product Information dialog box, carefully review important
information about the features you are installing. Click Next.
10. If there is a license agreement associated with the driver software,
review the license agreement and select I accept the License
Agreement(s). Click Next.
11. In the Installation Summary dialog box, review the features you
selected. Click Next.
12. Click Next to complete the installation.
13. If prompted, click the appropriate restart option. If you did not install
a component that requires a restart, you will not be prompted to restart.
© National Instruments Corporation 1-3 Measurement Studio for MCC User Manual
Page 13
Chapter 1 Introduction to Measurement Studio Measurement Computing Edition
Measurement Studio Features
The following list contains features included in Measurement Studio. Refer
to
mccdaq.com/mstudio for more information about the features and
functionality included in Measurement Studio.
• Windows Forms user interface controls
• Web Forms user interface controls
• Analysis class library
• Universal Library class library
• MccDaq Scan Components class library
• GPIB class library
Measurement Studio Resources
As you work with Measurement Studio, you might need to consult other
resources. For detailed Measurement Studio help, including function
reference and in-depth documentation on developing with Measurement
Studio, refer to the NI Measurement Studio Help within the Visual Studio
environment. The NI Measurement Studio Help is fully integrated with the
Visual Studio help. You must have Visual Studio installed to view the
online help, and you must have the Microsoft .NET Framework SDK 1.1
for Visual Studio .NET 2003 or the Microsoft .NET Framework SDK 2.0
for Visual Studio 2005 installed in order for links from Measurement
Studio help topics to .NET Framework help topics to work. You can launch
the NI Measurement Studio Help in the following ways:
• From the Windows Start menu, select Start»All Programs»
National Instruments»<Measurement Studio>»Measurement
Studio Documentation. The help launches in a stand-alone help
viewer.
• From Visual Studio, select Help»Contents to view the Visual Studio
table of contents. The NI Measurement Studio Help is listed in the table
of contents.
• From Visual Studio, select Measurement Studio»NI Measurement
Studio Help. The help launches within the application.
Tip As you work through this manual, you will see italicized references to relevant help
topics. To find these topics, use the table of contents in the NI Measurement Studio Help.
Measurement Studio for MCC User Manual 1-4 ni.com
Page 14

Chapter 1 Introduction to Measurement Studio Measurement Computing Edition
The following resources also are available to provide you with information
about Measurement Studio.
• Examples—Measurement Studio installs examples to the following
paths:
– Visual Basic .NET or Visual C#—
Instruments\<MeasurementStudio>\DotNET\Examples
Program Files\National
• Measurement Computing Technical Support—Refer to Appendix A,
Contacting Measurement Computing Corp., for more information.
• Measurement Studio Measurement Computing Edition Web site,
mccdaq.com/mstudio—Contains Measurement Studio news,
support, and downloads.
• NI Developer Zone,
zone.ni.com—Provides access to online
example programs, tutorials, technical news, and a Discussion Forum
where you can participate in Measurement Studio discussion forums
for Visual Basic 6.0, Visual C++, and .NET languages.
© National Instruments Corporation 1-5 Measurement Studio for MCC User Manual
Page 15

2
Measurement Studio
Measurement Computing
Edition .NET Class Libraries
This chapter provides overview information about the .NET class libraries
included with Measurement Studio Measurement Computing Edition
support for Visual Studio .NET 2003 and Visual Studio 2005. Refer to the
Using the Measurement Studio .NET Class Libraries section of the
NI Measurement Studio Help for detailed information about these libraries.
Refer to Chapter 4, Getting Started with Measurement Studio, for
step-by-step instructions on developing applications with these libraries.
Measurement Studio Support for Visual Studio .NET 2003 Class Library Overview
• Analysis
• Common
• MCC-488.2
• Universal Library
• MccDaq Scan Components
• User Interface
Refer to the following sections for information about each Measurement
Studio .NET class library.
© National Instruments Corporation 2-1 Measurement Studio for MCC User Manual
Page 16

Chapter 2 Measurement Studio Measurement Computing Edition .NET Class Libraries
Analysis
The Measurement Studio Analysis .NET class library is in the
NationalInstruments.Analysis namespace. The Analysis class
library includes a set of classes that provides various digital signal
processing, signal filtering, signal generation, peak detection, and other
general mathematical functionality. Use this library to analyze acquired
data or to generate data.
The Analysis class library includes the following functionality:
• Sawtooth, sine, square, triangle, and basic function wave generators.
• Bessel, Chebyshev, Inverse Chebyshev, Windowed, Kaiser, and
Elliptic Low, High, Bandpass, and Bandstop filters
• Signal processing functions such as convolution, deconvolution,
correlation, decimation, integration, and differentiation
• FFT, Inverse FFT, Real FFT, Fast Hartley, Inverse Fast Hartley, Fast
Hilbert, Inverse Fast Hilbert, DST, Inverse DST, DCT, and Inverse
DCT transformations
• Linear algebra functions such as determinant, check positive
definiteness, calculate dot product, and other various matrix functions
• Scaled and unscaled windowing classes
• Common statistical functions such as mean, median, mode, and
variance
• Exponential, linear, and polynomial curve fitting functions
• Signal generation functions
Refer to the following lists to determine the type of measurements available
in the Analysis .NET libraries.
Measurements
• Impulse Response Function
• Network Functions (avg)
Signal Generation
• Arbitrary Wave
• Chirp Pattern
• Gaussian White Noise
• Sine Pattern
Measurement Studio for MCC User Manual 2-2 ni.com
Page 17

Windowing
Chapter 2 Measurement Studio Measurement Computing Edition .NET Class Libraries
•Sine Wave
•Square Wave
• Triangle Wave
• Uniform White Noise
• Blackman Window
• Blackman-Harris Window
• Blackman-Nuttall Window
• Cosine Tapered window
• Dolph-Chebyshev Window
• Exact Blackman Window
• Exponential Window
• Flat Top Window
• Force Window
• Gauss Window
• General Cosine Window
• Hamming Window
• Hanning Window
•Kaiser Window
• Scaled Time Domain Windows
• Symmetric Time Domain Windows
• Triangle Window
Filters
• Bessel
• Butterworth
• Cascade
•Chebyshev
• Elliptic
•FIR
• FIR Windowed
•IIR
© National Instruments Corporation 2-3 Measurement Studio for MCC User Manual
Page 18

Chapter 2 Measurement Studio Measurement Computing Edition .NET Class Libraries
• IIR Cascade
• Inverse Chebyshev
•Kaiser
Signal Processing
• Autocorrelation
• Convolution
•Cross Power
• Cross Correlation
• Decimate
• Deconvolution
• Derivative x(t)
• Discrete Cosine Transform
• Discrete Sine Transform
• Fast Hartley Transform
• Fast Hilbert Transform
• Integral x(t)
• Inverse Fast Hartley Transform
• Inverse Fast Hilbert Transform
• Peak Detection
• Power Spectrum
• Pulse Parameters
• Real and Complex FFT
• Threshold Peak Detector
Linear Algebra
• Complex Determinant
• Complex Dot Product
• Complex Matrix Condition Number
• Complex Matrix Norm
• Complex Matrix Rank
• Complex Outer Product
• Complex Pseudo Inverse Matrix
Measurement Studio for MCC User Manual 2-4 ni.com
Page 19

Chapter 2 Measurement Studio Measurement Computing Edition .NET Class Libraries
• Determinant
• Dot Product
• Inverse Matrix
• Matrix Condition Number
• Matrix Multiplication
•Matrix Norm
• Matrix Rank
• Outer Product
• Pseudo Inverse Matrix
• Special Matrix
• Test Positive Definite Matrix
• Trace
• Transpose
Array and Numeric Operations
• 1D and 2D Array Arithmetic
• 1D and 2D Linear Evaluation
• Evaluation
• 1D Polar to Rectangular
• 1D Rectangular to Polar
• Complex Number Arithmetic
• Find Polynomial Roots
• Scale 1D and 2D
Curve Fitting
• Exponential Fit
• General Least Squares Linear Fit
• General Polynomial Fit
• Linear Fit
• Nonlinear Fit
© National Instruments Corporation 2-5 Measurement Studio for MCC User Manual
Page 20
Chapter 2 Measurement Studio Measurement Computing Edition .NET Class Libraries
Statistics
• Histogram
• Mean
• Median and Mode
• Moment about Mean
Tip For more information about analyzing or generating data with the Analysis class
library, refer to the Using the Measurement Studio Analysis .NET Library topic in the
NI Measurement Studio Help. For more information about the functionality included in the
Analysis class library, visit
ni.com/analysis and select Analysis in Measurement
Studio.
Common
The Measurement Studio Common .NET class library is in the
NationalInstruments namespace. The Common class library provides
a set of classes that facilitates the exchange of data between the acquisition,
analysis, and user interface portions of your application. The Common
class library includes the following features:
•A
ComplexDouble data type. This data type represents a complex
number of type
imaginary part.
•A
DigitalWaveform data type. This data type represents a set of
digital states that are grouped by samples or signals.
•An
AnalogWaveform data type. This data type represents an analog
signal that varies over time.
•A
DataConverter class that converts data from one data type to
another data type, such as converting an array of integers to an array of
doubles.
•An
EngineeringFormatInfo class that defines a custom formatter
to format numeric values as strings with engineering notation and
International System of Units (SI) prefixes and symbols.
Double that is composed of a real part and an
Tip For more detailed information about the Common class library, refer to the
NationalInstruments section in the NI Measurement Studio Help.
Measurement Studio for MCC User Manual 2-6 ni.com
Page 21
MCC-488.2
The Measurement Studio MCC-488.2 .NET class library is in the
MccDaq.Mcc4882 namespace. This class library is included when you
install the MCC-488.2 driver. The MCC-488.2 class library includes a set
of classes for communicating with GPIB instruments, controlling GPIB
devices, and acquiring GPIB status information. Use this library to design
code that communicates with and controls instruments on a GPIB interface.
Use the MCC-488.2 class library to configure and communicate with GPIB
devices using the
Universal Library
The Measurement Studio Universal Library .NET class library is in the
MccDaq namespace. This class library is included when you install the
Universal Library driver. Use the Universal Library class library to
communicate with and control Measurement Computing data acquisition
(DAQ) devices.
Use the Universal Library class library to perform the following types of
tasks:
• Analog signal measurement
• Analog signal generation
• Digital I/O
• Counting and timing
• Temperature measurement
Chapter 2 Measurement Studio Measurement Computing Edition .NET Class Libraries
Device and Board classes.
MccDaq Scan Components
The Measurement Studio Scan Components .NET class library is in the
MccDaq.ScanComponents namespace. The MccDaq Scan Components
library includes a set of components for reading and writing multiple
channels of analog data.
Use the MccDaq Scan Components library to perform the following types
of tasks:
• Analog input scans
• Analog output scans
© National Instruments Corporation 2-7 Measurement Studio for MCC User Manual
Page 22
Chapter 2 Measurement Studio Measurement Computing Edition .NET Class Libraries
User Interface
The Measurement Studio user interface controls are in the Windows Forms
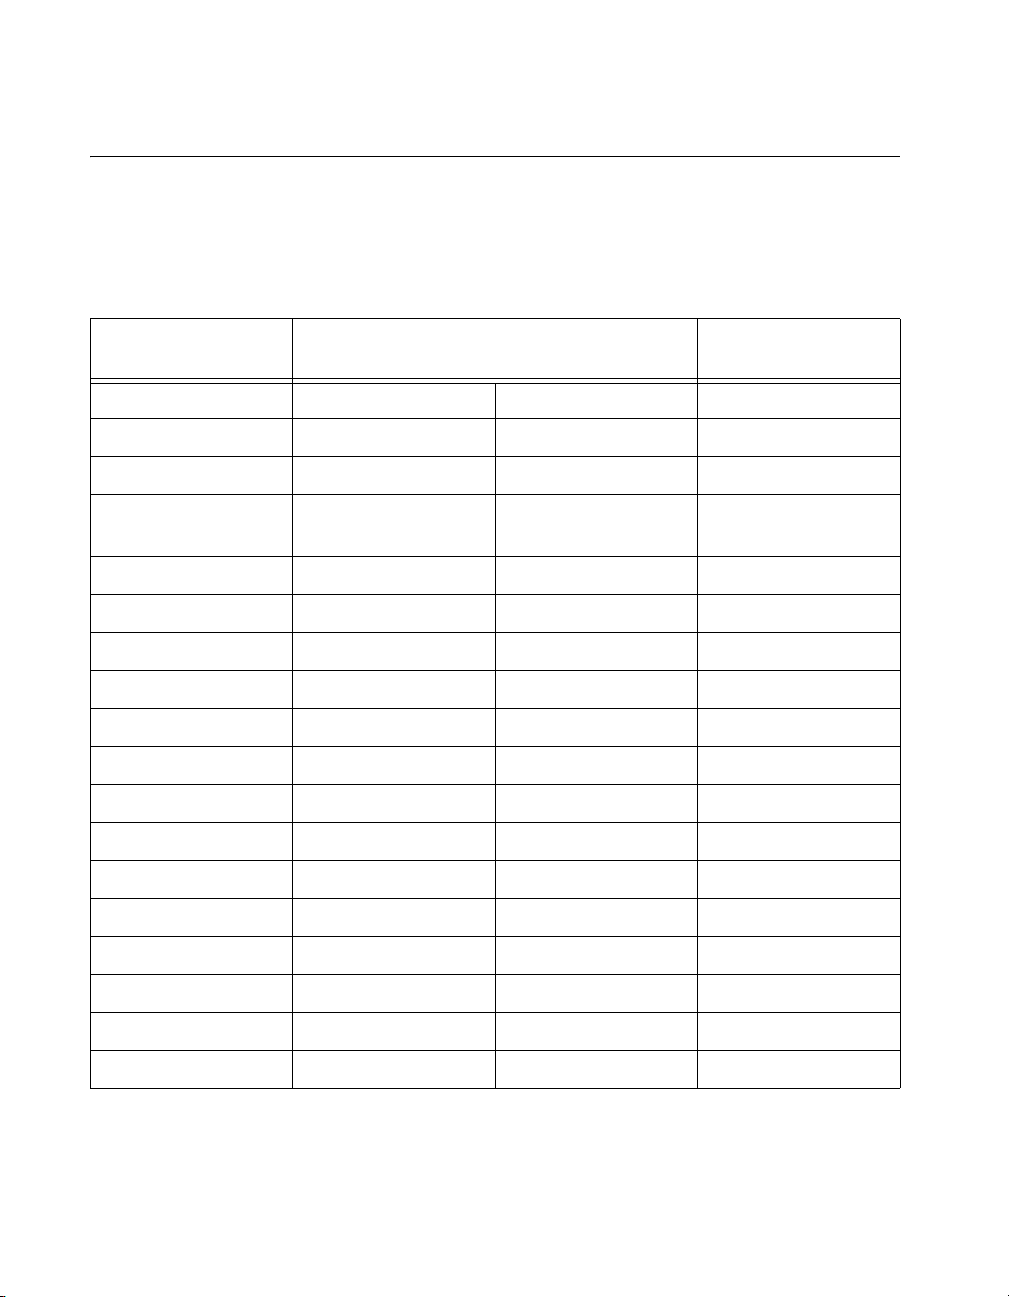
and Web Forms .NET class libraries. Refer to Table 2-1 for the UI controls
provided by Measurement Studio.
Table 2-1. Measurement Studio User Interface Controls
User Interface
Controls
Windows Forms Web Forms Windows Forms
Waveform graph ✔ ✔ ✔
Scatter graph ✔ ✔ ✔
Digital waveform
graph
Complex graph ✔ ✔ ✔
Legend ✔ ✔ ✔
Knob ✔ ✔ ✔
Gauge ✔ ✔ ✔
Meter ✔ ✔ ✔
Slide ✔ ✔ ✔
Thermometer ✔ ✔ ✔
Tank ✔ ✔ ✔
Numeric edit ✔ ✔ ✔
Switch ✔ ✔ ✔
Visual Studio 2005
✔ ✔ ✔
Visual Studio
.NET 2003
LED ✔ ✔ ✔
Property editor ✔ ✔
Array controls ✔
AutoRefresh control ✔
Measurement Studio for MCC User Manual 2-8 ni.com
Page 23
Chapter 2 Measurement Studio Measurement Computing Edition .NET Class Libraries
Windows Forms Controls
The Measurement Studio user interface controls are in the Windows Forms
.NET class library. The Windows Forms .NET class library is in the
NationalInstruments.UI.WindowsForms namespace. The Windows
Forms class library encapsulates the following Measurement Studio user
interface controls:
• Waveform graph
• Scatter graph
• Digital waveform graph
• Complex graph
•Legend
• Knob
•Gauge
• Meter
•Slide
• Thermometer
•Tank
• Numeric edit
• Switch
•LED
• Property editor
Use this class library to add measurement-specific user interface controls
to your application. You can configure the controls programmatically at
design time, through the Properties window in the Windows Forms
Designer, or at run time with the property editor control. The following
sections describe each of the Measurement Studio Windows Forms user
interface controls.
Tip For more information about easily using the .NET user interface controls,
refer to the Using the Measurement Studio Windows Forms .NET Controls section in the
NI Measurement Studio Help.
© National Instruments Corporation 2-9 Measurement Studio for MCC User Manual
Page 24
Chapter 2 Measurement Studio Measurement Computing Edition .NET Class Libraries
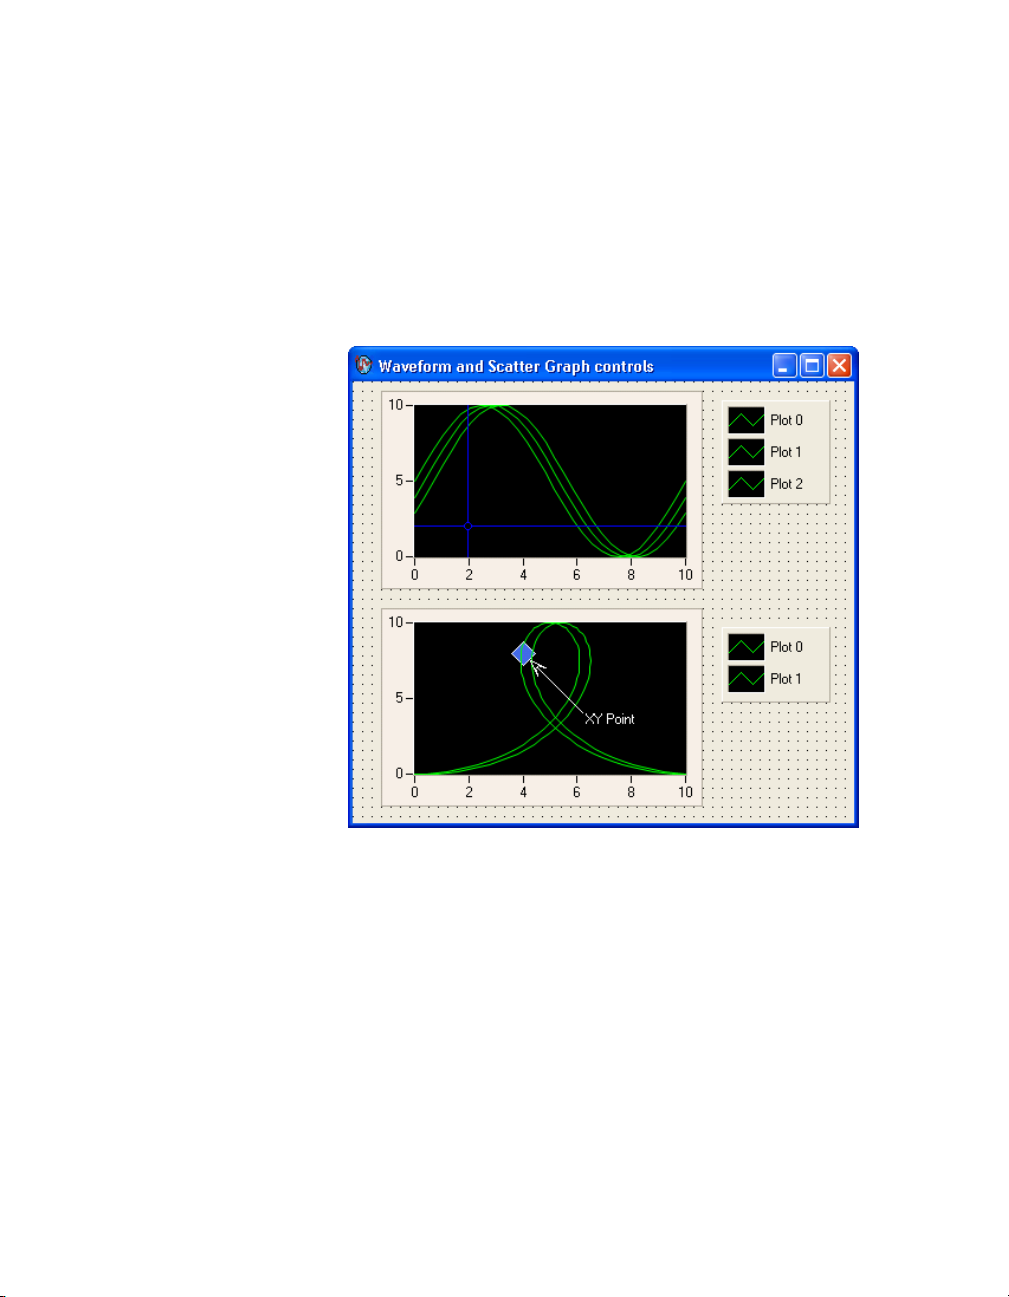
Waveform Graph and Scatter Graph Controls
Use the Measurement Studio waveform graph and scatter graph controls, as
shown in Figure 2-1, to display two-dimensional data on a Windows Forms
user interface. Use the waveform graph to display two-dimensional linear
data. You explicitly specify each value in one dimension and provide an
initial value and interval to implicitly specify the values in the other
dimension. Use the scatter graph to display two-dimensional linear or
nonlinear data. You explicitly specify each value in both dimensions.
Figure 2-1. Windows Forms Waveform Graph Control with Cursors and Windows
Forms Scatter Graph Control with XY Point Annotation; Both Graphs Have
Corresponding Legends
With the waveform graph and scatter graph controls and the classes that
interface with the controls, you can perform the following operations:
Plot Operations
• Plot and chart data.
• Configure a graph to contain multiple plots to show separate but
related data on the same graph.
• Draw lines or fills from a plot to an X value, Y value, or another plot.
Measurement Studio for MCC User Manual 2-10 ni.com
Page 25

Chapter 2 Measurement Studio Measurement Computing Edition .NET Class Libraries
• Specify plots in the scatter graph control as X and Y data. Specify plots
in the waveform graph control as X or Y data and optionally with date
and time scaling.
• Use the extensible plot and plot area drawing capabilities and events to
customize the graph appearance.
• Use plot data tooltips to display X and Y coordinates when a user
hovers the mouse over a data point.
• Create custom point and line styles for plots.
• Specify anti-aliased plots for plot lines.
Axis Operations
• Configure a graph to include multiple axes or independent ranges so
that plot data fits the graph plot area.
• Configure the axis modes to fixed, exact autoscaling, loose
autoscaling, strip chart, or scope chart.
• Use logarithmic axes with configurable bases.
• Interactively change the range of an axis and invert the axis at run time
by clicking on the axis end labels.
Cursor Operations
• Use cursors to identify key points in plots and the plot area.
• Configure cursor snap modes to be fixed, floating, nearest point, or to
plot.
• Use cursor labels to display X and Y data coordinates that the cursor
crosshair points to, and customize the text font and colors of the label.
• Create custom point and line styles for cursors.
Annotation Operations
• Configure text labels, arrows, and drawing shapes to annotate a point
anywhere in the plot area of the graph.
• Configure range area, text labels, and arrows to annotate a range in the
plot area of the graph.
Additional Operations
• Pan and zoom interactively.
• Configure major, minor, and custom divisions and origin lines.
© National Instruments Corporation 2-11 Measurement Studio for MCC User Manual
Page 26
Chapter 2 Measurement Studio Measurement Computing Edition .NET Class Libraries
• Copy the graph as a BMP, GIF, JPEG, or PNG image to the clipboard
or a file.
Tip For more information about using the waveform and scatter graph controls, refer to
the Using the Measurement Studio Windows Forms Scatter and Waveform Graph .NET
Controls section in the NI Measurement Studio Help.
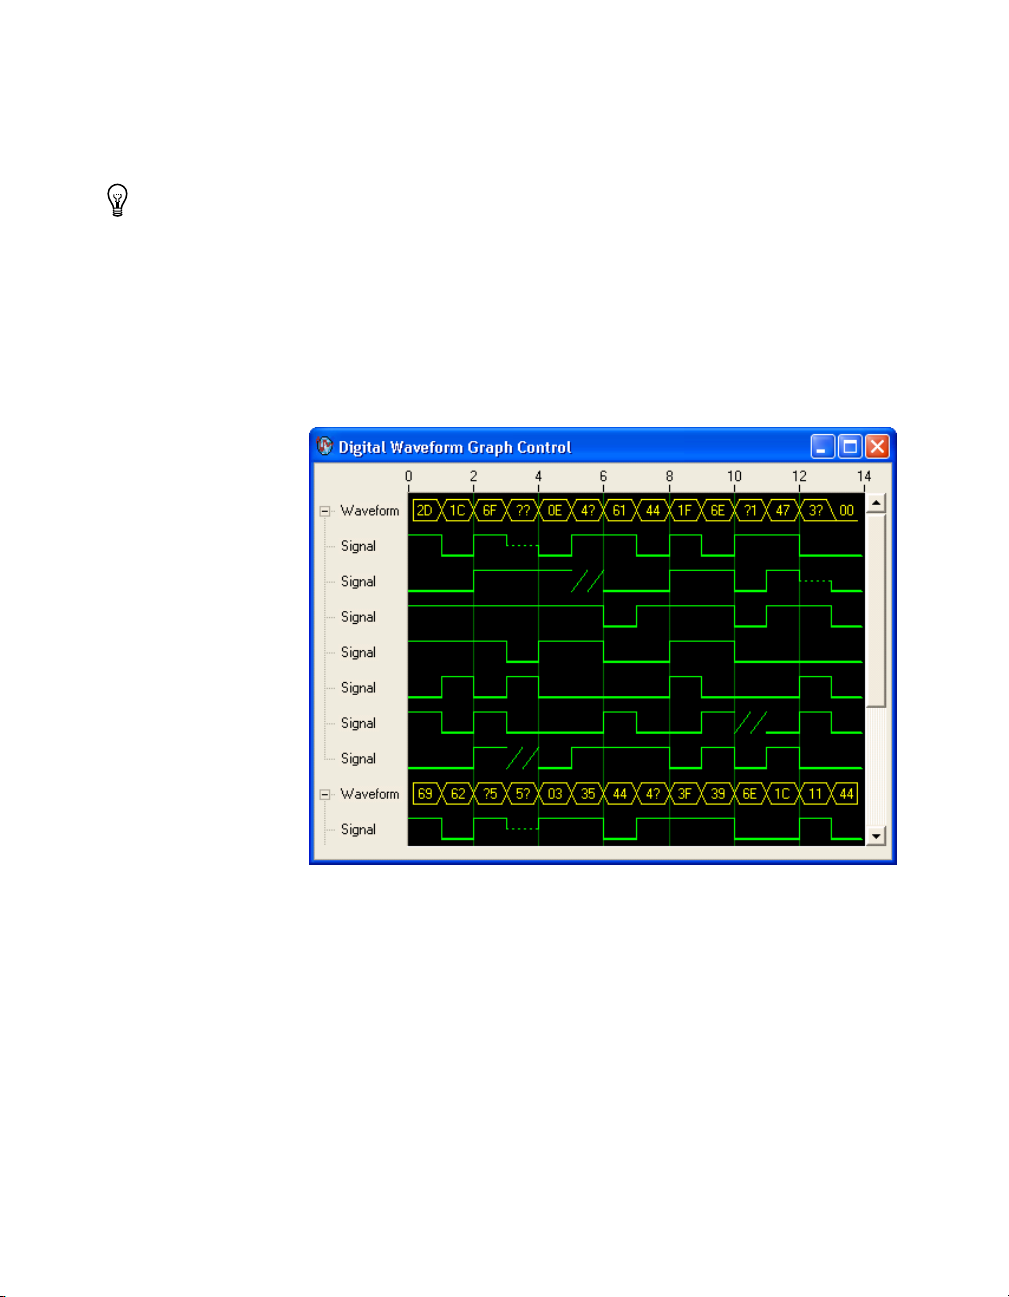
Digital Waveform Graph Control
Use the Measurement Studio digital waveform graph control, as shown in
Figure 2-2, to display
interface.
DigitalWaveform data on a Windows Forms user
Figure 2-2. Windows Forms Digital Graph Control
With the digital waveform graph control and the classes that interface with
the control, you can perform the following operations:
Plot Operations
• Plot digital waveform data. Data values can represent up to eight
different digital states.
• Configure plot labels on the y-axis.
• Configure plot templates to customize plots that are implicitly created
from plotted data.
Measurement Studio for MCC User Manual 2-12 ni.com
Page 27

Chapter 2 Measurement Studio Measurement Computing Edition .NET Class Libraries
• Specify anti-aliased digital plots.
• Expand and collapse signal plots interactively.
Waveform Sample and Signal State Operations
• Simultaneously display waveforms and signals or display signals only.
• Create custom waveform sample and signal state styles.
• Configure sample and state labels.
• Create custom waveform sample and signal state labels.
Axis Operations
• Configure the axis modes to fixed, exact autoscaling, or loose
autoscaling.
• Interactively change the range of an axis and invert the axis at run time
by clicking on the axis end labels.
Additional Operations
• Display data in sample or time mode.
• Pan with scroll bars.
• Configure the style and mode of scroll bars.
• Create custom scroll bars.
• Pan and zoom interactively.
• Configure major, minor, and custom divisions.
• Copy the graph as a BMP, GIF, JPEG, or PNG image to the clipboard
or a file.
Tip For more information about using the digital waveform graph control, refer to the
Using the Measurement Studio Windows Forms Digital Waveform Graph .NET Control
section in the NI Measurement Studio Help.
Complex Graph Control
Use the Measurement Studio complex graph control, as shown in
Figure 2-3, to display
interface. A
© National Instruments Corporation 2-13 Measurement Studio for MCC User Manual
ComplexDouble consists of a real part and an imaginary part.
ComplexDouble data on a Windows Forms user
Page 28
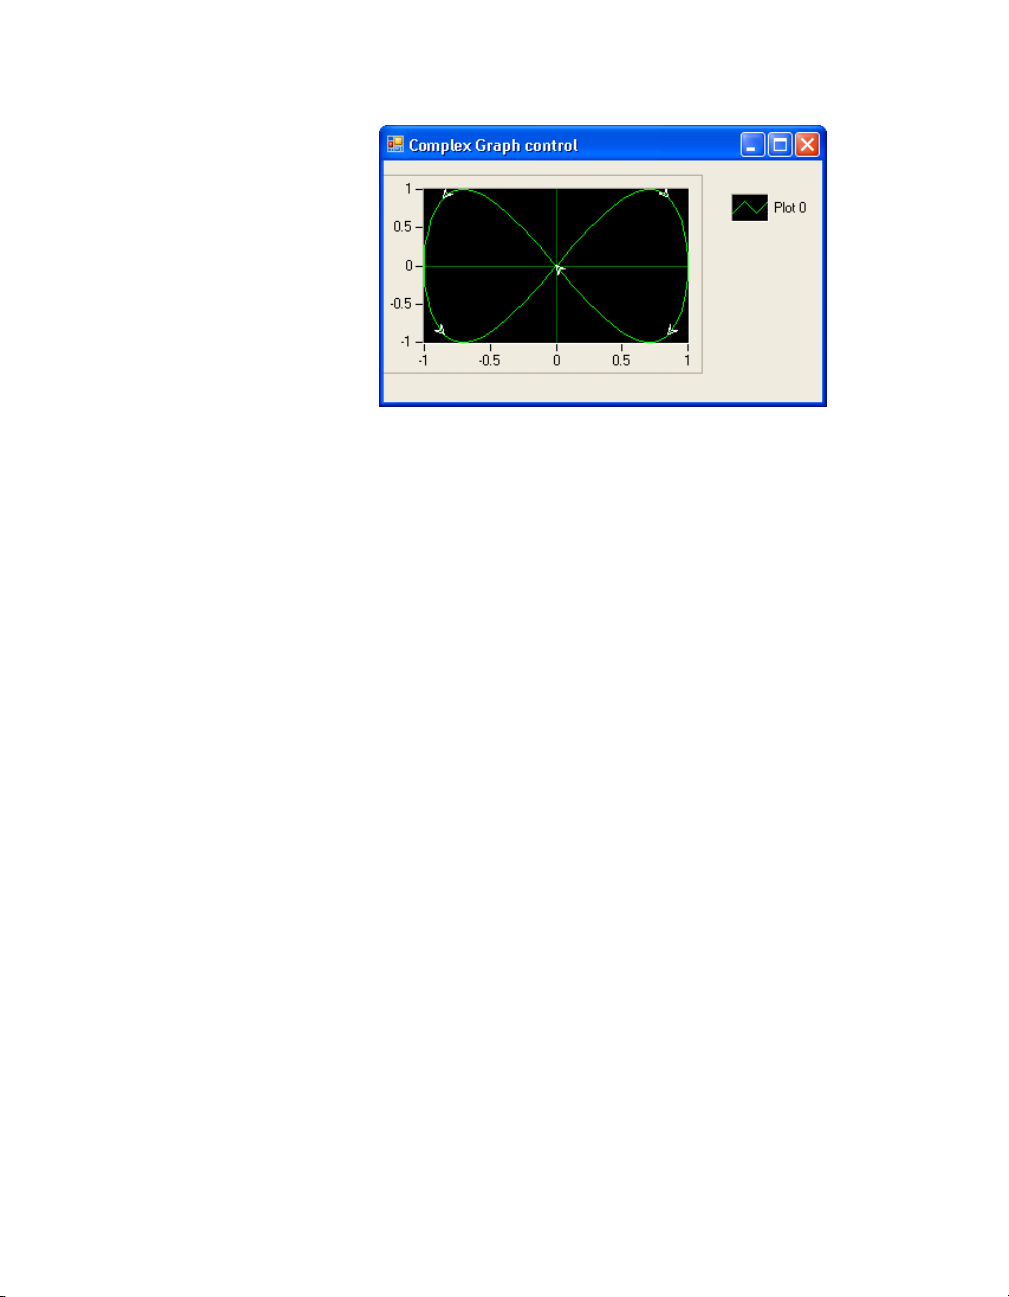
Chapter 2 Measurement Studio Measurement Computing Edition .NET Class Libraries
Figure 2-3. Windows Forms Complex Graph Control
With the complex graph control and the classes that interface with the
control, you can perform the following operations:
Plot Operations
• Plot and chart ComplexDouble data.
• Configure a graph to contain multiple plots to show separate but
related data on the same graph.
• Draw lines or fills from a plot to an X value, Y value, or another plot.
• Use the extensible plot and plot area drawing capabilities and events to
customize the graph appearance.
• Configure the plot to display arrows. The arrows indicate the direction
of the complex data.
• Create custom point and line styles for plots.
• Specify anti-aliased plots for plot lines.
Axis Operations
• Configure a graph to include multiple axes or independent ranges so
that plot data fits the graph plot area.
• Configure the axis modes to fixed, exact autoscaling, loose
autoscaling, strip chart, or scope chart.
• Interactively change the range of an axis and invert the axis at run time
by clicking on the axis end labels.
Measurement Studio for MCC User Manual 2-14 ni.com
Page 29
Tip For more information about using the complex graph control, refer to the Using
the Measurement Studio Windows Forms Complex Graph .NET Control section in the
NI Measurement Studio Help.
Legend Control
Tip For more information about using the legend control, refer to the Using the
Measurement Studio Windows Forms Legend .NET Control section in the NI Measurement
Studio Help.
Chapter 2 Measurement Studio Measurement Computing Edition .NET Class Libraries
Additional Operations
• Pan and zoom interactively.
• Configure major, minor, and custom divisions and origin lines.
• Copy the graph as a BMP, GIF, JPEG, or PNG image to the clipboard
or a file.
Use the Measurement Studio legend control, as shown in Figure 2-1, to
display symbols and descriptions for a specific set of elements of another
object, such as the plots or cursors of a graph. When you associate the
legend control with another object, any changes you make to that object are
automatically reflected in the legend. For example, if you associate the
legend control with the plots of a graph, any changes you make in the plots
collection editor are automatically reflected in the legend.
Numeric Controls
Use the Measurement Studio numeric controls to display numerical
information, on a Windows Forms user interface, with the look of scientific
instruments. The numeric controls include a knob, gauge, meter, slide,
thermometer, and tank. The following sections describe operations
available with the controls and the classes that interface with them.
With all of the numeric controls and the classes that interface with them,
you can perform the following operations:
• Configure the scale to be linear or logarithmic and toggle the visibility
of the scale.
• Fill the scale and configure the range, color, dimensions, and style of
the fill.
• Connect to the Measurement Studio .NET numeric edit control so that
if you change the value of one control, it changes the value of the other
control.
© National Instruments Corporation 2-15 Measurement Studio for MCC User Manual
Page 30
Chapter 2 Measurement Studio Measurement Computing Edition .NET Class Libraries
• Customize the appearance of the control using 3D lab styles or classic
2D styles and change the color and length of ticks and labels.
• Configure the format of value labels to engineering or date/time.
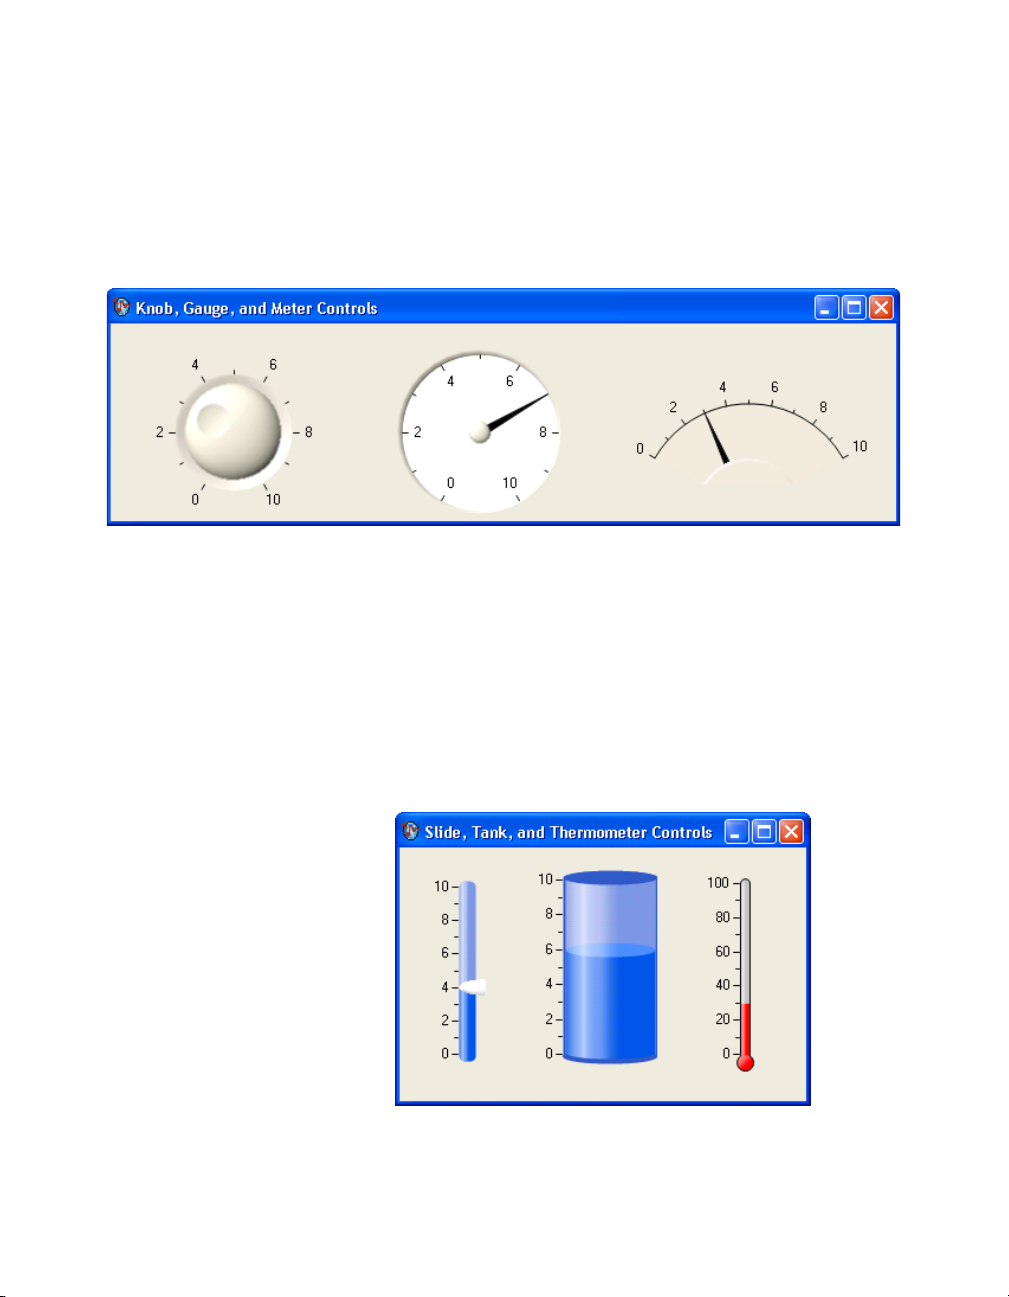
Use the Measurement Studio knob, gauge, and meter controls, as shown in
Figure 2-4, to input and display numeric data on your user interface.
Figure 2-4. Windows Forms Knob, Gauge, and Meter Controls
With the knob, gauge, and meter controls and the classes that interface with
the controls, you can perform the following operations:
• Specify the start and sweep angle of the arc programmatically or from
the Properties window.
• Use automatic division spacing, custom divisions, and invert the scale.
Use the Measurement Studio slide, tank, and thermometer controls, as
shown in Figure 2-5, to input and display numeric data on your interface.
Figure 2-5. Windows Forms Slide, Tank, and Thermometer Controls
Measurement Studio for MCC User Manual 2-16 ni.com
Page 31

With the slide, tank, and thermometer controls and the classes that interface
with them, you can perform the following operations:
• Fill to the minimum or maximum value of the scale.
• Position the scale horizontally with left, right, or both and position the
Tip For more information about using the Windows Forms knob, gauge, meter, slide,
tank, or thermometer controls, refer to the Knob, Gauge, Meter, Slide, Tank, or
Thermometer Class sections in the NI Measurement Studio Help.
Numeric Edit Control
Use the Measurement Studio numeric edit control, as shown in Figure 2-6,
to display numeric values and to provide a way by which end users can edit
numeric values. Typically, you use a numeric edit control to input or display
double numerical data instead of using a Windows Forms TextBox or
NumericUpDown control.
Chapter 2 Measurement Studio Measurement Computing Edition .NET Class Libraries
scale vertically with top, bottom, or both.
Figure 2-6. Windows Forms Numeric Edit Control
With the numeric edit control and the classes that interface with the control
you can perform the following operations:
• Use up/down buttons for easy incrementing and decrementing.
• Perform range checking.
• Set the minimum range value to negative infinity and the maximum
range value to positive infinity.
• Create custom formats or use built-in numeric formats including
generic, engineering, and simple double.
• Connect to a Measurement Studio numeric control so that if you
change the value of one control, it changes the value of the other
control.
• Set the coercion mode property to discrete or continuous values. This
property configures the control to allow entry or display of either a
discrete set of values or any value.
• Set the interaction mode to keyboard and mouse, keyboard only,
mouse only, or none.
© National Instruments Corporation 2-17 Measurement Studio for MCC User Manual
Page 32

Chapter 2 Measurement Studio Measurement Computing Edition .NET Class Libraries
Tip For more information about using the Windows Forms numeric edit control, refer to
the NumericEdit Class section in the NI Measurement Studio Help.
Switch and LED Controls
Use the Measurement Studio switch and LED controls as Boolean controls
on a Windows Forms user interface. You typically use a switch control, as
shown in Figure 2-7, to receive and control Boolean input on an application
user interface.
Figure 2-7. Windows Forms Switch Control in Vertical Toggle 3D Style
You typically use an LED control, as shown in Figure 2-8, to indicate a
Boolean value on an application user interface.
Figure 2-8. Windows Forms LED Control in Square 3D Style
With the switch and LED controls and the classes that interface with the
controls, you can perform the following operations:
• Receive notification before or after the state of the control changes.
• Configure how the control behaves when you click it with the mouse
or press the spacebar when the control has focus.
• Configure the appearance of the control.
• Make the control background transparent.
• Configure the LED control to blink while it is on or off and configure
the rate at which the LED control blinks.
Tip For more information about using the switch and LED controls, refer to the Using
the Measurement Studio Windows Forms Switch and LED .NET Controls section in the
NI Measurement Studio Help.
Measurement Studio for MCC User Manual 2-18 ni.com
Page 33

Property Editor Control
Use the Measurement Studio property editor control, as shown in
Figure 2-9, to configure properties for Windows Forms controls at run time.
Chapter 2 Measurement Studio Measurement Computing Edition .NET Class Libraries
Figure 2-9. Windows Forms Property Editor Control for the Windows Forms Knob
Control Scale Arc Property
With the property editor control and the classes that interface with the
control, you can perform the following operations:
• Edit any .NET type at run time, including collections.
• Edit expandable properties that represent nested properties of another
object, such as major divisions of an axis.
• Create custom editors and type converters for properties.
• Connect to a Windows Forms control so that if you change the value
of a property of the control, the property editor will update to reflect
the change.
• Configure the display mode as a visual representation of the value,
text-only, or both.
• Set the interaction mode to edit values or indicator.
© National Instruments Corporation 2-19 Measurement Studio for MCC User Manual
Page 34

Chapter 2 Measurement Studio Measurement Computing Edition .NET Class Libraries
Tip For more information about using the property editor control, refer to the Using the
Measurement Studio Windows Forms Property Editor Control topic in the NI Measurement
Studio Help.
Measurement Studio Support for Visual Studio 2005 Class Library Overview
Measurement Studio support for Visual Studio 2005 includes all of the
features and functionality described in the Measurement Studio Support for
Visual Studio .NET 2003 Class Library Overview section as well as the
following additional user interface features and functionality:
• Windows Forms array controls
• ASP.NET Web Forms controls
Windows Forms Array Controls
You can create an array of Measurement Studio controls that behave as a
single unit. For example, you can use these array controls to visualize and
control ports of a digital line or values of an array. Measurement Studio
includes switch, LED, and numeric edit array controls. You can create
control arrays of other controls if those controls meet the constraints of the
generic type parameter
TControl.
Measurement Studio for MCC User Manual 2-20 ni.com
Page 35

Chapter 2 Measurement Studio Measurement Computing Edition .NET Class Libraries
Switch and LED Array Controls
Use the Measurement Studio switch and LED array controls as an array of
Boolean controls on a Windows Forms user interface. You typically use a
switch array control, as shown in Figure 2-10, to control ports of a digital
line or values of an array. You typically use an LED array control, also
shown in Figure 2-10, to visualize ports of a digital line or values of an
array.
Figure 2-10. Windows Forms Switch and LED Array Controls
With the switch and LED array controls and the classes that interface with
the controls, you can perform the following operations:
• Set values by passing an array of data.
• Modify the number of controls displayed based on the length of the
specified values.
• Receive notification before or after the state of the control changes.
• Configure how the control behaves when you click it with the mouse
or press the spacebar when the control has focus.
• Configure the appearance of the control.
• Make the control background transparent.
• Configure the LED controls to blink while they are on or off and
configure the rate at which the LED controls blink.
Tip For more information about using the switch and LED array controls, refer to the
Using the Measurement Studio Windows Forms Control Array .NET Controls topic in the
NI Measurement Studio Help.
© National Instruments Corporation 2-21 Measurement Studio for MCC User Manual
Page 36

Chapter 2 Measurement Studio Measurement Computing Edition .NET Class Libraries
Numeric Edit Array Control
Use the Measurement Studio numeric edit array control, as shown in
Figure 2-11, to control and visualize values of an array of
Figure 2-11. Numeric Edit Array control
With the numeric edit array control and the classes that interface with the
control you can perform the following operations:
• Set values by passing an array of data.
• Modify the number of controls displayed based on the length of the
array of values you specify.
• Use up/down buttons for easy incrementing and decrementing.
• Perform range checking.
• Set the minimum range value to negative infinity and the maximum
range value to positive infinity.
• Create custom formats or use built-in numeric formats including
generic, engineering, and simple double.
• Connect to a numeric control so that if you change the value of one
control, it changes the value of the other control.
• Set the coercion mode property to discrete or continuous values. This
property configures the control to allow entry or display of either a
discrete set of values or any value.
• Set the interaction mode to keyboard and mouse, keyboard only,
mouse only, or none.
• Use the edit box to select text programmatically and to validate text
values.
double values.
Tip For more information about using the numeric edit array control, refer to the Using
the Measurement Studio Windows Forms Control Array .NET Controls topic in the
NI Measurement Studio Help.
Measurement Studio for MCC User Manual 2-22 ni.com
Page 37

Chapter 2 Measurement Studio Measurement Computing Edition .NET Class Libraries
ASP.NET Web Forms Controls
The Measurement Studio ASP.NET user interface controls are in the Web
Forms .NET class library. The Web Forms .NET class library is in the
NationalInstruments.UI.WebForms namespace. The Web Forms
class library encapsulates the following Measurement Studio user interface
controls:
• Waveform graph
• Scatter graph
• Digital waveform graph
• Complex graph
•Legend
• Knob
•Gauge
• Meter
•Slide
• Thermometer
•Tank
• Numeric edit
• Switch
•LED
• AutoRefresh
Use this class library to add measurement-specific user interface controls
to your Web application. You can configure the controls programmatically
at design time or through the Properties window in the Web Forms
Designer.
The Measurement Studio ASP.NET Web Forms controls are designed to
provide a rich user interface experience through the web browser. The
browsers are divided into two broad categories: uplevel and downlevel.
Uplevel browsers include recent versions of Microsoft Internet Explorer
and Mozilla Firefox. All other browsers are downlevel browsers.
The following sections describe each of the Measurement Studio Web
Forms user interface controls.
© National Instruments Corporation 2-23 Measurement Studio for MCC User Manual
Page 38

Chapter 2 Measurement Studio Measurement Computing Edition .NET Class Libraries
Waveform Graph and Scatter Graph Controls
Use the Measurement Studio waveform graph and scatter graph controls, as
shown in Figure 2-12, to display two-dimensional data on a Web-based
user interface. Use the waveform graph to display two-dimensional linear
data. You explicitly specify each value in one dimension and provide an
initial value and interval to implicitly specify the values in the other
dimension. Use the scatter graph to display two-dimensional linear or
nonlinear data. You explicitly specify each value in both dimensions.
Figure 2-12. Web Forms Waveform Graph and Scatter Graph Controls;
Both Graphs Have Corresponding Legends
With the waveform graph and scatter graph controls and the classes that
interface with the controls, you can perform the following operations:
Plot Operations
• Plot and chart data.
• Configure a graph to contain multiple plots to show separate but
related data on the same graph.
• Draw lines or fills from a plot to an X value, Y value, or another plot.
Measurement Studio for MCC User Manual 2-24 ni.com
Page 39

Chapter 2 Measurement Studio Measurement Computing Edition .NET Class Libraries
• Specify plots in the scatter graph control as X and Y data. Specify plots
in the waveform graph control as X or Y data and optionally with date
and time scaling.
• Use the extensible plot and plot area drawing capabilities and events to
customize the graph appearance.
• Create custom point and line styles for plots.
• Specify anti-aliased plots for plot lines.
Axis Operations
• Configure a graph to include multiple axes or independent ranges so
that plot data fits the graph plot area.
• Configure the axis modes to fixed, exact autoscaling, loose
autoscaling, strip chart, or scope chart.
• Use logarithmic axes with configurable bases.
• Interactively change the range of an axis and invert the axis at run time
by clicking on the axis end labels.
Cursor Operations
• Use cursors to identify key points in plots and the plot area.
• Configure cursor snap modes to be floating, nearest point, or to plot.
• Use cursor labels to display X and Y data coordinates that the cursor
crosshair points to, and customize the text font and colors of the label.
• Create custom point and line styles for cursors.
Annotation Operations
• Configure text labels, arrows, and drawing shapes to annotate a point
anywhere in the plot area of the graph.
• Configure range area, text labels, and arrows to annotate a range in the
plot area of the graph.
Additional Operations
• Zoom interactively.
• Specify the image format of the control as BMP, GIF, JPEG, or PNG.
• Configure major, minor, and custom divisions and origin lines.
© National Instruments Corporation 2-25 Measurement Studio for MCC User Manual
Page 40

Chapter 2 Measurement Studio Measurement Computing Edition .NET Class Libraries
Tip For more information about using the waveform and scatter graph controls, refer to
the Using the Measurement Studio Web Forms Scatter and Waveform Graph .NET Controls
section in the NI Measurement Studio Help.
Digital Waveform Graph Control
Use the Measurement Studio digital waveform graph control, as shown in
Figure 2-13, to display
application.
DigitalWaveform data in an ASP.NET Web
Figure 2-13. Web Forms Digital Graph Control
Measurement Studio for MCC User Manual 2-26 ni.com
Page 41

Chapter 2 Measurement Studio Measurement Computing Edition .NET Class Libraries
With the digital waveform graph control and the classes that interface with
the control, you can perform the following operations:
Plot Operations
• Plot digital waveform data, including digital signal state data and
timing information.
• Configure plot labels on the y-axis.
• Configure plot templates to customize plots that are implicitly created
from plotted data.
• Specify anti-aliased digital plots.
• Expand and collapse signal plots interactively.
Waveform Sample and Signal State Operations
• Simultaneously display waveforms and signals or display signals only.
• Create custom waveform sample and signal state styles.
• Configure waveform sample and signal state labels.
• Create custom waveform sample and signal state labels.
Axis Operations
• Configure the axis modes to fixed, exact autoscaling, or loose
autoscaling.
• Interactively change the range of an axis and invert the axis at run time
by clicking on the axis end labels.
Additional Operations
• Display data in sample or time mode.
• Configure the style and mode of scroll bars.
• Create custom scroll bars.
• Zoom interactively.
• Specify the image format of the control as BMP, GIF, JPEG, or PNG.
• Configure major, minor, and custom divisions.
Tip For more information about using the digital waveform graph control, refer to the
Using the Measurement Studio Web Forms Digital Waveform Graph .NET Control section
in the NI Measurement Studio Help.
© National Instruments Corporation 2-27 Measurement Studio for MCC User Manual
Page 42

Chapter 2 Measurement Studio Measurement Computing Edition .NET Class Libraries
Complex Graph Control
Use the Measurement Studio complex graph control, as shown in
Figure 2-14, to display
application. A
ComplexDouble consists of a real part and an imaginary
part.
ComplexDouble data on a ASP.NET Web
Figure 2-14. Web Forms Complex Graph Control
With the complex graph control and the classes that interface with the
control, you can perform the following operations:
Plot Operations
• Plot and chart ComplexDouble data.
• Configure a graph to contain multiple plots to show separate but
related data on the same graph.
• Draw lines or fills from a plot to an X value, Y value, or another plot.
• Use the extensible plot and plot area drawing capabilities and events to
customize the graph appearance.
• Configure the plot to display arrows. The arrows indicate the direction
of the complex data.
• Create custom point and line styles for plots.
• Specify anti-aliased plots for plot lines.
Measurement Studio for MCC User Manual 2-28 ni.com
Page 43

Tip For more information about using the complex graph control, refer to the Using
the Measurement Studio Web Forms Complex Graph .NET Control section in the
NI Measurement Studio Help.
Legend Control
Chapter 2 Measurement Studio Measurement Computing Edition .NET Class Libraries
Axis Operations
• Configure a graph to include multiple axes or independent ranges so
that plot data fits the graph plot area.
• Configure the axis modes to fixed, exact autoscaling, loose
autoscaling, strip chart, or scope chart.
• Interactively change the range of an axis and invert the axis at run time
by clicking on the axis end labels.
Additional Operations
• Zoom interactively.
• Specify the image format of the control as BMP, GIF, JPEG, or PNG.
• Configure major, minor, and custom divisions and origin lines.
Use the Measurement Studio legend control, as shown in Figure 2-12, to
display symbols and descriptions for a specific set of elements of another
object, such as the plots or cursors of a graph. When you associate the
legend control with another object, any changes you make to that object are
automatically reflected in the legend. For example, if you associate the
legend control with the plots of a graph, any changes you make in the plots
collection editor are automatically reflected in the legend.
Tip For more information about using the legend control, refer to the Using the
Measurement Studio Web Forms Legend .NET Control section in the NI Measurement
Studio Help.
Numeric Controls
Use the Measurement Studio numeric controls to display numerical
information, in an ASP.NET Web application, with the look of scientific
instruments. The numeric controls include a knob, gauge, meter, slide,
thermometer, and tank. The following sections describe operations
available with the controls and the classes that interface with them.
© National Instruments Corporation 2-29 Measurement Studio for MCC User Manual
Page 44

Chapter 2 Measurement Studio Measurement Computing Edition .NET Class Libraries
With all of the numeric controls and the classes that interface with them,
you can perform the following operations:
• Configure the scale to be linear or logarithmic and toggle the visibility
of the scale.
• Fill the scale and configure the range, color, dimensions, and style of
the fill.
• Connect to a Measurement Studio .NET numeric edit control so that if
you change the value of one control, it changes the value of the other
control.
• Customize the appearance of the control using 3D lab styles or classic
2D styles and change the color and length of ticks and labels.
• Configure the format of value labels to engineering or date/time.
• Specify the image format of the control as BMP, GIF, JPEG, or PNG.
• Interactively change the range of an axis and invert the axis at run time
by clicking on the axis end labels.
Use the Measurement Studio knob, gauge, and meter controls, as shown in
Figure 2-15, to input and display numeric data on your user interface.
Figure 2-15. Web Forms Knob, Gauge, and Meter Controls
Measurement Studio for MCC User Manual 2-30 ni.com
Page 45

Chapter 2 Measurement Studio Measurement Computing Edition .NET Class Libraries
With the knob, gauge, and meter controls and the classes that interface with
the controls, you can perform the following operations:
• Specify the start and sweep angle of the arc programmatically or from
the Properties window.
• Use automatic division spacing, custom divisions, and invert the scale.
Use the Measurement Studio slide, tank, and thermometer controls, as
shown in Figure 2-16, to input and display numeric data on your interface.
Figure 2-16. Web Forms Slide, Tank, and Thermometer Controls
With the slide, tank, and thermometer controls and the classes that interface
with them, you can perform the following operations:
• Fill to the minimum or maximum value of the scale.
• Position the scale horizontally with left, right, or both and position the
scale vertically with top, bottom, or both.
Tip For more information about using the Web Forms knob, gauge, meter, slide, tank, or
thermometer controls, refer to the Knob, Gauge, Meter, Slide, Tan k , or Thermometer Class
sections in the NI Measurement Studio Help.
© National Instruments Corporation 2-31 Measurement Studio for MCC User Manual
Page 46

Chapter 2 Measurement Studio Measurement Computing Edition .NET Class Libraries
Numeric Edit Control
Use the Measurement Studio numeric edit control, as shown in Figure 2-17,
to display numeric values and to provide a way by which end users can edit
numeric values. Typically, you use a numeric edit control to input or display
double numerical data instead of using a Web Forms TextBox control.
Figure 2-17. Web Forms Numeric Edit Control
With the numeric edit control and the classes that interface with the control
you can perform the following operations:
• Perform range checking.
• Set the minimum range value to negative infinity and the maximum
range value to positive infinity.
• Create custom formats or use built-in numeric formats including
generic, engineering, and simple double.
• Connect to a Measurement Studio numeric control so that if you
change the value of one control, it changes the value of the other
control.
• Set the coercion mode property to discrete or continuous values. This
property configures the control to allow entry or display of either a
discrete set of values or any value.
• Validate and format data without posting back to the Web server.
Tip For more information about using the Web Forms numeric edit control, refer to the
NumericEdit Class section in the NI Measurement Studio Help.
Measurement Studio for MCC User Manual 2-32 ni.com
Page 47

Chapter 2 Measurement Studio Measurement Computing Edition .NET Class Libraries
Switch and LED Controls
Use the Measurement Studio switch and LED controls as Boolean controls
in an ASP.NET Web application. You typically use a switch control to
receive and control Boolean input in an ASP.NET Web application. You
typically use an LED control to indicate a Boolean value in an ASP.NET
Web application. The switch and LED controls are shown in Figure 2-18.
Figure 2-18. Web Forms Switch Control in Vertical Toggle 3D Style and
Web Forms LED Control in Square 3D Style
With the switch and LED controls and the classes that interface with the
controls, you can perform the following operations:
• Receive notification before or after the state of the control changes.
• Specify the image format of the control as BMP, GIF, JPEG, or PNG.
Tip For more information about using the switch and LED controls, refer to the Using
the Measurement Studio Web Forms Switch and LED .NET Controls section in the
NI Measurement Studio Help.
AutoRefresh Control
Use the AutoRefresh control to update a Web control or a group of Web
controls on the client at a specified interval.
The AutoRefresh control renders JavaScript on the client to create a timer
in the browser. When the timer elapses, the AutoRefresh updates the
controls in the AutoRefresh group. For downlevel browsers, the controls
update via postback. For uplevel browsers, the client-side script rendered
by the AutoRefresh control uses a client callback to update the associated
controls on the client without posting the page back to the server.
© National Instruments Corporation 2-33 Measurement Studio for MCC User Manual
Page 48

Measurement Studio Integrated
Tools and Features
When you use Measurement Studio in the Visual Studio environment, you
have access to measurement and automation tools and features for.NET
Windows and ASP.NET. These integrated tools and features are designed
to help you quickly and easily build measurement and automation
applications. These integrated tools are included in support for both Visual
Studio .NET 2003 and Visual Studio 2005.
This chapter includes the following sections to help you develop
applications with Measurement Studio:
• Measurement Studio Menu
• Creating a Measurement Studio Project
• Adding or Removing Measurement Studio Class Libraries
Refer to the Developing with Measurement Studio section in the
NI Measurement Studio Help for more information about the functionality
of these tools and features.
3
Measurement Studio Menu
The Measurement Studio menu provides an easy way to access the
following National Instruments resources and tools:
• Add/Remove Class Libraries Wizard—Use the Measurement
Studio Add/Remove Class Libraries wizard to add or remove
Measurement Studio class libraries or assemblies in existing Visual
Basic .NET and Visual C# projects. Select Measurement Studio»
View .NET Class Library Wizard to access this menu item in Visual
Studio 2005.
• Measurement Computing»InstaCal—Use InstaCal to configure,
calibrate, and test Measurement Computing hardware.
• MCC Tools»GPIBConfig—Use GPIBConfig to configure
Measurement Computing GPIB hardware. Select MCC Tools»
GPIBConfig to access this menu item in Visual Studio 2005.
© National Instruments Corporation 3-1 Measurement Studio for MCC User Manual
Page 49

Chapter 3 Measurement Studio Integrated Tools and Features
• Instrument Driver Network—Use the NI Instrument Driver Network
at
ni.com/idnet as a central resource for downloading, developing,
and submitting instrument drivers. Select Measurement Studio
Online Resources»Instrument Driver Network to access this menu
item in Visual Studio 2005.
• NI Measurement Studio Help—Use the NI Measurement Studio
Help to access detailed Measurement Studio help, including function
reference, walkthroughs, and conceptual topic documentation on
developing with Measurement Studio..
• Preferences—Use the Measurement Studio Preferences dialog box to
configure Measurement Studio settings, such as conversion options
and add-in preferences. Select Tools»Options to access this menu item
in Visual Studio 2005.
• Patents—Use the Patents dialog box to view information about
NI patents.
• Licenses—Use the Licenses dialog box to view information about
NI licenses.
• About NI Measurement Studio—Use the NI Measurement Studio
About box to view version information.
Tip For more information about the resources included in the Measurement Studio menu,
refer to the Measurement Studio Menu topic in the NI Measurement Studio Help.
Creating a Measurement Studio Project
Measurement Studio includes class library and application templates that
you can use to quickly create measurement applications with Visual Basic
.NET, Visual C#, and ASP.NET. Refer to Chapter 4, Getting Started with
Measurement Studio, for step-by-step instructions on how to create a
Measurement Studio project. Use the Visual Studio New Project dialog
box, as shown for Visual Studio 2005 in Figure 3-1, to access these
templates and to create projects. You can create the following projects in
Measurement Studio:
• Measurement Studio Visual Basic .NET project
• Measurement Studio Visual C# project
• Measurement Studio ASP.NET project
Measurement Studio for MCC User Manual 3-2 ni.com
Page 50
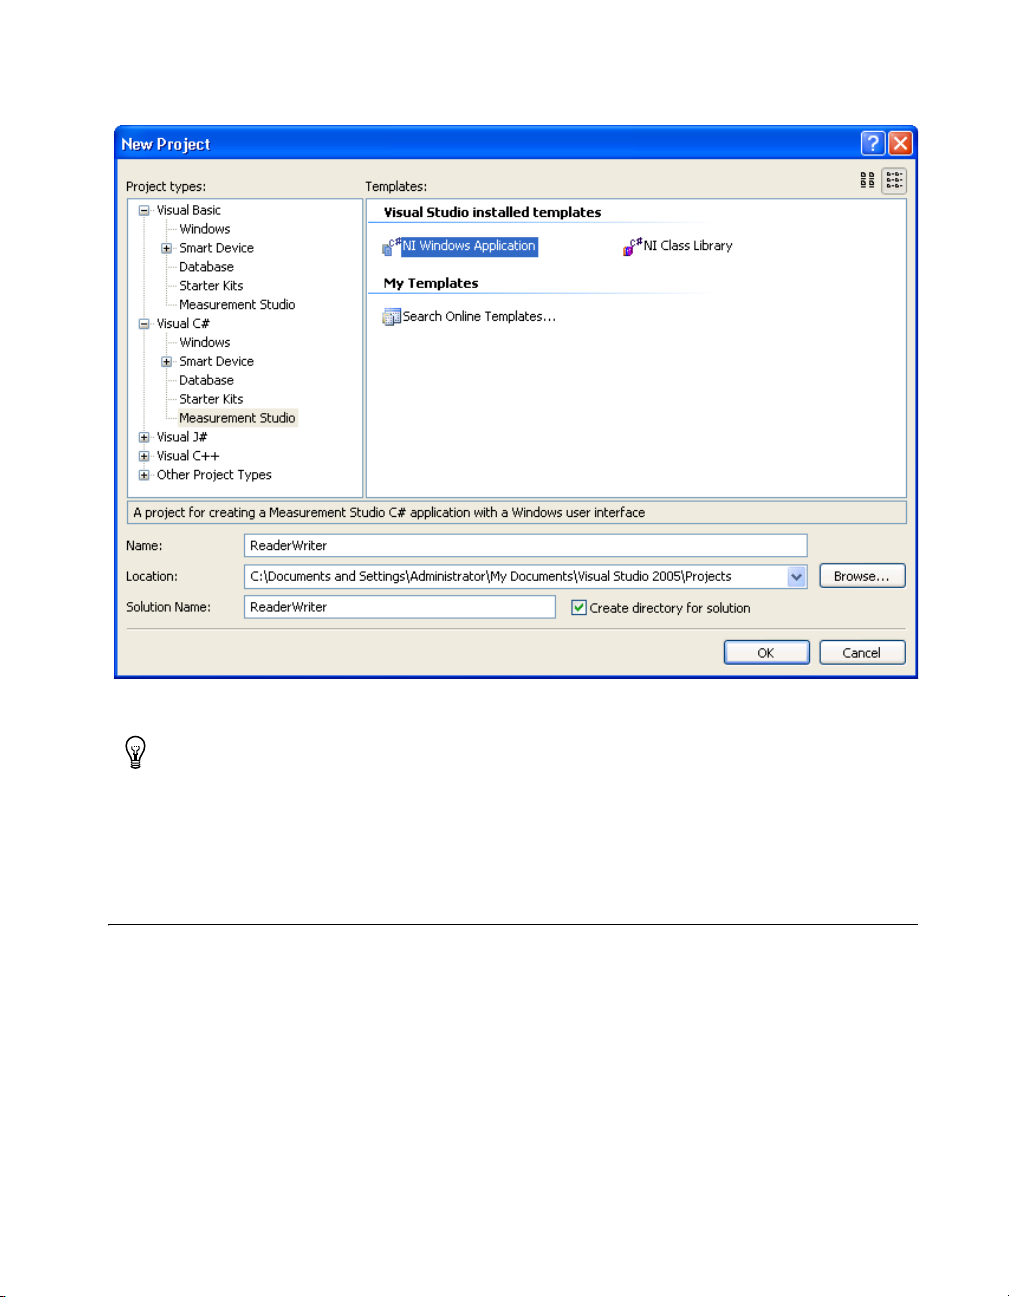
Chapter 3 Measurement Studio Integrated Tools and Features
Figure 3-1. New Project dialog box in Visual Studio 2005
Tip
For more information about using project templates to create a new Measurement
Studio project, refer to the Creating a New Measurement Studio Project section in the
NI Measurement Studio Help.
Adding or Removing Measurement Studio Class Libraries
To add or remove Measurement Studio class libraries from a project, use
the Measurement Studio Add/Remove Class Libraries wizard on the
Measurement Studio menu. This wizard provides an interface, as shown in
Figure 3-2, that you can use to select the Measurement Studio class
libraries you want to add to or remove from a project.
When you exit the wizard, the wizard adds or removes the appropriate
references to or from the project, thus adding or removing the functionality
associated with the class library.
© National Instruments Corporation 3-3 Measurement Studio for MCC User Manual
Page 51

Chapter 3 Measurement Studio Integrated Tools and Features
Figure 3-2. Measurement Studio Add/Remove Class Libraries Wizard
for Visual Studio 2005
For more information about using the Add/Remove Class Libraries wizard to add or
Tip
remove Measurement Studio class libraries, refer to the Adding or Removing Measurement
Studio Class Libraries section in the NI Measurement Studio Help.
Measurement Studio for MCC User Manual 3-4 ni.com
Page 52

4
Getting Started with
Measurement Studio
The following sections include overview information and step-by-step
instructions on developing applications with Measurement Studio tools and
features. Refer to the Developing with Measurement Studio section and the
Getting Started with the Measurement Studio Class Libraries section of the
NI Measurement Studio Help for more information about the functionality
of these tools and features.
Measurement Studio Walkthroughs for Visual Studio .NET 2003
Use the following walkthroughs to help you develop applications with
Measurement Studio in Visual Studio .NET 2003:
• Walkthrough: Creating a Measurement Studio Application with
Windows Forms Controls and Analysis in Visual Studio .NET 2003
• Walkthrough: Creating a Measurement Studio Measurement
Computing DAQ Application in Visual Studio .NET 2003
• Walkthrough: Creating a Measurement Studio MCCDaq Scan
Components Application in Visual Studio .NET 2003
• Walkthrough: Creating a Measurement Studio MCC-488.2
Application in Visual Studio .NET 2003
© National Instruments Corporation 4-1 Measurement Studio for MCC User Manual
Page 53

Chapter 4 Getting Started with Measurement Studio
Walkthrough: Creating a Measurement Studio Application with Windows Forms Controls and Analysis in Visual Studio .NET 2003
Measurement Studio includes user interface controls, such as a waveform
graph control and a gauge control, and analysis functionality such as signal
generation and mathematical functions. This walkthrough is designed to
help you learn how to add analysis and presentation functionality to a
Windows Forms application by taking you through the following steps:
• Setting up the project—Using the Measurement Studio Application
Wizard, you will create a new project that references the Measurement
Studio Analysis class library and Windows Forms controls.
• Adding user interface controls to the project—Using the Toolbox
and the Properties window, you will add and configure user interface
controls, including a button, waveform graph, legend, gauge, and
numeric edit.
• Generating, plotting, and analyzing the data—Using
NationalInstruments.Analysis.SignalGeneration.White
NoiseSignal
NationalInstruments.Analysis.Math.Statistics.Mean,
you will generate data, plot the generated data on a waveform graph,
and calculate the mean of the data.
• Customizing the user interface—Using the Collection Editor and
Auto Format dialog boxes, you will display the mean value on the
gauge and the numeric edit, as well as customize your user interface.
and
Before You Begin
The following components are required to complete this walkthrough:
• Microsoft Visual Studio .NET 2003
• Measurement Studio Measurement Computing Edition
Setting up the project
1. Select Start»All Programs»Microsoft Visual Studio .NET 2003»
Microsoft Visual Studio .NET 2003.
2. Select File»New»Project. The New Project dialog box launches.
3. In the Project Types pane, expand the Measurement Studio Projects
folder. Select Visual Basic Projects or Visual C# Projects, depending
on which language you want to create the project in.
Measurement Studio for MCC User Manual 4-2 ni.com
Page 54

Chapter 4 Getting Started with Measurement Studio
4. In the Templates pane, select Windows Application. Specify
MyMeasurementStudioProject for Name and specify a Location
of your choice.
5. Click OK. The Measurement Studio Application Wizard launches.
6. Select Analysis and Windows Forms User Interface Controls.
Tip If you are working with an existing project, you can access the Add Class Libraries
dialog box by selecting Measurement Studio»Add/Remove Class Libraries Wizard.
7. Click Finish to display
© National Instruments Corporation 4-3 Measurement Studio for MCC User Manual
Form1 in the Windows Forms Designer.
Page 55

Chapter 4 Getting Started with Measurement Studio
Adding user interface controls to the project
In this section, you will build a user interface that looks like
following screenshot.
1. Select View»Toolbox to display the Toolbox. The Toolbox contains
components and controls that you can add to your project.
2. Select the Windows Forms tab. The Windows Forms tab contains
controls and components included in the
namespace.
3. Select the Button control and drag and drop it onto the form.
4. Right-click the button and select Properties to display the Properties
window. You configure the properties of the control in the Properties
window.
5. The Text property is highlighted. Type
6. Select the Measurement Studio .NET Tools tab on the Toolbox.
7. Select the WaveformGraph control and drag and drop it onto
the form.
8. Right-click the waveform graph and select Edit Plots to display
the WaveformPlot Collection Editor dialog box. You use the
WaveformPlot Collection Editor to add or remove plots and to
configure plot properties.
Form1 in the
System.Windows.Forms
Start for the button text.
Measurement Studio for MCC User Manual 4-4 ni.com
Page 56

Chapter 4 Getting Started with Measurement Studio
9. Type Plot for the Name. Click OK.
10. Before you add the legend and gauge controls, you need to resize the
form to accommodate them. Select the form and use the double-sided
arrow to resize it.
11. Select the Legend control and drag and drop it onto the form.
12. Select the NumericEdit control and drag and drop it onto the form.
13. Select the Gauge control and drag and drop it onto the form.
14. Right-click the gauge and select Properties to display the Properties
window.
15. Type
© National Instruments Corporation 4-5 Measurement Studio for MCC User Manual
gauge for the name of the gauge.
Page 57

Chapter 4 Getting Started with Measurement Studio
The following screenshot shows Form1 with the user controls.
Generating, plotting, and analyzing the data
1. Double-click the button control to display the
cursor inside the click event handler of the button control.
2. Add the following code to generate random data, plot the data,
calculate the mean of the data, and display the mean on the gauge.
Form1 code, with the
[VB.NET]
' Declare and initialize an instance of WhiteNoiseSignal.
Dim whiteNoise As New WhiteNoiseSignal()
' Store the generated data in a double array named data.
Dim data As Double() = whiteNoise.Generate(1000.0, 256)
' Use the PlotY method to plot the data.
Plot.PlotY(data)
' Use the Mean method to calculate the mean of the data.
Dim mean As Double = Statistics.Mean(data)
' Display the mean on the gauge.
gauge.Value = mean
[C#]
// Declare and initialize an instance of WhiteNoiseSignal.
WhiteNoiseSignal whiteNoise = new WhiteNoiseSignal();
// Store the generated data in a double array named data.
double[] data = whiteNoise.Generate(1000.0, 256);
Measurement Studio for MCC User Manual 4-6 ni.com
Page 58

Chapter 4 Getting Started with Measurement Studio
// Use the PlotY method to plot the data.
Plot.PlotY(data);
// Use the Mean method to calculate the mean of the data.
double mean = Statistics.Mean(data);
// Display the mean on the gauge.
gauge.Value = mean;
Customizing your user interface
1. Right-click the legend and select Edit Items to display the LegendItem
Collection Editor dialog box. You use the LegendItem Collection
Editor to add or remove legend items and to configure legend item
properties.
2. Select Plot in the Source drop-down list and enter
Signal in the Tex t
box. Click OK. Now that you have specified a legend item for the plot,
changes you make to the plot will be reflected on the legend.
3. Right-click the graph and select Auto Format to display the Auto
Format dialog box. The Auto Format dialog box provides a set of
pre-configured control styles. When you select a style and click OK,
© National Instruments Corporation 4-7 Measurement Studio for MCC User Manual
Page 59

Chapter 4 Getting Started with Measurement Studio
the Auto Format feature configures the appropriate control properties
to reflect the style you chose.
4. Select Points Only. Click OK. Notice that the legend changed
automatically to match the formatting of the graph.
5. Right-click the gauge and select Auto Form at to display the Auto
Format dialog box.
6. Select Dark and click OK.
7. Right-click the gauge and select Properties to display the Properties
Window.
8. Set the Range property for the gauge with the drop-down Range type
editor. Type
-0.2 for the minimum value and type 0.2 for the
maximum value.
9. Right-click the numeric edit and select Properties to display the
Properties window.
10. Select Gauge in the Source drop-down list. Setting the Source
property to the gauge allows two-way binding between the controls.
11. Deselect ArrowKeys, Buttons, and Tex t for the InteractionMode
property of the numeric edit control. Deselecting these interaction
modes makes the numeric edit an indicator. The numeric edit control
only displays the calculated mean.
Measurement Studio for MCC User Manual 4-8 ni.com
Page 60

Chapter 4 Getting Started with Measurement Studio
12. Select the Format Mode property and in the Numeric Edit Format
Mode Editor dialog box, change the Precision to
13. Select File»Save Form1.cs to save your application.
14. Select Debug»Start Without Debugging to run the application.
15. After your program builds and runs, click Start. Notice the graph
shows the data plot, and the gauge and the numeric edit display the
mean of the data.
16. The following screenshot shows
Form1 with customization.
4.
Walkthrough: Creating a Measurement Studio Measurement Computing DAQ Application in Visual Studio .NET 2003
Measurement Studio includes class library and application templates that
you can use to quickly create Measurement Computing DAQ applications
with Visual Basic .NET and Visual C#. Refer to the following section,
Walkthrough: Creating a Measurement Studio Measurement Computing
DAQ Application in Visual Studio .NET 2003, for step-by-step instructions
on how to create a Measurement Studio Measurement Computing DAQ
project.
Measurement Studio Measurement Computing Edition includes user
interface controls, such as a meter control, and Measurement Computing
DAQ functionality such as analog input and digital I/O. This walkthrough
is designed to help you learn how to add Measurement Computing DAQ
© National Instruments Corporation 4-9 Measurement Studio for MCC User Manual
Page 61

Chapter 4 Getting Started with Measurement Studio
functionality to a Windows Forms application by taking you through the
following steps:
• Setting up the project—Using the Visual Studio New Project dialog
box, you will create a new project that references the Measurement
Studio Measurement Computing DAQ class library and Windows
Forms controls.
• Adding user interface controls to the project—Using the Toolbox
and the Properties window, you will add and configure user interface
controls, including a button and meter.
• Generating and displaying the data—Using
MccDaq.MccBoard.AIn and MccDaq.MccBoard.ToEngUnits,
you will read a raw data point from a channel on an Measurement
Computing device, convert the data point to volts, and show the value
on a meter.
Before You Begin
The following components are required to complete this walkthrough:
• Microsoft Visual Studio .NET 2003 or Microsoft Visual Studio 2005
• Measurement Studio Measurement Computing Edition
• Universal Library
• Measurement Computing DAQ device
Note For information about installing and configuring your Measurement Computing
DAQ device, refer to the Quick Start Guide that ships with your device. You can also use
the DEMO-BOARD simulated DAQ device to complete this walkthrough.
Setting up the project
1. Select Start»All Programs»Microsoft Visual Studio .NET 2003»
Microsoft Visual Studio .NET 2003.
2. Select File»New»Project. The New Project dialog box launches.
3. In the Project Types pane, expand the Measurement Studio Projects
folder. Select Visual Basic Projects or Visual C# Projects, depending
on which language you want to create the project in.
4. In the Templates pane, select Windows Application. Specify
MyMCCDAQProject for Name and specify a Location of your choice.
5. Click OK. The Measurement Studio Application Wizard launches.
6. Select MCC Universal Library and Windows Forms User Interface
Controls. When you select these libraries, the Measurement Studio
Measurement Studio for MCC User Manual 4-10 ni.com
Page 62

Chapter 4 Getting Started with Measurement Studio
Application Wizard automatically adds references to the appropriate
class libraries.
Tip If you are working with an existing project, you can access the Add Class Libraries
dialog box by selecting Measurement Studio»Add/Remove Class Libraries Wizard.
7. Click Finish to display
Form1 in the Windows Forms Designer.
Adding user interface controls to the project
1. Select View»Toolbox to display the Toolbox. The Toolbox contains
components and controls that you can add to your project.
2. Select the Windows Forms tab. The Windows Forms tab contains
controls and components included in the
System.Windows.Forms
namespace.
3. Select the Button control and drag and drop it onto the form.
4. Right-click the button and select Properties to display the Properties
window. You configure the properties of the control in the Properties
window.
5. The Text property will be highlighted. Type
Start for the button text.
6. Select the Measurement Studio .NET Tools tab on the Toolbox.
© National Instruments Corporation 4-11 Measurement Studio for MCC User Manual
Page 63

Chapter 4 Getting Started with Measurement Studio
7. Select the Meter control and drag and drop it onto the form.
8. Right-click the meter and select Properties to display the Properties
window.
9. Set the
CoercionIntervalBase property for the meter to –10.
10. Set the Range property for the meter with the drop-down Range type
editor. Type
the maximum value.
The following screenshot shows
–10 for the minimum value. Leave the default of 10 for
Form1 with the user controls.
Generating and displaying the data
1. Double-click on Form1 to display the
Form1 code.
2. Add the following code to declare a new Measurement Computing
board object.
[VB.NET]
' Declare a new Measurement Computing board object that uses board 0
Public DaqBoard As MccDaq.MccBoard = New MccDaq.MccBoard(0)
[C#]
private System.Windows.Forms.Button button1;
private MccDaq.MccBoard daqBoard;
private NationalInstruments.UI.WindowsForms.Meter meter1;
/// <summary>
/// Required designer variable.
/// </summary>
Measurement Studio for MCC User Manual 4-12 ni.com
Page 64

Chapter 4 Getting Started with Measurement Studio
private System.ComponentModel.Container components = null;
public Form1()
{
// Required for Windows Form Designer support
InitializeComponent();
daqBoard =new MccDaq.MccBoard(0);
3. Scroll down to move the cursor inside the click event handler of the
button control.
4. Add the following code to read a raw data point from a specified
channel on the Measurement Computing device, convert the data to
volts, and display the value on the meter.
[VB.NET]
'Set channel, range, raw value, and volt variables.
Dim Channel As Integer = 0
Dim Range As MccDaq.Range = MccDaq.Range.Bip10Volts
Dim RawValue As Integer = 0
Dim Volts As Double = 0.0F
' Perform analog input operation with Measurement Computing board,
' channel, and range, and return raw value.
DaqBoard.AIn(Channel, Range, RawValue)
' Convert raw value to engineering units.
DaqBoard.ToEngUnits(Range, RawValue, Volts)
' Display value on meter.
Meter1.Value = Volts
[C#]
// Set channel, range, raw value, and volt variables.
int channel = 0;
MccDaq.Range range =MccDaq.Range.Bip10Volts;
ushort rawValue =0;
float volts =0.0f;
// Perform analog input operation with Measurement Computing board,
/// channel, and range, and return raw value.
daqBoard.AIn(channel, range, out rawValue);
// Convert raw value to engineering units.
daqBoard.ToEngUnits(range, rawValue, out volts);
// Display value on meter.
meter1.Value =volts;
2003
5. Select File»Save Form1.cs to save your application.
6. Select Debug»Start Without Debugging to run the application.
7. After your program builds and runs, click Start. Notice each time you
click the Start button, the meter shows the acquired value.
© National Instruments Corporation 4-13 Measurement Studio for MCC User Manual
Page 65

Chapter 4 Getting Started with Measurement Studio
The following screenshot shows Form1 with the meter displaying the
acquired value.
Walkthrough: Creating a Measurement Studio MCCDaq Scan Components Application in Visual Studio .NET 2003
Measurement Studio includes a component library and application
templates that you can use to quickly create MccDaq Components
applications with Visual Basic .NET and Visual C#.
Measurement Studio Measurement Computing Edition includes user
interface controls, such as a waveform graph control, and MccDaq scan
components that perform analog input scans and analog output scans. This
walkthrough is designed to help you learn how to add analog scan and
presentation functionality to a Windows Forms application by taking you
through the following steps:
• Setting up the project—Using the Visual Studio New Project dialog
box, you will create a new project that references the Measurement
Studio MccDaq Scan Components library and Windows Forms
controls.
• Adding user interface controls to the project—Using the Toolbox
and the Properties window, you will add and configure user interface
controls and
waveform graph, and an
Measurement Studio for MCC User Manual 4-14 ni.com
MccDaq.Scan components, including a button and
AiScan component.
Page 66

Chapter 4 Getting Started with Measurement Studio
• Generating and displaying the data—Using the MccDaq.Scan
components, you will read data from a channel on an Measurement
Computing device, convert the data object to an array, and show the
value on a waveform graph.
Before You Begin
The following components are required to complete this walkthrough:
• Microsoft Visual Studio .NET 2003 or Microsoft Visual Studio 2005
• Measurement Studio Measurement Computing Edition
• MccDaq Scan Components
• Measurement Computing DAQ device
Note For information about installing and configuring your Measurement Computing
DAQ device, refer to the Quick Start Guide that ships with your device. You can also use
the DEMO-BOARD simulated DAQ device to complete this walkthrough.
Setting up the project
1. Select Start»All Programs»Microsoft Visual Studio .NET 2003»
Microsoft Visual Studio .NET 2003.
2. Select File»New»Project. The New Project dialog box launches.
© National Instruments Corporation 4-15 Measurement Studio for MCC User Manual
Page 67

Chapter 4 Getting Started with Measurement Studio
3. In the Project Types pane, expand the Measurement Studio Projects
folder. Select Visual Basic Projects or Visual C# Projects, depending
on which language you want to create the project in.
4. In the Templates pane, select Windows Application. Specify
MyMCCScanProject for Name and specify a Location of your
choice.
5. Click OK. The Measurement Studio Application Wizard launches.
6. Select Windows Forms User Interface Controls. When you select
this library, the Measurement Studio Application Wizard
automatically adds references to the appropriate class libraries.
Tip If you are working with an existing project, you can access the Add Class Libraries
dialog box by selecting Measurement Studio»Add/Remove Class Libraries Wizard.
7. Click Finish to display
Measurement Studio for MCC User Manual 4-16 ni.com
Form1 in the Windows Forms Designer.
Page 68

Chapter 4 Getting Started with Measurement Studio
Adding user interface controls to the project
1. Select View»Toolbox to display the Toolbox. The Toolbox contains
components and controls that you can add to your project.
2. Select the Windows Forms tab. The Windows Forms tab contains
controls and components included in the
System.Windows.Forms
namespace.
3. Select the Button control and drag and drop it onto the form.
4. Right-click the button and select Properties to display the Properties
window. You configure the properties of the control in the Properties
window.
5. The Text property is highlighted. Type
Start Scan for the button
text.
6. Select another button control and drag and drop it onto the form. Type
Stop Scan for the button text.
7. Select the Measurement Studio .NET Tools tab on the Toolbox.
8. Select the Waveform graph control and drag and drop it onto the
form.
9. Double-click the AIScan component (
aiScan1) to add it to the
component tray beneath the form.
10. Right-click the AIScan component (
aiScan1) and select Properties
to display the Properties window.
11. Click on the ClockRate property and type
500 for this property
setting.
© National Instruments Corporation 4-17 Measurement Studio for MCC User Manual
Page 69

Chapter 4 Getting Started with Measurement Studio
The following screenshot shows Form1 with the user controls. The AIScan
component is shown in the component tray.
Generating and displaying the data
1. Double-click the Start button to display the
2. Add the following line of code to start an analog in scan.
Form1 code.
[VB.NET]
' This starts the scan
AIScan1.Start()
[C#]
// This starts the scan
private void button1_Click(object sender, System.EventArgs e)
{
aiScan1.Start();
}
3. Double-click on the Stop Scan button to open the code window.
4. Add the following line of code that stops the analog in scan.
[VB.NET]
' This stops the scan
AiScan1.Stop()
Measurement Studio for MCC User Manual 4-18 ni.com
Page 70

Chapter 4 Getting Started with Measurement Studio
[C#]
// This stops the scan
private void button2_Click(object sender, System.EventArgs e)
{
aiScan1.Stop();
}
5. Double-click the AIScan component to open the code window.
6. Add the following lines of code to the
aiScan1 component to copy the analog data to an array.
DataReady event of the
[VB.NET]
Private Sub AiScan1_DataReady(ByVal sender As Object, ByVal e As System.EventArgs) Handles AiScan1.DataReady
WaveformGraph1.PlotY(AiScan.GetSingleChannelValues(), 0, 1.0 /
AiScan1.ActualRate)
[C#]
private void aiScan1_DataReady(object sender, System.EventArgs e)
{
waveformGraph1.PlotY(AiScan.GetSingleChannelValues(), 0,
1.0/aiScan1.ActualRate);
}
7. Add the following lines of code to the ErrorOccurred event of the
aiScan1 component to display a message box if an error occurs.
[VB.NET]
Private Sub AiScan1_ErrorOccurred(ByVal sender As Object, ByVal e As
MccDaq.ScanComponents.ErrorOccurredEventArgs) Handles AiScan1.ErrorOccurred
AiScan1.Stop()
MessageBox.Show(AiScan1.Status, "AI Scan Error")
End Sub
[C#]
private void aiScan1_ErrorOccurred(object sender,
MccDaq.ScanComponents.ErrorOccurredEventArgs e)
{
aiScan1.Stop();
MessageBox.Show(aiScan1.Status, "AI Scan Error");
}
© National Instruments Corporation 4-19 Measurement Studio for MCC User Manual
Page 71

Chapter 4 Getting Started with Measurement Studio
8. Select File»Save Form1.cs to save your application.
9. Select Debug»Start Without Debugging to run the application.
10. After your program builds and runs, click Start Scan.
The following screenshot shows
displaying the acquired values.
Form1 with the waveform graph
Walkthrough: Creating a Measurement Studio MCC-488.2 Application in Visual Studio .NET 2003
• Setting up the project—Using the Visual Studio New Project dialog
box, you will create a new project that references the Measurement
Studio MCC-488.2 class library and Windows Forms controls.
• Adding user interface controls to the project—Using the Toolbox
and the Properties window, you will add and configure user interface
controls, including a button and waveform graph.
• Generating and displaying data—Using
MCC.488.2.Address, you will read and plot 100 data points data
point from a GPIB device at the specified address.
MCC.488.2.Device and
Before You Begin
The following components are required to complete this walkthrough:
• Microsoft Visual Studio .NET 2003 or Microsoft Visual Studio 2005
• Measurement Studio Measurement Computing Edition
Measurement Studio for MCC User Manual 4-20 ni.com
Page 72

Chapter 4 Getting Started with Measurement Studio
• MCC-488.2 Library
• Measurement Computing GPIB Device
Setting up the project
1. Open Visual Studio .NET from Start»All Programs»Microsoft
Visual Studio .NET 2003»Microsoft Visual Studio .NET 2003.
2. Select File»New»Project. The New Project dialog box launches.
3. In the Project Types pane, expand the Measurement Studio Projects
folder. Select Visual Basic Projects or Visual C# Projects, depending
on which language you want to create the project in. This walkthrough
refers to Visual C#, but Visual Basic .NET users can follow the same
process.
4. In the Templates pane, select Windows Application. Specify
MyMCCGPIBProject for Name and select a Location of your choice.
5. Click OK. The Measurement Studio Application Wizard launches.
Tip If you are working with an existing project, you can access the Add Class Libraries
dialog box by selecting Measurement Studio»Add/Remove Class Libraries Wizard.
6. In the Application Wizard dialog box, select Windows Forms User
Interface Controls and MCC-488.2 Library. The wizard
automatically adds references to the appropriate class libraries and sets
up the project for you.
© National Instruments Corporation 4-21 Measurement Studio for MCC User Manual
Page 73

Chapter 4 Getting Started with Measurement Studio
7. Click Finish to display Form1 in the Windows Forms Designer.
Adding user interface controls to the project
1. Select View»Toolbox to display the Toolbox. The Toolbox contains
components and controls that you can add to your project.
2. Select the Windows Forms tab. The Windows Forms tab contains
controls and components included in the
System.Windows.Forms
namespace.
3. Select the Button control and drag and drop it onto the form.
4. Right-click the button and select Properties to display the Properties
window. You configure the properties of the control in the Properties
window.
5. The Text property is highlighted. Type
Run for the button text.
6. Select the WaveformGraph control and drag and drop it onto the
form.
7. The following screenshot shows
Form1 with the user controls.
Measurement Studio for MCC User Manual 4-22 ni.com
Page 74

Chapter 4 Getting Started with Measurement Studio
Generating and displaying the data
1. Double-click the button control to display the
Form1 code, with the
cursor inside the click event handler of the button control.
2. Add the following code to read a raw data point from a specified
channel on the Measurement Computing device, convert the data to
volts, and display the value on the graph.
[VB.NET]
Dim I As Integer
Dim WrtString As String = "val?"
Dim RdBufSize As Integer = 100
Dim NlChar As Char = "\n"
Dim NullChar As Char = "\0"
Dim PrimaryAddress As New Address(2)
Dim BoardNum As Integer = 0
' Open a gpib device
Dim Device As New Device(BoardNum, PrimaryAddress)
' Allocate a buffer to hold the data
Dim Buffer As IntPtr =
System.Runtime.InteropServices.Marshal.AllocHGlobal(RdBufSize)
' Read and plot 100 samples
For I = 0 To 99
' Write the string (val?) to the Fluke45
Device.Write(WrtString)
' Read the response from the Fluke45
Dim S As String = Device.ReadString(RdBufSize)
' Replace the newline character with a null and
© National Instruments Corporation 4-23 Measurement Studio for MCC User Manual
Page 75

Chapter 4 Getting Started with Measurement Studio
' convert the string to a double
Dim D As Double = Convert.ToDouble(S.Replace(NlChar, NullChar))
'Plot the point
WaveformGraph1.PlotYAppend(D, 1)
Next
System.Runtime.InteropServices.Marshal.FreeHGlobal(Buffer)
[C#]
stringwrtString = "val?";
int rdBufSize = 100;
char nlChar = '\n';
char nullChar = '\0';
addressprimaryAddress = new Address(2);
int boardNum = 0;
// open a gpib device
Device device = new Device(boardNum, primaryAddress);
// allocate a buffer to hold the data
IntPtr buffer =
System.Runtime.InteropServices.Marshal.AllocHGlobal(rdBufSize);
// read and plot 100 samples
for (int i=0; i<100; i++)
{
// write the string (val?) to the Fluke45
device.Write(wrtString);
// read the response from the Fluke45
string s = device.ReadString(rdBufSize);
// replace the newline character with a null and
// convert the string to a double
double d = Convert.ToDouble(s.Replace(nlChar, nullChar));
// plot the point
waveformGraph1.PlotYAppend(d, 1);
}
System.Runtime.InteropServices.Marshal.FreeHGlobal(buffer);
3. Select File»Save Form1.cs to save your application.
4. Select Debug»Start Without Debugging to run the application.
5. After your program builds and runs, click Run. Notice each time you
click the Run button, the graph shows the acquired value.
Measurement Studio for MCC User Manual 4-24 ni.com
Page 76

Chapter 4 Getting Started with Measurement Studio
The following screenshot shows Form1 with the graph displaying the
acquired value.
Measurement Studio Walkthroughs for Visual Studio 2005
Use the following walkthroughs to help you develop Measurement Studio
applications in Visual Studio 2005:
• Walkthrough: Creating a Measurement Studio Application with
Windows Forms Controls and Analysis in Visual Studio 2005
• Walkthrough: Creating a Measurement Studio Application with Web
Forms Controls and Analysis in Visual Studio 2005
Note Refer to Walkthrough: Creating a Measurement Studio MCCDaq Scan Components
Application in Visual Studio .NET 2003, Walkthrough: Creating a Measurement Studio
MCC-488.2 Application in Visual Studio .NET 2003, and Walkthrough: Creating a
Measurement Studio Measurement Computing DAQ Application in Visual Studio .NET
2003 for more walkthroughs available in Visual Studio 2005.
© National Instruments Corporation 4-25 Measurement Studio for MCC User Manual
Page 77

Chapter 4 Getting Started with Measurement Studio
Walkthrough: Creating a Measurement Studio Application with Windows Forms Controls and Analysis in Visual Studio 2005
Measurement Studio includes user interface controls, such as a waveform
graph control and a gauge control, and analysis functionality such as signal
generation and mathematical functions. This walkthrough is designed to
help you learn how to add analysis and presentation functionality to a
Windows Forms application by taking you through the following steps:
• Setting up the project—Using the Measurement Studio Application
Wizard, you will create a new project that references the Measurement
Studio Analysis class library and Windows Forms controls.
• Adding user interface controls to the project—Using the Toolbox,
smart tags, and the Properties window, you will add and configure a
button, waveform graph, legend, gauge, and numeric edit user
interface control.
• Generating, plotting, and analyzing the data—Using
NationalInstruments.Analysis.SignalGeneration.White
NoiseSignal
NationalInstruments.Analysis.Math.Statistics.Mean,
you will generate data, plot the generated data on a waveform graph,
and calculate the mean of the data.
• Customizing the user interface—Using smart tags and the Collection
Editor and Auto Format dialog boxes, you will display the mean value
on the gauge and the numeric edit, as well as customize your user
interface.
and
Before You Begin
The following components are required to complete this walkthrough:
• Microsoft Visual Studio 2005
• Measurement Studio Measurement Computing Edition
Setting up the project
1. Select Start»All Programs»Microsoft Visual Studio 2005»
Microsoft Visual Studio 2005.
2. Select File»New»Project. The New Project dialog box launches.
Measurement Studio for MCC User Manual 4-26 ni.com
Page 78

Chapter 4 Getting Started with Measurement Studio
3. In the Project types pane, select Measurement Studio under Visual
C# or Visual Basic, depending on which language you want to create
the project in.
4. In the Templates pane, select NI Windows Application. Specify
MyMeasurementStudioProject for Name and specify a Location
of your choice.
5. Click OK. The Measurement Studio Application Wizard launches.
6. Select Analysis and Windows Forms User Interface Controls.
© National Instruments Corporation 4-27 Measurement Studio for MCC User Manual
Page 79

Chapter 4 Getting Started with Measurement Studio
Tip IIf you are working with an existing project, you can access the Add/Remove Class
Libraries dialog box by selecting Measurement Studio»View .NET Class Library
Wizard.
7. Click Finish to display
Measurement Studio for MCC User Manual 4-28 ni.com
Form1 in the Windows Forms Designer.
Page 80

Chapter 4 Getting Started with Measurement Studio
Adding user interface controls to the project
In this section, you will build a user interface that looks like
Form1 in the
following screenshot.
1. Select View»Toolbox to display the Toolbox. The Toolbox contains
components and controls that you can add to your project.
2. Expand the All Windows Forms group. The All Windows Forms
group contains controls and components included in the
System.Windows.Forms namespace.
3. Select the Button control and drag and drop it onto the form.
4. Right-click the button and select Properties to display the Properties
window. You configure the properties of the control in the Properties
window.
5. The Text property is highlighted. Type
Start for the button text.
6. Expand the Measurement Studio group in the Toolbox.
© National Instruments Corporation 4-29 Measurement Studio for MCC User Manual
Page 81

Chapter 4 Getting Started with Measurement Studio
7. Select the WaveformGraph control and drag and drop it onto the
form.
8. Right-click the waveform graph and select Edit Plots to display the
WaveformPlot Collection Editor dialog box. You use the
WaveformPlot Collection Editor to add or remove plots and to
configure plot properties.
Measurement Studio for MCC User Manual 4-30 ni.com
Page 82

Chapter 4 Getting Started with Measurement Studio
Note You can also access the WaveformPlot Collection Editor dialog box by clicking the
waveform graph smart tag. You access the smart tag by right-clicking the arrow button in
the upper right corner of the control.
9. Type
Plot for the Name. Click OK.
10. Before you add the Measurement Studio legend, numeric edit, and
gauge controls, you need to resize the form to accommodate them.
Select the form and use the double-sided arrow to resize it.
11. Select the Legend control and drag and drop it onto the form.
12. Select the NumericEdit control and drag and drop it onto the form.
13. Select the Gauge control and drag and drop it onto the form.
14. Click the gauge smart tag to display the Gauge Tasks. You access the
smart tag by right-clicking the arrow button in the upper right corner
of the control.
15. Type
© National Instruments Corporation 4-31 Measurement Studio for MCC User Manual
gauge for the name of the gauge.
Page 83

Chapter 4 Getting Started with Measurement Studio
The following screenshot shows Form1 with the user controls.
Measurement Studio for MCC User Manual 4-32 ni.com
Page 84

Chapter 4 Getting Started with Measurement Studio
Generating, plotting, and analyzing the data
1. Double-click the button control to display the
cursor inside the click event handler of the button control.
2. Add the following code to generate random data, plot the data,
calculate the mean of the data, and display the mean on the gauge.
[VB.NET]
' Declare and initialize an instance of WhiteNoiseSignal.
Dim whiteNoise As New WhiteNoiseSignal()
' Store the generated data in a double array named data.
Dim data As Double() = whiteNoise.Generate(1000.0, 256)
' Use the PlotY method to plot the data.
Plot.PlotY(data)
' Use the Mean method to calculate the mean of the data.
Dim mean As Double = Statistics.Mean(data)
' Display the mean on the gauge.
gauge.Value = mean
[C#]
// Declare and initialize an instance of WhiteNoiseSignal.
WhiteNoiseSignal whiteNoise = new WhiteNoiseSignal();
// Store the generated data in a double array named data.
double[] data = whiteNoise.Generate(1000.0, 256);
// Use the PlotY method to plot the data.
Plot.PlotY(data);
// Use the Mean method to calculate the mean of the data.
double mean = Statistics.Mean(data);
// Display the mean on the gauge.
gauge.Value = mean;
Form1 code, with the
© National Instruments Corporation 4-33 Measurement Studio for MCC User Manual
Page 85

Chapter 4 Getting Started with Measurement Studio
Customizing your user interface
1. Right-click the legend and select Edit Items to display the LegendItem
Collection Editor dialog box. You use the LegendItem Collection
Editor to add or remove legend items and to configure legend item
properties.
2. Select Plot in the Source drop-down list and enter
Signal in the Tex t
box. Click OK. Now that you have specified a legend item for the plot,
changes you make to the plot are reflected on the legend.
3. Right-click the graph and select Auto Format to display the Auto
Format dialog box. The Auto Format dialog box provides a set of
pre-configured control styles. When you select a style and click OK,
the Auto Format feature configures the appropriate control properties
to reflect the style you chose.
4. Select Points Only. Click OK. Notice that the legend changed
automatically to match the formatting of the graph.
Measurement Studio for MCC User Manual 4-34 ni.com
Page 86

Chapter 4 Getting Started with Measurement Studio
5. Click the gauge smart tag to display the Gauge Tasks.
6. Select Auto Format to display the Auto Format dialog box.
7. Select Dark and click OK.
8. Right-click the gauge and select Properties to display the Properties
window.
9. Set the Range property for the gauge with the drop-down Range type
editor. Type
-0.2 for the minimum value and type 0.2 for the
maximum value.
10. Click the numeric edit smart tag to display the Numeric Edit Tasks.
11. Select Gauge in the Source drop-down list. Setting the Source
property to the gauge allows two-way binding between the controls.
12. Deselect ArrowKeys, Buttons, and Tex t for the InteractionMode
property of the numeric edit control. Deselecting these interaction
modes makes the numeric edit an indicator. The numeric edit control
only displays the calculated mean.
13. Select the Format Mode property and in the Numeric Edit Format
Mode Editor dialog box, change the Precision to
4 to show four
decimal places of precision.
14. Select File»Save Form1.cs to save your application.
15. Select Debug»Start Without Debugging to run the application.
© National Instruments Corporation 4-35 Measurement Studio for MCC User Manual
Page 87

Chapter 4 Getting Started with Measurement Studio
16. After your program builds and runs, click Start. Notice the graph
shows the data plot, and the gauge and the numeric edit display the
mean of the data.
17. The following screenshot shows
Form1 with customization.
Walkthrough: Creating a Measurement Studio Application with Web Forms Controls and Analysis in Visual Studio 2005
Measurement Studio includes user interface controls, such as a waveform
graph control and a gauge control, and analysis functionality such as signal
generation and mathematical functions. This walkthrough is designed to
help you learn how to add analysis and presentation functionality to a Web
Forms application by taking you through the following steps:
• Setting up the project—Using the Measurement Studio Application
Wizard, you will create a new project that references the Measurement
Studio Analysis class library and Web Forms controls.
• Adding user interface controls to the project—Using the Toolbox
and the Properties window, you will add and configure a button,
waveform graph, legend, gauge, and numeric edit user interface
control.
• Generating, plotting, and analyzing the data—Using
WhiteNoiseSignal and Mean, you will generate data, plot the
generated data on a waveform graph, and calculate the mean of
the data.
Measurement Studio for MCC User Manual 4-36 ni.com
Page 88

Chapter 4 Getting Started with Measurement Studio
• Customizing the user interface—Using the Collection Editor and
Auto Format dialog boxes, you will display the mean value on the
gauge and the numeric edit, as well as customize your user interface.
Before You Begin
The following components are required to complete this walkthrough:
• Microsoft Visual Studio 2005
• Measurement Studio Measurement Computing Edition
Setting up the project
1. Select Start»All Programs»Microsoft Visual Studio 2005»
Microsoft Visual Studio 2005.
2. Select File»New»Web Site. The New Web Site dialog box launches.
3. In the Templates pane, select Measurement Studio ASP.NET Web
Site. Select File System and specify a Location of your choice.
4. Use the drop-down box to select Visual C# or Visual Basic, depending
on which language you want to create the project in.
© National Instruments Corporation 4-37 Measurement Studio for MCC User Manual
Page 89

Chapter 4 Getting Started with Measurement Studio
5. Click OK. The Measurement Studio ASP.NET Web Site Wizard
launches.
6. Select Analysis and Web Forms User Interface Controls.
Tip If you are working with an existing project, you can access the Measurement Studio
ASP.NET Web Site Wizard dialog box by selecting Measurement Studio»View .NET
Class Library Wizard.
7. Click Finish to display
Measurement Studio for MCC User Manual 4-38 ni.com
Default.aspx in the Web Forms Designer.
Page 90

Chapter 4 Getting Started with Measurement Studio
Adding user interface controls to the project
In this section, you will build a Web page that looks like the following
screenshot.
1. Select View»Toolbox to display the Toolbox. The toolbox contains
components and controls that you can add to your project.
2. Click Design to switch from Source View to Design View.
3. Select View»Toolbox to display the Toolbox. The toolbox contains
components and controls that you can add to your project.
4. Expand the HTML group on the Toolbox. Select the Table control in
the toolbox and drag and drop it onto the form. You use the table cells
to arrange the user interface controls on your Web page, as shown in
the previous screenshot.
5. Expand the Standard group on the Toolbox. The Standard group
contains ASP.NET server controls included in the
System.Web.UI
namespace.
6. Select the Button control in the toolbox and drag and drop it into a
table cell.
7. Right-click the button and select Properties to display the Properties
window. You configure the properties of the control in the Properties
window.
© National Instruments Corporation 4-39 Measurement Studio for MCC User Manual
Page 91

Chapter 4 Getting Started with Measurement Studio
8. Scroll to the Text property in the Properties window. Type Start for
the button text.
9. Select the Measurement Studio tab on the Toolbox.
10. Select the WaveformGraph control and drag and drop it into a
table cell.
11. On the waveform graph smart tag, type graph for the name of the
waveform graph ID.
Tip You access the smart tag by right-clicking the arrow button in the upper right corner
of the control.
12. Select the Legend control and drag and drop it into a table cell.
13. Select the NumericEdit control and drag and drop it into a table cell.
Measurement Studio for MCC User Manual 4-40 ni.com
Page 92

Chapter 4 Getting Started with Measurement Studio
14. On the numeric edit smart tag, type numericedit for the Name of the
numeric edit ID.
15. Select the Gauge control and drag and drop it into a table cell.
16. On the gauge smart tag, type
gauge for the Name of the gauge ID. The
following screenshot shows the Web page with the user controls.
© National Instruments Corporation 4-41 Measurement Studio for MCC User Manual
Page 93

Chapter 4 Getting Started with Measurement Studio
Generating, plotting, and analyzing the data
1. Double-click the button control to display the
code, with the cursor inside the click event handler of the button
control.
2. Add the following code to generate random data, plot the data,
calculate the mean of the data, and display the mean on the gauge.
[VB.NET]
' Declare and initialize an instance of WhiteNoiseSignal.
Dim whiteNoise As New WhiteNoiseSignal()
' Store the generated data in a double array named data.
Dim data As Double() = whiteNoise.Generate(1000.0, 256)
' Use the PlotY method to plot the data.
Plot.PlotY(data)
' Use the Mean method to calculate the mean of the data.
Dim mean As Double = Statistics.Mean(data)
' Display the mean on the gauge.
gauge.Value = mean
Default.aspx.cs
Measurement Studio for MCC User Manual 4-42 ni.com
Page 94

Chapter 4 Getting Started with Measurement Studio
[C#]
// Declare and initialize an instance of WhiteNoiseSignal.
WhiteNoiseSignal whiteNoise = new WhiteNoiseSignal();
// Store the generated data in a double array named data.
double[] data = whiteNoise.Generate(1000.0, 256);
// Use the PlotY method to plot the data.
Plot.PlotY(data);
// Use the Mean method to calculate the mean of the data.
double mean = Statistics.Mean(data);
// Display the mean on the gauge.
gauge.Value = mean;
Customizing your user interface
1. Select the Default.aspx tab to return to the Web Forms Designer.
2. Right-click the legend and select Edit Items to display the LegendItem
Collection Editor dialog box. You use the LegendItem Collection
Editor to add or remove legend items and to configure legend item
properties.
© National Instruments Corporation 4-43 Measurement Studio for MCC User Manual
Page 95

Chapter 4 Getting Started with Measurement Studio
3. Select graph, Plots[0] in the Source drop-down list and enter Signal
in the Tex t box. Click OK. Now that you have specified a legend item
for the plot, changes you make to the plot are reflected on the legend.
4. Right-click the graph and select Auto Format to display the Auto
Format dialog box. The Auto Format dialog box provides a set of
pre-configured control styles. When you select a style and click OK,
the Auto Format feature configures the appropriate control properties
to reflect the style you chose.
5. Select Points Only. Click OK. Notice that the legend changed
automatically to match the formatting of the graph.
6. Right-click the gauge and select Auto Form at to display the Auto
Format dialog box.
Measurement Studio for MCC User Manual 4-44 ni.com
Page 96

Chapter 4 Getting Started with Measurement Studio
7. Select Dark and click OK.
8. Right-click the gauge and select Properties to display the Properties
window.
9. Set the Range property for the gauge with the drop-down Range type
editor. Type
-0.2 for the minimum value and type 0.2 for the
maximum value.
10. Right-click the numeric edit and select Properties to display the
Properties window.
11. Select Gauge in the Source drop-down list. Setting the Source
property to the gauge allows two-way binding between the controls.
12. Deselect ArrowKeys, Buttons, and Tex t for the InteractionMode
property of the numeric edit control. Deselecting these interaction
modes makes the numeric edit an indicator.
13. Select the Format Mode property and in the Numeric Edit Format
Mode Editor dialog box, change the Precision to
4.
14. Select File»Save Form1.cs to save your application.
15. Select Debug»Start Without Debugging to run the application.
16. After your program builds and runs, click Start. Notice the graph
shows the data plot, and the gauge and the numeric edit display the
mean of the data.
© National Instruments Corporation 4-45 Measurement Studio for MCC User Manual
Page 97

Chapter 4 Getting Started with Measurement Studio
The following screenshot shows the Web page with customization.
Measurement Studio for MCC User Manual 4-46 ni.com
Page 98

Contacting Measurement
Computing Corp.
You can reach Measurement Computing Corp. through the following ways:
Mail
Measurement Computing Corp.
16 Commerce Blvd.
Middleboro, MA 02346
Telephone
508-946-5100
FAX
508-946-9500
Technical Support
techsupport@MeasurementComputing.com
A
Sales
sales@measurementcomputing.com
Other correspondence
info@measurementcomputing.com
Visit our Web site at www.measurementcomputing.com.
© National Instruments Corporation A-1 Measurement Studio for MCC User Manual
Page 99

Glossary
A
analog I/O Reading or writing data in continuously variable physical quantities, such
as voltage or current.
annotate Adding text, arrows, or shapes to describe or highlight a point or region on
a graph.
API Application Programming Interface. A specification of software functions
and their input and return parameters.
array control An array of Measurement Studio user interface controls that behave as a
single unit.
assembly A collection of one or more files that are versioned and deployed as a unit.
An assembly is the primary building block of a .NET Framework
application. All managed types and resources are contained within an
assembly and are marked either as accessible only within the assembly or
as accessible from code in other assemblies.
asynchronous Function that begins an operation and returns control to the program prior
to the completion or termination of the operation.
B
button A control used to input or display Boolean information or to initiate an
action in a program.
C
chart To append new data points to the end of an existing plot over time.
client callback In Web Forms, page calls back to the server without fully posting back.
Callbacks are asynchronous and are accomplished with XML-HTTP.
Client callbacks do not include postback data, and they do not force the
page to refresh. Client callbacks do require a browser that supports the
XML-HTTP protocol.
© National Instruments Corporation G-1 Measurement Studio for MCC User Manual
Page 100

Glossary
coercion Automatic conversion that Measurement Studio controls perform to change
the numeric representation of a data element.
complex graph A control that displays a
data type represents a complex number of type
ComplexDouble data type; the ComplexDouble
Double that is composed of
a real part and an imaginary part.
context-sensitive help Help for dialog boxes, the controls in dialog boxes, and keywords in source
code that you can access with the key or a Help button, or by clicking the
link that appears in the Dynamic Help window in Visual Studio.
control Object for entering, displaying, or manipulating data on a user interface.
counter/timer I/O Reading or writing data based on high-precision timing through a counter
or timer. By combining a counter with a highly accurate clock, you can
create a wide variety of timing and counting applications, such as
monitoring and analyzing digital waveforms and generating complex
square waves.
cursor Flashing rectangle that shows where you may enter text on the screen. If
you have a mouse installed, there is a rectangular mouse cursor, or pointer.
cursor label Text object used to display X and Y coordinates that a cursor crosshair
points to on a graph.
D
DAQ Data acquisition. Process of acquiring data, typically from A/D or digital
input plug-in boards.
DAQ device A device that acquires or generates data and can contain multiple channels
and conversion devices. DAQ devices include plug-in devices which
connect to a computer USB port or PCI bus.
device An instrument or controller you can access as a single entity that controls
or monitors real-world I/O points. A device is often connected to a host
computer through some type of communication network.
digital I/O Reading or writing digital representations of data in discrete units (the
binary digits 1 and 0). Digital information is either on or off.
digital waveform graph A control that displays
Web Forms user interface; the
DigitalWaveform data on a Windows Forms or
DigitalWaveform data type represents a
set of digital states that are grouped by samples or signals.
Measurement Studio for MCC User Manual G-2 ni.com
 Loading...