

Page 1

LabVIEWTM SignalExpress
Getting Started with LabVIEW SignalExpress
Getting Started with LabVIEW SignalExpress
TM
August 2007
373873C-01
Page 2

Support
Worldwide Technical Support and Product Information
ni.com
National Instruments Corporate Headquarters
11500 North Mopac Expressway Austin, Texas 78759-3504 USA Tel: 512 683 0100
Worldwide Offices
Australia 1800 300 800, Austria 43 662 457990-0, Belgium 32 (0) 2 757 0020, Brazil 55 11 3262 3599,
Canada 800 433 3488, China 86 21 5050 9800, Czech Republic 420 224 235 774, Denmark 45 45 76 26 00,
Finland 385 (0) 9 725 72511, France 01 57 66 24 24, Germany 49 89 7413130, India 91 80 41190000,
Israel 972 3 6393737, Italy 39 02 413091, Japan 81 3 5472 2970, Korea 82 02 3451 3400,
Lebanon 961 (0) 1 33 28 28, Malaysia 1800 887710, Mexico 01 800 010 0793, Netherlands 31 (0) 348 433 466,
New Zealand 0800 553 322, Norway 47 (0) 66 90 76 60, Poland 48 22 3390150, Portugal 351 210 311 210,
Russia 7 495 783 6851, Singapore 1800 226 5886, Slovenia 386 3 425 42 00, South Africa 27 0 11 805 8197,
Spain 34 91 640 0085, Sweden 46 (0) 8 587 895 00, Switzerland 41 56 2005151, Taiwan 886 02 2377 2222,
Thailand 662 278 6777, Turkey 90 212 279 3031, United Kingdom 44 (0) 1635 523545
For further support information, refer to the Technical Support and Professional Services appendix. To comment
on National Instruments documentation, refer to the National Instruments Web site at ni.com/info and enter
the info code feedback.
© 2004–2007 National Instruments Corporation. All rights reserved.
Page 3

Important Information
Warranty
The media on which you receive National Instruments software are warranted not to fail to execute programming instructions, due to defects
in materials and workmanship, for a period of 90 days from date of shipment, as evidenced by receipts or other documentation. National
Instruments will, at its option, repair or replace software media that do not execute programming instructions if National Instruments receives
notice of such defects during the warranty period. National Instruments does not warrant that the operation of the software shall be
uninterrupted or error free.
A Return Material Authorization (RMA) number must be obtained from the factory and clearly marked on the outside of the package before
any equipment will be accepted for warranty work. National Instruments will pay the shipping costs of returning to the owner parts which are
covered by warranty.
National Instruments believes that the information in this document is accurate. The document has been carefully reviewed for technical
accuracy. In the event that technical or typographical errors exist, National Instruments reserves the right to make changes to subsequent
editions of this document without prior notice to holders of this edition. The reader should consult National Instruments if errors are suspected.
In no event shall National Instruments be liable for any damages arising out of or related to this document or the information contained in it.
XCEPT AS SPECIFIED HEREIN, NATIONAL INSTRUMENTS MAKES NO WARRANTIES, EXPRESS OR IMPLIED, AND SPECIFICALLY DISCLAIMS ANY WAR RANTY OF
E
MERCHANTABILITY OR FITNESS FOR A PARTICULAR PURPOSE . CUSTOMER’S RIGHT TO RECOVER DAMAGES CAUSED BY FAULT OR NEGLIGENCE ON THE PART OF
N
ATIONAL INSTRUMENTS SHALL BE LIMITED TO THE AMOUNT THERETOFORE PAID BY THE CUSTOMER. NATIONAL INSTRUMENTS WILL NOT BE LIABLE FOR
DAMAGES RESULTING FROM LOSS OF DATA, PROFITS, USE OF PRODUCTS, OR INCIDENTAL OR CONSEQUENTIAL DAMAGES, EVEN IF ADVISED OF THE POSS IBILITY
THEREOF. This limitation of the liability of National Instruments will apply regardless of the form of action, whether in contract or tort, including
negligence. Any action against National Instruments must be brought within one year after the cause of action accrues. National Instruments
shall not be liable for any delay in performance due to causes beyond its reasonable control. The warranty provided herein does not cover
damages, defects, malfunctions, or service failures caused by owner’s failure to follow the National Instruments installation, operation, or
maintenance instructions; owner’s modification of the product; owner’s abuse, misuse, or negligent acts; and power failure or surges, fire,
flood, accident, actions of third parties, or other events outside reasonable control.
Copyright
Under the copyright laws, this publication may not be reproduced or transmitted in any form, electronic or mechanical, including photocopying,
recording, storing in an information retrieval system, or translating, in whole or in part, without the prior written consent of National
Instruments Corporation.
National Instruments respects the intellectual property of others, and we ask our users to do the same. NI software is protected by copyright
and other intellectual property laws. Where NI software may be used to reproduce software or other materials belonging to others, you may
use NI software only to reproduce materials that you may reproduce in accordance with the terms of any applicable license or other legal
restriction.
Trademarks
National Instruments, NI, ni.com, and LabVIEW are trademarks of National Instruments Corporation. Refer to the Terms of Use section
on ni.com/legal for more information about National Instruments trademarks.
Other product and company names mentioned herein are trademarks or trade names of their respective companies.
Members of the National Instruments Alliance Partner Program are business entities independent from National Instruments and have no
agency, partnership, or joint-venture relationship with National Instruments.
Patents
For patents covering National Instruments products, refer to the appropriate location: Help»Patents in your software, the patents.txt file
on your CD, or
ni.com/patents.
WARNING REGARDING USE OF NATIONAL INSTRUMENTS PRODUCTS
(1) NATIONAL INSTRUMENTS PRODUCTS ARE NOT DESIGNED WITH COMPONENTS AND TESTING FOR A LEVEL OF
RELIABILITY SUITABLE FOR USE IN OR IN CONNECTION WITH SURGICAL IMPLANTS OR AS CRITICAL COMPONENTS IN
ANY LIFE SUPPORT SYSTEMS WHOSE FAILURE TO PERFORM CAN REASONABLY BE EXPECTED TO CAUSE SIGNIFICANT
INJURY TO A HUMAN.
(2) IN ANY APPLICATION, INCLUDING THE ABOVE, RELIABILITY OF OPERATION OF THE SOFTWARE PRODUCTS CAN BE
IMPAIRED BY ADVERSE FACTORS, INCLUDING BUT NOT LIMITED TO FLUCTUATIONS IN ELECTRICAL POWER SUPPLY,
COMPUTER HARDWARE MALFUNCTIONS, COMPUTER OPERATING SYSTEM SOFTWARE FITNESS, FITNESS OF COMPILERS
AND DEVELOPMENT SOFTWARE USED TO DEVELOP AN APPLICATION, INSTALLATION ERRORS, SOFTWARE AND
HARDWARE COMPATIBILITY PROBLEMS, MALFUNCTIONS OR FAILURES OF ELECTRONIC MONITORING OR CONTROL
DEVICES, TRANSIENT FAILURES OF ELECTRONIC SYSTEMS (HARDWARE AND/OR SOFTWARE), UNANTICIPATED USES OR
MISUSES, OR ERRORS ON THE PART OF THE USER OR APPLICATIONS DESIGNER (ADVERSE FACTORS SUCH AS THESE ARE
HEREAFTER COLLECTIVELY TERMED “SYSTEM FAILURES”). ANY APPLICATION WHERE A SYSTEM FAILURE WOULD
CREATE A RISK OF HARM TO PROPERTY OR PERSONS (INCLUDING THE RISK OF BODILY INJURY AND DEATH) SHOULD
NOT BE RELIANT SOLELY UPON ONE FORM OF ELECTRONIC SYSTEM DUE TO THE RISK OF SYSTEM FAILURE. TO AVOID
DAMAGE, INJURY, OR DEATH, THE USER OR APPLICATION DESIGNER MUST TAKE REASONABLY PRUDENT STEPS TO
PROTECT AGAINST SYSTEM FAILURES, INCLUDING BUT NOT LIMITED TO BACK-UP OR SHUT DOWN MECHANISMS.
BECAUSE EACH END-USER SYSTEM IS CUSTOMIZED AND DIFFERS FROM NATIONAL INSTRUMENTS' TESTING
PLATFORMS AND BECAUSE A USER OR APPLICATION DESIGNER MAY USE NATIONAL INSTRUMENTS PRODUCTS IN
COMBINATION WITH OTHER PRODUCTS IN A MANNER NOT EVALUATED OR CONTEMPLATED BY NATIONAL
INSTRUMENTS, THE USER OR APPLICATION DESIGNER IS ULTIMATELY RESPONSIBLE FOR VERIFYING AND VALIDATING
Page 4

THE SUITABILITY OF NATIONAL INSTRUMENTS PRODUCTS WHENEVER NATIONAL INSTRUMENTS PRODUCTS ARE
INCORPORATED IN A SYSTEM OR APPLICATION, INCLUDING, WITHOUT LIMITATION, THE APPROPRIATE DESIGN,
PROCESS AND SAFETY LEVEL OF SUCH SYSTEM OR APPLICATION.
Page 5

Contents
About This Manual
Conventions ...................................................................................................................vii
Related Documentation..................................................................................................vii
Chapter 1
Introduction to LabVIEW SignalExpress
Chapter 2
Installing LabVIEW SignalExpress
LabVIEW SignalExpress LE.........................................................................................2-1
Minimum System Requirements ...................................................................................2-1
Installing LabVIEW SignalExpress...............................................................................2-2
Chapter 3
Working with Projects
Opening a Project...........................................................................................................3-1
Running a Project and Displaying Signals ....................................................................3-2
Configuring a Step.........................................................................................................3-4
Moving and Deleting Steps............................................................................................3-8
Handling Errors and Warnings ......................................................................................3-8
Chapter 4
Working with Signals
Graphing Signals............................................................................................................4-1
Importing a Signal from a File.......................................................................................4-3
Aligning and Comparing Signals...................................................................................4-4
Signal Types in LabVIEW SignalExpress.....................................................................4-6
Exporting and Printing Signals ......................................................................................4-6
Saving Signals to File......................................................................................4-7
Exporting Signals to Microsoft Excel .............................................................4-7
Printing Signals ...............................................................................................4-7
Creating Reports in LabVIEW SignalExpress ................................................4-7
© National Instruments Corporation v Getting Started with LabVIEW SignalExpress
Page 6

Contents
Chapter 5
Logging Data
Recording a Signal ........................................................................................................ 5-1
Viewing a Logged Signal .............................................................................................. 5-2
Logging Signals with Predefined Start and Stop Conditions ........................................ 5-3
Analyzing Logged Signals ............................................................................................5-5
Advanced Playback .......................................................................................................5-6
Chapter 6
Performing Sweep Measurements
Defining Sweep Ranges and Outputs............................................................................6-1
Plotting Sweep Results.................................................................................................. 6-4
Running Multidimensional Sweeps...............................................................................6-5
Chapter 7
Extending LabVIEW SignalExpress Projects with LabVIEW
Importing LabVIEW VIs into LabVIEW SignalExpress as Steps................................7-1
Converting LabVIEW SignalExpress Projects to LabVIEW Block Diagrams............. 7-4
Chapter 8
Where to Go from Here
LabVIEW SignalExpress Sample Projects.................................................................... 8-1
Using Hardware with LabVIEW SignalExpress...........................................................8-1
Web Resources ..............................................................................................................8-1
Appendix A
Technical Support and Professional Services
Getting Started with LabVIEW SignalExpress vi ni.com
Page 7

About This Manual
Use this manual to familiarize yourself with LabVIEW SignalExpress
interactive measurements and the basic LabVIEW SignalExpress features
that you use to acquire and analyze signals.
This manual contains exercises that help you begin working with
LabVIEW SignalExpress. These exercises teach you how to run projects,
configure steps, work with signals, configure sweep measurements, log
data, and extend LabVIEW SignalExpress with LabVIEW graphical
programming.
Conventions
The following conventions appear in this manual:
» The » symbol leads you through nested menu items and dialog box options
to a final action. The sequence File»Page Setup»Options directs you to
pull down the File menu, select the Page Setup item, and select Options
from the last dialog box.
This icon denotes a note, which alerts you to important information.
bold Bold text denotes items that you must select or click in the software, such
as menu items and dialog box options. Bold text also denotes input and
output names, parameter names, dialog boxes, sections of dialog boxes, and
menu names.
italic Italic text denotes variables, emphasis, a cross-reference, or an introduction
to a key concept. Italic text also denotes text that is a placeholder for a word
or value that you must supply.
monospace Text in this font denotes text or characters that you should enter from the
keyboard. This font is also used for the proper names of disk drives, paths,
directories, programs, subprograms, subroutines, device names, functions,
operations, variables, filenames, and extensions.
Related Documentation
Refer to the LabVIEW SignalExpress Help, available by selecting Help»
LabVIEW SignalExpress Help, for more information as you read this
manual.
© National Instruments Corporation vii Getting Started with LabVIEW SignalExpress
Page 8

Introduction to LabVIEW
SignalExpress
National Instruments provides innovative solutions for scientists
and engineers to build automated measurement systems based on
industry-standard computers and platforms. National Instruments develops
robust, industry-leading programming environments for automating
measurement systems, such as LabVIEW for graphical development,
LabWindows
for Microsoft Visual Studio programming. You can use these programming
tools with National Instruments measurement hardware and interfaces to
traditional instruments to build custom, advanced virtual instrumentation
systems.
LabVIEW SignalExpress optimizes virtual instrumentation for design
engineers by offering instant interactive measurements that require no
programming. You can use LabVIEW SignalExpress interactively to
acquire, generate, analyze, compare, import, and log signals. You can
compare design data with measurement data in one step. LabVIEW
SignalExpress extends the ease of use and performance of virtual
instrumentation to those who must acquire or analyze signals without
programming applications. You also can extend the functionality of
LabVIEW SignalExpress by importing a custom virtual instrument (VI)
created in the LabVIEW Development System or by converting a
LabVIEW SignalExpress project to a LabVIEW block diagram so you can
continue development in LabVIEW. Refer to Chapter 7, Extending
LabVIEW SignalExpress Projects with LabVIEW, for more information.
™
/CVI™ for ANSI C programming, and Measurement Studio
1
© National Instruments Corporation 1-1 Getting Started with LabVIEW SignalExpress
Page 9

Installing LabVIEW
SignalExpress
You can use the LabVIEW SignalExpress CD to install LabVIEW
SignalExpress and complete the exercises in this manual.
LabVIEW SignalExpress LE
LabVIEW SignalExpress LE gives you a 30-day trial of the Full version of
LabVIEW SignalExpress. After that period, you must activate your version
of LabVIEW SignalExpress LE or purchase the Full version. If you activate
your version of LabVIEW SignalExpress LE before your 30-day trial of the
full version is complete, the full features are still available for the remainder
of your 30-day trial. You can use LabVIEW SignalExpress LE to complete
simple data acquisition and logging functions.
If you do not register your version of LabVIEW SignalExpress LE after
30 days, LabVIEW SignalExpress LE runs with the following limitations:
• You can no longer save projects, so you cannot convert projects into
LabVIEW block diagrams.
• You can run projects for only 10 minutes per session.
2
Refer to the National Instruments Web site at
purchase the full version of LabVIEW SignalExpress.
ni.com/signalexpress to
Minimum System Requirements
LabVIEW SignalExpress requires a minimum of 256 MB of RAM and a
Pentium III or later or Celeron 866 MHz or equivalent processor, but
National Instruments recommends 512 MB of RAM and a Pentium 4/M or
equivalent processor.
© National Instruments Corporation 2-1 Getting Started with LabVIEW SignalExpress
Page 10

Chapter 2 Installing LabVIEW SignalExpress
Installing LabVIEW SignalExpress
Complete the following steps to install LabVIEW SignalExpress on
Windows Vista/XP/2000/NT.
Note If you want to convert LabVIEW SignalExpress projects to LabVIEW block
diagrams, you must install LabVIEW 7.1 or later before you install LabVIEW
SignalExpress.
1. Disable any automatic virus detection programs before you install.
Some virus detection programs interfere with the installation program.
2. Log on as an administrator or as a user with administrator privileges.
3. Insert the LabVIEW SignalExpress Development or Evaluation CD
and follow the instructions that appear on the screen.
By default, LabVIEW SignalExpress installs in the
National Instruments\SignalExpress
4. After installation, check the hard disk for viruses and enable any virus
detection programs you disabled.
The example projects you use with this manual are located in
SignalExpress\Examples\Tutorial. The solutions for each exercise
are located in
SignalExpress\Examples\Tutorial\Solutions.
Program Files\
directory.
If you use LabVIEW SignalExpress with National Instruments data
acquisition or modular instrumentation hardware, you must install
NI-DAQmx 8.5 or later, NI-SCOPE 2.7 or later, NI-FGEN 2.2 or later, or
NI-DMM 2.4.2. LabVIEW SignalExpress includes a National Instruments
Driver CD that includes these drivers.
Getting Started with LabVIEW SignalExpress 2-2 ni.com
Page 11

Working with Projects
You can use LabVIEW SignalExpress to define measurement procedures
by adding and configuring steps in an interactive measurement
environment. A step is a configurable function that acquires, generates,
analyzes, loads, or stores signals. Most steps process input signals and
produce output signals. You can configure the operation of a step by
specifying values in a configuration view. A saved sequence of configured
steps is a LabVIEW SignalExpress project.
This chapter teaches you how to load and run existing projects and how to
configure steps in these projects.
Opening a Project
Complete the following steps to load a sample project in LabVIEW
SignalExpress.
1. Launch LabVIEW SignalExpress.
Notice that LabVIEW SignalExpress is split into three main views: the
Project View on the left, the Data View in the middle, and the help on
the right. Within the Data View, you should see the Data View tab, the
Logging Options tab, and the Project Documentation tab.
2. If LabVIEW SignalExpress does not open in the factory-default
configuration, select View»Data View to display the Data View.
3. Select File»Open Project, navigate to the
Examples\Tutorial
Project.seproj LabVIEW SignalExpress project.
4. Examine the window that appears, as shown in Figure 3-1 with the
help hidden, to learn about different components of LabVIEW
SignalExpress.
3
SignalExpress\
directory, and double-click the First
© National Instruments Corporation 3-1 Getting Started with LabVIEW SignalExpress
Page 12
Chapter 3 Working with Projects
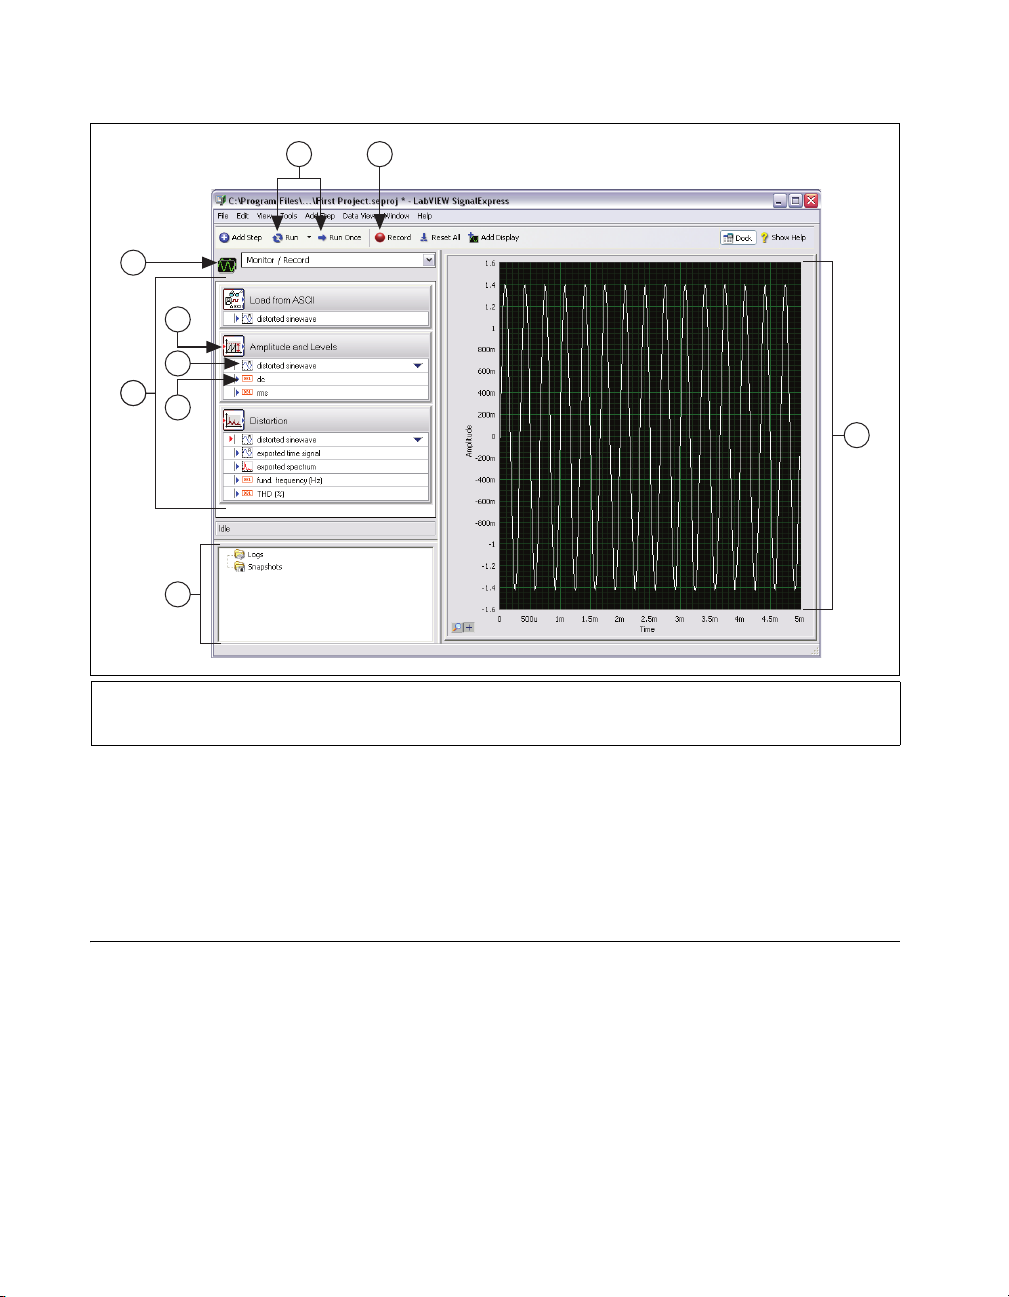
1
2
3
4
5
6
5
7
1 Execution control buttons
2 Work Area pull-down menu
3Step
9
4 Input
5 Output
6Project View
8
7 Logged Data window
8 Data View
9 Record button
Figure 3-1. First Project.seproj
The left pane is the Project View, which presents the order of
operations, or steps, for the project. The right pane is the Data View,
which displays the signal that the project generates and analyzes.
Running a Project and Displaying Signals
LabVIEW SignalExpress has two execution modes—Run and Run Once.
When you click the Run button, LabVIEW SignalExpress executes all
steps in the project continuously until you click the Stop button. The Stop
button appears in place of the Run button as a project runs. While the steps
in the project execute, the Data View updates continuously. While the
project runs, you can change the measurement configurations and view the
Getting Started with LabVIEW SignalExpress 3-2 ni.com
Page 13

Chapter 3 Working with Projects
results immediately. If you modify the configuration of steps while a
project runs, LabVIEW SignalExpress gives you direct, immediate
feedback on the changes you make. When you click the Run Once button,
LabVIEW SignalExpress executes all steps in the project one time.
Complete the following steps to run the sample project and display signals.
1. Click the Run button, shown at left, to execute all steps in the project
continuously.
The project loads a signal from a text file and performs two operations
on the signal—an amplitude and levels measurement and a distortion
measurement. The Amplitude and Levels step and the Distortion step
perform these measurements, respectively. When you run a project,
steps analyze input signals and generate new output signals as a result
of the analysis. In this project, the Load from ASCII step loads a
distorted sine wave, the Amplitude and Levels step and the Distortion
step analyze the sine wave, and both steps return new outputs. In the
Project View, LabVIEW SignalExpress indicates inputs with red
arrows and outputs with blue arrows.
The graph in the Data View still contains the loaded signal, which is a
time-domain signal. Graphs display time-domain, frequency-domain,
or x-y signals.
2. Click the exported spectrum output signal of the Distortion step in the
Project View and drag it to the Data View to display the signal.
LabVIEW SignalExpress creates a new graph in the Data View.
LabVIEW SignalExpress does not display the exported spectrum
signal on the same graph as the time-domain signal because the
exported spectrum signal is a frequency-domain signal. LabVIEW
SignalExpress automatically recognizes different types of signals and
renders them in the appropriate displays.
3. Select Help»LabVIEW SignalExpress Help, click the Search tab,
and enter
"signal types" to refer to the LabVIEW SignalExpress
Help for more information about signal types. The help provides
information about using LabVIEW SignalExpress functionality such
as projects, steps, and signals.
4. Click the dc output of the Amplitude and Levels step and drag it to the
Data View to display the measurement.
LabVIEW SignalExpress creates a table to display the scalar
measurement from the dc output.
© National Instruments Corporation 3-3 Getting Started with LabVIEW SignalExpress
Page 14
Chapter 3 Working with Projects
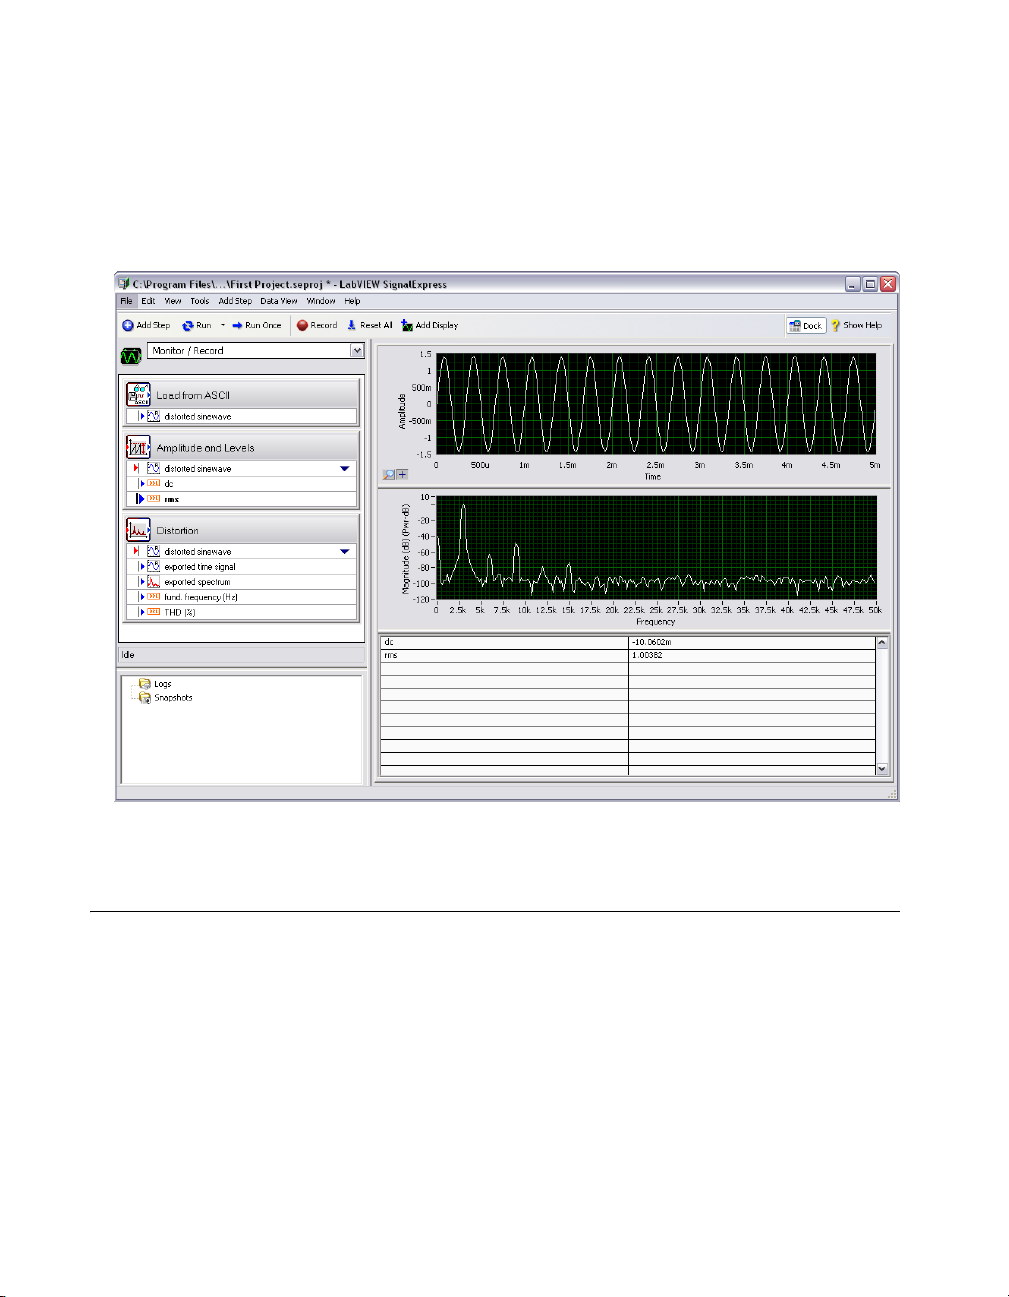
5. Drag the rms output to the table to display the scalar RMS
measurement.
LabVIEW SignalExpress creates a new row in the table to display the
second measurement. The project should appear as shown in
Figure 3-2.
Figure 3-2. Outputs of First Project.seproj
Configuring a Step
A step is a configurable function that acquires, generates, analyzes, loads,
or stores signals. Steps process input signals and produce output signals.
You can configure the operation of a step in SignalExpress by specifying
values in the Step Setup dialog box, or configuration view, for that step.
While a project runs, you can modify the configuration of steps to view
immediate feedback on the changes and adjust the measurements until you
achieve the results you need.
Getting Started with LabVIEW SignalExpress 3-4 ni.com
Page 15
Chapter 3 Working with Projects
Complete the following steps to configure the Distortion step and the
Amplitude and Levels step.
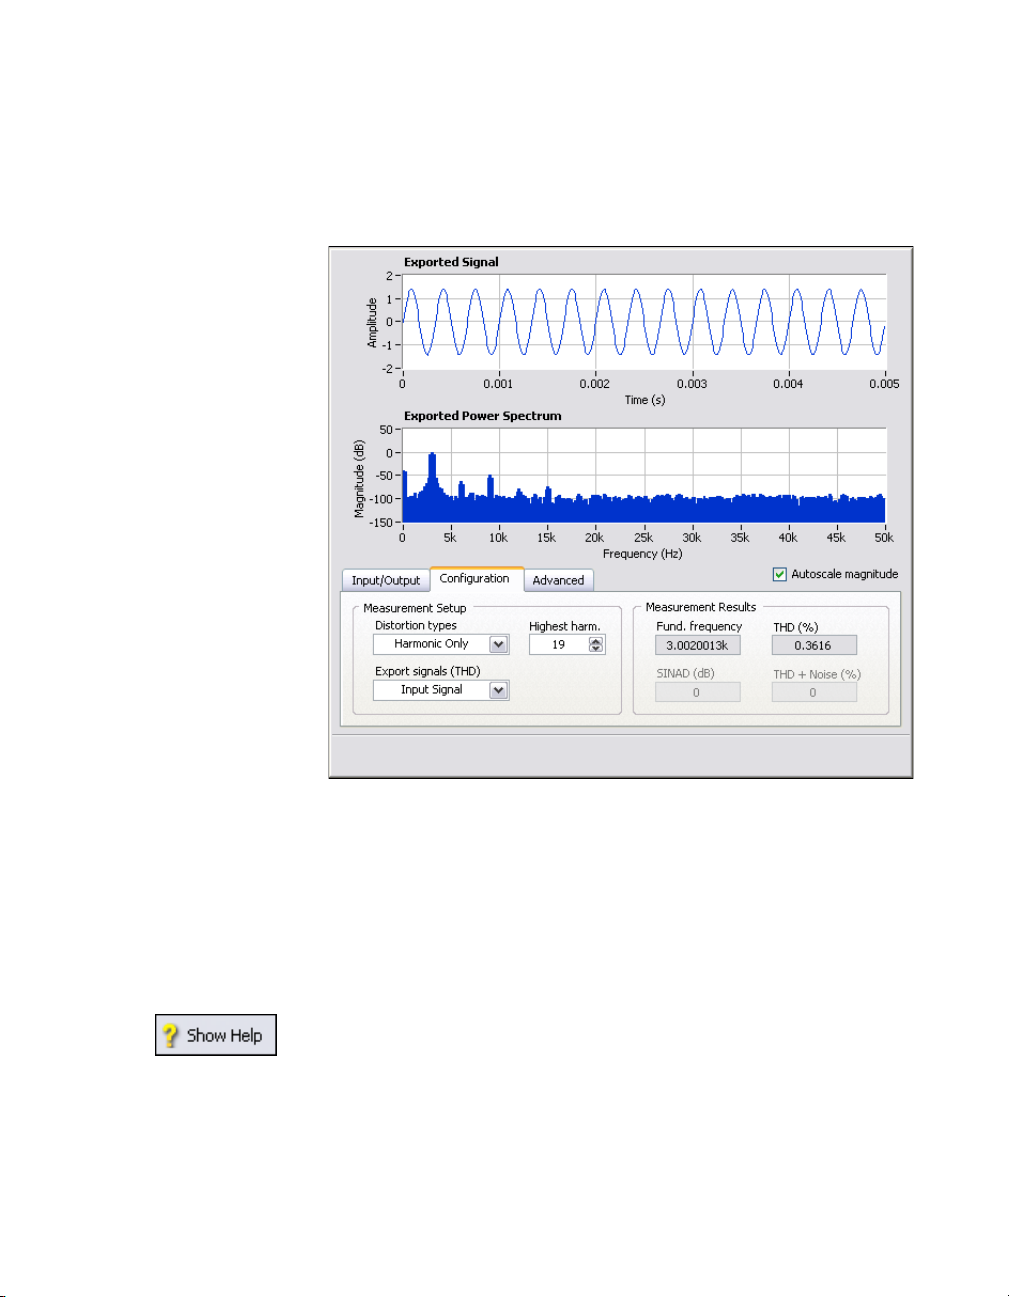
1. Double-click the Distortion step in the Project View. The Step Setup
dialog box for the Distortion step appears, as shown in Figure 3-3.
Figure 3-3. Distortion Step Setup Dialog Box
On the Configuration tab, the settings indicate that the Distortion step
receives a time-domain waveform signal as an input, performs a power
spectrum on the signal to convert it to the frequency domain, and
computes the total harmonic distortion (THD) and fundamental
frequency of the signal. The step generates three measurements as
outputs—the spectrum, the THD, and the fundamental frequency of
the original time-domain waveform input.
2. If the context help does not appear on the right side of the screen, click
the Show Help button, shown at left, to display complete reference
information about the step. The upper half of the context help displays
information about the step, and the lower half of the context help
displays information about an object when you move the cursor over
the object.
© National Instruments Corporation 3-5 Getting Started with LabVIEW SignalExpress
Page 16

Chapter 3 Working with Projects
3. On the Configuration tab, select Fundamental Tone from the
Export signals (THD) pull-down menu.
The operation of the step changes from displaying the
frequency-domain spectrum of the entire input signal to displaying
only the frequency spectrum of the fundamental tone of the input
signal. The graphed signals in the top half of the Step Setup dialog box
update to reflect the change you made.
4. Select Harmonics Only from the Export signals (THD) pull-down
menu.
The step changes to export only the spectrum of the harmonic signals
from the input signal. Both the output signal of the Distortion step and
the graph on the Data View update to reflect the change you made.
5. Click the Amplitude and Levels step in the Project View.
The Step Setup dialog box changes from displaying the configuration
of the Distortion step to displaying the configuration of the Amplitude
and Levels step.
Getting Started with LabVIEW SignalExpress 3-6 ni.com
Page 17
Chapter 3 Working with Projects
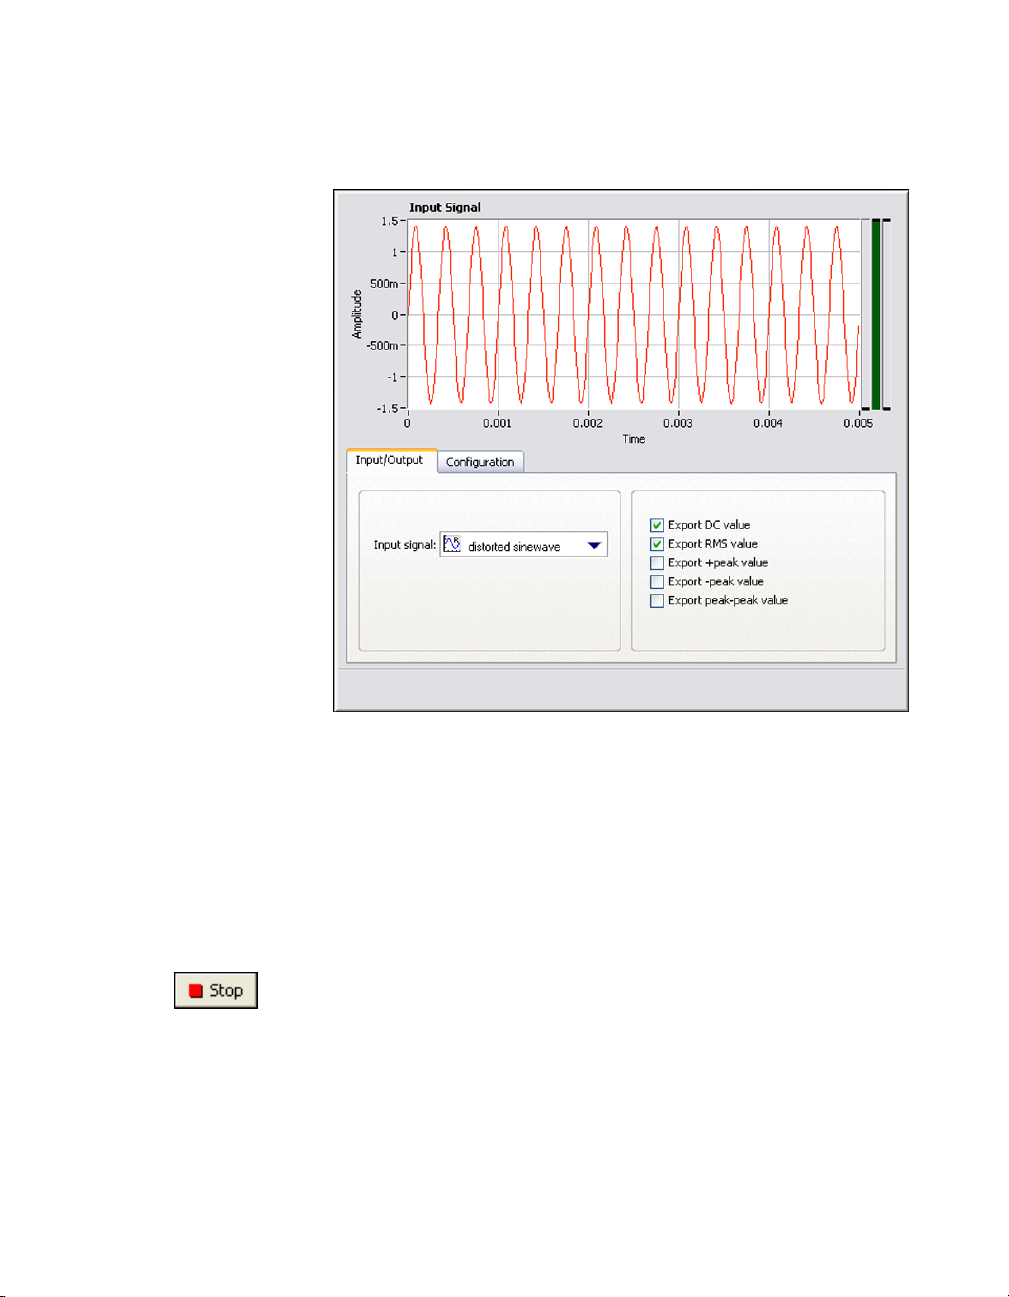
6. Click the Input/Output tab to display the list of possible inputs and
outputs for this step, as shown in Figure 3-4.
Figure 3-4. Amplitude and Levels Step Setup Dialog Box
7. Place checkmarks in the Export +peak value, Export -peak value,
and Export peak-peak value checkboxes to configure the Amplitude
and Levels step to return three additional measurements.
Three additional outputs appear in the Project View.
8. Click the Data View tab to display the Data View.
9. Drag the three new outputs from the Project View to the table to
display the scalar measurements.
10. Click the Stop button, shown at left, to stop the project.
When you click the Stop button, the project stops running after
completing the current cycle of operations, or the current iteration.
Click the down arrow on the Stop button and click the Abort button to
completely stop the project without finishing the current iteration.
© National Instruments Corporation 3-7 Getting Started with LabVIEW SignalExpress
Page 18
Chapter 3 Working with Projects
11. Select File»Save Project As and save the project as My First
Project.seproj in the SignalExpress\Examples\Tutorial
directory.
12. Select File»Close Project to close the project.
Moving and Deleting Steps
The steps in SignalExpress projects depend on input data, which means
steps can operate only on signals exported from previous steps in the
Project View. When you click the Input signal pull-down menu on the
Input tab of the Step Setup dialog box of a step, the menu displays only
compatible signals exported from a previous step. When the output of a
step becomes the input of another step, the steps become dependent on each
other, and the two steps execute sequentially at the same rate. The first step
generates an output signal that the second step must receive as an input
before the step can execute.
You can move a step within a project by dragging it up or down in the
Project View. You can delete a step by right-clicking it in the Project View
and selecting Delete from the shortcut menu. However, when you move or
delete a step, the status of signals in the project changes. For example, if
you delete a step that generates output signals, the operation of the project
breaks if any of the deleted output signals are inputs for other steps, and an
error indicator appears in the Project View. You also can cut, copy, and
paste steps within a project by pressing the <Ctrl-X>, <Ctrl-C>, and
<Ctrl-V> keys, respectively, or by right-clicking a step in the Project View
and selecting Cut, Copy, Paste Before Selected Step, or Paste After
Selected Step from the shortcut menu.
Handling Errors and Warnings
If an error occurs while a project runs, an error indicator, shown at left,
appears in the Project View on the step that encountered the error.
Double-click the step with the error to display an error description across
the bottom of the Step Setup dialog box. Click the Details button to the
right of the error description to display the full error description.
SignalExpress logs all errors and warnings in the Event Log while a project
runs. To display the Event Log, select
Log
tab in the Data View area. Refer to the
more information about errors and warnings by selecting
SignalExpress Help
Getting Started with LabVIEW SignalExpress 3-8 ni.com
, clicking the
View»Event Log
LabVIEW SignalExpress Help
Search
tab, and entering
and click the
Help»LabVIEW
errors
Event
.
for
Page 19
Working with Signals
You can use LabVIEW SignalExpress to generate and analyze signals to
evaluate designs without programming. This chapter teaches you how to
work with signals in LabVIEW SignalExpress, including how to plot
signals on graphs, import signals from a file, interactively align and
compare two signals, and save signals to a file.
Graphing Signals
Complete the following steps to plot signals in a sample project and
examine the signals visually using cursors.
1. Select File»Open Project, navigate to the
Examples\Tutorial
Signals.seproj. This project configures the Create Signal step
to create a square wave signal and the Filter step to perform a lowpass
Butterworth filter.
2. Drag the step signal output of the Create Signal step to the Data View.
3. Drag the filtered step output of the Filter step to the Data View.
You can plot signals of the same signal type on the same graph. Both
the step signal and the filtered step signals are time-domain signals,
so they appear on the same graph. If you want to plot signals of
different types, drag the signals to the same graph and LabVIEW
SignalExpress creates a new graph.
4. Click the Add Display button, shown at left, on the toolbar to create a
new graph.
5. Drag the filtered step output of the Filter step to the new graph.
4
SignalExpress\
directory, and double-click
© National Instruments Corporation 4-1 Getting Started with LabVIEW SignalExpress
Page 20
Chapter 4 Working with Signals
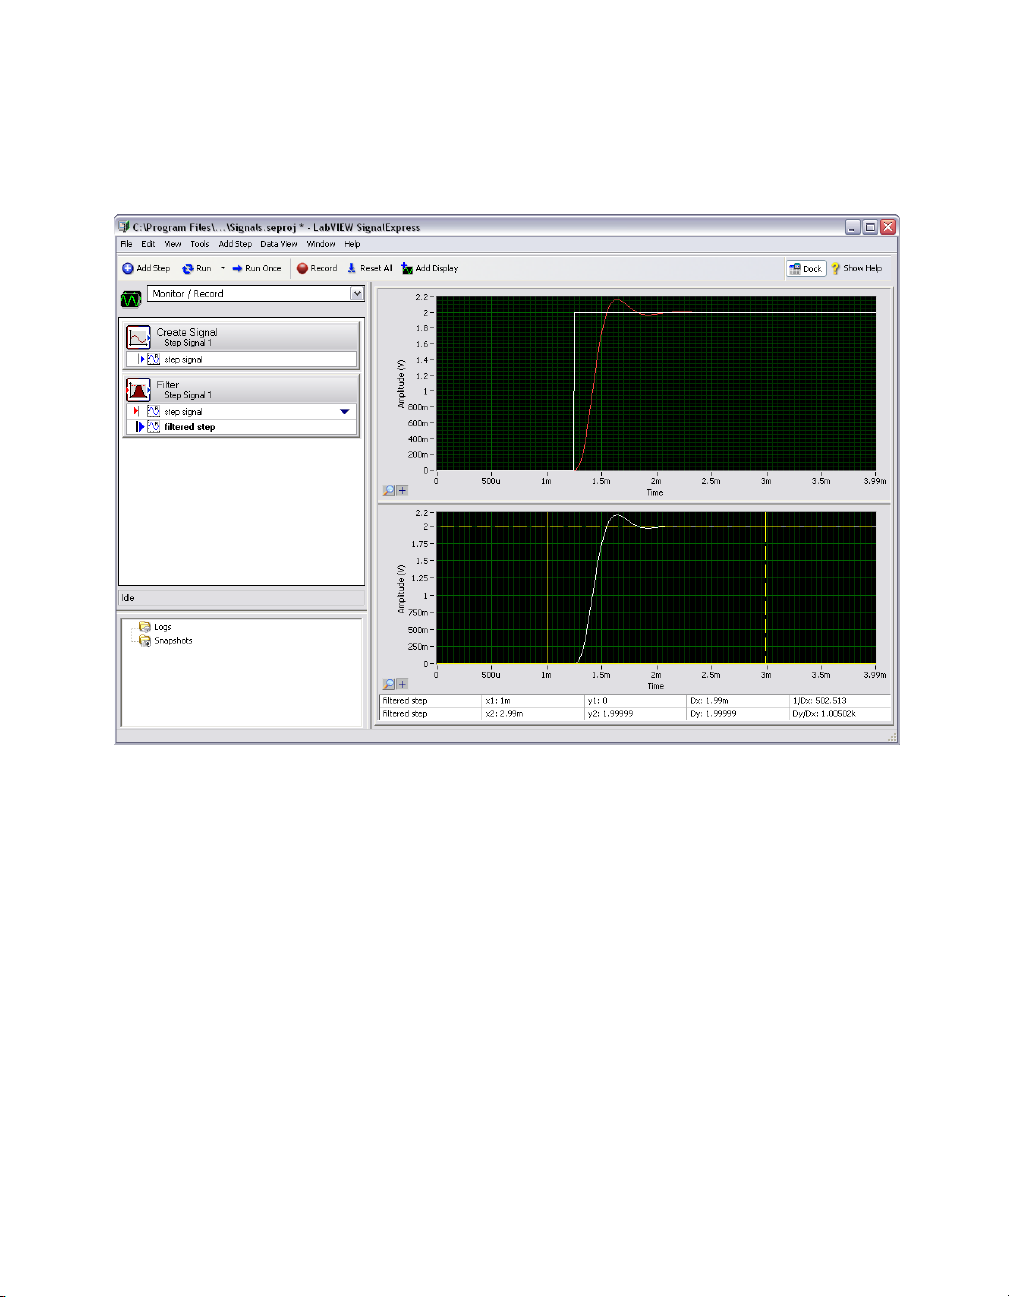
6. Right-click the new graph and select Visible Items»Cursors from the
shortcut menu to display two interactive cursors, as shown in
Figure 4-1.
Figure 4-1. Signals.seproj
As you drag the cursors, LabVIEW SignalExpress displays the x and
y values of the cursors in the cursor table at the bottom of the Data
View.
7. Select File»Save Project As and save the project as
My Signals.seproj in the SignalExpress\Examples\
Tutorial
Getting Started with LabVIEW SignalExpress 4-2 ni.com
directory.
Page 21
Importing a Signal from a File
You can import signals from standard file formats such as ASCII commaor tab-delimited files and LabVIEW measurement data files (
also can import signals from simulated results of EDA tools such as SPICE
simulators.
Complete the following steps to import a signal from a file.
1. Right-click the Project View and select Load/Save Signals»Analog
Signals»Load from ASCII from the shortcut menu.
2. Click the browse button, shown at left, in the Step Setup dialog box,
navigate to the
and double-click
and displays the signals in the file.
In the File preview section, column 1 shows the time stamp data, and
column 2 shows the actual voltage values of the signal.
3. Click the Import Signals tab to display the available signals in the file.
4. Place a checkmark in the Column 2 checkbox to import that signal,
and remove the checkmark from the Column 1 checkbox.
The Step Setup dialog box displays a preview of the signal in the
Imported Signal section.
5. Select Column 1 from the Input X values pull-down menu to set the
x-axis data of the waveform to the appropriate values.
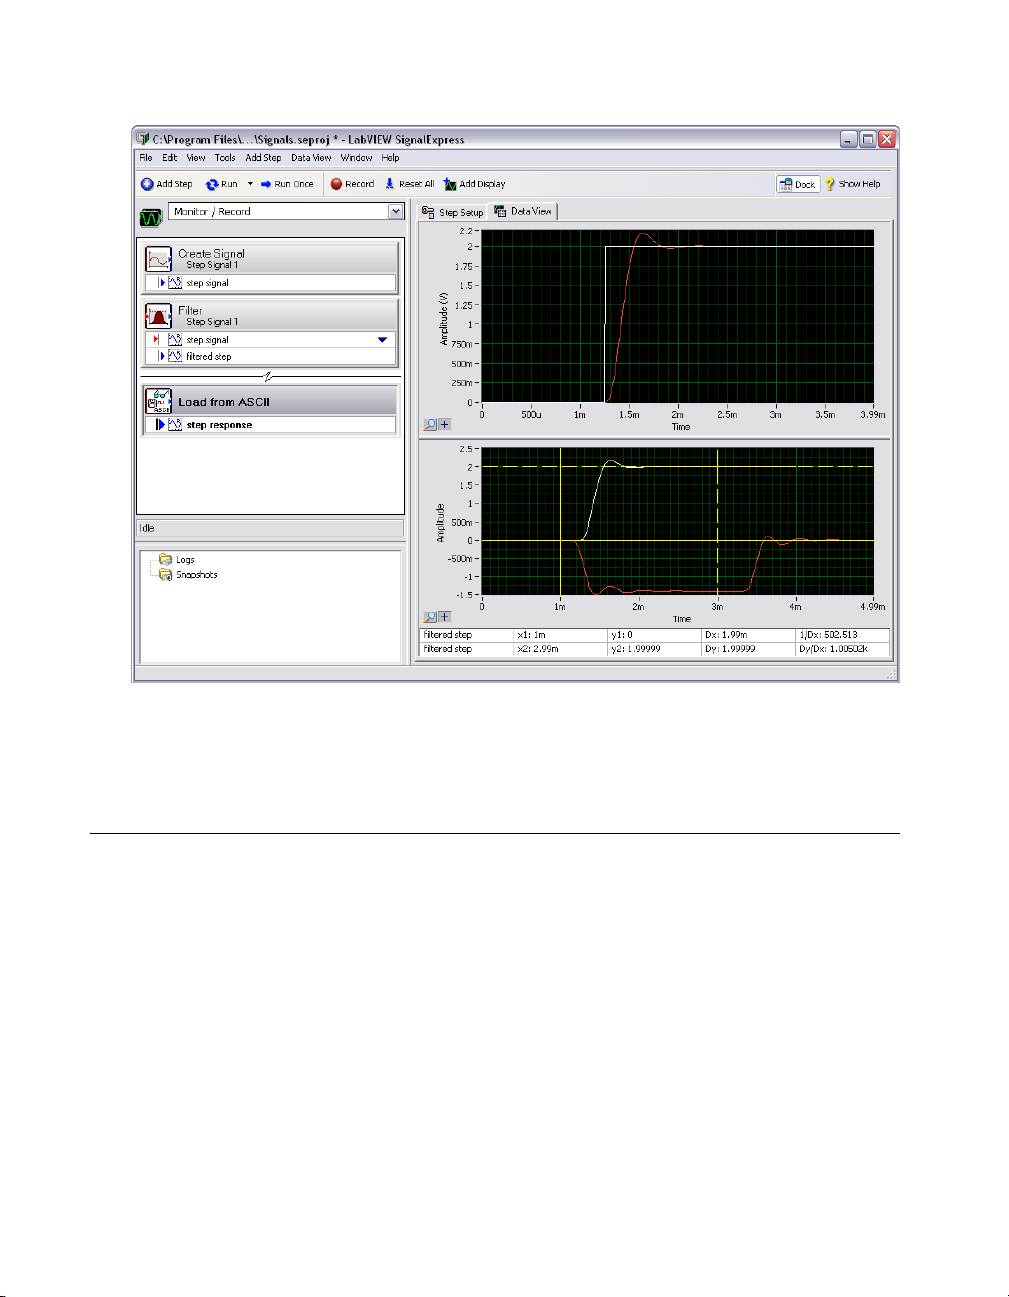
6. Open the Data View.
7. Right-click the Column 2 output in the Project View and select
Rename from the shortcut menu.
8. Enter
9. Drag the step response output of the Load from ASCII step to the
step response and press the <Enter> key to rename the output.
lower graph in the Data View.
The filtered step signal resembles the rising edge of the step response
output, as shown in Figure 4-2.
SignalExpress\Examples\Tutorial directory,
Step Response.txt. This step parses an ASCII file
Chapter 4 Working with Signals
.lvm). You
© National Instruments Corporation 4-3 Getting Started with LabVIEW SignalExpress
Page 22
Chapter 4 Working with Signals
Figure 4-2. Signals of Signals.seproj
10. Select File»Save Project to save the project.
Aligning and Comparing Signals
Although the filtered step signal and the step response output both show
an overshoot in the rising edge, assessing the similarity between the two
is difficult because the signals come from different sources and vary in
amplitude and timing. However, you can use the Interactive Alignment step
to align and compare two signals, so you can choose which type of
information you want to export from the operation to use in the project.
Complete the following steps to align two signals in the
My Signals.seproj project.
1. Right-click the step response output and select Send To»
Processing»Analog Signals»Interactive Alignment from the
shortcut menu to pass the step response signal from the Load from
ASCII step to the Interactive Alignment step.
Getting Started with LabVIEW SignalExpress 4-4 ni.com
Page 23
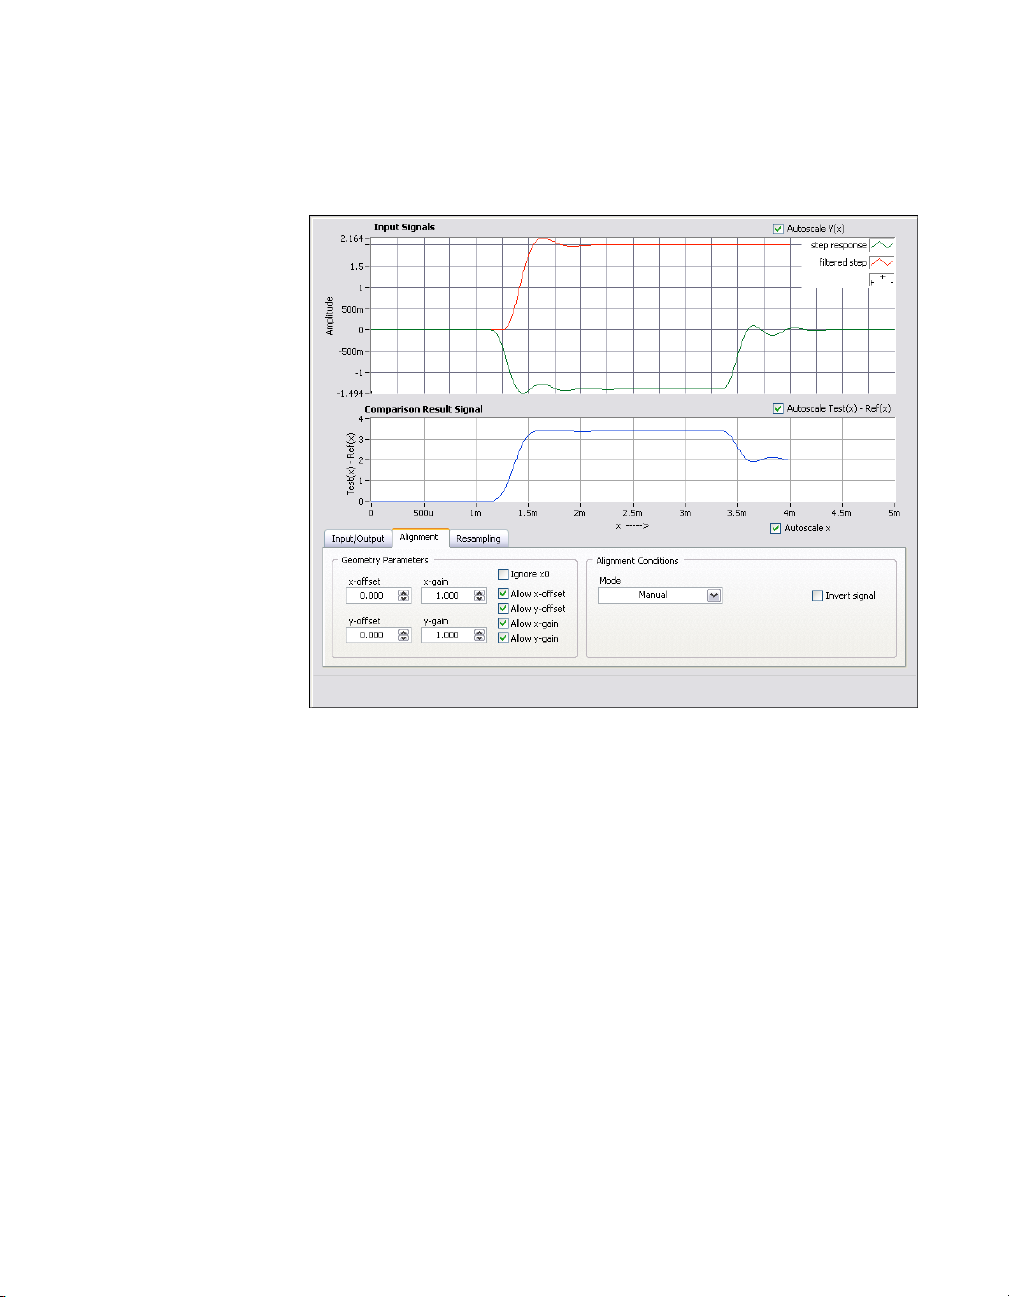
Chapter 4 Working with Signals
The step selects the two most recent signals from the project to use as
inputs and displays the signals on the graph of the Step Setup dialog
box, as shown in Figure 4-3.
Figure 4-3. Interactive Alignment Step Setup Dialog Box
When you add a step to a project, LabVIEW SignalExpress selects
input signals based on the signal types the step can accept. For
example, the Interactive Alignment step can operate only on
time-domain waveform signals. Therefore, the step selects as inputs
the last two time-domain signals created in the project. To change the
input signals for a step, select different signals from the pull-down
menu of compatible signals in the Input/Output tab of the Step Setup
dialog box.
2. Click the red signal in the Input Signals graph and drag it to another
point within the graph.
You can drag, expand, and contract signals on the graph.
3. Try to align the rising edges of the two signals by dragging a signal
within the graph. Click a signal to set an anchor point and press and
hold the <Alt> key to stretch the signal around that anchor point in the
x and y directions.
© National Instruments Corporation 4-5 Getting Started with LabVIEW SignalExpress
Page 24
Chapter 4 Working with Signals
On the Alignment tab of the Step Setup dialog box, the step computes
and displays the x and y gain and offset values you need to achieve
alignment specifications as you drag the signals.
4. Select Auto - Step from the Mode pull-down menu to align the
signals. LabVIEW SignalExpress bases this alignment mode on
built-in algorithms.
The lower graph in the Step Setup dialog box displays the difference
between the two signals.
5. On the Input/Output tab, place a checkmark in the Export aligned
signals checkbox to add the signals to the outputs of the step.
6. Select the Data View tab to open the Data View.
7. Click the Add Display button, shown at left, to add a third graph.
8. Drag the aligned reference and aligned test outputs of the Interactive
Alignment step to the new graph to view the aligned signals.
9. Select File»Save Project to save the project.
Signal Types in LabVIEW SignalExpress
Some steps, such as the Arithmetic step, can operate on multiple signal
types. For example, you can use the Arithmetic step to operate on
time-domain or frequency-domain waveforms. The Arithmetic step
changes behavior based on the type of input signals you select for the
step. For example, if you add two time-domain signals, LabVIEW
SignalExpress adds only their amplitudes. However, if you add two
frequency-domain phase signals, LabVIEW SignalExpress adds the
appropriate phase shift.
Refer to the LabVIEW SignalExpress Help for more information by
selecting Help»LabVIEW SignalExpress Help, clicking the Search tab,
and entering
"signal types".
Exporting and Printing Signals
You can use LabVIEW SignalExpress to document signals or continue
analysis in another software application. This section teaches you how to
export signals, including sending signals to an ASCII file, sending data to
Microsoft Excel, printing signals, and using the built-in documentation
feature to document the LabVIEW SignalExpress project.
Getting Started with LabVIEW SignalExpress 4-6 ni.com
Page 25

Saving Signals to File
Complete the following steps to save a signal to a file.
1. Click the Add Step button and select Load/Save Signals»Analog
2. Click the Signals tab in the Step Setup dialog box and select filtered
3. On the File Settings tab, save the file to
4. Select Overwrite from the If file already exists pull-down menu.
5. Select Generic ASCII from the Export file type pull-down menu.
6. Click the Close button to close the Step Setup dialog box.
7. Click the Run button to run the project and save the resulting signal to
8. Select File»Save Project to save the project.
9. Select File»Close Project to close the project.
Chapter 4 Working with Signals
Signals»Save to ASCII/LVM.
step from the Input Data pull-down menu.
SignalExpress\
Examples\Tutorial\filtered signal.txt
path control.
You can use a Load/Save Signals step to save data to a file every time
the project runs.
the specified ASCII file.
in the Export file
Exporting Signals to Microsoft Excel
To export signal data to Microsoft Excel, launch Excel and drag the output
signal of a step in LabVIEW SignalExpress to an Excel spreadsheet.
Printing Signals
To print an image of a graph, open the Data View and select File»Print»
Print Data View.
Creating Reports in LabVIEW SignalExpress
Select
View»Project Documentation
View. You can describe your project using text and drag and drop step
outputs into your documentation. When you drag and drop a step output into
the Project Documentation View, the value in the Project Documentation
View automatically updates to match the current value of the step output.
To print your documentation, open the Project Documentation View and
select File»Print»Print Documentation. To export your documentation to
HTML, open the Project Documentation View and select File»Export»
Export Documentation to HTML.
© National Instruments Corporation 4-7 Getting Started with LabVIEW SignalExpress
to display the Project Documentation
Page 26
Logging Data
You can use LabVIEW SignalExpress to record and analyze
measurements. You can record any time-domain, double, U32, or Boolean
step output. You also can analyze and process logged data by playing it
through analysis steps.
This chapter teaches you how to record data using the integrated data
logging features in LabVIEW SignalExpress. You learn how to record a
specified signal, play back that signal, and analyze the signal using analysis
steps. You also learn how to use the Recording Options View to log signals
based on specified start or stop conditions.
Recording a Signal
You can use the Record button to configure a data logging process.
Complete the following steps to specify a signal to record and to record the
signal.
1. Select File»Open Project, navigate to the
Examples\Tutorial
Logging.seproj.
This project uses the Create Signal step to generate a signal based on a
formula.
2. Click the Record button, shown at left, to open the Logging Signals
Selection dialog box.
The Logging Signals Selection dialog box displays the signals in the
project available for recording. You can select one signal or multiple
signals to record. You also can specify a name and description for
the log.
3. Place a checkmark in the signal checkbox to record the formula signal
generated in the Create Signal step.
4. Click the OK button to close the Logging Signals Selection dialog
box and begin recording the signal. The logging operation continues
until you click the Stop button.
5
SignalExpress\
directory, and double-click
© National Instruments Corporation 5-1 Getting Started with LabVIEW SignalExpress
Page 27
Chapter 5 Logging Data
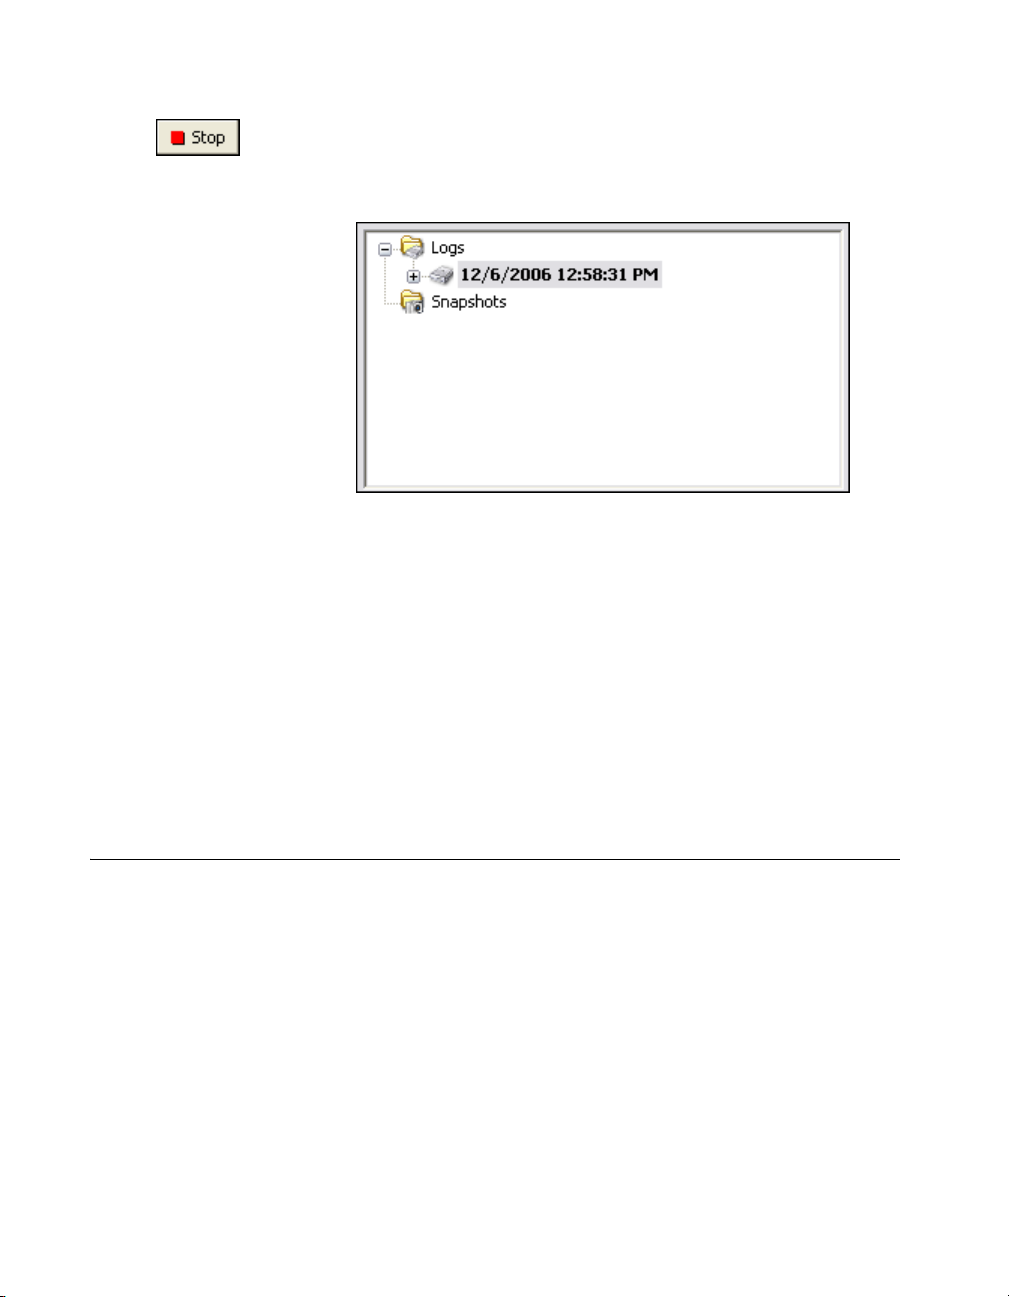
5. Click the Stop button, shown at left, to stop logging the signal.
The logged data appears in the Logged Data window, as shown in
Figure 5-1.
Figure 5-1. Logged Data Window
By default, LabVIEW SignalExpress names the logged data according
to the date and time you recorded the data. LabVIEW SignalExpress
saves logged data in the
in the Options dialog box.
6. Select Tools»Options and select the Logging option to specify the
directory for LabVIEW SignalExpress to save the logged data and to
customize various preferences for logged data.
7. Click the OK button to close the Options dialog box.
8. Select File»Save Project to save the project.
.tdms file format in the directory you specify
Viewing a Logged Signal
Complete the following steps to view the logged data.
1. If the Data View is not visible, select View»Data View to display the
Data View.
2. The Logged Data window displays a list of all logged data in the
current project. Select the data log you just recorded from the Logged
Data window and drag it into the Data View. The Data View displays
the logged data and a preview graph, as shown in Figure 5-2. The
signal displayed in the Data View may differ from the signal displayed
in Figure 5-2, depending on how long you record the signal.
Getting Started with LabVIEW SignalExpress 5-2 ni.com
Page 28
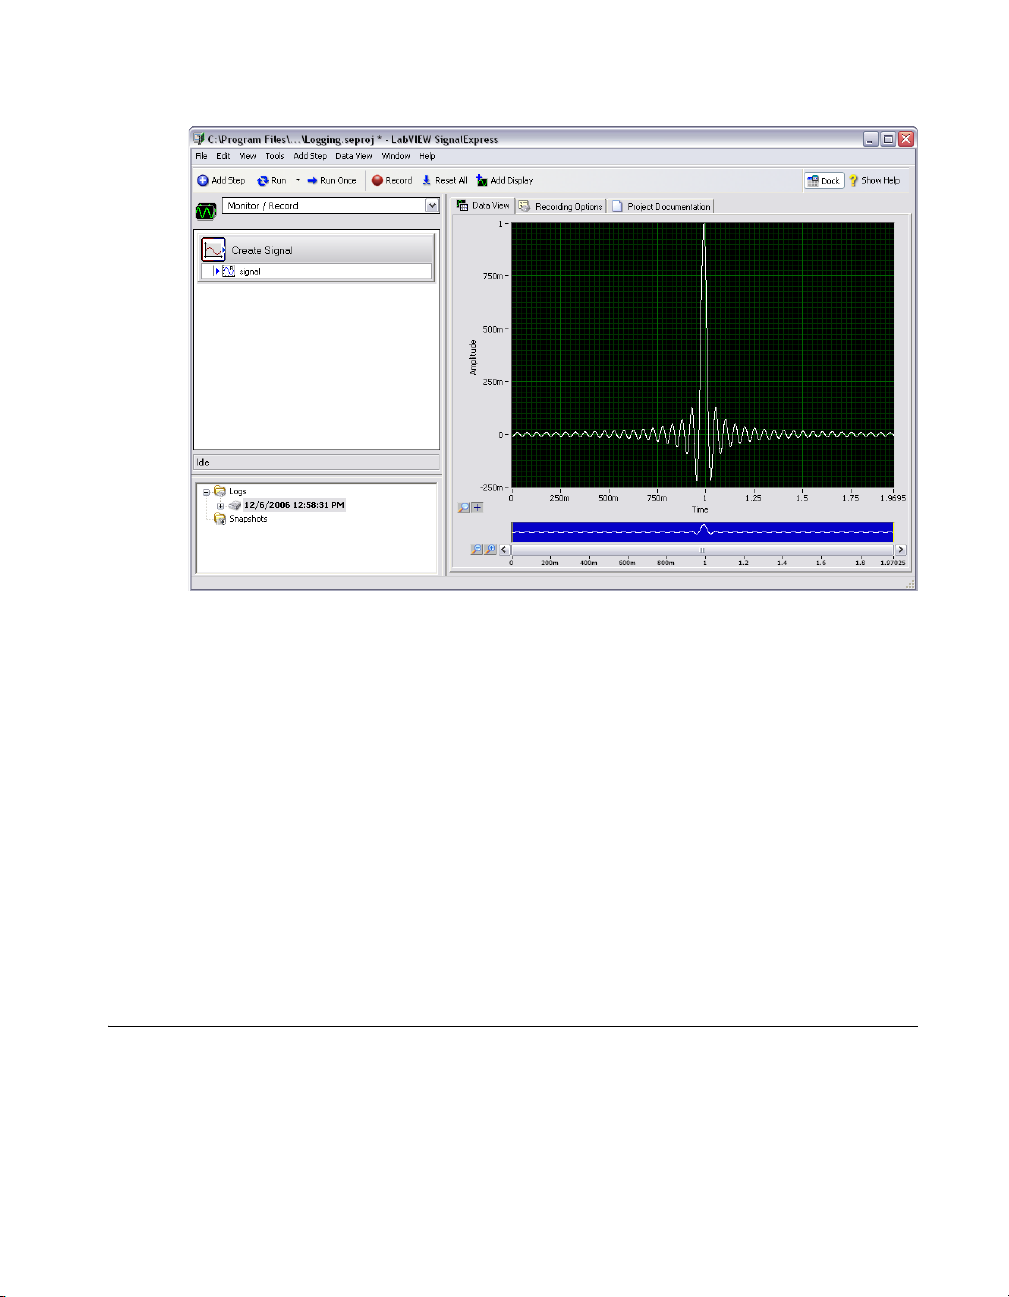
Figure 5-2. Logging.seproj
Chapter 5 Logging Data
The preview graph provides a method for zooming and panning
through data in the Data View. The preview graph appears by default
when viewing logged data. When viewing live or non-logged data,
right-click the Data View and select Visible Items»Preview to display
the preview graph.
3. Click the Zoom In button next to the preview graph to zoom in on the
logged signal. The cursors on the preview graph show the subset of
data currently displayed on the preview graph. Use the scroll bar
beneath the preview graph to scroll through the data. Click and drag the
cursors on the preview graph to increase or decrease the subset of data
you are viewing.
Logging Signals with Predefined Start and Stop Conditions
You can configure start and stop conditions that the signals must meet
before LabVIEW SignalExpress records or stops recording the signals.
Complete the following steps to log data based on start and stop conditions.
1. If the Recording Options tab is not visible, select View»Recording
Options to open the Recording Options View.
© National Instruments Corporation 5-3 Getting Started with LabVIEW SignalExpress
Page 29
Chapter 5 Logging Data
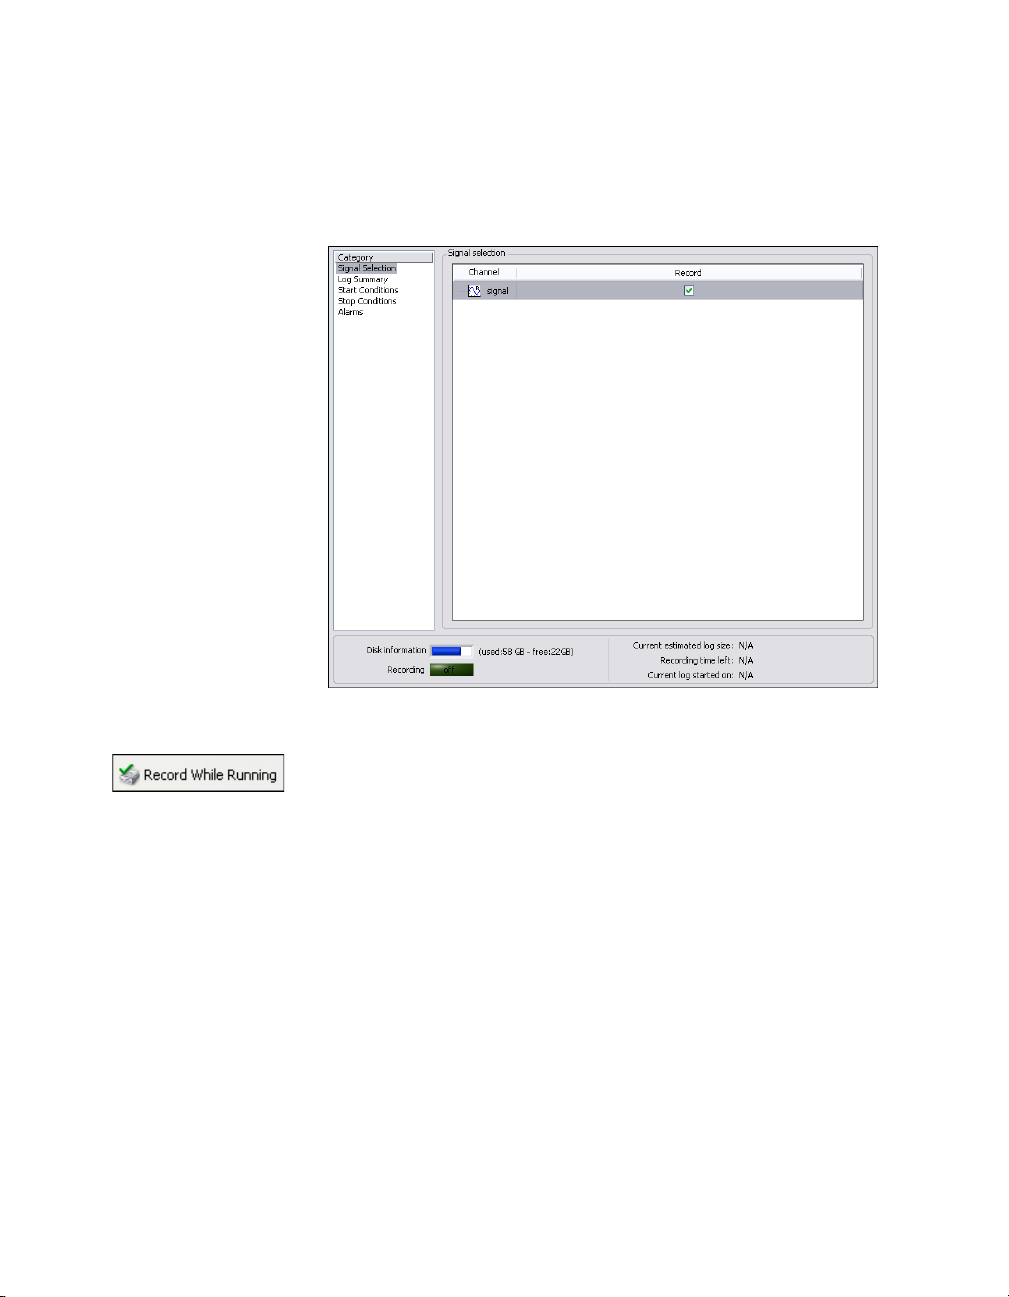
2. Select Signal Selection in the Category list in the Recording Options
View.
3. Place a checkmark next to the signal in the Record column, as shown
in Figure 5-3.
Figure 5-3. Signal Selection
The Record button changes to the Record While Running button,
shown at left. Ensure the Record While Running button is pressed.
When the Record While Running button is pressed, LabVIEW
SignalExpress records the selected signal when you click the Run or
Run Once button.
4. Select Start Conditions in the Category list in the Recording Options
View.
5. Click the Add button in the Logging start conditions page to
customize a start condition for your logging task.
a. Select the Signal option in the Condition source control to
specify for LabVIEW SignalExpress to begin recording when the
input signal meets the specified condition.
b. Select signal in the Signal control.
Getting Started with LabVIEW SignalExpress 5-4 ni.com
Page 30
Chapter 5 Logging Data
c. Select Rising slope in the Condition control to begin recording
the signal based on the value of the edge of the signal on a positive
slope.
d. Enter
6. Select Stop Conditions in the Category list in the Recording Options
View.
7. Click the Add button in the Logging stop conditions page to
customize a stop condition for your logging task.
a. Select the Duration option in the Condition source control.
b. Enter
c. Click the Run button, shown at left. LabVIEW SignalExpress
1 in the Value control to begin recording when the signal
crosses 1 on a rising slope.
5 in the Duration control to record the signal for 5 seconds
after the signal meets the start condition.
begins recording the signal when the signal crosses level 1 on a
rising slope and continues recording the signal for 5 seconds.
The Recording indicator on the bottom of the Recording Options
View will turn on when the signal meets the start condition and
logging is in progress. The Disk information indicator displays
the available hard disk space on the computer for the log.
Analyzing Logged Signals
After you log a signal, you can play back the logged data or run the logged
signal through analysis steps, just as you can with live data. Complete the
following steps to analyze a logged signal.
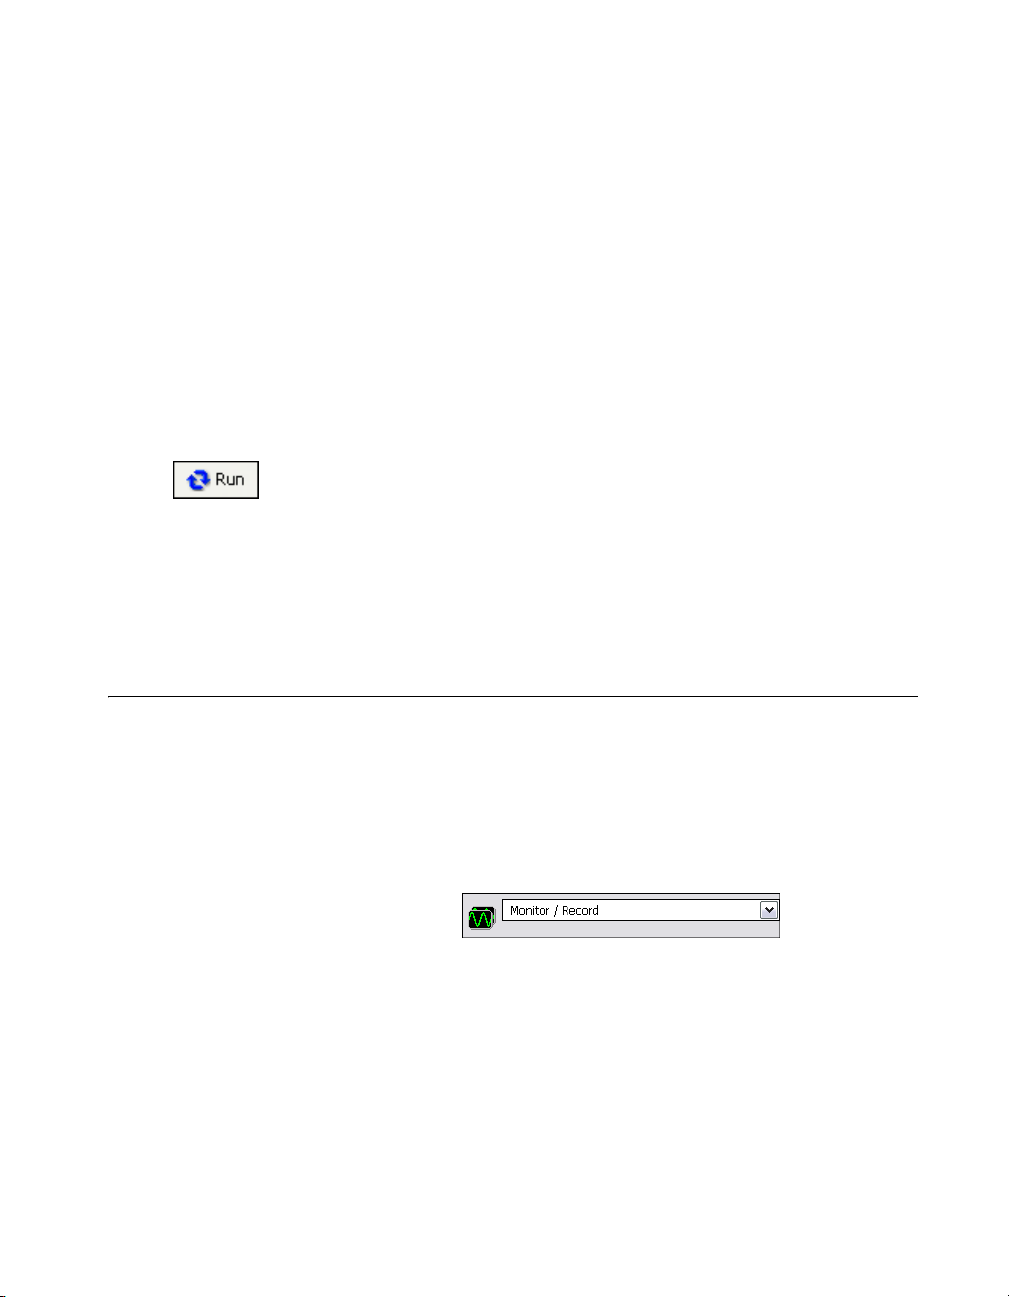
1. Navigate to the Work Area pull-down menu on the top left of the
LabVIEW SignalExpress window, as shown in Figure 5-4. Click the
down arrow and select Playback to switch to the Playback work area.
Figure 5-4. Work Area pull-down menu
Use work areas to perform multiple LabVIEW SignalExpress
operations from within the same project. You can acquire data, process
signals, record data, and perform measurements on logged data
without opening a new project. When you save your project,
LabVIEW SignalExpress saves every work area within the project in
the same project file.
© National Instruments Corporation 5-5 Getting Started with LabVIEW SignalExpress
Page 31

Chapter 5 Logging Data
The default work area, Monitor/Record, allows you to take
measurements, analyze live data, and log data. You must be in the
Playback work area to use logged data as an input for an analysis step.
For example, you can take a measurement and log the signal in the
Monitor/Record work area, and then run the logged data through an
analysis step in the Playback work area.
2. Click the Add Step button, shown at left, and select the Filter step from
Processing»Analog Signals»Filter. LabVIEW SignalExpress
automatically selects the first signal you logged as the input to the
Filter step.
3. Navigate to the Data View. Drag the filtered data output of the Filter
step into the Data View to view the resulting signal.
4. Click the Run button, shown at left. The Data View displays the
resulting filtered signal and LabVIEW SignalExpress plays back the
entire log.
Advanced Playback
You can configure advanced data playback options by using the Playback
Options View. The Playback Options View displays a preview of the
logged data and allows you to select a subset of that data to play back or run
through analysis steps.
1. Select View»Playback Options to open the Playback Options View,
as shown in Figure 5-5. The Playback Options View allows you to
preview the logged data, as well as specify a subset of the logged data
to play back or send to analysis steps.
Getting Started with LabVIEW SignalExpress 5-6 ni.com
Page 32

Chapter 5 Logging Data
Figure 5-5. Playback Options View
2. Select signal from the second log you created in the Logged signal
listbox.
3. Enter
1 in the Start time control to play back or analyze a subset of the
logged signal beginning 1 second after the start of the log.
4. Enter
4 in the Stop time control to play back or analyze a subset of the
logged signal ending four seconds after the start of the log.
5. Switch to the Data View and drag the filtered data output of the Filter
step into the Data View.
6. Click the Run button, shown at left. LabVIEW SignalExpress filters
the subset of the signal you specified in the Playback Options View and
displays the resulting filtered signal in the Data View.
7. Click the Stop button to stop running the project.
Refer to the LabVIEW SignalExpress Help for more information about
logging data, such as specifying alarm conditions and playback options.
© National Instruments Corporation 5-7 Getting Started with LabVIEW SignalExpress
Page 33

Performing Sweep
Measurements
You can use LabVIEW SignalExpress to automate measurements to
characterize and validate designs by creating sweep operations. You can
use the sweep measurements to gather data from designs over a range of
conditions to document the performance of the designs. For example, you
can use sweep operations to vary the frequency of a stimulus signal or vary
the level of a supply voltage while taking measurements to characterize
designs.
This chapter teaches you how to set up sweep operations using the Sweep
step in LabVIEW SignalExpress. You learn how to characterize the
performance of a filter by sweeping through a range of frequency values
and measuring the output of the filter. You also learn how to display sweep
results and perform multidimensional sweeps for more complex
measurements.
Defining Sweep Ranges and Outputs
6
You can use the Sweep step in LabVIEW SignalExpress to define
automated measurements for complex, repeatable sweep operations.
Complete the following steps to define a frequency range in a sample
project to sweep through a filter.
1. Select File»Open Project, navigate to the
Examples\Tutorial
2. Click the Run button, shown at left, to run the project.
The project generates a sine wave stimulus signal using the Create
Signal step, passes it through a bandpass elliptic filter using the Filter
step, measures the RMS level of the filter output using the Amplitude
and Levels step, and converts the level to decibels (dB) using the
Formula step. The Filter step acts as a simulated unit under test, so the
project uses no hardware. However, you also can sweep physical
signals generated from a National Instruments arbitrary waveform
© National Instruments Corporation 6-1 Getting Started with LabVIEW SignalExpress
directory, and double-click Sweep.seproj.
SignalExpress\
Page 34

Chapter 6 Performing Sweep Measurements
generator, function generator, dynamic signal analyses, or
multifunction I/O (MIO) device.
3. Click the Add Step button, shown at left, and select Execution
Control»Sweep.
4. Click the Add button in the Step Setup dialog box to display the list
of sweep parameters from each step in the project, as shown in
Figure 6-1.
Figure 6-1. Sweep Parameter Selection Dialog Box
5. Select the Frequency parameter under Create Signal and click the
OK button.
The Sweep step encloses the Create Signal step, which provides the
signal to sweep.
6. On the Sweep Configuration tab, select Exponential from the Type
pull-down menu.
7. Enter
1k in the Start Frequency (Hz) field, and enter 40k in the Stop
Frequency (Hz) field.
8. Enter
150 in the Number of points field.
The Sweep Configuration tab should appear as shown in Figure 6-2.
Getting Started with LabVIEW SignalExpress 6-2 ni.com
Page 35

Chapter 6 Performing Sweep Measurements
Figure 6-2. Sweep Step Setup Dialog Box
You used the Sweep step to specify a range of values to iterate through
the Frequency parameter of the Create Signal step. The Create Signal
step uses the defined frequency range to generate a sine wave at each
of these frequencies. However, you can use the Sweep step to sweep
any sweepable parameter value of any sweepable step in a project.
9. Click the Sweep Output tab.
10. Click the Add button to display the list of sweep outputs from each
step in the project.
11. Select the response amplitude in dB output under Formula and click
the OK button to plot this measurement against the swept Frequency
parameter.
The Sweep step creates a loop around all the steps in the Project View
to include all the steps in the sweep operation.
© National Instruments Corporation 6-3 Getting Started with LabVIEW SignalExpress
Page 36

Chapter 6 Performing Sweep Measurements
Plotting Sweep Results
Complete the following steps to run the sweep measurement.
1. Click the Run Once button, shown at left, to execute the sweep
measurement.
The stimulus signal output on the graph iterates through the specified
range of frequencies.
2. Drag the response amplitude in dB vs. Frequency signal from the
bottom of the Sweep loop to the Data View to display the output of the
sweep.
LabVIEW SignalExpress creates a new graph. The data from a sweep
operation is an x-y array that requires a separate graph, as shown in
Figure 6-3.
Figure 6-3. Sweep.seproj
Getting Started with LabVIEW SignalExpress 6-4 ni.com
Page 37

Chapter 6 Performing Sweep Measurements
3. Click the Run Once button again to execute the sweep.
The frequency response of the Filter step plots on the new graph while
the project runs. The graph displays the transfer function of the filter,
or the amplitude output expressed in decibels versus the frequency.
4. Double-click the Filter step to display the filter specifications in the
Step Setup dialog box.
The frequency response of the filter in the Filter Magnitude
Response graph matches the graph in the Data View.
5. Select File»Save Project As and save the project as
My Sweep.seproj in the SignalExpress\Examples\Tutorial
directory.
You can use the Sweep step to sweep multiple parameters simultaneously
by adding additional parameters on the Sweep Configuration tab of the
Sweep Step Setup dialog box. Sweeping two or more parameters
simultaneously is called a parallel sweep. For example, if you want to vary
the amplitude of a stimulus signal, you can run a parallel sweep. You can
use a parallel sweep to maximize the precision of the acquisition by varying
the input range of a digitizer or MIO device as you vary the signal level. As
the signal level increases, you can increase the input range of the
measurement device to ensure you use the entire resolution for the
measurement.
Running Multidimensional Sweeps
Use multidimensional, or nested, sweeps to iterate through one range while
you vary another range. For example, if you want to sweep through
frequencies of a stimulus signal at different amplitudes, run a nested sweep.
You can set the amplitude to level 1 and sweep through frequencies, and
then set the amplitude to level 2 and sweep through frequencies, and so on.
You can build a nested sweep by right-clicking a Sweep step in a project
and selecting Add Dimension from the shortcut menu to add another
sweep loop.
Complete the following steps to run a sample nested sweep project.
1. Select File»Open Project, navigate to the
Examples\Tutorial
Sweep.seproj.
2. Click the Run button, shown at left, to run the project.
Each iteration of the inner sweep loop sweeps the frequency of the
stimulus signal. The outer sweep loop varies the low and high cutoff
© National Instruments Corporation 6-5 Getting Started with LabVIEW SignalExpress
directory, and double-click Nested
SignalExpress\
Page 38

Chapter 6 Performing Sweep Measurements
frequencies of the Filter step. Each iteration appears in real time on the
upper graph, and then appears on the lower graph to display all the
sweeps at each cutoff frequency setting, as shown in Figure 6-4.
Figure 6-4. Nested Sweep.seproj
3. Click the Stop button, shown at left, to stop the project.
Getting Started with LabVIEW SignalExpress 6-6 ni.com
Page 39

Extending LabVIEW
SignalExpress Projects with
LabVIEW
You can use LabVIEW SignalExpress to define automated measurements
by using built-in steps for acquiring, generating, analyzing, or logging
signals. You can extend the functionality of LabVIEW SignalExpress
projects by using LabVIEW in the following ways:
• Build a VI in LabVIEW and import this VI into LabVIEW
SignalExpress to provide custom step functionality and expand the
number of steps available in LabVIEW SignalExpress.
• Convert a LabVIEW SignalExpress project to a LabVIEW block
diagram to continue development in LabVIEW.
You must have LabVIEW 7.1 or later to complete the exercises in this
chapter.
7
Importing LabVIEW VIs into LabVIEW SignalExpress as Steps
Use the Run LabVIEW VI step in LabVIEW SignalExpress to call custom
LabVIEW VIs. You can call a LabVIEW VI from LabVIEW
SignalExpress to do the following:
• Control GPIB instruments
• Control National Instruments hardware that LabVIEW SignalExpress
does not support
• Read or write data to more file formats
• Display operator instructions in a pop-up dialog box
• Define a measurement algorithm
© National Instruments Corporation 7-1 Getting Started with LabVIEW SignalExpress
Page 40

Chapter 7 Extending LabVIEW SignalExpress Projects with LabVIEW
Complete the following steps to import a VI from LabVIEW with the Run
LabVIEW VI Step.
1. Select File»Open Project, navigate to the
Examples\Tutorial
Step.seproj.
directory, and double-click User
This project uses the Create Signal step to generate a signal.
2. Click the Add Step button and select Run LabVIEW VI»Run
LabVIEW 8.2 VI.
The VI you run in this exercise was saved in LabVIEW 8.2. You must
use the version of the Run LabVIEW VI step that matches the version
of LabVIEW you saved your VI in.
3. Click the browse button on the Step Setup dialog box and select
Limiter-LV82.vi in the LabVIEW SignalExpress\Examples\
Tutorial
directory. The Limiter-LV82 VI accepts a time-domain
waveform as an input, clips the signal above and below values that you
specify in the Step Setup dialog box, and returns the clipped
waveform as an output signal.
When you import a LabVIEW VI, LabVIEW SignalExpress maps the
inputs of the VI as parameters and the outputs of the VI as output
signals in LabVIEW SignalExpress.
You can define whether the inputs for VIs become input signals or
parameters. An input signal appears in the Project View as an input to
a step, which means you can pass signals as inputs to a VI. A parameter
is a value you can configure on the Step Setup dialog box of a step.
You also can sweep parameters dynamically using the Sweep step. In
this project, the VI has an input signal, Time waveform in, and scalar
parameters, Upper limit and Lower limit.
Verify that the Step Setup dialog box appears as shown in Figure 7-1.
SignalExpress\
Getting Started with LabVIEW SignalExpress 7-2 ni.com
Page 41

Chapter 7 Extending LabVIEW SignalExpress Projects with LabVIEW
Figure 7-1. Limiter VI Step Setup Dialog Box
4. Click the Run button, shown at left, to run the project.
5. Drag the Clipped waveform out output signal from the Limiter.vi step
to the Data View.
6. Double-click the Limiter.vi step to display the Step Setup dialog box.
7. Select the Configure VI tab to display the VI.
8. Enter new values in the Upper limit and Lower limit fields. For
example, enter
100 in the Upper limit field.
9. Click the Apply button to apply the changes.
10. Click the Close button to close the VI and click the Close button to
close the Step Setup dialog box.
The Clipped waveform out signal changes on the Data View to reflect
the changes you made.
Refer to the LabVIEW SignalExpress Help for more information about
using LabVIEW VIs in LabVIEW SignalExpress and building VIs that
work well in LabVIEW SignalExpress.
© National Instruments Corporation 7-3 Getting Started with LabVIEW SignalExpress
Page 42

Chapter 7 Extending LabVIEW SignalExpress Projects with LabVIEW
Converting LabVIEW SignalExpress Projects to LabVIEW Block Diagrams
LabVIEW SignalExpress can convert LabVIEW SignalExpress projects
into LabVIEW block diagrams.
Note To convert an LabVIEW SignalExpress project to a LabVIEW VI, you must have
the LabVIEW 7.1 Full Development System or greater installed.
Complete the following steps to convert a LabVIEW SignalExpress project
to a LabVIEW block diagram.
1. Select File»Open Project, navigate to the
Examples\Tutorial\Solutions
Project.seproj.
2. Select Tools»Generate Code»LabVIEW Diagram.
3. Specify a filename and location for the new LabVIEW VI and click the
OK button.
The resulting LabVIEW block diagram reflects the execution of the
project in LabVIEW SignalExpress. The LabVIEW block diagram
consists of LabVIEW Express VIs wired together. Each Express VI
correlates to a step in the LabVIEW SignalExpress project. You can
double-click an Express VI to display the same Step Setup dialog box
as in LabVIEW SignalExpress. You also can right-click an Express VI
and select Open Front Panel from the shortcut menu to convert the
Express VI into a LabVIEW subVI. You can view the block diagram
to see how the LabVIEW block diagram executes and modify the
functionality of the VI. When you convert an Express VI into a subVI,
you cannot convert the subVI back into an Express VI.
SignalExpress\
and double-click My First
Note When you convert a LabVIEW SignalExpress project with logging, LabVIEW
SignalExpress generates a LabVIEW block diagram with one Express VI. You cannot
convert the generated Express VI into a subVI.
Getting Started with LabVIEW SignalExpress 7-4 ni.com
Page 43

Where to Go from Here
Refer to the following resources for more information about LabVIEW
SignalExpress.
LabVIEW SignalExpress Sample Projects
LabVIEW SignalExpress provides a variety of sample projects that
demonstrate more capabilities of LabVIEW SignalExpress. These projects
are located in the
examples to learn more about the features of LabVIEW SignalExpress or
to start with a project that closely resembles your needs.
Using Hardware with LabVIEW SignalExpress
This manual does not describe how to control hardware from LabVIEW
SignalExpress because LabVIEW SignalExpress supports a variety of
National Instruments hardware for acquiring and generating signals. You
can generate or acquire and log analog signals in SignalExpress using
National Instruments MIO devices, dynamic signal acquisition devices,
high-speed digitizers, or arbitrary waveform generator and function
generator devices. You also can synchronize multiple devices in a system
by sharing clocks and trigger signals between devices. Refer to the
LabVIEW SignalExpress Help by selecting Help»LabVIEW
SignalExpress Help for more information about using hardware with
LabVIEW SignalExpress.
SignalExpress\Examples directory. Review these
8
Web Resources
Refer to the National Instruments Web site at ni.com/signalexpress
for resources such as example projects, technical documents, and
LabVIEW VIs written for use in LabVIEW SignalExpress.
© National Instruments Corporation 8-1 Getting Started with LabVIEW SignalExpress
Page 44

Technical Support and
Professional Services
Visit the following sections of the National Instruments Web site at
ni.com for technical support and professional services:
• Support—Online technical support resources at
include the following:
– Self-Help Resources—For immediate answers and solutions,
visit the award-winning National Instruments Web site for
software drivers and updates, a searchable KnowledgeBase,
product manuals, step-by-step troubleshooting wizards, thousands
of example programs, tutorials, application notes, instrument
drivers, and so on.
– Free Technical Support—All registered users receive free Basic
Service, which includes access to hundreds of Application
Engineers worldwide in the NI Developer Exchange at
ni.com/exchange. National Instruments Application Engineers
make sure every question receives an answer.
• Training and Certification—Visit
self-paced training, eLearning virtual classrooms, interactive CDs,
and Certification program information. You also can register for
instructor-led, hands-on courses at locations around the world.
• System Integration—If you have time constraints, limited in-house
technical resources, or other project challenges, National Instruments
Alliance Partner members can help. To learn more, call your local
NI office or visit
ni.com/alliance.
A
ni.com/support
ni.com/training for
If you searched
your local office or NI corporate headquarters. Phone numbers for our
worldwide offices are listed at the front of this manual. You also can visit
the Worldwide Offices section of
office Web sites, which provide up-to-date contact information, support
phone numbers, email addresses, and current events.
© National Instruments Corporation A-1 Getting Started with LabVIEW SignalExpress
ni.com and could not find the answers you need, contact
ni.com/niglobal to access the branch
Page 45

LabVIEWTM SignalExpress
Initiation à LabVIEW SignalExpress
Initiation à LabVIEW SignalExpress
TM
Août 2007
373873B-0114
Page 46

Filiales francophones
National Instruments National Instruments National Instruments National Instruments
France Suisse Belgium nv Canada
2, rue Hennape Sonnenbergstr. 53 Ikaroslaan 13 1 Holiday Street
92735 Nanterre Cedex CH-5408 Ennetbaden B-1930 Zaventem East Tower, Suite 501
Point-Claire, Québec H9R 5N3
Support
E-mail : france.support@ni.com
switzerland.support@ni.com
belgium.support@ni.com
canada.support@ni.com
Site FTP : ftp.ni.com
Adresse web : ni.com
Téléphone :
France Tél. : 01 57 66 24 24 Fax : 01 57 66 24 14
Suisse Tél. : 056 2005151 Fax : 056 200 51 55
Belgique Tél. : 02 757 0020 Fax : 02 757 03 11 Tél. : 4050120 (Luxembourg)
Canada (Québec) Tél. : 450 510 3055 Fax : 450 510 3056
Filiales internationales
Afrique du Sud 27 0 11 805 8197, Allemagne 49 89 7413130, Australie 1800 300 800,
Autriche 43 662 457990-0, Brésil 55 11 3262 3599, Canada 800 433 3488, Chine 86 21 5050 9800,
Corée 82 02 3451 3400, Danemark 45 45 76 26 00, Espagne 34 91 640 0085, Finlande 385 (0) 9 725 72511,
Grande-Bretagne 44 0 1635 523545, Inde 91 80 41190000, Israël 972 3 6393737, Italie 39 02 413091,
Japon 81 3 5472 2970, Liban 961 (0) 1 33 28 28, Malaisie 1800 887710
Norvège 47 (0) 66 90 76 60, Nouvelle-Zélande 0800 553 322, Pays-Bas 31 (0) 348 433 466,
Pologne 48 22 3390150, Portugal 351 210 311 210, République Tchèque 420 224 235 774,
Russie 7 495 783 6851, Singapour 1800 226 5886, Slovénie 386 3 425 42 00, Suède 46 (0) 8 587 895 00,
Taïwan 886 02 2377 2222, Thaïlande 662 278 6777, Turquie 90 212 279 3031
ni.com/france/support
ni.com/switzerland
ni.com/belgium
ni.com/canada
, Mexique 01 800 010 0793,
National Instruments Corporate Headquarters
11500 North Mopac Expressway Austin, Texas 78759-3504 USA Tél. : 512 683 0100
Pour obtenir de plus amples informations, reportez-vous à l’annexe Support technique et services. Si vous
souhaitez formuler des commentaires sur la documentation National Instruments, reportez-vous au site Web de
National Instruments sur
© 2004–2007 National Instruments Corporation. Tous droits réservés.
ni.com/frinfo et entrez l’info-code feedback.
Page 47

Informations importantes
Garantie
Le support sur lequel vous recevez le logiciel National Instruments est garanti contre tout défaut d’exécution des instructions de programmation
qui résulterait d’un défaut matériel ou de fabrication, pour une période de 90 jours à partir de la date d’expédition, telle qu’indiquée sur les
reçus ou tout autre document. National Instruments réparera ou remplacera, au choix de National Instruments, le support n’exécutant pas les
instructions de programmation sous réserve que National Instruments se soit vu notifier lesdits défauts au cours de la période de garantie.
National Instruments ne garantit pas que le fonctionnement du logiciel sera ininterrompu ou exempt d’erreur.
Un produit ne pourra être accepté en retour dans le cadre de la garantie que si un numéro ARM (Autorisation de Retour Matériel) a été obtenu
auprès de l’usine et a été clairement apposé sur l’extérieur de l’emballage. National Instruments supportera les frais de port liés au retour au
propriétaire de pièces couvertes par la garantie.
National Instruments considère que les informations contenues dans le présent document sont correctes. Le document a été soigneusement revu
afin de vérifier son exactitude sur le plan technique. Dans l’hypothèse où ce document contiendrait des inexactitudes techniques ou des erreurs
typographiques, National Instruments se réserve le droit d’apporter des modifications aux futures éditions du présent document sans avoir
besoin d’en informer au préalable les titulaires de la présente édition. Le lecteur est invité à consulter National Instruments s’il pense avoir
relevé des erreurs. National Instruments ne pourra en aucun cas être tenu responsable des préjudices pouvant résulter ou pouvant être liés à ce
document ou à l’information qu’il contient.
EN DEHORS DE CE QUI EST EXPRESSÉMENT PRÉVU AUX PRÉSENTES, NATIONAL INSTRUMENTS NE DONNE AUCUNE
GARANTIE, EXPRESSE OU IMPLICITE, ET EXCLUT SPÉCIFIQUEMENT TOUTE GARANTIE QUANT À LA QUALITÉ
MARCHANDE OU À L’APTITUDE À UNE UTILISATION PARTICULIÈRE. LE DROIT À INDEMNISATION DE L’UTILISATEUR
DANS L’HYPOTHÈSE D’UNE FAUTE OU D’UNE NÉGLIGENCE DE NATIONAL INSTRUMENTS SERA LIMITÉ AU MONTANT
PAYÉ PAR L’UTILISATEUR POUR LE PRODUIT EN CAUSE. NATIONAL INSTRUMENTS NE POURRA ÊTRE TENU
RESPONSABLE DES DOMMAGES RÉSULTANT DE LA PERTE DE DONNÉES, DE PROFITS, D’UTILISATION DE PRODUITS OU
POUR TOUT PRÉJUDICE INDIRECT OU INCIDENT, MÊME SI NATIONAL INSTRUMENTS A ÉTÉ AVISÉ DE LA POSSIBILITÉ DE
LA SURVENANCE DE TELS DOMMAGES. Cette limitation de responsabilité de National Instruments s’appliquera quel que soit le
fondement de la mise en cause de sa responsabilité, contractuelle ou délictuelle, y compris s’il s’agit de négligence. Toute action contre
National Instruments devra être introduite dans le délai d’un an à compter de la survenance du fondement de cette action. National Instruments
ne pourra en aucun cas être tenu responsable des retards d’exécution résultant de causes pouvant raisonnablement être considérées comme
échappant à son contrôle. La garantie prévue aux présentes ne couvre pas les dommages, défauts, y compris de fonctionnement, résultant du
non-respect des instructions d’installation, d’utilisation ou d’entretien données par National Instruments ; de la modification du produit par le
propriétaire ; d’abus d’utilisation, de mauvaise utilisation ou de négligence de la part du propriétaire ; et de fluctuations dans l’alimentation
électrique, d’incendies, d’inondations, d’accidents, d’actes de tiers ou de tout autre événement pouvant raisonnablement être considéré comme
échappant au contrôle de National Instruments.
Droits d’auteur
Conformément à la réglementation applicable en matière de droits d’auteur, cette publication ne peut pas être reproduite ni transmise sous une
forme quelconque, que ce soit par voie électronique ou mécanique, notamment par photocopie, enregistrement ou stockage dans un système
permettant la récupération d’informations, ni traduite, en tout ou partie, sans le consentement préalable et écrit de National Instruments
Corporation.
National Instruments respecte les droits de propriété intellectuelle appartenant à des tiers et nous demandons aux utilisateurs de nos produits
de les respecter également. Les logiciels NI sont protégés par la réglementation applicable en matière de droits d’auteur et de propriété
intellectuelle. Lorsque des logiciels NI peuvent être utilisés pour reproduire des logiciels ou autre matériel appartenant à des tiers, vous ne
pouvez utiliser les logiciels NI à cette fin que pour autant que cette reproduction est permise par les termes du contrat de licence applicable
auxdits logiciels ou matériel et par la réglementation en vigueur.
Marques
National Instruments, NI, ni.com et LabVIEW sont des marques de National Instruments Corporation. Pour plus d’informations concernant les
marques de National Instruments, veuillez vous référer à la partie Terms of Use sur le site
Les autres noms de produits et de sociétés mentionnés aux présentes sont les marques ou les noms de leurs propriétaires respectifs.
Les membres du programme “National Instruments Alliance Partner Program” sont des entités professionnelles indépendantes de National
Instruments et aucune relation d’agence, de partenariat ou “joint-venture” n’existe entre ces entités et National Instruments.
ni.com/legal.
Brevets
Pour la liste des brevets protégeant les produits National Instruments, veuillez vous référer, selon le cas : à la rubrique Aide»Brevets de votre
logiciel, au fichier
patents.txt sur votre CD, ou à ni.com/patents.
MISE EN GARDE CONCERNANT L’UTILISATION DES PRODUITS NATIONAL INSTRUMENTS
(1) LES PRODUITS NATIONAL INSTRUMENTS NE SONT PAS CONÇUS AVEC DES COMPOSANTS NI SOUMIS À DES TESTS
D’UN NIVEAU SUFFISANT POUR ASSURER LA FIABILITÉ DE LEUR UTILISATION DANS OU EN RAPPORT AVEC DES
IMPLANTS CHIRURGICAUX OU EN TANT QUE COMPOSANTS ESSENTIELS DE SYSTÈMES DE MAINTIEN DE LA VIE DONT
LE MAUVAIS FONCTIONNEMENT POURRAIT CAUSER DES DOMMAGES IMPORTANTS SUR UNE PERSONNE.
(2) DANS TOUTE APPLICATION, Y COMPRIS CELLE CI-DESSUS, LE FONCTIONNEMENT DE PRODUITS LOGICIELS PEUT
ÊTRE CONTRARIÉ PAR CERTAINS FACTEURS, Y COMPRIS, NOTAMMENT, LES FLUCTUATIONS D’ALIMENTATION
ÉLECTRIQUE, LE MAUVAIS FONCTIONNEMENT DU MATÉRIEL INFORMATIQUE, LE MANQUE DE COMPATIBILITÉ AVEC LE
SYSTÈME D’EXPLOITATION DE L’ORDINATEUR, LE MANQUE D’ADÉQUATION DES COMPILATEURS ET LOGICIELS
UTILISÉS POUR DÉVELOPPER UNE APPLICATION, LES ERREURS D’INSTALLATION, LES PROBLÈMES DE COMPATIBILITÉ
ENTRE LE LOGICIEL ET LE MATÉRIEL, LES DÉFAUTS DE FONCTIONNEMENT OU LES PANNES DES APPAREILS
ÉLECTRONIQUES DE SURVEILLANCE OU DE CONTRÔLE, LES PANNES TEMPORAIRES DE SYSTÈMES ÉLECTRONIQUES
(MATÉRIEL ET/OU LOGICIEL), UNE UTILISATION NON PRÉVUE OU UNE MAUVAISE UTILISATION OU ENCORE DES
ERREURS DE LA PART DE L’UTILISATEUR OU DU CONCEPTEUR D’APPLICATION (DES FACTEURS TELS QUE CEUX
Page 48

PRÉCITÉS SONT CI-APRÈS DÉSIGNÉS ENSEMBLE DES “DÉFAILLANCES DE SYSTÈME”). TOUTE APPLICATION DANS
LAQUELLE UNE DÉFAILLANCE DE SYSTÈME ENGENDRERAIT UN RISQUE D’ATTEINTE AUX BIENS OU AUX PERSONNES
(Y COMPRIS UN RISQUE DE BLESSURES CORPORELLES OU DE DÉCÈS) NE DOIT PAS ÊTRE DÉPENDANTE D’UN SEUL
SYSTÈME ÉLECTRONIQUE EN RAISON DU RISQUE DE DÉFAILLANCE DE SYSTÈME. POUR ÉVITER TOUT DOMMAGE,
BLESSURE OU DÉCÈS, L’UTILISATEUR OU LE CONCEPTEUR D’APPLICATION DOIT PRENDRE TOUTES LES PRÉCAUTIONS
RAISONNABLEMENT NÉCESSAIRES À LA PROTECTION CONTRE LES DÉFAILLANCES DE SYSTÈME, Y COMPRIS
NOTAMMENT EN PRÉVOYANT DES MÉCANISMES DE SAUVEGARDE OU DE MISE HORS TENSION. LE SYSTÈME
INFORMATIQUE DE CHAQUE UTILISATEUR FINAL ÉTANT ADAPTÉ À SES BESOINS SPÉCIFIQUES ET DIFFÉRENT DES
PLATES-FORMES DE TEST DE NATIONAL INSTRUMENTS ET UN UTILISATEUR OU UN CONCEPTEUR D’APPLICATION
POUVANT UTILISER LES PRODUITS NATIONAL INSTRUMENTS EN COMBINAISON AVEC D’AUTRES PRODUITS D’UNE
FAÇON NON PRÉVUE OU NON TESTÉE PAR NATIONAL INSTRUMENTS, L’UTILISATEUR OU LE CONCEPTEUR
D’APPLICATION EST SEUL RESPONSABLE DE LA VÉRIFICATION ET DE LA VALIDATION DE L’ADÉQUATION ET DE LA
COMPATIBILITÉ DES PRODUITS NATIONAL INSTRUMENTS DÈS LORS QUE DES PRODUITS NATIONAL INSTRUMENTS SONT
INTÉGRÉS DANS UN SYSTÈME OU UNE APPLICATION, Y COMPRIS NOTAMMENT, DE L’ADÉQUATION DE LA CONCEPTION,
DU FONCTIONNEMENT ET DU NIVEAU DE SÉCURITÉ DUDIT SYSTÈME OU APPLICATION.
Page 49

Sommaire
À propos de ce manuel
Conventions ...................................................................................................................vii
Documentation associée ................................................................................................viii
Chapitre 1
Introduction à LabVIEW SignalExpress
Chapitre 2
Installation de LabVIEW SignalExpress
LabVIEW SignalExpress LE.........................................................................................2-1
Configuration système minimale requise ......................................................................2-1
Installation de LabVIEW SignalExpress .......................................................................2-2
Chapitre 3
Travailler avec des projets
Ouverture d’un projet.....................................................................................................3-1
Exécution d’un projet et affichage de signaux...............................................................3-2
Configuration d’une étape .............................................................................................3-5
Déplacement et suppression d’étapes ............................................................................3-8
Gestion des erreurs et des mises en garde......................................................................3-8
Chapitre 4
Manipulation de signaux
Représentation de signaux dans des graphes .................................................................4-1
Importation d’un signal à partir d’un fichier .................................................................4-3
Alignement et comparaison de signaux.........................................................................4-4
Types de signaux dans LabVIEW SignalExpress..........................................................4-6
Exportation et impression de signaux............................................................................4-7
Enregistrement de signaux dans un fichier......................................................4-7
Exportation de signaux dans Microsoft Excel.................................................4-8
Impression de signaux.....................................................................................4-8
Création de rapports dans LabVIEW SignalExpress.......................................4-8
© National Instruments Corporation v Initiation à LabVIEW SignalExpress
Page 50

Sommaire
Chapitre 5
Enregistrement des données
Enregistrement d’un signal............................................................................................5-1
Affichage d’un signal enregistré dans un journal..........................................................5-2
Enregistrement de signaux avec des conditions de démarrage et d’arrêt
prédéfinies ..................................................................................................................5-4
Analyse des signaux enregistrés.................................................................................... 5-6
Relecture avancée..........................................................................................................5-7
Chapitre 6
Réalisation de mesures de balayage
Définition de sorties et de gammes de balayage ........................................................... 6-1
Traçage des résultats du balayage ................................................................................. 6-4
Exécution de balayages multidimensionnels................................................................. 6-5
Chapitre 7
Extension des projets LabVIEW SignalExpress avec LabVIEW
Importation de VIs LabVIEW dans SignalExpress sous forme d’étapes...................... 7-1
Conversion de projets LabVIEW SignalExpress en diagrammes LabVIEW ............... 7-4
Chapitre 8
Et maintenant ?
Projets d’exemple LabVIEW SignalExpress.................................................................8-1
Utilisation du matériel avec LabVIEW SignalExpress ................................................. 8-1
Ressources Web............................................................................................................. 8-1
Annexe A
Support technique et services
Initiation à LabVIEW SignalExpress vi ni.com
Page 51

À propos de ce manuel
Utilisez ce manuel pour vous familiariser avec les mesures interactives dans
LabVIEW SignalExpress et les fonctionnalités de base de LabVIEW
SignalExpress que vous utilisez pour acquérir et analyser des signaux.
Ce manuel contient des exercices qui vous aident à prendre en main
LabVIEW SignalExpress. Ces exercices vous apprennent comment
exécuter des projets, configurer des étapes, manipuler des signaux,
configurer des mesures de balayage, enregistrer des données et étendre les
possibilités de LabVIEW SignalExpress avec l’environnement de
programmation graphique LabVIEW.
Conventions
Les conventions suivantes apparaissent dans ce manuel :
» Le symbole » vous guide à travers les éléments de menu imbriqués et les
options de boîte de dialogue pour une action finale. Ainsi, la séquence
Fichier»Mise en page»Options indique qu’il vous faut dérouler le menu
Fichier, sélectionner l’élément Mise en page et sélectionner Options dans
la dernière boîte de dialogue.
Cette icône représente une remarque qui vous donne des informations
importantes.
gras Du texte en caractères gras représente un élément que vous devez
sélectionner ou sur lequel vous devez cliquer dans le logiciel, comme les
éléments de menu ou les options de boîte de dialogue. Du texte en
caractères gras indique également des noms d’entrées et de sorties, des
noms de paramètres, des boîtes de dialogue, des sections de boîte de
dialogue et des noms de menus.
italique Du texte en italique signale les variables, la mise en valeur, une référence
croisée ou une introduction à un concept-clé. Il indique également un texte
que vous devez remplacer par un mot ou une valeur.
monospace Du texte dans cette police indique du texte ou des caractères qui doivent
être entrés avec le clavier. Cette police est également utilisée pour les noms
des disques durs, des chemins, des répertoires, des programmes, des
sous-programmes, des noms des périphériques, des fonctions, des
opérations, des variables et des noms de fichiers et d’extensions.
© National Instruments Corporation vii Initiation à LabVIEW SignalExpress
Page 52

À propos de ce manuel
Documentation associée
Reportez-vous à l’Aide LabVIEW Signal Express, disponible en
sélectionnant Aide»Aide LabVIEW Signal Express, pour obtenir des
informations complémentaires.
Initiation à LabVIEW SignalExpress viii ni.com
Page 53

Introduction à LabVIEW
SignalExpress
National Instruments offre des solutions innovatrices aux scientifiques et
aux ingénieurs pour construire des systèmes de mesure automatisés basés
sur les plates-formes et les ordinateurs conformes aux normes de
l’industrie. National Instruments développe des environnements de
programmation robustes, à la pointe de la technologie, comme LabVIEW
pour le développement graphique, LabWindows
programmation en C ANSI et Measurement Studio pour la programmation
avec Microsoft Visual Studio. Vous pouvez utiliser ces outils de
programmation avec le matériel de mesure de National Instruments et les
interfaces vers les instruments traditionnels pour construire des systèmes
d’instrumentation virtuelle avancés.
LabVIEW SignalExpress optimise l’instrumentation virtuelle pour les
ingénieurs concepteurs en offrant des mesures interactives instantanées qui
ne requièrent aucune programmation. Vous pouvez utiliser LabVIEW
SignalExpress de manière interactive pour acquérir, générer, analyser,
comparer, importer et enregistrer des signaux. Vous pouvez comparer des
données de conception avec des données de mesure en une étape.
LabVIEW SignalExpress apporte la simplicité d’utilisation et les
performances de l’instrumentation virtuelle aux personnes qui doivent
acquérir ou analyser des signaux sans programmer des applications. Vous
pouvez aussi étendre les fonctionnalités de LabVIEW SignalExpress en
important un VI (instrument virtuel) personnalisé créé dans
l’environnement de développement graphique LabVIEW ou en
convertissant un projet LabVIEW SignalExpress en un diagramme
LabVIEW ce qui vous permet de poursuivre le développement dans
l’environnement LabVIEW. Reportez-vous au chapitre 7, Extension des
projets LabVIEW SignalExpress avec LabVIEW, pour obtenir de plus
amples informations.
™
/CVI™ pour la
1
© National Instruments Corporation 1-1 Initiation à LabVIEW SignalExpress
Page 54

Installation de LabVIEW
SignalExpress
Vous pouvez utiliser le CD LabVIEW SignalExpress pour installer
LabVIEW SignalExpress et effectuer les exercices de ce manuel.
LabVIEW SignalExpress LE
LabVIEW SignalExpress LE vous offre une période d’évaluation de
30 jours de la version complète de LabVIEW SignalExpress. Une fois cette
période écoulée, vous devez activer votre version de LabVIEW
SignalExpress LE ou acheter la version complète. Si vous activez votre
version de SignalExpress LE avant la fin des 30 jours d’évaluation, toutes
les fonctionnalités resteront disponibles pendant le restant de la période
d’évaluation. Vous pouvez utiliser LabVIEW SignalExpress LE pour
effectuer une acquisition de données simple et enregistrer des fonctions.
Si vous n’enregistrez pas la version LE de LabVIEW SignalExpress dans
un délai de 30 jours, elle s’exécute avec les limites suivantes :
• Vous ne pouvez plus enregistrer les projets et vous ne pouvez donc pas
convertir les projets en diagrammes LabVIEW.
• Vous pouvez exécuter des projets à raison de 10 minutes seulement par
session.
2
Reportez-vous au site Web de National Instruments sur
signalexpress
SignalExpress.
pour acheter la version complète de LabVIEW
ni.com/
Configuration système minimale requise
LabVIEW SignalExpress exige un minimum de 256 Mo de RAM et un
processeur Pentium III ou plus récent, ou un processeur Celeron 866 MHz
ou équivalent, mais National Instruments recommande 512 Mo de RAM et
un processeur Pentium 4/M ou équivalent.
© National Instruments Corporation 2-1 Initiation à LabVIEW SignalExpress
Page 55

Chapitre 2 Installation de LabVIEW SignalExpress
Installation de LabVIEW SignalExpress
Effectuez les étapes suivantes pour installer LabVIEW SignalExpress sous
Windows Vista/XP/2000/NT.
Remarque Si vous voulez convertir des projets LabVIEW SignalExpress en diagrammes
LabVIEW, vous devez installer LabVIEW 7.1 ou une version ultérieure avant d’installer
LabVIEW SignalExpress.
1. Désactivez tous les programmes de détection automatique de virus
avant de procéder à l’installation. Certains programmes de détection de
virus interfèrent avec le programme d’installation.
2. Ouvrez une session en tant qu’administrateur ou en tant qu’utilisateur
jouissant de privilèges d’administrateur.
3. Insérez le CD LabVIEW SignalExpress Development ou le CD
d’évaluation et suivez les instructions qui s’affichent à l’écran.
Par défaut, LabVIEW SignalExpress s’installe dans le répertoire
Program Files\National Instruments\SignalExpress.
4. Après l’installation, vérifiez que le disque dur ne contient pas de virus
et activez les programmes de détection de virus que vous aviez
éventuellement désactivés.
Les projets d’exemple que vous utilisez avec ce manuel se trouvent dans le
répertoire
exercices se trouvent dans
Solutions
SignalExpress\Examples\Tutorial. Les solutions des
SignalExpress\Examples\Tutorial\
.
Si vous utilisez LabVIEW SignalExpress avec du matériel National
Instruments d’acquisition de données ou d’instrumentation modulaire,
vous devez installer NI-DAQmx 8.5 ou une version ultérieure,
NI-SCOPE 2.7 ou une version ultérieure, ou NI-FGEN 2.2 ou une version
ultérieure ou NI-DMM 2.4.2. LabVIEW SignalExpress comprend un CD
de drivers National Instruments qui intègre ces drivers.
Initiation à LabVIEW SignalExpress 2-2 ni.com
Page 56

Travailler avec des projets
Vous pouvez utiliser LabVIEW SignalExpress pour définir des procédures
de mesure en ajoutant et en configurant des étapes dans un environnement
de mesure interactif. Une étape est une fonction configurable qui acquiert,
génère, analyse, charge ou enregistre des signaux. La plupart des étapes
traitent des signaux en entrée et produisent des signaux en sortie. Vous
pouvez configurer le fonctionnement d’une étape en spécifiant des valeurs
sur la page de configuration. Une séquence enregistrée d’étapes
configurées constitue un projet LabVIEW SignalExpress.
Ce chapitre vous apprend à charger et à exécuter des projets existants et à
configurer des étapes dans ces projets.
Ouverture d’un projet
Effectuez les étapes suivantes pour charger un projet d’exemple dans
LabVIEW SignalExpress.
1. Lancez LabVIEW SignalExpress.
Notez que LabVIEW SignalExpress se divise en trois parties
principales : la Vue du projet à gauche, l’Affichage des données au
centre et l’aide à droite. Dans l’Affichage des données, vous voyez les
onglets Affichage des données, Options d’enregistrement et
Documentation du projet.
2. Si LabVIEW SignalExpress ne s’ouvre pas dans la configuration par
défaut, sélectionnez Affichage»Affichage des données pour afficher
l’Affichage des données.
3. Sélectionnez Fichier»Ouvrir un projet, naviguez vers le répertoire
SignalExpress\Examples\Tutorial et double-cliquez sur le
projet LabVIEW SignalExpress
4. Observez la fenêtre qui apparaît, montrée avec l’aide masquée dans la
figure 3-1, pour vous familiariser avec les différents composants de
LabVIEW SignalExpress.
3
First Project.seproj.
© National Instruments Corporation 3-1 Initiation à LabVIEW SignalExpress
Page 57

Chapitre 3 Travailler avec des projets
1
2
3
4
5
6
5
7
1 Boutons de contrôle d’exécution
2 Menu déroulant Zone de travail
3Étape
9
4 Entrée
5 Sortie
6 Vue du projet
8
7 Fenêtre Données enregistrées
8 Affichage des données
9 Bouton Enregistrer
Figure 3-1. First Project.seproj
Le panneau de gauche est la Vue du projet qui présente l’ordre des
opérations, ou étapes, du projet. Le panneau de droite est l’Affichage
des données qui présente le signal que le projet génère et analyse.
Exécution d’un projet et affichage de signaux
LabVIEW SignalExpress possède deux modes d’exécution : Exécuter et
Exécuter une fois. Lorsque vous cliquez sur le bouton Exécuter, LabVIEW
SignalExpress exécute toutes les étapes du projet en continu jusqu’à ce que
vous cliquiez sur le bouton Arrêter. Le bouton Arrêter apparaît à la place
du bouton Exécuter lorsqu’un projet s’exécute. L’Affichage des données
se met à jour continuellement pendant que les étapes du projet s’exécutent.
Pendant que le projet s’exécute, vous pouvez changer les configurations de
mesure et afficher les résultats immédiatement. Si vous modifiez la
configuration des étapes pendant qu’un projet s’exécute, LabVIEW
Initiation à LabVIEW SignalExpress 3-2 ni.com
Page 58

Chapitre 3 Travailler avec des projets
SignalExpress vous donne un retour d’informations immédiat et direct sur
les modifications que vous avez effectuées. Lorsque vous cliquez sur le
bouton Exécuter une fois, LabVIEW SignalExpress exécute toutes les
étapes du projet une seule fois.
Effectuez les étapes suivantes pour exécuter le projet d’exemple et afficher
des signaux.
1. Cliquez sur le bouton Exécuter, montré à gauche, pour exécuter toutes
les étapes du projet de manière continue.
Le projet charge un signal à partir d’un fichier texte et effectue deux
opérations sur le signal : une mesure de l’amplitude et des niveaux et
une mesure de distorsion. L’étape Amplitude et niveaux et l’étape
Distorsion effectuent ces mesures, respectivement. Lorsque vous
exécutez un projet, les étapes analysent des signaux en entrée et
génèrent de nouveaux signaux en sortie comme résultat de l’analyse.
Dans ce projet, l’étape Charger un fichier ASCII charge un signal
sinusoïdal déformé, l’étape Amplitude et niveaux et l’étape Distorsion
analysent le signal sinusoïdal et les deux renvoient de nouvelles
sorties. Dans la Vue du projet, LabVIEW SignalExpress indique les
entrées avec des flèches rouges et les sorties avec des flèches bleues.
Le graphe dans l’Affichage des données contient toujours le signal
chargé, qui est un signal du domaine temporel. Les graphes affichent
des signaux x-y, du domaine fréquentiel ou du domaine temporel.
2. Cliquez sur le signal en sortie spectre exporté dans l’étape Distorsion
de la Vue du projet et faites-le glisser sur l’Affichage des données pour
afficher le signal.
LabVIEW SignalExpress crée un nouveau graphe dans l’Affichage des
données. LabVIEW SignalExpress n’affiche pas le signal spectre
exporté sur le même graphe que le signal du domaine temporel car le
signal spectre exporté est un signal du domaine fréquentiel.
LabVIEW SignalExpress reconnaît automatiquement les différents
types de signaux et les affiche en fonction de leur type.
3. Sélectionnez Aide»Aide LabVIEW SignalExpress, cliquez sur
l’onglet Rechercher et entrez
"types de signaux" pour vous
référer à l’Aide LabVIEW SignalExpress pour obtenir des informations
complémentaires sur les types de signaux. L’aide offre des
informations sur l’utilisation des fonctionnalités de LabVIEW
SignalExpress telles que les projets, les étapes et les signaux.
© National Instruments Corporation 3-3 Initiation à LabVIEW SignalExpress
Page 59

Chapitre 3 Travailler avec des projets
4. Cliquez sur la sortie cc de l’étape Amplitude et niveaux et faites-la
5. Faites-glisser la sortie Veff vers la table pour afficher la mesure rms
glisser sur l’Affichage des données pour afficher la mesure.
LabVIEW SignalExpress crée une table pour afficher la mesure
scalaire dans la sortie cc.
scalaire.
LabVIEW SignalExpress crée une nouvelle ligne dans la table pour
afficher la deuxième mesure. Le projet doit ressembler à la figure 3-2.
Figure 3-2. Sorties de First Project.seproj
Initiation à LabVIEW SignalExpress 3-4 ni.com
Page 60

Configuration d’une étape
Une étape est une fonction configurable qui acquiert, génère, analyse,
charge ou enregistre des signaux. Les étapes traitent des signaux en
entrée et produisent des signaux en sortie. Vous pouvez configurer le
fonctionnement d’une étape dans SignalExpress en spécifiant des valeurs
dans la boîte de dialogue Configuration de l’étape, ou la page de
configuration, de cette étape. Pendant qu’un projet s’exécute, vous pouvez
modifier la configuration des étapes pour afficher immédiatement le retour
d’informations sur les modifications et ajuster les mesures jusqu’à ce que
vous obteniez les résultats escomptés.
Effectuez les étapes suivantes pour configurer l’étape Distorsion et l’étape
Amplitude et niveaux.
1. Double-cliquez sur l’étape Distorsion dans la Vue du projet. La boîte
de dialogue Configuration de l’étape pour l’étape Distorsion apparaît,
comme le montre la figure 3-3.
Chapitre 3 Travailler avec des projets
Figure 3-3. Boîte de dialogue de configuration de l’étape Distorsion
© National Instruments Corporation 3-5 Initiation à LabVIEW SignalExpress
Page 61

Chapitre 3 Travailler avec des projets
2. Si l’aide contextuelle n’apparaît pas à droite de l’écran, cliquez
3. Sur l’onglet Configuration, sélectionnez Ton fondamental dans le
4. Sélectionnez Harmoniques uniquement dans le menu déroulant
5. Cliquez sur l’étape Amplitude et niveaux dans la Vue du projet.
Sur l’onglet Configuration, les paramètres indiquent que l’étape
Distorsion reçoit un signal temporel sous forme d’une entrée, effectue
un spectre de puissance sur le signal pour le convertir en domaine
fréquentiel et calcule la distorsion harmonique totale (DHT) et la
fréquence fondamentale du signal. L’étape génère trois mesures sous
forme de sorties : le spectre, la DHT et la fréquence fondamentale de
l’entrée du signal du domaine temporel d’origine.
sur le bouton Afficher l’aide, montré à gauche, pour afficher des
informations de référence complètes sur l’étape. La partie supérieure
de l’aide contextuelle affiche des informations sur l’étape, et la partie
inférieure de l’aide contextuelle affiche des informations sur un objet
lorsque vous déplacez le curseur sur celui-ci.
menu déroulant Signaux à exporter (DHT).
Le fonctionnement de l’étape passe de l’affichage du spectre du
domaine fréquentiel du signal en entrée complet à l’affichage du
spectre de fréquence du ton fondamental du signal en entrée
uniquement. Les signaux représentés dans la partie supérieure de la
boîte de dialogue Configuration de l’étape se mettent à jour pour
refléter la modification que vous avez effectuée.
Signaux à exporter (DHT).
L’étape exporte alors uniquement le spectre des signaux harmoniques
du signal en entrée. Le signal en sortie de l’étape Distorsion et le
graphe de l’Affichage des données se mettent à jour pour refléter la
modification que vous avez apportée.
La boîte de dialogue Configuration de l’étape qui affichait la
configuration de l’étape Distorsion, affiche désormais la configuration
de l’étape Amplitude et niveaux.
Initiation à LabVIEW SignalExpress 3-6 ni.com
Page 62

Chapitre 3 Travailler avec des projets
6. Cliquez sur l’onglet Entrée/Sortie pour afficher la liste des entrées et
des sorties possibles pour cette étape, comme le montre la figure 3-4.
Figure 3-4. Boîte de dialogue de configuration de l’étape Amplitude et niveaux
7. Cochez les cases Exporter la valeur max., Exporter la valeur min.
et Exporter la valeur de pic à pic pour configurer l’étape Amplitude
et niveaux pour renvoyer trois mesures supplémentaires.
Trois sorties supplémentaires apparaissent dans la Vue du projet.
8. Cliquez sur l’onglet Affichage des données pour afficher l’Affichage
des données.
9. Faites glisser les trois nouvelles entrées dans la Vue du projet vers la
table pour afficher les mesures scalaires.
10. Cliquez sur le bouton Arrêter, montré à gauche, pour arrêter le projet.
Lorsque vous cliquez sur le bouton Arrêter, le projet arrête de
s’exécuter après avoir terminé le cycle de fonctionnement actuel ou
l’itération actuelle. Cliquez sur la flèche vers le bas à droite du bouton
Arrêter et cliquez sur le bouton Abandonner pour arrêter
complètement le projet sans terminer l’itération en cours.
11. Sélectionnez Fichier»Enregistrer le projet sous et enregistrez le
projet sous
SignalExpress\Examples\Tutorial.
Mon premier projet.seproj dans le répertoire
12. Sélectionnez Fichier»Fermer le projet pour fermer le projet.
© National Instruments Corporation 3-7 Initiation à LabVIEW SignalExpress
Page 63

Chapitre 3 Travailler avec des projets
Déplacement et suppression d’étapes
Les étapes des projets SignalExpress dépendent des données en entrée, ce
qui signifie qu’elles ne peuvent fonctionner qu’avec des signaux provenant
des étapes précédentes de la Vue du projet. Lorsque vous cliquez sur le
menu déroulant Signal en entrée de l’onglet Entrée de la boîte de dialogue
Configuration de l’étape, le menu affiche uniquement des signaux
compatibles exportés par une étape précédente. Lorsque la sortie d’une
étape devient l’entrée d’une autre étape, les deux étapes deviennent
dépendantes l’une de l’autre et s’exécutent de manière séquentielle, à la
même fréquence. La première étape génère un signal en sortie que la
deuxième étape reçoit comme entrée avant de pouvoir s’exécuter.
Vous pouvez déplacer une étape dans un projet en la faisant glisser vers le
haut ou vers le bas dans la Vue du projet. Vous pouvez supprimer une étape
en faisant un clic droit dessus dans la Vue du projet et en sélectionnant
Supprimer dans le menu local. Toutefois, lorsque vous déplacez ou
supprimez une étape, l’état des signaux du projet change. Par exemple,
si vous supprimez une étape qui génère des signaux en sortie, le
fonctionnement du projet est brisé si l’un des signaux en sortie supprimés
est l’entrée d’une autre étape et un indicateur d’erreur apparaît dans la Vue
du projet. Vous pouvez aussi couper, copier et coller des étapes dans un
projet en appuyant respectivement sur les touches <Ctrl-X>, <Ctrl-C> et
<Ctrl-V>, ou en cliquant avec le bouton droit sur la Vue du projet et en
sélectionnant Couper, Copier, Coller avant l’étape sélectionnée ou
Coller après l’étape sélectionnée dans le menu local.
Gestion des erreurs et des mises en garde
Si une erreur se produit pendant qu’un projet s’exécute, un indicateur
d’erreur, montré à gauche, apparaît dans la Vue du projet sur l’étape dans
laquelle l’erreur s’est produite. Double-cliquez sur l’étape où l’erreur s’est
produite pour afficher sa description au bas de la boîte de dialogue
Configuration de l’étape. Cliquez sur le bouton Détails à droite de la
description de l’erreur pour afficher la description complète.
SignalExpress enregistre toutes les erreurs et les mises en garde dans le
journal d’événements pendant l’exécution d’un projet. Pour afficher le
journal des événements, sélectionnez Affichage»Journal d’événements
puis cliquez sur l’onglet Journal d’événements dans la zone Affichage des
données. Reportez-vous à l’LabVIEW SignalExpress Help pour obtenir des
informations complémentaires sur les erreurs et les mises en garde en
sélectionnant Aide»Aide LabVIEW SignalExpress, en cliquant sur
l’onglet Rechercher et en entrant
Initiation à LabVIEW SignalExpress 3-8 ni.com
erreurs.
Page 64

Manipulation de signaux
Vous pouvez utiliser LabVIEW SignalExpress pour générer et analyser des
signaux afin d’évaluer des projets de conception sans programmation.
Ce chapitre vous apprend à travailler avec des signaux dans LabVIEW
SignalExpress, en vous indiquant notamment comment tracer des signaux
sur des graphes, importer des signaux d’un fichier, aligner et comparer
deux signaux de manière interactive et enregistrer des signaux dans un
fichier.
Représentation de signaux dans des graphes
Effectuez les étapes suivantes pour tracer des signaux dans un projet
d’exemple et examiner visuellement les signaux à l’aide de curseurs.
1. Sélectionnez Fichier»Ouvrir un projet, naviguez vers le répertoire
SignalExpress\Examples\Tutorial et double-cliquez sur
Signals.seproj. Ce projet configure l’étape Créer un signal
analogique pour qu’elle permette de créer un signal carré et l’étape
Filtre pour réaliser un filtre Butterworth passe-bas.
2. Faites glisser la sortie step signal de l’étape Créer un signal analogique
vers l’Affichage des données.
3. Faites glisser la sortie filtered step de l’étape Filtre vers l’onglet
Affichage des données.
Vous pouvez tracer des signaux du même type sur le même graphe.
Comme les signaux step signal et filtered step sont tous deux des
signaux temporels, ils apparaissent sur le même graphe. Si vous voulez
tracer des signaux de différents types, faites-les glisser sur le même
graphe et LabVIEW SignalExpress se chargera de créer un nouveau
graphe.
4. Cliquez sur le bouton Ajouter un volet de la barre d’outils, représenté
à gauche, pour créer un nouveau graphe.
5. Faites glisser la sortie filtered step de l’étape Filtre vers le nouveau
graphe.
4
© National Instruments Corporation 4-1 Initiation à LabVIEW SignalExpress
Page 65

Chapitre 4 Manipulation de signaux
6. Faites un clic droit sur le nouveau graphe et sélectionnez Éléments
visibles»Curseurs dans le menu local pour afficher deux curseurs
interactifs, comme le montre la figure 4-1.
Figure 4-1. Signals.seproj
Quand vous déplacez les curseurs, LabVIEW SignalExpress affiche
les valeurs x et y des curseurs dans le tableau de curseurs au bas de
l’Affichage des données.
7. Sélectionnez Fichier»Enregistrer le projet sous et enregistrez le
projet sous
SignalExpress\Examples\Tutorial.
Initiation à LabVIEW SignalExpress 4-2 ni.com
Mes signaux.seproj dans le répertoire
Page 66

Chapitre 4 Manipulation de signaux
Importation d’un signal à partir d’un fichier
Vous pouvez importer des signaux de formats de fichier standard comme
des fichiers ASCII délimités par des virgules ou des tabulations et des
fichiers de données de mesures LabVIEW (
importer des signaux à partir de résultats simulés d’outils EDA comme des
simulateurs SPICE.
Suivez les étapes ci-après pour importer un signal d’un fichier.
1. Cliquez avec le bouton droit sur la Vue du projet et sélectionnez
Charger/Enregistrer des signaux»Signaux analogiques»Charger
un fichier ASCII dans le menu local.
2. Cliquez sur le bouton Parcourir, représenté à gauche, dans la boîte de
dialogue Configuration de l’étape, naviguez vers le répertoire
SignalExpress\Examples\Tutorial et double-cliquez sur Step
Response.txt. Cette étape analyse un fichier ASCII et affiche les
signaux dans le fichier.
Dans la section Aperçu du fichier, la colonne 1 affiche les
informations d’horodatage et la colonne 2 indique les valeurs de
tension réelles du signal.
3. Cliquez sur l’onglet Signaux à importer pour afficher les signaux
disponibles dans le fichier.
4. Cochez l’option Colonne 2 pour importer ce signal et désélectionnez
l’option Colonne 1.
La boîte de dialogue Configuration de l’étape affiche un aperçu du
signal dans la section Signal importé.
5. Sélectionnez Colonne 1 dans le menu déroulant Valeurs X en entrée
pour définir les données de l’axe x de la waveform aux valeurs
appropriées.
6. Ouvrez l’Affichage des données.
7. Faites un clic droit sur la sortie Colonne 2 dans la Vue du projet et
sélectionnez Renommer dans le menu local.
8. Entrez
9. Faites glisser la sortie réponse indicielle de l’étape Charger un fichier
réponse indicielle et appuyez sur la touche <Entrée> pour
renommer la sortie.
ASCII vers le graphe du bas dans l’Affichage des données.
.lvm). Vous pouvez aussi
© National Instruments Corporation 4-3 Initiation à LabVIEW SignalExpress
Page 67

Chapitre 4 Manipulation de signaux
Le signal filtered step ressemble au front montant de la sortie réponse
indicielle, comme l’indique la figure 4-2.
Figure 4-2. Signals of Signals.seproj
10. Sélectionnez Fichier»Enregistrer le projet pour enregistrer le projet.
Alignement et comparaison de signaux
Bien que le signal filtered step et la sortie réponse indicielle montrent tous
les deux un overshoot dans le front montant, il est difficile d’évaluer leur
similarité car ces signaux proviennent de sources différentes et ont une
amplitude et un cadencement différents. Toutefois, vous pouvez utiliser
l’étape Alignement interactif pour aligner et comparer deux signaux, de
sorte que vous puissiez choisir quel type d’informations vous voulez
exporter de l’opération pour pouvoir les utiliser dans le projet.
Initiation à LabVIEW SignalExpress 4-4 ni.com
Page 68

Chapitre 4 Manipulation de signaux
Suivez les étapes ci-après pour aligner deux signaux dans le projet Mes
signaux.seproj.
1. Cliquez avec le bouton droit sur la sortie réponse indicielle et
sélectionnez Envoyer vers»Traitement»Signaux analogiques»
Alignement interactif dans le menu local pour transmettre le signal
réponse indicielle de l’étape Charger un fichier ASCII à l’étape
Alignement interactif.
L’étape sélectionne les deux signaux les plus récents dans le projet à
utiliser comme entrées et affiche les signaux sur le graphe de la boîte
de dialogue Configuration de l’étape, comme le montre la figure 4-3.
Figure 4-3. Boîte de dialogue de configuration de l’étape Alignement interactif
Lorsque vous ajoutez une étape dans un projet, LabVIEW
SignalExpress sélectionne les signaux en entrée en fonction des types
de signaux que l’étape accepte. Par exemple, l’étape Alignement
interactif ne peut être utilisée que sur des signaux waveform du
domaine temporel. Par conséquent, l’étape sélectionne comme entrées
les deux signaux du domaine temporel créés dans le projet. Pour
changer les signaux en entrée d’une étape, sélectionnez différents
signaux dans le menu déroulant de signaux compatibles dans l’onglet
Entrée/Sortie de la boîte de dialogue Configuration de l’étape.
© National Instruments Corporation 4-5 Initiation à LabVIEW SignalExpress
Page 69

Chapitre 4 Manipulation de signaux
2. Cliquez sur le signal rouge dans le graphe Signaux en entrée et
3. Essayez d’aligner les fronts montants de deux signaux en faisant
4. Sélectionnez Auto - Créneau dans le menu déroulant Mode pour
5. Sur l’onglet Entrée/Sortie, cochez l’option Exporter les signaux
6. Sélectionnez l’onglet Affichage des données pour ouvrir l’Affichage
7. Cliquez sur le bouton Ajouter un volet, montré à gauche, pour ajouter
8. Faites glisser les sorties référence alignée et test aligné de l’étape
9. Sélectionnez Fichier»Enregistrer le projet pour enregistrer le projet.
faites-le glisser vers un autre point du graphe.
Vous pouvez faire glisser, étendre et réduire des signaux sur le graphe.
glisser un signal dans le graphe. Cliquez sur un signal pour définir le
point d’ancrage et maintenez la touche <Alt> enfoncée pour étendre le
signal autour de ce point d’ancrage dans le sens des x et des y.
Sur l’onglet Alignement de la boîte de dialogue Configuration de
l’étape, l’étape calcule et affiche le gain des x et des y et les valeurs
d’offset dont vous avez besoin pour atteindre les spécifications
d’alignement lorsque vous faites glisser les signaux.
aligner les signaux. LabVIEW SignalExpress base ce mode
d’alignement sur des algorithmes intégrés.
Le graphe du bas de la boîte de dialogue Configuration de l’étape
affiche la différence entre les deux signaux.
alignés pour ajouter les signaux aux sorties de l’étape.
des données.
un troisième graphe.
Alignement interactif dans le nouveau graphe pour afficher les signaux
alignés.
Types de signaux dans LabVIEW SignalExpress
Certaines étapes, comme l’étape Arithmétique, peuvent fonctionner avec
plusieurs types de signaux. Par exemple, vous pouvez utiliser l’étape
Arithmétique pour manipuler des signaux des domaines fréquentiel et
temporel. L’étape Arithmétique adapte son comportement en fonction du
type de signaux en entrée que vous sélectionnez pour cette étape. Par
exemple, si vous ajoutez deux signaux du domaine temporel, LabVIEW
SignalExpress ajoute uniquement leur amplitude. Toutefois, si vous
ajoutez deux signaux de phase du domaine fréquentiel, LabVIEW
SignalExpress ajoute le seuil de décalage approprié.
Initiation à LabVIEW SignalExpress 4-6 ni.com
Page 70

Reportez-vous à l’Aide LabVIEW SignalExpress pour obtenir des
informations complémentaires en sélectionnant Aide»Aide LabVIEW
SignalExpress, en cliquant sur l’onglet Rechercher, et en entrant
de signaux".
Exportation et impression de signaux
Vous pouvez utiliser LabVIEW SignalExpress pour documenter des
signaux ou continuer des analyses dans d’autres applications logicielles.
Cette section vous apprend comment exporter des signaux, notamment
en les envoyant dans un fichier ASCII, en envoyant les données dans
Microsoft Excel, en imprimant des signaux et en utilisant la fonctionnalité
de documentation intégrée pour documenter le projet LabVIEW
SignalExpress.
Enregistrement de signaux dans un fichier
Suivez les étapes ci-après pour enregistrer un signal dans un fichier.
1. Cliquez sur le bouton Ajouter une étape et sélectionnez
Charger/Enregistrer des signaux»Signaux analogiques»
Enregistrer au format ASCII/LVM.
2. Cliquez sur l’onglet Signaux dans la boîte de dialogue Configuration
de l’étape et sélectionnez filtered step dans le menu déroulant
Données en entrée.
3. Sur l’onglet Paramètres du fichier, enregistrez le fichier sous
SignalExpress\Examples\Tutorial\signal filtré.txt
dans la commande Chemin du fichier à exporter.
4. Sélectionnez Remplacer dans le menu déroulant Si le fichier existe.
5. Sélectionnez ASCII générique dans le menu déroulant Type du
fichier à exporter.
Vous pouvez utiliser l’étape Charger/Enregistrer les signaux pour
enregistrer des données dans un fichier chaque fois que le projet
s’exécute.
6. Cliquez sur le bouton Exécuter pour exécuter le projet et enregistrer le
signal résultant dans le fichier ASCII spécifié.
7. Sélectionnez Fichier»Enregistrer le projet pour enregistrer le projet.
8. Sélectionnez Fichier»Fermer le projet pour fermer le projet.
Chapitre 4 Manipulation de signaux
"types
© National Instruments Corporation 4-7 Initiation à LabVIEW SignalExpress
Page 71

Chapitre 4 Manipulation de signaux
Exportation de signaux dans Microsoft Excel
Pour exporter des données de signaux dans Microsoft Excel, lancez Excel
et faites glisser le signal en sortie d’une étape de LabVIEW SignalExpress
dans un fichier tableur Excel.
Impression de signaux
Pour imprimer une image d’un graphe, ouvrez l’Affichage des données et
sélectionnez Fichier»Imprimer»Imprimer : Affichage des données.
Création de rapports dans LabVIEW SignalExpress
Sélectionnez Affichage»Documentation du projet pour afficher
l’affichage de la documentation du projet. Vous pouvez décrire votre projet
en utilisant du texte en effectuant une opération de glisser-déposer sur les
sorties des étapes dans votre documentation. Lorsque vous effectuez une
opération de glisser-déposer sur une sortie d’étape dans l’affichage de la
documentation du projet, la valeur de l’affichage de la documentation du
projet se met automatiquement à jour pour refléter la valeur actuelle de la
sortie de l’étape.
Pour imprimer la documentation, ouvrez l’affichage de la documentation
du projet et sélectionnez Fichier»Imprimer»Imprimer la
documentation. Pour exporter la documentation au format HTML,
ouvrez l’affichage de la documentation du projet et sélectionnez
Fichier»Exporter»Exporter la documentation en HTML.
Initiation à LabVIEW SignalExpress 4-8 ni.com
Page 72

Enregistrement des données
Vous pouvez utiliser LabVIEW SignalExpress pour enregistrer dans un
fichier journal, enregistrer et analyser vos mesures. Vous pouvez
enregistrer n’importe quelle sortie d’étape booléenne, U32, double ou du
domaine temporel. Vous pouvez aussi analyser et traiter les données ainsi
enregistrées en les relisant avec les étapes d’analyse.
Ce chapitre vous apprend à enregistrer des données en utilisant les
fonctionnalités d’enregistrement de données intégrées à LabVIEW
SignalExpress. Vous apprendrez à enregistrer un signal spécifié, à relire ce
signal et à l’analyser en utilisant des étapes d’analyse. Vous allez également
apprendre à utiliser les Options d’enregistrement pour enregistrer des
signaux en fonction de conditions de démarrage et d’arrêt spécifiées.
Enregistrement d’un signal
Vous pouvez utiliser le bouton Enregistrer pour configurer un processus
d’enregistrement de données.
5
Effectuez les étapes suivantes pour spécifier le signal à enregistrer et
l’enregistrer.
1. Sélectionnez Fichier»Ouvrir un projet, naviguez vers le répertoire
SignalExpress\Examples\Tutorial et double-cliquez sur
Logging.seproj.
Ce projet utilise l’étape Créer un signal analogique pour générer un
signal sur la base d’une formule.
2. Cliquez sur le bouton Enregistrer, illustré à gauche, pour ouvrir la
boîte de dialogue Sélection des signaux à enregistrer.
La boîte de dialogue Sélection des signaux à enregistrer affiche les
signaux dans le projet disponible pour l’enregistrement. Vous pouvez
sélectionner un ou plusieurs signaux à enregistrer. Vous pouvez aussi
spécifier un nom et une description pour l’enregistrement.
3. Cochez la case signal pour enregistrer le signal de la formule généré à
l’étape Créer un signal analogique.
© National Instruments Corporation 5-1 Initiation à LabVIEW SignalExpress
Page 73

Chapitre 5 Enregistrement des données
4. Cliquez sur le bouton OK pour fermer la boîte de dialogue Sélection
des signaux à enregistrer et commencer l’enregistrement du signal.
L’enregistrement se poursuit jusqu’à ce que vous cliquiez sur le bouton
Arrêter.
5. Cliquez sur le bouton Arrêter, montré à gauche, pour arrêter le projet.
Les données enregistrées apparaissent dans la fenêtre Données
enregistrées, comme le montre la figure 5-1.
Par défaut, LabVIEW SignalExpress nomme les données enregistrées
d’après la date et l’heure de leur enregistrement. LabVIEW
SignalExpress enregistre les données au format de fichier
le répertoire spécifié dans la boîte de dialogue Options.
6. Sélectionnez Outils»Options puis l’option Enregistrement pour
spécifier le dossier dans lequel LabVIEW SignalExpress enregistre les
données et pour personnaliser différentes préférences pour les données
enregistrées.
7. Cliquez sur le bouton OK pour fermer la boîte de dialogue Options.
8. Sélectionnez Fichier»Enregistrer le projet pour enregistrer le projet.
Figure 5-1. Fenêtre Données enregistrées
.tdms dans
Affichage d’un signal enregistré dans un journal
Effectuez les étapes suivantes pour afficher les données enregistrées dans
un fichier journal.
1. Si l’Affichage des données n’est pas visible, sélectionnez
Affichage»Affichage des données.
2. La fenêtre Données enregistrées présente la liste de toutes les données
enregistrées dans le projet actuel. Sélectionnez le journal de données
que vous venez d’enregistrer dans la fenêtre Données enregistrées et
faites-le glisser dans l’Affichage des données. L’Affichage des
données affiche les données enregistrées et un graphe d’aperçu,
comme le montre la figure 5-2. Le signal affiché dans l’Affichage des
Initiation à LabVIEW SignalExpress 5-2 ni.com
Page 74

Chapitre 5 Enregistrement des données
données peut différer de celui montré dans la figure 5-2 en fonction de
la durée d’enregistrement du signal.
Figure 5-2. Logging.seproj
Le graphe d’aperçu représente une façon d’effectuer un zoom avant ou
arrière sur les données de l’Affichage des données. Le graphe d’aperçu
apparaît par défaut lorsque vous affichez les données enregistrées.
Lorsque vous affichez des données en direct ou non enregistrées,
cliquez avec le bouton droit sur l’Affichage des données et
sélectionnez Éléments visibles»Aperçu pour afficher le graphe
d’aperçu.
3. Cliquez sur le bouton Zoom avant à côté du graphe d’aperçu pour
effectuer un zoom avant sur le signal enregistré. Les curseurs sur le
graphe d’aperçu montre le sous-ensemble de données actuellement
affiché sur le graphe d’aperçu. Utilisez la barre de défilement en
dessous du graphe d’aperçu pour faire défiler les données. Cliquez sur
le curseur et faites-le glisser sur le graphe d’aperçu pour agrandir ou
réduire le sous-ensemble des données affichées.
© National Instruments Corporation 5-3 Initiation à LabVIEW SignalExpress
Page 75

Chapitre 5 Enregistrement des données
Enregistrement de signaux avec des conditions de démarrage et d’arrêt prédéfinies
Vous pouvez configurer des conditions de démarrage et d’arrêt que les
signaux doivent respecter avant que LabVIEW SignalExpress les
enregistre ou arrête de les enregistrer. Effectuez les étapes suivantes pour
enregistrer les données en fonction de conditions de démarrage et d’arrêt.
1. Si l’onglet Options d’enregistrement n’est pas visible, sélectionnez
Affichage»Options d’enregistrement pour ouvrir la fenêtre Options
d’enregistrement.
2. Sélectionnez Sélection des signaux dans la liste de Catégorie de la
fenêtre Options d’enregistrement.
3. Cochez la case du signal dans la colonne Enregistrer, comme le
montre la figure 5-3.
Figure 5-3. Sélection des signaux
Le bouton Enregistrer devient le bouton Enregistrer pendant
l’exécution, montré à gauche. Assurez-vous que le bouton
Enregistrer pendant l’exécution est enclenché. Quand le bouton
Enregistrer pendant l’exécution est enclenché, LabVIEW
SignalExpress enregistre le signal sélectionné quand vous cliquez sur
le bouton Exécuter ou Exécuter une fois.
Initiation à LabVIEW SignalExpress 5-4 ni.com
Page 76

Chapitre 5 Enregistrement des données
4. Sélectionnez Conditions de démarrage dans la liste Catégorie de la
fenêtre Options d’enregistrement.
5. Cliquez sur le bouton Ajouter sur la page Conditions de démarrage
des enregistrements pour personnaliser une condition de démarrage
pour votre tâche d’enregistrement.
a. Sélectionnez l’option Signal dans la commande Source de
condition pour spécifier que LabVIEW SignalExpress doit
commencer l’enregistrement quand le signal en entrée remplit la
condition spécifiée.
b. Sélectionnez signal dans l’option Signal.
c. Sélectionnez Pente montante dans l’option Condition pour
commencer l’enregistrement du signal en fonction de la valeur du
front du signal sur une pente positive.
d. Entrez
1 dans l’option Valeur pour commencer l’enregistrement
quand le signal atteint 1 sur une pente montante.
6. Sélectionnez Conditions d’arrêt dans la liste Catégorie de la fenêtre
Options d’enregistrement.
7. Cliquez sur le bouton Ajouter sur la page Conditions d’arrêt des
enregistrements pour personnaliser une condition d’arrêt pour votre
tâche d’enregistrement.
a. Sélectionnez Durée dans l’option Source de condition.
b. Entrez
5 dans le champ de Durée pour enregistrer le signal
pendant 5 secondes à partir du moment où le signal remplit la
condition de démarrage.
c. Cliquez sur le bouton Exécuter, montré à gauche. LabVIEW
SignalExpress commence à enregistrer le signal quand celui-ci
atteint le niveau 1 sur une pente montante et continue à
l’enregistrer pendant 5 secondes.
L’indicateur Enregistrement en bas de la fenêtre Options
d’enregistrement s’allume lorsque le signal remplit la condition
de démarrage et reste allumé pendant l’enregistrement.
L’indicateur Infos sur le disque affiche l’espace disque
disponible sur l’ordinateur pour le journal.
© National Instruments Corporation 5-5 Initiation à LabVIEW SignalExpress
Page 77

Chapitre 5 Enregistrement des données
Analyse des signaux enregistrés
Une fois que vous avez enregistré un signal, vous pouvez repasser les
données enregistrées ou exécuter le signal enregistré via les étapes
d’analyse, comme vous pouvez le faire avec les données en direct.
Effectuez les étapes suivantes pour analyser un signal enregistré.
1. Naviguez vers le menu déroulant Zone de travail en haut à gauche de
la fenêtre LabVIEW SignalExpress, comme le montre la figure 5-4.
Cliquez sur la flèche vers le bas et sélectionnez Relecture pour passer
à la zone de travail Relecture.
Figure 5-4. Menu déroulant Zone de travail
Utilisez des zones de travail pour effectuer plusieurs étapes LabVIEW
SignalExpress à partir du même projet. Vous pouvez acquérir des
données, traiter des signaux, enregistrer les données dans un fichier
journal et effectuer des mesures sur les données enregistrées sans
devoir ouvrir un nouveau projet. Lorsque vous enregistrez votre projet,
LabVIEW SignalExpress enregistre toutes les zones de travail qui s’y
trouvent dans le même fichier de projet.
La zone de travail par défaut, Surveillance/Enregistrement, vous
permet de prendre des mesures, d’analyser des données en direct et
d’enregistrer des données. Vous devez vous trouver dans la zone de
travail Relecture pour utiliser les données enregistrées comme entrée
d’une étape d’analyse. Par exemple, vous pouvez effectuer une mesure
et enregistrer le signal dans la zone de travail Surveillance/
Enregistrement, puis exécuter les données enregistrées via une étape
d’analyse dans la zone de travail Relecture.
2. Cliquez sur le bouton Ajouter une étape, montré à gauche, et
sélectionnez l’étape Filtre en sélectionnant Traitement»Signaux
analogiques»Filtre. LabVIEW SignalExpress sélectionne
automatiquement le premier signal que vous avez enregistré comme
entrée de l’étape Filtre.
3. Naviguez vers l’Affichage des données. Faites glisser la sortie
données filtrées de l’étape Filtre dans l’Affichage des données pour
afficher le signal résultant.
4. Cliquez sur le bouton Exécuter, montré à gauche. L’Affichage des
données affiche le signal filtré résultant et LabVIEW SignalExpress
relit tout le journal.
Initiation à LabVIEW SignalExpress 5-6 ni.com
Page 78

Relecture avancée
Vous pouvez configurer des options de relecture de données avancées en
utilisant la fenêtre Options de relecture. La fenêtre Options de relecture
affiche un aperçu des données enregistrées et vous permet de sélectionner
un sous-ensemble de ces données à relire ou à exécuter via des étapes
d’analyse.
1. Sélectionnez Affichage»Options de relecture pour ouvrir la fenêtre
Options de relecture, comme le montre la figure 5-5. La fenêtre
Options de relecture vous permet d’obtenir un aperçu des données
enregistrées et de spécifier un sous-ensemble des données enregistrées
à relire ou à envoyer aux étapes d’analyse.
Chapitre 5 Enregistrement des données
Figure 5-5. Fenêtre Options de relecture
2. Sélectionnez signal dans le deuxième enregistrement que vous avez
créé dans la liste signal enregistré.
3. Entrez
4. Entrez
5. Passer à la fenêtre Affichage des données et faites glisser la sortie des
© National Instruments Corporation 5-7 Initiation à LabVIEW SignalExpress
1 dans le champ Temps de départ pour relire ou analyser un
sous-ensemble du signal enregistré qui commence une seconde après
le début du journal.
4 dans le champ Temps final pour relire ou analyser un
sous-ensemble du signal enregistré qui commence quatre secondes
après le début du journal.
données filtrées sur l’étape Filtre dans l’Affichage des données.
Page 79

Chapitre 5 Enregistrement des données
6. Cliquez sur le bouton Exécuter, montré à gauche. LabVIEW
SignalExpress filtre le sous-ensemble du signal que vous avez spécifié
dans la fenêtre Options de relecture et affiche le signal filtré résultant
dans l’Affichage des données.
7. Cliquez sur le bouton Arrêter pour arrêter l’exécution du projet.
Reportez-vous à l’Aide LabVIEW SignalExpress pour obtenir des
informations complémentaires sur l’enregistrement des données, comme
la spécification de conditions d’alarme et les options de relecture.
Initiation à LabVIEW SignalExpress 5-8 ni.com
Page 80

Réalisation de mesures de
balayage
Vous pouvez utiliser LabVIEW SignalExpress pour automatiser les
mesures afin de caractériser et valider des projets en créant des opérations
de balayage. Vous pouvez utiliser les mesures de balayage pour rassembler
des données de projets en fonction d’une gamme de conditions pour
documenter leurs performances. Par exemple, vous pouvez utiliser des
opérations de balayage pour faire varier la fréquence d’un signal
d’impulsion ou le niveau d’une tension d’alimentation tout en prenant des
mesures pour définir les caractéristiques des projets.
Ce chapitre vous apprend comment configurer des opérations de balayage
en utilisant l’étape Balayage dans LabVIEW SignalExpress. Vous allez
apprendre comment définir les caractéristiques des performances d’un
filtre en balayant une gamme des valeurs de fréquence et en mesurant la
sortie du filtre. Vous allez aussi apprendre à afficher les résultats du
balayage et effectuer des balayages multidimensionnels pour effectuer des
mesures plus complexes.
6
Définition de sorties et de gammes de balayage
Vous pouvez utiliser l'étape Balayage dans LabVIEW SignalExpress pour
définir des mesures automatisées dans le cadre d’opérations de balayage
complexes et susceptibles d’être répétées.
Effectuez les étapes suivantes pour définir une gamme de fréquence à
balayer dans un projet d’exemple utilisant un filtre.
1. Sélectionnez Fichier»Ouvrir un projet, naviguez vers le répertoire
SignalExpress\Examples\Tutorial et double-cliquez sur
Sweep.seproj.
2. Cliquez sur le bouton Exécuter, montré à gauche, pour exécuter le
projet.
Le projet génère un signal d’impulsion sinusoïdal à l’étape Créer un
signal analogique, ce signal passe ensuite dans un filtre passe-bande
elliptique à l’étape Filtre, mesure le niveau Veff de la sortie du filtre à
© National Instruments Corporation 6-1 Initiation à LabVIEW SignalExpress
Page 81

Chapitre 6 Réalisation de mesures de balayage
l’étape Amplitude et niveaux et convertit le niveau en décibels (dB) à
l’étape Formule. L’étape Filtre agit comme une unité simulée en cours
de test, le projet n’utilise donc pas de matériel. Toutefois, vous pouvez
aussi balayer des signaux physiques générés à partir d’analyses de
signaux dynamiques, d’un générateur de fonctions, d’un périphérique
d’E/S multifonction (MIO) ou d’un générateur de signaux arbitraires
National Instruments.
3. Cliquez sur le bouton Ajouter une étape, montré à gauche,
et sélectionnez Contrôle d’exécution»Balayage.
4. Cliquez sur le bouton Ajouter dans la boîte de dialogue
Configuration de l’étape pour afficher la liste des paramètres de
balayage de chaque étape du projet, comme le montre la figure 6-1.
Figure 6-1. Boîte de dialogue Sélection du paramètre de balayage
5. Sélectionnez le paramètre Fréquence sous Créer un signal
analogique et cliquez sur le bouton OK.
L’étape Balayage comprend l’étape Créer un signal analogique qui
fournit le signal à balayer.
6. Sur l’onglet Configuration du balayage, sélectionnez Exponentiel
dans le menu déroulant Type.
7. Entrez
1k dans le champ Fréquence de début (Hz), et 40k dans le
champ Fréquence de fin (Hz).
8. Entrez
150 dans le champ Nombre de points.
L’onglet Configuration du balayage doit apparaître, comme le
montre la figure 6-2.
Initiation à LabVIEW SignalExpress 6-2 ni.com
Page 82

Chapitre 6 Réalisation de mesures de balayage
Figure 6-2. Boîte de dialogue de configuration de l’étape Balayage
Vous avez utilisé l’étape Balayage pour spécifier une gamme de
valeurs sur laquelle effectuer des itérations dans le paramètre
Fréquence de l’étape Créer un signal analogique. L’étape Créer un
signal analogique utilise la gamme de fréquence définie pour générer
un signal sinusoïdal à chacune de ces fréquences. Toutefois, vous
pouvez utiliser l’étape Balayage pour balayer toute valeur d’un
paramètre susceptible d’être balayé de n’importe quelle étape d’un
projet elle-même susceptible d’être balayée.
9. Cliquez sur l’onglet Sortie du balayage.
10. Cliquez sur le bouton Ajouter pour afficher la liste de balayages en
sortie de chaque étape du projet.
11. Sélectionnez la sortie response amplitude in dB sous Formule et
cliquez sur le bouton OK pour tracer cette mesure par rapport au
paramètre Fréquence balayé.
L’étape Balayage crée une boucle autour de toutes les étapes de la Vue
du projet pour inclure toutes les étapes dans l’opération de balayage.
© National Instruments Corporation 6-3 Initiation à LabVIEW SignalExpress
Page 83

Chapitre 6 Réalisation de mesures de balayage
Traçage des résultats du balayage
Effectuez les étapes suivantes pour exécuter la mesure de balayage.
1. Cliquez sur le bouton Exécuter une fois, montré à gauche, pour
exécuter la mesure de balayage.
La sortie stimulus signal du graphe itère dans la gamme de fréquences
spécifiée.
2. Faites glisser le signal response amplitude in dB vs. Fréquence du
bas de la boucle de balayage vers l’Affichage des données pour
afficher la sortie du balayage.
LabVIEW SignalExpress crée un nouveau graphe. Les données d’une
opération de balayage sont représentées dans un tableau x-y qui
requiert un graphe séparé, comme le montre la figure 6-3.
Figure 6-3. Sweep.seproj
Initiation à LabVIEW SignalExpress 6-4 ni.com
Page 84

Chapitre 6 Réalisation de mesures de balayage
3. Cliquez sur le bouton Exécuter une fois pour exécuter à nouveau le
balayage.
La réponse en fréquence de l’étape Filtre est tracée sur le nouveau
graphe pendant que le projet s’exécute. Le graphe affiche la fonction
de transfert du filtre, ou la sortie d’amplitude exprimée en décibels par
rapport à la fréquence.
4. Double-cliquez sur l’étape Filtre pour afficher les spécifications du
filtre dans la boîte de dialogue Configuration de l’étape.
La réponse en fréquence du filtre dans le graphe response in
amplitude in dB correspond au graphe de l’Affichage des données.
5. Sélectionnez Fichier»Enregistrer le projet sous et enregistrez le
projet sous
SignalExpress\Examples\Tutorial.
Vous pouvez utiliser l’étape Balayage pour balayer plusieurs paramètres
simultanément en ajoutant des paramètres supplémentaires sur l’onglet
Configuration du balayage de la boîte de dialogue de configuration de
l’étape Balayage. Le balayage simultané de plusieurs paramètres est appelé
balayage parallèle. Par exemple, si vous voulez faire varier l’amplitude
d’un signal d’impulsion, vous pouvez exécuter un balayage parallèle. Vous
pouvez utiliser un balayage parallèle pour optimiser la précision de
l’acquisition en faisant varier la gamme d’entrée d’un numériseur ou d’un
périphérique MIO à mesure que vous faites varier le niveau du signal.
À mesure que le niveau du signal augmente, vous pouvez augmenter la
gamme d’entrée du périphérique de mesure pour vous assurer que vous
utilisez toute la résolution pour la mesure.
Mon balayage.seproj dans le répertoire
Exécution de balayages multidimensionnels
Utilisez des balayages multidimensionnels ou imbriqués pour effectuer des
itérations sur une gamme tout en faisant varier une autre gamme. Par
exemple, si vous voulez effectuer des itérations sur des fréquences d’un
signal d’impulsion à différentes amplitudes, exécutez un balayage
imbriqué. Vous pouvez définir l’amplitude au niveau 1 et effectuer des
itérations sur des fréquences, puis définir l’amplitude au niveau 2 et
effectuer des itérations sur des fréquences, et ainsi de suite. Vous pouvez
construire un balayage imbriqué en cliquant avec le bouton droit sur l’étape
Balayage dans un projet en sélectionnant Ajouter un balayage imbriqué
dans le menu local pour ajouter une autre boucle de balayage.
© National Instruments Corporation 6-5 Initiation à LabVIEW SignalExpress
Page 85

Chapitre 6 Réalisation de mesures de balayage
Effectuez les étapes suivantes pour exécuter un projet d’exemple de
balayage imbriqué.
1. Sélectionnez Fichier»Ouvrir un projet, naviguez vers le répertoire
SignalExpress\Examples\Tutorial et double-cliquez sur
Nested Sweep.seproj.
2. Cliquez sur le bouton Exécuter, montré à gauche, pour exécuter le
projet.
Chaque itération de la boucle de balayage interne balaie la fréquence
du signal d’impulsion. La boucle de balayage externe fait varier les
fréquences de coupure basse et haute de l’étape Filtre. Chaque itération
apparaît en temps réel sur le graphe supérieur, puis apparaît sur le
graphe inférieur pour afficher tous les balayages à chaque
configuration de la fréquence de coupure, comme le montre la
figure 6-4.
Figure 6-4. Nested Sweep.seproj
3. Cliquez sur le bouton Arrêter, montré à gauche, pour arrêter le projet.
Initiation à LabVIEW SignalExpress 6-6 ni.com
Page 86

7
Extension des projets LabVIEW
SignalExpress avec LabVIEW
Vous pouvez utiliser LabVIEW SignalExpress pour définir des mesures
automatisées en utilisant les étapes intégrées pour acquérir, générer ou
analyser des signaux. Vous pouvez étendre la fonctionnalité des projets
LabVIEW SignalExpress en utilisant LabVIEW des façons suivantes :
• Construisez un VI dans LabVIEW et importez-le dans LabVIEW
SignalExpress pour fournir une fonctionnalité d’étape personnalisée et
étendre le nombre d’étapes disponibles dans LabVIEW SignalExpress.
• Convertissez un projet LabVIEW SignalExpress en un diagramme
LabVIEW pour poursuivre le développement dans LabVIEW.
Vous devez avoir LabVIEW 7.1 ou une version ultérieure pour effectuer les
exercices de ce chapitre.
Importation de VIs LabVIEW dans SignalExpress sous forme d’étapes
Utilisez l'étape Exécuter un VI LabVIEW dans SignalExpress pour appeler
des VIs LabVIEW personnalisés. Vous pouvez appeler un VI LabVIEW à
partir de SignalExpress pour qu’il :
• Contrôle des instruments GPIB
• Contrôle du matériel National Instruments non supporté par LabVIEW
SignalExpress
• Lise ou écrive des données dans davantage de formats de fichier
• Affiche des instructions destinées à l’opérateur dans une boîte de
dialogue locale
• Définisse un algorithme de mesure
© National Instruments Corporation 7-1 Initiation à LabVIEW SignalExpress
Page 87

Chapitre 7 Extension des projets LabVIEW SignalExpress avec LabVIEW
Effectuez les étapes suivantes pour importer un VI LabVIEW avec l’étape
Exécuter un VI LabVIEW.
1. Sélectionnez Fichier»Ouvrir un projet, naviguez vers le répertoire
SignalExpress\Examples\Tutorial et double-cliquez sur User
Step.seproj.
Ce projet utilise l’étape Créer un signal analogique pour générer un
signal.
2. Cliquez sur le bouton Ajouter une étape et sélectionnez Exécuter un
VI LabVIEW»Exécuter un VI LabVIEW 8.2.
Le VI que vous exécutez dans cet exercice a été enregistré avec
LabVIEW 8.2. Vous devez utiliser la version de l’étape Exécuter un VI
LabVIEW qui correspond à la version de LabVIEW dans laquelle vous
avez enregistré votre VI.
3. Cliquez sur le bouton Parcourir dans la boîte de dialogue
Configuration de l’étape et sélectionnez
répertoire
LabVIEW SignalExpress\Examples\Tutorial. Le VI
Limiter-LV82 accepte une waveform du domaine temporel comme
entrée, écrête le signal au-dessus et en dessous des valeurs que vous
spécifiez dans la boîte de dialogue Configuration de l’étape, et
renvoie la waveform écrêtée sous forme d’un signal en sortie.
Lorsque vous importez un VI LabVIEW, LabVIEW SignalExpress
mappe les entrées du VI comme paramètres et les sorties du VI comme
signaux en sortie dans LabVIEW SignalExpress.
Vous pouvez définir si les entrées des VIs deviennent des signaux en
entrée ou des paramètres. Un signal en entrée apparaît dans la Vue du
projet comme une entrée d’une étape, ce qui signifie que vous pouvez
transmettre des signaux à un VI sous la forme d’entrées. Un paramètre
est une valeur que vous pouvez configurer dans la boîte de dialogue
Configuration de l’étape d’une étape. Vous pouvez aussi balayer des
paramètres de manière dynamique en utilisant l’étape Balayage. Dans
ce projet, le VI possède un signal en entrée Time Waveform in et les
paramètres scalaires Upper limit et Lower limit.
Assurez-vous que la boîte de dialogue Configuration de l’étape
apparaît comme dans la figure 7-1.
Limiter-LV82.vi dans le
Initiation à LabVIEW SignalExpress 7-2 ni.com
Page 88

Chapitre 7 Extension des projets LabVIEW SignalExpress avec LabVIEW
Figure 7-1. Boîte de dialogue de configuration de l’étape VI Limiter
4. Cliquez sur le bouton Exécuter, montré à gauche, pour exécuter le
projet.
5. Faites glisser le signal en sortie Clipped waveform out de l’étape VI
Limiter vers l’Affichage des données.
6. Double-cliquez sur l’étape VI Limiter pour afficher la boîte de
dialogue Configuration de l’étape.
7. Sélectionnez l’onglet Configurer le VI pour afficher le VI.
8. Entrez de nouvelles valeurs dans les champs Upper limit et Lower
limit. Par exemple, entrez
100 dans le champ Limite supérieure.
9. Le signal Clipped waveform out change sur l’Affichage des données
pour refléter les modifications effectuées.
Reportez-vous à l’Aide LabVIEW SignalExpress pour obtenir davantage
d’informations sur l’utilisation des VIs LabVIEW dans LabVIEW
SignalExpress et sur la construction de VIs qui fonctionnent sous
LabVIEW SignalExpress.
© National Instruments Corporation 7-3 Initiation à LabVIEW SignalExpress
Page 89

Chapitre 7 Extension des projets LabVIEW SignalExpress avec LabVIEW
Conversion de projets LabVIEW SignalExpress en diagrammes LabVIEW
LabVIEW SignalExpress peut convertir des projets LabVIEW
SignalExpress en diagrammes LabVIEW.
Remarque Pour convertir un projet LabVIEW SignalExpress en VI LabVIEW, le système
de développement complet de LabVIEW 7.1 ou une version supérieure doit être installée.
Effectuez les étapes suivantes pour convertir un projet LabVIEW
SignalExpress en diagramme LabVIEW.
1. Sélectionnez Fichier»Ouvrir un projet, naviguez vers le répertoire
SignalExpress\Examples\Tutorial\Solutions et
double-cliquez sur
2. Sélectionnez Outils»Générer le code»Diagramme LabVIEW.
3. Spécifiez un nom de fichier et un emplacement pour le VI LabVIEW
et cliquez sur le bouton OK.
Le diagramme LabVIEW résultant reflète l’exécution du projet dans
LabVIEW SignalExpress. Le diagramme LabVIEW comprend des
VIs Express LabVIEW câblés entre eux. Chaque VI Express
correspond à une étape dans le projet LabVIEW SignalExpress. Vous
pouvez double-cliquer sur un VI Express pour afficher la même
boîte de dialogue Configuration de l'étape que dans LabVIEW
SignalExpress. Vous pouvez également effectuer un clic droit sur un
VI Express et sélectionner Ouvrir la face-avant dans le menu local
pour convertir le VI Express en un sous-VI LabVIEW. Vous pouvez
afficher le diagramme LabVIEW pour voir comment il s’exécute et
modifier la fonctionnalité du VI. Lorsque vous convertissez un VI
Express en sous-VI, vous ne pouvez plus convertir le sous-VI en VI
Express.
Mon premier projet.seproj.
Remarque Lorsque vous convertissez un projet LabVIEW SignalExpress comportant un
enregistrement dans un fichier journal, LabVIEW SignalExpress génère un diagramme
LabVIEW avec un VI Express. Vous ne pouvez pas convertir le VI Express généré en un
sous-VI.
Initiation à LabVIEW SignalExpress 7-4 ni.com
Page 90

8
Et maintenant ?
Reportez-vous aux ressources suivantes pour obtenir de plus amples
informations sur LabVIEW SignalExpress.
Projets d’exemple LabVIEW SignalExpress
LabVIEW SignalExpress offre une variété de projets d’exemple qui
démontrent davantage de possibilités de LabVIEW SignalExpress. Ces
projets sont situés dans le répertoire
ces exemples en revue pour en savoir plus sur les fonctionnalités de
LabVIEW SignalExpress ou pour démarrer avec un projet qui s’approche
de vos exigences.
Utilisation du matériel avec LabVIEW SignalExpress
Ce manuel ne décrit pas comment contrôler du matériel à partir de
LabVIEW SignalExpress car LabVIEW SignalExpress supporte de
nombreux périphériques National Instruments pour l’acquisition et la
génération de signaux. Vous pouvez générer ou acquérir des signaux
analogiques dans LabVIEW SignalExpress en utilisant des numériseurs
haute vitesse, des périphériques d’acquisition de signaux dynamiques, des
générateurs de waveform arbitraires et des générateurs de fonctions ou des
périphériques MIO National Instruments. Vous pouvez aussi synchroniser
plusieurs périphériques dans un système en partageant des signaux
d’horloge et de déclenchement entre des périphériques. Reportez-vous à
l’Aide LabVIEW SignalExpress en sélectionnant Aide»Aide LabVIEW
SignalExpress pour obtenir des informations complémentaires sur
l’utilisation de périphériques avec LabVIEW SignalExpress.
SignalExpress\Examples. Passez
Ressources Web
Reportez-vous au site Web de National Instruments sur ni.com/france/
signalexpress
d’exemple, de la documentation technique et des VIs LabVIEW écrits pour
être utilisés dans LabVIEW SignalExpress.
© National Instruments Corporation 8-1 Initiation à LabVIEW SignalExpress
pour obtenir des ressources telles que des projets
Page 91

Support technique et services
Visitez les sections suivantes du site Web de National Instruments sur
ni.com pour obtenir une assistance technique et des services
professionnels :
• Support — Les ressources de support technique en ligne sur
ni.com/france/support comprennent notamment :
– Ressources d’auto-assistance — Pour obtenir des réponses et
des solutions, visitez le site Web primé de National Instruments
pour vous procurer des drivers et des mises à jour de logiciels,
pour faire des recherches dans la KnowledgeBase, pour accéder
aux manuels sur les produits et aux assistants de dépannage pas à
pas, ou pour obtenir des milliers d’exemples de programmes, des
tutoriels, des notes d’application, des drivers d’instruments et bien
plus encore.
– Support technique gratuit — Tous les utilisateurs enregistrés
peuvent bénéficier du Service de base gratuit, qui vous offre la
possibilité de contacter des centaines d’ingénieurs d’application
dans le monde entier, dans le cadre de NI Discussion Forums sur
ni.com/forums. Les ingénieurs d’application de National
Instruments s’efforcent de répondre à toutes les questions qui leur
sont adressées.
Pour obtenir des informations sur d’autres options de support
technique dans votre région, visitez
contactez votre filiale locale, grâce aux coordonnées qui se
trouvent sur
• Formations et certifications — Visitez
sur le volet Formations & Certifications à gauche de l’écran pour
obtenir des informations détaillées sur les programmes proposés. Vous
pouvez également vous inscrire à des cours de formation dispensés par
des instructeurs partout dans le monde.
• Intégrateurs — Si vous devez concilier délais serrés, ressources
techniques limitées et toute autre contrainte, nous vous invitons à faire
appel aux intégrateurs du Programme National Instruments Alliance
Partner. Pour en savoir plus, appelez votre filiale locale ou visitez le
site
ni.com/alliance.
ni.com/contact.
A
ni.com/services ou
ni.com/france et cliquez
© National Instruments Corporation A-1 Initiation à LabVIEW SignalExpress
Page 92

Annexe A Support technique et services
Si vous n’avez pas trouvé la réponse à vos questions sur ni.com, contactez
votre filiale locale ou le siège social de NI. Les numéros de téléphone des
filiales figurent au début de ce manuel. Vous pouvez également visiter la
page des filiales internationales sur
site Web local de votre filiale, qui contient les informations les plus à jour
pour contacter le support technique par téléphone, fax ou email, ainsi que
les dates des événements locaux.
ni.com/niglobal afin d’accéder au
Initiation à LabVIEW SignalExpress A-2 ni.com
Page 93

LabVIEWTM SignalExpress
Erste Schritte mit LabVIEW SignalExpress
Erste Schritte mit LabVIEW SignalExpress
TM
August 2007
373873C-0113
Page 94

Support
Deutschsprachige Niederlassungen
National Instruments National Instruments National Instruments
Germany GmbH Ges.m.b.H. Switzerland
Konrad-Celtis-Straße 79 Plainbachstraße 12 Sonnenbergstraße 53
81369 München 5101 Salzburg-Bergheim CH-5408 Ennetbaden
Tel.: +49 89 7413130 Tel.: +43 662 457990-0 Tel.: +41 56 2005151, +41 21 3205151 (Lausanne)
Fax: +49 89 7146035 Fax: +43 662 457990-19 Fax: +41 56 2005155
Lokaler technischer Support
Deutschland: ni.germany@ni.com www.ni.com/germany
Österreich: ni.austria@ni.com www.ni.com/austria
Schweiz: ni.switzerland@ni.com www.ni.com/switzerland
Technischer Support und Produktinformation weltweit
ni.com
National Instruments Corporate Firmenhauptsitz
11500 North Mopac Expressway Austin, Texas 78759-3504 USA Tel: 001 512 683 0100
Internationale Niederlassungen
Australien 1800 300 800, Belgien 32 (0) 2 757 0020, Brasilien 55 11 3262 3599, China 86 21 5050 9800,
Dänemark 45 45 76 26 00, Finnland 385 (0) 9 725 72511, Frankreich 01 57 66 24 24,
Großbritannien 44 0 1635 523545, Indien 91 80 41190000, Israel 972 3 6393737, Italien 39 02 413091,
Japan 81 3 5472 2970, Kanada 800 433 3488, Korea 82 02 3451 3400, Libanon 961 (0) 1 33 28 28,
Malaysia 1800 887710, Mexiko 01 800 010 0793, Neuseeland 0800 553 322, Niederlande 31 (0) 348 433 466,
Norwegen 47 (0) 66 90 76 60, Polen 48 223 390150, Portugal 351 210 311 210, Russland 7 495 783 6851,
Schweden 46 (0) 8 587 895 00, Singapur 1800 226 5886, Slowenien 386 3 425 42 00, Spanien 34 91 640 0085,
Südafrika 27 0 11 805 8197, Taiwan 886 02 2377 2222, Thailand 662 278 6777,
Tschechische Republik 420 224 235 774, Türkei 90 212 279 3031
Weitere Informationen finden Sie im Anhang unter Technische Unterstützung und professioneller Service. Für
Kommentare und Anregungen zu unserer Dokumentation geben Sie bitte auf unserer Website
Infocode
feedback ein.
ni.com/info den
© 2004–2007 National Instruments Corporation. Alle Rechte vorbehalten.
Page 95

Wichtige Informationen
Garantie
National Instruments gewährleistet, dass die Datenträger, auf denen National Instruments Software übermittelt wird, während eines Zeitraums
von 90 Tagen ab Lieferung, nachgewiesen durch Empfangsbestätigung oder sonstige Unterlagen, nicht aufgrund von Material- und
Verarbeitungsfehlern Programmanweisungen nicht ausführen. Datenträger, die Programmanweisungen nicht ausführen, werden nach Wahl
von National Instruments entweder repariert oder ersetzt, sofern National Instruments während der Garantiezeit über derartige Mängel
informiert wird.
Damit Gegenstände zur Ausführung von Garantieleistungen angenommen werden, müssen Sie sich eine Warenrücksendenummer
(RMA-Nummer) vom Hersteller geben lassen und diese auf der Packung deutlich sichtbar angeben. Die Kosten der Rücksendung von
Ersatzteilen, die von der Garantie erfasst sind, an Sie übernimmt National Instruments.
National Instruments geht davon aus, dass die Informationen in dieser Unterlage zutreffend sind. Die Unterlage ist sorgfältig auf technische
Richtigkeit überprüft worden. Für den Fall, dass dennoch technische oder Schreibfehler vorhanden sein sollten, behält sich National
Instruments das Recht vor, dies in späteren Ausgaben ohne vorherige Ankündigung zu berichtigen. Bitte wenden Sie sich an National
Instruments, falls Sie einen Fehler vermuten. National Instruments haftet in keinem Fall für Schäden, die sich aus oder im Zusammenhang mit
dieser Unterlage oder den darin enthaltenen Informationen ergeben.
SOWEIT HIER NICHT AUSDRÜCKLICH VORGESEHEN, SCHLIESST NATIONAL INSTRUMENTS JEDE GEWÄHRLEISTUNG, SEI
SIE AUSDRÜCKLICH ODER STILLSCHWEIGEND, AUS. DIESER AUSSCHLUSS GILT INSBESONDERE FÜR EINE ETWAIGE
KONKLUDENTE GEWÄHRLEISTUNG, DASS DIE PRODUKTE VON DURCHSCHNITTLICHER QUALITÄT UND FÜR DEN
NORMALEN GEBRAUCH ODER FÜR EINEN BESTIMMTEN ZWECK GEEIGNET SIND. EINE SCHADENERSATZPFLICHT FÜR
SCHULDHAFTES VERHALTEN SEITENS NATIONAL INSTRUMENTS IST AUF DEN VOM KUNDEN GEZAHLTEN KAUFPREIS
BEGRENZT. NATIONAL INSTRUMENTS HAFTET NICHT FÜR SCHÄDEN, DIE SICH AUS DEM VERLUST VON DATEN,
ENTGANGENEM GEWINN ODER NUTZUNGSMÖGLICHKEITEN ERGEBEN UND AUCH NICHT FÜR ZUFÄLLIGE ODER
FOLGESCHÄDEN, SELBST WENN NATIONAL INSTRUMENTS AUF DIE MÖGLICHKEIT SOLCHER SCHÄDEN HINGEWIESEN
WURDE. Diese Haftungsbegrenzung gilt unabhängig vom Rechtsgrund der Haftung. Ansprüche gegenüber National Instruments müssen
innerhalb eines Jahres nach Schadenseintritt gerichtlich geltend gemacht werden. Die Firma National Instruments haftet nicht für
Verspätungsschäden, die nicht in ihrem Verantwortungsbereich liegen. Diese Garantie erstreckt sich nicht auf Schäden, Fehler, Fehlfunktionen
oder Servicemängel, die auf der Nichtbefolgung von Anweisungen von National Instruments für die Installation, den Betrieb oder die Wartung,
auf Veränderungen des Produktes, Missbrauch oder Fehlgebrauch des Produktes, auf einer Unterbrechung der Energieversorgung, Feuer,
Wasserschäden, Unfälle, Handlungen Dritter oder anderen Geschehnissen, die nicht im Verantwortungsbereich von National Instruments
liegen, beruhen.
Urheberrechte
Gemäß den Bestimmungen des Urheberrechts darf diese Publikation ohne vorherige schriftliche Zustimmung der Firma National Instruments
Corporation weder vollständig noch teilweise vervielfältigt oder verbreitet werden, gleich in welcher Form, ob elektronisch oder mechanisch.
Das Verbot erfasst u.a. das Fotokopieren, das Aufzeichnen, das Speichern von Informationen in Retrieval Systemen sowie das Anfertigen von
Übersetzungen gleich welcher Art.
National Instruments achtet das geistige Eigentum anderer und fordert seine Nutzer auf, dies ebenso zu tun. Die Software von National
Instruments ist urheberrechtlich und durch andere Rechtsvorschriften zum Schutz geistigen Eigentums geschützt. Wenn Sie NI Software
nutzen, um Software oder andere Materialien, die im Eigentum Dritter stehen, zu vervielfältigen, dürfen Sie NI Software nur insoweit nutzen,
als Sie die betreffenden Materialien nach den jeweils anwendbaren Lizenzbestimmungen oder Rechtsvorschriften vervielfältigen dürfen.
Marken
National Instruments, NI, ni.com und LabVIEW sind Marken der Firma National Instruments Corporation. Nähere Informationen zu den
Marken von National Instruments finden Sie im Abschnitt Terms of Use unter ni.com/legal.
Sonstige hierin erwähnte Produkt- und Firmenbezeichnungen sind Marken oder Handelsnamen der jeweiligen Unternehmen.
Mitglieder des National Instruments Alliance Partner Programms sind eigenständige und von National Instruments unabhängige Unternehmen;
zwischen ihnen und National Instruments besteht keine gesellschaftsrechtliche Verbindung und auch kein Auftragsverhältnis.
Patente
Nähere Informationen über Patente auf Produkte von National Instruments finden Sie unter Hilfe»Patente in Ihrer Software, in der Datei
patents.txt auf Ihrer CD oder unter ni.com/patents.
WARNUNG ZUR NUTZUNG VON NATIONAL INSTRUMENTS PRODUKTEN
(1) DIE SOFTWAREPRODUKTE VON NATIONAL INSTRUMENTS WURDEN NICHT MIT KOMPONENTEN UND TESTS FÜR EIN
SICHERHEITSNIVEAU ENTWICKELT, DAS FÜR EINE VERWENDUNG BEI ODER IN ZUSAMMENHANG MIT CHIRURGISCHEN
IMPLANTATEN ODER ALS KRITISCHE KOMPONENTEN VON LEBENSERHALTENDEN SYSTEMEN GEEIGNET IST, DEREN
FEHLFUNKTION BEI VERNÜNFTIGER BETRACHTUNGSWEISE ZU ERHEBLICHEN VERLETZUNGEN VON MENSCHEN
FÜHREN KANN.
(2) BEI JEDER ANWENDUNG, EINSCHLIESSLICH DER OBEN GENANNTEN, KANN DIE ZUVERLÄSSIGKEIT DER FUNKTION
DER SOFTWAREPRODUKTE DURCH ENTGEGENWIRKENDE FAKTOREN, EINSCHLIESSLICH Z.B.
SPANNUNGSUNTERSCHIEDEN BEI DER STROMVERSORGUNG, FEHLFUNKTIONEN DER COMPUTER-HARDWARE,
FEHLENDER EIGNUNG DER SOFTWARE FÜR DAS COMPUTER-BETRIEBSSYSTEM, FEHLENDER EIGNUNG VON
ÜBERSETZUNGS- UND ENTWICKLUNGSSOFTWARE, DIE ZUR ENTWICKLUNG EINER ANWENDUNG EINGESETZT WERDEN,
INSTALLATIONSFEHLERN, PROBLEMEN BEI DER SOFTWARE- UND HARDWAREKOMPATIBILITÄT,
FUNKTIONSSTÖRUNGEN ODER AUSFALL DER ELEKTRONISCHEN ÜBERWACHUNGS- ODER KONTROLLGERÄTE,
VORÜBERGEHENDEN FEHLERN DER ELEKTRONISCHEN SYSTEME (HARDWARE UND/ODER SOFTWARE),
UNVORHERGESEHENEN EINSATZES ODER MISSBRAUCHS ODER FEHLERN DES ANWENDERS ODER DES
Page 96

ANWENDUNGSENTWICKLERS (ENTGEGENWIRKENDE FAKTOREN WIE DIESE WERDEN NACHSTEHEND
ZUSAMMENFASSEND “SYSTEMFEHLER” GENANNT) BEEINTRÄCHTIGT WERDEN. JEDE ANWENDUNG, BEI DER EIN
SYSTEMFEHLER EIN RISIKO FÜR SACHWERTE ODER PERSONEN DARSTELLT (EINSCHLIESSLICH DER GEFAHR
KÖRPERLICHER SCHÄDEN UND TOD), SOLLTE AUFGRUND DER GEFAHR VON SYSTEMFEHLERN NICHT LEDIGLICH AUF
EINE FORM VON ELEKTRONISCHEM SYSTEM GESTÜTZT WERDEN. UM SCHÄDEN UND, U.U. TÖDLICHE, VERLETZUNGEN
ZU VERMEIDEN, SOLLTE DER NUTZER ODER ANWENDUNGSENTWICKLER ANGEMESSENE SICHERHEITSMASSNAHMEN
ERGREIFEN, UM SYSTEMFEHLERN VORZUBEUGEN. HIERZU GEHÖREN UNTER ANDEREM SICHERUNGS- ODER
ABSCHALTMECHANISMEN. DA JEDES ENDNUTZERSYSTEM DEN KUNDENBEDÜRFNISSEN ANGEPASST IST UND SICH VON
DEM TESTUMFELD UNTERSCHEIDET, UND DA EIN NUTZER ODER ANWENDUNGSENTWICKLER SOFTWAREPRODUKTE
VON NATIONAL INSTRUMENTS IN VERBINDUNG MIT ANDEREN PRODUKTEN IN EINER VON NATIONAL INSTRUMENTS
NICHT GETESTETEN ODER VORHERGESEHENEN FORM EINSETZEN KANN, TRÄGT DER NUTZER BZW. DER
ANWENDUNGSENTWICKLER DIE LETZTENDLICHE VERANTWORTUNG FÜR DIE ÜBERPRÜFUNG UND AUSWERTUNG DER
EIGNUNG VON NATIONAL INSTRUMENTS PRODUKTEN, WENN PRODUKTE VON NATIONAL INSTRUMENTS IN EIN SYSTEM
ODER EINE ANWENDUNG INTEGRIERT WERDEN. DIES ERFORDERT U.A. DIE ENTSPRECHENDE ENTWICKLUNG UND
VERWENDUNG SOWIE EINHALTUNG EINER ENTSPRECHENDEN SICHERHEITSSTUFE BEI EINEM SOLCHEN SYSTEM ODER
EINER SOLCHEN ANWENDUNG.
Page 97

Inhaltsverzeichnis
Zu diesem Handbuch
Symbole und Darstellungen...........................................................................................vii
Literaturhinweise ...........................................................................................................viii
Kapitel 1
Einführung in LabVIEW SignalExpress
Kapitel 2
Installieren von LabVIEW SignalExpress
LabVIEW SignalExpress LE.........................................................................................2-1
Mindestvoraussetzungen zur Installation.......................................................................2-1
Installieren von LabVIEW SignalExpress.....................................................................2-2
Kapitel 3
Arbeit mit Projekten
Öffnen von Projekten.....................................................................................................3-1
Ausführen eines Projekts und Anzeigen von Signalen..................................................3-3
Konfigurieren von Schritten ..........................................................................................3-5
Verschieben und Löschen von Schritten .......................................................................3-8
Umgang mit Fehlern und Warnungen ...........................................................................3-8
Kapitel 4
Arbeit mit Signalen
Graphisches Darstellen von Signalen ............................................................................4-1
Importieren von Signalen aus Dateien...........................................................................4-3
Ausrichten und Vergleichen von Signalen ....................................................................4-4
Signaltypen in LabVIEW SignalExpress.......................................................................4-6
Exportieren und Drucken von Signalen.........................................................................4-7
Speichern von Signalen in Dateien..................................................................4-7
Exportieren von Signalen in Microsoft Excel .................................................4-7
Drucken von Signalen .....................................................................................4-8
Erstellen von Reports in LabVIEW SignalExpress.........................................4-8
© National Instruments Corporation v Erste Schritte mit LabVIEW SignalExpress
Page 98

Inhaltsverzeichnis
Kapitel 5
Protokollieren von Daten
Aufnehmen eines Signals ..............................................................................................5-1
Anzeigen aufgezeichneter Signale ................................................................................ 5-2
Protokollieren von Signalen mit festgelegten Start- und Endbedingungen................... 5-4
Analysieren aufgezeichneter Signale ............................................................................5-5
Erweiterte Wiedergabe .................................................................................................. 5-6
Kapitel 6
Messungen mit variierenden Größen
Festlegen des Messbereichs und der Ausgangsgrößen..................................................6-1
Darstellen der Sweep-Ergebnisse..................................................................................6-4
Geschachtelte Messungen mit variierenden Parametern............................................... 6-5
Kapitel 7
Erweitern von LabVIEW-SignalExpress-Projekten durch LabVIEW
Importieren von LabVIEW-VIs in LabVIEW SignalExpress als neue Schritte ........... 7-1
Umwandeln von LabVIEW-SignalExpress-Projekten
in LabVIEW-Blockdiagramme................................................................................... 7-4
Kapitel 8
Weitere Informationen
LabVIEW-SignalExpress-Beispielprojekte................................................................... 8-1
Verwenden von Hardware mit LabVIEW SignalExpress .............................................8-1
Informationen im WWW............................................................................................... 8-1
Anhang A
Technische Unterstützung und professioneller Service
Erste Schritte mit LabVIEW SignalExpress vi ni.com
Page 99

Zu diesem Handbuch
In diesem Handbuch erhalten Sie eine Einführung in die interaktive Messung mit LabVIEW SignalExpress und in die Grundfunktionen des
Programms zum Erfassen und Analysieren von Signalen.
Die im Buch enthaltenen Übungen sollen Ihnen den Einstieg in LabVIEW
SignalExpress erleichtern. Sie lernen damit die Konfiguration von Schritten, das Ausführen von Projekten, die Arbeit mit Signalen, das wiederholte
Messen mit variablen Parametern, das Protokollieren von Daten sowie die
Verwendung von LabVIEW SignalExpress durch die grafische Programmierumgebung LabVIEW.
Symbole und Darstellungen
In diesem Handbuch werden die folgenden Symbole und Darstellungen
verwendet:
» Das Symbol » kennzeichnet die Reihenfolge, in der Sie Menüpunkte und
Dialogfeldoptionen anzuklicken sind. So wird zum Beispiel mit der
Abfolge Datei»Seite einrichten»Optionen angezeigt, dass zunächst das
Menü Datei zu öffnen ist, daraus der Menüpunkt Seite einrichten auszuwählen und anschließend die Seite Optionen anzuklicken ist.
Dieses Zeichen steht für einen Hinweis auf wichtige Informationen.
fett In fettgedruckter Schrift sind Elemente dargestellt, die ausgewählt oder
angeklickt werden müssen, wie Menüpunkte oder Optionen in Dialogfeldern. Bei fettgedrucktem Text kann es sich auch um die Namen von Einund Ausgängen, Parameternamen, Dialogfelder, Bereiche in Dialogfeldern
und Menünamen handeln.
kursiv Variablen, Hervorhebungen, Querverweise und erstmals genannte Fachaus-
drücke sind durch Kursivschrift gekennzeichnet. Ebenfalls kursiv sind
Textstellen gedruckt, an denen Wörter bzw. Werte einzusetzen sind.
monospace In Monospace-Schrift (nicht proportionaler Schrift) ist Text dargestellt, der
über die Tastatur einzugeben ist. Diese Darstellungsweise wird ebenfalls
für Laufwerke, Pfade, Verzeichnisse, Programme, Unterprogramme, Subroutinen, Gerätenamen, Funktionen, Operationen, Variablen sowie
Dateinamen und -erweiterungen verwendet.
© National Instruments Corporation vii Erste Schritte mit LabVIEW SignalExpress
Page 100

Zu diesem Handbuch
Literaturhinweise
Wenn Sie beim Lesen dieses Handbuchs weitere Fragen haben, werden
diese möglicherweise in der Hilfe zu LabVIEW SignalExpress unter
Hilfe»LabVIEW-SignalExpress-Hilfe beantwortet.
Erste Schritte mit LabVIEW SignalExpress viii ni.com
 Loading...