


SRM-3000
Advanced Test Equipment Rentals
www.atecorp.com 800-404-ATEC (2832)
®
E
s
t
a
b
l
i
s
h
e
d
1
9
8
1
Selective Radiation Meter
Operating Manual
3001/98.21


SRM-3000
Selective Radiation Meter
300X/XX, Series C ...
Operating Manual

Please direct all enquiries to your local
sales company.
Narda Safety Test Solutions GmbH
Sandwiesenstr. 7
72793 Pfullingen, Germany
© 2007
Order no.: 3001/98.21
Edition : 11/07.06, C ...
Previous edition: 10/06.11, C ...
Subject to change without notice.
Our normal guarantee and delivery
terms apply
Printed in Germany

Contents
1 Introduction . . . . . . . . . . . . . . . . . . . . . . . . . . . . . . . . . . . . 1-1
2 Safety instructions . . . . . . . . . . . . . . . . . . . . . . . . . . . . . . 2-1
3 Preparation for use . . . . . . . . . . . . . . . . . . . . . . . . . . . . . . 3-1
1.1 Application. . . . . . . . . . . . . . . . . . . . . . . . . . . . . . 1-1
1.2 About this instrument. . . . . . . . . . . . . . . . . . . . . . 1-3
1.3 About this Manual . . . . . . . . . . . . . . . . . . . . . . . . 1-4
2.1 Before connecting up . . . . . . . . . . . . . . . . . . . . . 2-1
2.2 Correct use . . . . . . . . . . . . . . . . . . . . . . . . . . . . . 2-1
2.3 AC Adapter / Charger . . . . . . . . . . . . . . . . . . . . . 2-3
2.4 Faults and excessive stresses . . . . . . . . . . . . . . 2-4
2.5 Disposal in accordance with local regulations. . . 2-4
3.1 Unpacking . . . . . . . . . . . . . . . . . . . . . . . . . . . . . . 3-1
3.1.1 Packaging . . . . . . . . . . . . . . . . . . . . . . . . . . . . . . 3-1
3.1.2 Checking the instrument for transport damage . . 3-1
3.1.3 Recovery after transport and storage . . . . . . . . . 3-1
3.2 Power supply. . . . . . . . . . . . . . . . . . . . . . . . . . . . 3-2
3.2.1 Battery pack operation . . . . . . . . . . . . . . . . . . . . 3-2
3.2.2 Handling the battery pack . . . . . . . . . . . . . . . . . . 3-3
3.2.3 Operation from AC Adapter / Charger. . . . . . . . . 3-3
3.3 Switching the instrument on and off . . . . . . . . . . 3-4
3.3.1 Switching on . . . . . . . . . . . . . . . . . . . . . . . . . . . . 3-4
3.3.2 Switching off . . . . . . . . . . . . . . . . . . . . . . . . . . . . 3-5
4 Instrument concept . . . . . . . . . . . . . . . . . . . . . . . . . . . . . . 4-1
4.1 SRM as a field strength meter. . . . . . . . . . . . . . . 4-1
4.1.1 Overall concept . . . . . . . . . . . . . . . . . . . . . . . . . . 4-2
4.1.2 Basic instrument . . . . . . . . . . . . . . . . . . . . . . . . . 4-2

4.1.3 Antennas . . . . . . . . . . . . . . . . . . . . . . . . . . . . . . . 4-3
4.1.4 Cable . . . . . . . . . . . . . . . . . . . . . . . . . . . . . . . . . . 4-4
4.2 SRM as a spectrum analyzer . . . . . . . . . . . . . . . . 4-4
5 Measurement setup variants . . . . . . . . . . . . . . . . . . . . . . 5-1
5.1 Variant overview . . . . . . . . . . . . . . . . . . . . . . . . . . 5-1
5.1.1 Measurement setup with a three axis antenna. . . 5-2
5.1.2 Measurement setup with a single axis antenna . . 5-3
5.2 Assembling the measurement setup . . . . . . . . . .5-5
5.3 Fitting the antenna directly
on the basic instrument . . . . . . . . . . . . . . . . . . . . 5-6
5.4 Using a cable to connect the antenna
to the basic instrument . . . . . . . . . . . . . . . . . . . . . 5-8
5.5 Fitting the Narda antenna to a tripod . . . . . . . . . 5-11
5.5.1 Antenna holder for three axis antennas . . . . . . . 5-11
5.5.2 Antenna holder for single axis and
three axis antennas . . . . . . . . . . . . . . . . . . . . . . 5-12
5.6 Registering a non-Narda antenna . . . . . . . . . . .5-14
5.7 Registering a non-Narda cable. . . . . . . . . . . . . . 5-15
6 User interface . . . . . . . . . . . . . . . . . . . . . . . . . . . . . . . . . . 6-1
6.1 Control elements . . . . . . . . . . . . . . . . . . . . . . . . . 6-2
6.1.1 On / Off switch . . . . . . . . . . . . . . . . . . . . . . . . . . . 6-2
6.1.2 Menu selection keys. . . . . . . . . . . . . . . . . . . . . . . 6-2
6.1.3 Softkeys . . . . . . . . . . . . . . . . . . . . . . . . . . . . . . . . 6-3
6.1.4 Function keys . . . . . . . . . . . . . . . . . . . . . . . . . . . . 6-3
6.1.5 Rotary control . . . . . . . . . . . . . . . . . . . . . . . . . . . . 6-7
6.1.6 Keys for optimizing the display . . . . . . . . . . . . . . . 6-8
6.2 Operating status display. . . . . . . . . . . . . . . . . . . . 6-9
6.3 LCD panel elements. . . . . . . . . . . . . . . . . . . . . . 6-10
6.4 External connectors . . . . . . . . . . . . . . . . . . . . . . 6-12

7 “Safety Evaluation” mode . . . . . . . . . . . . . . . . . . . . . . . . 7-1
7.1 “Safety Evaluation” mode functions. . . . . . . . . . . 7-1
7.2 Selecting the operating mode . . . . . . . . . . . . . . . 7-1
7.3 Selecting the service to be measured . . . . . . . . . 7-4
7.3.1 Restricting the list of services to be measured
using the first service. . . . . . . . . . . . . . . . . . . . . . 7-4
7.3.2 Restricting the list of services to be measured
using the last service. . . . . . . . . . . . . . . . . . . . . . 7-5
7.3.3 Restoring the original list of services
to be measured . . . . . . . . . . . . . . . . . . . . . . . . . . 7-5
7.4 Setting the measurement range . . . . . . . . . . . . . 7-6
7.4.1 Setting the measurement range manually. . . . . . 7-6
7.4.2 Search for the best measurement range. . . . . . . 7-7
7.4.3 Using noise suppression (Noise Threshold) . . . . 7-8
7.5 Selecting the result type . . . . . . . . . . . . . . . . . . 7-10
7.6 Selecting the averaging parameters . . . . . . . . . 7-11
7.7 Selecting the resolution bandwidth (RBW) . . . . 7-13
7.8 Selecting display options. . . . . . . . . . . . . . . . . . 7-15
7.8.1 Selecting the units for the results . . . . . . . . . . . 7-15
7.8.2 Selecting display options. . . . . . . . . . . . . . . . . . 7-16
8 “Spectrum Analysis” mode . . . . . . . . . . . . . . . . . . . . . . . 8-1
8.1 Operating mode functions . . . . . . . . . . . . . . . . . . 8-1
8.2 Selecting the operating mode . . . . . . . . . . . . . . . 8-1
8.3 Selecting the frequency range. . . . . . . . . . . . . . . 8-4
8.3.1 Selecting the frequency range entry method. . . . 8-4
8.3.2 Defining the frequency range
by upper and lower frequencies . . . . . . . . . . . . . 8-4
8.3.3 Defining the frequency range
by center frequency and frequency span . . . . . . 8-6
8.4 Setting the resolution bandwidth (RBW) . . . . . . . 8-7

8.5 Setting the measurement range . . . . . . . . . . . . . . 8-9
8.5.1 Setting the measurement range manually . . . . . . 8-9
8.5.2 Search for the best measurement range . . . . . . 8-10
8.6 Selecting the result type . . . . . . . . . . . . . . . . . . . 8-11
8.7 Selecting the averaging parameters. . . . . . . . . . 8-12
8.8 Selecting the display . . . . . . . . . . . . . . . . . . . . . 8-14
8.8.1 Selecting the units . . . . . . . . . . . . . . . . . . . . . . . 8-14
8.8.2 Selecting the display mode and scaling . . . . . . . 8-16
8.8.3 Rapidly changing the frequency span
(Zoom function) . . . . . . . . . . . . . . . . . . . . . . . . . 8-20
8.9 Evaluating results . . . . . . . . . . . . . . . . . . . . . . . . 8-28
8.9.1 Marker functions. . . . . . . . . . . . . . . . . . . . . . . . . 8-28
8.9.2 Peak table. . . . . . . . . . . . . . . . . . . . . . . . . . . . . . 8-32
8.9.3 Integration over a defined frequency band. . . . . 8-37
9 “UMTS P-CPICH Demodulation” mode (option) . . . . . . 9-1
9.1 Operating mode functions . . . . . . . . . . . . . . . . . . 9-1
9.2 Selecting the operating mode. . . . . . . . . . . . . . . . 9-2
9.3 Selecting the display . . . . . . . . . . . . . . . . . . . . . . 9-5
9.3.1 Table Normal display mode . . . . . . . . . . . . . . . . . 9-6
9.3.2 Table Ratio display mode . . . . . . . . . . . . . . . . . . . 9-9
9.3.3 Bar Graph display mode. . . . . . . . . . . . . . . . . . . 9-10
9.3.4 Mixed display mode (numerical display
with graphical display versus time). . . . . . . . . . . 9-13
9.3.5 Value display mode (numerical) . . . . . . . . . . . . . 9-17
9.3.6 Graph (versus time) display mode . . . . . . . . . . . 9-18
9.4 Selecting an UMTS frequency or channel . . . . . 9-20
9.4.1 Selecting the center frequency . . . . . . . . . . . . . . 9-21
9.4.2 Selecting the channel number . . . . . . . . . . . . . . 9-22
9.5 Selecting the measurement range . . . . . . . . . . .9-23
9.5.1 Setting the measurement range manually . . . . . 9-23
9.5.2 Search for the best measurement range . . . . . . 9-24

9.5.3 Using noise suppression (Noise Threshold) . . . 9-25
9.6 Selecting the result type . . . . . . . . . . . . . . . . . . 9-27
9.7 Selecting the averaging parameters . . . . . . . . . 9-28
9.8 Selecting the UMTS demodulation algorithm
(FAST/SENSITIVE) . . . . . . . . . . . . . . . . . . . . . . 9-30
9.9 Setting the extrapolation factor (Extr. Fact.) . . . 9-31
9.10 Evaluating and interpreting
measurement results. . . . . . . . . . . . . . . . . . . . . 9-33
9.10.1 Individual results . . . . . . . . . . . . . . . . . . . . . . . . 9-33
9.10.2 Overall result (Total) . . . . . . . . . . . . . . . . . . . . . 9-34
9.10.3 Partial results for specific radio cells
(Scrambling Codes). . . . . . . . . . . . . . . . . . . . . . 9-34
9.10.4 Analog measurement result (Analog) . . . . . . . . 9-34
10 “Time Analysis” mode . . . . . . . . . . . . . . . . . . . . . . . . . . 10-1
10.1 Operating mode function . . . . . . . . . . . . . . . . . . 10-1
10.2 Selecting the operating mode . . . . . . . . . . . . . . 10-1
10.3 Selecting display options. . . . . . . . . . . . . . . . . . 10-4
10.3.1 Value display . . . . . . . . . . . . . . . . . . . . . . . . . . . 10-4
10.3.2 Graph display . . . . . . . . . . . . . . . . . . . . . . . . . . 10-6
10.3.3 Mixed display. . . . . . . . . . . . . . . . . . . . . . . . . . . 10-9
10.4 Selecting the Center Frequency (Fcent) . . . . . 10-10
10.5 Selecting the Detector Type
(RMS value, peak value) . . . . . . . . . . . . . . . . . 10-11
10.6 Selecting the Resolution Bandwidth (RBW) . . 10-12
10.7 Setting the measurement range . . . . . . . . . . . 10-13
10.7.1 Setting the measurement range manually. . . . 10-13
10.7.2 Search for the best measurement range. . . . . 10-14
10.7.3 Using noise suppression (Noise Threshold) . . 10-15
10.8 Selecting the Result Type . . . . . . . . . . . . . . . . 10-17
10.9 Selecting the Averaging Time . . . . . . . . . . . . . 10-18
10.10 Evaluating the results . . . . . . . . . . . . . . . . . . . 10-19

11 Isotropic measurements . . . . . . . . . . . . . . . . . . . . . . . . 11-1
11.1 Measurements with a three axis antenna. . . . . . 11-2
11.1.1 Isotropic measurement
with a three axis antenna . . . . . . . . . . . . . . . . . . 11-2
11.1.2 Measuring a single axis
with a three axis antenna . . . . . . . . . . . . . . . . . . 11-4
11.2 Measurement using a single axis antenna. . . . . 11-5
11.2.1 Standard measurement
using a single axis antenna . . . . . . . . . . . . . . . . 11-5
11.2.2 Isotropic measurement
with a single axis antenna . . . . . . . . . . . . . . . . . 11-6
12 Spatial Averaging (option) . . . . . . . . . . . . . . . . . . . . . . . 12-1
12.1 Spatial Averaging in
“Safety Evaluation” mode . . . . . . . . . . . . . . . . . . 12-4
12.1.1 Continuous Averaging . . . . . . . . . . . . . . . . . . . . 12-5
12.1.2 Discrete Averaging . . . . . . . . . . . . . . . . . . . . . . . 12-8
12.1.2.1 Discrete Averaging with a three axis antenna . . 12-8
12.1.2.2 Discrete Averaging with a single axis antenna .12-10
12.2 Spatial Averaging in
“Spectrum Analysis” mode . . . . . . . . . . . . . . . . 12-14
12.3 Spatial Averaging in
“Time Analysis” mode. . . . . . . . . . . . . . . . . . . . 12-16
13 Result memory . . . . . . . . . . . . . . . . . . . . . . . . . . . . . . . . 13-1
13.1 Saving data. . . . . . . . . . . . . . . . . . . . . . . . . . . . . 13-1
13.1.1 Saving a single measurement . . . . . . . . . . . . . . 13-2
13.1.2 Automatic saving . . . . . . . . . . . . . . . . . . . . . . . . 13-4
13.1.3 Time Controlled Storing (option). . . . . . . . . . . . .13-9
13.2 Managing data sets . . . . . . . . . . . . . . . . . . . . . 13-13
13.3 Entering and editing comments . . . . . . . . . . . . 13-17
13.4 Reading out stored data sets . . . . . . . . . . . . . . 13-19

14 General settings (Configuration) . . . . . . . . . . . . . . . . . . 14-1
14.1 Configurations for “Safety Evaluation” mode. . . 14-3
14.2 Configurations for “Spectrum Analysis” mode . . 14-3
14.3 Configurations for
“UMTS P-CPICH Demodulation” mode. . . . . . . 14-4
14.4 Configurations for “Time Analysis” mode . . . . . 14-5
14.5 Selecting a safety standard. . . . . . . . . . . . . . . . 14-6
14.6 Selecting a service table . . . . . . . . . . . . . . . . . . 14-7
14.7 Selecting a cell name table . . . . . . . . . . . . . . . . 14-9
14.8 Displaying device information . . . . . . . . . . . . . 14-11
14.9 Setting the date and time . . . . . . . . . . . . . . . . 14-13
14.10 Setting the number format
(Configure General). . . . . . . . . . . . . . . . . . . . . 14-15
14.11 Selecting the remote control interface
(Configure General). . . . . . . . . . . . . . . . . . . . . 14-15
14.12 Selecting the parameters
for the measurement range search
(Configure General). . . . . . . . . . . . . . . . . . . . . 14-16
14.13 Selecting an antenna / sensor. . . . . . . . . . . . . 14-17
14.14 Selecting a cable . . . . . . . . . . . . . . . . . . . . . . . 14-18
14.15 Creating and managing setups . . . . . . . . . . . . 14-20
15 Maintenance and repairs. . . . . . . . . . . . . . . . . . . . . . . . . 15-1
15.1 Changing the battery pack . . . . . . . . . . . . . . . . 15-1
15.2 Cleaning . . . . . . . . . . . . . . . . . . . . . . . . . . . . . . 15-2
15.3 AC Adapter / Charger . . . . . . . . . . . . . . . . . . . . 15-3
16 Adapting the instrument configuration using
“SRM-Tools” or “SRM-TS”16-1
16.1 Task of the “SRM-Tools” software . . . . . . . . . . . 16-1
16.2 Connecting a PC to the SRM-3000 . . . . . . . . . . 16-3
16.2.1 Serial interface connection . . . . . . . . . . . . . . . . 16-4

16.2.2 USB interface connection. . . . . . . . . . . . . . . . . . 16-4
16.3 SRM configuration . . . . . . . . . . . . . . . . . . . . . . 16-10
16.4 Reading out the stored results from a SRM . . .16-13
16.5 Updating the firmware of the SRM . . . . . . . . . .16-15
16.6 Activating options . . . . . . . . . . . . . . . . . . . . . . . 16-16
16.7 Installing and uninstalling “SRM-Tools”
or “SRM-TS” . . . . . . . . . . . . . . . . . . . . . . . . . . . 16-18
17 Remote control . . . . . . . . . . . . . . . . . . . . . . . . . . . . . . . . 17-1
17.1 Connecting to the PC . . . . . . . . . . . . . . . . . . . . . 17-1
17.2 Switching the SRM to
remote controlled operation . . . . . . . . . . . . . . . . 17-2
17.3 Fundamentals of remote control. . . . . . . . . . . . . 17-3
17.3.1 Remote control command syntax. . . . . . . . . . . . 17-3
17.3.2 Parameter syntax . . . . . . . . . . . . . . . . . . . . . . . . 17-4
17.3.3 Command line termination . . . . . . . . . . . . . . . . . 17-4
17.4 Separate document about remote control . . . . . 17-5
18 Specifications . . . . . . . . . . . . . . . . . . . . . . . . . . . . . . . . . 18-1
18.1 Frequency range and operating modes . . . . . . . 18-1
18.2 RF characteristics. . . . . . . . . . . . . . . . . . . . . . . . 18-1
18.2.1 Frequency . . . . . . . . . . . . . . . . . . . . . . . . . . . . . 18-1
18.2.2 “Spectrum Analysis” mode . . . . . . . . . . . . . . . . .18-3
18.2.3 “Safety Evaluation” mode . . . . . . . . . . . . . . . . . . 18-4
18.2.4 “UMTS P-CPICH Demodulation” mode (Option) 18-5
18.2.5 “Time Analysis” mode. . . . . . . . . . . . . . . . . . . . . 18-7
18.2.6 Measurement functions . . . . . . . . . . . . . . . . . . . 18-8
18.2.7 General specifications . . . . . . . . . . . . . . . . . . . 18-11
18.3 Three axis E-field measurement antenna
specifications . . . . . . . . . . . . . . . . . . . . . . . . . . 18-13
18.3.1 Characteristics . . . . . . . . . . . . . . . . . . . . . . . . . 18-13
18.3.2 Measurement uncertainty . . . . . . . . . . . . . . . . . 18-14

18.3.3 General specifications . . . . . . . . . . . . . . . . . . . 18-14
18.4 Single axis E-field antenna specifications
(3531/01) . . . . . . . . . . . . . . . . . . . . . . . . . . . . . 18-16
18.4.1 Characteristics. . . . . . . . . . . . . . . . . . . . . . . . . 18-16
18.4.2 Measurement uncertainty . . . . . . . . . . . . . . . . 18-17
18.4.3 General specifications . . . . . . . . . . . . . . . . . . . 18-17
18.5 Single axis E-field antenna specifications
(3531/02B). . . . . . . . . . . . . . . . . . . . . . . . . . . . 18-19
18.5.1 Characteristics. . . . . . . . . . . . . . . . . . . . . . . . . 18-19
18.5.2 Measurement uncertainty . . . . . . . . . . . . . . . . 18-20
18.5.3 General specifications . . . . . . . . . . . . . . . . . . . 18-20
18.6 Single axis H-field antenna specifications
(3551/01) . . . . . . . . . . . . . . . . . . . . . . . . . . . . . 18-22
18.6.1 Characteristics. . . . . . . . . . . . . . . . . . . . . . . . . 18-22
18.6.2 Measurement uncertainty . . . . . . . . . . . . . . . . 18-22
18.6.3 General specifications . . . . . . . . . . . . . . . . . . . 18-23
18.7 Conformity declaration . . . . . . . . . . . . . . . . . . 18-24
Appendix A:
Measurement methods using a single axis antenna . . A-1
Appendix B:
Technical descriptions . . . . . . . . . . . . . . . . . . . . . . . . . . B-1
Appendix C:
Instrument graphics . . . . . . . . . . . . . . . . . . . . . . . . . . . . C-1


1Introduction
1.1 Application
In today’s world, virtually everyone lives and works in an environment full of
technical equipment that generates electric and magnetic fields. As
research into the possible effects on humans has increased, so has
awareness of the problem and the depth of information within this area of
interest. Various authorities have long defined limit values to protect users
from excessive exposure to emissions.
The SRM-3000 provides practically everyone who is concerned with this
problem with a measuring instrument which, with the minimum of fuss, is
capable not only of showing whether limit values are being adhered to or
not, but also of allowing further analysis of the field components in relation
to the overall exposure.
The available operating modes cover the requirements of very different
users.
For example, a safety engineer concerned with the frequency spectrum of
telecommunications equipment can use the instrument to monitor
compliance with limit values at the workplace, and a planner can measure
the emissions present in public areas so that these can be taken into
account in future plans.
On the other hand, the SRM is also a high-quality evaluation tool for
qualified communications engineers who may be concerned with the
emission spectra present around telecommunications equipment.
The SRM takes care of all evaluations directly on site. Nevertheless, the
results can be transferred to a PC, so that measurement reports can be
produced, for example. The SRM can also be remote controlled from a PC.
1-1

1 Introduction SRM-3000
1-2
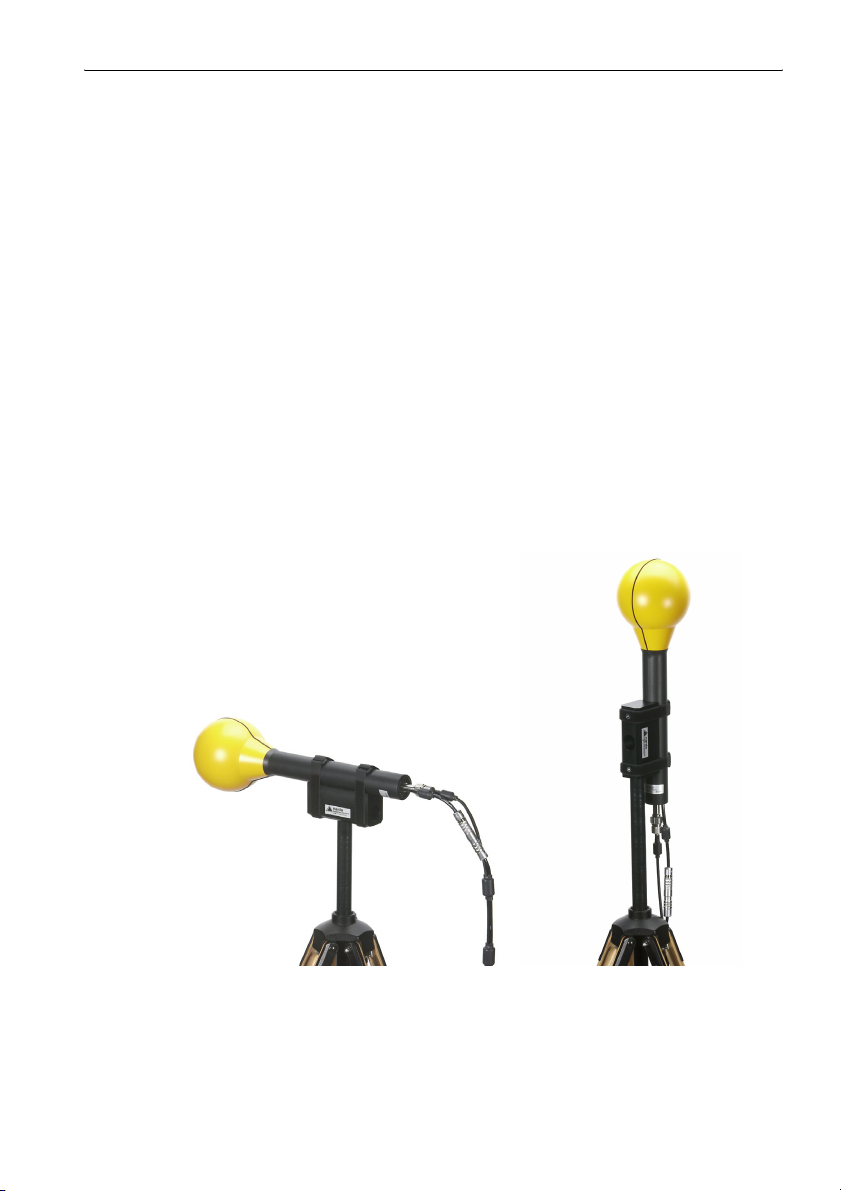
Fig. 1-1 The SRM-3000 in use

SRM-3000 1 Introduction
1.2 About this instrument
The SRM-3000 is an instrument for measuring high-frequency fields in the
range from 100 kHz to 3 GHz.
The instrument incorporates a very wide, versatile range of functions in an
extremely light weight, handy device. This means that it is also ideal for use
particularly under conditions that require high mobility and robustness.
The SRM-3000 is a complete measuring system. Along with the basic
instrument, the SRM, Narda Safety Test Solutions GmbH also supplies
various antennas as solutions to different applications and frequency
ranges. These antennas have either three axes or a single axis. All Narda
antennas can be mounted directly on the basic instrument or connected to
it using a special RF cable.
Antennas with three axes (three axis antennas) make it possible to
automatically detect the three spatial components of the field to be
measured. Isotropic measurements are simpler and much faster than with
single axis antennas.
Other commonly available antennas can also be connected to the SRM
using the customary types of connecting cable.
1-3

1 Introduction SRM-3000
1.3 About this Manual
The following is a standard text which explains the typographic conventions
used in Narda documentation.
Typographic conventions
Some of the paragraphs in this Manual are marked with various symbols or
headings to make it easier to read and understand.
ª The bent arrow indicates a cross-reference to another chapter or
section or to another document.
Note: This heading indicates important additional information or notes
about special features or situations.
✓ The check mark before a paragraph indicates a requirement that must
be fulfilled before the next steps can be carried out.
⇒ An arrow before a paragraph indicates a single action or task that must
be performed.
1. A numbered list indicates a series of actions that must be performed
one after the other.
1-4

2 Safety instructions
2.1 Before connecting up
This instrument was shipped in perfect condition. To ensure that this
condition is maintained and that operation is safe, please follow the
instructions given below.
2.2 Correct use
The instrument must only be used for the purpose and under the conditions
for which it is designed.
No warning function
The instrument is designed for detection and rapid evaluation of
electromagnetic field emissions. It is not a warning instrument; i.e. it does
Danger
not actively warn you of the presence of dangerous fields by means of
visible or audible signals.
⇒ Always consider this instrument to be a measuring instrument, not a
warning device.
⇒ Always carefully observe the measured value display when approaching
unknown fields.
⇒ If you are in any doubt, use a warning device such as “RadMan” or
“Nardalert” from Narda Safety Test Solutions to give warning of
potentially hazardous field strengths.
Danger
Unsuitable frequency range
Dangerous fields can be overlooked if an unsuitable frequency range is
selected.
⇒ Select the largest available or the appropriate frequency range.
⇒ Always carefully observe the measured value display when approaching
unknown fields.
⇒ If you are in any doubt, use a broadband device such as “RadMan” or
“Nardalert” from Narda Safety Test Solutions to give warning of
potentially hazardous field strengths.
2-1

2 Safety instructions SRM-3000
Misinterpretation of results obtained with single axis antennas
Only the field components which are parallel to the antenna axis will be
detected by a single-axis antenna.
Danger
Even if the field is strong, there is a danger that only a weak field or no field
at all will be measured if the antenna is not correctly positioned in the field.
⇒ Make sure that the measurement setup is suitable when using a single-
axis antenna.
Strong fields
Very strong fields can occur in the vicinity of some radiation sources.
⇒ Take care to observe safety barriers and markings.
Danger
⇒ In particular, persons fitted with electronic implants (pacemakers) must
keep away from danger areas.
Electric shock
High voltages can occur inside the instrument.
⇒ Do not bring the instrument or the antenna into contact with parts
Danger
carrying live voltages.
⇒ Do not open the instrument.
⇒ Do not use or handle an instrument which is open or which has been
visibly damaged.
⇒ Only use the accessories supplied and intended for use with the
SRM-3000.
Caution
2-2
Malfunction
Incorrect use, damage and unauthorized repairs can adversely affect the
accuracy and function of the instrument.
⇒ Only use the instrument under the conditions and for the purpose for
which it is designed.
⇒ Check the instrument regularly for signs of damage.
⇒ Repairs must only be made by qualified service personnel.

SRM-3000 2 Safety instructions
Malfunction
Metallic stickers placed on the (yellow) sensor area of the antenna can lead
to measurement errors, particularly to an underestimation of the
Caution
electromagnetic field strength.
⇒ Stickers or labels of any type should only be affixed to the (black)
antenna shaft.
2.3 AC Adapter / Charger
Electric shock
Parts carrying live voltages may be exposed if the AC Adapter / Charger is
damaged. This could result in injury from electric shock.
Danger
Caution
⇒ Never use a damaged AC Adapter / Charger.
Destruction
The AC Adapter / Charger can be destroyed or damaged by an incorrect AC
line voltage, condensation, too high or too low temperatures, and insufficient
ventilation.
⇒ Before connecting up the AC Adapter / Charger check that the
operating voltage of the AC Adapter / Charger and the voltage of the
local AC supply are the same.
⇒ Do not use an AC Adapter / Charger on which condensation has formed.
If condensation is unavoidable, e.g. because the AC Adapter / Charger is
cold and it is brought into a warm room, make sure that it has dried out
before connecting it up.
⇒ Only use the AC Adapter / Charger indoors and at temperatures between
+5 °C and +45 °C.
2-3

2 Safety instructions SRM-3000
2.4 Faults and excessive stresses
Take the instrument out of service and secure it against unauthorized use if
safe operation is no longer possible. This is the case, for example, if:
• the instrument shows visible signs of damage,
• the instrument does not work,
• the instrument has been subjected to any kind of stress that exceeds the
permitted limits.
In such cases, contact the service center for your area.
2.5 Disposal in accordance with local regulations
The SRM-3000 is a high-quality instrument that will give you many years of
reliable service. Nevertheless, even this product will eventually become
obsolete. When that time comes, please remember that electronic
equipment must be disposed of in accordance with local regulations.
The SRM-3000 conforms to the WEEE Directive of the European Union
(2002/96/EC) and belongs to Category 9 (Monitoring and Control
Instruments).
You can return the instrument to us free of charge for proper environmentfriendly disposal. You can obtain further information from your local Narda
Sales Partner or by visiting our website at www.narda-sts.com.
2-4

3 Preparation for use
3.1 Unpacking
3.1.1 Packaging
The packaging is designed to be reused as long as it has not been damaged
during previous use. Keep the original packaging and use it for all future
transport of the instrument.
3.1.2 Checking the instrument for transport damage
After unpacking, check the instrument and all accessories for any damage
that might have occurred during transport. This should be suspected if the
packaging itself has been clearly damaged. Do not attempt to use a
damaged instrument.
3.1.3 Recovery after transport and storage
Condensation can form on an instrument that has been stored or
transported at a low temperature when it is brought into a warmer
environment. To prevent any damage, wait until condensation is no longer
visible on the instrument surface. The instrument is not ready for use until it
has reached a temperature within the guaranteed operating range of
-10 °C to +50 °C.
3-1

3 Preparation for use SRM-3000
3.2 Power supply
The battery pack provided is usually used as the power supply. You can
also use the AC Adapter / Charger as an alternative power supply.
3.2.1 Battery pack operation
The SRM-3000 is operated from the battery pack supplied with the
instrument.
A fully charged battery pack is sufficient for about 4 hours operation. As
supplied, the battery pack is only pre-charged and needs to be fully charged
before it is used for the first time.
Note: Only use original battery packs as supplied with the instrument. If the
capacity of the battery pack supplied is insufficient for your test task
requirements, further battery packs can be obtained as accessories.
Charge indicator
The charge state of the battery pack is indicated by a battery symbol in the
“General information” section of the LCD panel.
ª Refer to sec. 6.3, page 6-10 for more details.
3-2
Discharge indication
If the battery voltage drops below a critical value, the battery symbol will be
replaced by the flashing message “Low Battery”. A warning message will
also be displayed at regular intervals in the center of the LCD panel. The
instrument will switch off automatically after about 10 minutes of further
operation. The instrument configuration is saved before switch off.

SRM-3000 3 Preparation for use
Charging the battery pack
A full charge cycle takes about 3.5 hours.
You must use the AC Adapter / Charger supplied with the instrument to
charge the battery pack.
Starting the charge cycle
✓ The local AC line voltage and the operating voltage of the AC Adapter /
Charger must be the same.
1. Connect the AC Adapter / Charger to the charging socket of the
SRM-3000.
2. Connect the AC Adapter / Charger to the AC power supply.
Charging starts.
A red LED next to the “Charge” label is on during the entire charge cycle.
When the battery pack is fully charged, the AC Adapter / Charger
automatically switches to trickle charging.
At this stage, a green LED next to the “Charge” label switches on.
3.2.2 Handling the battery pack
• Do not drop, damage or dismantle the battery pack.
• Only recharge the battery pack as described in this Operating Manual.
• Do not expose the battery pack to very high temperatures for a long time
either inside or outside the instrument.
• Do not leave a discharged battery pack in the instrument for a long time.
• Do not store battery packs for more than six months without recharging
them occasionally.
3.2.3 Operation from AC Adapter / Charger
The SRM-3000 can always be powered and operated from an AC Adapter /
Charger connected to it.
This is not recommended in practice, however, because the measurement
characteristics can be affected considerably by the presence of the power
supply cable in the field when the SRM-3000 is operated with the AC
Adapter / Charger connected to it.
3-3

3 Preparation for use SRM-3000
3.3 Switching the instrument on and off
3.3.1 Switching on
✓ You have made sure that the battery pack is sufficiently charged for the
planned measurement task.
⇒ Press the ON/OFF button for about 1 second.
The SRM-3000 switches on.
A green LED next to the “Status” label switches on.
The function test runs.
Function test
The function test checks the functions of various components and checks
internal processes. It takes about 5 seconds.
A test screen is displayed during the function test. This shows the
instrument name and serial number along with a list of the elements that are
to be tested.
3-4
Fig. 3-1 Display during function test
When the function test has been completed successfully, the instrument
reverts to the settings used for the last measurement and the measurement
screen is displayed.
Measurements can now be started.

SRM-3000 3 Preparation for use
Fig. 3-2 Display after completion of function test (example)
Note: The instrument reverts automatically to the default setting if you
change the antenna:
– Maximum input attenuation, i.e. least sensitive measurement
range
– Maximum frequency range
Possible faults
If a fault occurs during the function test, the message “Error detected during
initialization” will be displayed and the start-up process will be interrupted
automatically. The error code for the fault that was detected will be shown
on the display.
⇒ Contact the Service Center.
3.3.2 Switching off
⇒ Press the ON/OFF button for at least 1 second.
The LCD panel clears. The instrument is switched off.
3-5

3 Preparation for use SRM-3000
Notes:
3-6

4 Instrument concept
4.1 SRM as a field strength meter
The SRM is an instrument designed to measure electromagnetic fields in
the frequency range from 100 kHz to 3 GHz. The main measurement task is
the determination of field strength.
Users can select from several operating modes, all of which are designed to
give immediate, informative on-site results that require no further
processing or evaluation.
In “Safety Evaluation” mode, users can put together a list of frequency
ranges within which the field strength is to be measured. The results in each
frequency range of the so-called Service Table defined in this way are
displayed in units of field strength or as a percentage of a selected safety
standard. The displayed value 100% indicates that the limit value defined in
the standard has been reached. This makes direct, on-site determination of
compliance with defined limit values possible.
In “Spectrum Analysis” mode, all the field components in the selected
environment can be detected to give an overview of the spectrum or for
determining maximum values. Here too, the extended functions of the
instrument allow evaluation of the measured values directly on site.
In “UMTS P-CPICH Demodulation” mode (option) the SRM decodes the
Primary Common Pilot Channel of UMTS cells. As in “Safety Evaluation”
mode, the field strengths due to individual pilot channels can be determined
in units of field strength or as percentages of a selected human safety
standard level. The field strength exposure that the cell would cause when
fully loaded can be extrapolated from these values.
In “Time Analysis” mode, the SRM makes selective, continuous
measurements at a fixed, user-defined frequency. This allows detection of
even short duration spikes, e.g. from pulsed radar equipment. The
operating mode is ideal for timer-controlled measurements.
4-1

4 Instrument concept SRM-3000
4.1.1 Overall concept
In the simplest case, the complete test setup for measuring field strength
consists of the basic instrument plus an antenna which plugs into the basic
instrument.
Depending on the measurement method selected, it may be advisable or
necessary to place the antenna some distance from the basic instrument
rather than directly on it. Cables can be used to connect the antenna to the
basic instrument. The field strength measuring systems supplied by Narda
Safety Test Solutions include a 1.5 m long cable. A 5 m long cable is
available for special applications.
The antenna must be placed where it will not be disturbed and positioned
exactly for precision measurements. A tripod which is also provided with a
suitable positioning device can be added to the test setup for this purpose.
Regardless of the items supplied as described, you can also connect
customary antennas and cables to the basic instrument and make
measurements as required.
4.1.2 Basic instrument
The SRM is a field strength meter which can be used for outdoor
measurements, especially in locations where access is difficult or awkward.
The functions of the instrument have therefore been tailored to provide easy
handling under practical conditions of use.
Despite its wide range of functions, the SRM is very handy and light. There
are two ergonomically formed grips located to the left and right of the
casing, which allow secure handling during measurements and trouble-free
access to all controls at the same time.
The main menus are accessed by three menu selection buttons.
Sub-menus, functions and entry boxes within these menus is by means of
softkeys. Function keys allow direct entry of parameters and access to the
evaluation and memory functions.
The large easy-to-read LCD panel is backlit to allow operation even in
poorly-lit areas.
The foil keypad makes operation even under bad conditions safe and sure.
ª All the display and control elements of the basic instrument are
described in sec. 6, page 6-1.
4-2

SRM-3000 4 Instrument concept
4.1.3 Antennas
A three axis antenna is included as standard with your SRM-3000. This
antenna covers the frequency range from 75 MHz to 3 GHz. It automatically
determines the three spatial components of the field being measured, so
isotropic measurements are quick and easy to perform. It is designed for
outdoor use and for making measurements in places that are difficult to
access.
Narda Safety Test Solutions also supplies other single axis and three axis
antennas for electric and magnetic fields that are suitable for other
applications and lower frequency ranges.
Every Narda antenna is equipped with a control cable as well as the RF
connection. The control cable is connected to the basic instrument by a
multi pin connector, and is used to transmit the antenna parameters (type,
serial number, calibration date, list of antenna factors) so that these can be
recognized by the SRM.
Customary types of antenna can also be connected to the basic instrument.
The table below summarizes the types of antenna that are suitable for
measuring field strength exposure:
Type Field type
Broadband
dipole
Log- periodic
antenna
Loop antenna Magnetic field Between 100 kHz and
Table 4-1 Antenna types
measured
Electric field Between 30 MHz and
Electric field Between 30 MHz and
Frequency range
(typical values)
3 GHz
20 GHz
30 MHz
Notes
-
Directional
characteristic.
Not suitable for
isotropic
measurements.
-
4-3

4 Instrument concept SRM-3000
4.1.4 Cable
Narda Safety Test Solutions offers two cables that can be used for the
connection between the antenna and the basic instrument, covering the
frequency range between 100 kHz and 3 GHz. These cables are 1.5 m and
5 m long and contain ferrite to reduce the effects of the external field on the
measurement results. The cables contain a control cable as well as the RF
cable. This is connected to the basic instrument by a multi pin connector.
This control cable transmits the cable parameters (type, serial number,
calibration date, list of attenuation factors) so that these can be recognized
by the SRM. When the three axis antenna is used, the SRM also uses this
cable to control successive measurement of all three axes for an isotropic
result (see sec. 11.1.1, page 11-2), or to select a single axis in order to
obtain directional information (see sec. 11.1.2, page 11-4).
Customary types of cable can also be used for the connection between the
antenna and the basic instrument. However, such cables do not provide the
controller function for three axis antennas.
4.2 SRM as a spectrum analyzer
Although designed for field use, the basic instrument of the SRM can also
be used as a spectrum analyzer under laboratory conditions, for example.
The serial or USB interface can be used to connect the instrument to a PC
and provide access to the instrument functions.
4-4

5 Measurement setup variants
5.1 Variant overview
The measurement setups for using a three axis and a single axis antenna
are shown on the following pages.
ª Measurement setup with three axis antenna: sec. 5.1.1, page 5-2
ª Measurement setup with single axis antenna: sec. 5.1.2, page 5-3
Both variants are considered with regard to their suitability for mobile
applications (pendulum or sweep method) or for use in a precision
measurement (matrix method). The description of possible applications and
the limitations in their use is intended to help you select the right antenna
and measurement method for the type of measurement you want to make.
The two methods (pendulum or sweep method and matrix method) are
described in detail in Appendix A for measurements using a single axis
antenna.
ª Appendix A: Measurement methods using a single axis
antenna: see page A-1
The information in this section too can be of assistance when selecting the
appropriate measurement method. You should in any case familiarize
yourself with the correct procedure for the selected measurement method
before starting measurements.
5-1

5 Measurement setup variants SRM-3000
5.1.1 Measurement setup with a three axis antenna
Mobile measurement Precision measurement
Measurement
method
Measurable
frequency range
Appropriate use • Rapid determination of
Usage limitations • Spatial averaging of
• Manual movement of
antenna within the field
75 MHz to 3 GHz
maximum field strength
within a space
• Locating a maximum
value within a space
where interruptions in
operations are
unacceptable (e.g.
offices)
• Locating a maximum
value in spaces where
high mobility is needed
(e.g. platforms, rooftops)
immissions not possible
• Measurement at various
points within the space
• Sequential positioning of
antenna at various
heights using a tripod
• Exact measurement of a
defined space with the aid
of a tripod
• Spatial averaging of
immissions desirable
(required by some
standards)
• Location of local maxima
• Rapid determination of
maximum values not
possible as a large
number of measurements
have to be made
• Locating a maximum
value within a space
where interruptions in
operations are
unacceptable (e.g.
offices)
• Locating a maximum
value in spaces where
high mobility is needed
(e.g. platforms, rooftops)
• Locations where a tripod
cannot be used (e.g.
platforms, rooftops)
5-2
Table 5-1 Comparison of possible uses of a three axis antenna

SRM-3000 5 Measurement setup variants
5.1.2 Measurement setup with a single axis antenna
Note: The table below refers to customary antenna types. Two main types
are considered:
- broadband dipoles
- loop antennas
Mobile measurement
(pendulum or sweep method)
Measurement
method
Measurable
frequency range
Appropriate use • Rapid determination of
Table 5-2 Comparison of possible uses of a single axis antenna
• Manual movement of
antenna axis within the
field
Depends on the antenna selected
maximum field strength
within a space
• Locating a maximum
value within a space
where interruptions in
operations are
unacceptable (e.g.
offices)
• Locating a maximum
value in spaces where
high mobility is needed
(e.g. platforms, rooftops)
• Adequate experience
required
Precision measurement
(matrix method)
• Measurement at various
points within the space
• Sequential positioning of
antenna on three
orthogonal axes and at
various heights using a
tripod
• Exact measurement of a
defined space with the aid
of a tripod
• Spatial averaging of
immissions desirable
(required by some
standards)
• Location of local maxima
5-3

5 Measurement setup variants SRM-3000
Mobile measurement
(pendulum or sweep method)
Usage limitations • Spatial averaging of
immissions not possible
• Underestimates strongly
elliptically polarized
immissions
• Undefined measurement
uncertainty:
Measurements with single
axis antennas only detect
field components that are
parallel to the antenna
axis.
Even if the field is strong,
there is a danger that only
a weak field or no field at
all will be measured if the
antenna is not correctly
positioned in the field.
Table 5-2 Comparison of possible uses of a single axis antenna
Precision measurement
(matrix method)
• Rapid determination of
maximum values not
possible as a large
number of measurements
have to be made
• Signal does not remain
constant throughout the
measurement
• Locating a maximum
value within a space
where interruptions in
operations are
unacceptable (e.g.
offices)
• Locating a maximum
value in spaces where
high mobility is needed
(e.g. platforms, rooftops)
• Locations where a tripod
cannot be used (e.g.
platforms, rooftops)
5-4

SRM-3000 5 Measurement setup variants
5.2 Assembling the measurement setup
The connecting socket for the antenna is on the top end of the SRM.
12
Fig. 5-1 N type connector RF input socket, 50 Ω (1) and
Note: The multi pin connector is only used with Narda antennas and
multi pin type cable connector (2)
cables.
It has two functions:
• Automatic detection of the connected antenna and / or cable
• Control of three axis antenna for making isotropic measurements
5-5

5 Measurement setup variants SRM-3000
5.3 Fitting the antenna directly on the basic instrument
Connecting a Narda antenna
✓ The SRM is switched off.
1. Stand the basic instrument up vertically.
2. Place the N connector of the antenna over the N connector of the basic
instrument.
3. Carefully screw down the coupling ring of the N connector of the antenna
on to the N connector of the basic instrument taking care not to crossthread it.
Note: If there is resistance when you try to screw down the coupling ring, it
needs to be re-seated. Only about 4 turns are needed to establish a
firm connection.
5-6
Fig. 5-2 Connecting up the N connectors
4. Place the control cable plug of the antenna on the multi pin connector of
the basic instrument so that the red dot on the control cable plug and the
red dot on the multi pin connector are aligned.

SRM-3000 5 Measurement setup variants
5. Press the control cable plug into the connector using the locking sleeve
until the plug lock clicks into place.
Fig. 5-3 Connecting the multi pin connectors
The Narda antenna is now connected.
The instrument will automatically detect the type of antenna that is
connected.
This information will be shown in the general instrument configuration
section of the LCD panel when the instrument is switched on.
Connecting customary antenna types
You will not normally be able to connect customary types of antenna directly
to the basic instrument. You will need to use a connecting cable.
ª Connecting customary antenna types using a cable: see page 5-10
5-7

5 Measurement setup variants SRM-3000
5.4 Using a cable to connect the antenna to the basic instrument
Connecting a Narda cable
A Narda cable is connected in two stages:
• Connect the Narda cable to the SRM
• Connect the Narda cable to the Narda antenna
5-8
Fig. 5-4 Connecting the SRM-3000 and antenna with a cable
Connecting the Narda cable to the SRM
✓ The SRM is switched off.
1. Stand the basic instrument up vertically.
2. Place the N connector of the cable over the N connector of the basic
instrument.

SRM-3000 5 Measurement setup variants
3. Carefully screw down the coupling ring of the N connector of the cable on
to the N connector of the basic instrument taking care not to cross-thread
it.
Note: If there is resistance when you try to screw down the coupling ring, it
needs to be re-seated. Only about 4 turns are needed to establish a
firm connection.
4. Place the control cable plug of the cable on the multi pin connector of the
basic instrument so that the red dot on the control cable plug and the red
dot on the multi pin connector are aligned.
5. Press the control cable plug into the connector using the locking sleeve
until the plug lock clicks into place.
The Narda cable is now connected.
The instrument will automatically detect the type of cable that is
connected.
This information will be shown in the general instrument configuration
section of the LCD panel when the instrument is switched on.
Connecting the Narda cable to the Narda antenna
✓ The SRM is switched off.
1. Place the N connector at the end of the cable over the N connector of the
antenna.
2. Carefully screw down the coupling ring of the N connector at the end of
the cable on to the N connector of the antenna taking care not to crossthread it.
Note: If there is resistance when you try to screw down the coupling ring, it
needs to be re-seated. Only about 4 turns are needed to establish a
firm connection.
3. Place the control cable plug of the antenna on the multi pin connector of
the cable so that the red dot on the control cable plug and the red dot on
the multi pin connector are aligned.
4. Press the control cable plug into the connector using the locking sleeve
until the plug lock clicks into place.
The Narda antenna is now connected.
The instrument will automatically detect the type of antenna that is
connected.
This information will be shown in the general instrument configuration
section of the LCD panel when the instrument is switched on.
5-9

5 Measurement setup variants SRM-3000
Connecting customary antenna types using a cable
✓ The SRM is switched off.
1. Stand the basic instrument up vertically.
2. Place the N connector of the cable over the N connector of the basic
instrument.
3. Carefully screw down the coupling ring of the N connector of the cable on
to the N connector of the basic instrument taking care not to cross-thread
it.
Note: If there is resistance when you try to screw down the coupling ring, it
needs to be re-seated. Only about 4 turns are needed to establish a
firm connection.
4. Place the N connector at the other end of the cable over the N connector
of the antenna.
If the antenna is not equipped with an N connector you will need to use
an adapter.
5. Carefully screw down the coupling ring of the N connector of the cable on
to the N connector of the antenna taking care not to cross-thread it.
Note: If there is resistance when you try to screw down the coupling ring, it
needs to be re-seated.
5-10
SRM-3000 5 Measurement setup variants
5.5 Fitting the Narda antenna to a tripod
Special fittings are needed to attach Narda antennas to a tripod. Narda
provides two different types of antenna holder.
5.5.1 Antenna holder for three axis antennas
This antenna holder can be used to attach the antenna vertically or
horizontally to the tripod. In principle, the orientation has no effect on the
results, since the antenna has three axes. It is still a good idea to align the
antenna head roughly with the probable location of the field source to avoid
any possible side effects.
Assembly
1. Screw the antenna holder horizontally or vertically on to the tripod.
2. Attach the antenna using the Velcro strips.
3. Connect the antenna to the basic instrument using a cable,
see sec. 5.4, page 5-8.
Fig. 5-5 Antenna attached to holder for three axis antennas (3501/90.02),
mounted horizontally and vertically
5-11

5 Measurement setup variants SRM-3000
5.5.2 Antenna holder for single axis and three axis antennas
This holder is used to precisely align the antenna in defined positions.
This serves a dual purpose:
• Single axis antennas can be aligned in three mutually perpendicular
(orthogonal) directions one after the other by simple rotation, allowing
you to make isotropic measurements easily (see sec. 11.2.2, page 11-6)
• three axis antennas can be precisely oriented within a field, allowing you
to measure a specific axis (see sec. 11.1.2, page 11-4).
Assembly
5-12
Fig. 5-6 Single axis E field antenna (top) and single axis H field antenna (bottom)
mounted on the antenna holder for single axis and three axis antennas
(3501/90.01)

SRM-3000 5 Measurement setup variants
1. Screw the antenna holder plate on to the tripod.
2. Screw the antenna holder on to the antenna holder plate.
3. Open the Velcro strips and place the antenna in the holder so that the
N connector and the control cable lie in the groove provided
(see fig. 5-7).
4. Close the Velcro strips.
5. Turn the antenna to the desired position (marked on the antenna holder
plate) and fix it in position with the screw.
6. Connect the antenna to the basic instrument using a cable, see
sec. 5.4, page 5-8
Notice: When removing the antenna from the holder, first slide it a little in
the direction of the antenna head and then remove it from the
holder. This will prevent the black coating from being damaged by
the spacing screws.
Fig. 5-7 Cable and N connector in guide groove
5-13

5 Measurement setup variants SRM-3000
5.6 Registering a non-Narda antenna
Note: Automatic detection of the connected antenna type is not possible if
a customary antenna is used instead of a Narda antenna.
You will need to manually register / select the connected antenna on
the basic instrument in order to display the results in units of field
strength or as a percentage of a selected safety standard. This
requires that the corresponding antenna type has been defined by
the user with the aid of the “SRM-Tools” or “SRM-TS” PC software
supplied and has been saved in the basic instrument. Refer to
sec. 16, page 16-1 for more information.
Registering a non-Narda antenna
✓ The instrument is switched on.
1. Press the CONF button.
The CONFIGURATION menu opens.
2. Select the ANTENNA/SENSOR command.
3. Press the ENT button.
The ANTENNA/SENSOR menu opens.
4. Select the connected antenna type.
5. Press the ENT button.
The antenna type is shown in the general instrument configuration
section of the LCD panel.
5-14

SRM-3000 5 Measurement setup variants
5.7 Registering a non-Narda cable
Note: Automatic detection of the connected cable type is not possible if a
customary cable is used instead of a Narda cable.
You will need to manually register / select the connected cable on
the basic instrument in order to take the cable losses into account in
the results. This requires that the corresponding cable type has been
defined by the user with the aid of the “SRM-Tools” or “SRM-TS”
PC software supplied and has been saved in the basic instrument.
Refer to sec. 16, page 16-1 for more information.
Registering a non-Narda cable
✓ The instrument is switched on.
1. Press the CONF button.
The CONFIGURATION menu opens.
2. Select the CABLE command.
3. Press the ENT button.
The CABLE menu opens.
4. Select the cable type used and press the ENT button to confirm.
The cable type is shown in the general instrument configuration section
of the LCD panel.
5-15

5 Measurement setup variants SRM-3000
Notes:
5-16

6 User interface
7
Fig. 6-1 Display and control elements
No. Element
1
2
3
465
1 Rotary control
2 Softkeys
3 Function keys
4 Menu selection keys
5 On / Off switch
6 Status LED / Charge LED
7 LCD panel
Table 6-1 Display and control elements
6-1

6 User interface SRM-3000
6.1 Control elements
6.1.1 On / Off switch
Key Function
ON/OFF
Table 6-2 On / Off switch
On / Off switch.
• Starts the instrument with the same settings as were active
when it was last switched off.
• Switches the instrument off (press key for longer time).
6.1.2 Menu selection keys
Key Function.
CONF Opens the CONFIGURATION menu.
• Enables:
– Antenna selection.
– Cable selection.
– Standard selection.
– Service table selection.
– Cell name table selection (option).
– Device information display.
– Date and time settings.
– General instrument properties settings.
– “Safety Evaluation” mode configuration.
– “Spectrum Analysis” mode configuration.
– “UMTS P-CPICH Demodulation” mode configuration
(Option).
– “Time Analysis” mode configuration.
MEM Opens the MEMORY menu.
• Enables:
– Display and management of stored results.
– Definition and activation of special memory mode.
– Comment function settings.
MODE Opens the MODE menu.
• Enables operating mode selection.
6-2
Table 6-3 Menu selection keys

SRM-3000 6 User interface
6.1.3 Softkeys
The softkey functions vary according to the menu that is displayed.
The softkeys are operated using the row of keys on the right next to the
display.
6.1.4 Function keys
Note: Numerical entries can be made using either the function keys or the
rotary control. The two functions are mutually exclusive; if you use
the rotary control, the function keys are disabled, and vice versa.
Function key functions
Key Function
ESC / . Cancels an operating sequence.
• Cancels the current operating step; changes in values are also
canceled.
• Enables return to a higher menu level.
Key for entering a decimal point when editing a parameter.
ENT / 1 Confirms entries or activates menus.
• Ends the current operating step and confirms changes in
values.
• Activates sub-menus in the CONFIGURATION menu.
Key for entering the number 1 when editing a parameter.
HOLD / 2 Pauses the measurement.
• Stops the measurement.
(In stopped status you can access display and evaluation
functions but you cannot edit parameters.)
• Resumes the measurement.
Key for entering the number 2 when editing a parameter.
Table 6-4 Function keys
6-3

6 User interface SRM-3000
Key Function
SAVE / 3
(abc)
DISPL / 4
(def)
MARK / 5
(ghi)
EVAL / 6
(jkl)
Saves data sets.
• Saves:
– individual sets of data (spectra, tables)
Key for entering the number 3 when editing a parameter.
Key for entering the characters ABC.
Activates the DISPLAY menu.
• Enables the following in “Spectrum Analysis” mode:
– full screen display
– selection of display scale range
(20 dB, 40 dB, 60 dB, 80 dB, 100 dB)
– selection of the upper limit of the Y axis
– automatic Y axis scaling if the other parameters have been
selected correctly.
• Enables the following display modes in “Safety Evaluation”
mode:
– full screen
– as condensed table (Cond. Table)
• Enables the following display mode in “UMTS P-CPICH
Demodulation” mode (option) and “Time Analysis” mode:
– full screen
Key for entering the number 4 when editing a parameter.
Key for entering the characters DEF.
Activates the “Peak Marker” function.
• Enables the following in “Spectrum Analysis” mode:
– search for highest peak
– search for next peak to the right
– search for next peak to the left
– search for next higher peak
– search for next lower peak
Key for entering the number 5 when editing a parameter.
Key for entering the characters GHI.
Activates the EVALUATION FUNCTION menu.
• Enables the following in “Spectrum Analysis” mode:
– display of a list of the 20 highest peaks
– integration of the results over a selected frequency range
Key for entering the number 6 when editing a parameter.
Key for entering the characters JKL.
6-4
Table 6-4 Function keys

SRM-3000 6 User interface
Key Function
UNIT / 7
(nmo)
AXIS / 8
(pqrs)
ZOOM / 9
(tuv)
SETUP / 0
(wxyz)
Selects the display units.
• Opens a selection menu listing the available units.
Key for entering the number 7 when editing a parameter.
Key for entering the characters NMO.
Activates the MEASUREMENT MODE menu.
• If a three axis Narda antenna is used, enables:
– selection of an isotropic measurement mode
– selection of a measurement axis (X, Y or Z axis)
• If a single axis antenna is used, enables:
– selection of the isotropic measurement method for sequential
measurement of the three spatial components of the field
being measured
Key for entering the number 8 when editing a parameter.
Key for entering the characters PQRS.
Activates the “Zoom” function.
• Enables:
– rapid setting of a new sweep range within the sweep range
just selected in “Spectrum Analysis” mode
Key for entering the number 9 when editing a parameter.
Key for entering the characters TUV.
Activates the SETUP menu.
• Enables:
– saving of user defined setups
– recalling of saved setups
– deletion of saved setups
Key for entering the number 0 when editing a parameter.
Key for entering the characters WXYZ.
Table 6-4 Function keys
6-5

6 User interface SRM-3000
Editing parameters
Opening the numerical value entry box
⇒ Press the softkey that enables editing of a parameter (e.g. Fmin).
The box for entering the numerical value to be changed opens.
Entering the numerical value and units
ª For entry using the rotary control, see sec. 6.1.5, page 6-7.
1. Use the function keys to enter the first digit of the desired numerical
value.
The rotary control is disabled as soon as you have entered the first digit.
The digit you entered will be displayed. The previous value is deleted.
The softkeys will now be labeled with the possible units and the
backspace function.
2. Enter all the remaining digits of the numerical value, using the decimal
point if necessary.
3. Press the softkey that is labeled with the desired units.
The entry box now shows the complete numerical value and units.
Using the BACKSPACE softkey
Incorrect entries can be deleted by pressing the BACKSPACE softkey.
⇒ Press the BACKSPACE softkey.
The unit or digit furthest to the right will be deleted.
6-6
Completing an entry
⇒ Press the ENT key.
The entry box closes.
The values defined are displayed in the “Instrument configuration”
section.
The function keys are enabled.
The softkey functions change.

SRM-3000 6 User interface
6.1.5 Rotary control
Note: Numerical entries can be made using either the function keys or the
rotary control. The two functions are mutually exclusive; if you use
the rotary control, the function keys are disabled, and vice versa.
The first step in setting a parameter determines which method of
entry is selected.
Opening the numerical value entry box
⇒ Press the softkey that enables editing of a parameter (e.g. Fmin).
The box for entering the numerical value to be changed opens.
One digit of the displayed value is shown highlighted. The position of this
digit defines the step width when the rotary control is used to change the
value.
Examples: 100 = step width 100, 100 = step width 10, 100 = step width 1
Using the rotary control
⇒ Turn the rotary control one step to the right.
The original value will increase by one digit corresponding to the current
step width.
The > and < softkeys for changing the step width are activated.
The function keys are disabled.
– or –
⇒ Turn the rotary control one step to the left.
The original value will decrease by one digit corresponding to the current
step width.
The > and < softkeys for changing the step width are activated.
The function keys are disabled.
Changing the step width
⇒ Press the > softkey.
The highlighted digit moves one position to the right.
The step width is reduced by a factor of 10.
– or –
⇒ Press the < softkey.
The highlighted digit moves one position to the left.
The step width is increased by a factor of 10.
6-7

6 User interface SRM-3000
Completing an entry
⇒ Press the ENT key.
The entry box closes.
The values defined are displayed in the “Instrument configuration”
section.
The function keys are enabled.
The softkey functions change.
Note: The rotary control can only change the value of parameters within
the pre-set range limits.
6.1.6 Keys for optimizing the display
Key Function
CONTRAST key.
• Opens the “Adjust contrast” box for setting the display contrast.
BRIGHT key.
• Switches the display backlight on or off.
6-8
Table 6-5 keys for optimizing the display
Setting the display contrast
1. Press the CONTRAST key.
The display contrast is shown as a bar graph.
2. Use the rotary control to adjust the contrast.
3. Press the ENT key.
The contrast is adjusted. The bar graph is no longer displayed.
Switching on the backlight
⇒ Press the BRIGHT key for longer than 2 seconds.
The backlight switches on permanently.
Switching off the backlight
⇒ When the backlight is switched on permanently, press the BRIGHT key.
The backlight switches off.

SRM-3000 6 User interface
6.2 Operating status display
Element State Function
Status LED Green Indicates readiness for use
Red Instrument is being initialized
Error detected
Charge LED Red Battery is being charged
Green Charging cycle has ended
AC Adapter / Charger is still connected to the
instrument
Table 6-6 LED overview
6-9
6 User interface SRM-3000
6.3 LCD panel elements
123
5
4
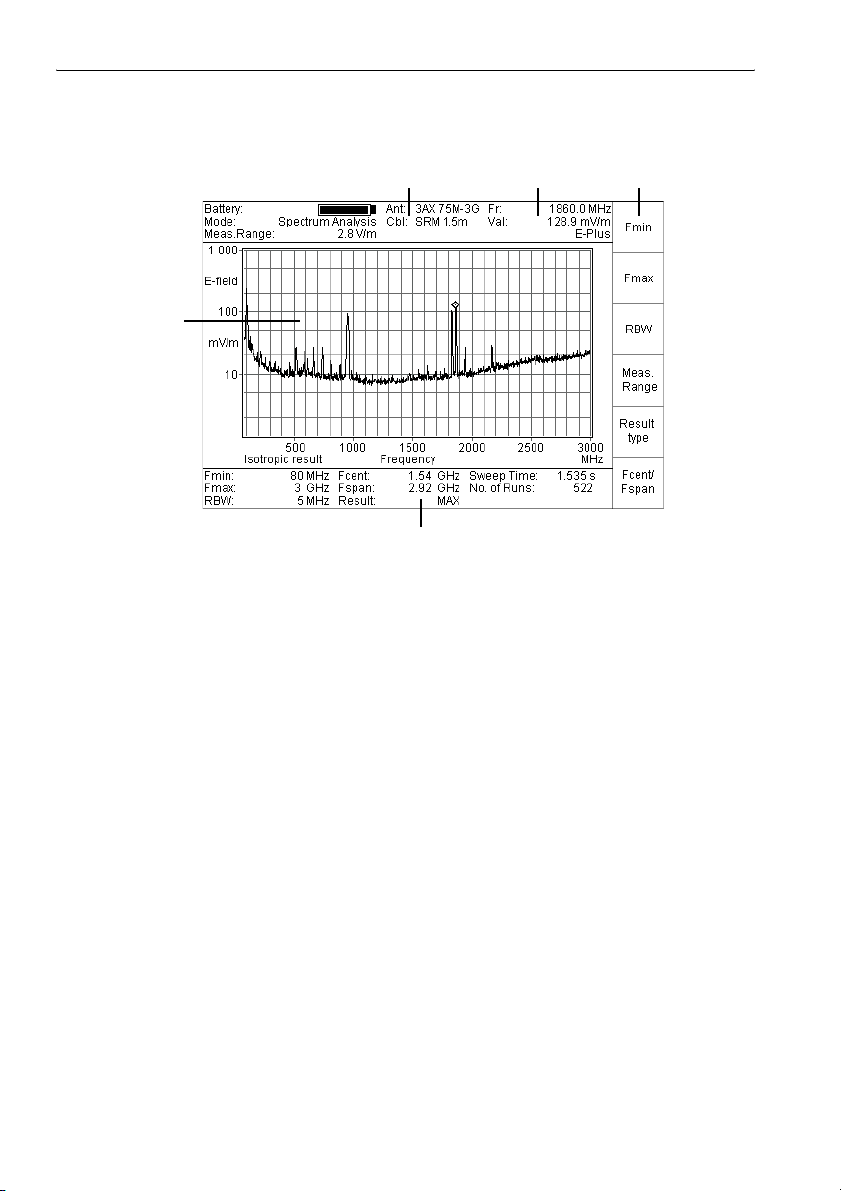
Fig. 6-2 LCD panel in “Spectrum Analysis” mode (example)
6-10

SRM-3000 6 User interface
No. Description
1 General information
The “General information” section gives information about the current
instrument status.
The following data are displayed here:
• type of antenna connected
• type of cable connected
• selected operating mode
• active standard
(if a standard has been activated as reference)
• battery pack charge status
• selected measurement range
2 Evaluation tools
The “Evaluation tools” section indicates the status of the active evaluation
tools, e.g. current position of the marker.
3 Softkeys
The softkey labels change according to the menu that is being displayed. The
softkeys are operated using the row of keys to the right next to the display.
4 Instrument configuration
The “Instrument configuration” section displays the user settings for the
individual operating modes.
5 Measurement data
The measurement result display depends on the operating mode and
evaluation tools that have been selected.
Refer to the sections covering the operating modes for more details.
Table 6-7 Key to LCD panel elements
ª More detailed information about the LCD panel is given in the sections
dealing with the different operating modes.
6-11

6 User interface SRM-3000
6.4 External connectors
There are two sockets on the top side of the SRM-3000. These are for
connecting the antenna and the control cable.
12
Fig. 6-3 Antenna and control cable connector sockets
No. Function
1 Antenna connector socket
• N connector
2 12 pole socket (multi pin connector) for connecting the control cable
• If a Narda antenna or Narda cable is used this socket automatically
detects the antenna and cable.
6-12
Table 6-8 Antenna and control cable connector sockets
On the base of the instrument you will find the battery holder on the left and
three further external connections on the right: USB, serial interface, AC
Adapter / Charger.
123 4
Fig. 6-4 Battery holder and external connectors

SRM-3000 6 User interface
No. Function
1 Battery holder
2 USB interface for connecting to a computer (PC)
3 Serial data interface (RS 232) for connecting to a computer (PC):
• 115 000 Baud
• 8 data bits
• 1 stop bit
• No parity
• Xon / Xoff protocol
4 AC Adapter / Charger connection
• Nominal voltage: 9 V
Table 6-9 Battery holder and external connectors
6-13

6 User interface SRM-3000
Notes:
6-14
7 “Safety Evaluation” mode
7.1 “Safety Evaluation” mode functions
“Safety Evaluation” mode was specially developed for evaluating field
strength exposure in a multi frequency environment. It provides an overview
of exposure values in units of field strength or as a percentage of a selected
safety standard for certain frequency bands or “services”. This makes an
immediate assessment of conformance to defined limit values possible right
at the point of measurement, as well as indicating the contribution made by
frequency bands of interest to the overall exposure level.
The service tables used as the basis for “Safety Evaluation” mode are
defined and transferred to the instrument using the “SRM-Tools” or
“SRM-TS” PC software.
ª Refer to sec. 16, page 16-1 for more information about this.
7.2 Selecting the operating mode
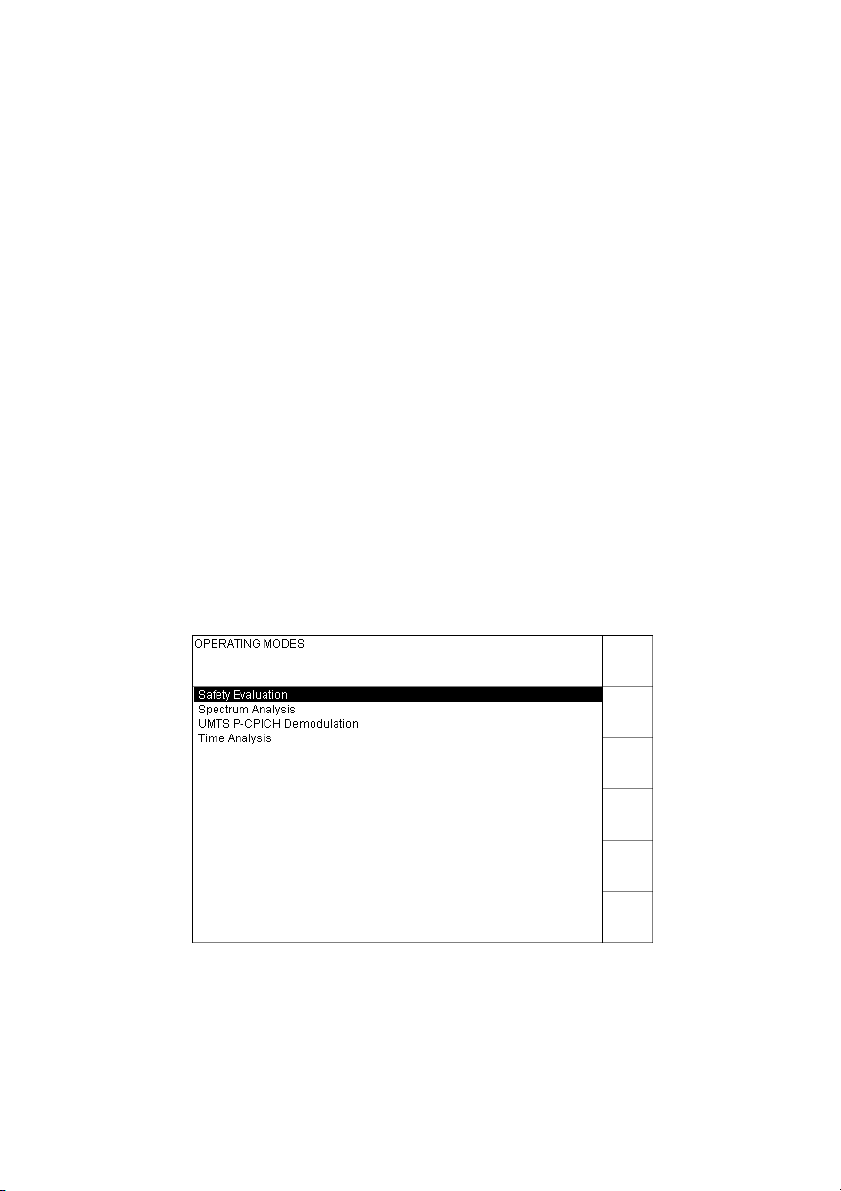
1. Press the MODE button.
The OPERATING MODES menu opens.
Fig. 7-1 OPERATING MODES menu
2. Use the rotary control to highlight “Safety Evaluation”.
7-1

7 “Safety Evaluation” mode SRM-3000
3. Press the ENT button.
The measurement menu for “Safety Evaluation” mode opens.
The softkey functions change.
123
4
8
7
Fig. 7-2 Measurement menu for “Safety Evaluation” mode
No. Description Explanation
1 Operational status:
Battery Battery charge state
Mode Operating mode
Meas. Range Input attenuator setting (input sensitivity)
2 Antenna parameters
Ant Selected / connected antenna
Cbl Selected / connected measurement cable
- Name of service table used
3 - Softkey functions
Table 7-1 Key to “Safety Evaluation” mode measurement menu
6
5
7-2

SRM-3000 7 “Safety Evaluation” mode
No. Description Explanation
4 Table of results (individual results)
5 Total Total result
6 Progress display (rotating bar)
7 Measurement parameters display
Processing Time Time to perform the measurement
No. of Runs Number of times measurement performed
AVG Number of averages.
Result Result type
Fmin Lower frequency limit
Fmax Upper frequency limit
RBW Resolution bandwidth.
8 Isotropic result Measurement type:
Table 7-1 Key to “Safety Evaluation” mode measurement menu
Only displayed for “Result Type” = “AVERAGE” and
“MAX AVERAGE”.
(ACT, MAX, AVERAGE, MAX AVERAGE)
Only displayed if “RBW Automatic” set to OFF in the
CONFIGURATION menu.
X, Y, Z axis measurement or isotropic measurement
7-3

7 “Safety Evaluation” mode SRM-3000
7.3 Selecting the service to be measured
All the frequency bands (or services) that are of interest when assessing
field strength exposure are usually collected together into a so-called
service table. “Safety Evaluation” mode is based on the selection and
activation of such a table. The desired service table is selected using the
CONFIGURATION menu (see sec. 14.6, page 14-7).
Note: If there is no active service table when you select “Safety Evaluation”
mode, a warning message will appear to remind you of this. “Safety
Evaluation” mode cannot be used if there are no service tables
available on the instrument.
If an antenna combined with a cable or an antenna and a separate cable are
used together, only those services which are within the frequency range of
the antenna and / or the cable will be taken into account in “Safety
Evaluation” mode.
“Safety Evaluation” mode provides two methods of further restricting the list
of services to be measured:
• Selection of the first service to be measured in the frequency range
(restricts the list upwards)
• Selection of the last service to be measured in the frequency range
(restricts the list downwards)
7.3.1 Restricting the list of services to be measured using the first service
✓ The “Safety Evaluation” mode measurement menu is displayed.
1. Press the Sel. first service softkey.
The “Select First Service” selection box opens showing the list of first
services to be measured.
2. Use the rotary control to highlight the desired first service to be
measured.
3. Press the ENT button.
The “Measurement parameters” pane of the measurement menu will
display the lower limit frequency of the selected service as the minimum
measurement frequency.
Note: If the newly selected service is after the last service just set in the
table, the list of services to be measured will be reduced to a single
service, i.e. to the service just selected.
7-4

SRM-3000 7 “Safety Evaluation” mode
7.3.2 Restricting the list of services to be measured using the last service
✓ The “Safety Evaluation” mode measurement menu is displayed.
1. Press the Sel. last service softkey.
The “Select Last Service” selection box opens showing the list of last
services to be measured.
2. Use the rotary control to highlight the desired last service to be
measured.
3. Press the ENT button.
The “Measurement parameters” pane of the measurement menu will
display the upper limit frequency of the selected service as the maximum
measurement frequency.
Note: If the newly selected service is before the first service just set in the
table, the list of services to be measured will be reduced to a single
service, i.e. to the service just selected.
7.3.3 Restoring the original list of services to be measured
✓ The “Safety Evaluation” mode measurement menu is displayed.
⇒ Press the Sel. all services softkey.
All the services in the service table are displayed.
7-5

7 “Safety Evaluation” mode SRM-3000
7.4 Setting the measurement range
The system sensitivity depends on the input attenuator setting, which is
determined by the “Measurement Range” parameter. A high measurement
sensitivity avoids any falsification of the results that might occur due to the
intrinsic noise of the device. However, the device must not be overloaded.
Overloading can also be caused by signals that are outside the frequency
range of the services being measured, such as those from a powerful radio
transmitter which might be superimposed on the mobile telephone signals
that you actually want to measure.
For the above reasons, the SRM allows you to
• select the measurement range manually,
• automatically search for the best measurement range,
• apply noise suppression.
The measurement range you select will apply to all operating modes, so you
do not have to set it each time you change from one operating mode to
another.
7.4.1 Setting the measurement range manually
This method can be used if you know the field situation.
1. Press the Meas Range softkey.
The “Set Measurement Range (MR)” selection box opens showing a list
of possible input sensitivities.
2. Use the rotary control to highlight the desired input sensitivity.
3. Press the ENT button.
The selected input sensitivity is set.
7-6

SRM-3000 7 “Safety Evaluation” mode
Fig. 7-3 “Set Measurement Range (MR)” selection box
7.4.2 Search for the best measurement range
This method is best if you do not know the field situation.
1. Press the Meas Range softkey.
The “Set Measurement Range (MR)” selection box opens;
the fourth softkey is labeled MR Search.
2. Press the MR Search softkey.
The message “Searching for best measurement range. Please wait.” is
displayed. The SRM makes a background measurement over the entire
frequency range covered by the antenna you are using. This will take
several seconds. When the measurement is finished, the SRM
automatically sets the measurement range to the best value and
displays the normal measurement menu again.
Note: Press the ESC key if you want to stop the automatic setting process.
ª Selecting the parameters for the measurement range search (Configure
General): see page 14-16
7-7

7 “Safety Evaluation” mode SRM-3000
7.4.3 Using noise suppression (Noise Threshold)
The intrinsic noise of the device is present in all frequency ranges, including
those that are not occupied with payload signals. When you perform a
spectrum analysis and display the results graphically, it is easy to see when
a spectral line disappears into the noise floor. You can set a threshold so
that you can also make this distinction when the results are presented
numerically as in “Safety Evaluation” mode. If the result is below this
threshold level, the device displays the threshold value preceded by the “<”
character (i.e. less than the threshold value) instead of the actual measured
value.
You can set threshold levels of 0, 3, 6, 10, 15 and 20 dB. These values are
relative to the level of the intrinsic noise floor.
Selecting the threshold value for noise suppression
1. Press the CONF key.
The CONFIGURATION menu opens.
2. Use the rotary control to highlight “Configure Safety Evaluation Mode”.
3. Press the ENT key.
The current settings will be displayed.
4. To change the setting, use the rotary control to highlight
“Noise Threshold Factor”.
5. Press the ENT key.
6. Use the rotary control to select a value between 0 and 20 dB.
7-8
Fig. 7-4 CONFIGURATION SAFETY EVALUATION menu;
setting the threshold value for noise suppression
(Noise Threshold Factor)

SRM-3000 7 “Safety Evaluation” mode
7. Press the ENT key.
The threshold value is set.
8. Press the ESC key twice to return to the measurement menu.
Activating and deactivating noise suppression
1. Press the CONF key.
The CONFIGURATION menu opens.
2. Use the rotary control to highlight “Configure Safety Evaluation Mode”.
3. Press the ENT key.
The current settings will be displayed.
4. To change the setting, use the rotary control to highlight
“Noise Threshold”.
5. Press the ENT key.
6. Use the rotary control to select “ON” or “OFF”.
Automatic noise suppression is activated or deactivated.
7. Press the ESC key twice to return to the measurement menu.
When noise suppression is activated, the measurement menu displays
the set threshold value preceded by the “<” character for all numerical
measurement values that are below the threshold value.
7-9

7 “Safety Evaluation” mode SRM-3000
7.5 Selecting the result type
The result type determines how the values recorded are evaluated and
displayed. One value is displayed for each service.
ACT The actual (latest) measured value is displayed.
MAX The maximum measured value is displayed.
AVERAGE The average of the measured values is taken ofer a
specified number of results or a specified time.
The resulting value is displayed.
ª Selecting the averaging parameters: see page 7-11
MAX AVERAGE The maximum of all the averaged values is displayed.
Selecting the result type
1. Press the Result type softkey.
A selection box showing a list of possible result types opens.
If the “Spatial Averaging” option has been activated, the fifth softkey will
be labeled Spatial AVG.
Spatial Averaging in “Time Analysis” mode: see page 12-16
2. Use the rotary control to highlight the desired result type.
3. Press the ENT button.
The selected result type is shown in the “Measurement parameters”
pane of the measurement menu.
7-10

SRM-3000 7 “Safety Evaluation” mode
7.6 Selecting the averaging parameters
The SRM provides two ways of averaging the results:
• Averaging over a specified number of individual results (Number of
Averages)
• Averaging over a specified time (Average Time)
You can set both parameters in the CONFIGURATION menu.
They will be effective only when you select “AVERAGE” or
“MAX AVERAGE” evaluation mode.
Selecting averaging over a specified number of results
(Number of Averages)
1. Press the CONF key.
The CONFIGURATION menu opens.
2. Use the rotary control to highlight “Configure Safety Evaluation Mode”.
3. Press the ENT key.
The current settings will be displayed.
Fig. 7-5 CONFIGURATION SAFETY EVALUATION menu
4. To change the setting, use the rotary control to highlight “Average Type”.
5. Press the ENT key.
6. Use the rotary control to set the command to “Number of Averages”.
7. Press the ENT key.
8. Use the rotary control to highlight “Number of Averages”.
9. Press the ENT key.
7-11

7 “Safety Evaluation” mode SRM-3000
10.Use the rotary control to set the number of averages (between 4 and 64).
11. Press the ENT key.
12.Press the ESC key twice to return to the measurement menu.
The selected averaging parameter is shown in the “Measurement
parameter” pane of the measurement menu.
Selecting averaging over a specified time (Average Time)
1. Press the CONF key.
The CONFIGURATION menu opens.
2. Use the rotary control to highlight “Configure Safety Evaluation Mode”.
3. Press the ENT key.
The current settings will be displayed.
4. To change the setting, use the rotary control to highlight “Average Type”.
5. Press the ENT key.
6. Use the rotary control to set the command to “Average Time”.
7. Press the ENT key.
8. Use the rotary control to highlight “Average Time”.
9. Press the ENT key.
10.Use the rotary control to set the averaging time (between 1 and 30 min).
11. Press the ENT key.
12.Press the ESC key twice to return to the measurement menu.
The selected averaging parameter is shown in the “Measurement
parameter” pane of the measurement menu.
7-12
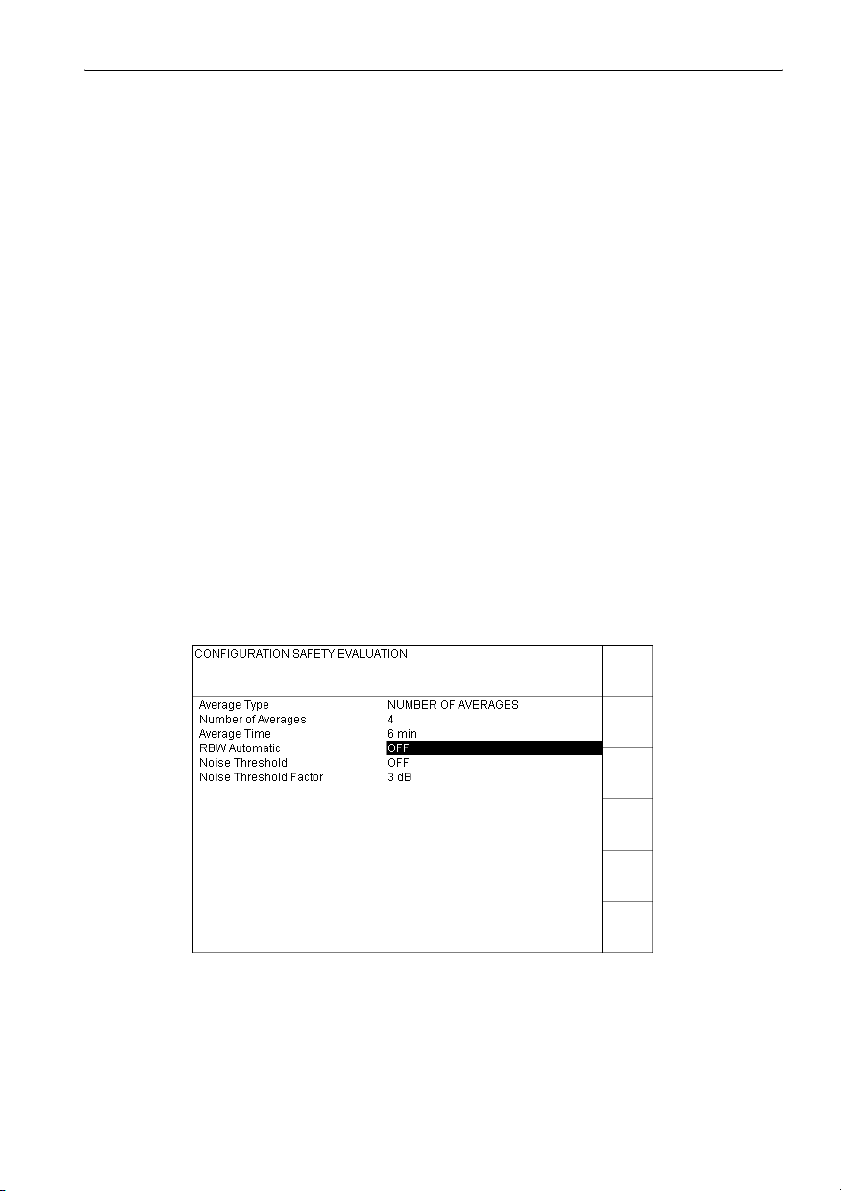
SRM-3000 7 “Safety Evaluation” mode
7.7 Selecting the resolution bandwidth (RBW)
You will not normally need to enter the resolution bandwidth (RBW)
manually in “Safety Evaluation” mode. In the default setting of the SRM
(“RBW Automatic”), the device selects the resolution bandwidth so that the
narrowest band service being measured is resolved finely enough for an
accurate measurement. Nevertheless, you can set the resolution bandwidth
manually. As a rule, the finer the resolution, the longer the measurement will
take.
The actual setting can be seen from the lowermost softkey label:
(no label) RBW Automatic (default setting)
RBW You must enter the resolution bandwidth manually.
Deactivating automatic resolution bandwidth selection in the
CONFIGURATION menu
1. Press the CONF key.
The CONFIGURATION menu opens.
ª Also refer to sec. 14, page 14-1.
2. Use the rotary control to highlight “Configure Safety Evaluation Mode”.
3. Press the ENT key.
The current settings will be displayed.
Fig. 7-6 CONFIGURATION SAFETY EVALUATION menu
7-13

7 “Safety Evaluation” mode SRM-3000
4. To change the setting, use the rotary control to highlight
“RBW Automatic”.
5. Press the ENT key.
6. Use the rotary control to set the command to “OFF”.
7. Press the ENT key.
8. Press the ESC key twice to return to the measurement menu.
The lowermost softkey is now labeled RBW. The selected value is
shown in the “Measurement parameter” pane of the measurement
menu.
Defining the resolution bandwidth in the measurement menu
✓ “RBW Automatic” is set to “OFF” in the CONFIGURATION menu.
✓ The “Safety Evaluation” mode measurement menu is open.
1. Press the RBW softkey.
A selection box showing a list of the possible resolution bandwidths
opens.
2. Use the rotary control to highlight the setting you want.
3. Press the ENT key.
The selected value is shown in the “Measurement parameter” pane of
the measurement menu.
Note: A narrow resolution bandwidth will result in a long measurement
time. You can see that the device is working by looking at the
progress display (rotating bar) in the measurement menu
(see fig. 7-2).
7-14
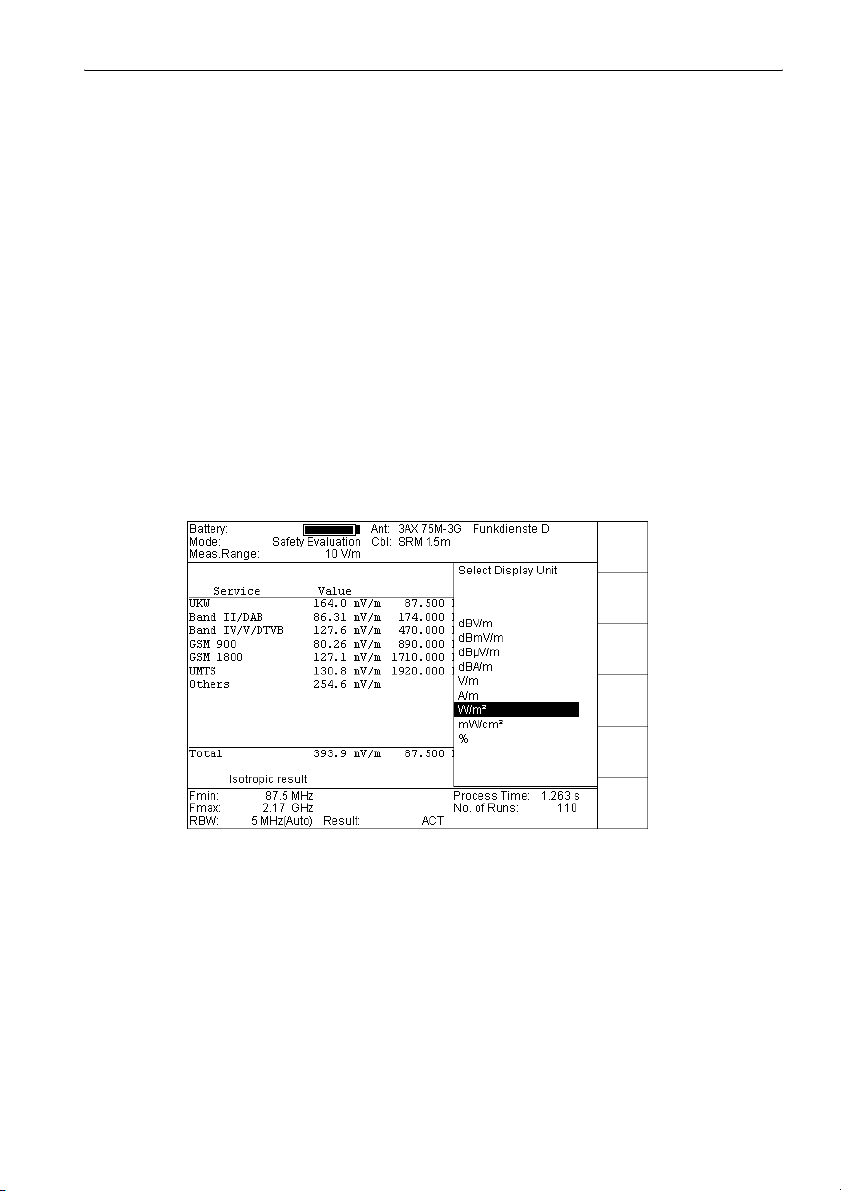
SRM-3000 7 “Safety Evaluation” mode
7.8 Selecting display options
The following display options can be selected:
• Units for the results
• Full screen display of the service table
• Display of results as a detailed table or a condensed table
7.8.1 Selecting the units for the results
✓ “Safety Evaluation” mode is set.
1. Press the UNIT button.
The “Select Display Unit” selection box opens.
2. Use the rotary control to select the desired units.
3. Press the ENT button.
The measurement results will be displayed with the selected units in the
“Safety Evaluation” mode measurement menu.
Fig. 7-7 “Select Display Unit” selection box
Refer to sec. 8.8.1, page 8-14 for a detailed description of the units that can
be set.
7-15
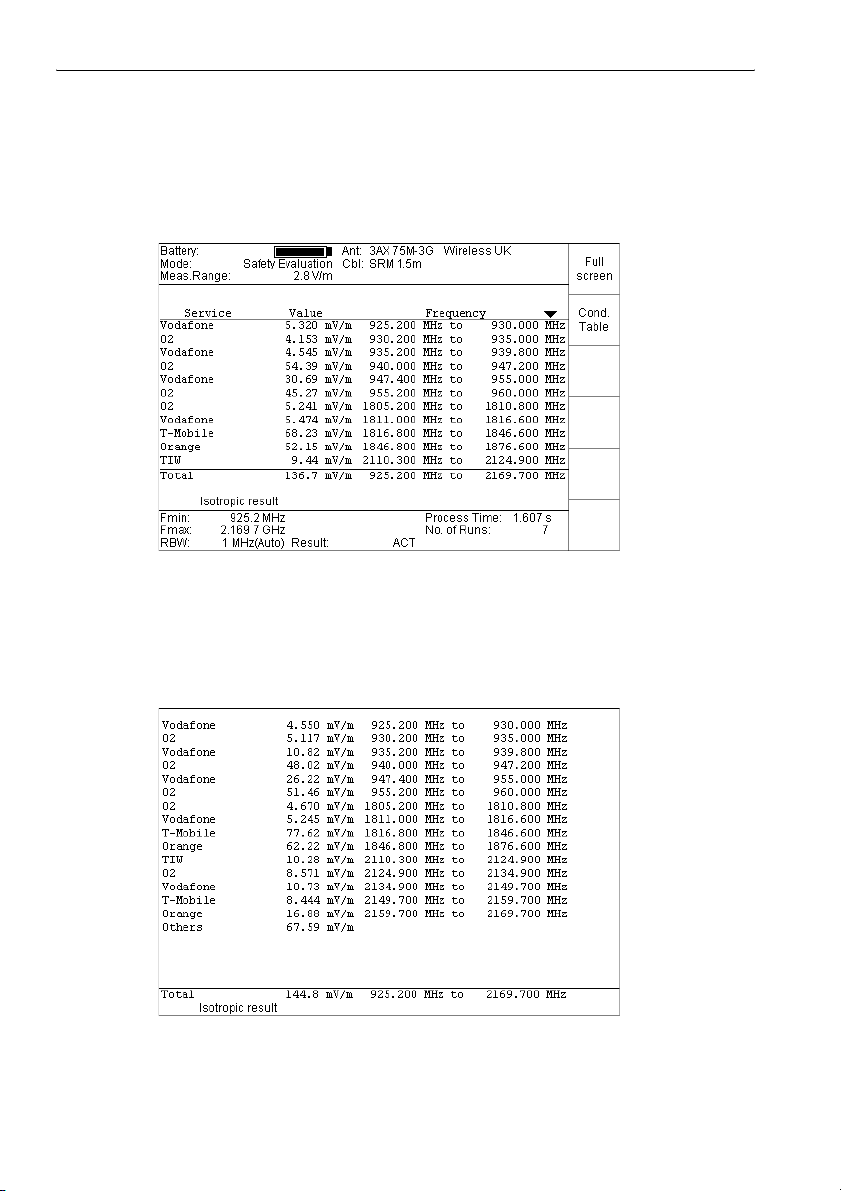
7 “Safety Evaluation” mode SRM-3000
7.8.2 Selecting display options
✓ “Safety Evaluation” mode is set.
⇒ Press the DISPL button.
The softkey functions change.
Fig. 7-8 Softkeys for selecting the display type
Selecting “Full Screen” display
⇒ Press the Full Screen softkey.
The entire display area is used to display the service table.
7-16
Fig. 7-9 “Full Screen” display
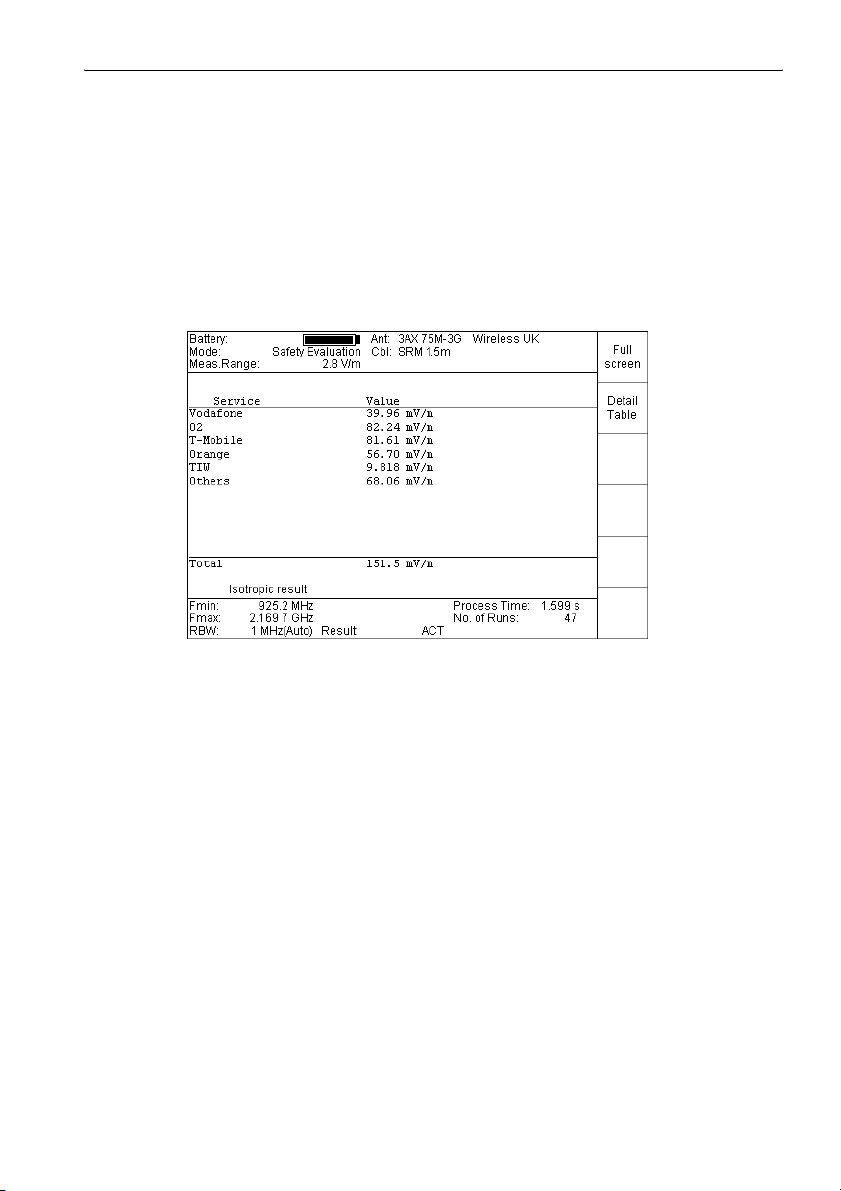
SRM-3000 7 “Safety Evaluation” mode
Displaying the normal size service table (Detailed Table)
⇒ Press any button.
The service table will be displayed normal size again.
Displaying the condensed service table (Condensed Table)
⇒ Press the Cond. Table softkey.
The display switches to the condensed table display.
The softkey function changes to “Detail Table”.
Fig. 7-10 “Cond. Table” display
Displaying the detailed service table (Detailed Table)
⇒ Press the Detail Table softkey.
The display switches to the detailed table display.
The softkey function changes to “Cond. Table”.
7-17

7 “Safety Evaluation” mode SRM-3000
Notes:
7-18

8 “Spectrum Analysis” mode
8.1 Operating mode functions
In “Spectrum Analysis” mode, you can display all the field components in
the selected environment for an overview of the detected spectrum or to
determine maximum values. Complete evaluation of the results can be
performed directly at the measurement site.
8.2 Selecting the operating mode
1. Press the MODE button.
The OPERATING MODES menu opens.
Fig. 8-1 OPERATING MODES menu
2. Use the rotary control to highlight “Spectrum Analysis”.
3. Press the ENT button.
The measurement menu for “Spectrum Analysis” mode opens.
The softkey functions change.
8-1
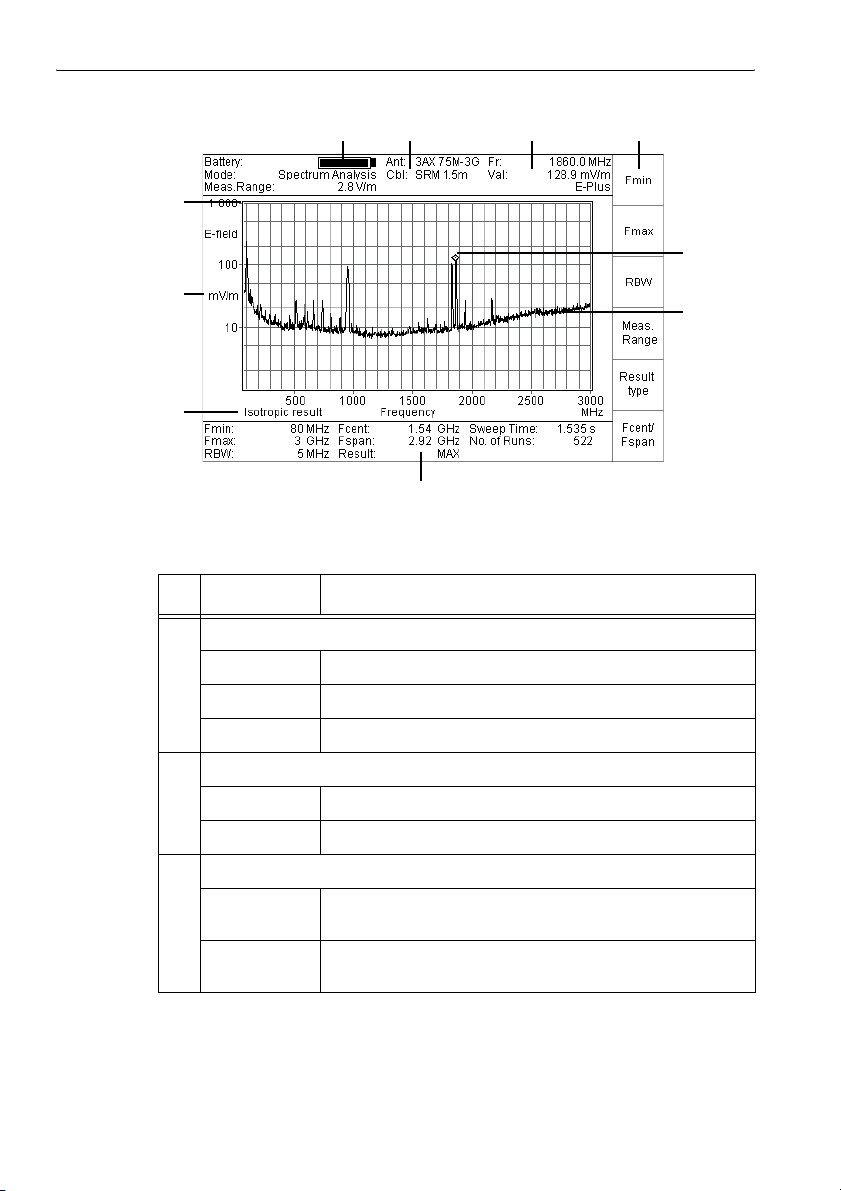
8 “Spectrum Analysis” mode SRM-3000
134
10
9
8
Fig. 8-2 Measurement menu for “Spectrum Analysis” mode
No. Name Description
1 Operating states
Battery Battery charge state
Mode Operating mode
Meas. Range Input attenuator setting (input sensitivity)
2
7
5
6
8-2
2 Antenna parameters
Type Selected / connected antenna
Cbl Selected / connected measurement cable
3 Digital result display
Fr (Pk ...) Frequency display, e.g. for the marker position.
The display depends on the chosen settings.
Val Level value e.g. for the marker position.
The display depends on the chosen settings.
Table 8-1 Key to “Spectrum Analysis” mode measurement menu

SRM-3000 8 “Spectrum Analysis” mode
No. Name Description
4 - Softkey functions
5- Marker
6 Graphic result display (spectrum)
- Frequency spectrum (graphic)
7 Measurement parameters display
Sweep Time Sweep time (the total time of the complete process to
No. of Runs Number of times measurement performed
AVG Number of averages.
Fcent Center frequency
Fspan Frequency span
Result Result type
Fmin Lower frequency limit of spectrum
determine the isotropic result is shown here for three axis
antennas)
Only displayed for “Trace Type” = “AVERAGE” and “MAX
AVERAGE”.
Fmax Upper frequency limit of spectrum
RBW Resolution bandwidth
8 Isotropic result Display of measurement type:
X, Y, Z axis measurement or isotropic measurement
9 mV/m (dBV ...) Y axis scale units
- X axis scale
10 - Reference line, reference point
Table 8-1 Key to “Spectrum Analysis” mode measurement menu
8-3

8 “Spectrum Analysis” mode SRM-3000
8.3 Selecting the frequency range
There are two ways to set the frequency range in “Spectrum Analysis”
mode:
• By entering the upper and lower frequencies
• By entering the center frequency and frequency span
8.3.1 Selecting the frequency range entry method
The lowermost softkey in the “Spectrum Analysis” mode measurement
menu toggles between the functions “Fmin/Fmax” and “Fcent/Fspan”.
• If the toggle function shown is “Fcent/Fspan”, the first two softkeys have
the functions “Fmin” and “Fmax”. The frequency range is defined by
setting the upper and lower frequencies.
• If the toggle function shown is “Fmin/Fmax”, the first two softkeys have
the functions “Fcent” and “Fspan”. The frequency range is defined by
setting the center frequency and frequency span.
Note: Both pairs of values are always displayed in the “Measurement
parameters” pane of the measurement menu. The display
automatically adjusts to the last frequency range defined.
8.3.2 Defining the frequency range by upper and lower frequencies
✓ The toggle key function is “Fcent/Fspan”.
1. Press the Fmin softkey.
An entry box opens where you can enter the value of the lower frequency
limit.
2. Enter the value using the function keys or the rotary control.
As soon as the first digit is entered, the softkey functions change to show
the possible units.
8-4

SRM-3000 8 “Spectrum Analysis” mode
Fig. 8-3 “Set Fmin” entry box
3. Use the appropriate softkey to enter the units.
4. Press the ENT button.
The lower frequency limit you defined will be displayed in the
“Measurement parameters” pane of the measurement menu.
5. Press the Fmax softkey and enter the upper frequency limit in the same
way.
The display frequency axis automatically adjusts to the selected
frequency range.
The upper frequency limit you defined will be displayed in the
“Measurement parameters” pane of the measurement menu. The values
of Fcent and Fspan are also adjusted to match your entries and now
correspond to the defined frequency range.
8-5

8 “Spectrum Analysis” mode SRM-3000
8.3.3 Defining the frequency range by center frequency and frequency span
✓ The toggle key function is “Fmin/Fmax”.
1. Press the Fcent softkey.
An entry box opens where you can enter the value of the frequency that
is to be at the center of the desired frequency sweep range.
2. Enter the value using the function keys or the rotary control.
As soon as the first digit is entered, the softkey functions change to show
the possible units.
8-6
Fig. 8-4 “Set Fcent” entry box
3. Use the appropriate softkey to enter the units.
4. Press the ENT button.
The center frequency you defined will be displayed in the “Measurement
parameters” pane of the measurement menu.
5. Press the Fspan softkey and enter the value in the same way for the
frequency band to be examined by the spectrum analyzer.
The display frequency axis automatically adjusts to the selected
frequency range.
The frequency span you defined will be displayed in the “Measurement
parameters” pane of the measurement menu. The values of “Fmin” and
“Fmax” are also adjusted to match your entries and now correspond to
the defined frequency range.

SRM-3000 8 “Spectrum Analysis” mode
8.4 Setting the resolution bandwidth (RBW)
The resolution bandwidth (RBW) characterizes the selectivity of the
spectrum analyzer in respect of signals having the same amplitude. Only
signals which are separated by a frequency greater than the defined
resolution bandwidth can be distinguished from one another.
Tip: An appropriately small value of RBW must be selected for signals that
are very closely spaced in frequency. A larger resolution bandwidth
can be selected for broadband signals.
Setting methods
The SRM-3000 can automatically define a suitable resolution bandwidth
dependent on the selected frequency span. Two options for this are
provided in the CONFIGURATION menu:
FAST SWEEP The RBW is set so that the optimum sweep time
can be achieved.
HIGH RESOLUTION The RBW is set so that the highest resolution can
be achieved.
You can alternatively set the resolution bandwidth directly from a range of
preset values. This option is available when the setting “OFF” is selected in
the CONFIGURATION menu.
ª The criteria governing the resolution bandwidths available for the
currently selected frequency span are explained in Appendix B.
Activating automatic resolution bandwidth selection in the
CONFIGURATION menu
1. Press the CONF button.
The CONFIGURATION menu opens.
ª Also refer to sec. 14, page 14-1.
2. Use the rotary control to highlight “Configure Spectrum Analysis Mode”.
3. Press the ENT button.
4. Use the rotary control to highlight “RBW Automatic”.
5. Press the ENT button.
The current setting will be highlighted.
8-7

8 “Spectrum Analysis” mode SRM-3000
6. Use the rotary control to highlight “FAST SWEEP” or “HIGH
RESOLUTION”.
Fig. 8-5 CONFIGURATION SPECTRUM ANALYSIS (RBW Automatic) menu
7. Press the ENT button.
8. Return to the measurement menu of “Spectrum Analysis” mode by
pressing the MODE button and selecting “Spectrum Analysis”.
Automatic resolution bandwidth selection is activated.
The RBW softkey is no longer displayed.
8-8
Defining the resolution bandwidth in the measurement menu
✓ “RBW Automatic” in the CONFIGURATION menu is set to “OFF”.
✓ The “Spectrum Analysis” mode measurement menu is open.
1. Press the RBW softkey.
A selection box opens showing a list of possible resolution bandwidths.
2. Use the rotary control to highlight the desired setting.
3. Press the ENT button.
The selected value will be shown in the “Measurement parameters” pane
of the measurement menu.
The spectrum is re-drawn using the RBW.

SRM-3000 8 “Spectrum Analysis” mode
8.5 Setting the measurement range
The system sensitivity depends on the input attenuator setting, which is
determined by the “Measurement Range” parameter. A high measurement
sensitivity avoids any falsification of the results that might occur due to the
intrinsic noise of the device. However, the device must not be overloaded.
Overloading can also be caused by signals that are outside the set
frequency range, such as those from powerful UHF and VHF broadcast
transmitters.
For the above reasons, the SRM allows you to
• select the measurement range manually,
• automatically search for the best measurement range.
Note: The measurement range you select will apply to all operating modes,
so you do not have to set it each time you change from one operating
mode to another.
8.5.1 Setting the measurement range manually
This method can be used if you know the field situation.
1. Press the Meas Range softkey.
The “Set Measurement Range (MR)” selection box opens showing a list
of possible input sensitivities.
2. Use the rotary control to highlight the desired input sensitivity.
3. Press the ENT button.
The selected input sensitivity is set.
8-9
8 “Spectrum Analysis” mode SRM-3000
Fig. 8-6 “Set Measurement Range (MR)” selection box
8.5.2 Search for the best measurement range
This method is best if you do not know the field situation.
1. Press the Meas Range softkey.
The “Set Measurement Range (MR)” selection box opens;
the fourth softkey is labeled MR Search.
2. Press the MR Search softkey.
The message “Searching for best measurement range. Please wait.” is
displayed. The SRM makes a background measurement over the entire
frequency range covered by the antenna you are using. This will take
several seconds. When the measurement is finished, the SRM
automatically sets the measurement range to the best value and
displays the normal measurement menu again.
Note: Press the ESC key if you want to stop the automatic setting process.
ª Selecting the parameters for the measurement range search (Configure
General): see page 14-16
8-10

SRM-3000 8 “Spectrum Analysis” mode
8.6 Selecting the result type
The result type defines how the values recorded are displayed.
ACT The rms value of the current (actual) spectral line is
displayed.
MAX The maximum value occurring for all spectral lines since
activation of MAX trace type is displayed.
AVERAGE The average of the measured values is taken over a
specified number of results or a specified time.
The resulting value is displayed.
ª Selecting the averaging parameters: see page 8-12
MAX AVERAGE The maximum value of all the averaged spectra is
displayed.
Selecting the result type
1. Press the Result type softkey.
The “Select Result Type” selection box opens showing a list of possible
result types.
If the “Spatial Averaging” option has been activated, the fifth softkey will
be labeled Spatial AVG.
Spatial Averaging in “Spectrum Analysis” mode: see page 12-14
2. Use the rotary control to highlight the desired result type.
3. Press the ENT button.
The selected result type is shown in the “Measurement parameters”
pane of the measurement menu.
8-11

8 “Spectrum Analysis” mode SRM-3000
8.7 Selecting the averaging parameters
The SRM provides two ways of averaging the results:
• Averaging over a specified number of individual results (Number of
Averages)
• Averaging over a specified time (Average Time)
You can set both parameters in the CONFIGURATION menu.
They will be effective only when you select “AVERAGE” or
“MAX AVERAGE” evaluation mode.
Selecting averaging over a specified number of results
(Number of Averages)
1. Press the CONF key.
The CONFIGURATION menu opens.
2. Use the rotary control to highlight “Configure Spectrum Analysis Mode”.
3. Press the ENT key.
The current settings will be displayed.
4. To change the setting, use the rotary control to highlight “Average Type”.
5. Press the ENT key.
6. Use the rotary control to set the command to “Number of Averages”.
7. Press the ENT key.
8. Use the rotary control to highlight “Number of Averages”.
9. Press the ENT key.
10.Use the rotary control to set the number of averages (between 4 and 64).
11. Press the ENT key.
12.Press the ESC key twice to return to the measurement menu.
The selected averaging parameter is shown in the “Measurement
parameter” pane of the measurement menu.
8-12
Selecting averaging over a specified time (Average Time)
1. Press the CONF key.
The CONFIGURATION menu opens.
2. Use the rotary control to highlight “Configure Spectrum Analysis Mode”.
3. Press the ENT key.
The current settings will be displayed.
4. To change the setting, use the rotary control to highlight “Average Type”.
5. Press the ENT key.
6. Use the rotary control to set the command to “Average Time”.
SRM-3000 8 “Spectrum Analysis” mode
Fig. 8-7 CONFIGURATION SPECTRUM ANALYSIS menu
7. Press the ENT key.
8. Use the rotary control to highlight “Average Time”.
9. Press the ENT key.
10.Use the rotary control to set the averaging time (between 1 and 30 min).
11. Press the ENT key.
12.Press the ESC key twice to return to the measurement menu.
The selected averaging parameter is shown in the “Measurement
parameter” pane of the measurement menu.
8-13

8 “Spectrum Analysis” mode SRM-3000
8.8 Selecting the display
This section describes how to optimize the display of measurement results
in “Spectrum Analysis” mode.
8.8.1 Selecting the units
The Y axis units are selected using the UNIT button.
The following power and voltage units are available if an antenna is not
connected or selected:
dBm Power level referred to 1 mW
dBV Voltage level referred to 1 V
dBmV Voltage level referred to 1 mV
dBµV Voltage level referred to 1 µV
The following units are available if an antenna is connected or selected:
V/m Electric field strength
(calculated using the characteristic impedance of a vacuum
Zo = 377 Ω if not measured directly)
A/m Magnetic field strength
(calculated using the characteristic impedance of a vacuum
Zo = 377 Ω if not measured directly)
dBV/m Electric field strength
(expressed logarithmically, referred to 1 V/m)
dBmV/m Electric field strength
(expressed logarithmically, referred to 1 mV/m)
dBµV/m Electric field strength
(expressed logarithmically, referred to 1 µV/m)
dBA/m Magnetic field strength
(expressed logarithmically, referred to 1 A/m)
2
W/m
mW/cm
% % referred to a selected safety standard
Power density
(calculated using the characteristic impedance of a vacuum
Zo = 377 Ω)
2
Power density
(calculated using the characteristic impedance of a vacuum
Zo = 377 Ω)
8-14
SRM-3000 8 “Spectrum Analysis” mode
✓ “Spectrum Analysis” mode is set.
1. Press the UNIT button.
The “Select Display Unit” selection box opens showing a list of available
units.
Fig. 8-8 “Select Display Unit” selection box
2. Use the rotary control to highlight the desired units.
3. Press the ENT button.
The measurement results will be displayed with the selected units in the
“Spectrum Analysis” mode measurement menu.
8-15

8 “Spectrum Analysis” mode SRM-3000
8.8.2 Selecting the display mode and scaling
The display mode (full screen), scaling and the Y axis reference value are
set using the DISPL button.
✓ “Spectrum Analysis” mode is set.
⇒ Press the DISPL button.
The softkey functions change.
Fig. 8-9 Softkeys for selecting the display mode and scaling
8-16

SRM-3000 8 “Spectrum Analysis” mode
Selecting the display mode
⇒ Press the Full Screen softkey.
The entire display area is used to display the spectrum.
Fig. 8-10 “Full Screen” display mode
Displaying the spectrum in normal size
⇒ Press any button.
The display mode reverts to the normal size spectrum display.
8-17

8 “Spectrum Analysis” mode SRM-3000
Selecting the Y axis scaling
✓ The DISPL button has been pressed.
✓ The corresponding softkeys are displayed.
1. Press the Y-Scale Range softkey.
The “Select Y-Scale Range” selection box opens.
Fig. 8-11 “Select Y-Scale Range” selection box
8-18
2. Use the rotary control to highlight the desired value.
3. Press the ENT button.
The Y axis will be displayed with the selected scale range in the
“Spectrum Analysis” mode measurement menu.
Selecting the Y axis reference point
✓ The DISPL button has been pressed.
✓ The corresponding softkeys are displayed.
1. Press the Y-Scale Ref softkey.
The “Select Y-Scale Reference” selection box is displayed.
The Auto softkey is displayed.

SRM-3000 8 “Spectrum Analysis” mode
Fig. 8-12 “Select Y-Scale Reference” selection box
2. Use the rotary control to highlight the desired value.
3. Press the ENT button.
The Y axis reference point is set to the selected value in the “Spectrum
Analysis” mode measurement menu.
Note: The reference value is shown in the selected units.
Selecting the reference value automatically
✓ The “Select Y-Scale Reference”selection box is displayed.
✓ The Auto softkey is displayed.
⇒ Press the Auto softkey.
The Y-axis reference value is the same as the measurement range.
The Y-axis reference adjusts automatically when you change the
measurement range.
The selection box closes.
8-19

8 “Spectrum Analysis” mode SRM-3000
8.8.3 Rapidly changing the frequency span (Zoom function)
Zoom functions are provided to allow rapid alteration in the frequency span.
An area of interest within the selected frequency span is marked and the
upper and lower frequency limits of the marked frequency range are then
set as the limits of the new frequency span.
Note: Executing this function starts a new measurement. New
measurement parameter values may also be set automatically, e.g.
a new resolution bandwidth.
The individual settings are described in the sections below.
✓ “Spectrum Analysis” mode is set.
⇒ Press the ZOOM button.
The softkey functions change.
The zoom area is defined by two vertical lines on the display. The
frequencies at the line positions are shown as Zmin and Zmax in the
measurement menu. Zcent is the frequency at the center of the zoom
area.
8-20
Fig. 8-13 Softkeys for selecting the zoom settings
 Loading...