

Page 1

User Manual
Version 2018-9b
Page 2

Page 3

Table of Contents
Quick Start ..............................................................................11
Connecting to power supply system ....................................................................................... 11
Connecting antenna ............................................................................................................... 11
Connecting the handle to the device ................................................................................. 11
Connecting the antenna to the handle ............................................................................... 12
Switching the device on .......................................................................................................... 12
Screen Details ........................................................................................................................ 13
Touchscreen Functions .......................................................................................................... 14
Touch gestures .................................................................................................................. 14
Locking the touchscreen .................................................................................................... 14
Button bar .......................................................................................................................... 14
Types of buttons in the button bar ..................................................................................... 14
Introduction .............................................................................17
About the SignalShark user documentation ........................................................................... 17
About this device .................................................................................................................... 18
The Real Time Spectrum Analyzer .................................................................................... 18
The Monitoring Receiver .................................................................................................... 19
The RF Direction Finding & Localization System .............................................................. 20
Features ................................................................................................................................. 20
RF parameters ................................................................................................................... 21
Display ............................................................................................................................... 21
Connectivity ....................................................................................................................... 21
Power supply ..................................................................................................................... 21
Overview of options ................................................................................................................ 21
Antenna handle ...................................................................................................................... 22
Narda directional antennas .................................................................................................... 23
About this online help ............................................................................................................. 25
User interface language ..................................................................................................... 25
Typographical conventions ................................................................................................ 25
Control elements ................................................................................................................ 25
User actions ....................................................................................................................... 26
3
Page 4

SignalShark User Manual
Device Overview .....................................................................27
Display and control panels ..................................................................................................... 27
Top side panel with connectors .............................................................................................. 28
Left side with battery compartment ........................................................................................ 29
Bottom side panel with connectors ......................................................................................... 29
Connecting Antennas and Cables ........................................31
Connecting Narda Directional Antennas ................................................................................ 31
Connecting the handle to the device ................................................................................. 31
Connecting the antenna to the handle ............................................................................... 32
Connecting non-directional Narda antennas .......................................................................... 32
Connecting a Narda antenna directly to the device ........................................................... 32
Connecting a Narda antenna to the device using a Narda cable ...................................... 33
Connecting cables and antennas from other manufacturers .................................................. 34
Connecting cables and antennas directly to the device ..................................................... 34
Connecting third party antennas to the handle .................................................................. 34
Basic Operation ......................................................................37
Operation from battery ........................................................................................................... 37
Battery indicators ............................................................................................................... 37
Charging the batteries ....................................................................................................... 38
Changing the batteries ........................................................................................................... 38
Hot swappable features ..................................................................................................... 38
Operation from AC adapter / charger ..................................................................................... 39
Keypad and keyboard ............................................................................................................ 39
Integrated keypad .............................................................................................................. 39
External USB keyboard ..................................................................................................... 39
Switching the device on and off .............................................................................................. 40
Touchscreen control ............................................................................................................... 41
Displaying detailed system information .................................................................................. 42
Changing general settings ...................................................................................................... 43
Creating a screenshot ............................................................................................................ 43
Using Tasks and Views .......................................................................................................... 44
Tasks ................................................................................................................................. 44
Views ................................................................................................................................. 45
Managing tasks and views ................................................................................................. 46
4
Page 5

Quick Start
Screen Overview.....................................................................49
System information area ........................................................................................................ 50
Progress bar ...................................................................................................................... 51
Toolbar ................................................................................................................................... 51
Button bar ............................................................................................................................... 52
Types of buttons in the button bar ..................................................................................... 52
Measurement info bar ............................................................................................................ 54
Measurement settings ....................................................................................................... 54
Status of running measurement ......................................................................................... 54
Using Markers .........................................................................55
Setting markers individually .................................................................................................... 56
Using the Marker Configuration menu .................................................................................... 57
Using the Marker Configuration menu ............................................................................... 57
Markers button bar ............................................................................................................. 57
Markers .............................................................................................................................. 58
FXD Marker ....................................................................................................................... 59
Search ............................................................................................................................... 59
Functions ........................................................................................................................... 60
Working with delta markers ............................................................................................... 61
Spectrum View ........................................................................63
Available Buttons .................................................................................................................... 63
Setting the reference level / attenuation value (Ref. Level / Attenuator) ................................ 64
Setting the reference level (Ref. Level) ............................................................................. 64
Setting the attenuator value (Attenuator) ........................................................................... 65
Settings in the context menu ............................................................................................. 65
Setting the measurement frequency (Fcent / Fspan, Fstart / Fstop) ...................................... 66
Selecting the entry mode (Entry Mode) ............................................................................. 66
If Entry Mode is set to Fcent .............................................................................................. 66
If Entry Mode is set to Fstart .............................................................................................. 66
Setting the resolution / EMC bandwidth (RBW / EBW) .......................................................... 67
Selecting the filter type ...................................................................................................... 67
Setting the resolution / EMC bandwidth (RBW / EBW) ...................................................... 68
Settings in the context menu ............................................................................................. 68
Setting the measurement time (Meas. Time) ......................................................................... 69
Configuring the measurement performance (Config) ............................................................. 69
Setting the number of measurements (Scan. No) ............................................................. 69
Setting the measurement sequence (Seq Mode) .............................................................. 69
Defining the stop behavior (Stop Mode) ............................................................................ 70
5
Page 6

SignalShark User Manual
Selecting traces (Traces) ....................................................................................................... 70
Changing general display settings (Display) .......................................................................... 71
Lmax .................................................................................................................................. 72
Lrange................................................................................................................................ 73
Normal Range .................................................................................................................... 73
Unit .................................................................................................................................... 73
Level Meter View.....................................................................75
Available buttons .................................................................................................................... 75
Setting the reference level / attenuation value (Ref. Level / Attenuator) ................................ 76
Setting the reference level (Ref. Level) ............................................................................. 76
Setting the attenuator value (Attenuator) ........................................................................... 77
Settings in the context menu ............................................................................................. 77
Setting the tuner frequency (Ftune) ........................................................................................ 78
Setting the tuner frequency (Ftune) ................................................................................... 78
Setting the step width (Fstep) ............................................................................................ 78
Setting the channel / EMC bandwidth (CBW / EBW) ............................................................. 78
Selecting a filter type ......................................................................................................... 79
Setting the resolution / EMC bandwidth (RBW / EBW) ...................................................... 79
Enabling/disabling oversampling (CBW only) .................................................................... 79
Setting the video time (Tvideo) ............................................................................................... 79
Setting the measurement time (Meas. Time) ......................................................................... 79
Configuring the measurement performance (Config) ............................................................. 80
Setting the number of measurements (Scan. No) ............................................................. 80
Setting the measurement sequence (Seq Mode) .............................................................. 80
Defining the stop behavior (Stop Mode) ............................................................................ 80
Setting the detectors (Detectors) ............................................................................................ 81
Detector 1, Detector 2, Detector 3 ..................................................................................... 81
Persistence ........................................................................................................................ 81
Changing display settings (Display and Tone) ....................................................................... 81
Changing display settings .................................................................................................. 82
Using tone search (Display and Tone) ................................................................................... 84
Persistence View ....................................................................85
Available buttons ............................................................................................................... 85
Setting the reference level / attenuation value (Ref. Level / Attenuator) ................................ 86
Setting the reference level (Ref. Level) ............................................................................. 86
Setting the attenuator value (Attenuator) ........................................................................... 87
Settings in the context menu ............................................................................................. 87
6
Page 7

Quick Start
Setting the measurement frequency (Fcent / Fspan, Fstart / Fstop) ..................................... 88
Selecting the entry mode (Entry Mode) ............................................................................. 88
If Entry Mode is set to Fcent .............................................................................................. 88
If Entry Mode is set to Fstart .............................................................................................. 88
Setting the resolution / EMC bandwidth (RBW / EBW) ......................................................... 89
Selecting the filter type ...................................................................................................... 89
Setting the resolution / EMC bandwidth (RBW / EBW) ...................................................... 90
Settings in the context menu ............................................................................................. 90
Setting the measurement time (Meas. Time) ......................................................................... 90
Configuring the measurement performance (Config) ............................................................. 91
Selecting the persistence type (Pers. Type) ...................................................................... 91
Setting the number of measurements (Scan. No) ............................................................. 91
Setting the measurement sequence (Seq Mode) .............................................................. 91
Defining the stop behavior (Stop Mode) ............................................................................ 91
Changing the general display settings ................................................................................... 92
Lmax .................................................................................................................................. 92
Lrange................................................................................................................................ 93
Normal Range .................................................................................................................... 93
Unit .................................................................................................................................... 93
Max. Probability / Min. Probability ...................................................................................... 93
Limits ................................................................................................................................. 94
Spectrogram View ..................................................................95
Available buttons ............................................................................................................... 95
Setting the reference level / attenuation value (Ref. Level / Attenuator) ................................ 96
Setting the reference level (Ref. Level) ............................................................................. 96
Setting the attenuator value (Attenuator) ........................................................................... 97
Settings in the context menu ............................................................................................. 97
Setting the measurement frequency (Fcent / Fspan, Fstart / Fstop) ...................................... 98
Selecting the entry mode (Entry Mode) ............................................................................. 98
If Entry Mode is set to Fcent .............................................................................................. 98
If Entry Mode is set to Fstart .............................................................................................. 98
Setting the resolution / EMC bandwidth (RBW / EBW) ......................................................... 99
Selecting the filter type ...................................................................................................... 99
Setting the resolution / EMC bandwidth (RBW / EBW) .................................................... 100
Settings in the context menu ........................................................................................... 100
Setting the measurement time (Meas. Time) ....................................................................... 100
Configuring the measurement performance (Config) ........................................................... 101
Setting the number of spectrogram frames (Sgram Frames) .......................................... 101
Setting the number of measurements (Scan. No) ........................................................... 101
Setting the measurement sequence (Seq Mode) ............................................................ 101
7
Page 8

SignalShark User Manual
Defining the stop behavior (Stop Mode) .......................................................................... 101
Setting the detectors (Detectors) .......................................................................................... 102
Changing general display settings (Display) ........................................................................ 103
Lmax ................................................................................................................................ 103
Lrange.............................................................................................................................. 104
Normal Range .................................................................................................................. 104
Unit .................................................................................................................................. 104
Peak Table View....................................................................105
Available buttons ............................................................................................................. 105
Setting the reference level / attenuation value (Ref. Level / Attenuator) .............................. 106
Setting the reference level (Ref. Level) ........................................................................... 106
Setting the attenuator value (Attenuator) ......................................................................... 107
Settings in the context menu ........................................................................................... 107
Setting the measurement frequency (Fcent / Fspan, Fstart / Fstop) ................................... 108
Selecting the entry mode (Entry Mode) ........................................................................... 108
If Entry Mode is set to Fcent ............................................................................................ 108
If Entry Mode is set to Fstart ............................................................................................ 108
Setting the resolution / EMC bandwidth (RBW / EBW) ....................................................... 109
Selecting the filter type .................................................................................................... 109
Setting the resolution / EMC bandwidth (RBW / EBW) .................................................... 110
Settings in the context menu ........................................................................................... 110
Setting the measurement time (Meas. Time) ....................................................................... 110
Configuring the measurement performance (Config) ........................................................... 110
Setting the lower and upper frequency limits (Lower Freq. Lim. / Upper Freq. Lim.) ...... 111
Setting the threshold (Threshold) .................................................................................... 111
Switching limits on / off (Limits) ....................................................................................... 111
Setting the number of measurements (Scan. No) ........................................................... 111
Setting the measurement sequence (Seq Mode) ............................................................ 111
Defining the stop behavior (Stop Mode) .......................................................................... 111
Editing the peak excursion value (Peak Excursion) ......................................................... 112
Exclude low frequencies (Exclude LO) ............................................................................ 112
Selecting traces (Traces) ..................................................................................................... 112
Changing general display settings (Display) ........................................................................ 113
Administration ......................................................................115
Operating System ................................................................................................................. 115
System partitions ............................................................................................................. 115
User management ........................................................................................................... 115
Updating the operating system ........................................................................................ 116
Activating Windows .......................................................................................................... 117
8
Page 9

Quick Start
Internet security and malware protection ......................................................................... 117
Narda Recovery Environment .......................................................................................... 118
Narda Recovery Stick ...................................................................................................... 119
Related documents .......................................................................................................... 121
Installing Options .................................................................................................................. 122
Updating the firmware .......................................................................................................... 122
Remote Control .....................................................................123
Legal Disclosure ...................................................................125
Narda Safety Test Solutions Software License Agreement ................................................. 125
Acknowledgements .............................................................................................................. 128
General Acknowledgements ............................................................................................ 128
Open Source Acknowledgements ................................................................................... 128
Glossary ................................................................................135
Index ......................................................................................137
9
Page 10

Page 11

Quick Start
The AC connection is not recommended for general use, as the measurement
connected to it.
Connecting to power supply system
Before the first use, the batteries of the SignalShark have to be charged.
characteristics can be significantly affected by the presence of the power supply cable in
the electromagnetic field when the SignalShark is operated with the AC adapter / charger
To charge the batteries:
Put the batteries into the battery compartment.
1
2
Connect the AC adapter / charger to socket No. 7 on the top side panel (see picture
below).
When the charge cycle is completed the charge LED on the keypad lights up green, the
battery symbol on the screen shows a full battery and the AC adapter / charger
switches to trickle charge mode.
See also:
Operation from battery
Changing the batteries
Connecting antenna
Directional Narda antennas are connected to the device via the Narda antenna handle.
Connecting the handle to the device
The antenna handle has a built-in cable with two connectors:
•
Control connector: for power supply and for transmitting the compass data and control
signals
•
N-connector: for transmitting the RF signal
11
Page 12
SignalShark User Manual
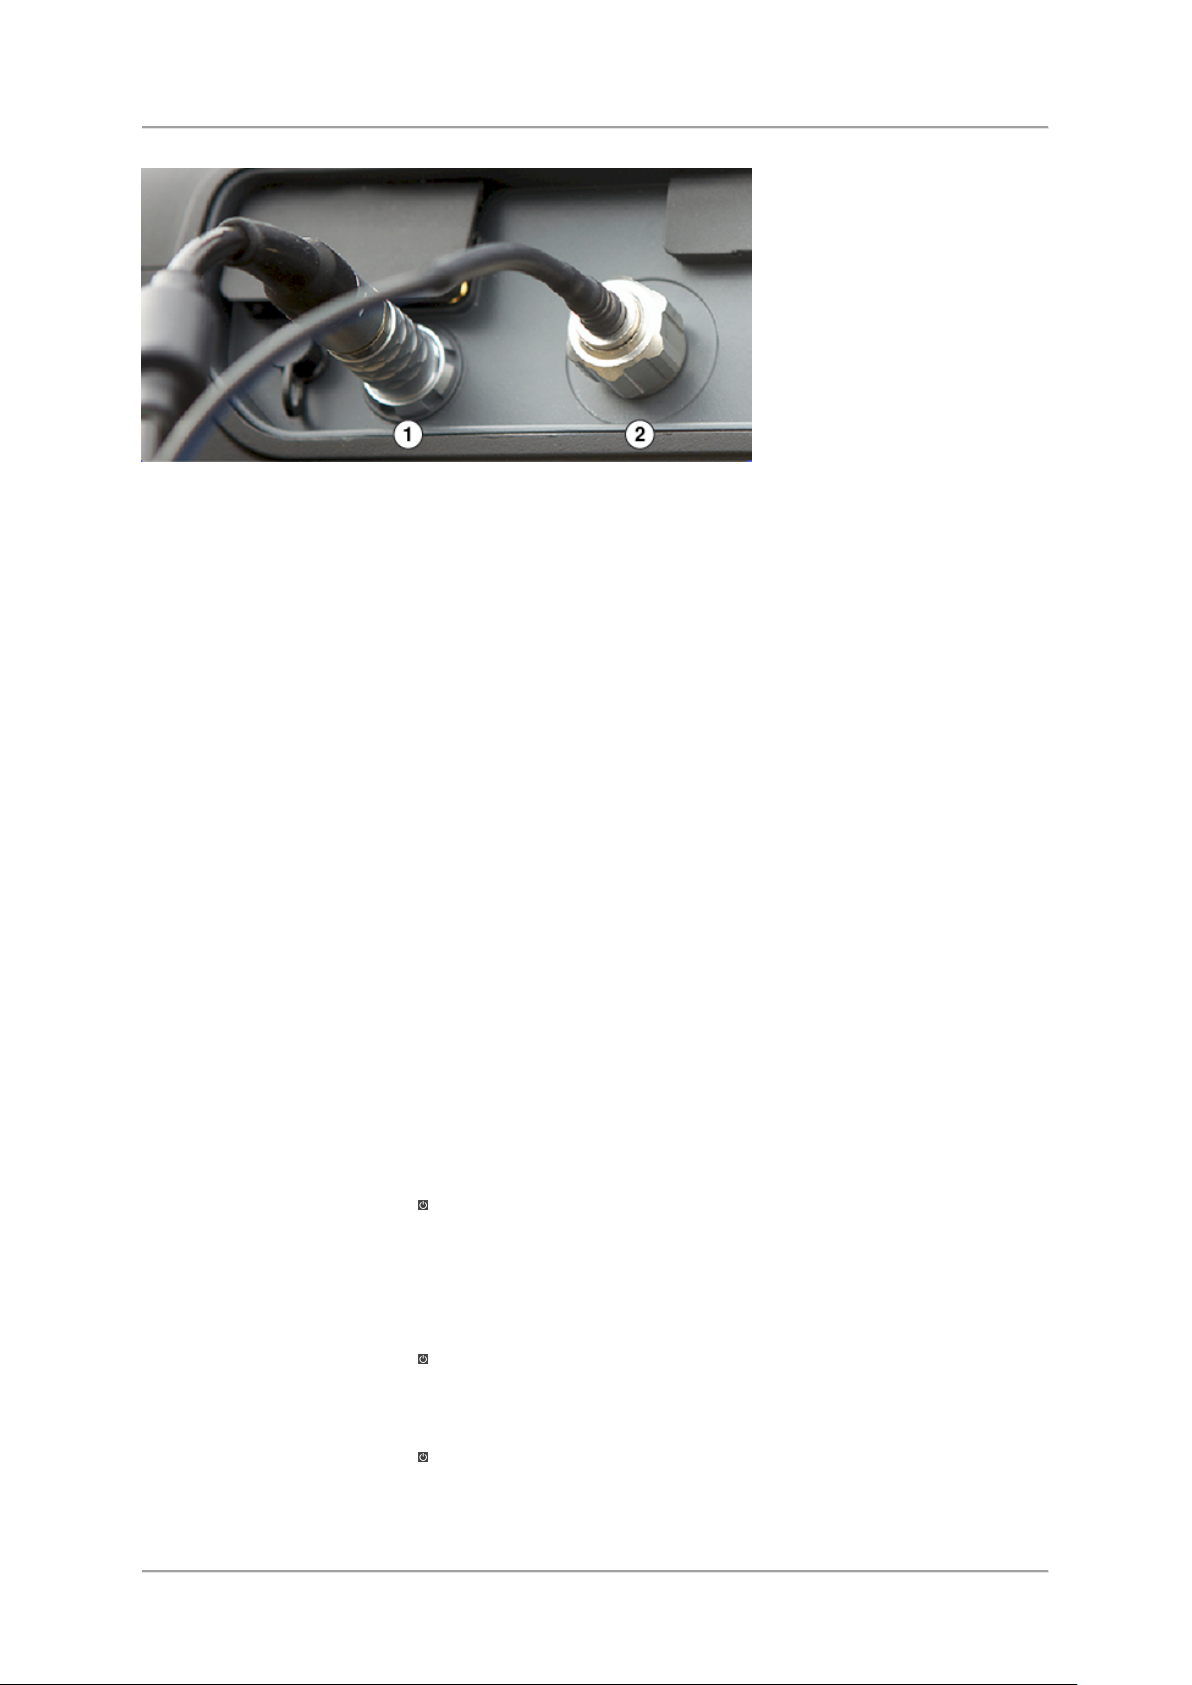
Figure:
Control connector (1), N-connector (2)
To connect the handle:
1.
Plug the control cable plug of the handle into the control connector socket on the device
(1), making sure that the red mark on the control cable plug is aligned with the notch on
the control connector socket.
Press the control cable plug into the control connector socket using the locking sleeve
2.
until the plug lock clicks into place.
3.
Place the N-connector of the handle into the N-connector of the basic unit (2) and tighten
the coupling nut slowly and without tilting.
Connecting the antenna to the handle
Narda directional antennas can be attached to the handle in positions that are at angles of 90
degrees to each other. This makes it quick and easy for you to change the polarization plane
of the antenna.
⇒ Push the antenna onto the handle until you hear the connector click into place.
See also:
Connecting Narda directional antennas
Connecting non-directional Narda antennas
Connecting cables and antennas from other manufacturers
Switching the device on
⇒ Press and hold down the key for a few seconds.
The device switches on.
The device performs a self test during the boot up process. The results are displayed on the
screen. The device starts with the last used settings.
To switch off:
⇒ Press and hold down the
The device switches off.
key for a few seconds.
To force shutdown:
⇒ Press and hold down the
key for at least 10 seconds to switch off the device immediately
without shutting down the operating system properly.
12
Page 13

Screen Details
1
System information
⇒ For showing detailed system information, see Displaying detailed system information.
2
Toolbar
⇒ For changing the general settings, see Changing general settings.
3
Task bar
Allows to switch between active tasks.
4/5
Task area
to six views which can be arranged to your own preferences.
6
Measurement info bar
Indicates settings and process analysis; displays error messages.
7
Button bar
operation and selected function.
Quick Start
Basic measurement screen with night color scheme and two views (RT Spectrum,
Spectrogram).
This area shows system information like date, time and battery status. Tapping the
dropdown icon opens the full system information menu.
The toolbar gives access to the settings menu and to general functions like forward /
backward or zoom in / out.
⇒ For further information about the toolbar, see Toolbar.
Graphical and numerical display of measurement values. The Task area can contain up
The layout of the button bar is context sensitive and depends on the current view,
13
Page 14

SignalShark User Manual
Touchscreen Functions
The SignalShark provides a resistive touchscreen allowing an easy and fast access.
Touch gestures
The following types of gestures can be used on the touchscreen of the device.
•
Tap: Tap for < 1 s.
•
Long tap: Tap for > 2 s.
•
Double tap: Tap briefly twice.
Locking the touchscreen
⇒ Press the Stealth/Touch key for > 2 s to lock the touchscreen.
⇒ Press the Stealth/Touch key again for > 2 s to unlock it.
Button bar
The Button bar is your main access to change measurement settings, to configure the
current active view and to adapt the display settings to your needs. The Button bar is
context sensitive. Thus, the available buttons depend on the active view.
The title of the main menu is displayed on top of the Button bar.
⇒ When you have opened a submenu, tap the title of that menu to get back to the main
menu.
Types of buttons in the button bar
In the button bar there are 3 types of buttons which are distinguished by the triangle in the
lower right corner.
Buttons without a triangle (e.g. Preamp)
These buttons just have the displayed toggle function.
⇒ Tap the button to switch the function (e.g. switch Preamp on/off).
Buttons with an outlined triangle (e.g. Ref. Level)
14
Page 15

These buttons have two modes:
⇒ Long tap the button to open a context menu.
Quick Start
⇒ Short tap the button to change settings only.
Buttons with a filled triangle (e.g. Configure)
These buttons show a submenu when tapped. Some buttons even may have several
submenus.
⇒ To close the submenus, tap the header of the Button bar or press the Esc key until Main
is displayed.
15
Page 16

Page 17

Introduction
About the SignalShark user documentation
This online help is part of the user documentation that is delivered with your device.
⇒ Please read all manuals carefully and completely before using the device.
⇒ Keep the printed documents so that they are readily available to all users of the device.
⇒ Always make sure that the printed documents accompany the device if it is given to a third
party.
General safety information
This printed document contains all safety information for operating your device.
Quick start guide
This printed document describes first steps to start up this device.
Online help
This online help describes all features and functions of the device.
To open the online help:
1.
Briefly press the Help/Preset key.
The online help opens in full screen mode providing several navigation elements like
the table of content, the index or the search function to quickly get access to the
needed information.
2.
Tap the Close Help button in the top bar of the Online help to close the help window.
When closing the help window the screen is set back to operation mode.
Command Reference Guide
The device can be remote controlled by SCPI commands. All remote commands can be
found in the Command Reference Guide which is available as a PDF document.
⇒ To download the PDF from the Narda web site (customer login needed), tap www.narda-
sts.com.
17
Page 18

SignalShark User Manual
About this device
SignalShark is a flexible platform up to 8 GHz which can be converted by options into three
application oriented solutions.
The Real Time Spectrum Analyzer
40 MHz Real-time Bandwidth (RTBW)
•
•
POI: 3.125 μs, FFT overlap 75%
•
High Dynamic Range
•
High Speed Scan by stitched FFT Analyzer
18
Page 19

The Monitoring Receiver
Introduction
•
High sensitivity with a wide intermodulation-free dynamic range
•
100 % Probability of Intercept (POI) for signals longer than 3.125 μs
Analog demodulation (available from July 2018)
•
•
Two digital down converters (DDC) for simultaneous measurement and demodulation
•
Vita 49 streaming (available from April 2018)
19
Page 20

SignalShark User Manual
•
•
•
•
•
•
•
reproduction even in a noisy environment
The RF Direction Finding & Localization System
Available from October 2018:
•
Smart manual DF Antennas
Full automatic DF Antennas
•
Features
Windows 10 based
Touchscreen
4 RF-Inputs
1 GigE Ethernet
USB 3.0 & 2.0 Host
Internal SSD
MicroSD card (SDXC, up to 2 Tbyte)
20
• Illuminated keypad (usable in dark
environments)
Microphone to record voice comments
•
Direct access to important functions like
•
e.g. Marker, Save,…
•
Key lock function to avoid unintentional
operation
•
Stealth Mode (to switch off any light or
sound immediately)
• Speaker with clear and loud sound
Page 21

RF parameters
Option
Order number
Spectrum (scanned or real-time)
Shows signal level over frequency.
BN 3310/101
(included in
SignalShark Basic
Marker and Peak Table (of Spectrum)
⇒ For RF parameters please the data sheet.
Display
• Size 10.4”
•
Readable in sunlight
•
Resistive touchscreen, can be operated with gloves
Connectivity
SignalShark runs on Windows 10 and provides all connectivity of a PC:
•
USB 3.0 & 2.0: for keyboard, mouse, printer, hard disk, …
•
Display port: connect monitor, beamer, …
MicroSD: store results, ...
•
•
Ethernet: connect to your network, Internet, ...
Introduction
Power supply
• The SignalShark has a long lasting dual battery pack:
•
2 x smart technology lithium-ion rechargeable battery pack
•
Hot-swappable (when using both battery packs) for interruption-free long-term
measurements.
However, operation is possible using only one battery back.
•
Batteries commercially available, Type: RRC2057, Li-ion, 48 Wh
•
Internal and external charging
Vehicle-adapter available
•
•
Operating time: approx. 3 hours (with 2 battery packs)
Additionally, it comes with a 100 V to 240 V external power supply.
Overview of options
The table below shows all the options available for the SignalShark. Your particular device
may not be equipped with all the options listed here and described in this online help.
Contact your local sales representative for advice or to order an option.
Table:
Available options
List of relevant signal peaks in the measured spectrum.
Set)
21
Page 22

SignalShark User Manual
Spectrogram*
selected time resolution.
3310/95.002
Level Meter (& Compass)*
Shows channel level as bar graph and compass values.
3310/95.003
Persistence (of real time Spectrum)*
occurrence. Sporadic signals are detected easily.
3310/95.004
Analog Demodulation*
3310/95.007
SCPI Remote Control*
3310/95.012
VITA 49 I/Q Streaming*
3310/95.014
Visual representation of recorded spectra over time. Colors represent the
signal level. The smallest selectable time resolution is 31.25 μ
Detectors are used to compress the high speed real time spectra to the
Displays spectra as level versus frequency. Color indicates rate of
s.
* = option
Antenna handle
The antenna handle is designed for attaching to the Narda directional antennas, providing an
ergonomic grip for the antenna. An electronic 3-axis compass, a 16 dB preamplifier, and a
button for starting measurements are all built in to the handle. The snap fixing allows you to
quickly and easily adjust the antennas by 90° to match the polarization plane. The antenna
module used and the polarization plane are automatically detected by the basic unit. The
power supply is provided from the basic unit via the separate data cable.
Figure:
22
Antenna handle
Page 23

Introduction
An arm support, which simply clips on to the handle and allows effortless long term use.
Figure:
Antenna handle with arm support
Narda directional antennas
Three Narda directional antennas that are specially matched to the SignalShark and which fit
the antenna handle are available. They cover the frequency range from 20 MHz to 8 GHz. A
highly sensitive loop antenna is also available as an accessory for covering the lower
frequency range from 9 kHz to 30 MHz.
You can of course also use directional or omnidirectional antennas from other manufacturers
with the SignalShark. Even Direction Finding is available when using the antenna with the
antenna handle and adapter.
Figure:
Directional antenna 1, frequency range 20 MHz to 250 MHz
23
Page 24

SignalShark User Manual
Figure:
Figure:
Directional antenna 2, frequency range 200 MHz to 500 MHz
Directional antenna 3, frequency range 400 MHz to 8 GHz
Figure:
24
Loop antenna, frequency range 9 kHz to 30 MHz
Page 25

Introduction
Requirement
Action
⇒ Switch on the device.
1.
Sequence of actions
Result
The device starts a self test.
Blue underlined
Links (external) and references (internal)
online help.
Bold text
Control element or menu name
⇒ Press the OK key.
Important additional information or details of special features or
situations.
Button
Control element on the touchscreen
Key
Control element on the keypad
Rotary knob
Control element on top of the keypad
About this online help
User interface language
This operating manual uses English terminology to describe the user interface.
Typographical conventions
Various elements are used in this operating manual to draw attention to special meanings or
important points in the text.
Indicates a requirement that must be fulfilled before the subsequent
action
can be taken. Example:
The measurement screen is displayed.
⇒
Indicates a single action. Example:
2.
3.
text
Indicates a sequence of actions that must be performed in the given
order.
Indicates the result of an action. Example:
Clicking on this section opens an external target or another page of the
Indicates device control elements and menu names. Example:
Control elements
25
Page 26

SignalShark User Manual
Press
When a key is operated < 1 s
Long press
When a key is operated > 2 s
Tap
When a button on the touchscreen is tapped < 1 s
Long tap
When a button on the touchscreen is tapped > 2 s
Double tap
When a button on the touchscreen is tapped twice.
User actions
26
Page 27

Device Overview
No.
Description
1
Large 10.4‘‘ high-resolution liquid crystal touchscreen.
2
Microphone for recording voice comments.
3 / 4 Rotary knob and keypad for navigation, changing settings, entering values, confirming
or cancelling entries. Keypad is illuminated for operation in dark surroundings.
5
LEDs showing the charge status of both batteries and operating status.
6
Loudspeaker for clear output of demodulated signal content and the audible signal
search tone even in noisy surroundings.
7
2 x lithium-ion rechargeable batteries.
The device is protected against moisture penetration (IP class see data sheet).
Display and control panels
27
Page 28

SignalShark User Manual
No.
Description
1
USB 3.0 host
2
3.5 mm headphone jack
3
External GNSS SMA (f) input
4
Micro SDcard slot (micro SDXC)
5
100 kOhm PPS/Trigger SMA (f) input
6
1 GigE connector for remote control and I/Q streaming
7
DC input / charge socket
8
3 x RF SMA (f) input
9
N-connector: RF N (f) socket for connecting the antenna
10
Control connector: 12-pole socket for connecting the antenna control cable (for
automatic recognition of Narda antennas and cables).
11
10 MHz Ref SMA (f) input
Top side panel with connectors
28
Page 29

Left side with battery compartment
No.
Description
1
USB 2.0 host
2
Display port
Figure: Battery compartments with closed lids and packs pulled out partly.
Device Overview
Bottom side panel with connectors
29
Page 30

Page 31

Connecting Antennas and Cables
Make sure that the cable does not twist when you are tightening the coupling nut. The
needed to make a secure connection.
Connecting Narda Directional Antennas
Directional Narda antennas are connected to the device via the Narda antenna handle.
Full use of all the functions of the SignalShark is only possible when you use the Narda
antenna handle.
⇒ For information about connecting other than directional Narda antennas and non-Narda
antennas see Connecting cables and antennas from other manufacturers.
Connecting the handle to the device
The antenna handle has a built-in cable with two connectors:
•
Control connector: for power supply and for transmitting the compass data and control
signals
•
N-connector: for transmitting the RF signal
Figure:
Control connector (1), N-connector (2)
To connect the handle:
1.
Plug the control cable plug of the handle into the control connector socket on the device
(1), making sure that the red mark on the control cable plug is aligned with the notch on
the control connector socket (show figure).
Press the control cable plug into the control connector socket using the locking sleeve
2.
until the plug lock clicks into place.
3.
Place the N-connector of the handle into the N-connector of the basic unit (2) and tighten
the coupling nut slowly and without tilting.
electrical properties of the high quality coaxial cable could otherwise be affected by
torsion forces. If the nut seems difficult to do up, undo it and start again. About 4 turns are
To unplug the connectors:
1.
Unscrew the coupling nut from the N-connector.
2.
Pull the control cable plug back using the ridged top of the plug until the lock clicks open.
31
Page 32

SignalShark User Manual
The device automatically detects the connected antenna. Information about the detected
device using removable media (e. g. USB stick).
If the nut seems difficult to do up, undo it and start again. About four turns are needed to
make a secure connection.
The device automatically detects the connected antenna. Information about the detected
device using removable media (e. g. USB stick).
Connecting the antenna to the handle
Narda directional antennas can be attached to the handle in positions that are at angles of 90
degrees to each other. This makes it quick and easy for you to change the polarization plane
of the antenna.
⇒ Push the antenna onto the handle until you hear the connector click into place.
⇒ To remove the antenna, press in the two unlocking buttons and pull off the antenna.
antenna is displayed in the system information menu. If the antenna is not detected, it is
probably not configured. The configuration data of the antenna can be loaded into the
Connecting non-directional Narda antennas
You can use other antennas from Narda instead of the directional antennas, for example if
you want to make omnidirectional measurements. These antennas can either be attached
directly to the instrument or connected to it using a Narda cable.
Connecting a Narda antenna directly to the device
1. Place the Basic Unit in a vertical position.
2.
Plug the N-connector plug of the antenna onto the N-connector socket of the Basic Unit.
Carefully do up the coupling nut on the antenna N-connector, making sure that it is not
3.
cross-threaded.
4. Plug the control cable plug of the antenna cable into the control connector socket on the
device, making sure that the red mark on the control cable plug is aligned with the notch
on the control connector socket.
5.
Press the control cable plug into the control connector socket using the locking sleeve
until the plug lock clicks into place.
The Narda antenna is now connected.
antenna is displayed in the system information menu. If the antenna is not detected, it is
probably not configured. The configuration data of the antenna can be loaded into the
32
Page 33

Connecting Antennas and Cables
If the nut seems difficult to do up, undo it and start again. About 4 turns are needed to
make a secure connection.
The device automatically detects the connected cable. Information about the detected
using removable media (e. g. USB stick).
If the nut seems difficult to do up, undo it and start again. About 4 turns are needed to
make a secure connection.
Connecting a Narda antenna to the device using a Narda cable
To connect a Narda cable to the SignalShark:
Place the device in a vertical position.
1.
2.
Plug the N-connector on the cable onto the N-connector of the device.
Carefully do up the coupling nut on the cable N connector, making sure that it is not cross-
3.
threaded.
4. Plug the control cable plug of the cable into the control connector socket on the device,
making sure that the red mark on the control cable plug is aligned with the notch on the
control connector socket.
5.
Press the control cable plug into the socket using the locking sleeve until the plug lock
clicks into place.
The Narda cable is now connected.
cable is displayed in the system information menu. If the cable is not detected, it is
probably not configured. The configuration data of the cable can be loaded into the device
To connect a Narda cable to a Narda antenna:
Plug the N-connector on the cable on to the N connector of the antenna.
1.
2.
Carefully do up the coupling nut on the cable N-connector, making sure that it is not cross-
threaded.
3. Plug the control cable plug of the antenna into the control cable socket on the cable
making sure that the red dots on both connectors are aligned.
4.
Press the antenna control cable plug into the connector using the locking sleeve until the
plug lock clicks into place.
The Narda antenna is now connected.
The device automatically detects the connected antenna. Information about the
detected antenna is displayed in the system information menu.
33
Page 34

SignalShark User Manual
When using other components, you will need to enter the data for the cable and antenna
into the SignalShark manually.
Connecting cables and antennas from other manufacturers
In contrast with the use of Narda components, automatic detection of the cable or antenna
connected does not work if you use third party products (commercially available cables or
antennas).
For this reason, the cable loss is not taken into account automatically when other cables are
used, and the results are not shown automatically in units of field strength if other antennas
are used.
Connecting cables and antennas directly to the device
The configuration data for the components have been uploaded and selected.
⇒ Connect the component(s) to the RF input of the SignalShark.
Connecting third party antennas to the handle
Antennas fitted with a N-connector can also be used as directional antennas with the Narda
handle by means of the Antenna Adapter 3100/15.
34
Page 35

Connecting Antennas and Cables
The device remembers the last third party antenna that was used with the antenna
antenna is displayed before making measurements.
To connect the antenna:
The configuration data for the antenna have been uploaded.
1.
Connect the handle to the SignalShark (see Connecting the handle to the device).
2.
Connect the N-connector of the third party antenna to the antenna adapter. When you do
this, make sure that the antenna is screwed on to correspond with the polarization
direction shown on the adapter (i.e. antenna dipole position is in the direction of the
arrow).
3.
Connect the antenna adapter to the antenna handle.
The device will indicate the correct polarization H or V in Direction Finding mode (not
yet implemented).
4.
Select the antenna you are using.
adapter and selects this automatically when it is plugged in. Check that the correct
35
Page 36

Page 37

Basic Operation
Only use type 2259/92.16 (RRC2057, Li-Ion, 7.5 V, 6.4 Ah. The part number (P/N) of the
be obtained as accessories.
Display
Meaning
The battery is fully charged.
The battery is 50% discharged.
The battery is almost discharged.
When the battery symbol A or B flashes, the battery charge state is critical. You
be saved before it switches off.
The AC adapter / charger is connected and the battery is charging.
This chapter describes the general operation of the device. The use of specific functions and
features is explained in the view descriptions accordingly.
Operation from battery
When using both, fully charged batteries, you have an operating time of approx. 3 hours. The
batteries are supplied in a pre-charged state and must be fully charged before being used for
the first time.
battery type in use is printed at the lower end of the battery label. Additional batteries can
Battery indicators
Information about the batteries is shown on the keypad and on the screen.
On the keypad
The operating status of the batteries is separately displayed for each battery with 2 LEDs:
•
LED lights up red: Battery is charging.
LED lights up green: Charging is completed and the AC adapter / charger is still
•
connected.
•
LED is off: No battery is inserted or no AC adapter / charger is connected.
In the upper status line of the screen
The exact charge status of the batteries can be seen in the display.
The symbols show the average value of the 2 battery packs ((A+B)/2). In the system
information menu the user can check the status for each battery separately (see Displaying
detailed system information).
should now switch the device off, connect it to the AC adapter / charger, or
change the battery packs. The letter A/B indicates which battery pack must be
replaced first. If you continue to operate the device from the batteries, it will
switch off automatically after a short time. The device configuration will however
37
Page 38

SignalShark User Manual
Observe the safety instructions for handling batteries given in the document General
Safety Information provided with this product.
Charging the batteries
You must use the AC adapter / charger provided or the optionally available external charger
to recharge the batteries.
•
Charging time with both batteries charging in the device: approx. 4.2 hours (nominal)
•
Charging time with external charger: approx. 3 hours (nominal)
To start the charge cycle when charging in the device:
The AC line voltage must be the same as the operating voltage of the AC adapter /
charger.
1.
Connect the AC adapter / charger to the DC input / charge socket of the SignalShark.
2.
Connect the AC adapter / charger to the AC line.
The charge cycle starts.
The Charge LED on the keypad lights up red and the battery symbol on the screen
shows the charging arrow during the charge cycle.
When the charge cycle is completed the charge LED on the keypad lights up green, the
battery symbol on the screen shows a full battery and the AC adapter / charger
switches to trickle charge mode.
Changing the batteries
Hot swappable features
The device is equipped with two batteries, but it can also be operated with only one battery.
Therefore it is possible to change one battery, while the other one supplies the device with
power.
To change the batteries:
During operation, change batteries one after another only to avoid unintentional switch-off
of the device!
1.
Push lock (1) downwards to open the battery compartment cover.
2.
Pull out the battery using the tab (2).
3.
Hold the tab on the new battery pack and slide the battery pack into the compartment.
4.
Put the battery compartment cover back in place and snap it into position.
38
Page 39

Basic Operation
Element
Function (standard mode)
Num lock
active
External keyboard short cuts
Set quickly the frequency, select
When using an external mouse
Move up, select items from lists,
demodulation volume, etc.
Move left in entry boxes, select items
demodulation volume, etc.
Move right in entry boxes, select
the demodulation volume, etc.
Move down, select items from lists,
demodulation volume, etc.
Confirm changed settings, select
Enter = short press
Operation from AC adapter / charger
The SignalShark can also be operated and powered from the AC adapter / charger.
However, this is not recommended for general use, as the measurement characteristics can
be significantly affected by the presence of the power supply cable in the electromagnetic
field when the SignalShark is operated with the AC adapter / charger connected to it.
Keypad and keyboard
Integrated keypad
The device will be operated mainly via the touchscreen and the integrated keypad.
The following table explains all elements that can be found on the integrated keypad as well
as the corresponding shortcuts when using an external USB-keyboard.
External USB keyboard
You may additionally connect an external USB keyboard to comfortably enter characters or
navigate through the views.
Shortcuts allowing access to the functions of the integrated keypad are listed in the last
column of the table.
Connecting a USB keyboard:
⇒ Plug in the USB plug of the keyboard to one of the two USB sockets.
Table:
Keys of the integrated keypad and shortcuts of external USB keyboard
functions and values, navigate and
zoom on maps, move limits and
markers, etc.
select bearings, set the
from lists, select bearings, set the
2 Up
4 Left
the scroll wheel will have the
same function as the
Rotary knob.
items from lists, select bearings, set
select bearings, set the
functions, etc
6 Right
8 Down
5
Shift + F10 = long press
39
Page 40

SignalShark User Manual
Strg + Enter = double press
Cancel the current operating step
move back to a higher menu level
Short press: enter / leave num mode
Alt + n
Long press: toggle key lock
Strg + 1
Short press: open the online help
F1
Long press: set to preset values
Strg + F1
Short press: toggle Stealth mode
Shift + F9
Long press: toggle touch lock
For actions using the keypad, the term press is used instead of tap. Tap is used when
working on the touchscreen.
(changes in values are rejected),
Open the Tasks menu
Open the Marker menu
Change the volume
Toggle stop / hold a measurement
Save measurement
1 Esc
3 Shift + F11
7 Shift + F7
9 (not yet implemented)
. (decimal
point)
Shift + F12
0 Strg + s
Long press: switch on/off
Charge status of the two batteries A
and B
Operating status LED
Switching the device on and off
To switch on:
⇒ Press and hold down the
The device switches on.
The device performs a self test during the boot up process. The results are displayed on the
screen. The device starts with the last used settings.
key for a few seconds.
40
Page 41

To switch off:
Basic Operation
⇒ Press and hold down the
key for a few seconds.
The device switches off.
To force shutdown:
⇒ Press and hold down the
key for at least 10 seconds to switch off the device
immediately without shutting down the operating system properly.
Touchscreen control
The SignalShark provides a resistive touchscreen allowing an easy and fast access by three
basic touch gestures.
•
Tap: Tap for < 1 s.
•
Long tap: Tap for > 2 s.
•
Double tap: Tap briefly twice.
To lock the touchscreen:
⇒ Press the Stealth/Touch key for > 2 s to lock the touchscreen.
⇒ Press the Stealth/Touch key again for > 2 s to unlock it.
41
Page 42

SignalShark User Manual
In the system information menu, the current settings can be viewed only.
To change settings, see Changing general settings.
Device
Information about the SignalShark firmware
Options
Overview of installed options
Batteries
Information about the condition of each battery
GNSS
GNSS information
Antenna
Data of currently connected/selected antenna
Antenna Handle
Information about the connected antenna handle
External Device
Currently connected/selected external device
Cable
Currently connected/selected cable
Service
Information about some device hardware operation conditions
Displaying detailed system information
⇒ In the display header tap the dropdown icon of the system information area to open the
system information menu.
To close a menu or view:
⇒ Press the Esc key or tap the header of the Button bar.
42
Page 43

Changing general settings
Settings
Change general device parameters like date, time or display brightness.
All Tasks
Set listed measurement parameters related to all tasks.
Network
Set network parameters.
Antennas
Set antenna configuration parameters.
External Device
Set configuration parameters for external devices.
Cables
Set cable configuration parameters.
Data Logger
View and select stored data sets and screenshots.
Setups
Manage your setups. In a setup you can store and recall your device
settings (e.g. tasks and views).
⇒ In the toolbar tap the button.
Basic Operation
To close a menu or view:
⇒ Press the Esc key or tap the header of the button bar.
Creating a screenshot
⇒ In the toolbar tap the button.
A screenshot of the active window is stored to the memory.
Stored screenshots can be found in this folder:
D:\Narda_SignalShark\Datalogger\Screen Shots
43
Page 44

SignalShark User Manual
Using Tasks and Views
The design and GUI layout of SignalShark is based on customer applications. This can be
seen most clearly in the concept of Tasks and Views.
Tasks
The measurement task of a customer application often consists of several measurements,
like finding a signal in the spectrum, measuring its level and drawing it into a map. In most
cases, SignalShark can handle a complete workflow in one single task:
Tasks are represented by a tab on the screen, like a web site within a web browser.
•
•
They encapsulate all measurement parameters and the underlying measurement engine
working mode.
•
Within a task, all measurements are performed at the same time.
The creation of a task is the prerequisite for being able to perform a measurement at all. To
support a wide variety of measurement applications, SignalShark provides several task
modes:
Spectrum (Scan) Mode
•
This mode supports measuring the spectrum with full frequency span of 8 kHz up to
8 GHz within one measurement and a maximum measurement speed of 40 GHz/s.
•
RT Spectrum Mode
The Real-Time Spectrum Mode enables real-time spectrum measurements with a
frequency span of up to 40 MHz. This frequency span will be acquired simultaneously in
frequency and also gapless in time with 3.125 µs POI.
•
Auto DF Mode (if available)
The Auto Direction Finding Mode supports control of the automatic DF antennas and
handles the calculation of bearings out of the DF data.
44
Page 45

Basic Operation
Measurement Engine or Task Mode
View
Spectrum (Scan)
RT Spectrum (Real Time)
Spectrum
●
●
Peak Table
●
●
Level Meter
–
●
Spectrogram
–
●
Persistence
–
●
Views
A view is a window containing a specific visual representations of measurement data. Up to
six views can be added to a task and arranged to you personal needs and taste.
Figure:
Table:
This example shows the two horizontally split views Spectrum and Spectrogram
assigned to the RT Spectrum task.
Relation between measurement tasks and views.
(The available tasks and views depend on the firmware release and the options
included in your software package.)
45
Page 46

SignalShark User Manual
Managing tasks and views
After adding a task you may add additional views to that task and rearrange them to your
needs. As default each new task opens with a Spectrum view.
Adding a task
1. On the keypad press the Tasks key.
The Tasks menu is displayed in the Button bar.
2.
Tap the Add Task button.
The dialog to add a task opens.
3.
Follow the explanations given in the Add Task window to add a new task or to replace an
existing task.
After adding a task, the dialog and the Tasks menu is closed and the new task tab is
displayed in the Task bar.
Adding a view
1. On the keyboard press the Tasks key.
The Tasks menu is displayed in the Button bar.
2.
In the Button bar tap the Configure Task Views button.
The ConfigTaskViews menu opens.
3.
Tap a view to select it.
4.
Tap into one of the Diamond fields to place the selected view there.
If you select a diamond field already in use, that view will be moved to another field.
5.
Repeat steps 3. and 4. to add further views.
46
Page 47

Basic Operation
Changing the position of a view
1. In the Button bar tap the Configure Task Views button.
The ConfigTaskViews menu opens and the already added views are displayed.
Tap the move view button of the view you want to move.
2.
3.
Select a new position from the grey marked diamond fields.
4.
Tap the Button bar header once to close the configuration menus and tap it again to
close the Tasks menu.
Deleting a view
1. In the Button bar tap the Configure Task Views button.
The ConfigTaskViews menu opens and the already added views are displayed.
2.
Tap the delete (x) button of the view to be deleted.
Tap the Button bar header once to close the configuration menus and tap it again to
3.
close the Tasks menu.
Zooming views in/out
When using several views within a task you may wish to quickly enlarge a view.
⇒ Just double tap on the title bar of the view.
The window is enlarged to full frame.
⇒ To zoom out and restore the window size double tap again the title bar of the view.
47
Page 48

Page 49

Screen Overview
1
System information
⇒ For showing detailed system information, see Displaying detailed system information.
2
Toolbar
⇒ For changing the general settings, see Changing general settings.
3
Task bar
Allows to switch between active tasks.
4/5
Task area
to six views which can be arranged to your own preferences.
6
Measurement info bar
Indicates settings and process analysis; displays error messages.
7
Button bar
operation and selected function.
Basic measurement screen with night color scheme and two views (RT Spectrum,
Spectrogram).
This area shows system information like date, time and battery status. Tapping the
dropdown icon opens the full system information menu.
The toolbar gives access to the settings menu and to general functions like forward /
backward or zoom in / out.
⇒ For further information about the toolbar, see Toolbar.
Graphical and numerical display of measurement values. The Task area can contain up
The layout of the button bar is context sensitive and depends on the current view,
49
Page 50

SignalShark User Manual
The displayed icons depend on the current running measurements and device status:
Shows the current date.
Shows the current time.
Shows the charge status of the batteries.
Shows that measurement is running
Shows that measurement has been stopped.
Shows that measurement has only been paused.
Shows that a view from the Data Logger.is displayed, and not a current
measurement.
Shows that the A/D converter is overdriven.
Shows that GNSS signal is being received.
Shows that the numbers are active on the numeric block. The Num key is lit in
blue.
Touchscreen function has been locked.
Due to too many active views no permanent real time calculation is possible.
System information area
System information is displayed in the left panel of the upper status bar. Tapping the panel
opens the full menu.
50
Page 51

Screen Overview
Last / next action in history.
General settings menu.
Screenshot camera
Progress bar
The progress of a measurement is displayed in the progress bar above the graph:
⇒ For displaying detailed system information, see Displaying detailed system information.
Toolbar
In the toolbar the general settings menu and other frequently used functions are grouped.ddd
Tapping the dropdown icon opens the action history.
⇒ See Changing general settings.
Tap to get a screenshot from the current display.
51
Page 52

SignalShark User Manual
Button bar
The Button bar is your main access to change measurement settings, to configure the
current active view and to adapt the display settings to your needs. The Button bar is
context sensitive. Thus, the available buttons depend on the active view.
The title of the main menu is displayed on top of the Button bar.
⇒ When you have opened a submenu, tap the title of that menu to get back to the main
menu.
Types of buttons in the button bar
In the button bar there are 3 types of buttons which are distinguished by the triangle in the
lower right corner.
Buttons without a triangle (e.g. Preamp)
These buttons just have the displayed toggle function.
⇒ Tap the button to switch the function (e.g. switch Preamp on/off).
Buttons with an outlined triangle (e.g. Ref. Level)
These buttons have two modes:
⇒ Long tap the button to open a context menu.
52
Page 53

Screen Overview
⇒ Short tap the button to change settings only.
Buttons with a filled triangle (e.g. Configure)
These buttons show a submenu when tapped. Some buttons even may have several
submenus.
⇒ To close the submenus, tap the header of the Button bar or press the Esc key until Main
is displayed.
53
Page 54

SignalShark User Manual
RL
Reference level
Input Preamp
Preamplifier in handle on / off
Fcent
Center frequency
Fspan
Displayed frequency span
RBW
Resolution bandwidth
VBW
Video bandwidth
Meas. Time
Elapsed time of current measurement
Scan. No
Current scan of running test
Scan Count
Total amount of scans made since last
measurement start
Measurement info bar
The measurement info bar on the bottom of the screen gives information about the current
measurement. The contents of the display may vary, depending on the operating mode.
Measurement settings
The displayed parameters depend on the selected application.
Status of running measurement
54
Page 55

Using Markers
Axis
Select frequency (Freq.) or time (Time) axis to set marker.
Spectrogram.
Left Peak /
The displayed button depends on the selected axis:
•
Axis = Time: Set marker to upper peak from current position.
Right Peak /
The displayed button depends on the selected axis:
• Axis = Time: Set marker to lower peak from current position.
Both Axis
Select if Next Peak and Peak is related to only one or both axis.
Next Peak
Set marker to next peak from current position.
Peak
Set marker to highest peak in the selected range.
Marker Conf.
Set marker configuration.
⇒ For more information, see Using the Marker Configuration menu.
Marker to Fcent
Sets Fcent to the position of the active marker.
automatically adapted.
M1 ... M8
M1 to M8 are eight locations to define and store marker settings.
⇒ For more information, see Setting markers individually.
Type
Set marker type:
⇒ For more information, see Working with delta markers
The Marker function is very useful for marking and comparing specific individual frequencies
in the display:
•
Eight independent markers
•
Individual display of each marker or display of the delta between the markers
•
Automatic location of peak values
•
Automatic peak tracking
•
Rotary knob with acceleration function
To open the marker menu:
⇒ Press the Marker key.
The marker menu opens in the button bar.
⇒ The following table gives an overview of the available marker functions. See the following
sections to learn more about some of these functions in detail.
Table:
Marker functions overview.
Upper Peak
Lower Peak
Time axis is available only in views with a time dimension, e.g.
• Axis = Freq.: Set marker to left peak from current position.
• Axis = Freq.: Set marker to right peak from current position.
Parameter that depend on Fcent like Fspan and RBW are
• Normal: Value of selected marker is displayed.
•
Delta: Delta of two selected markers is displayed.
55
Page 56

SignalShark User Manual
Trace
Specify on which trace the marker is to be used.
Demod
(Not yet implemented.)
Add Trans
Allows to add the signal selected by the active marker to the
(Not yet implemented.)
Table
Choose, how the active markers are displayed in the marker table:
•
Off: The table is hidden.
transmitter table.
• All: All enabled markers are displayed in the table.
•
One: Only one of the enabled markers is displayed in the table.
Setting markers individually
Markers can be set individually by selecting a marker from the button bar and changing the
parameters.
To set a marker:
1.
On the keypad press the Marker key.
The Marker menu opens.
2.
Tap a marker button (M1 ... M8).
The marker is added to the active marker list above the measurement display.
By tapping the marker again it is removed from the table.
3.
Change the setting to your needs (see Table).
4.
To close the Marker Config menu, press the Esc key or tap the header of the button bar.
To fold / unfold the Marker Table:
1.
On the keypad press the Marker key.
The Marker menu opens.
2.
In the Button bar tap the Table button on the very bottom of the bar.
The Marker Table dropdown list is displayed on the very top of the bar.
3.
Tap on the dropdown list and select an entry:
–
All: All enabled markers are displayed in the table.
One: Only one of the enabled markers is displayed in the table.
–
–
Off: The table is hidden.
4.
To close the Marker Config menu, press the Esc key repeatedly until the main menu is
displayed.
56
Page 57

Using Markers
Tab
Select tab in the Marker Config window.
Marker No.
Select a marker to be set.
Enabled
Enable / disable marker.
retained.
Type
Set marker type: M = Single marker, D = Delta marker.
Ref.
Referenced marker if marker is set to delta.
Trace
Trace which the marker refers to.
Freq. Link
Two markers can be linked via a fixed frequency.
Time Link
Two markers can be linked via a fixed time.
Functions
Assign a function to a marker.
M1 as ref.
for all Delta Markers
Set marker 1 as reference for all delta markers.
Reset all Markers
Reset all markers.
Using the Marker Configuration menu
Using the Marker Configuration menu
Instead of setting markers individually from the button bar markers can also be configured
fast and easily via the Marker Config menu.
Changing the configuration:
1.
Press the Marker key.
2.
In the Button bar tap the Marker Conf. button.
The Marker Config window opens showing the settings for each marker. The settings
can be changed in the Button bar.
3.
In the Markers tab of the Marker Config window, tap a marker from the list.
– or –
Tap Marker No. in the Button bar and select a marker from the dropdown list.
The editable parameters are displayed in the Button bar.
4.
Tap a parameter in the Button bar and change it as needed.
Select another tab to change further settings (see following topics).
5.
6.
To close the Marker Config menu, press the Esc key or tap the header of the button bar.
Markers button bar
In the Markers button bar following settings are available:
A disabled marker is not displayed, but all settings are
57
Page 58

SignalShark User Manual
Marker No.
Marker 1 to 8.
Enabled
Marker is enabled/disabled.
Type
M = Single marker, D = Delta marker
Ref.
Referenced marker if marker is set to delta.
Trace
Trace which the marker refers to.
Freq. Link
Coupling two markers over the frequency.
Time Link
Coupling two markers over the time.
Function
Function that is referred to the marker.
Markers
Shows the eight markers and their current settings.
58
Page 59

Using Markers
Frequency
Enter a frequency as marker position.
Time
Enter a time as marker position.
Value
Enter an absolute power level as marker position.
Spectrogram
Search Range
All / Visible: Select to search all data or just the
Track Peaks
Marker is fixed to a peak even if the frequency varies.
FXD Marker
The FXD Marker menu allows to set a marker to a fixed frequency, time, or value.
Search
The Search menu allows to set various parameters for setting markers to a peak, e.g. when
tapping the Next Peak button.
visible data.
59
Page 60

SignalShark User Manual
Auto peak Search
for M1
Marker 1 always shows highest peak.
Exclude LO
Only frequencies higher than 4 x RBW are evaluated.
are excluded.
Peak Excursion
Peak Excursion determines what is considered a
peak in contrast to noise.
Use Search Limits
Narrow the search range:
• Threshold: Set the lower power level
Noise Marker
Setting the noise marker parameters:
• NBW: Setting the noise bandwidth.
Channel Power
Setting the channel power parameter:
•
CBW: Setting the channel bandwidth.
Low frequencies, DC portion, and mirror frequencies
• Lower Frequency: Set lower frequency limit
•
Upper Frequency: Set upper frequency limit
Functions
The Functions menu allows to specify a function. This function can then be assigned to a
marker. Additional functions will be provided with upcoming firmware updates.
• Auto NBW: Switching automatic noise bandwidth On /
Off.
60
Page 61

Using Markers
Working with delta markers
All markers can be set to show values according to their position or to display deltas to
another marker. The settings can be changed directly from the Button bar or from the
Marker Configuration menu.
Setting a marker to delta from the Button bar
A delta marker can be defined directly from the Button bar. When set from the Button bar
only marker 1 can be the referenced marker. To select another marker as reference, see
Setting a marker to delta from the Marker Configuration menu.
To set a marker as delta marker:
1.
In the Button bar select a [marker].
The selected marker is displayed above the measurement display.
2.
In the Type field select Delta.
The name of the marker in the marker list is changed from Mx to Dx (e.g. M4 to D4).
The displayed values are the differences to marker 1.
Setting a marker to delta from the Marker Configuration menu
When setting a marker to delta from the Marker Configuration menu, any other marker can
be chosen as a reference.
To set a marker as delta marker:
1.
In the Button bar tap the Marker Conf. button.
The Marker Config menu opens.
2.
In the Type field select D.
The type of the marker in the marker list changes from M to D. Marker 1 is set as
reference (default).
To select a reference marker:
The Marker Config menu is displayed.
1.
Select a delta marker from the list.
2.
In the Button bar tap the Ref. button.
A dropdown list opens in the display header.
3.
Select a marker from the list.
4.
Tap the header of the Button bar twice to close the menus.
61
Page 62

Page 63

Spectrum View
The spectrum view shows the level over the frequency. All the field components in the
selected range can be recorded to give an overview of the detected spectrum or to determine
the maximum values in Spectrum view. The extended functions of the device enable you to
perform optimum evaluation of the measured values directly on site. Marker functions and a
peak table are provided for rapid assessment of the results of spectrum analysis. You can
also display the wideband value of the integrated level for a freely-definable frequency band.
Available Buttons
For information about the different types of buttons and how to select them see Button bar.
⇒ Tap a button to change setting or to open the submenu.
Ref. Level / Attenuator
Fcent/Fspan, Fstart/Fstop
RBW / EBW
Meas. Time
Config
Traces
Display
63
Page 64

SignalShark User Manual
The Reference Level is an indirect way to set the current attenuator value. It defines the
5.
Press the Esc key twice to close the menus.
Background information about the Reference Level
Y-Scale Ref parameter in the Display menu.
Setting the reference level / attenuation value (Ref. Level / Attenuator)
Here you can do the following:
•
Set the Reference Level (RL) or Attenuator value (depends on the Entry Mode setting).
•
Select the RF input
•
Select the Entry Mode
•
Select +5 dB / -5 dB
maximum measurable level. For better convenience it also sets the upper axis limit of the
view.
You can stop this coupling by setting the entry mode to Abs.in the Display settings:
1. Tap the header of the desired view.
2. Tap the Display button.
3. Long tap the Lmax button.
4. Tap the Entry Mode button to select Abs.
The sensitivity of the system depends on the input attenuator setting. This setting is
determined by the Reference Level (RL) parameter. High measurement sensitivity avoids
falsification of the results due to noise generated internally by the device. On the other
hand, it is important that the device is not overloaded (saturated). Saturation can also be
caused by signals outside the frequency band, e.g. high power radio transmitters when
measuring mobile telephone signals. The reference level setting covers up to 25 dB
depending on the attached components (handle, type of antenna, etc.) and is coupled to
the setting of the input attenuator (Attenuator, Atten). The input attenuator can be
matched ideally to the measurement signal by means of its fine adjustment in steps of
0.5 dB. At the highest reference level setting, Atten = 2 dB; at the most sensitive
reference level, Atten = 0 dB.
It is possible to decouple the reference level and the input attenuator indirectly using the
Setting the reference level (Ref. Level)
You selected the desired view.
RL is selected as entry mode.
1.
Tap the Ref. Level button.
The settings dialog opens.
2.
Enter the required value and tap the unit button.
The settings is accepted immediately and the dropdown list is closed.
Or use the Rotary knob to change the value.
64
Page 65

Setting the attenuator value (Attenuator)
About the +5 dB / -5 dB buttons:
value increases by +5 dB as well).
You selected the desired view.
Attn is selected as entry mode.
Tap the Attenuator button.
1.
The settings menu opens.
2.
Enter the required value and tap the unit button.
The settings is accepted immediately and the dropdown list is closed.
Or use the Rotary knob to change the value.
Settings in the context menu
You selected the desired view.
1.
Long tap the Ref. Level or Attenuator button.
The context menu opens.
2.
Here you can do the following:
Selecting the RF input (Input)
Spectrum View
To select the RF input:
Tap the Input button and enter an input.
1.
2.
Tap the OK button to accept the setting.
The input window is closed.
3.
Press the Esc key to close the context menu.
Setting the entry mode (Entry Mode)
To select the Entry Mode:
1.
Tap the Entry Mode button to select the mode:
–
RL: Reference Level
–
Attn: Attenuation
2.
Press the Esc key to close the context menu.
Lowering/rising the level by 5 dB (+5 dB / -5 dB)
1. Tap the +5 dB or -5 dB button.
2.
Press the Esc key to close the context menu.
You can use the +5 dB / -5 dB buttons to check for over modulation and to rapidly change
the values in 5 dB steps. The buttons are only enabled if the change is possible in the
selected direction. The Y scale is fixed as soon as you make a change using the +5 dB / 5 dB buttons so that changes in level are easier to see.
As well as controlling overload, the +5 dB / -5 dB offset can also be used to distinguish an
actual measurement signal from an intrinsic spurious signal (Spurious). Regardless of the
reference level setting, the measurement signal will display the same level value until
compression occurs from overloading. In contrast, the displayed value of an intrinsic
spurious signal will change each time the reference level is changed (RL +5 dB: displayed
65
Page 66

SignalShark User Manual
Setting the measurement frequency (Fcent / Fspan, Fstart / Fstop)
Here you can set the measurement frequency.
Depending on the Entry Mode setting the frequency can be entered in two modes:
•
Entry Mode = Fcent: Define a center frequency and a frequency span.
•
Entry Mode = Fstart: Define a start and stop frequency.
Selecting the entry mode (Entry Mode)
You selected the desired view.
1.
Long tap one of the two buttons Fcent / Fstart or Fspan / Fstop (display depends on the
current Entry Mode).
The context menu opens.
2.
Tap the Entry Mode button to select Fcent or Fstart.
3.
Press the Esc key to close the context menu.
If Entry Mode is set to Fcent
Setting the center frequency (Fcent)
1. Tap the Fcent or Fspan button.
2.
Enter the required value and select a unit.
The setting is accepted immediately and the dropdown list is closed.
Setting the frequency span (Fspan)
1. Tap the Fcent or Fspan button.
2.
Enter the required value and select a unit.
The setting is accepted immediately and the dropdown list is closed.
Setting the step width (Fstep)
1. Long tap the Fcent button.
The context menu opens.
2.
Tap the Fstep button.
3.
Enter the step width and select a unit.
The menu is closed.
Press the Esc key to close the context menu.
4.
If Entry Mode is set to Fstart
Setting the start frequency (Fstart)
1. Tap the Fstart button.
2.
Enter the required value and select a unit.
The setting is accepted immediately and the dropdown list is closed.
66
Page 67

Spectrum View
Normal and EMC filter types:
corresponding views by the text EBW.
Setting the stop frequency (Fstop)
1. Tap the Fstop button.
2.
Enter the required value and select a unit.
The setting is accepted immediately and the dropdown list is closed.
Setting the step width (Fstep)
1. Long tap the Fstart button.
The context menu opens.
2.
Tap the Fstep button.
3.
Enter the step width and select a unit.
The menu is closed.
Press the Esc key to close the context menu.
4.
Setting the resolution / EMC bandwidth (RBW / EBW)
Here you can do the following:
1.
Set the resolution bandwidth (RBW) or EMC bandwidth (EBW).
Enable automatic setting of the resolution bandwidth (Auto RBW).
2.
3.
Set the entry mode (RBW Entry).
4.
Select the filter type (Filter Type).
The normal filter types resolution bandwidth (RBW) or channel bandwidth (CBW) allows
you to select a narrow frequency range with the desired bandwidth from a wideband
spectrum and to suppress the remaining signal components.
In the task modes Spectrum (Scan) and RT Spectrum, it is possible to use EMC filters
instead of the normal filters. When using EMC filters the following bandwidths can be
selected: 10 Hz, 100 Hz, 200 Hz, 1 kHz, 9 kHz, 10 kHz, 100 kHz, 120 kHz, 1 MHz.
The available bandwidths also depend on the Fspan setting.
After selecting the filter type EMC, the text RBW or CBW is replaced everywhere in the
Selecting the filter type
You selected the desired view.
To select the filter type:
1.
Long tap the RBW / EBW button. (The displayed button label depends on the currently
selected filter type.)
The context menu opens.
2.
Tap the Filter Type button to select Normal or EMC type.
3.
Press the Esc key to close the context menu.
67
Page 68

SignalShark User Manual
Setting the resolution / EMC bandwidth (RBW / EBW)
You selected the desired view.
To set the resolution / EMC bandwidth:
1.
Tap the RBW / EBW button.
2.
Enter the required value and select a unit.
The setting is accepted immediately and the dropdown list is closed.
Settings in the context menu
You selected the desired view.
⇒ Long tap the RBW / EBW button.
The context menu opens.
Enabling/disabling the auto resolution bandwidth (Auto RBW / Auto EBW)
Enable or disable automatic calculation of resolution bandwidth.
To set Auto RBW:
1.
Tap the Auto RBW button to switch function On / Off.
2.
Press the Esc key to close the context menu.
Setting the resolution bandwidth entry mode (RBW Entry / RBW Entry)
This button allows you to select the entry type Absolute or Relative.
To set RBW Entry:
1.
Tap the RBW Entry button to select the required type.
2.
Press the Esc key to close the context menu.
68
Page 69

Spectrum View
Setting the measurement time (Meas. Time)
Here you can set the measurement time. The measurement or detector time defines the time
range used by the internal detectors to calculate their values (+Pk, RMS, -Pk, ...).
To set the measurement time:
You selected the desired view.
1.
Tap the Meas. Time button.
2.
Enter the required value and select a unit.
The setting is accepted immediately and the dropdown list is closed.
Configuring the measurement performance (Config)
Here you can define how measurements are performed.
To open the Config menu:
You selected the desired view.
1.
Tap the Config button.
2.
Then you can do the following:
Setting the number of measurements (Scan. No)
Sets the number of measurements for a single run measurement until the measurement
stops.
It also affects the longtime detectors (MxP, MxR, ...).
To change the parameters:
1.
Tap the button and set the number of measurements either by using the rotary control
knob or by entering the value.
2.
Tap the OK button.
3.
Press the Esc key or tap the header to close the menu.
Setting the measurement sequence (Seq Mode)
Here you can set the following:
•
Single: Measurement stops after the number of scan count is reached.
•
Conti: Continuous measurement.
To change the parameters:
1.
Tap the toggle button to select Single or Conti.
Press the Esc key or tap the header to close the menu.
2.
69
Page 70

SignalShark User Manual
BACKGROUND
• Detector 1: +Pk (Plus Peak)
Defining the stop behavior (Stop Mode)
The stop mode value changes the behavior of the measurement engine, after the Run key is
pressed.
•
Hold: Measurement continues in the background.
•
Stop: Measurement stops and runs again.
You can stop/hold the measurement using the Run key.
To change these parameters:
1.
Tap the toggle button to select Hold or Stop.
2.
Press the Esc key or tap the header to close the menu.
Selecting traces (Traces)
Here you can select which traces are to be displayed (see Glossary for further explanations):
•
+Pk
•
RMS
Avg
•
–
Short tap: Avg
–
Long tap: third detector -Pk, Avg, Smp
•
MxP
•
MxR
•
AvR
•
MnR
MxA
•
•
Enable All: Tap to select all traces
•
Disable All: Tap to deselect all traces
To select the traces to be displayed:
You selected the desired view.
1.
Tap the Traces button.
2.
Tap a button to switch the trace On / Off.
3.
Tap the Enable All button to display all traces.
Tap the Disable All button to hide all traces. At least the RMS trace remains on as
4.
5.
To set the Third Detector: Long tap the Avg button and select a trace from the dropdown
6.
Press the Esc key to close the menu.
There are three main detectors which compress all spectra occurring in the
measurement time to one spectrum (per measurement time), whereby the third detector
can have different functions.
Basis Traces:
70
default.
list.
Page 71

Spectrum View
–
MxS (Maximum of Sample)
• Detector 2: RMS
• Detector 3: The function of the third detector can be set via the context menu as
follows:
– -Pk (Minus Peak)
– Avg (Average)
– Smp (Sample)
In order to be able to view very fast signals with the naked eye (the measurement time
is partly 10 ms), there is a downstream compression for these detectors, which the user
can display as an additional trace.
The compression time is determined by the Scan Count. After the Scan Count has
elapsed, the signal then decays exponentially.
Example:
• Measurement Time: 10 ms
• Scan Count: 300
• Trace: MxP
Over the time of 10 ms x 300 = 3 s, the data of the +Pk (Plus Peak) become
summarized in a Trace (in this case, the maximum values that have occurred during this
time). If the signal would no longer be present after the 3 s, the Trace would slowly fade
away. In this way, short pulses, for example, can be made visible.
Calculated traces:
• Detector 1: MxP (Maximum of Plus Peak)
• Detector 2:
– MxR (Maximum of RMS)
– AvR (Average of RMS)
– MnR (Minimum of RMS)
• Detector 3 (depending on the configuration):
– MnP (Minimum of Minus Peak)
– MxA (Maximum of Average)
Changing general display settings (Display)
Here you can change general display settings such as the zero point of the Y-axis, the range
of the Y-axis or the axis unit (the available settings depend on the current view).
To open the Display menu:
You selected the desired view.
1.
Tap the Display button.
The Display menu opens.
2.
You can now do the following:
71
Page 72

SignalShark User Manual
Lmax
Here you can do the following:
•
Set the zero level of the y-axis
•
Set the Entry Mode: Absolute or Relative
•
Set the Coupling: On / Off (not available in Level Meter view)
When coupling is set to On, the views of a task are coupled (e.g. the axis).
To set the zero level:
1.
Tap the Lmax button.
2.
Enter the required value and tap the unit button.
The setting is accepted immediately and the input window is closed.
3.
Press the Esc key to close the menu.
Settings in the Lmax context menu
⇒ Long tap the Lmax button.
The context menu opens.
Entry Mode
The Entry Mode button allows you to determine whether values are entered as absolute or
relative values.
To set the Entry Mode:
1.
Tap the Entry Mode button to select Abs. (Absolute) or Rel. (Relative).
Press the Esc key twice to close the menus.
2.
Coupling
The Coupling button allows you to couple the level axis of the views within a task.
Thus, Coupling is not available in the Level Meter view.
To set the Coupling:
1.
Tap the Display button.
2.
Long tap the Lmax button.
The Context menu opens.
3.
Tap the Coupling button to switch coupling On or Off.
4.
Press the Esc key twice to close the menus.
72
Page 73

Spectrum View
Lrange
The Lrange button allows you to set the range of the y-axis.
To set the y-axis range:
1.
Tap the Display button.
2.
Tap the Lrange button.
Enter the required value and tap the unit button.
3.
The setting is accepted immediately and the input window is closed.
4.
Press the Esc key to close the menu.
Normal Range
The Normal Range button allows you to reset Lmax and Lrange depending on the current
Reference Level. This is a good starting point for most measurements.
To set Normal Range:
1.
Tap the Display button.
2.
Tap the Normal Range button.
Lmax and Lrange are set immediately.
3.
Press the Esc key to close the menu.
Unit
The Unit button allows you to set the unit of the y-axis.
To set the y-axis unit:
1.
Tap the Display button.
The menu opens.
2.
Tap the Unit button.
Select the required unit from the dropdown list.
3.
Press the Esc key twice to close the dropdown list and the menu.
4.
73
Page 74

Page 75

Level Meter View
The Level Meter view allows you to make selective measurements at a defined frequency
(Fcent) e.g. for monitoring the field strength of a communications channel. The channel
bandwidth (CBW) for this can be set in the range 25 Hz to 40 MHz (zero span mode). Steep
filters enable precise separation of adjacent channels. The Peak detector values (for brief
pulsed signals) and RMS detector values (for variable signals) are displayed simultaneously.
One advantage of Level Meter view is that the measurement is in real time and there are no
time gaps.
Available buttons
For information about the different types of buttons and how to select them see Button bar.
⇒ Tap a button to change setting or to open the submenu.
Ref. Level / Attenuator
Ftune
CBW / EBW
Tvideo
Meas. Time
Config
Detectors
Display and Tone
75
Page 76

SignalShark User Manual
The Reference Level is an indirect way to set the current attenuator value. It defines the
5.
Press the Esc key twice to close the menus.
Background information about the Reference Level
Y-Scale Ref parameter in the Display menu.
Setting the reference level / attenuation value (Ref. Level / Attenuator)
Here you can do the following:
•
Set the Reference Level (RL) or Attenuator value (depends on the Entry Mode setting).
•
Select the RF input
•
Select the Entry Mode
•
Select +5 dB / -5 dB
maximum measurable level. For better convenience it also sets the upper axis limit of the
view.
You can stop this coupling by setting the entry mode to Abs.in the Display settings:
1. Tap the header of the desired view.
2. Tap the Display button.
3. Long tap the Lmax button.
4. Tap the Entry Mode button to select Abs.
The sensitivity of the system depends on the input attenuator setting. This setting is
determined by the Reference Level (RL) parameter. High measurement sensitivity avoids
falsification of the results due to noise generated internally by the device. On the other
hand, it is important that the device is not overloaded (saturated). Saturation can also be
caused by signals outside the frequency band, e.g. high power radio transmitters when
measuring mobile telephone signals. The reference level setting covers up to 25 dB
depending on the attached components (handle, type of antenna, etc.) and is coupled to
the setting of the input attenuator (Attenuator, Atten). The input attenuator can be
matched ideally to the measurement signal by means of its fine adjustment in steps of
0.5 dB. At the highest reference level setting, Atten = 2 dB; at the most sensitive
reference level, Atten = 0 dB.
It is possible to decouple the reference level and the input attenuator indirectly using the
Setting the reference level (Ref. Level)
You selected the desired view.
RL is selected as entry mode.
1.
Tap the Ref. Level button.
The settings dialog opens.
2.
Enter the required value and tap the unit button.
The settings is accepted immediately and the dropdown list is closed.
Or use the Rotary knob to change the value.
76
Page 77

Setting the attenuator value (Attenuator)
About the +5 dB / -5 dB buttons:
value increases by +5 dB as well).
You selected the desired view.
Attn is selected as entry mode.
Tap the Attenuator button.
1.
The settings menu opens.
2.
Enter the required value and tap the unit button.
The settings is accepted immediately and the dropdown list is closed.
Or use the Rotary knob to change the value.
Settings in the context menu
You selected the desired view.
1.
Long tap the Ref. Level or Attenuator button.
The context menu opens.
2.
Here you can do the following:
Selecting the RF input (Input)
Level Meter View
To select the RF input:
Tap the Input button and enter an input.
1.
2.
Tap the OK button to accept the setting.
The input window is closed.
3.
Press the Esc key to close the context menu.
Setting the entry mode (Entry Mode)
To select the Entry Mode:
1.
Tap the Entry Mode button to select the mode:
–
RL: Reference Level
–
Attn: Attenuation
2.
Press the Esc key to close the context menu.
Lowering/rising the level by 5 dB (+5 dB / -5 dB)
1. Tap the +5 dB or -5 dB button.
2.
Press the Esc key to close the context menu.
You can use the +5 dB / -5 dB buttons to check for over modulation and to rapidly change
the values in 5 dB steps. The buttons are only enabled if the change is possible in the
selected direction. The Y scale is fixed as soon as you make a change using the +5 dB / 5 dB buttons so that changes in level are easier to see.
As well as controlling overload, the +5 dB / -5 dB offset can also be used to distinguish an
actual measurement signal from an intrinsic spurious signal (Spurious). Regardless of the
reference level setting, the measurement signal will display the same level value until
compression occurs from overloading. In contrast, the displayed value of an intrinsic
spurious signal will change each time the reference level is changed (RL +5 dB: displayed
77
Page 78

SignalShark User Manual
Normal and EMC filter types:
corresponding views by the label EBW.
Setting the tuner frequency (Ftune)
Here you can set the tuner frequency and step width.
Setting the tuner frequency (Ftune)
You selected the desired view.
1.
Tap the Ftune button.
2.
Enter the required value and select a unit.
The settings is accepted immediately and the input window is closed.
Setting the step width (Fstep)
You selected the desired view.
1.
Long tap the Ftune button.
The context menu opens.
2.
Tap the Fstep button.
Enter the step width and select a unit.
3.
The settings are accepted immediately and the input window is closed.
4.
Press the Esc key to close the context menu.
Setting the channel / EMC bandwidth (CBW / EBW)
Here you can do the following:
1.
Select the current filter type CBW or EBW (CISPR, MIL-STD-461-F).
2.
Set the channel bandwidth (CBW) or EMC bandwidth (EBW).
Select Oversampling.
3.
The channel bandwidth (CBW) filter type allows you to select a narrow frequency range
with the desired bandwidth from a wideband spectrum and to suppress the remaining
signal components.
Instead of the CBW filter two EMC filters according to the standards CISPR and MIL-
STD-461-F can be selected.
When selecting an EMC filter, following bandwidths are available:
• CISPR: 200 Hz, 9 kHz, 120 kHz, 1 MHz
• MIL: 10 Hz, 100 Hz, 1 kHz, 10 kHz, 100 kHz, 1 MHz
The available bandwidths also depend on the Fspan setting.
After selecting an EMC filter type, the label CBW is replaced everywhere in the
78
Page 79

Level Meter View
Selecting a filter type
You selected the desired view.
1.
Long tap the CBW / EBW button. (The displayed button label depends on the currently
selected filter type.)
The context menu opens.
Tap the Filter Type button and select the desired filter type from the dropdown list.
2.
3.
Tap the head of the Button bar twice to get back to the main menu (or use the Esc key
instead).
Setting the resolution / EMC bandwidth (RBW / EBW)
Setting the bandwidth:
You selected the desired view and set the desired filter type.
1.
Tap the CBW / EBW button.
2.
Set the bandwidth by rotating the rotary knob or enter the required value and select a
unit.
The setting is accepted immediately and the input window is closed.
Enabling/disabling oversampling (CBW only)
You selected the desired view and selected CBW as filter type.
1.
Long tap the CBW button.
The context menu opens.
2.
Tap the Oversampling button to switch it On or Off.
Press the Esc key to close the context menu.
3.
Setting the video time (Tvideo)
To set the Tvideo value:
Tap the header of the desired view.
1.
2.
Tap the Tvideo button.
Enter the required value and select a unit.
3.
The settings is accepted immediately and the input window is closed.
Setting the measurement time (Meas. Time)
Here you can set the measurement time. The measurement or detector time defines the time
range used by the internal detectors to calculate their values (+Pk, RMS, -Pk, ...).
To set the measurement time:
You selected the desired view.
1.
Tap the Meas. Time button.
2.
Enter the required value and select a unit.
The setting is accepted immediately and the dropdown list is closed.
79
Page 80

SignalShark User Manual
Configuring the measurement performance (Config)
Here you can define how measurements are performed.
You selected the desired view.
1.
Tap the Config button.
2.
Then you can do the following:
Setting the number of measurements (Scan. No)
Sets the number of measurements for a single run measurement until the measurement
stops. It also affects the longtime detectors (MxP, MxR, ...).
Changing the parameters:
1.
Tap the button and set the number of measurements either by using the rotary control
knob or by entering the value.
Tap the OK button.
2.
Press the Esc key or tap the header to close the menu.
3.
Setting the measurement sequence (Seq Mode)
Here you can set the following:
•
Single: Measurement stops after the number of scan count is reached.
•
Conti: Continuous measurement.
To change the parameters:
1.
Tap the toggle button to select Single or Conti.
2.
Press the Esc key or tap the header to close the menu.
Defining the stop behavior (Stop Mode)
The stop mode value changes the behavior of the measurement engine, after the Run key is
pressed.
Hold: Measurement continues in the background.
•
Stop: Measurement stops and runs again.
•
You can stop/hold the measurement using the Run key.
80
Page 81

Level Meter View
To change these parameters:
1.
Tap the toggle button to select Hold or Stop.
2.
Press the Esc key or tap the header to close the menu.
Setting the detectors (Detectors)
With the Detectors button, the three detectors can be set to a detector type or switched off.
Open the Detectors menu:
You selected the desired view.
1.
Tap the Detectors button.
The Detectors menu opens.
2.
Then you can do the following:
Detector 1, Detector 2, Detector 3
To select the detector types:
Tap a detector and select from the dropdown menu:
1.
–
Detector 1: +Pk, Off
–
Detector 2: RMS, Off
–
Detector 3: -Pk, Smp, Avg, Off
Press the Esc or OK key to close the dropdown list.
2.
3.
Press the Esc key to close the menu.
Persistence
To set the Persistence time value:
1.
Tap the Persistence button.
The Persistence menu opens.
2.
Enter the required value and select a unit.
The settings is accepted immediately and the input window is closed.
3.
Press the Esc key to close the menu.
Changing display settings (Display and Tone)
Here you can change general display settings such as the zero point of the Y-axis, the range
of the Y-axis or the axis unit (the available settings depend on the current view). In the lower
section of the Button bar you can enable tone search and change the tone search
configuration.
To open the menu:
You selected the Level Meter view.
1.
Tap the Display and Tone button.
The menu opens.
2.
You can now do the following
81
Page 82

SignalShark User Manual
Changing display settings
Lmax
Here you can do the following:
•
Set the zero level of the y-axis
•
Set the Entry Mode: Absolute or Relative
•
Set the Coupling: On / Off (not available in Level Meter view)
When coupling is set to On, the views of a task are coupled (e.g. the axis).
To set the zero level:
1.
Tap the Lmax button.
2.
Enter the required value and tap the unit button.
The setting is accepted immediately and the input window is closed.
3.
Press the Esc key to close the menu.
Settings in the Lmax context menu
⇒ Long tap the Lmax button.
The context menu opens.
Entry Mode
The Entry Mode button allows you to determine whether values are entered as absolute or
relative values.
To set the Entry Mode:
1.
Tap the Entry Mode button to select Abs. (Absolute) or Rel. (Relative).
2.
Press the Esc key twice to close the menus.
Coupling
The Coupling button allows you to couple the level axis of the views within a task.
Thus, Coupling is not available in the Level Meter view.
To set the Coupling:
1.
Tap the Display button.
2.
Long tap the Lmax button.
The Context menu opens.
3.
Tap the Coupling button to switch coupling On or Off.
4.
Press the Esc key twice to close the menus.
82
Page 83

Level Meter View
Lrange
The Lrange button allows you to set the range of the y-axis.
To set the y-axis range:
1.
Tap the Display button.
2.
Tap the Lrange button.
3.
Enter the required value and tap the unit button.
The setting is accepted immediately and the input window is closed.
4.
Press the Esc key to close the menu.
Normal Range
The Normal Range button allows you to reset Lmax and Lrange depending on the current
Reference Level. This is a good starting point for most measurements.
To set Normal Range:
1.
Tap the Display button.
2.
Tap the Normal Range button.
Lmax and Lrange are set immediately.
3.
Press the Esc key to close the menu.
Unit
The Unit button allows you to set the unit of the y-axis.
To set the y-axis unit:
1.
Tap the Display button.
The menu opens.
2.
Tap the Unit button.
3.
Select the required unit from the dropdown list.
Press the Esc key twice to close the dropdown list and the menu.
4.
83
Page 84

SignalShark User Manual
Using tone search (Display and Tone)
Basic steps for using tone search:
Connect the antenna handle with an appropriate antenna to the SignalShark.
1.
2.
Add a RT Spectrum task (if not already available) and add a Level Meter view to the task
(see Using Tasks and Views).
3.
Tap the Level Meter view to select it.
4.
In the Main menu set Ftune to your needs.
To simplify use, you may couple Fcent of the Spectrum view and Ftune of the
Level Meter view:
a.
In the Button bar long tap the Ftune button.
Tap the Fcent = Ftune button to set it to On.
b.
5.
Set CBW according to your signal (see Setting the channel / EMC bandwidth).
To enable and configure tone search:
In the Display and Tone menu tap the Tone button to set it to On.
1.
2.
Tap the Tone Gain button and select Octave per 30 dB from the dropdown list.
This is for ruff detection of the PIM source.
3.
Tap the Tone Reference button and change the value using the rotary knob, until the
resulting tone pitch is most comfortable.
Leaf this parameter opened for easy, continuous adjustment during operation.
If you have roughly located the PIM source:
1.
Tap the Tone Gain button and select Octave per 20 dB or Octave per 10 dB from the
dropdown list.
This is for fine detection of the PIM source. The tone pitch to signal level ratio will be
more agile and precise.
2.
Tap the Tone Reference button and change the value using the rotary knob, until the
resulting tone pitch is most comfortable.
Leaf this parameter opened for easy, continuous adjustment during operation.
84
Page 85

Persistence View
The Persistence View displays the signal level over time using a color spectrum. The colors
from blue to green to red indicate the frequency of the occurrence, whereby blue is the
lowest and red the most frequent value.
Available buttons
For information about the different types of buttons and how to select them see Button bar.
⇒ Tap a button to change setting or to open the submenu.
Ref. Level / Attenuator
Fcent/Fspan, Fstart/Fstop
RBW / EBW
Meas. Time
Config
Display
85
Page 86

SignalShark User Manual
The Reference Level is an indirect way to set the current attenuator value. It defines the
5.
Press the Esc key twice to close the menus.
Background information about the Reference Level
Y-Scale Ref parameter in the Display menu.
Setting the reference level / attenuation value (Ref. Level / Attenuator)
Here you can do the following:
•
Set the Reference Level (RL) or Attenuator value (depends on the Entry Mode setting).
•
Select the RF input
•
Select the Entry Mode
•
Select +5 dB / -5 dB
maximum measurable level. For better convenience it also sets the upper axis limit of the
view.
You can stop this coupling by setting the entry mode to Abs.in the Display settings:
1. Tap the header of the desired view.
2. Tap the Display button.
3. Long tap the Lmax button.
4. Tap the Entry Mode button to select Abs.
The sensitivity of the system depends on the input attenuator setting. This setting is
determined by the Reference Level (RL) parameter. High measurement sensitivity avoids
falsification of the results due to noise generated internally by the device. On the other
hand, it is important that the device is not overloaded (saturated). Saturation can also be
caused by signals outside the frequency band, e.g. high power radio transmitters when
measuring mobile telephone signals. The reference level setting covers up to 25 dB
depending on the attached components (handle, type of antenna, etc.) and is coupled to
the setting of the input attenuator (Attenuator, Atten). The input attenuator can be
matched ideally to the measurement signal by means of its fine adjustment in steps of
0.5 dB. At the highest reference level setting, Atten = 2 dB; at the most sensitive
reference level, Atten = 0 dB.
It is possible to decouple the reference level and the input attenuator indirectly using the
Setting the reference level (Ref. Level)
You selected the desired view.
RL is selected as entry mode.
1.
Tap the Ref. Level button.
The settings dialog opens.
2.
Enter the required value and tap the unit button.
The settings is accepted immediately and the dropdown list is closed.
Or use the Rotary knob to change the value.
86
Page 87

Setting the attenuator value (Attenuator)
About the +5 dB / -5 dB buttons:
value increases by +5 dB as well).
You selected the desired view.
Attn is selected as entry mode.
Tap the Attenuator button.
1.
The settings menu opens.
2.
Enter the required value and tap the unit button.
The settings is accepted immediately and the dropdown list is closed.
Or use the Rotary knob to change the value.
Settings in the context menu
You selected the desired view.
1.
Long tap the Ref. Level or Attenuator button.
The context menu opens.
2.
Here you can do the following:
Selecting the RF input (Input)
Persistence View
To select the RF input:
Tap the Input button and enter an input.
1.
2.
Tap the OK button to accept the setting.
The input window is closed.
3.
Press the Esc key to close the context menu.
Setting the entry mode (Entry Mode)
To select the Entry Mode:
1.
Tap the Entry Mode button to select the mode:
–
RL: Reference Level
–
Attn: Attenuation
2.
Press the Esc key to close the context menu.
Lowering/rising the level by 5 dB (+5 dB / -5 dB)
1. Tap the +5 dB or -5 dB button.
2.
Press the Esc key to close the context menu.
You can use the +5 dB / -5 dB buttons to check for over modulation and to rapidly change
the values in 5 dB steps. The buttons are only enabled if the change is possible in the
selected direction. The Y scale is fixed as soon as you make a change using the +5 dB / 5 dB buttons so that changes in level are easier to see.
As well as controlling overload, the +5 dB / -5 dB offset can also be used to distinguish an
actual measurement signal from an intrinsic spurious signal (Spurious). Regardless of the
reference level setting, the measurement signal will display the same level value until
compression occurs from overloading. In contrast, the displayed value of an intrinsic
spurious signal will change each time the reference level is changed (RL +5 dB: displayed
87
Page 88

SignalShark User Manual
Setting the measurement frequency (Fcent / Fspan, Fstart / Fstop)
Here you can set the measurement frequency.
Depending on the Entry Mode setting the frequency can be entered in two modes:
•
Entry Mode = Fcent: Define a center frequency and a frequency span.
•
Entry Mode = Fstart: Define a start and stop frequency.
Selecting the entry mode (Entry Mode)
You selected the desired view.
1.
Long tap one of the two buttons Fcent / Fstart or Fspan / Fstop (display depends on the
current Entry Mode).
The context menu opens.
2.
Tap the Entry Mode button to select Fcent or Fstart.
3.
Press the Esc key to close the context menu.
If Entry Mode is set to Fcent
Setting the center frequency (Fcent)
1. Tap the Fcent or Fspan button.
2.
Enter the required value and select a unit.
The setting is accepted immediately and the dropdown list is closed.
Setting the frequency span (Fspan)
1. Tap the Fcent or Fspan button.
2.
Enter the required value and select a unit.
The setting is accepted immediately and the dropdown list is closed.
Setting the step width (Fstep)
1. Long tap the Fcent button.
The context menu opens.
2.
Tap the Fstep button.
3.
Enter the step width and select a unit.
The menu is closed.
Press the Esc key to close the context menu.
4.
If Entry Mode is set to Fstart
Setting the start frequency (Fstart)
1. Tap the Fstart button.
2.
Enter the required value and select a unit.
The setting is accepted immediately and the dropdown list is closed.
88
Page 89

Persistence View
Normal and EMC filter types:
corresponding views by the text EBW.
Setting the stop frequency (Fstop)
1. Tap the Fstop button.
2.
Enter the required value and select a unit.
The setting is accepted immediately and the dropdown list is closed.
Setting the step width (Fstep)
1. Long tap the Fstart button.
The context menu opens.
2.
Tap the Fstep button.
3.
Enter the step width and select a unit.
The menu is closed.
Press the Esc key to close the context menu.
4.
Setting the resolution / EMC bandwidth (RBW / EBW)
Here you can do the following:
1.
Set the resolution bandwidth (RBW) or EMC bandwidth (EBW).
Enable automatic setting of the resolution bandwidth (Auto RBW).
2.
3.
Set the entry mode (RBW Entry).
4.
Select the filter type (Filter Type).
The normal filter types resolution bandwidth (RBW) or channel bandwidth (CBW) allows
you to select a narrow frequency range with the desired bandwidth from a wideband
spectrum and to suppress the remaining signal components.
In the task modes Spectrum (Scan) and RT Spectrum, it is possible to use EMC filters
instead of the normal filters. When using EMC filters the following bandwidths can be
selected: 10 Hz, 100 Hz, 200 Hz, 1 kHz, 9 kHz, 10 kHz, 100 kHz, 120 kHz, 1 MHz.
The available bandwidths also depend on the Fspan setting.
After selecting the filter type EMC, the text RBW or CBW is replaced everywhere in the
Selecting the filter type
You selected the desired view.
To select the filter type:
1.
Long tap the RBW / EBW button. (The displayed button label depends on the currently
selected filter type.)
The context menu opens.
2.
Tap the Filter Type button to select Normal or EMC type.
3.
Press the Esc key to close the context menu.
89
Page 90

SignalShark User Manual
Setting the resolution / EMC bandwidth (RBW / EBW)
You selected the desired view.
To set the resolution / EMC bandwidth:
1.
Tap the RBW / EBW button.
2.
Enter the required value and select a unit.
The setting is accepted immediately and the dropdown list is closed.
Settings in the context menu
You selected the desired view.
⇒ Long tap the RBW / EBW button.
The context menu opens.
Enabling/disabling the auto resolution bandwidth (Auto RBW / Auto EBW)
Enable or disable automatic calculation of resolution bandwidth.
To set Auto RBW:
1.
Tap the Auto RBW button to switch function On / Off.
2.
Press the Esc key to close the context menu.
Setting the resolution bandwidth entry mode (RBW Entry / RBW Entry)
This button allows you to select the entry type Absolute or Relative.
To set RBW Entry:
1.
Tap the RBW Entry button to select the required type.
2.
Press the Esc key to close the context menu.
Setting the measurement time (Meas. Time)
Here you can set the measurement time. The measurement or detector time defines the time
range used by the internal detectors to calculate their values (+Pk, RMS, -Pk, ...).
To set the measurement time:
You selected the desired view.
1.
Tap the Meas. Time button.
2.
Enter the required value and select a unit.
The setting is accepted immediately and the dropdown list is closed.
90
Page 91

Persistence View
Configuring the measurement performance (Config)
Here you can define how measurements are performed.
You selected the desired view.
Tap the Config button.
1.
2.
Then you can do the following:
Selecting the persistence type (Pers. Type)
The persistence can be displayed as average or maximum.
To select the persistence type:
1.
Tap the Pers. Type button to select Avg or Max.
2.
Press the Esc button to close the menu.
Setting the number of measurements (Scan. No)
Sets the number of measurements for a single run measurement until the measurement
stops. It also affects the longtime detectors (MxP, MxR, ...).
To change the parameters:
1.
Tap the button and set the number of measurements either by using the rotary control
knob or by entering the value.
2.
Tap the OK button.
Press the Esc key or tap the header to close the menu.
3.
Setting the measurement sequence (Seq Mode)
Here you can set the following:
•
Single: Measurement stops after the number of scan count is reached.
•
Conti: Continuous measurement.
To change the parameters:
1.
Tap the toggle button to select Single or Conti.
2.
Press the Esc key or tap the header to close the menu.
Defining the stop behavior (Stop Mode)
The stop mode value changes the behavior of the measurement engine, after the Run key is
pressed.
•
Hold: Measurement continues in the background.
•
Stop: Measurement stops and runs again.
You can stop/hold the measurement using the Run key.
To change these parameters:
1.
Tap the toggle button to select Hold or Stop.
2.
Press the Esc key or tap the header to close the menu.
91
Page 92

SignalShark User Manual
Changing the general display settings
Here you can change general display settings such as the zero point of the Y-axis, the range
of the Y-axis or the axis unit (the available settings depend on the current view).
Open the Display menu:
You selected the desired view.
1.
Tap the Display button.
The Display menu opens.
2.
You can now do the following:
Lmax
Here you can do the following:
•
Set the zero level of the y-axis
•
Set the Entry Mode: Absolute or Relative
•
Set the Coupling: On / Off (not available in Level Meter view)
When coupling is set to On, the views of a task are coupled (e.g. the axis).
Setting the zero level:
1.
Tap the Lmax button.
2.
Enter the required value and tap the unit button.
The setting is accepted immediately and the input window is closed.
3.
Press the Esc key to close the menu.
Settings in the Lmax context menu
1. Long tap the Lmax button.
The context menu opens.
2.
You can now do the following:
Entry Mode
The Entry Mode button allows you to determine whether values are entered as absolute or
relative values.
To set the Entry Mode:
1.
Tap the Entry Mode button to select Abs. (Absolute) or Rel. (Relative).
2.
Press the Esc key twice to close the menus.
Coupling
The Coupling button allows you to couple the level axis of the views within a task. Thus,
Coupling is not available in the Level Meter view.
To set the Coupling:
1.
Tap the Display button.
2.
Long tap the Lmax button.
The Context menu opens.
3.
Tap the Coupling button to switch coupling On or Off.
4.
Press the Esc key twice to close the menus.
92
Page 93

Persistence View
Lrange
The Lrange button allows you to set the range of the y-axis.
To set the y-axis range:
1.
Tap the Display button.
2.
Tap the Lrange button.
Enter the required value and tap the unit button.
3.
The setting is accepted immediately and the input window is closed.
4.
Press the Esc key to close the menu.
Normal Range
The Normal Range button allows you to reset Lmax and Lrange depending on the current
Reference Level. This is a good starting point for most measurements.
To set the Normal Range:
1.
Tap the Display button.
2.
Tap the Normal Range button.
Lmax and Lrange are set immediately.
3.
Press the Esc key to close the menu.
Unit
The Unit button allows you to set the unit of the y-axis.
To set the y-axis unit:
1.
Tap the Display button.
The menu opens.
2.
Tap the Unit button.
Select the required unit from the dropdown list.
3.
4.
Press the Esc key twice to close the dropdown list and the menu.
Max. Probability / Min. Probability
The Max. Probability and Min. Probability buttons allow you to set the probability borders.
In the diagram, the probability with which a signal is detected, is represented by colors:
•
Dark blue for value selected under Min. Probability: 0.00001% to 10%
•
Dark red for the value selected under Max. Probability: 0.0001% to 100%
To set Max. Probability and Min. Probability:
1.
Tap the Display button.
2.
Tap the Max. Probability or Min. Probability button.
3.
Set the Probability using the Rotary knob.
After using the rotary knob once the value can also be selected from the dropdown list.
4.
Press the Esc or OK key to close the dropdown list.
93
Page 94

SignalShark User Manual
Limits
The Limits button allows you to select how limits are handled:
•
Clip: Signals below the Min. Probability limit (marked in dark blue) are displayed.
•
Omit: Signals below the Min. Probability limit (marked in dark blue) are hidden. This
improves the clarity of the graph.
To select a limit mode:
1.
Tap the Display button.
2.
Tap the Limits button to select Clip or Omit.
Press the Esc key to close the menu.
3.
94
Page 95

Spectrogram View
The spectrogram allows the display of the signal strength over time of a spectrum while
colors represent the signal level.
RMS, +Pk and -Pk are available as detectors. Detectors compress the high-speed real time
spectra to the selected time resolution.
Available buttons
For information about the different types of buttons and how to select them see Button bar.
⇒ Tap a button to change setting or to open the submenu.
Ref. Level / Attenuator
Fcent/Fspan, Fstart/Fstop
RBW / EBW
Meas. Time
Config
Detectors
Display
95
Page 96

SignalShark User Manual
The Reference Level is an indirect way to set the current attenuator value. It defines the
5.
Press the Esc key twice to close the menus.
Background information about the Reference Level
Y-Scale Ref parameter in the Display menu.
Setting the reference level / attenuation value (Ref. Level / Attenuator)
Here you can do the following:
•
Set the Reference Level (RL) or Attenuator value (depends on the Entry Mode setting).
•
Select the RF input
•
Select the Entry Mode
•
Select +5 dB / -5 dB
maximum measurable level. For better convenience it also sets the upper axis limit of the
view.
You can stop this coupling by setting the entry mode to Abs.in the Display settings:
1. Tap the header of the desired view.
2. Tap the Display button.
3. Long tap the Lmax button.
4. Tap the Entry Mode button to select Abs.
The sensitivity of the system depends on the input attenuator setting. This setting is
determined by the Reference Level (RL) parameter. High measurement sensitivity avoids
falsification of the results due to noise generated internally by the device. On the other
hand, it is important that the device is not overloaded (saturated). Saturation can also be
caused by signals outside the frequency band, e.g. high power radio transmitters when
measuring mobile telephone signals. The reference level setting covers up to 25 dB
depending on the attached components (handle, type of antenna, etc.) and is coupled to
the setting of the input attenuator (Attenuator, Atten). The input attenuator can be
matched ideally to the measurement signal by means of its fine adjustment in steps of
0.5 dB. At the highest reference level setting, Atten = 2 dB; at the most sensitive
reference level, Atten = 0 dB.
It is possible to decouple the reference level and the input attenuator indirectly using the
Setting the reference level (Ref. Level)
You selected the desired view.
RL is selected as entry mode.
1.
Tap the Ref. Level button.
The settings dialog opens.
2.
Enter the required value and tap the unit button.
The settings is accepted immediately and the dropdown list is closed.
Or use the Rotary knob to change the value.
96
Page 97

Setting the attenuator value (Attenuator)
About the +5 dB / -5 dB buttons:
value increases by +5 dB as well).
You selected the desired view.
Attn is selected as entry mode.
Tap the Attenuator button.
1.
The settings menu opens.
2.
Enter the required value and tap the unit button.
The settings is accepted immediately and the dropdown list is closed.
Or use the Rotary knob to change the value.
Settings in the context menu
You selected the desired view.
1.
Long tap the Ref. Level or Attenuator button.
The context menu opens.
2.
Here you can do the following:
Selecting the RF input (Input)
Spectrogram View
To select the RF input:
1.
Tap the Input button and enter an input.
2.
Tap the OK button to accept the setting.
The input window is closed.
3.
Press the Esc key to close the context menu.
Setting the entry mode (Entry Mode)
To select the Entry Mode:
Tap the Entry Mode button to select the mode:
1.
–
RL: Reference Level
–
Attn: Attenuation
2.
Press the Esc key to close the context menu.
Lowering/rising the level by 5 dB (+5 dB / -5 dB)
1. Tap the +5 dB or -5 dB button.
2.
Press the Esc key to close the context menu.
You can use the +5 dB / -5 dB buttons to check for over modulation and to rapidly change
the values in 5 dB steps. The buttons are only enabled if the change is possible in the
selected direction. The Y scale is fixed as soon as you make a change using the +5 dB / 5 dB buttons so that changes in level are easier to see.
As well as controlling overload, the +5 dB / -5 dB offset can also be used to distinguish an
actual measurement signal from an intrinsic spurious signal (Spurious). Regardless of the
reference level setting, the measurement signal will display the same level value until
compression occurs from overloading. In contrast, the displayed value of an intrinsic
spurious signal will change each time the reference level is changed (RL +5 dB: displayed
97
Page 98

SignalShark User Manual
Setting the measurement frequency (Fcent / Fspan, Fstart / Fstop)
Here you can set the measurement frequency.
Depending on the Entry Mode setting the frequency can be entered in two modes:
•
Entry Mode = Fcent: Define a center frequency and a frequency span.
•
Entry Mode = Fstart: Define a start and stop frequency.
Selecting the entry mode (Entry Mode)
You selected the desired view.
1.
Long tap one of the two buttons Fcent / Fstart or Fspan / Fstop (display depends on the
current Entry Mode).
The context menu opens.
2.
Tap the Entry Mode button to select Fcent or Fstart.
3.
Press the Esc key to close the context menu.
If Entry Mode is set to Fcent
Setting the center frequency (Fcent)
1. Tap the Fcent or Fspan button.
2.
Enter the required value and select a unit.
The setting is accepted immediately and the dropdown list is closed.
Setting the frequency span (Fspan)
1. Tap the Fcent or Fspan button.
2.
Enter the required value and select a unit.
The setting is accepted immediately and the dropdown list is closed.
Setting the step width (Fstep)
1. Long tap the Fcent button.
The context menu opens.
2.
Tap the Fstep button.
3.
Enter the step width and select a unit.
The menu is closed.
Press the Esc key to close the context menu.
4.
If Entry Mode is set to Fstart
Setting the start frequency (Fstart)
1. Tap the Fstart button.
2.
Enter the required value and select a unit.
The setting is accepted immediately and the dropdown list is closed.
98
Page 99

Spectrogram View
Normal and EMC filter types:
corresponding views by the text EBW.
Setting the stop frequency (Fstop)
1. Tap the Fstop button.
2.
Enter the required value and select a unit.
The setting is accepted immediately and the dropdown list is closed.
Setting the step width (Fstep)
1. Long tap the Fstart button.
The context menu opens.
2.
Tap the Fstep button.
3.
Enter the step width and select a unit.
The menu is closed.
Press the Esc key to close the context menu.
4.
Setting the resolution / EMC bandwidth (RBW / EBW)
Here you can do the following:
1.
Set the resolution bandwidth (RBW) or EMC bandwidth (EBW).
Enable automatic setting of the resolution bandwidth (Auto RBW).
2.
3.
Set the entry mode (RBW Entry).
4.
Select the filter type (Filter Type).
The normal filter types resolution bandwidth (RBW) or channel bandwidth (CBW) allows
you to select a narrow frequency range with the desired bandwidth from a wideband
spectrum and to suppress the remaining signal components.
In the task modes Spectrum (Scan) and RT Spectrum, it is possible to use EMC filters
instead of the normal filters. When using EMC filters the following bandwidths can be
selected: 10 Hz, 100 Hz, 200 Hz, 1 kHz, 9 kHz, 10 kHz, 100 kHz, 120 kHz, 1 MHz.
The available bandwidths also depend on the Fspan setting.
After selecting the filter type EMC, the text RBW or CBW is replaced everywhere in the
Selecting the filter type
You selected the desired view.
To select the filter type:
1.
Long tap the RBW / EBW button. (The displayed button label depends on the currently
selected filter type.)
The context menu opens.
2.
Tap the Filter Type button to select Normal or EMC type.
3.
Press the Esc key to close the context menu.
99
Page 100

SignalShark User Manual
Setting the resolution / EMC bandwidth (RBW / EBW)
You selected the desired view.
To set the resolution / EMC bandwidth:
1.
Tap the RBW / EBW button.
2.
Enter the required value and select a unit.
The setting is accepted immediately and the dropdown list is closed.
Settings in the context menu
You selected the desired view.
⇒ Long tap the RBW / EBW button.
The context menu opens.
Enabling/disabling the auto resolution bandwidth (Auto RBW / Auto EBW)
Enable or disable automatic calculation of resolution bandwidth.
To set Auto RBW:
1.
Tap the Auto RBW button to switch function On / Off.
2.
Press the Esc key to close the context menu.
Setting the resolution bandwidth entry mode (RBW Entry / RBW Entry)
This button allows you to select the entry type Absolute or Relative.
To set RBW Entry:
1.
Tap the RBW Entry button to select the required type.
2.
Press the Esc key to close the context menu.
Setting the measurement time (Meas. Time)
Here you can set the measurement time. The measurement or detector time defines the time
range used by the internal detectors to calculate their values (+Pk, RMS, -Pk, ...).
To set the measurement time:
You selected the desired view.
1.
Tap the Meas. Time button.
2.
Enter the required value and select a unit.
The setting is accepted immediately and the dropdown list is closed.
100
 Loading...