


NBM-550
Distributed by:
Air-Met Scientic Pty Ltd
Work with Confidence
Air-Met Sales/Service
P: 1800 000 744
F: 1800 000 774
E: sales@airmet.com.au
Air-Met Rental
P: 1300 137 067
E: hire@airmet.com.au
W: www.airmet.com.au
Narda Broadband Field Meter
Operating manual

This product is protected by the following patents:
China Design Patent ZL 2006 3 0303322.X
China Design Patent ZL 2006 3 0190679.1
European Design Patent 000594254-001
European Design Patent 000597836-0001
German Patent DE19536948A1
U.S. Design Patent No. US D570,235 S
U.S. Patent No. 5,877,619
Narda Safety Test Solutions GmbH
Sandwiesenstraße 7
72793 Pfullingen, Germany
® Names and Logo are registered trademarks of Narda Safety Test Solutions GmbH
and L3 Communications Holdings, Inc. –
Trade names are trademarks of the owners.
© 2015
Order no.: 2401/98.21
Version: 06/15.03, A ...
Previous version: 05/11.03, A ...
Subject to change.
Our normal guarantee and delivery terms
apply.
Printed in Germany

Contents
1 Useful information . . . . . . . . . . . . . . . . . . . . . . . . . . . . . . . . . . . . . . . . 1
1.1 Measuring electromagnetic fields . . . . . . . . . . . . . . . . . . . . . . . . . 2
1.2 About the NBM-550 . . . . . . . . . . . . . . . . . . . . . . . . . . . . . . . . . . . 2
Applications . . . . . . . . . . . . . . . . . . . . . . . . . . . . . . . . . . . . . . . . . 3
1.3 About the EHP-50 Analyzer (option). . . . . . . . . . . . . . . . . . . . . . . 3
1.4 About this operating manual . . . . . . . . . . . . . . . . . . . . . . . . . . . . . 4
Structure of this operating manual . . . . . . . . . . . . . . . . . . . . . . . . 4
User interface language . . . . . . . . . . . . . . . . . . . . . . . . . . . . . . . . 4
Characters and symbols used . . . . . . . . . . . . . . . . . . . . . . . . . . . 5
Terminology . . . . . . . . . . . . . . . . . . . . . . . . . . . . . . . . . . . . . . . . . 6
2 Safety instructions . . . . . . . . . . . . . . . . . . . . . . . . . . . . . . . . . . . . . . . . 7
2.1 Using this operating manual . . . . . . . . . . . . . . . . . . . . . . . . . . . . . 8
2.2 Proper use . . . . . . . . . . . . . . . . . . . . . . . . . . . . . . . . . . . . . . . . . . 8
2.3 Improper use. . . . . . . . . . . . . . . . . . . . . . . . . . . . . . . . . . . . . . . . . 8
2.4 Dangers from electromagnetic fields . . . . . . . . . . . . . . . . . . . . . . 9
Strong Fields. . . . . . . . . . . . . . . . . . . . . . . . . . . . . . . . . . . . . . . . . 9
Measurement Errors . . . . . . . . . . . . . . . . . . . . . . . . . . . . . . . . . . . 9
Probe is not operating properly. . . . . . . . . . . . . . . . . . . . . . . . . . . 9
2.5 Dangers when handling rechargeable batteries . . . . . . . . . . . . . 10
2.6 Dangers from AC Adapter / Charger. . . . . . . . . . . . . . . . . . . . . . 10
3 Preparing the NBM-550 for use . . . . . . . . . . . . . . . . . . . . . . . . . . . . . 11
3.1 Unpacking. . . . . . . . . . . . . . . . . . . . . . . . . . . . . . . . . . . . . . . . . . 12
Packaging . . . . . . . . . . . . . . . . . . . . . . . . . . . . . . . . . . . . . . . . . . 12
Items included. . . . . . . . . . . . . . . . . . . . . . . . . . . . . . . . . . . . . . . 12
Unpacking the probes . . . . . . . . . . . . . . . . . . . . . . . . . . . . . . . . . 13
Transport damage . . . . . . . . . . . . . . . . . . . . . . . . . . . . . . . . . . . . 13
Equipping the case . . . . . . . . . . . . . . . . . . . . . . . . . . . . . . . . . . . 14
After transport and storage . . . . . . . . . . . . . . . . . . . . . . . . . . . . . 15
Narda NBM-550 I

Contents
3.2 Instrument overview. . . . . . . . . . . . . . . . . . . . . . . . . . . . . . . . . . 16
NBM-550 . . . . . . . . . . . . . . . . . . . . . . . . . . . . . . . . . . . . . . . . . . 16
Probes . . . . . . . . . . . . . . . . . . . . . . . . . . . . . . . . . . . . . . . . . . . . 18
3.3 Power supply NBM-550 . . . . . . . . . . . . . . . . . . . . . . . . . . . . . . . 20
Operation from rechargeable batteries . . . . . . . . . . . . . . . . . . . 20
Charge state and power source indicator . . . . . . . . . . . . . . . . . 22
3.4 Power supply EHP-50 . . . . . . . . . . . . . . . . . . . . . . . . . . . . . . . . 23
Displaying the charge state and power source . . . . . . . . . . . . . 24
3.5 Connecting the probe. . . . . . . . . . . . . . . . . . . . . . . . . . . . . . . . . 24
Probe with “Push-Pull” connector . . . . . . . . . . . . . . . . . . . . . . . 25
Probe with threaded coupling connector . . . . . . . . . . . . . . . . . . 25
3.6 Connecting and setting up the EHP-50 . . . . . . . . . . . . . . . . . . . 26
3.7 Fitting the GPS module . . . . . . . . . . . . . . . . . . . . . . . . . . . . . . . 27
3.8 Using the table top tripod . . . . . . . . . . . . . . . . . . . . . . . . . . . . . . 27
4 Getting started . . . . . . . . . . . . . . . . . . . . . . . . . . . . . . . . . . . . . . . . . . 29
4.1 Switching on. . . . . . . . . . . . . . . . . . . . . . . . . . . . . . . . . . . . . . . . 30
Self test . . . . . . . . . . . . . . . . . . . . . . . . . . . . . . . . . . . . . . . . . . . 30
Calibration . . . . . . . . . . . . . . . . . . . . . . . . . . . . . . . . . . . . . . . . . 30
EHP-50 . . . . . . . . . . . . . . . . . . . . . . . . . . . . . . . . . . . . . . . . . . . 31
GPS reception . . . . . . . . . . . . . . . . . . . . . . . . . . . . . . . . . . . . . . 31
4.2 The NBM-550 operating concept . . . . . . . . . . . . . . . . . . . . . . . . 32
Measurement screen overview . . . . . . . . . . . . . . . . . . . . . . . . . 32
The menu levels. . . . . . . . . . . . . . . . . . . . . . . . . . . . . . . . . . . . . 33
Navigating in the menus . . . . . . . . . . . . . . . . . . . . . . . . . . . . . . 34
4.3 Making basic settings. . . . . . . . . . . . . . . . . . . . . . . . . . . . . . . . . 35
Selecting the language . . . . . . . . . . . . . . . . . . . . . . . . . . . . . . . 35
Setting the auto zero adjustment . . . . . . . . . . . . . . . . . . . . . . . . 35
Setting the auto off function . . . . . . . . . . . . . . . . . . . . . . . . . . . . 36
Setting the backlight. . . . . . . . . . . . . . . . . . . . . . . . . . . . . . . . . . 37
Setting the contrast . . . . . . . . . . . . . . . . . . . . . . . . . . . . . . . . . . 37
Changing the display units . . . . . . . . . . . . . . . . . . . . . . . . . . . . . 37
II NBM-550 Narda

Contents
Changing the units format. . . . . . . . . . . . . . . . . . . . . . . . . . . . . . 38
Setting the date and time . . . . . . . . . . . . . . . . . . . . . . . . . . . . . . 38
Changing the GPS display . . . . . . . . . . . . . . . . . . . . . . . . . . . . . 39
Selecting the field type and units for combination probes. . . . . . 40
Locking the keypad . . . . . . . . . . . . . . . . . . . . . . . . . . . . . . . . . . . 41
5 Measuring with the NBM-550 and HF probes . . . . . . . . . . . . . . . . . . 43
5.1 Avoiding measurement errors . . . . . . . . . . . . . . . . . . . . . . . . . . . 44
Electrostatic charges . . . . . . . . . . . . . . . . . . . . . . . . . . . . . . . . . 44
Changes in temperature . . . . . . . . . . . . . . . . . . . . . . . . . . . . . . . 44
Strong low frequency fields. . . . . . . . . . . . . . . . . . . . . . . . . . . . . 45
5.2 Measuring in Normal display mode . . . . . . . . . . . . . . . . . . . . . . 46
Selecting the result type . . . . . . . . . . . . . . . . . . . . . . . . . . . . . . . 46
Freezing a measured value . . . . . . . . . . . . . . . . . . . . . . . . . . . . 47
Storing a measured value. . . . . . . . . . . . . . . . . . . . . . . . . . . . . . 47
Add voice comments (optional). . . . . . . . . . . . . . . . . . . . . . . . . . 48
Setting the averaging time . . . . . . . . . . . . . . . . . . . . . . . . . . . . . 49
5.3 Measuring the spatial average . . . . . . . . . . . . . . . . . . . . . . . . . . 49
Measuring discrete values . . . . . . . . . . . . . . . . . . . . . . . . . . . . . 50
Measuring values continuously. . . . . . . . . . . . . . . . . . . . . . . . . . 51
5.4 Measuring in History display mode. . . . . . . . . . . . . . . . . . . . . . . 52
Display overview . . . . . . . . . . . . . . . . . . . . . . . . . . . . . . . . . . . . . 52
Evaluating the curve . . . . . . . . . . . . . . . . . . . . . . . . . . . . . . . . . . 53
Storing the graphical record . . . . . . . . . . . . . . . . . . . . . . . . . . . . 54
5.5 Measuring in XYZ display mode . . . . . . . . . . . . . . . . . . . . . . . . . 54
Display overview . . . . . . . . . . . . . . . . . . . . . . . . . . . . . . . . . . . . . 55
5.6 Measuring in Monitor display mode . . . . . . . . . . . . . . . . . . . . . . 56
Display overview . . . . . . . . . . . . . . . . . . . . . . . . . . . . . . . . . . . . . 56
5.7 Activating the alarm function. . . . . . . . . . . . . . . . . . . . . . . . . . . . 57
5.8 Audible Indicator (hot spot search) . . . . . . . . . . . . . . . . . . . . . . . 58
5.9 Measuring with a test standard. . . . . . . . . . . . . . . . . . . . . . . . . . 58
Possible displays when using a test standard. . . . . . . . . . . . . . . 60
Narda NBM-550 III

Contents
5.10 Measuring with a correction frequency . . . . . . . . . . . . . . . . . . . 62
6 Measurements with the NBM-550 and EHP-50 . . . . . . . . . . . . . . . . 63
6.1 General information . . . . . . . . . . . . . . . . . . . . . . . . . . . . . . . . . . 64
EHP-50 versions supported. . . . . . . . . . . . . . . . . . . . . . . . . . . . 64
Selecting EHP-50 mode manually . . . . . . . . . . . . . . . . . . . . . . . 64
6.2 Display types . . . . . . . . . . . . . . . . . . . . . . . . . . . . . . . . . . . . . . . 65
6.3 General settings. . . . . . . . . . . . . . . . . . . . . . . . . . . . . . . . . . . . . 66
Display wideband or peak value . . . . . . . . . . . . . . . . . . . . . . . . 66
Changing the field type and measurement range . . . . . . . . . . . 66
Changing the result type . . . . . . . . . . . . . . . . . . . . . . . . . . . . . . 67
Changing the frequency range (Span). . . . . . . . . . . . . . . . . . . . 68
Freezing a measured value . . . . . . . . . . . . . . . . . . . . . . . . . . . . 68
Storing a measured value . . . . . . . . . . . . . . . . . . . . . . . . . . . . . 68
6.4 WPM display mode (Weighted Peak method) . . . . . . . . . . . . . . 69
6.5 Spectrum display mode . . . . . . . . . . . . . . . . . . . . . . . . . . . . . . . 71
6.6 Standard display mode . . . . . . . . . . . . . . . . . . . . . . . . . . . . . . . 73
6.7 XYZ display mode . . . . . . . . . . . . . . . . . . . . . . . . . . . . . . . . . . . 74
6.8 Monitor display mode. . . . . . . . . . . . . . . . . . . . . . . . . . . . . . . . . 74
6.9 Other settings. . . . . . . . . . . . . . . . . . . . . . . . . . . . . . . . . . . . . . . 75
Unavailable functions . . . . . . . . . . . . . . . . . . . . . . . . . . . . . . . . . 75
The alarm function . . . . . . . . . . . . . . . . . . . . . . . . . . . . . . . . . . . 75
Storing measured values . . . . . . . . . . . . . . . . . . . . . . . . . . . . . . 75
Managing result data . . . . . . . . . . . . . . . . . . . . . . . . . . . . . . . . . 77
Saving and loading device settings . . . . . . . . . . . . . . . . . . . . . . 77
7 Recording and managing measured values . . . . . . . . . . . . . . . . . . 79
7.1 Storage types. . . . . . . . . . . . . . . . . . . . . . . . . . . . . . . . . . . . . . . 80
7.2 Recording measurements by timer control . . . . . . . . . . . . . . . . 80
Setting the recording parameters. . . . . . . . . . . . . . . . . . . . . . . . 81
Starting the recording . . . . . . . . . . . . . . . . . . . . . . . . . . . . . . . . 82
7.3 Recording conditional measurements (optional) . . . . . . . . . . . . 82
IV NBM-550 Narda

Contents
Setting the recording parameters . . . . . . . . . . . . . . . . . . . . . . . . 83
Starting / stopping the recording. . . . . . . . . . . . . . . . . . . . . . . . . 84
7.4 Managing result data . . . . . . . . . . . . . . . . . . . . . . . . . . . . . . . . . 84
Using the Memory Manager . . . . . . . . . . . . . . . . . . . . . . . . . . . . 85
Using the Data Viewer . . . . . . . . . . . . . . . . . . . . . . . . . . . . . . . . 85
Data Viewer display examples . . . . . . . . . . . . . . . . . . . . . . . . . . 86
8 Setup and configure . . . . . . . . . . . . . . . . . . . . . . . . . . . . . . . . . . . . . . 89
8.1 Configuring the interface. . . . . . . . . . . . . . . . . . . . . . . . . . . . . . . 90
8.2 Saving and loading instrument settings . . . . . . . . . . . . . . . . . . . 90
Menu overview . . . . . . . . . . . . . . . . . . . . . . . . . . . . . . . . . . . . . . 90
Changing a setup name . . . . . . . . . . . . . . . . . . . . . . . . . . . . . . . 91
Setting the power on behavior . . . . . . . . . . . . . . . . . . . . . . . . . . 92
8.3 Displaying instrument and probe information . . . . . . . . . . . . . . . 92
8.4 Using the NBM-550 as a controller. . . . . . . . . . . . . . . . . . . . . . . 93
8.5 Activating instrument options . . . . . . . . . . . . . . . . . . . . . . . . . . . 94
9 PC software . . . . . . . . . . . . . . . . . . . . . . . . . . . . . . . . . . . . . . . . . . . . . 95
9.1 Using the PC software . . . . . . . . . . . . . . . . . . . . . . . . . . . . . . . . 96
Minimum system requirements. . . . . . . . . . . . . . . . . . . . . . . . . . 96
9.2 Connecting the NBM-550 . . . . . . . . . . . . . . . . . . . . . . . . . . . . . . 97
9.3 Working with the PC software. . . . . . . . . . . . . . . . . . . . . . . . . . . 97
9.4 Updating the firmware. . . . . . . . . . . . . . . . . . . . . . . . . . . . . . . . . 98
9.5 Performing a reset . . . . . . . . . . . . . . . . . . . . . . . . . . . . . . . . . . . 99
10 Overview of all menus and functions . . . . . . . . . . . . . . . . . . . . . . . 101
10.1 Measurement menus . . . . . . . . . . . . . . . . . . . . . . . . . . . . . . . . 102
10.2 Main menu . . . . . . . . . . . . . . . . . . . . . . . . . . . . . . . . . . . . . . . . 103
10.3 Measurement Settings (HF mode) . . . . . . . . . . . . . . . . . . . . . . 104
Page 1. . . . . . . . . . . . . . . . . . . . . . . . . . . . . . . . . . . . . . . . . . . . 104
Page 2. . . . . . . . . . . . . . . . . . . . . . . . . . . . . . . . . . . . . . . . . . . . 105
10.4 Measurement Settings (LF mode) . . . . . . . . . . . . . . . . . . . . . . 106
Page 1. . . . . . . . . . . . . . . . . . . . . . . . . . . . . . . . . . . . . . . . . . . . 106
Narda NBM-550 V

Contents
Page 2 . . . . . . . . . . . . . . . . . . . . . . . . . . . . . . . . . . . . . . . . . . . 107
10.5 Data Logger . . . . . . . . . . . . . . . . . . . . . . . . . . . . . . . . . . . . . . . 108
10.6 Memory Manager. . . . . . . . . . . . . . . . . . . . . . . . . . . . . . . . . . . 110
10.7 Interface . . . . . . . . . . . . . . . . . . . . . . . . . . . . . . . . . . . . . . . . . . 111
10.8 Information . . . . . . . . . . . . . . . . . . . . . . . . . . . . . . . . . . . . . . . . 112
10.9 Setup . . . . . . . . . . . . . . . . . . . . . . . . . . . . . . . . . . . . . . . . . . . . 113
10.10 Clock . . . . . . . . . . . . . . . . . . . . . . . . . . . . . . . . . . . . . . . . . . . . 114
11 Instrument maintenance . . . . . . . . . . . . . . . . . . . . . . . . . . . . . . . . . 115
11.1 Cleaning the instrument. . . . . . . . . . . . . . . . . . . . . . . . . . . . . . 116
11.2 Replacing / removing the batteries . . . . . . . . . . . . . . . . . . . . . 117
11.3 Disposal . . . . . . . . . . . . . . . . . . . . . . . . . . . . . . . . . . . . . . . . . . 119
Rechargeable batteries . . . . . . . . . . . . . . . . . . . . . . . . . . . . . . 119
Instrument . . . . . . . . . . . . . . . . . . . . . . . . . . . . . . . . . . . . . . . . 119
11.4 Checking instrument functions. . . . . . . . . . . . . . . . . . . . . . . . . 120
Appropriate test sources . . . . . . . . . . . . . . . . . . . . . . . . . . . . . 122
12 Specifications. . . . . . . . . . . . . . . . . . . . . . . . . . . . . . . . . . . . . . . . . . 123
12.1 Display . . . . . . . . . . . . . . . . . . . . . . . . . . . . . . . . . . . . . . . . . . . 124
12.2 Measurement functions (with HF probes) . . . . . . . . . . . . . . . . 124
12.3 Result memory. . . . . . . . . . . . . . . . . . . . . . . . . . . . . . . . . . . . . 125
12.4 Interfaces . . . . . . . . . . . . . . . . . . . . . . . . . . . . . . . . . . . . . . . . . 125
12.5 Options . . . . . . . . . . . . . . . . . . . . . . . . . . . . . . . . . . . . . . . . . . 126
12.6 General specifications . . . . . . . . . . . . . . . . . . . . . . . . . . . . . . . 127
12.7 Standards compliance . . . . . . . . . . . . . . . . . . . . . . . . . . . . . . . 128
12.8 AC Adapter / Charger . . . . . . . . . . . . . . . . . . . . . . . . . . . . . . . 128
12.9 EHP-50 . . . . . . . . . . . . . . . . . . . . . . . . . . . . . . . . . . . . . . . . . . 128
12.10 CE Declaration of Conformity . . . . . . . . . . . . . . . . . . . . . . . . . 129
12.11 Declarations of origin . . . . . . . . . . . . . . . . . . . . . . . . . . . . . . . . 131
VI NBM-550 Narda

Contents
13 Ordering information . . . . . . . . . . . . . . . . . . . . . . . . . . . . . . . . . . . . 133
13.1 NBM-550. . . . . . . . . . . . . . . . . . . . . . . . . . . . . . . . . . . . . . . . . . 134
13.2 Probes . . . . . . . . . . . . . . . . . . . . . . . . . . . . . . . . . . . . . . . . . . . 134
High frequency probes . . . . . . . . . . . . . . . . . . . . . . . . . . . . . . . 134
Low frequency probes . . . . . . . . . . . . . . . . . . . . . . . . . . . . . . . 135
13.3 Accessories . . . . . . . . . . . . . . . . . . . . . . . . . . . . . . . . . . . . . . . 135
14 Glossary. . . . . . . . . . . . . . . . . . . . . . . . . . . . . . . . . . . . . . . . . . . . . . . 137
Index. . . . . . . . . . . . . . . . . . . . . . . . . . . . . . . . . . . . . . . . . . . . . . . . . . 141
Narda NBM-550 VII

Contents
VIII NBM-550 Narda

1 Useful information
This chapter contains basic information about measuring
electromagnetic fields, about using the NBM-550, and about
the structure of this operating manual.
1.1 Measuring electromagnetic fields (page 2)
1.2 About the NBM-550 (page 2)
1.3 About the EHP-50 Analyzer (option) (page 3)
1.4 About this operating manual (page 4)
Narda NBM-550 1

1 Useful information
1.1 Measuring electromagnetic fields
In today’s world, practically everyone lives and works in an
environment surrounded by technical equipment that
generates electromagnetic fields. Our recognition of the
problems associated with such fields and our depth of
information in this area has increased as the effects of such
fields on the human body have been examined more
closely. Various authorities have long defined limit values
designed to protect users from the dangers of exposure to
such emissions.
1.2 About the NBM-550
The Narda Broadband Field Meter NBM-550 provides
virtually everyone concerned with this subject with an
instrument for measuring non-ionizing radiation with utmost
accuracy within the frequency range from 100 kHz to
60 GHz (depending on the probe used). The instrument has
a wide range of functions, yet it is very easy to use. It also
features a handy design, robust casing, long battery life, and
high measurement accuracy.
Probes for various measurement applications are
connected to the NBM-550 basic unit. Flat frequency
response probes are available, as well as so-called shaped
probes that evaluate the field according to a specific human
safety standard. These probes are calibrated separately
from the measuring instrument, and include a non-volatile
memory containing the probe parameters and calibration
data. They can therefore be used with any instrument in the
NBM-500 family without any loss in calibration accuracy.
The PC software supplied with the instrument allows you to
remote control the NBM-550 as well as to export saved
measurement data and to analyze the results.
2 NBM-550 Narda

1.3 About the EHP-50 Analyzer (option)
Applications
The NBM-550 makes precision measurements for human
safety purposes, particularly in workplace environments
where high electric or magnetic field strengths are likely. It
can also be used to demonstrate the electromagnetic
compatibility (EMC) of devices and equipment.
Examples:
• Measuring field strengths as part of general safety
regulations
• Measuring the field strengths around transmitting and
radar equipment to establish safety zones and for
monitoring during operations
• Measuring the field strength emanating from mobile
phone repeaters and satellite communications systems
to ensure compliance with human safety limit values
• Measuring the field strength in the industrial workplace
environment, such as plastics welding equipment, RF
heating, tempering, and drying equipment
• Measurements to ensure the safety of persons using
diathermy equipment and other medical equipment that
generates high frequency radiation
• Field strength measurements in TEM cells and absorber
chambers
1.3 About the EHP-50 Analyzer (option)
The optionally available EHP-50 Analyzer can be used to
measure either electric or magnetic fields in the frequency
range between 1 Hz and 400 kHz. As well as wideband
measurement, it is also possible to perform spectrum
analysis on the LF fields because of the FFT function built
into the EHP-50. It is also possible to display the numerical
value of the highest peak in the spectrum (“Highest Peak”).
The IEC 6176-2 Weighted Peak method (time domain) is
provided to allow standard-compliant measurement of
complex signal shapes. The EHP-50 Analyzer can be
operated as a stand-alone system since it has its own power
supply and built-in signal processing. It forms a complete
measuring system for recording, processing, storing and
displaying LF field measurements when used in conjunction
Narda NBM-550 3

1 Useful information
with the NBM-550 as a convenient control and display unit.
Even so, the EHP-50 still performs the measurement by
itself and transfers the results to the NBM-550 in digital form
via an optical cable.
Note: The NBM-550 only supports the functions of the EHP-50 for
versions EHP-50D and EHP-50F. The EHP-50D has a
frequency range restricted to 5 Hz – 100 kHz and does not
yet support the Weighted Peak method.
1.4 About this operating manual
Structure of this operating manual
This operating manual is divided into two main parts:
1. Operating the NBM-550 and measuring with HF probes:
You will find all the information you need to make the
most important settings on the NBM-550 and easily
carry out most of the measurement tasks using HF
probes in chapters 3 to 5 and 7 to 9.
2. Measuring with the EHP-50 Analyzer:
You will find all the information you need to operate the
EHP-50 LF Analyzer in conjunction with the NBM-550 in
chapter 6. Cross references are provided to information
already described in other chapters.
3. Overview of menus and their functions:
You will find an overview of all menu functions, together
with a brief description of each function in chapter 10.
You can use this overview to find a function quickly.
User interface language
English language terms are used in this operating manual to
describe the user interface.
You can display the user interface of the NBM-550 in other
languages (see “Selecting the language” on page 35).
Please note that if you change the language, the
displayed terms will differ from those described in this
manual.
4 NBM-550 Narda

1.4 About this operating manual
Characters and symbols used
Various elements are used in this operating manual to
indicate special meanings or particularly important
passages in the text.
Symbols and terms used in warnings
According to the American National Standard ANSI Z535.62006, the following warnings, symbols, and terms are used
in this document:
The general danger symbol warns of risk of serious injury
when used with the signal words CAUTION, WARNING,
and DANGER. Follow all the instructions in order to avoid
injuries or death.
NOTICE
CAUTION
WARNING
DANGER
Indicates a danger that results in damage to or destruction
of the instrument.
Indicates a hazardous situation which, if not avoided,
could result in minor or moderate injury.
Indicates a hazardous situation which, if not avoided,
could result in death or serious injury.
Indicates a hazardous situation which, if not avoided, will
result in death or serious injury.
Structure of warnings
All warnings are structured as follows:
SIGNAL WORD
Type and source of danger
Consequences of failure to observe warning
Instructions for preventing danger
Narda NBM-550 5

1 Useful information
! Important instruction
✓ Requirement
Instruction
1.
2.
3.
Result
Bold type Control element
CAPITALS Menu name
Symbols and marks used in this document
Indicates an instruction that must be followed to avoid
danger.
Indicates a requirement that must be met before the next
instruction can be carried out, e.g.
✓ The instrument is switched off.
Indicates a single instruction, e.g.
Switch the instrument on.
Sequence of instructions
Indicates a sequence of instructions that must be carried
out in the order given.
Indicates the result of carrying out an instruction, e.g.
The instrument starts a self test.
Indicates a control element on the instrument, e.g.
Press the ENTER key.
Indicates a menu name, e.g.
Open the MAIN menu.
Terminology
Item Meaning
Battery Rechargeable battery
Dry battery Non-rechargeable battery
6 NBM-550 Narda

2 Safety instructions
This chapter contains important instructions on how to use
the NBM-550 safely. Please therefore read this chapter
carefully and follow the instructions closely.
2.1 Using this operating manual (page 8)
2.2 Proper use (page 8)
2.3 Improper use (page 8)
2.4 Dangers from electromagnetic fields (page 9)
2.5 Dangers when handling rechargeable batteries
(page 10)
2.6 Dangers from AC Adapter / Charger (page 10)
Narda NBM-550 7

2 Safety instructions
2.1 Using this operating manual
Carefully read this entire operating manual before you
start using the instrument.
Keep this operating manual so that it is available to
everyone who uses the instrument, and ensure that this
operating manual is with the instrument if you pass it on
to a third party.
2.2 Proper use
The NBM-550 is designed to measure and evaluate
electromagnetic fields.
Only use the instrument for the purpose and under the
conditions for which it has been designed.
In particular, observe the technical data given in the
“Specifications” on page 123.
Proper use also includes:
observing any national accident prevention regulations
at the place of use.
ensuring that the instrument is used only by
appropriately qualified and trained persons.
2.3 Improper use
The NBM-550 is not a warning device that gives active
notice of the existence of dangerous fields by means of a
visible or audible warning signal.
Remember that this instrument is a measuring device,
not a warning device.
Carefully observe the actual measurement displayed
when you are approaching an unknown field source.
If in doubt, use an additional warning device such as
“RadMan” or “Nardalert”, available from Narda Safety
Test Solutions.
8 NBM-550 Narda

2.4 Dangers from electromagnetic fields
2.4 Dangers from electromagnetic fields
Strong Fields
Very high field strengths can occur in the vicinity of
some radiation sources.
Do not cross or ignore safety barriers or markings.
Persons with electronic implants (e.g. heart
pacemakers) must avoid danger zones.
Measurement Errors
Metallic labels (stickers) affixed to the yellow sensor
area of the probe can lead to measurement errors,
usually an underestimation of the electromagnetic field
strength.
Affix labels of any type only to the black probe shaft.
If the instrument malfunctions, take it out of service and
contact your Narda Service Center. The addresses are
listed at the end of this operating manual and on the
Internet at http://www.narda-sts.com.
Probe is not operating properly
Possibly present high radiation values are not
recognized.
Check probes for proper operation with a signal source
before using this measuring instrument. This is
especially important for thermocouples because the
sensors can be affected by various mechanical and
environmental stressors.
Narda offers portable sources to accomplish this important step (see “Accessories” on page 135).
Before beginning any RF radiation measurement, always
inform yourself of the frequencies and field strengths that
you could expect to encounter.
Narda NBM-550 9

2 Safety instructions
2.5 Dangers when handling rechargeable batteries
When handled improperly, rechargeable batteries can
overheat, explode, or ignite.
Only use the NBM-550 with NiMH rechargeable
batteries (AA, Mignon).
Do not use dry batteries.
Do not replace individual batteries; always replace the
entire set.
Always use identical batteries.
Never touch both poles of the batteries simultaneously
with a metal object.
Make sure you insert the batteries correctly as shown on
the base of the battery compartment.
Always close the battery compartment immediately after
replacing batteries.
Never use the NBM-550 with the battery compartment
open.
2.6 Dangers from AC Adapter / Charger
You could experience electric shock from the AC
adapter/charger.
Do not use the instrument when the casing is damaged
because parts carrying dangerous voltages could be
exposed.
Do not use an AC adapter/charger that has been moved
from a cold to a warm room, thereby forming
condensation.
Only use the AC adapter/charger indoors and at
temperatures between 0 °C and +40 °C.
The AC adapter/charger could be destroyed if the
voltage specification on the AC adapter/charger does
not match the AC line voltage.
Only use the AC adapter/charger if the voltage
specification on the AC adapter/charger matches the AC
line voltage.
10 NBM-550 Narda

3 Preparing
the NBM-550 for use
This chapter describes all you need to do before starting to
use the NBM-550.
3.1 Unpacking (page 12)
3.2 Instrument overview (page 16)
3.3 Power supply NBM-550 (page 20)
3.4 Power supply EHP-50 (page 23)
3.5 Connecting the probe (page 24)
3.6 Connecting and setting up the EHP-50 (page 26)
3.7 Fitting the GPS module (page 27)
3.8 Using the table top tripod (page 27)
Narda NBM-550 11

3 Preparing the NBM-550 for use
3.1 Unpacking
Packaging
The packaging is designed to be re-used as long as it has
not been damaged.
Keep the original packaging and use it whenever the
instrument needs to be shipped or transported.
Items included
Check that all the following items have been delivered.
NBM-550
•NBM-550
• 4 x NiMH Mignon/AA batteries (packaged separately)
•Case
• Probe (type and quantity as ordered)
• AC Adapter / Charger
• Shoulder strap
• USB cable
• Table top tripod
• CD-ROM with NBM-TS PC software
• Operating manual
• Calibration certificate
EHP-50 Set for NBM-550
• EHP-50 Analyzer
• 12 V AC/DC charger
• Optical connector (bridged, for stand-alone operation)
• Extension rod, 0.5 m
• Optical cable, 10 m
• O/E converter USB, RP-02
• CD-ROM with EHP-TS PC software and
operating manual (PDF file)
• 2 foam inlays for the case
12 NBM-550 Narda

3.1 Unpacking
Unpacking the probes
1. Carefully open the foil bag to prevent damage to the
probes. Use a pair of scissors to cut open the outer edge
of the bag at the plug end of the probe.
2. Hold the probe by the plug body to remove it from the
bag.
3. Place the probe in the appropriate recess in the case to
store it safely.
The plastic bag is no longer needed and can be disposed of.
Note: Factory-fresh NBM probes are usually supplied sealed in a
plastic foil under vacuum. This prevents any degradation
due to moisture and means that the recommended
calibration interval can be increased by as much as 6
months. This is intended to ensure that the recommended
period of use of 24 months can still be achieved even if
delays occur in transit or due to customs procedures.
Transport damage
NOTICE
Instrument/accessories damaged during
transportation
Using damaged instrument/accessories can lead to
subsequent damage.
Check the instrument and all accessories for damage
when you have unpacked them.
If the instrument is damaged, contact your Narda
Service Center.
The addresses of your Narda Service Center are listed at
the end of this operating manual and on the Internet at
http://www.narda-sts.com.
Narda NBM-550 13

3 Preparing the NBM-550 for use
2
2
2
1
6
5
4
3
7
8
1
3
4
5
6
6
7
9
8
2
Equipping the case
You can use the case provided to store a wide range of
optional accessories in addition to the items supplied. The
figures below show the compartments in the case lid and
case base.
Case lid
1 Test generator
2Probe
3 O/E converter USB
4 GPS fitting set
5 RadMan Personal Monitor
6 Compartment for cables
and operating manual
7 O/E converter RS232
8 Extension rod
Case base
1 NBM-550 basic unit
2 GPS (assembled)
3 Rechargeable batteries
4 AC adapter
5 Table top tripod
6 Probe or EHP-50 with
foam inlays
7 NBM-520 basic unit
8 Shoulder strap
9 Earphone
14 NBM-550 Narda

3.1 Unpacking
After transport and storage
NOTICE
Condensation on an instrument can lead to
damage
Condensation can form on an instrument that has
been stored at a low temperature when it is brought
into a warm room. It may be damaged if used.
Wait until all visible condensation has evaporated from
the instrument surface to avoid damaging the instrument.
Note: The instrument is not ready for use until it has reached a
temperature within the operating range of -10 to +50 °C.
Narda NBM-550 15

3 Preparing the NBM-550 for use
1
3
4
5
2
6
8
7
6a
6b
6c
6d
3.2 Instrument overview
NBM-550
Figure 1 Device overview NBM-550
16 NBM-550 Narda

1 Probe connector socket
ESC
OK
2 Microphone
3Display
4 Operating panel
Function keys
Used to select the menu functions shown on the display
ESC key
Used to exit from a menu / reset functions and measured values
OK key
Used to open a menu or function / confirm a setting
UP/DOWN arrow keys
Used to select menus and functions / change values / lock the keypad / change the
contrast
ON/OFF key
Used to switch the instrument on or off
Charge Charge state
Indicates the charge state (red = rapid charging, green = trickle charging)
Status Operating status
Indicates the instrument operating status: Green = normal operation, red = remote
operation, flashing red = firmware update or exceeded alarm threshold
5 Tripod bush
6 Electrical and optical connectors
6a Multi-function socket for USB / GPS (optional) / external trigger
6b Earphone
6c Optical connector
6d AC Adapter / Charger
7 Tripod bush (on back of instrument)
8 Battery compartment (on back of instrument)
3.2 Instrument overview
Narda NBM-550 17

3 Preparing the NBM-550 for use
9
10a
12
13
11
13a 13c 13e
13d
13b
10b
Probes
Figure 2 Overview of probes
18 NBM-550 Narda

3.2 Instrument overview
Probe (various models available)
9 Probe head
10 Probe plug
10a Probe with threaded coupling connector
10b Probe with “Push-Pull” connector
EHP-50
11 Probe head
12 Tripod bush
13 Electrical and optical connections
13a Optical connector
13b AUX signal input for electrical signals – can only be used with EHP-TS.
13c ON / OFF button
13d Status LED
13e Charger unit
Please follow the instructions in the EHP-50 operating manual.
Meanings of colors and flashing rates:
• No charger unit connected:
– Red, rapid flashing: cannot set up communications
– Green, rapid flashing: setting up communications
– Green, slow flashing: data transfer in progress (flashing rate depends on
measurement speed)
• Charger unit connected (no data transfer possible):
– Orange, rapid flashing: battery charging
– Green, rapid flashing: battery fully charged
Narda NBM-550 19

3 Preparing the NBM-550 for use
3.3 Power supply NBM-550
The power supply is normally taken from the batteries
provided. You can use the AC Adapter / Charger supplied as
an alternative power source.
Note: We do not recommend that you operate the instrument with
the AC Adapter / Charger connected, as this can
significantly degrade the measurement performance of the
NBM-550. The measurement accuracy figures given in the
specifications cannot then be guaranteed.
Operation from rechargeable batteries
The rechargeable NiMH batteries for this device are
packaged separately. You must insert the batteries into the
device and then charge them up fully before using the
device. The charging cycle takes about 2 hours. Do not use
dry batteries in this device.
Improper pole positions
The batteries can explode and damage the instrument
if you put the batteries in the wrong way round.
Observe the positions of the positive and negative
poles marked in the battery compartment.
NOTICE
Inserting the batteries
1. Open the battery compartment cover underneath the
device by undoing the two screws with a screwdriver or
the edge of a coin.
2. Take the NiMH batteries provided out of their protective
foil and insert them into the battery compartment. Make
sure you put them in the right way round. The positions
of the positive and negative poles are marked in the
battery compartment by "+" and " –" respectively. Match
the markings to the markings on the batteries.
3. Close the battery compartment cover and do up the two
screws again to secure it.
20 NBM-550 Narda

3.3 Power supply NBM-550
Charging the batteries
If the device is probably not going to be used for several
weeks, it should be recharged before being stored to avoid
the possibility of deep discharge of the batteries. If storage
is likely to be for a period of more than two months, remove
the batteries from the device after recharging them.
Note: Deep discharge can significantly reduce the battery
capacity. This is indicated by unusually short charging
cycles. If this happens, the nominal capacity can be
restored by discharging and recharging the batteries several
times. Regeneration usually takes four to five recharging
cycles.
WARNING
Charging the batteries with wrong AC
Adapter / Charger
Overheating, explosion, or ignition of rechargeable
batteries/batteries or their surroundings
You must use only the AC Adapter / Charger supplied
to charge the batteries.
Note: A complete charge cycle takes about 2 hours (with the
instrument switched off).
Starting the charge cycle
✓ The AC line voltage must match the operating voltage of
the AC Adapter / Charger.
1. Connect the AC Adapter / Charger to the charging
socket of the NBM-550.
2. Connect the AC Adapter / Charger to the AC line
The charge cycle starts.
The Charge LED glows red during the entire charge
cycle.
As soon as the batteries are fully charged, the AC Adapter /
Charger switches to trickle charge mode and the Charge
LED glows green.
Narda NBM-550 21
3 Preparing the NBM-550 for use
Proper handling of rechargeable batteries
Observe the following precautions when handling
rechargeable batteries:
• Always handle the batteries with care.
• Do not drop or damage the batteries or expose them to
excessively high temperatures.
• Do not leave the batteries inside or outside the
instrument for more than one or two days in a very warm
place (e.g. in an automobile).
• Do not leave the discharged batteries in the unused
instrument for a long period of time.
• Do not store the batteries for more than six months
without discharging and recharging them in the
meantime.
• Avoid deep discharging the batteries as this could cause
the cells to reverse polarity and make them useless.
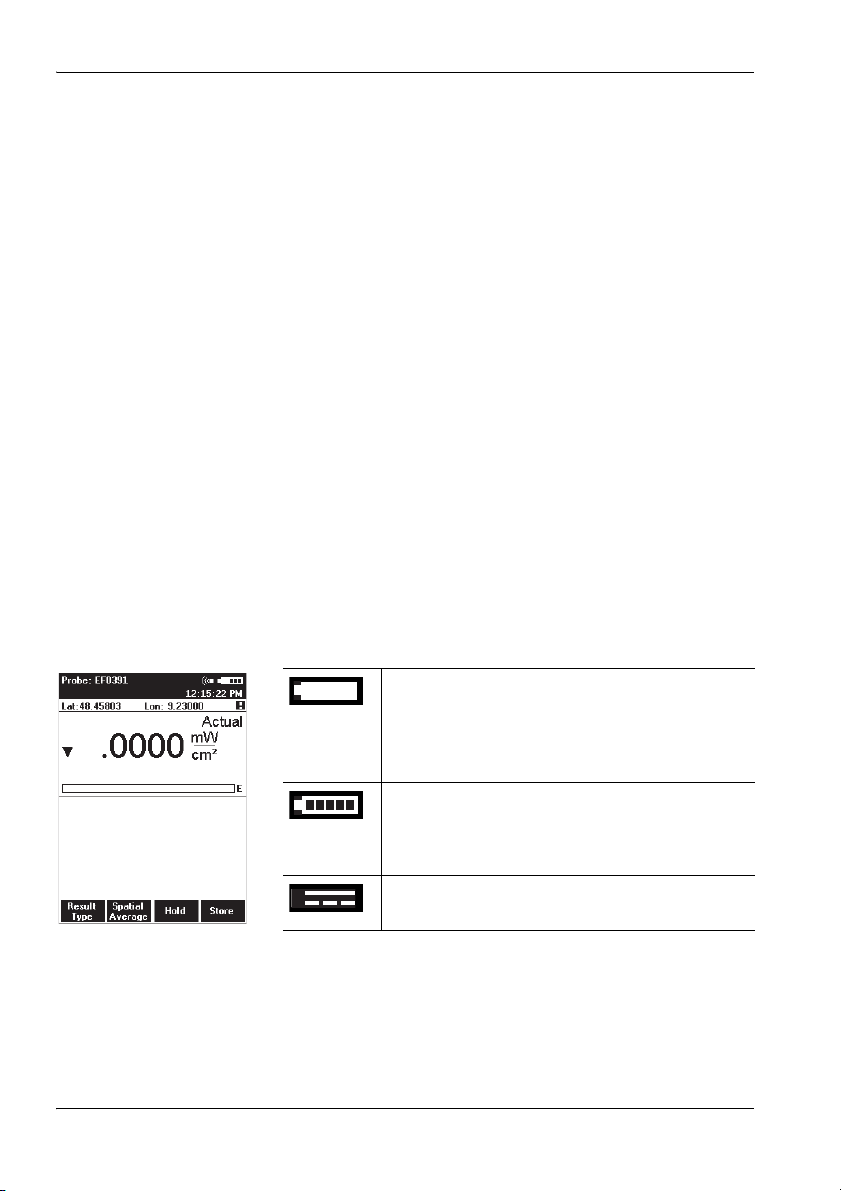
Charge state and power source indicator
The battery charge state and the power source used are
indicated at the top right of the display:
Table 1 Charge state and power source indication
Power is supplied by the rechargeable batteries:
• Continuous display: Charge level = 10%
• Flashing display: Charge level ≤ 5%
If the charge level drops to ≤ 5%, the instrument will
switch off automatically within a few minutes.
Power is supplied by the rechargeable batteries.
The charge level is indicated in 20% steps by black
bars within the battery symbol. The batteries are
fully charged when all five bars are shown.
Power is supplied by the AC Adapter / Charger.
The batteries are charged at the same time.
22 NBM-550 Narda

3.4 Power supply EHP-50
The EHP-50 Analyzer is fitted with a fixed, nonexchangeable rechargeable battery which provides at least
9 hours of operation when fully charged. The battery is
charged using the charger unit supplied. It takes
approximately 6 hours to recharge the battery if it is almost
completely discharged.
Note: You cannot operate the EHP-50 with the charger unit
connected as this considerably affects the measurement
characteristics of the EHP-50.
Charging the battery
Charging the battery with an unsuitable
charger unit
The battery can overheat, explode or ignite
spontaneously.
You must only use the charger unit supplied with the
device for charging the battery.
3.4 Power supply EHP-50
WARNING
Starting the charging cycle:
✓ The AC line voltage must match the operating voltage of
the charger unit.
Connect the charger unit to the AC line first and then
connect it to the charger socket on the EHP-50
(Figure 2 13d).
The charging cycle starts and the DATA LED flashes
rapidly:
– Orange: battery charging
– Green: battery fully charged
Note: You can charge the battery with the EHP-50 switched on or
off. If you connect the charger unit when a measurement is
in progress, the measurement will stop and the charging
cycle starts. The EHP-50 remains switched off when you
unplug the charger unit.
Narda NBM-550 23

3 Preparing the NBM-550 for use
Displaying the charge state and power source
The charge state of the battery is shown upper left in the
display during the measurement. The same symbols are
used as in the charge state display for the NBM-550 (see
“Charge state and power source indicator” on page 22).
Correct handling of rechargeable batteries
Avoid completely (deep) discharging the batteries as
otherwise the polarity of a cell may reverse and make the
battery useless.
3.5 Connecting the probe
Probe is not operating properly
High radiation values that may be present cannot be
recognized when a probe is defective.
Check probes for proper operation with a signal source
before using this measuring instrument. This is
especially important for thermocouples because the
sensors can be affected by various mechanical and
environmental stressors.
Narda offers portable sources to accomplish this important step (see “Accessories” on page 135).
Before beginning any RF radiation measurement,
always advise yourself of the frequencies and field
strengths that you could expect to encounter.
WARNING
There are many different probes available for different
applications for the NBM-550. You can find more information
about the order numbers and specifications of the probes
under “Ordering information” on page 133, as well as in
24 NBM-550 Narda

3.5 Connecting the probe
the data sheets of the NBM-550 and probes. These
documents can also be downloaded from the Narda web
site on the Internet at http://www.narda-sts.com.
„
NOTICE
Wrong handling of the probe
Damage of the probe head
Always hold the probe at the metal plug end.
Probe with “Push-Pull” connector
Connecting the probe
✓ The red mark on the probe plug (10) is pointing towards
the front of the instrument.
Push the probe plug (10) straight down into the probe
socket (1) until it clicks into place.
Disconnecting the probe
Slide the sleeve on the probe plug (10) upwards and pull
the probe upwards to remove it.
Probe with threaded coupling connector
The latest devices use threaded connectors for the link
between the probe and the basic unit. The basic unit is fitted
with a longer socket which can be recognized by the
approximately 1 cm long threaded section. Probes fitted
with "push-pull" connectors can still be used with this
connector. Probes with threaded coupling connectors can
only be used with this new, longer connecting socket.
Connecting the probe
✓ Make sure the guide lug on the probe plug (10) is
pointing towards the front of the instrument.
Push the probe plug (10) straight down into the probe
socket (1) and tighten the threaded coupling using your
thumb and forefinger. Never tighten the coupling using
pliers or other tools.
Narda NBM-550 25

3 Preparing the NBM-550 for use
Disconnecting the probe
Undo the threaded coupling using your thumb and
forefinger and then pull the probe upwards to release it.
3.6 Connecting and setting up the EHP-50
The EHP-50 Analyzer is connected using the optical cable
supplied with it. Using the optical cable for data transfer
prevents the field distortions that are caused by electrically
conductive cables.
To connect the probe:
1. Plug the black plug of the optical cable into the optical
connector of the NBM-550 (Figure 1: 6c). The plug will
only fit in one direction and will lock in place when light
pressure is applied.
2. EHP-50D: Plug the white plug of the optical cable into
the optical connector of the EHP-50 (Figure 2: 13a). The
plug nose must be aligned with the indentation on the
socket.
– or –
EHP-50F: Plug the black plug of the optical cable into the
optical connector of the EHP-50 with the groove of the
grip pointing towards the center of the probe. The plug
can only be inserted in this one direction and will lock
into place when you apply light pressure.
Observe the following when setting up the device:
Do not use a conductive tripod.
Make sure that the device is at least one meter above the
ground.
Make sure that the device is at least two meters from any
person and from the NBM-550.
26 NBM-550 Narda

3.7 Fitting the GPS module
The GPS receiver module is included in the option set as an
accessory (see “Ordering information” on page 133). It
allows you to determine the exact position of the instrument
using GPS (Global Positioning System).
Fitting the GPS module
1. Remove the probe.
2. Place the handle against the casing from below so that
the thread of the knurled screw fits into the tripod bush.
3. Do up the knurled screw and plug the GPS module cable
into the multi-function socket.
4. Reconnect the probe.
Note: The GPS module can only be used with NBM-550 devices
for which a GPS option was ordered and activated (see
“Activating instrument options” on page 94). When
reordered, activation is carried out via the supplied
activation code (contained in the Options Passport
Document).
3.7 Fitting the GPS module
3.8 Using the table top tripod
A table top tripod is included with the NBM-550. This makes
the instrument easier and more convenient to use.
Attaching the tripod
1. Loosen the butterfly screw on the side.
You can now easily move the ball joint and tripod
screw.
2. Screw the knurled screw into the threaded bush on the
back panel of the NBM-550.
3. Fold out the tripod legs, adjust the position of the
instrument and tighten up the butterfly screw.
4. To remove the tripod at any time, loosen the butterfly
screw and unscrew the knurled screw.
Narda NBM-550 27

3 Preparing the NBM-550 for use
28 NBM-550 Narda

4 Getting started
This chapter describes how to switch on the NBM-550, the
operating concept, and the initial settings.
4.1 Switching on (page 30)
4.2 The NBM-550 operating concept (page 32)
4.3 Making basic settings (page 35)
Narda NBM-550 29

4 Getting started
4.1 Switching on
Now that you have prepared the instrument for use, you can
switch it on.
Press the ON/OFF key to switch the instrument on.
The instrument performs a self test.
Self test
The progress of the self test is displayed on the screen. The
instrument is not ready for use until all tests have been
completed successfully and OK is displayed.
If an error message is displayed
Press the ON/OFF key to switch the instrument off and
then switch it on again.
If an error message is displayed again:
Switch the instrument off and contact your nearest
Service Center.
Calibration
The NBM-550 and probes must be calibrated at certain
intervals to guarantee the quality of the measurement
results. If you have missed the date for a calibration, this will
be displayed by default after the self test is complete.
Note: You can deactivate the calibration date reminder
under MAIN/MEASUREMENT SETTINGS/Cal. Date
Check.
To display the measurement screen after viewing the
calibration date reminder
Press the Continue key.
Tip: You can view the last and next calibration dates under
MAIN/INFORMATION/DEVICE INFORMATION and
.../PROBE INFORMATION.
30 NBM-550 Narda

4.1 Switching on
EHP-50
If the EHP-50 is already switched on and connected to the
NBM-550, the NBM-550 will detect it automatically and will
switch to EHP-50 measurement mode when the switch on
routine has completed.
If you connect or switch on the EHP-50 after you have
started the NBM-550, you will have to select EHP-50 mode
manually (see “Selecting EHP-50 mode manually” on
page 64).
GPS reception
The GPS receiver module is included as an accessory in
the option set (see “Ordering information” on page 133)
and allows you to determine the exact position of the
instrument using GPS (Global Positioning System).
When the GPS module is connected, the coordinates along
with other information are shown in the upper section of the
display.
If GPS cannot be received despite a GPS module
connection (e.g. in closed rooms), Lat: and Lon: are
displayed without appropriate values.
If GPS was received but suddenly interrupted (e.g. due to
poor signal quality or an unplugged GPS plug), the most
recent available coordinations remain displayed and are
marked with an exclamation point.
The information is explained in the table below.
Table 2 GPS symbols in the display
Symbol Meaning
Lat Latitude
Lon Longitude
Warning that the displayed GPS data is not up to date.
GPS data is being received with enhanced accuracy
(deviation < 3 m).
This type of reception is only possible in regions
where the corresponding satellite service is available.
Narda NBM-550 31

4 Getting started
1
3
4
6
7
8
9
5
10
11
2
Note: After connecting to the GPS module, it can take up to
5 minutes for a position display to appear. The waiting time
decreases with short-term switching off and on, i.e. when
the satellite positions are only marginally changed. GPS
reception may be impaired by high field levels and, in
particular, by field levels in the L-band (1 to 2 GHz).
4.2 The NBM-550 operating concept
When the self test is complete, the display switches to
measurement mode.
The settings will depend on the power on behavior that you
have selected (see “Saving and loading instrument
settings” on page 90).
Measurement screen overview
The description below gives you an initial overview of the
display elements in the measurement screen display. Other
elements are described in the chapters dealing with the
individual functions and in the “Overview of all menus and
functions” on page 101.
1 Probe used (also shows the EHP-50 battery charge
state and the selected frequency range if the EHP-50
is used)
2 Alarm function (switched on)
3 Battery charge state
4 Time
5 Warning: displayed GPS data is not up to date.
6 Present display mode selection
7 Measured value and units
8 Bar graph of measured value with display of field
type: E = E field, H = H field, S = S field
9 Function keys
10 Out of measurement range display.
– Down arrow: signal too small
– Up arrow: signal too large.
11 GPS coordinates (optional)
32 NBM-550 Narda

4.2 The NBM-550 operating concept
The menu levels
The NBM-550 operating concept is context sensitive. It only
displays the functions that are possible based on the probe
being used, the settings selected, and the menu that is
open.
Settings are divided into different levels to separate
functions that are used often from those that are used less
often:
• 1st level: The measurement screen
• 2nd level: The main menu
• 3rd level: The sub-menus
• 4th level: The functions
The measurement screen
You can directly activate a function or make a selection by
pressing one of the four function keys in the measurement
screen.
All other settings have to be made using the menus
described below.
The main menu
The MAIN menu opens when you press the OK key. All
other settings are made from this menu.
The most impor tant settings are once again assigned to the
function keys in the MAIN menu.
Narda NBM-550 33

4 Getting started
The sub-menus
Select a sub-menu from the MAIN menu and press the OK
key to open the selected sub-menu.
The example shows: DATA LOGGER.
The function levels
Select a function from the sub-menu and press the OK key
to open the selected function. You can then make the
settings you require or read out the desired information.
The example shows: Timer Start.
Navigating in the menus
Use the following keys to navigate through the menus and
select the functions:
Function keys
Select the function shown in the display, which depends
on the menu selected
ESC
OK
34 NBM-550 Narda
ESC key
Exits from the menu (with or without making changes)
OK key
Opens a menu or a function and confirms a setting
▲/▼ key
Select a menu or a function and change values

To simplify the description of the selection of a menu level or
function, the menu and function names will be listed one
after the other and separated by a slash.
Example: To change the start time, open the Timer Start function
(MAIN/DATA LOGGER/...).
You can find an overview of all the menus and functions
under “Overview of all menus and functions” on
page 101.
4.3 Making basic settings
When the self test is complete, the display switches to
measurement mode.
The settings will depend on the power on behavior that you
have selected (see “Saving and loading instrument
settings” on page 90).
Selecting the language
You can set the user interface language to a different
language.
4.3 Making basic settings
Changing the user interface language
1. Open the Language function (MAIN/MEASUREMENT
SETTINGS/...).
2. Use the arrow keys ▲/▼ to select the desired language
and then press the OK key to confirm the setting.
Setting the auto zero adjustment
Zeroing compensates for the influence of temperature
fluctuations on the measurement results of the basic unit.
No measurement is possible during a zeroing, which takes
7s. For this period, the last measurement value is displayed
and a remaining time counter is shown.
If the Auto-Zero Interval function is activated, an automatic
zero adjustment will be performed at the specified intervals.
Narda NBM-550 35

4 Getting started
The following settings are possible:
• 6/15/30/60 minutes: Auto zero every 6/15/30/60
minutes
• off: Auto zero function disabled
The default setting is 15 minutes.
Changing the setting
1. Open the Auto-Zero Interval function (MAIN/
MEASUREMENT SETTINGS/Next/...).
2. Use the arrow keys ▲/▼ to select the desired setting and
then press the OK key to confirm the setting.
Starting a zero adjustment manually
1. Open the MAIN menu.
2. Press the Zero function key.
A zero adjustment is performed and the instrument fi-
nally changes back to the measurement display.
Setting the auto off function
You can set the instrument to switch off automatically after a
specified time without any activity to protect the batteries
from being discharged.
The following settings are possible:
• 6/15/30/60 minutes: Switches off after 6/15/30/60
minutes
• off: Auto off function disabled
The default setting is 15 minutes.
Note: The auto off function is disabled during long-term
measurements using the Timer Logging function (see
“Recording measurements by timer control” on
page 80) and Conditional Logging function (see
“Recording conditional measurements (optional)” on
page 82).
Changing the setting
1. Open the Auto Power-Off function (MAIN/
MEASUREMENT SETTINGS/Next/...).
2. Use the arrow keys ▲/▼ to select the desired setting and
then press the OK key to confirm the setting.
36 NBM-550 Narda

4.3 Making basic settings
Setting the backlight
The display backlight is activated every time you press a key
and switches off after a specified time to preserve battery
power.
The following settings are possible:
• off: Backlight disabled
• 5/10/30/60 s: Backlight switches off after 5/10/30/60
seconds
• permanent: Backlight is switched on permanently
The default setting is 10 seconds.
Changing the switch off delay time
1. Open the LCD Backlight function (MAIN/
MEASUREMENT SETTINGS/Next/...).
2. Use the arrow keys ▲/▼ to select the desired setting and
then press the OK key to confirm the setting.
Setting the contrast
✓ The display shows the measurement screen.
Press the arrow keys ▲ or ▼ to increase or decrease the
contrast.
Changing the display units
Power density or field strength units can be selected when
using normal (flat) probes. The units can simply be
converted, while the measurement will stay the same.
Results from shaped probes are always displayed in %. A
shaped probe provides a frequency sensitivity that mirrors a
particular standard, such as ICNIRP.
Values in % (of standard) are related to the equivalent
power density limit, not to the field strength. A shaped probe
can also display results as a field strength or power density
value for a selected frequency of this particular standard
(see “Measuring with a test standard” on page 58). This
is why the display unit can be selected for shaped probes as
well.
Narda NBM-550 37
4 Getting started
Changing the units
1. Open the MAIN menu.
2. Press the Unit function key repeatedly until the desired
units are displayed.
Units are set in the following order:
3. Press the ESC key.
The display reverts to the measurement screen and
2
– mW/cm2 – V/m – A/m – W/m2 –...
W/m
the selected units are displayed.
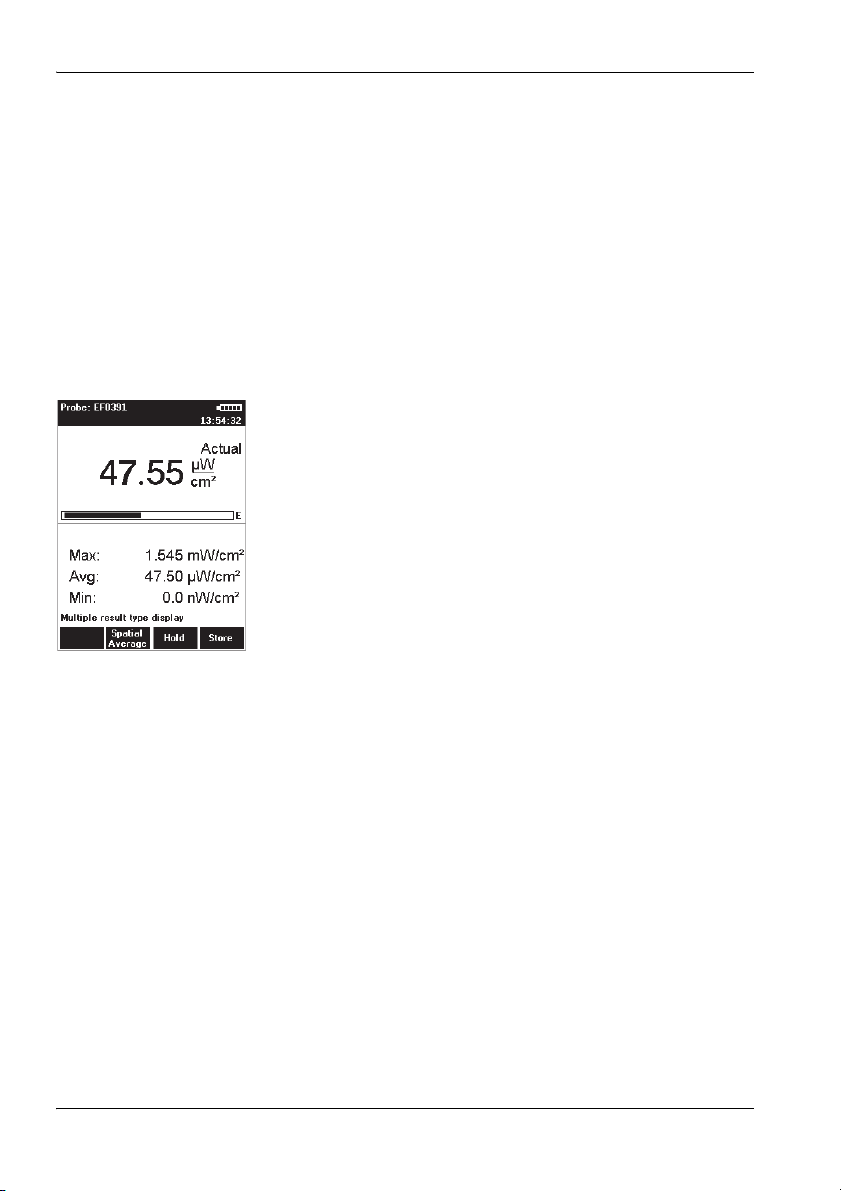
Changing the units format
The units for the measurement values can be displayed in
two different formats:
• Fixed Triad
Units are displayed with a fixed format
(mW/cm
• Variable Triads
Units are adjusted to match the size of the measured
value (47.55 μW/cm
Tip: We recommend that you use the Variable Triads
2
, W/m2, V/m, A/m)
2
in the example shown on the left)
format for signals that have a high dynamic range,
otherwise the display of very small or very large
values will be meaningless.
Changing the units format
1. Open the Results Format function (MAIN/
MEASUREMENT SETTINGS/Next/...).
2. Use the arrow keys ▲/▼ to select the desired format and
then press the OK key to confirm the setting.
Note: Be careful not to make read-off errors due to the different
formats when you use the Variable Triads setting.
Setting the date and time
Before you start using the instrument, set the date and time.
This is particularly important if you want to save measured
values, because the date and time of measurement are also
saved.
38 NBM-550 Narda

4.3 Making basic settings
Tip: Instead of making the setting manually, you can use
the PC software supplied to synchronize the date and
time.
Setting the date and time
1. Open the Clock function in the MAIN menu.
2. Set the time format:
– Select the Time Format function,
– use the arrow keys ▲/▼ to select the 12-hour or
24-hour time format and press the OK key to confirm
the selection.
3. Set the time:
– Select the Time function,
– use the </> function keys to select the seconds,
minutes, or hours, and use the arrow keys ▲/▼ to
change the value. If you choose the 12-hour time
format, you must also select AM or PM,
– press the OK key to confirm the selection.
4. Set the date format:
– Select the Date Format function,
– use the arrow keys ▲/▼ to select the format
(mm/dd/yyyy, dd.mm.yyyy, yyyy-mm-dd) and press
the OK key to confirm the selection.
5. Set the date:
– Select the Date function,
– use the </> function keys to select the day, month or
year and use the arrow keys ▲/▼ to change the value,
– press the OK key to confirm the selection.
Changing the GPS display
There are three formats used for displaying GPS
coordinates:
• DMS: (d)dd° mm’ ss.s’’ N
Example: Lat: 48° 48’ 10.5’’ N / Lon: 9° 15’ 00.0’’ E
• MinDec: (-)(d)dd° mm.mmm’
Example: Lat: 48° 48.175’ / Lon: 9° 15.000’
• DegDec: (-)(d)dd.ddddd°
Example: Lat: 48.29166° / Lon: 9.25000°
The default setting is DegDec.
Narda NBM-550 39

4 Getting started
Selecting the field type and units for combination probes
Combination probes can measure E-fields and H-fields at
the same time. If you are using a combination probe, you
can select the field that is to be measured and the units that
are to be shown in the lower half of the display
The simultaneous display of E and H-Field is only possible
in NORMAL display mode.
Setting the field type
1. Select the Combi Probe Use function (MAIN/
MEASUREMENT SETTINGS/Next...).
2. Use the arrow keys ▲/▼ to select the desired format:
– E-Field and H-Field
– E-Field only
– H-Field only
3. Press the OK key to confirm the selection.
Setting the units
1. Select the E+H Field Units function (MAIN/
MEASUREMENT SETTINGS/Next...).
2. Use the arrow keys ▲/▼ to select the desired units:
– Selected Unit: The units selected using the Unit
function key will be used
– V/m for E-fields and A/m for H-fields
3. Press the OK key to confirm the selection.
Note: For simultaneous display of E and H-Field, always select the
NORMAL display mode. In the other modes, display is
limited to the S-Field.
40 NBM-550 Narda

4.3 Making basic settings
Locking the keypad
To prevent inadvertent operation of any of the keys, you can
lock the keypad.
Locking the keypad
Press the two arrow keys ▲/▼ simultaneously.
The message KEY LOCK is displayed.
Unlocking the keypad
Press the two arrow keys ▲/▼ simultaneously again.
Narda NBM-550 41

4 Getting started
42 NBM-550 Narda

5 Measuring with the
NBM-550 and HF probes
This chapter describes how to use the NBM-550 in
combination with HF probes for measurements.
You can find information on how to use the EHP-50 LF
Analyzer in the chapter “Measurements with the
NBM-550 and EHP-50” on page 63.
You can find an overview of all the menus and functions
under “Overview of all menus and functions” on
page 101.
5.1 Avoiding measurement errors (page 44)
5.2 Measuring in Normal display mode (page 46)
5.3 Measuring the spatial average (page 49)
5.4 Measuring in History display mode (page 52)
5.5 Measuring in XYZ display mode (page 54)
5.6 Measuring in Monitor display mode (page 56)
5.7 Activating the alarm function (page 57)
5.8 Audible Indicator (hot spot search) (page 58)
5.9 Measuring with a test standard (page 58)
5.10 Measuring with a correction frequency (page 62)
Narda NBM-550 43

5 Measuring with the NBM-550 and HF probes
5.1 Avoiding measurement errors
The measurement result can be falsified by external
influences when measuring electromagnetic fields.
Considerable measurement deviations can occur under
certain circumstances, particularly when measuring low
field strengths. The following tips may be of assistance in
recognizing sources of interference so as to avoid
measurement errors. The following factors can affect the
measurement result:
• Electrostatic charges
• Changes in temperature
• Strong low frequency fields (e.g. due to high tension
lines)
Electrostatic charges
The following effect will be noted with all field strength
meters: If you move the probe quickly, excessive field
strength values will be displayed which do not reflect the
actual field conditions. This effect is caused by electrostatic
charges.
The NBM has been designed in a way that minimizes this
effect. However, if you move the probe very quickly, field
strengths on the order of a few V/m can be displayed.
Recommendation: Hold the device steady during the measurement. Delete the
stored maximum values and average values by pressing
Clear before using the Max, Average or Max Average
result types. Do not touch the probe at any time during the
measurement.
Changes in temperature
Ambient temperature changes as well as warming by direct
sunlight will create offset voltages that may impact the
measurement result. Zeroing eliminates offset voltages
within the instrument only. Offset voltages caused by the
probe or the probe connector can not be eliminated.
Particularly probes with thermocouple sensors are affected
by offset voltages until stable temperature conditions are
achieved.
44 NBM-550 Narda

5.1 Avoiding measurement errors
Recommendation: Try to avoid heating caused by direct sunlight during
measurements with thermocouple probes. Consider an
adequate settling time for stabilization of the probe in case
of temperature changes. A settling time of about 15 minutes
will ensure stabilized conditions. Extremely high steps of the
environmental temperature changes may require longer
settling times.
Strong low frequency fields
The result display when measuring high frequency
electromagnetic fields can be falsified by low frequency
fields. Wideband probes will detect signals even if the
frequency is well outside the specified measurement range
(out-of-band attenuation is 20 dB/decade). A probe
specified to measure from 100 kHz to 3 GHz would
therefore attenuate signals down to 100 Hz by at least
60 dB (= field strength / 1000). However, very high field
strengths of several thousand V/m can occur in the vicinity
of high tension lines. An RF wideband probe would
therefore register several V/m.
Recommendation: Thoroughly inspect every measurement location before any
measurement and make a note of any possible sources of
interference, such as high tension lines in the vicinity. Keep
a critical eye on any possible increase in the minimum
display value (noise floor) which may indicate interfering
factors. Increase the distance from the source of low
frequency interference or use a probe that has a higher
frequency cutoff point at the lower end of its range.
Further useful information can be found under FAQ at
www.narda-sts.com
Narda NBM-550 45

5 Measuring with the NBM-550 and HF probes
E
154 s
5.2 Measuring in Normal display mode
The latest measurement results are displayed in Normal
mode. You can also display maximum and average values.
Selecting the result type
You can select the following result displays on the NBM-550:
Result type Description
Actual The latest measured value of field strength is shown numerically and as a bar
Max Hold The maximum field strength measured during the course of the measurement is
Average The average of the current measurement values is determined and displayed.
Max Avg The maximum value of the measured average values is displayed.
154 s
The following averages are determined for result types Average or Max Average:
• Linear average of power values (e.g. W/m
• Root mean square (RMS) of field strength values (e.g. V/m or A/m)
Both types of average give the same result. The averaging process conforms to current safety
standards for high frequency fields and normally takes place over a period of 6 minutes. The units
of the measured value can be switched at any time without affecting the results already averaged.
graph.
frozen and displayed numerically and as a separate line on the bar graph. The bar
graph continues to display the latest value.
Press the ESC (Clear) key to reset the display value to 0.
The progress in forming the average value is shown as a bar graph until the first
valid average value has been determined. The remaining measurement time in
seconds is shown in the window on the right. You can set the averaging time in the
MEASUREMENT SETTINGS/Averaging Time menu (see “Setting the
averaging time” on page 49).
The bar graph disappears once the first average value has been determined. The
average result is then valid. As the measurement continues, the average is formed
continuously using the results obtained during the time window (averaging time).
Press the ESC (Clear) key to reset the display value to 0.
The average values are determined as described for the Average result type. Only
the highest average value determined during the course of the measurement is
displayed.
Press the ESC (Clear) key to reset the display value to 0.
2
or mW/cm2)
46 NBM-550 Narda

5.2 Measuring in Normal display mode
Selecting a result type
Press the Result Type key repeatedly until the desired
result type is shown.
Freezing a measured value
Press the Hold key to freeze the measured value being
displayed at the moment.
Hold appears flashing in the display.
The button label changes to Release.
Press the Release key to resume the measurement.
Storing a measured value
You can store the measured values in an internal memory in
the NBM-550 for documentation.
Storing a measured value
Press the Store key.
The measured value displayed at the moment is
stored with the date and time under the index number
displayed. The remaining memory space is also displayed.
You can also trigger storing of measured values using an
external signal.
Storing measured values using an external trigger
1. Open the External Trigger function
(MAIN/INTERFACE/...).
2. Use the arrow keys ▲/▼ to select the On setting and
press the OK key.
3. Connect the trigger cable (optional accessory) to the
multi-function socket and connect the other end (BNC) to
a control contact (e.g. closing contact of an odometer).
4. A measured value will be stored every time the contact
closes (just like pressing the Store function key).
Narda NBM-550 47

5 Measuring with the NBM-550 and HF probes
Add voice comments (optional)
You can add a spoken comment up to 30 s in length to the
stored measured values. To do this, you must activate voice
recording (default setting: deactivated).
Note: The user is automatically asked for voice comments. When
measurements are saved manually, this is carried out by
pressing the STORE button. Comments are only recorded
before beginning the measurement at measurement series
(Condition Logging or Timer Logging).
Activating voice recording
1. Open the Voice Recorder function
(MAIN/DATA LOGGER/...).
2. Use the arrow keys ▲/▼ to select the On setting and
press the OK key.
The voice recording function is activated.
Adding a comment
✓ You have just stored a measured value.
The message “Voice recorder enabled” is displayed
when voice recording has been enabled.
In case you do not want any comments:
Press Cancel Record.
In case you want to record a comment:
1. Press the Start Record function key and speak the
comment.
– Speak in the direction of the microphone (above the
display) from a distance of 20 to 30 cm, and
– speak loudly enough, so that the bar reaches at least
two-thirds of its maximum length.
Recording starts. The bar graph (VU meter) shows
the level of the recorded signal.
2. Press the Stop Record function key to stop recording.
3. Press the Store Record function key in order to save
voice comments.
Note: The recording will automatically be ended after 30 seconds.
Before saving, you have the option to repeat the voice
comments by pressing the Repeat Record button, or to
proceed without comments by pressing the Cancel Record
button.
48 NBM-550 Narda

5.3 Measuring the spatial average
Setting the averaging time
You can set the time used to form the average for Average
and MaxAvg display types in the range 4 s to 30 min in
2 second steps.
Setting the time and resolution
1. Open the Averaging Time function
(MAIN/MEASUREMENT SETTINGS/...).
2. Select the digit using the </> function keys.
3. Change the value using the arrow keys ▲/▼.
4. Press the OK key to confirm the settings.
5.3 Measuring the spatial average
You can determine the spatial average of the field strength
using the Spatial Average function. This function is used to
determine the exposure to electromagnetic radiation of the
human body, for example.
Two measurement methods are available:
• Discrete
Individual results are recorded and averaged. You can
measure at specific locations using this method.
• Continuous
Results are recorded and averaged continuously during
the time that the probe is moved around the area of
interest. You can measure the field strength affecting a
particular space using this method.
Selecting the measurement method
1. Open the Spatial AVG Mode function
(MAIN/MEASUREMENT SETTINGS/Next/...).
2. Use the arrow keys ▲/▼ to select the method and press
the OK key.
Narda NBM-550 49

5 Measuring with the NBM-550 and HF probes
Measuring discrete values
✓ You selected Discrete as the Spatial AVG Mode.
1. Press the Spatial Average key.
Spatial measurement mode is displayed
The result counter top left shows #0, indicating that
no values have been measured yet.
2. Press the Measure key.
The measured value is stored,
#1 indicates that one result has been stored,
Pos. 1 shows the measured value.
3. Press the Measure key again to make another
measurement.
The measured values are stored,
#... indicates the number of measurements.
The average of all the measurements is shown after
Pos. 1 .
4. When you have recorded all the measured values,
– you can either add positions so you can record more
results (e.g. at different locations) or
– you can store the entire measurement.
Adding a position
1. Press the Add Position key.
Pos. 2 is displayed,
The result counter shows #0.
2. Record new measured values as described above.
3. You can add more positions and record more results if
necessary.
Avg Pos shows the average value for all the positions
measured, along with the positions used to form the
average (e.g. 1-4 for positions 1 through 4).
You can store the measurement results when you have
recorded all the measured values.
Storing the results
Press the Store key.
The average of all positions and the averages for
each separate position are stored.
50 NBM-550 Narda

5.3 Measuring the spatial average
Measuring values continuously
Making the measurement
✓ You have selected Continuous as Spatial AVG Mode.
1. Press the Spatial Average key.
Spatial measurement mode is displayed.
2. Press the Start key.
The measurement starts. The elapsed measurement
time is shown top left in the display.
3. Move the NBM-550 evenly around the space to be
measured. Press the Stop key to end the measurement.
Pos.1 displays the measured average value.
4. You can then
– add positions to record further average values or
– store the entire measurement.
Note: The NBM-550 emits an audible signal every second to
assist you in moving it evenly.
Adding a position
1. Press the Add Position key.
Pos. 2 is displayed,
the elapsed time counter shows 00:00 s.
2. Record new measured values as described above.
3. You can add more positions and record more results if
necessary.
Avg Pos shows the average value for all the positions
measured, along with the positions used to form the
average (e.g. 1-4 for positions 1 through 4).
You can store the measurement results when you have
recorded all the measured values.
Storing the results
Press the Store key.
The average of all positions and the averages for
each separate position are stored.
Narda NBM-550 51

5 Measuring with the NBM-550 and HF probes
12
3
4
5.4 Measuring in History display mode
You can display the progress of the measurement versus
time in History mode. You can use the cursor to mark
individual points on the curve and display the associated
values.
Changing to History display mode
✓ The display is in measurement mode.
1. Press the OK key to open the MAIN menu.
2. Press the Display function key until Display: History
appears.
3. Press the ESC key to return to measurement mode.
The curve is shown in the lower half of the display
screen.
Note: The progress memory is always active. As a result, a valid
curve already appears when changing to History mode. It
will be deleted, however, as soon as you change a
parameter that affects the measurement result (e.g.
correction frequency or time span). The rolling
measurement memory deletes all values that date back
longer than the set time period.
Display overview
1 Defines the Y axis display range as the maximum
measurable field strength
2 X axis time resolution (time period per line of
graduation)
3 Graphic display of measurement progress
The record begins at the right hand edge. The latest
measurement is always shown at the right hand
edge.
4 The functions are the same as in Normal display
mode (see “Measuring in Normal display mode”
on page 46.
52 NBM-550 Narda

5.4 Measuring in History display mode
max
min
t
E/H
Changing the time period:
1. Open the History Time Scale function
(MAIN/DATA LOGGER/...).
2. Use the arrow keys ▲/▼ to set the desired time and
press the OK key to confirm the setting.
Evaluating the curve
1. Press the Hold key to freeze the curve.
Hold is shown flashing in the display.
Recording continues in the background.
2. Press the Marker ON function key to show the cursor.
Other items will also appear in the display:
– Cross-hairs for selecting the measurement point
– MAX shows the maximum value at the cursor position
– MIN shows the minimum value at the cursor position
– Time shows the time the measurement at the cursor
position was made
– Interval shows the display resolution (cursor step
size)
3. Press the / function keys to move the cursor to the
left or right or press the Highest Peak function key to
move the marker to the highest measured value.
4. Press the Marker OFF function key to switch off the
cursor.
5. Press the Release function key to unfreeze the display.
The measurement record and curve are updated to
show the changes since the Hold key was pressed.
Significance of MAX and MIN values
Measured values are recorded continuously as the curve is
recorded. However, the cursor can only select discrete time
points which have to be used to produce the graphic display.
The maximum and minimum values measured within the
corresponding time window (interval) are displayed for
these time points (see figure, left). A maximum of 200
measurement intervals are shown in the progress memory.
Narda NBM-550 53

5 Measuring with the NBM-550 and HF probes
Storing the graphical record
The measurement values of the progress memory can be
saved.
To save the measurement value recording:
1. Press the Hold key to freeze the curve.
2. Press the Store History function key.
The measurement value recording is saved. You can
add a comment if this function is activated.
5.5 Measuring in XYZ display mode
In XYZ display mode, the measurement values of the three
spatial axes as well as the isotropic field strength calculated
from them are displayed simultaneously.
Note: XYZ display mode is not available for all probe types. If the
probe you are using does not support XYZ mode, it will not
be available for selection.
Changing to XYZ display mode
✓ The display is in measurement mode.
1. Press the OK key to open the MAIN menu.
2. Press the Display function key until Display: XYZ
appears.
3. Press the ESC key to return to measurement mode.
54 NBM-550 Narda

5.5 Measuring in XYZ display mode
1
3
4
5
2
6
RSS X2Y2Z
2
++=
Display overview
1 Result type Actual displays the field strength in the
upper display area
2 Display of the RSS (root sum square) field strength
value calculated from the X, Y, and Z values (valid for
units V/m and A/m, linear addition for mW/cm
2
W/m
):
3 Graphic display of field strength showing the selected
field type (E-field in the example shown here)
4 Only the latest measured values for each axis can be
shown (result type Actual)
5 Measured values for the three axes
6The Result Type function only applies to the upper
display area. The other functions are as for Normal
display mode (see “Measuring in Normal display
mode” on page 46).
Changing the result type
Note: You can only change the result type for the upper display
area.
Press the Result Type function key to select a different
result type (refer to “Selecting the result type” on
page 46 for information about result types).
2
and
Narda NBM-550 55

5 Measuring with the NBM-550 and HF probes
1
4
3
5
2
6
5.6 Measuring in Monitor display mode
Monitor display mode simultaneously shows the maximum,
average, and minimum measured values as well as the
latest measured value.
Changing to Monitor display mode
✓ The display is in measurement mode.
1. Press the OK key to open the MAIN menu.
2. Press the Display function key until Display: Monitor
appears.
3. Press the ESC key to return to measurement mode.
Measurement and determination of the maximum,
average, and minimum values starts immediately.
Display overview
1 Field strength result type shown in upper display area
2 Display of latest field strength value
3 Remaining averaging time
4 Graphic display of field strength showing the selected
field type (E-field in the example shown here)
5 Calculated values since the beginning of
measurement:
– Max: Maximum value
– Avg: Average value
– Min: Minimum value
6The Result Type function cannot be selected. Other
functions are as for Normal display mode (see
“Measuring in Normal display mode” on page 46).
Resetting the values shown in the lower display area:
Press the ESC (Clear) key.
56 NBM-550 Narda

5.7 Activating the alarm function
5.7 Activating the alarm function
The alarm function allows you to enter a limit value. The
instrument outputs an audible signal and the Status LED
flashes red when this limit value is exceeded.
This function is useful for checking limit values or for
signaling an early warning of dangerous field strengths, for
example.
The possible alarm limits are:
• Normal probes
Table 3 Setting ranges of the limit values (in 1 dB steps)
Measuring range Minimum Maximum
V/m 100 mV/m 100 kV/m
A/m 250 μA/m 250 A/m
2
W/m
2
mW/cm
• Shaped probes: 0.1% – 10,000% (in 1 dB steps)
Defining the alarm limits
1. Open the Alarm Limit function
(MAIN/MEASUREMENT SETTINGS/...).
2. Use the arrow keys ▲/▼ to change the value and press
the OK key to confirm the setting.
25 μW/m
2.5 nW/cm
2
2
25 MW//m
2.5 kW/cm
2
2
Activating the alarm function
1. Open the Alarm Function function
(MAIN/MEASUREMENT SETTINGS/...).
2. Use the arrow keys ▲/▼ to select On and press the OK
key to confirm the setting.
The symbol is shown in the display when the
alarm function is activated (see “Measurement
screen overview” on page 32).
Narda NBM-550 57

5 Measuring with the NBM-550 and HF probes
5.8 Audible Indicator (hot spot search)
You can use the Audible Indicator function to indicate
changes in field strength and determine hot spots (areas of
maximum field strength). The audible signal changes
according to the way the field changes:
• Continuous tone: Field strength is increasing
• Interrupted tone: Field strength is decreasing
• No tone: Field strength is constant
Activating the function
1. Open the Audible Indicator function
(MAIN/MEASUREMENT SETTINGS/Next/...).
2. Use the arrow keys ▲/▼ to select On and press the OK
key to confirm the setting.
5.9 Measuring with a test standard
The NBM-550 allows measurement based on test
standards in the NORMAL display mode. Since the
measurement result refers to a single, defined frequency (in
contrast with the usual broadband measurements),
measuring with a test standard only makes sense if the field
you want to measure is dominated by a known frequency.
You can apply a test standard as follows:
• Use a shaped probe. The standard is set by the probe
and cannot be changed.
• Use a flat probe and apply one of the standards stored in
the instrument.
• Use the NBM-TS PC software to customize your own
standard.
Three steps are needed to make a measurement using a
test standard:
• Step 1: Select a test standard
• Step 2: Select the reference frequency
• Step 3: Apply the test standard
These steps are described below.
58 NBM-550 Narda

5.9 Measuring with a test standard
Step 1: Select a test standard
1. Open the Standard function
(MAIN/MEASUREMENT SETTINGS/...).
2. Use the arrow keys ▲/▼ to select a standard and press
the OK key.
Step 2: Select the reference frequency
Open the Frequency function
(MAIN/MEASUREMENT SETTINGS/...).
You can now
• use a calibrated frequency from the memory (the probe
is calibrated at these frequencies) or
• enter a frequency value of your choice.
Using a calibrated frequency
1. Press the ▲ or ▼ arrow key
The measuring frequency is set to the next higher or
next lower calibrated frequency.
2. Press the OK key to confirm the setting and then use the
ESC key to exit from the menus.
Entering a frequency manually
1. Press the Edit function key.
2. Select the digit using the / function keys.
3. Change the value using the arrow keys ▲/▼.
4. Press the OK key when you have completed the settings
to confirm them and then press the ESC key to exit from
the menus.
Narda NBM-550 59

5 Measuring with the NBM-550 and HF probes
Step 3: Applying the test standard
1. Open the Apply Standard function
(MAIN/MEASUREMENT SETTINGS/...).
2. Use the arrow keys ▲/▼ to select On and press the OK
key.
The test standard is activated, the selected frequency
(Freq) is shown top left in the display.
Note: When you no longer wish to use a test standard, set
Apply Standard to Off by following the same
procedure as above.
Possible displays when using a test standard
When you apply a test standard (Apply Standard = On),
additional information is shown in the lower display area in
Normal display mode.
Table 4 Display combinations when using a test standard
Probe type E+H Field
E-field or
H-field
(flat)
E-field or
H-field
(shaped)
Combination
probe
(flat)
Units
– Measured value shown
– Measured value in % • Probe standard
V/m and A/m Measured value shown
Selected Unit Measured value shown
Upper area Lower area
with selected units
with selected S-field
units (product of E-field
and H-field)
with selected S-field
units (product of E-field
and H-field)
Display (only in NORMAL mode)
• Selected standard
• Value in % calculated according to
the standard and frequency
• Value and selected units calculated
according to the standard and
frequency
• Selected standard
• Measured value in V/m and A/m
(E-field and H-field)
• Value in % calculated according to
the standard and frequency
• Selected standard
• Measured value shown with selected
unit (E-field and H-field)
• Value in % calculated according to
the standard and frequency
60 NBM-550 Narda

5.9 Measuring with a test standard
Example displays
Probe type: E-field flat probe
Probe type: E-field shaped probe
Probe type: Combination (E-field and H-field) flat probe
Combi probe uses: V/m, A/m
Note: The S-field is shown in the upper area of the display
as the product of the magnitudes of the E-field and
H-field.
Narda NBM-550 61
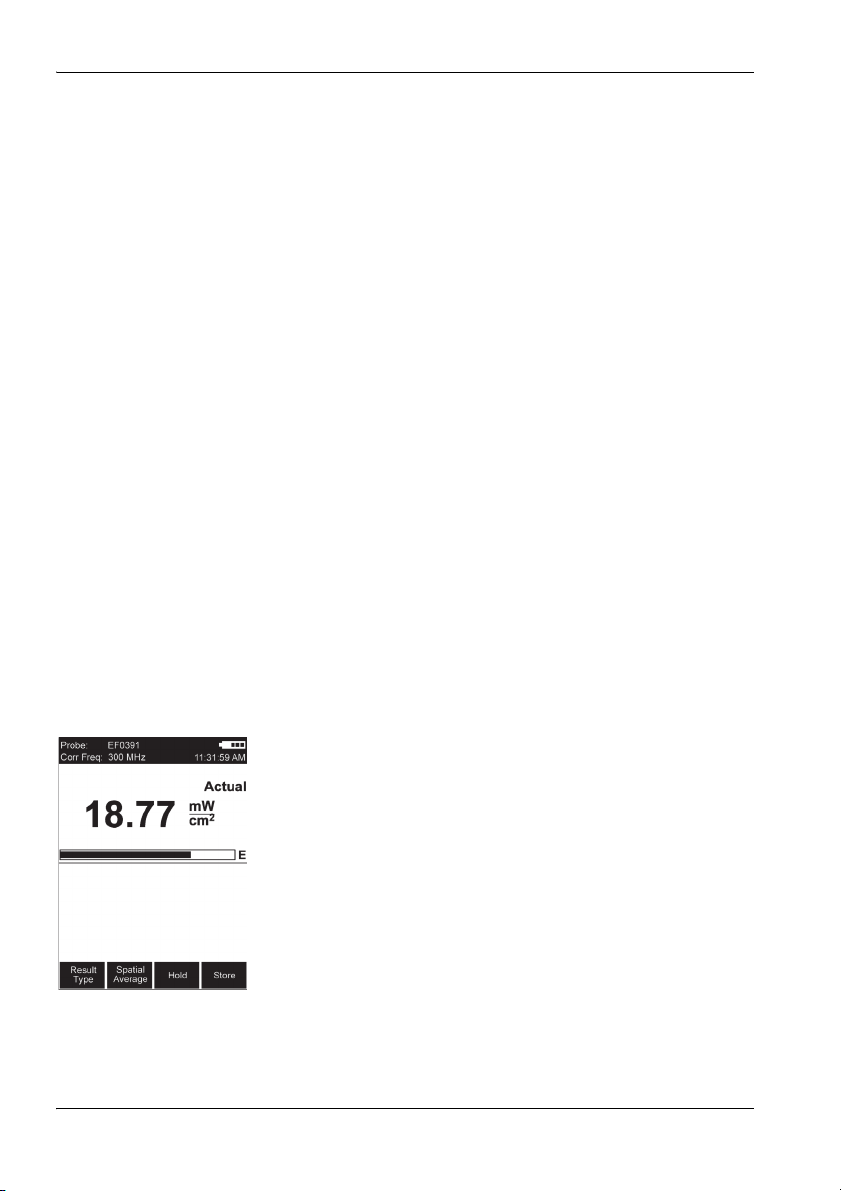
5 Measuring with the NBM-550 and HF probes
5.10 Measuring with a correction frequency
All probes are calibrated in our factory to guarantee the
traceability of measurements back national standards. This
calibration is performed at various frequencies over the
entire measurement range of the probe concerned. An
average correction factor is then used for normal
measurements (broadband measurements over the entire
frequency range) to give minimal measurement uncertainty.
If you only want to make a measurement at a specific,
known frequency, however, you can use the correction value
at the calibrated frequency to enhance the accuracy of the
measurement. Ideally, the calibration frequency and the
measuring frequency should be identical.
However, any intermediate value (with a resolution of
1 kHz), which is calculated from the bordering calibration
frequencies using interpolation, can also be set.
Selecting the correction frequency
Open the Frequency function
(MAIN/MEASUREMENT SETTINGS/...).
1. Press the ▲ or ▼ arrow key.
The measuring frequency is set to the next higher or
next lower calibrated frequency (intermediate values
can be entered after pressing the Edit button).
2. Press the OK key to confirm the setting.
Applying the correction frequency
1. Open the Apply Correction Frequency function
(MAIN/MEASUREMENT SETTINGS/...).
2. Select On and press the OK key to confirm the setting.
The correction frequency (Corr Freq) is shown top
left in the display.
62 NBM-550 Narda

6 Measurements with the
NBM-550 and EHP-50
This chapter describes the special functions of the
NBM-550 when used with the EHP-50 LF Analyzer.
You can find information about measuring with HF probes in
the chapter “Measuring with the NBM-550 and HF
probes” on page 43.
The EHP-50 Analyzer can also be operated as a standalone FFT analyzer. You can find information on how to
operate it along with further important information in the
Operating Manual for the EHP-50, which is provided as a
PDF file on the EHP-TS PC software CD.
6.1 General information (page 64)
6.2 Display types (page 65)
6.3 General settings (page 66)
6.4 WPM display mode (Weighted Peak method) (page 69)
6.5 Spectrum display mode (page 71)
6.6 Standard display mode (page 73)
6.7 XYZ display mode (page 74)
6.8 Monitor display mode (page 74)
6.9 Other settings (page 75)
Narda NBM-550 63

6 Measurements with the NBM-550 and EHP-50
6.1 General information
The EHP-50 Analyzer is a stand-alone measuring
instrument with remote operation. This operating manual
describes how measurements can be made using the
NBM-550 for operation of the EHP-50. Descriptions of
stand-alone operation and operation from a PC are found in
the Operating Manual for the EHP-50, which is included on
the EHP-TS CD-ROM as a PDF file.
EHP-50 versions supported
The NBM-550 only supports the functions of the EHP-50 for
versions EHP-50D and EHP-50F. The EHP-50D has a
restricted frequency range of 5 Hz to 100 kHz and does not
yet support the Weighted Peak method.
Selecting EHP-50 mode manually
When starting up, the NBM-550 recognizes an EHP-50
connected to it if this has already been switched on (see
“Connecting and setting up the EHP-50” on page 26).
EHP-50 operating mode will be selected automatically after
initialization has completed successfully if there is no HF
probe connected to the NBM-550 (HF probes have priority).
If you connect the EHP-50 to an NBM-550 that has already
been started and then switch it on, you will have to select
the EHP-50 operating mode manually.
To select the EHP-50 operating mode manually:
✓ The display is in measuring mode.
1. Open the function EHP-50 display
(MAIN MENU/INTERFACES/...).
2. Use the arrow keys ▲/▼ to select the On setting and
confirm by pressing the OK key.
The display switches to the measuring mode immedi-
ately.
64 NBM-550 Narda

6.2 Display types
The measurement settings you used last time will be
applied after the EHP-50 and NBM-550 have started up.
You can change the settings by opening a previously saved
setup (see “Saving and loading instrument settings” on
page 90) or change the measurement parameters manually.
WPM, Spectrum, Standard, XYZ, and Monitor display types
are available in LF mode. The features common to all
display types in LF mode as well as the differences are
shown in the table below:
6.2 Display types
Display
type
WPM
(Weighted
Peak
method)
Spectrum X – Graphical display of field strength versus
Standard X – Graphical display as Spectrum mode but with
XYZ X X Numerical display of measurement results for
Monitor X X Numerical display of measurement results for
History – X
Normal – X
LF mode (with
EHP-50)
X-Numerical display of the percentage of the limit
HF mode (with
HF probe)
value reached referred to the selected safety
standard (wideband from 1 Hz to 400 kHz) with
graphical display of time characteristic. See
“WPM display mode (Weighted Peak
method)” on page 69.
frequency. Numerical display of the wideband
value or the highest spectral line. See
“Spectrum display mode” on page 71.
the measured values referred to the limit values
of a safety standard and indicated as
percentage values. See “Standard display
mode” on page 73.
each separate axis of the EHP-50 with display
of the isotropic value (RSS). Display of the
wideband value or the highest spectral line. See
“XYZ display mode” on page 74.
the wideband value or the highest spectral line
(Actual, Max, Avg, Min). See “Monitor display
mode” on page 74.
Narda NBM-550 65

6 Measurements with the NBM-550 and EHP-50
To select the display mode:
✓ The display is in measuring mode.
1. Press the OK key to open the main menu.
2. Press the View key until the desired display mode is
shown.
3. Press the ESC key to switch to measuring mode.
6.3 General settings
The following settings are identical for all display modes and
so they are described together here. The functions specific
to each separate display mode are described in the sections
for each display mode.
Display wideband or peak value
You can display the numerical value referred to the
wideband measurement or to the peak value.
To switch the display:
1. Open the Frequency mode function
(MAIN MENU/MEASUREMENT SETTINGS/...).
2. Use the arrow keys ▲/▼ to select the desired setting and
press the OK key to confirm.
3. Press the ESC key twice to return to measuring mode.
Changing the field type and measurement range
✓ The display is in measuring mode.
1. Press the OK key to open the main menu.
2. Press the left function key (E-field/H-field) several times
until the field type and measurement range are set as
you require (E-field: 1 kV/m > 100 kV/m > H-field: 10 mT
> 100 µT > ...).
3. Press the ESC key to switch to measure mode.
66 NBM-550 Narda

6.3 General settings
The magnetic field range is displayed in Gauss if you have
previously selected Gauss as the units.
To set the display to Gauss:
1. Open the Magnetic field unit function
Open the Frequency mode function
(MAIN MENU/MEASUREMENT SETTINGS/...).
2. Use the arrow keys ▲/▼ to select the Gauss setting and
press the OK key to confirm.
3. Press the ESC key twice to return to measuring mode.
Changing the result type
Different result types are available depending on the display
type. The table below gives an overview:
Result type
ACT
(Actual)
1)
Monitor
XYZ X–––
Spectrum
Standard
WPM
1) All result types are shown simultaneously.
2) Only one result type can be selected at a time.
2)
2)
2)
XXXX
XXX–
XXX–
XX– –
MAX
(Maximum)
AVG
(Average)
MIN
(Minimum)
Maximum
The maximum measured value is retained.
You can reset the maximum value and restart the
measurement by pressing the ESC key.
Narda NBM-550 67

6 Measurements with the NBM-550 and EHP-50
Average
The average value is determined. You can set the number of
measurements to be used to form the average to 4, 8, 16 or
32.
To change the number of averages:
1. Open the No. of averages function
(MAIN MENU/MEASUREMENT SETTINGS/...).
2. Use the arrow keys ▲/▼ to select the desired setting and
press the OK key to confirm.
3. Press the ESC key twice to return to measuring mode.
Changing the frequency range (Span)
You can select the following frequency ranges: 100 Hz,
200 Hz, 500 Hz, 1 kHz, 2 kHz, 10 kHz, 100 kHz or 400 kHz.
The frequency range for WPM is fixed at 1 Hz to 400 kHz
Use the arrow keys ▲/▼ to change the Span.
Freezing a measured value
This function is the same as the measurement with HF
probes. See under “Freezing a measured value” on
page 47 for more information.
Storing a measured value
This function is the same as the measurement with HF
probes. See under “Storing a measured value” on
page 47 for more information.
68 NBM-550 Narda

6.4 WPM display mode (Weighted Peak method)
6.4 WPM display mode (Weighted Peak
method)
Information about WPM
Fields with complex signal characteristics, such as those
caused by the current pulses used in resistance welding,
are becoming more and more common. The Weighted Peak
method gives the correct measurement value for this kind of
pulsed signal and takes the phase of the frequency
components into account at the same time. This makes
measurement much easier, since you only have to select
the relevant safety standard. The device then supplies the
measured value as a percentage of the limit value.
The EHP-50F performs the Weighted Peak method with
mathematical convolution in the time domain to conform
with ICNIRP 2010 and IEC 61786-2. The measurement
covers the entire frequency range from 1 Hz to 400 kHz. A
graph shows the time characteristic of the measured value.
The EHP-50F supports exposure level evaluation according
to:
• ICNIRP 1998, public
• ICNIRP 1998, occupational
• ICNIRP 2010, public
• ICNIRP 2010, occupational
• Directive 2013/35/EU, Limbs Action Levels
• Directive 2013/35/EU, High Action Levels
• Directive 2013/35/EU, Low Action Levels
Narda NBM-550 69

6 Measurements with the NBM-550 and EHP-50
1
4
3
2
5
WPM display mode displays the percentage of the limit
value that has been reached referred to the selected safety
standard (wideband value from 1 Hz to 400 kHz) and a
graph of the field strength value versus time.
1 Result type and numerical display of the percentage
of the limit value reached for the selected standard
2 Display of the currently selected sensor axis:
Isotropic, X, Y, or Z
3 Graphical display of weighted field strength with
indication of selected field type (H-field in the
example)
4 Display of selected evaluation standard
5 Graph of measured value versus time. The measured
value axis is logarithmic and is fixed, depending on
the field type and measurement range selected. The
time axis setting is variable
To change the time scale:
1. Open the History Time Scale function
(MAIN MENU/DATA LOGGER/...)
2. Use the arrow keys ▲/▼ to select the desired time and
press the OK key to confirm the setting.
Taking measurements from the graph
1. Press the Hold key to freeze the display.
Hold is shown in the display, but measurements con-
tinue to be made in the background.
2. Press the Marker ON function key to dispplay the cursor.
Further items are now shown in the display:
– Crosshairs: For selecting a measurement point
– WPM: Maximum value at the cursor position
– Time: Time the measurement at the cursor position
was made
3. Use the / function keys to shift the cursor to the left or
right, or press the Highest value function key to move
the marker to the highest value.
4. Press the Marker OFF function key to remove the cursor
from the display.
70 NBM-550 Narda
5. Press the Continue function key to unfreeze the display.
The recorded measured values and the graph will be
updated from the time that the Hold key was pressed.

Meaning of the WPM values
1
4
3
2
Measurement values are captured continuously while the
graph is drawn. However, the graph display can only use
discrete time points that can be selected using the cursor.
The maximum value measured within the corresponding
time window (interval) between time points is shown for
each time point. The trace memory can display a maximum
of 200 measurement intervals.
Saving the measurement values recorded
You can save the measurement values in the trace memory.
To save the measured value recording:
1. Press the Hold key to freeze the display.
2. Press the Save History function key.
The measured value recording is saved. You can add
a voice comment if you have activated this function.
6.5 Spectrum display mode
Spectrum display mode displays the field strength versus
frequency values graphically and numerically.
6.5 Spectrum display mode
1 Result type and numerical display of field strength or
marker value
2 Wideband or frequency of maximum field strength or
of the marker
3 Graphical display of field strength with indication of
selected field type (E-field in the example)
4 Spectrum with information about:
– 1kV/m: field type and measurement range
– 100 Hz: span (in addition to display top left). The
logarithmic axis scale always spans 6 decades.
Narda NBM-550 71

6 Measurements with the NBM-550 and EHP-50
To use the marker function:
You can use the marker to read out each separate
evaluation frequency in the spectrum of the FFT analysis.
1. Press the Marker function key (the key is labeled OFF
when the marker function is active).
The marker is shown as a horizontal and a vertical
line. The numerical value of the marker is shown in
the upper display window.
2. Use the / function keys to shift the marker to the left
or right.
3. Press the Highest value function key to move the
marker to the highest value on the trace.
Other functions
The other functions are the same for all display modes and
are described under “General settings” on page 66.
72 NBM-550 Narda
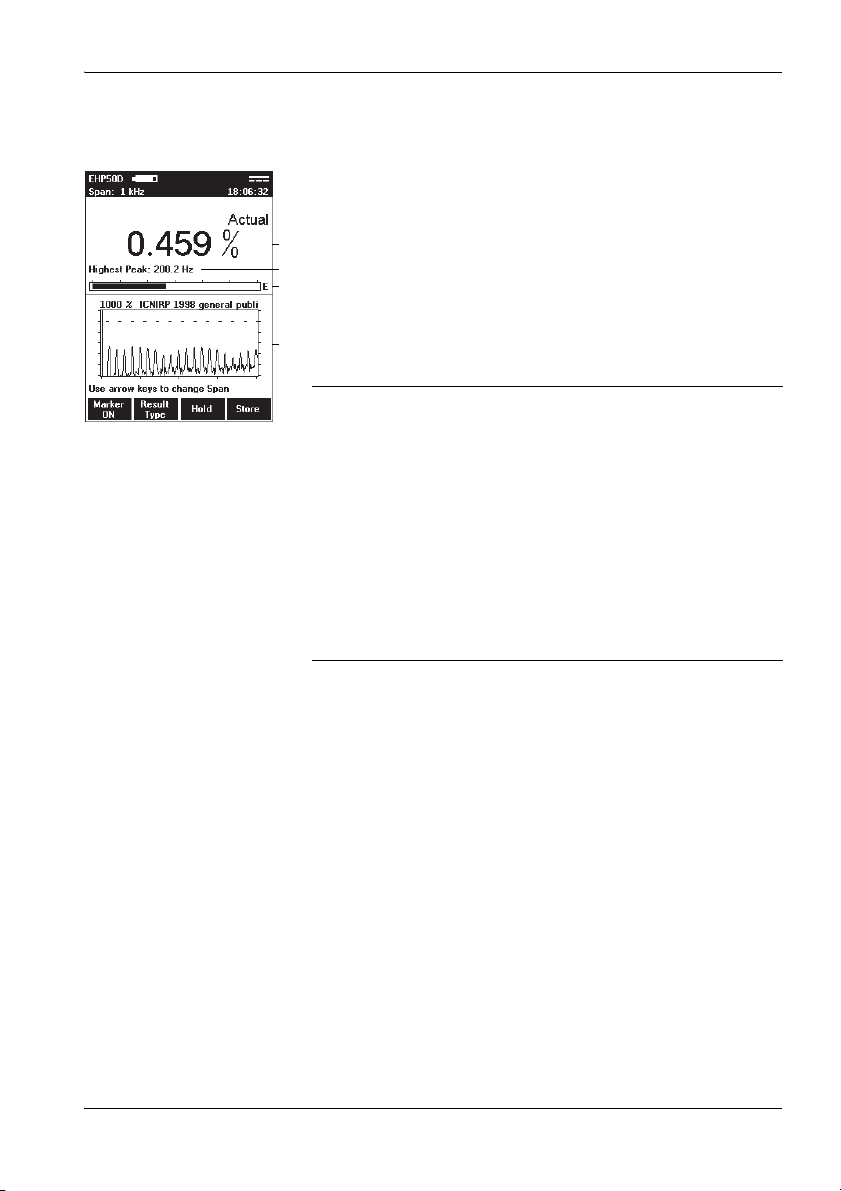
6.6 Standard display mode
1
4
3
2
Standard display mode corresponds to Spectrum display
mode but with the measured values normalized against a
safety standard and shown as percentage values. Limit
values must be defined by the safety standard for the
frequency range being used.
Note: Simultaneous display of the wideband value in
percent is not possible in this display mode. The
“Peak value” is therefore always shown
automatically.
1 Result type and numerical display of percentage of
the standard or the marker value
2 Frequency of the maximum field strength or of the
marker
3 Graphical display of field strength with indication of
the selected field type (E-field in the example)
4 Spectrum with indication of the selected standard
showing the limit value (the dotted line corresponds
to 100 %). The span is shown in the display header
top left. The logarithmic axis scale always spans 6
decades.
6.6 Standard display mode
To use the marker function:
You can use the marker to read out each separate
evaluation frequency in the spectrum of the FFT analysis.
1. Press the Marker function key (the key is labeled OFF
when the marker function is active).
The marker is shown as a horizontal and a vertical
line. The numerical value of the marker is shown in
the upper display window.
2. Use the / function keys to shift the marker to the left
or right.
3. Press the Highest value function key to move the
marker to the highest value on the trace.
Narda NBM-550 73
Other functions
The other functions are the same for all display modes and
are described under “General settings” on page 66.

6 Measurements with the NBM-550 and EHP-50
1
4
3
2
1
4
3
2
6.7 XYZ display mode
XYZ display mode allows you to display the numerical
measurement results for each separate axis of the EHP-50
as well as the isotropic value (RSS). This display mode is
useful for optimum alignment of the EHP-50 and allows you
to see if an axis is overdriven and correct this by adjusting
the alignment. The result type displayed is always the actual
value (Actual).
1 Numerical display of the actual measured value
2 Wideband or frequency of the highest field strength
3 Graphical display of field strength with indication of
the selected field type (E-field in the example)
4 Numerical display of the measured values for the X, Y
and Z axis.
Other functions
The other functions are the same for all display modes and
are described under “General settings” on page 66.
6.8 Monitor display mode
Monitor display mode shows the numerical actual,
maximum, average, and minimum measured values
simultaneously.
1 Numerical display of the actual measured value
2 Wideband or frequency of the highest field strength
3 Graphical display of field strength with indication of
the selected field type (E-field in the example)
4 Numerical display of the maximum (Max), average
(Avg) and minimum (Min) values.
Other functions
The other functions are the same for all display modes and
74 NBM-550 Narda
are described under “General settings” on page 66.

6.9 Other settings
Where necessary, you can make other settings in the same
way as for HF probes. There are some restrictions for
certain functions; these are explained below. Detailed
descriptions are found in the chapters indicated.
Unavailable functions
The following functions available in HF mode are not
available in LF mode:
• Auto zero
• Correction frequency
• Spatial average value
• Conditional storing of results (but timer controlled storing
is possible; see “Storing measured values” on
page 75.)
The alarm function
The alarm function can be used without any restrictions.
See “Activating the alarm function” on page 57.
Note: The alarm thresholds for HF and LF modes are saved
separately in a setup. This also applies to the E-field and Hfield thresholds in LF mode.
6.9 Other settings
Storing measured values
You can only record wideband values or highest spectral
values using timer controlled storage in LF mode with the
EHP-50. It is not possible to use the conditional storage
function.
See “Recording measurements by timer control” on
page 80 for more information.
The selected time interval is temporarily increased
automatically in LF mode if the measuring time of the
EHP-50 makes a longer interval time necessary. The
interval time menu parameter is not changed though. This
Narda NBM-550 75

6 Measurements with the NBM-550 and EHP-50
means that 1 s will be displayed even if an interval time of
10 s is necessary, for example. The table below shows the
relationship between span and timer interval:
Span Timer interval
100 Hz ≥ 10 s
200 Hz ≥ 5s
500 Hz ≥ 2s
> 500 Hz ≥ 1s
Generally the measurement time or refresh rate for the
result display in LF mode depends on the selected span.
Span Measuring time
100 Hz approx. 4 s
200 Hz approx. 2 s
> 500 Hz approx. 1 s
Note: Timer logging results obtained in LF mode can be
subsequently averaged using the optionally available NBMTS PC software. RMS/MEAN and MEDIAN post average
evaluations are available.
Note: Since uninterrupted measurement is not possible in LF
mode (except for WPM), the measurement results are not
summarized into Min/Max/Avg values for each
measurement interval. The Actual values are recorded once
every interval instead.
76 NBM-550 Narda

6.9 Other settings
Managing result data
Please refer to “Managing result data” on page 84 for
information. The results saved in EHP-50 mode are
indicated by the following abbreviations in the Data Viewer:
• LFS = Spectrum display mode
• LF% = Standard display mode
• LF3 = XYZ display mode
• LFM = Monitor display mode
• LFT = Timer Logging storage type
• WPV = Weighted Peak value (single measurement)
• WPH = Weighted Peak history (values versus time)
Saving and loading device settings
You can save and recall your device settings in a setup in
the same way as in HF mode. All EHP-50-specific settings
are saved separately. This also applies to the selected
standard.
See “Saving and loading instrument settings” on
page 90 for more information.
Narda NBM-550 77

6 Measurements with the NBM-550 and EHP-50
78 NBM-550 Narda

7 Recording and managing
measured values
This chapter describes how to record measurement values
automatically (Data Logger) and how to recall and manage
the measurement data that you have recorded manually or
automatically.
7.1 Storage types (page 80)
7.2 Recording measurements by timer control (page 80)
7.3 Recording conditional measurements (optional)
(page 82)
7.4 Managing result data (page 84)
Narda NBM-550 79

7 Recording and managing measured values
7.1 Storage types
As well as manually storing individual values (see “Storing
a measured value” on page 47), you can also store entire
sequences of measurements automatically.
There are two ways to do this:
• You can start storing results at a specified time and stop
storing them again after a defined time period has
elapsed (see “Recording measurements by timer
control” on page 80).
• You can set the instrument to start storing results
depending upon the measured field strength (see
“Recording conditional measurements (optional)”
on page 82).
7.2 Recording measurements by timer control
For timer controlled recordings, measured values are
recorded without interruption within the specified time
period and are combined in 3 values per measurement
interval (minimum value, maximum value, and average of
the measurement interval).
The averages can be very easily converted subsequently to
other averaging times with the NBM-TS PC Software (postaverage function).
You must take the following steps to record measurements
by timer control:
1. Set the recording parameters:
– enter the starting time (Timer Start),
– enter the recording time (Timer Duration),
– enter the recording interval (Timer Interval).
2. Select Timer Logging function to start the recording.
These steps are explained below.
80 NBM-550 Narda

7.2 Recording measurements by timer control
Setting the recording parameters
1. Open the DATA LOGGER menu
(MAIN/DATA LOGGER).
2. To enter the starting time:
– open the Timer Start function,
– select a digit using the / function keys and use the
arrow keys ▲/▼ to change the value,
– press the OK key when you have completed the
settings to confirm them.
Note: The current time can easily be set with the Current
Time button.
3. To enter the recording time:
– open the Timer Duration function,
– select a digit using the / function keys and use the
arrow keys ▲/▼ to change the value,
– press the OK key when you have completed the
settings to confirm them.
4. To enter the recording interval:
– open the Timer Interval function,
– select a digit using the / function keys and use the
arrow keys ▲/▼ to change the value,
– press the OK key when you have completed the
settings to confirm them.
Started measurement intervals are always carried out to
completion. The actual duration is rounded to a multiple of
the interval time.
The maximum duration is determined by the selected
interval time (see table below), because the number of
measurement intervals is limited to 32000.
Interval
time
(seconds)
1 8:53:20
2 17:46:40
3 26:40:00
5 44:26:40
10 88:53:20
> 10 99:59:59
Maximum duration
(HH:MM:SS)
Narda NBM-550 81

7 Recording and managing measured values
Starting the recording
✓ The DATA LOGGER menu (MAIN/DATA LOGGER) is
open.
Press the Timer Logging function key.
The display switches to measurement mode.
The latest measured value is shown in the upper half
of the display. The values you entered for the starting
time and recording time are shown in the lower half of
the display.
Note: If voice recording is activated, a comment can be
recorded (optional).
The recording starts at a preset time. The remaining
recording time (Remaining Time) is displayed.
The recording is stopped after the preset recording
duration (Timer Duration) has elapsed.
Note: The recording starts immediately when Instant Start is
selected.
The recording can be prematurely stopped at any time with
the Stop and Exit button.
7.3 Recording conditional measurements (optional)
For conditional recording, the measurement is triggered
when the predetermined field strength values are exceeded
or fallen short of. Up to 32000 events can be recorded.
You must take the following steps to record measurements
conditionally:
1. Set the recording parameters:
– enter the starting condition (Store Condition),
– enter the store range (Store Range),
– enter the upper threshold,
– enter the lower threshold.
2. Start the recording:
– select the Condition Logging function,
–press Start.
These steps are explained below.
82 NBM-550 Narda

7.3 Recording conditional measurements (optional)
Setting the recording parameters
The following parameters are available:
Parameter Meaning
Store Condition Specifies the condition for starting recording.
• Upper THRHLD (upper threshold)
The recording starts if the Upper Threshold value is exceeded.
• Out of GAP
The recording starts if the value is outside the range defined by
the Upper Threshold and Lower Threshold.
Store Range Specifies the range of values to be stored (max. 32000 events).
• First and Last
The first and last values occurring within the time period when
the Store Condition is fulfilled are recorded.
• Store All
All the values occurring within the time period when the Store
Condition is fulfilled are recorded.
Upper Threshold Specifies the upper threshold value
Lower Threshold Specifies the lower threshold value
Setting the recording parameters
1. Open the DATA LOGGER menu
(MAIN/DATA LOGGER).
2. To enter the starting condition:
– open the Store Condition function,
– sse the arrow keys ▲/▼ to select the condition you
want to use and press the OK key to confirm the
setting.
3. To enter the store range:
– open the Store Range function,
– use the arrow keys ▲/▼ to select the range you want
to use and press the OK key to confirm the setting.
4. To enter the upper threshold:
– open the Upper Threshold function,
– select the threshold value with the arrow keys ▲/▼
and press the OK button to apply the settings.
5. To enter the lower threshold (only effective at OUT of
Gap):
– open the Lower Threshold function,
– select the threshold value with the arrow keys ▲/▼
(only effective at OUT of Gap) and press the OK
button to apply the settings.
Narda NBM-550 83

7 Recording and managing measured values
Starting / stopping the recording
✓ The DATA LOGGER menu (MAIN/DATA LOGGER) is
open.
1. Press the Condition Logging function key.
The display switches to measurement mode.
Note: If voice recording is activated, a comment can be
recorded (optional).
The latest measured value is shown in the upper half
of the display.
The starting condition and the values you entered for
the thresholds (depending on the starting condition)
are shown in the lower half of the display.
2. Press the Start function key.
Recording starts as soon as the condition is fulfilled.
The number of values measured that fulfill the condi-
tion is displayed (Number of Events).
3. Press the Exit function key to end the recording.
7.4 Managing result data
There are two menus provided for you to display and delete
measurement data that you have recorded either manually
or automatically:
• Memory Manager (MAIN/MEMORY MANAGER)
• Data Viewer (MAIN/Data Viewer function key)
The differences between these menus are described in the
table below:
Menu Displays Deletes Comment
Memory Manager • Overview of the last data set
• Display of free storage space
in %
Data Viewer Overview of all stored data sets and
display of the measurement results
• Last data set
• All data sets
Last data set only Yes
playback
Ye s
Note: Before final deletion of data sets, a warning notice always
appears giving you the option to cancel the deletion
process.
84 NBM-550 Narda

7.4 Managing result data
Using the Memory Manager
Open the MEMORY MANAGER menu (MAIN/...).
The last data set stored is displayed (refer to Table 5
for the meanings of the columns).
Press the Play key to play back the comment (if
available).
Press the Delete Latest key to delete the displayed
(= last) entry.
Press the Delete All key to delete all the data sets.
Using the Data Viewer
Displaying the stored measurement data
Press the Data Viewer function key in the MAIN menu.
The list of all stored data opens.
Table 5 Column meanings
Column Function
Index Consecutive number identifying the data se.
# Number of stored sub data sets within a measurement
Date Date when the data set was stored.
Time Time when the data set was stored
Type Storage type:
series (max. 32000); always 1 for manually stored
results, since only one data set is stored each time).
A maximum of 999 sub data sets can be displayed on
the device (intervals or events). The NBM-TS PC
software enables complete evaluation of all data.
• CON: Condition Logging
• HST: History mode
• MON: Monitor mode
• NOR: Normal mode
• SPA: Spatial Averaging
• TIM: Timer controlled (Timer Logging)
• XYZ: XYZ mode
A comment has been added.
Narda NBM-550 85

7 Recording and managing measured values
Paging through the overview list
Press the Previous or Next function key to page back or
forward in the list.
To display saved measurement data:
Use the arrow keys ▲/▼ to select an entry from the list
and press the OK key to open the entry.
The stored data are displayed.
Note: With the ▲/▼ arrow keys, you can scroll to the next or
previous entries.
Data Viewer display examples
Some examples of the possible contents of the
measurement data memory are shown below. Results are
shown in the same format as for the measurement itself.
Example 1: Manual storing
Display Meaning
Values Monitor display mode, E-field.
Data Viewer Display is in Data Viewer mode.
Monitor Measurement values were saved in the Monitor
Index 0002 The values were stored at memor y position 2.
display mode.
Example 2: Timer Logging
Display Meaning
Values Timer display mode
Data Viewer Display is in Data Viewer mode
Timer Values were stored by timer control
Index 0004 The series of values was stored at memory
(1) First value in the series
86 NBM-550 Narda
position 4.

7.4 Managing result data
Example 3: Condition Logging
Display Meaning
Values Conditional display mode
Meaning of the status indicators on the First
and Last Storage Range:
• F (First): first measurement value in which the
condition is fulfilled
• L (Last): last measurement value in which the
condition is still fulfilled
• -: no change, neither to F nor L (only with
combination probes)
Meaning of the status indicators Store all on the
Storing Range:
• Y (Yes): measurement value fulfills the
condition
• N (No): measurement value does not fulfill the
condition (only with combination probes)
Settings Selected settings for starting condition, store
Data Viewer Display is in Data Viewer mode.
Conditional Measured values were stored conditionally.
Index 0007 The values were stored at memory position 7.
(1) First value in the series
range, and upper and lower threshold
Paging within a series of measurements
Use the Previous (Sub) or Next (Sub) key to page back
or forward in the series of measurements.
The value in brackets after the index indicates the sub
data set within the measurement series.
Playing back a comment
Note: Measurement data with comments are indicated by a
loudspeaker symbol in the overview list.
✓ The earphone must be connected for playback.
Press the Play function key. This function is available
from the overview list view and the selected
measurement view.
The comment is played back.
Narda NBM-550 87

7 Recording and managing measured values
Deleting a data set
Note: You can only ever delete the last entry in the memory.
✓ The overview list is open.
Press the Delete Latest function key.
The last (latest) entry is deleted.
88 NBM-550 Narda

8 Setup and configure
This chapter describes additional functions and settings for
the interface, for instrument information and settings, as well
as for use of the NBM-550 as a controller and for the
activation of new instrument options.
8.1 Configuring the interface (page 90)
8.2 Saving and loading instrument settings (page 90)
8.3 Displaying instrument and probe information (page 92)
8.4 Using the NBM-550 as a controller (page 93)
8.5 Activating instrument options (page 94)
Narda NBM-550 89

8 Setup and configure
8.1 Configuring the interface
You can use the serial interface via USB or an optical
connection.
Configuring the interface
Open the Serial Interface function (MAIN/INTERFACE/...).
Use the arrow keys ▲/▼ to select USB or Optical and
press the OK key.
Note: Logging parameters (e.g. the baud rate) are permanently
set and cannot be changed (see “Interfaces” on
page 125).
8.2 Saving and loading instrument settings
You can save your current instrument settings (setups) and
recall them when you need them again. Nine memory
positions are provided for such settings, so you can save
setups for different measurement tasks or for different
users, for example.
Note: You can use the NBM-TS PC software to store the setups
completely in the database and upload them to the
instrument again when they are needed.
Menu overview
Open the MAIN/SETUP menu.
Default These settings will be used when the instrument is
Setup 1-8 Memory positions
User Indicates that a user setup is stored at this
Factory Indicates that the factory default settings apply
90 NBM-550 Narda
switched on as long as Power On = Default.
memory position
because a user setup has not been stored
 Loading...