

Page 1

MICRO PHOT ON D EVICES
PDM-IR
900 nm – 1700 nm Infrared Photon
Detection Module
ã Micro Photon Devices S.r.l.
Via Stradivari, 4
39100 Bolzano (BZ), Italy
email [email protected]
Phone +39 0471 051212 • Fax +39 0471 501524
PDM-IR User Manual Version 3.0.3 - September 2018
Page 2

PDM-IR user manual v3.0.3
Micro Photon Devices S.r.l. – Italy All Rights Reserved
2
!
Table of Contents
1! INTRODUCTION 4!
2! THE INGAAS/INP SINGLE-PHOTON AVALANCHE DIODE 5!
2.1! Gated)Mode)Operation) 5!
2.2! Free)Running)Operation) 8!
2.3! Further)readings) 9!
3! PDM-IR HARDWARE CHARACTERISTICS 10!
3.1! Rear)Panel) 10!
3.2! Mechanical)Dimension) 11!
4! PDM-IR SPECIFICATIONS 13!
4.1! PDM-IR)Trigger)Section) 14!
4.1.1! Internal Trigger 15!
4.1.2! Trigger In 16!
4.1.3! Aux In 16!
4.1.4! Logic Function 17!
4.2! PDM-IR)Gate)Section) 18!
4.2.1! Gated mode with fixed gate width operation 19!
4.2.2! Gated mode with Free-gate operation 20!
4.2.3! Free running mode 20!
4.3! PDM-IR)SPAD)Section) 21!
4.3.1! Temperature 22!
4.3.2! Excess Bias 22!
4.3.3! Hold Off 22!
4.4! PDM-IR)Counters)Section) 23!
4.5! PDM-IR)Output)Section) 23!
4.5.1! PHOTON OUT 24!
4.5.2! TTL AUX OUT 25!
4.5.3! NIM AUX OUT 25!
4.6! PDM-IR)LED)Status) 25!
4.7! PDM-IR)propagation)delays) 26!
5! PDM-IR SOFTWARE INTERFACE 28!
Page 3

PDM-IR user manual v3.0.3
Micro Photon Devices S.r.l. – Italy All Rights Reserved
3
!
5.1! Installation) 28!
5.2! Software)Interface) 28!
5.2.1! Main Window: Trigger and Gate Section 28!
5.2.2! Main Window: SPAD Section 30!
5.2.3! Main Window: Output Section 31!
5.2.4! Main Window: Status Section 32!
5.2.5! Main Window: Counter Section 33!
5.2.6! Counter Window 34!
5.2.7! Module Selection Window 34!
5.2.8! Module Info Window 35!
5.2.9! Configurations Window 35!
5.2.10! Save configuration Window 36!
5.2.11! RunTime Menu 37!
6! SETUPS 38!
6.1! Basic)setups) 38!
6.1.1! Photon Counting setup 38!
6.1.2! Photon Timing setup 40!
6.2! Advanced)setups) 41!
6.2.1! Cross correlation setup with external sync 41!
6.2.2! Cross correlation setup without sync 43!
6.2.3! Long Decay Measurement 44!
7! SYSTEM REQUIREMENTS 47!
COPYRIGHT AND DISCLAIMER 47!
Page 4
PDM-IR user manual v3.0.3
Micro Photon Devices S.r.l. – Italy All Rights Reserved
4
!
1 Introduction
The MPD PDM-IR, is built around a Peltier cooled InGaAs/InP Single-Photon Avalanche Diode (SPAD) for the
detection of near-infrared single photons from 900 nm up to 1700 nm.
The module includes a programmable frequency and pulse generator for gating the detector, a front-end
circuit for photodetector’s avalanche sensing, a fast circuit for detector’s avalanche current quenching and
operative bias voltage resetting and some sub-circuits for signal conditioning. All the main parameters and
delay paths are adjustable by the user through the software interface, in order to match the requirements of
different applications. The system can be conveniently used both for counting and timing measurements,
since the high-performance electronics guarantees a clean temporal response even with fast gate transitions.
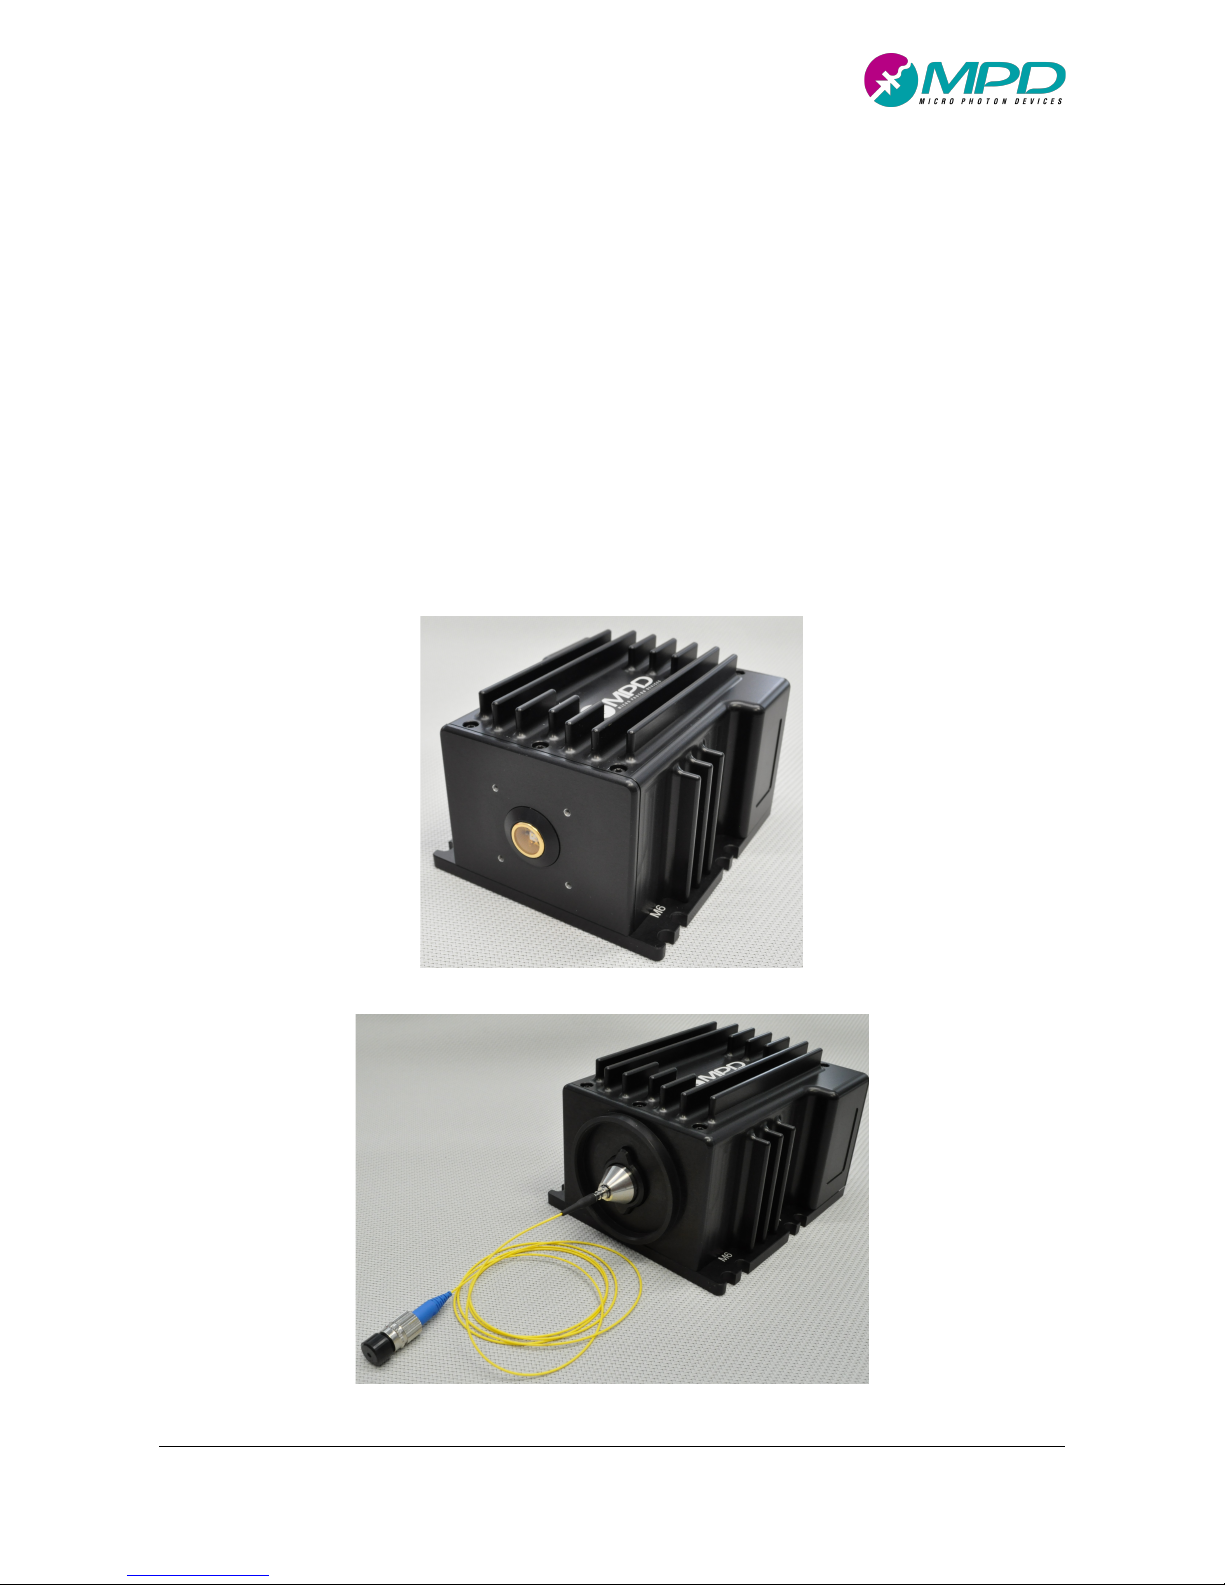
PDM-IR can work either in free-runnging or in gated mode (see paragraph 2) and the optical interface can be
chosen between a free space and a pigtailed version as shown by Figure 1 and Figure 2.
Figure 1. PDM-IR free space version.
Figure 2. PDM-IR fiber pigtailed version.
Page 5

PDM-IR user manual v3.0.3
Micro Photon Devices S.r.l. – Italy All Rights Reserved
5
!
2 The InGaAs/InP Single-Photon Avalanche Diode
The core of this module is a Single-Photon Avalanche Diode (SPAD), housed into the Detection Head. The
detector has a 25 μm diameter active area in case of the free space version or a 10 µm diameter SPAD when
pigtailed with a single-mode fiber. The diode is mounted on the top of a three-stage Peltier cooler. A SPAD is
a p-n junction, biased well above the breakdown voltage (VB), that stays in a meta-stable state with no
current flowing. At this bias, the electric field is so high that a single charge carrier injected in the depletion
layer can trigger a self-sustaining avalanche. The current rises swiftly (nanoseconds or sub nanosecond risetime) to a macroscopic steady level, in the milliAmpere range. If the primary carrier is photo-generated, the
leading edge of the avalanche pulse precisely marks the photon arrival time. The current continues to flow
until the avalanche is quenched by lowering the bias voltage down to or below VB. Then the bias voltage
must be restored, in order to detect another photon. These operations are usually performed by a suitable
circuit named Active Quenching Circuit (AQC).
The device primary source of internal noise consists in a random dark-counting rate (DCR) arising from free
carriers thermally generated. These events compete with photons in triggering the detector and thus impair
the signal to noise ratio. The Peltier cooler is therefore useful to lower the temperature of the detector in
order to diminish this effect.
2.1 Gated Mode Operation
Normally single photon detectors are operated in the so-called free-running mode, where the devices are
enabled immediately after the quenching of each avalanche current. This is true for Silicon SPADs but for
InGaAs SPADs, due to higher DCR, gated regime is also used, for further reducing these unwanted counts:
the detector is periodically enabled for a short time window called Gate, of duration
!
"#
(Gate Width),
whereas it is usually held off at a bias slightly below the breakdown voltage.
The counting rate (CR) of a detector operated in free running, and not in gated mode, is simply the number
of counts generated by the module output (PHOTON OUT) divided by the integration time:
$% &
'()*+,-./-$.(012
301+4,516.0-!6)+
When the detector is operated in gated mode, the photon-out count rate (CR) must be corrected considering
both the Gate Frequency, i.e. the frequency at which the SPAD is periodically enabled, and the Gate Width
(
!
"#
), i.e. the time length during which the SPAD is turned on during each duty cycle. The correction is due
to the fact that photons (or dark-counts) may be absorbed during the times the SPAD is kept turned off and
Page 6

PDM-IR user manual v3.0.3
Micro Photon Devices S.r.l. – Italy All Rights Reserved
6
!
so are not counted. The correction considers how many photons have been counted and for how long, during
the integration time, the SPAD has been kept really turned on. In order to calculate the true counting rate,
thus, the following formula must be used:
$%
789:
& ;
<
!
"#
=>?-@<;$% A!
B
where T is the Gate Period, i.e. the reciprocal of the Gate Frequency.
In most of the applications, this formula can usually be approximated to:
$%
789:
C $% A
!
!
"#
-----/.,------$% D! E <
that is the raw counts divided by the duty-cycle applied to the detector.
However, a secondary source of noise exists in SPADs: the afterpulsing. During the avalanche some carriers
are captured by deep levels in the junction depletion layer and subsequently released with a statistically
fluctuating delay. Released carriers can retrigger the avalanche, generating after-pulses correlated with a
previous avalanche pulse which sum up with the DCR. In order to mitigate these avalanche re-triggerings,
after each avalanche, during the subsequent gating occurrences, the detector is kept off for a user
programmable time, named hold-off time,
!
F"
. In this way the trapped carriers can be released without
triggering further avalanches. The hold-off time is particularly useful when cooling the detector since the
afterpulsing effect worsens at low temperatures because the decay times of the trapped carriers increase.
The hold-off time is usually longer than the gate period T.
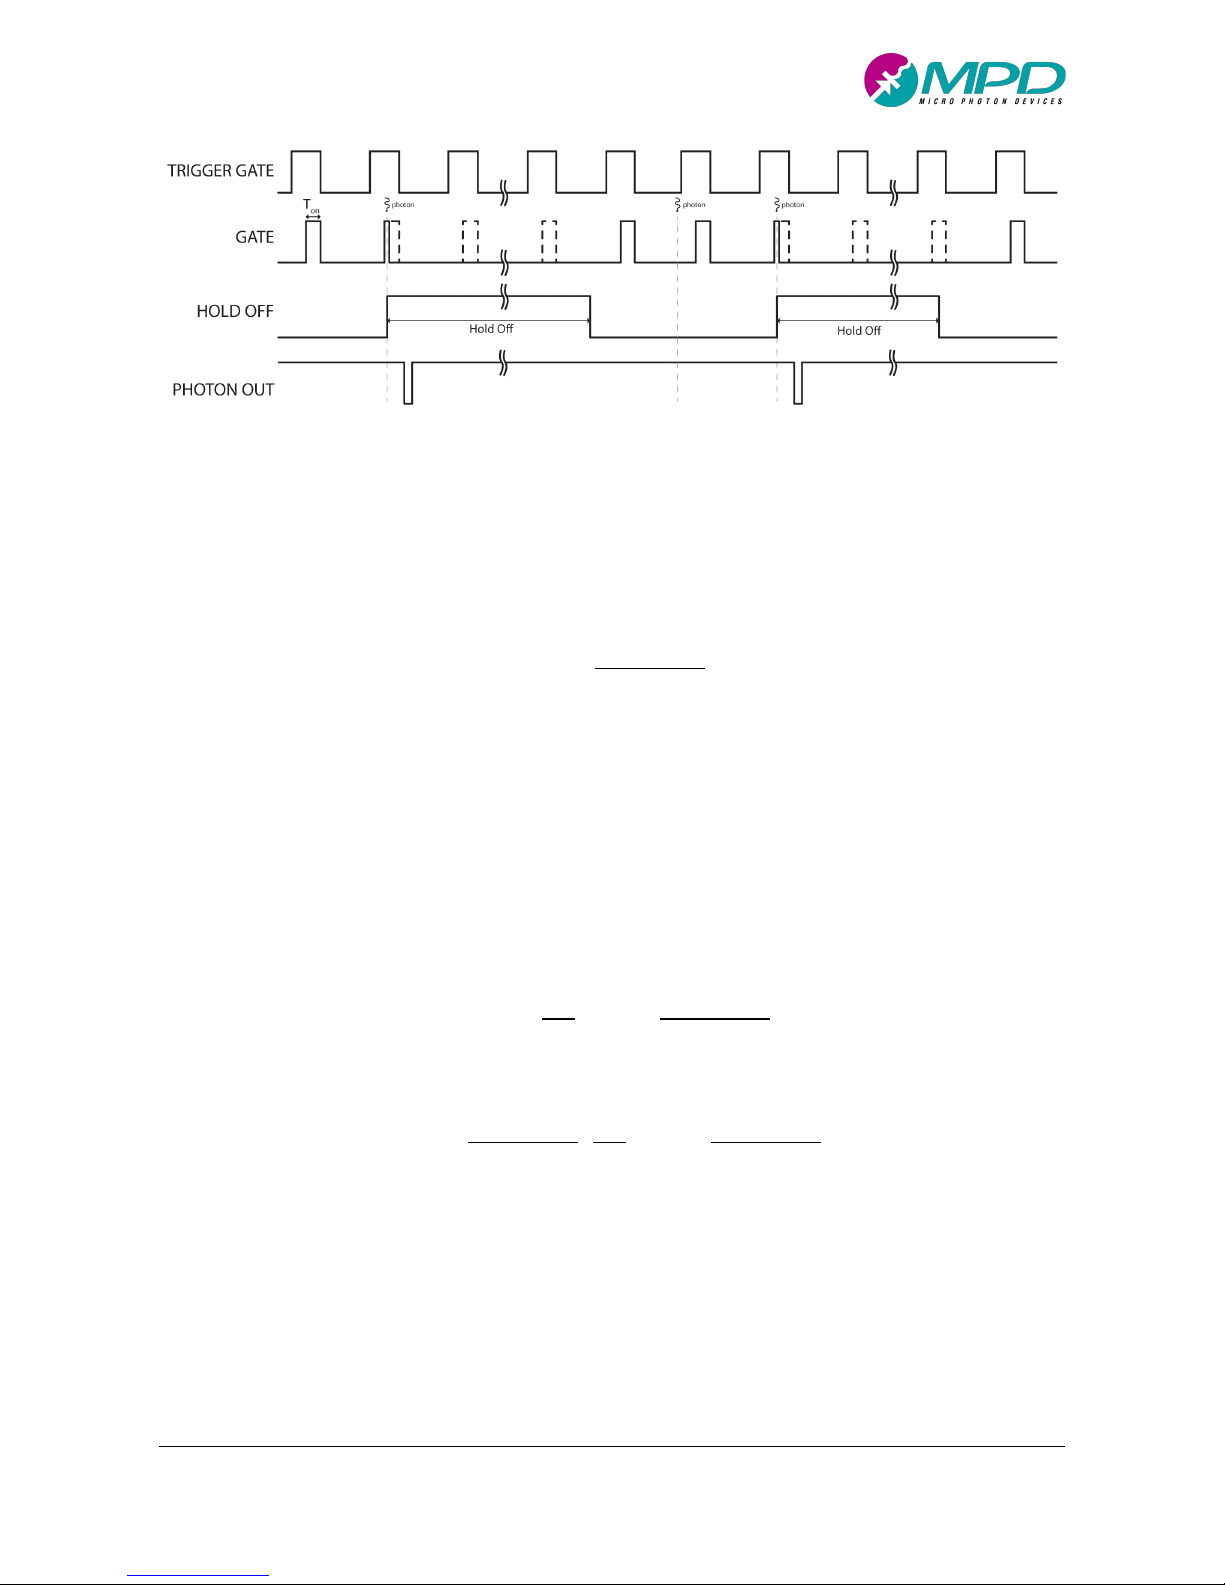
An example of a photon counter module, operated in gated mode and employing the hold-off feature, is
shown in Figure 3. The reference signal is TRIGGER GATE which sets the gate repetition rate (frequency). The
signal actually applied to the SPAD is GATE, it is synchronized with TRIGGER GATE and has a width that
corresponds to the TON of the SPAD. Initially GATE and TRIGGER GATE are synchronized and their pulses
correspond 1-to-1. When a photon is absorbed, it triggers the avalanche current which is marked, in this
example, by the falling edge of Photon Output pulse. Once the avalanche is detected it is immediately
quenched; the system does not wait for the end of the Gate window to bias below breakdown the SPAD.
Now GATE and TRIGGER GATE begin to differ. During the hold-off time, the TRIGGER GATE pulses are ignored,
and GATE remains low, keeping the photodetector OFF. The SPAD is enabled again when the hold off time is
over. Of course, if a photon arrives at the detector after the end of a previous hold-off but during the gateoff time, it is not detected as shown in Figure 3. Finally, in case the hold-off ends inside a GATE pulse, the
latter is either skipped (as shown in Figure 3) or applied with a reduced width, i.e. only the remaining part of
TON following the end of the hold-off. For a complete description of what happens see paragraph 4.2.
Page 7
PDM-IR user manual v3.0.3
Micro Photon Devices S.r.l. – Italy All Rights Reserved
7
!
Figure 3. Main waveform in the module in case of the gated mode operation: output of pulse generator (TRIGGER
GATE), pulses at the SPAD detector (GATE), hold off time keeping the detector off for the amount of time
(HOLD OFF) and photon output signal (PHOTON OUTPUT).
Now, because of the hold-off time, the measured counting rate CR is not equivalent to the actual rate of
photons but can be estimated by:
$%F"&
$%
<;$% A!
F"
In counting applications, the maximum count rate should be then limited at about
<G@H!F"B
, because for
higher values the correction factor becomes so high that even small errors in the equation’s parameters will
result in high errors in the CRHO counting-rate.
Since the MPD PDM-IR biases the SPAD in gated mode and applies the hold-off every time an avalanche is
detected, the two effects must be applied at the same time in order to obtain the correct photon counting
rate CR
photon
from the measured counting rate CR. From simple mathematics, it turns out that the final
equation is the following:
$%
IJKLKM
& ;
<
!
"#
=>?-N<;
$%
<;$% D !
F"
A!
O
which can then be simplified to :
$%
IJKLKM
C
$%
<;$% D !
F"
A
!
!
"#
-----/.,-----
$% D!
<;$% D !
F"
E <
Please note that the previous equations do not consider the Photon Detection Efficiency of the InGaAs SPAD.
These formulas also strictly apply when the photon rate is uniformly distributed over time while particular
care must be used when applied to specific cases like the one discussed in paragraph 6.1.2.
Figure 3 is, in addition, very helpful in explaining the VALID GATE output. This signal is generated in order to
properly trace which TRIGGER GATE pulse effectively enabled the SPAD, i.e., which are the pulses that were
Page 8
PDM-IR user manual v3.0.3
Micro Photon Devices S.r.l. – Italy All Rights Reserved
8
!
not blanked during the hold-off time (VALID GATE is a digital signal with the same pattern of Gate). This
information is particularly useful when looking for the percentage of counts over the total number of
available valid gates. In fact, in timing measurements one must be careful not to exceed the single-photon
statistics, in order not to distort the TCSPC histogram (see paragraph 6.1.2).
2.2 Free Running Operation
As already discussed, normally single photon detectors are operated in the so-called free-running mode,
where the devices are enabled immediately after the quenching of each avalanche current. PDM-IR allows
the user the possibility to choose which type of module operation, and thus not only the gated mode but
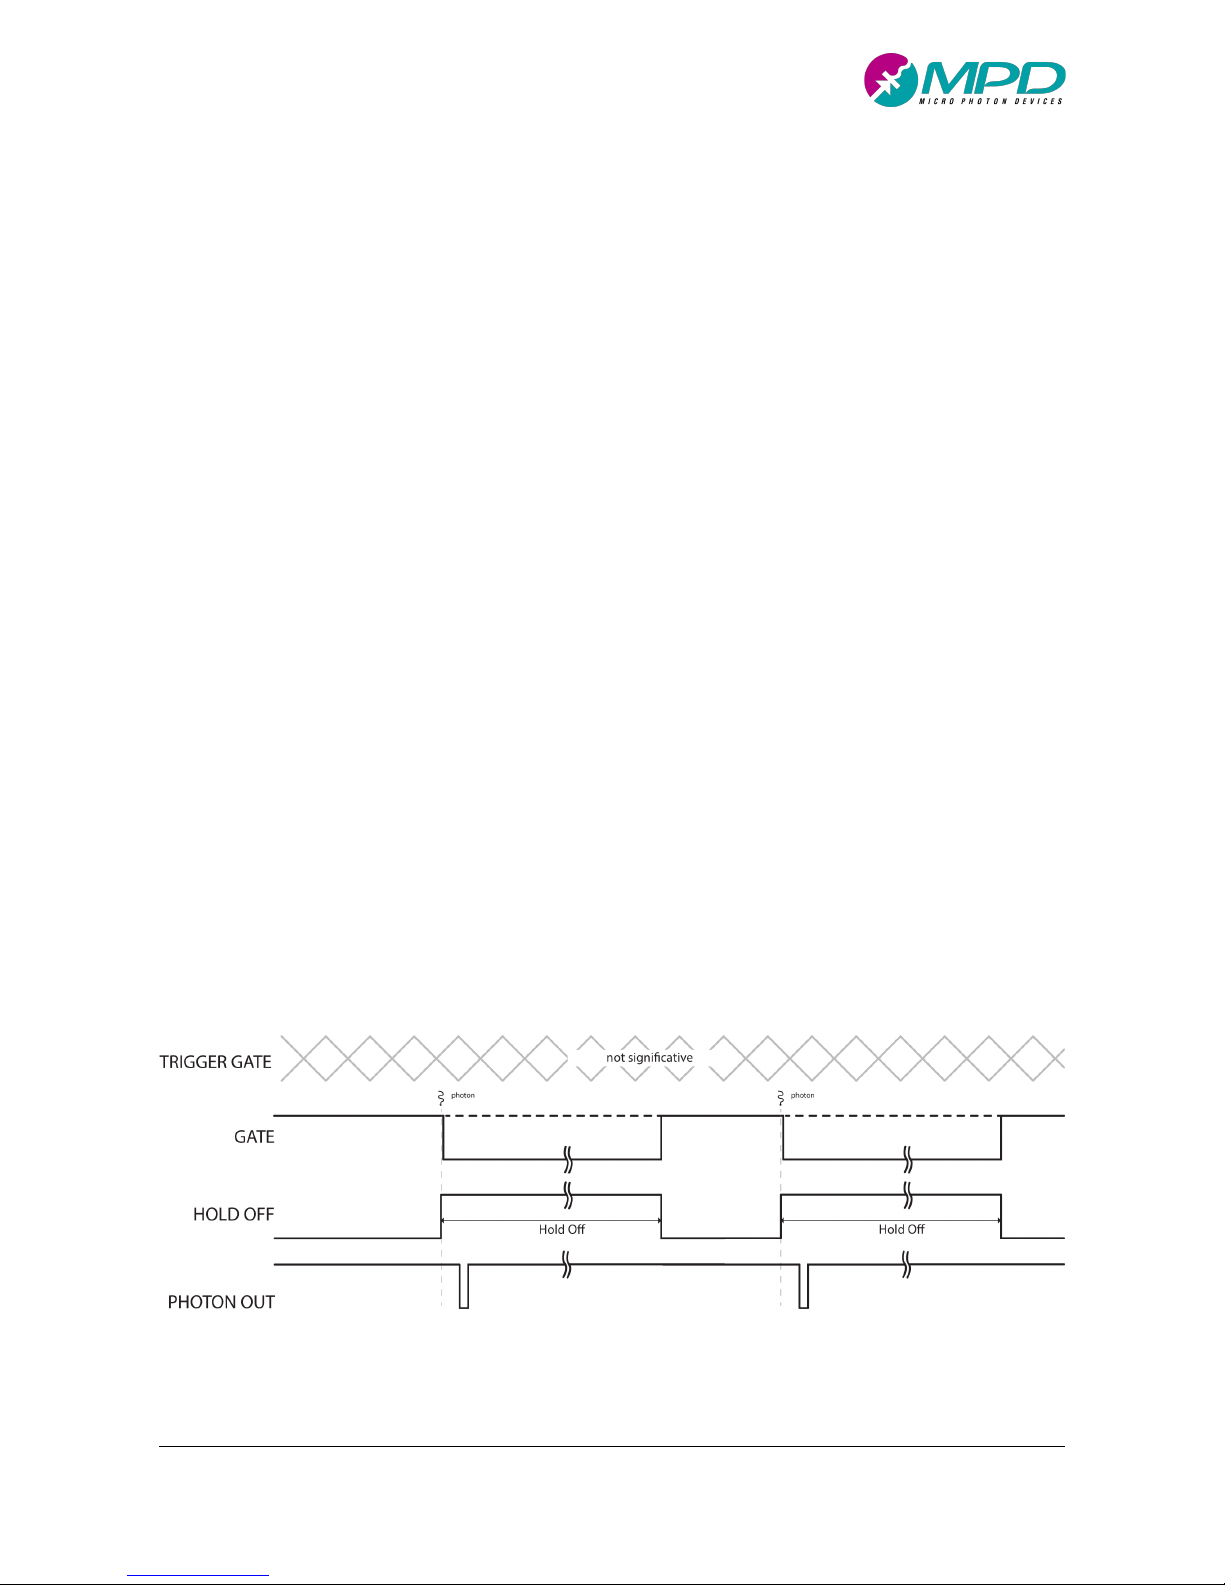
also the free running mode is possible with PDM-IR. In this mode of operation, as shown in Figure 4, TRIGGER
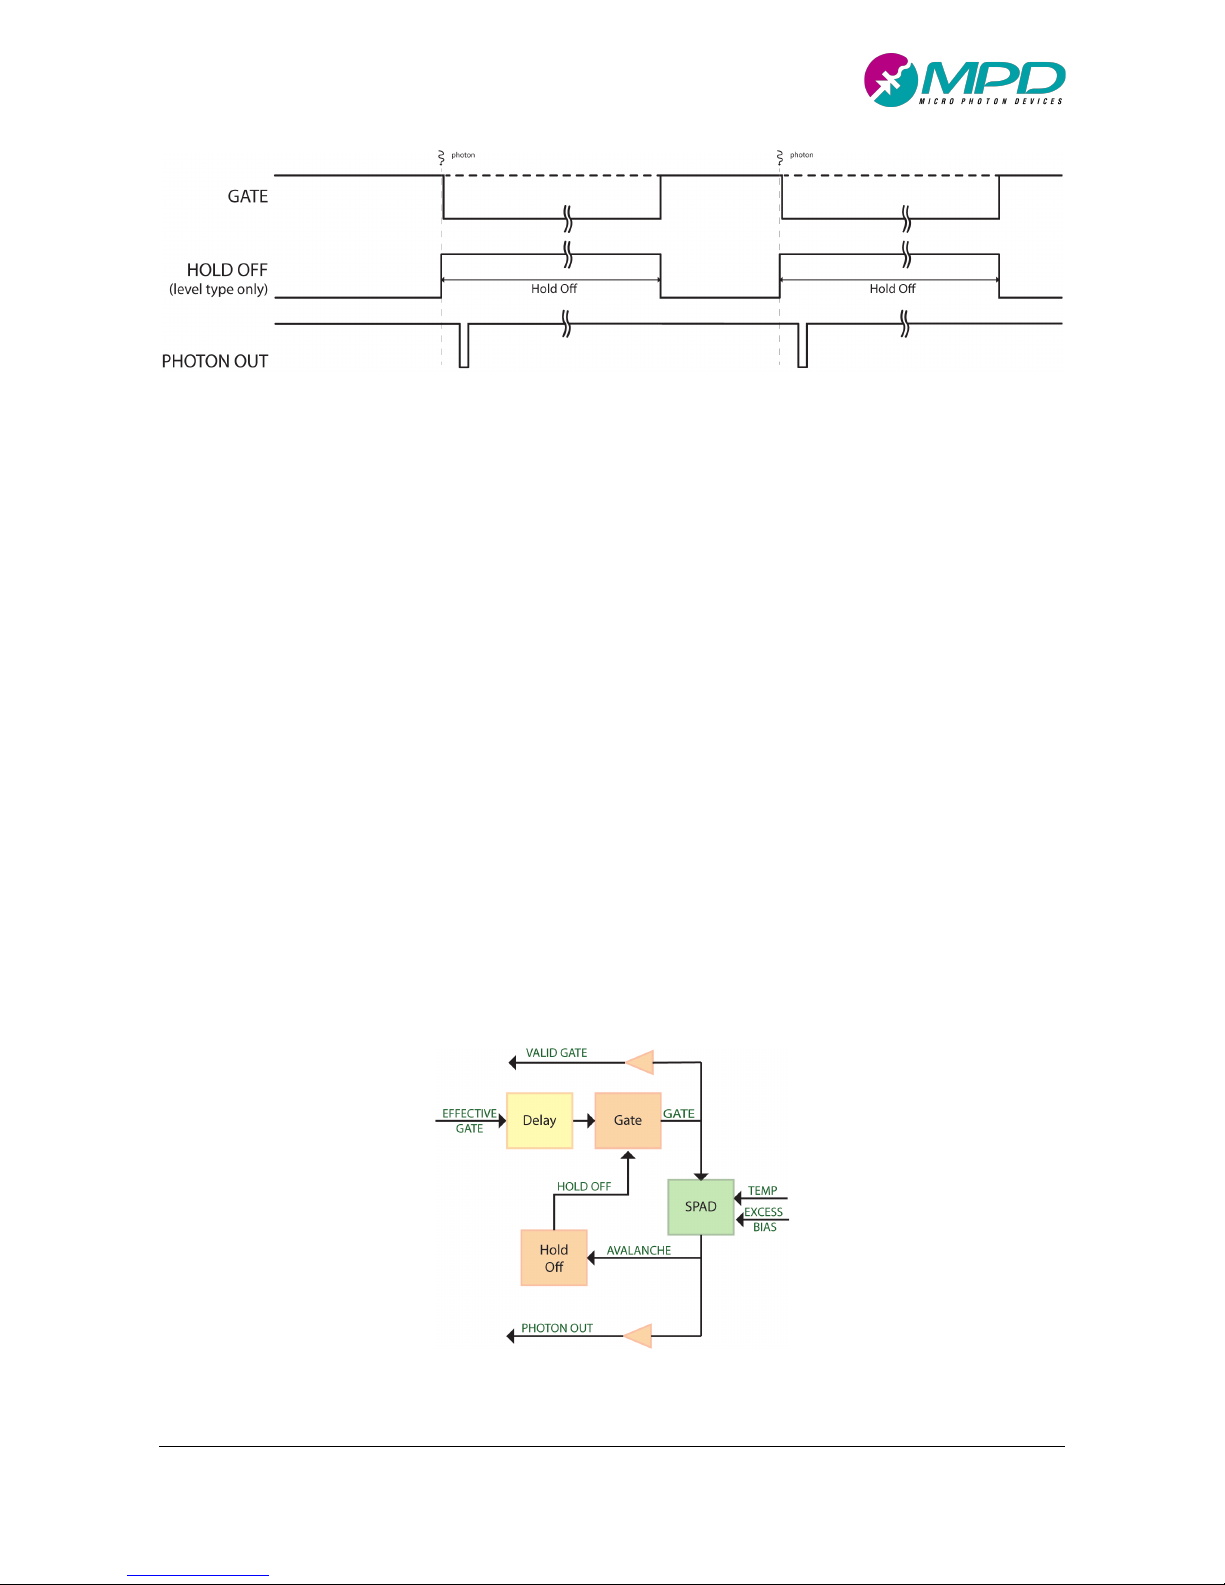
GATE signal is no more useful because the SPAD is always enabled until an avalanche is triggered. After each
of them, the SPAD is disabled for the hold off time and then immediately and swiftly re-enabled.
Overall, as a suggestion, the gated mode is used to achieve the best Signal-to-Noise (SNR) ratios and timing
resolutions whenever the signal to be detected is synchronous with a reference signal (for example the laser
clock used to stimulate the signal emission) that can be used to synchronize the PDM-IR. Indeed, better S/N
ratio or dynamic range, in case of TCSPC measurements, are achieved by enabling the detector only for the
short windows where the signal is present and keeping the detector off whenever the signal is not present.
The free running mode is typically used instead whenever the signal to be detected is not synchronous with
a reference signal (like the stimulated emission of photons from a nonlinear crystal by a CW laser). Of course,
free-running mode can also be used whenever a synchronous signal has to be detected but the S/N ratio (or
the dynamic range) is, in this case, lower compared to the gated mode module since the detector is always
enabled and InGaAs/InP diodes have much higher noise and after pulsing, compared to the silicon diodes.
Figure 4. Main waveforms for PDM-IR module in case of the free running operation: TRIGGER GATE is not significative
and ignored, the SPAD detector enabling time (GATE), the off time in case of avalanche (HOLD OFF) and
photon output signal (PHOTON OUTPUT).
Page 9

PDM-IR user manual v3.0.3
Micro Photon Devices S.r.l. – Italy All Rights Reserved
9
!
2.3 Further readings
Cova, S., Ghioni, M., Lacaita, A. L., Samori, C., and Zappa, F. “Avalanche photodiodes and quenching circuits
for single-photon detection”, Applied Optics, 35(12), 1956—1976 (1996).
http://dx.doi.org/10.1364/AO.35.001956
Cova, S., Ghioni, M., Zappa, F., Rech, I., and Gulinatti, A., “A view on progress of silicon single-photon
avalanche diodes and quenching circuits”, Proceedings of SPIE , 6372, pp. 63720I-1 - 63720I-12 (2006).
http://dx.doi.org/10.1117/12.685963
Alberto Tosi, Alberto Dalla Mora, Franco Zappa and Sergio Cova, “Single-photon avalanche diodes for the
near-infrared range: detector and circuit issues,” Journal of Modern Optics, 56:2-3, 299-308 (2008) -
http://dx.doi.org/10.1080/09500340802263075
Alberto Tosi, Alberto Dalla Mora, Simone Tisa, Fabio Acerbi, Franco Zappa and Sergio Cova , “InGaAs/InP
SPADs for near-infrared applications: device operating conditions and dedicated electronics,” Proc. SPIE
7681, Advanced Photon Counting Techniques IV, 76810R (April 28, 2010);
http://dx.doi.org/10.1117/12.850696
Alberto Tosi, Adriano Della Frera, Andrea Bahgat Shehata, and Carmelo Scarcella, “Fully programmable
single-photon detection module for InGaAs/InP single-photon avalanche diodes with clean and subnanosecond gating transitions,” Rev. Sci. Instrum. 83, 013104 (2012)
http://dx.doi.org/10.1063/1.3675579
Page 10
PDM-IR user manual v3.0.3
Micro Photon Devices S.r.l. – Italy All Rights Reserved
10
!
3 PDM-IR hardware characteristics
3.1 Rear Panel
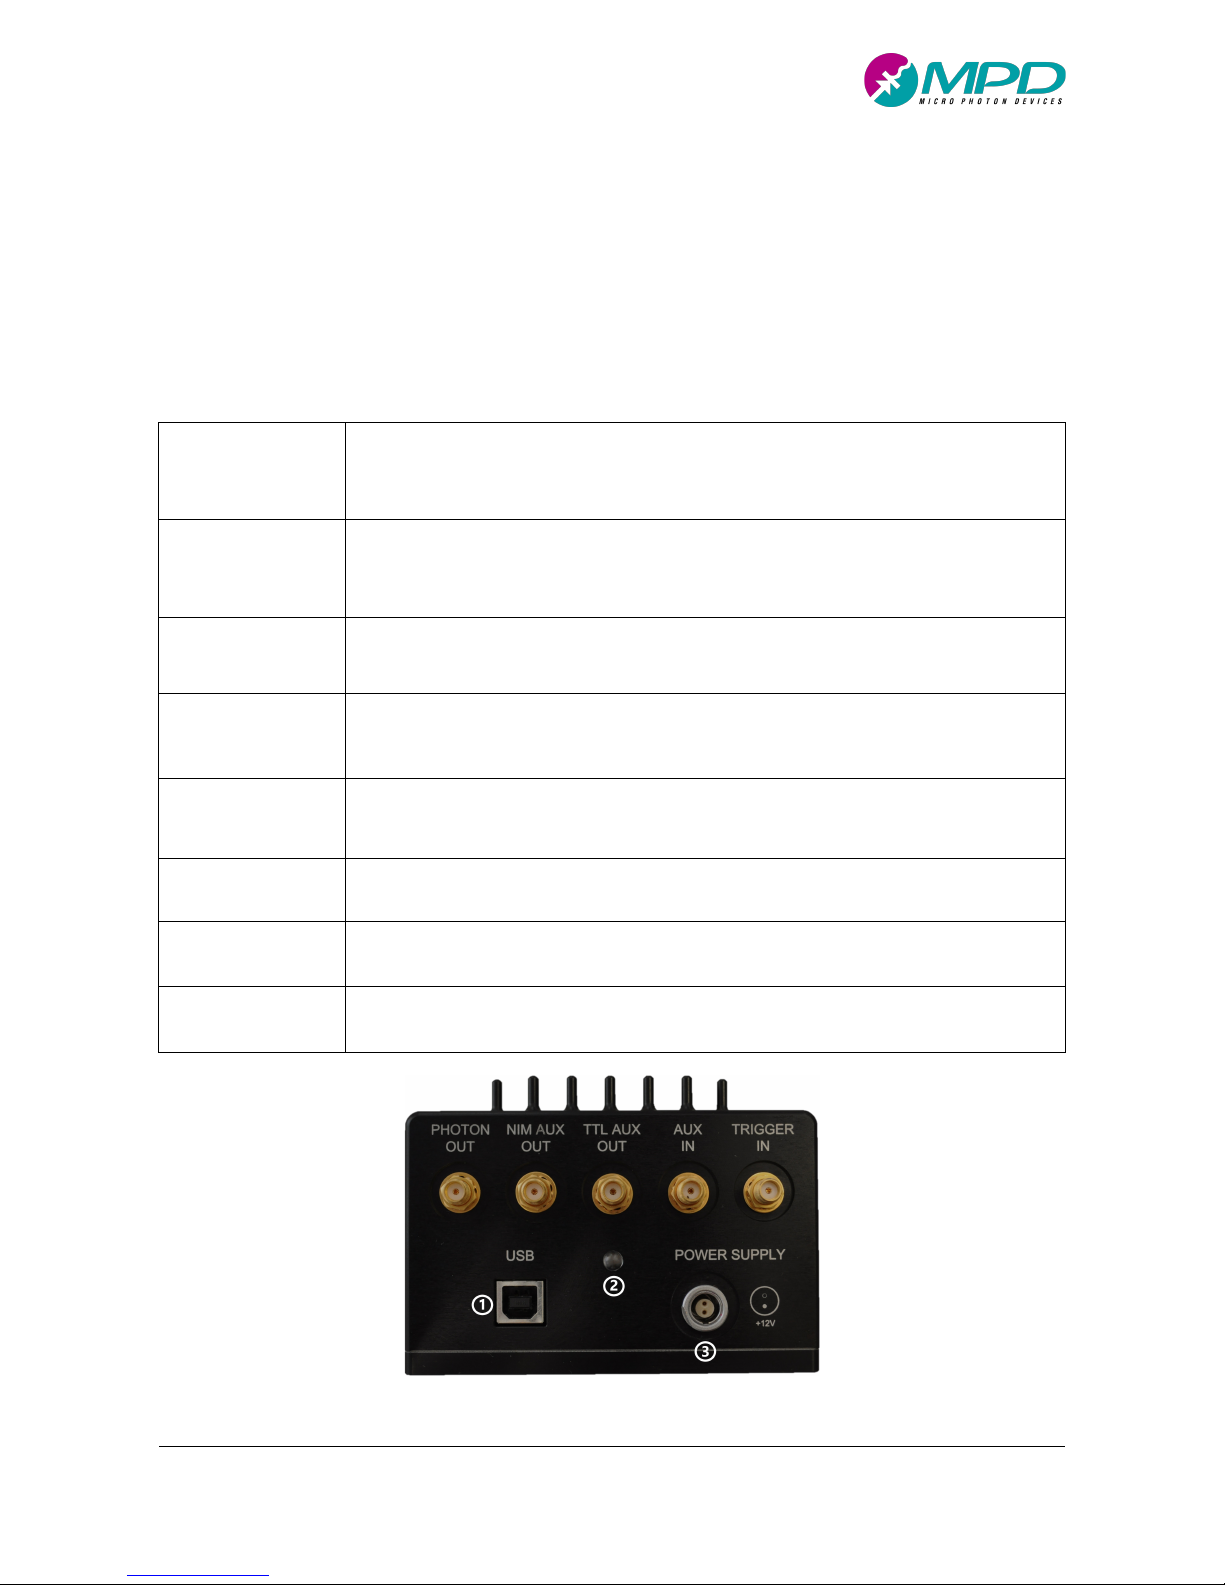
The PDM-IR has USB, power, IOs connectors and LED lens on rear side as shown in Figure 5. A description of
each component can be found in Table 1.
Table 1. PDM-IR rear panel components
PHOTON OUT
RF output, requires 50 Ohm DC terminated transmission lines. The output is a NIM pulse,
which means that the low logic level is 0 V and the high logic level is -800 mV. The falling
edge of the pulse marks, with very low jitter, the photon detection time. See paragraph 4.5
for a complete electrical description of this signal.
NIM AUX OUT
RF output, requires 50 Ohm DC terminated transmission lines. The output is a NIM pulse,
which means that the low logic level is 0 V and the high logic level is -800 mV. Output signal
is user selectable. See paragraph 4.5 for the available possibilities and for a complete
electrical description of this signal.
TTL AUX OUT
RF output, requires 50 Ohm DC terminated transmission lines. Electric pulses of 3.3V LVTTL
are generated at this output. Output signal is user selectable. See paragraph 4.5 for the
available possibilities and for a complete electrical description of this signal.
AUX IN
RF input, 50 Ohm with fixed DC impedance. The trigger signal can be positive or negative and
the input internal threshold is fully programmable. See Table 4 for a complete electrical
description of this input.
TRIGGER IN
RF input, 50 Ohm with fixed DC impedance. The trigger signal can be positive or negative and
the input internal threshold is fully programmable. See Table 3 for a complete electrical
description of this input.
USB ❶
Connector for a USB type-B cable. Used for PC connection
POWER SUPPLY ❸
Jack for connecting the provided +12V power supply. It requires at least 15 W output power.
Use only power supply provided by MPD to avoid electronics damage.
STATUS LED ❷
This LED indicates the PDM-IR status. It can be Green, Orange, Red and Off. See paragraph
4.6 for a complete description of the possible statuses
Figure 5. PDM-IR rear panel with highlighted connectors.
Page 11
PDM-IR user manual v3.0.3
Micro Photon Devices S.r.l. – Italy All Rights Reserved
11
!
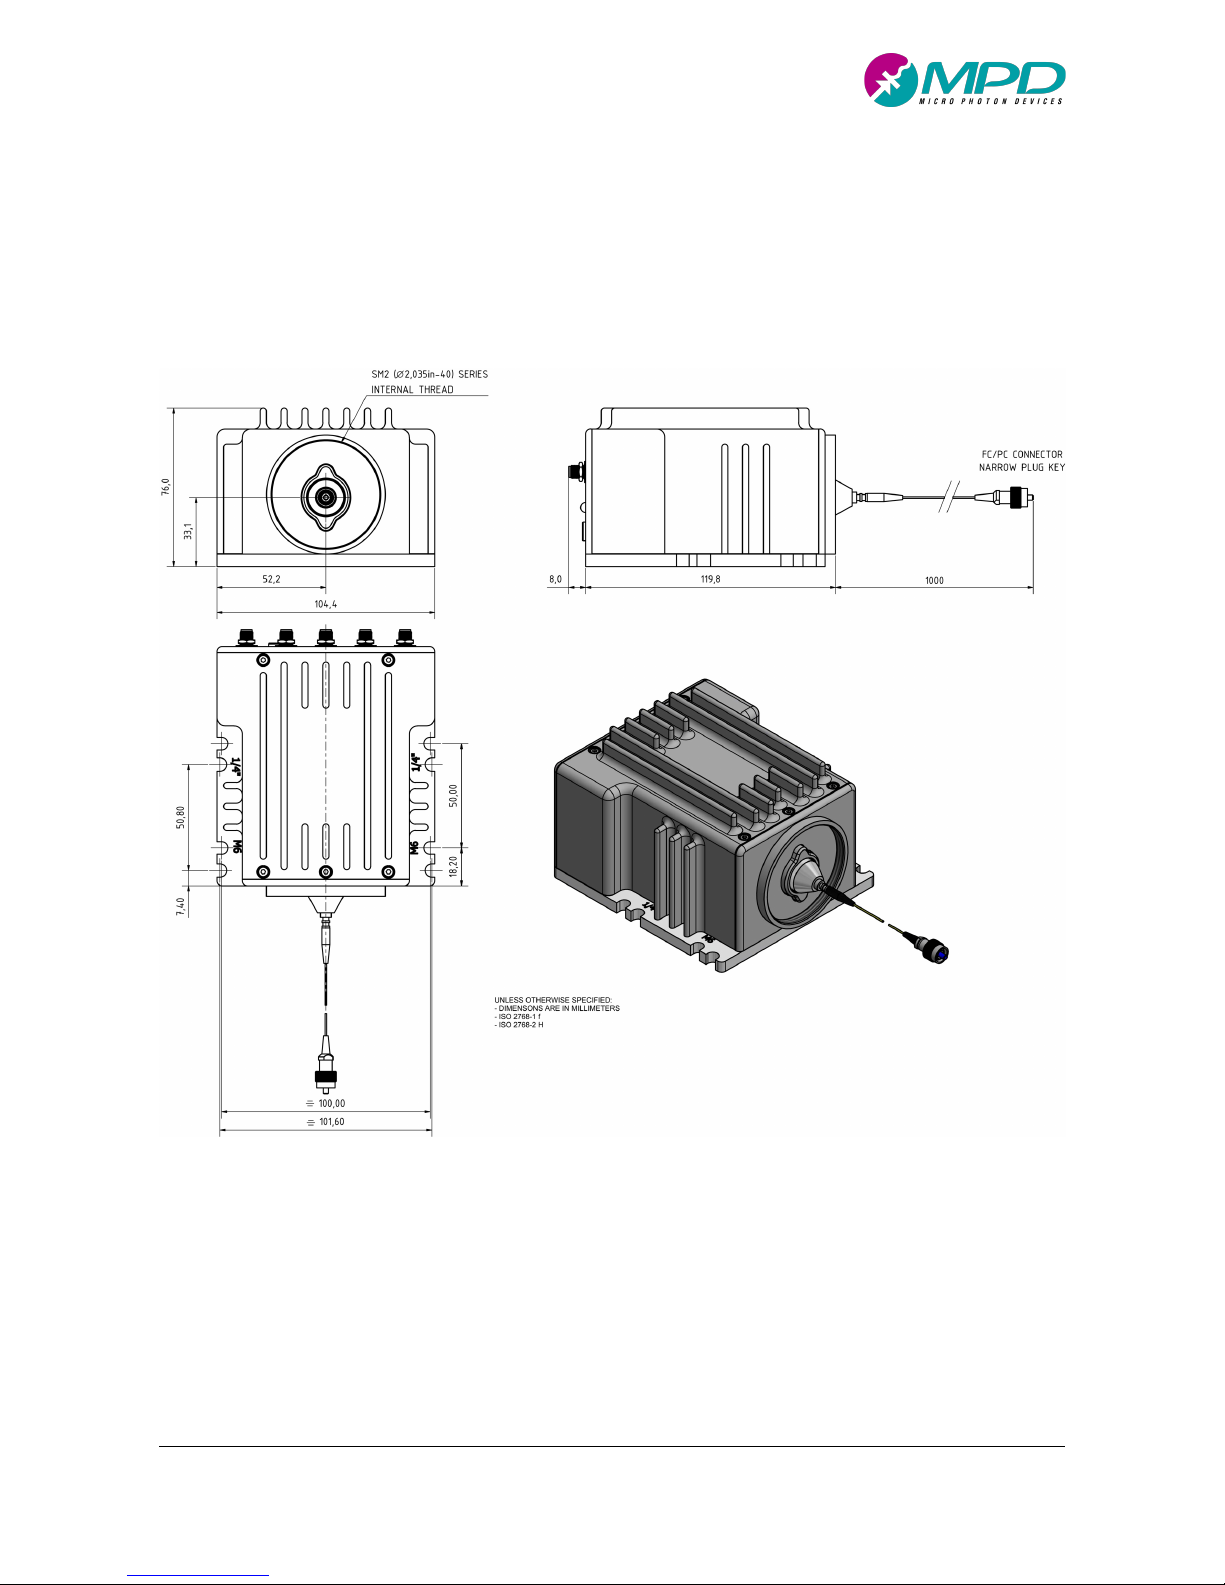
3.2 PDM-IR Mechanical Dimension
Figure 6. Mechanical dimensions of the PDM-IR fiber pigtailed version.
Page 12
PDM-IR user manual v3.0.3
Micro Photon Devices S.r.l. – Italy All Rights Reserved
12
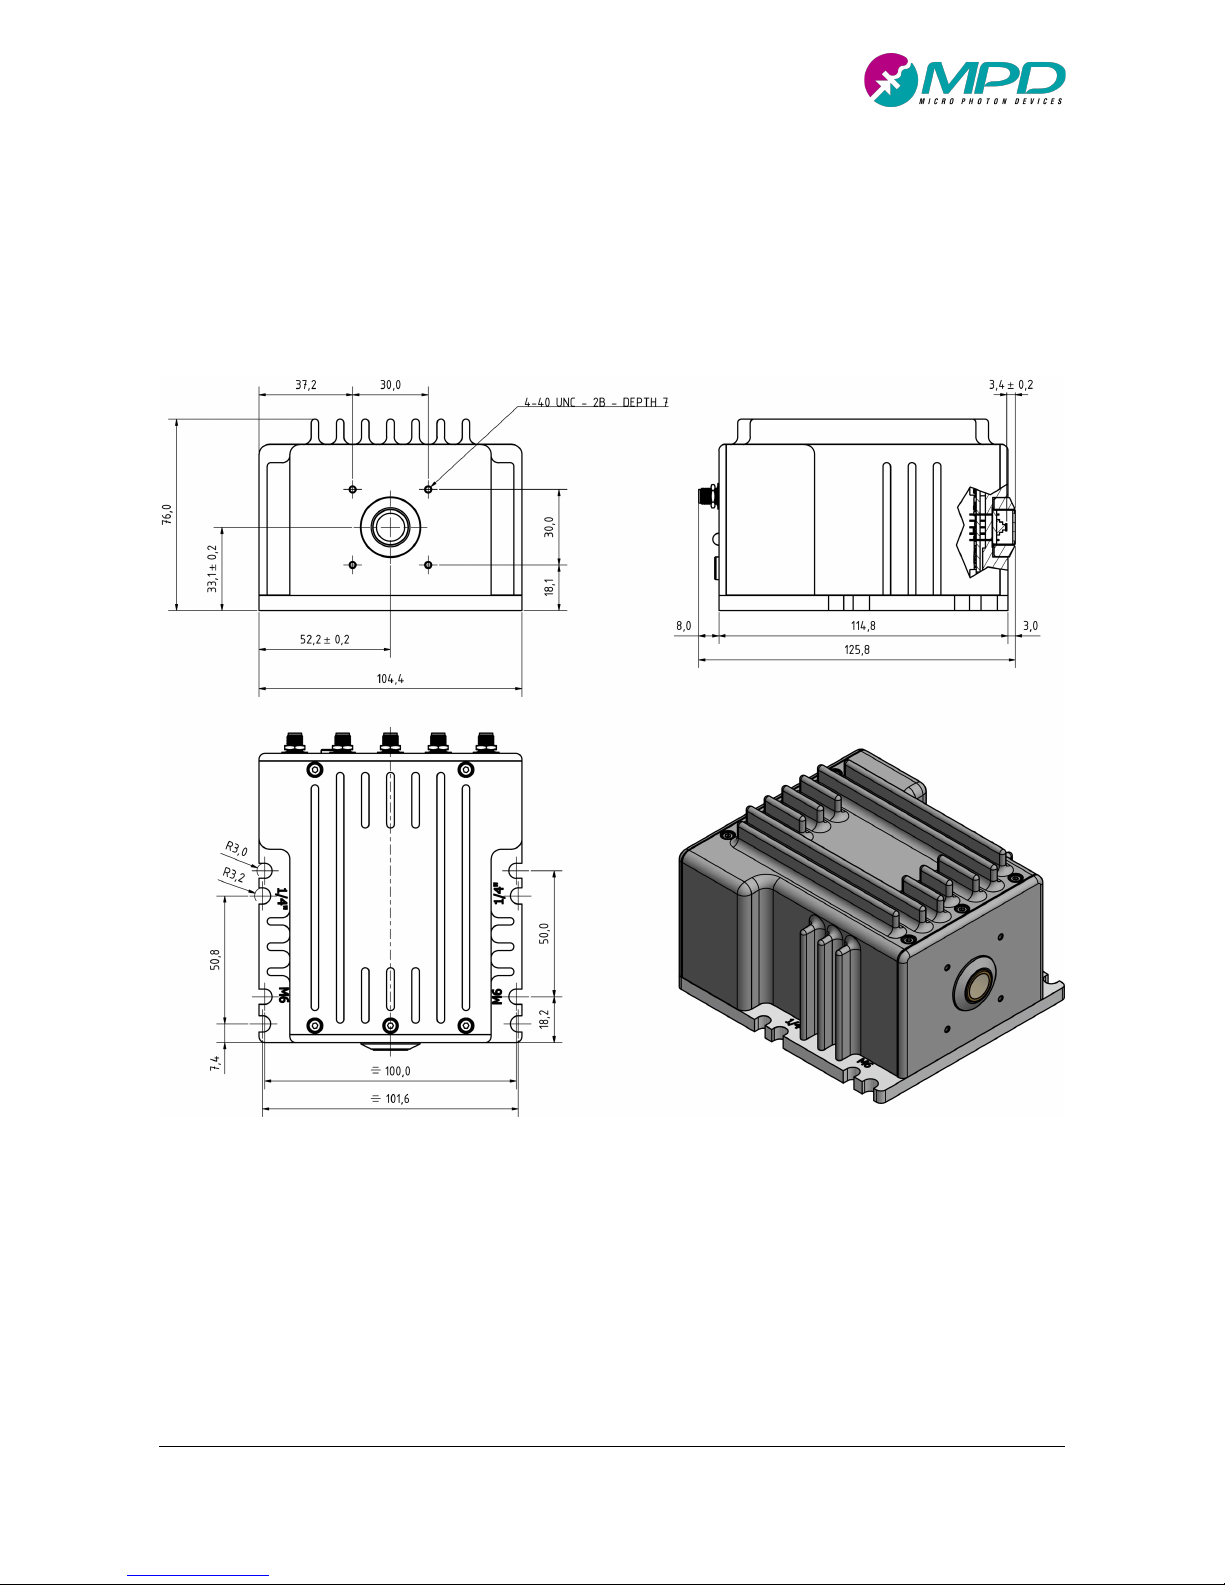
!
Figure 7. Mechanical dimensions of the PDM-IR free space version.
Page 13

PDM-IR user manual v3.0.3
Micro Photon Devices S.r.l. – Italy All Rights Reserved
13
!
4 PDM-IR Specifications
The PDM-IR module is a complete system for photon counting in the NIR range (Figure 1, Figure 2) and it can
be used either in gated or in free-running mode. Both modes of operations can be optimized through the use
of several user selectable parameters, all controllable from a computer using either the delivered SDK library
or the provided Windows® PC software.
When used in gated mode (see Figure 3 and paragraph 2 for details), the TRIGGER GATE signal, for GATE
frequency generation, can be provided either using an INTERNAL TRIGGER or through an external signal fed
into the TRIGGER IN input. In the former case, for synchronizing the GATE with other instruments, it is
possible to replicate the INTERNAL TRIGGER at one of the two available outputs, depending on the desired
pulse polarity, i.e. the TTL AUX OUT or the NIM AUX OUT. Complex external trigger patterns can be also fed
to the TRIGGER IN input, since it accepts not only periodic but also aperiodic signals as shown in Figure 12.
Additionally, it is possible to create even more complex TRIGGER GATE patterns for GATE generation, by
combining the auxiliary input AUX IN signal with the INTERNAL TRIGGER or the TRIGGER IN, and by using the
provided user-selectable logic functions (see paragraph 4.1 for more details). An example of such
combination is shown in Figure 10. Finally, GATE signal can be generated either by exactly replicating
TRIGGER GATE (Figure 13) or by creating a new signal, synchronized with the rising edge of TRIGGER GATE
and with a fixed gated-ON width equal to the user set TON value (Figure 12). See paragraph 4.2 for more
details. Of course, as discussed in paragraph 2, independently of the chosen trigger pattern, GATE signal is
disabled for the duration of the HOLD OFF time, following each avalanche triggering. At the end of the Hold
off time, two types of reset are possible depending on how the gate electronics handles what happens when
the hold-off terminates inside a gate-ON time window. See paragraph 4.2 for a detailed description.
When used in free running mode (see also Figure 4 and paragraph 2), the INTERNAL TRIGGER, TRIGGER IN
and AUX IN signals are meaningless and the SPAD is always on until a SPAD avalanche is initiated. In this case,
the avalanche current is first quenched and then, after a well-defined hold-off, the detector is immediately
enabled (see paragraph 4.2.3). Of course, in free running mode only one type of hold off reset is possible
since GATE signal is always immediately enabled at the end of the hold-off time, as shown in Figure 14.
Concerning the SPAD parameters Hold-OFF time, excess bias voltage and SPAD temperature, they are all user
selectable to get the best results from the measurement (see paragraph 4.3 for in-depth description).
Concerning the outputs: PHOTON OUT is the low timing jitter output signal, precisely marking the photon
detection time; NIM AUX OUT and TTL AUX OUT, shouldn’t be used for low jitter timing measurements and
Page 14
PDM-IR user manual v3.0.3
Micro Photon Devices S.r.l. – Italy All Rights Reserved
14
!
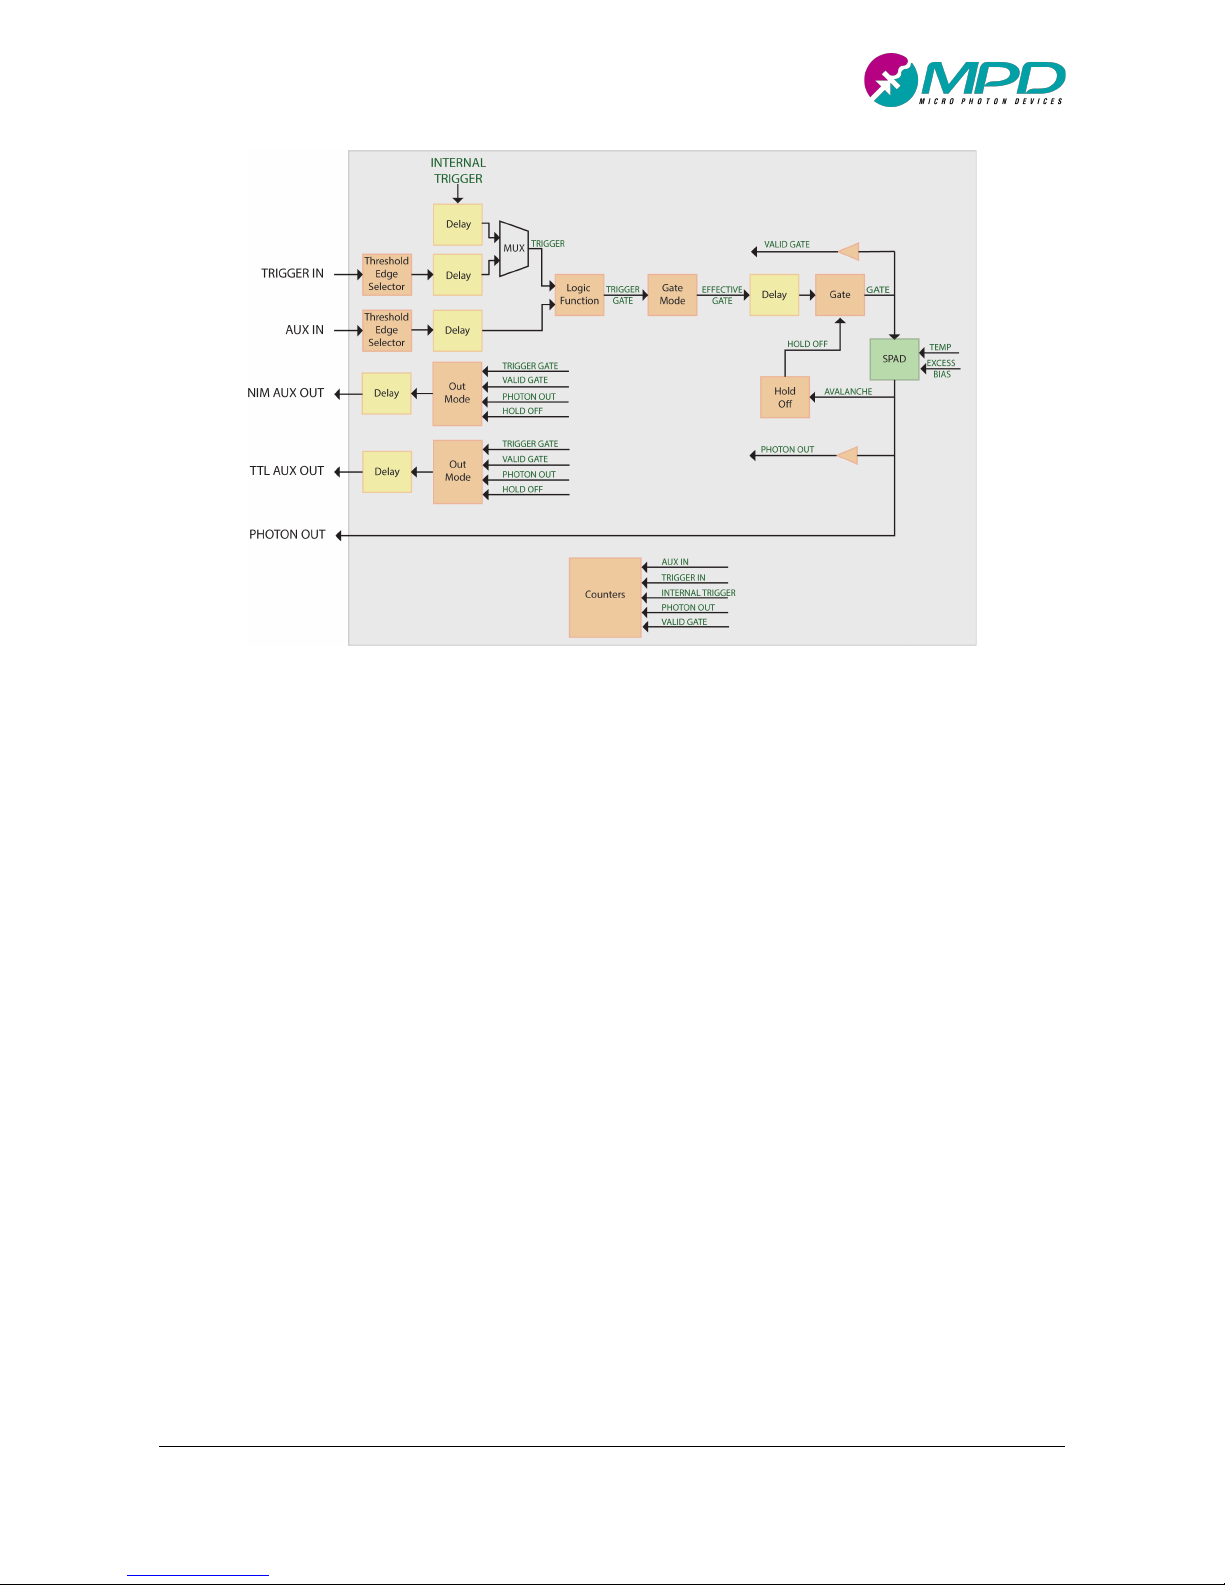
Figure 8. PDM-IR Block diagram.
the output signal can be chosen independently, on each out channel, among TRIGGER GATE, INTERNAL
TRIGGER, VALID GATE, PHOTON OUT, HOLD OFF and MODULE STATUS signals (paragraph 4.5).
Independently on the chosen PDM-IR mode of operation, the module has also internal counters that
continuously monitor the following signals: TRIGGER IN, AUX IN, INTERNAL TRIGGER, PHOTON OUT and
VALID GATE. Specially in case of the PHOTON OUT, these counters are useful for counting applications
whenever an external counter is not available (paragraph 4.4).
Finally, in the PDM-IR, all the main signal paths have a programmable delay, designed to help the user in
synchronizing the various signals between them and with the external instruments. This feature is very
helpful in many applications as it allows to avoid the hassle of continuously changing the cable length.
In Figure 8 the full PDM-IR block diagram is shown, while in the next paragraphs we will describe the functions
and the characteristics of each subsection of it.
4.1 PDM-IR Trigger Section
This section is designed for generating the TRIGGER GATE signal that in turn is used for shaping the GATE
signal actually applied to the detector. As discussed in paragraph 2, by controlling the detector in gated mode
it is possible to enable the SPAD only when the signal is impinging the detector and thus increasing the SNR.
Page 15
PDM-IR user manual v3.0.3
Micro Photon Devices S.r.l. – Italy All Rights Reserved
15
!
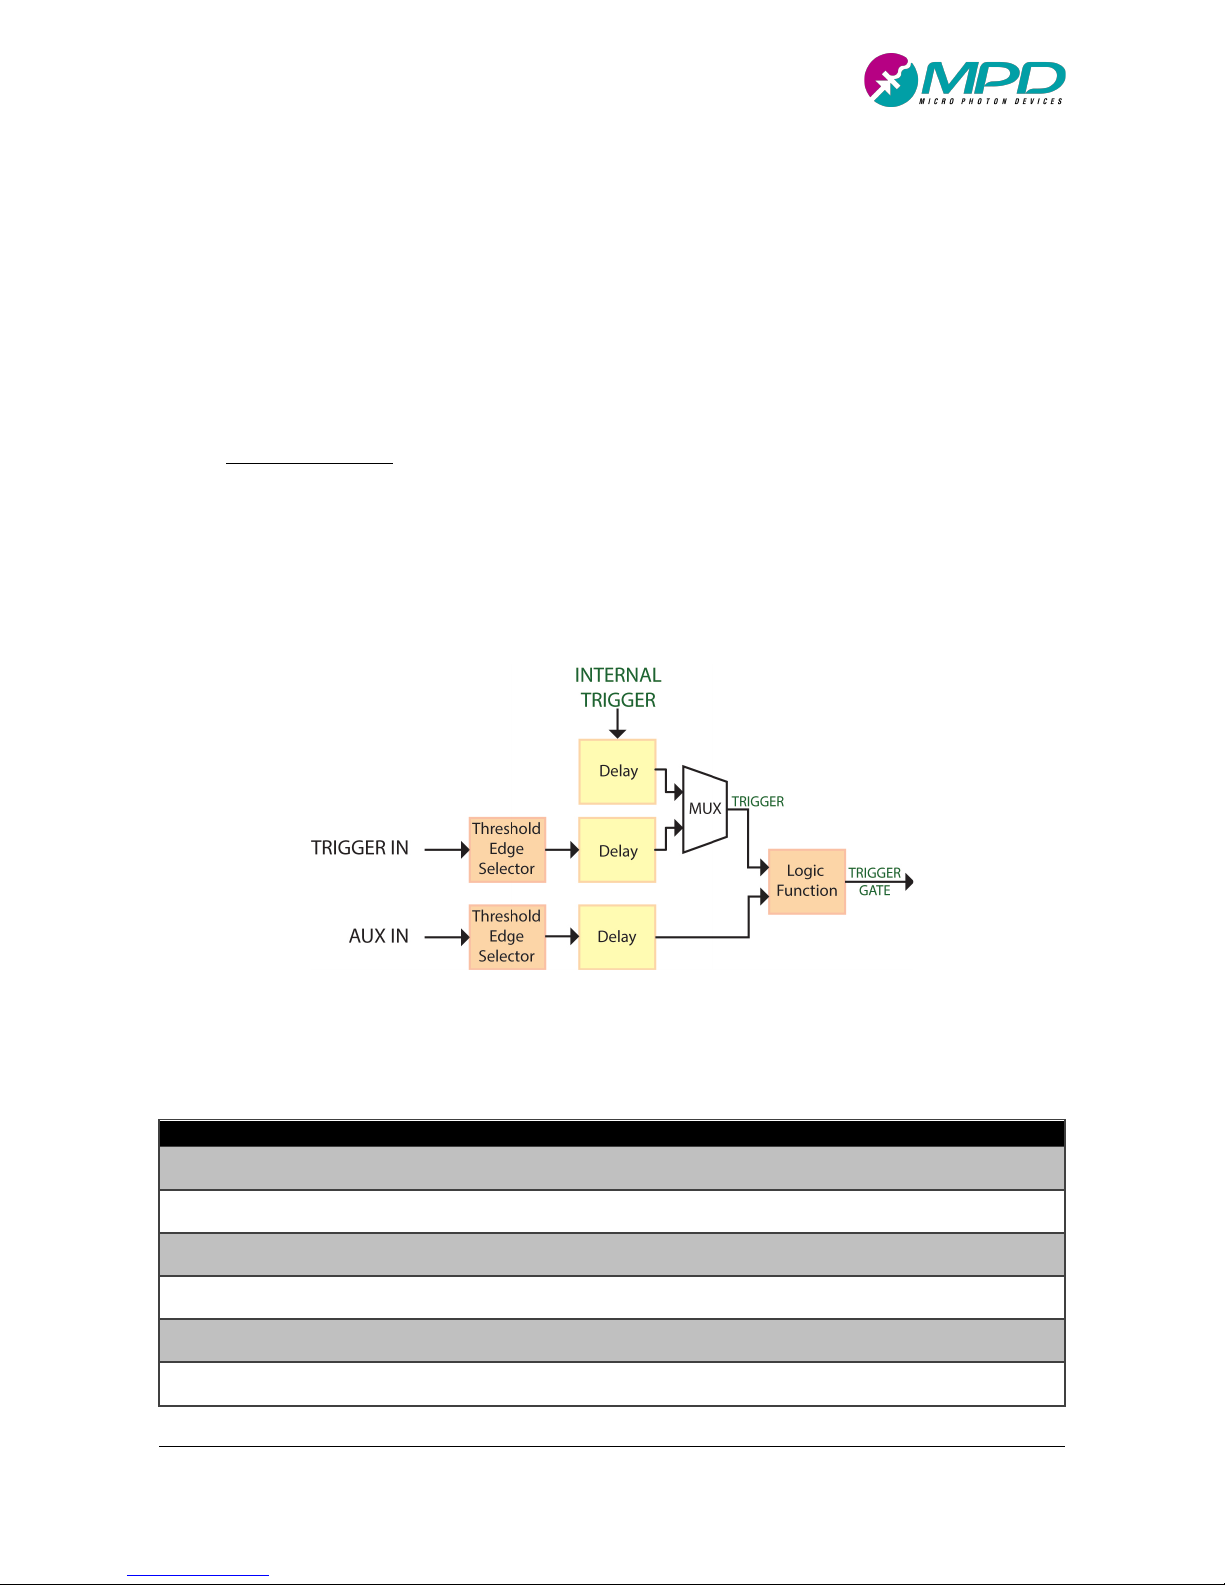
The PDM-IR offers an advanced Trigger section in order to generate trigger events only when required by the
application (Figure 9). It accepts 3 signals: TRIGGER IN and AUX IN, provided by the user and INTERNAL
TRIGGER, which is internally generated. The external inputs accept positive or negative signals and the
threshold can be user selected with tens of mV resolution. TRIGGER IN and INTERNAL TRIGGER are mutually
exclusive and can be combined with AUX IN with a user selectable logic operation in order to generate the
final TRIGGER GATE. In the next paragraphs the performance of each sub-block of the Trigger section, shown
in Figure 9, is illustrated.
4.1.1 Internal Trigger
The INTERNAL TRIGGER is an internally created waveform with a periodic pattern with fixed frequency
(selectable by the user) and a duty cycle equal to 50%. In order to be able to synchronize the PDM-IR module
with other instrumentations, set the TTL AUX OUT and/or the NIM AUX OUT to output the INTERNAL
TRIGGER. In Table 2 the Electrical characteristics of the INTERNAL TRIGGER are illustrated.
Figure 9. PDM-IR Trigger Section Block diagram.
Table 2. Internal trigger specifications
Parameter
Symbol
Description
Min.
Typ.
Max.
Unit
Internal Trigger Frequency
freqIN 100 100 M
Hz
Internal Trigger Frequency Step
ΔfreqIN 1
Hz
Frequency Total Stability
-100 100
ppm
Internal Trigger Duty Cycle
40
50
60
%
Internal Trigger Delay
δ
INT_TRIGGER
0
100
ns
Internal Trigger Delay step
1
ns
Page 16

PDM-IR user manual v3.0.3
Micro Photon Devices S.r.l. – Italy All Rights Reserved
16
!
4.1.2 Trigger In
The TRIGGER IN, provided by the user, can be periodic or aperiodic, positive and/or negative. It’s normally
used to synchronize the GATE signal of the PDM-IR with a LASER source that cannot be triggered. The user
can set the threshold voltage and the significative edge. In Table 3 the Electrical characteristics of the
TRIGGER IN input are illustrated.
Table 3. Trigger In specifications
Parameter
Symbol
Description
Min.
Typ.
Max.
Unit
Trigger In Max Frequency
100 M
Hz
Trigger In Delay
δ
TRIGGER_IN
0
100
ns
Trigger In Delay step
1
ns
Trigger In high voltage
V
IH_IN
3 V Trigger In low voltage
V
IL_IN
-2 V Trigger In differential range
V
ID_IN
-2 2
V
Trigger In termination
R
IN_IN
50 Ω
Trigger In voltage overdrive
V
OV_IN
100
mV
Trigger In pulse width
t
IN_PULSEmi n
800
ps
Trigger In Slew Rate
SRIN 10
V/µs
Trigger In Edge
Neg/pos
Trigger In Threshold
V
TH_IN
-2 2 V Trigger In Threshold resolution
ΔV
TH_IN
10 mV
4.1.3 Aux In
The AUX IN input is provided by the user, can be periodic or aperiodic, positive and/or negative. It’s an
auxiliary signal, useful to enable or disable the SPAD in certain conditions. Threshold voltage and significative
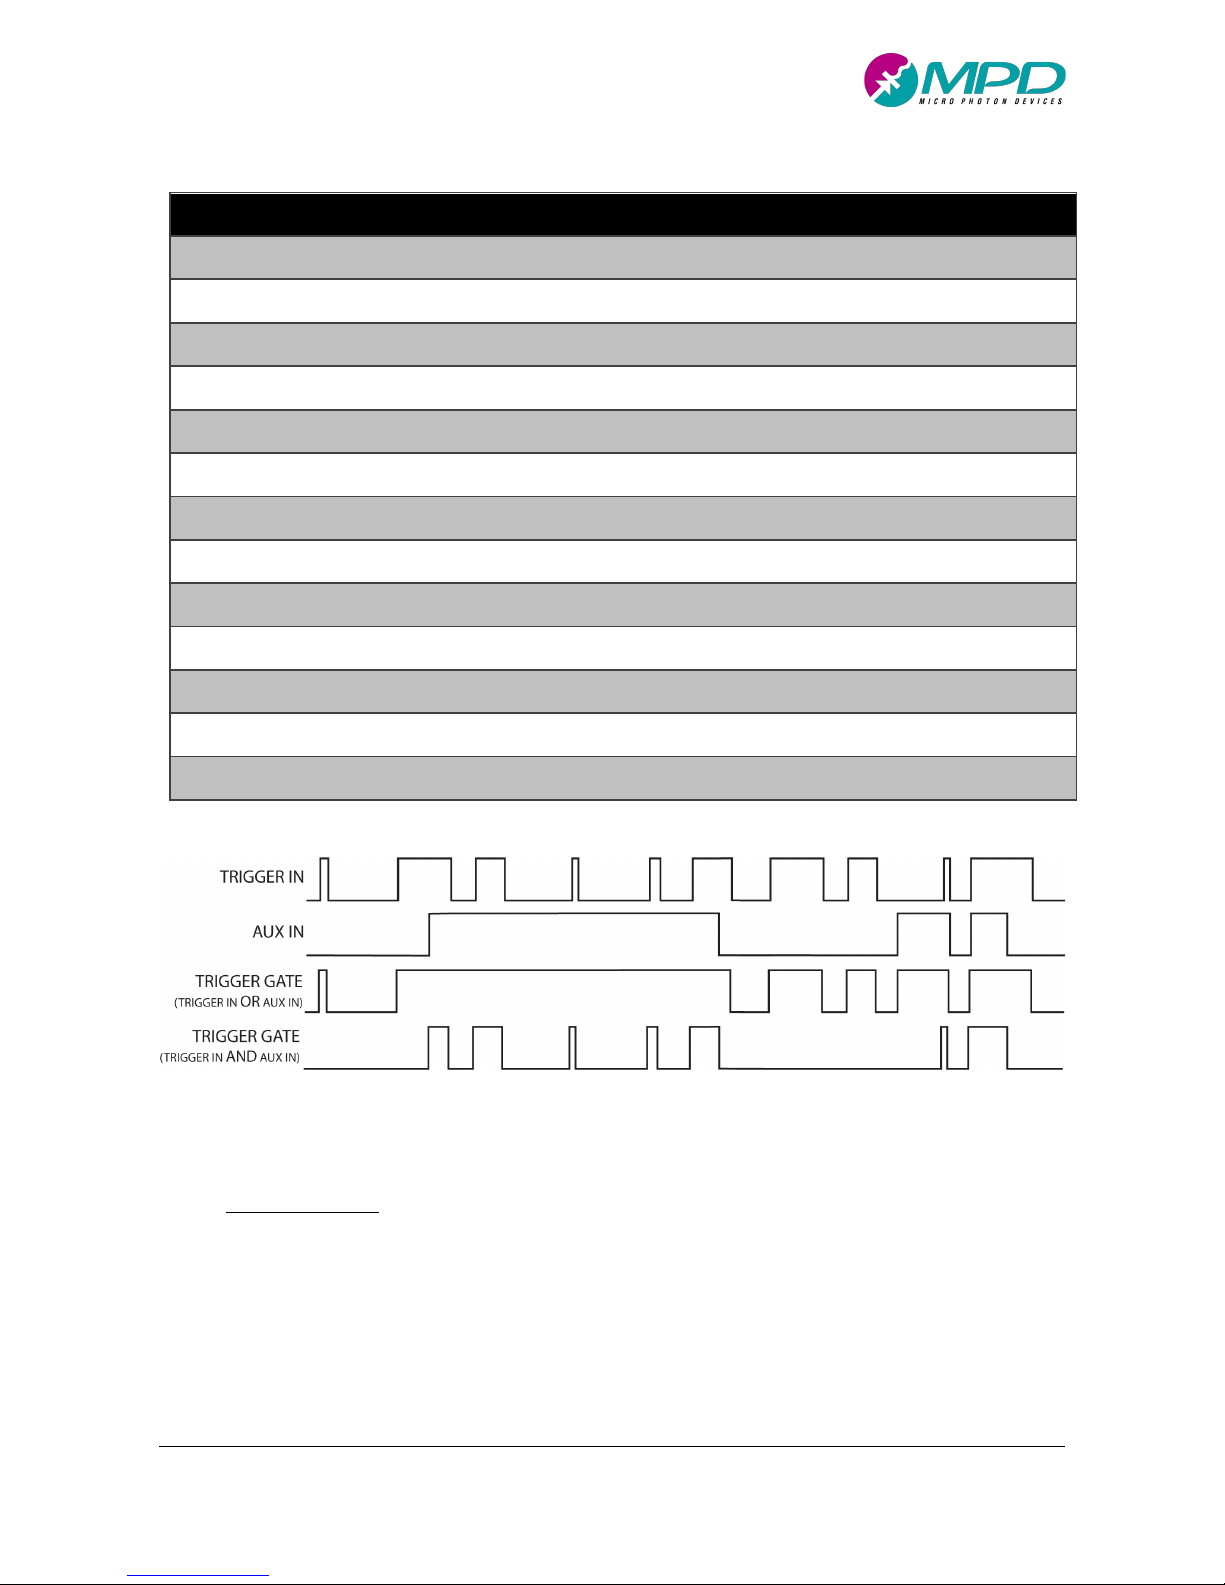
edge can be set by the user. The logic function between AUX IN and TRIGGER (see Figure 9) can be for
example very useful in some measurements, like cross-correlation ones (see paragraph 6.2.1). Figure 10
shows an example of what happens in case of an aperiodic and complex TRIGGER IN is combined with the
shown AUX IN signal by means of a OR logic port which generates the TRIGGER GATE. The same figure shows
the case where the TRIGGER GATE is generated combining TRIGGER IN and AUX IN with an AND logic. In
Table 4 the Electrical characteristics of the AUX IN input are illustrated.
Page 17
PDM-IR user manual v3.0.3
Micro Photon Devices S.r.l. – Italy All Rights Reserved
17
!
Table 4. Aux In electrical specifications.
Parameter
Symbol
Description
Min.
Typ.
Max.
Unit
Aux In Max Frequency
100 M
Hz
Aux In Delay
δ
AUX_IN
0 100
ns
Aux In Delay step
1
ns
Aux In high voltage
V
IH_AUX
3 V Aux In low voltage
V
IL_AUX
-2 V Aux In differential range
V
ID_AUX
-2 2 V Aux In termination
R
IN_AUX
50 Ω
Aux In voltage overdrive
V
OV_AUX
100
mV
Aux In pulse width
t
IN_AUX
800
ps
Aux In Slew Rate
SR
AUX
10
V/µs
Aux In Edge
Neg/pos
Aux In Threshold
V
TH_AUX
-2 2 V Aux in Threshold resolution
ΔV
TH_AUX
10 mV
Figure 10. Advance trigger section using AUX IN signal in logic function with TRIGGER IN signal. TRIGGER GATE is shown
in case of use the OR port and the AND port between the two signals.
4.1.4 Logic Function
The Logic Function Block allows advanced gate triggering using TRIGGER (selected between TRIGGER IN and
INTERNAL TRIGGER) and AUX IN as inputs. The Logic Function can be AND, OR or XOR. The two inputs and
the output can also be inverted if needed. Figure 10 shows an example of combination between TRIGGER IN
and AUX IN signals in case OR or AND logic is used.
Page 18
PDM-IR user manual v3.0.3
Micro Photon Devices S.r.l. – Italy All Rights Reserved
18
!
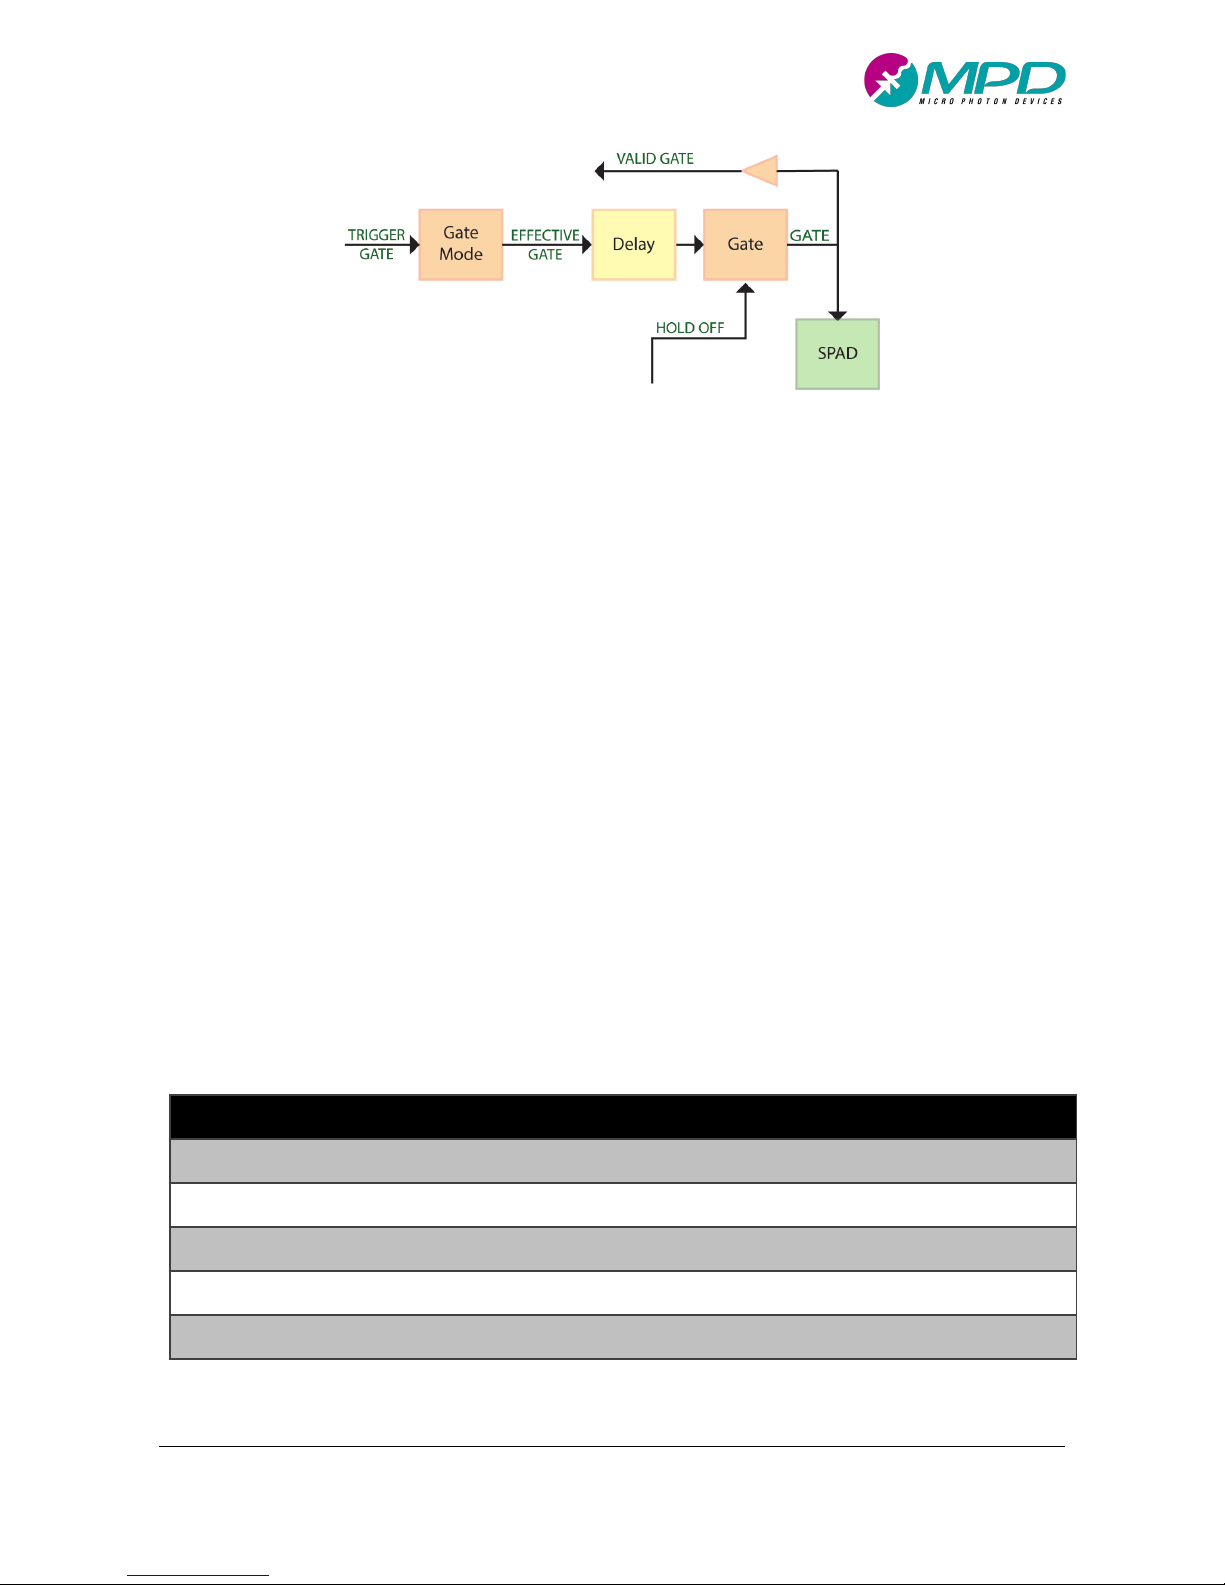
Figure 11. PDM-IR Gate Section Block diagram.
4.2 PDM-IR Gate Section
The TRIGGER GATE signal (see Figure 11), coming from the PDM-IR Trigger Section (4.1), is shaped in order
to generate the desiderated gate width and frequency, i.e. the EFFECTIVE GATE. The PDM-IR offers also three
possible mode of generating the EFFECTIVE GATE signal and thus of operation:
1. For each TRIGGER GATE rising edge, a fixed gate width, set by the TON parameter, is generated
(described in 4.2.1);
2. EFFECTIVE GATE replicates the TRIGGER GATE waveform (see paragraph 4.2.2);
3. The module works in free running mode and thus becomes TRIGGER GATE independent (see 4.2.3).
The EFFECTIVE GATE, whose electrical characteristics are shown in Table 5, can also be delayed before being
applied to the SPAD. The GATE signal is thus the EFFECTIVE GATE after a user controllable delay and with the
HOLD-OFF, also user controllable, applied after every avalanche triggering. As GATE depends on the actual
photon flux, it can only be monitored through the VALID GATE signal. Finally, as HOLD-OFF plays an important
role in GATE generation, it is also here discussed, while its possible selectable values are shown in paragraph
4.3.3.
Table 5. Gate electrical specifications.
Parameter
Symbol
Description
Min.
Typ.
Max.
Unit
Effective Gate
Max Frequency
100M
Hz
Effective Gate
Delay
δ
EFFECTIVE_GATE
0 100
ns
Effective Gate
Delay step
1
ns
Gate Window
t
ON
1 n 1.5 m
s
Gate Window
Step
ΔTON 1
ns
Page 19
PDM-IR user manual v3.0.3
Micro Photon Devices S.r.l. – Italy All Rights Reserved
19
!
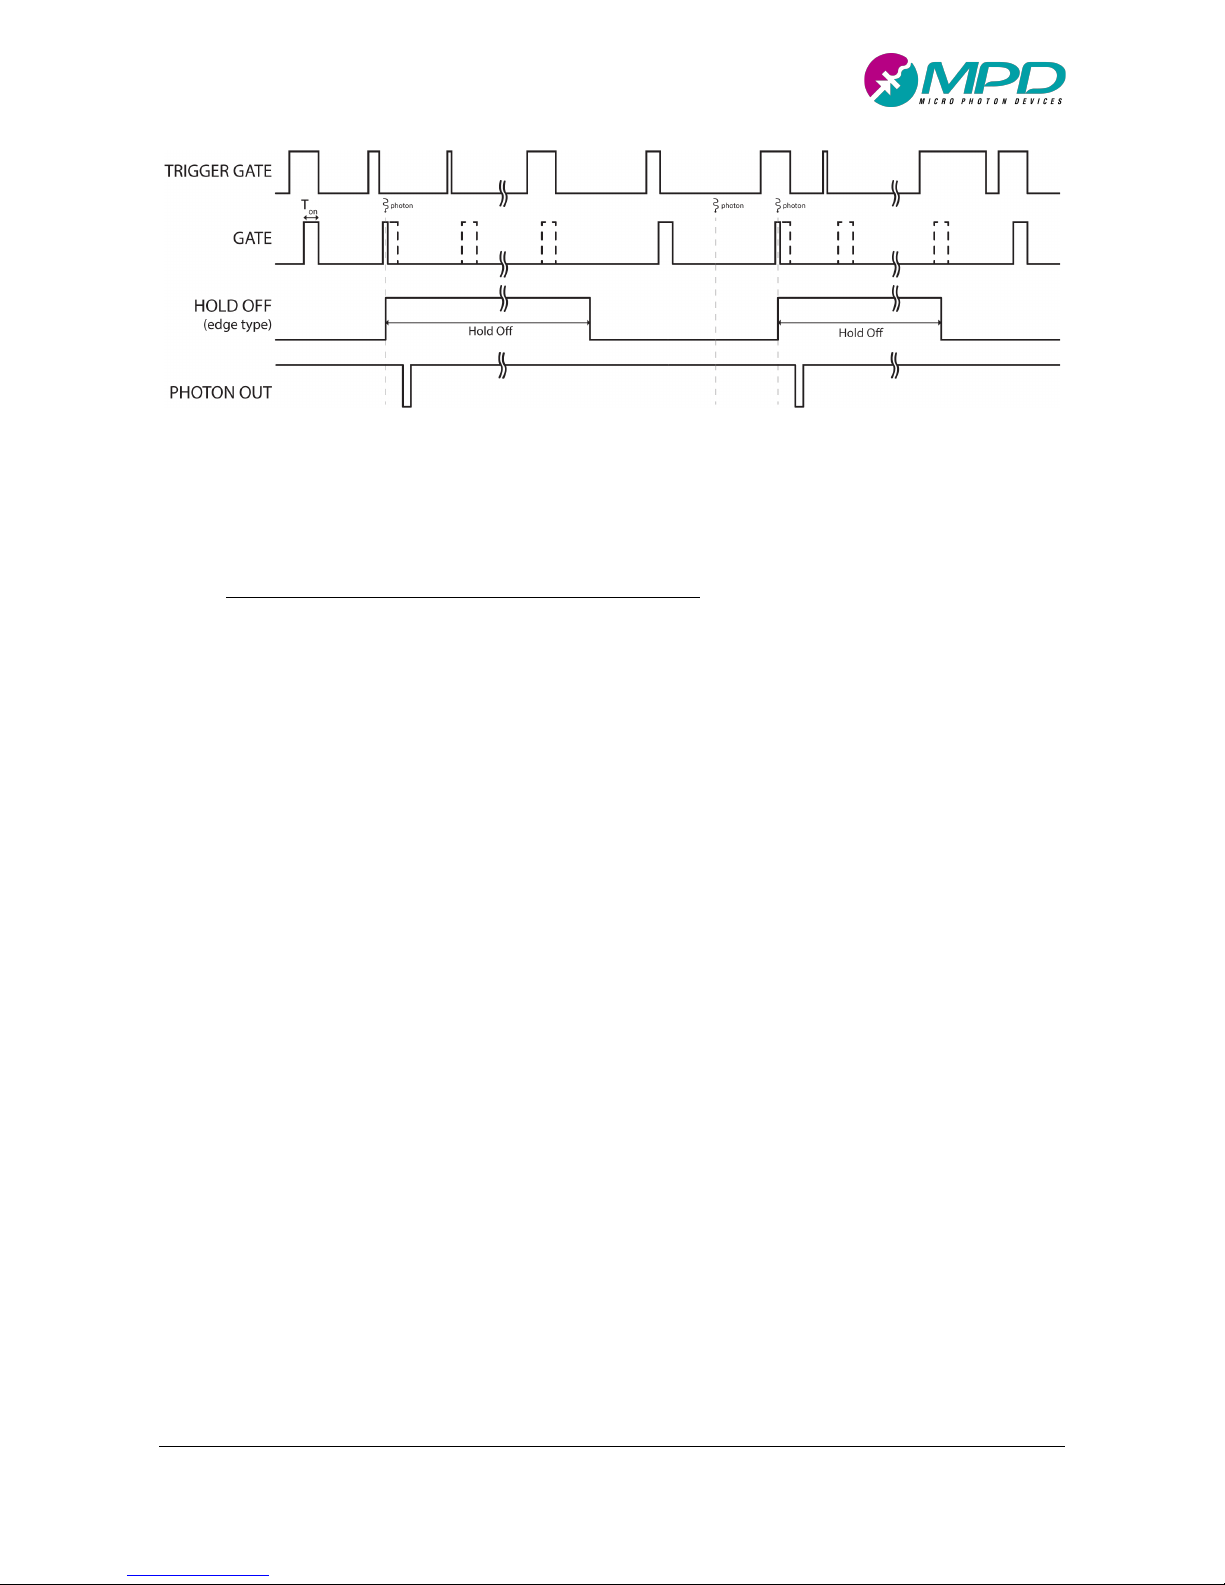
Figure 12. Typical signals in Gated mode with fixed gate width operation and hold-off set to HOLD OFF EDG E (i.e. gate
pulses that even partially overlap with the hold off are skipped).
4.2.1 Gated mode with fixed gate width operation
In this operating mode, shown in Figure 12, the PDM-IR generates a gate window, with a fixed width equal
to TON, for each TRIGGER GATE rising edge. In case of a photon detection (or in general an avalanche
triggering), while at PHOTON OUT a pulse is generated for marking the photon arrival time, the GATE signal
is swiftly disabled for a period equals to the set HOLD-OFF time and all trigger events during this time are
masked. At the end of the Hold off time, two types of reset are possible depending on how the gate
electronics handles what happens when the hold-off terminates inside a gate-ON time window.
More precisely, the Hold Off can be synchronized with the EFFECTIVE GATE signal (HOLD OFF EDGE) or can
be set asynchronous (HOLD OFF LEVEL). With the HOLD OFF EDGE modality, the first gate window to be
applied to the SPAD, following the end of a HOLD-OFF, is the first one to have its rising edge positioned in
time after the end of the hold-off, as shown in Figure 12. In this case, as shown in Figure 12, the gate window,
that happens across the time instant that the HOLD-OFF ends, is skipped. The use of HOLD OFF EDGE is thus
a safe condition because it ensures that all the applied gate pulses have the same width, i.e. the set TON. It
follows that the equations discussed in paragraph 2 can be applied seamlessly and that the user does not
incur in any measurement distortion, especially in case of high photon fluxes and in correlation
measurements.
With the HOLD OFF LEVEL modality the SPAD can be immediately enabled at the end of the hold-off, if the
status of GATE is high, as shown in Figure 13. For example, if the hold-off ends in the middle of a GATE
window, the latter is not skipped as before, but the SPAD is enabled starting from the end of the HOLD OFF
and stopping, as usual, with the end of this particular GATE window. In a simpler way, GATE will always follow
the EFFECTIVE GATE pattern, immediately as the hold off ends.
Page 20
PDM-IR user manual v3.0.3
Micro Photon Devices S.r.l. – Italy All Rights Reserved
20
!
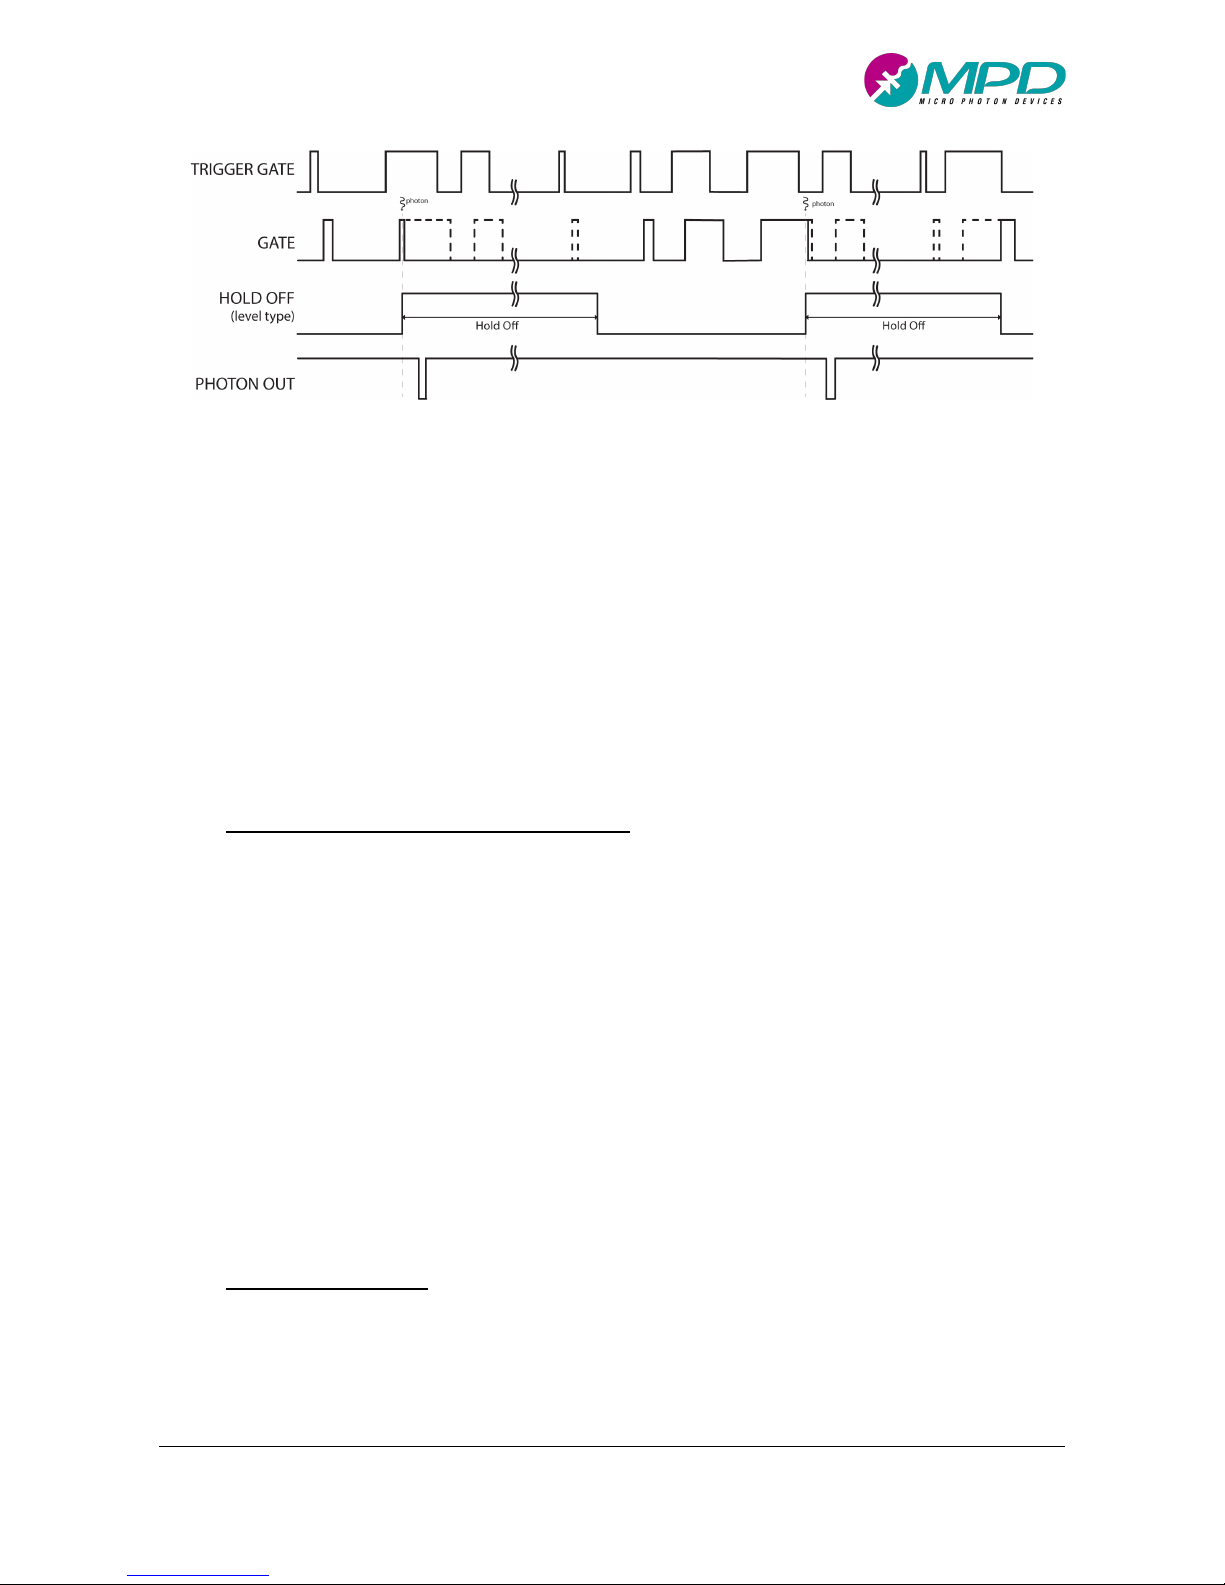
Figure 13. Typical signals in Gated mode with Free-gate operation and hold-off set to HOLD OFF LEVEL.
In this case non-standard gates are generated which may lead to measurement errors at high photon fluxes
and in other cases. For this reason, this modality is normally more useful if used in conjunction with the freegate mode of operation (see paragraph 4.2.2).
Finally, it is worth noting that, in gated-mode with fixed gate width, after an avalanche triggering, GATE signal
is left disabled until the next GATE pulse, even if TON is longer than the hold-off time. In other words, in this
gate modality, only the first event inside a gate-on window is recorded.
4.2.2 Gated mode with Free-gate operation
In gated mode with Free-gate operation (Figure 13), the PDM-IR works like the previous mode, generating a
gate window for each trigger event, but GATE pulses replicate exactly those of TRIGGER GATE, apart of course
when the HOLD OFF is applied. In fact, in this mode of operation TRIGGER GATE and EFFECTIVE GATE are
identical. Even in gate-mode with Free-gate operation, in case of photon detection, all GATE windows that
occur during a HOLD OFF are masked. Finally, even with this mode of operation HOLD OFF LEVEL and HOLD
OFF EDGE can be chosen. In Free-gate operation, opposite to the gated mode with fixed width, it is possible
to have multiple triggers inside a TON window when TON is longer than the set HOLD OFF (normally TON >>
HOLD OFF). Of course, in order to unlock this possibility, the HOLD OFF LEVEL should be set as, only in this
case, when the HOLD OFF ends the GATE is immediately applied if the TRIGGER GATE is high. In this way it is
possible thus to count more than 1 photon per gate, useful in some particular applications.
4.2.3 Free running mode
In free running mode, as shown in Figure 14, the SPAD is always enabled and it is TRIGGER GATE independent.
In case of photon detection, the SPAD is disabled during the hold off time, but at the end of it is swiftly is reenabled. Of course, in this case only the HOLD OFF LEVEL setting is allowed.
Page 21
PDM-IR user manual v3.0.3
Micro Photon Devices S.r.l. – Italy All Rights Reserved
21
!
Figure 14. Typical signals in Free running mode.
4.3 PDM-IR SPAD Section
After having discussed how the internal PDM-IR circuitry control the SPAD operation, the last component of
the PDM-IR to be discussed is the SPAD itself. Indeed, in order to get the best performance from the SPAD,
the user should be allowed to adjust the SPAD main parameters. For this reason, PDM-IR allows the control
of both the SPAD working temperature and the Excess Bias voltage. The lower temperature, the lower the
DCR but the higher the afterpulsing effect, given a hold off time, as the trap decay times increase. Of course,
when setting the lowest SPAD temperatures, the PDM-IR must be placed on a good heatsink, so that it can
dissipate the heath generated by the Peltier cooler. If this is not done, the module might heat up too much
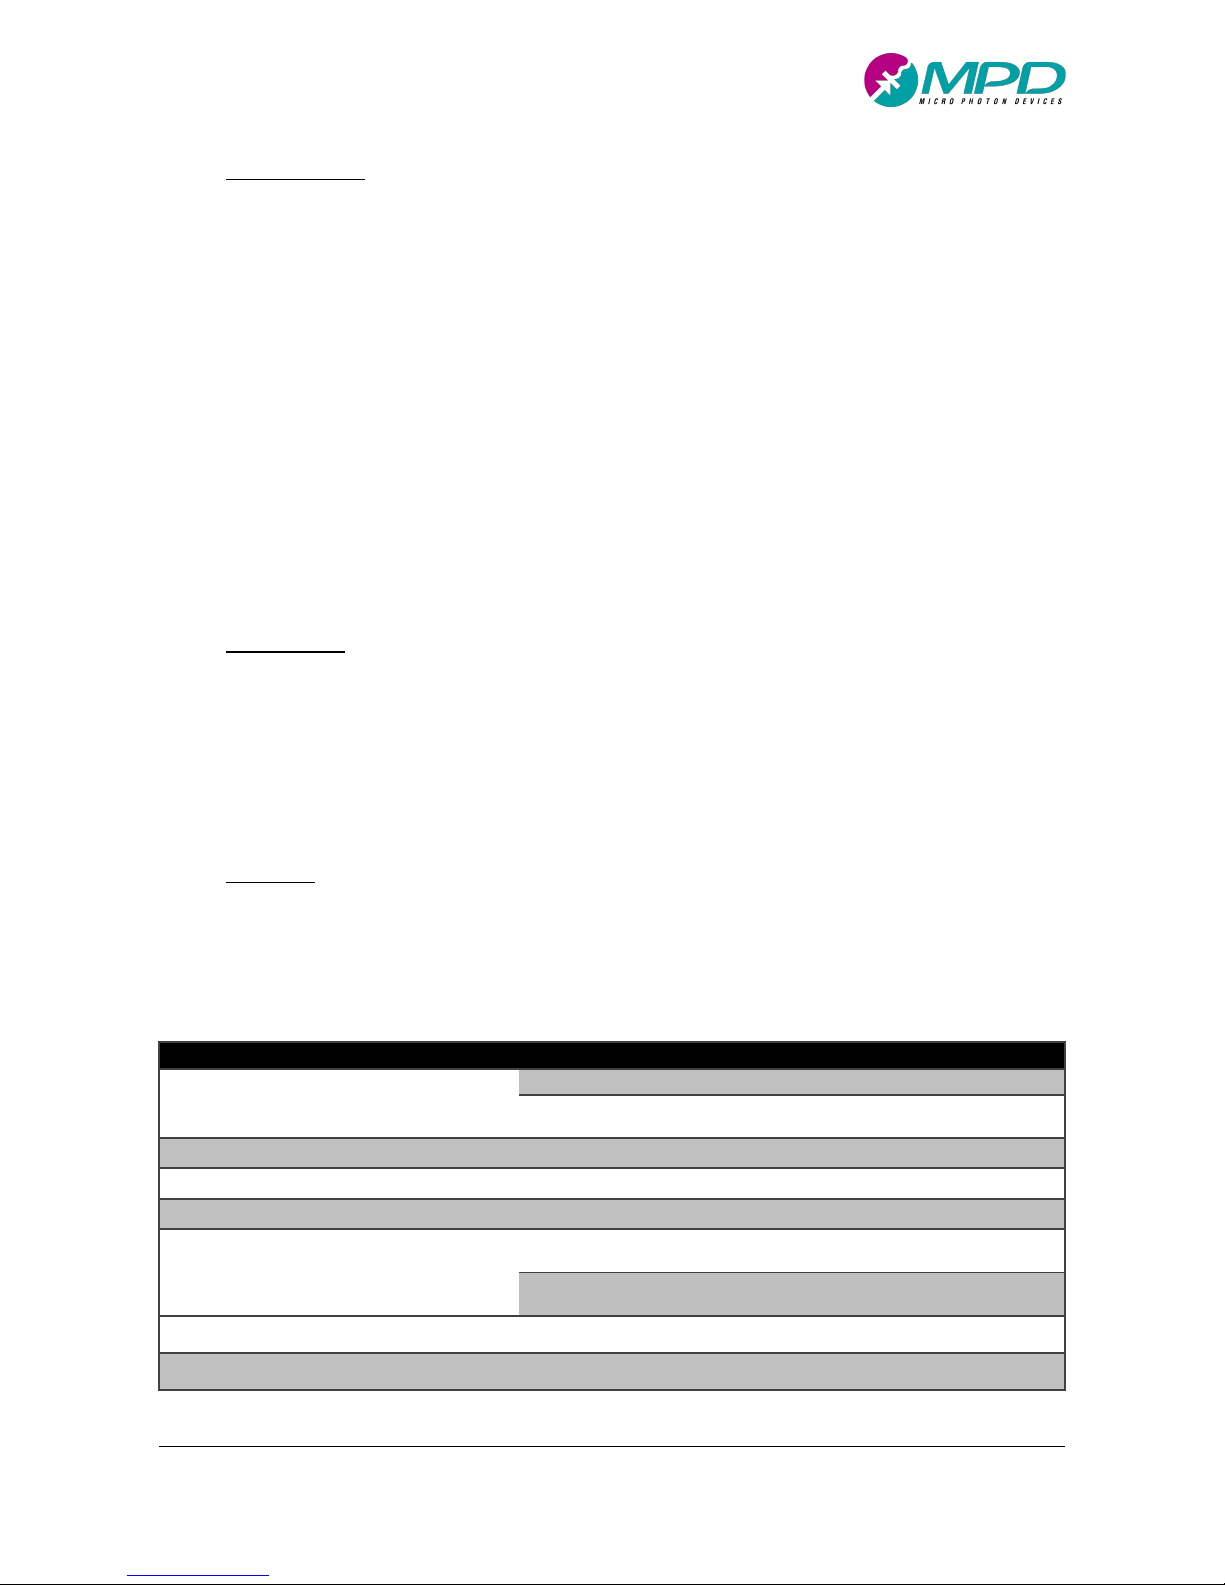
and go in safe mode shutting down the detector operation. In Figure 15 section of the PDM-IR block diagram
related to the SPAD is showed.
In the next paragraphs, the 3 parameters related to the SPAD setting are discussed in detail: SPAD
temperature, SPAD excess bias voltage and SPAD hold off. In Table 6, the possible settings and their allowed
range of operation, are showed.
Figure 15. PDM-IR SPAD Section Block diagram.
Page 22
PDM-IR user manual v3.0.3
Micro Photon Devices S.r.l. – Italy All Rights Reserved
22
!
4.3.1 Temperature
The user can select the working temperature among 4 different predefined values:
• High temperature (243K): the dark count rate is the highest than other temperature modes, but no
particular caution is required for module thermal stability.
• Medium temperature (233K): the dark count rate is the one shown in the test report. In this case the
module requires to be placed on a reasonable heat sink for uninterrupted operation.
• Low temperature (229K): the dark count rate is very low. In this case the module requires a very good
heath sink for optimal thermal dissipation and uninterrupted operation.
• Lowest temperature (225K): the dark count rate is the lowest as possible. In this case the module
requires a very good heath sink for thermal dissipation and a fan, in order to work without errors.
Also, a low ambient temperature (of about 20-22°C) will be required.
4.3.2 Excess Bias
The excess bias is the difference between the SPAD bias voltage and its breakdown and it controls directly
the SPAD performance: the higher the Excess Bias, the higher the Photon Detection Efficiency (PDE) the
better the timing resolution but the higher the DCR. As the DCR increases more than linearly while the PDE
increases linearly or less than linearly, the best trade off should be found for each measurement set-up.
4.3.3 Hold Off
The hold-off has been already extensively discussed both in paragraph 2 and in paragraph 4.2, so we remind
here only to its specifications shown in Table 6.
Table 6. SPAD specifications.
Parameter
Symbol
Description
Min.
Typ.
Max.
Unit
Excess Bias
VEX
Gated mode with fixed gate width
2 7
V
Gated mode with Free-gate AND
Free running mode
2 5
V
Excess Bias Step
ΔVEX
100 mV
Hold Off
tHO 1 3000
us
Hold Off step
ΔtHO
10 ns
SPAD DCR
DCR
VEX = 2 V, Temp = 229K
FREE SPACE module
7 k
10 k
cps
VEX = 2 V, Temp = 229K
SM Fiber-pigtailed module
1k
2 k
cps
SPAD active area
Free space optical interface
25 µm
SPAD fibre
Fibre pigtailed SPAD
SMF-28 fibre
Page 23
PDM-IR user manual v3.0.3
Micro Photon Devices S.r.l. – Italy All Rights Reserved
23
!
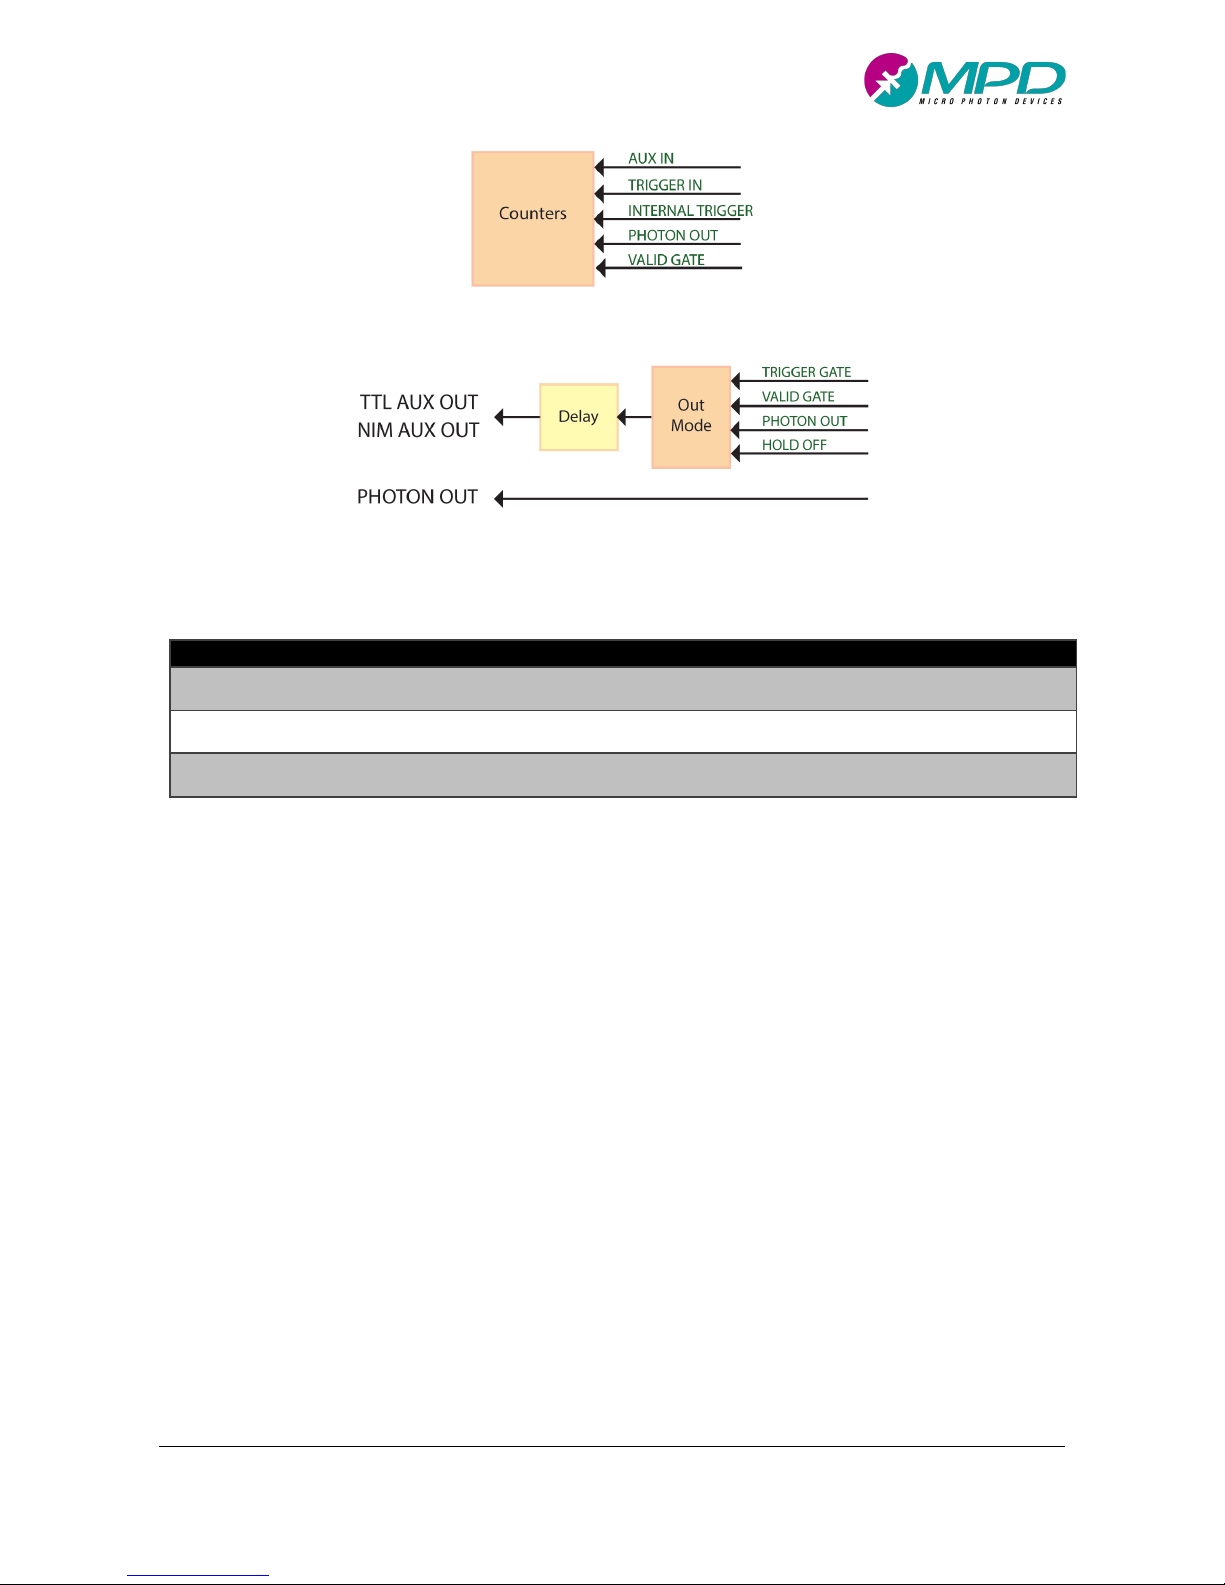
Figure 16. PDM-IR Counters Section Block diagram.
Figure 17. PDM-IR Output Section Block diagram.
Table 7. Counters specifications
Parameter
Symbol
Description
Min.
Typ.
Max.
Unit
Counter Integration Time
0.1 60 s Counter Integration Time step
20 ms
Counter Max Frequency
100
MHz
4.4 PDM-IR Counters Section
The PDM-IR integrates 5 counters to analyze the major signals: AUX IN, TRIGGER IN, INTERNAL TRIGGER,
PHOTON OUT, VALID GATE. Every counter stores data counts accumulated during counter integration time;
In order to avoid missed readings, specially at short integration time, the count data are stored in a 20
positions circular array, that are automatically read from the VisualPDM-IR software or that can be read by
using the provided SDK. The counter characteristics are shown in Table 7.
4.5 PDM-IR Output Section
The PDM-IR provides the PHOTON OUT output and two user-selectable outputs: a positive LVTTL output and
a negative NIM output. Both outputs can be selected among the following signals: TRIGGER GATE, VALID
GATE, PHOTON OUT, HOLD OFF, INTERNAL TRIGGER and MODULE STATUS. The module status is high in case
of module error (it is the equivalent of the red led, see paragraph 4.6). The outputs are RF output: they
require 50 Ohm transmission line coaxial cable and a 50 Ohm termination to properly work. Electrical
specifications of the three signals are shown in Table 8.
Page 24

PDM-IR user manual v3.0.3
Micro Photon Devices S.r.l. – Italy All Rights Reserved
24
!
Table 8. Outputs specifications.
Parameter
Symbol
Description
Min.
Typ.
Max.
Unit
NIM Aux Out low logic level
V
OH_NIM
50 Ω termination required
0
V
NIM Aux Out high logic level
V
OL_NIM
50 Ω termination required
-800 mV
NIM Aux Out bandwidth
100
MHz
NIM Aux Rise/Fall Time
20-80% 400 ps
NIM Aux Delay
δ
NIM_AUX
0 100
ns
NIM Aux Delay step
1
ns
TTL Aux Out low logic level
V
OH_TTL
50 Ω termination required
0
V
TTL Aux Out high logic level
V
OL_TTL
50 Ω termination required
2.4 3.3
V
TTL Aux Rise/Fall Time
20-80% 1 ns
TTL Aux Out bandwidth
100
MHz
TTL Aux Delay
δ
TTL_AUX
0 100
ns
TTL Aux Delay step
1
ns
Photon Out low logic level
V
OH_NIM
50 Ω termination required
0
V
Photon Out high logic level
V
OL_NIM
50 Ω termination required
-800 mV
Photon Out Rise/Fall Time
20-80% 400 ps
Photon Out Pulse width
10 ns
4.5.1 PHOTON OUT
The PHOTON OUT generates an output pulse, according to the NIM standard, with low timing jitter. In this
way it precisely marks the photon arrival time. It has a fixed delay between the photon arrival time and a
specific output connector (see paragraph 4.7). The photon detection is marked by the signal falling edge from
0V to -800mV providing -16 mA current in a DC grounded 50 Ohm termination. The low-level signal (-800 mV)
is voltage protected and cannot provide a lower voltage, in case of unterminated lines. Moreover, the use of
unterminated transmission lines corrupts the rising edge of the signal and, as a result, the signal becomes
unusable. This output is specifically designed to be used in combination with the most common available
TCSPC instrumentation available in the market.
Page 25

PDM-IR user manual v3.0.3
Micro Photon Devices S.r.l. – Italy All Rights Reserved
25
!
4.5.2 TTL AUX OUT
The TTL AUX OUT offers the possibility to interface and sync the PDM-IR with other instruments; in fact, the
LVTTL output levels (0 ÷ 3.3 V) allows to communicate with standard CMOS electronics.
4.5.3 NIM AUX OUT
The auxiliary output NIM AUX OUT is the negative levels signal (from 0 to -800mV providing -16 mA current
in a DC grounded 50 Ohm termination). The low-level signal (-800 mV) is voltage protected and cannot
provide a lower voltage, in case of unterminated lines. Moreover, the use of unterminated transmission lines
corrupts the rising edge of the signal and, as a result, the signal becomes unusable.
4.6 PDM-IR LED Status
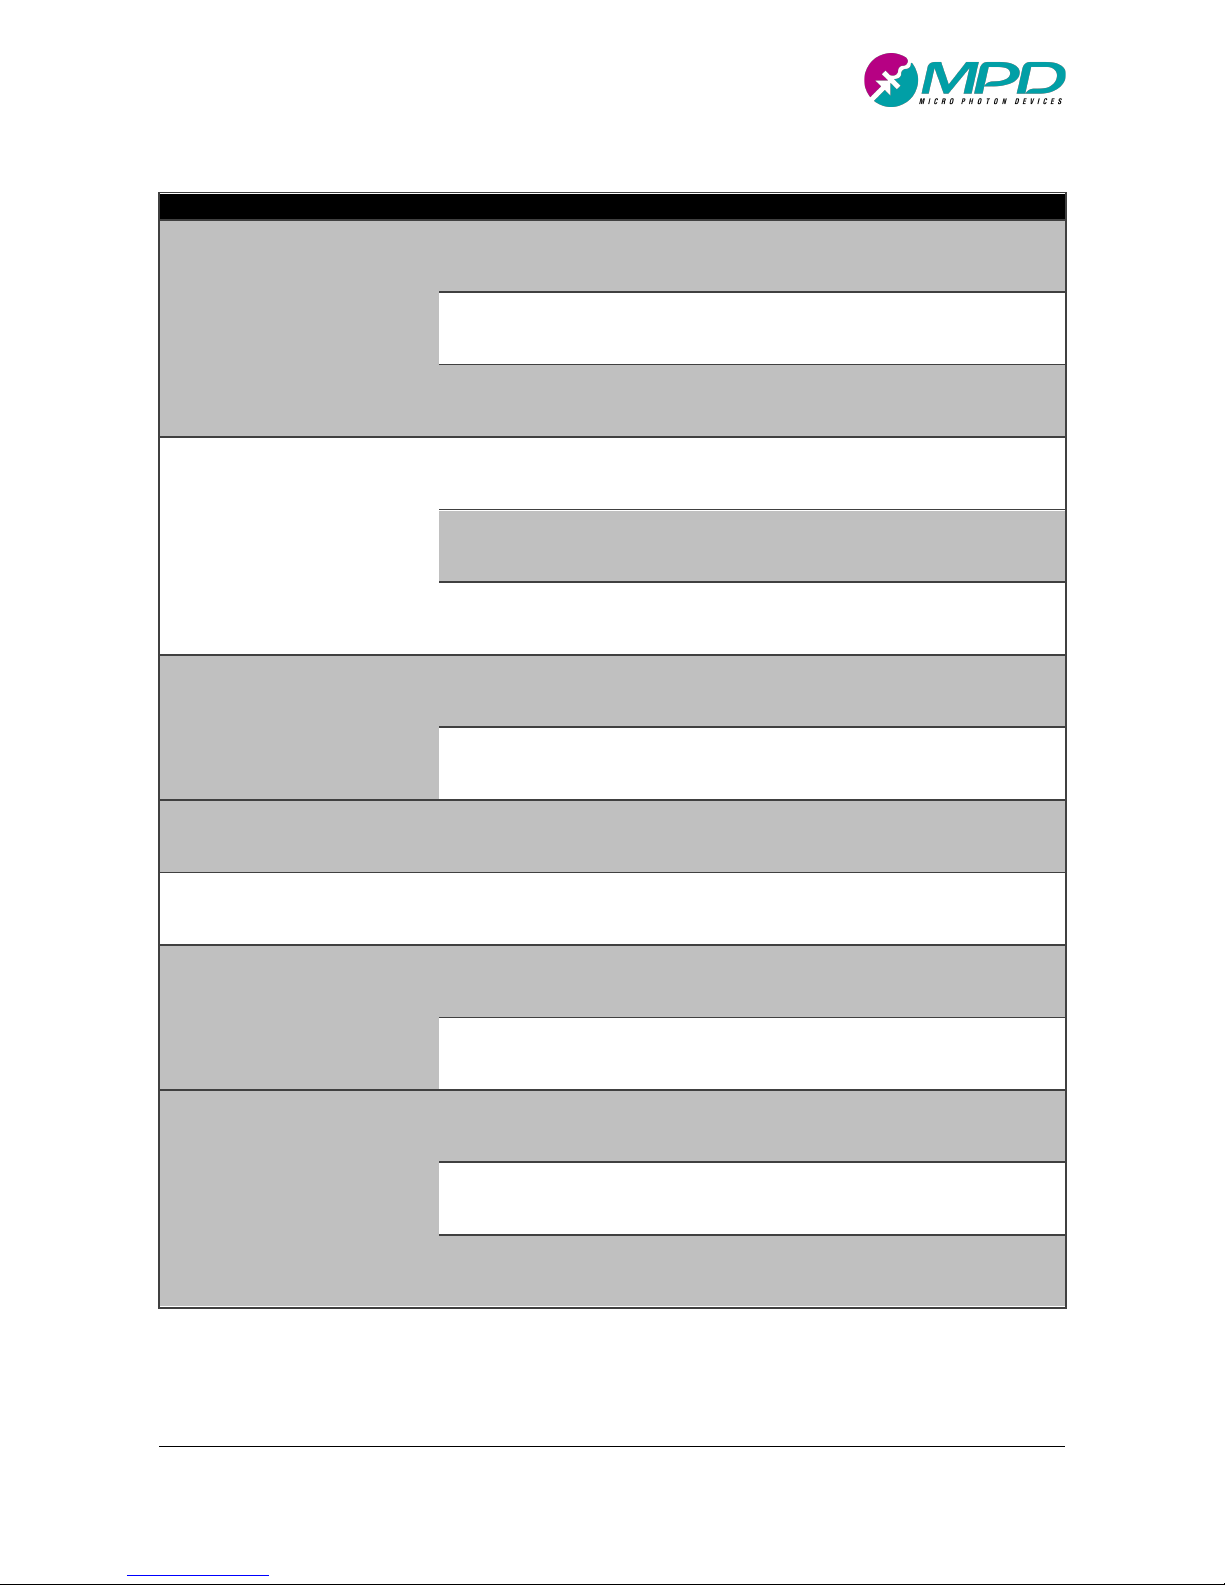
The PDM-IR has a LED lens on the rear panel for showing the current module status. Table 9 shows the LED
colors and their meanings. Unless the PDM-IR has detected a serious error that is signaled with a RED colored
LED, the standard condition for the LED status is OFF. For this reason, it is important to understand the LED
color sequence during the most common procedures with the PDM-IR, like changing module parameters.
These typical sequences are described in Table 10.
Table 9. LED color meaning.
OFF LED
when the LED is OFF, there are 2 possibilities: the module is not powered-ON or the
module is correctly working and the SPAD is enabled.
BLINKING
ORANGE
a blinking orange LED indicates that the PDM-IR is powered-ON but the SPAD is not
polarized. This state is active for less than 10 seconds after powering-ON the module
or whenever the SPAD has been turned off using the SDK or the VisualPDM-IR
software.
ORANGE LED
when the LED shows a stable Orange color, the PDM-IR is updating the its internal
working parameters (SPAD ON/OFF status, free-running/gated working mode, gate
parameter, …). At the end of any update procedure, the LED will always change to
GREEN, if the update procedure completes successfully with the SPAD enabled, to
BLINKING ORANGE if the update procedure completes successfully with the SPAD
disabled or to RED LED if there is an error.
GREEN LED
this LED color is used when the SPAD is correctly polarized and ready to detect
photons. The green color is always active only for 5 seconds to report the success of
an update procedure; after that, the LED will change status to the OFF state in order
to avoid measurement errors due to an unwanted light source.
RED LED
when red color is active, the SPAD is disabled for safety precautions as an error
occurred. In order to understand what happened, use the SDK or the VisualPDM-IR
for reading the error type.
Page 26

PDM-IR user manual v3.0.3
Micro Photon Devices S.r.l. – Italy All Rights Reserved
26
!
Table 10. Examples of LED colors sequence during common procedures on the PDM-IR.
* with PDM-IR all parameter can be updated at any time, i.e. after the SPAD has been successfully turned on
(LED OFF), when the module is currently updating parameters (LED ORANGE), or when the module as just
(within less than 5s) updated a parameter (LED GREEN).
4.7 PDM-IR propagation delays
Table 11 shows the intrinsic propagation delays between the major signals. The propagation delays are
typical values and accurate within +/- 5 ns and they have been measured with all the programmable delays
set to 0 ns.
Procedure/Action
Initial
condition
LED sequence
Final Condition
Switching on the PDM-IR
PDM-IR not
powered
- OFF
- BLINKING ORANGE for 10 seconds
- ORANGE until SPAD ON
- GREEN for 5 seconds
- OFF
SPAD ON
Updating a parameter
SPAD ON
- OFF/ORANGE/GREEN*
- ORANGE until parameters
updated
- GREEN for 5 seconds
- OFF
SPAD ON,
parameter
updated
Updating a parameter
SPAD OFF
- BLINKING ORANGE
SPAD OFF,
parameter
updated
Updating a parameter while
setting a value out of its limit
any
- no changes
no parameter
updated
TURNING ON SPAD
SPAD OFF
- BLINKING ORANGE
- ORANGE until SPAD ON
- GREEN for 5 seconds
- OFF
SPAD ON
TURNING OFF SPAD
SPAD ON
- OFF/ORANGE/GREEN*
- ORANGE until SPAD OFF
- BLINKING ORANGE
SPAD OFF
Page 27
PDM-IR user manual v3.0.3
Micro Photon Devices S.r.l. – Italy All Rights Reserved
27
!
Table 11. Propagation delays of main signals
Input signal
Output signal
Propagation delay
TRIGGER IN
GATE
30 ns
TTL AUX OUT (as TRIGGER GATE)
28 ns
NIM AUX OUT (as TRIGGER GATE)
26 ns
TRIGGER AUX
GATE
30 ns
TTL AUX OUT (as TRIGGER GATE)
28 ns
NIM AUX OUT (as TRIGGER GATE)
26 ns
GATE
TTL AUX OUT (as VALID GATE)
12 ns
NIM AUX OUT (as VALID GATE)
14 ns
TTL AUX OUT (as INTERNAL
TRIGGER)
GATE
14 ns
NIM AUX OUT (as INTERNAL
TRIGGER)
GATE
12 ns
HOLD OFF
TTL AUX OUT (as HOLD OFF)
18 ns
NIM AUX OUT (as HOLD OFF)
16 ns
PHOTON
PHOTON OUT
5 ns
TTL AUX OUT (as PHOTON OUT)
22 ns
NIM AUX OUT (as PHOTON OUT)
20 ns
Page 28
PDM-IR user manual v3.0.3
Micro Photon Devices S.r.l. – Italy All Rights Reserved
28
!
5 PDM-IR Software Interface
The PDM-IR is provided with a control software, which runs on Microsoft Windows operating systems:
VisualPDM-IR. This software provides a direct access to PDM-IR settings.
5.1 Installation
Double-click the desired installer (32-bit or 64-bit) and follow the guided installation procedure. Please note
that USB driver from FTDI, included in the PDM-IR USB-Key, must be installed before connecting the PDM-IR
to the PC.
5.2 Software Interface
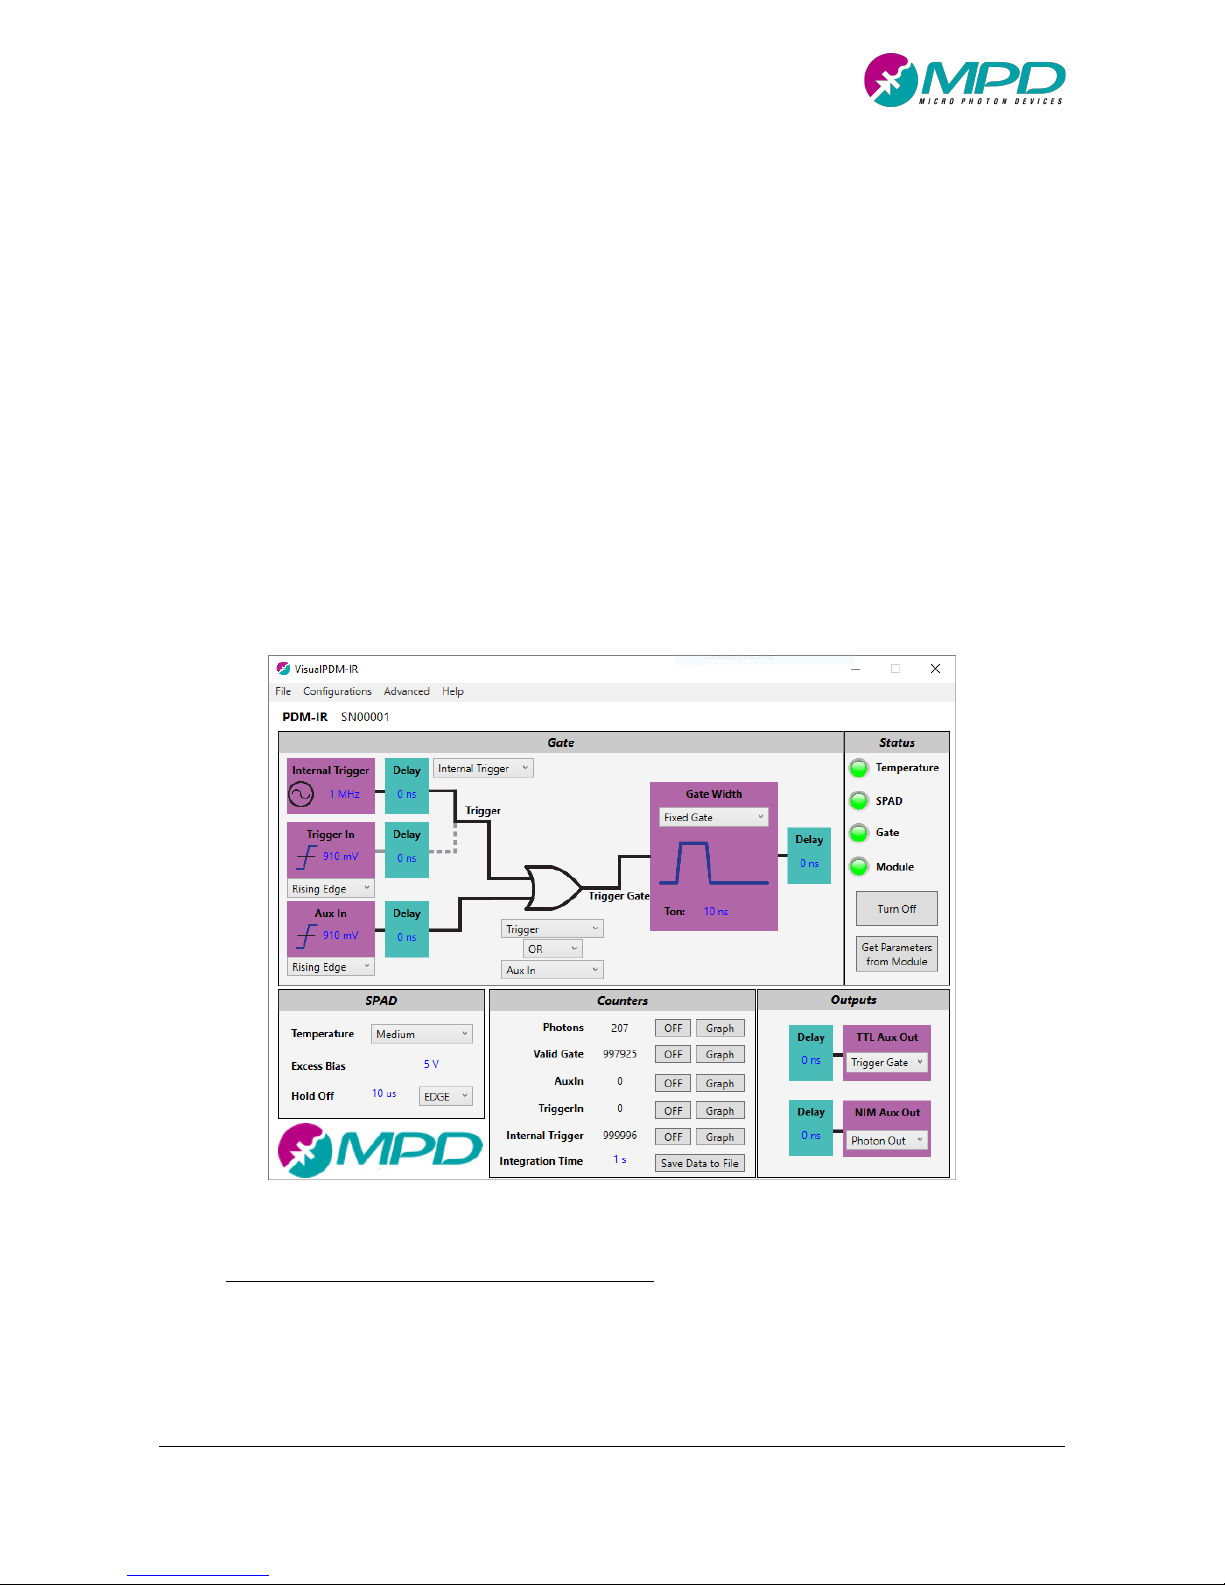
The VisualPDM-IR interface is composed by a main window divided in several sections as shown in Figure 18,
and a satellite window for each active counter (see Figure 24).
Figure 18. Screenshot of the main window of the graphical user interface.
5.2.1 Main Window: Trigger and Gate Section
This panel manages the trigger and gate settings as described in PDM-IR Trigger Section and PDM-IR Gate
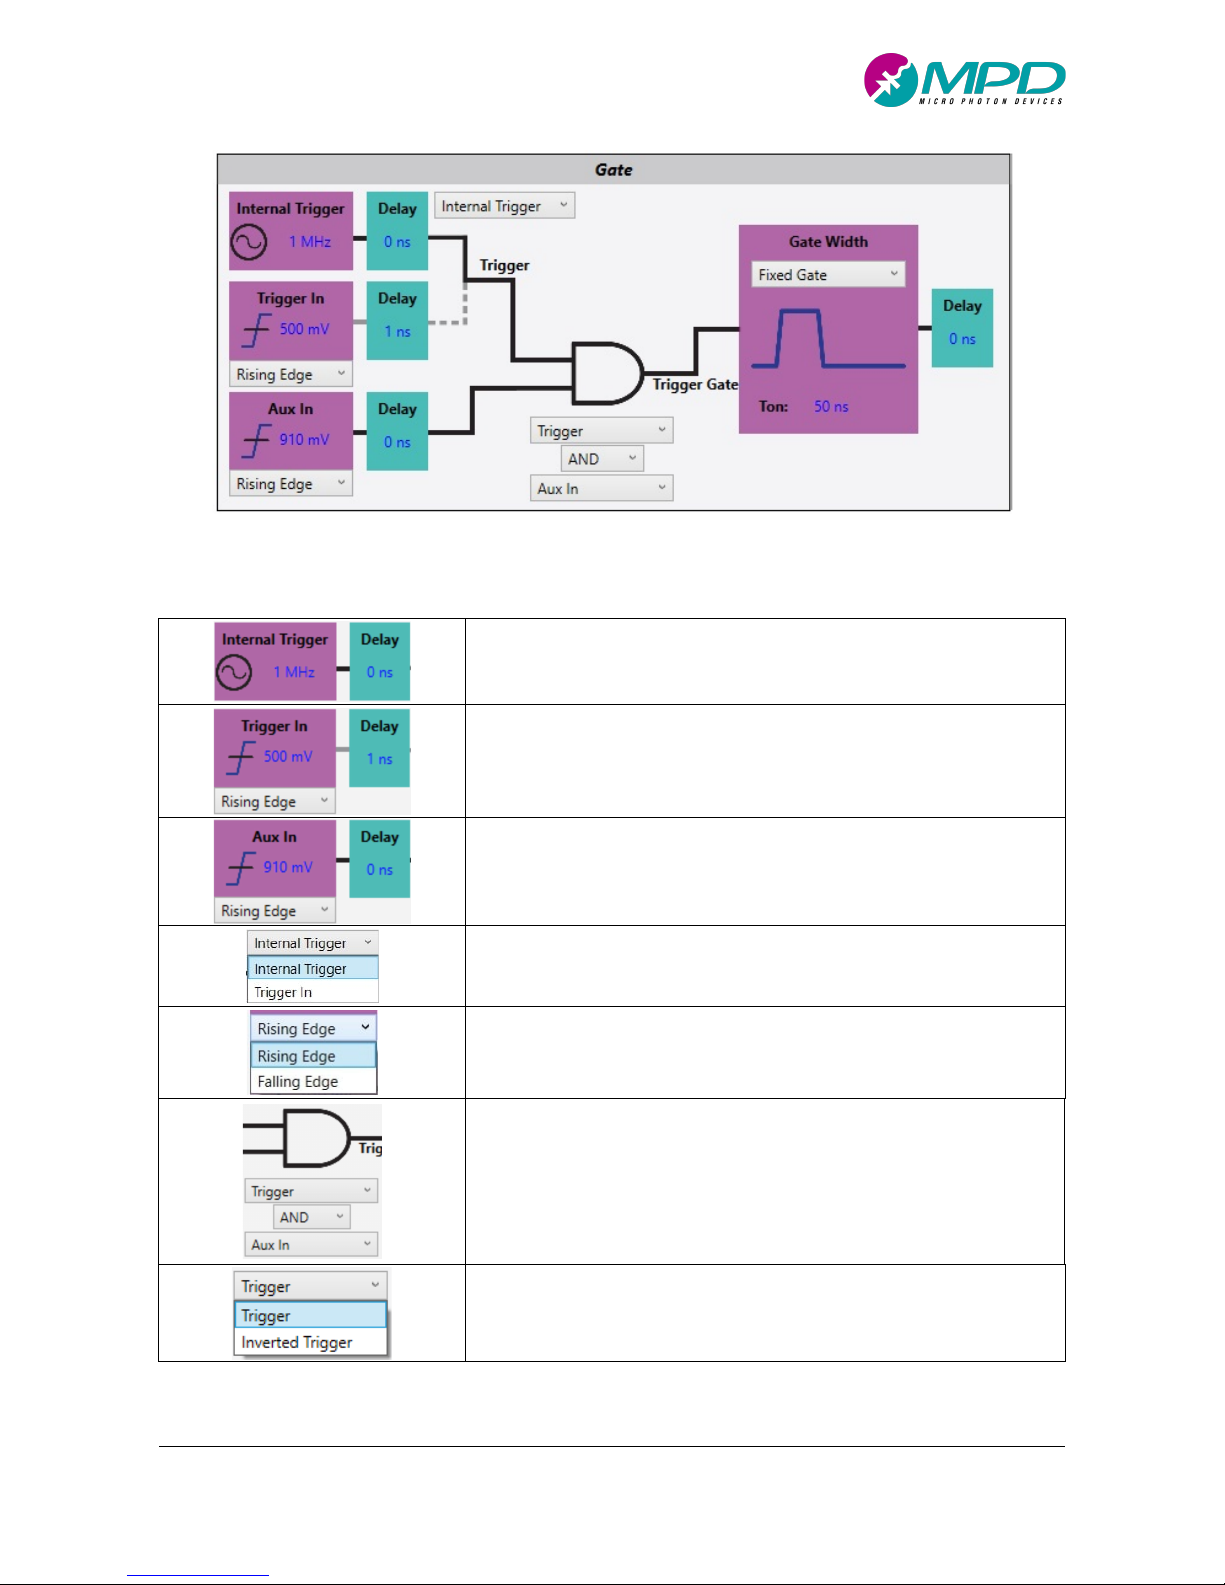
Section. Figure 19 shows a screenshot of the section and Table 12 explains the meaning of each control.
Page 29
PDM-IR user manual v3.0.3
Micro Photon Devices S.r.l. – Italy All Rights Reserved
29
!
Figure 19. Trigger and Gate Section of the VisualPDM-IR Main Window.
Table 12. Trigger and Gate Section explained.
Internal Trigger Settings: these two fields set the frequency (freqIN)
and the Delay of INTERNAL TRIGGER (δ
INT_TRIGGER
).
Trigger In Settings: these three fields set the significant edge (Edge
Selection List), the threshold level (V
TH_IN
) and the Delay of TRIGGER IN
(δ
TRIGGER_IN
).
Aux In Settings: these three fields set the significant edge (Edge
Selection List), the threshold level (V
TH_AUX
) and the delay of AUX IN
(δ
TRIGGER_AUX
). These controls are disabled when Logic Function gate
List is equal to “Only” (see below).
Trigger Selection List: let the user to choose TRIGGER between
INTERNAL TRIGGER and TRIGGER IN.
Edge Selection List: selection list used in both the Aux In settings box
and the Trigger In settings box for choosing the rising or the falling
edge of the input signal
Logic Function Settings. Set the logic function (Logic Function gate
List) between TRIGGER (Logic Function Input1 list) and AUX IN (Logic
Function Input2 List) to generate TRIGGER GATE.
Logic Function Input1 list. Allows to invert or not the TRIGGER input
before sending it to the logic gate.
Page 30
PDM-IR user manual v3.0.3
Micro Photon Devices S.r.l. – Italy All Rights Reserved
30
!
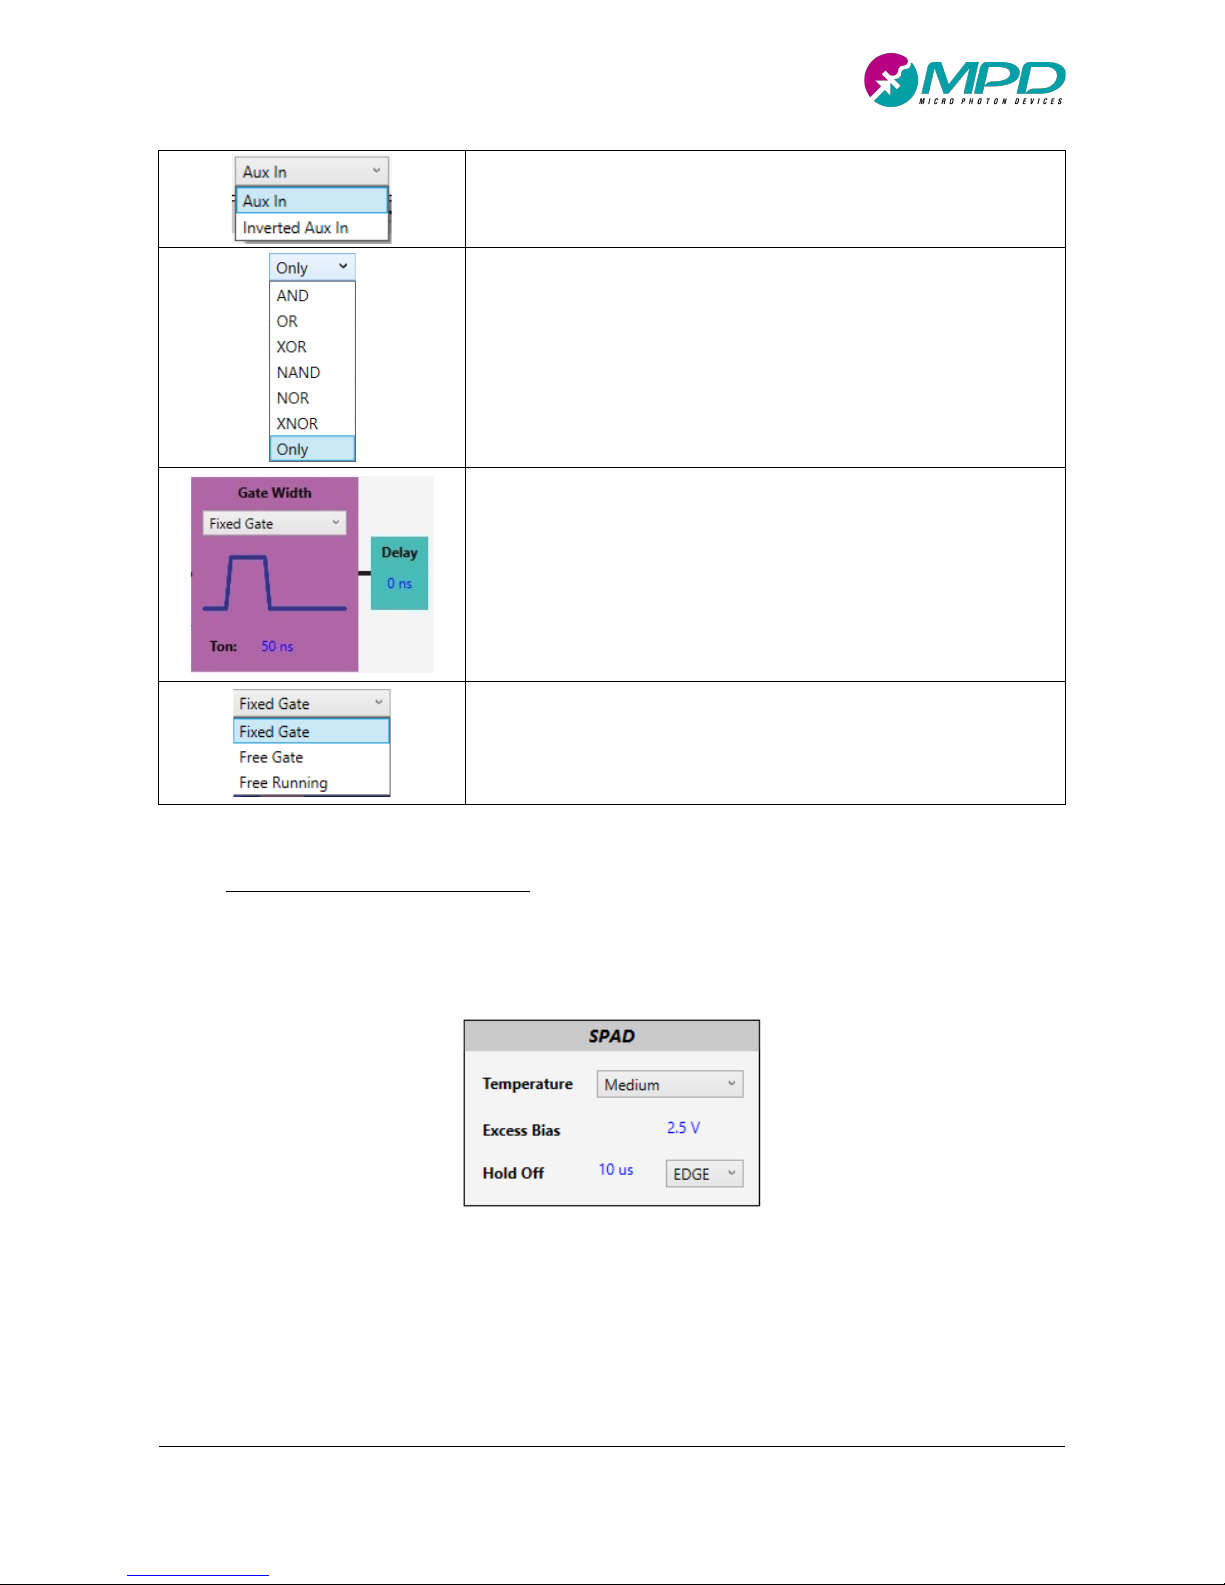
Logic Function Input2 List. Allows to invert or not the AUX IN input
before sending it to the logic gate. This field is not visible and enabled
when the logic port is set to “Only” (see below).
Logic Function gate List: selects which logic gate will be used to
combine TRIGGER with AUX IN. “Only” means TRIGGER ONLY and thus
TRIGGER will be identical to TRIGGER GATE and sent directly to the
gate generation section.
Gate Width Settings: these fields allows to select the gate mode (see
PDM-IR Gate Section), the TON width and the delay of the EFFECTIVE
GATE (δ
EFFECTIVE_GATE
). The TON field is of course visible only in case of
gate mode with fixed gated width.
Gate Mode List: allows to choose the Gate Mode operation. It can be
gate mode with fixed gate width (Fixed Gate), gate mode with freegate operation (Free Gate), or Free running mode (Free running).
5.2.2 Main Window: SPAD Section
This panel manages the SPAD settings (Figure 20) like Temperature (see paragraph 4.3.1), Excess Bias (see
paragraph 4.3.2) and Hold Off time (see paragraph 4.3.3). Each control is explained in Table 13.
Figure 20. SPAD Section of the VisualPDM-IR Main Windows.
Page 31
PDM-IR user manual v3.0.3
Micro Photon Devices S.r.l. – Italy All Rights Reserved
31
!
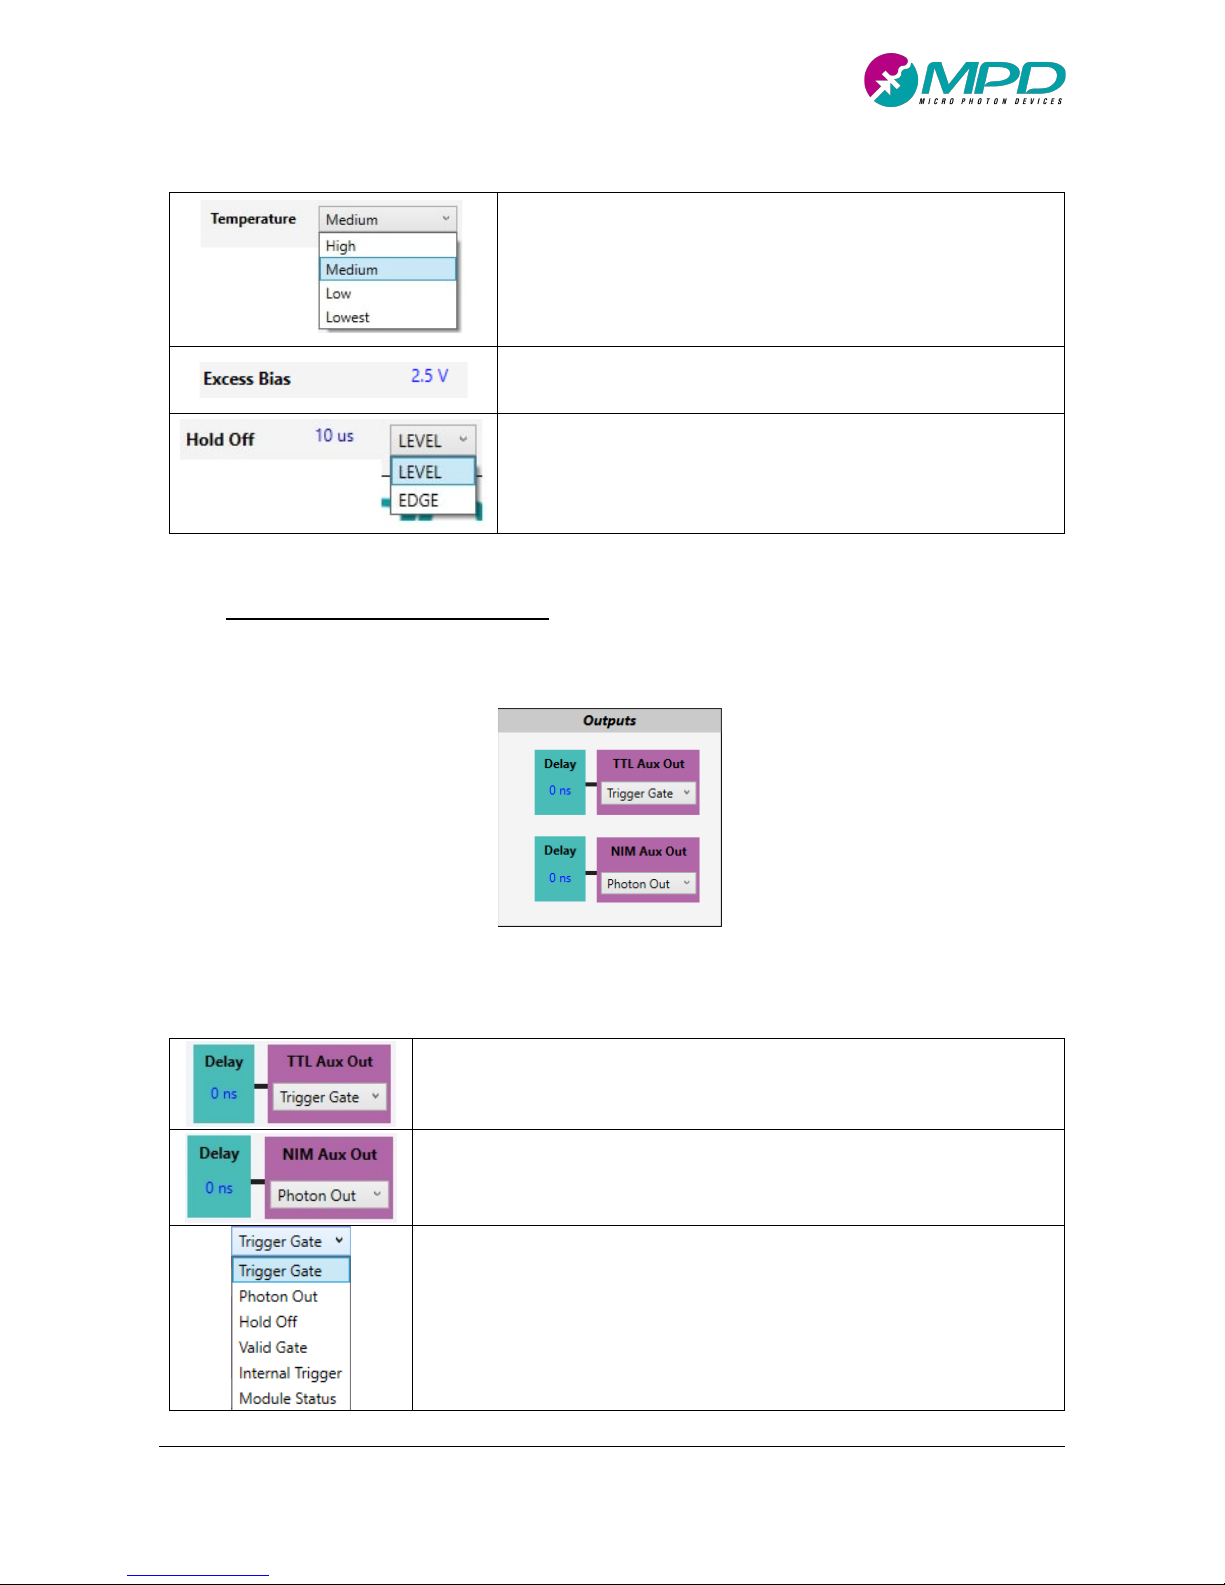
Table 13. SPAD Section controls explained
Temperature: Allows to change the SPAD working temperature
through a selection list. See paragraph 4.3.1 for more information
Excess Bias: set the SPAD Excess Bias Voltage (VEX)
Hold Off: set the Hold Off time (tHO) of the SPAD. LEVEL and
EDGE select the synchronism with the gate. See paragraph 4.2
for details.
5.2.3 Main Window: Output Section
The panel in Figure 21 manages the outputs (see paragraph 4.5). Each control is explained in Table 14.
Figure 21. Output Section of the VisualPDM-IR Main Windows.
Table 14. Output Section controls explained.
TTL AUX OUT: these two fields set the desired TTL output signal chosen
from the Out Signal List and the delay introduced in the output path
(δ
TTL_AUX
).
NIM AUX OUT: these two fields set the desired NIM output signal chosen
from Out Signal List and the delay introduced in the output path (δ
NIM_AUX
).
Out Signal List: list of signals that can be routed to the output connectors.
Page 32
PDM-IR user manual v3.0.3
Micro Photon Devices S.r.l. – Italy All Rights Reserved
32
!
5.2.4 Main Window: Status Section
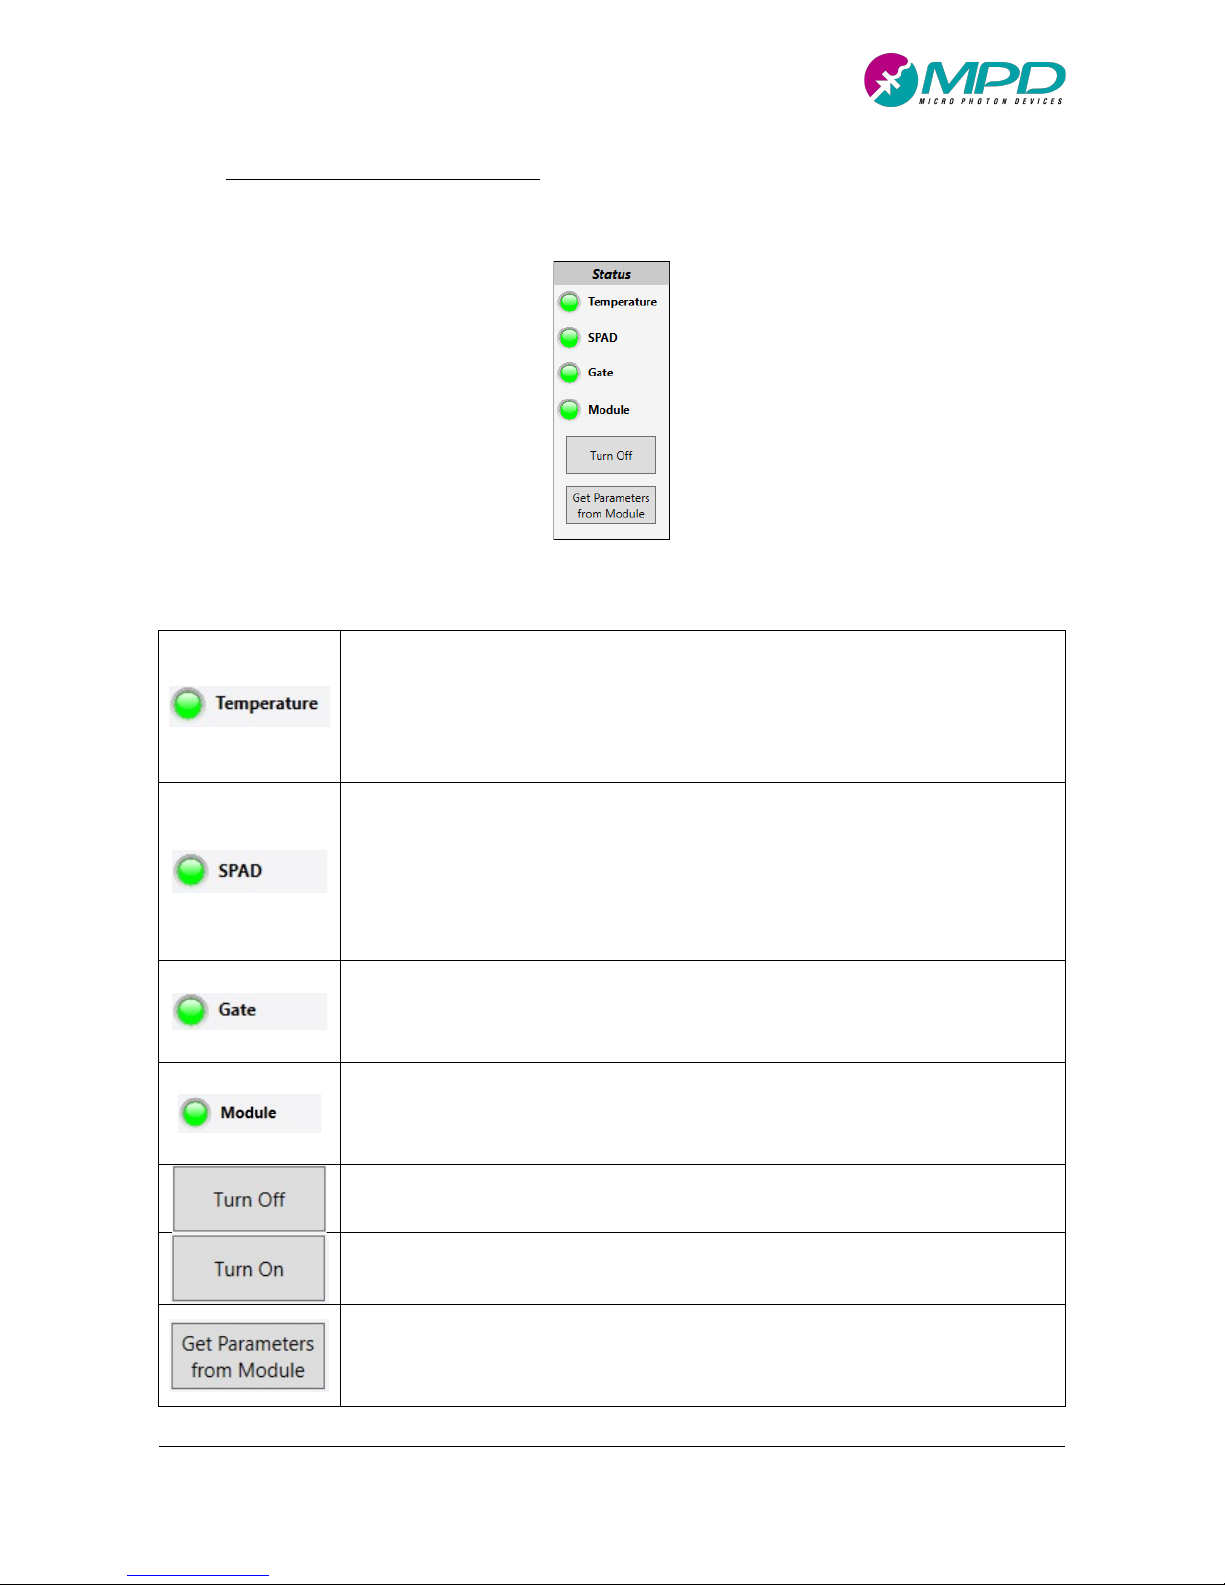
This panel shows the actual module status (Figure 22). Each control is explained in Table 15.
Figure 22. Status Section of the VisualPDM-IR Main Windows.
Table 15. Status Section controls explained.
Temperature Status: Indicates the SPAD temperature status.
Dark Green LED means the SPAD temperature controller is working properly but it
isn’t cooling the SPAD.
Yellow LED indicates that the controller is changing the SPAD’s temperature.
Light Green LED means that the SPAD temperature is set correctly.
Red LED indicates an error of the temperature controller.
SPAD Status: Indicates the SPAD bias status.
Dark Green LED means that the SPAD is properly working but it is biased below the
breakdown voltage and thus it is not able to detect photons.
Yellow LED indicates that the SPAD bias voltage is currently changing.
Light Green LED means that the SPAD is correctly biased and ready to detect
photons according to the GATE settings.
Red LED indicates that an error occurred during the SPAD bias voltage setting.
Gate Status: Indicates the gate mode status.
Dark Green LED denotes that the Gate is off.
Yellow LED denotes that PDM-IR is updating GATE settings.
Light Green LED means that the gate is ON.
Module Status: Indicates the module status.
Light Green LED means that the module has no errors.
Red LED indicates that there is at least an error on the module. The Red LED is
associated with a pop-up message indicating the error.
Turn Off: Disables the SPAD. This button is visible only when the SPAD is ON.
Turn ON: Enables the SPAD. This button is visible only when the SPAD is OFF.
Get Parameters from Module: this button reads from PDM-IR all module
parameters and thus synchronizes the SW interface with actual module settings.
The SW interface is always synchronized with the module, anyway, when the
module is powered OFF/ON without closing the SW a resynchronization is needed.
Page 33
PDM-IR user manual v3.0.3
Micro Photon Devices S.r.l. – Italy All Rights Reserved
33
!
5.2.5 Main Window: Counter Section
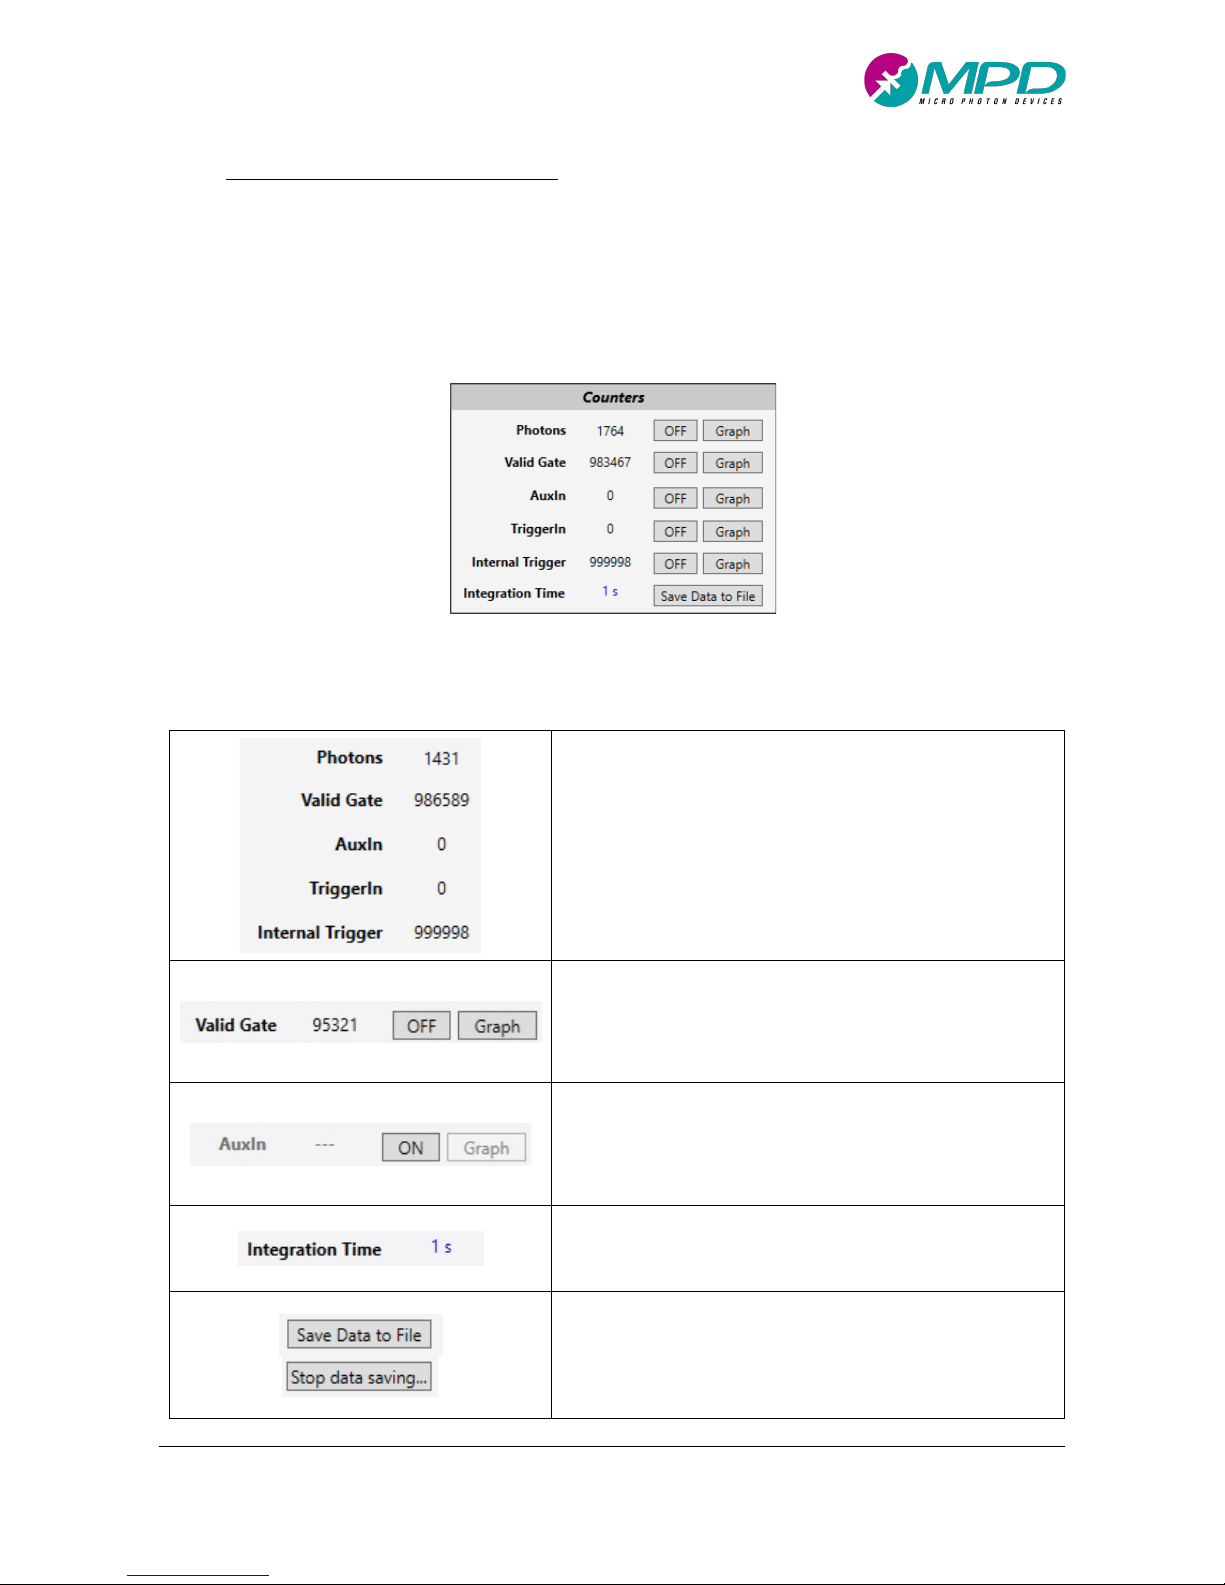
PDM-IR has five internal counters that can be enabled or disabled. Once enabled, it is possible to see each
actual counter value or its variation in time through graph displayed in a satellite window. The integration
time is user settable and common for all counters. The counters data can saved on a csv file (commaseparated values). This counter panel is shown in Figure 23 while controls are explained in Table 16.
Figure 23. Counter Section of the VisualPDM-IR Main Windows.
Table 16. Counter Section controls explained
Counter Values: displays the last values read from each
counter
OFF button: it’s visible when the counter is enabled. The
OFF button disables the counter.
Graph button: opens the time chart of the relative
counter (see 5.2.6).
ON button: it’s visible when the counter is disabled. The
ON button enables the counter and the Graph button.
Graph button: it is disabled and greyed when the counter
is disabled.
Integration time: sets and shows the integration time of
the displayed values.
Save data: save counter values to csv file. The file is
updated every integration time. the integration time can’t
be modified in the data are stored in a file. “Save data to
File” starts the data acquisition after choosing the name
path. “Stop data saving…” stops the data acquisition
Page 34
PDM-IR user manual v3.0.3
Micro Photon Devices S.r.l. – Italy All Rights Reserved
34
!
5.2.6 Counter Window
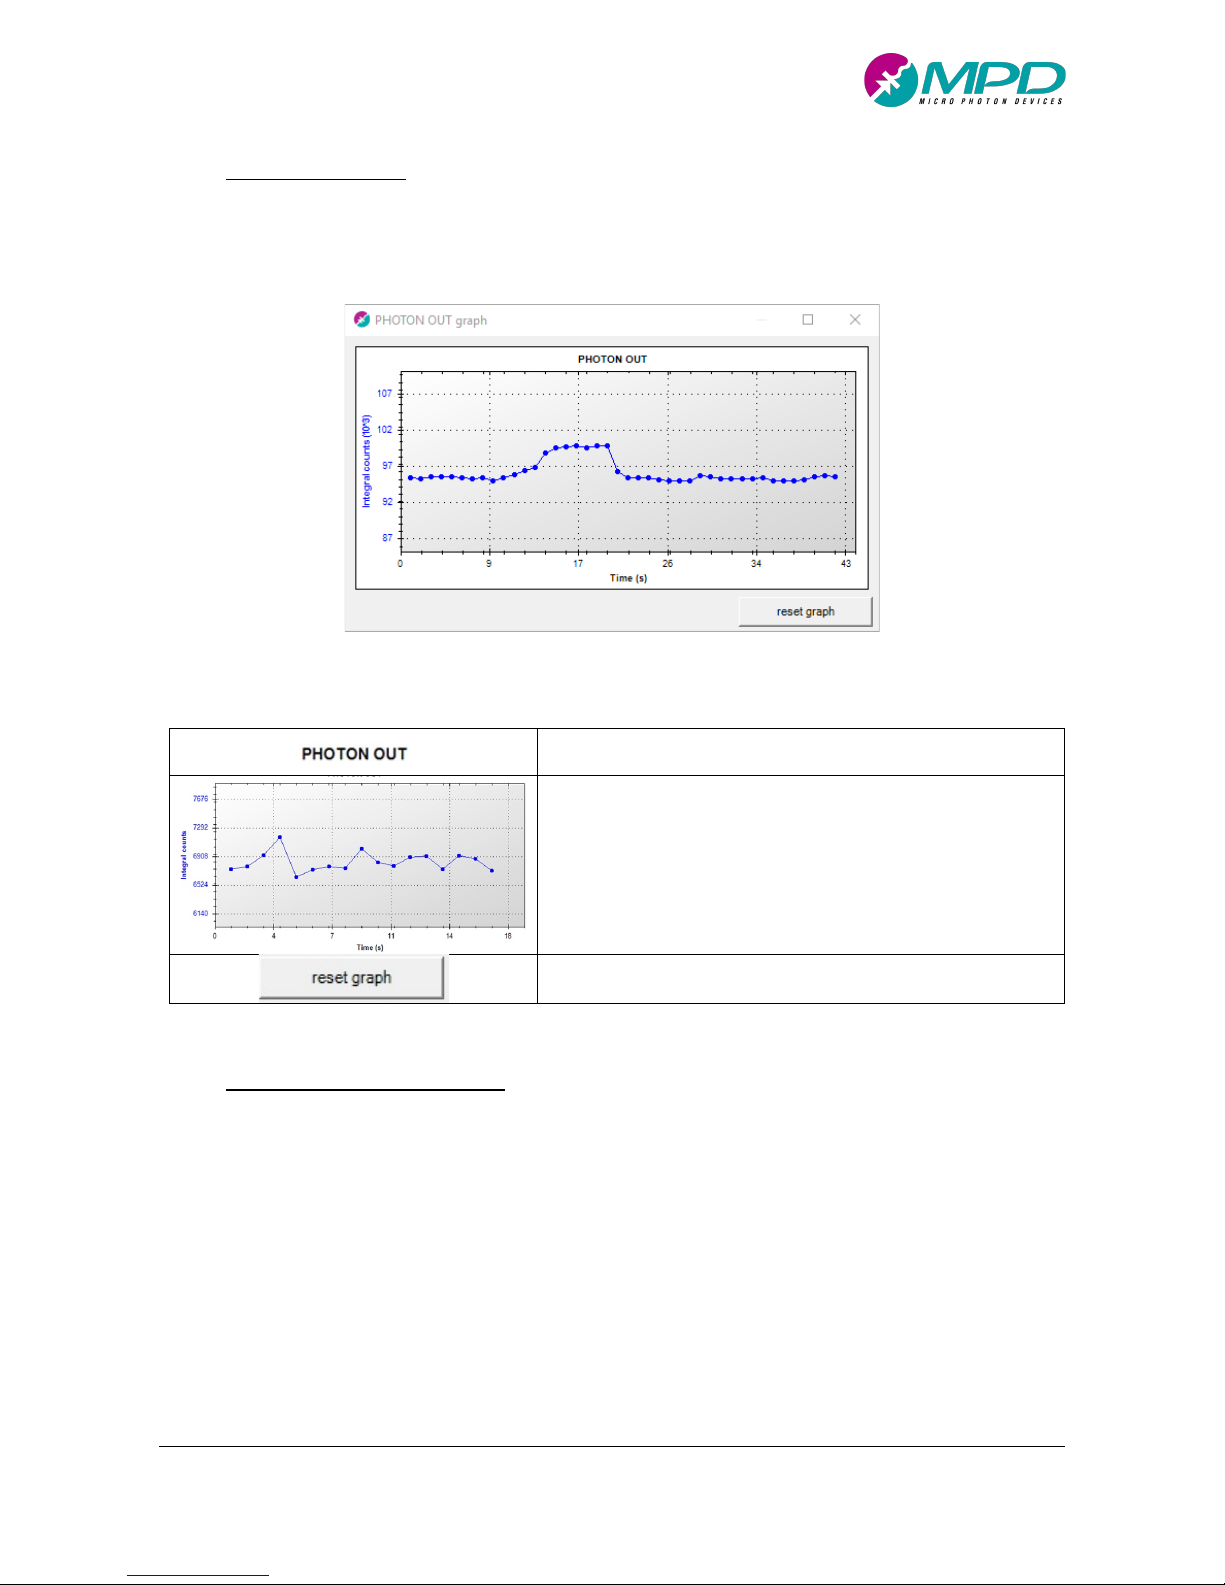
This satellite window shows the counter graph for evaluating the counts vs time (Figure 24) and display the
counter data values and the relative controls. Each control is explained in Table 17.
Figure 24. Counter Graph of the VisualPDM-IR. Satellite Window.
Table 17. Counter Graph controls explained.
Counter type: indicates the counter type
Graph Area: display the counts trace
Reset Graph: clean Graph Area.
5.2.7 Module Selection Window
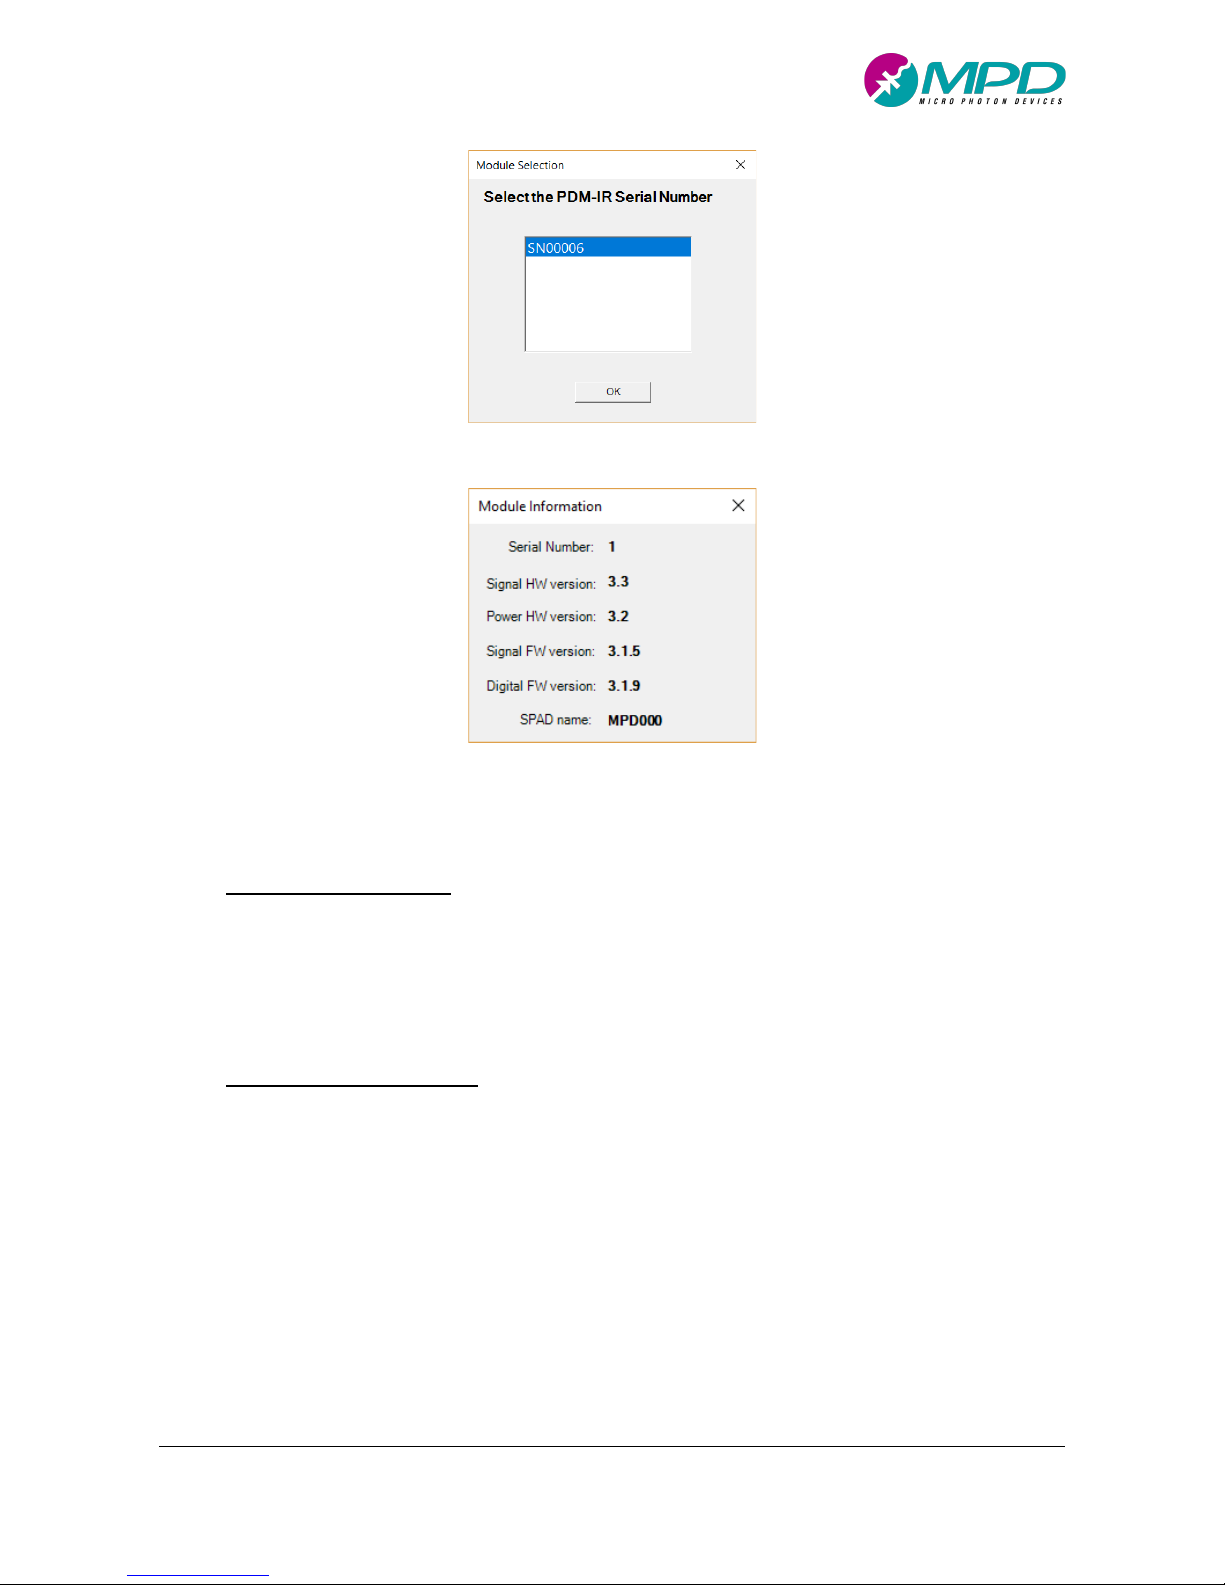
In case of multiple PDM-IRs connected at the same PC, the software offers the possibility to control all of
them, by means of the pop-up widow shown in Figure 25. In this figure the list of all detected PDM-IR modules
is indicated, allowing the user to choose or change the controlled PDM-IR by the Serial Number. Actual active
module is also shown by the SW interface in the top left corner as shown in Figure 18. The pop-up window is
immediately shown at SW start-up, in case of detection of more than one PDM-IR connected to the PC. The
user can also switch between modules by opening the pop-up window by means of the run-time menu File
→ Open Module (see paragraph 5.2.11). Every time a new module is selected pressing the OK button, the
software gets the actual configuration from the module.
Page 35
PDM-IR user manual v3.0.3
Micro Photon Devices S.r.l. – Italy All Rights Reserved
35
!
Figure 25. Pop-up window for the module selection.
Figure 26. Pop-up for PDM-IR module information.
5.2.8 Module Info Window
With the software interface it is possible to read the module hardware and revision versions for diagnostic
purposes, for example when contacting MPD for support. This pop-up (shown in Figure 26) can be opened
by pressing the “Show PDM-IR Module Info” button in the “Advanced” menu.
5.2.9 Configurations Window
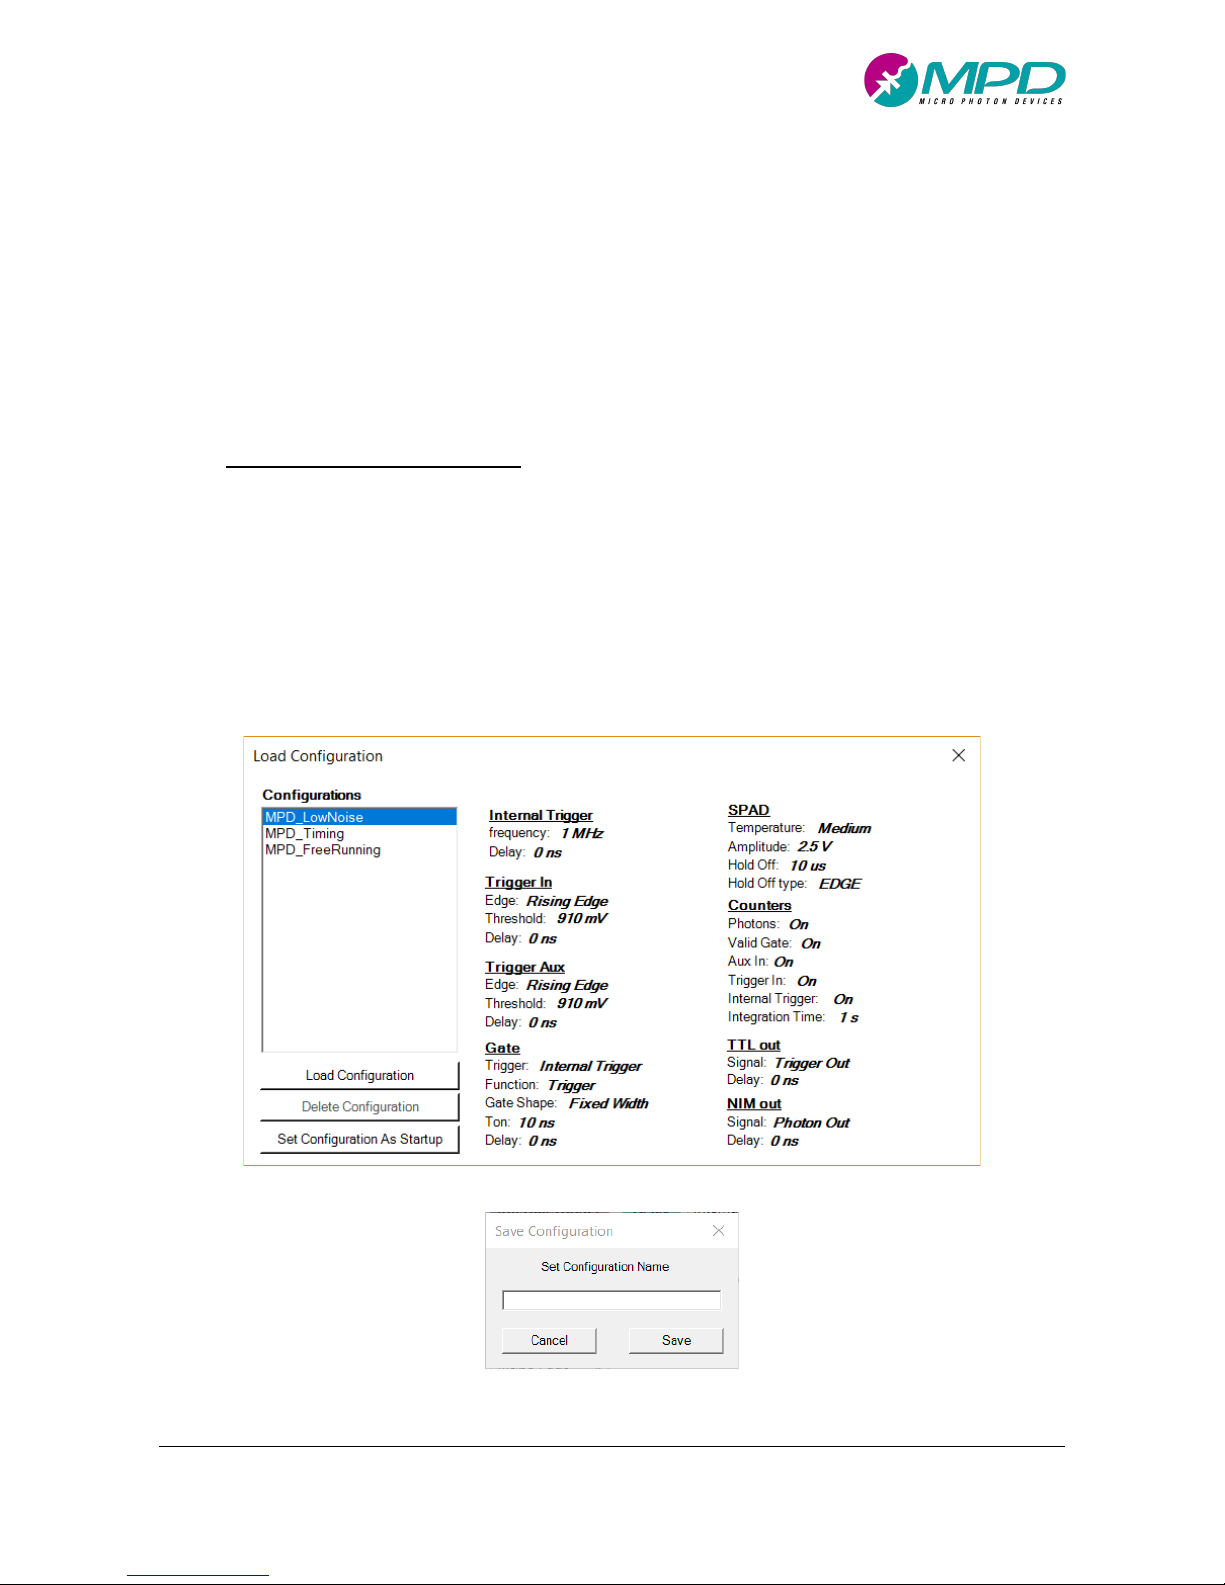
A complete set of parameters that fully configures a PDM-IR is called a “Configuration”. With the VisualPDMIR it is possible to save multiple configurations and load them whenever a specific one is needed for a
particular application or experimental set-up. In order to see which configurations are stored and to load
them, the “Load Configuration” menu item, in the “Configurations” run time menu, should be pressed. Upon
pressing, the pop-up window shown in Figure 27 is opened. The module can store up to 10 configurations,
with three of them preconfigured by MPD. While the latter are not erasable, all other user’s configuration
can be deleted by selecting them and then pressing the “Delete Configuration” button. Of course, in order to
upload a configuration in the module, it must be selected in the Configurations List and then the “Load
Page 36
PDM-IR user manual v3.0.3
Micro Photon Devices S.r.l. – Italy All Rights Reserved
36
!
Configuration” button should be pressed. Whenever a configuration is selected, the load configuration
window will also preview it in the dedicated window-panel as shown in Figure 27. Finally, with the same
window, it is possible to set a configuration as power up configuration, i.e. the one that will be loaded when
the PDM-IR is powered on without the need to be attached to a PC. This operation is performed by pressing
the “Save Configuration as Startup” button. It is also worth noting that the configurations are stored inside
the module and thus can be accessed anywhere, even when a module is moved from one lab to another and
thus connected to different PCs.
5.2.10 Save configuration Window
In order to save a configuration, the menu item “Configurations → Save Configuration” should be selected.
This action will open the window shown in Figure 28. In order to save a configuration, first the desired
configuration name must be written in the dedicated text box, then the “Save” button should be pressed.
The name will be useful for identifying it in the configurations list. Please be aware that the SW does not
verify if the configuration name has been already used or not. Instead, by pressing the “Cancel” button, the
window will be closed with no saved configuration.
Figure 27. Pop-up window for module configurations.
Figure 28. Pop-up for save the current configuration.
Page 37

PDM-IR user manual v3.0.3
Micro Photon Devices S.r.l. – Italy All Rights Reserved
37
!
Figure 29. Runtime menu.
5.2.11 RunTime Menu
The VisualPDM-IR has the runtime menu shown in Figure 29. The functions unlocked by the various menu
items have been already described in the previous paragraphs and are summarized again in Table 18.
Table 18. Runtime menu controls explained.
File → Open Module
Allows to change the PDM-IR that is controlled by the SW
when more than one module are attached to the same PC.
By pressing the menu item, the module selection window,
shown in paragraph 0, will appear.
File → Exit
Closes the software and the communication with the
module.
Configurations → Load Configuration
Opens the configurations window (see paragraph 5.2.9).
Configurations → Save Configuration
Allows to save the current configuration in the module, and
to assign a name to it (see paragraph 5.2.10).
Advanced → Show PDM-IR Module Info
Shows the hardware and firmware version of the module
(see paragraph 5.2.8).
About
Shows the software version.
Page 38
PDM-IR user manual v3.0.3
Micro Photon Devices S.r.l. – Italy All Rights Reserved
38
!
6 Setup Examples
In this chapter, some measurement examples are briefly discussed.
6.1 Basic setups
6.1.1 Photon Counting setup
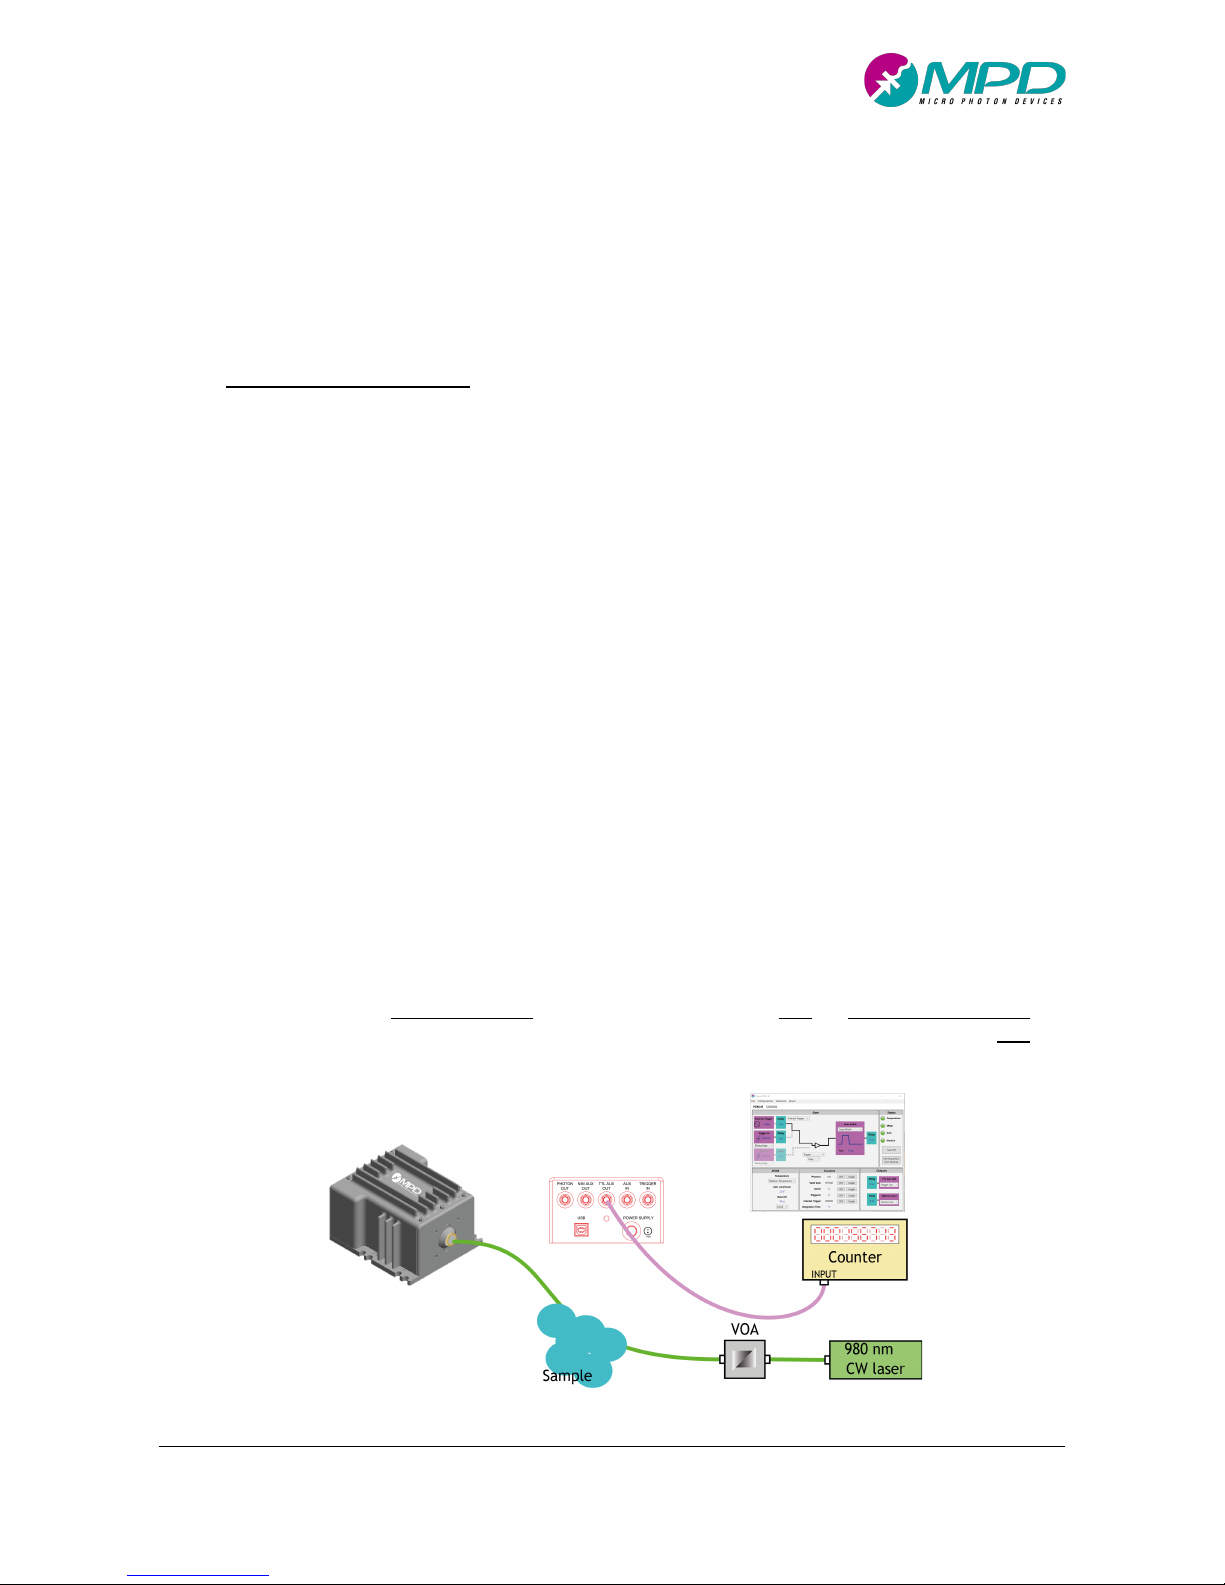
Photon-counting is the simplest type of measurement performable with the module and Figure 30shows a
possible example of the experimental setup. It consists of a continuous wave laser that produces photons at
980 nm, properly attenuated, and a sample that absorbs photons and re-emits in the near infrared part of
the electromagnetic spectrum. These photons, properly collected, are sent to the SPAD detector.
As the laser in this example produces a continuous wave, the photons emitted from the sample will be
asynchronous respect to any trigger, including the module internal one. Thus, for detecting these photons,
the PDM-IR can be used either in free running mode or in gated mode. The internal counter associated to
the NIM OUT (Photons) can also be conveniently used without the use of an external one. In free running
mode the measurement is straightforward (see paragraph 2 for a description the various modes of operation
and paragraph 4.2.3 specifically for free running): as the SPAD is immediately turned on following each
avalanche triggering, all photons impinging on the detector, apart those coming during the hold-off time, are
detected. Thus, supposing N
imp
the number of impinging photons on a SPAD active area during an integration
time T, N
count
the photons counted by the detector in the same integration time, and considering the PDE,
N
count
is equal to N
imp
reduced by the PDE and multiplied by the ratio between the actual integration time and
the set one T:
'
PKQML
& '
RSI
DTUVD
! ; '
PKQMLD!F"
!
& '
RSI
DTUV D @< ;'
PKQML
!
F"
!
B &
TUVD '
RSI
<WTUV D '
RSI
D
!
F"
!
Figure 30. Simple setup for a photon-counting measure (green: optical signals, pink: electric signals).
Page 39

PDM-IR user manual v3.0.3
Micro Photon Devices S.r.l. – Italy All Rights Reserved
39
!
By expressing N
imp
as a function of N
count
one obtains also:
'
RSI
&
<
TUV
X
'
PKQMLYZ
<;'
PKQMLYZ
X
!
F"
!
or, by dividing both sides of the equation by the integration time we obtained the very simple equation:
$%
RSI
&
'
RSI
!
&
<
TUV
X
'
PKQMLYZ
!
[
<;'
PKQMLYZ
X
!
F"
!
&
<
TUV
D
$%
PKQML
<;$%
PKQMLD!F"
So, in order to calculate the impinging count rate, the user just need to measure the module count rate
(CR
count
) and to correct for both the detection efficiency (calculated at the experiment wavelength) and the
HOLD-OFF.
In case, the user wants to perform the same measurement in gated mode, the PDM-IR should be set in gated
mode with internal trigger and Fixed gate width operation (see paragraph 2 for a description the various
modes of operation and paragraph 4.2.1 specifically for Gated-Mode with Fixed-Gate-Width). Even in this
case the internal counter “Photons” can be conveniently used. As already explained in paragraph 2, due to
the combined effect of the hold-off and the fact that the SPAD is enabled only during gate-ON windows of
width TON and period TP, the calculation of the impinging photon flux CR
imp
is a bit more complex and equal
to:
$%
RSI
C
<
TUV
D
$%
PKQML
<;$%
PKQMLD!F"
A
!T
!
"#
-----/.,-----
$%
PKQML
D!T
<;$%
PKQMLD!F"
E <
From the above equation it turns also out that:
$%
PKQML
C
TUVD
!
"#
!T
D$%
RSI
<WTUV D
!
"#
!T
D$%
RSID!F"
Which means that detecting asynchronous photons with a gated mode configuration always reduces the
efficiency in counting photons of the quantit\-
!"#G!T
, which is simply the duty-cycle D at which the SPAD is
switched on/off. In other words, a gated mode module running asynchronous respect to the signal behaves
as a free-running with a lower efficiency and SNR and thus, in this case, the free running mode should be
chosen (Poisson noise is the square root of signal and thus a lower count rate means a higher noise). This is
true if the hold-off is long enough so that the afterpulsing is low, otherwise it might be more advantageous
for the SNR, the gated mode which would reduce the number of avalanches and thus the afterpulsing.
Of course, if the laser would have been a pulsed one, using a gated mode operation would have been much
more advantageous. In this case, indeed, the detector is turned on only when signal and noise are present
Page 40
PDM-IR user manual v3.0.3
Micro Photon Devices S.r.l. – Italy All Rights Reserved
40
!
and turned off when only noise can be measured. As consequence, the signal is detected with PDE efficiency,
while noise is reduced by the duty-cycle factor. Additionally, as the hold off is typically microsecond long, the
module has a longer ON time, compared to a free running operation, as it is not switched off by noise during
the OFF part of the gate, further improving the SNR.
6.1.2 Photon Timing setup
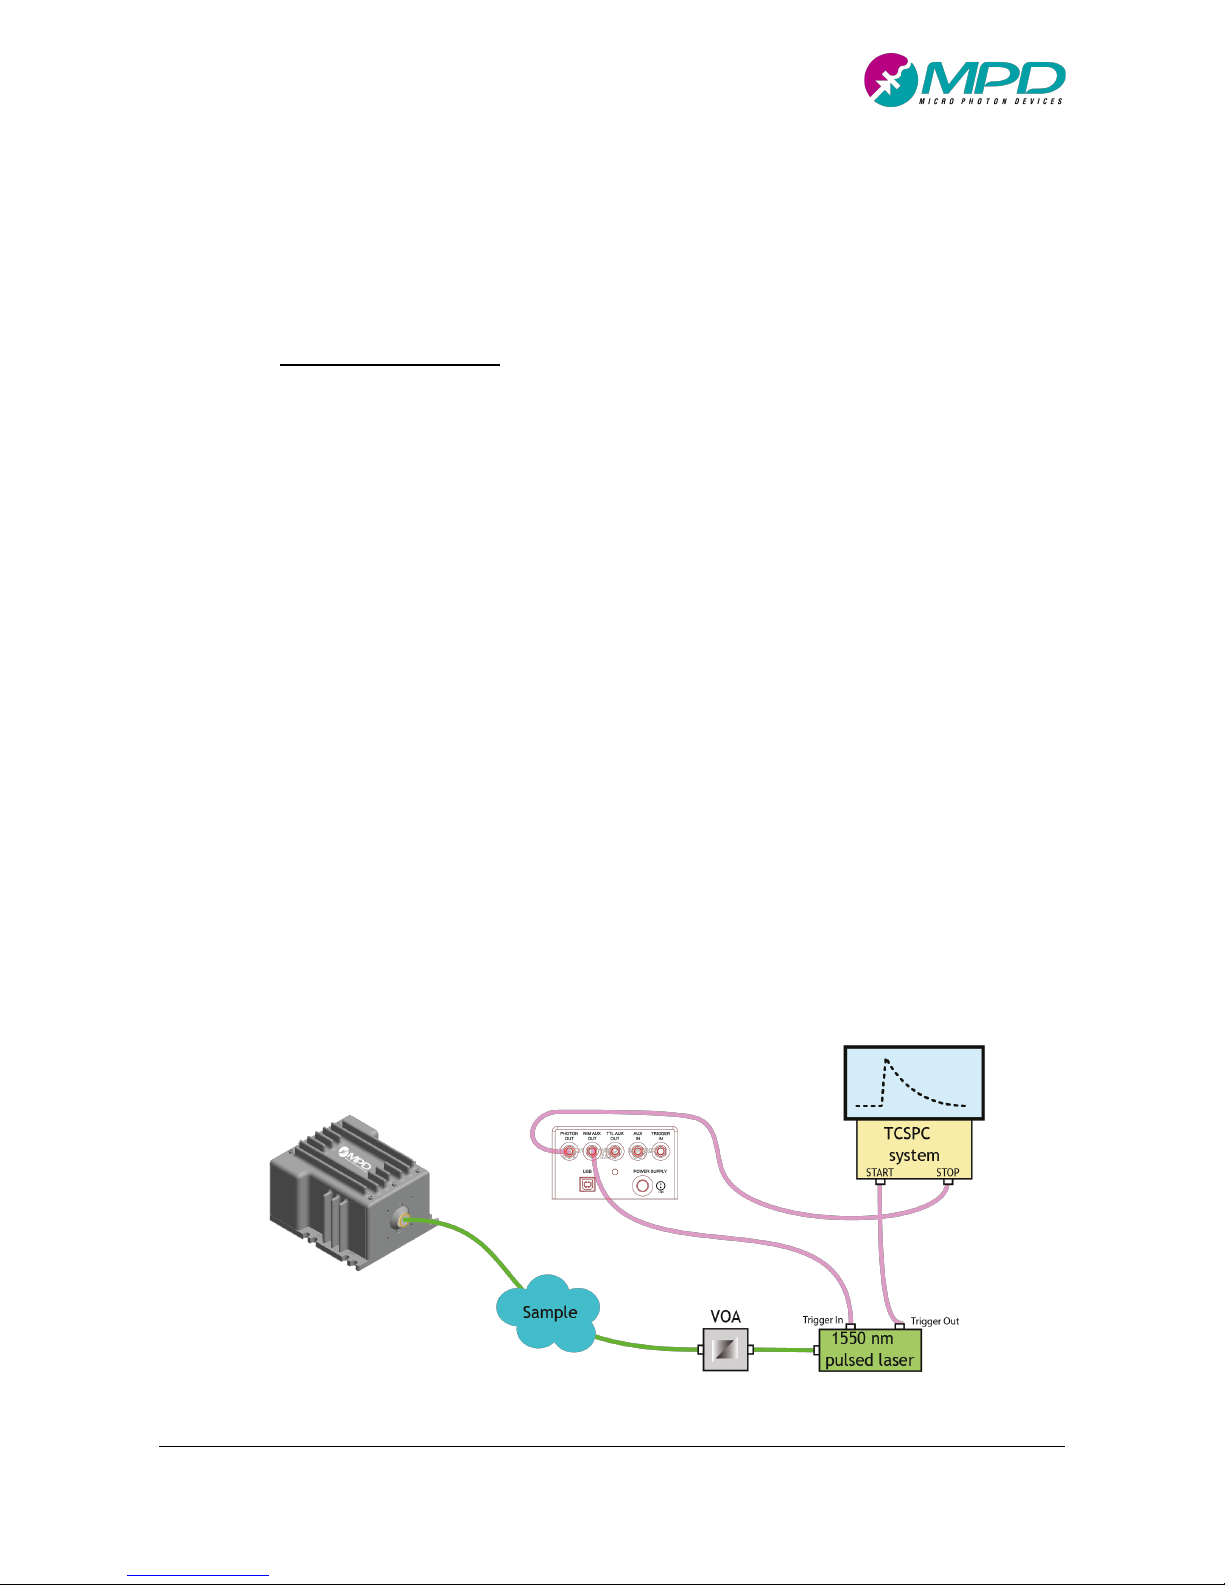
Another typical setup in which the PDM-IR is used is a photon-timing one, illustrated in Figure 31. This setup
can be adopted for measurement of fast waveforms of repetitive optical pulses. The technique is commonly
known as Time Correlated Single Photon Timing (TCSPC). This setup consists of a pulsed laser source which
excites a fluorescent sample that reemits photons with an exponential decay. In this example the module is
still internally triggered. Additionally, in this case, the NIM AUX OUT has been set to output the INTERNAL
TRIGGER and has been connected to the trigger-in input of the laser. In this way, the laser is triggered by the
PDM-IR module. The trigger-out signal of the laser is then used, as START of a TCSPC system. The STOP signal
to the TCSPC system is given by the PHOTON OUT of the PDM-IR module. It is worth noting that in this
example the INTERNAL TRIGGER, used to synchronize the laser, has been routed to the NIM AUX OUT as we
supposed to use a laser which can accept negative pulses and that it is triggered on the negative edge, like
with PicoQuant semiconductor lasers. In other cases, the TTL AUX out might have been better suited. As a
general rule, when connecting instruments, it is very important to verify the voltage levels and the polarity
of all the involved signals and to attenuate/invert them if necessary in order to comply with the inputs’
absolute maximum ratings.
In order to ensure that the photons, emitted by the sample, impinge on the detector when the gate is
enabled, it is necessary to take particular care to signal propagation delays inside the cables and in the
instruments, included the PDM-IR (see paragraph 4.7 for the actual numbers).
Figure 31. Simple setup for a photon-timing measure (green: optical signals, pink: electric signals).
Page 41

PDM-IR user manual v3.0.3
Micro Photon Devices S.r.l. – Italy All Rights Reserved
41
!
In this case all the equations used in the previous example are still valid and can be used in order to calculate
the actual counting rate of the detector. Anyway, the TCSPC technique is normally adopted in order to
correctly reconstruct the shape of the temporal response of fast pulses or fast fluorescence decays (like in
our example) by accurately measuring photon arrival times and not simply measuring the number of counts
in a period of time.
When using the TCSPC technique it is very important to avoid the pile-up effect. This is normally achieved by
attenuating the laser light so that only the 5% (or 1%) of the emitted fluorescence pulses are detected by the
sensor, i.e. module count rate should be smaller than 5% (1%) of the laser repetition rate. However, as we
are now in gate mode it is very important to correctly calculate the count rate. Additionally the equations
described in paragraph 2 are not valid as module duty cycle D should not be considered: since the Gate
window is synchronized with the laser, all laser photons reach the detector always when the latter it is on.
As a consequence, the correction due to the gate mode does not apply because for the laser pulses the SPAD
behaves as if operated in free running. Only the correction for the hold-off time must be implemented. In
addition, we will consider negligible the effect of the DCR and of the afterpulsing: the minor error that is
committed is conservative in calculating the correct counting-rate for avoiding the pile-up effect.
The condition to be satisfied is thus that the module count rate CR
count
should be smaller than 5% (or 1%) of
the laser pulses effectively shined on the detector, i.e. those emitted when the SPAD was not in HOLD-OFF:
$%
PKQML
] ^_D/
`aa
& ^_ D @/
bcdYe
;$%
PKQML
D
!
F"
U
bcdYe
B & ^_D@/
bcdYe;/bcdYe
D$%
PKQMLD!F"
B
and thus, simplifying:
$%
<;$% A!
F"
] ^-_D /
bcdYe
where
U
bcdYe
&
<
/
bcdYe
[
, THO is the hold-off time and CR is the actual module counting rate as measured at a
counter.
6.2 Advanced setups
6.2.1 Cross correlation setup with an external synchronization
In many cases, cross-correlation measurements have low photon rate, that’s why, optimizing the setup to
collect as many photons as possible is the main goal. This paragraph analyzes the measurement setup and a
PDM-IR configuration to get the best results. A cross correlation setup is commonly composed by two PDMIR because there are at least 2 optical channels to detect and, as described in paragraph 2, it’s important to
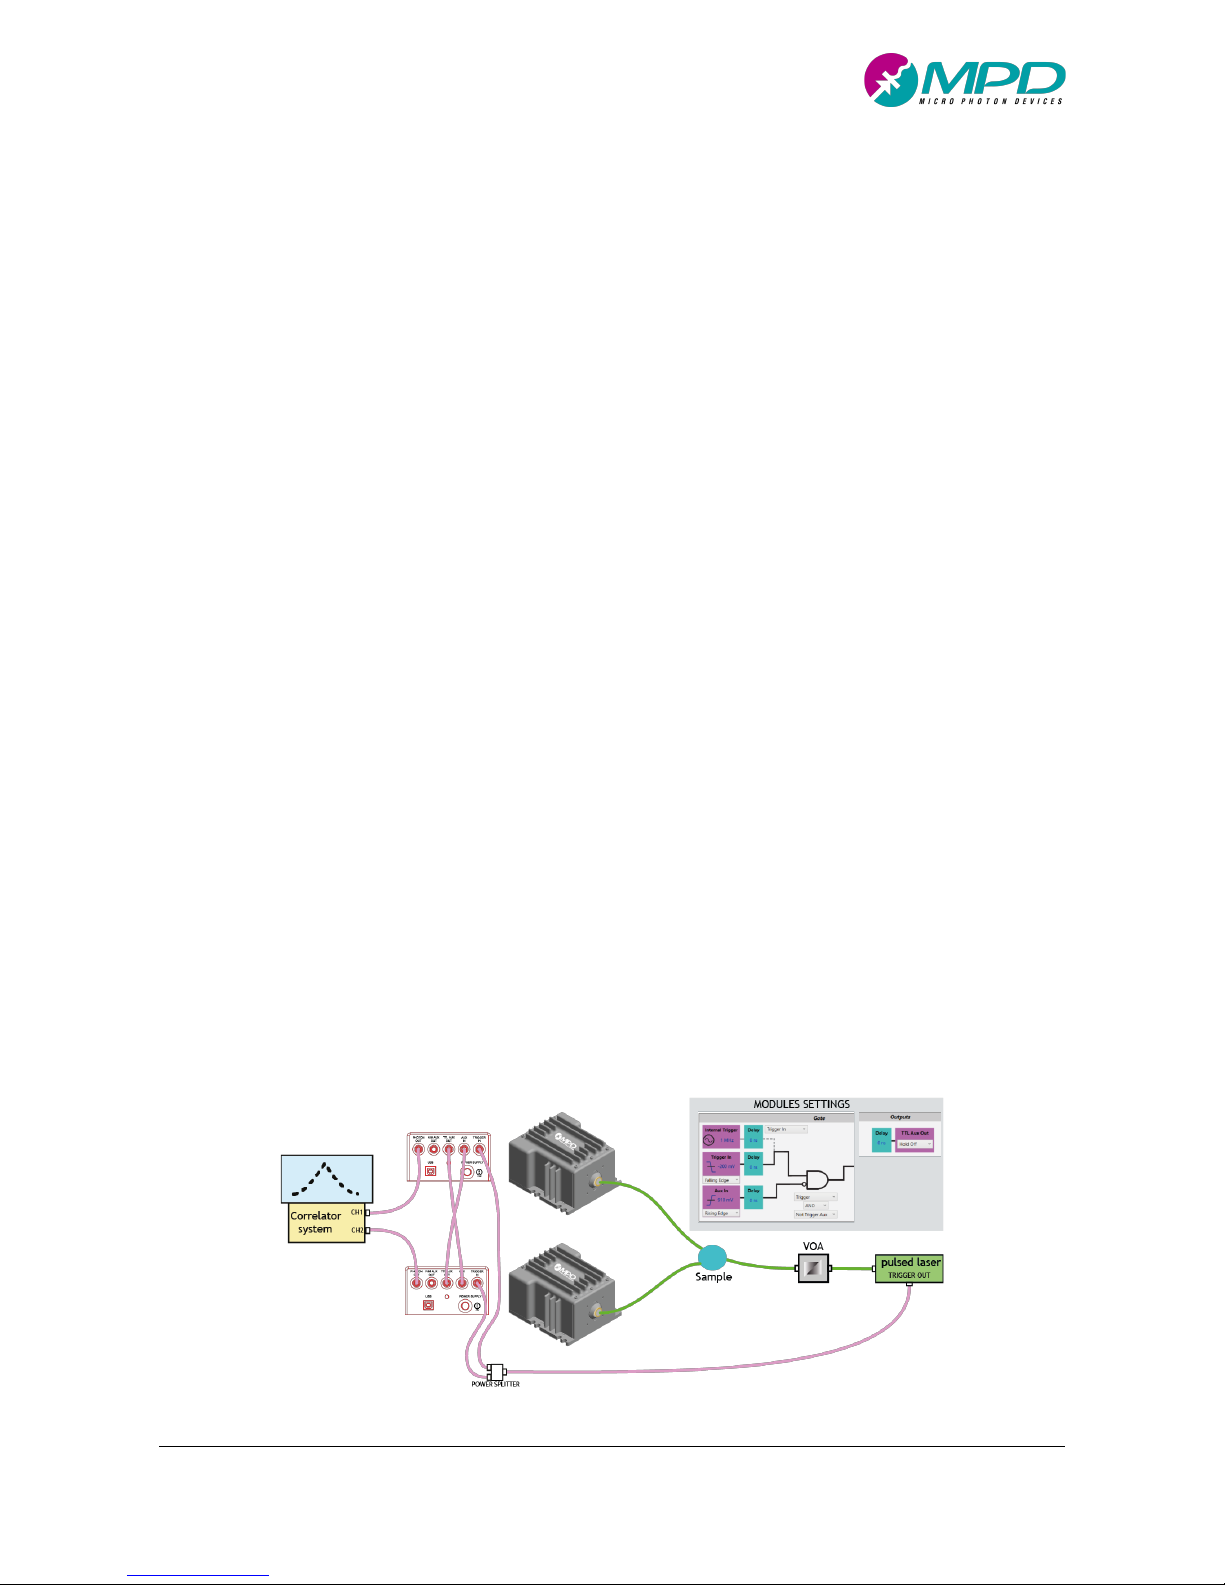
enable the SPADs only when the photons impinge on the detector. Figure 32 shows a case where the
Page 42
PDM-IR user manual v3.0.3
Micro Photon Devices S.r.l. – Italy All Rights Reserved
42
!
synchronism signal is provided by the pulsed laser and the PDM-IRs can be enabled only for the required time
to collect the photons. Anyway, due to the long hold off time (tens of microseconds), there is a significant
probability that when the signal photons arrive at the detectors, one of the two is disabled due to a previous
avalanche. This reduces the SNR because a correlated count can’t be detected and, whenever the enabled
SPAD is triggered, a distortion in the measurement is also created (the other SPAD did not count because the
expected photon did not arrive or was not seen for the PDE < 1 but because it was OFF). Even if this distortion
could be corrected, the effect of such event would anyway be a longer measurement time. The best solution
is thus to enable both SPADs only if they both can detect photons.
A proposed solution is here described step by step:
1. Set the PDM-IRs to work in fixed gate width mode (see 4.2.1) and with the GATE generated by
TRIGGER IN.
2. Connect the LASER TRIGGER OUT to the TRIGGER IN of each PDM-IR by means of a wideband 50/50
power splitter (the voltage levels at the outputs are the half of the input levels); set the correct edge
and threshold settings of the TRIGGER IN input.
3. Set the correct TRIGGER IN delay so that detectors are enabled when the photons arrive
4. Set the correct T
ON
width so that it is longer than the correlation curve to be acquired.
5. For each module use the second input connector (AUX IN) to get the HOLD OFF status of the other
module: set the TTL AUX OUT as HOLD OFF, set the AUX IN threshold voltage around 1 V with rising
edge trigger edge, connect the TTL AUX OUT of each module to the AUX IN of the other module. AUX
IN delay and TTL AUX OUT delay should be set to 0 ns to minimize the time of synchronization of the
two modules.
6. Set the AND as the Logic Function between TRIGGER IN and NOT AUX IN: the SPAD of each module
is enabled only when the other module isn’t in hold off.
7. Use the PHOTON OUT outputs as correlator system inputs.
Figure 32. Example setup for cross correlation measurements with an external sync.
Page 43
PDM-IR user manual v3.0.3
Micro Photon Devices S.r.l. – Italy All Rights Reserved
43
!
Figure 33. Example setup for cross correlation measurements without external sync.
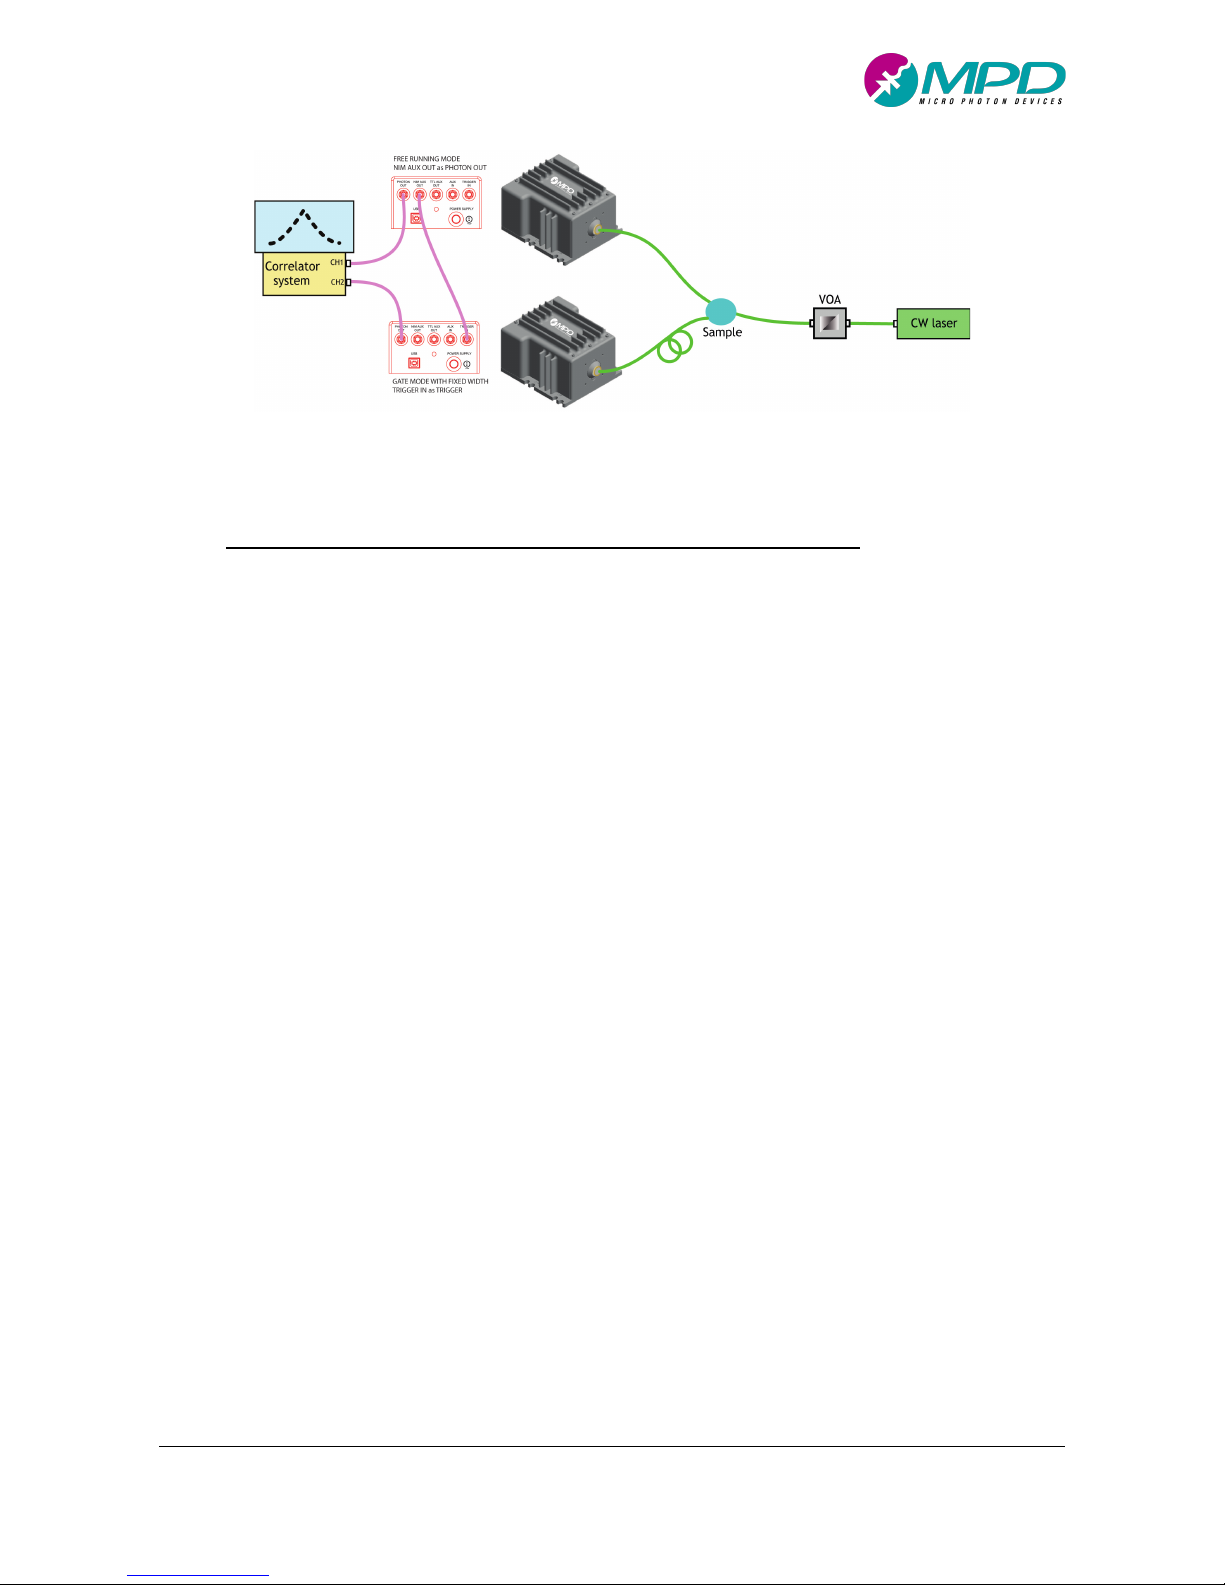
6.2.2 Cross correlation setup without an external synchronization
Whenever photons are emitted totally asynchronously, previous set-up cannot be used. For example, if the
sample emits photons stimulated by a CW laser, there is no possibility to sync the PDM-IR with the photon
emission for calculating the cross-correlation. In order to overcome this limitation, the simplest setup is
composed by both PDM-IR in free running mode. Anyway, this setup doesn’t optimize the measurements
because one of the two detectors could be in hold off while the other detects the correlated photon. As
result, the SNR is drastically reduced due to the high InGaAs/InP DCR.
This paragraph describes an alternative solution, shown in Figure 33, that allows to collect better results.
With this configuration one module is set to work in free running mode in order to collect as much
asynchronous photons as possible. The other PDM-IR is set to work in gated mode with fixed gate width and
his own TRIGGER IN is connected to the NIM AUX OUT of the other module. Setting the NIM AUX OUT of the
free-running module as PHOTON OUT, the gated SPAD is enabled ONLY every time the first module detects
a photon. Finally, in order to make this setup working two other settings must be ensured:
1. Since there is a fixed delay from the instant a photon is detect by the free-running PDM-IR to the
instant the gate is opened on the second PDM-IR (due to modules internal delays, see paragraph 4.7,
and the cable used to connect the two modules), photons arriving at the gated PDM-IR must be
delayed by making longer the optical path from the sample to the gated PDM-IR. In case of an
experimental set-up using optical fibers, this can be easily archived by using longer optical fiber
patches.
2. In order to be sure that the gated PDM-IR can be gated-on whenever the trigger arrives from the
free-running module, the gated SPAD MUST NOT BE in HOLD-OFF. Setting the hold off time of the
free-running module longer than the sum of gate-width and hold-off time of the gated module, will
allow the above condition to be met.
Page 44

PDM-IR user manual v3.0.3
Micro Photon Devices S.r.l. – Italy All Rights Reserved
44
!
6.2.3 Long Decay Measurement
Short Decay measurements up to hundreds of nanoseconds can be measured in gated mode with fixed gate
width without any particular issue (see paragraph 6.1.2): for ensuring that the photons emitted by the sample
impinge on the detector when the gate has been enabled, it is necessary to take particular care to signal
propagation delays inside cables, optic fibers and instruments, including the PDM-IR. This information is
easily obtained by reading the instruments respective user manuals. In this way the gated mode photon
counter behaves as if it would be a free-running module: the detector is always ON when the photons arrive.
Longer decays, in the range of microseconds, have usually maximum laser repetition rates in the order of few
hundreds of kHz or lower, in order to avoid aliasing effects. With such sources, setting up a TCSPC might not
be easy and the condition on detection rate, for avoiding the pile-up effect, could impair the measurement
acquisition time. Indeed, the easiest way to measure such decay would be the use of the module in free
running mode. In this way, the condition to avoid the pile-up effect would be that the module count-rate,
corrected for the hold-off, should be smaller than 5% (1%). Anyway, in this situation with laser frequencies
of 100kHz or smaller the condition becomes 5kc/s, 1kc/s or smaller and modules dark counting rates could
be already in the same order of magnitude or larger. It would thus seem that in case of a module with DCR =
5kc/s and an experiment with 100kHz of f
LASER
, a TCSPC measurement would not be possible. This is not the
case. Let’s start from the known formula and let’s also separate the contributions of the signal
$%
dRfMcb
from
the noise
$%
MKRdY
(noise can be DCR only or DCR plus an uncorrelated background light); let’s also name
$%
LKLcb
& $%
dRfMcb
W$%
MKRdY
, which is the count rate with no corrections that can be simply seen by
attaching the PDM-IR PHOTON OUT to a counter (or by using the internal “Photons” counter):
$%
dRfMcb
W$%
MKRdY
<;g$%
dRfMcb
W$%
MKRdY
h
D!
F"
&
$%
dRfMcb
<;$%
LKLcbD!F"
W
$%
MKRdY
<;$%
LKLcbD!F"
] ^_ D /
ijk`l
Now we have two terms in the above equation, one with the contribution of the signal and the other one
with the contribution of the noise. As seen, both noise and signal contribute to the pile-up effect, anyway
only the counts inside the TCSPC Region Of Interest (ROI) should be considered. Specifically, it important to
consider only noise distortion over the same time window of the signal and not outside the signal limits.
Indeed, background noise distortion comes with a non-flat curve in a TCSPC measurement (not easily
removable thus) and it is important that only the part within the signal time limits is distorted less than 5%.
Supposing to select a ROI large enough to contain the whole signal, and thus the signal contribution to the
pile-up effect is considered unmodified, but not much longer than the signal duration, so that noise
Page 45

PDM-IR user manual v3.0.3
Micro Photon Devices S.r.l. – Italy All Rights Reserved
45
!
contribution can be reduced by the ratio between the ROI and the laser period D
LASER
= 1/f
LASER
, the equation
above becomes:
$%
dRfMcb
<;$%
LKLcbD!F"
W
$%
MKRdY
<;$%
LKLcbD!F"-
D
%m3
U
ijk`l
] ^_D /
ijk`l
For example, supposing f
LASER
= 100 kHz, THO = 10µs, CR
noise
= 5kc/s and ROI = 20µs, one obtains that CR
signal
=
3571 c/s. Since CR
noise
is the count rate that can be read by a counter (like the internal Photons), without any
correction for the HOLD OFF and since CR
signal
is the signal count rate, i.e. the THO-uncorrected count rate one
could ideally measure if detector noise could be “switched off”, the above result would mean that when
module PHOTON OUT count rate is 3571 c/s + 5000 c/s = 8571 c/s, than the PDM-IR is at the 5% TCSPC limit.
It is also worth pointing out that in MPD datasheets all the DCR values are corrected by the HOLD-OFF. As a
consequence, if a test report states that, a specific PDM-IR with a specific configuration has DCR = 2k/s, it
means that when connecting this module to a counter and by using the stated configuration, the read count
rate CR
noise
would be:
Hnnn
o
2
&
$%
MKRdY
<;$%
MKRdYD!F"
p $%
MKRdY
&
Hnnn
o
2
<WHnnn
o
2
D<nq2
& <rsntuv-oG2
Summarizing, it is possible to measure a microsecond decay signal with a free running PDM-IR provided the
above equation is used for calculating the pile up effect.
A better solution, but a bit more difficult to implement, would be to acquire only few “slices” of the decay
curve, as sampling points (see Figure 34) and recreate the full decay curve fitting these points. This could be
achieved by using the PDM-IR in gated mode with a hold-off time longer than the ROI, so that only one pulse
per decay, as in the equivalent free running mode, would be counted. Anyway, in this case and respect to
the free running mode, both signal and noise would be reduced by the same factor D, where D is the gated
mode duty cycle, calculated as ratio between the slice on time TON (i.e. the PDM-IR gate on time) and the
repetition period T (i.e. PDM-IR gate frequency). Anyway, in this case the laser could be increased for the
signal only of the same factor D or actually even a bit more as with a lower noise it is possible to push even
further the signal before reaching the 5% (1%) pile up limit. Additionally, by reducing the number of dark
counts, the detector is, on average, ON and ready to detect signal-photons for a longer time as the hold-off
time caused by noise is also reduced. Finally, it is also worth noting that any distortion due to the long holdoff is kept negligible because of the low count rate with respect to the laser frequency.
Summarizing, while with a free running module, a decay measurement is the simplest, with a gated mode
module used to sample the decay, it is possible to increase the SNR even more that the duty D at the expense
of having a curve sampled and not “continuous”.
Page 46
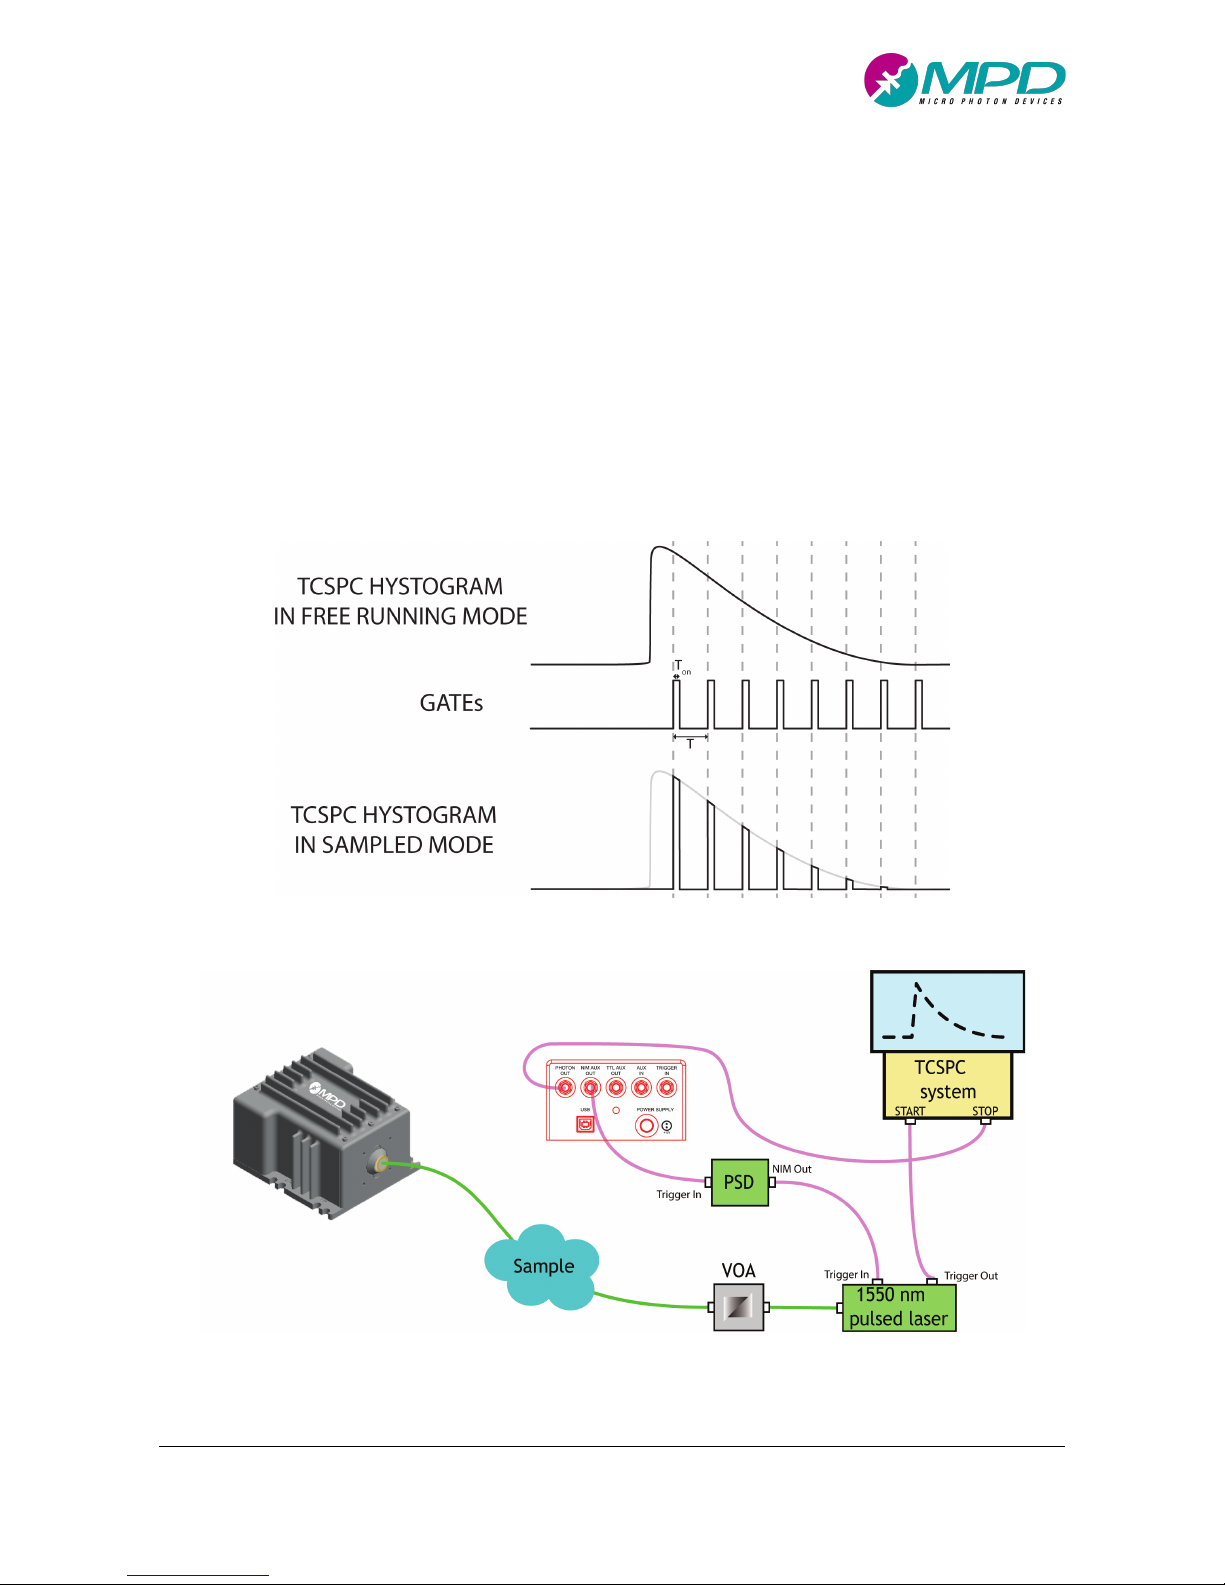
PDM-IR user manual v3.0.3
Micro Photon Devices S.r.l. – Italy All Rights Reserved
46
!
In order to perform this measurement using the setup proposed in Figure 35 follow the instructions:
1. Set the PDM-IR trigger as INTERNAL TRIGGER and set the internal frequency between 10 to 100
times higher than the desired laser trigger frequency (the laser trigger frequency is
application dependent)
2. Set the NIM AUX OUT as TRIGGER GATE and connect it to the MPD Picosecond Delayer input.
The PSD, in this application, is used as divider, in order trigger the laser at the desired
frequency, i.e. 10 to 100 times less than the module gate frequency.
3. Acquire the raw data of the histogram by setting correctly the TCSPC system parameters.
4. Elaborate the histogram with a custom-made program or Matlab function.
Figure 34. Free running mode vs Sampled mode of a long decay curve.
Figure 35. Example setup for lon decay measurements.
Page 47

PDM-IR user manual v3.0.3
Micro Photon Devices S.r.l. – Italy All Rights Reserved
47
!
7 System requirements
• USB 2.0 interface
• Host computer (minimum requirements)
o 1 GHz processor and 512 MB of RAM
• Supported operating systems
o VisualPDM-IR
§ Microsoft Windows XP, Vista, 7, 8,10, 32 or 64 bit versions
o SDK
§ Microsoft Windows XP, Vista, 7, 8, 10, 32 or 64 bit versions
§ Linux Ubuntu 12.04 LTS, Fedora Core 15 or compatible distributions, 32 or 64 bit
versions. Different distributions should work, but were not tested.
§ Mac OS X 10.7.5 and above
Copyright and disclaimer
No part of this manual, including the products and software described in it, may be reproduced, transmitted,
transcribed, stored in a retrieval system, or translated into any language in any form or by any means, except
for the documentation kept by the purchaser for backup purposes, without the express written permission
of Micro Photon Devices S.r.l. All trademarks mentioned herein are property of their respective companies.
Micro Photon Devices S.r.l. reserves the right to modify or change the design and the specifications the
products described in this document without notice.
 Loading...