

Page 1
Advanced Electrical Materials
Page 2

DISCLAIMER
Please note that all product, product specifications and data detailed in this brochure are subject to change
without notice to improve reliability, function, design or otherwise. Morgan AM&T B.V. and its affiliates does
not assume any responsibility for the correctness of this information nor for damages consequent to its use.
Statements regarding the suitability of products for certain types of applications are based on knowledge of
typical requirements that are often placed on Morgan products in generic applications
Page 3

Page 4

CONTENTS PAGE
Introduction
Recommendations
...................................................................................................................... 1
........................................................................................................... 4
First time Use ..................................................................................................................... 5
Minimum PC requirements: ........................................................................................................................ 5
Registration of software on 1st use ............................................................................................................ 6
Software update procedure ...................................................................................................................... 11
Using the MSPro14 Measuring Box................................................................................ 12
Welcome Screen ........................................................................................................................................ 13
Home Screen .............................................................................................................................................. 14
Settings ..................................................................................................................................................... 15
Date & Time .......................................................................................................................................... 15
Units & Language ................................................................................................................................. 16
Alarms ................................................................................................................................................... 16
Display .................................................................................................................................................. 17
Power Management .............................................................................................................................. 17
Sensor Settings ..................................................................................................................................... 18
Start Measurement ................................................................................................................................... 19
Commutator .......................................................................................................................................... 19
Setting the Sensor ............................................................................................................ 21
Completing one Recording ................................................................................................ 24
Slip-ring ................................................................................................................................................. 31
Setting the Sensor ............................................................................................................ 32
Completing one Recording ................................................................................................ 33
View Data ................................................................................................................................................. 38
Standby Screen .......................................................................................................................................... 40
PC Analysis Software
DASPro14
General ..................................................................................................................................................... 43
User Interface ........................................................................................................................................... 43
Using DASPro14 for the first time ............................................................................................................ 46
Using DASPro14 ...................................................................................................................................... 46
.................................................................................................................................................. 43
.................................................................................................. 43
Page 5

Adding Datasets.................................................................................................................................... 46
Printing
................................................................................................................................................. 48
Reading and Comparing Values
Adjusting Profiles
Zooming behaviour ............................................................................................................................... 50
Alarms ................................................................................................................................................... 50
Downloading .Mas files ......................................................................................................................... 50
............................................................................................................................... 49
Appendix A: Specifications
Appendix B: Warranty & Repairs
Warranty ...................................................................................................................................................... 52
Repairs & Calibration ................................................................................................................................. 52
........................................................................................................ 49
......................................................................................... 51
............................................................................... 52
Page 6
INTRODUCTION
The primary object of maintaining or reconditioning a commutator or slip ring (Collector) is to remove those
irregularities which lead to impaired brush efficiency and reduced brush and collector life. Collectors should,
in an ideal world, be smooth and true. A collector that is in bad condition should be either re-ground or
turned.
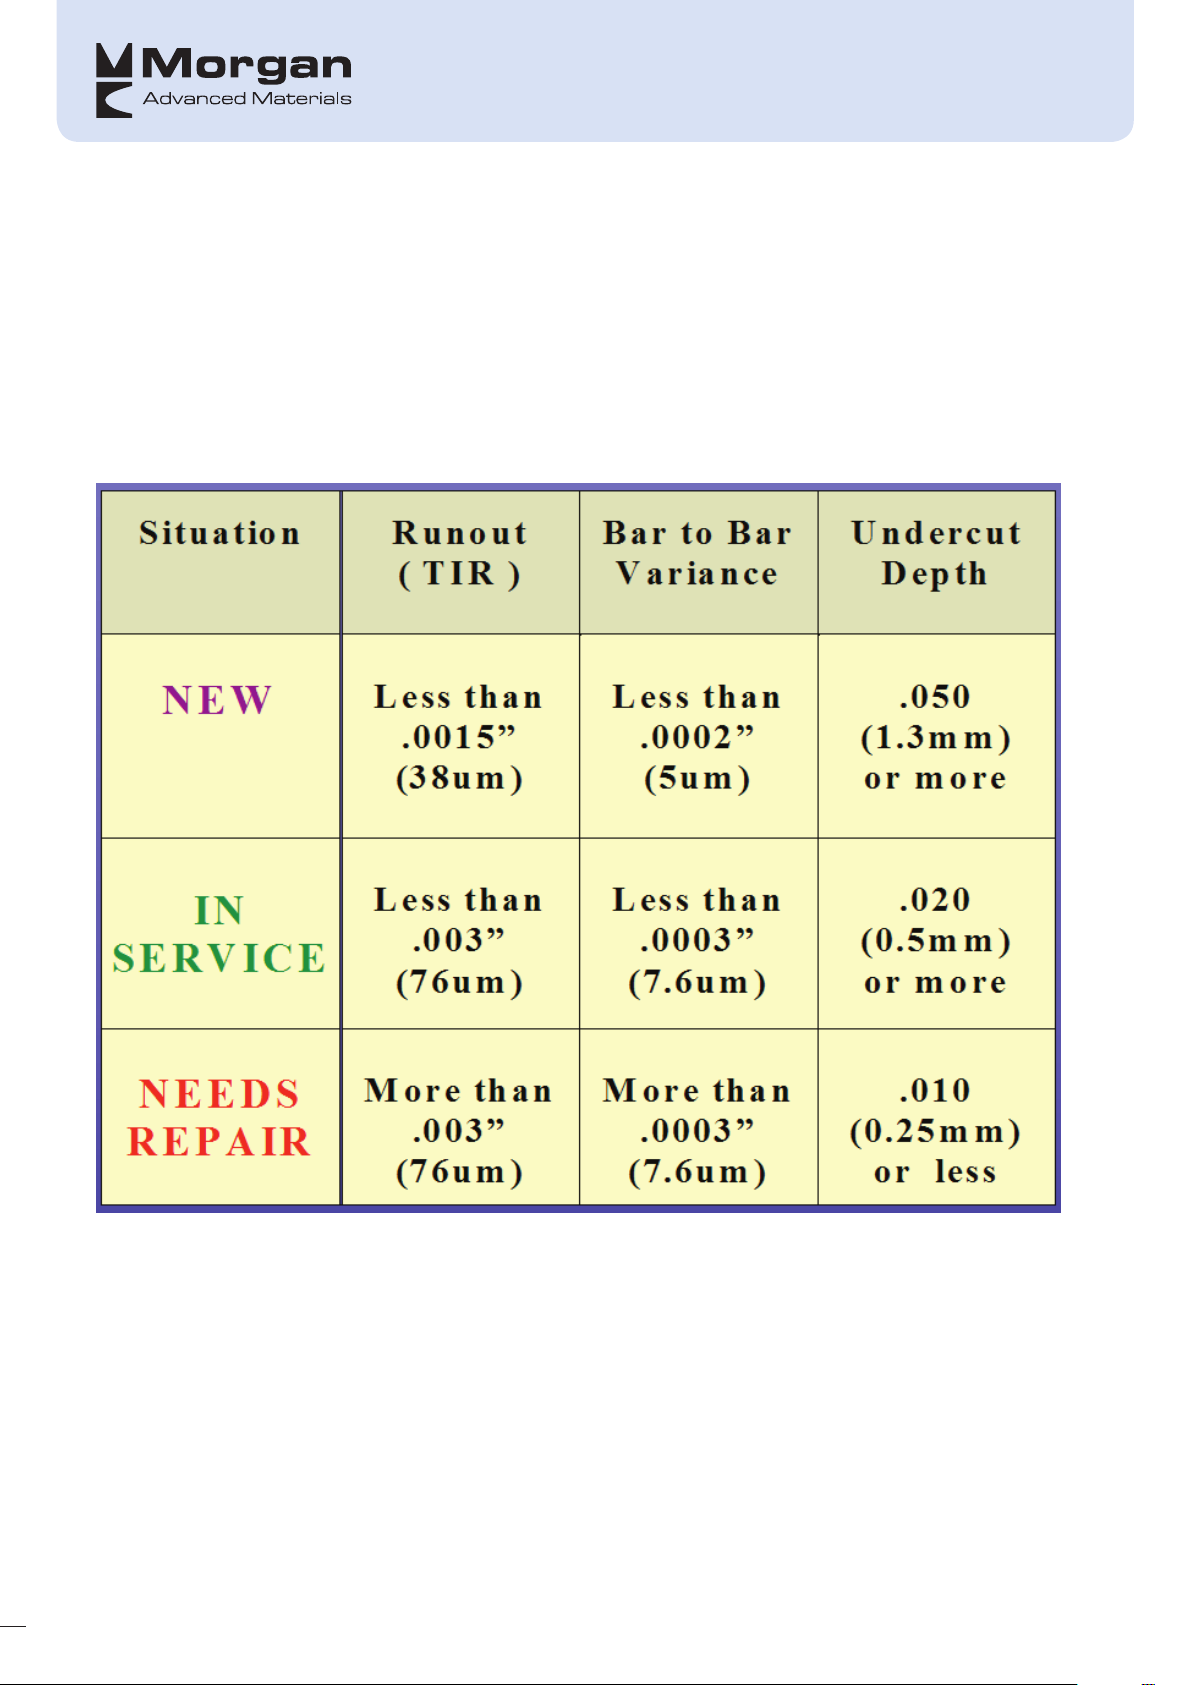
In general, collectors with a Total Indicated Runout (TIR) of 76µm (3 mil) or greater and on a commutator
with a Maximum Bar-to-Bar Height (MBTB) of 7.6 µm (0.3 mil) or greater needs to be re-ground or turned:
Regular use of a profiling device such as the MSPro14 will help to confirm whether there is a problem with
the collector and this should be done at least every six months and if possible every 2 months. Trending this
information will help better plan maintenance schedules.
1
Page 7
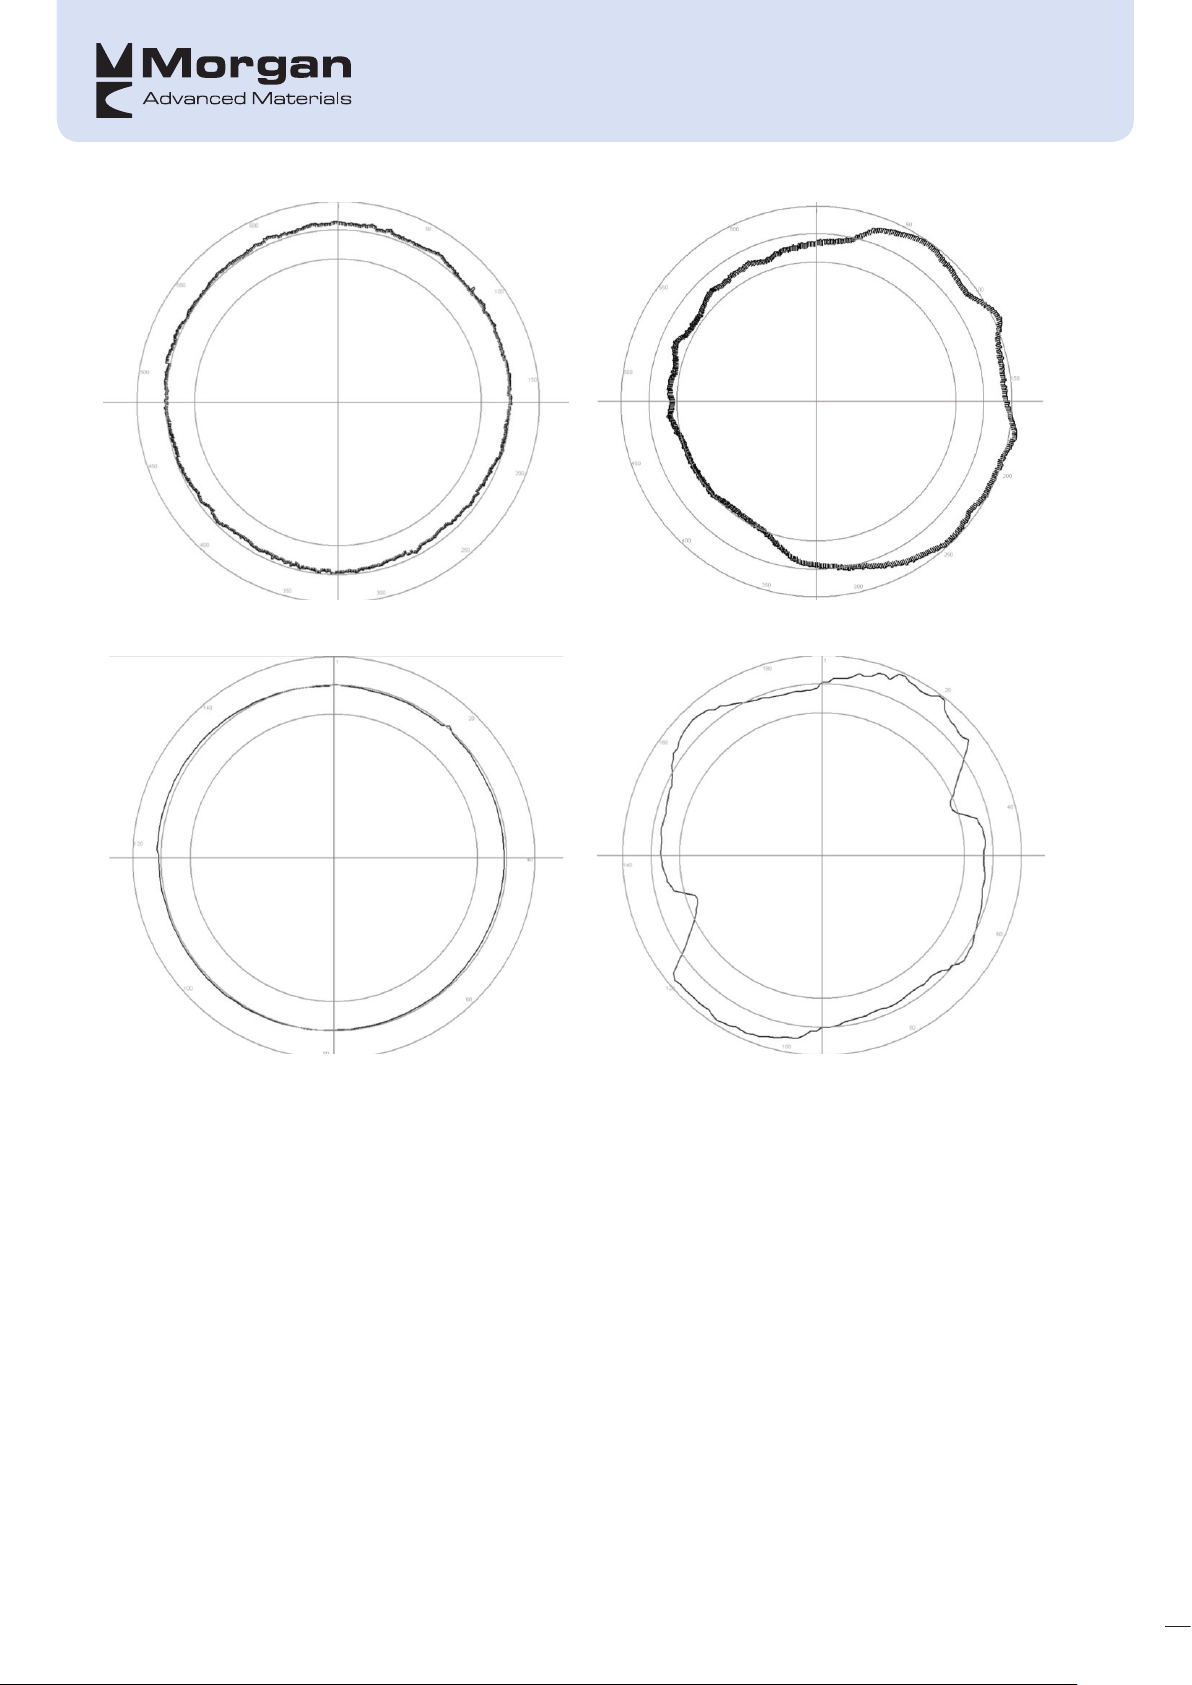
An acceptable slip ring profile
An unacceptable slip ring profile
An acceptable commutator Profile
Therefore congratulations on purchasing the MSPro14 – the new and improved Surface Profiler from Morgan
Advanced Materials. The MSPro14 is used for:
• Collector surface profiling and measures TIR, MBTB as well as collector diameter
• The TIR for collectors is the difference between the minimum height and the maximum height. The TIR is
also referred to as the ‘runout’ or 'out of roundness'.
• The MBTB Height for commutators is the maximum height difference between two adjacent bars. The
MSPro14 can also determine when there are high micas present on Commutators. High Micas occur
when there appears to be no gap between two consecutive bars. High Micas will be indicated as a bar
number in the edit recordings dialog window.
• The MSPro14 takes recordings in what the industry knows as ‘shape’ mode. Shape mode takes readings
as the sensor moves over the collector surface and using these values it is able to generate a shape of
the collector. Shape mode records a large number of samples, thus enabling a profile to be recorded
allowing wear patterns and irregularities to be inspected.
An unacceptable commutator profile
2
Page 8
• Peak height mode can be selected (in the DASPro14 software) and is where one value per bar is
displayed – this being the peak height of multiple samples taken across the entire bar.
1
2
3
• Collected data can be transferred to a PC where it can be analysed in detail using the DASPro14
Windows based software supplied in the kit.
The MSPro14 also offers:
• A solid easy to mount sensor that can be fitted to a vast range of holder sizes, and is rugged enough to
cope with extreme environments including vibration
• Easy to use responsive industrial colour touch screen
• Optimised sensor head that is not negatively affected by Helically Grooved Slip Rings
• Zero setting light indicators for easy set up
• Previous Morgan supplied profiler measurements (.mas files) can be stored and combined
• Extra extensive memory for storing information and editable on the data acquisition box
• Comes in a robust carrying case including all attachments
4
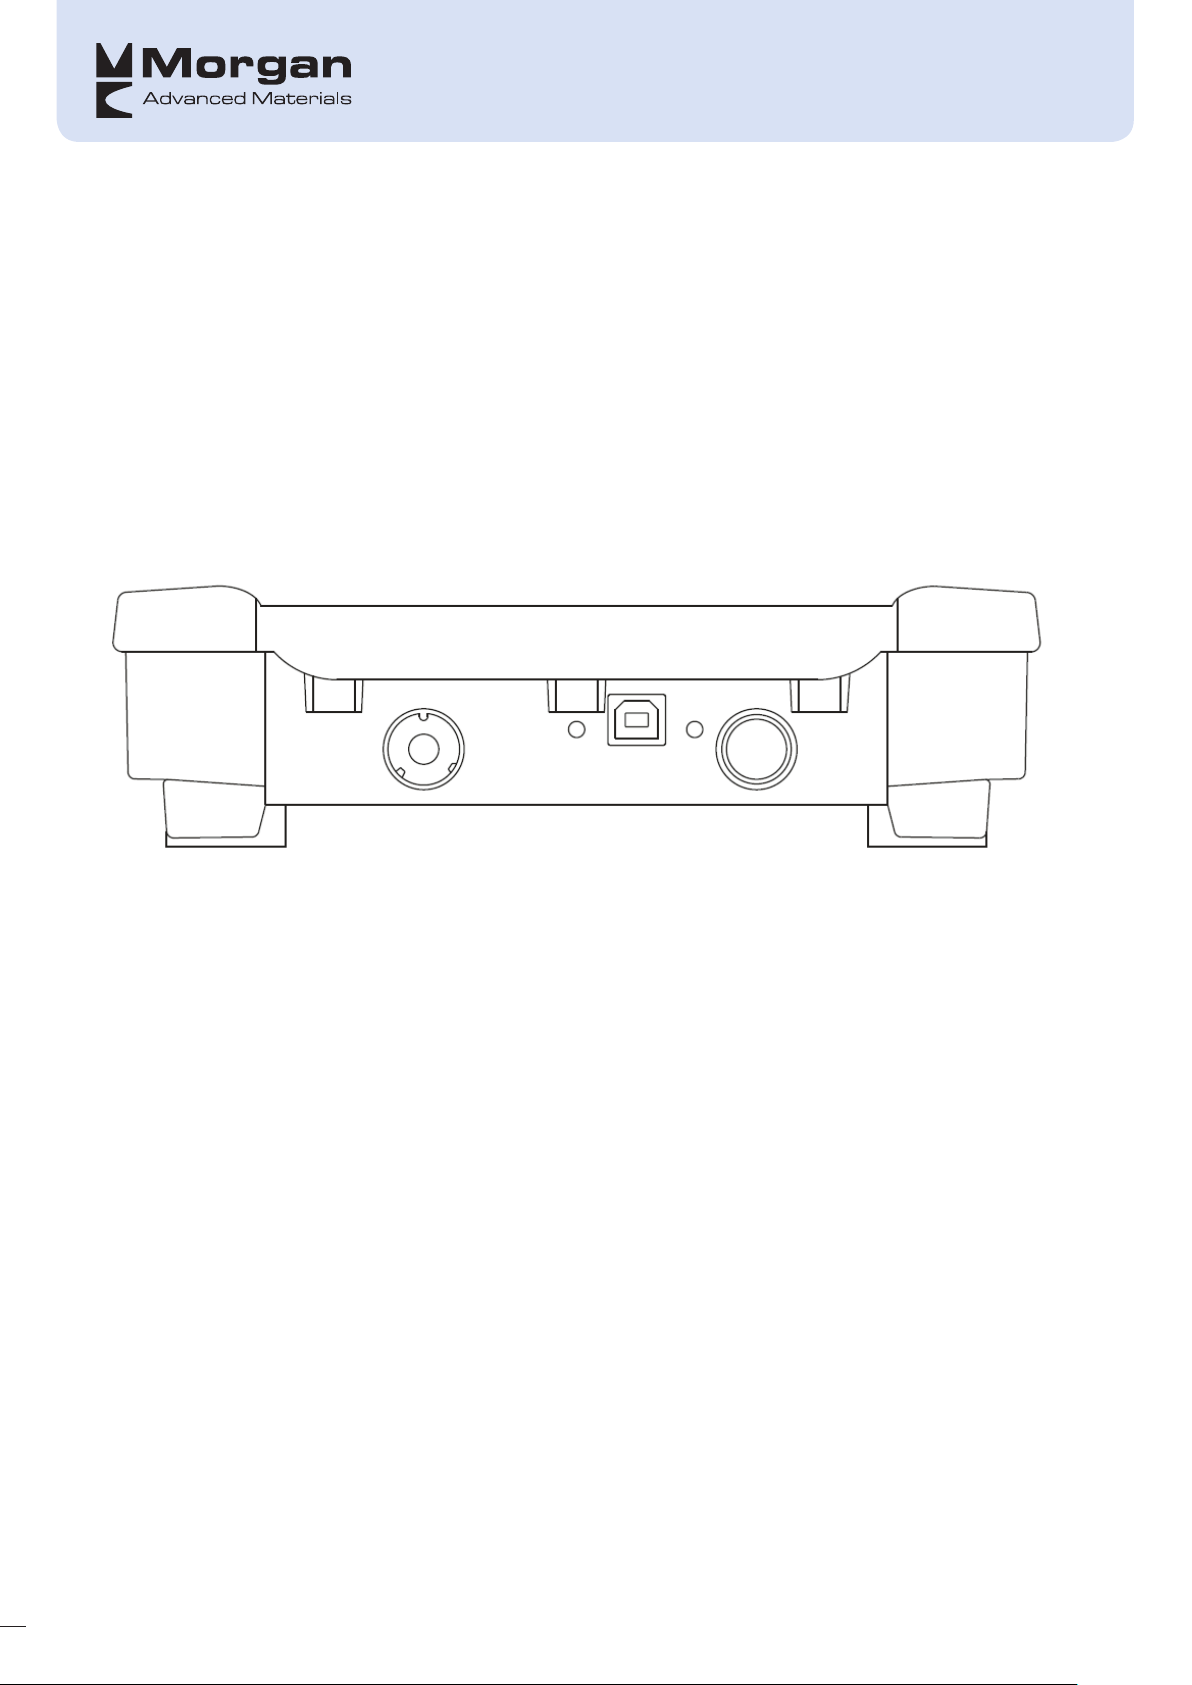
On/off button (1)
Sensor lead port (2)
USB port (3)
LED display showing 3 different colours: (4)
• Green = Device is on
• Orange = Device is on and charging
• Red = Device is off and charging
Standard Kit Items:
Included in the MSPro14 package which is supplied in a robust lightweight case including:
• Data Acquisition Unit (the measuring box)
• USB stick containing this manual and latest PC software (DASPro14 - Data Analysis Software)
• Sensor
• Protective Sensor sleeve and sensor spacer set
• USB cable
• AC power adaptor
• External Battery
• G (or C)-Clamp
• Flashlight & pen
3
Page 9
RECOMMENDATIONS
Read this manual prior to installing the software and using the device for the first time. All instructions
included in the manual must be followed.
Remove any loose dirt/debris from the collector surface prior to taking a profile and always ensure that the
sensor head is clean before taking any readings as this could affect the results of the profile severely. Use a
clean, lint free cloth for this, for example, spectacle lens cleaning cloths
The sensor head is a highly accurate piece of equipment, and although constructed to withstand normal
handling, it should be treated with care at all times. The sensor should always be stored in its supplied
sleeve when not in use.
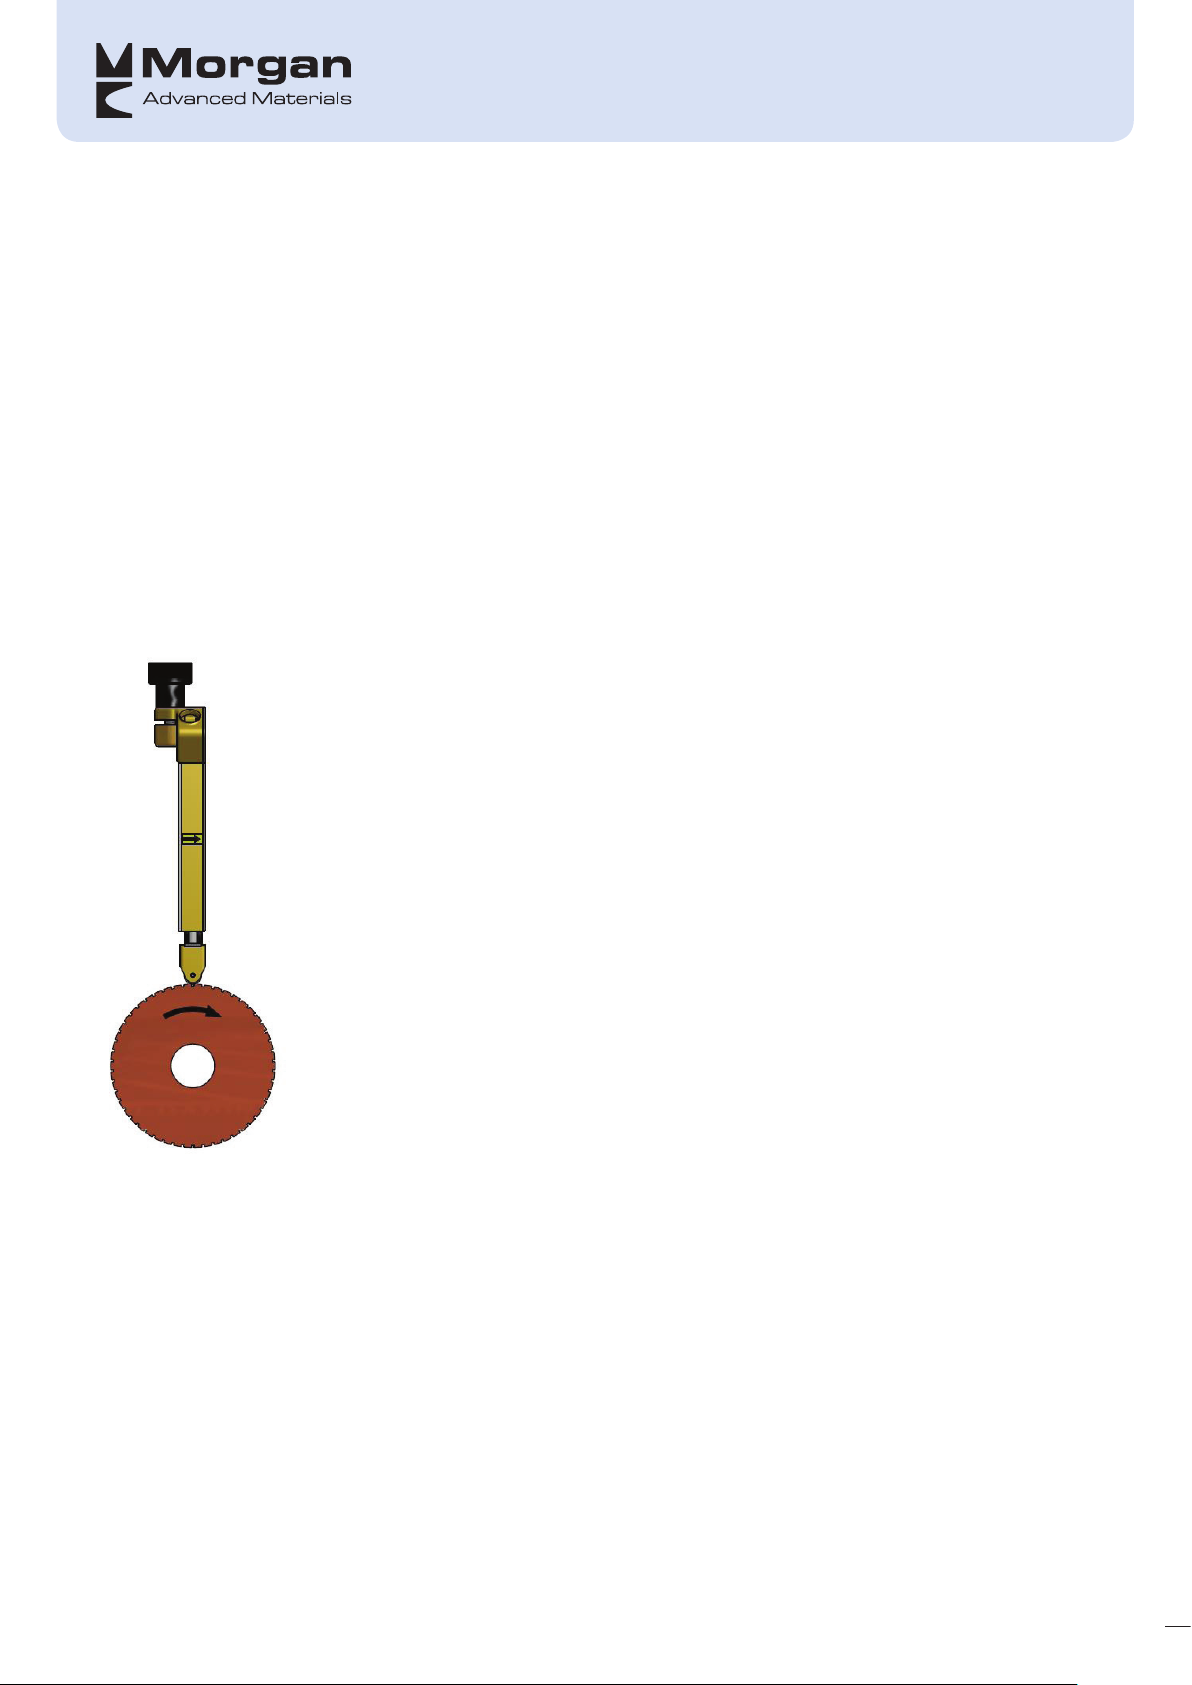
When recording a profile, the results will be more consistent when the sensor is mounted as radially as
possible (ideally ±1°) and when rotated in the direction as indicated in the figure below.
Under no circumstances should the sensor be clamped directly – it should always be fitted in a holder or
sleeve and the sleeve held in place with a clamp.
It is recommended that the sensor is calibrated every 12 months – this can either be done by sending your
MSPro14 to your local Morgan Sales office or directly to Morgan Advanced Materials Netherlands.
4
Page 10

FIRST TIME USE
Minimum PC requirements:
• Operating system: Windows XP or higher
• Minimal 100MB of free disk space
• Minimum of 1GB RAM memory
• One free USB 2.0 port
Once connected to a PC using the USB-cable, the Measuring Box reports itself as new USB-device. The
Measuring Box may be accessed using a Windows File Explorer standard program. This enables the user to:
• Access files stored in the Flash memory of the Measuring Box (note that each measurement results in
one file)
• update the Measuring Box software
5
Page 11

Registration of software on 1st use
Insert the supplied USB Memory stick into the PC and open the file; double-click on the software link which
looks like:
Follow the on-screen instructions; if there are any warnings displayed regarding the software installation
which could depend on your PC configuration, then press “Yes”, however, if in doubt always contact your IT
administrator.
Press “I agree” to continue
6
Page 12
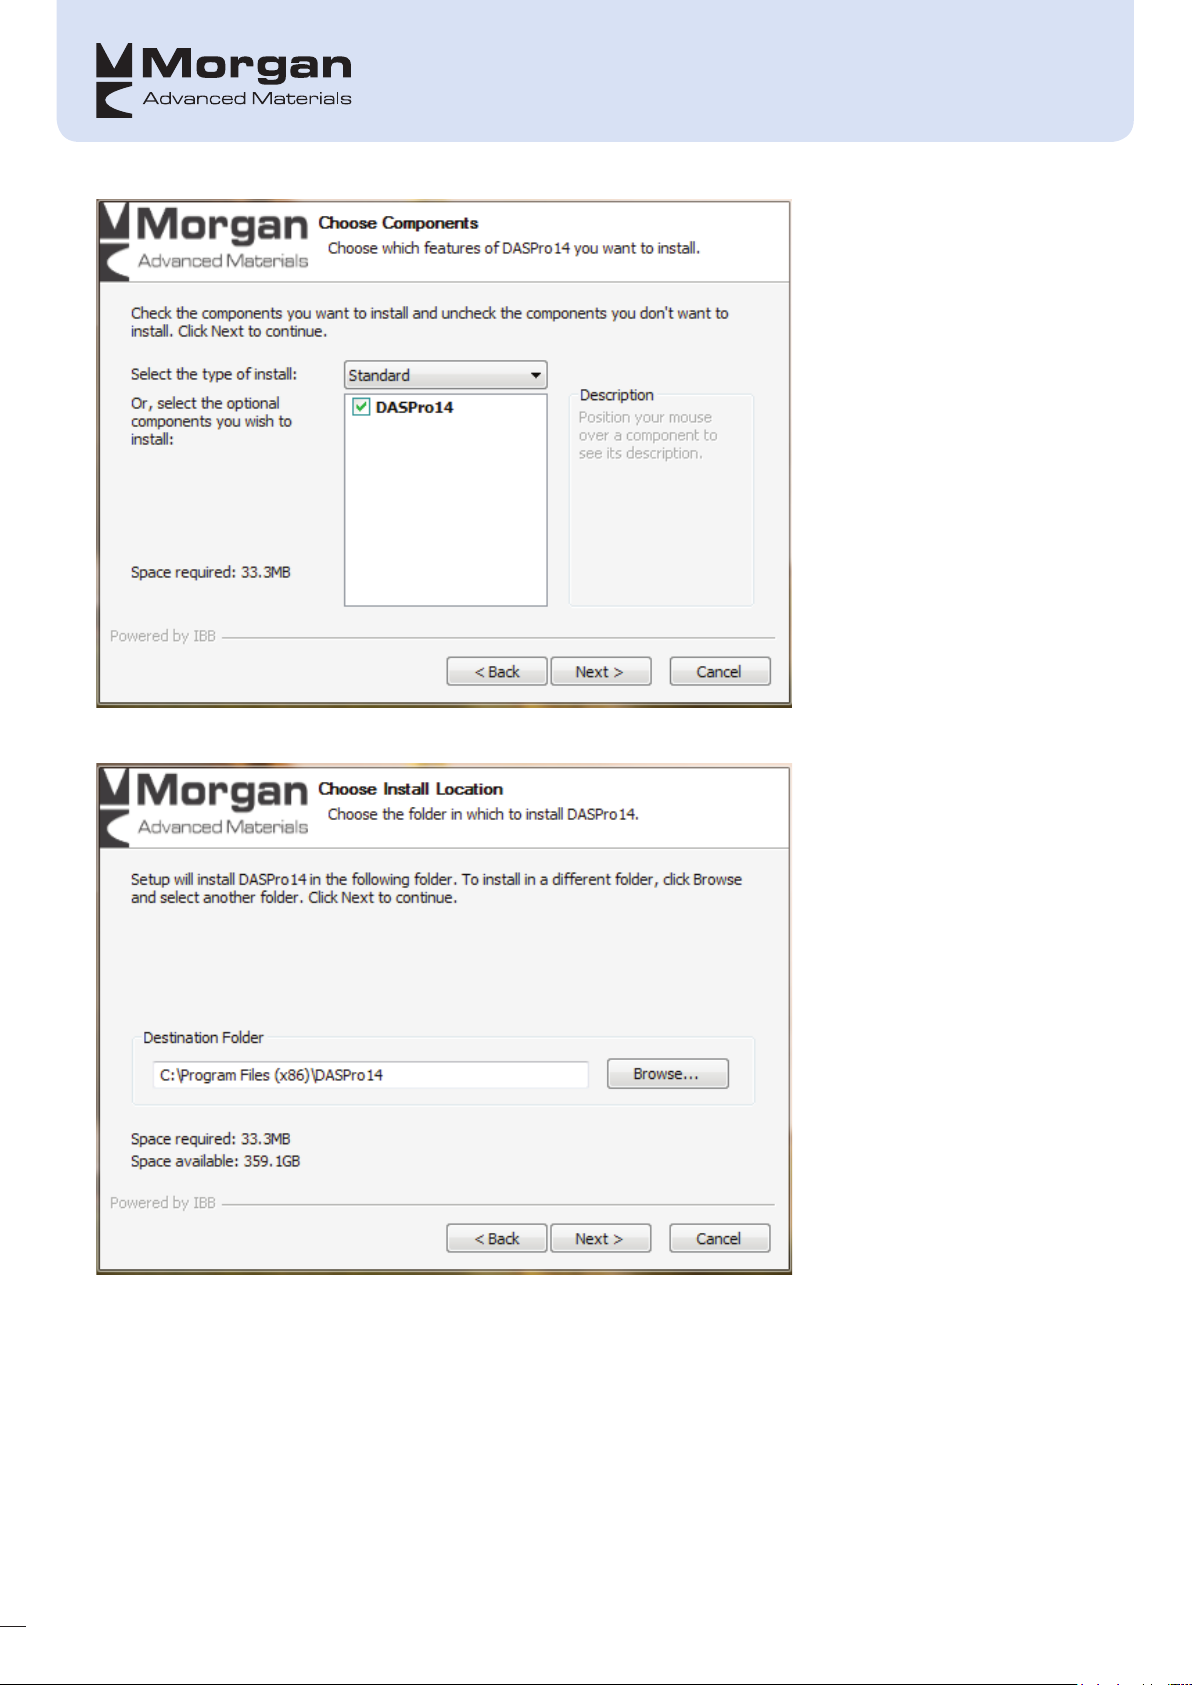
Click Next
The default file location is selected; however, change if you require and click “Next” to continue
7
Page 13
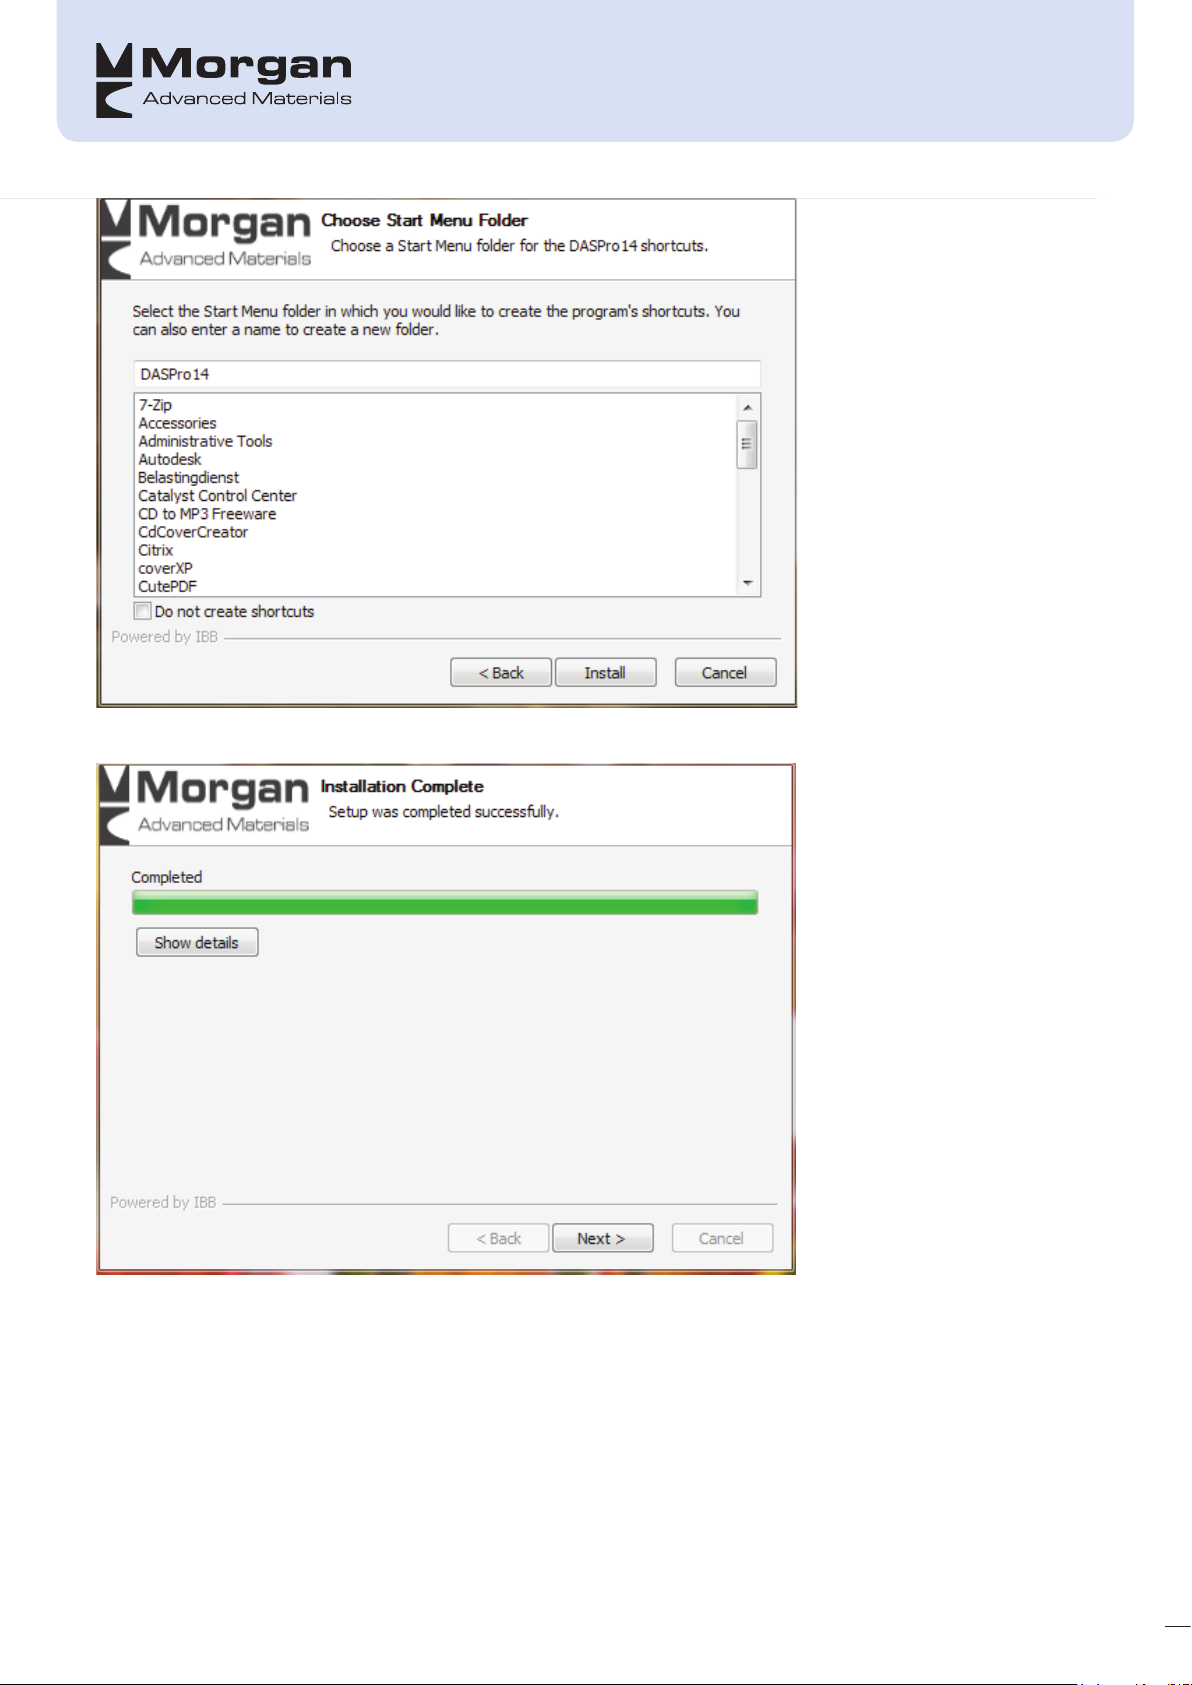
Once details are correct, press “Install”
Once installation is complete, press “Next”
8
Page 14
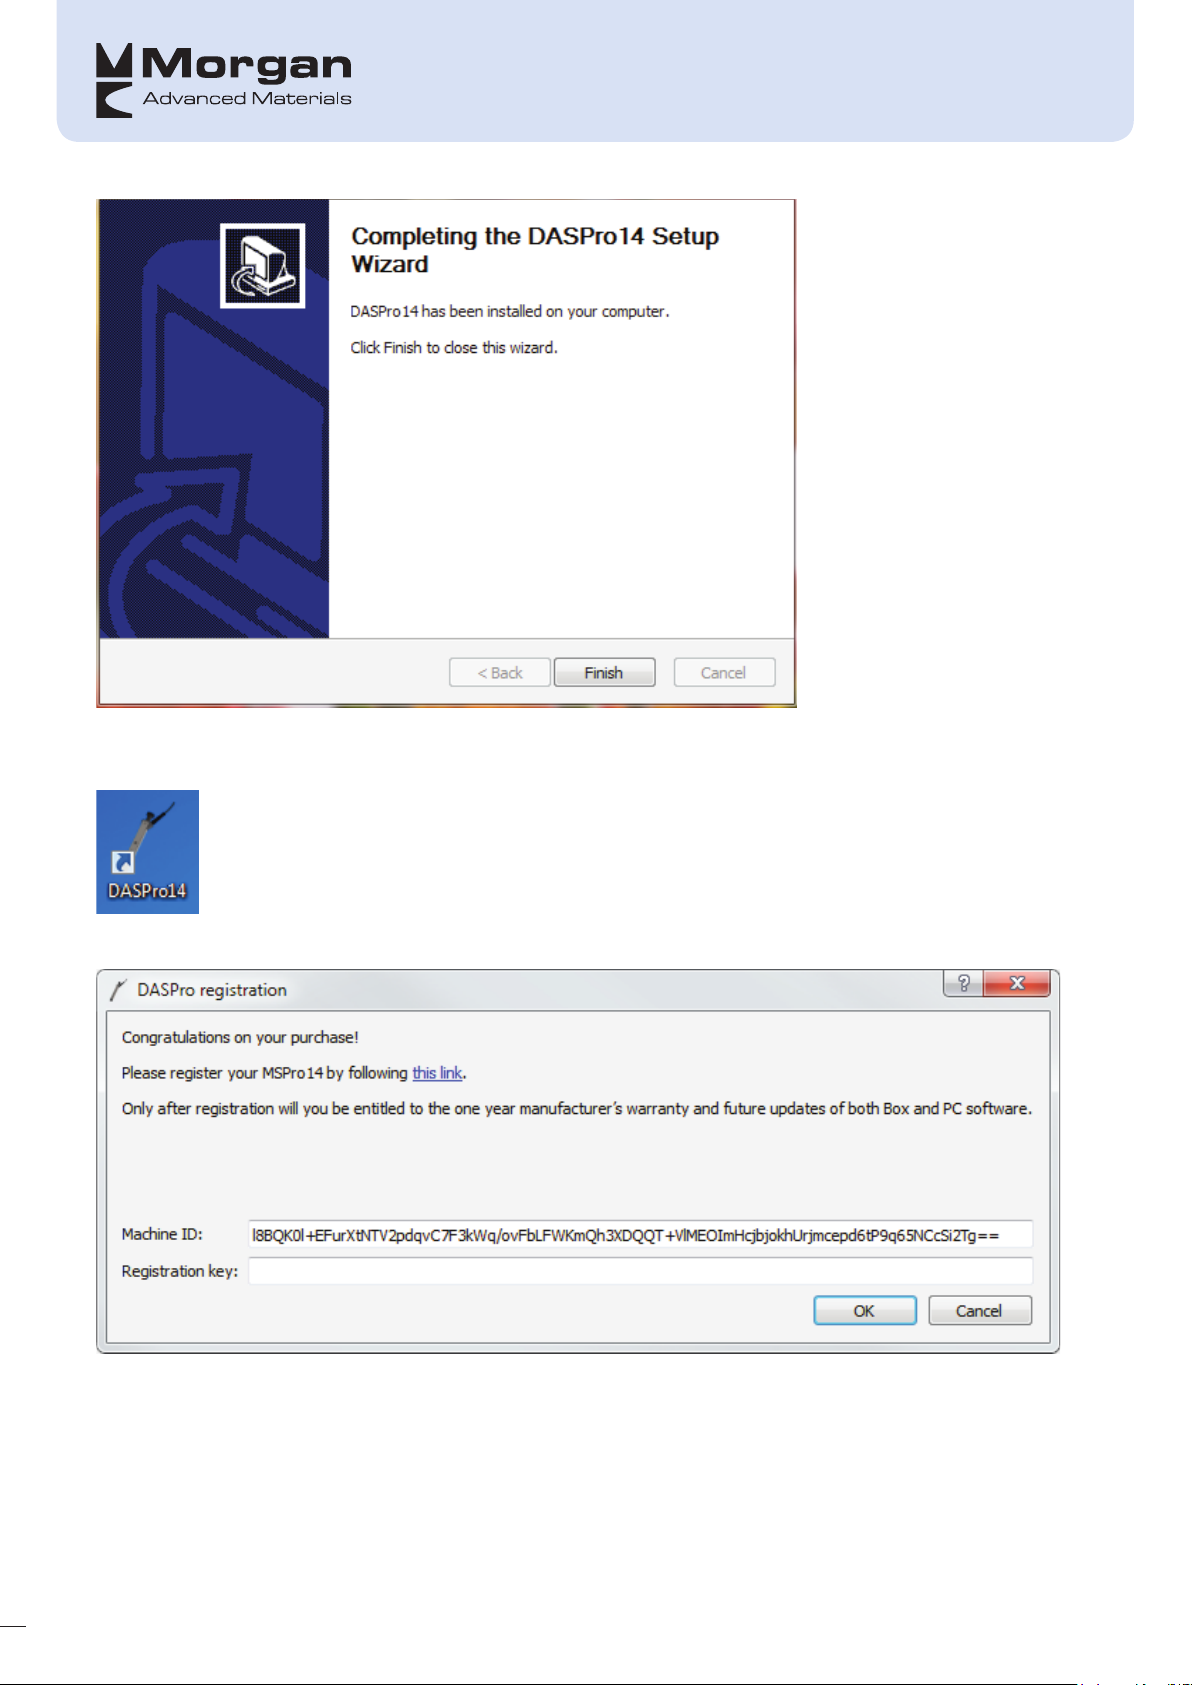
The DASPro14 software is now ready to be registered prior to first use and can be done as follows:
Double-click the link shown below which should be on your PC desktop:
This will then open the following screen:
If a registration key is already known, enter it in the appropriate field, else click the link which opens a
webpage:
9
Page 15

http://www.morganelectricalmaterials.com/mspro14-registration-form
Once the necessary fields have been completed the submit button should be pressed and this will
automatically send an email to: [email protected] so that a registration key can be sent
back to the user.
Once the registration key is received enter it in the appropriate field and press “OK” and the software will
open accordingly.
10
Page 16

Software update procedure
Software updating will not be done automatically. The procedure for doing this on both PC-software and
MSPro14 Box is as follows:
• The user will receive an attachment in an email sent to the address used for registering the PC software
or is instructed to download it from a specific server.
• Measuring Box:
– Connect the measuring box to the PC or Laptop.
– Copy the update file to a specific folder on the measuring box.
– Disconnect the box from the PC or Laptop.
– Restart the box to perform the update.
• PC software
– Follow on-screen instructions as in the initial installation
11
Page 17

USING THE MSPRO14 MEASURING BOX
First, connect the sensor to the MSPro14 measuring box then turn the unit on; wait for it to start-up at which
point you will see the following screen:
The status bar will show how the loading is progressing and once loaded the Welcome Screen will be
displayed.
12
Page 18
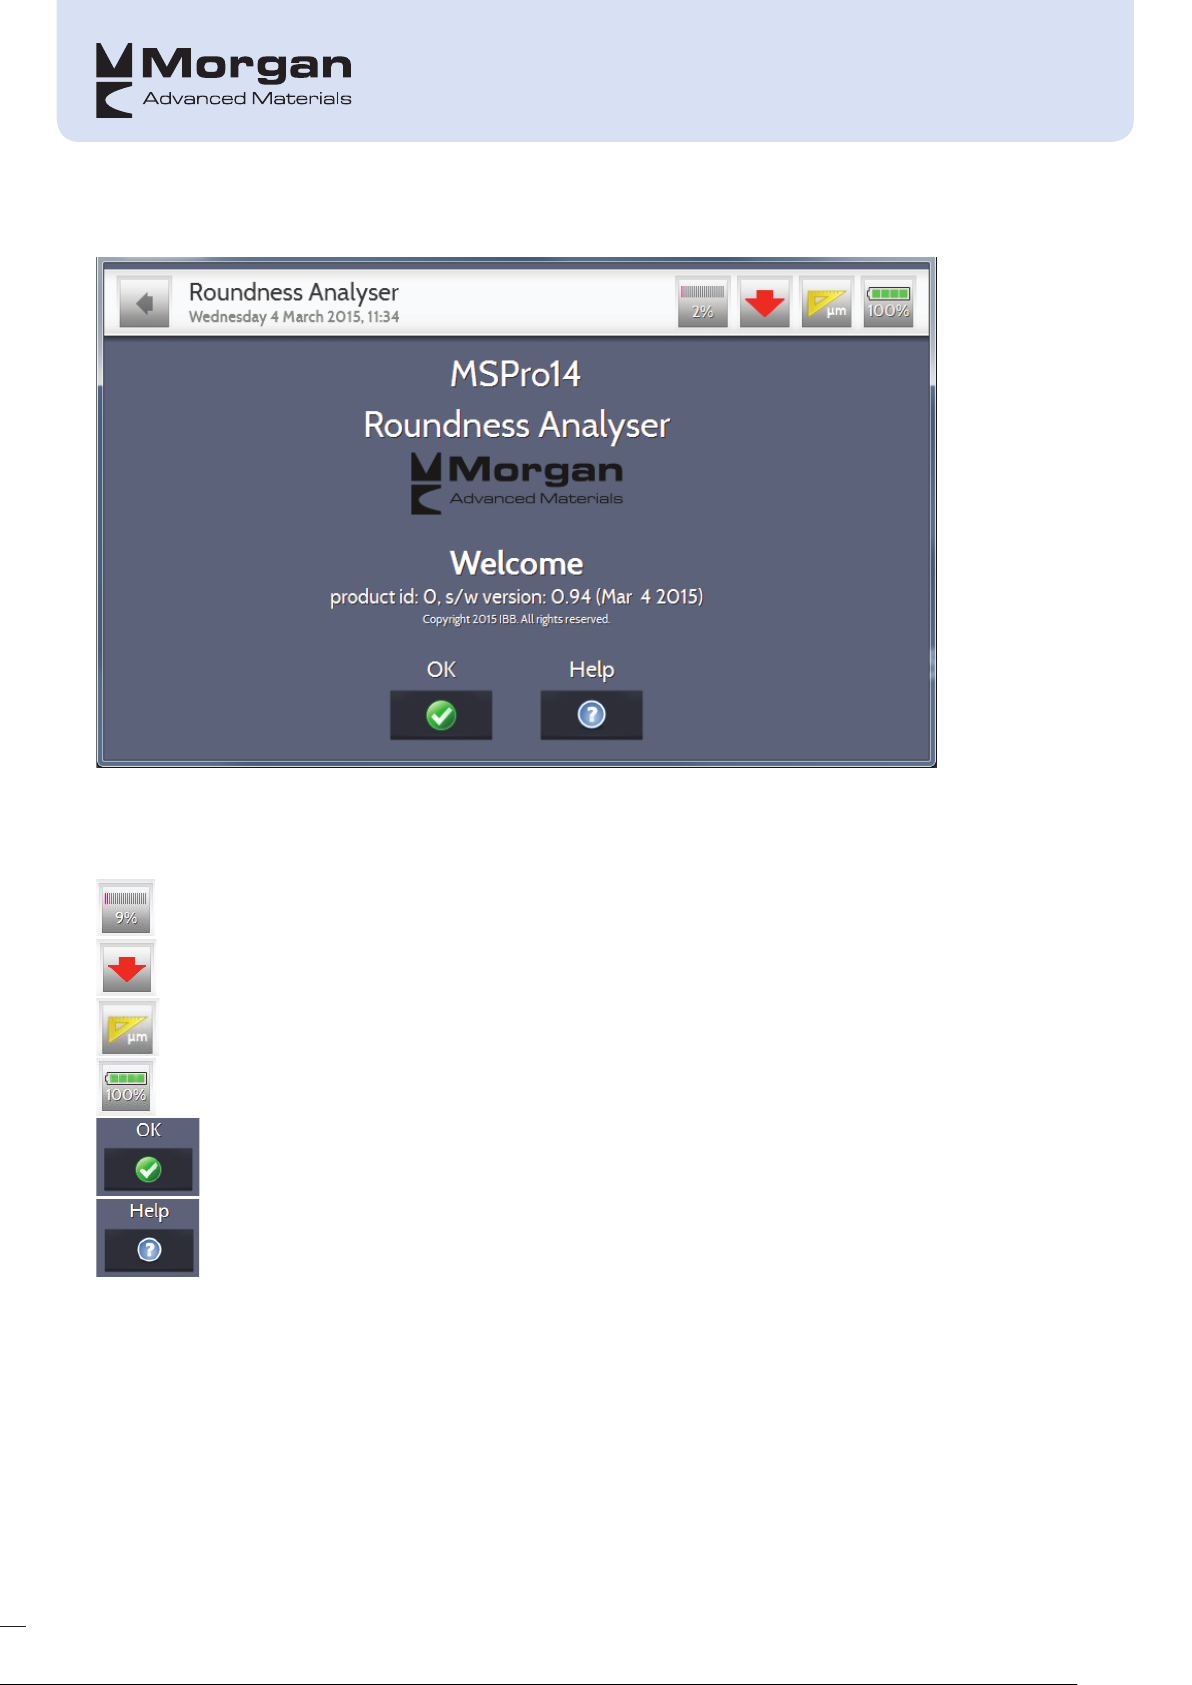
Welcome Screen
This screen shows both the MSPro14 product ID and box software version.
The symbols on the top of the screen mean the following:
The size of the memory will be at least 30 Mbyte. This should be enough to store at least 250
datasets
Sensor position
Units currently set on box – either metric or imperial
Battery life
Press ok to continue
Help
.
13
Page 19
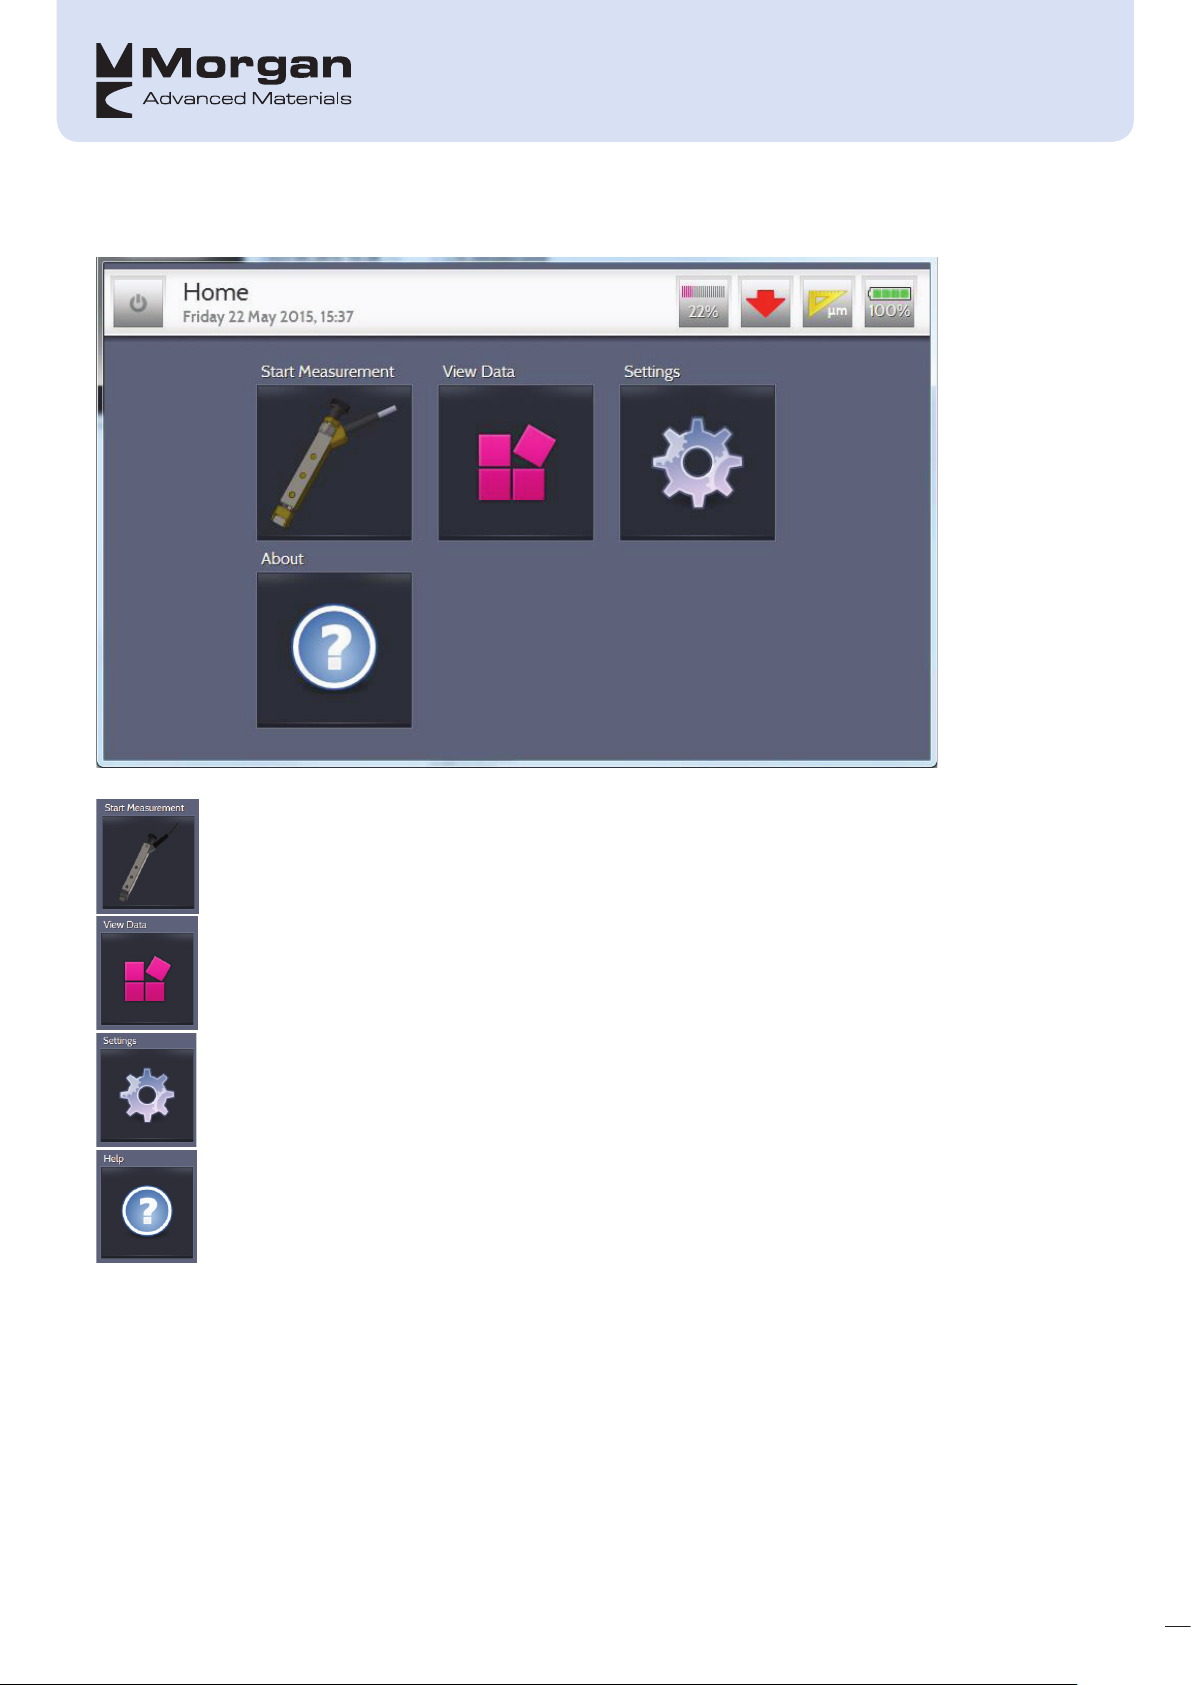
Home Screen
There are 4 options to use:
Start Measurement
View Data
Settings
Help
14
Page 20
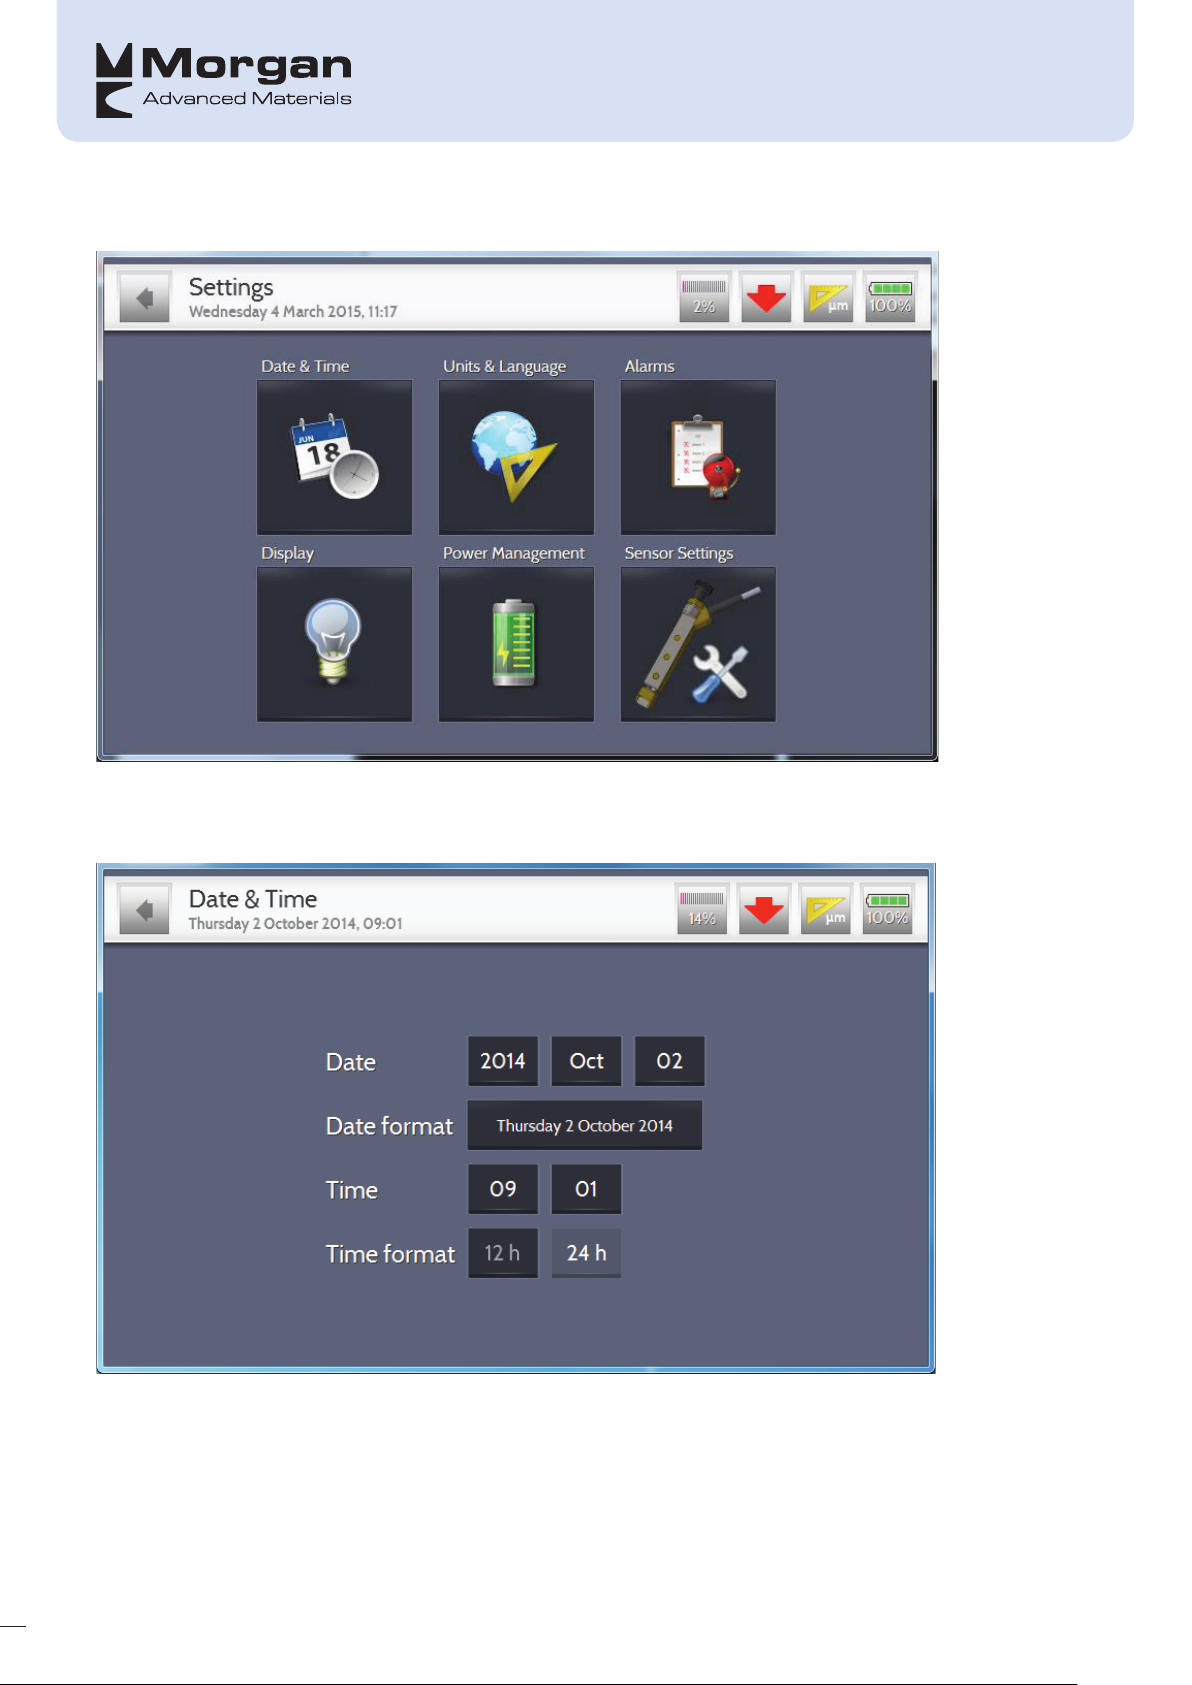
SETTINGS
From this screen you can alter 6-off different settings:
Date & Time
15
Page 21
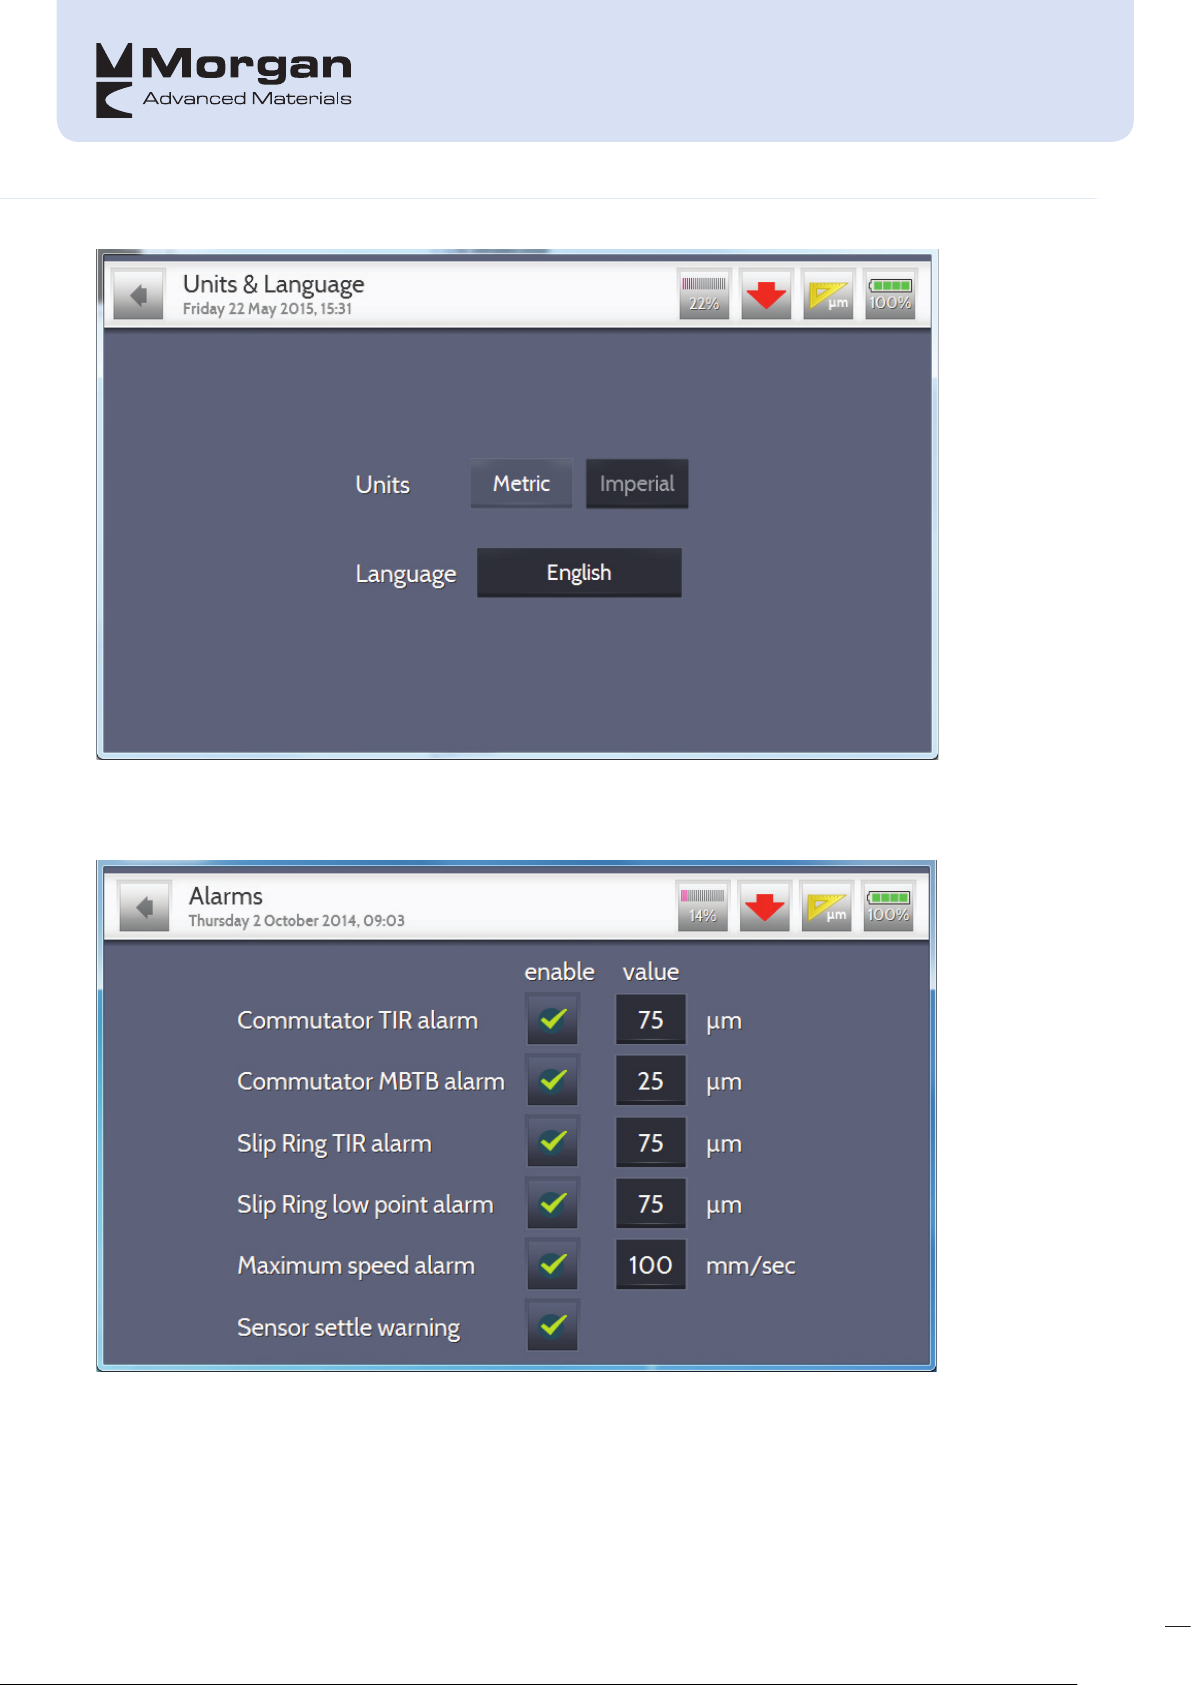
Units & Language
There are 5 different languages to choose from: English, Dutch, French, German and Spanish
Alarms
Alarms can be set depending on the tolerances you require
16
Page 22
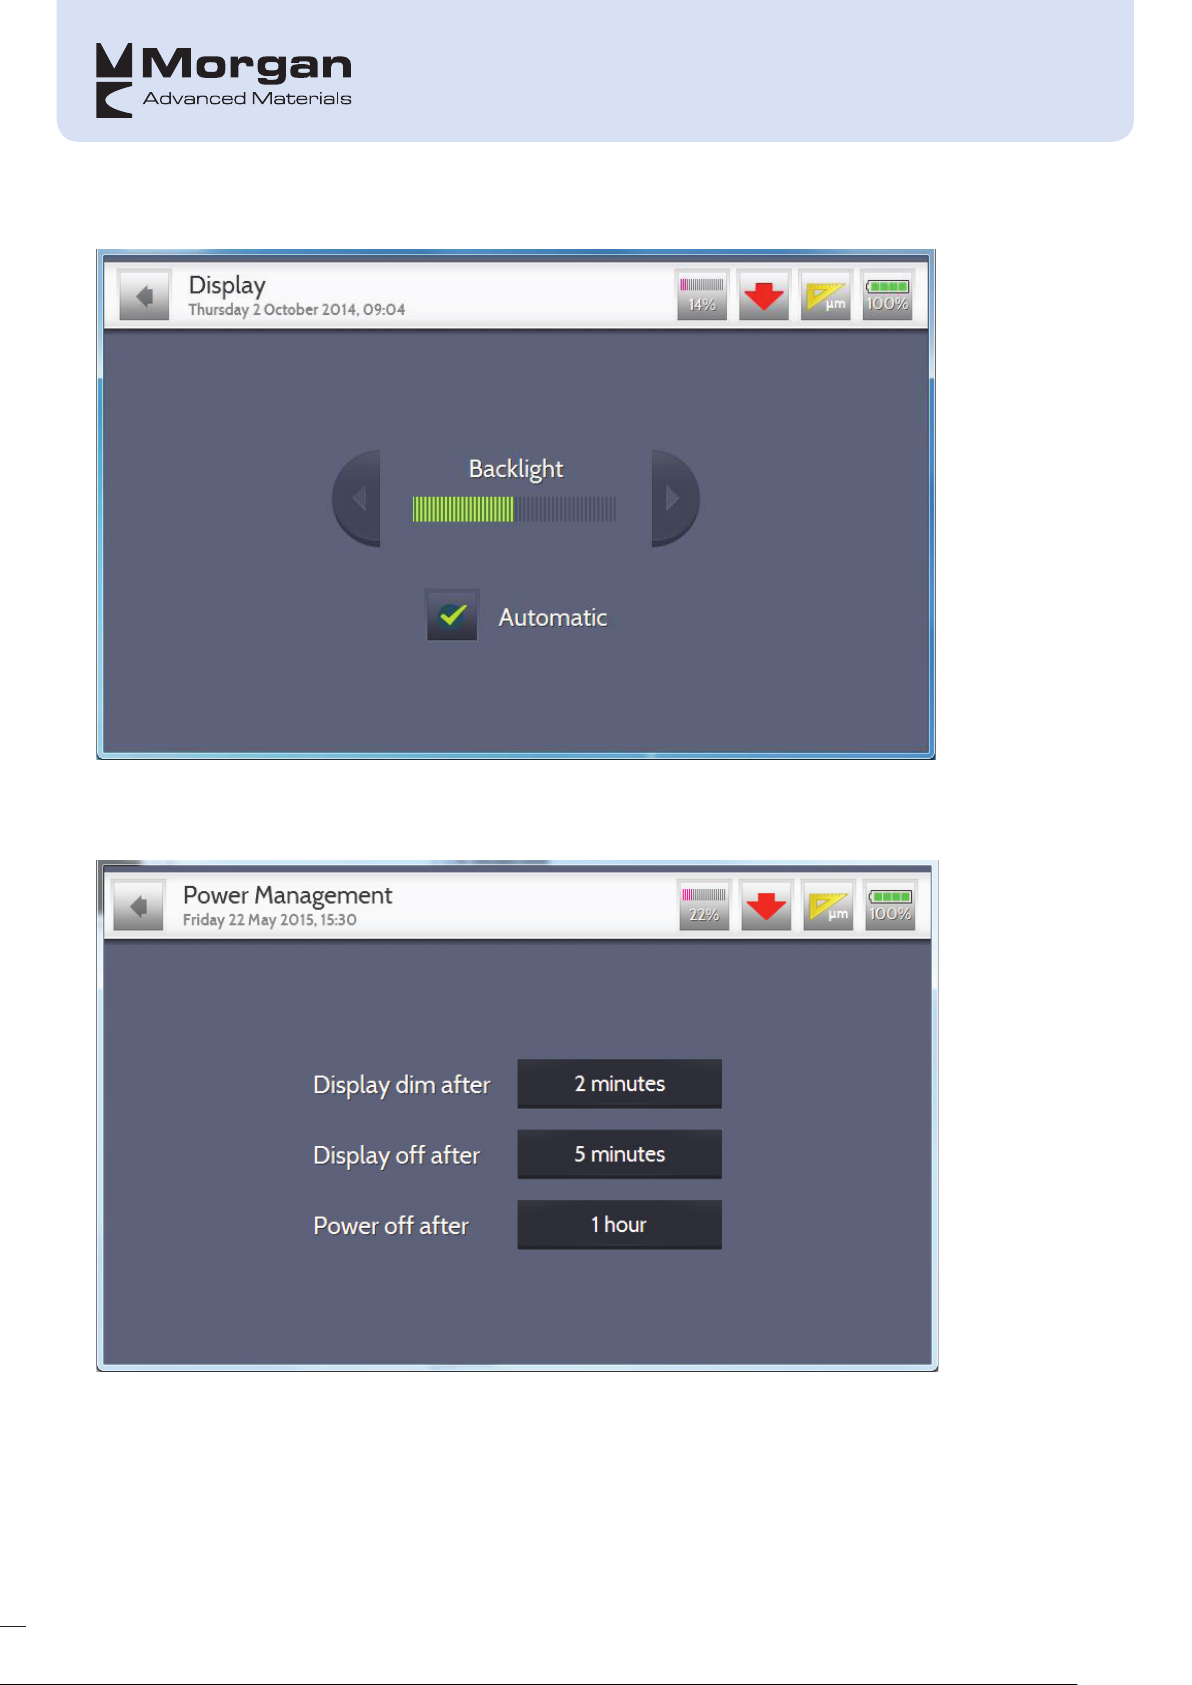
Display
Brightness can be automatic or user defined
Power Management
17
Page 23
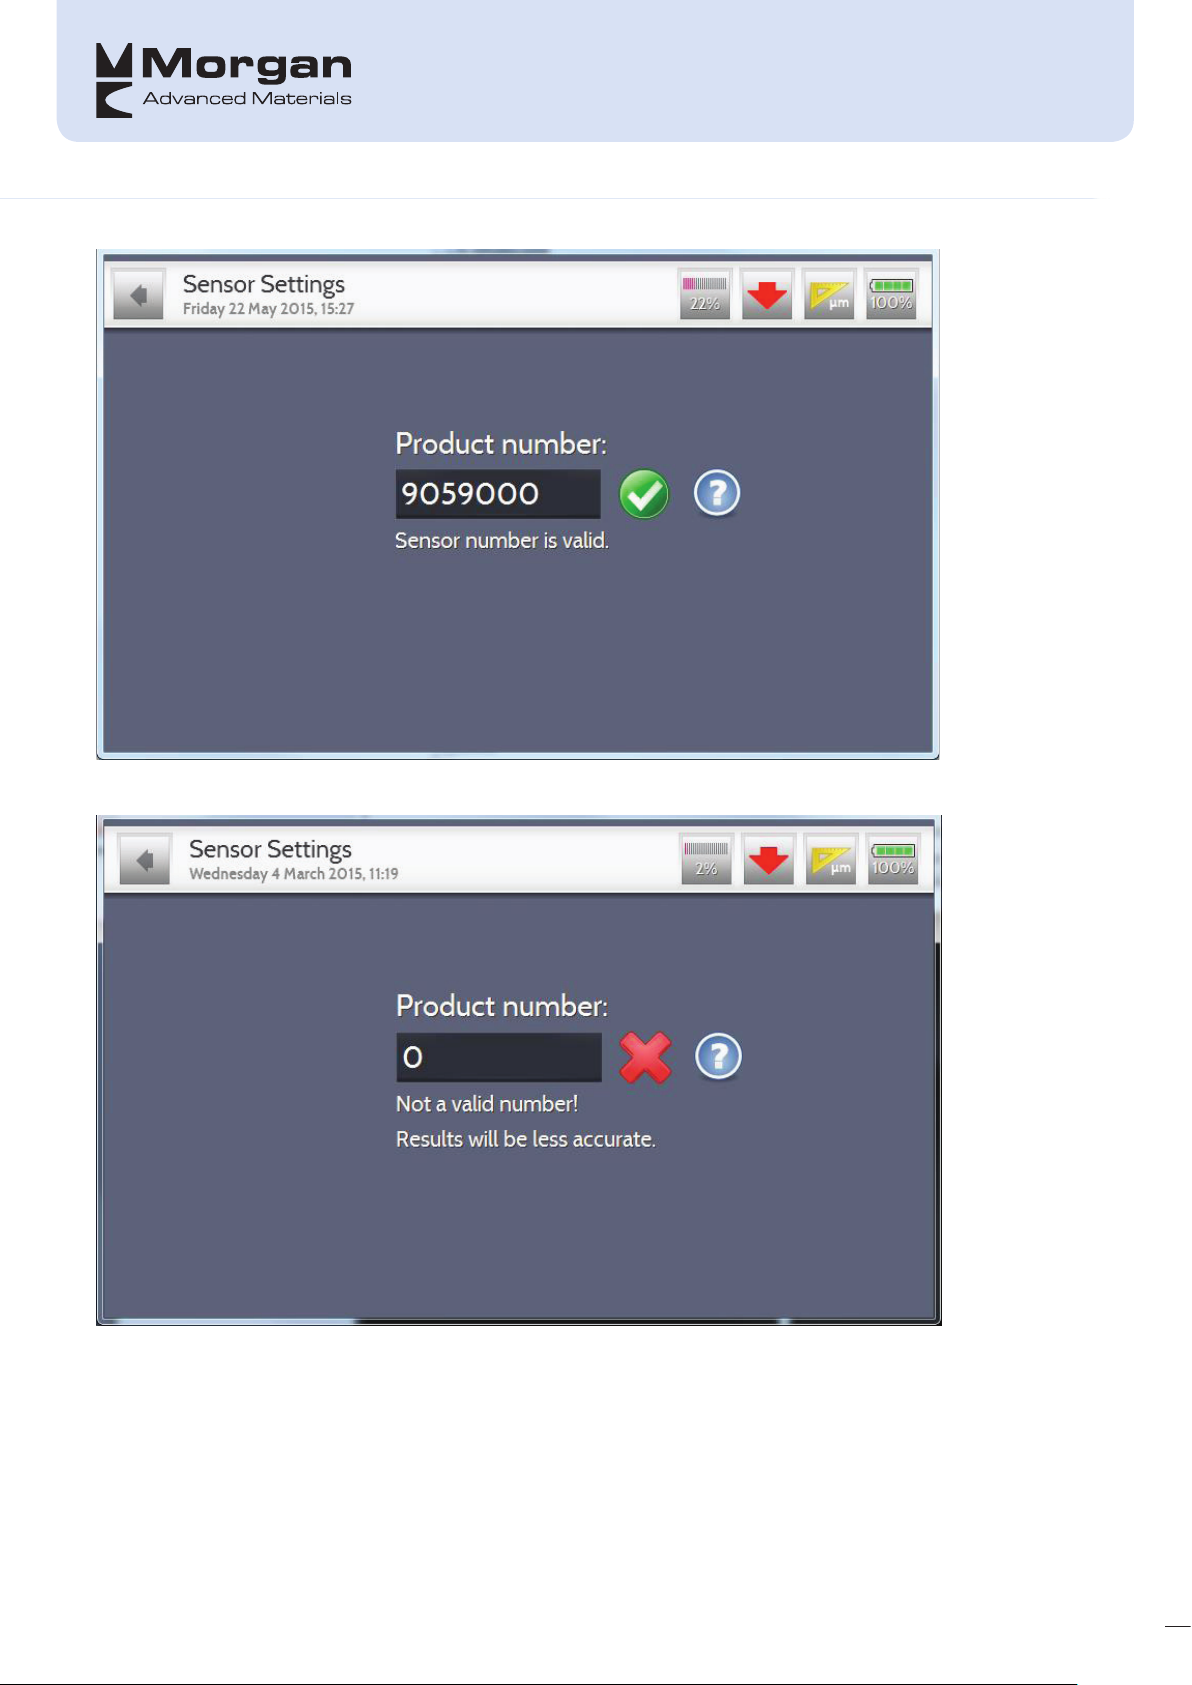
Sensor Settings
This will display when the sensor number is correct
If the sensor number is not valid or entered then this is shown
18
Page 24
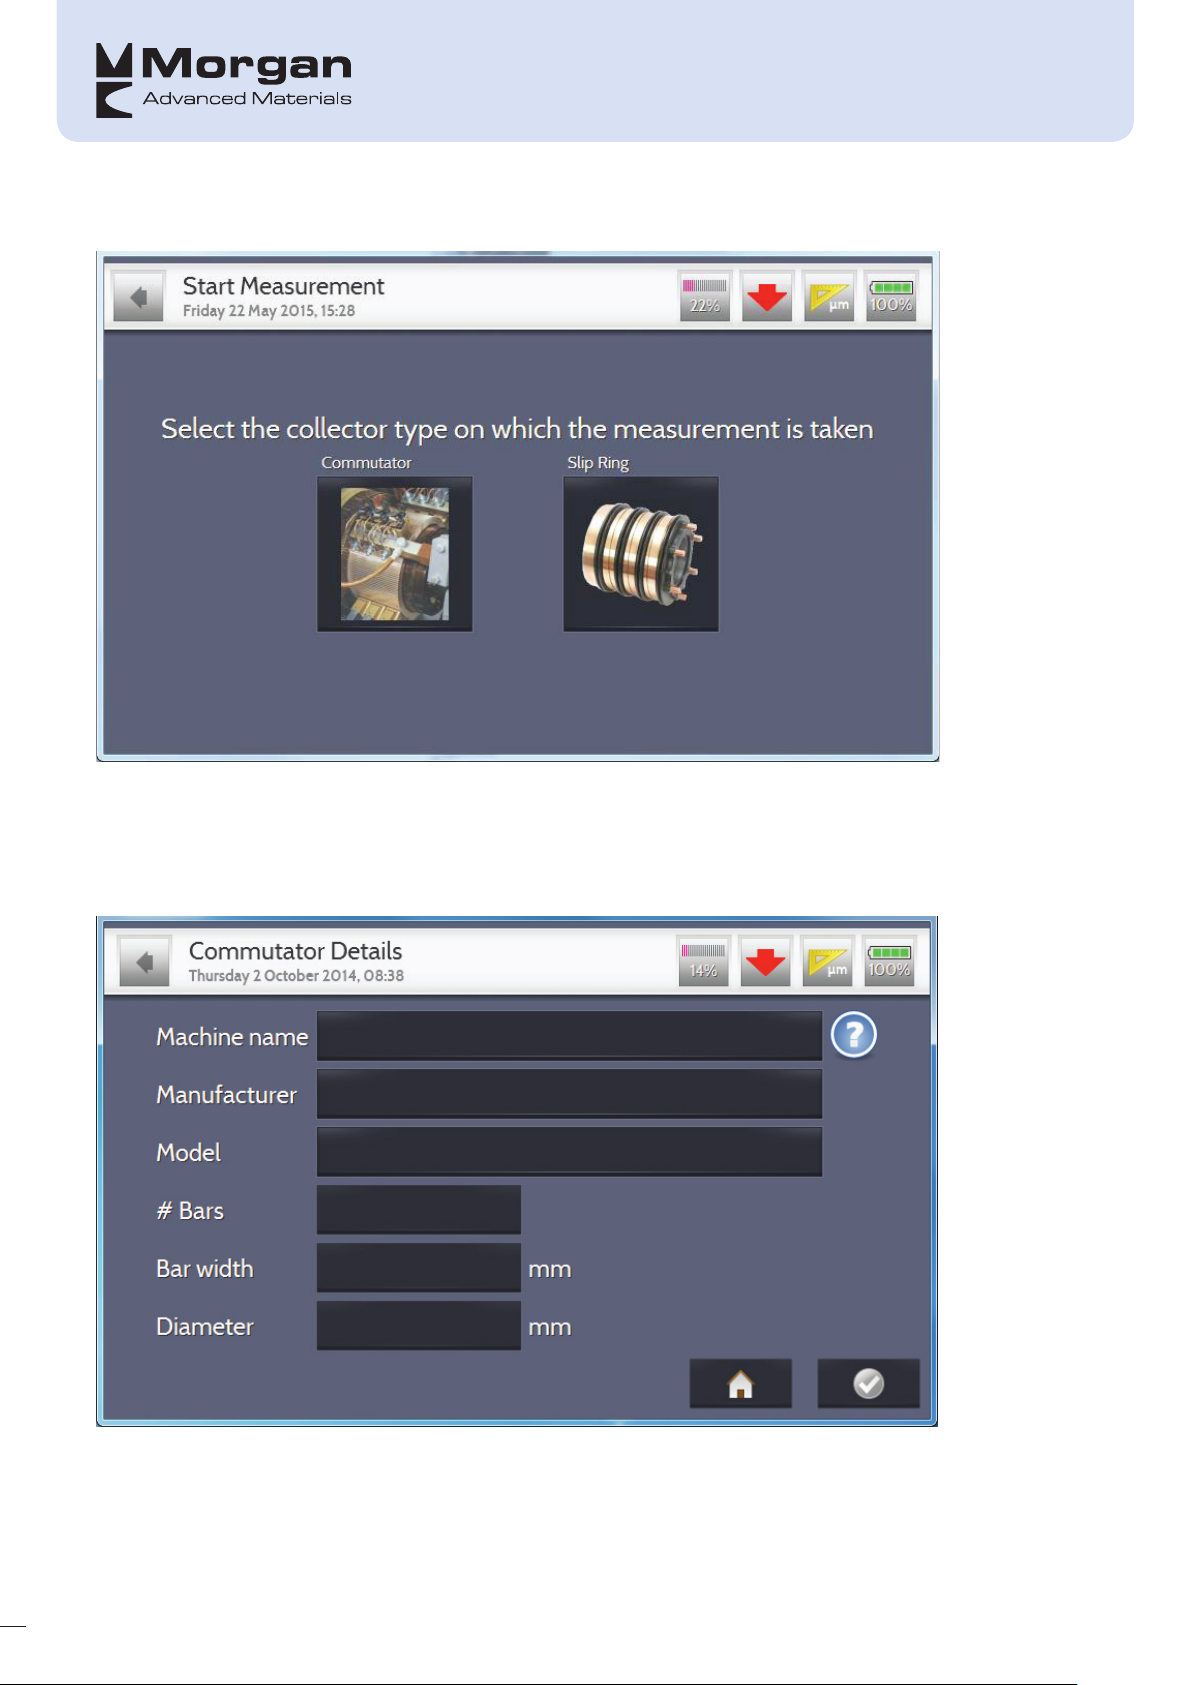
START MEASUREMENT
Once you decide to take a measurement you must determine the type of collector on which the profile is
being taken, i.e. Commutator or Slip-ring
Commutator
19
Page 25
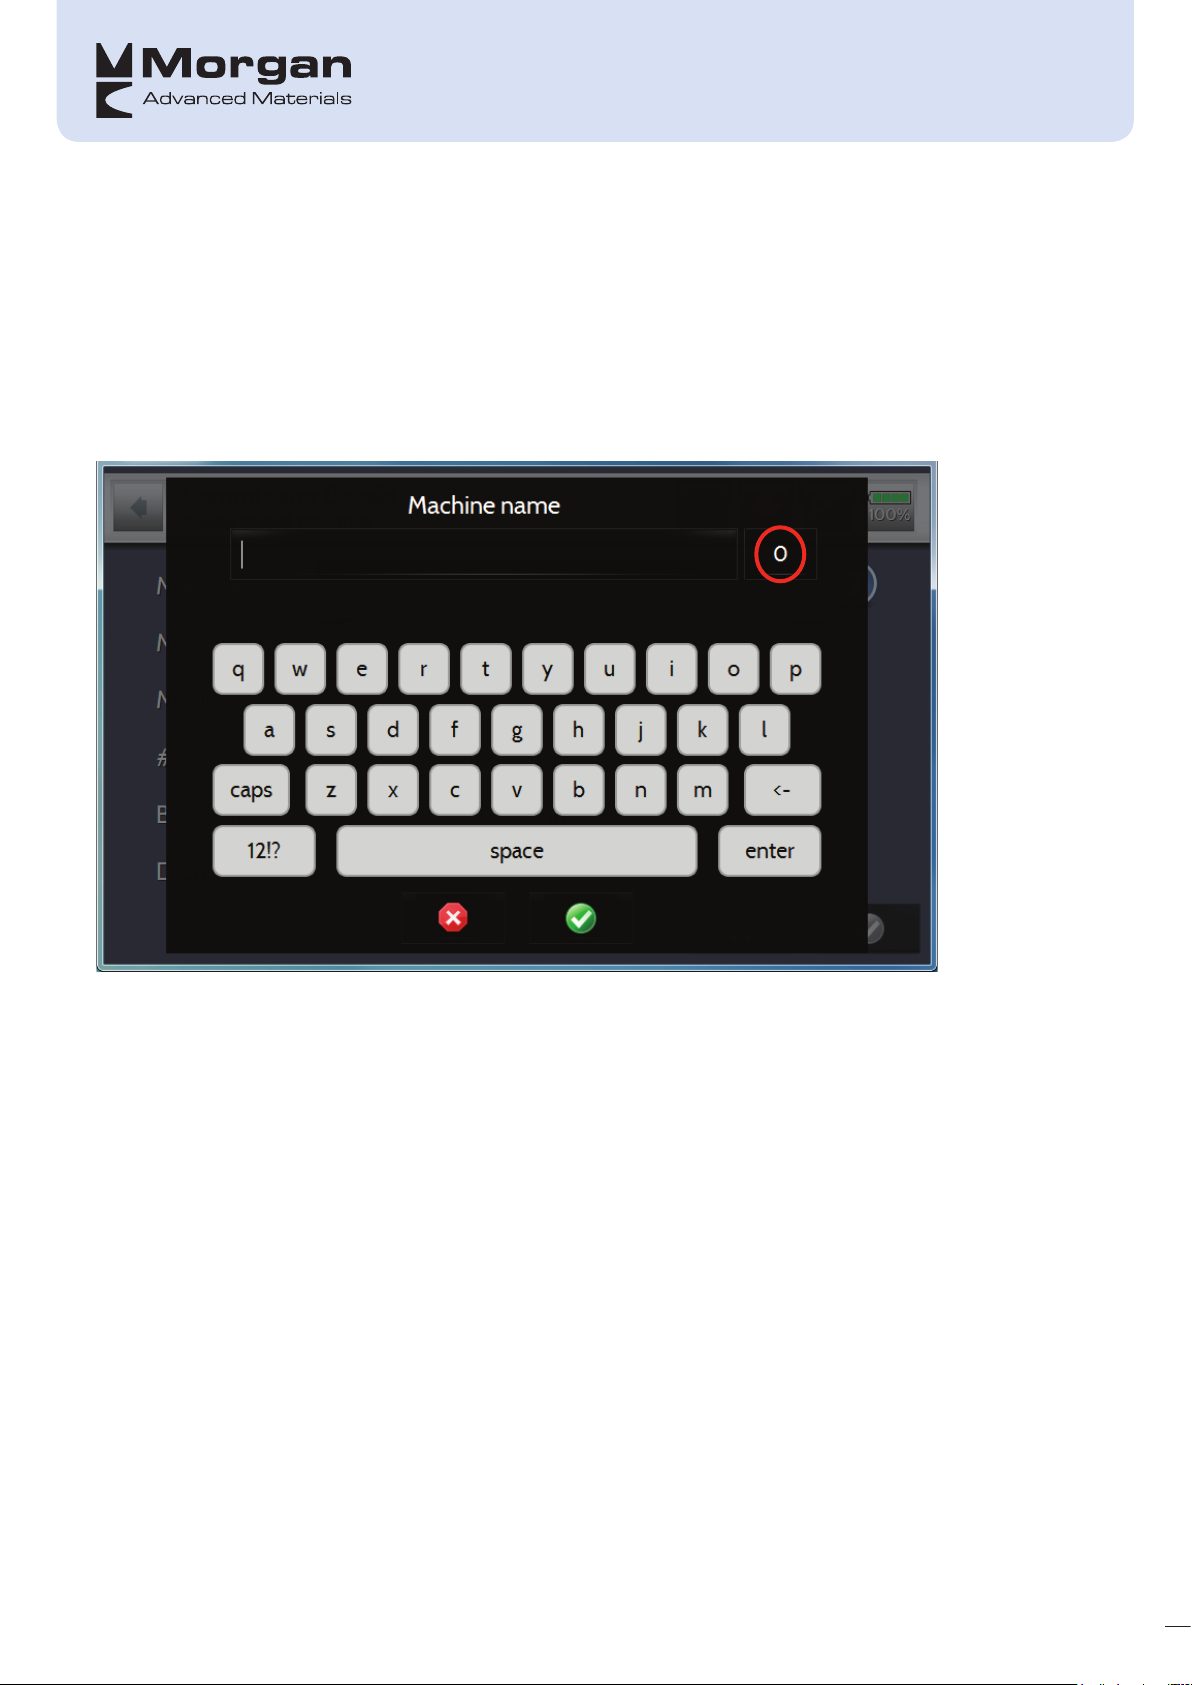
On this screen as much information as possible is to be filled in as it can be used to generate your own
company specific machine database, and in order for a machine to be saved in the database the top 3 fields
are to be completed:
• Machine Name
• Manufacturer
• Model
Also, if the number of bars is known (diameter can also be entered but is not as accurate on a commutator)
then this should be entered as it will mean that the recording will stop automatically rather than the user
having to stop the recording manually.
Enter the required information using the on-screen keypad. Note the highlighted ‘0’; if there are any
machines in your database this number will reflect that allowing you to choose the previously entered
machines – thus saving re-entering information.
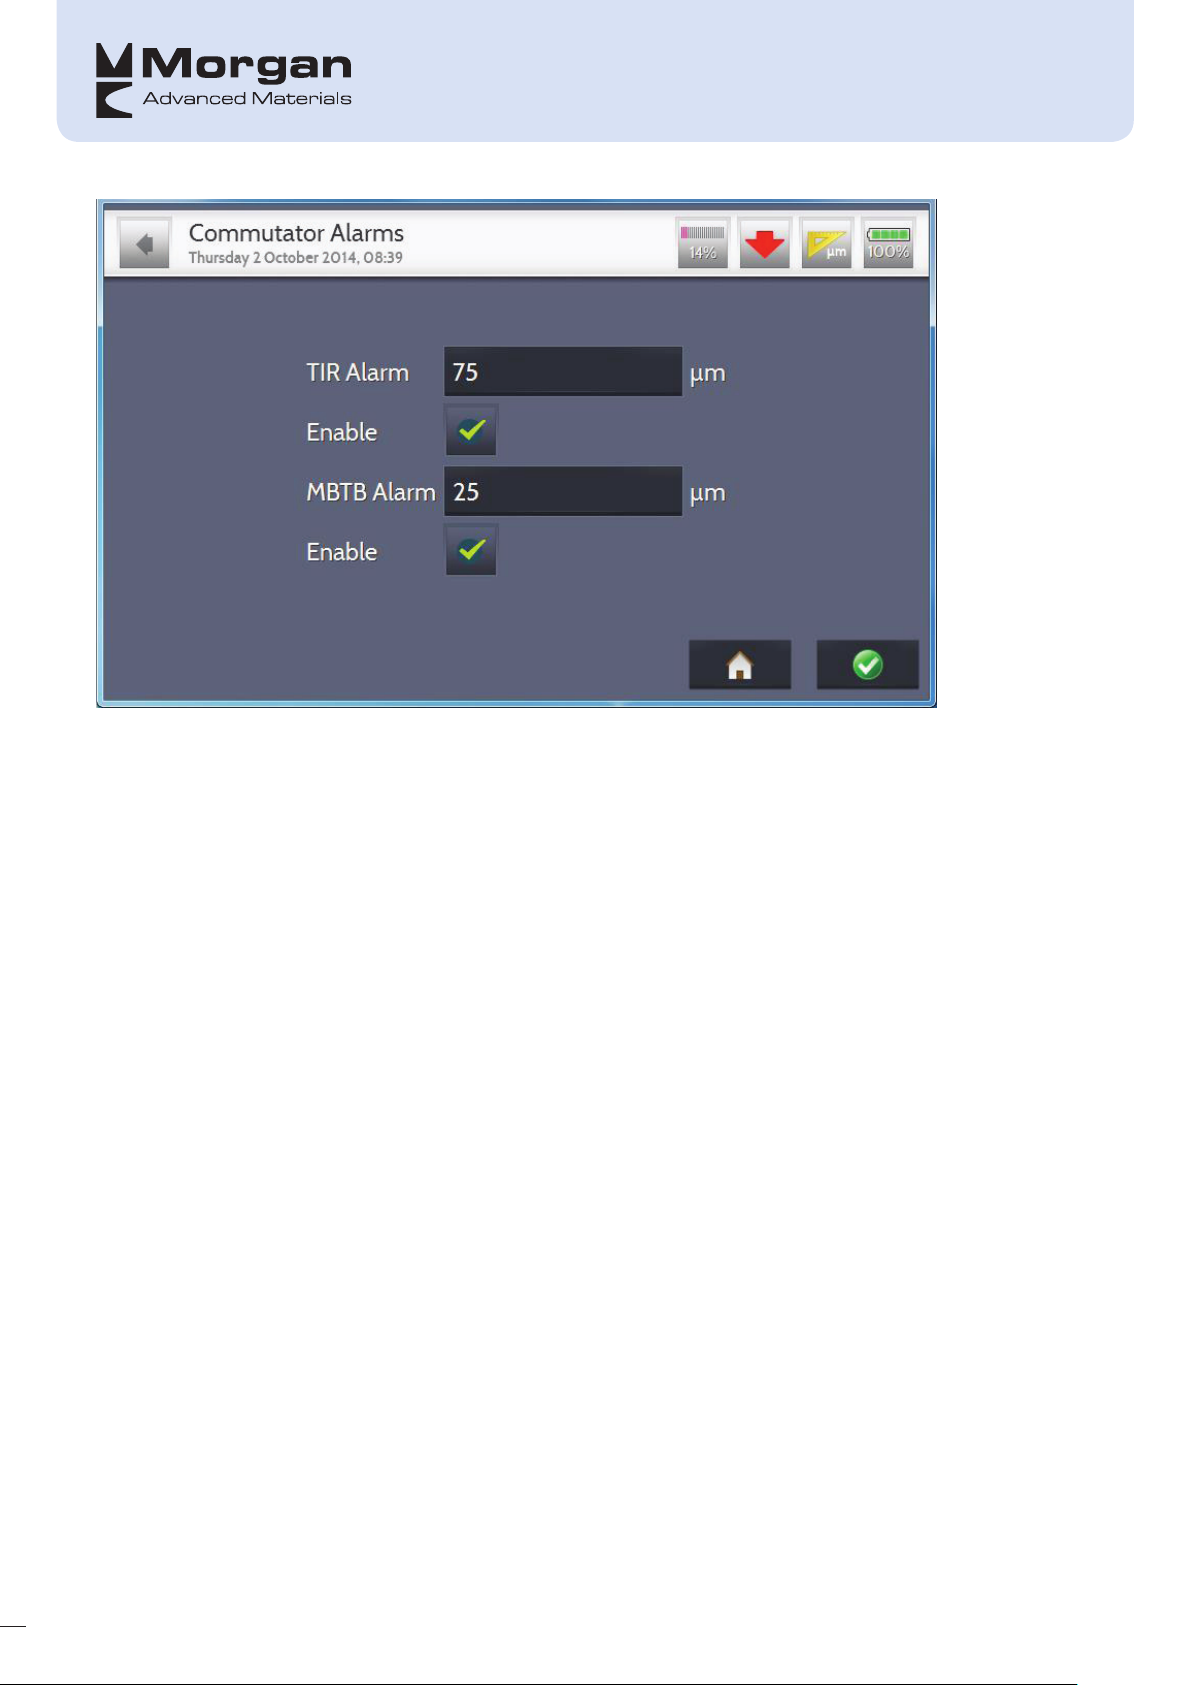
The next screen is used to determine whether you require TIR and MBTB alarms, and if so, the value at
which it is triggered; note that the default is that which is set on the Alarms page previously described.
20
Page 26
Setting the Sensor
The sensor has been designed so that for the greatest measurement range the sensor head
positioned mid-way through its travel, i.e. 3mm (118mil) in real terms, out of a possible 6mm (236mil). The
ideal displacement is 0.00mm (0mil) however anywhere between ±0.2mm (±8mil) can be used as a start
point. In order to fit the sensor the following needs to done:
• Loosen the clamp knob counter-clockwise so that the clamp is as flat as possible.
• Fit the sensor into the chosen empty brush box or sleeve along with any required packing pieces (or
custom made holder) but do not tighten fully at this stage. Care should be taken to ensure that the sensor
is fitted as square as possible in the brush box and if a commutator is being profiled (ideally) in the centre
of a bar not in the gap between bars.
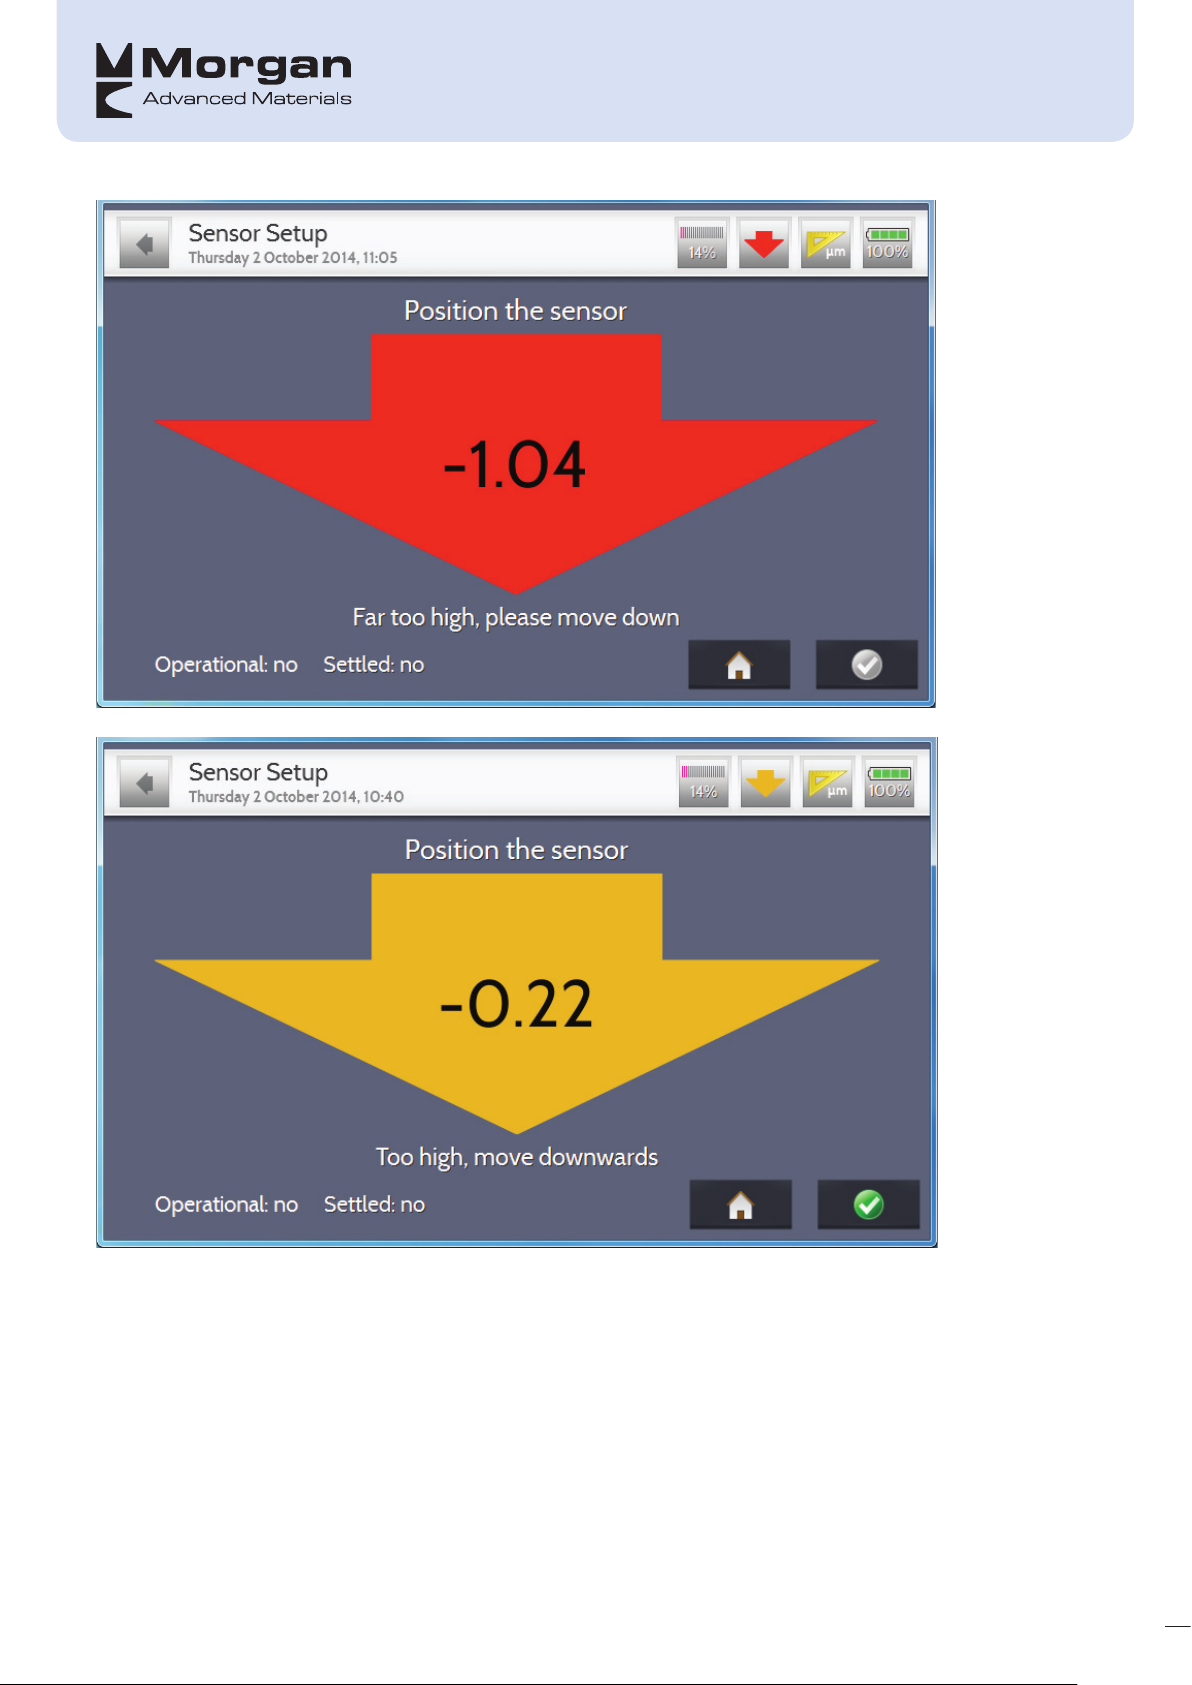
• The sensor must be located in the brush box so the display reads ±0.2mm or ±8 mil or less; this will be
highlighted by the screen displaying either red, amber or green icons – with appropriate text
accompanying the icon:
should be
21
Page 27
22
Page 28
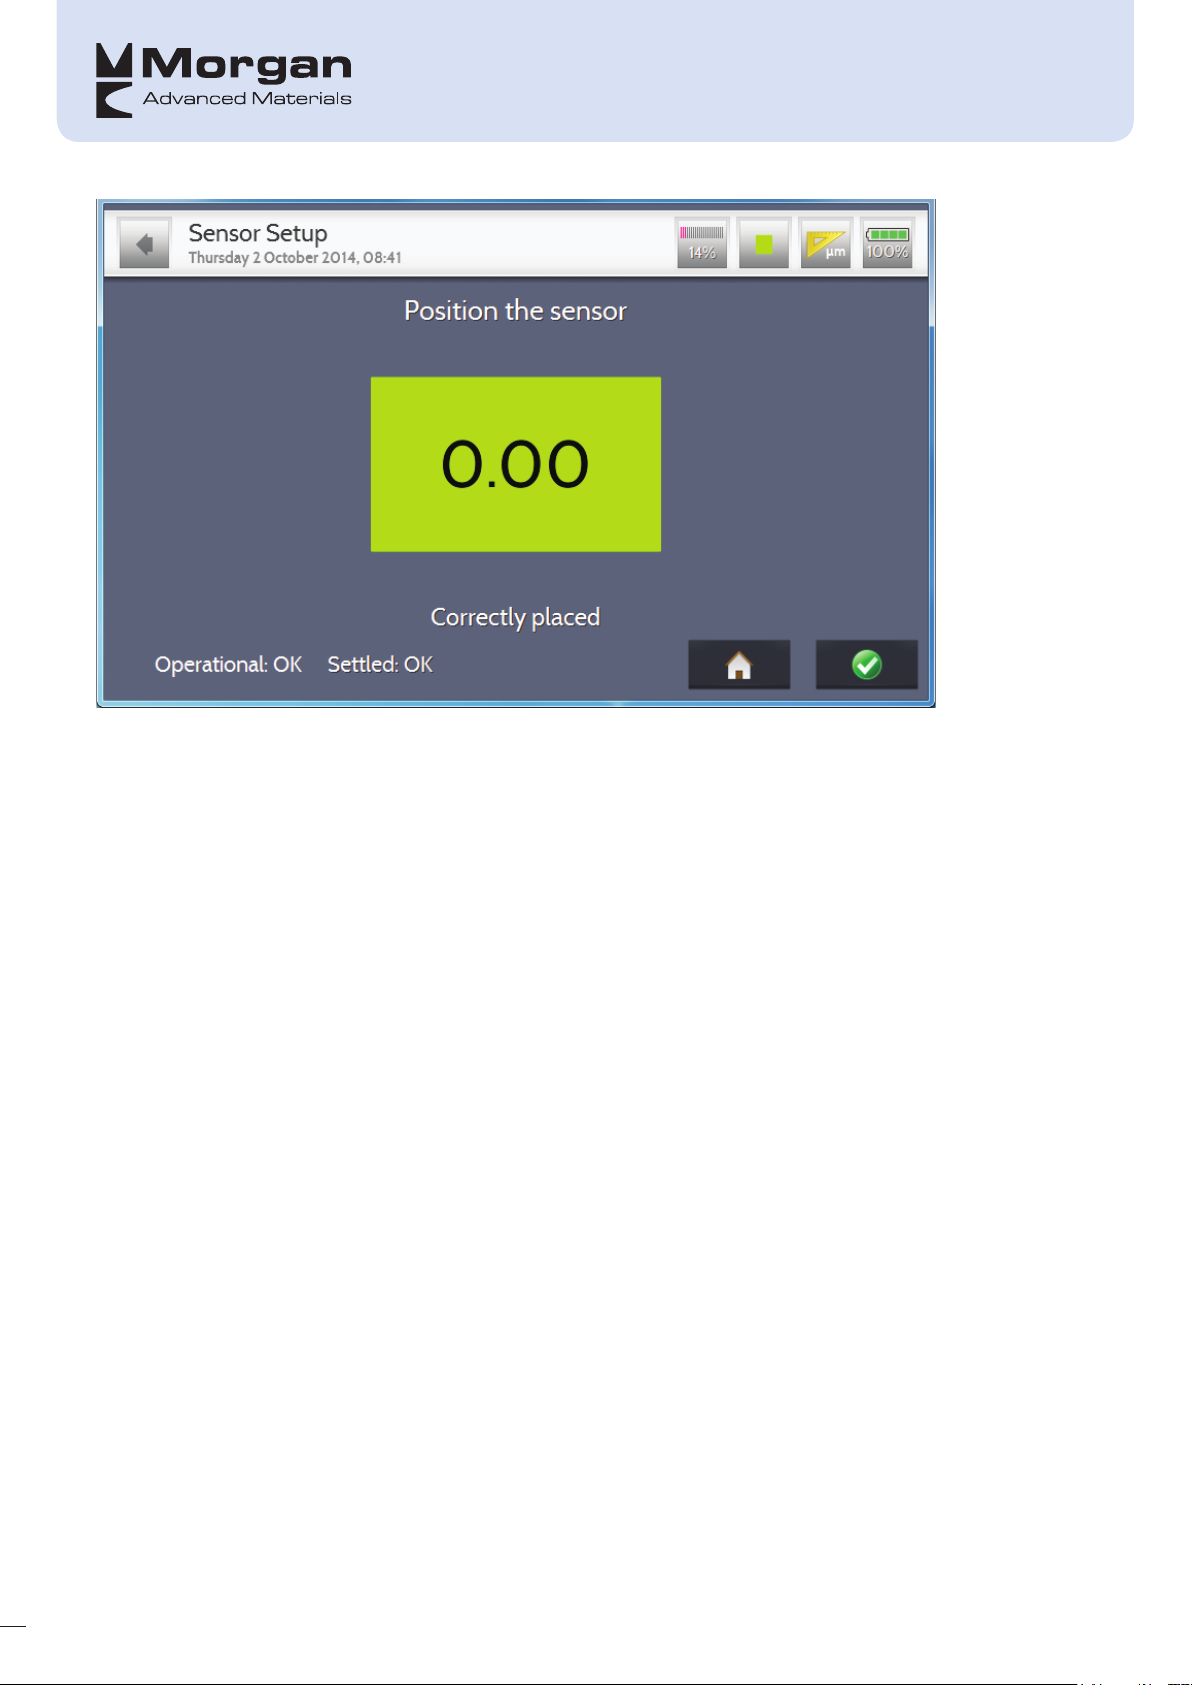
• When the sensor head is in position (ideally the display will be green), tighten the clamp in the holder or
sleeve fully so that there is no movement from the sensor. Only hand tighten the sensor and do not use
any tools or other equipment (as over tightening may damage the clamp).
• Mark the collector surface so that a reference start/stop point can be located
• Next, the collector needs to be rotated in the direction in which the profile will be taken in order to stabilise
the sensor; if a full rotation is not possible then the collector must be rocked back and forth slightly – note
that for consistent results the last movement must be in the same direction as that in which the profile will
be taken. Note that the ‘Operational’ and ‘Settled’ flags (on bottom left hand side of the screen) will
change to ‘OK’ once this has been carried out correctly.
• Check the display still reads ±0.2mm (±8mil) or less and if you are measuring a commutator also ensure
that the sensor is still located approximately in the middle of the marked bar
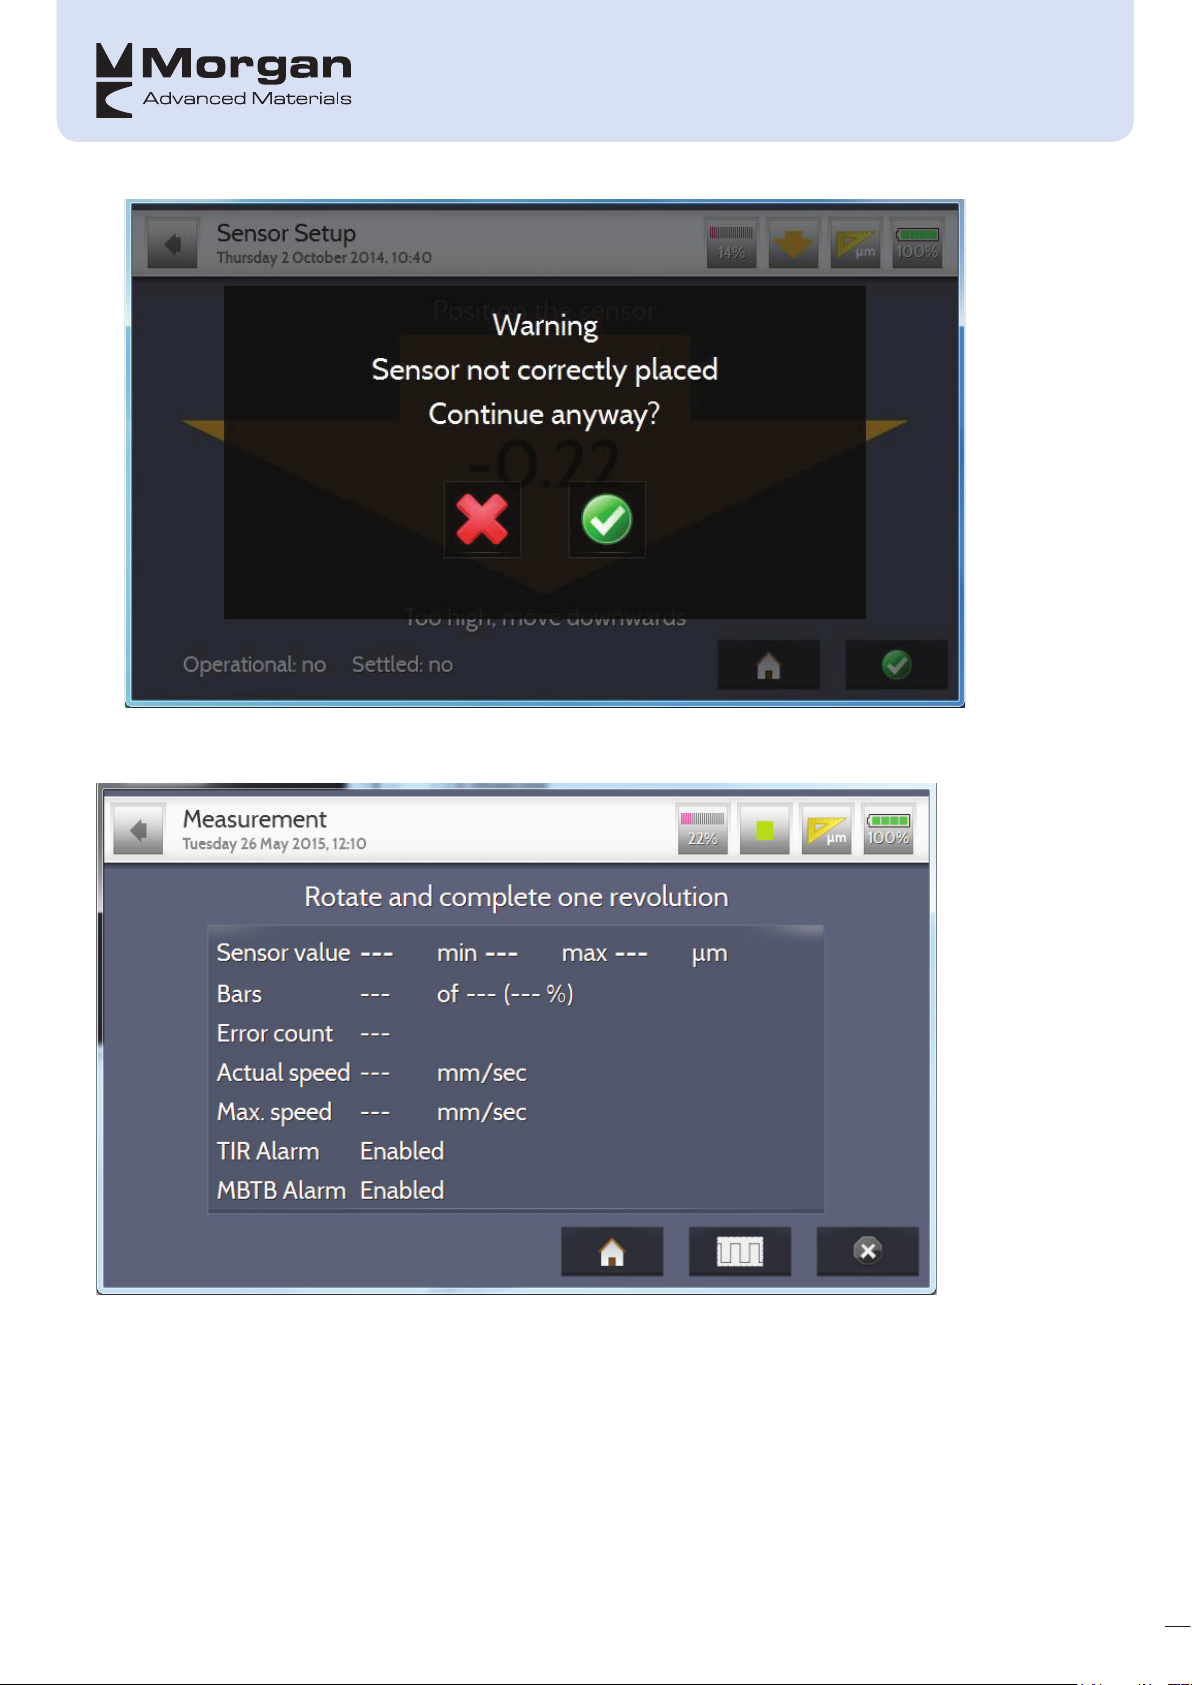
• It is possible to continue when the sensor has not been placed correctly, i.e. when the arrow is orange
however an additional warning appears advising you of the issue.
23
Page 29
Completing one Recording
The collector should be rotated and the unit will start taking recordings
24
Page 30
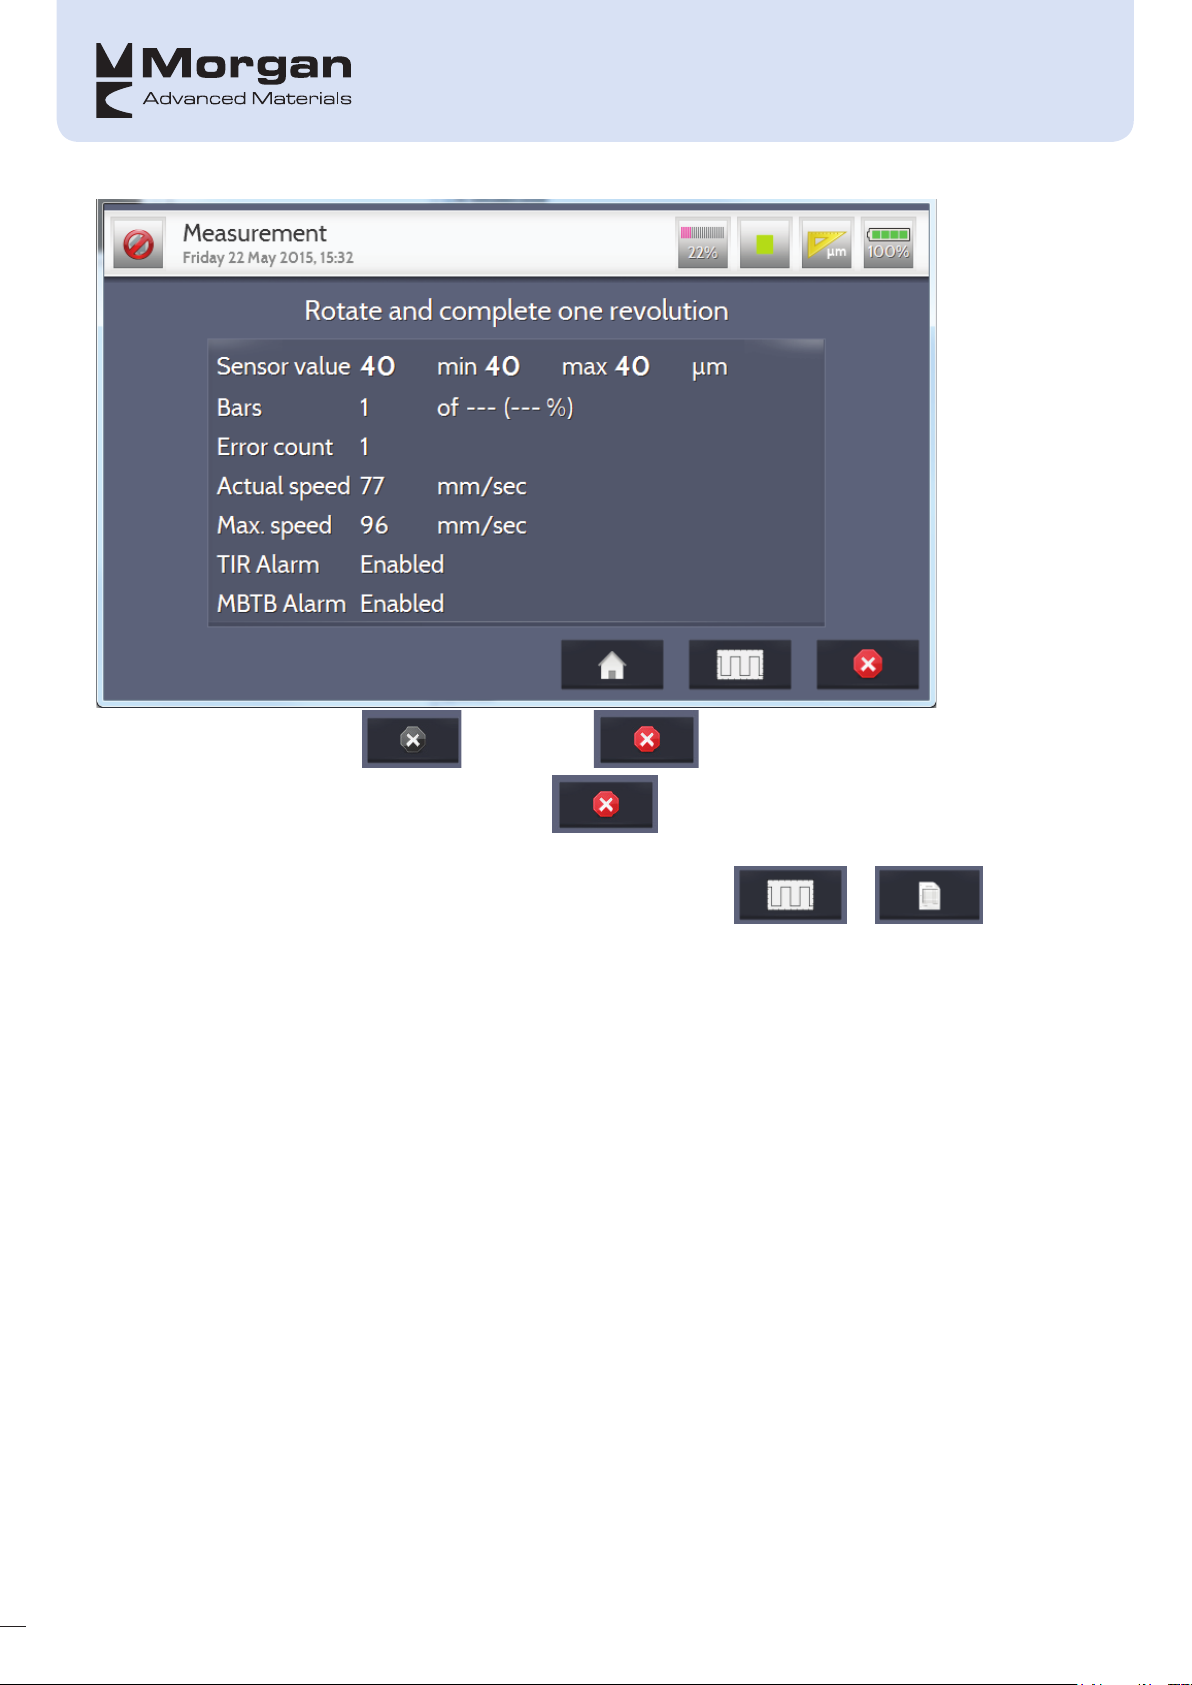
When rotation is detected the will change to ; the recording will stop automatically if
the number of bars (or diameter) was entered, else will have to be pressed.
It is possible to alter the way the readings are displayed by pressing the or button;
this will alternate between text or a real-time linear graph.
25
Page 31
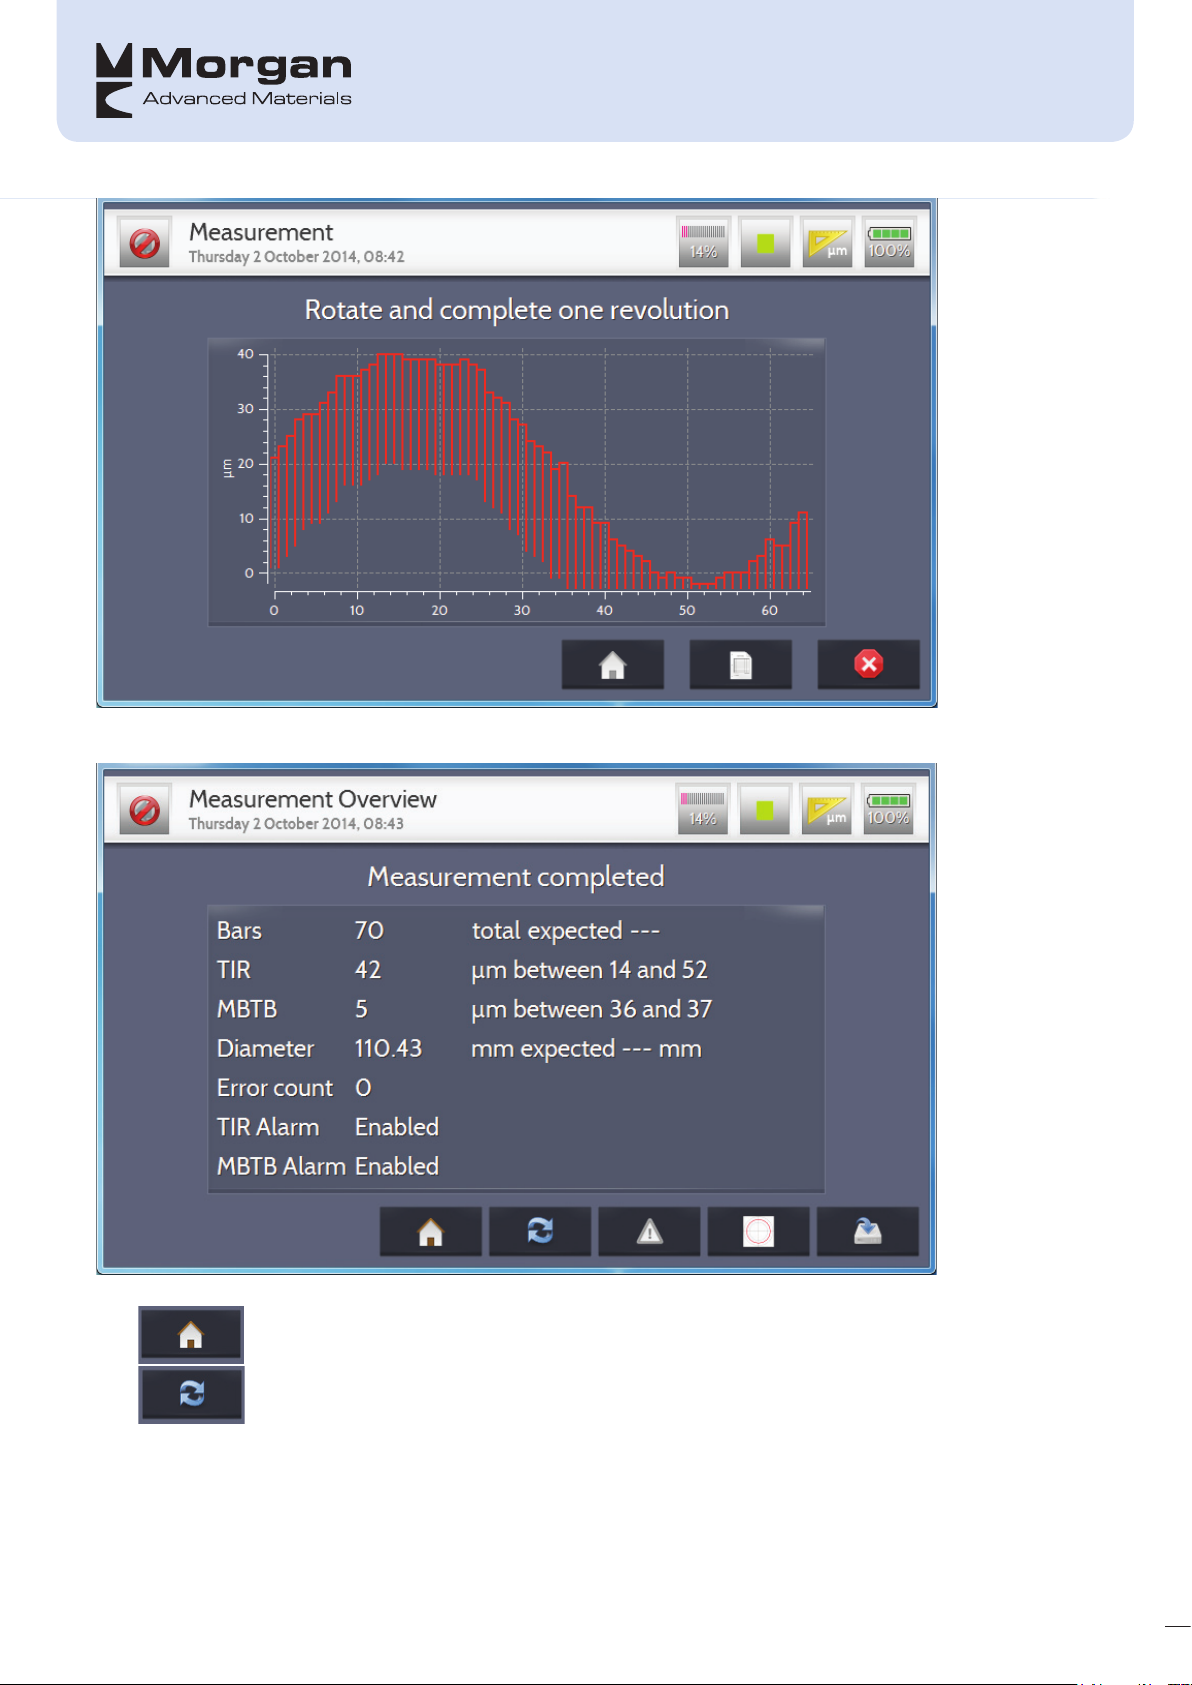
On completion of the recording, the following summary page is displayed:
The symbols on the bottom of the screen mean the following:
Return to home screen without saving
Re-take recording, therefore deleting existing one
26
Page 32
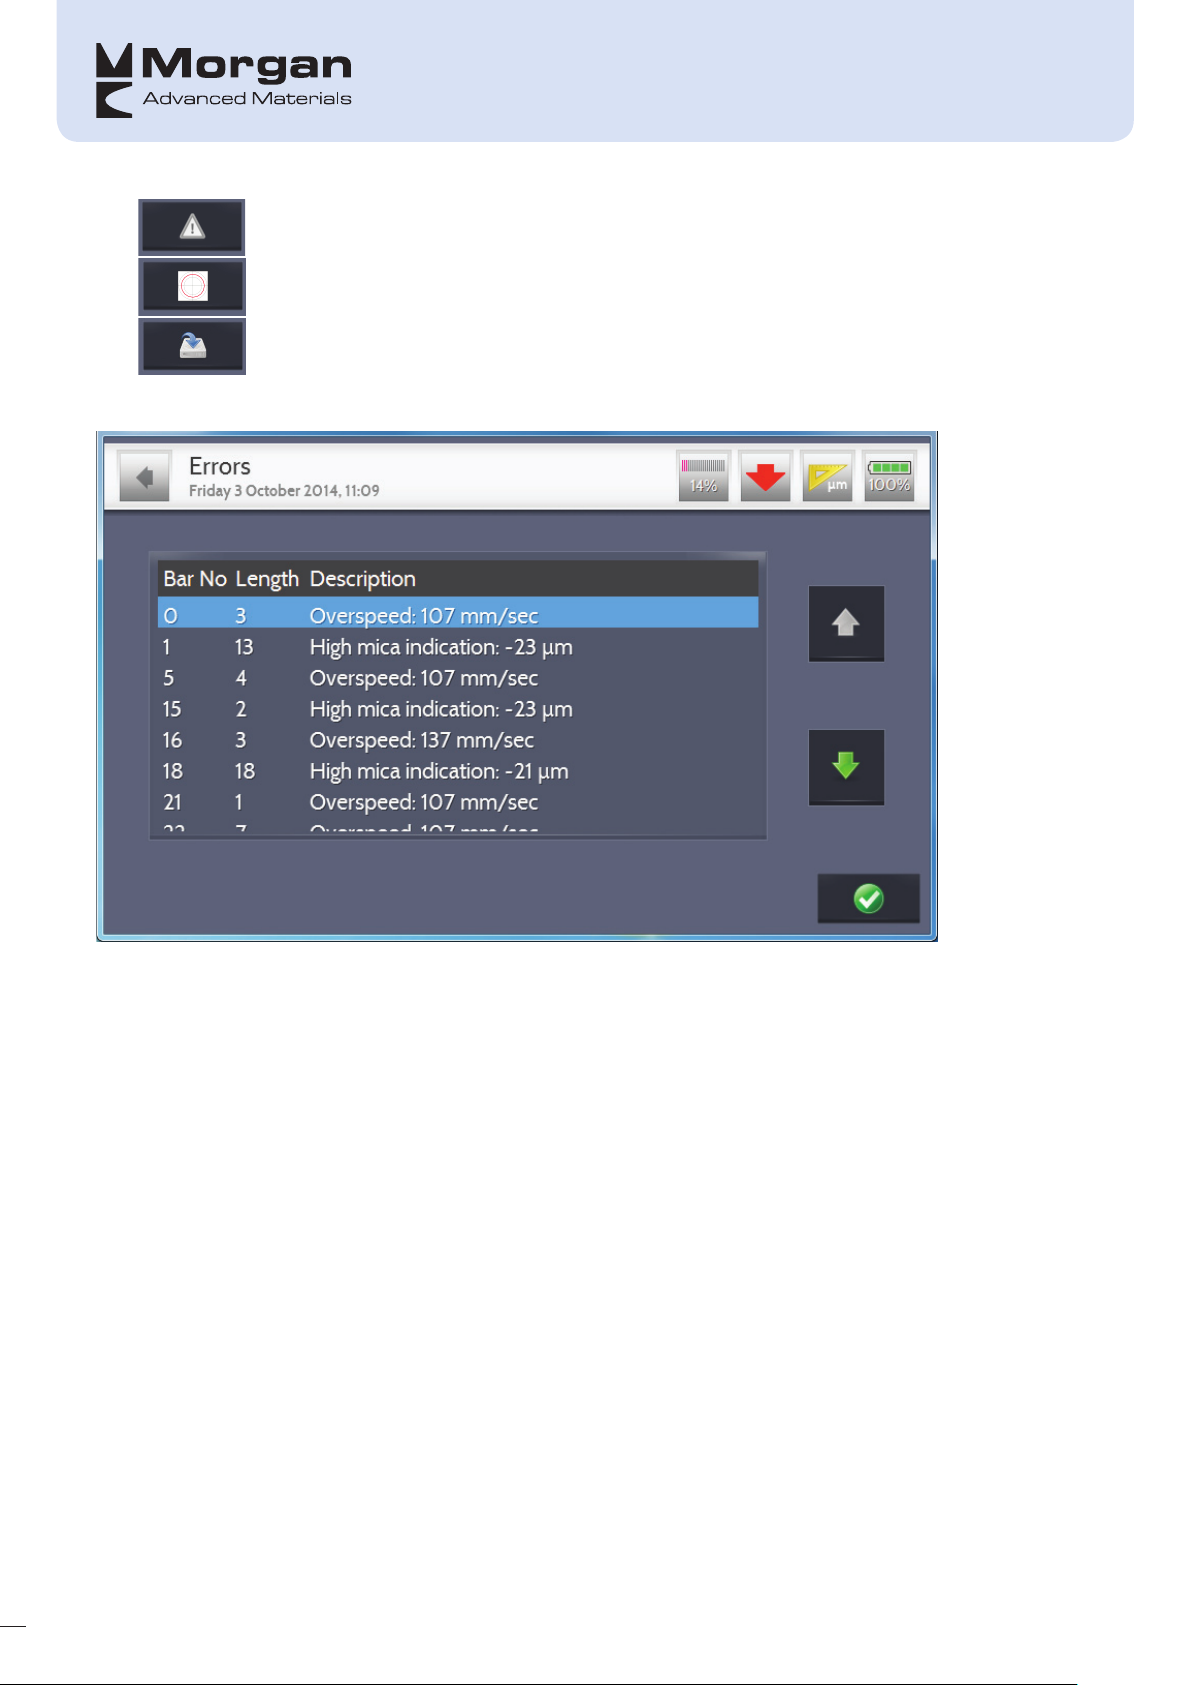
View alarms/errors – if this symbol is highlighted in red
View radial plot
Save recording
If there are any alarms triggered/errors they will be displayed as follows:
The radial plot button allows the user to have an overview of the general shape – and zoom in and out.
27
Page 33
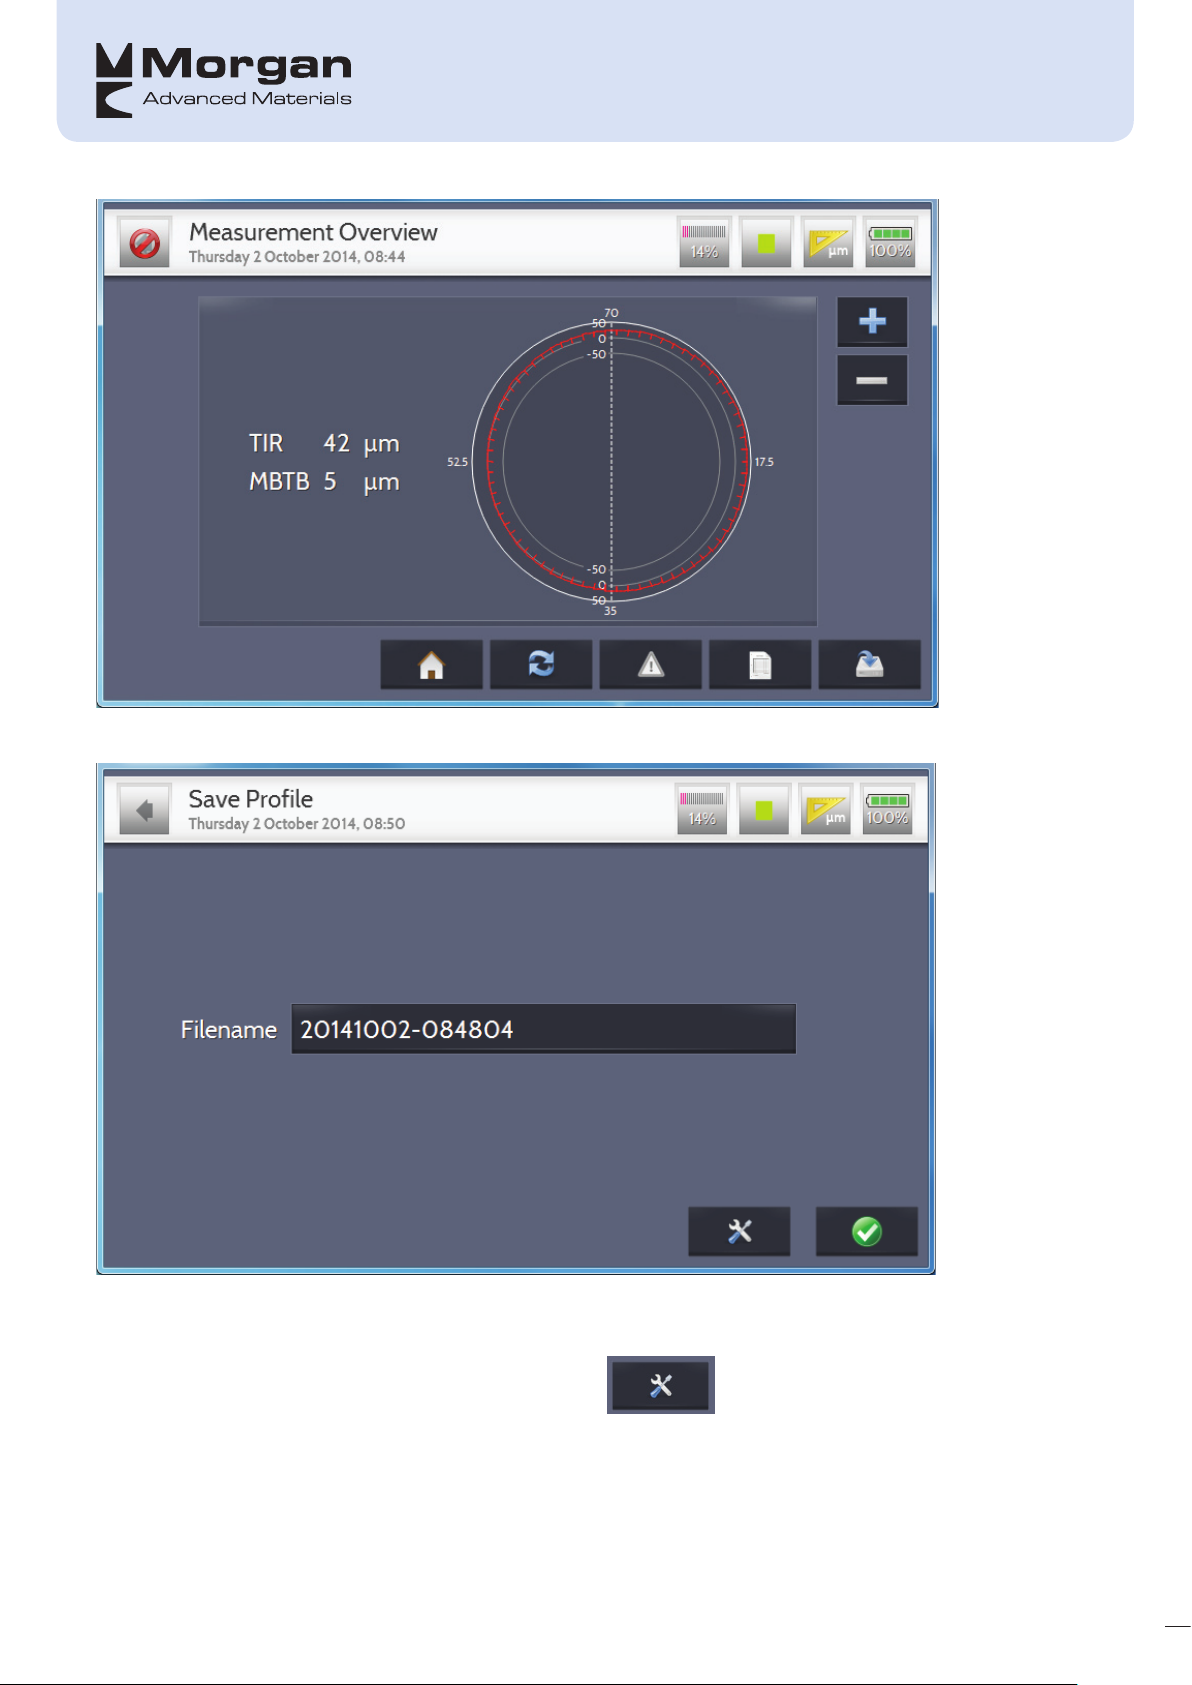
If the user wants to save the recording, the following screen is displayed:
The default filename is in the format: year/month/day-hour/minute/second – hence it will be totally unique;
this filename can be over-written and/or modified if desired.
In order to add the machine details into the database, the button must be pressed – provided
the machine information is not already in the database, unless the user wants to update the existing data
with the latest reading(s).
28
Page 34
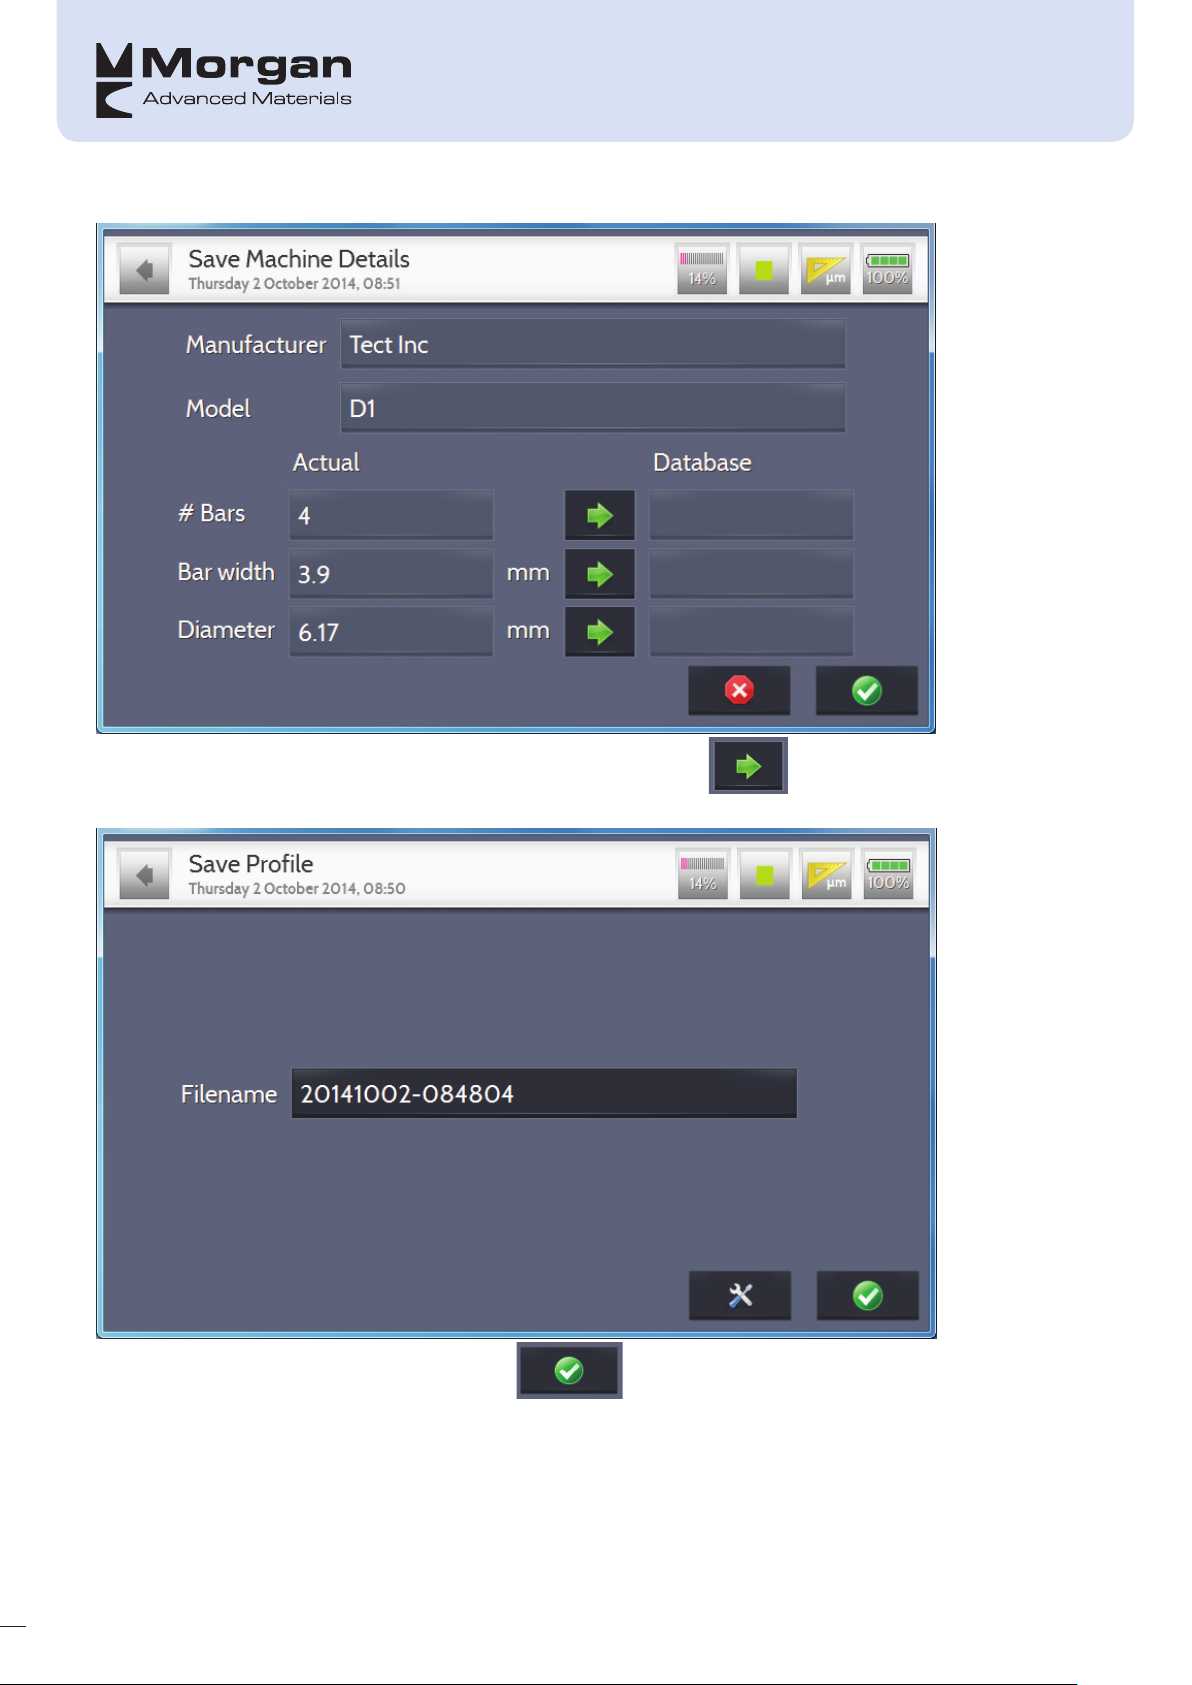
The information can be transferred into the database by pressing the button.
29
Once the user wants to save the recording, the button must be pressed. This will then lead to
the following options:
Page 35
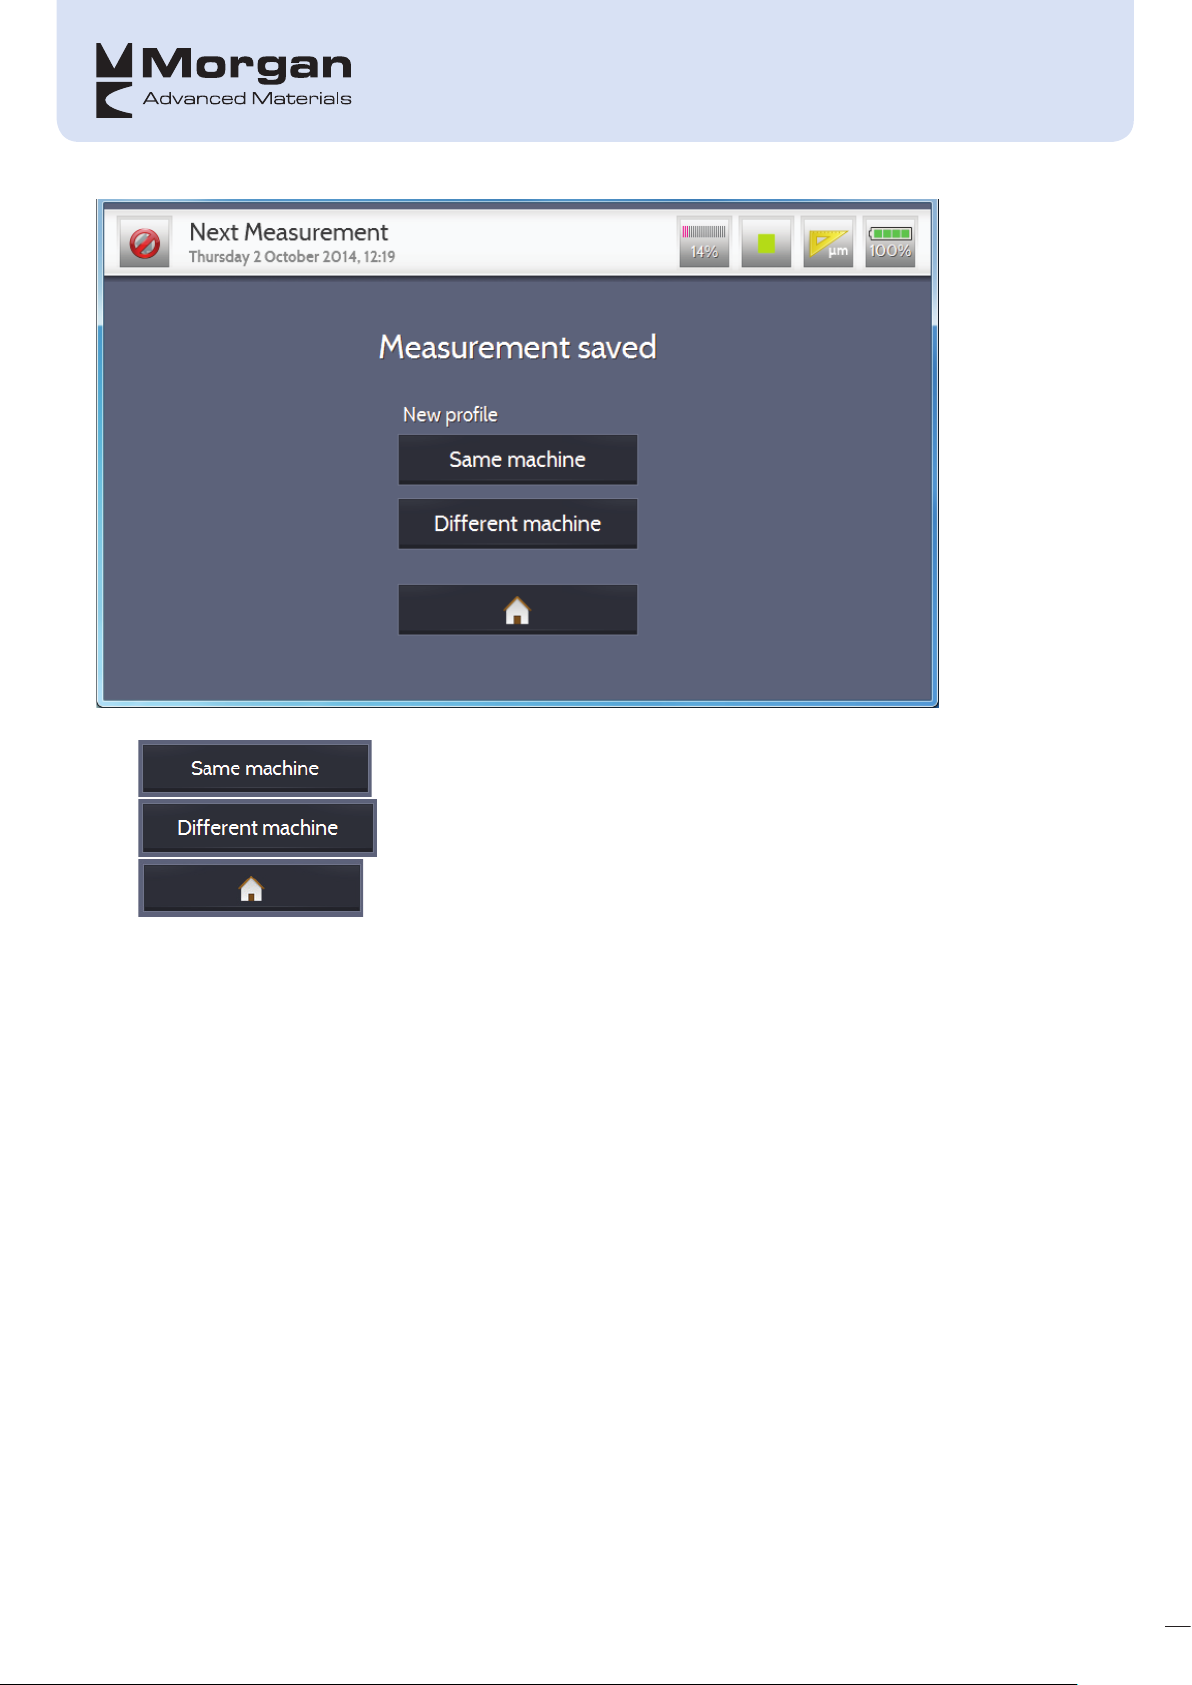
Same Machine returns the user to the sensor
setup
Different Machine returns the user to the Start
Measurement screen
Return to home screen
30
Page 36
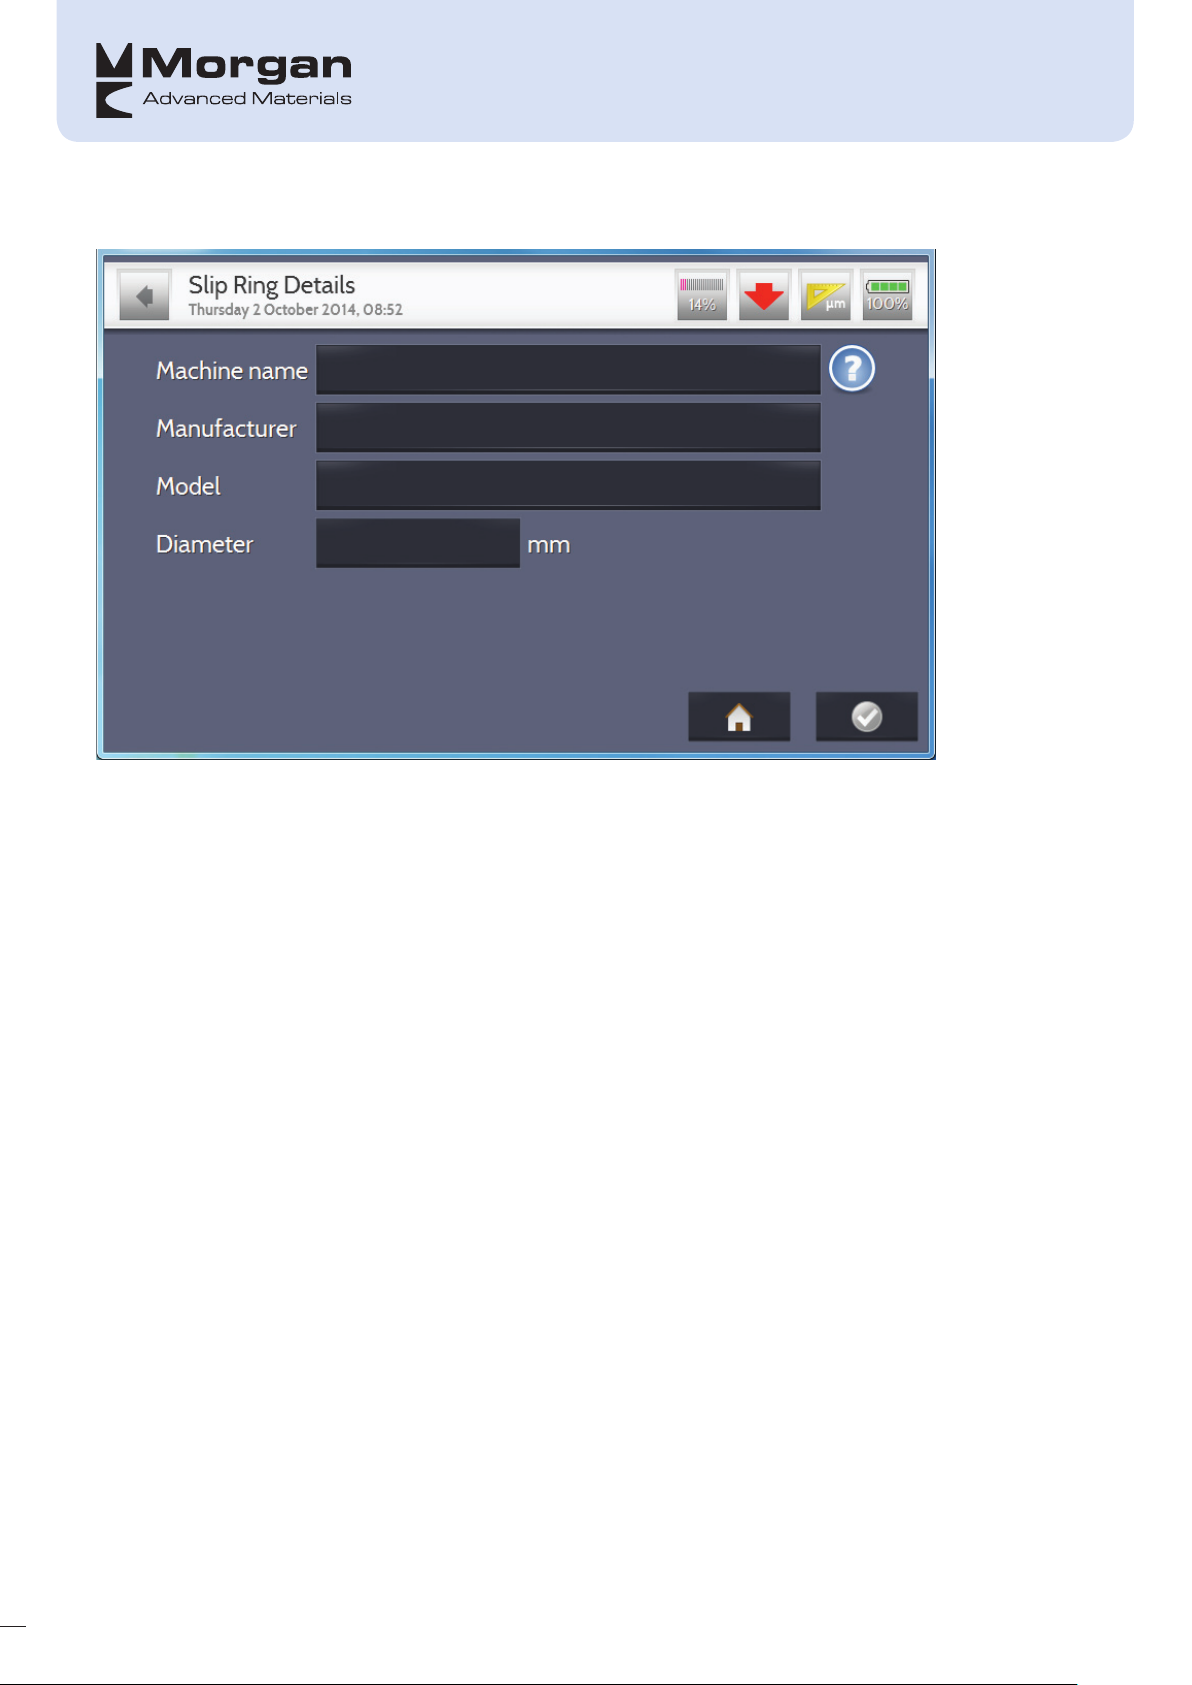
Slip-ring
On this screen as much information as possible is to be filled in as it can be used to generate your own
company specific machine database, and in order for a machine to be saved in the database the top 3 fields
are to be completed:
• Machine Name
• Manufacturer
• Model
Also, if the diameter is known then this should be entered as it will mean that the recording will stop
automatically rather than the user having to stop the recording manually.
31
Page 37
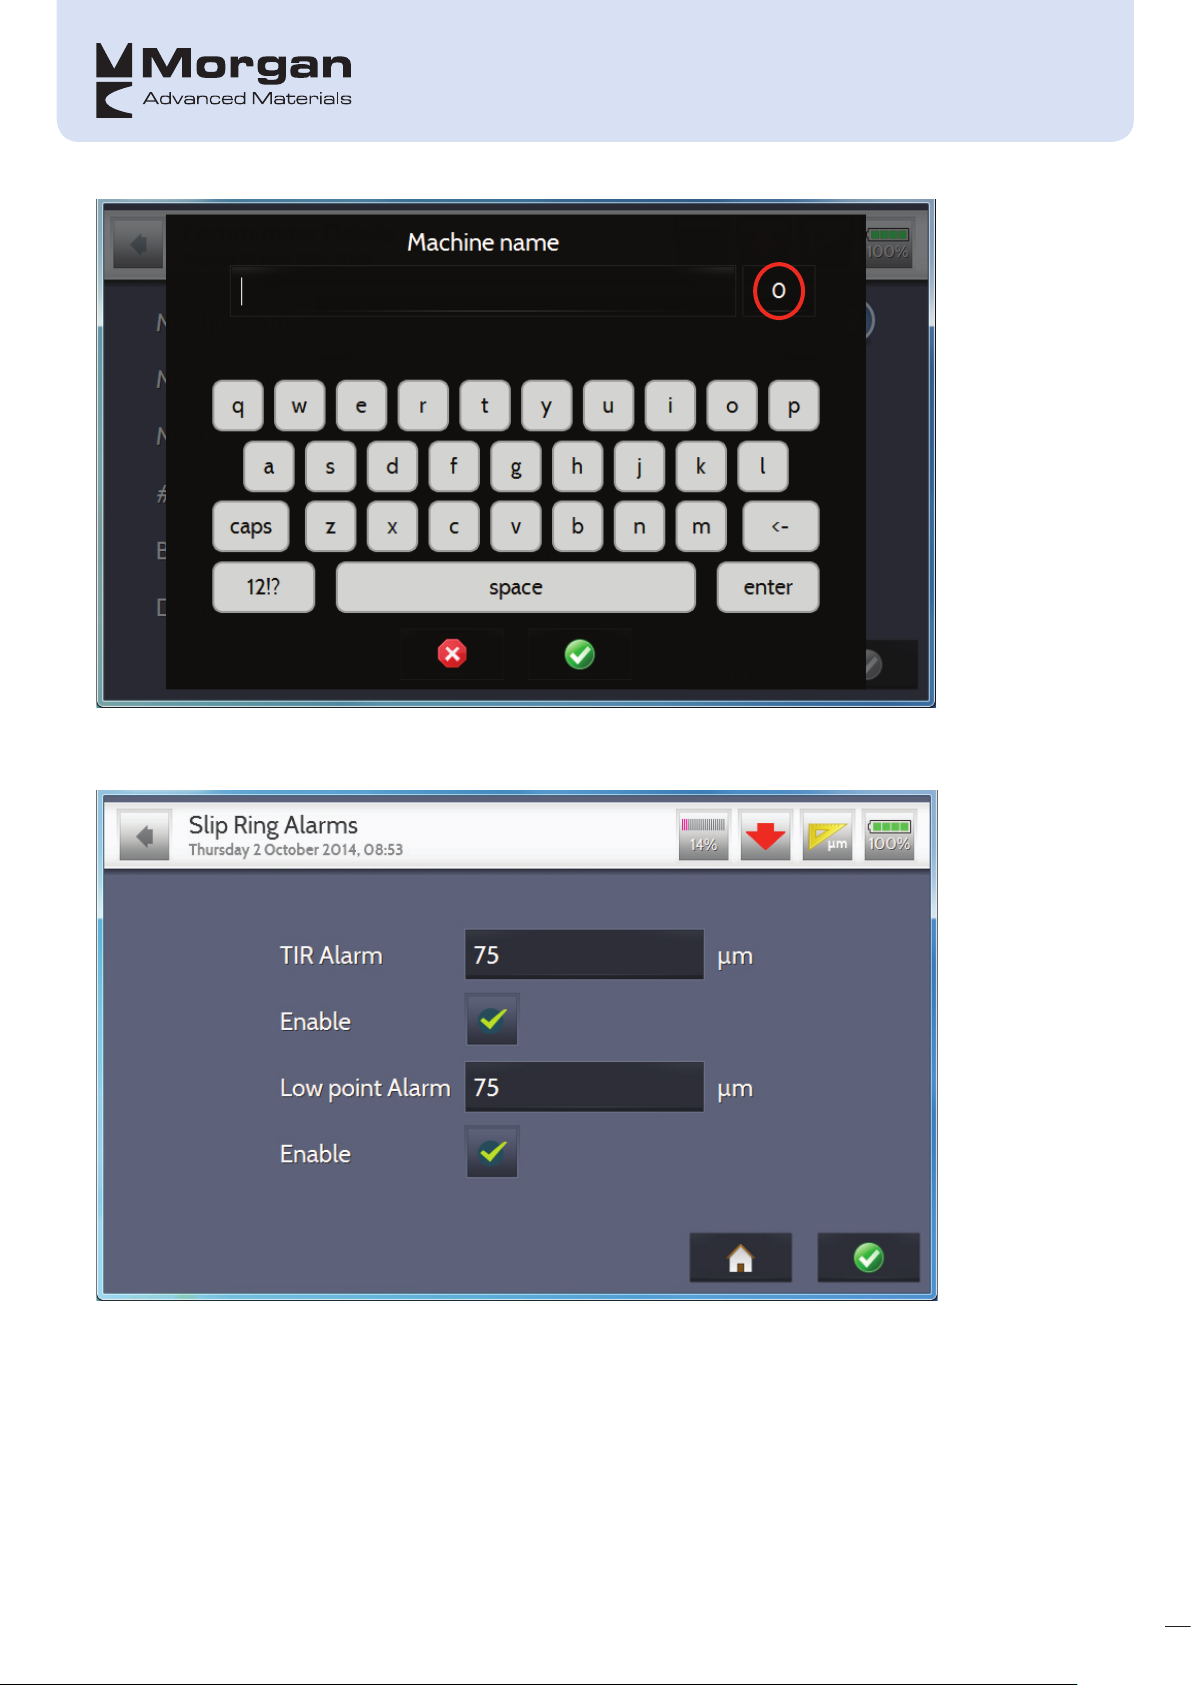
The next screen is used to determine whether you require TIR and Low Point alarms, and if so, the value at
which it is triggered; note that the default is that which is set in the Alarms page.
Setting the Sensor
Set the Sensor in the same way as that described for a Commutator.
32
Page 38
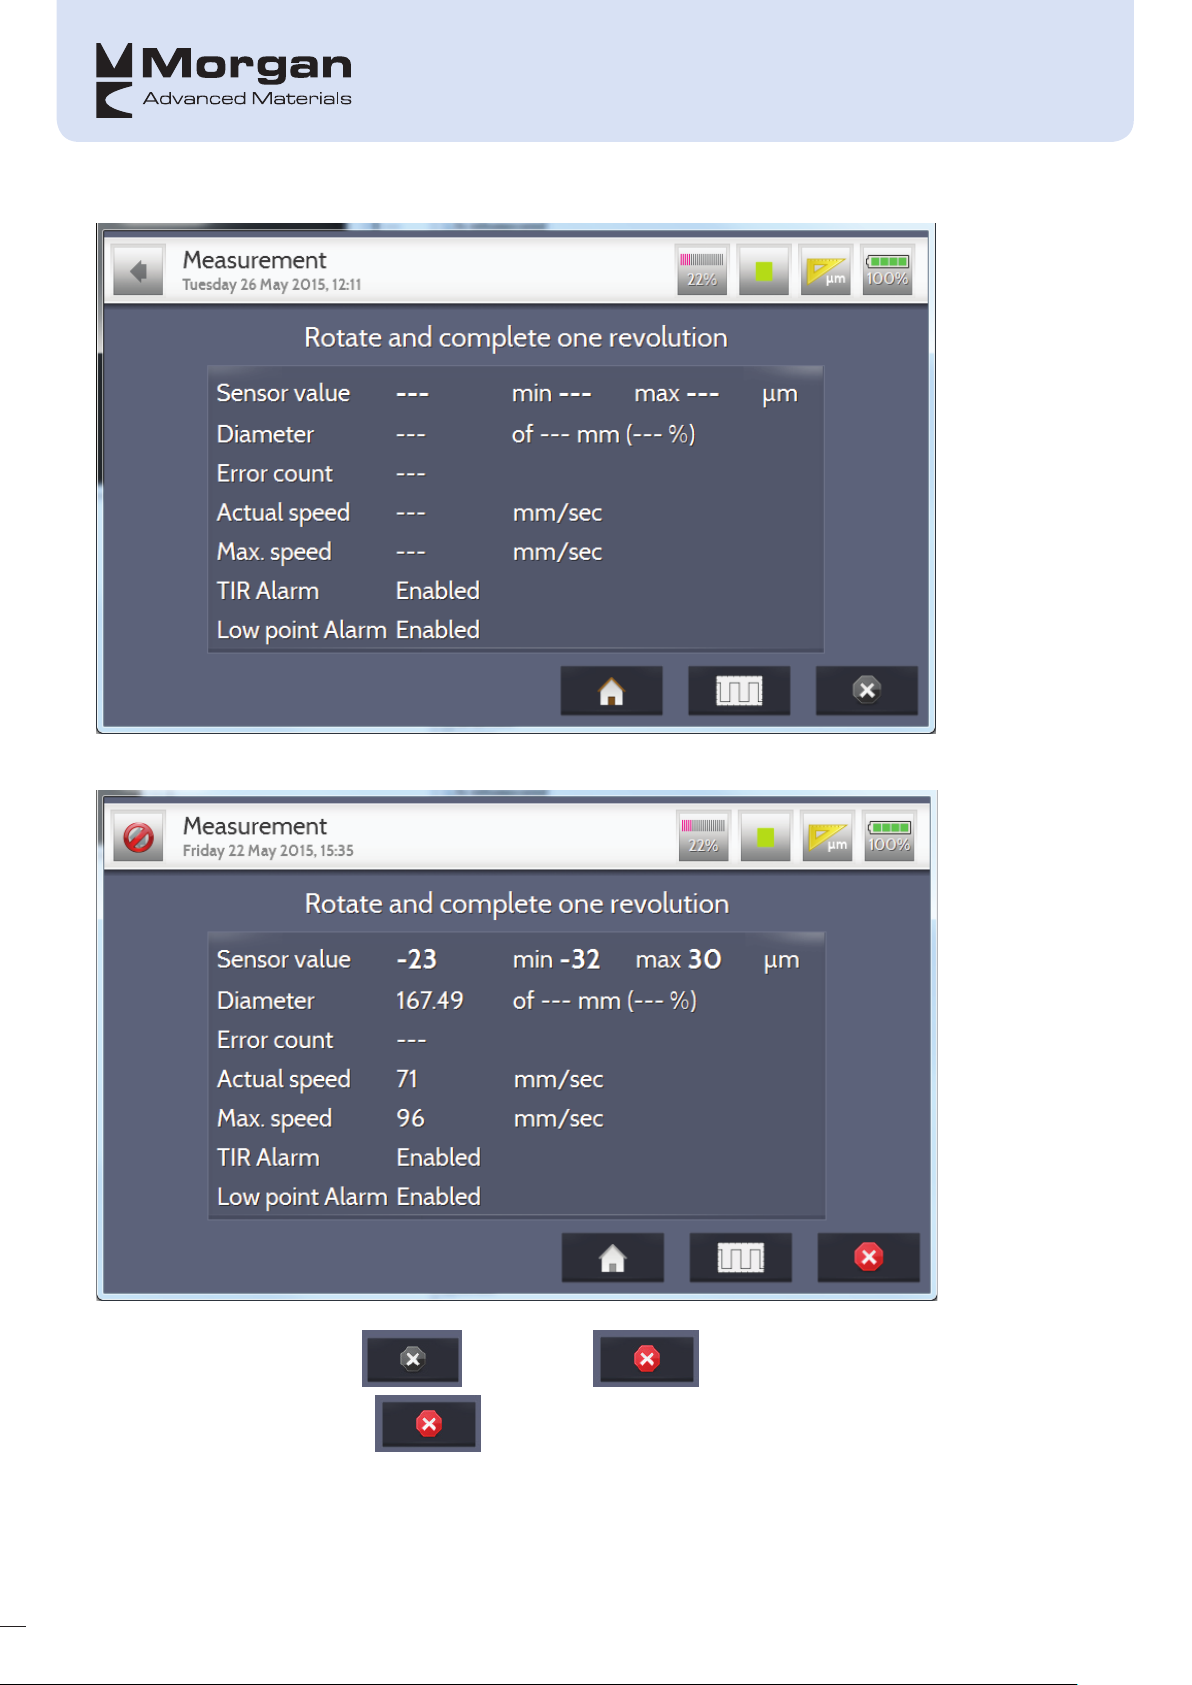
Completing one Recording
The collector should be rotated and the unit will start taking recordings
33
When rotation is detected the will change to ; the recording will stop automatically if
the diameter was entered, else will have to be pressed.
Page 39
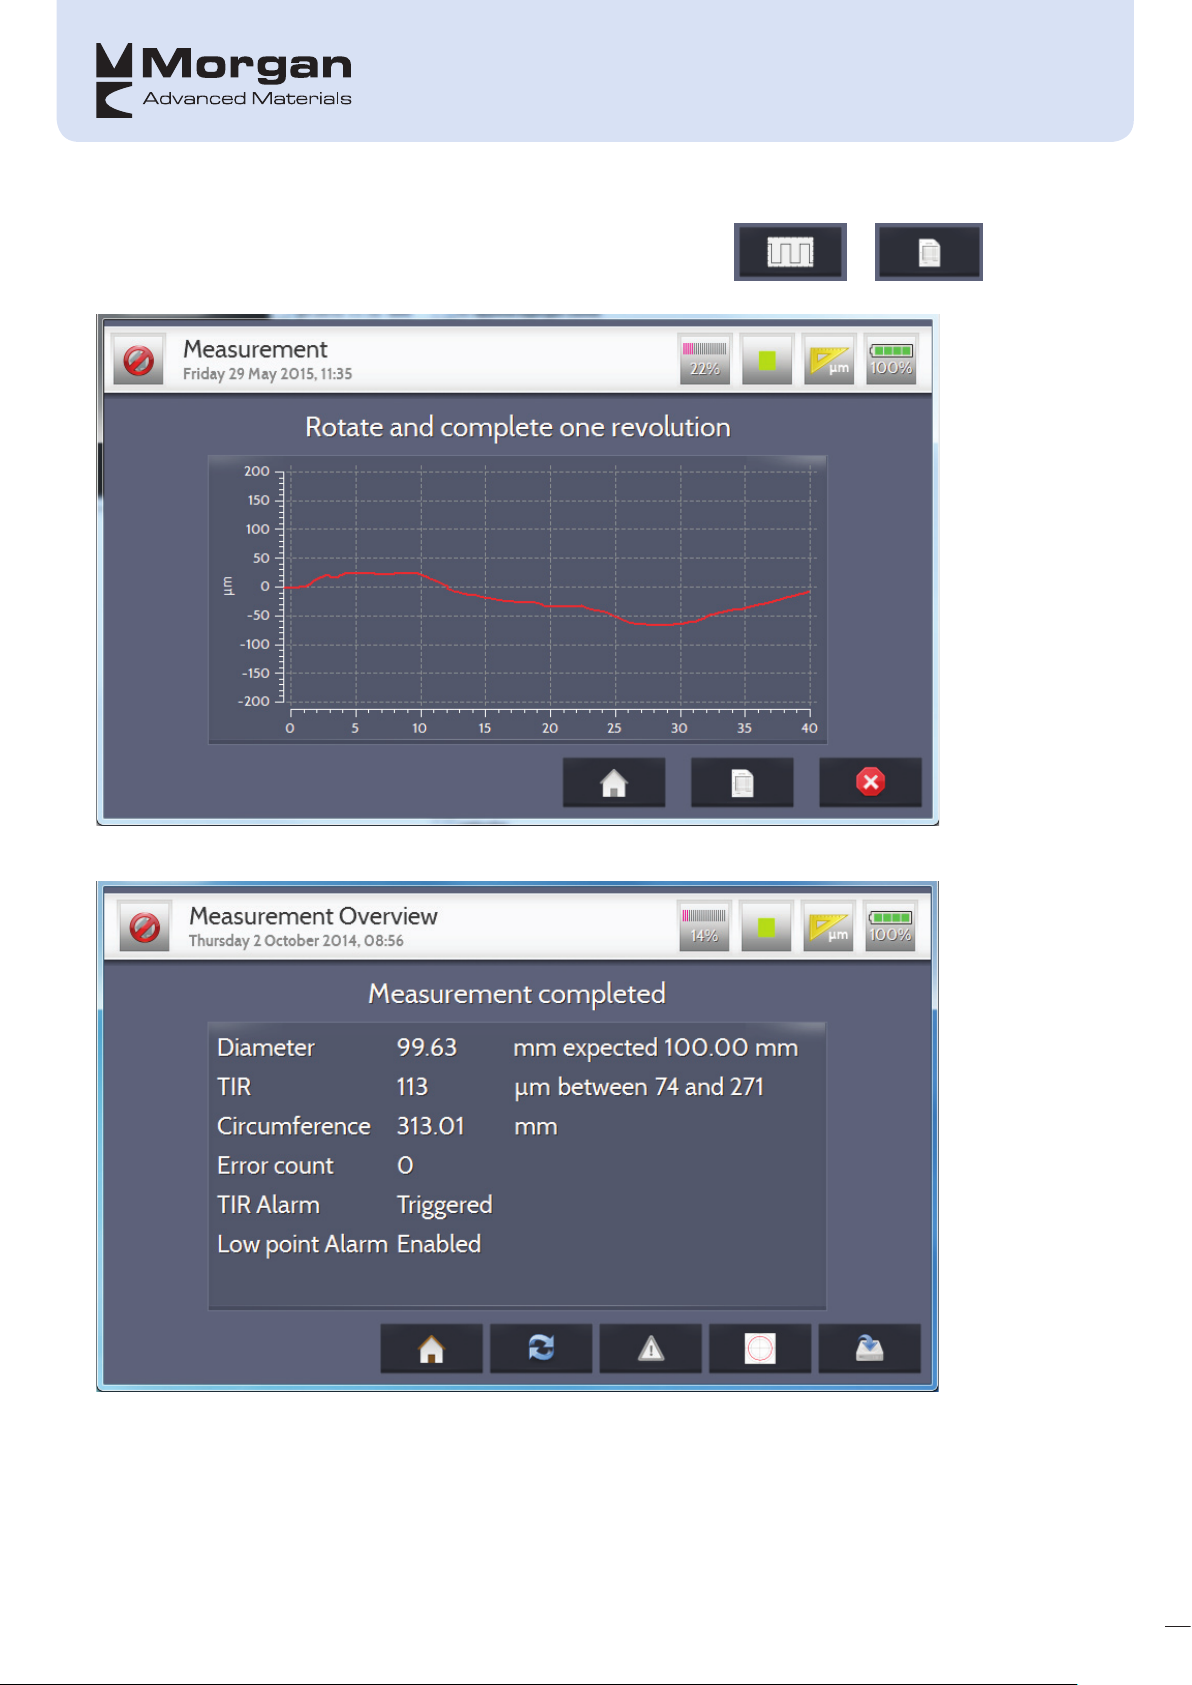
It is possible to alter the way the readings are displayed by pressing the or button;
this will alternate between either text or a real-time graph.
On completion of the recording, the following summary page is displayed:
The symbols on the bottom of the screen mean the following:
34
Page 40
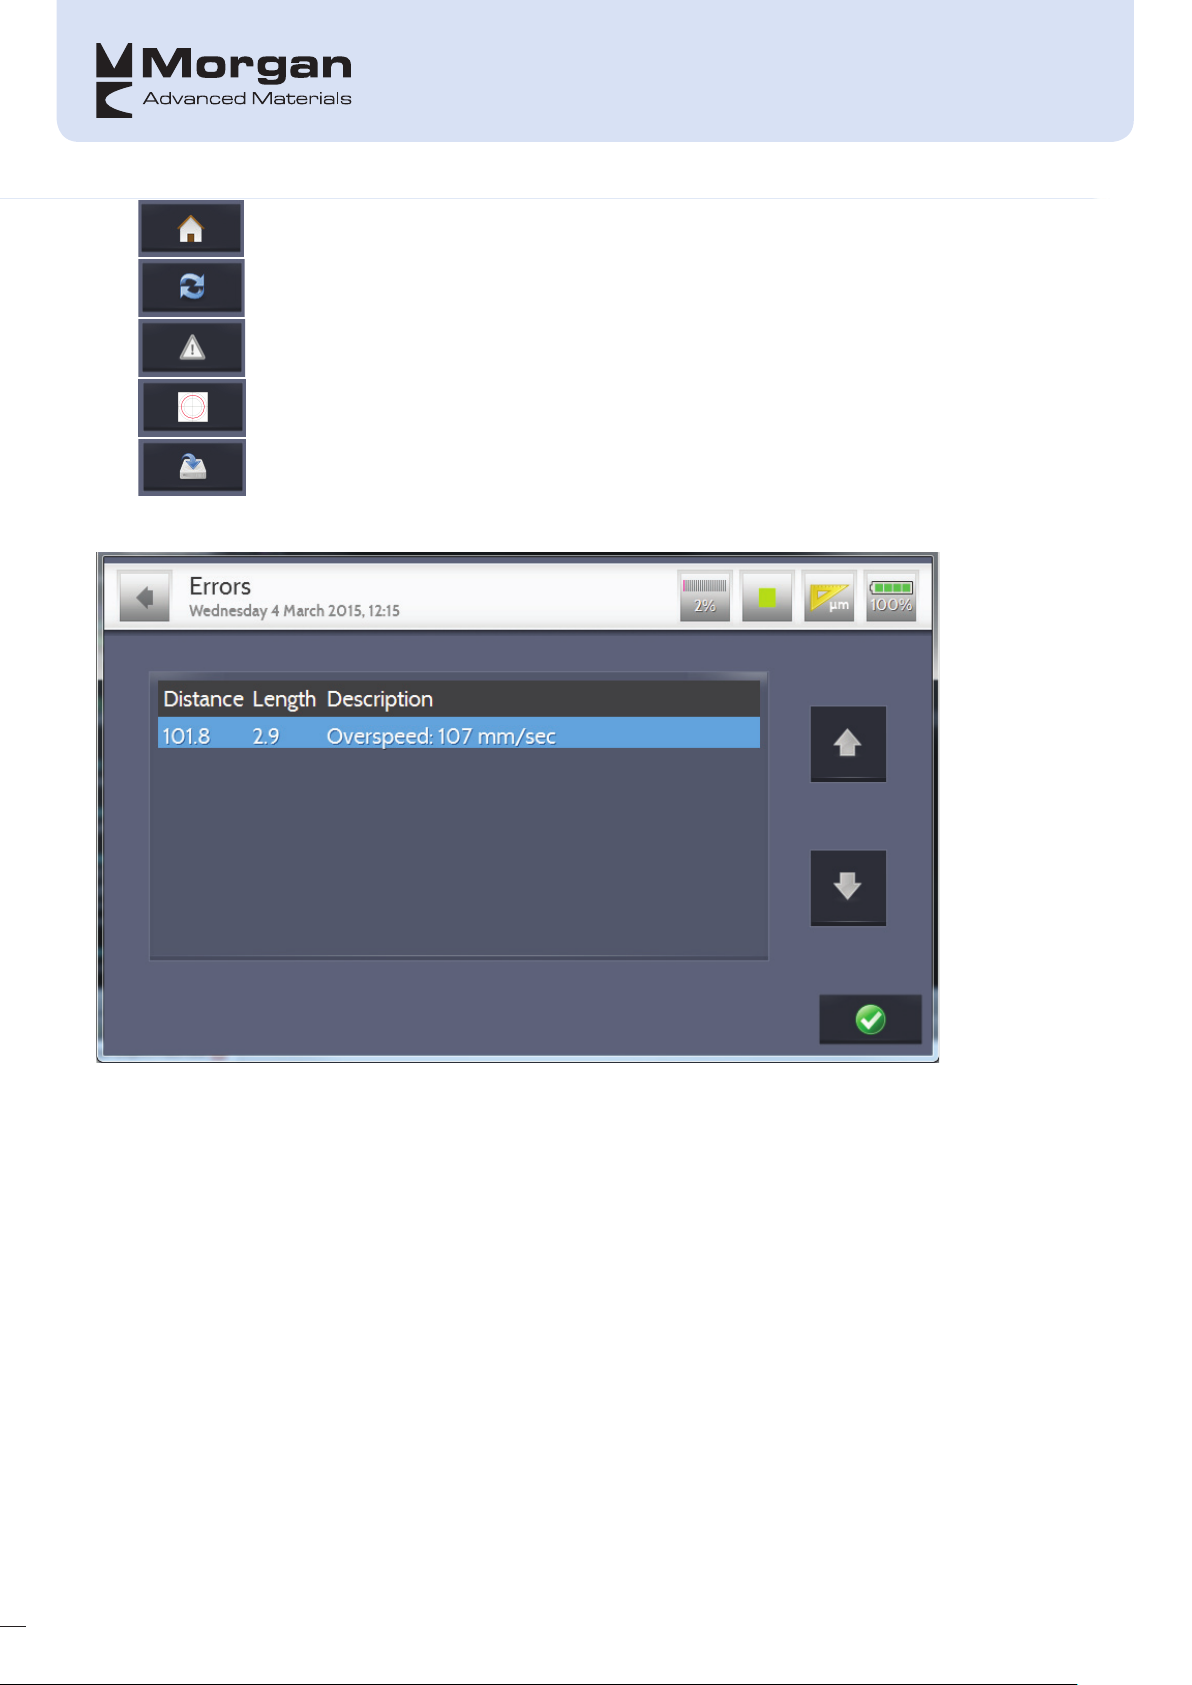
Return to home screen without saving
Re-take recording
View alarms/errors – if this symbol is highlighted in red
View radial plot
Save recording
If there are any alarms triggered/errors they will be displayed as follows:
35
The radial plot button allows the user to have an overview of the general shape – and zoom in and out.
Page 41
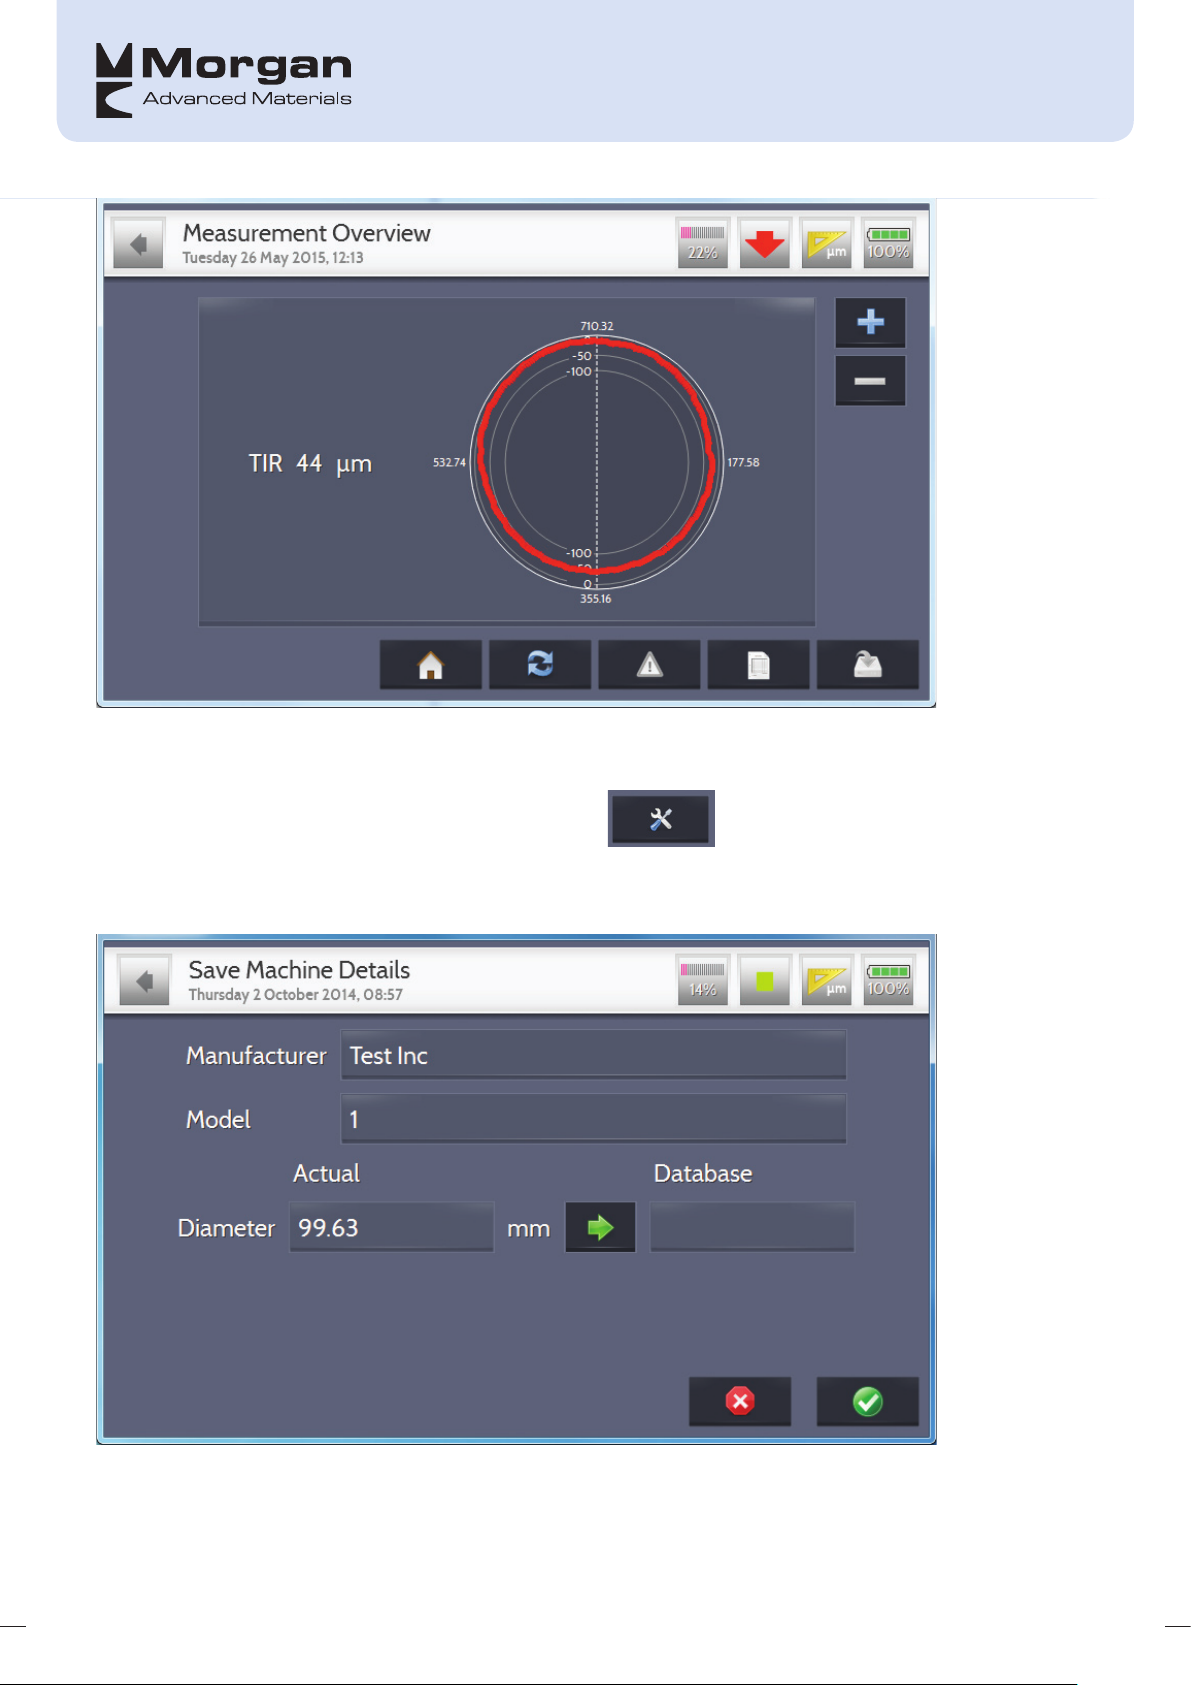
The results can be saved in exactly the same way as that described in the Commutator section.
In order to add the machine details into the database, the button must be pressed – provided
the machine information is not already in the database, unless the user wants to update the existing data
with the latest reading(s).
36
Page 42

The information can be transferred into the database by pressing the button and saved as
previously described.
37
Page 43
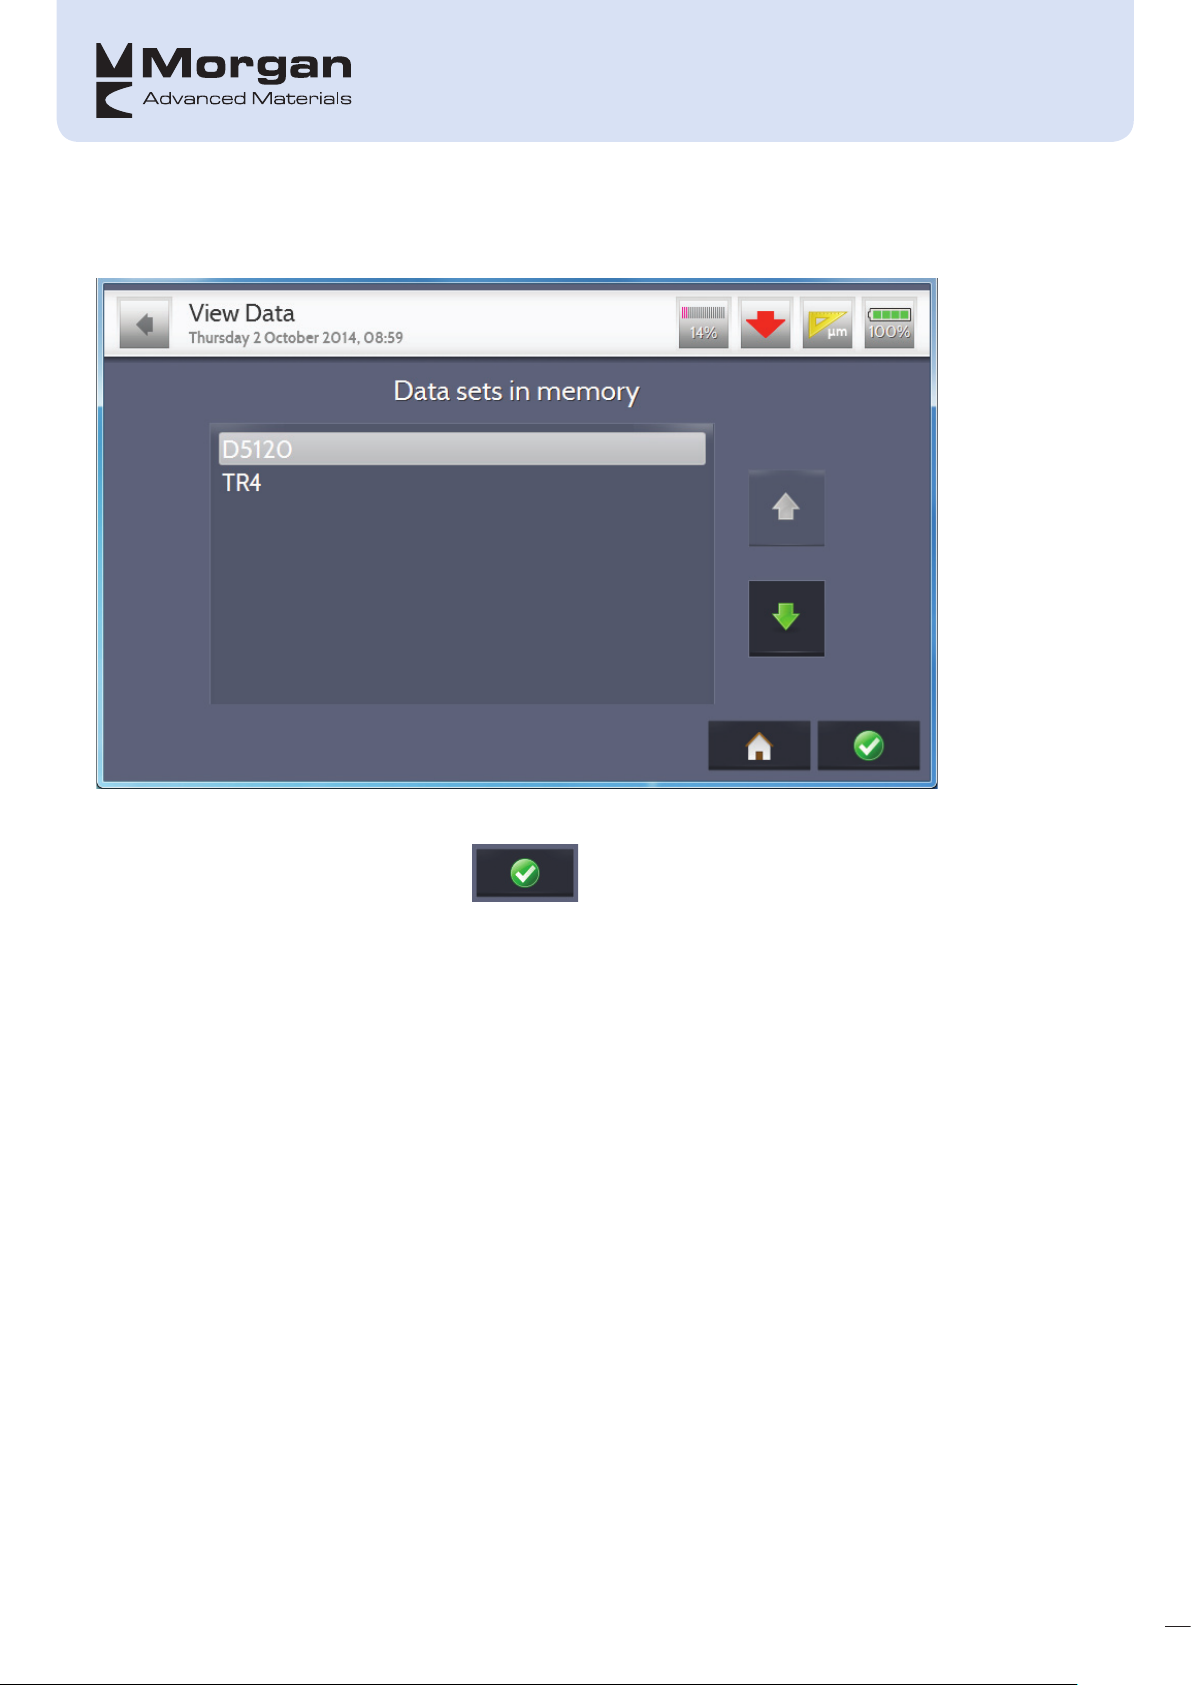
VIEW DATA
When the user wants to view previously taken collector readings, the following screen will be displayed:
Scrolling through the data sets can be achieved by using the arrows on the side of the screen.
When the required data set is located, the button should be pressed. This will then show the
individual recordings taken for on each machine:
38
Page 44
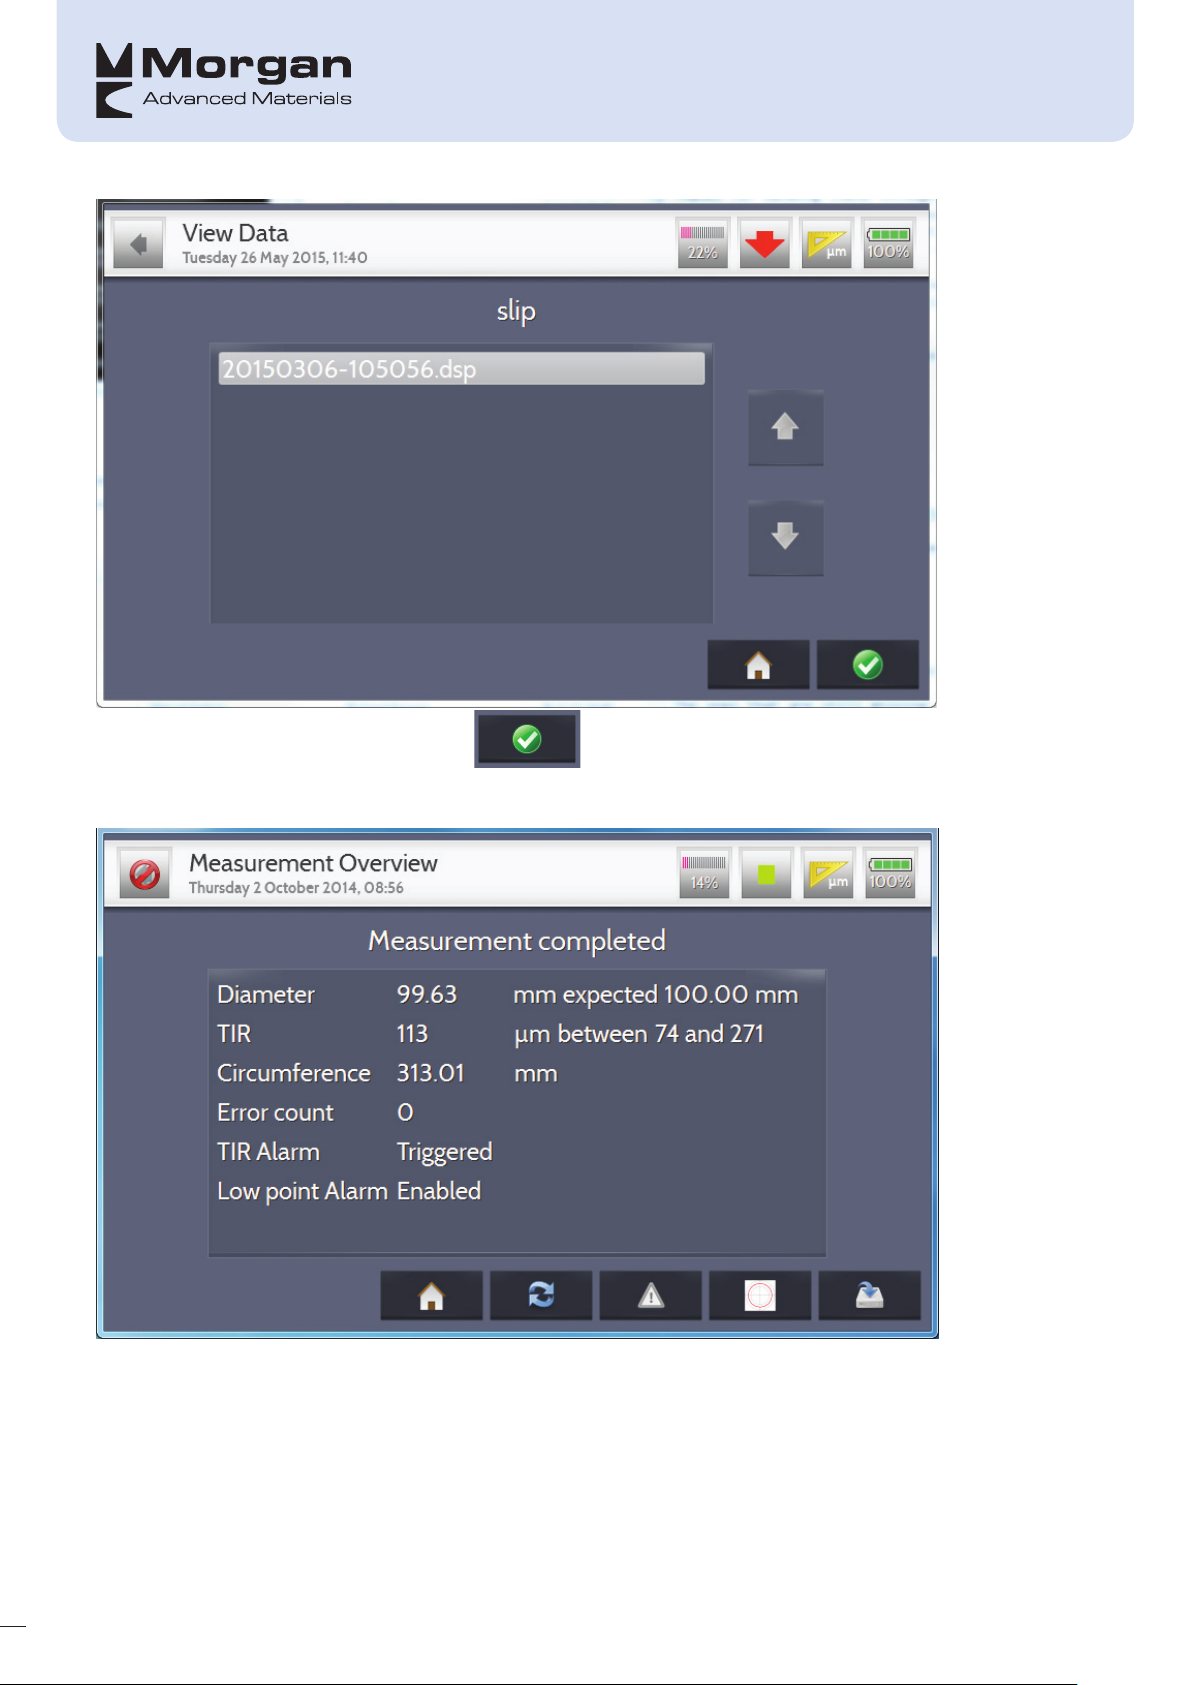
Once the required recording is located the button is again pressed to continue; this will then
display the same screen as that displayed following the completion of the recording, i.e.:
39
The different icons can be selected as previously described.
Page 45
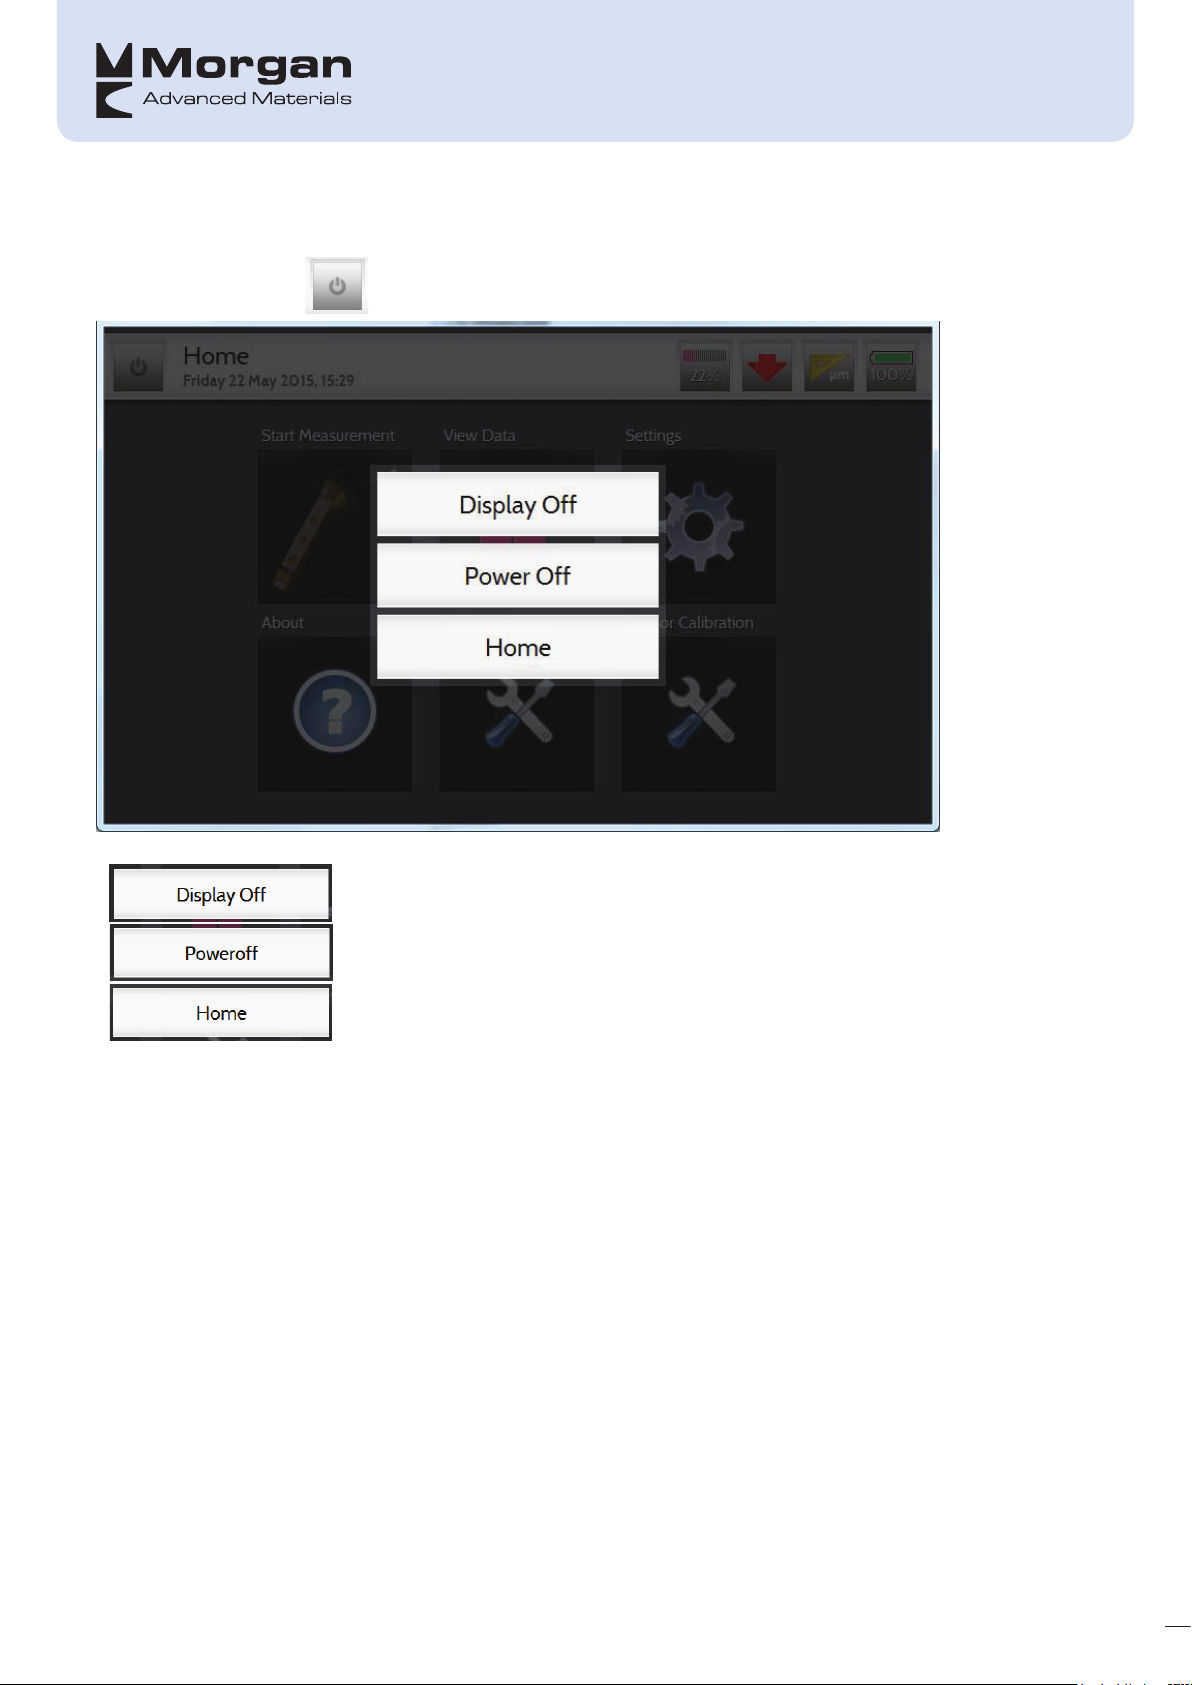
Standby Screen
On the main menu, the button gives the user the following options:
Turns the screen off
Turns the unit off
Returns to home screen
After pressing the “Display Off” button the screen will go blank/turn off; when the screen is then pressed
again the following is shown:
40
Page 46
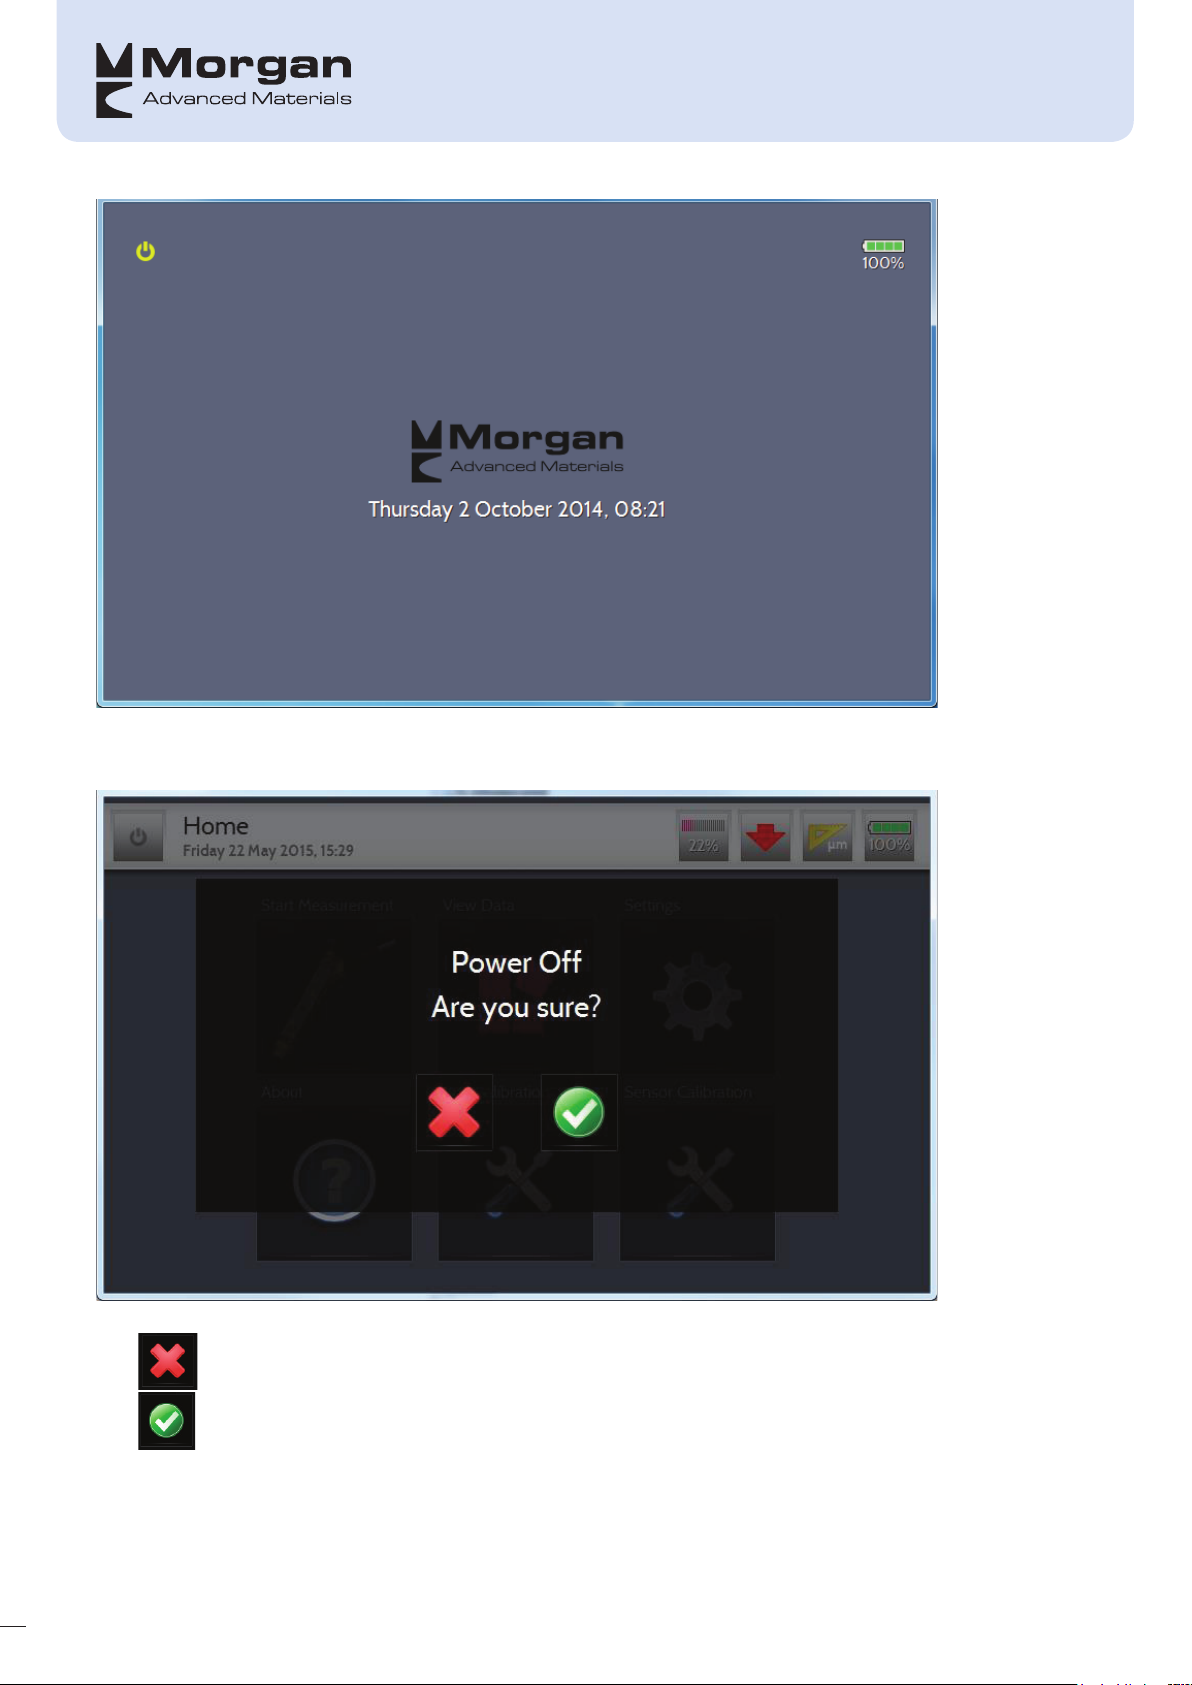
Pressing the screen again takes you back to the Home screen
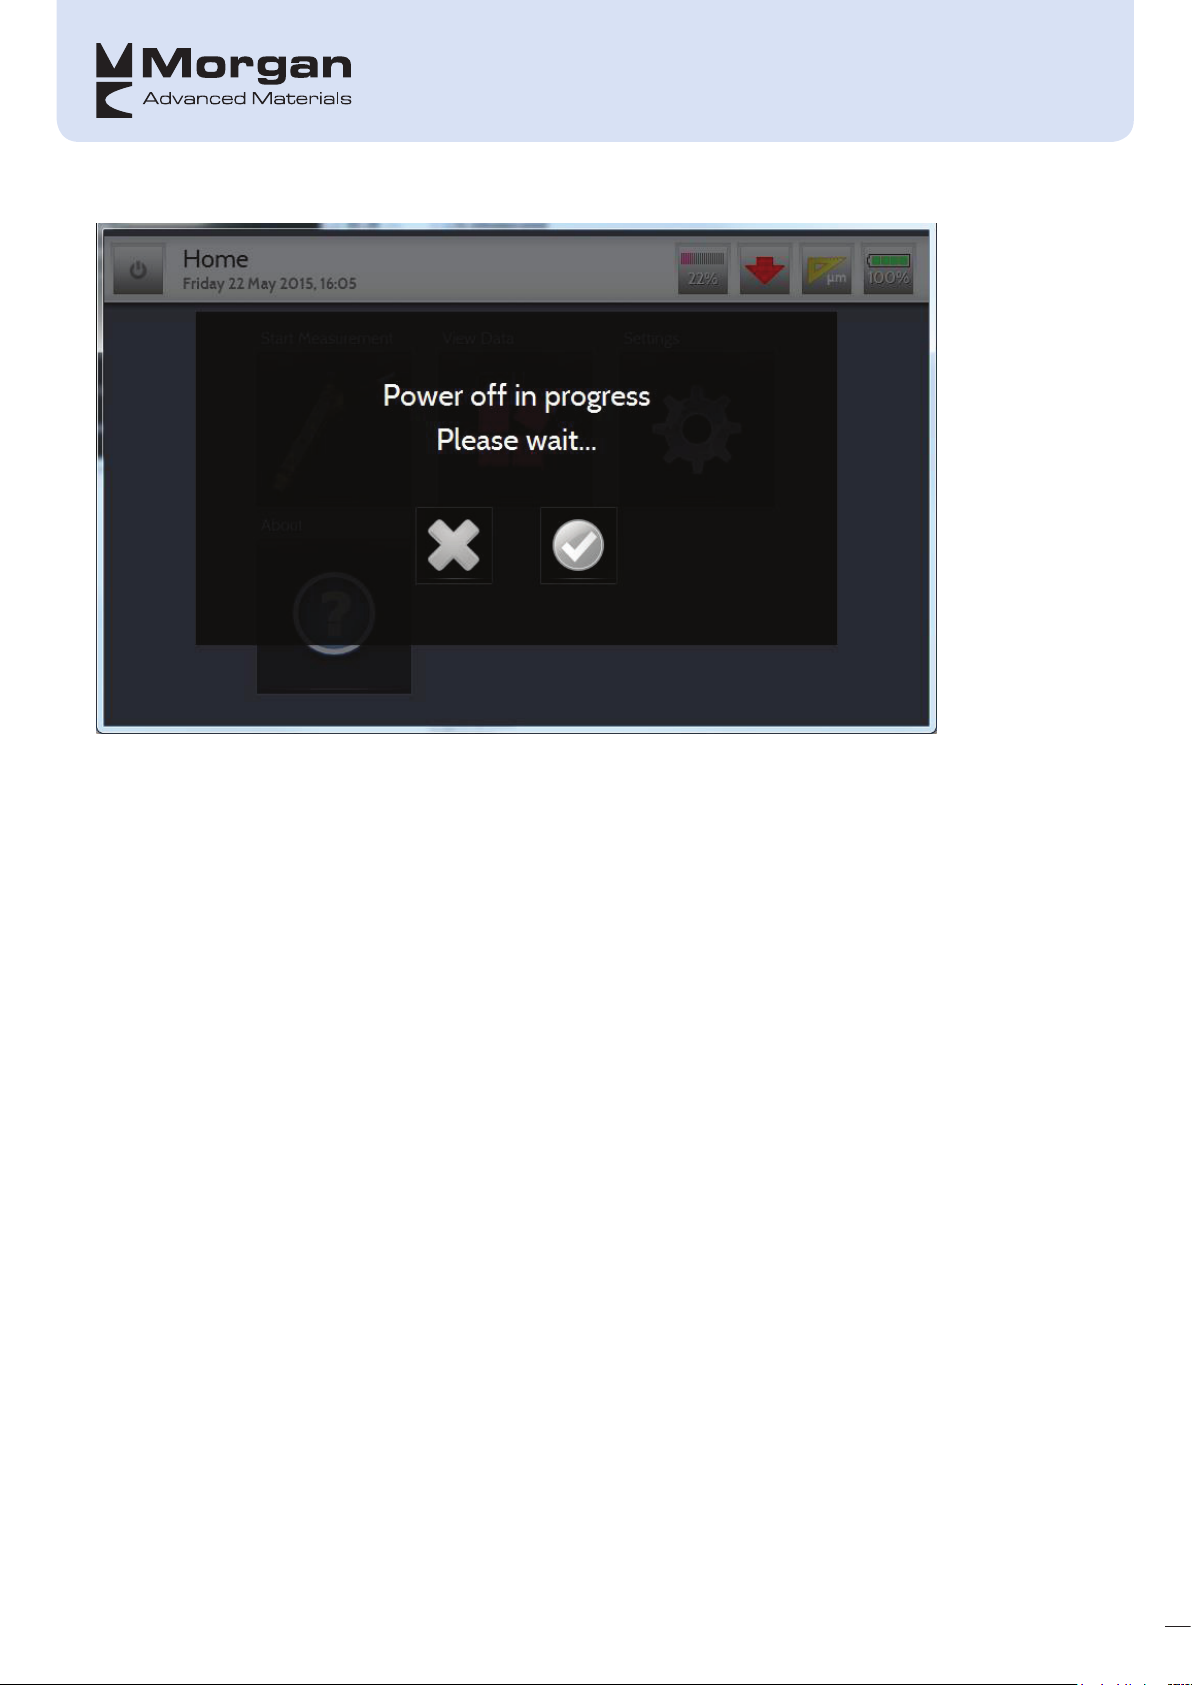
The Power Off button shows the following screen:
41
Return to home screen without turning off
Turns unit off
Page 47
42
Page 48
PC ANALYSIS SOFTWARE
DASPro14
1
3
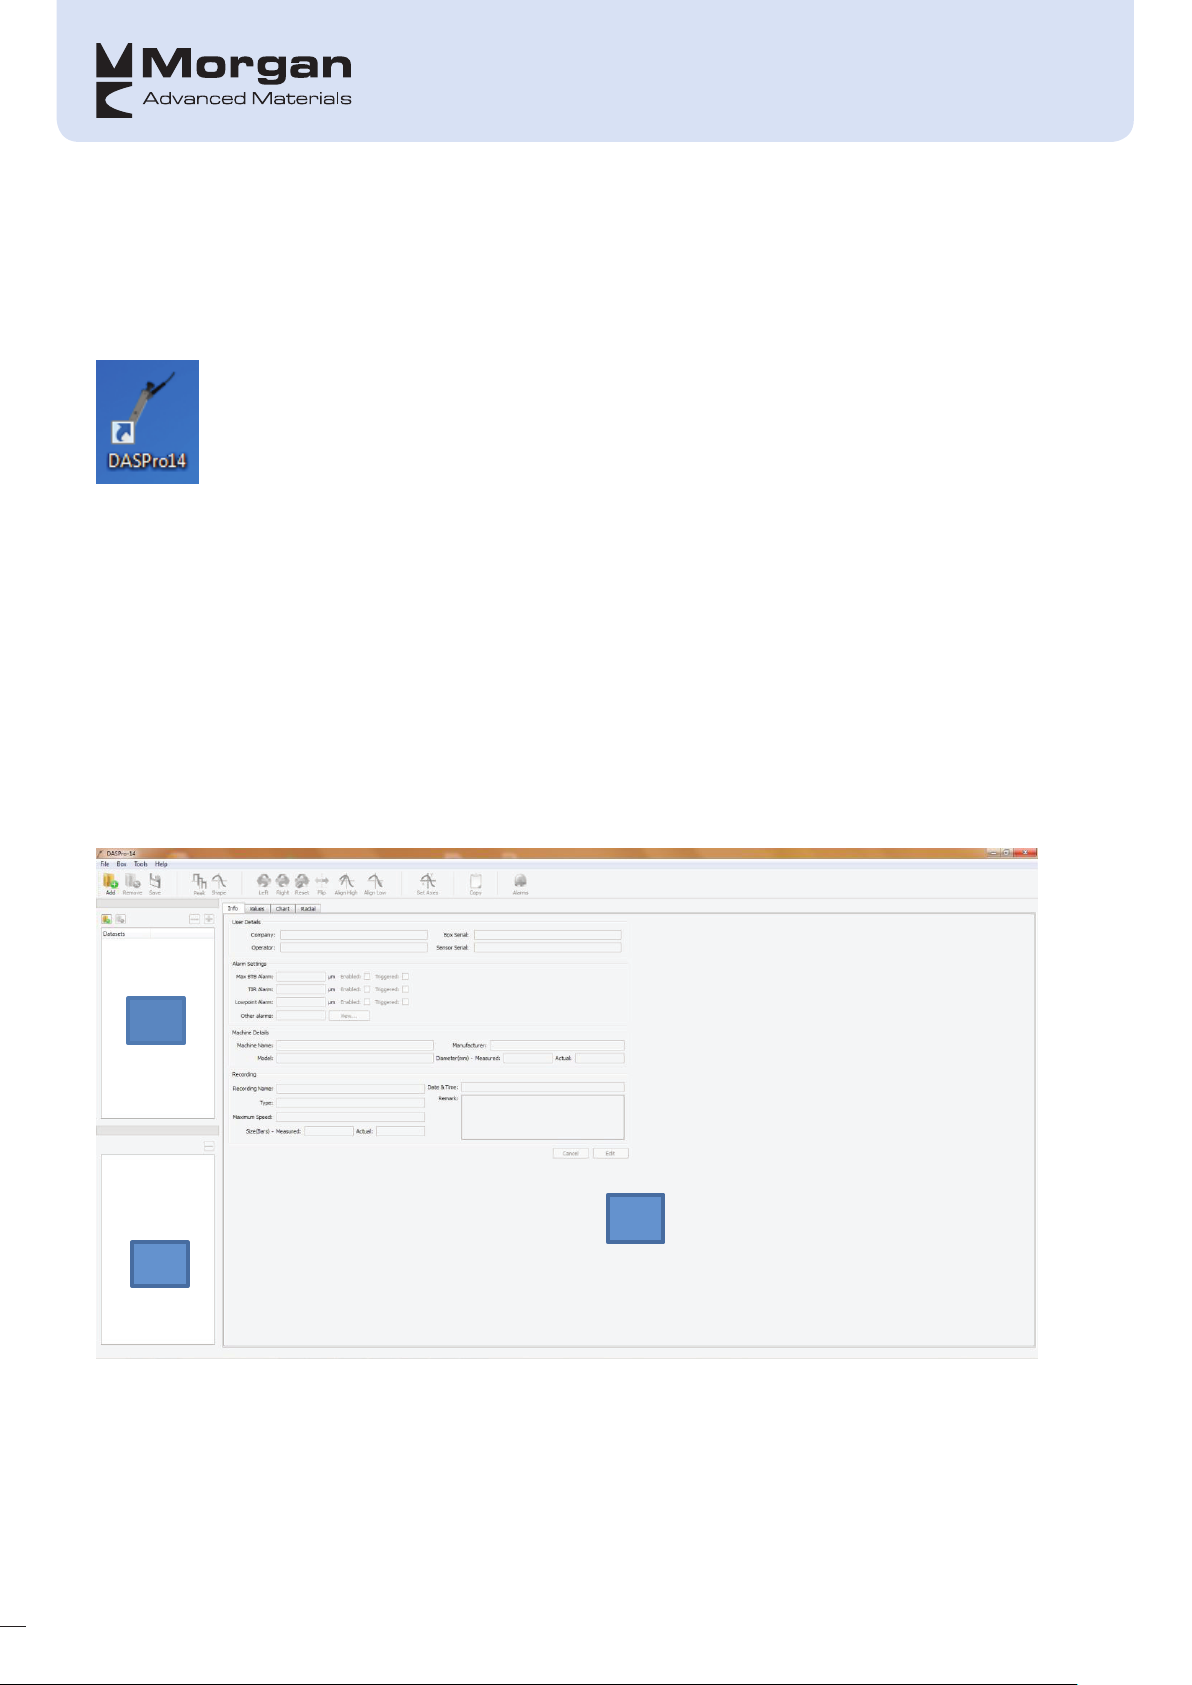
To open the DASPro14 software double-click the link as shown below:
GENERAL
• The DASPro14 can be run on a PC or Laptop running Windows® XP or higher.
• Multiple Measuring Boxes can be managed by a single PC or Laptop.
• Only one Measuring Box can be connected to the PC or Laptop at the same time.
handling multiple Measuring Boxes simultaneously.
• No licence is needed to run the DASPro14 software.
• Capability to import measuring files from the old PC profiler software
• Prepare a measurement on PC
• Download it to the measuring box
USER INTERFACE
There will be no support for
43
2
The main window contains the following areas:
• (1) Selected Downloaded datasets
• (2) Recordings list: Selected recordings from the downloaded datasets.
• (3) View area: this area will be used to plot the recordings, show values, etc. and has multiple tabs:
Page 49
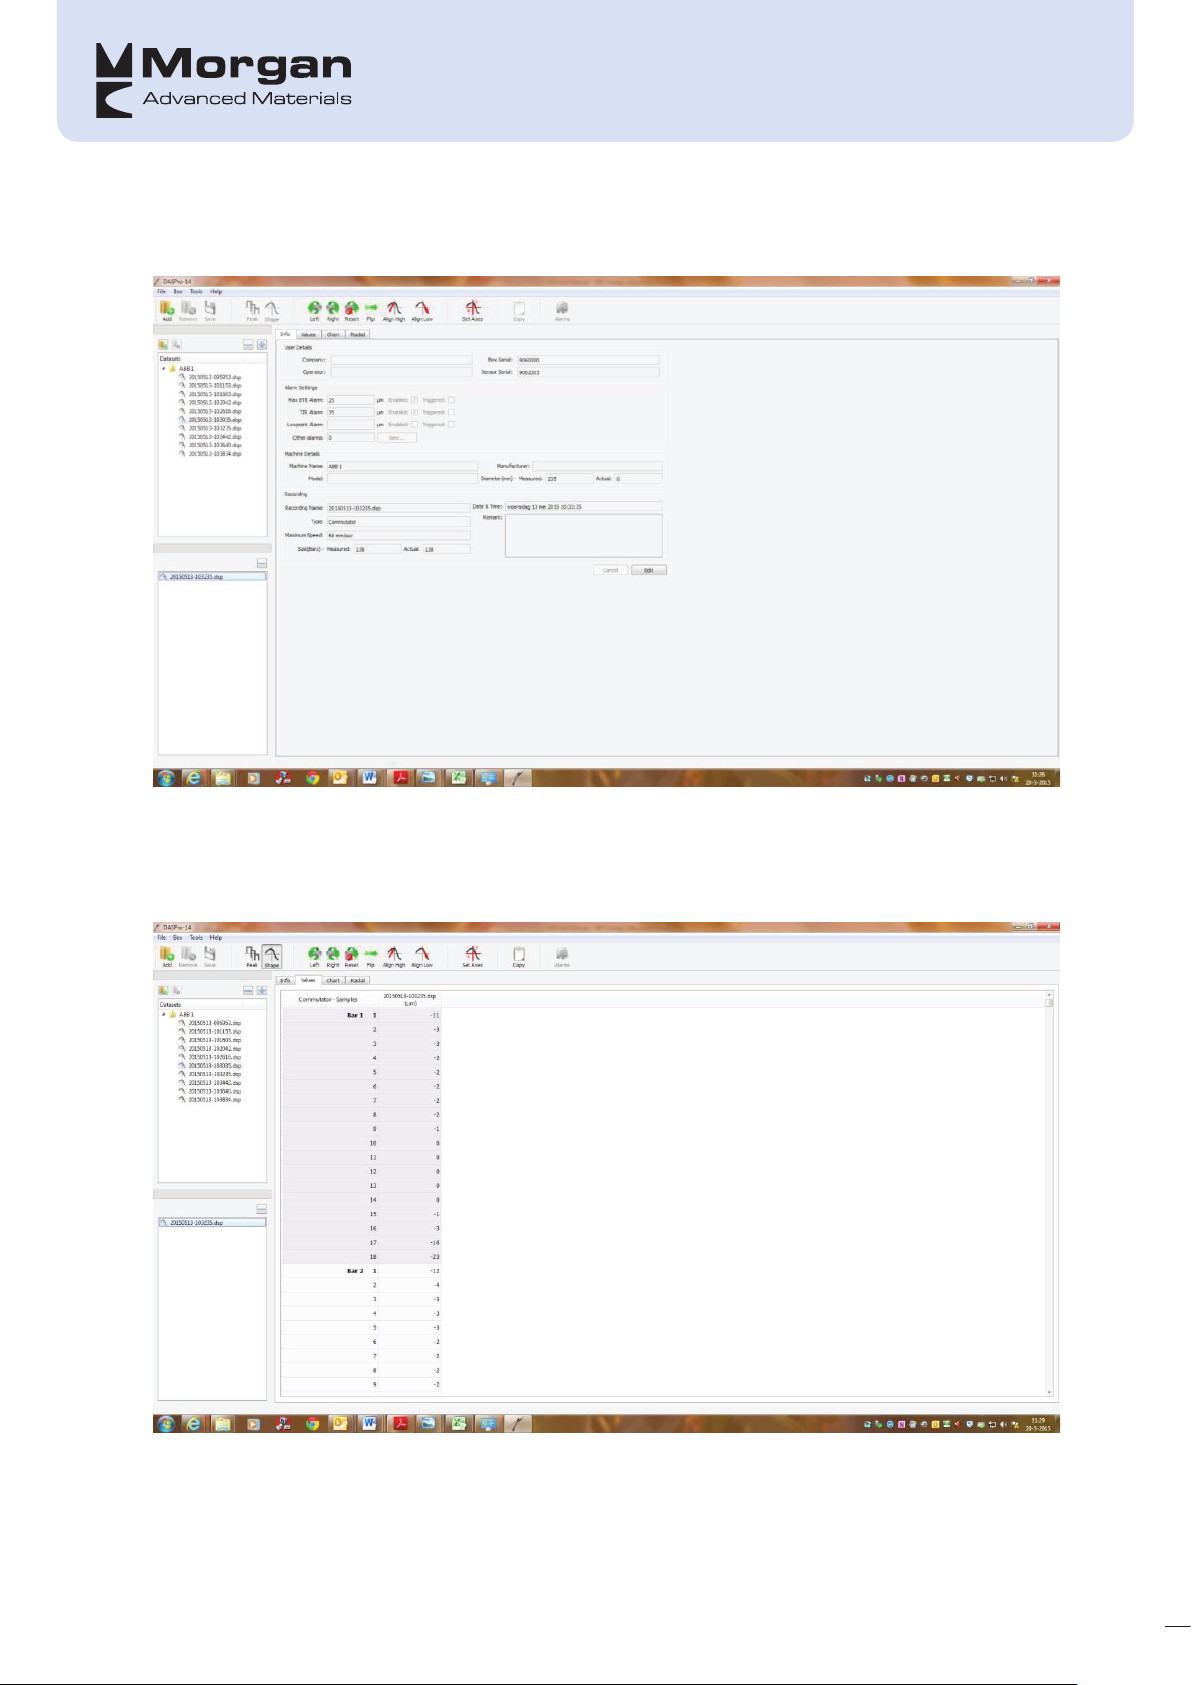
• Tab bar:
1. Info: The info tab shows information about the loaded measurement and allows the user to make changes:
a) User details (eg. Company, Operator, etc)
b) Alarm Settings: BTB, TIR, etc.
c) Recording details (eg. Name, type, size, etc.)
2. Values: This tab will show a table containing the measured values in numeric form. The values can be
modified by the user.
a) Ability to copy values to clipboard for pasting in another application (for example, Microsoft. Excel)
44
Page 50
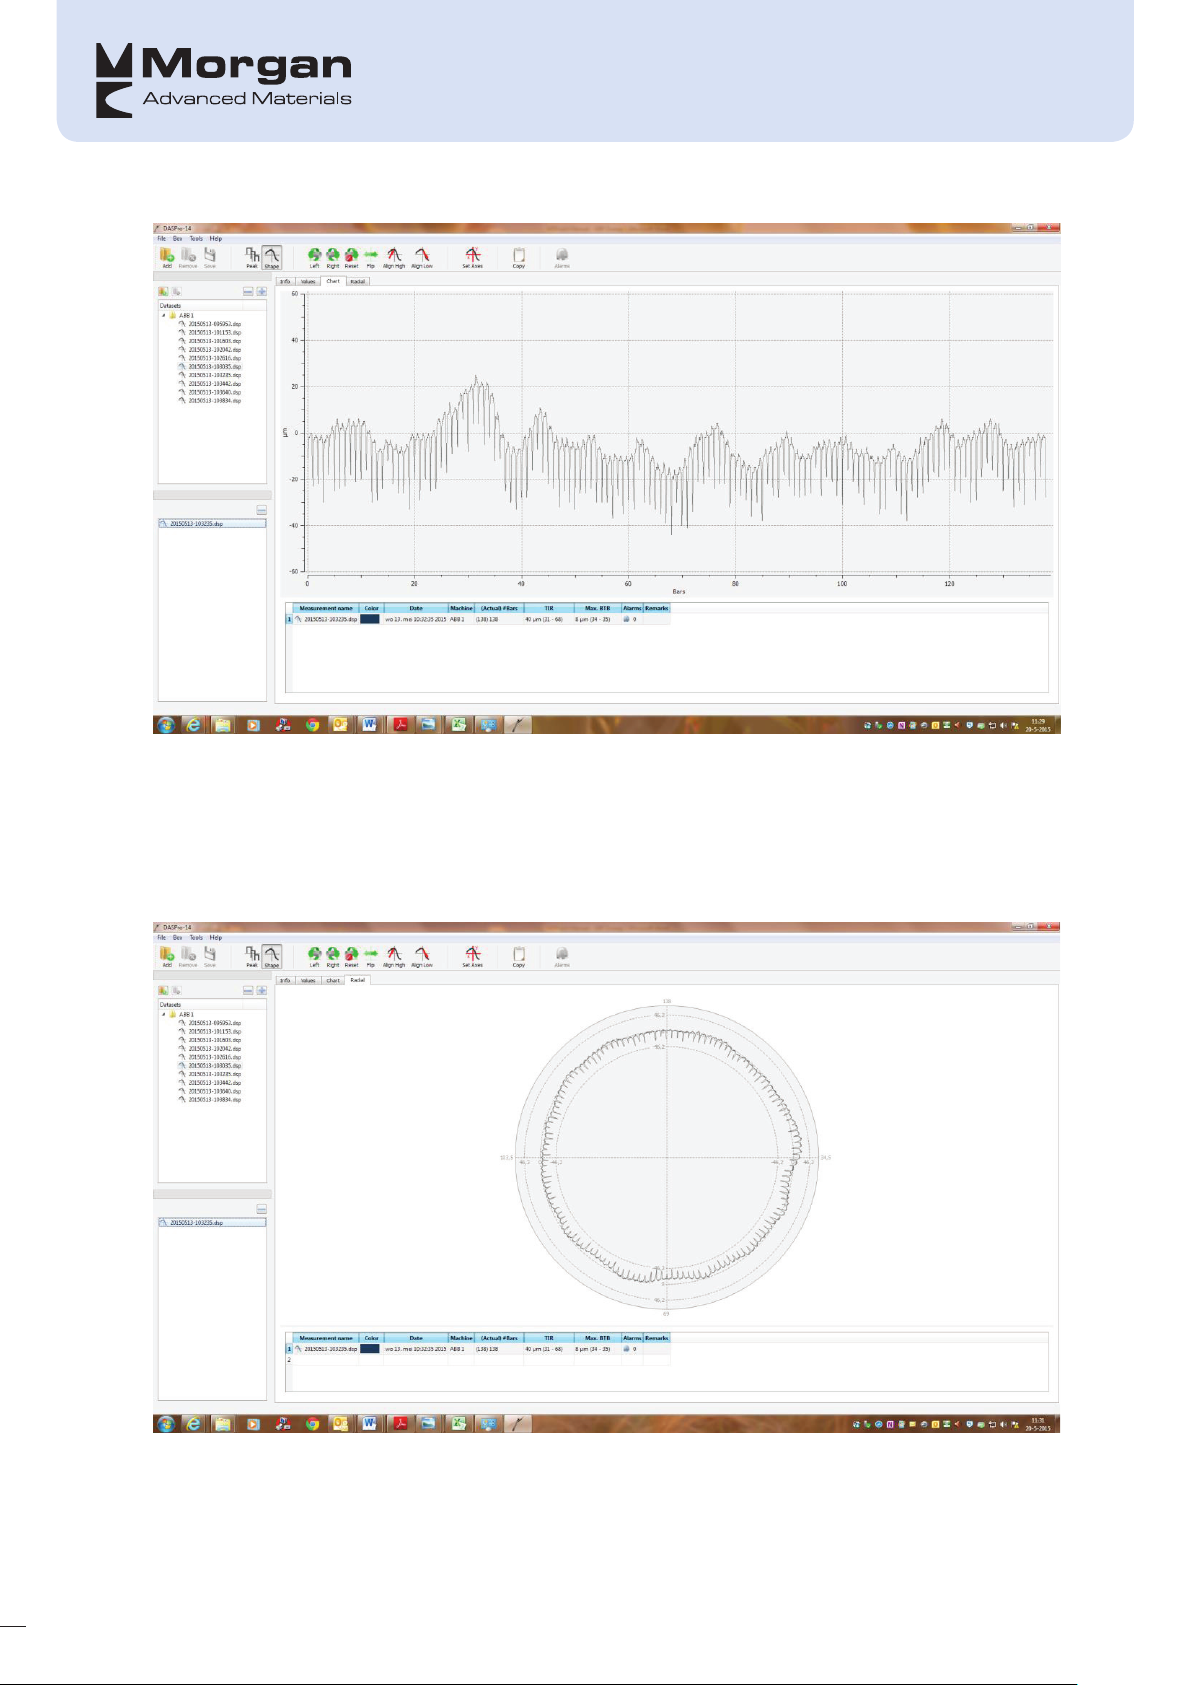
3. Chart: The chart tab will show a linear plot of the selected recording(s). Available functions are:
a) Pan & zoom
b)
Rotate, flip & align plot
c) Adjust axis scale & colours
d) Show/hide horizontal and/or vertical gridlines
e) Copy (copy chart plot + legend as a picture on the clipboard)
f) Print (chart plot + headers)
4. Radial: The radial tab will show a radial plot of the selected recording(s).
Available functions are:
45
a) Pan & zoom
Page 51
b)
Rotate, flip & align plot
c) Adjust axes scale & colours
d)
Show/hide middle circle, limit circles and/or central gridlines
e) Copy radial plot + legend as a picture on the clipboard
f) Print (radial plot + headers)
• Menu bar
1. File: file related functions like: open, save, close, etc.
2. Box
3. Tools
4. Help
• Button bar: The button bar will show the most commonly used functions as buttons. Depending on the
selected tab, other buttons will be available.
• Status bar: shows status information and is used for showing status information, for example:
1. Detected Measuring Box
2. PC/Measuring Box software update available (future option)
USING DASPRO14 FOR THE FIRST TIME
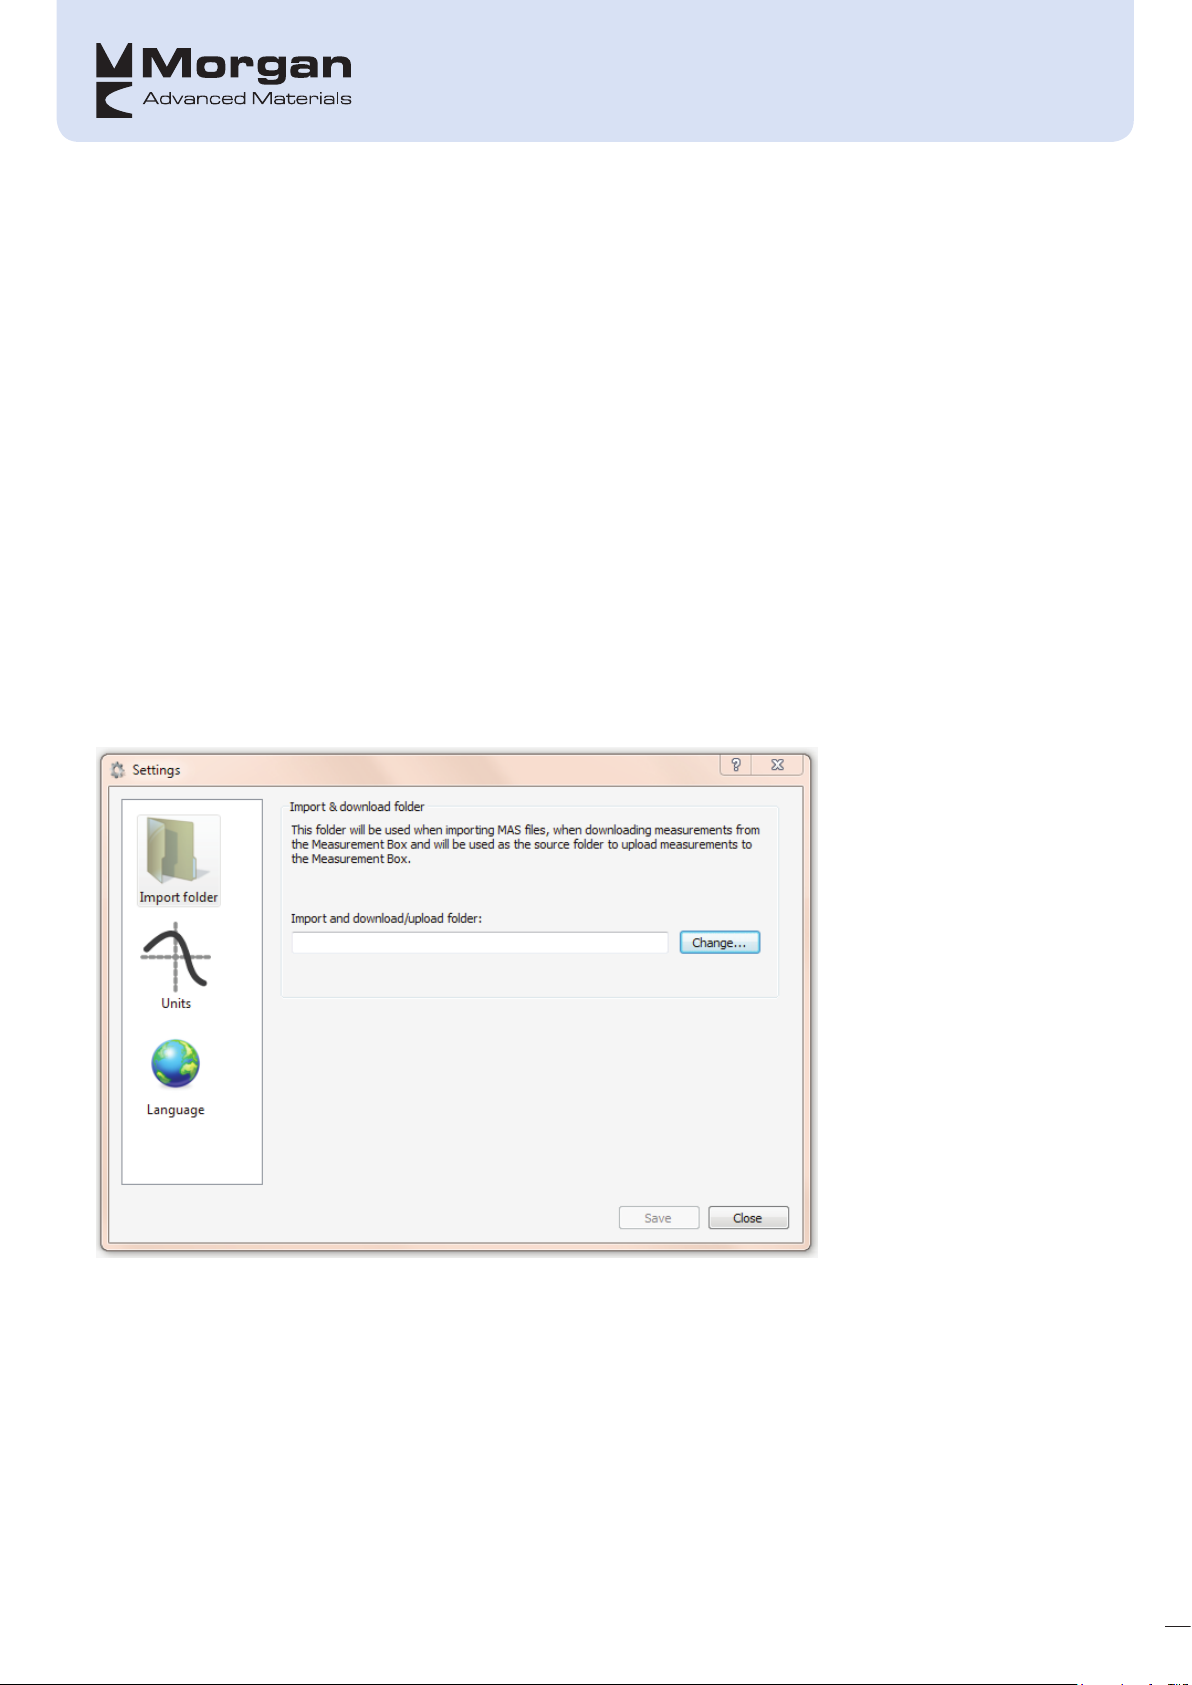
On first use the import folder in which the datasets will be downloaded to needs to be set; the following
screen will be displayed: (Note that this can be changed at any time by selecting “Tools>Settings”
The units and language can also be set in this screen
USING DASPRO14
Adding Datasets
There are 2 ways in which recordings can be added to the import folder:
• As in normal file handling and dragging and dropping the associated files directly from the MSPro14 unit
46
Page 52
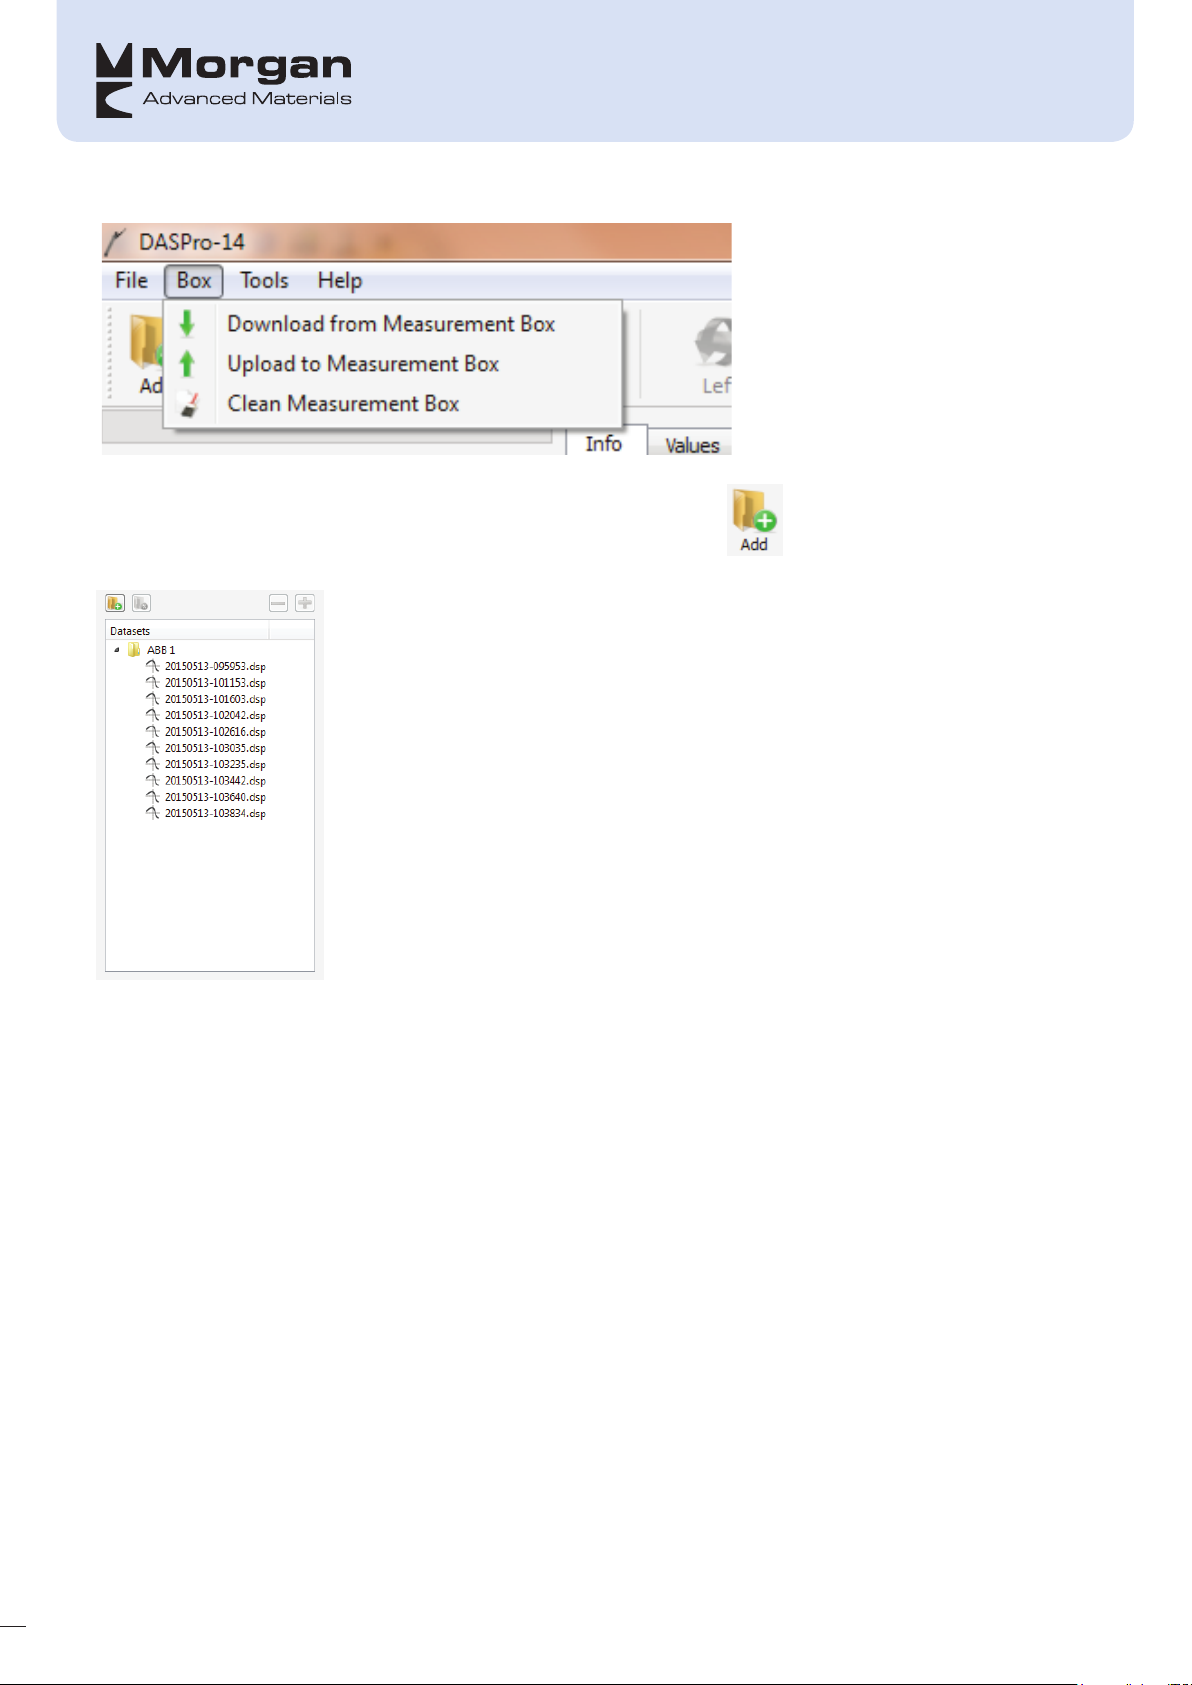
• By selecting “Download from Measurement Box” and following the on-screen instructions
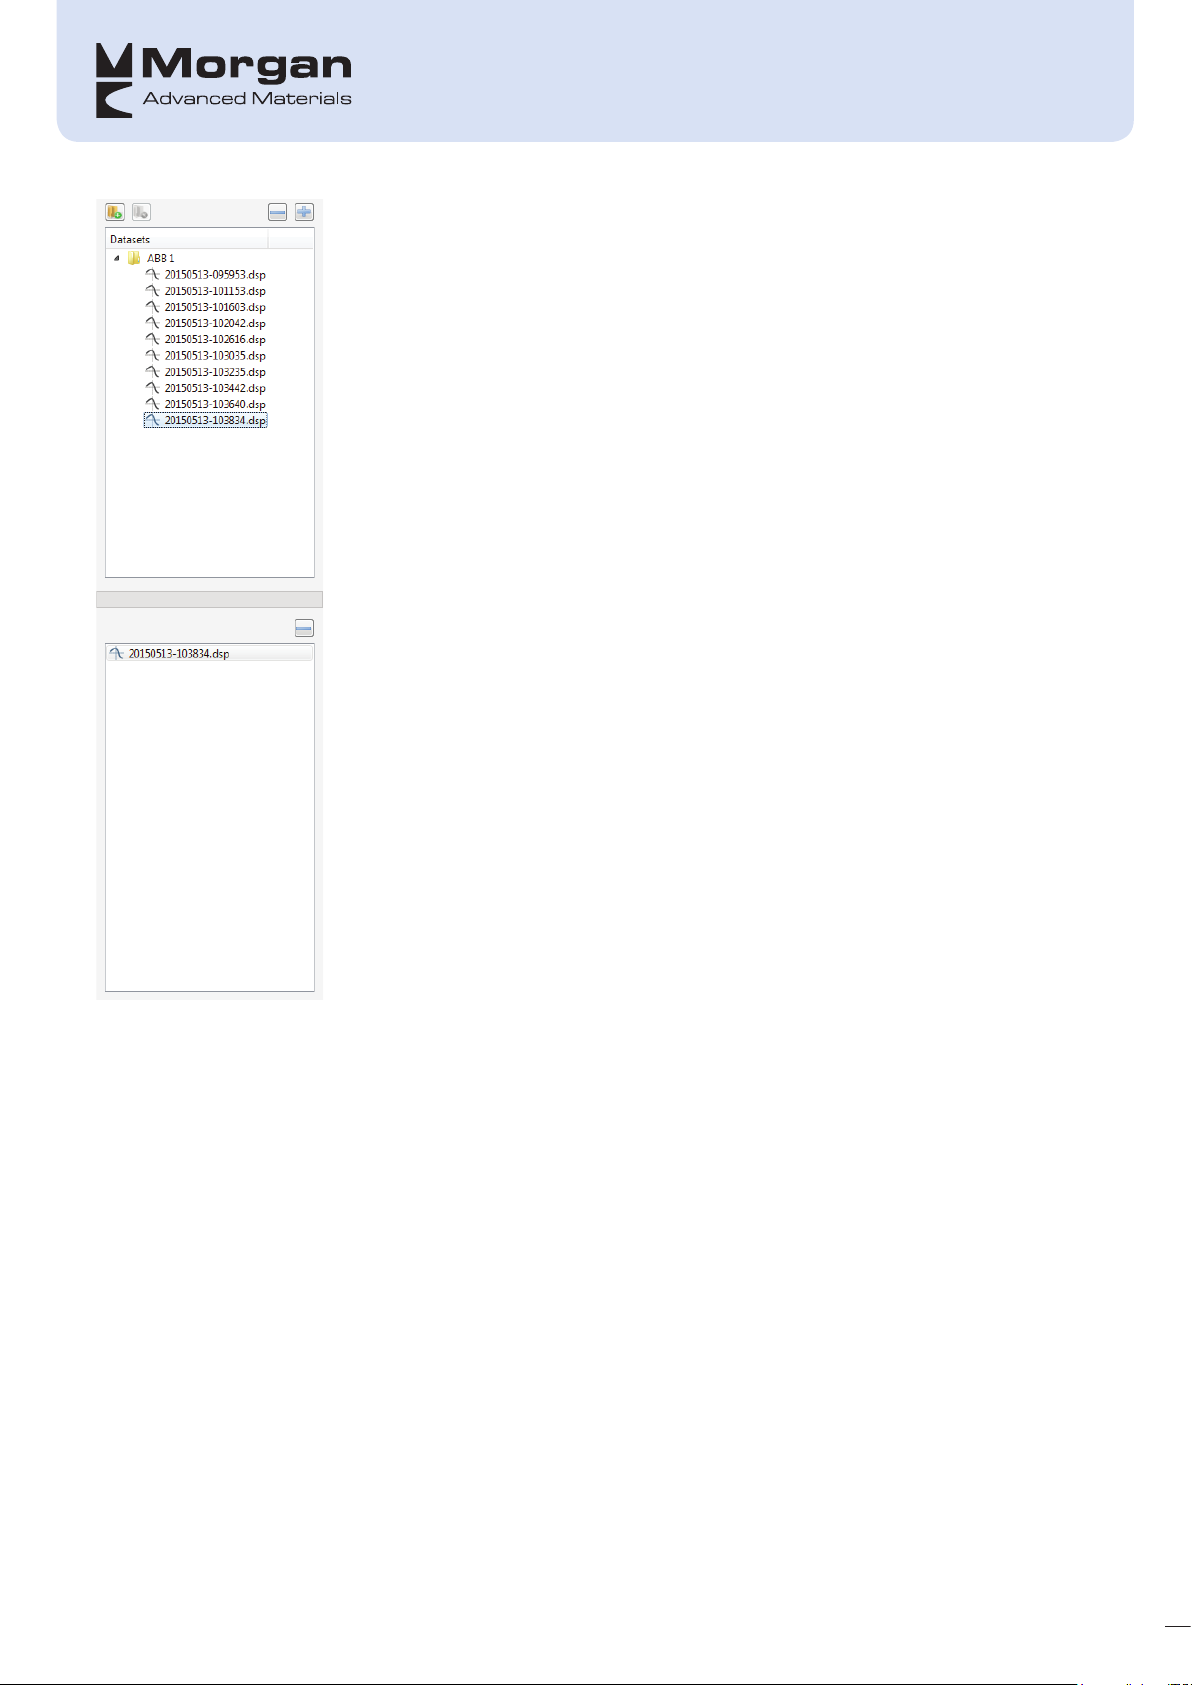
Once there are datasets on the PC, they can be added by pressing the button; the dataset will then be
displayed in the dedicated area. Clicking on the dataset displays the individual recordings:
Double-clicking on the individual recording will add it to the recordings list where it can be viewed in detail by
selecting one of the 4 different tabs
47
Page 53
Printing
To print a report on the data, click File>Print Report and select what needs to be printed from the
available options and follow on-screen instructions
48
Page 54
Reading and Comparing Values
• When a chart is displayed it is possible to follow the profile and obtain specific information along the
length of the profile; this can be done by placing the cross-hair at the required point and clicking the left
mouse button. Once this is done a horizontal and vertical line will appear, and the values indicated by the
cross-hair are displayed in the top right-hand corner of the chart
• Note that the cross-hair can be moved by pressing the left and right arrows on the keyboard
Adjusting Profiles
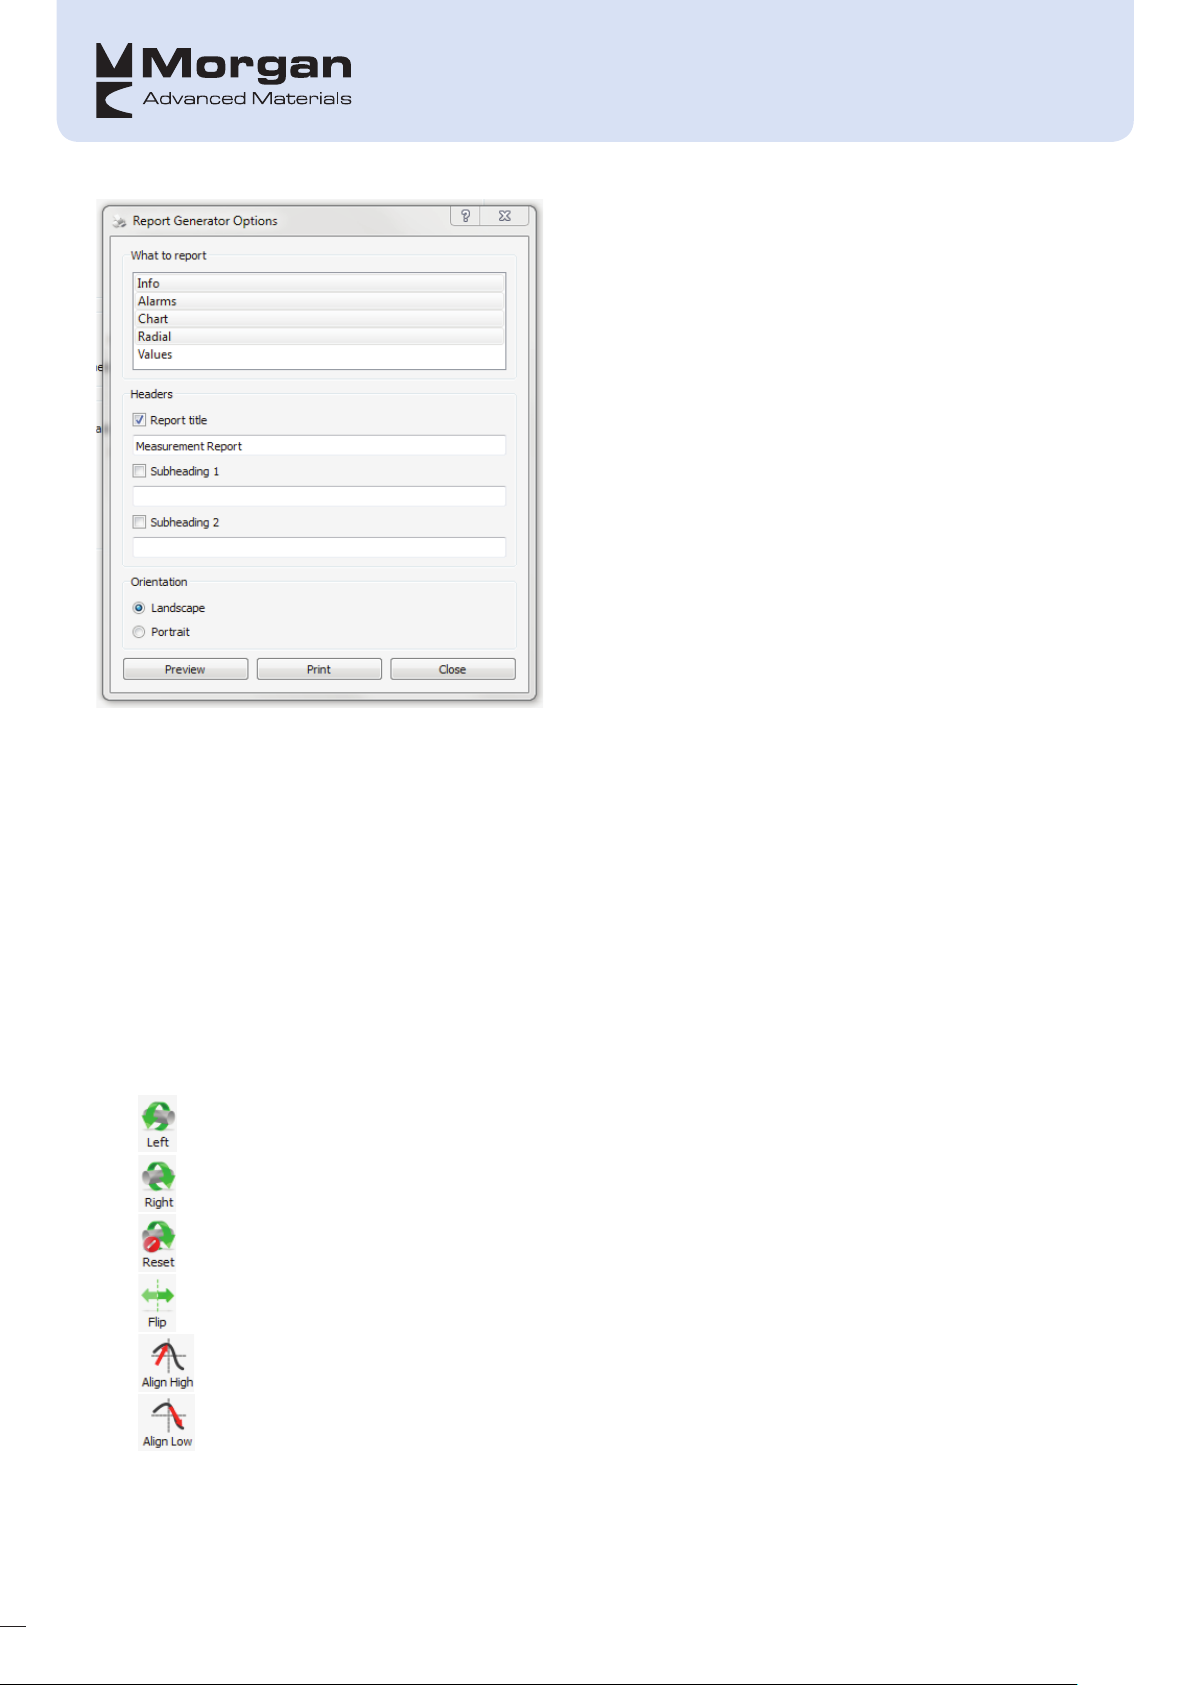
There are 6 different buttons available to allow the user to adjust the way in which the profiles are displayed
and mean that profiles that were taken on the same machines, but from different starting positions, can be
aligned.
Move the profile left by one bar/segment
Move the profile right by one bar/segment
Return the profile to its original position
Mirroring the profile
49
When there are 2 or more profiles this aligns the profile to
the highest bar/segment
When there are 2 or more profiles this aligns the profile to
the lowest bar/segment
Page 55

Zooming behaviour
• Zooming is only possible in the Chart and Radial tabs. To zoom in on any part of a chart:
1. Left-click a place on the left side of the chart section you wish to zoom.
2. Hold down the mouse button while you drag a rectangle across and down to the right.
3. Release the mouse button to perform the zoom.
4. Proceed as above, but only move the mouse directly left or right to select the area to be
vertical lines will be displayed across the chart to indicate the selection.
•
To zoom in vertically:
1. Proceed as above, but only move the mouse directly up or down to select the area to be
horizontal lines will be displayed across the chart to indicate the selection.
• To zoom out from any view:
1. Left-click any place in the chart and drag a rectangle across and up to the left to display a
a cross in it. When you release the mouse button the chart will return to its
To zoom in horizontally:
enlarged. Two
enlarged. Two
rectangle with
original size and location.
Alarms
The PC-Software can check the commutator and slip ring recordings for the following alarm conditions. If the
button is in colour then it will indicate that an alarm has been triggered on the selected profile, if black
and white then no alarms are triggered:
• TIR - Total Indicated Runout
– The difference between the highest and lowest points
• MBTB - Maximum Bar-to-bar
– The difference in height between adjacent commutator bars.
• MSTS - Maximum Segment to segment
– The difference in height between adjacent slip ring segments.
•
High Mica
– Lists any Mica insulation (between commutator bars) which are not recessed below the bar
surface.
on the profile.
Downloading .Mas files
It is possible to download profiles taken on the previous version of the profiler that Morgan used to offer; this
can be done by selecting “File>Importing MAS File…” and following the on-screen instructions.
50
Page 56
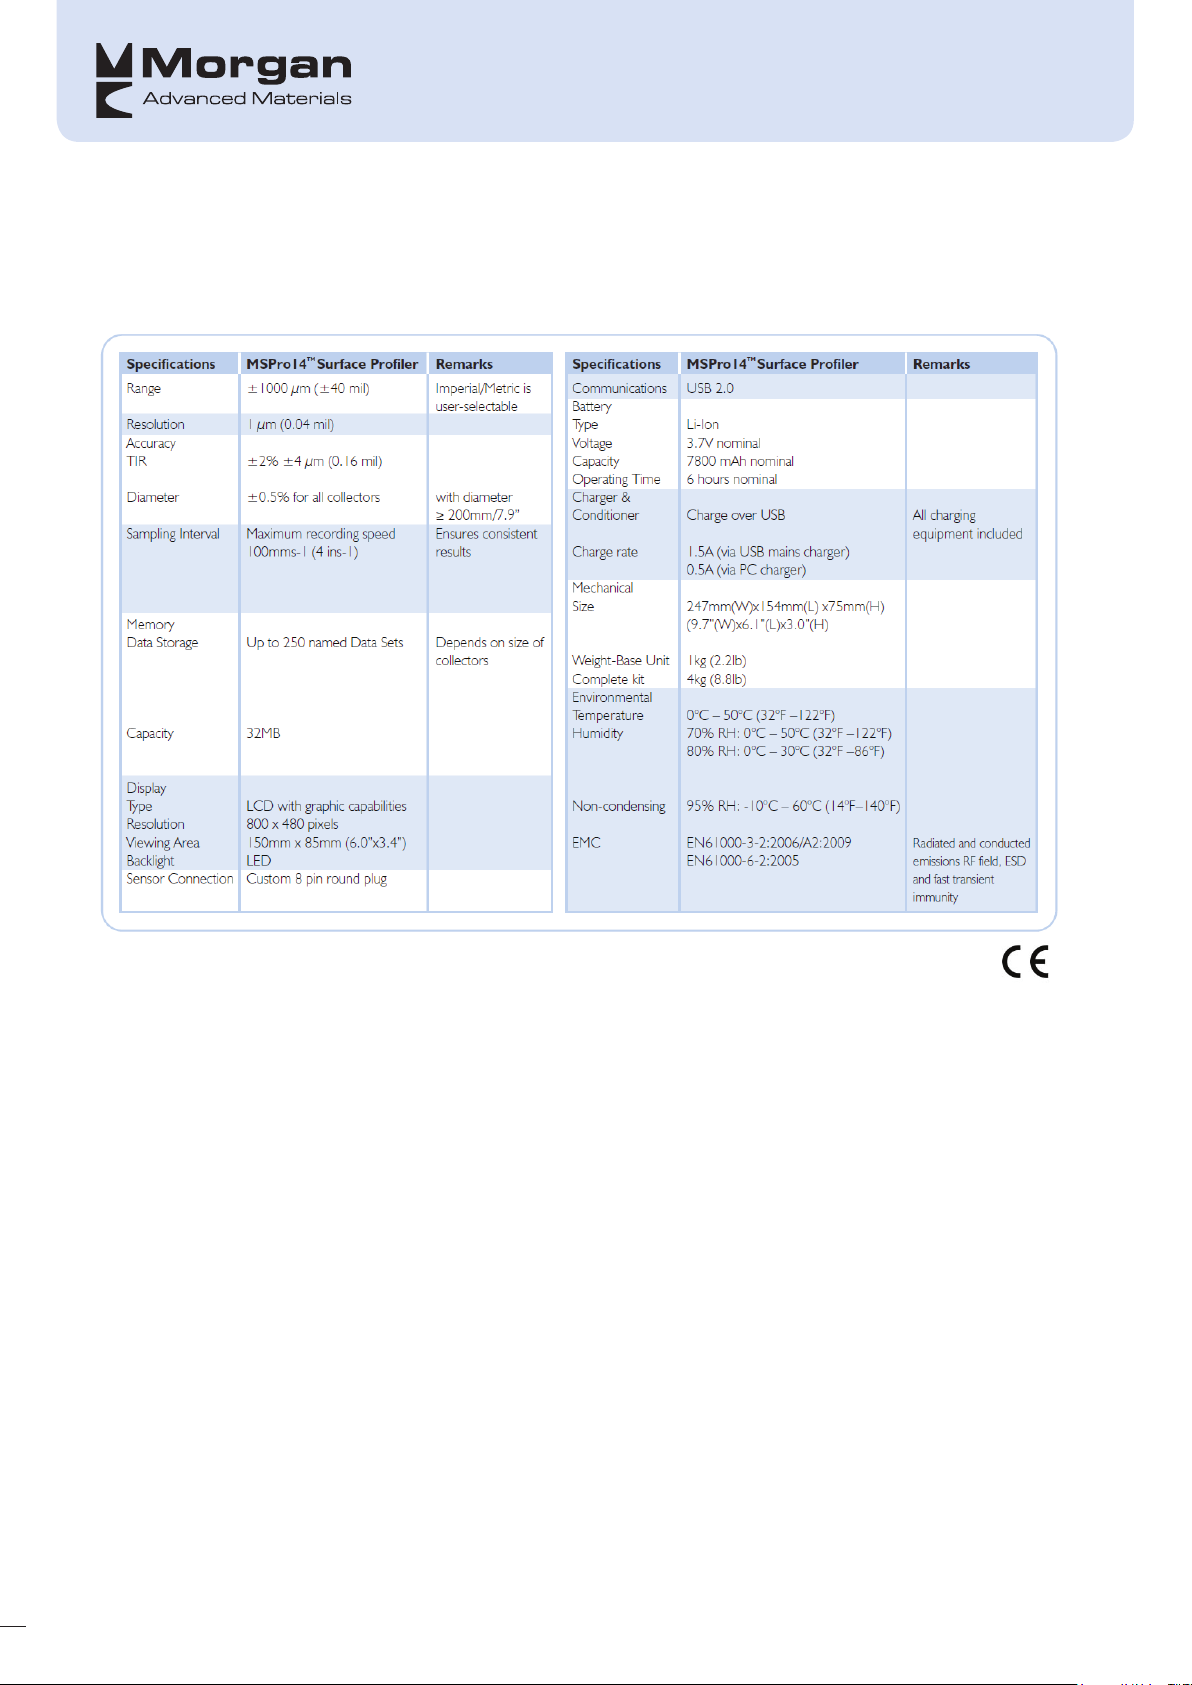
APPENDIX A: SPECIFICATIONS
These specifications may be changed in future versions:
51
Page 57

APPENDIX B: WARRANTY & REPAIRS
Warranty
The warranty covers construction and material faults of the MSPro14 equipment and the warranty period is
valid for 1 year after invoicing.
Damage due to incorrect or inexpert handling is excluded from the warranty. Do not open the housing of the
MSPro14 unit yourself as this will invalidate the warranty.
Repairs & Calibration
Repairs can and will be done by (or under the authority of) the developer/manufacturer; this can also be
done elsewhere but this is at the Users own risk .
In the unlikely event that repairs are necessary please contact your local Morgan sales office. They can
inform you on how to proceed. You can contact them as well if you want to have your MSPro14 calibrated.
52
Page 58

M O R GAN AD V ANCED M ATERIA L S
Our manufacturing sites are ISO 9001 and where applicable ISO 13485 certified
For all enquiries, please contact our specialist sales and manufacturing sites:
TRANSPORT
LISTED ON
THE LONDON
STOCK
EXCHANGE
SELLING INTO
>100
COUNTRIES
MANUFACTURING IN
>30
COUNTR IES
For all enquiries, please contact our specialist sales and manufacturing sites:
The Netherlands
China
USA
OVER
9000
EMPLOYEES
Asia
Morgan Advanced Materials
Oude Veiling 3
1689 AA Zwaag
The Netherlands
T +31 229255555
F +31 229255541
Visit our website
www.morganadvancedmaterials.com
Morgan Advanced Materials
4250 Longwu Rd.
Shanghai 200241
China
T +86 (21) 64342745
F +86 (21) 64342850
Follow us on
twitter.com/morganadvanced
Morgan Advanced Materials plc
Quadrant, 55-57 High Street,
Windsor, Berkshire, SL4 1LP United Kingdom
Copyright 10.2014
Morgan Advanced Materials
251 Forrester Drive
Greenville, SC 29607
USA
T +1-864-458-7777
F +1-864-281-0180
facebook.com/MorganAdvancedMaterials
Follow us on
Morgan Advanced Materials
21 Amour Street, Revesby
NSW, 2212
Australia
T +61 2 9772 5600
F +61 9774 5677
linkedin.com/company/morgan-advanced-materials
Follow us on
www.morganadvancedmaterials.com
 Loading...