

Page 1

Step-by-Step OptimizatiOn Guide
W O R L D O F W O N D E R
Page 2

GET READY TO EXPERIENCE
THE WORLD OF HIGH DEFINITION AT ITS VERY BEST!
You’ll learn all about HD Home Theater along with Goofy and get guidance from the
pros on how to fine-tune your system for maximum performance. Then, sit back, relax,
and experience all the excitement of Disney WOW World of Wonder — the ultimate fun
and easy guide to getting the most from your HD Home Theater.
IT’S EASY!
This handbook will explain how to use the WOW A/V Tools. You will find both beginner and
advanced sections to choose from along with simple step-by-step instructions. A/V Tools
in the Beginner section are designed for ease of use in the proper alignment of your Home
Theater Equipment. The Advanced section contains A/V Tools that address professional
evaluation and calibration tasks for specific monitors, displays, and projectors.
GETTING STARTED
When calibrating your system, it is recommended that you make the adjustments in the
same type of viewing environment in which you typically watch TV. Some televisions
feature settings that might affect the proper calibration of your television. If you encounter
difficulties in calibrating your TV, try changing these settings first and then re-calibrate
using the on-screen guide.
The labels for controls used in this booklet may be different from the names used in the
menus on your television. Please refer to your owner’s manual if you have any questions
about how your controls are labeled.
Throughout this booklet, you will see Test Patterns marked with an Asterisk (*). These are
Digital Reference Standard (DRS) images. These DRS images are a basic representation of
how the correct or optimal settings should appear on your TV. Please note that the images
in this booklet are for reference only. Printing limitations prevent Test Pattern images from
being an exact representation of how they appear on your TV.
Under no circumstances should you open your system to expose electronic circuitry or attempt to
adjust internal controls. You may cause serious damage to your equipment and endanger yourself.
W A R N I N G
BEGINNER
QUICK & EASY CALIBRATION
VIDEO
Brightness . . . . . . . . . . . . . . . . . . . . . . . 3
Contrast . . . . . . . . . . . . . . . . . . . . . . . . .4
Aspect Ratio . . . . . . . . . . . . . . . . . . . . . 6
Color . . . . . . . . . . . . . . . . . . . . . . . . . . . .9
Sharpness . . . . . . . . . . . . . . . . . . . . . . 10
Viewing Angle . . . . . . . . . . . . . . . . . . .11
ADVANCED
PREMIUM CALIBRATION TOOLS
MONITOR SELECTION
Advanced Brightness . . . . . . . . . . . . 16
Advanced Contrast . . . . . . . . . . . . . . 18
Aspect Ratio . . . . . . . . . . . . . . . . . . . . . 6
Convergence . . . . . . . . . . . . . . . . . . . 20
DISPLAY EVALUATION TOOLS
MONITOR SELECTION
Purity Test . . . . . . . . . . . . . . . . . . . . . .34
Scaling Test . . . . . . . . . . . . . . . . . . . . .35
Advanced Scaling 1 . . . . . . . . . . . . . .37
Advanced Scaling 2 . . . . . . . . . . . . . .38
Sharpness / Focus . . . . . . . . . . . . . . .28
Hyperbolic Zone Plate . . . . . . . . . . .39
AUDIO SET UP TOOLS
SPL METER NOT REQUIRED
Speaker ID . . . . . . . . . . . . . . . . . . . . . . 13
Polarity Test . . . . . . . . . . . . . . . . . . . . 13
Noise Floor . . . . . . . . . . . . . . . . . . . . . 14
Buzz & Rattle Test . . . . . . . . . . . . . . . 15
A/V Sync Test . . . . . . . . . . . . . . . . . . . 33
EXPERT
HD Shootout . . . . . . . . . . . . . . . . . . . 50
PIXEL FLIPPER
Pixel Flipper . . . . . . . . . . . . . . . . . . . . 51
AUDIO
Speaker ID . . . . . . . . . . . . . . . . . . . . . . 13
Polarity Test . . . . . . . . . . . . . . . . . . . . 13
Noise Floor . . . . . . . . . . . . . . . . . . . . . 14
Buzz & Rattle Test . . . . . . . . . . . . . . . 15
Chroma & Hue . . . . . . . . . . . . . . . . . .23
Sharpness / Focus . . . . . . . . . . . . . . .28
Overscan Test . . . . . . . . . . . . . . . . . . 30
A/V Sync Test . . . . . . . . . . . . . . . . . . .33
White-Black Clipping . . . . . . . . . . . . 41
Viewing Angle Test . . . . . . . . . . . . . . .11
Gamma Response . . . . . . . . . . . . . . .43
Grayscale . . . . . . . . . . . . . . . . . . . . . . 44
Compound Test Chart . . . . . . . . . . . 46
SPL METER REQUIRED
Speaker Level Adjustment . . . . . . . .48
Subwoofer Level Adjustment . . . . 49
Video Encoder Stress Test . . . . . . . 50
A/V Tools Direct Access . . . . . . . . . . 51
BD-LIVE™ EXPERIENCE
Making The Connection . . . . . . . . . . 51
Page 3

BEGINNER | QUICK & EASY CALIBRATION
VIDEO
GENERaL INFORmatION
BRIGhtNEss
BLACK LEVEL
VIDEO
CONNECTIONS
First, you need to know how your display is connected to
your system. For High Definition systems, you may be digitally
connected with HDMI or DVI. This will provide the most accurate
signal to your display.
For analog systems, you may be connected with VGA or Component
cables. These are capable of HD resolutions but will not provide the
best HD image accuracy or experience. If you are unsure of your
connection, please consult your owner’s manual.
AUDIO
Audio connections from your playback equipment may be either
digital or analog. Digital audio connections include HDMI, Fiber
cable or S/PDIF copper cables. Analog connections are typically
copper cables utilizing RCA Phono Pin connectors. If you are unsure
about your audio connections, please consult your owner’s manual.
CALIBRATION
2 3
The A/V Tools on this WOW disc will allow you to calibrate your
system in order to get the best possible picture and sound. The
Video test patterns can be used to calibrate CRT based TV sets,
flat-panel displays and projection equipment. Audio test signals
are selectable for a variety of sound formats from Stereo to 7.1
Channel Surround.†
The calibration test signals will enable you to adjust controls on
your equipment to achieve optimal settings. Other tests are
designed for evaluation only, intended to measure general system
performance. This will allow you to identify whether or not your
system needs attention from a qualified technician.
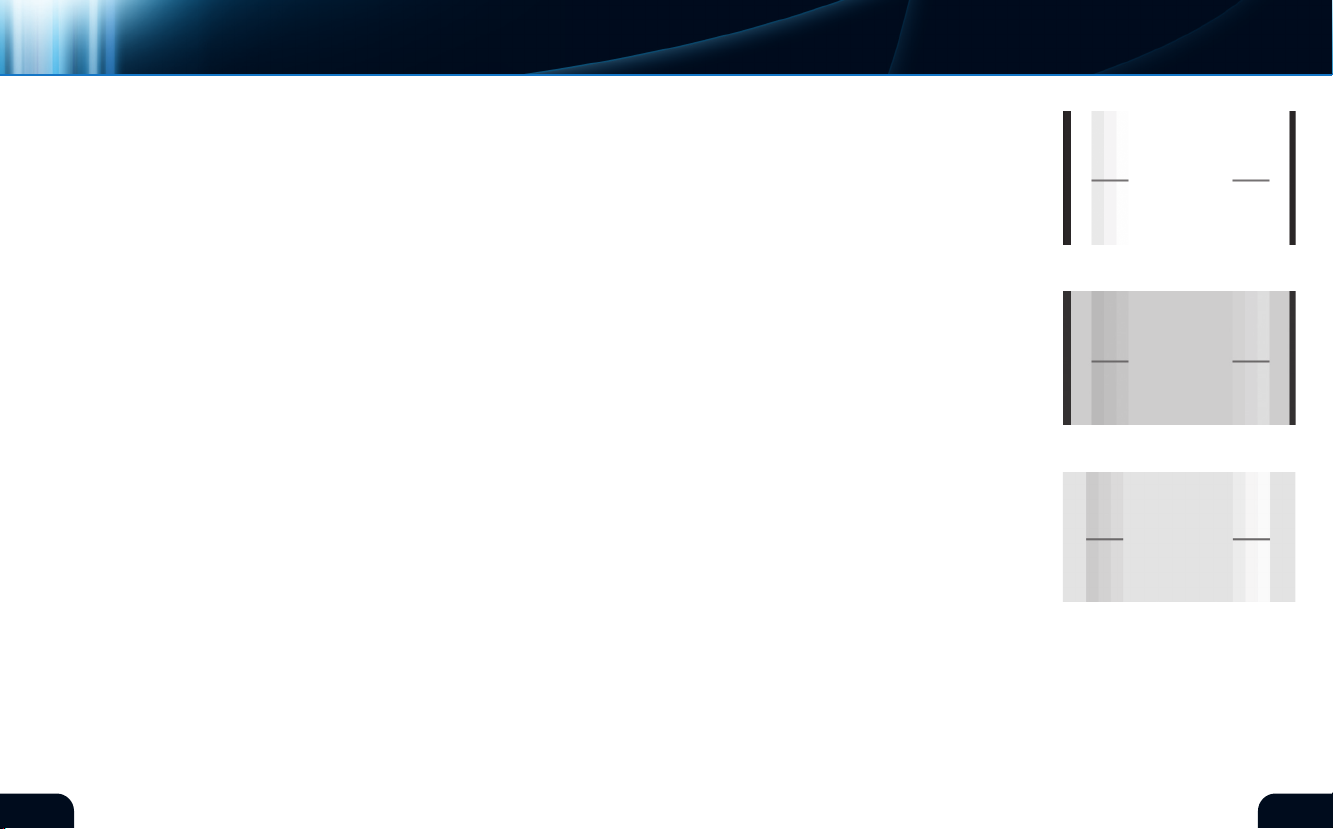
The Brightness PLUGE (Picture Line Up GEnerator) pattern contains
two groups of vertical strips. The left group of strips are three
steps slightly darker than ideal black and the right group are three
steps slightly brighter than ideal black. These strips will assist in
the adjustment of the Brightness control. Room
lighting and type of display will affect where this
control is adjusted. Use lighting representative of
your viewing situation to adjust the monitor.
The top sample on the right (figure 1) shows the
Brightness control set too high. Notice the black
area is slightly grey instead of jet black and all of
the vertical test strips are also visible. Lower the
Brightness control until only the brighter right
hand steps are visible.
The middle sample on the right (figure 2) shows
the Brightness control adjusted too low. All of
the test strips are extinguished; this condition is
called “black clipping.” Clipped blacks will display
shadow areas as solid black where there should
be subtle detail. The Brightness control should
be raised until the brighter test strips on the right
side come into view.
The bottom sample on the right (figure 3) shows a
properly adjusted Brightness control. Only the right
hand vertical steps are visible while the left hand steps
are not. The black area in between is ideal black.
Too High. (figure 1)
Too Low. (figure 2)
Correct. (figure 3)*
*Digital Reference Standard† For 7.1 Demo clips, access The Nightmare Before Christmas
OVERVIEW
Page 4
BEGINNER | QUICK & EASY CALIBRATION
VIDEO
The visibility of the brighter steps indicates that subtle detail in
shadow areas will be visible while the absence of the darker steps
shows the monitor’s ability to display true black is being fully
utilized.
A monitor adjusted in a dark room will appear too dark when
the room is lit. A monitor adjusted in a lit room may appear too
bright in a darkened room. Perform these adjustments in lighting
conditions typical of the normal viewing environment.
CONtRast
WHITE LEVEL/PICTURE
OVERVIEW
The center area of the white box represents ideal video white with
two groups of vertical strips. Set the Contrast control so the center
area appears as a fully white object would, like a white shirt, white
clouds or piece of white paper. On either side of center, you’ll see
vertical strips that are three steps brighter on the right and three
steps darker on the left (figure 6).
The top sample on the right (figure 4) shows the Contrast control
adjusted too high. The white strips on the right are washed
out, called “white clipping.” The video signal has exceeded the
capability of the monitor to show detail in the brightest whites.
Lower the Contrast control until you see at least one of the three
lighter vertical strips on the right.
center of the white box appears as a fully white
object with at least one of the right hand vertical
strips still showing. At this setting, the monitor is
showing whites near the maximum performance
capability of the display.
The bottom sample on the right (figure 6) shows
a proper maximum contrast setting with two of
the brightest vertical strips blending together.
This means the upper limits of light output from
the monitor have been reached.
Brightness and Contrast adjustments are
affected by room lighting in the viewing area.
If your room lighting is relatively dark such that
these settings create an image that’s too bright,
you may reduce the Contrast setting to create a
more comfortable picture. The Contrast control
actually sets how white the whitest object is on
the screen and may be adjusted downward to
prevent an overly bright image. You may need to
touch up the Brightness control after setting the
white level to ensure shadow details are not lost.
Too High. (figure 4)
Too Low. (figure 5)
Correct. (figure 6)*
The middle sample on the right (figure 5) shows the Contrast
control adjusted too low. The whites are dull and all the vertical
test strips are visible. At this point, the monitor is not showing all
the detail it can in the brightest areas. Raise the Contrast until the
4 5
*Digital Reference Standard
Page 5
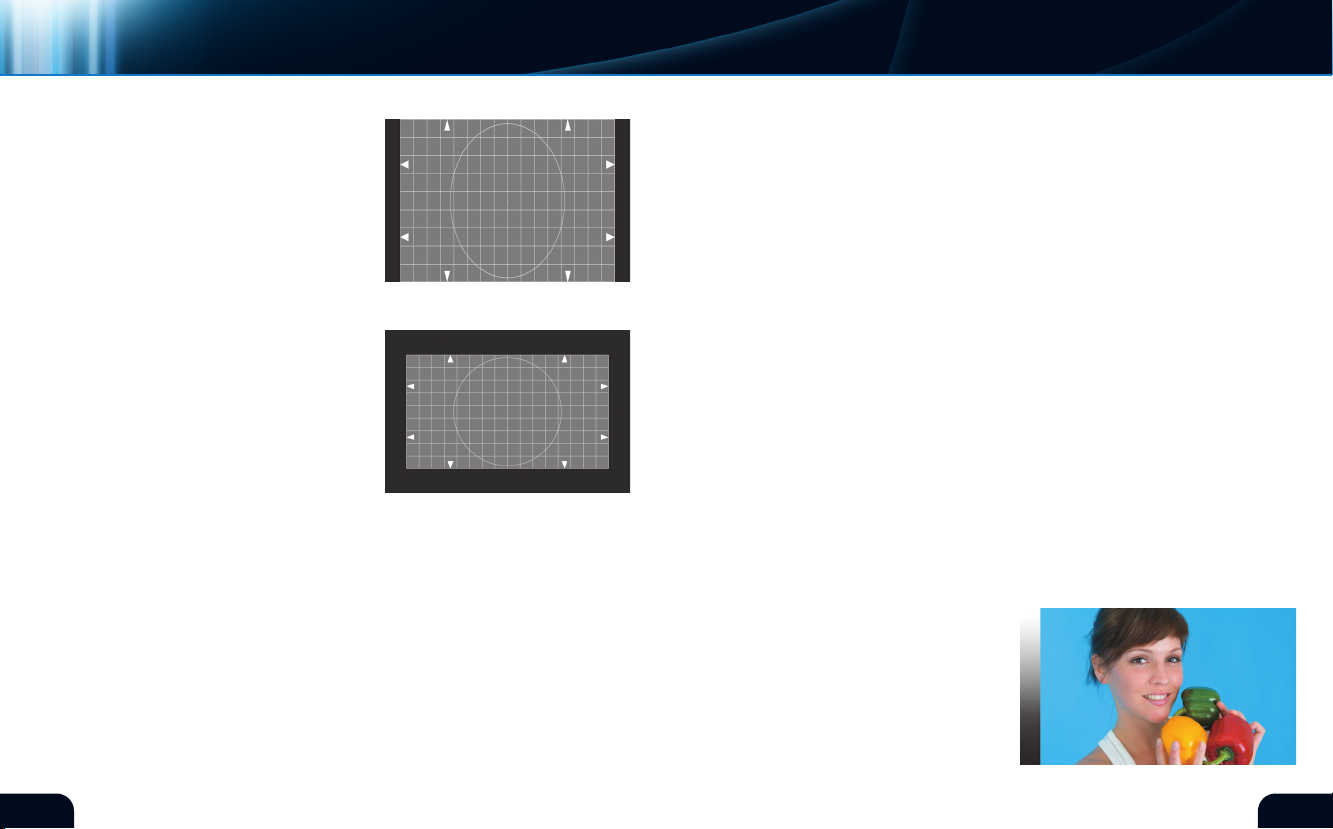
aspECt RatIO
BEGINNER | QUICK & EASY CALIBRATION
VIDEO
Native television aspect ratio is set to 4:3 for older SD (Standard
Definition) displays and 16:9 for common HD (High Definition)
systems. This means that no
matter what the screen size, the
display area will be 4 units wide
by 3 units tall for SD monitors
and 16 units wide by 9 units
tall for HD monitors. The units
can be anything: feet, inches
or meters. The relationship
between height and width will
remain constant no matter what
(figure 7)*
LETTERBOX
SIDE BARS
*Digital Reference Standard
6 7
All widescreen video material destined for Blu-ray™ distribution
assumes a 16:9 display system. Modern players and displays
AND
connected with an HDMI cable have the ability to communicate
with each other and perform preliminary setups. However,
monitors, Blu-ray players and DVD players allow these settings to
be overridden, allowing for mismatched video components.
For example, if you connect your Blu-ray player to a 4:3 television
receiver with analog cables, the Blu-ray player will continue to
output 16:9 aspect video because it has no way of knowing that a
4:3 display is connected. The images will be squeezed sideways by
the television and the pictures will look tall and skinny. To remedy
this, you will need to set the Blu-ray player’s output to format the
delivered video for a 4:3 display. With 16:9 video content, it is likely
that the Blu-ray player will squeeze the image vertically and apply
the screen size (figure 7).
black bars to the top and bottom of the image,
creating a 16:9 image within a 4:3 display area.
This is the “letterbox” method of preserving a
16:9 image on a 4:3 display (figure 8).
Conversely, connecting a standard definition
DVD player with analog cables to a 16:9 monitor
may induce the opposite problem. The DVD
player may be delivering letterbox images or
full 4:3 images to a display not formatted to
either, creating short, fat pictures. To remedy this condition, either
the player or the monitor (or both) need to be set to agree on the
type of video to be displayed. In the case of 4:3 programs on a 16:9
display, the player (or the monitor) will add black vertical bars on
either side of the image, allowing the 4:3 image to be displayed at
the proper aspect ratio in the center of the screen.
As you might guess, these settings can become confusing,
particularly when both the player and the monitor have the ability
to battle each other for proper display formats. The aspect ratio
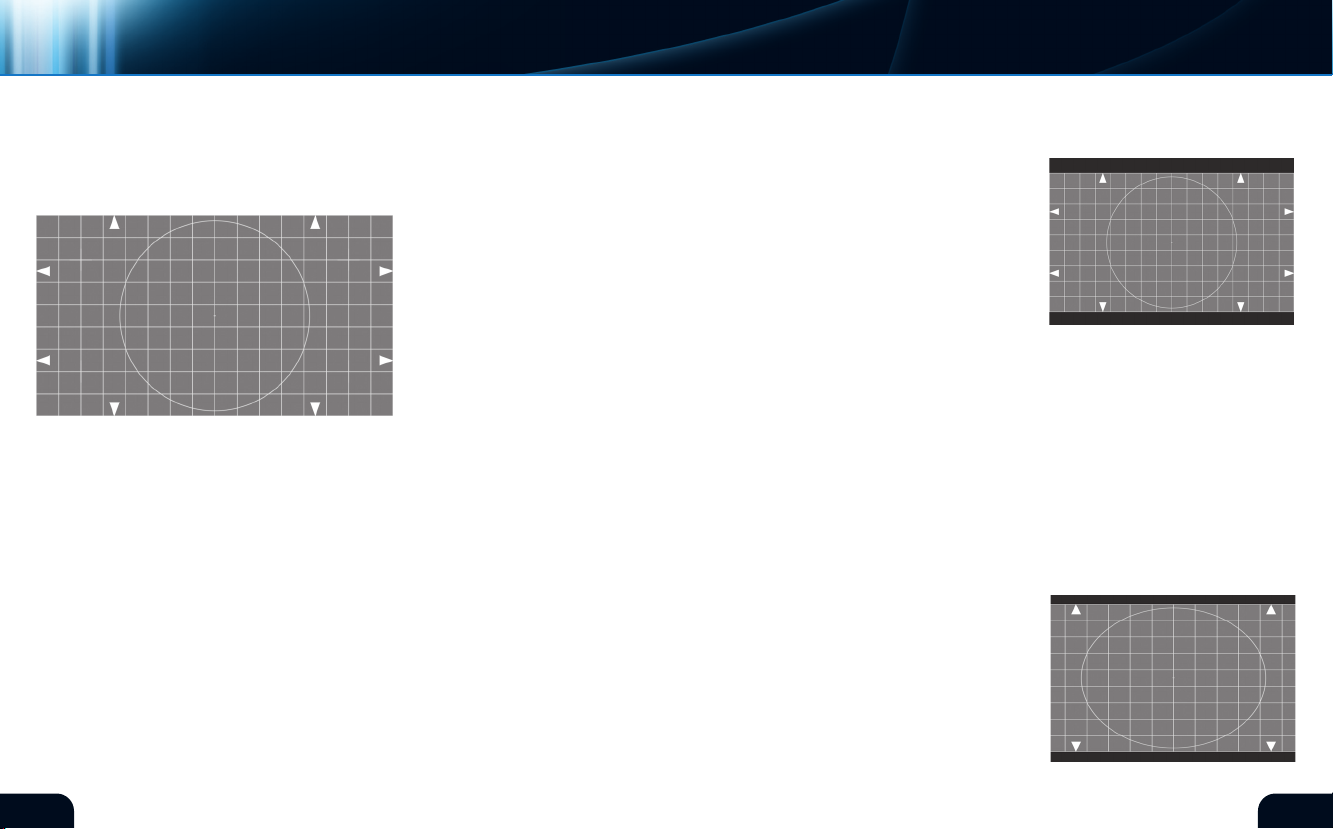
test chart will assist you with this setup. The
following examples show several states of
improper aspect ratio settings.
The appearance of the aspect ratio chart is
considered “normal” when played from a Bluray™ player through an HDMI cable to a 16:9
digital display (figure 7). The circles should
appear round instead of oval in any direction.
Letterbox 16:9 video on 4:3 display.
Incorrect Aspect Ratio Settings.
(figure 8)*
(figure 9)
Page 6
BEGINNER | QUICK & EASY CALIBRATION
VIDEO
PLAYER SETUP
DISPLAY SETUP
MISMATCHED
EQUIPMENT
8 9
The arrows on the sides
should be uniformly visible
and there should be no
black bars on either side of
the chart nor on the top and
bottom (figures 9, 10, 11).
If this is not the case, find
the controls on your Bluray™ player that affect the
display type. Set this control
to match the connected
display, in this case 16:9
(figure 7).
If the display still appears
improper, find the controls
on your monitor that affect
display sizing. Many flat
panel displays provide easy
access to settings that allow
for several basic aspect ratio compensations, intended for use
when 4:3 SD video is present. All of these compensations should be
disabled to bring the test chart into compliance. Check that your
monitor is set to accept a 16:9 video source as opposed to a 4:3
source. The most important use of these settings is to make both
the player and display system agree on the native format of the
display.
Manufacturers of players and televisions generally provide
settings to allow for a variety of equipment to be connected with
mismatched native aspect ratios. Using these same aspect ratio
controls, it’s possible to connect your Blu-ray player to a 4:3 display.
Incorrect Aspect Ratio Settings.
Incorrect Aspect Ratio Settings.
(figure 10)
(figure 11)
Set your Blu-ray™ player’s aspect controls to output a 4:3 image
instead of 16:9. The Blu-ray player will likely apply a “letterbox”
correction to the images. Similarly, a DVD player may have aspect
ratio controls as the DVD format was introduced just as widescreen
televisions were becoming available.
If your primary video source is 4:3 and there are no aspect controls
on the player, set your 16:9 monitor to expect 4:3 video. The
monitor will apply aspect ratio corrections that avoid fat or skinny
pictures. The inverse of a “letterbox” correction is the “windowbox”
or “side panel” that allows a 4:3 image to rest in the center of a 16:9
display. The source image is narrower than 16:9, so the extra screen
real estate on the sides is unused. The unused area may be filled
with black or some shade of grey.
The images in the Beginning Color & Hue Test have been
specifically selected for color and tone. These pictures can be
used as a reference for adjusting your monitor. Please adjust the
controls affecting color and tint so the images appear accurate on
your monitor. For more precise adjustment
of color and tone, please use the Chroma
and Hue calibration tools in the advanced
section of the disc.
Beginning with the first image shown on the
right, adjust the color until the flesh tones
appear slightly saturated or artificially high,
then reduce the color level until flesh tones
appear normal and lifelike (figure 12).
(figure 12)*
*Digital Reference Standard
COLOR
SATURATION
Page 7
BEGINNER | QUICK & EASY CALIBRATION
VIDEO
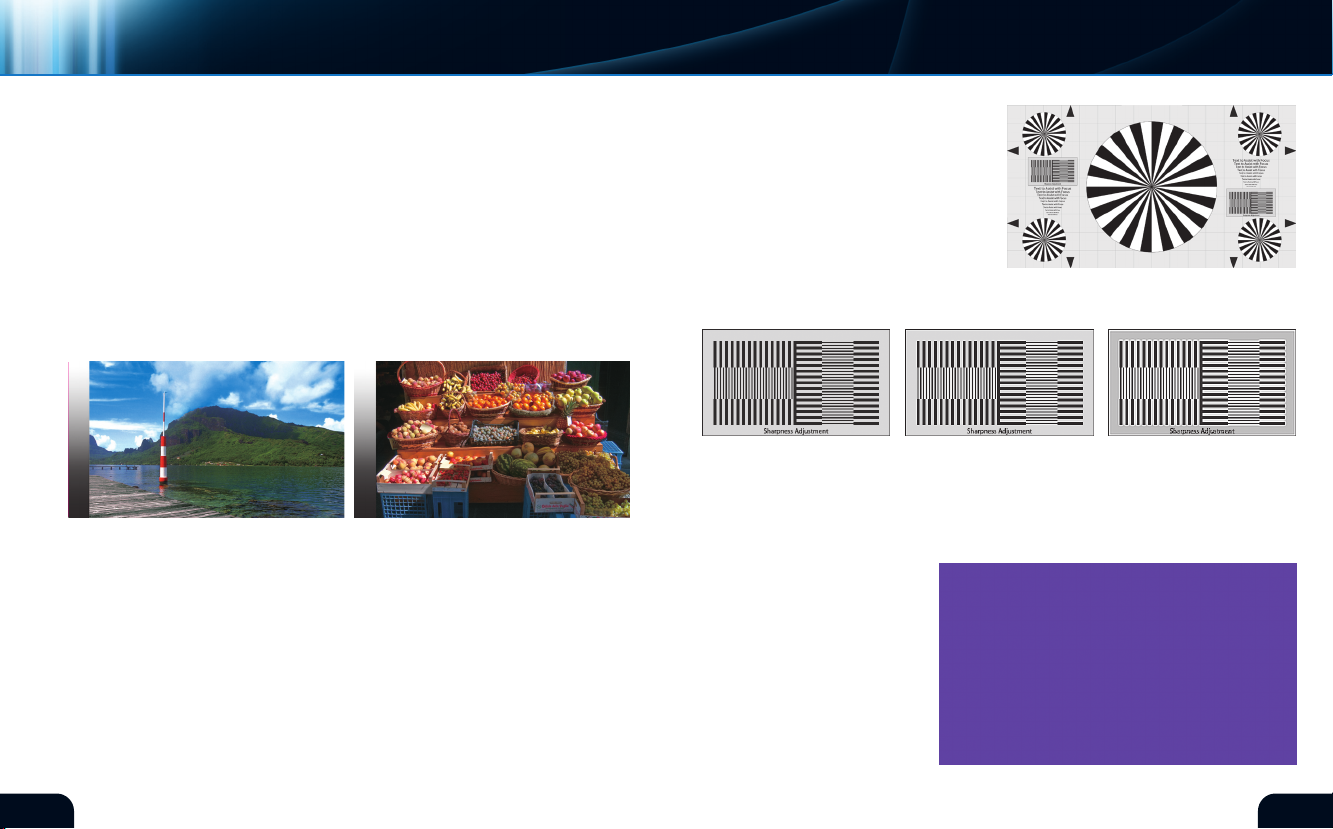
In the image below (figure 13), the blue sky should appear deep
and natural. If it appears to be washed out, bring the color level up
slightly.
This image should be colorful and lifelike. If the color and tone are
set properly, then the variety of colors should be clearly different
and complementary (figure 14).
You may wish to move between these images making small
adjustments to color until you are satisfied with the picture’s
accuracy.
(figure 14)*(figure 13)*
shaRpNEss
ARTIFICIAL EDGE ENHANCEMENT
SHARPNESS
ADJUSTMENT
10 11
If your equipment has an electronic adjustment for “sharpness,”
use the black and white box patterns and the text to assist with this
setting (figure 15a). The sharpness adjustment is not a substitute
for incorrect optical focus. Sharpness adds a white line around dark
areas to artificially define object edges. This creates the perception
of additional resolution. If used improperly, it can severely impair
the image quality. Observe the chart’s sharpness blocks and the
text while adjusting the sharpness control. The samples below show
some of the effects of adjustments. The
left sample is uncompensated as seen
on the chart. Adding a slight amount
of sharpness will add some desirable
definition to the image as shown in
the center sample. Adding too much
sharpness will begin to add undesirable
edging artifacts as seen below in the
sample on the right (figure 15b).
Uncompensated Mild Sharpness Too Much Sharpness
(figure 15b)
(figure 15a)
VIEWING aNGLE tEst
This pattern (figure 16) should
appear as a solid color. The
pattern is intended for use with
flat panel displays and may not
be useful for front projection
equipment. On direct view
CRT equipment, this pattern
will also be useful for detecting
magnetic interference.
(figure 16)*
*Digital Reference Standard*Digital Reference Standard
Page 8

BEGINNER | QUICK & EASY CALIBRATION
VIDEO/AUDIO
VIEWING
ANGLE
CRT PURITY
Observe the screen for color purity deviations. The entire screen
should be a solid magenta color that is mixed from pure red and pure
blue. Change your viewing angle to see whether looking straight
at the screen, sitting off axis, standing or changing the viewing
distance affects the appearance of the pattern. Ideally, there will
be no change in hue or intensity within reasonable viewing angles.
On displays with viewing angle deficiencies, you may see parts of
the screen turning red and other parts of the screen turning blue
as you move around the viewing area. Below is an example of what
a color change may look like (figure 17). A slight change in color
is common on some consumer monitors. A large change within
the reasonable viewing area indicates viewing angle deficiencies.
You may need to modify what is considered an acceptable viewing
position. If the pattern shows
stationary deficiencies that do
not change as you move around
the viewing area, it may indicate
a defective display or improper
mounting. Check the mounting
system on flat panel displays
to ensure the cabinet is not
being twisted or subjected
to pressures that distort the
(figure 17)
Direct view CRT systems are sensitive to magnetic interference. If
you see areas of this pattern that favor a different color (figure 17),
check the electronic equipment or other objects around your
monitor for a possible source of magnetic interference. Alter the
position of the monitor to see if the pattern changes. If nothing
seems to help, consider calling a service technician in order to
display system.
improve the color purity. Do not attempt to open the monitor as
CRT systems contain high voltage components that will injure you,
even after the power is disconnected.
spEaKER IDENtIFICatION
The Channel ID test allows you to ensure that your speakers are
connected to your system correctly. This section is invaluable for
multiple source systems.
The Channel ID test consists of an announcer identifying the left
speaker as left, and the center speaker as center, and so on. If
the announcements do not match the correct speaker, first check
the connections between the receiver and speakers. If they are
connected correctly, check the connections between the Blu-ray™
player and receiver for proper channel assignment.
If the Blu-ray player is connected to your receiver or monitor via
a digital optical, digital coaxial or HDMI cable, it is not possible to
change the channel assignment from the player.
pOLaRItY tEst
A Polarity test allows you to determine if your speakers are
connected correctly. Each speaker has a positive and negative
wire connector as does the receiver. The positive and negative
connections on each speaker should be wired to the corresponding
connection on the receiver.
12 13
Page 9

BEGINNER | QUICK & EASY CALIBRATION
AUDIO
The Polarity test will begin using the left front and right front
speakers only. It will advance around the system in a clockwise
pattern. Each test will involve two speakers only. The test will end
with the left front and center speakers.
A test signal will emanate from each pair of speakers. The signal
uses a broadband energy that covers the entire audible frequency
spectrum. This type of signal is called pink noise and will be used
on most of the tests on this disc.
The signal will be in-phase for the first ten seconds for each pair of
speakers being tested and then switch to being out-of-phase for
6 seconds. When the signal switches to out-of-phase there should
be an audible drop in level and the sonic image or noise will shift to
an undetermined location in the room instead of centered between
the speakers. If the audio level decreases when the signal is outof-phase, your speakers are in-phase and you may advance to the
next set of speakers.
Remember that all speakers in the system must work together so
you have to check the connections on every speaker to determine
if any are out-of-phase.
For best results, before you begin the Polarity test adjust the
volume of each speaker so they are approximately equal in level.
The test signal consists of several different bands of pink noise
recorded at successively lower volumes. The test signal starts at
minus 20 dB full scale and decreases in 5 dB steps with the last
signal recorded at minus 60 dB full scale. The noise floor for a
particular frequency band is the point at which you can no longer
hear the test signal.
This test can help you identify how the noise generated by
household systems and appliances, such as air conditioners and
refrigerators, affects your listening experience. For instance, try
turning off the heater or air conditioner to see if you can hear a
lower volume test signal in one of the low frequency bands.
BUZZ & RattLE tEst
The Rattle test is intended to trigger sympathetic vibrations in
objects such as lamps, tables and windows that will vibrate in
response to the audio emanating from your speakers and subwoofer.
The sweep tones in the rattle test are also used to check for speaker
resonances.
The first tone of the test covers the entire audible frequency
spectrum. Each subsequent tone is set to a particular frequency
range, which will help you identify which objects are affected at
certain frequencies.
NOIsE FLOOR tEst
If objects do vibrate, you should either move these objects or alter
Dynamic range is the difference between the loudest undistorted
signal and lowest audible signal of your home theater system. This
test will help determine the noise floor of your listening environment.
14 15
them so they do not interfere with your listening experience.
Page 10

ADVANCED | PREMIUM CALIBRATION TOOLS
MONITOR SELECTION
Each tone will repeat until you advance the test by selecting the
on-screen menu button to proceed to the next sweep tone.
Caution – you should be aware that sweep tones, especially at
higher frequencies, can cause hearing damage. Extreme care
should be used with these tests, especially when small children or
animals who are more sensitive to high frequencies, are present. In
addition, playing back the test tones at excessively high volumes
may cause speaker damage as well.
aDVaNCED BRIGhtNEss tEst
BLACK CHECKERBOARD
This moving test pattern (figure 18) is designed to fine tune the
residual brightness level of a display system. It consists of a
super black background with a barely visible graduated overlay
of geometric shapes. The darkest of the shapes are marked as
(figure 18)*
“invisible” and should be
adjusted so they blend into
the background. The remaining
shapes are “visible” along
with an “ideal” target. With
Brightness properly set, true
black in a video image will
completely extinguish light
coming from the monitor while
preserving shadow detail only a
few percent brighter.
full screen and graduated with
many more brightness levels.
The sample illustration to the
right (figure 19) is the same
pattern with the background
lightened in order to reveal the
elements you’ll be looking for.
Adjusting the brightness setting
is done with visual observation
which can fatigue the eye and
lead to a setting that is less than optimum. To aid in identifying
the foreground patterns from the background, the geometric ele-
ments will shift position during the adjustment cycle and will briefly
brighten to reveal their position. This will prevent false observations
caused by image retention in the human eye.
Adjust the Brightness control of the display so the “invisible” test
pattern elements are extinguished against the background. Only
the elements marked “visible” should be seen. There is also a set
of “ideal” elements that should be on the verge of being visible.
This is a very dark pattern suitable for setting up a monitor in a
darkened room. No bright elements are present to create lighting
backscatter. The Brightness adjustment will interact with the
Contrast adjustment as set with the White Checkerboard pattern
found in the next test on this disc. You will need to return to both
test patterns several times in order to satisfy both the Contrast and
Brightness settings.
(figure 19)
BRIGHTNESS
ADJUSTMENT
16 17
*Digital Reference Standard
The adjustment procedure is basically the same as using the PLUGE
signal found on the Color Bar pattern, except these elements are
Page 11

ADVANCED | PREMIUM CALIBRATION TOOLS
MONITOR SELECTION
aDVaNCED CONtRast tEst
OVERVIEW
ADJUSTMENT
CONTRAST
18 19
*Digital Reference Standard
WHITE CHECKERBOARD
This moving test pattern (figure 20) is designed to fine tune the
contrast level of a display system that affects the maximum light
output from the display. It consists of a super white background
with an overlay of geometric shapes of different brightness levels.
The test will identify the capacity of your monitor to produce
the required light level for a true
white object without loss of detail in the brightest areas. To aid
in identifying fine bright object
details, the geometric shapes
will darken to reveal themselves
initially and then move slightly
during the adjustment phase
(figure 20)*
The adjustment procedure is basically the same as using the PLUGE
signal found on the Color Bar pattern except these elements are
graduated with many more brightness levels. The illustration to the
right (figure 21) is the same pattern with the background darkened
revealing the elements you’ll be looking for.
Adjust the Contrast control of the display so the elements labeled
“ideal white” have a light output equivalent to white snow, bright
clouds or a brightly lit white shirt. Elements brighter than ideal
white are expected to disappear into the background. The last
visible element is an indicator of how much additional light output,
or “headroom,” your monitor can deliver. The display’s full dynamic
range is utilized when the “Ideal White” elements just become fully
for easy recognition.
visible during Contrast adjustment. Your
display is expected to show ideal white
elements distinct from the background. If
the geometric elements darker than ideal
white begin blending into the background
before proper light output is reached,
your monitor is “clipping,” or losing detail
in the brightest whites of video. Reducing
Contrast may remedy this at the expense
of a dimmer image. You may expect “white
clipping” behavior in older CRT monitors, projectors with modest
light output expectations or other aging display systems that may
be getting worn out.
Please be aware the Contrast adjustment will interact with the
Brightness control as set with the Black Checkerboard pattern
found in the previous test on this disc. You will need to return
to both test patterns several times in order to optimize both the
Contrast and Brightness settings.
ADVANCED Premium Calibration Tools
Aspect Ratio see page . . . . . . . . . . . . . . . . . . . . . . . . . . . . . . . . . 6
(figure 21)
Page 12

CONVERGENCE tEst
ADVANCED | PREMIUM CALIBRATION TOOLS
MONITOR SELECTION
CROSSHATCH DISPLAY
This test pattern (figure 22)
is a regular grid of squares.
There are 16 squares horizontally and 9 squares vertically,
corresponding to the aspect
ratio of current HDTV equipment. This pattern is most
useful for direct view CRT
(figure 22)*
DIRECT
VIEW CRTS
THREE GUN
PROJECTORS
20 21
*Digital Reference Standard *Digital Reference Standard
The mechanics of a CRT dictate a separate source for red, green
and blue image elements. These three color sources must be
“registered” so they fit together on the screen. Many modern CRTs
have no controls for registration as the alignment is part of the
device’s construction. However, some systems have adjustments
to precisely align the individual “guns” so they coincide on the
display. Do not attempt to adjust registration yourself if it involves
opening the monitor as dangerous high voltage is present inside
the cabinet. If external controls do exist, be advised that this
adjustment is reserved for the most skillful and patient of people.
Use this test pattern to align a projection system using three
individual optical color sources. Typically, the registration controls
are easily accessible in these systems as they need touch-up after
moving the equipment. Set the green channel to be correct in
sizing, geometry, focus etc. Then, adjust the red and blue controls
to match the green, so the entire test chart appears as a uniform
monitors or projection systems
that require the registration of
multiple image sources.
white grid without color fringes. Below are examples of incorrect
alignment and correct final alignment (figure 23).
(figure 23)*
Misaligned Aligned
Occasionally, several projectors are “stacked” together to achieve
a higher screen brightness than is otherwise available. Use the
focus chart found elsewhere on this disc to set up the individual
projectors first. Use this test pattern to perform the aiming and
sizing alignments of all projectors together. Test your alignment
with live images to confirm successful registration.
On CRT based systems, you may encounter adjustments useful for
correcting geometric distortions other than sizing. This crosshatch
chart and others containing uniform geometric shapes will be useful
for making these adjustments. The following illustrations show some
of these deficiencies. Adjust the appropriate controls to achieve
uniform squares in the crosshatch and a round circle in the center.
Note that three gun CRT systems may have these controls for each
gun, which requires patience for successful adjustment (figure 24,
see next page).
MULTIPLE
PROJECTORS
GEOMETRIC
DISTORTIONS
Page 13

ADVANCED | PREMIUM CALIBRATION TOOLS
MONITOR SELECTION
ChROma & hUE
KEYSTONE
LINEARITY
PINCUSHION
SKEW
(figure 24)
This modified industry standard test pattern (figure 25) contains
examples of the three primary colors, the three secondary colors,
75% white as mixed from the
primaries, ideal black and ideal
white. A PLUGE signal (Picture
Line Up GEnerator) integrated
into the pattern also contains
super black and super white
signals for monitor setup. The
pattern also contains a row of
reversed color bars used to
perform chroma and hue setup
when used in conjunction with
a blue optical filter.
Establish the location of display controls affecting “chroma” or
“color.” Hold the blue filter packaged with this disc up to your eyes
and observe the color bar pattern (figure 26, next page). This will
filter out all colors except those with a blue component. You will
see a series of vertical blue bars containing elements of (from left
to right) white, cyan, magenta and blue separated by black bars.
When the chroma level is properly set, the white vertical bar on the
left should have the same amount of blue as the pure blue bar on
the right. To facilitate this observation, the reverse color bar strip
just below the main color bars will allow direct comparison of the
white bar against the blue bar. Set the color level of your monitor
so the boundary between white and blue disappears on both ends
of the pattern. One should not be brighter than the other.
(figure 25)*
OVERVIEW
CHROMA
22 23
*Digital Reference Standard
Page 14

ADVANCED | PREMIUM CALIBRATION TOOLS
MONITOR SELECTION
HUE OR TINT
ADJUSTMENT
COLOR
ADJUSTMENTS
Locate the display controls affecting “hue” or “tint.” Using the blue
filter, observe the main color bar samples of cyan and magenta.
Directly beneath those are reversed samples of magenta and cyan.
Adjust the hue or tint control to balance the levels of the main color
bars with the samples on the reverse strip.
The hue or tint is now properly adjusted.
Please keep in mind the chroma level will
interact with the hue control, one placing
the other slightly out of balance. Go back
and forth between adjusting the color
and hue a few times until both settings
are optimal (figure 27).
(figure 26)
The color bar pattern on the left is
properly adjusted (figure 27). Notice that all visible bars are the
same shade when seen through the blue filter. It is likely that your
television will either match this condition or will
the hue looks like when misadjusted (figure 28).
The “chroma” or “color” control will interact
slightly with the “hue” or “tint” control. While
looking through the blue filter, adjust the
control until the shades of the far left and far
right main color bars diverge from the narrow
strip of reverse color bars below (figure 29).
The adjustment is correct when the transition
between the main bars and the reverse bars on
the far left and right sides disappears as in the
reference image (figure 27). You may need to
alternate between the “color” and “hue” control
to achieve perfection. The example on the right
shows what chroma or color looks like when
misadjusted. This concludes the use of the blue
filter gel.
(figure 28)
(figure 29)
be very close right out of the box. You may test
for proper adjustment by moving the controls
slightly to observe the changes. To the right are
examples of what you will see when the controls
are misadjusted. Adjust the controls to match
the example shown here on the left.
(figure 27)*
The most critical adjustment is the “hue” or “tint”
control. This adjustment will have a dramatic impact on flesh tones
if misadjusted. While looking through the blue filter, adjust the
control in either direction until you see the two center bars change
shade. The narrow strip of reverse color bars under the main bars
The bottom quarter of the color bar pattern has a full width solid
bar of ideal digital black containing two test signal areas. On the
next page is a strip (figure 30) containing a box of ideal digital
white along with vertical strips showing three steps slightly lighter
and darker than ideal white. On the right side of the strip is a similar
arrangement with ideal digital black as the background along with
vertical strips slightly lighter and darker than ideal black. These
are “PLUGE” signals, which stands for “Picture Line Up GEnerator.”
The PLUGE signal aids the adjustment of proper black and white
displayed by a monitor. The PLUGE signals, which may be difficult
to spot, are marked with short horizontal grey bars.
LUMINANCE
ADJUSTMENTS
will assist in precise adjustment of hue or tint. Adjust the control
until the transition between the main center bars and the reverse
bars below disappears. The next example on the right shows what
24 25
*Digital Reference Standard
Any monitor has a maximum range of light output for both black
and white, called “contrast ratio.” The Contrast control adjusts the
Page 15
ADVANCED | PREMIUM CALIBRATION TOOLS
MONITOR SELECTION
BRIGHTNESS
difference between ideal white and ideal black contained in this
test pattern to match the display capability of the monitor. Contrast
mostly affects the white parts of a video image but will also affect
the dark areas. The Brightness adjustment sounds like it should
set how bright things are on the screen. Instead, Brightness is set
to remove residual light output when true black is present in the
video. The Brightness and Contrast controls interact considerably,
so you will need to switch back and forth between the two controls
to satisfy both settings.
(figure 30)*
The right hand portion of the black background contains two
groups of vertical strips (figure 30). The left group are three steps
slightly darker than ideal black and the right group are three
steps slightly brighter than ideal black. These strips will assist in
the adjustment of the Brightness control. Room lighting and type
of display will affect how this control is adjusted. Use lighting
representative of your viewing situation to adjust the monitor.
The bottom sample (figure 3, page 3) shows a properly adjusted
Brightness control. Only the right hand vertical steps are visible
while the left hand strips are not. The black area in between is ideal
black and the monitor is now set to show this to be the darkest
object on display.
Refer back to the section on Brightness earlier in this manual
(pgs 3-4) for complete instructions on making these adjustments.
The center area of the white box (figure 30) represents ideal video
white. Set the Contrast control so this area appears as a fully white
object would, like a white shirt, white clouds or piece of white
paper. On either side of center, you’ll find vertical strips that are
three steps brighter on the right and three steps darker on the left.
The strips on the right will blend into the white background if you
have adjusted Contrast beyond the capability of the monitor to
display it.
Refer back to the Contrast section earlier in the manual (page 5) for
detailed instructions on properly setting the Contrast. The bottom
sample (figure 6, page 5) shows the proper maximum Contrast
setting with two of the brightest vertical strips blending together.
This means the upper levels of light output from the monitor have
been reached.
Remember, Brightness and Contrast adjustments are affected by
room lighting in the viewing area. A monitor adjusted in a dark
room will appear too dark when the room is lit. A monitor adjusted
in a lit room may appear too bright in a darkened room. Perform
these adjustments in lighting conditions typical of the normal
viewing environment.
CONTRAST
26 27
*Digital Reference Standard
Page 16

ADVANCED | PREMIUM CALIBRATION TOOLS
MONITOR SELECTION
ROOM
LIGHTING
CONDITIONS
If your room lighting is relatively dark such that these settings
create an image that’s too bright, you may reduce the Contrast
setting to create a more comfortable picture. The Contrast control
actually sets how white the whitest object is on the screen and may
be adjusted downward to prevent an overly bright image. You may
need to touch up the Brightness control after setting the white
level to ensure shadow details are not lost.
shaRpNEss & FOCUs ChaRt
This chart on the right (figure 31) provides a target suitable
for optically focusing projection equipment. Please note that
direct view CRT or flat panel displays do not have optical focus
adjustments. The chart also contains elements to assist in adjusting
electronic image enhancement, usually called “sharpness,” found
in most display systems of any kind.
Set up the framing and centering of your projection equipment
using the “Overscan” chart found elsewhere on this disc. Once the
basic setup of your projector is satisfactory, use this focus chart to
set fine optical focus. The major starburst pattern on the chart is
designed to visually indicate the best focus adjustment. Adjust the
optical focus so the center of the chart shows the highest detail
level. Optical focus may interact with projector sizing. You may
need to touch up the basic setup so the points of the arrows on
the chart’s edges just touch the margins of the screen area. Text
is shown on the chart to assist in setting focus for best readability.
(figure 31)*
If your equipment has an electronic adjustment for “sharpness,”
use the black and white box patterns and the text to assist with
this setting. The sharpness adjustment is not a substitute for
incorrect optical focus. Sharpness is used to artificially define
object edges to create the perception of additional resolution.
If used improperly, it can severely impair the image quality.
Observe the chart’s sharpness blocks and the text while adjusting
the sharpness control. The samples on the preceding page
(figure 32), show some of the effects of adjustments. The left
sample is uncompensated as seen on the chart. Adding a slight
SHARPNESS
ADJUSTMENT
Uncompensated Mild Sharpness Too Much Sharpness
(figure 32)
28 29
*Digital Reference Standard
Page 17

ADVANCED | PREMIUM CALIBRATION TOOLS
MONITOR SELECTION
amount of sharpness will add some desirable definition to the
image as shown in the center sample. Adding too much sharpness
will begin to add undesirable edging artifacts as seen on the right
hand sample.
OVERsCaN tEst
The extreme edges of a video
image are generally hidden from
view by either physically masking the borders with a bezel or
by scaling the image up electronically to push the edge of
the image off screen. Electronic
enlargement of the video image
is called “overscan.” This chart
(figure 33) will reveal whether
(figure 33)*
The highest resolution digital displays rely on having a pixel
count exactly matching an HDTV or Blu-ray™ signal, namely
1920 horizontal pixels by 1080 vertical pixels. The pixels in the
video should precisely overlay the physical display elements
on the monitor. Electronic overscan on digital displays will
degrade the image slightly by resizing the video so it is no longer
pixel accurate against the physical structure of the display. If
possible, disable electronic overscan for the best image results.
30 31
*Digital Reference Standard
electronic overscan is present
and how much of the screen
margins, if any, are missing.
Observe the darker square areas on the chart. They should appear
to be a flat grey when viewed from a distance. Viewed closely, the
pixels in both the 1 Pixel checkerboard and 1 Pixel line patterns
should line up exactly with the physical pixels on the display. If they
don’t you may see a pattern within the squares indicating the image
is scaled. Scaling does not allow a pixel for pixel match between the
video source and the display, degrading overall resolution. Below
are examples (figure 34) of what some of the grey squares should
look like when unscaled (top row) and scaled with electronic
overscan (bottom row). These tests will only work properly with a
native 1920x1080 pixel monitor.
2 Pixel Squares 1 Pixel Squares 1 Pixel H Lines 1 Pixel V Lines
(figure 34)
On the next page, look at the top, bottom and both sides of the chart.
Ideally, the white arrows should be touching all four edges of the
screen without the tips cut off. There should also be no space between
the tips of the arrows and the screen edge. This is usually not the case
as most digital displays are oversized or masked by a few percent.
DIGITAL
DISPLAYS
UNSCALED
SCALED
IMAGE
MASKING
PERCENTAGE
Page 18

ADVANCED | PREMIUM CALIBRATION TOOLS
MONITOR SELECTION
Read the percentage of overscan directly
from the edge markings by determining which
percentage line is the first one unmasked
(figure 35). The readings should be uniform on
all four sides. If the readings are not uniform, the
image is not centered on the display area.
DIRECT VIEW
CRT DISPLAYS
PROJECTION
DISPLAYS
32 33
*Digital Reference Standard *Digital Reference Standard
Most direct view CRTs will exhibit some form of
overscan. The percentage of overscan may be
read in the same way as a digital display. Since
there is no expectation that pixels in video will
precisely correlate with the CRT’s physical
structure, you may ignore the tests using the
grey squares.
This chart (figure 36) may be used to set up projectors so they
are square with the screen. Observing the white arrows on all the
edges, use the sizing options on the projector to make the tips
(figure 36)*
(figure 35)
of the arrows just touch the margins of the screen. Preferably,
an optical zoom on the lens should be used instead of electronic
sizing controls. The circle on the test pattern will reveal whether
the projector is set to the correct aspect ratio. If necessary, use
the horizontal and vertical sizing controls to make the circle true.
The white grid pattern on the grey background and the arrows
will assist in leveling the image and detecting keystone effects.
The horizontal lines should be level and the vertical lines should
be uniformly perpendicular to the floor. The white lines will assist
in registering older 3-CRT projectors. The single pixel squares and
text on the chart will assist in focusing the projector. Test patterns
specific to setting up projection equipment are available elsewhere
on this disc.
aUDIO/VIDEO sYNC tEst
This moving test pattern will indicate whether audio events are
in sync with video events. There are adjustments in some digital
audio systems that will affect audio sync against video.
The center of this test
pattern (figure 37) ro-
tates once every two
seconds. Accompanying the video is
a continuous audio
tone interrupted by a
louder tone when the
(figure 37)*
rotating marker coin-
INDICATORS
Page 19

ADVANCED | DISPLAY EVALUATION TOOLS
MONITOR SELECTION
cides with the “zero” marks. Watch the markers (calibrated for both
television frames and milliseconds) and listen for the tone to emphasize exactly when the zero markings light up yellow.
ADJUSTMENT
If the emphasized tone and zero markings appear to coincide, your
audio delay is probably in good alignment. You can double check
by watching the markings before and after the zero markings. If the
emphasized tone seems to hit on one of the marks before or after
zero, use the numbers shown to adjust your audio delay to bring
the events into complete synchronization with the video.
pURItY tEst
This set of patterns are flat field pure
colors; Red, Blue, Green, Black and
White. The purpose is to place the
monitor in a number of situations
that might point out dead pixels in
individual colors and reveal nonuniform brightness across the
surface of the display. Step through
(figure 38)*
DEFECTIVE
PIXELS
34 35
*Digital Reference Standard
In the case of digital displays, such as LCD, OLED, DLP, Plasma
and others, look for individual pixels that do not appear to be
functioning. Depending upon the display type, the reasons for a
defective pixel will vary. A defective pixel may cause no light to be
emitted (black) or the defect may cause light to always be emitted
(white or single color). This condition may be the result of a stuck
pixel (figure 39).
each of the colors and examine the
screen carefully, edge to edge and
top to bottom.
Check your display with each of the flat field images for purity or
uniformity issues. Is the entire screen evenly lit with each of the
colors? Are there “hot spots” or dark areas? Are the solid primary
colors contaminated with other colors? The example on the
previous page shows a flat green field with no pixel or purity defects
(figure 38). The example below on the right shows a flat red field
with uniformity issues (figure 40). With flat panel displays, nonuniform brightness may be an indication of defective backlight
sources, twisted display panels or irregular pressure on the monitor
cabinet due to improperly installed mounting brackets. Call a service
technician if the defect is serious. Do not attempt to disassemble or
repair the monitor yourself.
(figure 39) (figure 40)
sCaLING tEst
ONE PIXEL CHECKERBOARD
The sharpness and clarity of a High Definition video source depends
upon accurate pixel for pixel reproduction of the source material on
the monitor. This test pattern is a black and white checkerboard
with one pixel spacing. The monitor is expected to display individual
black and white pixels without blending against neighboring pixels
or creating artifacts. This pattern is intended for observation only
as few controls are available to affect the outcome.
DEFECTIVE
PURITY
Page 20

ADVANCED | DISPLAY EVALUATION TOOLS
MONITOR SELECTION
aDVaNCED sCaLING tEst 1
From a distance, the monitor may
appear to be fl at grey. Looking
closely, however, you should see the
individual checkerboard squares as
shown in the inset. This condition
is only possible in systems that are
digitally connected and do not scale
(fi gure 41)*
ARTIFACTS
BLURRING
36 37
*Digital Reference Standard
If the display system is scaling the image, artifacts will appear in
this test pattern that represent the impairment of a full resolution
image. Below is an example of what these artifacts may look like
(fi gures 42 & 43). They are created when the pixels of the test
pattern do not exactly overlay the pixels of the display causing an
“alias” pattern to appear. Check your system for opportunities to
disable monitor overscan or other resizing functions.
If your connection to the monitor is analog, you may also experience
additional blurring. For best results, use digital connections
throughout your entire video system.
(fi gure 42) (fi gure 43)
the image (fi gure 41).
ALTERNATING HORIZONTAL PIXELS
The sharpness and clarity of a High Defi nition video source depends
upon accurate pixel for pixel reproduction of the source material
on the monitor. This test pattern is uniform black and white pixels
alternating across the width of the
display. The monitor is expected to
display individual black and white
pixels without blending against
neighboring pixels or creating
artifacts. This pattern is intended
for observation only as few controls
are available to affect the outcome
(fi gure 44).
From a distance, the monitor may appear to be fl at grey. Looking
closely, however, you should see the individual vertical lines as
shown in the inset. This condition is only possible in systems that
are digitally connected and do not scale the image.
If the display system is scaling the image, artifacts will appear in
this test pattern that represent the impairment of a full resolution
image. On the right is an example of what
these artifacts may look like (fi gure 45).
They are created when the pixels of the
test pattern do not exactly overlay the
pixels of the display causing an “alias”
pattern to appear. Check your system for
opportunities to disable monitor overscan
or other resizing functions.
(fi gure 44)*
(fi gure 45)
OBSERVATION
ARTIFACTS
Page 21

ADVANCED | DISPLAY EVALUATION TOOLS
MONITOR SELECTION
BLURRING
aDVaNCED sCaLING tEst 2
OBSERVATION
ARTIFACTS
38 39
*Digital Reference Standard
If your connection to the monitor is analog, you may also experience
additional blurring. For best results, use digital connections
throughout your entire video system.
ALTERNATING VERTICAL PIXELS
This pattern is a variation of the One
Pixel Checkerboard using only the
alternating vertical pixel component
(figure 46). The purpose is to single
out system timing and artifact
creation in the vertical dimension of
the image.
(figure 46)*
individual horizontal lines visible on close observation as shown
in the inset. Proper display of this pattern is generally possible in
analog or digital systems that do not scale the image vertically.
If the display system is scaling the image, artifacts will appear in
this test pattern that represent the impairment of a full resolution
(figure 47)
From a distance, the monitor
may appear to be flat grey with
image. On the left (figure 47) is an
example of what these artifacts may look
like. They are created when the pixels of
the test pattern do not exactly overlay
the pixels of the display causing an “alias”
pattern to appear. Check your system for
opportunities to disable monitor overscan
or other resizing functions.
Blurring in the vertical dimension is not expected unless your
system is scaling the video. It’s also possible that some video signal
processing to enhance vertical resolution may be at work in your
system. While this enhancement may be subjectively pleasing on
lesser quality video, such as up-scaled Standard Definition video, it
will actually degrade vertical resolution on high quality native High
Definition material. Disabling artificial enhancement on native HD
programs is recommended.
ZONE pLatEs
Zone Plates are multi-dimensional test signals that show the
interaction between video elements in a range of packing densities
and the electronic systems processing them. Two zone plates are
provided on this disc (figure 48).
This test signal is a compound frequency sweep in both the
horizontal and vertical directions. The resulting test pattern
will theoretically cross most of
the sensitive areas where signal
processing and display technologies
are likely to create artifacts. The
most common artifacts are called
“aliasing,” which refers to secondary
patterns not present in the original
signal. These secondary patterns
may come from scaling the image,
video filtering or some other
transformation affecting the original
(figure 48)*
*Digital Reference Standard
BLURRING
HYPERBOLIC
ZONE PLATE
Page 22

ADVANCED | DISPLAY EVALUATION TOOLS
MONITOR SELECTION
test signal. Some amount of aliasing is normal due to the limitations
of video systems. However, irregularities in signal processing or
display technology will show themselves using this pattern.
Below are several examples of what the hyperbolic zone plate
may show (figure 49). The first box on the left is a section of the
original test signal without impairments. In a perfect system, the
test signal will be displayed unaltered. The second example shows
scaling artifacts indicated by regular horizontal and vertical aliases.
The third example shows filtering artifacts from applying too much
sharpness, causing adjacent video elements to interact with each
other. The fourth example shows a lack of high detail. There are
many other variations of these artifacts, which may require more
thorough analysis by professionals.
(figure 49)* (figure 51)
SINUSOIDAL
ZONE PLATE
40 41
*Digital Reference Standard
This test signal consists of concentric rings with increasing packing
density as they move away from the focal point. This test pattern
contains elements that cross many boundaries within a video
system, possibly revealing aliases caused
by scaling, interlacing, filtering or poor
alignment (figure 50).
To the right are two examples (figure 51) of
possible artifacts that stem from filtering
and scaling the original test pattern. If the
test pattern on your monitor displays fairly
(figure 50)*
extreme artifacts or aliases, you may also see other impairments on
program video. Consult a service technician to diagnose and find a
possible solution to the problem.
On interlaced display systems, this test pattern may show artifacts
due to interlace “twitter.” The impairments found in interlaced
video are inherent in the format. Attempts to remedy the artifacts
may solve the impairments but may well introduce others. If your
equipment has settings and adjustments that relate to smoothing
or filtering, test the settings with the zone plates to gauge their
effects on program video.
WhItE-BLaCK CLIppING tEst
COMPOUND CHECKERBOARD
This is a moving test chart that embodies many elements of the
individual white and black checkerboard charts. It also contains a
test area to determine the actual black and white clip points for
your display (figure 52, see next page).
The middle dark band of the test pattern is used to adjust the residual
brightness on the monitor so that the darkest geometric shapes on
BRIGHTNESS
Page 23

ADVANCED | DISPLAY EVALUATION TOOLS
MONITOR SELECTION
the left below “Ideal Black” begin
to blend into the background. The
residual brightness is most easily
set in a darkened room but should
be adjusted in room lighting typical
of the viewing environment.
The top band of the test pattern is
used to adjust contrast to achieve
(figure 52)*
CONTRAST
CLIP POINTS
42 43
control of your monitor until the “Ideal White” elements are fully
visible, allowing the brightest geometric shapes on the right side
above ideal white to be barely visible against the background. This
utilizes the maximum Contrast capability of your monitor. You may
wish to reduce this setting if the screen appears too bright in a
darkened room. Brightness and Contrast interact and will require
several iterations of both adjustments for proper setup.
The bottom strip of the test chart contains a continuous grey scale
ramp, which runs from ideal black on the left to ideal white on the
right. On either end of the ramp are extensions that continue the
ramp beyond the ideal levels into Super Black
and Super White. Within these extensions
are vertical hash marks set to ideal black on
the left and ideal white on the right. When
Brightness is properly set, you will not see
hash marks darker than ideal black on the
left portion of the chart. The right side
(figure 53) tests for the amount of white
“headroom” available by observing where the
(figure 53)
background stops getting brighter against
the ideal white hash marks. All hash marks
the desired white levels relative to
room lighting. Adjust the Contrast
move occasionally to make themselves more visible. Read the
numeric markings along the bottom edge where the brightness
stops changing for the digital value of white headroom.
ADVANCED Premium Calibration Tools
Viewing Angle Test see page . . . . . . . . . . . . . . . . . . . . . . . . . . . 11
Gamma REspONsE
Gamma correction was introduced into television signals to
compensate for the non-linear brightness response of CRT displays.
An original image on a CRT without gamma compensation would
appear darker with too much contrast. The blacks would appear
muddy while slightly brighter parts of the image would appear
too bright. In the early days of television, it was decided that
this deficiency in the CRT display should be compensated at the
camera, boosting mid range grey while leaving blacks and whites
undisturbed. Although display technologies have changed and
the CRT has become rare, images are created and stored today
with gamma compensation
to remain compatible with
historical images and all display
systems. Television and monitor
manufacturers apply gamma
compensation for their unique
display technologies to create a
standardized image. This chart
(figure 54) will reveal what the
gamma number of your display
device is.
(figure 54)*
*Digital Reference Standard
Page 24

ADVANCED | DISPLAY EVALUATION TOOLS
MONITOR SELECTION
READING
GAMMA
CLIP POINTS
This test chart (figure 54) consists of a fine grain black and white
checkered background, which should appear flat grey from a
distance. Our eyes will average the black and white elements
together to approximate 50% grey. If you are using a digitally
connected flat panel display, this chart will only work well if the
display presents a pixel accurate 1920x1080 image without
overscan. Disable the overscan setting on your monitor if possible
or the results are likely to be invalid.
The vertical bars are 50% grey with varying degrees of gamma
compensation. The darkest vertical bar is 50% grey with no gamma
compensation, marked “1.0.” The vertical bars appear incrementally
brighter across the chart as the gamma compensation number
increases. While standing back from the display, notice which
vertical bar seems to blend best into the checkered background.
The standard gamma target is “2.2.” If your monitor has gamma
settings, it should be left in the “normal” position for the most
accurate image reproduction.
GRaYsCaLE
The Grayscale test pattern (figure 55) may take many forms but the
elements are always examples of full black, full white and shades
of grey in between. This pattern will run the Red, Green and Blue
channels of the display system through the entire available brightness range. A truly accurate rendition of the test pattern will not
contain color shifts at any point. A color shift indicates one or more
of the color channels’ failure to track the grayscale properly.
Both the continuous grayscale and the 10 step grayscale present
ideal black, ideal white and shades of grey in between. The
continuous grayscale strips on the top and bottom are bisected
by a special grayscale, labeled the “High Scale Ramp,” (figure 56)
which exceeds the contrast performance expectation of most
monitors. The extreme ends of the High Scale Ramp are absolute
digital white and black. Near the ends of the High Scale Ramp are
reference dots that indicate the points where the ramp is expected
to clip or stop changing brightness. The example on the right shows
the High Scale Ramp continuing to brighten compared to the Ideal
Ramp as it nears the right edge of the pattern. The example on the
left shows the expected High Scale Ramp blending into the Ideal
Ramp as it approaches the end.
If there are questions about
the accuracy of Brightness and
Contrast settings, return to
the Color Bar pattern to adjust
these parameters.
(figure 55)*
USER
ADJUSTMENTS
SERVICE
ADJUSTMENTS
44 45
If a monitor presents color shifts along the path of the grayscale,
it will require qualified service personnel with specialized instruments to repair the issue. Do not attempt to open the monitor and
perform these adjustments yourself.
(figure 56)
*Digital Reference Standard
Page 25

ADVANCED | DISPLAY EVALUATION TOOLS
MONITOR SELECTION
COmpOUND tEst ChaRt
(figure 57)*
COMPONENTS
The background of this chart embodies the crosshatch pattern
and edge marking arrows found elsewhere on this disc. Use these
elements to gauge the basic sizing and geometry of your display
system. A centered circle assists in determining whether proper
aspect ratio is present. Also present are Action Safe and Title Safe
boundaries representing commonly used margins for screen content.
A Multiburst signal (figure 58) indicates basic frequency response
of your display system. If your display uses analog connections, the
portions of this test strip with higher packing density may begin
to degrade into a flat grey field instead of showing the high details
within. The markings on individual chips on this chart will help
quantify the limits of your display system.
As a quick reference, this chart
(figure 57) embodies many of
the patterns found elsewhere on
this disc. It also contains unique
patterns used for checking
display response and alignment.
It is not intended to be used as
an ultimate setup tool, rather as
a “status at a glance” to quickly
check a display device for
proper operation.
A PLUGE strip with ideal black and ideal white labeled with a “0”
(zero) mark, along with several shades on either side, may be used
to check the brightness and contrast adjustments of your display
(figure 59). The black +1 chip should be visible while the -1 and
-2 chips should not with proper brightness settings. Similarly, the
white +1 chip should be visible to confirm proper contrast settings.
Use the appropriate full screen PLUGE patterns, located elsewhere
in this disc, if adjustment is necessary.
(figure 59)*
A Color Bar strip displays the basic accuracy of hue and color
levels (figure 60). Use the blue filter provided to check this setting
if necessary. Use the full screen color bar signal found elsewhere on
this disc to confirm proper color alignment.
(figure 60)*
Elements testing for resolution performance and scaling artifacts
are seen in multiple pixel count chips including one, two and three
pixel patterns on a single strip (figure 61). Several of these patterns
are found as full screen charts elsewhere on this disc. Also present
in this compound test chart is a basic focus wedge to assist with
setting up projection equipment.
(figure 61)*
Vertical and horizontal wedge patterns will quickly determine the
amount of degradation present in high resolution elements. The
46 47
*Digital Reference Standard *Digital Reference Standard
(figure 58)*
vertical wedge (right side, figure 57) is calibrated in MHz while
Page 26

ADVANCED | AUDIO SET UP TOOLS
the horizontal wedge (figure 62) is calibrated in TV Lines. These
indicators are intended for analog connected devices. While the
readings are subjective, they are useful in quantifying basic system
performance.
(figure 62)*
Sharpness setup blocks are included to assist
in adjusting aperture correction or sharpness
found in most display systems (figure 63). Use
these blocks in conjunction with other high
resolution elements of this chart, including
text, to sharpen the image without over
(figure 63)*
If any of these parameters appear to be out of adjustment, confirm
them using the test signals dedicated to the specific adjustments,
located elsewhere on this disc.
exaggerating high detail.
lifelike sonic presentation and allow a soundtrack to be heard as
the producer and recording engineer intended.
The test signal used will be band-limited pink noise. If you have
remote control capability for level adjustment on your system, use
the remote to begin the test, seated in your normal viewing position.
Adjust the individual channels for equal volume at that position.
For best results, use a sound pressure level meter to adjust channel
levels. A comfortable volume is usually between 78 dB and 85 dB
as measured on a Radio Shack or equivalent sound level meter set
for C weighting and slow response.
It is important to keep in mind that music and sound tracks are
dynamic, that is they have loud and soft passages. Properly setting
the levels should allow the loudest passages to have impact without
distorting the sound.
As you set your levels, do not try to set them at maximum volume.
aDVaNCED aUDIO sEt Up tOOLs
SPL METER NOT REQUIRED
Speaker ID, Polarity Test, Noise Floor, Buzz & Rattle Test
see pages . . . . . . . . . . . . . . . . . . . . . . . . . . . . . . . . . . . . . . . . . 13-15
A/V Sync see page . . . . . . . . . . . . . . . . . . . . . . . . . . . . . . . . . . . 33
This portion of the audio test is specifically for subwoofer setup.
If you do not have a subwoofer or it is not connected to your
receiver, please proceed to the next audio test.
sUBWOOFER LEVEL aDjUstmENt
SPL METER REQUIRED
TEST
DESCRIPTION
spEaKER LEVEL aDjUstmENt
SPL METER REQUIRED
LEVEL
ADJUSTMENT
48 49
*Digital Reference Standard
This test will allow you to adjust the level of each speaker to ensure
that your system is balanced from left to right and from front to
rear. When properly adjusted, the speakers will produce the most
TEST
Just like the other speakers in your system, the subwoofer should
not be set for maximum output. Because this is a very demanding
test, prior to commencing, be sure to reduce the level of the
subwoofer to no more than 50% of its maximum output.
Page 27

EXPERT
The band of pink noise generated by this test is specifically directed
to the LFE Channel (low frequency effects) and will help you position
your subwoofer to the most desirable location in your listening
environment that will allow you to get the maximum volume without
distortion. Once this position is located, often in or near a corner,
select the phase setting (if one is available) for maximum volume
without distortion.
You will now need to adjust the subwoofer level control to 3 dB
higher than the sound pressure level used during the speaker level
adjustment section on this disc. If you find that the subwoofer
volume control is set for maximum, you will need to reduce the
sound pressure level used during the level adjustment test in the
previous section by approximately 3 dB. Then, repeat both tests.
A properly calibrated subwoofer will reduce the potential for
distortion or premature failure.
hD shOOtOUt
In this section, we provide a comparison of both Picture and Sound
Quality between Standard Definition DVD and High Definition
Blu-ray™ Disc formats. In addition, we have included both Stereo
and Surround versions of the same sound track so you can directly
compare Multi-Channel Audio experiences.
We invite you to access the original files for this test in the
ENCODER STRESS TEST folder of this disc. With these files, you
can test and measure your own video encoder and compare your
results to our Benchmark Reference Video Encoder, produced
using the best available professional equipment and the industry’s
most talented compression artists and engineers. Press ENTER on
your remote to proceed.
a/V tOOLs DIRECt aCCEss
This control allows you to bypass the regular menus and go to a
list of all A/V Tools where you can access the tool of your choice
directly.
pIXEL FLIppER
The Pixel Flipper is a tool that will exercise all of the pixels on your
screen. Each and every pixel will be turned on and off between 24
and 29 times per second. The Pixel Flipper attempts to fix plasma
burn-in and repair stuck LCD pixels. Please note that not all pixel
issues can be corrected by this process. At a minimum, it is recommended that you run the Pixel Flipper for at least 1 hour. If this
does not correct the problem you are having, you may want to try
running the Pixel Flipper overnight. When ready, please press the
“Enter” key on your remote to begin running the Pixel Flipper. You
may press “Enter” again to stop the tool.
ENCODER stREss tEst
BD-LIVE™ EXpERIENCE
The Video Encoder Stress Test is specifically designed to push
the limits of your professional video encoding system. In this test,
you will encounter the most difficult possible video encoding
challenges all running simultaneously on one screen.
50 51
Access the Disney BD- Live network – for a sneak peek at upcoming
Disney Movies.
Page 28

CREDIts
WOW
EXECUTIVE PRODUCER
Richard J. Casey
PRODUCER / DIRECTOR
Richard J. Casey
ASSOCIATE PRODUCER
John S. Banks
WRITERS
John S. Banks
Robert Smith
Richard J. Casey
Steve Wiedemann
GRAPHICS & ANIMATION
John S. Banks
ORIGINAL MUSIC
Michael Stearns
Fritz Heede
AUDIO EDITING
Tom McCarthy
AUDIO CALIBRATION TOOLS
Tom McCarthy
VIDEO CALIBRATION TOOLS
Steve Wiedemann
NARRATION
Eryca Dawson
Craig Sechler
VIDEO ENCODING &
AUTHORING BY DELUXE
MASTERED AT THE
MASTERING LAB IN OJAI, CA
Doug Sax
Robert Hadley
PRODUCTION SUPERVISOR
Janice Iannelli
PRODUCTION COORDINATOR
Jennifer BaRoss
Melanie J. Casey
PRODUCTION ASSISTANTS
Tiffany Storm
Skyler Zuckerman
PACKAGING/DESIGN
BY LISAIUS MARKETING
SPECIAL THANKS
Philip Brown
Randy Berg
Heather Bruseth
Brandon Ripley
Frederick Mazzarella
Clementine Casey
Vicky Chou
National University
CREDIts
VIsIONs
EXECUTIVE PRODUCER
Richard J. Casey
PRODUCERS
John S. Banks
Richard J. Casey
DIRECTOR
John S. Banks
CINEMATOGRAPHY
John S. Banks
GRAPHICS/EFFECTS
John S. Banks
ORIGINAL MUSIC
Michael Stearns
Fritz Heede
MASTERED AT THE
MASTERING LAB IN OJAI, CA
Doug Sax
Robert Hadley
VIDEO ENCODING &
AUTHORING BY DELUXE
PACKAGING/DESIGN
BY LISAIUS MARKETING
52 53
Page 29

W O R L D O F W O N D E R
© 2010 R&B Films, Ltd. www.rbfilms.com. All Rights Reserved.
WARNING: Unauthorized reproduction, duplication, distribution, or
any commercial use in whole or in part is strictly prohibited.
© Buena Vista Home Entertainment, Inc. 10001031
DIGITAL REFERENCE STANDARD
™
 Loading...