


EnDaL curve/vi
Release 09/2017
Manual
for
EnDaL curve
and
EnDaL vi


EnDaL curve/vi ENVIRONMENTAL AND SAFETY INSTRUCTIONS
- 1 -
T A B L E OF CONTENTS
1. ENVIRONMENTAL AND SAFETY INSTRUCTIONS ......................................... 3
2. INTRODUCTION ...................................................................................... 4
3. TECHNICAL PARAMETERS ......................................................................... 5
4. DEVICE DESCRIPTION ............................................................................... 7
4.1 DEVICE SETUP ............................................................................................................ 7
4.2 CONNECTING EXTERNAL SENSORS AND SWITCHES............................................................ 8
4.2.1 External Acceleration Sensors And Switches ..................................................................... 8
4.2.2 Digital / Analogue Input ............................................................................................... 8
4.3 OPERATION .............................................................................................................. 9
4.3.1 Switching On And Off .................................................................................................. 9
4.3.2 Status indication ........................................................................................................... 9
4.4 CHANGING THE BATTERIES ......................................................................................... 10
4.5 MOUNTING INFORMATION ........................................................................................ 11
4.6 MEASUREMENT DATA ACQUISITION ............................................................................. 12
4.6.1 Measuring Shock Events .............................................................................................. 12
4.6.2 Storing Digital Events .................................................................................................. 12
4.6.3 Synchronous measurements ......................................................................................... 13
4.6.4 Measuring The Analogue Signal ................................................................................... 13
5. PC EVALUATION SOFTWARE ENCUR ....................................................... 14
5.1 SYSTEM REQUIREMENTS ............................................................................................. 14
5.2 INSTALLATION .......................................................................................................... 14
5.3 OVERVIEW .............................................................................................................. 15
5.4 CONFIGURATIONS (OPTIONS) ..................................................................................... 18
5.4.1 Basic Settings ............................................................................................................. 18
5.4.2 Classification ............................................................................................................. 20
5.4.3 Limit Value................................................................................................................. 20
5.4.4 Spectrum ................................................................................................................... 20
5.5 MANAGE MEASURING AND PROGRAM FILES ................................................................... 21
5.6 DEVICE CONFIGURATION ........................................................................................... 22
5.6.1 Measuring Program .................................................................................................... 22

ENVIRONMENTAL AND SAFETY INSTRUCTIONS EnDaL curve/vi
- 2 -
5.6.2 Sensor Configuration .................................................................................................. 24
5.6.3 Autoprogramming ...................................................................................................... 25
5.6.4 Password .................................................................................................................. 25
5.7 EVALUATION OF MEASURING DATA .............................................................................. 26
5.7.1 Device Status and Acquisition Periods ........................................................................... 26
5.7.2 Overall Graphic (total) ................................................................................................ 27
5.7.3 Acceleration Data ...................................................................................................... 28
5.7.3.1 A-table .............................................................................................................. 28
5.7.3.2 Curve Analysis ................................................................................................... 29
5.7.3.3 Distribution ........................................................................................................ 31
5.7.3.4 Classification ..................................................................................................... 32
5.7.3.5 Limit Table ......................................................................................................... 32
5.7.4 Continuously measured data (Synchronous data) ............................................................ 32
5.7.5 Digital Events ............................................................................................................ 32
5.7.6 GPS-Data .................................................................................................................. 33
5.8 HELP .................................................................................................................... 34
6. SERVICE AND CALIBRATION................................................................... 34
7. WARRANTY CERTIFICATE ....................................................................... 35

EnDaL curve/vi ENVIRONMENTAL AND SAFETY INSTRUCTIONS
- 3 -
1. E N V IRO NMENTAL AND SAFETY INSTRUCTIONS
Data Transfer Cable
To ensure full functionality of the system, please use only the supplied cables and accessories for connection
to a personal computer.
Environment & disposal
The EnDaL curve/vi contains no corrosive or environmentally damaging substances. This
does not apply to batteries.
Used batteries must be removed immediately from the device. Please dispose of used batteries in an
ecologically sound manner and according to the local regulations. Lithium batteries are hazardous waste.
Battery operation
The EnDaL curve is typically supplied with two exchangeable alkaline or lithium batteries
(type C|R14). They can be bought in specialized stores according to the specification stated in the
instruction manual. The usage of secondary battery cells (NiMH) is also possible. Furthermore there is a
special device configuration for external power supply.
Please label the EnDaL curve as hazardous material of class 9, according to the Worldwide
UN classification, when using it with lithium batteries.
ATTENTION!
Use only intrinsically safe batteries.
In case of non-compliance with the national regulations/laws applicable in the handling of lithium
batteries, any liability and warranty claim becomes void!
Decommissioning
In case of decommissioning, the devices must be properly switched off. All batteries must be
removed from the device and be disposed of in an ecologically sound manner.

INTRODUCTION EnDaL curve/vi
- 4 -
2. I N T R OD U CTION
The EnDaL curve/vi is a universal data logger. It is designed for long-term measurements, so
it is suitable to monitor transport cargo in critical environments.
The EnDaL curve/vi is available in many different configurations. Therefore, it can be
modified to meet a lot of special requirements. With internal or external acceleration sensors as well as the
sensor input for temperature, relative humidity and air pressure, the EnDaL curve/vi is
suitable for many applications. The configuration with external sensors makes it possible to measure with
optimal coupling on positions which are difficult to access. The configurable analogue input allows you to
use analogue sensors from other manufacturers. A device version suitable for use in a clean room is also
available.
Additionally you can connect the EnDaL curve/vi with an external tracking system like the
data link TM. Thereby, it is possible to track the GPS positions and send the device status as
well as measurement data via email.
Because of its versatility of power supply and its degree of protection IP65, the
EnDaL curve/vi is suitable as an independent long-term transport data logging system. By the use of an
external power supply, it is also suitable for stationary applications.
The license-free software ENCUR for configuration and evaluation enables graphical und tabular analyses
of the measured data. The measuring data can be archived on the computer or exported for use with other
software programs.

EnDaL curve/vi TECHNICAL PARAMETERS
- 5 -
3. T E C HN ICAL PARAMETERS
Case and operational conditions
Case material
Aluminium, powder-coated
Degree of protection
IP65
IP40 for version with external NiMH secondary cells and internal 9 V
alkaline primary cell
Weight
800 g (with batteries excluding additional equipment)
Dimensions (H/W/D)
180 mm / 106 mm / 37 mm
Mounting type
Screw mounting, individual mounting plates are possible
Operating and storage
conditions
-20 °C to +70 °C with alkaline primary batteries
-40 °C to +85 °C with lithium primary batteries
-20 °C to +60 °C with NiMH secondary batteries
Data security
Data retention
minimum 10 years (independent of battery condition)
System time
internal clock supported independently from the power supply by an
internal battery, exchange of this battery at SMT ELEKTRONIK after 6
years recommended,
information of the time zone can be stored in the device
Password
3 levels of protection: no protection, protection of configuration, protection
of readout and configuration
Power supply
internal
2x batteries of type C/R14 changeable:
Primary cells: alkaline, lithium
Secondary cells: nickel metal hydride (NiMH)
Alternative 1x 9 V alkaline block battery
external
Alkaline battery pack
NiMH secondary
Mains supply
External interfaces
RS232
RS232 to USB adapter optionally available
Display and control elements
LED
2x red (error, alarm)

TECHNICAL PARAMETERS EnDaL curve/vi
- 6 -
3x green (power, active, memory)
Key button
1x “control“ to display the operating state via LEDs
Shackle
magnetic on/off-switch
Bypass switch
toggle switch to bypass the safety bar (permanently switched on)
Sound module
Only for EnDaL vi
Device sensors
Measured variable
Measuring range
Tolerance
Data storage
Acceleration
internal
2, 5, 10, 20, 50,
100, 200 g, discrete
configurable
±2 % of measuring
range
±5 % of measuring
value
16384
thereof 10 or 20 with
waveform (depending
on curve duration)
Acceleration
external
100, 200, 500,
1000, 2000 pC
Acceleration
external 3D ICP®
50, 100, 250, 500,
1000 mV
Temperature
-40…+120 °C
(depends on the
model)
±1 K
16384
Relative Humidity
0…100 %rh
±2 %rh at
20…80 %rh
Analogue Input
0…2.5 V
±0.1 %
Digital Input
4 channels with
respectively high/low
Low: 0…0.8 V
High: 2.4…12 V
4096
EnDaL curve/vi DEVICE DESCRIPTION
- 7 -
4. D E VI C E D ESCRIPTION
4.1 D E V I C E S E T U P
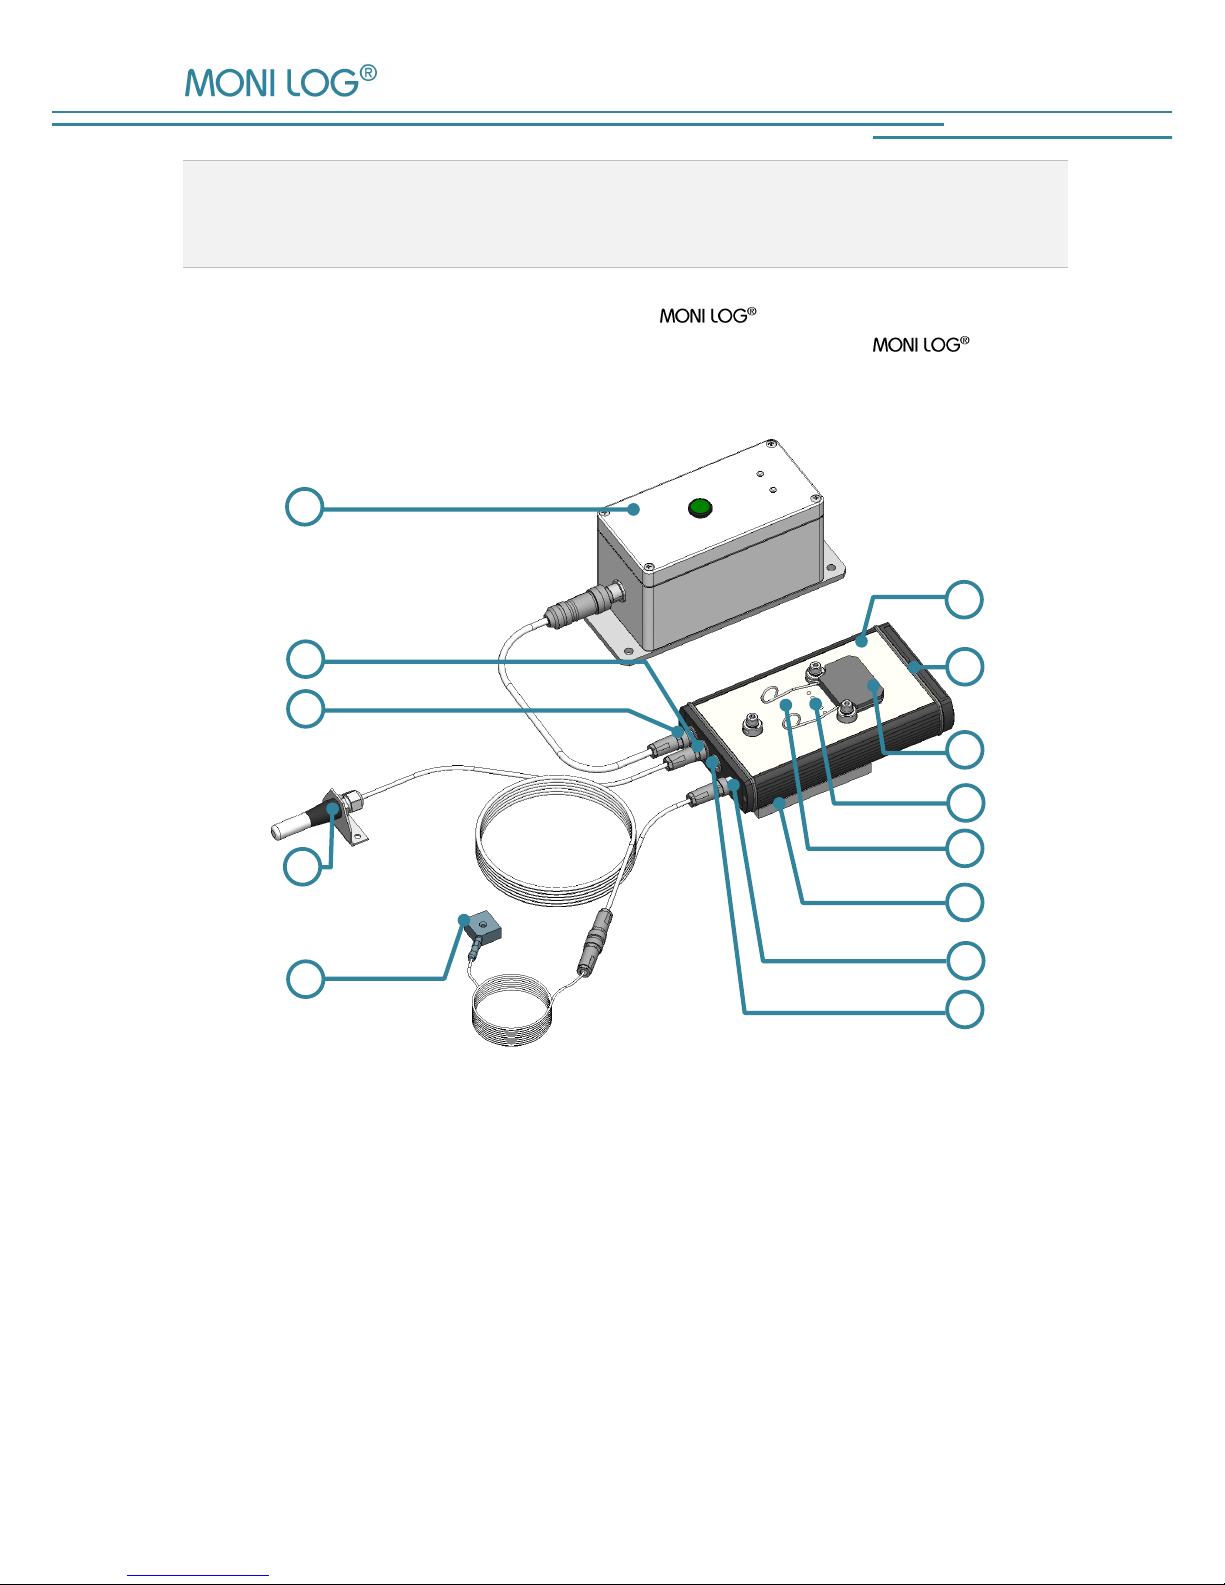
The following picture shows a possible configuration of a EnDaL vi. The available inputs and
outputs on the EnDaL curve/vi depend on the specific model. Please contact the distribution
of SMT ELEKTRONIK GmbH for further information.
1 EnDaL curve/vi
8 Connection for RS232 interface (COM-Port)
2 Cover for battery compartment and bypass
switch
9 Connection for external TH or THP sensor
3 Magnetic shackle (on/off-switch)
10 Connection for external power supply
4 LEDs for device status
11 External TH or THP sensor
5 Control key
12 External acceleration sensor
6 Mounting plate
13 External power supply
7 Connection for external acceleration sensor
132 3 4 1 5 6 7 8 9101211

DEVICE DESCRIPTION EnDaL curve/vi
- 8 -
4.2 C O N N E C T I N G E X T E R N A L S E N S O R S A N D S W I T C H E S
4 . 2 . 1 Ex t e r n a l A c c e l e r a t i o n S e n s o r s A n d S w i t c h e s
Depending on the model, EnDaL curve/vi can be equipped with internal acceleration
sensors as well as with inputs for external acceleration sensors. Piezoelectric acceleration sensors with
integrated electronics (EnDaL vi) or without (EnDaL curve) can be connected to the 3 inputs designated
with X, Y, Z. However, internal and external acceleration sensors cannot be used simultaneously.
The measuring ranges of the internal charge amplifiers are 100, 200, 500, 1000 or 2000 pC for each
channel (EnDaL curve). Measuring ranges of 50, 100, 250, 500 or 1000 mV can be set for ICP sensors
(EnDaL vi). The transmission factors of each sensor connected to a channel can also be entered in the
measuring program so that the stored measured values correspond to the accelerations in g transmitted by
the sensors.
In order to obtain correct spatial shock values (R) derived from the 3 channels x, y and z (see evaluation
software) make sure to place these sensor channels orthogonal to one another.
Always ensure to switch off the EnDaL curve/vi before connecting external acceleration sensors.
Otherwise the device may record acceleration events during the connector insertion.
To prevent effects of cable movement on the measurement, it is recommended to fasten the sensor cables
with a cable holder. An adhesive tape may also be used for fastening (see also DIN ISO 5348).
4 . 2 . 2 Dig i t a l / A n a l o g u e I n p u t
The “In D/A” socket provides the configurable analogue input and up to 4 digital inputs. The switching
state of switches can be evaluated without additional circuits. The analogue sensor is temporarily supplied
by 5 V at the time of measurement.
1 Ground
2 Analogue input 0 ... 2,5 V
3 Digital channel D0 (cannot be used with external ICP sensor)
4 Digital channel D1
5 Digital channel D2
6 Digital channel D3
7 5 V / 20 mA supply of sensor, switched
An optional terminal box is available to ease connection to that “In D/A” socket.

EnDaL curve/vi DEVICE DESCRIPTION
- 9 -
4.3 O P E R A T I O N
4 . 3 . 1 S w i t c h i n g O n A n d O f f
The device offers a magnetic switch for turning on and off. This is implemented by the special safety
shackle. After power up of the device (removal of the safety shackle), the LEDs signalize the status of the
device for a few seconds. When the LEDs go out, the device is ready for measuring.
To avoid an intentional or unintentional interruption of the measurement, the magnetic off-switch can be
bypassed by a toggle switch. This switch is located inside the battery compartment.
Toggle the switch corresponding to the figure or the label
inside the cover of battery compartment to “ON“, if you
want to bypass the functionality of the safety shackle. With
the position “Shackle”, the device can be switched on and
off by the safety shackle.
You can check the on/off-state of the device by pressing the
control key.
4 . 3 . 2 S t at u s i n d i c a t i o n
The status of the device is always signalized after power up. Generally the device is switched on by
removing the safety shackle. When the LEDs do not light up afterwards, check - using the control key whether the bypass switch is activated (see 4.3.2).
The LEDs indicate the following states:
LED
Colour
Visualization
State Description
Error
Red
Permanent
Hardware failure which is unrecoverable by user,
Synchronization of the baud rate
Power
Green
Permanent
Battery reserve 100…30 % or external power supply
Flashing
Battery reserve <30 %
Alarm
Red
Permanent
Exceedance of threshold value for X, Y or Z
Active
Green
Permanent
Active acquisition period, within a start/stop period
Flashing
Inactive, Beyond a start/stop period
Memory
Green
Permanent
Usage of all memory areas below 50 %
Flashing
Usage of at least one area above 50 %
Off
At least one memory area is full
An alternative to the indication by means of the integrated LEDs is to signalise the current operating status
with an external test connector. This test connector needs to be connected to the
EnDaL curve/vi via the RS-232 data cable. The function of this test connector is described in a separate
appendix.

DEVICE DESCRIPTION EnDaL curve/vi
- 10 -
4.4 C H A N G I N G T H E B A T T E R I ES
Before changing the batteries, switch off the instrument using the safety shackle.
(Dashed circle must be covered).
Remove the two screws securing the battery cover with a flat screwdriver (4x0.8). Ensure that the toggle
switch next to the battery compartment is set to "Shackle" and not to "ON", so that the safety shackle can
switch off the EnDaL curve. After unscrewing the battery holder (cross recessed head H size 2), the used
batteries can be removed. Insert the new batteries, making sure their polarity is correct. Tighten the battery
holder with a tightening torque of 75 Ncm. When fitting the battery-cover, make sure that the gasket has
the correct orientation (lips pointing into the device). Ensure that the sealing faces are clean. The maximum
tightening torque for the screws of the cover is 30 Ncm.
In order to change the 9V battery of the EnDaL vi (version with an external power supply),
open the battery compartment cover and the inner battery cover by carefully applying a flat screwdriver. In
this case no screws need to be removed.

EnDaL curve/vi DEVICE DESCRIPTION
- 11 -
4.5 M O U N T I N G I N F O R M A T I O N
Depending on the type of measurement you want to perform, attach the instrument to the goods
to be transported, inside the package or to the means of transport. To avoid unintentional shock
absorption and thus the measurement of insufficient acceleration values, you should attach the
EnDaL curve/vi as close as possible to the goods or package.
Shocks absorbing padding or instable assemblies distort the measurement results!
The available mounting accessories give you the following possibilities of fastening the instrument:
Direct mounting of the instrument (recommended method)
If the freight or its package is suited for direct mounting, there is no need to fasten a mounting plate. The
instrument is then fastened directly with 3 M5 cheese head screws with spring washer or similar fasteners.
This method ensures optimum transmission to the internal sensor.
Mounting with mounting plate
Fasten the mounting plate with the screws to the freight or
the means of transport. Then fasten the instrument to this
plate using the screws M5x50 and a locking element
(spring washer, lock washer).
Attachment with adhesive tape
This method of fastening is suited for smooth, non-porous surfaces and for short-term fastening. Apply two
double-sided adhesive strips onto the rear of the mounting plate of the EnDaL curve/vi. Now
pull off the protective liner from the other side and stick the EnDaL curve/vi onto a suitable
surface of the freight (e.g. inside a container). The location can only be corrected by using new adhesive
tapes.
Provide for clean, non-greasy surfaces!
We urgently recommend securing the instrument additionally by tightening or tie-down straps!
06,6 / 011x6,8
M5
48
70
60
68

DEVICE DESCRIPTION EnDaL curve/vi
- 12 -
4 . 6 M E A S U R E M E N T D A T A A C Q U I S I T I O N
4 . 6 . 1 Mea s u r i n g S h o c k E v e n t s
Every acceleration event that exceeds the set recording threshold and the minimum shock duration on at
least one of the active measuring channels (X, Y, Z) is recorded. In addition to date and time, the peak
values of acceleration, the shock values integrated over time (speed difference) for the active measuring
channels and the event duration are recorded with their amount and direction.
The duration of the event (t) is the time while the
permanently set hardware threshold (approx. 5% of
the measuring range) is exceeded in at least one
channel.
All shock events are always recorded with their curve.
Depending on the curve duration that has been set,
this curve is stored in the memory for the 10 or 20
greatest shock events. Knowing the shock curve is
important for the determination of weak points in
securing transported goods.
The measuring ranges, the frequency range of the
analogue filter, the minimum shock duration and the
recording threshold can be set and defined before every application. We recommend using the preset
measuring program files.
To detect transport damage as early as during the transport, an alarm threshold can be set for every
measuring channel. Pressing the Ctrl button indicates a possible excess of a limit value by a red LED (see
indication of operating states). For devices starting from production 11/2002 this signaling is reset
automatically after each PC data communication.
4 . 6 . 2 S t o r i n g D i g i t a l E v e n t s
Every voltage level change at one of the 4 available digital inputs causes the input states of all digital
channels to be stored with a resolution of seconds with date, time and optionally geographical position.
The storage of digital events can only be activated by active channels.
Both low-active and high-active voltage levels and normally closed or open switches can be connected. This
allows the monitoring of door contacts, tilt switches or run times of connected units.
When an external ICP acceleration sensor is selected in the measuring program, the digital channel D0 is
used for sensor monitoring and can then not be used for the monitoring of external switching signals. In
case of an a-channel X failure D0 indicates a low level, otherwise a high level.
If a Tracking Module or data link TM GPS is connected, it is possible to
determine global location coordinates for acceleration and digital events.

EnDaL curve/vi DEVICE DESCRIPTION
- 13 -
4 . 6 . 3 S y n c h r o n o u s m e a s u r e m e n t s
The measurement of temperature and humidity and the free analogue measuring channel and optionally the
recording of geographical position are time-controlled and occur at regular intervals. The interval is
transmitted by the PC software (can be set from 2 seconds to 60 minutes) and is the same for every
measurement mentioned in this paragraph.
If the sensor is not connected or defective, the measured value is defined as the absolute lower-range value
(-40 °C or 0 % relative humidity).
A maximum of 16,384 records are possible which results in the following durations of operation.
Interval in min
Duration of operation with 16,384
possible measured values
1
11 days
5
56 days
10
113 days
20
227 days
60
682 days
4 . 6 . 4 Mea s u r i n g T h e A n a l o g u e S i g n a l
The analogue input In D/A pin1+2 allows the measurement of a voltage signal in the 0...2.5 V range.
Higher signal levels need an external voltage divider connected in series and low signals an amplifier. The
measured values are indicated as figure * unit of measurement if you have entered the parameters Offset,
Factor and Unit of measurement correctly in the menu EnDaL / Program / Sensors button / Analogue
measuring channel filecard before the recording. You can enter up to 6 characters for the unit of
measurement. The figure that is shown in the evaluation results from:
Figure = (1638 * UM/volts - offset) * factor
where UM is the voltage in volts applied at the analogue input In D/A between pin 2 and pin 1.
Example:
For a physically correct indication of a voltage between 0 and 10 volts connected via a 4:1 voltage
divider, you have to enter the following:
Offset: “0.0“
Factor: “0.002442“
Unit of measurement: “volts“

PC EVALUATION SOFTWARE ENCUR EnDaL curve/vi
- 14 -
5. PC EVALUATION SO F TW ARE E N C U R
5 . 1 S Y S T E M R E Q U I R E M E N T S
The evaluation software ENCUR is exclusively designed for the usage with the data logger
EnDaL curve and EnDaL vi.
The software ENCUR requires the following minimum PC specifications:
- Operating system: Windows Vista / 7 / 8 / 10
- 30 MB hard drive space
- USB interface or COM port
- Internet connection for installation and use of Google Earth
The installer of Google Earth will download the current program files from the internet, so they cannot be
terminated. Please obtain information about the special system requirements of Google Earth.
5 . 2 I N S T A L L A T I O N
Start the setup “Setup_Encur_3.x.exe“. Follow the instructions of the installation wizard. The setup installs
the software files, some example files and help files into the chosen program path. The driver for the Prolific
USB serial adapter can be installed optionally. The adapter is available at SMT ELEKTRONIK GmbH.
Please contact the technical support for further information.

EnDaL curve/vi PC EVALUATION SOFTWARE ENCUR
- 15 -
5 . 3 O V E R V I E W
Function
Symbol
Main menu
(context menu)
Shortcut
Opened file
Closed file
Menu File
Transfer device data
Data transfer
Ctrl+T
X
Open measuring file (*.edz)
or program file(*.epz)
Open
Ctrl+O
Drag&Drop
X
open last files
Save file (*.edz)
Save
Ctrl+S
X
Print
Print
Ctrl+P
X
Print preview
Print preview
X
Close current project
(measuring file)
Close
Ctrl+W
X
Close ENCUR
Exit
Alt+F4
X
X
Menu EnDaL
Open measuring program
(file)
Meas. program
Ctrl+M
X
X
Auto programming
(transfers a predefined
measuring program file)
Autoprogramming
Ctrl+A
X

PC EVALUATION SOFTWARE ENCUR EnDaL curve/vi
- 16 -
Function
Symbol
Main menu
(context menu)
Shortcut
Opened file
Closed file
Overall graphic total
(graphical overview with all
measured values for all
acquisition periods)
Overall graphic total
(Overall graphic total)
Ctrl+Alt+G
X
Overall graphic
(graphical overview with all
measured values for selected
acquisition period)
Overall graphic
(Overall graphic)
Ctrl+Alt+O
X
Acceleration table
(for selected acquisition
period)
Acceleration a-table
(Acceleration a-table)
Ctrl+Alt+A
X
Distribution of acceleration
(for selected acquisition
period)
Acceleration Distribution
Table/Graphic
(Acceleration Distribution
Table/Graphic)
X
Classification of acceleration
(for selected acquisition
period)
Acceleration
Classification Table/Graphic
(Acceleration Classification
Table/Graphic)
X
Limit table
(a-table with values above
the chosen limit for the
selected acquisition period)
Acceleration
Limit table
(Acceleration Limit table)
X
Synchronous table
(table with the cyclic
measured values)
Synchronous table
(Synchronous table)
Ctrl+Alt+T
X
Table of digital events
Digital table
(Digital table)
Ctrl+Alt+D
X
GPS values
(opens the configured
standard program to show
the tracked GPS values for
the selected acquisition
period)
GPS values
(GPS values)
Ctrl+Alt+I
X

EnDaL curve/vi PC EVALUATION SOFTWARE ENCUR
- 17 -
Function
Symbol
Main menu
(context menu)
Shortcut
Opened file
Closed file
Change password
(configuration of the device
protection)
Change password
X
Menu Options
Basic settings (configuration
of interfaces and display)
Basic settings
X X
Classification (parameter for
classification)
Classification Shock
duration/ Acceleration/
Velocity
X
Limit value (sets the threshold
for limit table)
Limit value
X
Spectrum (parameter for
spectral analysis)
Spectrum
X X
Language setting
Language English/
Deutsch
X
Menu Help
Help topics (manual)
Help topics
F1
X
X
Info about…
Info about…
X X

PC EVALUATION SOFTWARE ENCUR EnDaL curve/vi
- 18 -
5 . 4 C O N F I G U R A T I O N S ( O P T I O N S )
5 . 4 . 1 Ba s i c S e t t i n g s
In the menu Basic settings the file path, the communication interface as well as the graphical view can be
configured. The types of measurement data to be transferred from the EnDaL curve/vi to the PC can also
be configured. This menu is located in the tab Options.
Confirming the basic settings with the button “OK” saves the configuration for the next program start in the
selected working directory.
Path settings
The transferred data will be automatically saved in the “Working directory”. This directory can be changed
in the tab “Path settings”. Additionally the user settings will be stored in this file path for the next start of
ENCUR.
The “Measuring program for automatic programming” is an
individually configured measuring program file, which can be
chosen to configure more than one device with the same
program. The file can be transferred by the menu “EnDaL
Autoprogramming” (Strg + A).
The selected “GPS program” is used to display the measured GPS
data. GPS values are tracked by a Tracking
Module or a data link TM, which can be connected
with the EnDaL curve or EnDaL vi. If the file path
is invalid, the ENCUR program will assume the standard software
of the PC system.

EnDaL curve/vi PC EVALUATION SOFTWARE ENCUR
- 19 -
Data transfer
Under “Com-Port” you can select the port which is used to interface the EnDaL curve/vi. If
“Auto COM-Port” is checked, ENCUR will automatically search for a connected data logger. In this case,
the COM-Port cannot be selected by the user. The box shows the connected port, which was used most
recently. It may also show the first port where a device was recognized. The main window of ENCUR
provides a button which displays the status of the connection:
Text
Display
Function
… Searching for device
n.c. No Port selected or no device found
COM<n>
Selected or connected COM-Port
If the “Auto COM-Port” is activated, you can search for a
device with a click on this button.
In “Basic settings”, the baudrate can be configured. The
EnDaL curve/vi adjusts its baudrate
automatically. A baud rate of 115200 is recommended to
reduce the transfer time. When using long data cables, it can be necessary to select a lower baud rate.
In the panel “Data transfer”, you can select the different types of measurement data to be transferred from
the EnDaL curve/vi to the PC. The transfer of the acceleration curves is bound to the transfer of
acceleration events.
Graphics
With the tab “Graphics”, the colours of the overall graphic and the curve graphics can be individually
configured.

PC EVALUATION SOFTWARE ENCUR EnDaL curve/vi
- 20 -
5 . 4 . 2 Cla s s i f i c a t i o n
In the menu “Options Classification”, the parameter for the classification can be selected. The
classification (table and graphic) sorts the measured values according to selected parameters (see 5.7.3.4)
5 . 4 . 3 L i mi t V a l u e
The menu “Options Limit value” activates a filter for the measuring data.
This filter consists of a measured variable and a limit value. The status view
shows the number of all measuring data exceeding the selected limit. The
Limit table (“EnDaL Acceleration Limit table”) lists all filtered measuring
data exceeding the limit value for the selected acquisition period.
5 . 4 . 4 Sp e c t r u m
In the menu Spectrum you can configure parameters for the spectral analyses. Changes will take effect for
diagrams opened after configuration, not for diagrams currently shown. The parameter Quality affects the
Vibration Response Spectrum (VRS) as well as the Shock Response Spectrum (SRS). A typical value for the
quality is 10.
The bandwidth affects the Power Spectral Density (PSD) and
the VRS. Since the calculation of the SRS uses the results of the
PSD, the SRS also depends on the bandwidth. For further
information, please refer to the description of the spectrum
analyses (see 5.7.3.2).

EnDaL curve/vi PC EVALUATION SOFTWARE ENCUR
- 21 -
5 . 5 M A N A G E M E A S U R I N G A N D P R O G R A M F I L E S
Open files (*.epz and *.edz)
If all files are closed, you can load a measuring file (*.edz) or a measuring program file (*.epz). There are
different ways to open a file: Using the menu “File Open“, pushing the button , using the shortcut
“Ctrl + O“ or via drag & drop. Furthermore the menu “File” lists the four most recently used files. You
can set the filter for measuring program files (*.epz) and measuring files (*.edz) in the dialog box “Open”
on the bottom right.
Reading out the device
Start the readout of the device using the button , or by menu “File Data transfer“ or by short-cut
“Ctrl + T“. The file read out prior to that remains saved in the working directory.
Prior to readout, please ensure that the safety shackle is removed and the device is turned on! Also
configure the correct COM port if the automatic search is inactive!
If a password for reading out is set, the software prompts you to enter it.
Save a measuring file (*.edz)
If a measuring file is open, it can be saved by menu “File Save“, by using the button or by using the
shortcut “Ctrl + S“. Additionally, the software will ask to save the current project when you close the file or
the software.
Save a measuring program file (*.epz)
The device settings will also be saved in a measuring file. Additionally, you can predefine a configuration
file (measuring program file) and save this for configuration of devices in the future. You can find the save
option within the measuring program window (“EnDaL Meas. program“, “Ctrl + M”, Button ).
Print preview and print
A status report can be printed by “Ctrl + P“, or by the button or through the menu “File Print“. Print
preview shows a tabular overview of the status report. The status report contains the device configuration
and the summary of measuring data.

PC EVALUATION SOFTWARE ENCUR EnDaL curve/vi
- 22 -
5 . 6 D E V I C E C O N F I G U R A T I O N
5 . 6 . 1 Meas u r i n g P r o g r a m
The measuring program configures the settings for data recording. From ENCUR 3.0, the configuration
parameters of the acceleration sensors including their measuring range are transferred to the device only if
selected (see 5.6.2).
Please check whether the safety shackle is removed and the device is switched on before transferring the
configuration to the device! Check also the correct COM port if the automatic search is inactive!
The sensor settings (included the positions 4 and 5) will be only transmitted, if the checkbox
„Retain sensor settings“ is NOT checked!!!
1 6 4 5 9
10
11 8 7
12
13
14
15
16
17
18
19
20 3 2

EnDaL curve/vi PC EVALUATION SOFTWARE ENCUR
- 23 -
N°
Label
Function
1
Meas. channels
(cycl.)
Activates/deactivates the cyclic measured parameters (Interval
T/F/AN):
GPS, temperature (T), relative humidity (H), analogue channel (AN)
2
Events
(Digital)
Activates/deactivates the event triggered parameters:
Digital channels (D0, D1, D2, D3),
3
Retain sensor settings
The settings of the sensor configuration window and the parameters
inner frame (measuring range and acceleration channels) won’t be
transferred to the device, if check. Deactivation of the checkbox opens
the window for sensor configuration.
4
Events
(Acceleration)
Activates/deactivates the event triggered parameters:
Acceleration channels (X, Y, Z),
GPS for digital channels and acceleration channels.
From ENCUR 3.0, the meas. channels is only configurable using the
sensor configuration window.
5
Meas. range
Shows the measuring range of the sensor and the corresponding
maximum acceleration value. From ENCUR 3.0, the meas. range is
only configurable and transferable using the sensor configuration
window.
6
Reg. threshold
The percentage threshold of measuring range at which an acceleration
event will be recorded
7
Alarm threshold
The percentage threshold of measuring range at which an alarm event
will be signalized.
8
Frequency range
Configures the cutoff frequency for the low pass filter of 4th order in
discrete steps between 16 Hz and 1000 Hz.
9
Min. shock duration
Minimal shock duration at which an acceleration event will be recorded
10
Curve duration
Duration of the recorded acceleration curves
(20 curves at 1024 ms, 10 curves at 2048 ms)
11
Interval T/H/AN
Interval for cyclic measurement (synchronous interval)
12
Serial number
Manufacturer serial number (read only)
13
Mailbox
Short note e.g. a transport name or route information (max. 64
characters)
14
New battery
Configures battery type and resets counter of operating hours
15
Time configuration
Sets the device time. A time zone information can be configured
16
Activation periods
Periods of time when the device is ready for measuring.

PC EVALUATION SOFTWARE ENCUR EnDaL curve/vi
- 24 -
N°
Label
Function
17
Send
Sends the above parameters to the device (transmission of the sensor
setting depends on setting “Retain sensor settings” (N° 3))
18
Save
Saves the current configuration (including the sensor configurations) in
a measuring program file (*.epz)
19
Print
Print preview of the current configuration
20
Close
Closes the measuring program
5 . 6 . 2 Se n s o r C o n f i g u r a t i o n
The sensor configuration can be accessed from the field “Retain sensor settings” of the measuring program
window, as soon the checkbox is cleared. In this menu, you can configure the external and internal sensors.
However, saving a measuring program file (*.epz) also contains the parameters of the sensors. Clicking
“Close” requires a confirmation to apply the settings for the measuring program file and for transmitting the
sensor parameters to the device.
Changes of parameters will not take effect until the configuration
is transmitted to the device.
Acceleration sensors
In the tab “Acceleration sensors”, the correct sensor type of the
device can be selected. Additionally, the measuring range and
the associated unit of the sensor can be set. With specification of
the coefficients, which are stated in the respective calibration
certificates, the software calculates the maximum measuring range
for the acceleration. The acceleration channels can be
activated/deactivated as well the GPS tracking function for
acceleration and digital events (requires a Tracking
Module or a data link).
Analogue measuring channel
In this tab, the analogue measuring input can be configured. This
configuration requires a linear relationship between the input
signal (x) and the output signal (y). The parameters Offset (n),
Factor/Coefficient (m) and Meas. delay (t0) have the following
coherence:
𝑦 (𝑡)= 𝑚 ∗ (1638 ∗ 𝑥 − 𝑛) ∗(𝑡 + 𝑡
0
)
The Measuring unit pertains the output signal and is for better readability during evaluation.

EnDaL curve/vi PC EVALUATION SOFTWARE ENCUR
- 25 -
Digital channel
Each one of the 4 digital channels can be individually labelled
(name). The respective logic states or conditions on (1) and off (0)
can be labelled as well. This is for better readability during
evaluation.
5 . 6 . 3 A u t o p r o g r a m m i ng
Autoprogramming is a fast method to configure the data logger
EnDaL curve/vi.
Using this function, the software reads data from a connected
device and then sends a predefined measuring program to the device. The sensor configuration will not be
affected.
This function can be accessed through menu “EnDaL Autoprogramming” or shortcut “Ctrl + A”.
If the password protection for configuration is enabled, the software asks to enter this password between
reading out and send of the configuration. Due to the time delay, the EnDaL curve/vi will
break the communication. Do not enter the password until the LEDs go black!
5 . 6 . 4 P a s s w o r d
You can protect the data logger with a password. This function can be found in the menu “EnDaL
Change password“. There are different ways to protect the device. The option “only measuring program”
protects against unwanted reconfiguration of the
device. The full password protection protects
against both unwanted reading out and
reconfiguration.
The software will then ask for the password at the
respective points. If you have forgotten your
password, please contact the support stating the
device serial number.

PC EVALUATION SOFTWARE ENCUR EnDaL curve/vi
- 26 -
5 . 7 E V A L U A T I O N O F M E A S U R I N G D A T A
5 . 7 . 1 D e v i c e S t a t u s a nd A c q u i s i t i o n P e r i o d s
N°
Label
Function
1
Instrument data
Information of serial number, mailbox, device time and operating
time.
2
Measuring parameters
Device configuration relevant for recording
3
Limit value
Number of the measured values exceeding the configured limit (see
5.4.3)
4
Overview of events
Shows the number of measured values with minimum and maximum
5
Acquisition periods
Shows the periods where the device was active for recording, why
the period ended and the number of measured values in this period
The instrument data includes the manufacturer serial number which is also printed on the device label.
The mailbox shows a short note (e.g. with transport or installation information), which was noted down
by the customer in the measuring program before. System time is the time of the device on the moment of
reading out. The time zone is also displayed. The operating time shows the elapsed operating hours and
the estimated percentage power consumption since the last reset of the battery using the measuring
program.
Except for the “overall graphic total”, all of the following types of analyses relate to the selected (marked)
acquisition period. The “overall graphic total” is an overview of all acquisition periods. The particular
analysis can be opened by the context menu (right-clicking on the acquisition period), the menu “EnDaL” or
the buttons on the top.
1
2 3 4
5

EnDaL curve/vi PC EVALUATION SOFTWARE ENCUR
- 27 -
5 . 7 . 2 O v e r a l l G r a p h i c ( t o t a l )
The “Overall graphic” shows the occurrence of all measured parameters of the selected acquisition period.
The “Overall graphic total” shows this occurrence over all acquisition periods.
Nr.
Description
1
Diagram area for all measured variables
2
Ordinate for the relative humidity (H) in %rH
3
Ordinate for analogue measuring channel (AN)
4
Ordinate for temperature (T) and dew point (DP) in °C
5
Ordinate for acceleration in g
6
Digital channels
7
Legend with hide function for each measured variable
8
Measurement values at cursor position
9
Export and print function
2 5 6 3 7
8 9 1
4

PC EVALUATION SOFTWARE ENCUR EnDaL curve/vi
- 28 -
In the overall graphic you can navigate as follows:
Key
Mouse key
Mouse
movement
Function
Ctrl
right
-
Opens functions (context menu) for marked curve
-
right
Left or right
Moves the graphic
-
left
From left to right
Zooms in the time base
-
left
From right to left
Zooms out the time base (standard view)
-
Double click left
-
Opens the acceleration curve of the marked curve
5 . 7 . 3 A c c e l e r a t i o n D a t a
There are many ways to represent the recorded acceleration data. Besides the overall graphic, the
acceleration table (a-table) is an important viewing tool.
5 . 7 . 3 . 1 A - t a b l e
The acceleration table summarizes all acceleration events with their parameters. The table shows the time
stamp, the acceleration value and the shock strength (change of velocity) for every acceleration channel
(X, Y, Z) as well as the spatial vector (R). Additionally, the parameters for the shock duration and the
shock direction are shown. If GPS coordinates are available for the corresponding acceleration event, it will
be indicated by the symbol “i” in the last column.
EnDaL curve/vi PC EVALUATION SOFTWARE ENCUR
- 29 -
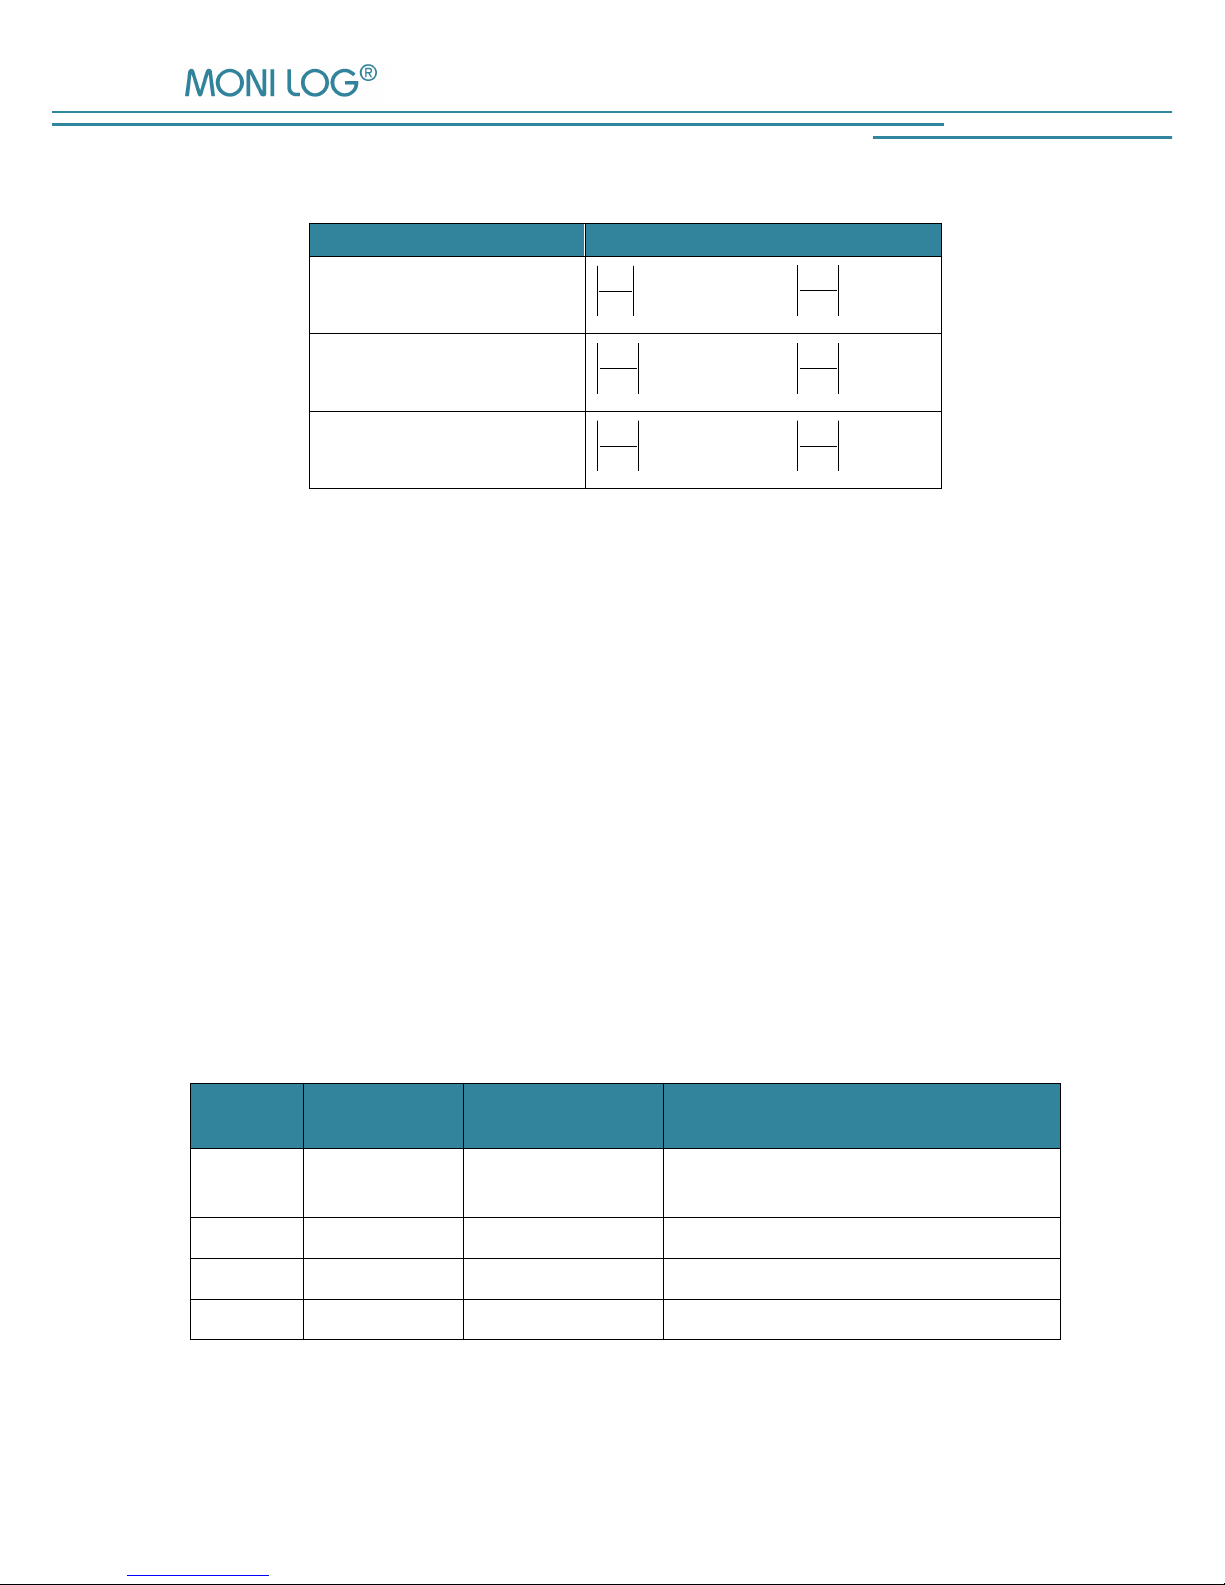
The headers “direction” and “area” indicate from where the acceleration was induced. The area indicator
is defined as follows:
Shock in direction of
Function
Corner
58.0
max
1
a
a
N
and
N
a
a
2
0 58
max
.
Edge
N
a
a
1
0 58
max
.
and
N
a
a
2
0 58
max
.
Surface
N
a
a
1
0 58
max
.
and
N
a
a
2
0 58
max
.
a
max
Acceleration value of the direction component with the highest absolute value
aN1 Acceleration value of the component with the second highest absolute value
aN2 Acceleration value of the component with the lowest absolute value
An acceleration curve is available for each event marked in pink. Right-clicking on an event marked in pink,
opens a popup menu, where the curve analysis can be selected. You can also start the external program to
evaluate the GPS coordinates. With the menu “Export”, you can print the table or export it as a text file
(separated by semicolon). In this way, it is possible to import the table in other programs like Microsoft
Excel.
5 . 7 . 3 . 2 C u r v e A n a l y s i s
In order to assess transport damages, it is often necessary to analyze measured data comprehensively. It is
not possible to derive all this information from the acceleration table. Thus, ENCUR offers advanced ways
to analyze the curves and spectra graphically. These graphical analyses can be accessed through the
acceleration table, the context menu of the overall graphic or directly from the analysis.
In the legend of the graphics, you can enable and disable the visibility of each acceleration channel. The
current measuring values of the cursor position are represented on the top right. Additionally, an octave
analysis is shown on the bottom right. All diagrams of the curve analysis can be operated as follows:
Key
Mouse key
Mouse
movement
Function
Ctrl
right
-
Opens functions (context menu) for further
analyses and export
-
right
Left or right
Moves the graphic
-
left
From left to right
Zooms in
-
left
From right to left
Zooms out (standard view)

PC EVALUATION SOFTWARE ENCUR EnDaL curve/vi
- 30 -
Curve table and acceleration curve
The curve table represents the course of the
acceleration curve for the channels X, Y, Z and the
magnitude R. On the top of the table, the time stamp
of the curve can be seen. Right-clicking opens further
analysis windows as well as export and print
functions. The acceleration curve shows the same
content of data in graphical form as the curve table.
FFT (Fast Fourier Transformation) and
octave analysis
The Fourier transformation represents the root mean
square (RMS) values of specific frequencies. This
way, it is possible to recognize the strength of
specific frequency bands. This can be useful
because high frequency ranges of shocks are not
always critical for cargo. The ordinate of the
frequency analysis is normalized to 1 g and
scaled in dB.
The octave analysis is the arithmetic mean of the
FFT for specific frequency ranges. The calculation is
carried out before the values are normalized for the
dB scale. Therefore, it has the unit of the
acceleration. Using the drop down menu, the channel for the octave analysis can be selected.
PSD – Power Spectral Density
The PSD represents the potential power of a
particular frequency range of a random
acceleration signal. This frequency range
(Bandwidth) can be configured under “Options
Spectrum”. The calculation is based on the
unnormalized result of the FFT. The unit is the
square of the acceleration per frequency ([𝑔2/𝐻𝑧]).

EnDaL curve/vi PC EVALUATION SOFTWARE ENCUR
- 31 -
SRS - Shock Response Spectrum
The SRS is a mathematical model to estimate the
potential damage of the cargo. It represents the
system’s response in form of the acceleration peak
value of a particular frequency or a frequency
range. This frequency range (Bandwidth) can be
configured under “Options Spectrum”. The SRS
is based on the result of the PSD. The unit is
acceleration peak value per frequency ([𝑔/𝐻𝑧]).
VRS – Vibration Response Spectrum
The VRS is a similar approach like the SRS. This
mathematical model describes the system’s
response on vibrations with certain frequencies. In
contrast to SRS, the root mean square value is
shown instead of the peak value. Thus, the unit is
[𝑔
𝑅𝑀𝑆
].
5 . 7 . 3 . 3 D i s t r i b u t i o n
The distribution divides the shock events of an
acquisition period into 10 equal time periods. The
shock events are then ordered into these periods. The
distribution can be displayed in tabular form or in
form of a bar graph.
In both windows, it is possible to open a popup menu
by a right click. There, you can toggle between
tabular or bar graph form and print or export the
distribution.

PC EVALUATION SOFTWARE ENCUR EnDaL curve/vi
- 32 -
5 . 7 . 3 . 4 C l a s s i f i c a t i o n
The classification orders the occurred shocks of an
acquisition period into 10 classes. The classification
is carried out according to the maximum value. The
classification is on a linear basis. Under “Options
Classification”, parameters for the classification
(magnitude, velocity, shock duration) can be
selected.
The classification can be displayed in tabular form
or in form of a bar graph.
In both windows, it is possible to open a popup
menu by a right click. There, you can toggle
between tabular or bar graph form and print or export the distribution.
5 . 7 . 3 . 5 L i m i t T a b l e
The limit table filters shock events in the acceleration table regarding the configured threshold for the
selected acquisition period. Under “Options Limit value”, the parameter and threshold can be set. The
meaning and functionality of the limit table is equal to that of the acceleration table (see 5.7.3.1). The total
number of all measured values exceeding the threshold is represented by the field “Limit value” of the status
data.
5 . 7 . 4 C o n t i n u o u s ly m e a s u r e d d a t a ( S y n c h r o n o u s d a t a )
The cyclically measured data are represented
by the synchronous table. Depending on the
device configuration and active sensors, the
table indicates, including timestamps, the
measured temperature and relative humidity,
the calculated dew point, the analogue
measuring channel as well as the availability
of GPS coordinates (“i”). Using the context
menu, GPS data can be viewed with the
external program and the table can be printed or exported.
5 . 7 . 5 D i g i t a l E v e n t s
Each time a digital channel senses a change
of its logic state (high or low), a digital event
will be generated. There are 4 digital
channels in total. The logic states will be

EnDaL curve/vi PC EVALUATION SOFTWARE ENCUR
- 33 -
displayed with their labels according to the sensor configuration (see 5.6.2). GPS information can be
viewed, if available. Using the context menu, GPS data can be printed or exported.
5 . 7 . 6 G P S - D a t a
Using a MONI LOG® data link TM enables tracking of GPS coordinates. GPS data are available for
shock events, digital events, and synchronous data. To display this geo data, a KML file will be generated
for the selected acquisition period and then opened by the program which is configured in the basic
settings. The usage of Google Earth as GPS program is recommended.
Please note that an internet connection is necessary to use Google Earth.
In Google Earth on the left side, the EnDaL curve/vi device is listed with its measuring data. You can
enable and disable display of different types of measuring data as well as single events using the check
boxes. With a click on an event in the list or on the map, more information of the event will be shown.

SERVICE AND CALIBRATION EnDaL curve/vi
- 34 -
5 . 8 H E L P
Help topics
… opens the pdf help in the selected language. The help file is implemented in the software, so there is no
prior setup necessary to use the help function. Opening the help creates a local copy in the configured
working directory.
Each window within ENCUR has a “?” symbol on the top left. A click on this symbol will open the pdf help
on the respective page. Please note that the printed manual contains more information about the device
and the software than you can find with fast help functions.
Info about
… shows some information about the publisher and the version of ENCUR.
6. S ER VI C E AND CALIBRAT ION
The EnDaL curve/vi has an internal backup battery, which supplies the internal clock while
the device is switched off. This backup battery must be replaced every 6 years.
The sensors should be recalibrated every 2 years to guarantee the measuring accuracy.
Please contact the customer support for changing the backup battery or recalibrating the sensors.

EnDaL curve/vi WARRANTY CERTIFICATE
- 35 -
7. W A RR AN TY CERTIFICATE
EnDaL curve/vi
Against submission of this warranty certificate we grant a 12-month warranty from the date of delivery for
the above instrument.
In case of deficiencies we first have the right of rectification, either rectification of the deficiency or
subsequent delivery. Should the rectification fail, and only then, we will take back the instrument and
reimburse the purchase price. Any further warranty claims shall be excluded.
This warranty covers all faults that impair the proper functioning of the instrument due to technical defects of
individual components or assemblies.
Batteries and rechargeable batteries as expendables are not covered by this warranty.
This warranty will only be granted if the instrument has been used properly for its intended purpose.
Any attempts of the warrantee or third persons to repair the instruments or to intervene in any other way
exclude warranty claims.
Any mechanical damage which is the result of undue stress also excludes warranty claims.
We will immediately notify the warrantee of any repair work excluded from warranty coverage.
If the instrument is sent in together with the warranty certificate, this will be considered as a repair order for
the elimination of all damage.
The warrantee can exclude partial services.
In case of any malfunctions of the instrument, please state the serial no. You can find it on type label or on
the logs when evaluating your data.
SMT ELEKTRONIK GmbH Telephone: +49 351 / 266 13 0
An der Prießnitzaue 22 Fax.: +49 351 / 266 13 10
D – 01328 Dresden Email: info@smt-elektronik.de
GERMANY
Copyright
The software is protected under the amended copyright law. Copies (with the exception of
backup copies) may only be made after express permission by SMT ELEKTRONIK GmbH.
Google and Google Earth are trademarks of the Google company.
 Loading...