

Page 1
Navigator Software User‟s Manual
Rev 1.1.1 May 2008
Navigator Software
Contents
1. NAVIGATOR SOFTWARE
2. INSTALLATION
3. USING NAVIGATOR SOFTWARE
3.1 STARTING THE PROGRAM
3.2 SYSTEM SET UP
3.3 LOAD DATA FILE
3.3.1 LOADING PARTIAL FILES
3.4 DATA TABLE WINDOW
3.4.1 JUMPING TO A SPECIFIC POINT
3.4.2 CREATING A REPORT
3.5 GRAPH WINDOW
3.5.1 GRAPH BUTTONS
3.5.2 ZOOM TO FIT
3.5.3 CUSTOMIZING THE GRAPH
3.5.4 SEARCH
3.5.5 USING REAL TIME DATA
3.5.6 ANNOTATING REAL TIME DATA
3.6 WORKING WITH REMOTE RECORDERS
3.6.1 SET CLOCK
3.6.2 CARD STATUS
3.6.3 RECORD FUNCTIONS
3.6.4 MEDIA
3.6.5 CONFIGURATION
3.6.6 FILE
3.6.7 RESET DEVICE
APPENDIX A – LANGUAGE FILES
Page 1 of 20
Page 2
Navigator Software User‟s Manual
Go to Contents
1 NAVIGATOR SOFTWARE
The Navigator Software is a program for viewing and exporting both real-time and non-real-time data from the
recorder. It also enables recorders to be controlled and configured remotely.
2 INSTALLATION
This program will run on Windows XP/2000 and later. It is not compatible with earlier versions of Windows.
To install the Navigator Software:
1. If you have the USB option on your recorder, make sure it is not plugged in during the installation.
2. Insert the Navigator CD into the CD drive. The setup program should launch automatically if your system
is set to auto play CDs. If not, select the CD directory and run the setup.exe file.
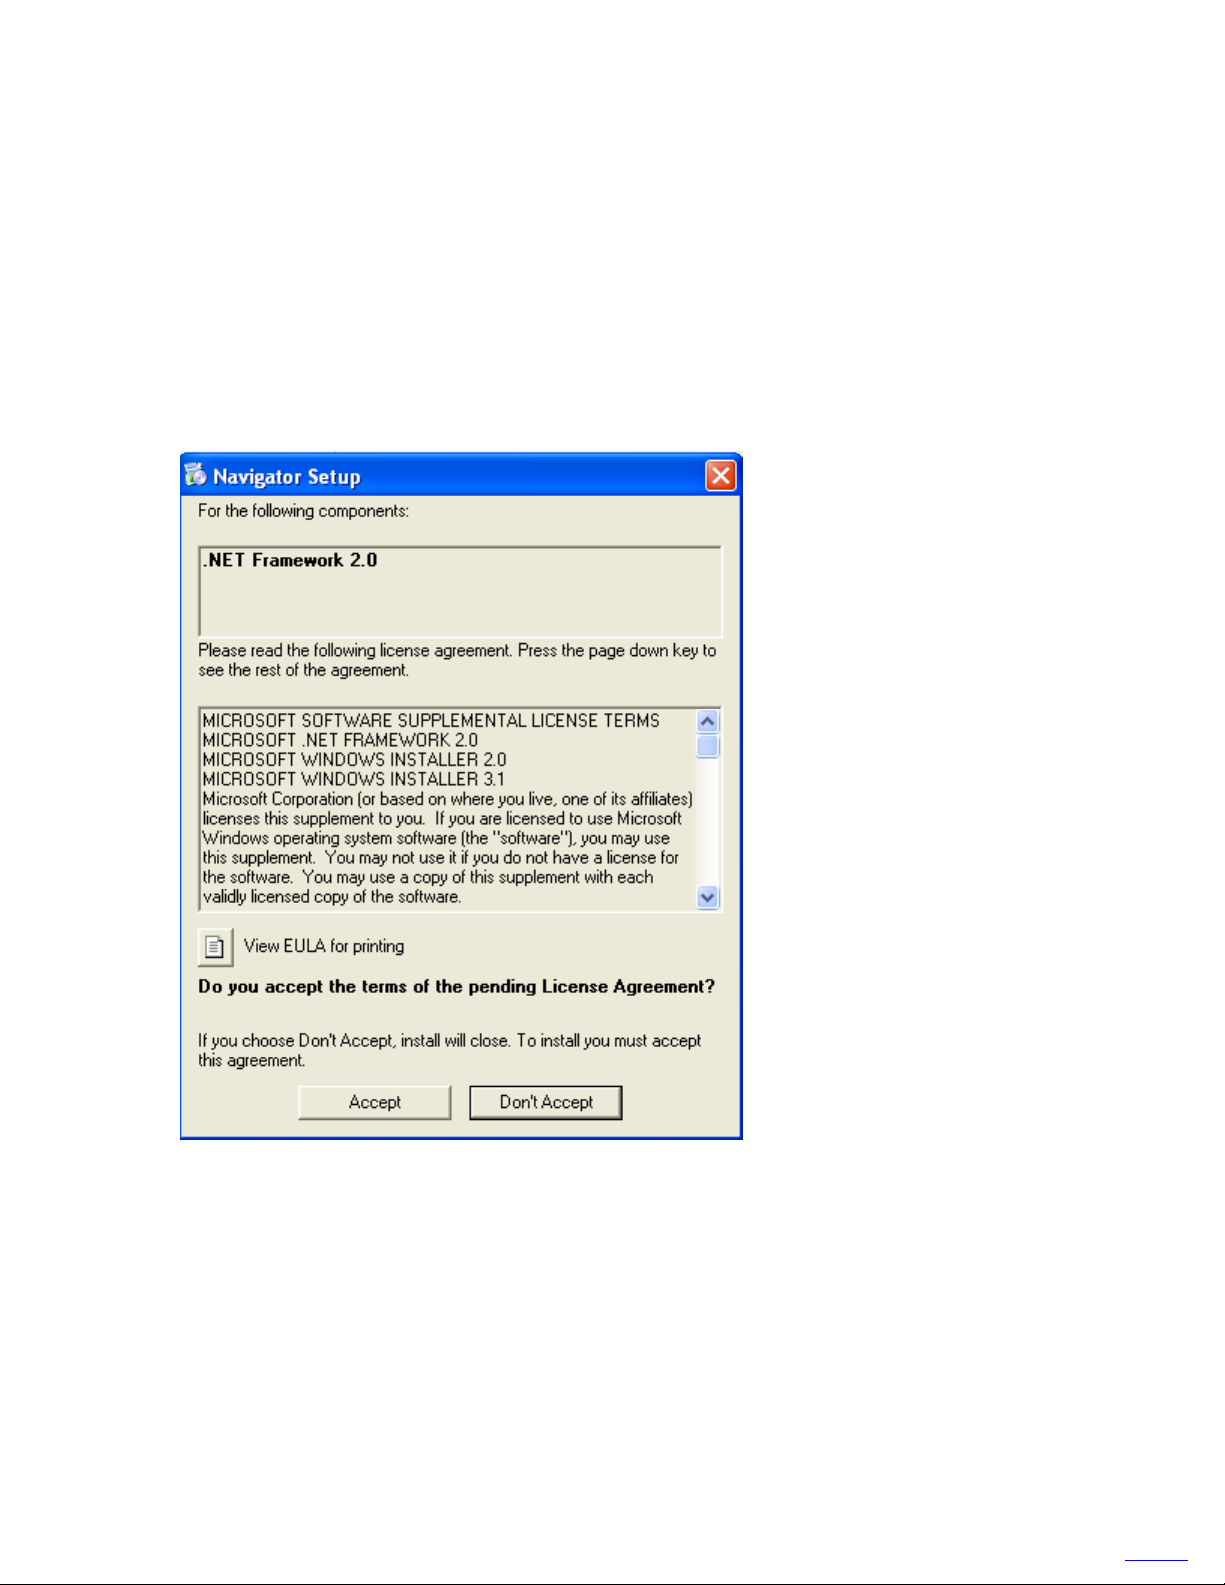
3. Navigator Software needs .NET Framework 2.0 to run. If .NET Framework 2.0 is not installed on the PC,
it will be installed first. This may take several minutes. Make sure you have network access.
4. After .NET Framework 2.0 is installed, the installation will launch the “Welcome to Navigator Setup
Wizard”.
5. Accept the license agreement and the default install directory or modify it as needed.
6. Enter the installer‟s name and organization.
7. Accept the default start menu folder or modify it as needed.
8. Decide whether you want a desktop icon and check the box if you do.
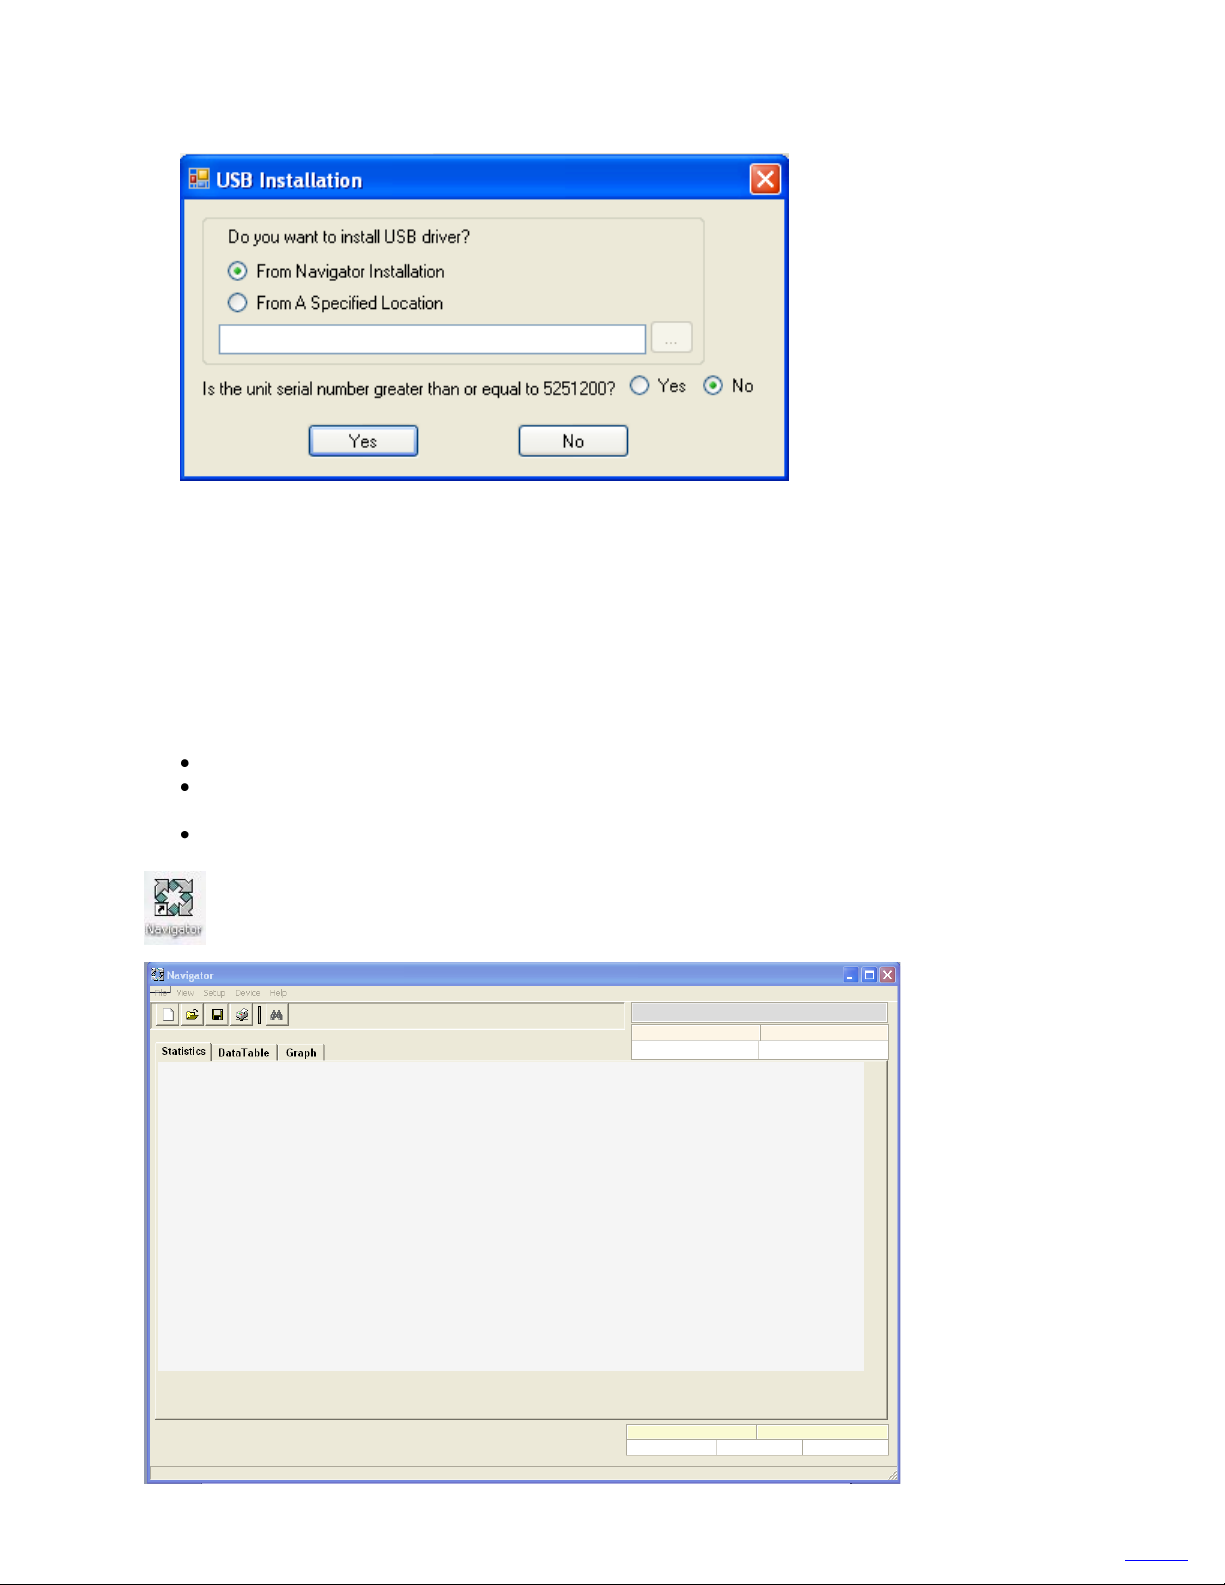
9. The USB installation will be launched.
Page 2 of 20
Page 3
Navigator Software User‟s Manual
Go to Contents
If you don‟t have the USB option, click the No button and the Navigator installation will be done.
If you have the USB option and want to install the USB drivers, follow these steps:
a) Since the drivers are being loaded as part of the Navigator Installation, check the radio button “From
Navigator Intallation”. The menu will explain what the option “From A Specified Location” is.
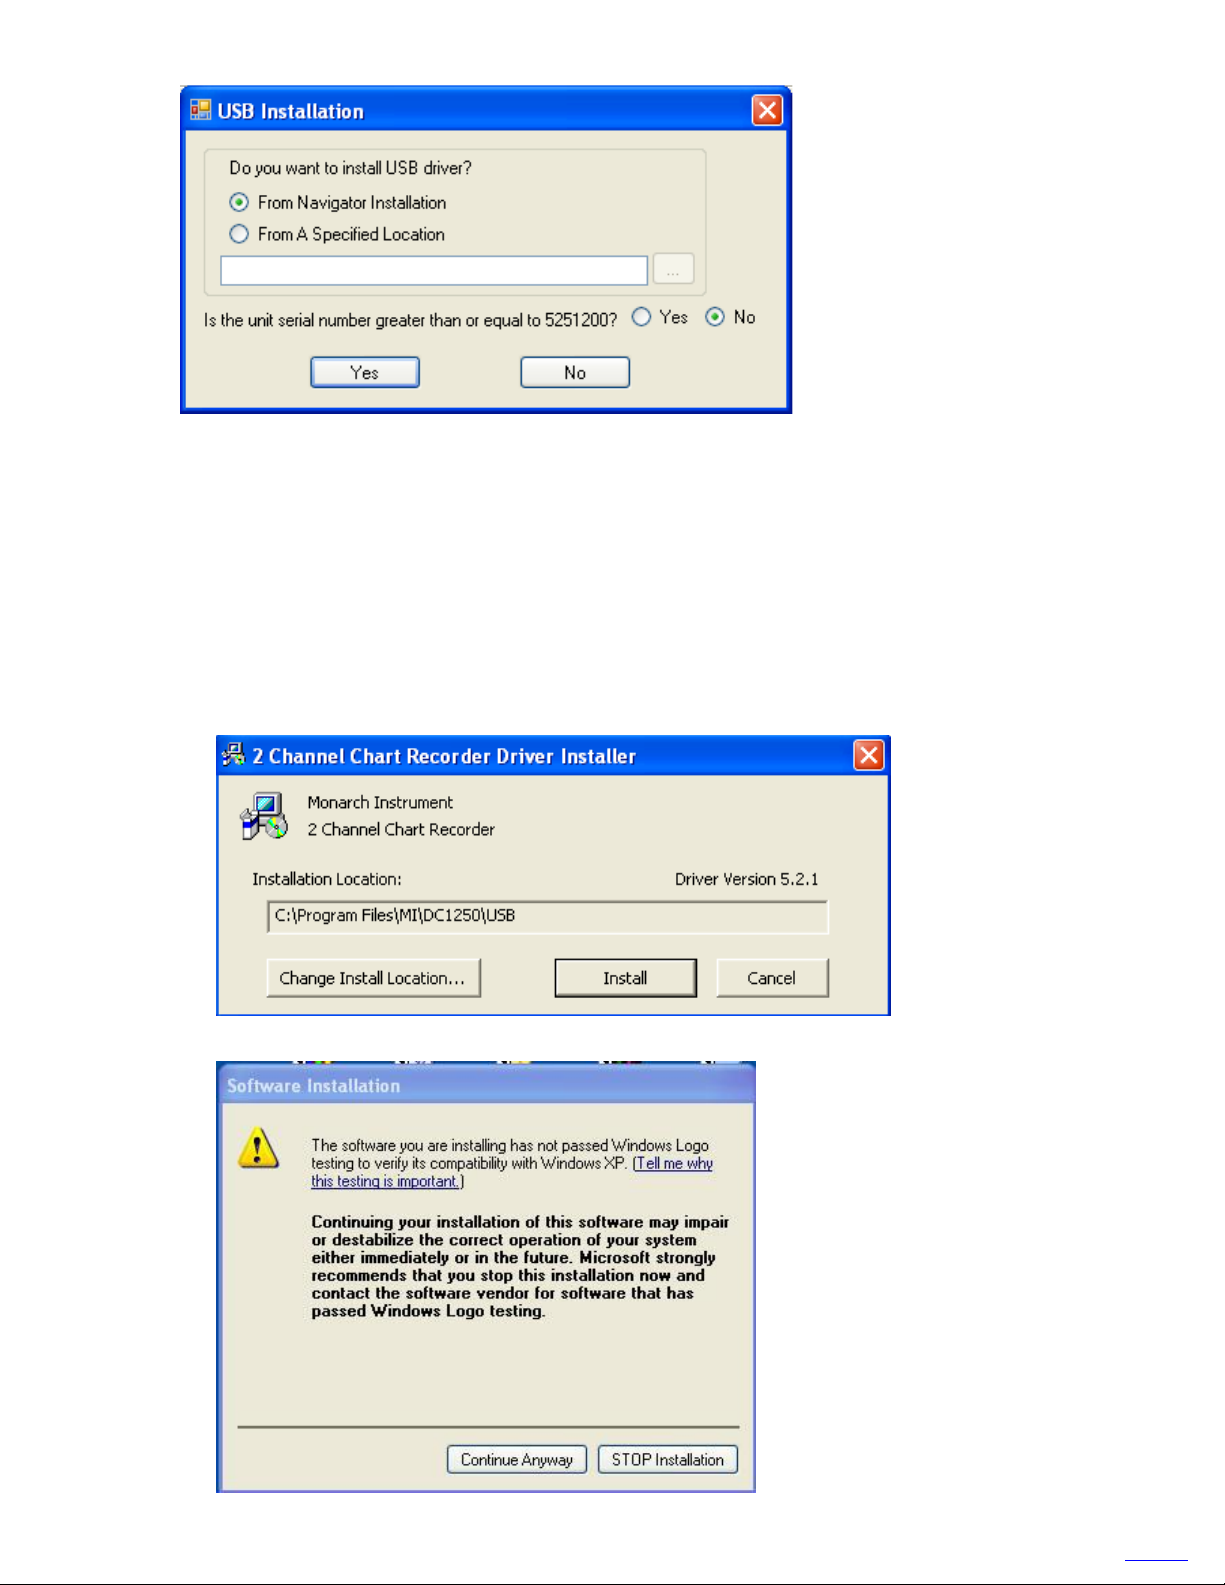
b) Verify the serial number of your unit. Select Yes or No for the question “Is the unit serial number
greater than or equal to 5251200?” If your serial number is greater than 5251200 the USB driver
installed will be from Silicon Lab. If your serial number is less than 5251200 the USB driver will be
from TI.
c) Click the Yes button to continue.
10. To continue with the installation of the USB drivers from Silicon Lab (serial number >= 5251200), follow
these steps:
a) Once you click the Yes button, the 2 Channel Chart Recorder Driver Installer will launch.
b) Change the Install Location if desired and then click the Install button. The installer will scan the
system and the following warning message will appear.
Page 3 of 20
Page 4

Navigator Software User‟s Manual
Go to Contents
c) Click the Continue Anyway button and you will be asked to restart your computer.
d) Once your computer has been restarted, turn the recorder on and plug the USB cable into the unit
and your PC.
e) The “Found New Hardware Wizard” will launch.
f) Make sure the installation CD is still in the CD drive and select the “Yes, now and every time I
connect a device” option. Then click the Next> button.
g) Select the “Install the software automatically (Recommended)” option and click the Next> button.
h) The following Hardware Installation warning will appear.
i) Click the Continue Anyway button. When you are done click the Finish button to complete the
installation.
Note: You can check the successful installation by right clicking on the My Computer
icon in the Start menu and selecting Properties. Then choose the Hardware tab and
click the Device Manager button. You should see one instance of the recorder device under Ports (COM
& LPT) listed as 2 Channel Chart Recorder USB Bridge (COMx).
Page 4 of 20
Page 5
Navigator Software User‟s Manual
Recorder
Recorder
Go to Contents
11. To continue with the installation of the USB drivers from TI (serial number < 5251200), follow these steps:
a) If this is your first installation, the recorder VCP Installer will launch and run. Accept the license
agreement and continue.
Note: If you have previously installed the TI USB driver, the installer will uninstall the old driver. You will
then have to install the driver manually. To install the driver manually run setup.exe, which is
located on the release CD in the Ti-Usb_driver folder.
b) Once the software has been installed, turn the recorder on and plug the USB cable into the unit and
your PC.
c) The “Found New Hardware Wizard” will launch (as shown in step 10e above).
d) Make sure the installation CD is still in the CD drive and select the “Yes, now and every time I
connect a device” option. Then click the Next> button.
e) Select the “Install the software automatically (Recommended)” option and click the Next> button.
f) The Wizard will search for the device – depending on your system this may take some time. Once the
driver is found you will get the following warning message:
g) Click the Continue Anyway button. When you are done click the Finish button to complete the
installation.
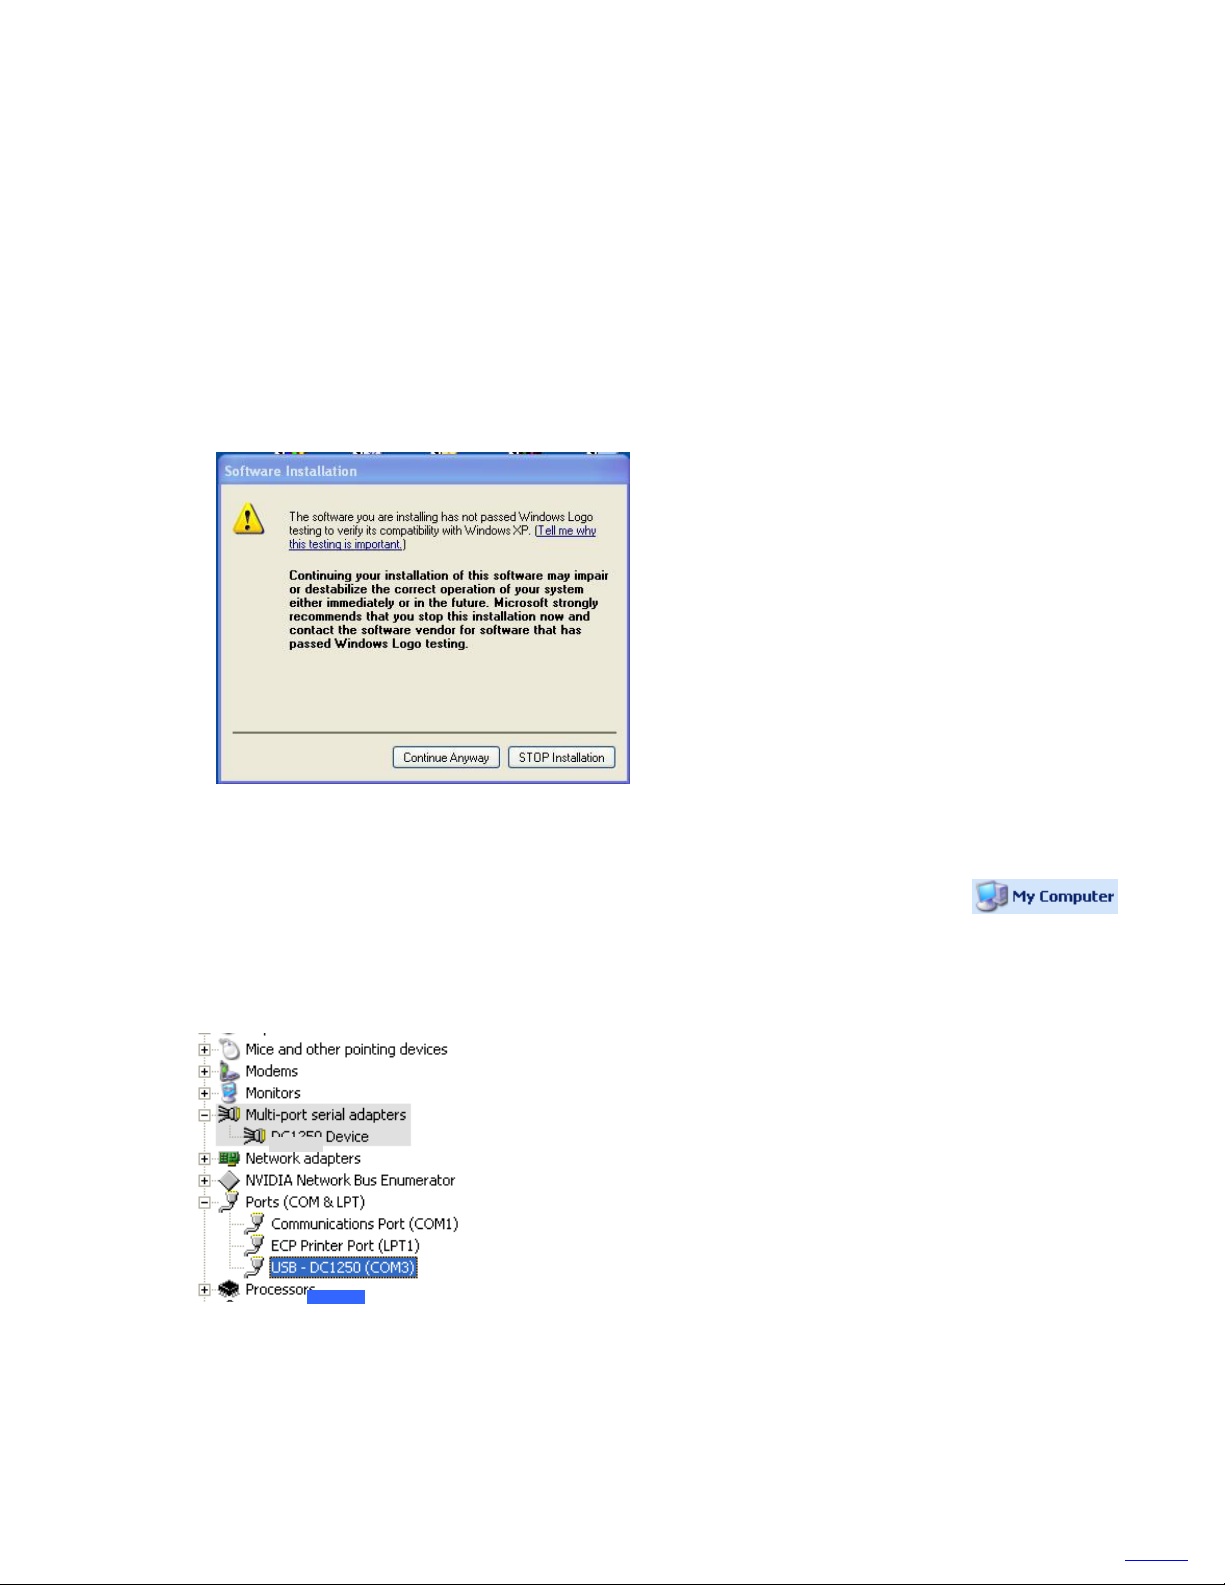
Note: Although the recorder connects via the USB port, the PC sees it as a virtual
COM port. You can check the successful installation by right clicking on the My
Computer icon in the Start menu and selecting Properties. Then choose the Hardware tab and click the
Device Manager button. You should see two instances of the recorder device as shown below, one as
“Multi-port serial adapters” and again under Ports (COM & LPT) as USB-recorder (COMx). For successful
operation “x” should be 6 or less.
Tip: Make sure you have no other programs running that take
control of the serial ports in the background (like some Hotsync
programs), as these will prevent the Navigator Software from
seeing the COM port.
Navigator Software is now installed in Demo mode. If you have purchased an upgrade license, you may activate
it by running the software and selecting Setup - Features - Update on the toolbar and typing the license number
provided.
Page 5 of 20
Page 6
Navigator Software User‟s Manual
Go to Contents
NOTE: If you wish to load the USB Drivers after Navigator Software has been installed, there is a program called
DC1250USBInstallApp.exe under the installation directory to do so. Run this executable to open the
USB Installation application.
Select “From A Specified Location” and then click the browse (…) button to select the USB driver setup
file.
Follow step 10 or 11 depending on which USB driver is being loaded.
3 USING NAVIGATOR SOFTWARE
3.1 STARTING THE PROGRAM
The Navigator Software has the following main features:
It can display information from existing data files in summarized, tabular and graphic formats.
It is capable of monitoring an external device and collecting real-time data (this requires the USB or
Ethernet option on the recorder(s).
It can export the collected data to Excel™.
To start the program, click the desktop icon if installed (shown left), or use the Window‟s Start menu.
This will launch the main dialog as shown below.
Page 6 of 20
Page 7

Navigator Software User‟s Manual
Go to Contents
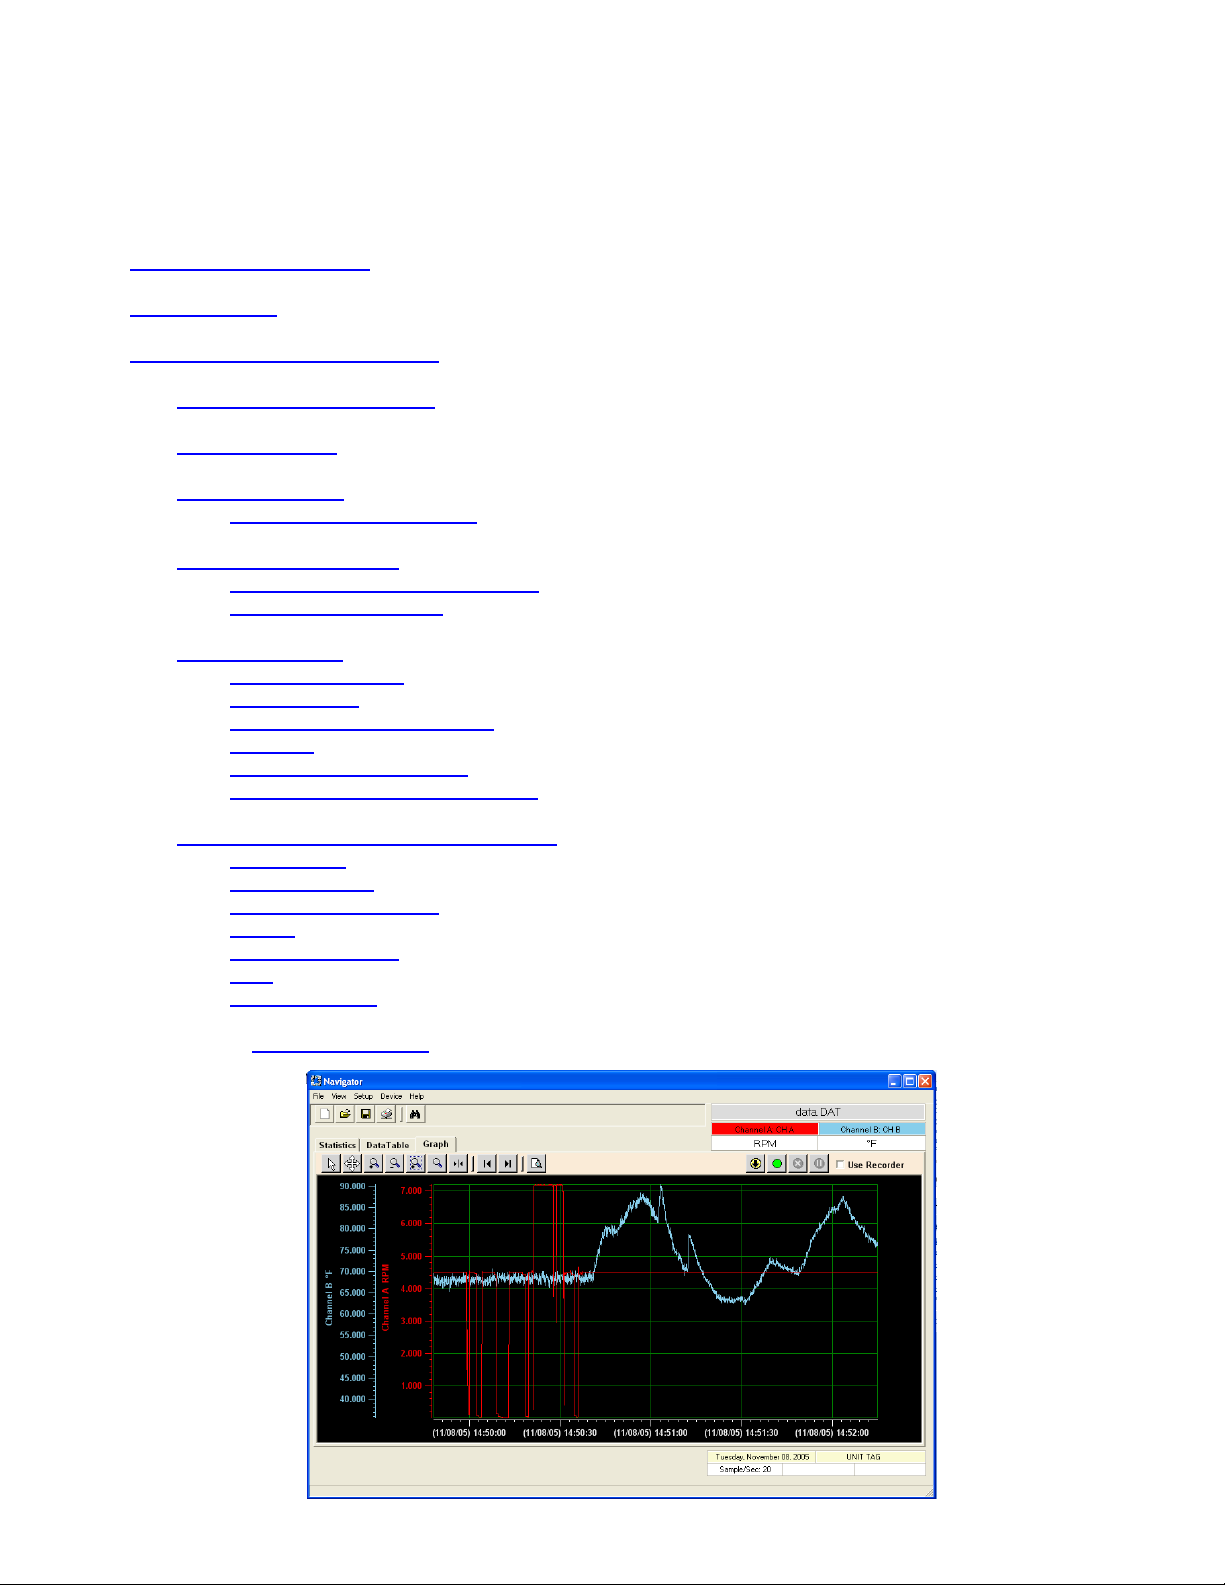
The main dialog consists of: a pull-down menu bar, a toolbar with basic icons and three tabs that determine
what is displayed in the workspace below.
The pull-down menu items are:
File Allows the user to open or export a file, select the data source
or Exit the program.
View Duplicates Icon options for the Graphics Screen.
Setup Allows the user to customize the program – Section 3.2.
Device Allows interaction with a remote recorder – Section 3.6.
Help Provides help files or information about the software.
The icons from left to right are: New, Open File, Save, Print Table and Search.
The tabs are:
Statistics Shows an overview of the loaded data
DataTable Shows a tabular layout of the data
Graph Shows a graphic representation of the data
3.2 SYSTEM SET-UP
There are a number of items that can be set up before using the program, although these default to useable
options.
The Setup menu has the following options:
3.2.1 Language – Default is English. It is simple to add languages (see Appendix A). If there is a
language file in the Navigator directory that contains languages besides English, these will be
shown and the user can select the language of his/her choice.
3.2.2 Preferences –
3.2.2.1 Temperature – Sets the default working temperature Celsius or Fahrenheit. Once
selected, all temperatures will be in these units irrespective of how they were recorded.
This is a start up setting and cannot be changed once selected without reloading the file.
Default is Centigrade.
3.2.2.2 Decimal Places – Determines how numeric data will be displayed. Select 0, 1, 2 or 3
places after the decimal. Default is 2.
3.2.2.3 Default Directory – Sets the default directory where data files are saved or read from.
The user can change the system default Program Files/Navigator/Data.
3.2.2.4 Page Mode Size – Select the maximum amount of data to load into memory at one time.
Default is 1MB. This will determine how much free memory is available versus speed of
operation.
3.2.3 Features – Allows the user to upgrade from the free demo (default) version to the Lite or Full
versions. Select Update and enter your serial number in the spaces shown. Upgrades can be
purchased from your distributor. Use the menu Help – About to see what features you have.
3.2.4 CommPort – Allows the user to override the default settings for the USB Com port if required.
These values are set automatically from the registry entries made by the driver install routine and
should not need to be changed.
3.2.5 Ethernet – Allows the user to communicate in real time with a recorder over the Ethernet. Only
one recorder can be connected at a time. The throughput is a function of network traffic and
whatever else is communicating with the connected recorder, e.g. a web browser. It is
recommended that the recorder be configured for sample speeds of 20 samples/second or less
for reliable operation.
3.2.5.1 IP Address – Allows the user to enter the device IP address and assign a user-friendly
name to the device.
3.2.5.2 Connect – Select the recorder you wish to connect to. If you do not see the IP address,
go to IP Address above and add it. Once connected you can use all the remote functions
described elsewhere in this manual.
3.2.5.3 Disconnect – Releases the remote recorder. You need to do this in order to connect to
another machine or to a USB port.
Page 7 of 20
Page 8
Navigator Software User‟s Manual
Go to Contents
3.3 LOAD DATA FILE
There are two sources for data, the local PC or the remote recorder. In order to load data from a remote
recorder it is necessary to select Use Recorder from the File menu or go to the Graph window (click the
Graph tab) and check the Use Recorder box on the top right as shown below. Obviously a recorder also
needs to be connected to the PC via its USB or Ethernet port.
To load a data file, click the File menu then choose Open or click the File Open icon (shown right).
In the Open File dialog, choose the file that you want to load. If the “Use Recorder” box was checked
the dialog box will only show files that are on the CompactFlash™ card on the remote recorder. Note that
loading files from a remote recorder is a lot slower than loading them from the local hard drive or
CompactFlash™ card plugged into the PC. It is possible to only load partial files to save time – see below. If
using files from the PC, simply browse to the directory in which the file to be loaded resides.
While the file is loading, a progress bar on the bottom of the screen will indicate loading progress. When
loading large files, enough data will be loaded to fill the table or the graphics screen. When scrolling beyond
these limits, additional data will be loaded as needed. Once data is loaded, the Statistics window will open
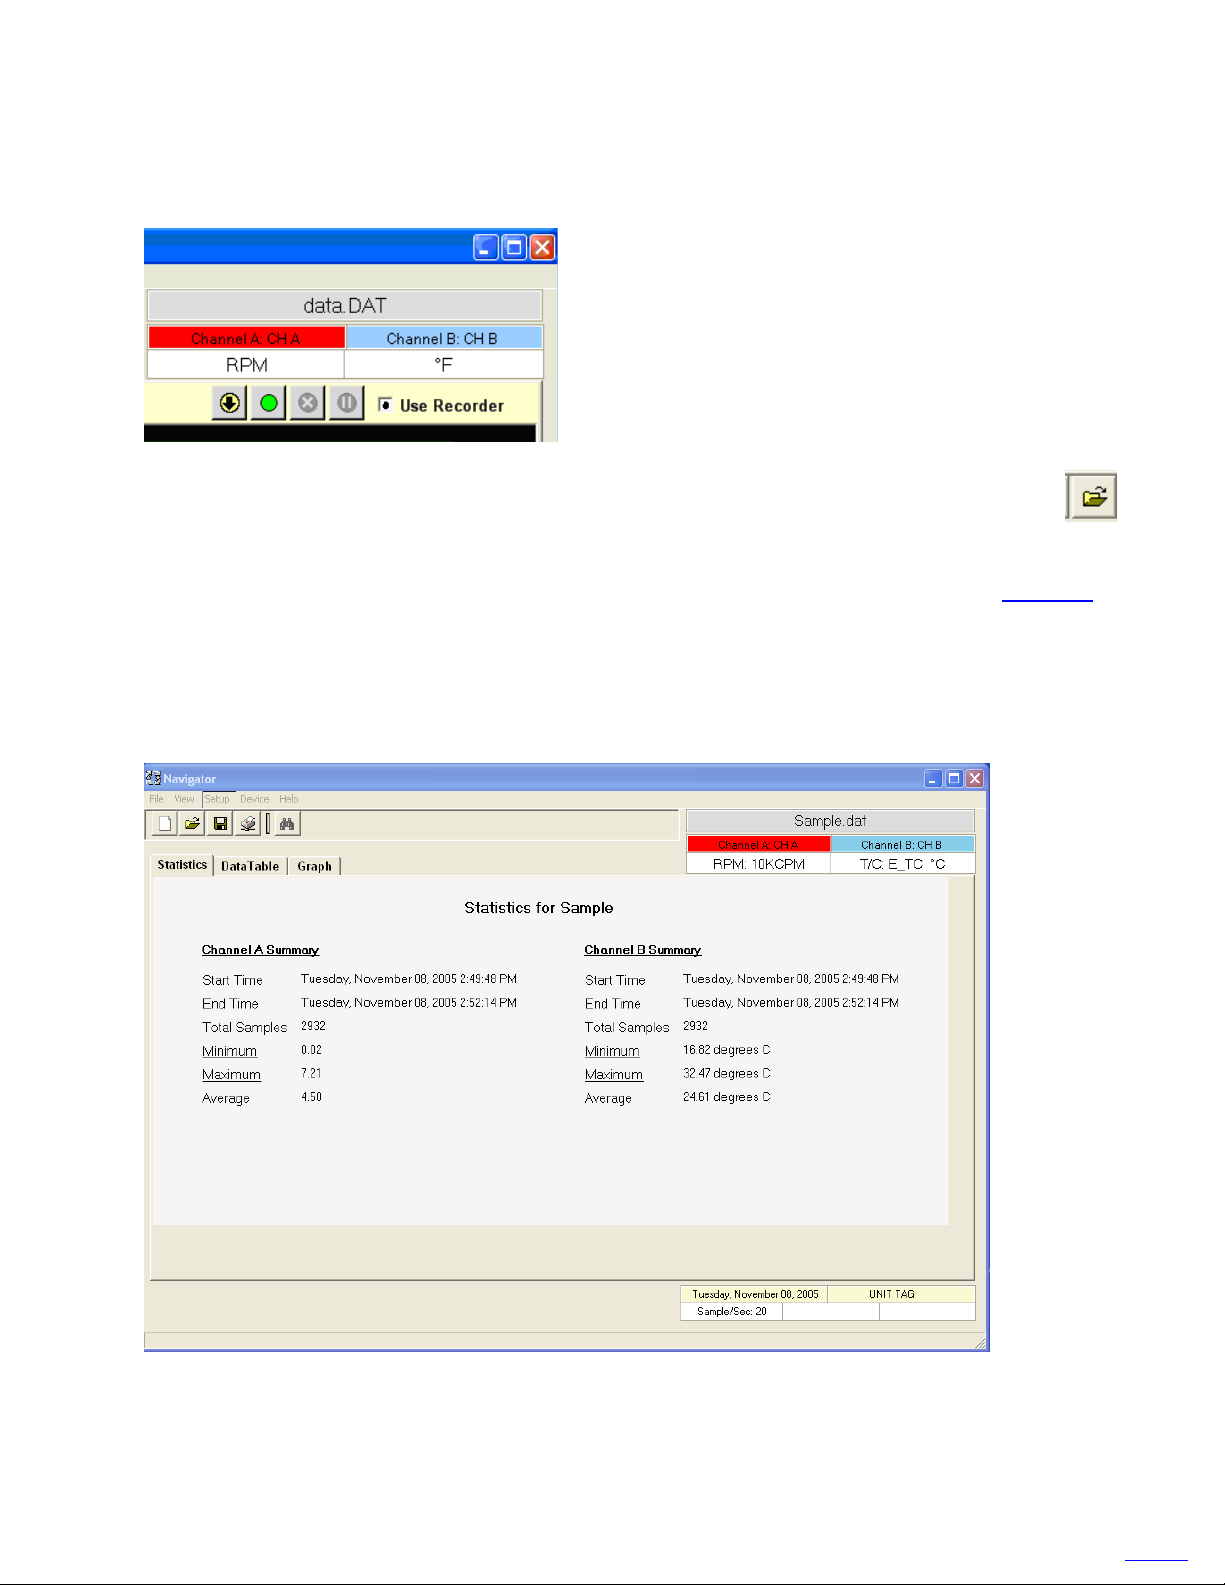
showing a summary of the loaded data.
In the example above, the file Sample.DAT was loaded. The channel information is listed below the file name
in the upper right corner. In this example there are two channels. Channel A is called CH A and its units are
RPM with 10kRPM being the full scale. Channel B is called CH B and is a Type E Thermocouple measuring
°C. The channel name section is the same color as the trace for that channel on the graph.
Page 8 of 20
Page 9

Navigator Software User‟s Manual
Go to Contents
In the lower right corner the date the data was recorded, the recorder identification and sample rate are
displayed. This sample recording was started on Tuesday, November 08, 2005 at 2:49:48 PM. The sample
rate was 20 Samples/Sec and the recorder was identified by the UNIT TAG.
The summary information for each channel is displayed in the workspace section. By clicking on Minimum or
Maximum you can jump directly to those points on the graph.
3.3.1 LOADING PARTIAL FILES
When opening files from the recorder,
large files can take a long time to load.
You can simply download the period
of interest without the need to load the
entire file. So if you need information
for 12:00PM to 3:00PM on May 11th,
2006, you can request only this data –
assuming it is in the data file you have
chosen. Make sure Use Recorder has
been checked – see above, and go to
File – Open.
The Copy File dialog box will open as
shown right showing files on the
remote recorder. Data files are type
.DAT.
Once you select a file and click OK you will get the
Time Filter dialog box. If the Whole File box is
checked you can click OK to load the entire file.
Otherwise, uncheck this box and edit the Start: and
End: times for the data you want. Click OK. If the data
you are looking for is in the file, the information will be
loaded; otherwise you will get an error message telling
you that no such data can be found. Thus you can
leave a recorder to record events and simply download
the data when an exception occurs.
Page 9 of 20
Page 10

Navigator Software User‟s Manual
Go to Contents
3.4 DATA TABLE WINDOW
The DataTable page shows the time and value of every data sample on each channel and any alarms
associated with them. This window is also used to export data directly into an ExcelTM spreadsheet and can
be used to highlight a specific point on the graph.
3.4.1 JUMPING TO A SPECIFIC POINT ON THE GRAPH
If you double-click a value in any Channel Value column in the DataTable, the program will highlight that
point in the Graph window. The graph will be automatically scaled to show the unique point highlighted by
a rectangular box as shown below:
.
Page 10 of 20
Page 11

Navigator Software User‟s Manual
Go to Contents
Move the cursor into the rectangle for precise information about the point. The graph can be zoomed and
panned to show the relationship of this point to the rest of the traces. (Refer to the Graph Window
section).
3.4.2 CREATING A REPORT
Select the DataTable tab. Navigator Software has the ability to create custom reports to be exported to
TM
Excel
directly. The user can select the entire data set (beware of large files), highlight rows in the table,
or choose specific dates and times using the filter. Also, the user can select what columns from the table
to export.
To export all the data simply click the Excel
down menu. To select multiple rows from the DataTable, click the left edge of the starting row to export.
This will highlight the row. Then scroll to the last row to export and hold down the Shift key and click the
left edge of the last row. This will highlight all rows between the start and the end. Then click the ExcelTM
button. The data will be exported and the spreadsheet will open automatically.
The report can be further customized by selecting which columns to include in
the report. This is done via the Report dialog box on the right side of the
DataTable window – also shown right.
The Include Columns check boxes determine which columns of the
DataTable will be exported to the spreadsheet. Simply select the data you
want. The Channel status is the condition of the alarms, if any. The channel
annotation is the content of any user comments attached to that point.
Below the Report dialog box is the Filter dialog box. This is yet another easy
way to limit what data is exported to the spreadsheet. You can filter data by
Date or Time or Both simply by checking the relative boxes as shown below.
TM
button
or choose File – Export from the pull-
The From: and To: data entry areas default to the start and end times of the
data in the table to be exported and can be edited by the user to specify an
exact timeframe for export. Once all parameters are set, press the Export
button (the one with the Excel
TM
logo on it) and the data will open into an
ExcelTM spreadsheet. Note: you will need to have a valid copy of ExcelTM on
your PC, otherwise use the File – Export menu option to name a CSV
(comma delimited) file for later use.
Page 11 of 20
Page 12

Navigator Software User‟s Manual
Go to Contents
3.5 GRAPH WINDOW
A graphic representation of the information can be displayed by selecting the Graph tab. The following is an
example of a Graph page.
There are two channels shown on the graph: Channel A and Channel B. The X-Axis is the time and the YAxis is the data sample value. Each channel has its own y-axis with matched color so it can be easily
identified. On the top right corner of the screen is the information box giving the name of the file and
identifying the two traces showing the original name and scale settings for each. The graphic data is loaded
from a file or may be displayed in real time if connected to a recorder. See 3.5.5.
The graphic area is fully interactive. Data can be zoomed and scrolled, the interaction controlled by the icons
in the toolbar above the graph. Also, specific points may be located using the Search option.
3.5.1 GRAPH BUTTONS
- Select
The default cursor. This is used to scroll the trends horizontally and vertically by simply right clicking in the
graph area. Traces can be scrolled individually by clicking and dragging the individual vertical scales or
together by clicking and dragging in the graph area.
- Stretch
Click this button to stretch (zoom) or shrink the graph along the x-axis (time) and y-axis (scale). Traces
can be zoomed individually by clicking and dragging the individual vertical scales or together by clicking
and dragging in the graph area.
- Zoom In
Click this button to zoom in on the graph.
- Zoom Out
Click this button to zoom out on the graph.
Page 12 of 20
Page 13

Navigator Software User‟s Manual
Go to Contents
- Zoom Window
Click this button to zoom to a user-defined window, when clicked the cursor will turn into a draw window
tool. Draw a window around the area of interest by holding the right mouse button and dragging the
window. On release the window area will fill the graphics screen.
- Zoom All
Click this button to fit all data into one screen.
- Cursor
Click this button to enable the cursor. Once enabled, right
click anywhere on the graph and select Channel A –
Setup or Channel B – Setup to lock the cursor to that
trace. As the cursor is dragged along the time base by
right clicking, the cross-hairs will track the trace and the
pop-up box will show details about the point in the crosshairs as shown right. The cursor will turn to the finger
pointer whenever the cursor can be dragged.
- Scroll to end
Click either the left or right scroll button to jump to the start
or end of the data.
- Print
Once you have set up the graph and wish to print it, click this button to print.
Print Range: Current Page – Only print the page you see.
All – Print all the data points that are plotted on the graph. Please specified how many
pages onto which you want to split all the data points.
3.5.2 ZOOM TO FIT
Navigator Software allows the user to automatically zoom (scale) a channel to fit the vertical axis to the
maximum and minimum values of that part of the trace on the screen.
Page 13 of 20
Page 14

Navigator Software User‟s Manual
Go to Contents
There are two edit boxes on the dialog that specifies the channel tag in different colors as shown below:
The colors match the channel trace colors. If the user changes the trace color, the corresponding edit box
will change color accordingly. If the user double-clicks one of them, that trace will zoom to fit the screen in
the vertical direction. The fit is – minimum value is placed at the bottom of the graph, maximum value at
the top. Use the zoom and stretch tools above to fine-tune the fit.
3.5.3 CUSTOMIZING THE GRAPH PROPERTIES
You can modify the graph properties by right-clicking the mouse in the graphics area. A menu appears as
shown below.
The user can modify Channel A or B properties, change the color of the background, or turn the grid on or
off. Moving the cursor over the Channel A item pops up the Setup window. Click on this to modify the
Channel A properties.
The trace can be turned off by selecting Disable. This will allow a single trace to be displayed.
If a trace is enabled it can be customized as follows:
Marker Type – Identifies the actual points recorded. The trace is extrapolated between these points. The
points can be marked by a square, circle, or diamond, and the size can be adjusted. No marker can also
be selected.
Line type – Can be solid, dashed, or dotted. The thickness and color can be selected to suit.
The Alarm section of the Channel Setup Dialog allows the display of alarm conditions provided alarms
were set on the original data capture. Enable or disable the Alarm by checking the appropriate button.
The Alarms pull-down menu will show any alarms that were set in the original recording. These will be
identified as Alarm 1, 2 and so on. You can select how these alarms will be indicated.
Page 14 of 20
Page 15

Navigator Software User‟s Manual
Go to Contents
Note: The Alarms will only be visible in the event that a trace actually entered an alarm condition in which
case that part of the trace in alarm will be indicated by the choices made in the setup. In the example
above, Alarm 1 will be indicated by a solid red line 3 pixels thick.
If you apply the Trace and Alarm settings as shown in the Channel Setup Dialog above, the trace will look
like that shown below. Note that the vertical scale is always in the same color as the trace.
Any data in the trace above the red line is in alarm.
Note: Double-clicking on any point on the trend will take you to the corresponding entry in the DataTable.
3.5.4 SEARCH
By using the search icon (shown left) the user can jump directly to time/date related information in
the DataTable or on the Graph.
Enter the Date or Time required (select the Channel
on the Graph) and click OK. The data will be
rearranged and the point on the graph or in the
DataTable will be highlighted. If no data can be
found (out of the range selected) an error message
to this effect will be displayed.
Page 15 of 20
Page 16

Navigator Software User‟s Manual
Go to Contents
3.5.5 USING REAL TIME DATA
Data can be displayed in real time and recorded to a file on the local PC by connecting a Recorder to the
PC via a USB or Ethernet port. If a remote recorder is connected to the PC you will
see the OnLine icon as shown right. To connect via the Ethernet see 3.2.5
Several of the buttons on the Graph window relate to this function.
In order to read files from the recorder or display data in real time it is necessary to check the “Use
Recorder” box on the top right of the Graph window or in the File menu.
- Save to File
Click this button to save real time data to a file on the PC. It is necessary to name the file. Note – always
choose a new name, it is not possible to append to an existing file.
- Start Real Time Data Display
Click this button to start the real time data trends. The PC will make connection with the recorder and start
displaying real time data at the sample rate set in the recorder. The axes will auto scale to maximize the
display resolution. The user can override these settings by pausing the display and zooming the display
to suit.
Once checked, the buttons to the left of the checkbox function as
follows:
- Stop Device
Click this button to stop the real time trend. Once stopped, all parameters are reset once the start button
is clicked. To stop temporarily use the pause button.
- Pause
Click this button to temporarily suspend the real time update. Data will continue to be saved in the
background. During pause it is possible to zoom or stretch the display to alter the time base and scale. It
is also possible to append a note to the trend line – see below. Once this is done, press the Start button
to resume. The pause button will be grayed out until the Start button is pressed.
3.5.6 ANNOTATING REAL TIME DATA
It is possible to add an annotation to the real time trend to explain an event or make notes. To do this it is
necessary to Pause the display – see above.
Place the cursor at the point on the trend where you wish to add a message and right-click.
Select the channel, then select Annotation. This will pop up a note box where you can enter the
information. Once done, press Enter and a folder icon will be placed at the selected point on the trend.
Page 16 of 20
Page 17

Navigator Software User‟s Manual
Go to Contents
This folder will travel with the trend and can be reviewed at any time by double-clicking the folder icon.
This information is also saved to the file if the file is currently recording to the PC.
3.6 WORKING WITH REMOTE RECORDERS
The remote recorder can be controlled from the Device Menu. As
shown at right, the user can set the clock, get the card status
(CompactFlash™ card in the remote recorder), control the record
functions, change the recorder configuration, manipulate files and reset
the device. Note that a number of these functions cannot be executed
if the remote recorder is in record mode or the real time graph is active.
You will receive warning messages.
3.6.1 SET CLOCK
Selecting this option will bring up the Set Clock
window which will default to the current time and
date of your PC. The user can change this as
needed. Click the OK button to set the time and
date on the remote recorder to this time. You
cannot change time while the remote recorder is in
record mode – the option will be grayed out.
3.6.2 CARD STATUS
Clicking this option will display the status of the
CompactFlash™ card in the remote recorder. This
will bring up the status window shown below.
3.6.3 RECORD FUNCTIONS
This option allows the user to stop or start recording in the remote recorder or set the triggered record
mode on.
Page 17 of 20
Page 18

Navigator Software User‟s Manual
Go to Contents
3.6.4 MEDIA
This option allows the user to format the CompactFlash™ card in the remote recorder. Use caution as this
can destroy data. You can check the content of the card using the File option below. You cannot format a
card while the recorder is in the record mode.
3.6.5 CONFIGURATION
This option allows the user to read, write, save, change or send a configuration. The configuration file,
designated by .CFG, is a copy of all the setups in the recorder. There needs to be a copy of the config file
saved on the recorder‟s memory card in order to read or change the configuration.
3.6.5.1 Read - Allows the user to download the configuration file from the recorder to the PC. You
will need to select the file from the file dialog box. Once the configuration file has been read
the configuration popup dialog box will open. To edit a file remotely ensure the Use Recorder
box is checked.
This is a representation of everything that is currently set up in the recorder. The parameters may be
edited and saved (back to the recorder). Check the recorder manual for setting details. Note: In order
to see the settings for Channel B, select “B” from the Channel pull-down menu.
Page 18 of 20
Page 19

Navigator Software User‟s Manual
Go to Contents
3.6.5.2 Save – Remote and local.
Clicking Yes will save the configuration to the PC locally.
Clicking No will save the configuration as set up in the recorder onto the CompactFlash™
card.
3.6.5.3 Change – Allows the user to change the configuration on the recorder. This will present a
dialog box with all the files on the remote recorder. Choose an alternate configuration file to
load and press OK. The recorder will reset with the new configuration in place.
3.6.5.4 Create – This will bring up a default configuration window that the user can use to make a
new configuration file.
3.6.5.5 Send – This will copy a configuration file from the PC to the remote recorder.
3.6.6 FILE
This option allows the user to read a file or delete a file from the CompactFlash™ card on the remote
recorder.
3.6.7 RESET DEVICE
This option will force a reset of the remote recorder. This option is not available if the recorder is in the
record mode.
Page 19 of 20
Page 20

Navigator Software User‟s Manual
APPENDIX A - LANGUAGE FILES
Adding a language is a simple process. Navigator Software uses an ExcelTM compatible file Language.CSV,
which resides in the Navigator program directory, to read all text that is displayed in the program. The first column
is the English words. To add a language, simple add a column and make sure the first entry in the column is the
language. When the Setup – Language option is chosen, the program reads the first row of this spreadsheet and
displays the languages available.
Below is an example of the format of a hypothetical language file. It has English, German and Spanish. The letter
„G‟ is added in front of the text for German and „S‟ is added for Spanish. Selecting either German or Spanish from
the Setup – Language menu will replace the English text with the corresponding German or Spanish text. The
edited file must reside in the program directory.
Go to Contents
navigator user manual r111.doc, 052308, MLK
Page 20 of 20
 Loading...