

Page 1
D
A
CH
HF-Spektrum-Analysator
Bitte lesen Sie diese Anleitung vor dem Betrieb
gründlich durch und heben Sie sie für ein späteres Nachlesen auf.
1 Hinweise für den sicheren Gebrauch
Das Gerät entspricht allen relevanten Richtlinien der
EU und ist deshalb mit gekennzeichnet.
G
Verwenden Sie das Gerät nur im Innenbereich und
schützen Sie es vor Tropf- und Spritzwasser, hoher
Luftfeuchtigkeit und Hitze (zulässiger Einsatztemperaturbereich 0 – 40 °C).
G
Verwenden Sie für die Reinigung nur ein trockenes,
weiches Tuch, auf keinen Fall Wasser oder Chemikalien.
G
Wird das Gerät zweckentfremdet, nicht richtig
bedient oder nicht fachgerecht repariert, kann keine
Haftung für daraus resultierende Sach- oder Personenschäden und keine Garantie für das Gerät über nommen werden.
2 Übersicht
Der RF-EXPLORER ist für eine einfache und intuitive
Benutzung konstruiert. Es muss keine umfangreiche
Bedienungsanleitung durchgearbeitet werden, um die
hochentwickelte Funktionsvielfalt nutzen zu können.
Der größte Teil des komplexen Spektrum-Analysators
wird durch die Firmware vereinfacht. Zum Beispiel
müssen Sie nicht jedes Mal die Auflösungsbandbreite
(RBW) einstellen, wenn eine andere Frequenz-Darstellungsbandbreite gewählt wird. Sie müssen nicht
einmal wissen, was RBW ist.
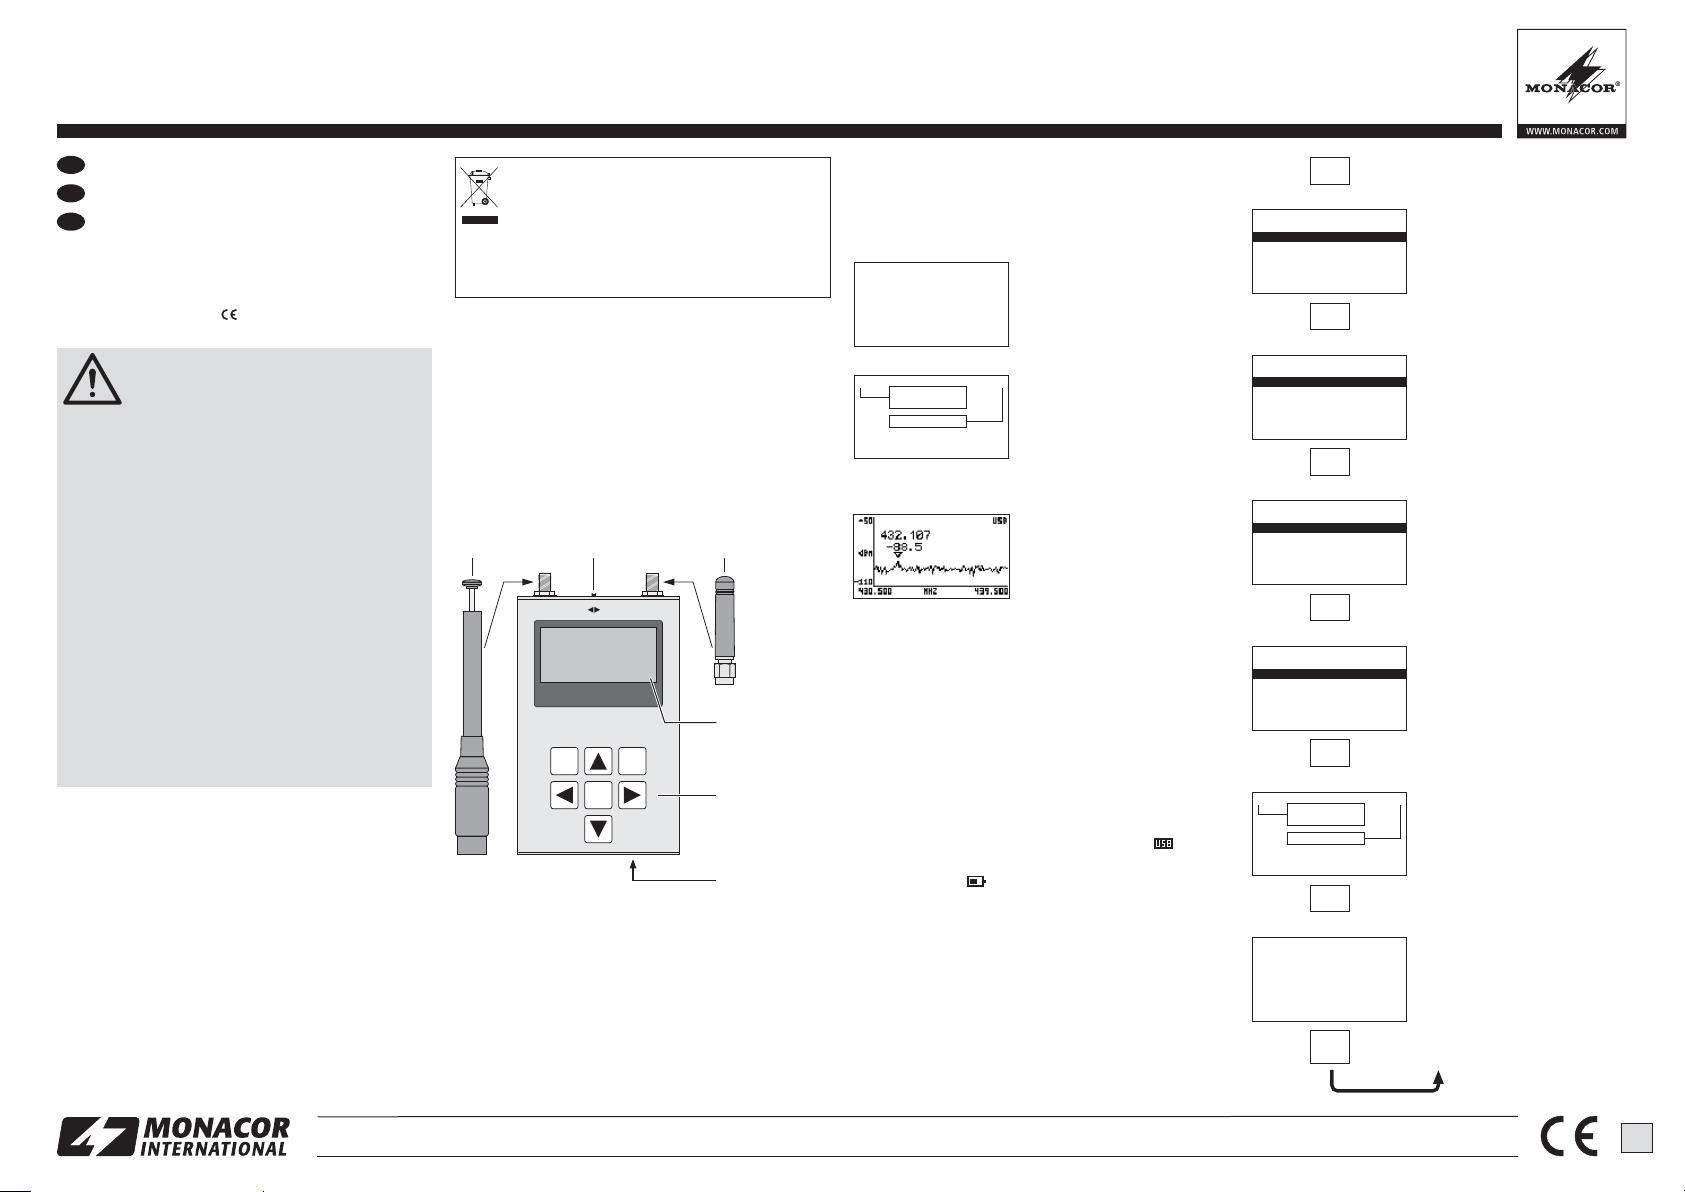
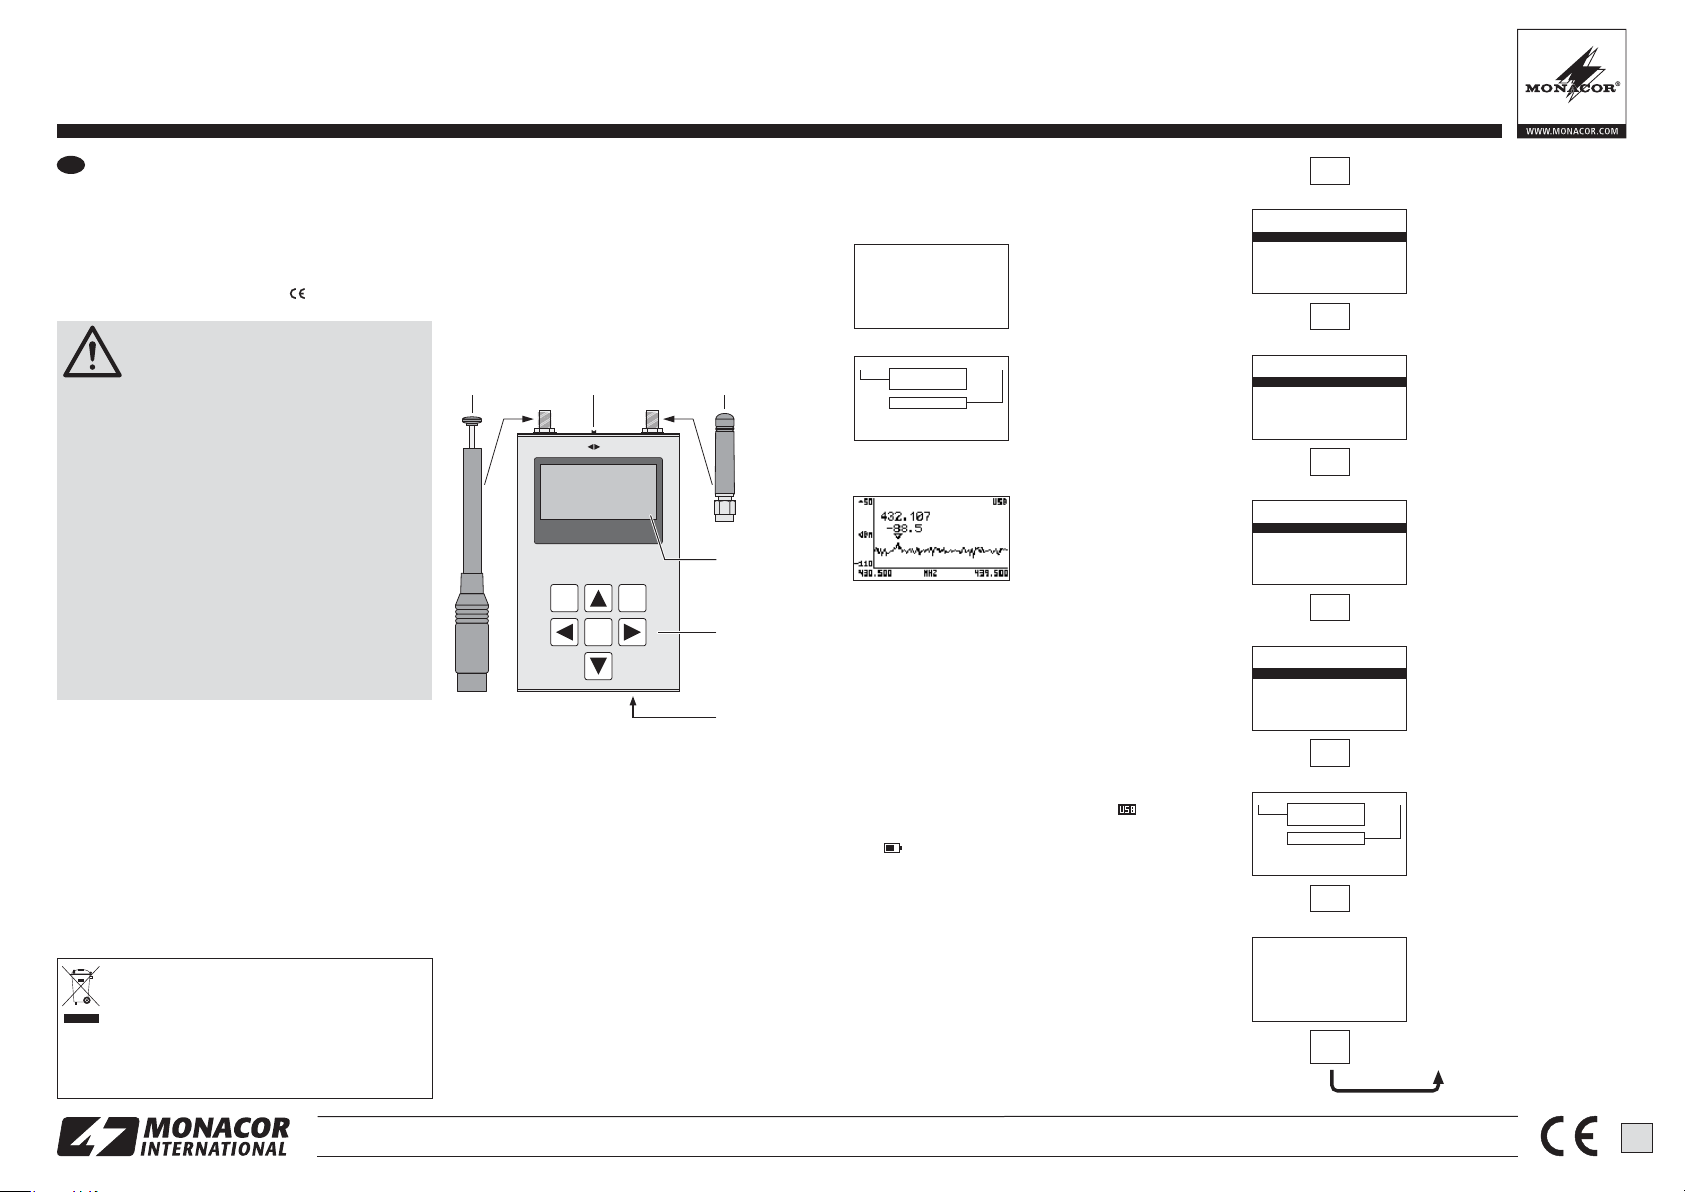
Abb. 1 Anschlüsse und Bedienelemente
1 Antenne für den Bereich 240 – 960MHz
2 Ein-/Ausschalter
3 Antenne für den Bereich 15 – 2700MHz
4 Display
5 Tastatur
6 Mini-USB-Anschluss zum Aufladen des Akkus (dazu
den Ein-/Ausschalter in die Position ON stellen) und
zur Bedienung über einen PC
3 Spektrum-Analysator-Modus
Akku aufladen
Nach dem Einschalten des RF-EXPLORERs erscheinen auf dem Display nacheinander kurz zwei Menüs
mit Informationen:
⬇
Abb. 2 Info-Menüs
Dann startet automatisch der Spektrum-AnalysatorModus:
Abb. 3 Spektrumdarstellung
Auf dem Display gibt es eine X- und eine Y-Achse:
X für die Frequenz in MHz und Y für die Leistung in
dBm. In der Abb. 3 reicht der Frequenzbereich von
430,5 MHz bis 439,5 MHz und die Amplitude (Dynamikbereich) von
-
50 dBm bis -110dBm.
Konfigurationseinstellungen wie Amplitudenreferenz
und Frequenz-Darstellungsbandbreite werden zwischen den Messungen beibehalten. In der Darstellung
ist eine kleine Markierung ▽ zu sehen. Diese zeigt die
Spitzenamplitude in der aktuellen Frequenz-Darstellungsbandbreite. Der erste Wert gibt die Frequenz an
diesem Punkt an und der zweite Wert die Amplitude.
Das Display zeigt ebenfalls ein Symbol für den
USB-Anschluss (bei Anschluss an einen PC ) oder ein
Batteriesymbol (wenn der Ein- / Ausschalter auf
ON steht). Zum Aufladen des internen Akkus den
RF-EXPLORER an eine USB-Buchse anschließen
und den Ein- /Ausschalter in die Position ON stellen.
Das USB- und das Batteriesymbol er scheinen dann
abwechselnd.
4 Menüs
Die Bedienung erfolgt über mehrere Menüs, die nacheinander mit der Taste MENU aufgerufen werden. Mit
der Taste RETURN kann von jedem Menü aus zurück
auf die Spektrumdarstellung geschaltet werden.
⬇
⬇
⬇
⬇
⬇
⬇
Abb. 4 Menüstruktur
MENU
RF Explorer
Spectrum Analyzer
ver01.09 09-ago-12
www.rf-explorer.com
MENU
* *
240-960MHZ
[ACTIVE]
15-2700MHZ
64KB RAM Extra found
2MB ROM Extra found
MENU
CONFIG MENU
Backlight: Max
Contrast: 3
USB Bauds: 500Kbps
Draw Mode: Vectors
Marker: Peak
DSP: Fast
MENU
ATTENUATOR MENU
Calculator: Max
Top dBm: -050
Bottom dBm: -110
Iterations: 004
Offset dB: +000
Units: dBm
MENU
FREQUENCY MENU
Center Freq: 435.000
Freq Span: 009.000
Start Freq: 430.500
Stop Freq: 439.500
Module: 240-960M
MENU
OPERATIONAL MODE
SPECTRUM Analyzer
RF Generator
WiFi Analyzer
MENU
* *
240-960MHZ
[ACTIVE]
15-2700MHZ
64KB RAM Extra found
2MB ROM Extra found
RF Explorer
Spectrum Analyzer
ver01.09 09-ago-12
www.rf-explorer.com
ENTER
MENURETURN
Handheld Spectrum Analyser
USB 2.0
RF Explorer
OFFON
RF 50Ω
1
4
5
6
23
Soll das Gerät endgültig aus dem Betrieb
genommen werden, übergeben Sie es zur
umweltgerechten Entsorgung einem örtlichen Recyclingbetrieb.
Defekte Akkus dürfen nicht in den Hausmüll geworfen werden. Geben Sie sie nur in den Sondermüll
(z. B. Sammelbehälter bei Ihrem Fachhändler).
Vorsicht bei hoher EM-Einstrahlung
Mit dem RF-EXPLORER können sehr
kleine Signale bis
-
120 dBm gemessen
werden. Darum sind die Antenneneingänge sehr
empfindlich und können durch eine zu hohe Einstrahlung auch bei ausgeschaltetem Gerät be schädigt werden. Der maximale Eingangspegel von
+5 dBm darf nicht überschritten werden. Dieser
ergibt sich z. B. bei einem Abstand von ca. 1m zu
einem Mikrowellenherd oder von ca. 10 cm zu einem
Mobiltelefon.
Es müssen auch unbedingt statischen Entladen
über die Antennen vermieden werden. Fassen Sie
z. B. das Metallgehäuse mit einer Hand fest an,
bevor Sie mit der anderen Hand eine Antenne aufstecken oder berühren.
– Zur Lagerung oder zum Transport das Gerät in
einer Metallbox aufbewahren und / oder die Antennen abnehmen.
– In Bereichen mit sehr hoher HF-Strahlung je einen
SMA-Stecker mit einem 50-Ω-Abschluss wider stand auf die Antennenbuchsen stecken.
1
RF-EXPLORER/3 Bestellnummer 25.4670
ELECTRONICS FOR SPECIALISTS ELECTRONICS FOR SPECIALISTS ELECTRONICS FOR SPECIALISTS ELECTRONICS FOR SPECIALISTS ELECTRONICS FOR SPECIALISTS ELECTRONICS FOR SPECIALISTS ELECTRONICS FOR SPECIALISTS ELECTRONICS FOR SPECIALISTS ELECTRONICS FOR SPECIALISTS ELECTRONICS FOR SPECIALISTS ELECTRONICS FOR SPECIALISTS
®
MONACOR INTERNATIONAL GmbH & Co. KG • Zum Falsch 36 • 28307 Bremen • Germany Copyright©by MONACOR INTERNATIONAL. All rights reserved. A-1409.99.03.10.2014
Page 2
ATTENUATOR MENU
Calculator: Max
Top dBm: -050
Bottom dBm: -110
Iterations: 004
Offset dB: +000
Units: dBm
FREQUENCY MENU
Center Freq: 435.000
Freq Span: 002.500
Low Freq: 433.750
High Freq: 436.250
Module: 240-960M
FREQUENCY MENU
Center Freq: 435.000
Freq Span: 006.500
Start Freq: 431.750
Stop Freq: 438.250
Module: 240-960M
FREQUENCY MENU
Center Freq: 435.000
Freq Span: 009.000
Start Freq: 430.500
Stop Freq: 439.500
Module: 240-960M
OPERATIONAL MODE
SPECTRUM Analyzer
RF Generator
WiFi Analyzer
RF-EXPLORER/3 Bestellnummer 25.4670
ELECTRONICS FOR SPECIALISTS ELECTRONICS FOR SPECIALISTS ELECTRONICS FOR SPECIALISTS ELECTRONICS FOR SPECIALISTS ELECTRONICS FOR SPECIALISTS ELECTRONICS FOR SPECIALISTS ELECTRONICS FOR SPECIALISTS ELECTRONICS FOR SPECIALISTS ELECTRONICS FOR SPECIALISTS ELECTRONICS FOR SPECIALISTS ELECTRONICS FOR SPECIALISTS
4.1 Menü Betriebsart
Abb. 5 Menü Betriebsart
Die Betriebsart Spektrum-Analysator ist angewählt
und kann mit der Taste ENTER eingeschaltet werden.
Es erscheint dann die Spektrumdarstellung.
Die Betriebsart WiFi-Analysator (Kap. 5) kann mit
der Taste ▼ oder ▲ und ENTER angewählt werden,
wenn im Frequenzmenü in der unteren Zeile „Module“
der Frequenzbereich „15 – 2700 M“ gewählt ist
(Kap. 4.2). Anderenfalls erscheint die Meldung „THIS
FEATURE IS NOT AVAILABLE IN THE SELECTED
MODE“. Dann mit der Taste ENTER wieder auf das
Menü Betriebsart zurückschalten.
Die Betriebsart „RF Generator“ ist bei diesem Modell
nicht vorhanden. Beim Anwählen wird ebenfalls die
Meldung „THIS FEATURE IS NOT …“ angezeigt.
4.2 Frequenzmenü
Abb. 6 Frequenzmenü
Dieses Menü, mit dem Frequenzeinstellungen geändert werden können, ist wahrscheinlich das am meisten verwendete Menü.
Wenn nach dem Einschalten des RF-EXPLORERs
während der Spektrumdarstellung zweimal die Taste
MENU gedrückt wird, erscheint das Frequenzmenü.
Dieses Verhalten ändert sich jedoch anschließend.
Jedes Mal, wenn während der Spektrumdarstellung
die Taste MENU gedrückt wird, erscheint das zuletzt
aufgerufene Menü. So wird Zeit gespart, da nicht
durch alle Menüs navigiert werden muss, um zur vorherigen Stelle zu gelangen.
Der in der Spektrumdarstellung gezeigte Frequenzbereich kann auf zwei unterschiedliche Methoden ge ändert werden:
1. Center Freq und Freq Span
Dies ist die übliche Spektrum-Analysator-Ein stel lung, die allen Fachleuten vertraut ist. Es wird die
Mittenfrequenz (Center Freq) des zu analysierenden Frequenzbands eingestellt und dann die
Bandbreite (Freq Span).
®
2. Start Freq und Stop Freq
Diese anwenderfreundliche Methode bieten nur
wenige Spektrum-Analysatoren. Es wird die untere
Frequenz (Start Freq) und die obere Frequenz
(Stop Freq) des zu analysierenden Frequenzbands
eingestellt.
Wenn Center Freq und Freq Span eingestellt werden,
ändern sich entsprechend Start und Stop Freq und
umgekehrt. Im Allgemeinen werden Center Freq/
Freq Span eingestellt, wenn die Frequenz bekannt ist
und Start / Stop Freq, um einen bestimmten Bereich
zu überprüfen.
Um zu einer Option zu gelangen, die Tasten ▲ und ▼
verwenden. Dann die Taste ENTER drücken, um die
Option editieren zu können. Mit der Taste ◀ oder ▶
zu der Stelle gehen, die geändert werden soll. Mit der
Taste ▲ oder ▼ den gewünschten Wert einstellen
und die Einstellung mit der Taste ENTER bestätigen
oder mit der Taste RETURN zurücknehmen.
In der Zeile Module den zu analysierenden Frequenzbereich 240 – 960 MHz oder 15 – 2700 MHz mit
der Taste ENTER wählen. Im Bereich 240 – 960MHz
-
können sehr kleine Signale bis
120 dBm gemessen
werden. Im Bereich 15 – 2700MHz sind wegen des großen Frequenzbereichs und des damit größeren Grundrauschens Messungen nur bis -100 dBm möglich.
Hinweis: Die Bandbreite lässt sich zwischen 0,112MHz und
100 MHz einstellen. Die einstellbare niedrigste und einstellbare höchste Frequenz ist von den Einstellungen in den
Menüzeilen „Freq Span“ und „Module“ abhängig.
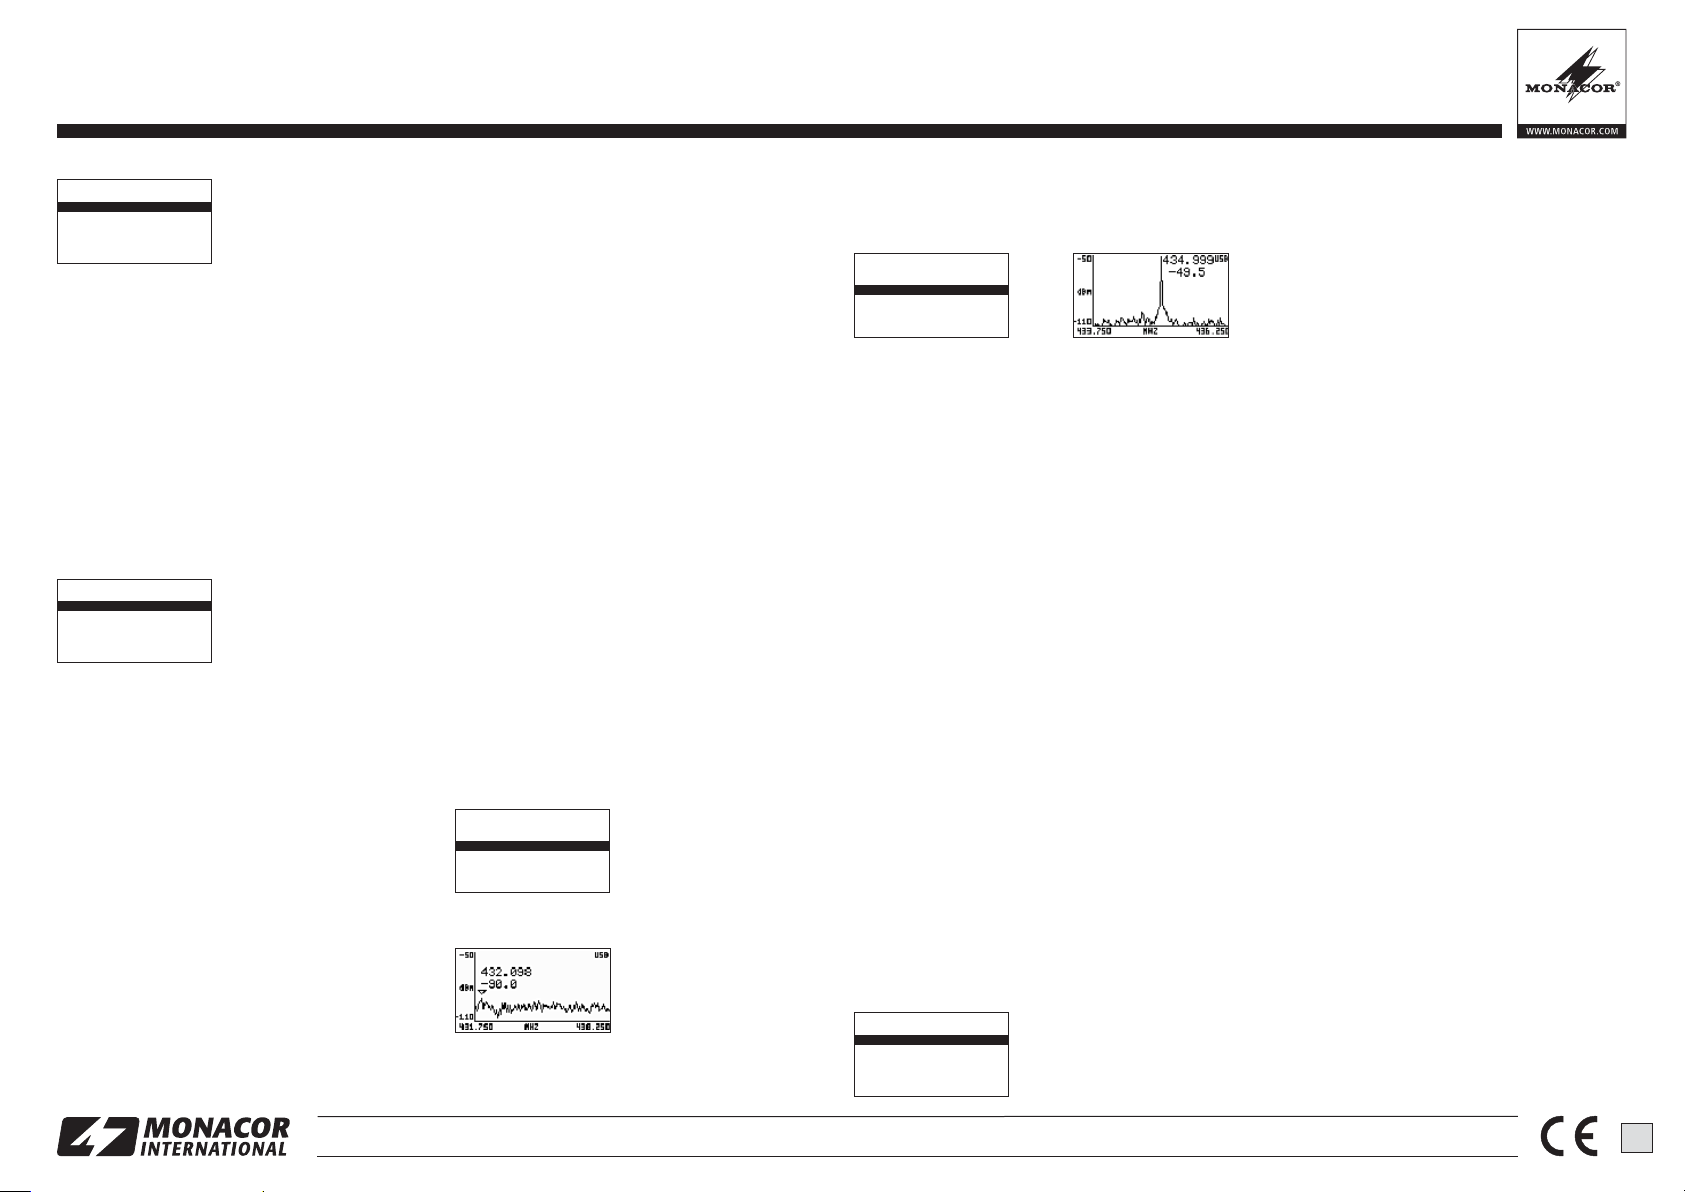
Beispiel für die Änderung der Bandbreite auf 6,5 MHz;
die untere und obere Frequenz werden im Vergleich
zur Abb. 6 automatisch aktualisiert:
Abb. 7 Bandbreite 6,5 MHz
Mit der Taste RETURN das Menü schließen und
zurück auf die Spektrumdarstellung schalten.
Abb. 8 Spektrumdarstellung
mit Bandbreite 6,5 MHz
Der neue Frequenzbereich ist eingestellt. Als weiteres
Beispiel den Vorgang wiederholen, um die Bandbreite
auf 2,5 MHz zu ändern. Dazu wieder die Taste MENU
drücken: Die vorherige Menüoption (Freq Span) ist
angewählt. Den Wert auf 2,5 MHz ändern und mit der
Taste ENTER bestätigen. Dann die Taste RETURN
drücken, um zur Spektrumdarstellung zurückzukehren.
RETURN ➡
Abb. 9 Bandbreite auf 2,5 MHz geändert
Der neue Frequenzbereich ist eingestellt, aber das
Interessante ist jetzt, dass die Mittenfrequenz auch
geändert werden kann, ohne erneut das Frequenzmenü aufrufen zu müssen. Hierzu während der Spektrumdarstellung die Taste ◀ oder ▶ (mehrfach) drücken: Die Mittenfrequenz wird jedes Mal um 1⁄8 der
Bandbreite verringert bzw. erhöht, d.h. bei einer
Bandbreite von 2,5 MHz um 0,3125 MHz mit einem
einfachen Tastendruck. Diese direkte Methode ist be sonders bei einer schmalen Bandbreite zweckmäßig.
Während der Spektrumdarstellung lassen sich die
Messwerte und die Messkurve durch Drücken
der Taste ENTER einfrieren. Das erleichtert das Ab lesen bei sich schnell ändernden Werten. Neben der
Y-Achse blinkt dann die Anzeige HLD. Zum Zurückschalten auf die aktuellen Werte die Taste ENTER
erneut drücken.
An der X-Achse sind die Frequenzen des ScanBereichs angegeben. Alternativ dazu kann die Bandbreite (SP), die Mittenfrequenz (C) und die Auflösungsbandbreite (RBW) angezeigt werden. Zum
Umschalten die Taste RETURN drücken. Wenn jetzt
die Taste ◀ oder ▶ (mehrfach) gedrückt wird, ändert
sich nicht die Mittenfrequenz, sondern die Bandbreite.
So kann auch die Bandbreite schnell geändert werden, ohne das Menü aufrufen zu müssen.
4.3 Menü Abschwächung
Mit diesem Menü lässt sich die Pegeldarstellung in
der Y-Achse ändern. Um das Menü aufzurufen, die
Taste MENU so oft drücken, bis das Menü auf dem
Display erscheint.
Abb. 10 Menü Abschwächung
Dieses Menü hat einige interessante Optionen:
Calculator: Bietet fünf Modi für die Anzeige der Pegel.
Zum Ändern des Modus die Taste ENTER drücken.
Max: Es werden die Spitzenwerte von den letzten Frequenzband-Scan-Iterationen [-Durchläufen]
(siehe Menüoption unten) verwendet, in diesem
Fall die Spitzenwerte von den letzten 4 Scans.
Dies ist der Standardmodus, mit dem sich schnell
ändernde HF-Signale entdeckt werden können
oder mit dem sich in schwierigen Fällen die Kanalbelegung feststellen lässt. (Der gewählte Modus
wird in der Spektrumdarstellung links von der
Y-Achse angezeigt, bei diesem Modus mit MAx.)
Average: Es wird der arithmetische mittlere Durchschnitt während der letzten Scan-Iterationen be rechnet. Dieser Modus eignet sich besonders, um
den Durchschnitt des Grundrauschens zu ermitteln
und um Signale mit konstanter Frequenz und
Amplitude (Continuous Wave) anzuzeigen.
(Dieser Modus wird in der Spektrumdarstellung mit
AVG angezeigt.)
Overwrt: Höhere Pegelwerte überschreiben niedrigere Werte bis die Taste RETURN gedrückt oder
die Mittenfrequenz mit der Taste ◀ oder ▶ geän-
dert wird.
(Dieser Modus wird mit OWR angezeigt.)
Max Hold: Gleichzeitige Darstellung der aktuellen
Pegel und der maximalen Pegel.
(Dieser Modus wird mit MxH angezeigt.)
Normal: Keine Berechnung, laufende aktuelle An zeige der Pegel.
(Dieser Modus wird mit nOR angezeigt.)
Top/Bottom dBm: Hiermit wird der Pegelmessbereich eingestellt, „Top dBm“ für den oberen Messwert
der Y-Achse und „Bottom dBm“ für den unteren Wert.
Die Differenz zwischen beiden Werten kann nicht kleiner als 10 dBm werden.
Iterations: Gibt die Anzahl der Scan-Durchläufe an,
um die Spitzenwerte (Calculator: Max) oder die
Durchschnittswerte (Calculator: Average) zu berechnen, einstellbar von 1 bis 28. Je höher der Iterationswert, desto genauer die Berechnung, aber desto träger die Darstellung.
Offset dB: Verschiebt den gemessenen Pegel um
den eingestellten Wert (±100 dB).
Beispiel: An einer Stelle im Raum wird bei einer be stimmten Frequenz ein Pegel von
-
MONACOR INTERNATIONAL GmbH & Co. KG • Zum Falsch 36 • 28307 Bremen • Germany Copyright©by MONACOR INTERNATIONAL. All rights reserved. A-1409.99.03.10.2014
76 dB gemessen.
2
Page 3
Bei einem Offset von +76 dB zeigt der RF-EXPLORER dann 0 dB an. Bei Messungen an anderen Stellen im Raum wird nun die Pegelabweichung zur Referenzstelle direkt in dB angezeigt.
Units: Mit der Taste ENTER kann für die Y-Achse die
Einheit dBm oder dBμV gewählt werden. In der Spektrumdarstellung wird die gewählte Einheit mit „dBm“
oder „dBV“ links neben der Y-Achse angezeigt.
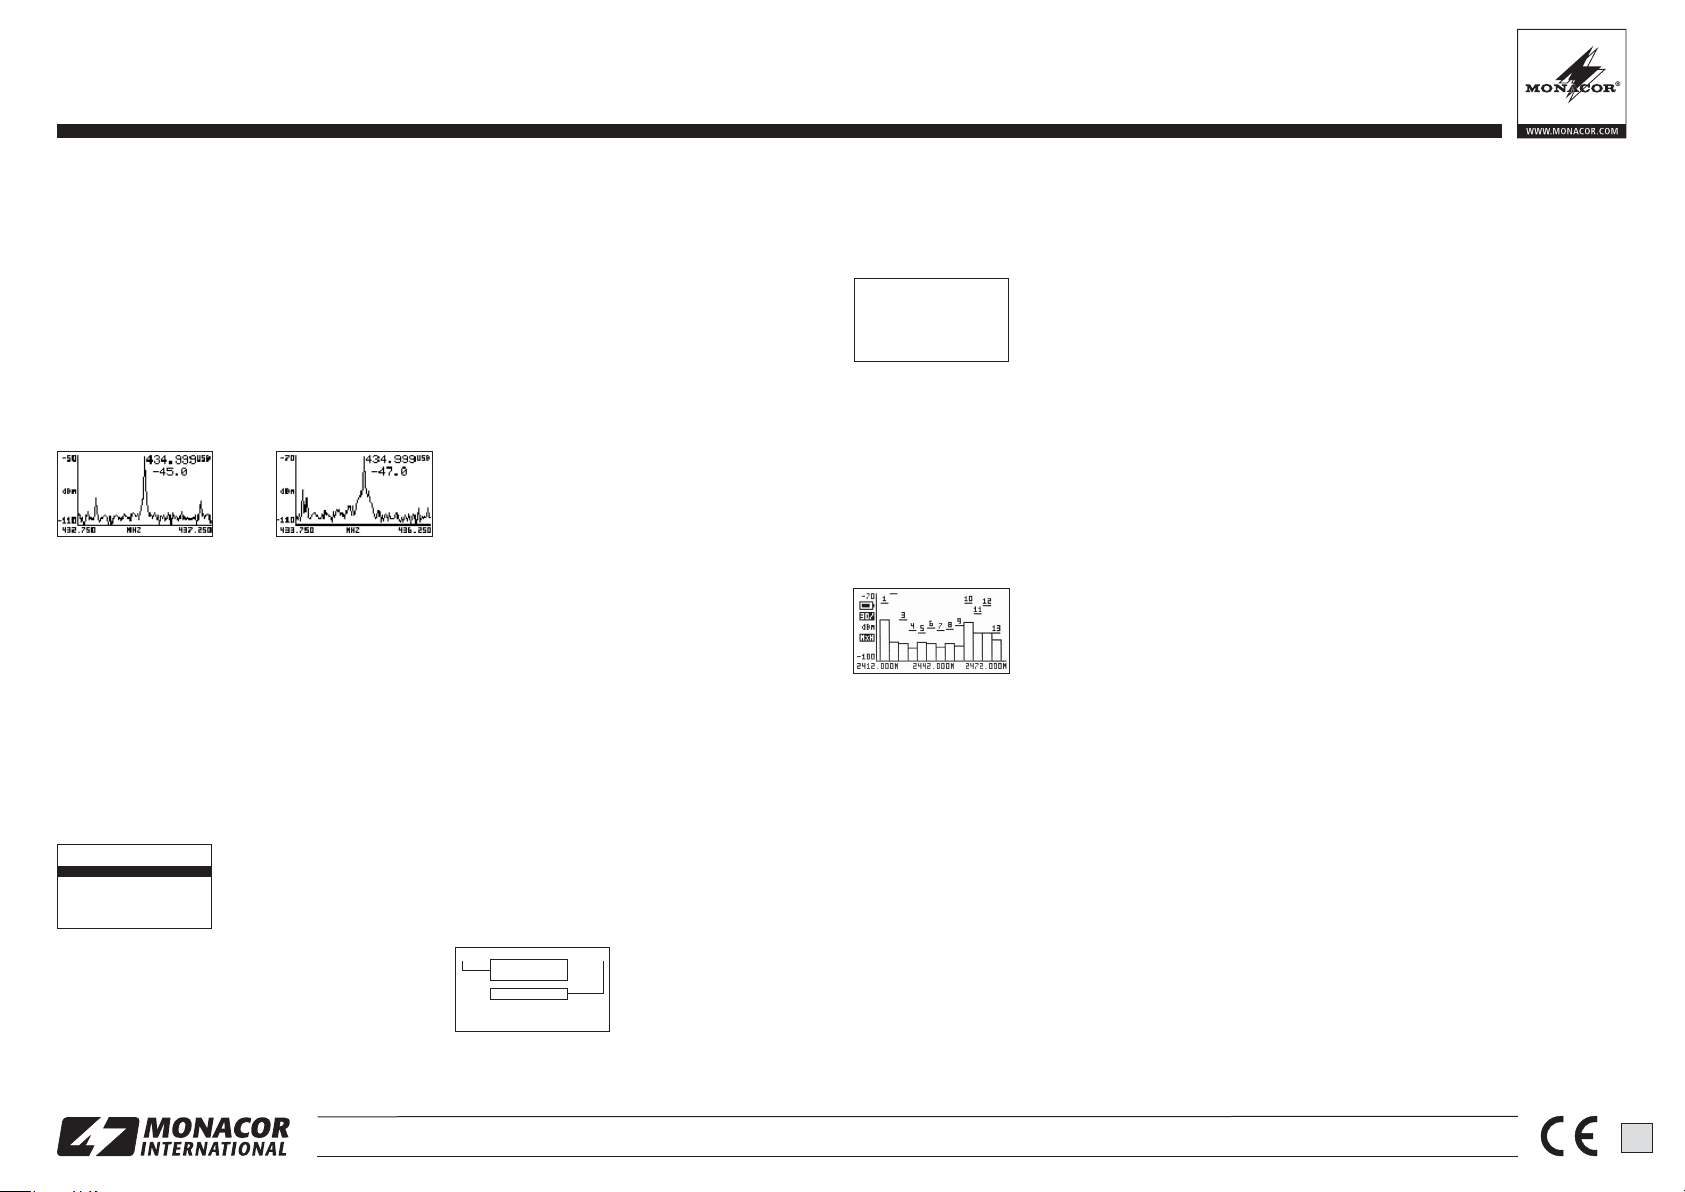
Für einen einfachen Test den oberen dBm-Wert auf
-
70 dBm ändern. Dann die Taste RETURN drücken,
um zur Spektrumdarstellung zurückzukehren. Der
angezeigte Pegelbereich ist jetzt kleiner und das Signal auf dem Display dadurch größer, besonders das
Grundrauschen.
➡
Abb. 11 Oberen dBm-Wert um 20dB verringert
Da der obere dBm-Wert sehr häufig geändert wird,
kann dieser während der Spektrumdarstellung um
5 dBm mit der Taste ▲ erhöht und mit der Taste ▼ um
5 dBm reduziert werden. Diese Shortcuts, zusammen
mit den Tasten ◀ und ▶ zum Ändern der Mittenfrequenz, sind für Konfigurationseinstellungen in Echtzeit
sehr nützlich, da kein Menü aufgerufen werden muss.
4.4 Konfigurationsmenü
Im RF-EXPLORER gibt es einige Konfigurationsmöglichkeiten, mit denen das Gerät entsprechend nach
Wunsch oder Anwendung eingestellt werden kann.
Die Taste ENTER so oft drücken, bis das Konfigurationsmenü auf dem Display erscheint.
Abb. 12 Konfigurationsmenü
Die Optionen in diesem Menü lassen sich mit den
Tasten ▲ und ▼ anwählen und durch mehrfaches
Drücken der Taste ENTER einstellen.
Backlight: Hintergrundbeleuchtung für das Display:
OFF, Low, Med, High, Max. Der RF-EXPLORER bietet drinnen und draußen gute Sichtbarkeit, selbst bei
direktem Sonnenlicht. Bei einer geringen Hintergrundbeleuchtung wird der Akku geschont.
Contrast: 10 Kontraststufen für das Display stehen
zur Verfügung.
USB Bauds: Die Voreinstellung ist 500kbit / s, welche
auch empfohlen wird. Wenn es bei der Datenübertragung zum PC Probleme gibt, was selten vorkommt,
auf die langsamere Geschwindigkeit von 2,4 kBit / s
wechseln. Jedoch wird dies nicht empfohlen, da die
Verbindung sehr langsam wird. Die Datenübertragungsgeschwindigkeit des RF-EXPLORERs und des
PCs müssen übereinstimmen, um eine korrekte Verbindung zu erhalten.
Draw Mode: Bei der Einstellung „Vectors“ wird eine
Pegelkurve für den gescanten Frequenzbereich an gezeigt, bei der Einstellung „Fill“ zeigen einzelne Säulen den Pegel an.
Marker: Setzen einer Markierung ▽ zum Ablesen von
Frequenz und Pegel an diesem Punkt
None: keine Markierung
Peak: automatische Markierung der Frequenz mit
dem größten Pegel
Manual: Die Markierung lässt sich im Scan-Bereich
mit den Tasten ◀ und ▶ verschieben.
DSP: Der digitale Signalprozessor des RF-EXPLORERs ist mit einem Unterprogramm ausgestattet, das
unerwünschte Signale herausrechnet (filtert), die bei
der Signalverarbeitung entstehen (u. a. Spiegelfrequenzen). Bei einer aufwendigen Filterung wird
jedoch durch den hohen Rechenaufwand der Messvorgang langsamer und kurze Nutzsignale (z. B. WiFiSignale) können nicht erkannt werden.
Zum Messen von kurzen Nutzsignalen sollte die
Einstellung Fast gewählt werden (wird in der Spektrumdarstellung mit FST angezeigt) und für genaue
und störungsarme Messungen die Einstellung Filter
(Anzeige FIR).
4.5 Info-Menüs
Die beiden Info-Menüs, die nach dem Einschalten
nacheinander kurz angezeigt werden, lassen sich auch
durch mehrfaches Drücken der Taste MENU aufrufen:
Abb. 13 Info Antennenanschluss,
Scan-Bereich, Speicher
Im oberen Bereich wird angezeigt, an welche Buchse
die Antenne für den Bereich 240– 960 MHz angeschlossen wird und an welche Buchse die Antenne für
den Bereich 15 – 2700MHz. Außerdem ist zu sehen,
welcher Scan-Bereich gewählt wurde (einstellbar im
Frequenzmenü, Zeile „Module“). Im unteren Bereich
ist jeweils die Größe der Speicher angegeben.
Das zweite Info-Menü zeigt in der dritten Zeile die
Firmware-Version an:
Abb. 14 Info Firmware-Version
5 WiFi-Analysator-Modus
Dieser Modus dient zur Anzeige der 13 WLANKanäle im 2,4-GHz-Bereich. Um den Modus einschalten zu können, muss im Frequenzmenü in der Zeile
„Module“ der Frequenzbereich „15 – 2700M“ gewählt
sein (Kap. 4.2).
Zum Einschalten die Taste MENU so oft drücken,
bis das Menü OPERATIONAL MODE (Abb. 5) er scheint. Mit der Taste ▼ oder ▲ die Zeile „WiFi Analyzer“ anwählen. Dann die Taste ENTER drücken.
Abb. 15 WiFi-Analysator-Modus
6 PC Software
Auf unserer Homepage finden Sie eine Software für
Windows XP/ Vista / Win7 / Win8, mit der Sie den RFEXPLORER von Ihrem Computer aus bedienen können. Gleich zeitig erhalten Sie damit auch eine Software für eventuelle Firmware-Aktualisierungen (RF
Explorer Firmware Update Loader).
http: //www.monacor.de/en/support /software-updates /
(Bitte beachten, dass „Microsoft ®.NET Framework
v4Client Profile“ installiert werden muss.)
Windows ist ein registriertes Warenzeichen der Microsoft Corporation in den
USA und anderen Ländern.
Lizenz
Die im RF-EXPLORER enthaltene Firmware ist urheberrechtlich geschützt © durch Ariel Rocholl, 2010–
2011.
RF Explorer PC Client ist eine freie Software unter
GPL v3, daher können Sie diese entsprechend den
GPL-Bedingungen ändern, weitergeben und benutzen.
7 Technische Daten
Display: . . . . . . . . . . . . kontrastreiche LCD-Anzeige
mit Hintergrundbeleuchtung,
128 × 64 Pixels
Messbereich: . . . . . . . 15 – 2700MHz
Amplitudenauflösung: . 0,5 dBm
Dynamikbereich: . . . . .
-
120 dBm bis 0 dBm
Absolute MaximalEingangsleistung
linke Antenne
(240 – 960 MHz): . . . +5 dBm
rechte Antenne
(15 – 2700 MHz): . . . +30 dBm
Mittlerer Rauschpegel:-115dBm (typisch)
Frequenzstabilität und
-genauigkeit: . . . . . . . . ±10 ppm (typisch) ≙ 0,001 %
Amplitudenstabilität und
-genauigkeit: . . . . . . . . ±3 dBm (typisch)
Frequenzauflösung: . . 1 kHz
Auflösungsbandbreite
(RBW): . . . . . . . . . . . . automatisch 2,6 – 600kHz
Antennenanschlüsse: . SMA, 50 Ω
passende kalibrierte 50-ΩAntennen im Lieferumfang
Stromversorgung: . . . . Lithium-Polymer-Akku,
860 mAh, Betriebsdauer ca.
16 h, aufladbar über den USB-
Anschluss
Abmessungen: . . . . . 71 × 122 × 25 mm
Gewicht: . . . . . . . . . . . 200 g
Änderungen vorbehalten.
CONFIG MENU
Backlight: Max
Contrast: 3
USB Bauds: 500Kbps
Draw Mode: Vectors
Marker: Peak
DSP: Fast
RF Explorer
Spectrum Analyzer
ver01.09 09-ago-12
www.rf-explorer.com
* *
240-960MHZ
[ACTIVE]
15-2700MHZ
64KB RAM Extra found
2MB ROM Extra found
3
RF-EXPLORER/3 Bestellnummer 25.4670
ELECTRONICS FOR SPECIALISTS ELECTRONICS FOR SPECIALISTS ELECTRONICS FOR SPECIALISTS ELECTRONICS FOR SPECIALISTS ELECTRONICS FOR SPECIALISTS ELECTRONICS FOR SPECIALISTS ELECTRONICS FOR SPECIALISTS ELECTRONICS FOR SPECIALISTS ELECTRONICS FOR SPECIALISTS ELECTRONICS FOR SPECIALISTS ELECTRONICS FOR SPECIALISTS
®
MONACOR INTERNATIONAL GmbH & Co. KG • Zum Falsch 36 • 28307 Bremen • Germany Copyright©by MONACOR INTERNATIONAL. All rights reserved. A-1409.99.03.10.2014
Page 4
RF Explorer
Spectrum Analyzer
ver01.09 09-ago-12
www.rf-explorer.com
* *
240-960MHZ
[ACTIVE]
15-2700MHZ
64KB RAM Extra found
2MB ROM Extra found
CONFIG MENU
Backlight: Max
Contrast: 3
USB Bauds: 500Kbps
Draw Mode: Vectors
Marker: Peak
DSP: Fast
ATTENUATOR MENU
Calculator: Max
Top dBm: -050
Bottom dBm: -110
Iterations: 004
Offset dB: +000
Units: dBm
FREQUENCY MENU
Center Freq: 435.000
Freq Span: 009.000
Start Freq: 430.500
Stop Freq: 439.500
Module: 240-960M
OPERATIONAL MODE
SPECTRUM Analyzer
RF Generator
WiFi Analyzer
* *
240-960MHZ
[ACTIVE]
15-2700MHZ
64KB RAM Extra found
2MB ROM Extra found
RF Explorer
Spectrum Analyzer
ver01.09 09-ago-12
www.rf-explorer.com
ENTER
MENURETURN
Handheld Spectrum Analyser
USB 2.0
RF Explorer
OFFON
RF 50Ω
1
4
5
6
23
RF-EXPLORER/3 Order number 25.4670
ELECTRONICS FOR SPECIALISTS ELECTRONICS FOR SPECIALISTS ELECTRONICS FOR SPECIALISTS ELECTRONICS FOR SPECIALISTS ELECTRONICS FOR SPECIALISTS ELECTRONICS FOR SPECIALISTS ELECTRONICS FOR SPECIALISTS ELECTRONICS FOR SPECIALISTS ELECTRONICS FOR SPECIALISTS ELECTRONICS FOR SPECIALISTS ELECTRONICS FOR SPECIALISTS
GB
RF Spectrum Analyser
Please read these operating instructions carefully prior
to operating the unit and keep them for later reference.
1 Safety Notes
The unit corresponds to all relevant directives of the
EU and is therefore marked with .
Caution with high EM radiation
The RF EXPLORER allows to measure
Therefore, the antenna inputs are very sensitive and
may be damaged by an excessive radiation even
with the unit switched off. The maximum input
level of +5 dBm must not be exceeded. This level
results e. g. at a distance of approx. 1 m to a micro wave oven or at a distance of approx. 10 cm to a
mobile phone.
discharging via the antennas. For instance, firmly
seize the metal housing by one hand prior to attaching or touching an antenna by the other hand.
– For storage or transport, keep the unit in a metal
– In areas of very high RF radiation connect one
G
G
G
Do not put defective rechargeable batteries into the
household rubbish but take them to a special waste
disposal (e. g. collective container at your retailer).
very small signals down to
It is also absolutely necessary to prevent static
box and / or remove the antennas.
SMA plug each with a 50Ω terminating resistor to
the antenna jacks.
The unit is suitable for indoor use only. Protect it
against dripping water and splash water, high air
humidity and heat (admissible ambient temperature
range 0 – 40 °C).
For cleaning only use a dry, soft cloth, never use
chemicals or water.
No guarantee claims for the unit and no liability for
any resulting personal damage or material damage
will be accepted if the unit is used for other purposes than originally intended, if it is not correctly
operated or not repaired in an expert way.
If the unit is to be put out of operation definitively, take it to a local recycling plant for a
disposal which is not harmful to the environment.
®
2 Overview
The RF EXPLORER has been designed to be intuitive
and easy to use. There is no need to read comprehensive user manuals to get advantage of its
3 Spectrum Analyser Mode
Recharging the battery
After switching on the RF EXPLORER, the display
successively shows two menus with information:
MENU
⬇
advanced functionality. Most of the complexity inherent to the spectrum analyser is simplified by the
firmware. For instance, you do not need to adjust the
-
120 dBm.
resolution bandwidth (RGW) each time you select a
different frequency span. Actually, you do not even
need to know what RBW is.
⬇
Fig. 2 Info menus
Then the spectrum analyser mode is started automatically:
Fig. 3 Spectrum display
The display shows an X axis and a Y axis, X for the
frequency in MHz and Y for power in dBm. Fig. 3
shows the frequency range from 430.5 MHz to
MENU
⬇
MENU
⬇
MENU
⬇
439.5 MHz and the amplitude (dynamic range) from
-
50 dBm to -110dBm.
Configuration settings such as amplitude reference
and frequency span are preserved between sessions.
Fig. 1 Connections and operating elements
1 Antenna for the range 240 – 960MHz
2 On / off switch
3 Antenna for the range 15 – 2700MHz
4 Display
5 Keypad
6 Mini USB port to charge the battery (for this pur-
pose, set the on / off switch to position ON) and for
operation via a PC
The display shows a small marker ▽ which indicates
the peak amplitude in the current frequency span. The
first value states the frequency at this point and the
second value the amplitude.
The display also shows a symbol for the USB
port (in case of connection to a PC) or a battery symbol (when the on / off switch is set to ON). To
recharge the internal rechargeable battery, connect the RF-EXPLORER to a USB jack and set the
on/off switch to position ON. Then the USB symbol
and the battery symbol are displayed alternately.
MENU
⬇
MENU
⬇
4 Menus
The unit is operated via several menus which are successively called with the button MENU. The button
RETURN allows to return from each menu to the
spectrum display.
MENU
Fig. 4 Menu structure
MONACOR INTERNATIONAL GmbH & Co. KG • Zum Falsch 36 • 28307 Bremen • Germany Copyright©by MONACOR INTERNATIONAL. All rights reserved. A-1409.99.03.10.2014
4
Page 5

4.1 Menu operating mode
Fig. 5 Menu operating mode
The operating mode spectrum analyser is selected
and can be switched on with the button ENTER. Then
the spectrum is displayed.
The operating mode WiFi analyser (chapter 5) can
be selected with the button ▼ or ▲ and ENTER when
the frequency range “15 – 2700 M” has been selected
in the lower line “Module” of the frequency menu
(chapter 4.2). Otherwise the message “THIS FEATURE IS NOT AVAILABLE IN THE SELECTED
MODE” is displayed. In this case return to the menu
operating mode with the button ENTER.
The operating mode “RF Generator” is not available for this model. When selecting it, the message
“THIS FEATURE IS NOT …” is likewise displayed.
4.2 Frequency menu
Fig. 6 Frequency menu
This menu which allows to change frequency settings
is probably the menu most used.
When, after switching-on the RF EXPLORER, the
spectrum is displayed and the button MENU is
pressed twice, the frequency menu appears. However, this procedure is changed in the following. Each
time the button MENU is pressed while the spectrum
is displayed, the last menu called appears. Thus, time
is saved as it is not necessary to navigate through all
menus to return to the previous one.
There are two different methods to change the frequency range shown in the spectrum display:
1. Center Freq and Freq Span
This is the usual spectrum analyser adjustment all
experts are familiar with. The center frequency
(Center Freq) of the frequency band to be analysed
is adjusted and then the bandwidth (Freq Span).
2. Start Freq and Stop Freq
Only a few spectrum analysers offer this userfriendly method. The lower frequency (Start Freq)
and the higher frequency (Stop Freq) of the frequency range to be analysed are adjusted.
When Center Freq and Freq Span are adjusted, Start
Freq and Stop Freq are changed accordingly and vice
versa. In general, Center Freq / Freq Span are adjusted when the frequency is known and Start / Stop
Freq to check a certain range.
To go to an option, use the buttons ▲ and ▼. Then
press the button ENTER to be able to edit the option.
Go to the place to be changed with the button ◀ or ▶.
Adjust the desired value with the button ▲ or ▼ and
confirm the adjustment with the button ENTER or cancel it with the button RETURN.
In the line Module select the frequency range
240 – 960 MHz or 15 – 2700 MHz to be analysed with
the button ENTER. In the range of 240 – 960MHz
minor signals to
-
120 dBm can be measured. In the
range 15 – 2700 MHz, measurements to -100 dBm
only are possible due to the large frequency range
and the higher background noise resulting.
Note: The bandwidth can be adjusted between 0.112 MHz
and 100 MHz. The lowest and highest frequencies which can
be adjusted depend on the adjustments in the menu lines
“Freq Span” and “Module”.
Example for changing the bandwidth to 6.5 MHz; the
lower and higher frequencies are automatically updated compared to fig. 6:
Fig. 7 Bandwidth 6.5 MHz
Exit the menu with the button RETURN and return to
the spectrum display.
Fig. 8 Spectrum display
with bandwidth 6.5 MHz
The new frequency range is adjusted. As a further
example, repeat the procedure to change the bandwidth to 2.5 MHz. For this purpose press the button
MENU again: The previous menu option (Freq Span) is
selected. Change the value to 2.5 MHz and confirm with
the button ENTER. Then press the button RETURN to
return to the spectrum display.
RETURN ➡
Fig. 9 The bandwidth is changed to 2.5 MHz
The new frequency range is adjusted but what is interesting now is that the center frequency can also be
changed with no need to call the frequency menu. For
this purpose press the button ◀ or ▶ (repeatedly)
when the spectrum is displayed: Each time the center
frequency is reduced or increased by 1⁄8 of the bandwidth, i. e. at a bandwidth of 2.5 MHz by 0.3125 MHz
by just pressing a key. This direct method is especially
useful with a narrow bandwidth.
During the spectrum display the measuring values
and the measuring curve can be frozen by pressing
the button ENTER. This facilitates the reading for values rapidly changing. In this case, the indication HLD
next to the Y axis is flashing. To return to the present
values, press the button ENTER again.
The frequencies of the scan range are indicated at the
X axis. Alternatively to this, the bandwidth (SP), the
centre frequency (C) and the resolution bandwidth
(RBW) can be indicated. To switch over, press the button RETURN. When the button ◀ or ▶ is now pressed
(repeatedly), it is not the centre frequency which is
changed but the bandwidth. Thus, the bandwidth can
also rapidly be changed without calling the menu.
4.3 Attenuator menu
This menu allows to change the level display in the
Y axis. To call the menu, press the button MENU
repeatedly until the menu is displayed.
Fig. 10 Attenuator menu
This menu has some interesting options:
Calculator: offers five modes for the level display. To
change the mode, press the button ENTER.
Max: The peak values of the last frequency band
scan iterations [sweeps] (see menu option below)
are used, in this case the peak values of the last
4 scans. This is the standard mode by which rapidly changing RF signals may be detected or the
channel assignment can be found in difficult cases.
(The selected mode is shown in the spectrum
display on the left of the Y axle, for this mode
with MAx.)
Average: The arithmetic media average during the
last scan iterations is calculated. This mode is
especially suitable to find the average of the noise
floor and to display signals with constant frequency
and amplitude (Continuous Wave).
(This mode is shown in the spectrum display with
AVG.)
Overwrt: Higher level values overwrite lower values until the button RETURN is pressed or the center frequency is changed with the button ◀ or ▶.
(This mode is shown with OWR.)
Max Hold: Simultaneous display of the present
levels and the maximum levels.
(This mode is shown with MxH.)
Normal: No calculation, continuous display of the
current levels.
(This mode is shown with nOR.)
Top/Bottom dBm: Herewith the measuring range of
the level is adjusted. “Top dBm” for the upper measured value of the Y axis and “Bottom dBm” for the
lower value. The difference between the two values
cannot be inferior to 10 dBm.
Iterations: Indicates the number of scan sweeps to
calculate the peak values (calculator: max) or the
average values (calculator: average), adjustable from
1 to 28. The higher the iteration value, the more exact
the calculation, but the slower the display.
Offset dB: Moves the measured level by the value
adjusted (±100 dB).
Example: A level of
-
76 dB is measured at a certain
frequency at a place in the room. With an offset of
+76 dB the RF-EXPLORER shows 0 dB in this case.
For measurements at other places in the room the
level deviation to the place of reference is directly
shown in dB.
Units: The unit dBm or dBμV can be selected for the
Y axle with the button ENTER. In the spectrum display, the selected unit is shown by “dBm” or “dBV” on
the left next to the Y axle.
For a simple test change the upper dBm value to
-
70 dBm. Then press the button RETURN to return to
the spectrum display. The level range indicated is now
FREQUENCY MENU
Center Freq: 435.000
Freq Span: 009.000
Start Freq: 430.500
Stop Freq: 439.500
Module: 240-960M
OPERATIONAL MODE
SPECTRUM Analyzer
RF Generator
WiFi Analyzer
ATTENUATOR MENU
Calculator: Max
Top dBm: -050
Bottom dBm: -110
Iterations: 004
Offset dB: +000
Units: dBm
FREQUENCY MENU
Center Freq: 435.000
Freq Span: 002.500
Low Freq: 433.750
High Freq: 436.250
Module: 240-960M
FREQUENCY MENU
Center Freq: 435.000
Freq Span: 006.500
Start Freq: 431.750
Stop Freq: 438.250
Module: 240-960M
5
RF-EXPLORER/3 Order number 25.4670
ELECTRONICS FOR SPECIALISTS ELECTRONICS FOR SPECIALISTS ELECTRONICS FOR SPECIALISTS ELECTRONICS FOR SPECIALISTS ELECTRONICS FOR SPECIALISTS ELECTRONICS FOR SPECIALISTS ELECTRONICS FOR SPECIALISTS ELECTRONICS FOR SPECIALISTS ELECTRONICS FOR SPECIALISTS ELECTRONICS FOR SPECIALISTS ELECTRONICS FOR SPECIALISTS
®
MONACOR INTERNATIONAL GmbH & Co. KG • Zum Falsch 36 • 28307 Bremen • Germany Copyright©by MONACOR INTERNATIONAL. All rights reserved. A-1409.99.03.10.2014
Page 6

CONFIG MENU
Backlight: Max
Contrast: 3
USB Bauds: 500Kbps
Draw Mode: Vectors
Marker: Peak
DSP: Fast
RF Explorer
Spectrum Analyzer
ver01.09 09-ago-12
www.rf-explorer.com
* *
240-960MHZ
[ACTIVE]
15-2700MHZ
64KB RAM Extra found
2MB ROM Extra found
RF-EXPLORER/3 Order number 25.4670
ELECTRONICS FOR SPECIALISTS ELECTRONICS FOR SPECIALISTS ELECTRONICS FOR SPECIALISTS ELECTRONICS FOR SPECIALISTS ELECTRONICS FOR SPECIALISTS ELECTRONICS FOR SPECIALISTS ELECTRONICS FOR SPECIALISTS ELECTRONICS FOR SPECIALISTS ELECTRONICS FOR SPECIALISTS ELECTRONICS FOR SPECIALISTS ELECTRONICS FOR SPECIALISTS
smaller and thus the signal on the display is higher,
especially the noise floor.
➡
Fig. 11 Upper dBm value reduced by 20dB
As the upper dBm value is very frequently changed,
this value can be increased by 5 dBm with the button
▲ and be reduced by 5 dBm with the button ▼ when
the spectrum is displayed. Together with the buttons
◀ and ▶ to change the center frequency, these shortcuts are very useful for configuration adjustments in
real time as there is no need to call a menu.
4.4 Configuration menu
RF EXPLORER offers some configuration facilities to
adjust the unit as desired or according to application.
Press the button ENTER repeatedly until the configuration menu is displayed.
Fig. 12 Configuration menu
The options in this menu can be selected with the buttons ▲ and ▼ and be adjusted by pressing the button
ENTER repeatedly.
Backlight: Backlight for the display: OFF, Low, Med,
High, Max. The RF EXPLORER offers good visibility
indoors and outdoors, even in direct sunlight. With a
low backlight the battery is preserved.
Contrast: 10 contrast levels for the display are available.
USB Bauds: The presetting is 500 kbits / s which is
also recommended. When problems occur during
data transfer to the PC which is quite rare, change to
the slower speed of 2.4 kbits / s. However, this is not
recommended as the connection becomes very slow.
The speed of data transfer of the RF EXPLORER
must match the speed of the PC to obtain a correct
connection.
Draw Mode: In case of the adjustment “Vectors” a
level curve for the scanned frequency range is displayed, in case of the adjustment “Fill” individual
columns show the level.
®
Marker: Place a marker ▽ to read frequency and
level at this point.
None: no marker
Peak: automatic marking of the frequency with the
highest level
Manual: The marker can be moved in the scan
range with the buttons ◀ and ▶.
DSP: The digital signal processor of the RF-EX PLORER is equipped with a subprogram which filters
unwanted signals occurring in case of signal processing (e. g. image frequencies). However, for an extensive filtering, the measuring process will become more
slowly and short wanted signals (e. g. WiFi signals)
cannot be recognized due to the high calculating effort.
To measure short wanted signals, the adjustment
Fast should be selected (is shown by FST in the spectrum display) and for exact measurements free of interference select the adjustment Filter (indication FIR).
4.5 Info menus
The two info menus which are shortly displayed successively after switching-on, can be called by pressing the button MENU repeatedly:
Fig. 13 Info antenna connection,
scan range, storage
The upper range shows the jack for connecting the
antenna for the range 240 – 960 MHz and the jack for
connecting the antenna for therange 15 – 2700 MHz.
Be sides, it is possible to see which scan range has
been selected (adjustable in the frequency menu, line
“Module”). In the lower range the storage space is
5 WiFi Analyser Mode
This mode serves to display the 13 WLAN channels in
the 2.4 GHz range. To be able to switch on the mode,
the frequency range “15 – 2700M” must be selected in
the line “Module” of the frequency menu (chapter 4.2).
To switch on, press the button MENU repeatedly
until the menu OPERATIONAL MODE (fig. 5) ap pears. Select the line “WiFi Analyzer” with the button
▼ or ▲. Then press the button ENTER.
Fig. 15 WiFi Analyser mode
6 PC Software
On our homepage you will find a software for Windows XP/ VISTA / Win7/ Win8 which allows to operate
the RF EXPLORER from your computer. At the same
time you also receive a software for possible firmware
updating (RF Explorer Firmware Update Loader).
http: //www.monacor.de/en/support /software-updates /
®
(Please note that “Microsoft
Profile” must be installed.)
Windows is a registered trademark of the Microsoft Corporation in the USA and
other countries.
Licence
The firmware included in the RF EXPLORER is protected by copyright © by Ariel Rocholl, 2010– 2011.
RF Explorer PC Client is a free software under
GPL v3, therefore you are free to modify, distribute
and use it according to GPL terms.
.NET Framework v4Client
7 Specifications
Display: . . . . . . . . . . . . high contrast LCD display
Measuring range: . . . . 15 – 2700 MHz
Amplitude resolution: . 0.5 dBm
Dynamic range: . . . . .
Absolute
max. input power
left antenna
(240 – 960 MHz): . . . +5 dBm
right antenna
(15 – 2700 MHz): . . . +30 dBm
Medium noise level: . .
Frequency stability
and accuracy: . . . . . . . ±10 ppm (typical) ≙ 0.001%
Amplitude stability
and accuracy: . . . . . . . ±3 dBm (typical)
Frequency resolution: . 1 kHz
Resolution
bandwidth (RBW): . . . automatic 2.6 – 600 kHz
Antenna connections: . SMA, 50 Ω
Power supply: . . . . . . . lithium polymer rechargeable
Dimensions: . . . . . . . . 71 × 122 × 25 mm
Weight: . . . . . . . . . . . . 200 g
with backlight,
128 × 64 pixels
-
120 dBm to 0 dBm
-
115dBm (typical)
matching calibrated
50 Ω antennas supplied
battery, 860mAh,
operating time approx. 16 h,
rechargeable via the USB port
indicated in each case.
The second info menu shows the firmware version
in the third line:
Fig. 14 Info firmware version
Subject to technical modification.
MONACOR INTERNATIONAL GmbH & Co. KG • Zum Falsch 36 • 28307 Bremen • Germany Copyright©by MONACOR INTERNATIONAL. All rights reserved. A-1409.99.03.10.2014
6
Page 7

Analyseur de spectre HF
Veuillez lire la présente notice avec attention
avant le fonctionnement et conservez-la pour
pouvoir vous y reporter ultérieurement.
1 Conseils dʼutilisation
Lʼappareil répond à toutes les directives nécessaires
de lʼUnion européenne et porte donc le symbole .
G
Lʼappareil nʼest conçu que pour une utilisation en
intérieur. Protégez-le de tout type de projections
dʼeau, des éclaboussures, dʼune humidité élevée et
la chaleur (plage de température de fonctionnement
autorisée : 0 – 40 °C).
G
Pour le nettoyage, utilisez un chiffon sec et doux, en
aucun cas de produits chimiques ou dʼeau.
G
Nous déclinons toute responsabilité en cas de dommages corporels ou matériels résultants si lʼappareil est utilisé dans un but autre que celui pour
lequel il a été conçu, sʼil nʼest pas correctement utilisé ou sʼil nʼest pas réparé par une personne habilitée ; de même, la garantie deviendrait caduque.
2 Eléments
Le RF-EXPLORER est conçu pour une utilisation simple et intuitive. Il nʼest pas nécessaire dʼavoir à lire
une notice très détaillée pour pouvoir utiliser la grande
multiplicité des fonctionnalités de lʼappareil. La plus
grande partie du complexe analyseur de spectre a été
simplifiée par le Firmware. Par exemple, vous nʼavez
pas besoin de régler la largeur de bande de résolution
(RBW) chaque fois que vous sélectionnez une largeur
de bande dʼaffichage différente. Vous nʼavez pas
besoin de savoir ce que RBW est.
Schéma 1 Branchements et éléments
1 Antenne pour la plage 240 – 960 MHz
2 Interrupteur marche / arrêt
3 Antenne pour la plage 15 – 2700 MHz
4 Affichage
5 Clavier
6 Port mini USB pour charger lʼaccu (mettez pour ce
faire lʼinterrupteur marche / arrêt sur la position ON)
et pour une utilisation via un PC
3 Mode analyseur de spectre
charge de lʼaccumulateur
Une fois le RF-EXPLORER allumé, sʼaffichent brièvement sur lʼaffichage deux menus avec les informations suivantes :
⬇
Schéma 2 Menus info
Ensuite le mode analyseur de spectre démarre automatiquement.
Schéma 3 Affichage spectre
Sur lʼaffichage, il y a un axe X et un axe Y, X pour
la fréquence en MHz et Y pour la puissance en dBm.
Sur le schéma 3, la bande passante va de 430,5 MHz
à 439,5 MHz et lʼamplitude (plage dynamique) de
-
50 dBm à -110dBm.
Les réglages de configuration tels que la référence
dʼamplitude et la largeur de bande dʼaffichage de fréquence sont conservés entre les sessions. Sur lʼaffichage, on peut voir un petit repère ▽. Il indique lʼamplitude crête dans la largeur de bande de fréquence
actuelle. La première valeur donne la fréquence à ce
point et la seconde valeur lʼamplitude.
Lʼaffichage indique également un symbole pour
le port USB (pour un branchement à un PC) ou un
symbole de batterie (si lʼinterrupteur marche / arrêt
est sur ON). Pour charger lʼaccumulateur interne,
reliez le RF-EXPLORER à une prise USB et mettez
lʼinterrupteur Marche /Arrêt sur la position ON. Les
symboles USB et de batterie sʼaffichent en alternance.
4 Menus
Lʼutilisation sʼeffectue via plusieurs menus pouvant
être appelés les uns après les autres avec la touche
MENU. Avec la touche RETURN, on peut revenir de
chaque menu sur lʼaffichage du spectre.
⬇
⬇
⬇
⬇
⬇
⬇
Schéma 4 Structure du menu
MENU
RF Explorer
Spectrum Analyzer
ver01.09 09-ago-12
www.rf-explorer.com
MENU
* *
240-960MHZ
[ACTIVE]
15-2700MHZ
64KB RAM Extra found
2MB ROM Extra found
MENU
CONFIG MENU
Backlight: Max
Contrast: 3
USB Bauds: 500Kbps
Draw Mode: Vectors
Marker: Peak
DSP: Fast
MENU
ATTENUATOR MENU
Calculator: Max
Top dBm: -050
Bottom dBm: -110
Iterations: 004
Offset dB: +000
Units: dBm
MENU
FREQUENCY MENU
Center Freq: 435.000
Freq Span: 009.000
Start Freq: 430.500
Stop Freq: 439.500
Module: 240-960M
MENU
OPERATIONAL MODE
SPECTRUM Analyzer
RF Generator
WiFi Analyzer
MENU
* *
240-960MHZ
[ACTIVE]
15-2700MHZ
64KB RAM Extra found
2MB ROM Extra found
RF Explorer
Spectrum Analyzer
ver01.09 09-ago-12
www.rf-explorer.com
ENTER
MENURETURN
Handheld Spectrum Analyser
USB 2.0
RF Explorer
OFFON
RF 50Ω
1
4
5
6
23
Lorsque lʼappareil est définitivement retiré du
service, vous devez le déposer dans une
usine de recyclage de proximité pour contribuer à son élimination non polluante.
Ne jetez pas les batteries défectueuses dans la poubelle domestique, déposez-les dans un container
spécifique ou ramenez-les à votre revendeur.
Attention au rayonnement EM
Avec le RF-EXPLORER, on peut mesurer
de très petits signaux jusquʼà
-
120 dBm.
Les entrées dʼantenne sont donc très sensibles et
peuvent être endommagées par un rayonnement
trop élevé, même lorsque lʼappareil est éteint. Le
niveau maximal dʼentrée de +5 dBm ne doit pas être
dépassé. Cʼest le niveau par exemple à une distance
de 1 m environ dʼun four à micro-ondes ou une distance de 10 cm environ avec un téléphone mobile.
Il est impératif dʼéviter tout déchargement statique
via les antennes. Tenez, par exemple, le boîtier
métallique avec une main avant de fixer ou toucher
une antenne avec lʼautre main.
– Pour le stockage ou le transport, mettez lʼappareil
dans un coffret métallique et / ou retirez les an tennes.
– Dans des zones avec un rayonnement HF élevé,
mettez une fiche SMA respectivement avec résistance terminale de 50 Ω sur les prises dʼantenne.
7
RF-EXPLORER/3 Référence numérique 25.4670
ELECTRONICS FOR SPECIALISTS ELECTRONICS FOR SPECIALISTS ELECTRONICS FOR SPECIALISTS ELECTRONICS FOR SPECIALISTS ELECTRONICS FOR SPECIALISTS ELECTRONICS FOR SPECIALISTS ELECTRONICS FOR SPECIALISTS ELECTRONICS FOR SPECIALISTS ELECTRONICS FOR SPECIALISTS ELECTRONICS FOR SPECIALISTS ELECTRONICS FOR SPECIALISTS
®
MONACOR INTERNATIONAL GmbH & Co. KG • Zum Falsch 36 • 28307 Bremen • Germany Copyright©by MONACOR INTERNATIONAL. All rights reserved. A-1409.99.03.10.2014
F
B
CH
Page 8

FREQUENCY MENU
Center Freq: 435.000
Freq Span: 009.000
Start Freq: 430.500
Stop Freq: 439.500
Module: 240-960M
OPERATIONAL MODE
SPECTRUM Analyzer
RF Generator
WiFi Analyzer
ATTENUATOR MENU
Calculator: Max
Top dBm: -050
Bottom dBm: -110
Iterations: 004
Offset dB: +000
Units: dBm
FREQUENCY MENU
Center Freq: 435.000
Freq Span: 002.500
Low Freq: 433.750
High Freq: 436.250
Module: 240-960M
FREQUENCY MENU
Center Freq: 435.000
Freq Span: 006.500
Start Freq: 431.750
Stop Freq: 438.250
Module: 240-960M
RF-EXPLORER/3 Référence numérique 25.4670
ELECTRONICS FOR SPECIALISTS ELECTRONICS FOR SPECIALISTS ELECTRONICS FOR SPECIALISTS ELECTRONICS FOR SPECIALISTS ELECTRONICS FOR SPECIALISTS ELECTRONICS FOR SPECIALISTS ELECTRONICS FOR SPECIALISTS ELECTRONICS FOR SPECIALISTS ELECTRONICS FOR SPECIALISTS ELECTRONICS FOR SPECIALISTS ELECTRONICS FOR SPECIALISTS
4.1 Menu mode de fonctionnement
Schéma 5 Menu mode de fonc-
tionnement
Le mode de fonctionnement analyseur de spectre est
sélectionné et peut être activé avec la touche ENTER.
Le spectre sʼaffiche.
Vous pouvez sélectionner le mode de fonctionnement Analyseur WiFi (chapitre 5) avec la touche ▼
ou ▲ et ENTER, si, dans la ligne inférieure “Module”
du menu Fréquences, la plage de fréquence
“15 – 2700 M” est sélectionnée (chapitre 4.2). Sinon le
message “THIS FEATURE IS NOT AVAILABLE IN
THE SELECTED MODE” sʼaffiche. Dans ce cas, avec
la touche ENTER, revenez au menu Mode de fonctionnement.
Le mode de fonctionnement “RF Generator” nʼest
pas prévu sur ce modèle. Si vous le sélectionnez, le
message “THIS FEATURE IS NOT …” sʼaffiche de la
même manière.
4.2 Menu fréquence
Schéma 6 Menu fréquence
Ce menu dans lequel les réglages de fréquence peuvent être modifiés, est généralement le menu le plus
utilisé.
Une fois le RF-EXPLORER allumé, si vous ap puyez deux fois sur la touche MENU lorsque le spectre est affiché, le menu de fréquence sʼaffiche. En
revanche, ce processus est modifié par la suite. A
chaque fois que vous appuyez sur la touche MENU
lorsque le spectre est affiché, le dernier menu appelé
sʼaffiche. On gagne ainsi du temps et il nʼest pas
nécessaire de naviguer dans tous les menus pour
arriver à lʼendroit précédent.
La plage de fréquences affichée dans le spectre peut
être modifiée de deux manières différentes :
1. Center Freq et Freq Span
Cʼest le réglage de spectre classique que tous les
professionnels connaissent. La fréquence centrale
(Center Freq) de la bande de fréquences à analyser
est réglée, puis la largeur de bande (Freq Span).
®
2. Start Freq et Stop Freq
Seuls quelques modèles dʼanalyseurs de spectre
proposent cette méthode conviviale. La fréquence
inférieure (Start Freq) et la fréquence supérieure
(Stop Freq) de la bande de fréquence à analyser
sont réglées.
Si Centre Freq et Freq Scan sont réglées, Start et
Stop Freq se modifient en conséquence et inversement. En général, Center Freq / Freq Span sont
réglées lorsque la fréquence est connue et Start /
Stop Freq pour vérifier une plage donnée.
La nouvelle plage de fréquence est réglée. Comme
exemple suivant, répétez la procédure pour modifier
la largeur de bande à 2,5 MHz. Ensuite appuyez sur la
touche MENU : lʼoption précédente du menu (Freq
Span) est sélectionnée. Modifiez la valeur à 2,5 MHz
et confirmez avec la touche ENTER. Appuyez ensuite
sur la touche RETURN pour revenir à lʼaffichage du
spectre.
RETURN ➡
Schéma 10 Menu atténuation
Ce menu propose quelques options intéressantes :
Calculator : propose 5 modes pour lʼaffichage des
niveaux. Pour modifier le mode, appuyez sur la
touche ENTER.
Max : on utilise les valeurs crête des dernières itérations de scan de bande passante [sweeps] (voir
option menu ci-dessous), dans ce cas, les valeurs
Pour arriver à une option, utilisez les touches ▲ et ▼.
Appuyez ensuite sur la touche ENTER pour éditer
lʼoption. Avec la touche ◀ ou ▶, allez à lʼendroit qui
doit être modifié. Avec la touche ▲ ou ▼, réglez la
valeur voulue et confirmez le réglage avec la touche
ENTER ou revenez en arrière avec la touche
RETURN.
Dans la ligne Module, sélectionnez la bande passante 240 – 960 MHz ou 15 – 2700 MHz à analyser,
avec la touche ENTER. Dans la plage 240 – 960 MHz,
on peut mesurer de très petits signaux jusquʼà
-
120 dBm. Dans la plage 15 – 2700 MHz, seules des
mesures jusquʼà -100 dBm sont possibles à cause de
la grande plage de fréquences et donc du bruit de
fond plus important.
Conseil : la largeur de bande peut être réglée entre 0,112MHz
et 100 MHz. La fréquence la plus basse et la fréquence la
plus élevée réglables dépendent des réglages dans la ligne
“Freq Span” et “Module”.
Exemple pour la modification de la largeur de bande
sur 6,5 MHz ; la fréquence inférieure et la fréquence
supérieure sont automatiquement actualisées par
rapport au schéma 6.
Schéma 7 Largeur de bande
6,5 MHz
Avec la touche RETURN, quittez le menu et revenez
à lʼaffichage du spectre.
Schéma 8 Affichage du spectre
avec largeur de bande
6,5 MHz
Schéma 9 Largeur de bande modifiée à 2,5 MHz
La nouvelle plage de fréquence est réglée mais le fait
intéressant est que la fréquence moyenne peut également être modifiée sans devoir rappeler le menu de
fréquence. Appuyez (plusieurs fois) sur la touche ◀
ou ▶ lorsque le spectre est affiché : la fréquence
moyenne est diminuée ou augmentée, chaque fois, 1⁄8
de la largeur de bande, cʼest-à-dire pour une largeur
de bande de 2,5 MHz, de 0,3125 MHz avec une simple pression de touche. Cette méthode directe est
particulièrement intéressante pour une petite largeur
de bande.
Pendant la visualisation du spectre, on peut geler les
valeurs de mesure et la courbe de mesure en
appuyant sur la touche ENTER. Cela facilite la lecture
de valeurs se modifiant rapidement. A côté de lʼaxe Y,
lʼaffichage HLD clignote. Pour revenir aux valeurs
actuelles, appuyez une nouvelle fois sur la touche
ENTER.
Sur lʼaxe X, les fréquences de la plage Scan sont indiquées. A la place, la largeur de bande (SP), la fréquence médiane (C) et la largeur de bande de résolution (RBW) sont affichées. Pour commuter, appuyez
sur la touche RETURN. Si maintenant, vous appuyez
(plusieurs fois), sur la touche ◀ ou ▶, la largeur de
bande se modifie et pas la fréquence moyenne. Ainsi,
la largeur de bande peut être modifiée rapidement
sans devoir appeler le menu.
4.3 Menu atténuation
Avec ce menu, on peut modifier lʼaffichage de niveau
dans lʼaxe Y. Pour appeler le menu, appuyez sur la
touche MENU jusquʼà ce que le menu soit visible sur
lʼaffichage.
crête des 4 derniers scans. Cʼest le mode standard
avec lequel on peut découvrir rapidement dʼautres
signaux HF ou avec lequel on peut trouver lʼattribution des canaux dans des cas difficiles. (Le
mode sélectionné est affiché dans la visualisation
du spectre à gauche de lʼaxe Y, pour ce mode avec
MAx.)
Average : cʼest la moyenne arithmétique pendant
les dernières itérations Scan. Ce mode est adapté
pour obtenir la moyenne dʼun bruit de fond et pour
afficher des signaux avec fréquence et amplitude
constante (Continuous wave).
(Ce mode est affiché dans la visualisation de spectre avec AVG.)
Overwrt : les valeurs plus élevées de niveau écrasent les valeurs les plus basses jusquʼà ce que la
touche RETURN soit activée ou que la fréquence
moyenne soit modifiée avec la touche ◀ ou ▶.
(Ce mode est affiché avec OWR.)
Max Hold : affichage simultané des niveaux ac tuels et des niveaux maxima.
(Ce mode est affiché avec MxH.)
Normal : pas de calcul, affichage continu des ni veaux actuels.
(Ce mode est affiché avec nOR.)
Top/ Bottom dBm : la plage de mesure de niveau est
réglée, “Top dBm” pour la valeur supérieure de
mesure sur lʼaxe Y et “Bottom dBm” pour la valeur
inférieure. La différence entre les deux valeurs ne
peut pas être inférieure à 10 dBm.
Iterations : indique le nombre de défilements Scans
pour calculer les valeurs crête (Calculator : Max) ou
les valeurs moyennes (Calculator : Average), réglable
de 1 à 28. Plus la valeur dʼitération est importante,
plus le calcul est précis mais plus lʼaffichage est lent.
MONACOR INTERNATIONAL GmbH & Co. KG • Zum Falsch 36 • 28307 Bremen • Germany Copyright©by MONACOR INTERNATIONAL. All rights reserved. A-1409.99.03.10.2014
8
Page 9

Offset dB : déplace le niveau mesuré de la valeur
réglée (±100 dB).
Exemple : à un endroit dans une pièce, un niveau de
-
76 dB est mesuré pour une fréquence donnée. Pour
un Offset de +76 dB, le RF-EXPLORER indique alors
0 dB. Pour des mesures à dʼautres endroits dans la
pièce, la déviation de niveau par rapport à la position
de référence est directement affichée en dB.
Units : Avec la touche ENTER, on peut régler, pour
lʼaxe Y, lʼunité dBm ou dBμV. Dans la visualisation de
spectre, lʼunité sélectionnée est affichée avec “dBm”
ou “dBV” à gauche à côté de lʼaxe Y.
Pour un test simple, modifiez la valeur supérieure
dBm sur
-
70 dBm. Appuyez sur la touche RETURN
pour revenir à lʼaffichage du spectre. La plage de
niveau affichée est plus petite et ainsi le signal sur lʼaffichage est plus grand, en particulier le bruit de fond.
➡
Schéma 11 Valeur dBm supérieure diminuée de 20 dB
Puisque la valeur dBm supérieure est très souvent
modifiée, elle peut être augmentée de 5 dBm avec la
touche ▲ et diminuée de 5dBm avec la touche ▼
lorsque le spectre est affiché. Ces raccourcis avec les
touches ◀ et ▶ pour modifier la fréquence moyenne,
sont très utiles en temps réel pour les réglages de
configuration car il nʼest pas nécessaire dʼappeler un
menu.
4.4 Menu configuration
Dans le RF-EXPLORER, quelques possibilités de
configuration existent avec lesquelles lʼappareil peut
être réglé sur les souhaits ou types dʼutilisations.
Appuyez sur la touche ENTER jusquʼà ce que le
menu de configuration soit visible sur lʼaffichage.
Schéma 12 Menu de configuration
Dans ce menu, on peut sélectionner les options avec
les touches ▲ et ▼ et les régler par plusieurs pressions sur la touche ENTER.
Backlight : éclairage arrière-plan pour lʼaffichage :
OFF, Low, Med, High, Max. Le RF-EXPLORER offre
en intérieur et en extérieur une bonne lisibilité même
avec une lumière directe du soleil. Avec un éclairage
dʼarrière-plan faible, lʼaccumulateur est préservé.
Contrast : 10 niveaux de contraste pour lʼaffichage.
USB Bauds : le préréglage est de 500 kbits / s, ce qui
est recommandé. Si lors de la transmission de données vers le PC, des problèmes surviennent, ce qui
est rare, il faut basculer sur une vitesse plus lente
de 2,4 kbits / s. Cependant, cela nʼest pas recommandé puisque la connexion est très lente. La vitesse
de transmission de données du RF-EXPLORER
doit coïncider avec celle du PC pour obtenir une
connexion correcte.
Draw Mode : avec le réglage “Vectors”, on affiche
une courbe de niveau pour la plage de fréquence
scannée, avec le réglage “Fill”, des colonnes individuelles indiquent le niveau.
Marker : placement dʼun repère ▽ pour lire la fré-
quence et le niveau à cet endroit
None : pas de repère
Peak : repère automatique de la fréquence avec le
niveau le plus élevé
Manual : on peut déplacer le repère avec les
touches ◀ et ▶ dans la plage Scan.
DSP : le processeur digital de signal du RF-EXPLORER est doté dʼun sous-programme qui calcule (filtre)
les signaux non souhaités apparaissant lors du traitement de signal (entre autres fréquences image).
Cependant, pour un filtrage efficace, le processus de
mesure est plus lent et les brefs signaux utiles (par
exemple signaux WiFi), ne peuvent pas être détectés
à cause dʼun travail plus important de calcul.
Pour mesurer de brefs signaux utiles, il faut sélectionner le réglage Fast (indiqué par FST dans la
visualisation de spectre) et pour des mesures précises et sans interférences, il faut sélectionner le
réglage Filter (affichage FIR).
4.5 Menus info
Les deux menus info brièvement affichés lʼun après
lʼautre après lʼallumage peuvent être appelés par plusieurs pressions sur la touche MENU :
Schéma 13 Info branchement
antenne, plage scan,
mémoire
Dans la plage supérieure sʼaffiche la prise à laquelle
lʼantenne pour la plage 240 – 960 MHz est reliée et la
prise pour lʼantenne dans la plage 15 – 2700 MHz. On
peut voir également quelle plage Scan a été sélectionnée (réglable dans le menu fréquence, ligne
“Module”). Dans la partie inférieure, la taille de la
mémoire est indiquée.
Le second menu Info indique, dans la troisième
ligne, la version du firmware :
Schéma 14 Info version Firmware
5 Mode analyseur WiFi
Ce mode permet dʼafficher les 13 canaux WLAN dans
la plage 2,4 GHz. Pour activer le mode, sélectionnez
dans le menu fréquence, ligne “Module“, la plage de
fréquence “15 – 2700M” (chapitre 4.2).
Pour activer, appuyez sur la touche MENU jusquʼà
ce que le menu OPERATIONAL MODE (schéma 5)
soit visible. Avec la touche ▼ ou ▲, sélectionnez la
ligne “WiFi Analyzer”. Appuyez ensuite sur la touche
ENTER.
Schéma 15 Mode analyseur WiFi
6 Logiciel PC
Vous trouverez sur notre site un logiciel pour
Windows XP/ Vista / Win7/ Win8, avec lequel vous
pouvez utiliser le RF-EXPLORER depuis votre ordinateur. Simultanément, vous obtenez un logiciel
pour des actualisations éventuelles du Firmware
(RF Explorer Firmware Update Loader).
http: //www.monacor.de/en/support /software-updates /
(Attention : “Microsoft
®
.NET Framework v4Client Pro-
file” doit être installé.)
Windows est une marque déposée de Microsoft Corporation aux Etats-Unis et
dans les autres pays.
Licence
Le Firmware contenu dans le RF-EXPLORER est protégé par le copyright © par Ariel Rocholl, 2010– 2011.
RF Explorer PC Client est un logiciel libre de droit
sous GPL v3 ; vous pouvez donc le changer, faire
passer et lʼutiliser en respectant les conditions GPL.
7 Caractéristiques techniques
Affichage : . . . . . . . . . . affichage LCD riche en con -
traste, éclairage arrière-plan,
128 × 64 pixels
Plage de mesure: . . . . 15 – 2700 MHz
Résolution amplitude : 0,5 dBm
Plage dynamique : . . .
-
120 dBm à 0 dBm
Puissance dʼentrée
absolue maximale
antenne gauche
(240 – 960 MHz): . . . +5 dBm
antenne droite
(15 – 2700 MHz): . . . +30 dBm
Niveau sonore moyen :
-
115dBm (typique)
Stabilité et
précision fréquences : ±10 ppm (typique) ≙ 0,001 %
Stabilité et précision
amplitude : . . . . . . . . . ±3 dBm (typique)
Résolution fréquence : 1 kHz
Résolution largeur
de bande (RBW) : . . . . automatique 2,6 – 600 kHz
Branchements
antenne : . . . . . . . . . . SMA, 50 Ω
antennes 50 Ω calibrées cor-
respondantes livrées
Alimentation : . . . . . . . accumulateur lithium poly-
mère, 860 mAh,
durée fonc. 16 h environ,
rechargeable via port USB
Dimensions : . . . . . . . . 71 × 122 × 25 mm
Poids : . . . . . . . . . . . . 200 g
Tout droit de modification réservé.
CONFIG MENU
Backlight: Max
Contrast: 3
USB Bauds: 500Kbps
Draw Mode: Vectors
Marker: Peak
DSP: Fast
RF Explorer
Spectrum Analyzer
ver01.09 09-ago-12
www.rf-explorer.com
* *
240-960MHZ
[ACTIVE]
15-2700MHZ
64KB RAM Extra found
2MB ROM Extra found
9
RF-EXPLORER/3 Référence numérique 25.4670
ELECTRONICS FOR SPECIALISTS ELECTRONICS FOR SPECIALISTS ELECTRONICS FOR SPECIALISTS ELECTRONICS FOR SPECIALISTS ELECTRONICS FOR SPECIALISTS ELECTRONICS FOR SPECIALISTS ELECTRONICS FOR SPECIALISTS ELECTRONICS FOR SPECIALISTS ELECTRONICS FOR SPECIALISTS ELECTRONICS FOR SPECIALISTS ELECTRONICS FOR SPECIALISTS
®
MONACOR INTERNATIONAL GmbH & Co. KG • Zum Falsch 36 • 28307 Bremen • Germany Copyright©by MONACOR INTERNATIONAL. All rights reserved. A-1409.99.03.10.2014
Page 10

RF Explorer
Spectrum Analyzer
ver01.09 09-ago-12
www.rf-explorer.com
* *
240-960MHZ
[ACTIVE]
15-2700MHZ
64KB RAM Extra found
2MB ROM Extra found
CONFIG MENU
Backlight: Max
Contrast: 3
USB Bauds: 500Kbps
Draw Mode: Vectors
Marker: Peak
DSP: Fast
ATTENUATOR MENU
Calculator: Max
Top dBm: -050
Bottom dBm: -110
Iterations: 004
Offset dB: +000
Units: dBm
FREQUENCY MENU
Center Freq: 435.000
Freq Span: 009.000
Start Freq: 430.500
Stop Freq: 439.500
Module: 240-960M
OPERATIONAL MODE
SPECTRUM Analyzer
RF Generator
WiFi Analyzer
* *
240-960MHZ
[ACTIVE]
15-2700MHZ
64KB RAM Extra found
2MB ROM Extra found
RF Explorer
Spectrum Analyzer
ver01.09 09-ago-12
www.rf-explorer.com
ENTER
MENURETURN
Handheld Spectrum Analyser
USB 2.0
RF Explorer
OFFON
RF 50Ω
1
4
5
6
23
RF-EXPLORER/3 Numero d’ordine 25.4670
ELECTRONICS FOR SPECIALISTS ELECTRONICS FOR SPECIALISTS ELECTRONICS FOR SPECIALISTS ELECTRONICS FOR SPECIALISTS ELECTRONICS FOR SPECIALISTS ELECTRONICS FOR SPECIALISTS ELECTRONICS FOR SPECIALISTS ELECTRONICS FOR SPECIALISTS ELECTRONICS FOR SPECIALISTS ELECTRONICS FOR SPECIALISTS ELECTRONICS FOR SPECIALISTS
I
Analizzatore di spettro RF
Vi preghiamo di leggere attentamente le presenti
istruzioni prima della messa in funzione e di conservarle per un uso futuro.
1 Avvertenze di sicurezza
Lʼapparecchio è conforme a tutte le direttive rilevanti
dellʼUE e pertanto porta la sigla .
Attenzione con radiazione
elettromagnetica alta
rare dei segnali molto piccoli fino a
ciò gli ingressi delle antenne sono molto sensibili e
possono essere danneggiati da una radiazione
troppo alta anche con lʼapparecchio spento. Il
livello massimo dʼingresso di +5 dBm non deve
essere superato. Esso si ottiene p. es. con una
distanza di 1 m ca. da un forno a microonde, oppure
di 10 cm ca. da un cellulare.
che statiche tramite le antenne. Per esempio, afferrare bene il contenitore metallico con una mano
prima di inserire o toccare unʼantenna con lʼaltra
mano.
– Per il deposito o per il trasporto tener lʼapparecchio
– In zone con altissima radiazione RF inserire un
G
G
G
Con il RF-EXPLORER si possono misu-
Si devono evitare assolutamente anche le scari-
in una cassa metallica e / o staccare le antenne.
connettore SMA con resistenza terminale di 50Ω
nelle prese per antenne.
Usare lʼapparecchio solo allʼinterno di locali e proteggerlo dallʼacqua gocciolante e dagli spruzzi dʼacqua, da alta umidità dellʼaria e dal calore (temperatura dʼimpiego ammessa 0 – 40 °C).
Per la pulizia usare solo un panno morbido,
asciutto; non impiegare in nessun caso acqua o
prodotti chimici.
Nel caso dʼuso improprio, dʼimpiego scorretto o di
riparazione non a regola dʼarte dellʼapparecchio,
non si assume nessuna responsabilità per eventuali
danni consequenziali a persone o a cose e non si
assume nessuna garanzia per lʼapparecchio.
®
Se si desidera eliminare lʼapparecchio definitivamente, consegnarlo per lo smaltimento
ad unʼistituzione locale per il riciclaggio.
Non gettare le batterie scariche o difettose nelle
immondizie di casa bensì negli appositi contenitori
3 Modo analizzatore di spettro
Ricaricare la batteria
Dopo lʼaccensione del RF-EXPLORER, sul display si
vedono brevemente uno dopo lʼaltro due menù con
informazioni:
MENU
⬇
(p. es. presso il vostro rivenditore).
MENU
2 Descrizione
Il RF-EXPLORER è stato costruito per un uso sem-
⬇
⬇
plice e intuitivo. Non occorre studiare vaste istruzioni
dʼuso per poter sfruttare le molteplici funzioni sofisti-
-
120 dBm. Per-
cate. La maggiore parte dellʼanalizzatore complesso
di spettro è semplificato dal firmware. Per esempio,
non occorre impostare ogni volta la larghezza di
banda della risoluzione (RBW) quando si sceglie
unʼaltra rappresentazione della larghezza di banda.
Fig. 2 Menù informazioni
Quindi si avvia automaticamente il modo analizzatore
di spettro:
MENU
⬇
Non è nemmeno necessario sapere che cosa è RBW.
Fig. 3 Rappresentazione dello
spettro
Sul display esiste un asse X e un asse Y:
X per la frequenza in MHz e Y per la potenza in dBm.
MENU
⬇
In fig. 3, il campo delle frequenze va da 430,5 MHz
fino a 439,5 MHz e lʼampiezza (gamma dinamica) da
-
50 dBm fino a -110dBm.
Le impostazioni della configurazione come la referenza dellʼampiezza e la rappresentazione della larghezza di banda delle frequenze sono mantenute fra
le misurazioni. Nella rappresentazione si vede un piccolo segno ▽ che indica lʼampiezza di picco nella rap-
MENU
⬇
presentazione della larghezza attuale di banda. Il
primo valore indica la frequenza in questo punto, e il
secondo valore indica lʼampiezza.
Il display indica anche un simbolo per il contatto
USB (nel caso di collegamento con un PC) oppure un
Fig. 1 Collegamento e elementi di comando
1 Antenna per le frequenze 240 – 960 MHz
2 Interruttore on/off
3 Antenna per le frequenze 15 – 2700 MHz
4 Display
5 Tastiera
6 Contatto Mini-USB per ricaricare la batteria ricarica-
bile (portare lʼinterruttore on / off in posizione ON) e
per il comando tramite un PC
simbolo di batteria (se lʼinterruttore on / off è su
ON). Per ricaricare la batteria interna, collegare il
RF-EXPLORER con una presa USB e portare lʼinterruttore on / off in posizione ON. Allora appaiono alternativamente i simboli USB e batteria.
4 Menù
Il comando avviene tramite alcuni menù che si possono chiamare uno dopo lʼaltro con il tasto MENU.
Con il tasto RETURN si può ritornare da ogni menù
alla rappresentazione dello spettro.
MENU
⬇
MENU
Fig. 4 Struttura del menù
MONACOR INTERNATIONAL GmbH & Co. KG • Zum Falsch 36 • 28307 Bremen • Germany Copyright©by MONACOR INTERNATIONAL. All rights reserved. A-1409.99.03.10.2014
10
Page 11

4.1 Menù modo di funzionamento
Fig. 5 Menù modo di funziona-
mento
È scelto il modo di funzionamento analizzatore di
spettro, e con il tasto ENTER si può attivare il modo.
Si vede la rappresentazione dello spettro.
Il modo di funzionamento WiFi-Analysator (Cap. 5)
può essere aperto con il tasto ▼ o ▲ e ENTER, se nel
menù delle frequenze, nella riga inferiore “Module“ è
scelta la gamma di frequenze “15 – 2700M” (Cap. 4.2).
Altrimenti si vede il messaggio “THIS FEATURE IS
NOT AVAILABLE IN THE SELECTED MODE”. Allora,
con il tasto ENTER, ritornare al menù modo di funzionamento.
Il modo “RF Generator” non esiste per questo
modello. Se viene scelto, si vede pure il messaggio
“THIS FEATURE IS NOT …”.
4.2 Menù frequenze
Fig. 6 Menù frequenze
Questo menù, con il quale si possono modificare le
impostazioni delle frequenze, è probabilmente il
menù usato di più.
Se dopo lʼaccensione del RF-EXPLORER e
durante la rappresentazione dello spettro si preme
due volte il tasto MENU, appare il menù delle frequenze. Tuttavia, questa reazione cambia successivamente. Ogni volta che si preme il tasto MENU
durante la rappresentazione dello spettro, appare il
menù chiamato per ultimo. In questo modo si risparmia del tempo dato che non occorre navigare attraverso tutti i menù per giungere al punto precedente.
La gamma di frequenze visualizzata nella rappresentazione dello spettro può essere modificata in due
modi differenti:
1. Center Freq e Freq Span
Questa è lʼimpostazione usuale di un analizzatore
di spettro come la conoscono tutti gli esperti. Sʼimposta la frequenza centrale (Center Freq) della
banda da analizzare e quindi la larghezza di banda
(Freq Span).
2. Start Freq e Stop Freq
Questo metodo molto comodo e offerto solo da
pochi analizzatori di spettro. Sʼimposta la frequenza inferiore (Start Freq) e la frequenza superiore (Stop Freq) della banda da analizzare.
Se sʼimpostano Center Freq e Freq Span, cambiano
in corrispondenza Start e Stop Freq e viceversa. Di
solito sʼimposta Center Freq / Freq Span se la frequenza è conosciuta, e Start / Stop Freq per controllare una determinata gamma.
Per giungere ad unʼopzione, usare i tasti ▲ e ▼.
Quindi premere il tasto ENTER per poter editare lʼopzione. Con il tasto ◀ o ▶ muoversi sul punto da modificare. Con il tasto ▲ o ▼ impostare il valore desiderato e confermare lʼimpostazione con il tasto ENTER
oppure cancellarla con il tasto RETURN.
Nella riga Module scegliere con il tasto ENTER la
gamma di frequenza da analizzare, 240 – 960 MHz o
15 – 2700MHz. Nel campo 240 – 960 MHz si possono
misurare dei segnali molto piccoli fino a
-
120 dBm. Nel
campo 15 – 2700MHz, a causa della vasta gamma di
frequenze e quindi del maggiore rumore di fondo sono
possibili delle misurazioni solo fino a -100 dBm.
Nota: La larghezza di banda può essere impostata fra
0,112MHz e 100 MHz. La frequenza impostabile più bassa e
più alta dipende dalle impostazioni nelle righe del menù “Freq
Span” e “Module”.
Esempio per la modifica della larghezza di banda a
6,5 MHz; la frequenza inferiore e superiore viene
aggiornata automaticamente rispetto a fig. 6:
Fig. 7 Larghezza di banda
6,5 MHz
Con il tasto RETURN chiudere il menù e ritornare alla
rappresentazione dello spettro.
Fig. 8 Rappresentazione dello
spettro con larghezza
di banda 6,5 MHz
La nuova gamma di frequenze è impostata. Come
esempio ulteriore, ripetere la procedura per modificare la larghezza di banda a 2,5 MHz. Per fare ciò
premere nuovamente il tasto MENU: È scelta lʼopzione precedente del menù (Freq Span). Cambiare il
valore a 2,5 MHz e confermare con il tasto ENTER.
Quindi premere il tasto RETURN per ritornare alla
rappresentazione dello spettro.
RETURN ➡
Fig. 9 Larghezza di banda modificata a 2,5 MHz
La nuova gamma di frequenze è impostata, ma la
cosa interessante è che ora si può modificare anche
la frequenza centrale senza dovere chiamare nuovamente il menù frequenze. In questo caso, durante la
rappresentazione dello spettro premere (più volte) il
tasto ◀ o ▶: Ogni volta, la frequenza centrale viene
ridotta o aumentata di
1
⁄8 della larghezza di banda,
cioè, nel caso di larghezza di banda di 2,5 MHz, di
0,3125 MHz con la semplice pressione di un tasto.
Questo metodo diretto è particolarmente utile con una
larghezza stretta di banda.
Durante la rappresentazione dello spettro, i valori
misurati e la curva delle misurazioni possono essere
fissati premendo il tasto ENTER. Così è facilitata la
lettura nel caso di valori che cambiano velocemente.
Di fianco allʻasse Y lampeggia la segnalazione HLD.
Per ritornare ai valori attuali, premere nuovamente il
tasto ENTER.
Sullʼasse X sono indicate le frequenze del settore
scan. In alternativa si può indicare la larghezza di
banda (SP), la frequenza centrale (C) e la banda passante di risoluzione (RBW). Per cambiare, premere il
tasto RETURN. Se a questo punto si preme (ripetutamente) il tasto ◀ o ▶, non cambia la frequenza centrale bensì la larghezza di banda. In questo modo è
possibile variare velocemente anche la larghezza di
banda senza dover aprire il menù.
4.3 Menù attenuazione
Con questo menù è possibile modificare sullʼasse Y la
rappresentazione del livello. Per chiamare il menù,
premere il tasto MENU tante volte finché sul display
appare il menù.
Fig. 10 Menù attenuazione
Questo menù ha alcune opzioni interessanti:
Calculator: Offre cinque modi per la visualizzazione
del livello. Per cambiare il modo premere il tasto
ENTER.
Max: Si utilizzano i valori di picco delle ultime scansioni della banda di frequenze (vedi opzioni del
menù in basso), in questo caso i valori di picco delle
ultime 4 scansioni. Si tratta del modo standard con
il quale si possono scoprire dei segnali RF che
cambiano velocemente oppure con il quale, in caso
difficili, si può stabilire lʼoccupazione dei cavi.
(Nella rappresentazione dello spettro, il modo
scelto è indicato a sinistra dellʻasse Y, in questo
modo con MAx.)
Average: Viene calcolato la media aritmetica
durante le ultime scansioni. Questo modo è particolarmente adatto per stabilire la media del rumore
di base e per visualizzare i segnali con frequenza
e ampiezza costante (continuous wave).
(Nella rappresentazione dello spettro, questo
modo è indicato con AVG.)
Overwrt: I valori più alti del livello sovrascrivono i
valori più bassi finché non si preme il tasto
RETURN oppure finché la frequenza centrale non
viene modificata con il tasto ◀ o ▶.
(Questo modo è indicato con OWR.)
Max Hold: Rappresentazione contemporanea dei
livelli attuali e dei livelli massimi.
(Questo modo è indicato con MxH.)
Normal: Nessun calcolo, visualizzazione attuale
dei livelli.
(Questo modo è indicato con nOR.)
Top/ Bottom dBm: Qui sʼimposta la gamma delle
misurazioni del livello, “Top dBm” per il valore di
misura superiore dellʼasse Y e “Bottom dBm” per il
valore inferiore. La differenza fra i due valori non può
essere inferiore a 10 dBm.
Iterations: Indica il numero delle scansioni per calcolare i valori di picco (Calculator: Max) o i valori medi
(Calculator: Average), impostabili fra 1 e 28. Più è alto
il valore delle scansioni, più esatto è il calcolo, ma più
lenta è la rappresentazione.
Offset dB: Sposta il livello misurato secondo il valore
impostato (±100 dB).
Esempio: In un punto della sala, con una frequenza
determinata si misura un livello di
-
76 dB. Con un offset di +76 dB, il RF-EXPLORER indicherà 0dB. Per le
misure in altri punti della sala, la deviazione del livello
rispetto al punto di riferimento sarà indicata in dB.
ATTENUATOR MENU
Calculator: Max
Top dBm: -050
Bottom dBm: -110
Iterations: 004
Offset dB: +000
Units: dBm
FREQUENCY MENU
Center Freq: 435.000
Freq Span: 002.500
Low Freq: 433.750
High Freq: 436.250
Module: 240-960M
FREQUENCY MENU
Center Freq: 435.000
Freq Span: 006.500
Start Freq: 431.750
Stop Freq: 438.250
Module: 240-960M
FREQUENCY MENU
Center Freq: 435.000
Freq Span: 009.000
Start Freq: 430.500
Stop Freq: 439.500
Module: 240-960M
OPERATIONAL MODE
SPECTRUM Analyzer
RF Generator
WiFi Analyzer
11
RF-EXPLORER/3 Numero d’ordine 25.4670
ELECTRONICS FOR SPECIALISTS ELECTRONICS FOR SPECIALISTS ELECTRONICS FOR SPECIALISTS ELECTRONICS FOR SPECIALISTS ELECTRONICS FOR SPECIALISTS ELECTRONICS FOR SPECIALISTS ELECTRONICS FOR SPECIALISTS ELECTRONICS FOR SPECIALISTS ELECTRONICS FOR SPECIALISTS ELECTRONICS FOR SPECIALISTS ELECTRONICS FOR SPECIALISTS
®
MONACOR INTERNATIONAL GmbH & Co. KG • Zum Falsch 36 • 28307 Bremen • Germany Copyright©by MONACOR INTERNATIONAL. All rights reserved. A-1409.99.03.10.2014
Page 12

CONFIG MENU
Backlight: Max
Contrast: 3
USB Bauds: 500Kbps
Draw Mode: Vectors
Marker: Peak
DSP: Fast
RF Explorer
Spectrum Analyzer
ver01.09 09-ago-12
www.rf-explorer.com
* *
240-960MHZ
[ACTIVE]
15-2700MHZ
64KB RAM Extra found
2MB ROM Extra found
RF-EXPLORER/3 Numero d’ordine 25.4670
ELECTRONICS FOR SPECIALISTS ELECTRONICS FOR SPECIALISTS ELECTRONICS FOR SPECIALISTS ELECTRONICS FOR SPECIALISTS ELECTRONICS FOR SPECIALISTS ELECTRONICS FOR SPECIALISTS ELECTRONICS FOR SPECIALISTS ELECTRONICS FOR SPECIALISTS ELECTRONICS FOR SPECIALISTS ELECTRONICS FOR SPECIALISTS ELECTRONICS FOR SPECIALISTS
Units: Con il tasto ENTER, per lʼasse Y si può scegliere lʼunità dBm o dBμV. Nella rappresentazione
dello spettro, lʼunità scelta è indicata con “dBm” o
“dBV” a sinistra dellʼasse Y.
Per un test semplice portare il valore dBm superiore a
-
70 dBm. Quindi premere il tasto RETURN per ritornare alla rappresentazione dello spettro. La gamma
del livello visualizzata ora è più piccola e il segnale sul
display di conseguenza è più grande, specialmente il
rumore di base.
➡
Fig. 11 Valore dBm superiore ridotto di 20 dB
Dato che il valore dBm superiore viene modificato
molto spesso, durante la rappresentazione dello spettro è possibile aumentarlo di 5 dBm con il tasto ▲ e
ridurlo di 5 dBm con il tasto ▼. Questi shortcut,
insieme ai tasti ◀ e ▶ per modificare la frequenza
centrale sono molto utili per le impostazioni della configurazione in tempo reale, visto che non si deve chiamare nessun menù.
4.4 Menù configurazione
Nel RF-EXPLORER esistono alcune possibilità di
configurazione con le quali è possibile impostare
lʻapparecchio secondo desiderio o secondo lʼapplicazione. Premere il tasto ENTER tante volte finché sul
display appare il menù configurazione.
Fig. 12 Menù configurazione
Le opzioni di questo menù si possono scegliere con i
tasti ▲ e ▼ e si impostano con una pressione ripetuta
del tasto ENTER.
Backlight: Retroilluminazione del display: OFF, Low,
Med, High, Max. Il RF-EXPLORER offre allʼinterno
come allʼesterno una buona visibilità anche con la
luce diretta del sole. Con una retroilluminazione
ridotta si risparmia la batteria ricaricabile.
Contrast: Sono disponibili 10 livelli di contrasto per il
display.
®
USB Bauds: La preimpostazione è di 500 kbit / s,
valore da consigliare. Se ci sono dei problemi durante
la trasmissione dei dati verso il PC, cosa che succede
raramente, passare alla velocità minore di 2,4 kBit / s.
Tuttavia ciò non è consigliabile perché il collegamento
diventa molto lento. La velocità di trasmissione dati
del RF-EXPLORERs e del PC devono corrispondere
per ottenere un collegamento corretto.
Draw Mode: Con lʼimpostazione “Vectors” viene
visualizzata un curva del livello per tutta la gamma
scansionata delle frequenze, con lʼimpostazione “Fill”,
le colonne singole indicano il livello.
Marker: Per posizionare un segno ▽ per leggere la
frequenza e il livello in questo punto
None: nessun segno
Peak: posizionamento automatico del segno per la
frequenza con il livello maggiore
Manual: Nella gamma delle scansioni, il segno
può essere spostato con i tasti ◀ e ▶.
DSP: Il processore digitale dei segnali del RFEXPLORER è equipaggiato con un sottoprogramma
che filtra i segnali non desiderati, che si creano
durante lʼelaborazione dei segnali (fra gli altri, frequenze dʼimmagine). Con un vasto filtraggio, in
seguito ai molti calcoli, la misurazione diventa più
lenta e brevi segnali utili (p. es. segnali WiFi) non possono essere riconosciuti.
Per misurare brevi segnali utili, si dovrebbe scegliere lʼimpostazione Fast (indicata con FST nella rappresentazione dello spettro) e per delle misure precise e con poche interferenze lʻimpostazione Filter
(indicazione FIR).
4.5 Menù delle informazioni
I due menù delle informazioni che sono visualizzati
brevemente, uno dopo lʼaltro, dopo lʼaccensione, possono essere aperti anche con una pressione ripetuta
(impostabile nel menu frequenza, riga “Module”).
Nella zona inferiore è indicata la relativa dimensione
della memoria.
Il secondo menù delle informazioni indica nella
terza riga la versione del firmware:
Fig. 14 Info Versione del firmware
5 Modo analizzatore WiFi
Questo modo serve per visualizzare i 13 canali WLAN
nella gamma 2,4 GHz. Per potere attivare il modo, nel
menù frequenze, nella riga “Module” deve esser scelta
la gamma di frequenze “15 – 2700M” (Cap. 4.2).
Per attivare il modo, premere il tasto MENU tante
volte finché appare il menù OPERATIONAL MODE
(fig. 5). Con il tasto ▼ o ▲ scegliere la riga “WiFi Analyzer”. Quindi premere il tasto ENTER.
Fig. 15 Modo analizzatore WiFi
6 Software per il PC
Alla nostra homepage trovate un software per Windows XP/ Vista / Win7/ Win8, con i quale comandare il
RF-EXPLORER dal vostro computer. Nello stesso
tempo ricevete anche un software per eventuali
aggiornamenti del firmware (RF Explorer Firmware
Update Loader).
http: //www.monacor.de/en/support /software-updates /
(Da notare che deve essere installato “Microsoft ®.NET
Framework v4Client Profile”.)
7 Dati tecnici
Display: . . . . . . . . . . . . a LCD con alto contrasto,
Campo di misura: . . . . 15 – 2700 MHz
Risoluzione
dellʼampiezza: . . . . . . . 0,5 dBm
Gamma dinamica: . . .
Potenza max. assoluta
allʼingresso
antenna sinistra
(240 – 960 MHz): . . . +5 dBm
antenna destra
(15 – 2700 MHz): . . . +30 dBm
Livello medi di rumore:
Stabilità e precisione
della frequenza: . . . . . ±10 ppm (tipico) ≙ 0,001 %
Stabilità e precisione
dellʼampiezza: . . . . . . . ±3 dBm (tipico)
Risoluzione della
frequenza: . . . . . . . . . 1 kHz
Larghezza di banda della
risoluzione di (RBW): . automatico 2,6 – 600 kHz
Contatti antenne: . . . . SMA, 50 Ω
Alimentazione: . . . . . . batteria ricaricabile ai poli-
Dimensioni: . . . . . . . . 71 × 122 × 25 mm
Peso: . . . . . . . . . . . . . 200 g
con retroilluminazione,
128 × 64 pixel
-
120 dBm a 0 dBm
-
115dBm (tipico)
antenne adatte calibrate di
50 Ω in dotazione
meri di litio, 860 mAh, durata
ca. 16 h, ricaricabile tramite
contatto USB
del tasto MENU:
Windows è un marchio registrato della Microsoft Corporation negli USA e in altri
Fig. 13 Info collegamento
antenne, gamma delle
scansioni, memoria
Nella zona superiore si vede a quale presa si collega
lʼantenna per la gamma 240 – 960 MHz e a quale
presa lʼantenna per la gamma 15 – 2700 MHz. Inoltre
si vede quale gamma è stata scelta per le scansioni
paesi.
Licenza
Il firmware contenuto nel RF-EXPLORER è protetto
dai diritti dʼautore © tramite Ariel Rocholl, 2010– 2011.
RF Explorer PC Client è un software libero secondo
GPL v3, perciò lo potete modificare, inoltrare a altri e
usare secondo le condizioni GPL.
Con riserva di modifiche tecniche.
MONACOR INTERNATIONAL GmbH & Co. KG • Zum Falsch 36 • 28307 Bremen • Germany Copyright©by MONACOR INTERNATIONAL. All rights reserved. A-1409.99.03.10.2014
12
 Loading...