

Page 1
SpectraMax®Paradigm®
Multi-Mode Detection Platform
User Guide
5014038 E
May 2015
Page 2

SpectraMax Paradigm Multi-Mode Detection Platform User Guide
This document is provided to customers who have purchased Molecular Devices equipment, software,
reagents, and consumables to use in the operation of such Molecular Devices equipment, software,
reagents, and consumables. This document is copyright protected and any reproduction of this
document, in whole or any part, is strictly prohibited, except as Molecular Devices may authorize in
writing.
Software that may be described in this document is furnished under a non-transferrable license. It is
against the law to copy, modify, or distribute the software on any medium, except as specifically
allowed in the license agreement. Furthermore, the license agreement may prohibit the software
from being disassembled, reverse engineered, or decompiled for any purpose.
Portions of this document may make reference to other manufacturers and/or their products, which
may contain parts whose names are registered as trademarks and/or function as trademarks of their
respective owners. Any such usage is intended only to designate those manufacturers’ products as
supplied by Molecular Devices for incorporation into its equipment and does not imply any right and/or
license to use or permit others to use such manufacturers’ and/or their product names as trademarks.
Each product is shipped with documentation stating specifications and other technical information.
Molecular Devices products are warranted to meet the stated specifications. Molecular Devices makes
no other warranties or representations express or implied, including but not limited to, the fitness of
this product for any particular purpose and assumes no responsibility or contingent liability, including
indirect or consequential damages, for any use to which the purchaser may put the equipment
described herein, or for any adverse circumstances arising therefrom. The sole obligation of Molecular
Devices and the customer's sole remedy are limited to repair or replacement of the product in the
event that the product fails to do as warranted.
For research use only. Not for use in diagnostic procedures.
The trademarks mentioned herein are the property of Molecular Devices, LLC or their respective owners. These trademarks may not
be used in any type of promotion or advertising without the prior written permission of Molecular Devices, LLC.
Patents: http://www.moleculardevices.com/productpatents
Product manufactured by Molecular Devices, LLC.
1311 Orleans Drive, Sunnyvale, California, United States of America 94089.
Molecular Devices, LLC is ISO 9001 registered.
©2015 Molecular Devices, LLC.
All rights reserved.
2 5014038 E
Page 3

Contents
Safety Information 7
Warnings, Cautions, Notes, and Tips 7
Symbols on Instrument Labels 8
Before Operating the Instrument 9
Electrical Safety 9
Laser Safety 10
Chemical and Biological Safety 11
Moving Parts Safety 12
Cleaning and Maintenance Safety 13
Chapter 1: Introduction 15
Applications 16
Dual Photomultiplier Tubes 16
Microplate Controls 16
Environmental Controls 18
Chapter 2: Read Modes and Read Types 19
Supported Read Types 19
Absorbance Read Mode 23
Fluorescence Intensity Read Mode 28
Luminescence Read Mode 33
Time-Resolved Fluorescence Read Mode 38
FRET Read Mode 44
HTRF Read Mode 45
Fluorescence Polarization Read Mode 49
AlphaScreen Read Mode 53
Western Blot TRF Read Mode 57
Chapter 3: Unpacking and Setting Up the Instrument 61
Contents of the Package 62
Unpacking the Instrument 63
Removing the Transport Locks 67
Connecting the Instrument Cables 72
Unlocking the SpectraMaxParadigm Instrument 75
5014038 E 3
Page 4

SpectraMax Paradigm Multi-Mode Detection Platform User Guide
Connecting and Disconnecting a Gas Supply 76
Chapter 4: Using the Instrument 79
Front Panel Controls and Indicators 80
Turning the Instrument On and Off 82
Using Detection Cartridges 84
Loading and Unloading Microplates 90
Chapter 5: Available Detection Cartridges 93
Absorbance Detection Cartridge 94
Tunable Wavelength (TUNE) Detection Cartridge 97
Multi-Mode (MULTI) Detection Cartridge 102
AlphaScreen Detection Cartridges 107
Cisbio HTRF Detection Cartridge 110
Time Resolved Fluorescence (TRF) Detection Cartridge 113
Fluorescence Intensity (FI) Detection Cartridges 116
Fluorescence Intensity (FI) GeneBLAzer Detection Cartridge 119
Fluorescence Intensity Dual Label (FI-DL) (MultiTox-Fluor) Detection Cartridge 122
Fluorescence Polarization (FP) Detection Cartridges 125
Glow Luminescence (LUM) Detection Cartridges 128
Dual Color Luminescence (LUM) (BRET2) Detection Cartridge 131
Dual Color Luminescence (LUM) (Chroma-Glo) Detection Cartridge 136
ScanLater Western Blot (WB) Detection Cartridge 142
Chapter 6: Maintenance and Troubleshooting 147
Doing Preventive Maintenance 148
Cleaning the Instrument 149
Replacing Fuses 149
Moving the Instrument 152
Packing the Instrument for Storage or Service 153
Troubleshooting 164
Obtaining Support 165
Appendix A: Instrument Specifications 167
Computer System Specifications 167
Physical Specifications 168
4 5014038 E
Page 5

Appendix B: System Diagrams and Dimensions 171
Appendix C: Electromagnetic Compatibility 173
Glossary 175
Index 183
5014038 E 5
Page 6

SpectraMax Paradigm Multi-Mode Detection Platform User Guide
6 5014038 E
Page 7
Safety Information
The safety information section provides information on the safe use of the instrument,
including the use of user-attention statements in this guide, a key to understanding the
safety labels on the instrument, precautions to follow before operating the instrument, and
precautions to follow while operating the instrument.
Please read and observe all warnings, cautions, and instructions. Remember, the most
important key to safety is to operate the instrument with care.
WARNING! If the instrument is used in a manner not specified by Molecular
Devices, the protection provided by the equipment might be impaired.
Warnings, Cautions, Notes, and Tips
All warning symbols in the user guide are framed within a yellow triangle. An exclamation
mark is used for most warnings. Other symbols can warn of other types of hazards such as
biohazard, electrical, or laser safety warnings as are described in the text of the warning.
When warnings and cautions are displayed in this guide, be careful to follow the specific
safety information related to them.
The following user-attention statements can be displayed in the text of Molecular Devices
user documentation. Each statement implies a particular level of observation or
recommended procedure as described:
WARNING! A warning indicates a situation or operation that could cause
personal injury if precautions are not followed.
CAUTION! A caution indicates a situation or operation that could cause damage to
the instrument or loss of data if correct procedures are not followed.
Note: A note calls attention to significant information.
Tip: A tip provides useful information or a shortcut, but is not essential to the
completion of a procedure.
5014038 E 7
Page 8
SpectraMax Paradigm Multi-Mode Detection Platform User Guide
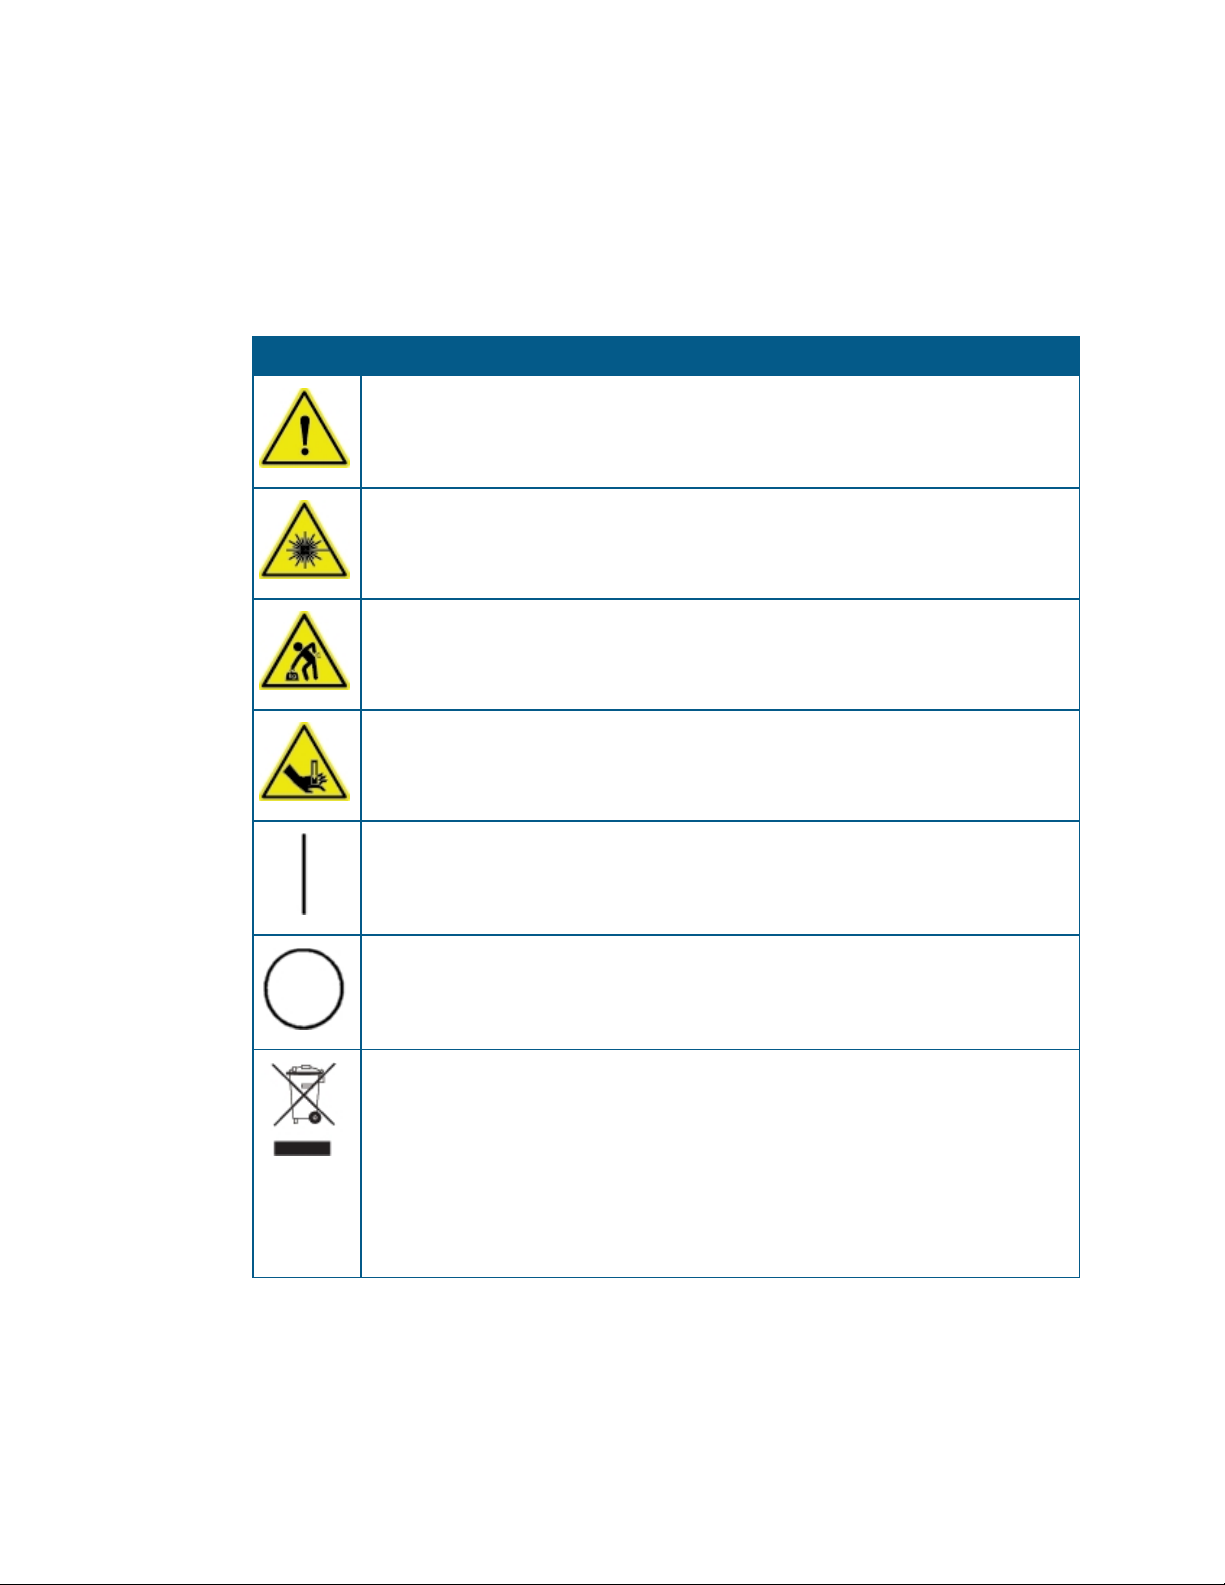
Symbols on Instrument Labels
Each safety label located on the instrument contains an alert symbol that indicates the type
of potential safety hazard related to the label. The following table lists the alert symbols that
can be found on Molecular Devices instruments.
Table S-1: Instrument Label Alert Symbols
Symbol Indication
This symbol indicates that the product documentation needs to be consulted.
This symbol indicates a potential laser hazard. The instrument is rated a Class 1 Laser
Product because it can house one or more laser modules, and the laser light cannot be
accessed. See Laser Safety on page 10.
This symbol indicates a potential lifting hazard. To prevent injury, use a minimum of
two people to lift the instrument. For information about the weight of the instrument,
see Physical Specifications on page 168.
This symbol indicates a potential pinch hazard.
This symbol on the power switch indicates power on. See Turning the Instrument On
and Off on page 82.
This symbol on the power switch indicates power off. See Turning the Instrument On
and Off on page 82.
This symbol on the product is required in accordance with the Waste Electrical and
Electronic Equipment (WEEE) Directive of the European Union. It indicates that you
must not discard this electrical or electronic product or its components in domestic
household waste or in the municipal waste collection system.
For products under the requirement of the WEEE directive, please contact your
dealer or local Molecular Devices office for the procedures to facilitate the proper
collection, treatment, recovery, recycling, and safe disposal of the device.
8 5014038 E
Page 9

Before Operating the Instrument
Make sure that everyone involved with the operation of the instrument has:
Received instruction in general safety practices for laboratories.
Received instruction in specific safety practices for the instrument.
Read and understood all Safety Data Sheets (SDS) for all materials being used.
Electrical Safety
To prevent electrically related injuries and property damage, properly inspect all electrical
equipment before use and immediately report all electrical deficiencies. Contact Molecular
Devices technical support for servicing of equipment that requires the removal of covers or
panels.
WARNING! HIGH VOLTAGE. Within the instrument is the potential of an
electrical shock hazard existing from a high voltage source. All safety instructions
should be read and understood before proceeding with the installation,
maintenance, and servicing of all modules.
Safety Information
Do not remove the instrument covers. To prevent electrical shock, use the supplied power
cords only and connect to a properly grounded wall outlet. Use only multi-plug power strips
that are provided by the manufacturer.
To protect against fire hazard, replace the fuses only with the same type and rating as the
original factory-installed fuses. See Replacing Fuses on page 149.
To ensure sufficient ventilation and provide access for disconnecting power from the
instrument, maintain a 20cm to 30cm (7.9in. to 11.8in.) gap between the rear of the
instrument and the wall.
Molecular Devices recommends turning the power off when the instrument is not in use.
5014038 E 9
Page 10
SpectraMax Paradigm Multi-Mode Detection Platform User Guide
Laser Safety
WARNING! LASER LIGHT. This symbol indicates that a potential hazard to
personal safety exists from a laser source. When this symbol is displayed in this
guide, be careful to follow to the specific safety information related to the
symbol.
The SpectraMaxParadigm Multi-Mode Detection Platform is rated a Class 1 Laser Product
because it houses one or more laser modules, and the laser light cannot be accessed.
The embedded laser module inside the SpectraMaxParadigm Multi-Mode Detection
Platform basic instrument is used for the plate height detection and has the following
specifications.
Table S-2: Embedded Laser Module Specifications
Item Description
Lasertype Diode laser
Wavelength 650nm
Maximumoutputpower 0.9mW, cw
Laser class Class2 (IEC60825-1, ed. 2.0:2007)
Fan angle 58°
The SpectraMaxParadigm Multi-Mode Detection Platform is equipped with a redundant
laser safety system. A hardware interlock prevents the laser module from turning on, unless
the microplate chamber flap is closed and the front cover of the detection cartridge drawers
are in place. The user or the service engineer is not exposed to radiation from the laser
module during operation, maintenance, or service. The closed microplate chamber provides
the protective housing.
WARNING! LASER LIGHT. The instrument must be operated only when all the
doors and panels of the instrument are in place and closed.
Laser or Laser Diodes in Detection Cartridges
Some detection cartridges can have a laser or laser diode up to Laser Class 4 inside the
detection cartridge. The lasers are non-operational until after the detection cartridges are
properly installed in the SpectraMaxParadigm Multi-Mode Detection Platform.
10 5014038 E
Page 11
Chemical and Biological Safety
Normal operation of the instrument can involve the use of materials that are toxic,
flammable, or otherwise biologically harmful. When using such materials, observe the
following precautions:
Handle infectious samples based on good laboratory procedures and methods to
prevent the spread of disease.
Observe all cautionary information printed on the original containers of solutions before
their use.
Dispose of all waste solutions based on the waste disposal procedures of your facility.
Operate the instrument in accordance with the instructions outlined in this guide, and
take all the necessary precautions when using pathological, toxic, or radioactive
materials.
Splashing of liquids can occur. Therefore, take applicable safety precautions, such as
using safety glasses and wearing protective clothing, when working with potentially
hazardous liquids.
Use a correctly contained environment when using hazardous materials.
Use a compressed gas supply in a well-ventilated area. The instrument is not air-tight,
and so gas can escape into the atmosphere surrounding the instrument. When using
potentially toxic gas, always observe the applicable cautionary procedures as defined by
your safety officer to maintain a safe working environment.
Observe the applicable cautionary procedures as defined by your safety officer when
using flammable solvents in or near a powered-up instrument.
Observe the applicable cautionary procedures as defined by your safety officer when
using toxic, pathological, or radioactive materials.
Safety Information
WARNING! Never use the instrument in an environment where potentially
damaging liquids or gases are present.
CAUTION! Use of organic solvents (such as dichloromethane) can cause harm to the
optics in the instrument. Extreme caution is recommended when using organic
solvents. Always use a plate lid and do not place a plate containing these materials in
the microplate chamber for prolonged periods of time. Damage caused by the use of
incompatible or aggressive solvents is NOT covered by the instrument warranty.
5014038 E 11
Page 12
SpectraMax Paradigm Multi-Mode Detection Platform User Guide
Moving Parts Safety
To prevent injury due to moving parts, observe the following:
Never try to exchange labware, reagents, or tools while the instrument is operating.
Never try to physically restrict the moving components of the instrument.
Keep the instrument work area clear to prevent obstruction of the movement. Provide
clearance in the front of the instrument of 18cm (7.1in.) for the microplate drawer and
15cm (5.9in.) for the detection cartridge drawer.
The instrument has adjustable optics to define the read height, or z-height. In a top
read, the read height is the gap between the lens and the top of the microplate, or the
top of the lid if the microplate is lidded.
CAUTION!To prevent damage to the instrument, the height of the microplate must
not exceed 25mm, including the lid if the microplate is lidded.
Transport locks are placed on the detection cartridge drawers and the microplate drawer to
protect the instrument from damage during shipping. The transport locks must be removed
before powering on the instrument.
To move the microplate drawer or the detection cartridge drawers into or out of the
instrument, always use the buttons on the keypad or the controls in the software. See Using
Detection Cartridges on page 84 or Loading and Unloading Microplates on page 90.
CAUTION! To prevent damage to the installed detection cartridges and the
instrument, do not manually slide the detection cartridge drawer in or out when the
instrument is powered on or when one or more detection cartridges are installed in
the drawer.
Note: Observe all warnings and cautions listed for all external devices attached to or in
use during the operation of the instrument. See the applicable user guide for the
operating and safety procedures of that device.
12 5014038 E
Page 13

Cleaning and Maintenance Safety
Observe the cleaning procedures outlined in this guide for the instrument.
Do the following before cleaning equipment that has been exposed to hazardous material:
Contact the applicable Chemical and Biological Safety personnel.
Review the Chemical and Biological Safety information contained in this guide.
Do only the maintenance described in this guide. Maintenance procedures other than those
specified in this guide can be done only by Molecular Devices qualified personnel. See
Obtaining Support on page 165.
WARNING! BIOHAZARD. It is your responsibility to decontaminate
components of the instrument before requesting service by a service engineer or
returning parts to Molecular Devices for repair. Molecular Devices will not accept
items that have not been decontaminated where it is applicable to do so. If parts
are returned, they must be enclosed in a sealed plastic bag stating that the
contents are safe to handle and are not contaminated.
Safety Information
For approved cleaning and maintenance procedures, see Maintenance and Troubleshooting
on page 147.
5014038 E 13
Page 14

SpectraMax Paradigm Multi-Mode Detection Platform User Guide
14 5014038 E
Page 15

Chapter 1: Introduction
The SpectraMax®Paradigm® Multi-Mode Detection Platform from Molecular Devices® is a
user-upgradeable, multi-mode microplate reader capable of performing absorbance,
fluorescence, time-resolved fluorescence (including HTRF), fluorescence polarization,
AlphaScreen®, AlphaLISA®, and luminescence measurements. An external computer running
the SoftMax® Pro provides integrated instrument control, data display, and statistical data
analysis.
Detection cartridge modularity lets you configure the system to meet your current needs,
while providing flexibility to address future applications. Up to six detection cartridges can be
installed in each of the two detection cartridge drawers. The software detects the installed
cartridge configuration and does all measurement types supported by the detection
cartridges. For information about detection cartridges, see Available Detection Cartridges on
page 93.
Depending on the application, the instrument can read 6, 12, 24, 48, 96, and 384-well
microplates. For micro-volume measurements, the instrument supports SpectraDrop 24-well
Micro-Volume Microplates and SpectraDrop 64-well Micro-Volume Microplates. The
instrument is capable of reading 1536-well microplates when used with specific detection
cartridges. See Selecting Suitable Microplate Types on page 91.
1
CAUTION! To prevent damage to the instrument, the height of the microplate must
not exceed 25mm, including the lid if the microplate is lidded.
The SoftMax Pro Software can collect data from one or more microplates and store it in a
single data file, using the same or different instrument settings for different microplates.
Assays requiring a read in two or more read modes or read types can be combined in a single
experiment and run with a single command in the software, by defining separate microplate
reads and enabling Auto Read. For information on the acquisition and analysis capabilities of
the software, see the SoftMax Pro Software application help or user guide.
The SpectraMaxParadigm Instrument can be integrated with an automated laboratory
system. When integrated, the detection protocols are accessed by the robotic controller
software.
5014038 E 15
Page 16

SpectraMax Paradigm Multi-Mode Detection Platform User Guide
Applications
The high sensitivity and flexibility of the SpectraMaxParadigm Instrument make it useful for
applications in the fields of biochemistry, cell biology, immunology, molecular biology, and
microbiology.
Typical applications include ELISA, nucleic acid, protein, enzymatic type homogeneous and
heterogeneous assays, microbial growth, endotoxin testing, and pipettor calibration.
Application notes with specific application protocol suggestions can be found in the
Information Center and the Knowledge Base on the Molecular Devices web site at
www.moleculardevices.com.
Dual Photomultiplier Tubes
The SpectraMaxParadigm Instrument is equipped with two photo multiplier tubes (PMTs).
The dual PMTs let the instrument measure two separate emissions successively or
simultaneously, resulting in faster read times and increased throughput.
Microplate Controls
Microplate controls include Shake and On-the-Fly Detection. The instrument can also detect
the height and position of a microplate in the microplate drawer.
Shake
The Shake feature of the instrument permits the contents of the wells in a microplate to be
mixed automatically inside the microplate chamber before each read cycle, making it
possible to do kinetic analysis of solid-phase, enzyme-mediated reactions.
Shake must be selected before you start a read. The process related to the Shake setting
depends on the selected read mode:
In endpoint reads, Shake shakes the plate for a definable number of seconds and then
reads at all selected wavelengths.
In kinetic reads, Shake can shake the plate for a definable number of seconds before the
initial reading, and for a definable number of seconds before each subsequent reading.
The following Shake settings are available for the SpectraMaxi3x Instrument:
Intensity: Low, Medium, or High. The actual shake speed is based on the microplate
format.
Direction: Linear or Orbital patterns.
Duration: Length of time in seconds (1 to 60).
Molecular Devices strongly recommends the use of Shake for ELISAs and other solid-phase,
enzyme-mediated reactions to enhance accuracy.
16 5014038 E
Page 17
Chapter 1: Introduction
On-the-Fly Detection
With some detection cartridges, the instrument can read microplates as the microplate
drawer is moving within the chamber instead of pausing the microplate drawer to read each
well. This results in shorter read times.
There are two On-the-Fly Detection modes:
Selecting Performance results in a faster read time than not using On-the-Fly Detection,
but not as fast as the Speed mode. Performance provides considerably better results
than Speed for demanding assays.
Selecting Speed results in the fastest possible read time per microplate. However, there
is a trade-off between the data quality and read speed because each well is sampled for
shorter integration times.
The following table compares the read time for different plate types in each of the on-the-fly
detection modes. These read times do not include the time needed for the microplate
drawer to move the plate into the instrument and start the read, and then move the plate
out of the instrument, which can add approximately 25 seconds to the overall read time.
Table 1-1: Plate Read Times for On-the-Fly Detection (±5seconds)
Mode 96-well 384-well 1536-well
Optimized for speed 12seconds 25seconds 50seconds
Optimized for performance 20seconds 40seconds 80seconds
Microplate Height Sensing
Microplates up to a height of 25mm can be placed in the microplate drawer of the
instrument. A sensor detects the height of a microplate positioned in the microplate drawer
and confirms that the height is consistent with the selected microplate type and that it is
positioned properly on the microplate drawer.
CAUTION! To prevent damage to the instrument, the height of the microplate must
not exceed 25mm, including the lid if the microplate is lidded.
5014038 E 17
Page 18

SpectraMax Paradigm Multi-Mode Detection Platform User Guide
Environmental Controls
The environmental controls of the instrument include temperature regulation and a gas
inlet.
Temperature Regulation
The temperature inside the microplate chamber can be maintained at ambient plus 4°C ± 1°C
up to 45°C. When using a detection cartridge that has a flash lamp, temperature can be
maintained at ambient plus 5°C ± 1°C up to 45°C. You can set and control the temperature by
using the software. See the SoftMax Pro Software application help or user guide.
Note:The temperature sensors detect the temperature of the air inside the chamber,
not the temperature of the samples in the microplate. If you use the instrument to
warm the samples, Molecular Devices recommends that you use a seal or lid on the
microplate to prevent evaporation of the sample. Using a seal or lid also helps to
maintain uniform temperature. Letting the prepared sample equilibrate inside the
microplate chamber can take an hour or more. You can speed up equilibration by prewarming the sample and the assay reagents to the desired temperature before
placing the microplate in the chamber. Validate the data quality to determine whether
the seal or lid can stay on the microplate for the read.
Gas Inlet
The gas inlet permits the partial pressure of CO2, nitrogen, or other gas inside the microplate
chamber to be applied. This is useful when reading a cell-based assay in which the CO
environment needs to be controlled to keep cell cultures alive. The gas supply is not
controlled or monitored by the instrument or software. See Connecting and Disconnecting a
Gas Supply on page 76.
Note: The combination of temperature and CO2environment controls does not create
a true CO2incubator environment in the instrument.
Use a compressed gas supply in a well-ventilated area. The instrument is not air-tight, and so
gas can escape into the atmosphere surrounding the instrument. When using potentially
toxic gas, always observe the applicable cautionary procedures as defined by your safety
officer to maintain a safe working environment.
2
18 5014038 E
Page 19

Chapter 2: Read Modes and Read Types
The detection capabilities of the SpectraMaxParadigm Multi-Mode Detection Platform are
determined by the installed detection cartridges. Up to six detection cartridges can be
installed in each of the two detection cartridge drawers. For information about detection
cartridges, see Available Detection Cartridges on page 93.
The software detects the installed cartridge configuration and does all measurement types
supported by the detection cartridges. Use the SoftMax Pro Software to define the
parameters for the read mode and read type of your assay. See the SoftMax Pro Software
application help or user guide.
Application notes with specific application protocol suggestions can be found in the
Information Center and the Knowledge Base on the Molecular Devices web site at
www.moleculardevices.com.
For more information on the supported read modes, see the following topics:
Absorbance Read Mode on page 23
Fluorescence Intensity Read Mode on page 28
Luminescence Read Mode on page 33
Time-Resolved Fluorescence Read Mode on page 38
HTRF Read Mode on page 45
FRET Read Mode on page 44
Fluorescence Polarization Read Mode on page 49
AlphaScreen Read Mode on page 53
Western Blot TRF Read Mode on page 57
2
Supported Read Types
For most read modes, endpoint, kinetic, multi-point well-scan, and spectrum microplate
applications can be set up and run with the SoftMax Pro Software.
For more information on the supported read types, see the following topics:
Endpoint Read Type on page 20
Kinetic Read Type on page 20
Well Scan Read Type on page 21
Spectrum Read Type on page 21
Membrane Read Type on page 22
5014038 E 19
Page 20

SpectraMax Paradigm Multi-Mode Detection Platform User Guide
Endpoint Read Type
In an Endpoint read, a reading of each microplate well is taken in the center of each well, at a
single wavelength or at multiple wavelengths. Depending on the read mode, raw data values
are reported as optical density (OD), %Transmittance (%T), relative fluorescence units (RFU),
or relative luminescence units (RLU).
Kinetic Read Type
In a Kinetic read, the instrument collects data over time with multiple readings taken in the
center of each well at regular intervals.
The values calculated based on raw kinetic data include VMax, VMax per Sec, Time to VMax,
and Onset Time. Kinetic readings can be single-wavelength or multiple-wavelength readings.
Kinetic analysis can be done for up to 99 hours. The kinetic read interval depends on the
instrument setup parameters selected in the SoftMax Pro Software.
Kinetic analysis has many advantages when determining the relative activity of an enzyme in
different types of microplate assays, including ELISAs and the purification and
characterization of enzymes and enzyme conjugates. Kinetic analysis is capable of providing
improved dynamic range, precision, and sensitivity relative to endpoint analysis.
Peak Pro™ Analysis functions provide advanced peak detection and characterization for
applicable kinetic reads. See the SoftMax Pro Software Formula Reference Guide.
20 5014038 E
Page 21

Chapter 2: Read Modes and Read Types
Well Scan Read Type
A Well Scan read can take readings at more than one location within a well. A Well Scan read
takes one or more readings of a single well of a microplate on an evenly spaced grid inside of
each well at single or multiple wavelengths.
Some applications involve the detection of whole cells in large-area tissue culture plates. Well
Scan reads can be used with such microplates to permit maximum surface area detection in
whole-cell protocols. Since many cell lines tend to grow as clumps or in the corners of
microplate wells, you can choose from several patterns and define the number of points to
be scanned to work best with your particular application.
The following scanning patterns are available:
A horizontal line
A vertical line
A cross pattern
A fill pattern
The fill pattern can be either round or square to match the shape of the well. The image in
the Well Scan settings shows the shape of the well as defined for the selected microplate.
You can set the density of the well scan to determine the number of points to read in a line
pattern or the maximum number of horizontal and vertical points included in a cross or fill
pattern.
Depending on the read mode selected, the values are reported as optical density (OD),
%Transmittance (%T), relative fluorescence units (RFU), or relative luminescence units (RLU).
Spectrum Read Type
Depending on the read mode selected, a Spectrum read measures optical density (OD),
%Transmittance (%T), relative fluorescence units (RFU), or relative luminescence units (RLU)
across a spectrum of wavelengths.
Spectrum reads are available only for specific detection cartridges. See Available Detection
Cartridges on page 93.
5014038 E 21
Page 22

SpectraMax Paradigm Multi-Mode Detection Platform User Guide
Membrane Read Type
The Membrane read type is used for a time-resolved fluorescence reading of a Western Blot
membrane. The selected area is read, and a TIFF image is generated with the results of the
read.
The Molecular Devices ScanLater™Western Blot Assay Kit is a novel system for protein
analysis that is incorporated into a SpectraMaxParadigm Multi-Mode Detection Platform.
Membranes are incubated with Eu-chelate labeled secondary antibodies or streptavidin that
bind specifically to the target protein-specific primary antibody. For more information,
contact your Molecular Devices representative or search the knowledge base for ScanLater
or Western Blot at www.moleculardevices.com/support.
For information about the detection cartridge for Western Blot membrane reads, see
ScanLater Western Blot (WB) Detection Cartridge on page 142.
22 5014038 E
Page 23

Absorbance Read Mode
In the Absorbance (ABS) read mode, the instrument measures the Optical Density (OD) of
the sample solutions.
Absorbance is the quantity of light absorbed by a solution. To measure absorbance
accurately, it is necessary to eliminate light scatter. If there is no turbidity, then
absorbance=optical density.
A=log10(I0/I)=–log10(I/I0)
where I0is incident light before it enters the sample, I is the intensity of light after it passes
through the sample, and A is the measured absorbance.
For Absorbance reads, you can choose whether to display absorbance data as Optical
Density (OD) or %Transmittance (%T) in the Reduction dialog.
Optical Density
Optical density (OD)is the quantity of light passing through a sample to a detector relative to
the total quantity of light available. Optical Density includes absorbance of the sample plus
light scatter from turbidity and background. You can compensate for background using
blanks.
Chapter 2: Read Modes and Read Types
A blank well contains everything used with the sample wells except the chromophore and
sample-specific compounds. Do not use an empty well for a blank.
Some applications are designed for turbid samples, such as algae or other micro-organisms
in suspension. The reported OD values for turbid samples are likely to be different when read
by different instruments.
For optimum results, Molecular Devices recommends that you run replicates for all blanks,
controls, and samples. In this case, the blank value that can be subtracted is the average
value of all blanks.
% Transmittance
%Transmittance is the ratio of transmitted light to the incident light for absorbance reads.
T=I/I
0
%T=100T
where I is the intensity of light after it passes through the sample and I0is incident light
before it enters the sample.
Optical Density and %Transmittance are related by the following formulas:
%T=10
2–OD
OD=2–log10(%T)
The factor of two comes from the fact that %T is expressed as a percent of the transmitted
light and log10(100)=2.
When in %Transmittance analysis mode, the SoftMax Pro Software converts the raw OD
values reported by the instrument to %Transmittance using the above formula. All
subsequent calculations are done on the converted numbers.
5014038 E 23
Page 24

SpectraMax Paradigm Multi-Mode Detection Platform User Guide
Applications of Absorbance
Absorbance-based detection has been commonly used to evaluate changes in color or
turbidity, permitting widespread use including ELISAs, protein quantitation, endotoxin
assays, and cytotoxicity assays. With absorbance readers that are capable of measuring in
the ultraviolet (UV) range, the concentration of nucleic acids (DNA and RNA) can be found
using their molar extinction coefficients.
For micro-volume measurements, you can use SpectraDrop 24-well Micro-Volume
Microplates and SpectraDrop 64-well Micro-Volume Microplates.
To do absorbance reads, the SpectraMaxParadigm Multi-Mode Detection Platform requires
the Absorbance Detection Cartridge, see page 94.
You can use the Protocol Manager in the SoftMax Pro Software to quickly find and open a
predefined protocol.
More protocols and updated protocols can be downloaded from the Knowledge Base on the
Molecular Devices support web site (www.moleculardevices.com/support) or from the
protocol sharing web site (www.softmaxpro.org).
PathCheck Pathlength Measurement Technology
The temperature-independent PathCheck® Pathlength Measurement Technology
normalizes your absorbance values to a 1cm path length based on the near-infrared
absorbance of water.
The Beer–Lambert law states that absorbance is proportional to the distance that light
travels through the sample:
A = εbc
where A is the absorbance, εis the molar absorptivity of the sample, b is the pathlength, and
c is the concentration of the sample. The longer the pathlength, the higher the absorbance.
Microplate readers use a vertical light path so the distance of the light through the sample
depends on the volume. This variable pathlength makes it difficult to do extinction-based
assays and also makes it confusing to compare results between microplate readers and
spectrophotometers.
The standard pathlength of a 1cm cuvette is the conventional basis for quantifying the
unique absorptivity properties of compounds in solution. Quantitative analysis can be done
on the basis of extinction coefficients, without standard curves (for example, NADH-based
enzyme assays). When using a cuvette, the pathlength is known and is independent of
sample volume, so absorbance is directly proportional to concentration when there is no
background interference.
24 5014038 E
Page 25
Chapter 2: Read Modes and Read Types
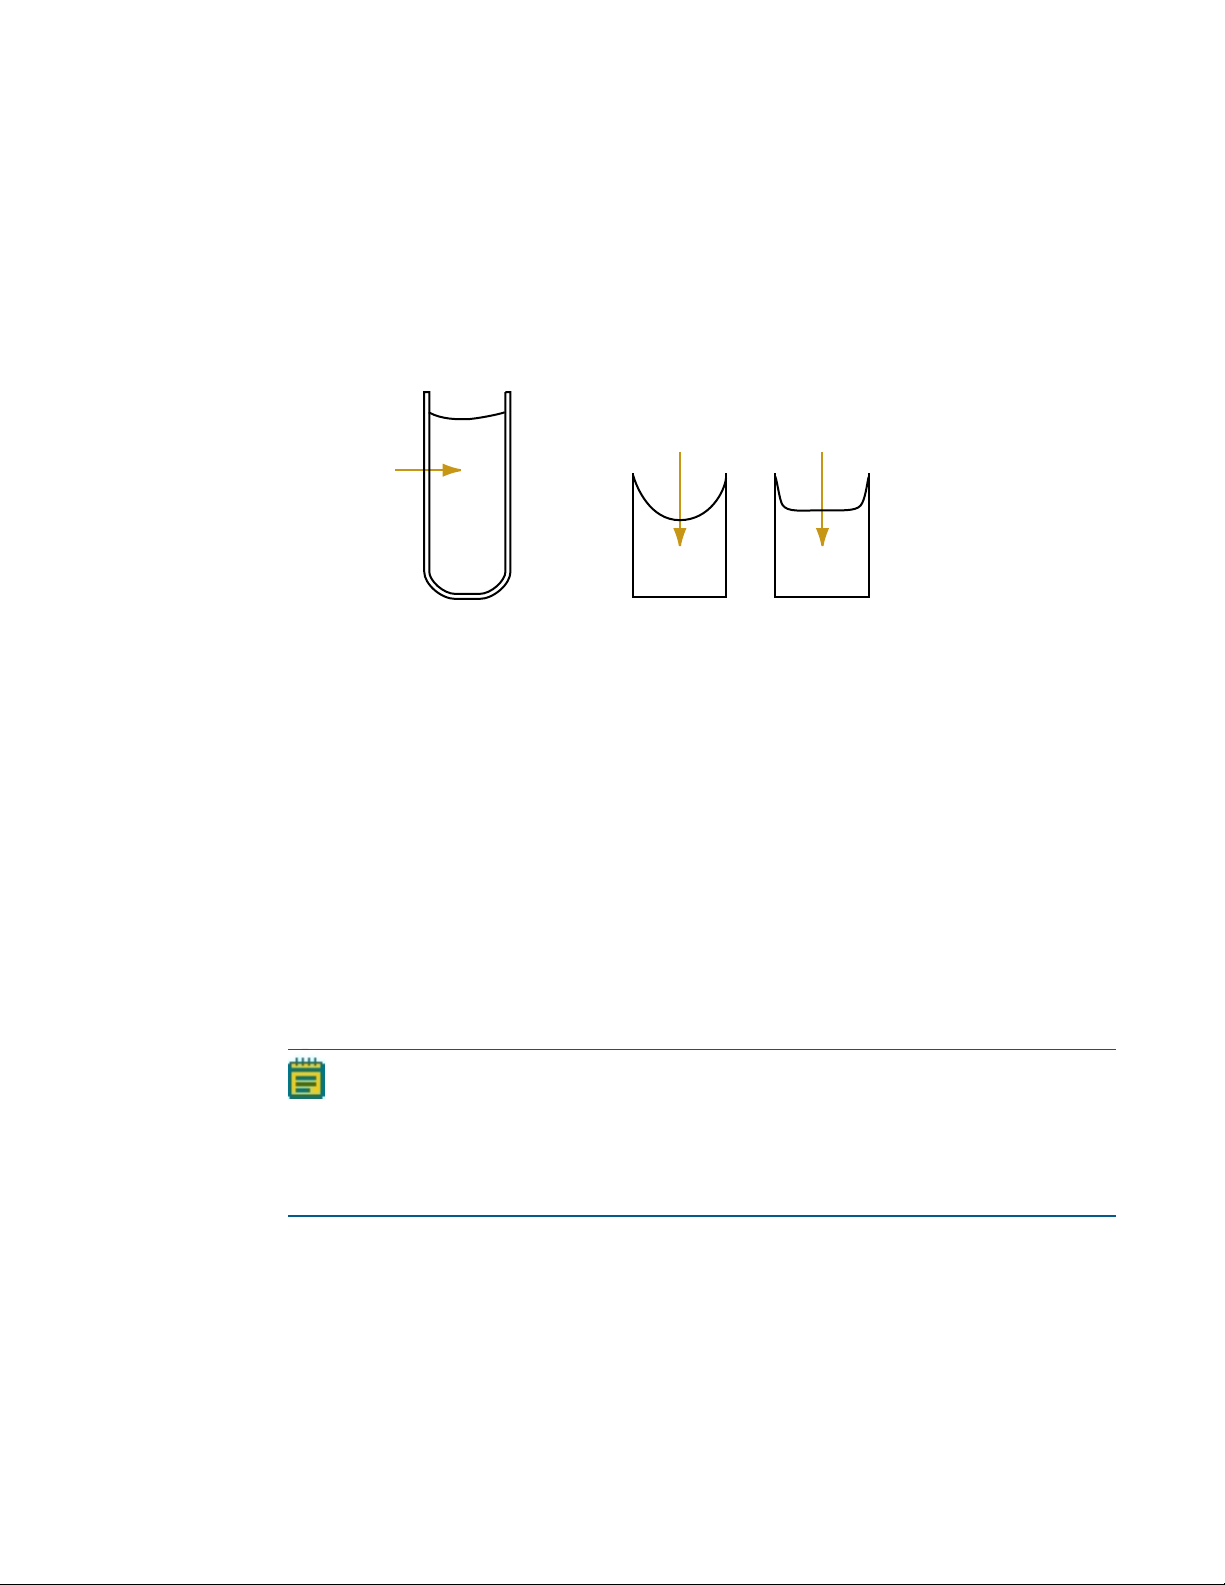
Horizontal
light path
Vertical light path
Cuvette Microplate wells
In a microplate, pathlength is dependent on the liquid volume, so absorbance is
proportional to both the concentration and the pathlength of the sample. Standard curves
are often used to determine analyte concentrations in vertical-beam photometry of
unknowns, yet errors can still occur from pipetting the samples and standards. The
PathCheck technology automatically determines the pathlength of aqueous samples in the
microplate and normalizes the absorbance in each well to a pathlength of 1cm. This way of
correcting the microwell absorbance values is accurate to within ±4% of the values obtained
directly in a 1cm cuvette.
Figure 2-1: Cuvette and Microplate Well Light Paths
The 1cm values can be obtained by using the factory installed Water Constant. PathCheck
technology is used to normalize the data acquired from absorbance endpoint microplate
readings to a 1cm pathlength, correcting the OD for each well to the value expected if the
sample were read in a 1cm cuvette.
Water Constant
The Water Constant correction method is supported for absorbance endpoint reads.
The PathCheck technology is based on the absorbance of water in the near infrared spectral
region (between 900 nm to 1000 nm). If the sample is completely aqueous, has no turbidity
and has a low salt concentration (less than 0.5 M), the Water Constant is sufficient. The
Water Constant is determined for each instrument during manufacture and is stored in the
instrument.
Note: After you have read a plate with PathCheck technology turned on, PathCheck
information is stored permanently in the data file. You have the option of applying, or
not applying, PathCheck technology to the absorbance values. If you do not have
PathCheck technology turned on during the plate read, you cannot apply the
PathCheck Pathlength Measurement Technology feature after the read.
5014038 E 25
Page 26

SpectraMax Paradigm Multi-Mode Detection Platform User Guide
Eliminating the Pathlength-Independent Component
Raw OD measurements of microplate samples include both pathlength-dependent
components (sample and solvent) and a pathlength-independent component (OD of
microplate material). The pathlength-independent component must be eliminated from the
calculation to get valid results that have been normalized by the PathCheck technology. You
can do this using a plate blank or using a plate background constant.
Using a Plate Blank
This method can be used if all samples in the microplate are the same volume and you are
not depending on the PathCheck technology to correct for variability in volumes.
To use this method:
1. Designate a minimum of one well (preferably several) as Plate Blank.
2. Pipette buffer (for example, your sample matrix) into those wells and read along with
your samples. Do not use an empty well for a blank.
The SoftMax Pro Software automatically subtracts the average of the blank wells from
each of the samples. The OD of the microplate material is subtracted as part of the blank.
3. Make sure that Use Plate Blank is checked under Other Options in the Data Reduction
dialog.
Using a Plate Background Constant
If your sample volumes are not identical or if you choose not to use a Plate Blank, then you
must use a Plate Background Constant. Omitting a Plate Background Constant results in
artificially high values after being normalized by the PathCheck technology.
To determine the Plate Background Constant:
1. Fill a clean microplate with water.
2. Read at the wavelengths that you will be reading your samples.
The average OD value is the Plate Background Constant. If you intend to read your samples
at more than one wavelength, there should be a corresponding number of Plate Background
Constant values for each wavelength.
Note: It is important that you put water in the wells and not read a dry microplate for
the Plate Background Constant. A dry microplate has a slightly higher OD value than a
water-filled microplate because of differences in refractive indices. Using a dry
microplate results in PathCheck technology normalized values that are lower than
1cm cuvette values.
26 5014038 E
Page 27

Chapter 2: Read Modes and Read Types
Interfering Substances
Material that absorbs in the 900nm to 1000nm spectral region could interfere with
PathCheck technology measurements. Fortunately, there are few materials that do interfere
at the concentrations generally used.
Turbidity is the most common interference. If you can detect turbidity in your sample, you
should not use the PathCheck technology. Turbidity elevates the 900nm measurement
more than the 1000nm measurement and causes an erroneously low estimate of
pathlength. Using Cuvette Reference does not reliably correct for turbidity.
Samples that are highly colored in the upper-visible spectrum might have absorbance
extending into the near-infrared (NIR) spectrum and can interfere with the PathCheck
technology. Examples include Lowry assays, molybdate-based assays, and samples
containing hemoglobins or porphyrins. In general, if the sample is distinctly red or purple,
you should check for interference before using the PathCheck technology.
To determine possible color interference, do the following:
Measure the OD at 900nm and 1000nm (both measured with air reference).
Subtract the 900nm value from the 1000nm value.
Do the same for pure water.
If the delta OD for the sample differs significantly from the delta OD for water, then it is
recommended to not use the PathCheck technology.
Organic solvents could interfere with the PathCheck technology if they have absorbance in
the region of the NIR water peak. Solvents such as ethanol and methanol do not absorb in
the NIR region, so they do not interfere, except for causing a decrease in the water
absorbance to the extent of their presence in the solution. If, however, the solvent absorbs
between 900nm and 1000nm, the interference would be similar to the interference of highly
colored samples as previously described. If you are considering adding an organic solvent
other than ethanol or methanol, you should run a Spectrum scan between 900nm and
1000nm to determine if the solvent would interfere with the PathCheck technology.
5014038 E 27
Page 28
SpectraMax Paradigm Multi-Mode Detection Platform User Guide
500 550 600 650
0
0.5
1.0
Excitation maximum
Emission maximum
Relative Fluorescence
Wavelength (nm)
Absorption
Stokes
Shift
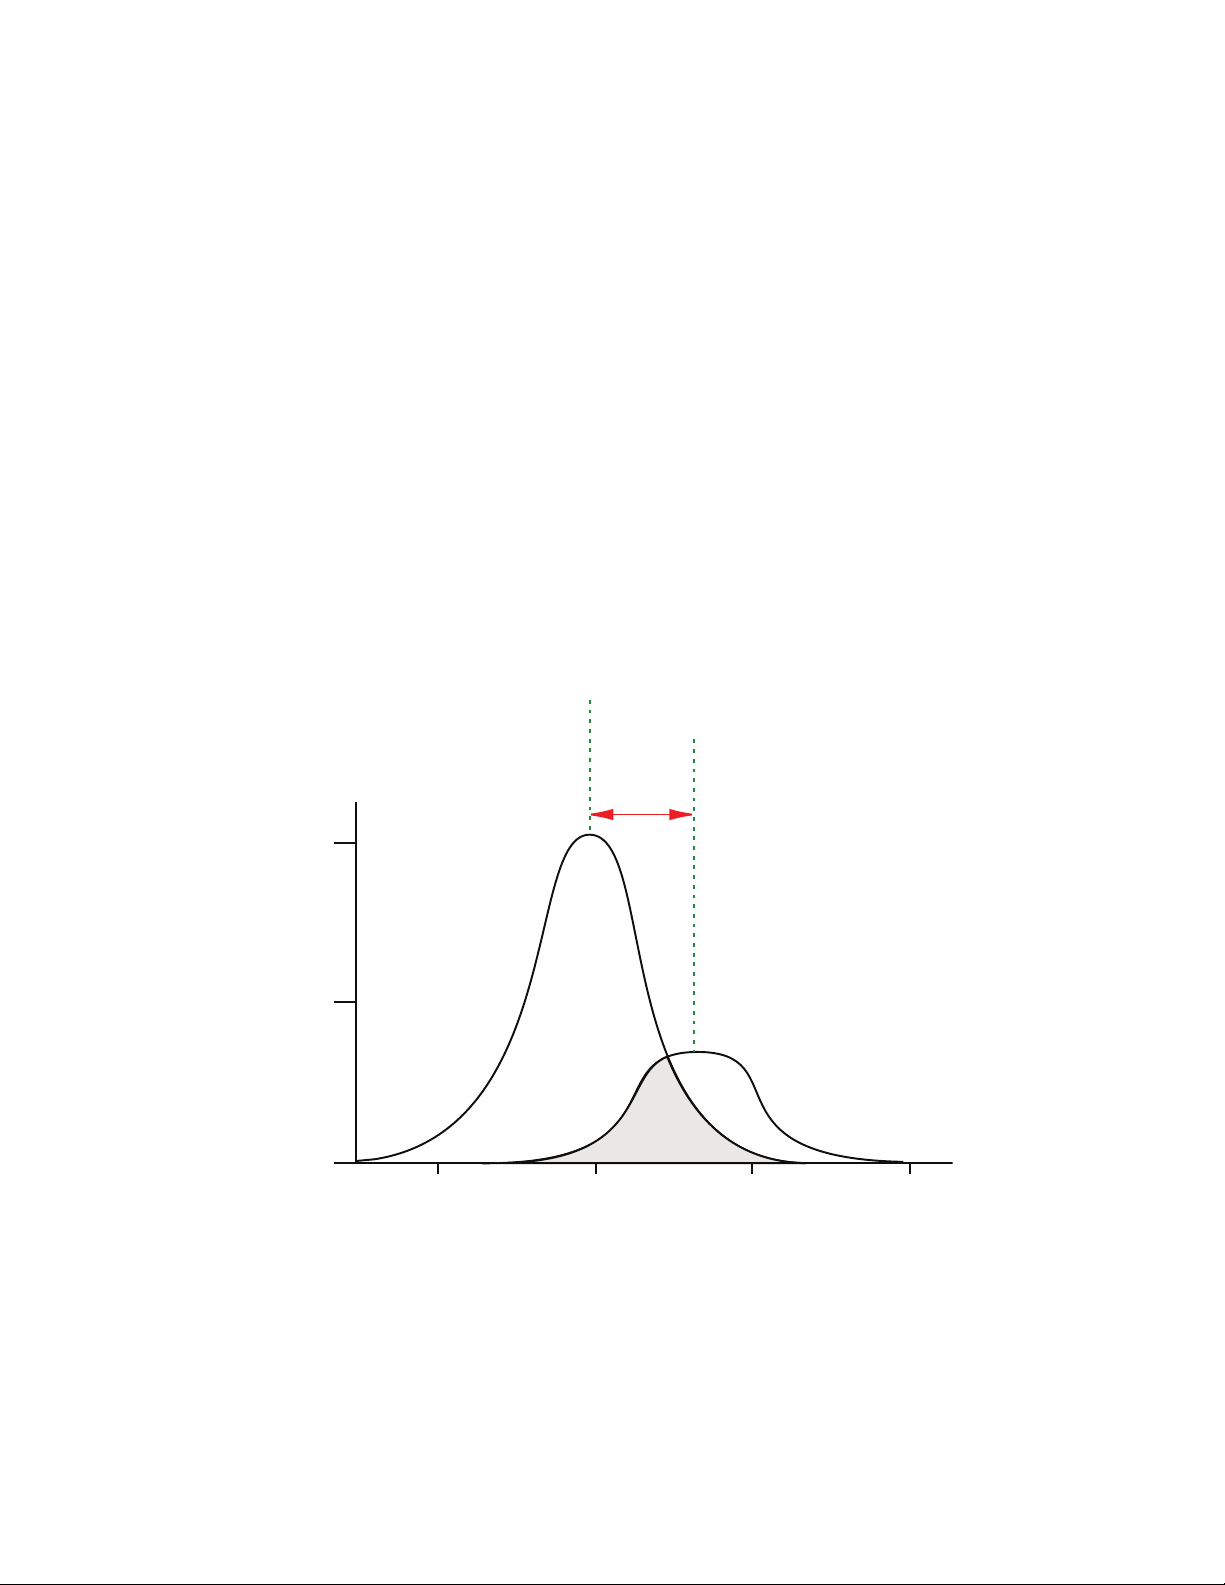
Fluorescence Intensity Read Mode
Fluorescence occurs when absorbed light is re-radiated at a longer wavelength. In the
Fluorescence Intensity (FL) read mode, the instrument measures the intensity of the reradiated light and expresses the result in Relative Fluorescence Units (RFU).
The governing equation for fluorescence is:
Fluorescence = extinctioncoefficient × concentration × quantumyield ×
excitationintensity × pathlength × emissioncollectionefficiency
Fluorescent materials absorb light energy of a characteristic wavelength (excitation), undergo
an electronic state change, and instantaneously emit light of a longer wavelength (emission).
Most common fluorescent materials have well-characterized excitation and emission
spectra. The following figure shows an example of excitation and emission spectra for a
fluorophore. The excitation and emission bands are each fairly broad, with half-bandwidths
of approximately 40nm, and the difference between the wavelengths of the excitation and
emission maxima (the Stokes shift) is generally fairly small, about 30nm. There is
considerable overlap between the excitation and emission spectra (gray area) when a small
Stokes shift is present.
Figure 2-2: Excitation and Emission Spectra
Because the intensity of the excitation light is usually many tens of thousands of times
greater than that of the emitted light, you must have sufficient spectral separation to reduce
the interference of the excitation light with detection of the emitted light.
28 5014038 E
Page 29
Chapter 2: Read Modes and Read Types
500 550 600 650
0
0.5
1.0
Excitation maximum
of fluorophore
Emission maximum
of fluorophore
Relative Fluorescence
Wavelength (nm)
Excitation
reading wavelength
Emission
reading wavelength
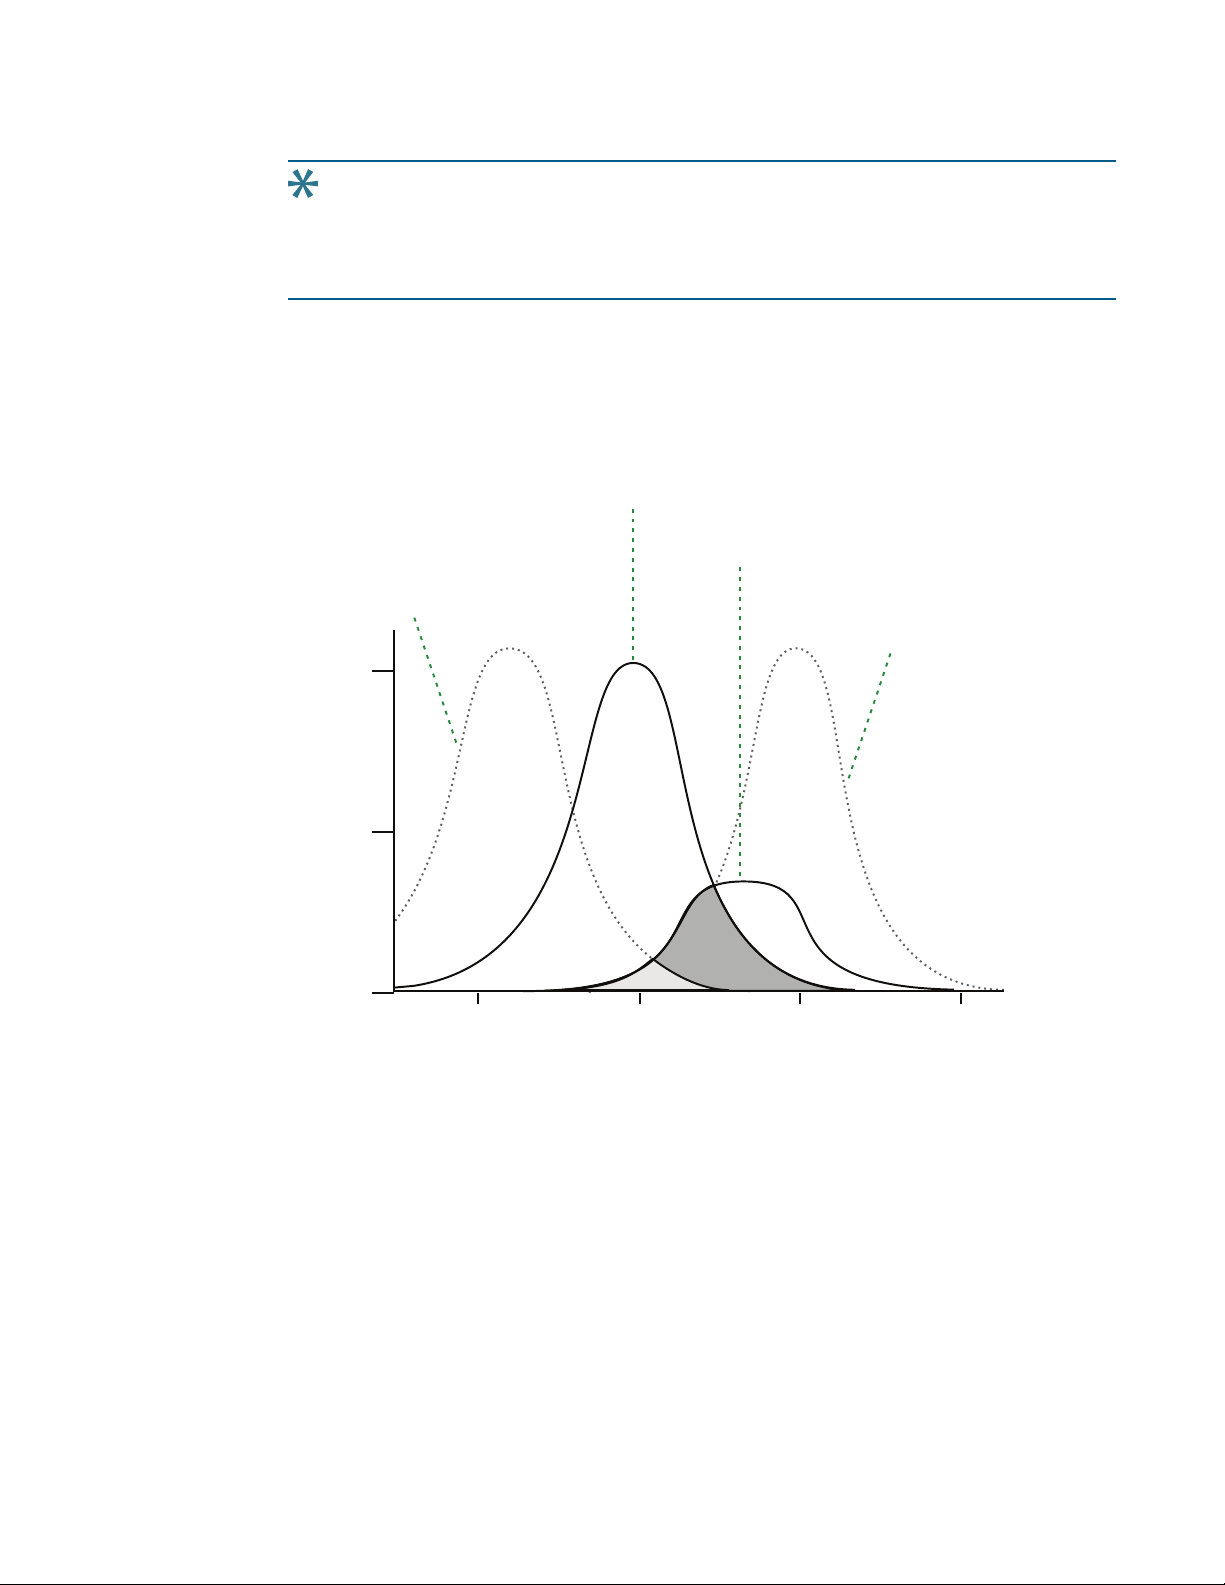
Tip: If the Stokes shift is small, you should choose an excitation wavelength that is as
far away from the emission maximum as possible while still being capable of
stimulating the fluorophore so that less of the excited light overlaps the emission
spectrum, permitting better selection and quantitation of the emitted light.
The Spectral Optimization Wizard in the SoftMax Pro Software provides the best settings
for maximizing the signal to background window, (S-B)/B, while minimizing the optimization
time. You can use this wizard with a Tunable Wavelength (TUNE) Detection Cartridge installed
in the SpectraMaxParadigm Multi-Mode Detection Platform. See the SoftMax Pro Software
application help or user guide.
5014038 E 29
Figure 2-3: Optimized Excitation and Emission Reading Wavelengths
The previous figure shows that the best results are often obtained when the excitation and
emission wavelengths used for reading are not the same as the peak wavelengths of the
excitation and emission spectra of the fluorophore. When the reading wavelengths for
excitation and emission are separated, a smaller quantity of excitation light passes through
to the emission monochromator (gray area) and on to the PMT, resulting in a purer emission
signal and more accurate data.
Page 30

SpectraMax Paradigm Multi-Mode Detection Platform User Guide
The instrument permits scanning of both excitation and emission wavelengths, using
separate tunable dual monochromators. One benefit of scanning emission spectra is that
you can determine more accurately whether the emission is, in fact, the expected
fluorophore, or multiple fluorophores, and not one generated by a variety of background
sources or by contaminants. One more benefit is that you can find excitation and emission
wavelengths that prevent interference when interfering fluorescent species are present.
For this reason, it is desirable to scan emission for both an intermediate concentration of
labeled sample, as well as the background of unlabeled sample. The optimum setting is
where the ratio of the sample emission to background emission is at the maximum.
Fluorescence intensity data is dependent on a number of variables. See Analyzing
Fluorescence Intensity Data on page 31.
Applications of Fluorescence Intensity
Fluorescence intensity is used widely in applications such as fluorescent ELISAs, protein
assays, nucleic acid quantitation, reporter gene assays, cell viability, cell proliferation, and
cytotoxicity. One more major application of this mode is to study the kinetics of ion release.
Some assays use a fluorescent label to selectively attach to certain compounds. The quantity
or concentration of the compound can then be quantified by measuring the fluorescence
intensity of the label, which is attached to the compound. Such methods are often used to
quantify low concentrations of DNA or RNA, for example.
You can use the Protocol Manager in the SoftMax Pro Software to quickly find and open a
predefined protocol.
More protocols and updated protocols can be downloaded from the Knowledge Base on the
Molecular Devices support web site (www.moleculardevices.com/support) or from the
protocol sharing web site (www.softmaxpro.org).
The following detection cartridges have fluorescence intensity read mode capability:
Tunable Wavelength (TUNE) Detection Cartridge, see page 97
Multi-Mode (MULTI) Detection Cartridge, see page 102
Fluorescence Intensity (FI) Detection Cartridges, see page 116
Fluorescence Intensity (FI) GeneBLAzer Detection Cartridge, see page 119
Fluorescence Intensity Dual Label (FI-DL) (MultiTox-Fluor) Detection Cartridge, see page
122
30 5014038 E
Page 31

Chapter 2: Read Modes and Read Types
conc
label
=
(sample – blank)
std – blank
conc
std
Analyzing Fluorescence Intensity Data
Fluorescence intensity data is dependent on a number of variables. Raw data is compared to
a standard curve with known concentrations of a reference label.
A standard curve consists of, at a minimum, a blank sample and a reference standard sample
of known concentration. The raw data can then be expressed in equivalent concentration of
a reference label.
Analyzing and validating fluorescence intensity data generally consists of the following:
Background Correction and Quantification on page 31
Detection Limit on page 32
Linearity and the Linear Dynamic Range on page 32
Background Correction and Quantification
A blank well contains everything used with the sample wells except the label and samplespecific compounds. Do not use an empty well for a blank.
The blank sample reveals the offset underlying each data sample. This offset does not carry
information on the label, and is generally subtracted before data reduction is done.
The blank-subtracted raw data are proportional to the quantity of label in a sample such that
the label concentration is quantified by the following equation.
where conc
is the concentration of the standard, and sample, blank, and standard are
std
average values of replicates for the sample, blank, and standard wells. In the general case
where the standard curve covers a concentration range of more than a few linear logs,
(standard–blank)/conc
is equivalent to the slope of the standard curve, and so the
std
concentration of the label is determined by (sample–blank)/(slopeofstandardcurve).
For optimum results, Molecular Devices recommends that you run replicates for all blanks,
controls, and samples. In this case, the blank value that can be subtracted is the average
value of all blanks.
5014038 E 31
Page 32

SpectraMax Paradigm Multi-Mode Detection Platform User Guide
Det Limit =
3 Stdev
blank
std – blank
conc
std
LDR = log10
max conc lin
detec!on limit
( )
Detection Limit
The detection limit is the smallest sample concentration that can be measured reliably above
the blank. Determining the detection limit requires taking a number of blank measurements
and calculating an average value and standard deviation for the blanks. The detection
threshold is defined as the average blank plus three standard deviations. If the average
sample value measures above the threshold, the sample can be detected at a statistically
significant level.
The detection limit can be described by the following equation:
where conc
is the concentration of the standard, StDev
std
is the standard deviation of the
Blan k
blank replicates, and blank and Std are average values of the replicates for the blank and
standard wells.
Determining the detection limit for an assay requires multiple blanks to calculate their
standard deviation.
Linearity and the Linear Dynamic Range
Within a wide range at moderately high concentrations, blanked raw data is proportional to
the quantity of label in a sample.
The linear dynamic range (LDR) is defined by:
where LDRis expressed as a log, and max conc lin is the highest concentration in the linear
range that can be quantified.
When the standard curve after blank reduction is not linear in concentration at the lower
end, there might be an incorrect or contaminated blank.
32 5014038 E
Page 33

Luminescence Read Mode
In luminescence read mode, no excitation is necessary as the species being measured emit
light naturally. For this reason, the lamp does not flash, so no background excitation
interference occurs.
In the Luminescence (LUM) read mode, the instrument provides measurements in Relative
Luminescence Units (RLUs).
Luminescence is the emission of light by processes that derive energy from essentially nonthermal changes, the motion of subatomic particles, or the excitation of an atomic system by
radiation. Luminescence detection relies on the production of light from a chemical reaction
in a sample.
To help eliminate background luminescence from a microplate that has been exposed to
light, Molecular Devices recommends dark adaptation of the microplate by placing the
sample-loaded microplate in the instrument for several minutes before starting the read.
If wavelength selection is desired, you can choose the wavelength where peak emission is
expected to occur. Also, multiple wavelength choices let species with multiple components
be differentiated and measured easily.
Chapter 2: Read Modes and Read Types
When maximum sensitivity is required, Molecular Devices recommends the use of dual-color
luminescence detection cartridges. See Dual Color Luminescence (LUM) (BRET2) Detection
Cartridge on page 131 and Dual Color Luminescence (LUM) (Chroma-Glo) Detection Cartridge
on page 136.
Luminescence can be read from the top or the bottom of a microplate. Solid white
microplates or white microplates with clear bottoms are recommended for luminescence
reads.
Concentrations or qualitative results are derived from raw data with a standard curve or by
comparison with reference controls. See Analyzing Luminescence Data on page 35.
5014038 E 33
Page 34

SpectraMax Paradigm Multi-Mode Detection Platform User Guide
Applications of Luminescence
Chemiluminescent or bioluminescent reactions can be induced to measure the quantity of a
particular compound in a sample. Examples of luminescent assays include the following:
Reporter gene assays (the measurement of luciferase gene expression)
Quantitation of adenosine triphosphate (ATP) as an indication of cell counts with cellproliferation, cytotoxicity, and biomass assays
Enzyme measurements with luminescent substrates, such as immunoassays
You can use the Protocol Manager in the SoftMax Pro Software to quickly find and open a
predefined protocol.
More protocols and updated protocols can be downloaded from the Knowledge Base on the
Molecular Devices support web site (www.moleculardevices.com/support) or from the
protocol sharing web site (www.softmaxpro.org).
The following detection cartridges have luminescence read mode capability:
Tunable Wavelength (TUNE) Detection Cartridge, see page 97
Multi-Mode (MULTI) Detection Cartridge, see page 102
Glow Luminescence (LUM) Detection Cartridges, see page 128
Dual Color Luminescence (LUM) (BRET2) Detection Cartridge, see page 131
Dual Color Luminescence (LUM) (Chroma-Glo) Detection Cartridge, see page 136
34 5014038 E
Page 35

Chapter 2: Read Modes and Read Types
Analyzing Luminescence Data
The conversion rate of photons to counts is individual for each reader. Therefore, raw data
from the same plate can seem significantly different from one instrument to the next. Also,
the data format used by other manufacturers might not be counts per second and can be
different by several orders of magnitude. It is important to know that the number of counts
and the size of figures is in no way an indication of sensitivity. See Detection Limit on page 36.
Concentrations or qualitative results are derived from raw data with a standard curve or by
comparison with reference controls. A standard curve consists of, at a minimum, a blank
sample and a reference standard sample of known concentration. The raw data can then be
expressed in equivalent concentration of a reference label. The raw data is normalized to
counts per second by dividing the number of counts by the read time per well.
Analyzing and validating luminescence data generally consists of the following:
Background Correction on page 35
Detection Limit on page 36
Sample Volumes and Concentration of Reactants on page 36
Data Optimization on page 37
Background Correction
The light detected in a luminescent measurement generally has two components: specific
light from the luminescent reaction and an approximately constant level of background light
caused by various factors, including the plate material and impurities in the reagents. The
background can be effectively measured using blank replicates. Blanks should include the
luminescent substrate (chemical energy source) but not the luminescence agent (generally
an enzymatic group which makes the substrate glow).
A blank well contains everything used with the sample wells except the label and samplespecific compounds. Do not use an empty well for a blank.
The blank sample reveals the offset underlying each data sample. This offset does not carry
information on the label, and is generally subtracted before data reduction is done.
For optimum results, Molecular Devices recommends that you run replicates for all blanks,
controls, and samples. In this case, the blank value that can be subtracted is the average
value of all blanks.
To help eliminate background luminescence from a microplate that has been exposed to
light, Molecular Devices recommends dark adaptation of the microplate by placing the
sample-loaded microplate in the instrument for several minutes before starting the read.
5014038 E 35
Page 36

SpectraMax Paradigm Multi-Mode Detection Platform User Guide
Det Limit =
3 Stdev
blank
std – blank
conc
std
Detection Limit
The detection limit is the smallest sample concentration that can be measured reliably above
the blank. Determining the detection limit requires taking a number of blank measurements
and calculating an average value and standard deviation for the blanks. The detection
threshold is defined as the average blank plus three standard deviations. If the average
sample value measures above the threshold, the sample can be detected at a statistically
significant level.
The detection limit can be described by the following equation:
where conc
is the concentration of the standard, StDev
std
is the standard deviation of the
Blan k
blank replicates, and blank and Std are average values of the replicates for the blank and
standard wells.
Determining the detection limit for an assay requires multiple blanks to calculate their
standard deviation.
Sample Volumes and Concentration of Reactants
The concentration of the luminescent agent impacts the quantity of light output in a
luminescent reaction. Light is emitted as a result of a reaction between two or more
compounds. Therefore, the quantity of light output is proportional to the quantity of the
limiting reagent in the sample.
For example, in an ATP/luciferin-luciferase system, when total volume is held constant and
ATP is the limiting reagent, the blanked light output is proportional to the concentration of
ATP in the sample, at very high concentrations of ATP. Substrate can be used up and become
rate-limiting, providing it is the rate-limiting component. In this case, the non-linearity is an
effect of the assay and not caused by the microplate reader.
Note: Very bright samples can exceed the linear dynamic range of the instrument. If
such is the case, reading can be done using an attenuation filter.
36 5014038 E
Page 37

Chapter 2: Read Modes and Read Types
Z´ = 1 –
| Mean
c+
– Meanc– |
3(SD
c+
) + 3(SDc– )
Data Optimization
The measurement noise is dependent on the read time per sample (time per plate or time
per well). In particular, the detection limit improves when the read time is increased.
Therefore, it is important to specify the read time when comparing measurements.
All low-light-level detection devices have some measurement noise in common. To average
out the measurement noise, optimization of the time per well involves accumulating as
many counts as possible. Within some range, you can reduce noise (CVs, detection limit) by
increasing the read time per well, as far as is acceptable from throughput and sample
stability considerations.
Z´ is the standard statistical parameter in the high-throughput screening community for
measuring the quality of a screening assay independent of test compounds. It is used as a
measure of the signal separation between the positive controls and the negative controls in
an assay.
The value of Z´ can be determined using the following formula:
where SD is the standard deviation, c+ is the positive control, and c– is the negative control.
A Z´ value greater than or equal to 0.4 is the generally acceptable minimum for an assay.
Higher values might be desired when results are more critical.
Z´ is not linear and can be made unrealistically small by outliers that skew the standard
deviations in either population. To improve the Z´ value, you can increase the quantity of
label in the sample, if acceptable for the assay, or increase the read time per well.
5014038 E 37
Page 38

SpectraMax Paradigm Multi-Mode Detection Platform User Guide
Time-Resolved Fluorescence Read Mode
Time-resolved fluorescence (TRF) is a measurement technique that depends on three
characteristics that lead to better discrimination between the specific signal, proportional to
the quantity of label, and the unspecific fluorescence resulting from background and
compound interference:
Pulsed excitation light sources
Time-gated electronics faster than the fluorescence lifetime
Labels with prolonged fluorescence lifetime
The time-gating electronics introduce a delay between the cut off of each light pulse and the
start of signal collection. During the delay, the unspecific fluorescence (caused by test
compounds, assay reagents, and the microplate) vanishes while only a small portion of the
specific fluorescence from the label is sacrificed. Enough of the specific signal remains during
the decay period with the added benefit of reduced background.
In Time-Resolved Fluorescence read mode, the instrument detects the extremely long
emission half-lives of rare earth elements called lanthanides such as europium (lifetime of
about 700 µs), samarium (lifetime of about 70 µs), or terbium (lifetime of about 1000 µs).
Applications of Time-Resolved Fluorescence
Time-resolved fluorescence (TRF) is widely used in high throughput screening applications
such as kinase assays, and is useful in some fluorescence immunoassays, such as DELFIA
(dissociation-enhanced enzyme linked fluorescence immunoassay). TRF is also useful in
some assay variants of TR-FRET (time-resolved fluorescence resonance energy transfer) in
which the FRET acceptor label acts as a quencher only and does not emit fluorescence. The
proximity between donor label and acceptor (quencher) is then quantified by the intensity
decrease of the donor label.
DELFIA requires washing steps as in an ELISA, but the TR-FRET assay involving quenching is a
homogeneous microplate assay technique and requires only mixing and measuring—no
wash steps are required. It can also be miniaturized, which makes it useful for highthroughput screening applications.
The Cisbio Bioassays HTRF (Homogeneous Time-Resolved Fluorescence) technology is a
proprietary time-resolved fluorescence technology that overcomes many of the drawbacks
of standard Fluorescence Resonance Energy Transfer (FRET) techniques, such as the
requirements to correct for autofluorescence and the fluorescent contributions of unbound
fluorophores. See HTRF Read Mode on page 45.
38 5014038 E
Page 39

Chapter 2: Read Modes and Read Types
You can use the Protocol Manager in the SoftMax Pro Software to quickly find and open a
predefined protocol.
More protocols and updated protocols can be downloaded from the Knowledge Base on the
Molecular Devices support web site (www.moleculardevices.com/support) or from the
protocol sharing web site (www.softmaxpro.org).
The following detection cartridges have time-resolved fluorescence read mode capability:
Tunable Wavelength (TUNE) Detection Cartridge, see page 97
Multi-Mode (MULTI) Detection Cartridge, see page 102
Cisbio HTRF Detection Cartridge on page 110
Time Resolved Fluorescence (TRF) Detection Cartridge, see page 113
Analyzing Time-Resolved Fluorescence Data
A time-resolved fluorescence (TRF) measurement includes a number of pulses. Each pulse
consists of turning the light source on and off (Excitation Time), pausing for a specified length
of time (Measurement Delay), and measuring the fluorescence intensity of the sample for a
specified length of time (Integration Time). These pulses are repeated several times, as
specified in the protocol parameters.
Analyzing and interpreting TRF data generally consists of the following:
Blank Correction on page 39
Data Normalization on page 40
Data Optimization on page 40
Blank Correction
Although background is significantly lower than with fluorescence intensity measurements,
Molecular Devices recommends that you use blanks or assay controls.
A blank well contains everything used with the sample wells except the label and samplespecific compounds. Do not use an empty well for a blank.
The blank sample reveals the offset underlying each data sample. This offset does not carry
information on the label, and is generally subtracted before data reduction is done.
For optimum results, Molecular Devices recommends that you run replicates for all blanks,
controls, and samples. In this case, the blank value that can be subtracted is the average
value of all blanks.
5014038 E 39
Page 40

SpectraMax Paradigm Multi-Mode Detection Platform User Guide
Data Normalization
TRF raw data changes in magnitude when the timing parameters are changed. However, TRF
data are normalized for a number of 1000 pulses. This means that the sample raw data does
not change when only the number of pulses is changed.
When selecting a fast read mode, the raw data becomes slightly lower because during the
continuous plate movement, some signal is collected under non-optimum focusing
conditions.
Data Optimization
There are two timing parameters which can be optimized to adjust the performance of the
measurement as desired: time per well and integration time per cycle.
The measurement noise is dependent on the read time per sample (time per plate or time
per well). In particular, the detection limit improves when the read time is increased.
Therefore, it is important to specify the read time when comparing measurements. For TRF,
the read time per well increases with the selected number of pulses. The time between
pulses and the intensity of each pulse, however, can be different on various systems.
All low-light-level detection devices have some measurement noise in common. To average
out the measurement noise, optimization of the time per well involves accumulating as
many counts as possible. Within some range, you can reduce noise (CVs, detection limit) by
increasing the read time per well, as far as is acceptable from throughput and sample
stability considerations.
To further optimize measurement results, optimize the timing parameters. The following
table and figure can be used as guidelines for the selection of timing parameters.
40 5014038 E
Page 41

Chapter 2: Read Modes and Read Types
t
1
t
4
t
3
t
2
Table 2-1: Time-resolved fluorescence timing parameters example
Parameter Value Comment
Pulse length 0.100ms The period for excitation of the sample, shown as t1in the
following figure.
This is the suggested value for the TUNE, MULTI, and TRF
detection cartridges.
Measurement delay 0.010 ms The delay to ensure the excitation pulse is no longer
detectable, shown as t2in the following figure.
This is the suggested value for the TUNE, MULTI and TRF
detection cartridges.
Integration time per
cycle (pulse)
Integration time per
cycle (pulse)
0.890ms The period for accumulating the signal, shown as t3in the
following figure.
This is the suggested value for the TUNEand MULTI detection
cartridges.
1.890ms The period for accumulating the signal, shown as t3in the
following figure.
This is the suggested value for the TRF detection cartridge.
Figure 2-4: Timing parameters for time-resolved fluorescence
5014038 E 41
Page 42

SpectraMax Paradigm Multi-Mode Detection Platform User Guide
When neglecting the time delay t2compared to the integration time window t3, the
accumulated signal A can be approximated with the following equation:
A / A
= (1 – exp(–M)) x 100%
max
In the previous equation, M is the size of the time window (or integration time) divided by
the exponential decay time constant (or the fluorescence lifetime of the label).
M = (integration time) / (fluorescence lifetime)
For example, using Europium, which has a fluorescence lifetime of 700µs, and the suggested
integration time per cycle of 1.890ms (or 1890µs), M=1890/700=2.7. Inserting this value
of M into the first equation yields A/A
=93%.
max
To optimize the integration time per cycle (pulse), the integration time should be set such
that the value of M produces the desired signal. For example, to get more than 86% signal,
select an integration time such that M is greater than 2.0. Using the previous Europium
example and solving for the integration time, the integration time can be set to M (2.0) times
the fluorescence lifetime (700µs), or 1400µs (1.4ms).
Table 2-2: Achievable accumulated signal percentage compared to M
M 0.25 0.50 0.75 1.00 1.25 1.50 2.00 3.00
A/A
[%] 22 39 53 63 71 78 86 95
max
M can be technically limited by the time between pulses. Further gain in signal above some
value of M can be negligible to improve results.
When performing a dual-label Europium-Samarium measurement, there are more timing
parameters. There is some residual cross-talk of the Samarium signal captured in the
Europium emission channel. Samarium has a much shorter fluorescence lifetime, so to
reduce the cross-talk of Samarium in the Europium channel, Europium is measured in a time
window shifted away from the time window for Samarium. This lets the Europium be
quantified without cross contamination from the Samarium. The known Europium
concentration can then be used to remove the Europium cross-contamination in the
Samarium channel.
42 5014038 E
Page 43

Chapter 2: Read Modes and Read Types
Suggested timing parameters for a dual-label Europium-Samarium measurement are listed in
the following table.
Table 2-3: Time-resolved fluorescence timing parameters for dual-label EuropiumSamarium
Parameter Value Comment
Pulse length 0.100ms The time interval for flash monitoring
This is the suggested value for the TRF detection
cartridge.
Measurement delay (first
window)
Integration time (first window) 0.100ms The period for accumulating the Samarium signal
Measurement delay (second
window)
Integration time (second
window)
0.010ms The delay to ensure the excitation pulse is no longer
detectable
This is the suggested value for the TRF detection
cartridge.
This is the suggested value for the TRF detection
cartridge.
0.140ms The read out of the Samarium signal
This is the suggested value for the TRF detection
cartridge.
0.750ms The period for accumulating the Europium signal
This is the suggested value for the TRF detection
cartridge.
5014038 E 43
Page 44

SpectraMax Paradigm Multi-Mode Detection Platform User Guide
FRET Read Mode
Fluorescence resonance energy transfer (FRET) is a distance-dependent interaction between
the electronic excited states of two dye molecules in which excitation is transferred from a
donor molecule to an acceptor molecule without emission of a photon.
FRET relies on the distance-dependent transfer of energy from a donor molecule to an
acceptor molecule. Due to its sensitivity to distance, FRET has been used to investigate
molecular interactions. FRET is the radiationless transmission of energy from a donor
molecule to an acceptor molecule. The donor molecule is the dye or chromophore that
initially absorbs the energy and the acceptor is the chromophore to which the energy is
subsequently transferred. This resonance interaction occurs over greater than interatomic
distances, without conversion to thermal energy, and without a molecular collision. The
transfer of energy leads to a reduction in the fluorescence intensity and excited state lifetime
of the donor, and an increase in the emission intensity of the acceptor. A pair of molecules
that interact in such a manner that FRET occurs is often referred to as a donor/acceptor pair.
While there are many factors that influence FRET, the primary conditions that need to be
met for FRET to occur are relatively few:
The donor and acceptor molecules must be in close proximity to each other.
The absorption or excitation spectrum of the acceptor must overlap the fluorescence
emission spectrum of the donor.
The degree to which they overlap is referred to as the spectral overlap integral (J).
The donor and acceptor transition must be approximately parallel.
You can use the Protocol Manager in the SoftMax Pro Software to quickly find and open a
predefined protocol.
More protocols and updated protocols can be downloaded from the Knowledge Base on the
Molecular Devices support web site (www.moleculardevices.com/support) or from the
protocol sharing web site (www.softmaxpro.org).
The following detection cartridge has FRET read mode capability:
Cisbio HTRF Detection Cartridge, see page 110
44 5014038 E
Page 45

HTRF Read Mode
Homogeneous time-resolved fluorescence (HTRF) is a measurement technique based on
fluorescence resonance energy transfer (FRET) using the advantages of time-resolved
fluorescence (TRF) reading.
Fluorescence resonance energy transfer (FRET) is a distance-dependent interaction between
the electronic excited states of two dye molecules in which excitation is transferred from a
donor molecule to an acceptor molecule without emission of a photon.
FRET relies on the distance-dependent transfer of energy from a donor molecule to an
acceptor molecule. Due to its sensitivity to distance, FRET has been used to investigate
molecular interactions. FRET is the radiationless transmission of energy from a donor
molecule to an acceptor molecule. The donor molecule is the dye or chromophore that
initially absorbs the energy and the acceptor is the chromophore to which the energy is
subsequently transferred. This resonance interaction occurs over greater than interatomic
distances, without conversion to thermal energy, and without a molecular collision. The
transfer of energy leads to a reduction in the fluorescence intensity and excited state lifetime
of the donor, and an increase in the emission intensity of the acceptor. A pair of molecules
that interact in such a manner that FRET occurs is often referred to as a donor/acceptor pair.
Chapter 2: Read Modes and Read Types
While there are many factors that influence FRET, the primary conditions that need to be
met for FRET to occur are relatively few:
The donor and acceptor molecules must be in close proximity to each other.
The absorption or excitation spectrum of the acceptor must overlap the fluorescence
emission spectrum of the donor.
The degree to which they overlap is referred to as the spectral overlap integral (J).
The donor and acceptor transition must be approximately parallel.
HTRF uses a donor fluorophore with a long fluorescence lifetime, such as Europium. The
acceptor fluorophore acts as if it also has a long fluorescence lifetime. This lets the timegating principle of time-resolved fluorescence be applied to the acceptor emission to
separate specific signal from background and signal caused by compound interference.
Time-gating electronics introduce a delay between the flashes and the start of signal
collection. During the delay, the unspecific fluorescence caused by test compounds, assay
reagents, and the microplate vanishes while only a small portion of the specific fluorescence
from the acceptor fluorophore is sacrificed. Enough of the specific signal remains, with the
benefit of reduced background.
5014038 E 45
Page 46

SpectraMax Paradigm Multi-Mode Detection Platform User Guide
Applications of Homogeneous Time-Resolved Fluorescence
Homogeneous time-resolved fluorescence (HTRF) is used in competitive assays to quantify
the binding between two labeled molecules, or the disintegration of a bound complex.
Binding partners can have similar molecular weights as opposed to fluorescence polarization
read modes. HTRF is a homogeneous assay that requires only mixing and measuring—no
wash steps are required. It can also be miniaturized, which makes it useful for highthroughput screening applications.
The fluorescence ratio related to the HTRF readout is a correction method developed by
Cisbio, for which Cisbio has granted a license to Molecular Devices. Its application is strictly
limited to the use of HTRF reagents and technology, excluding other TR-FRET technologies
such as IMAP TR-FRET calculations of acceptor to donor ratios.
You can use the Protocol Manager in the SoftMax Pro Software to quickly find and open a
predefined protocol.
More protocols and updated protocols can be downloaded from the Knowledge Base on the
Molecular Devices support web site (www.moleculardevices.com/support) or from the
protocol sharing web site (www.softmaxpro.org).
To do HTRF reads, the instrument requires the Cisbio HTRF Detection Cartridge, see page
110.
HTRF is a registered trademark of Cisbio Bioassays.
Analyzing HTRF Data
A Homogeneous Time-Resolved Fluorescence (HTRF) measurement includes a number of
flash intervals. Each flash interval consists of flashing the lamp, pausing for a specified length
of time, and measuring the fluorescence intensity of the sample. These flash intervals are
repeated several times, as specified in the protocol parameters. See Data Optimization on
page 47.
Analyzing and interpreting HTRF data generally consists of the following:
Data Reduction on page 47
Data Optimization on page 47
46 5014038 E
Page 47

Chapter 2: Read Modes and Read Types
Data Reduction
Data reduction for HTRF reads consists of two steps.
First, a ratio of the signal measured by the emission from the acceptor label at 665nm to the
signal measured by the emission of the donor label at 616nm is calculated and multiplied by
a factor of 10,000. This generates what is called the HTRF ratio.
In the second step, ratios are calculated that represent the relative change in the HTRF signal
compared to that of the assay background, represented by assay controls potentially named
negative or Standard 0. This relative response ratio is called the Delta F and is formatted as a
percentage, although values greater than 100 can be generated.
Data Optimization
The measurement noise is dependent on the read time per sample (time per plate or time
per well). In particular, the detection limit improves when the read time is increased.
Therefore, it is important to specify the read time when comparing measurements. For TRF,
the read time per well increases with the selected number of pulses. The time between
pulses, however, can be different on various systems.
Table 2-4: HTRF timing parameters example
Parameter Value Comment
Number of pulses 30 The number of flashes per read.
Measurement delay 30µs The delay to ensure the excitation pulse is no longer
detectable.
Integration time per cycle
(pulse)
400µs The period for accumulating the signal.
Defining the number of flashes (pulses) cannot be used for comparative purposes because
the flash and intensity rate varies from system to system.
There are two timing parameters which can be optimized to adjust the performance of the
measurement as desired: time per plate or time per well, and integration time per cycle.
All low-light-level detection devices have some measurement noise in common. To average
out the measurement noise, optimization of the time per well involves accumulating as
many counts as possible. Within some range, you can reduce noise (CVs, detection limit) by
increasing the read time per well, as far as is acceptable from throughput and sample
stability considerations.
As the number of flashes (read time per well) is increased, several aspects of the data
improve:
Delta F values show less variability (better CVs).
Small Delta F values are better distinguished from noise.
Noise of background is reduced.
5014038 E 47
Page 48

SpectraMax Paradigm Multi-Mode Detection Platform User Guide
The second timing parameter which can be optimized is the Integration time per cycle. Care
must be taken in optimizing the integration time to consider noise. Delta F is higher at low
integration times, but noise is also high at low integration times. The optimum integration
time is where noise is minimized while maximizing Delta F.
In the following example, the optimum integration time (read time per cycle) is displayed to
be in the 500µs to 1000µs range, as noise is minimized and Delta F is still relatively high.
Going greater than 1000µs shows a sharp decline in Delta F without apparent improvement
in noise.
Figure 2-5: Relationship Between Integration Time, Noise, and Delta F
48 5014038 E
Page 49

Z´ is the standard statistical parameter in the high-throughput screening community for
Z´ = 1 –
| Mean
c+
– Meanc– |
3(SD
c+
) + 3(SDc– )
measuring the quality of a screening assay independent of test compounds. It is used as a
measure of the signal separation between the positive controls and the negative controls in
an assay.
The value of Z´ can be determined using the following formula:
where SD is the standard deviation, c+ is the positive control, and c– is the negative control.
A Z´ value greater than or equal to 0.4 is the generally acceptable minimum for an assay.
Higher values might be desired when results are more critical.
Z´ is not linear and can be made unrealistically small by outliers that skew the standard
deviations in either population. To improve the Z´ value, you can increase the quantity of
label in the sample, if acceptable for the assay, or increase the read time per well.
Fluorescence Polarization Read Mode
Fluorescence polarization (FP) mode measures the relative change of polarization of emitted
fluorescent compared to excitation light.
Chapter 2: Read Modes and Read Types
Fluorescence polarization detection is similar to fluorescence intensity, with the important
difference that it uses plane-polarized light, rather than non-polarized light. Plate readers
measure FP of the sample by detecting light emitted both parallel and perpendicular to the
plane of excitation.
By using a fluorescent dye to label a small molecule, its binding to a different molecule of
equal or greater size can be monitored through its speed of rotation.
When molecules are excited with polarized light, the polarization of the emitted light
depends on the size of the molecule to which the fluorophore is bound. Larger molecules
emit a higher percentage of polarized light, while smaller molecules emit a lower percentage
of polarized light because of their rapid molecular movement. For this reason FP is generally
used for molecular binding assays in high-throughput screening (HTS).
Fluorescence polarization mode returns two sets of data: one for fluorescence intensity
parallel (P) to the excitation plane, and the other for fluorescence intensity perpendicular (S)
to the excitation plane. These S and P values are used to calculate the Polarization (mP) and
Anisotropy (r) values in SoftMax Pro Software.
The Fluorescence Polarization data for a sample is evaluated based on its relative position
between the low and high control values. See Analyzing Fluorescence Polarization Data on
page 50.
5014038 E 49
Page 50

SpectraMax Paradigm Multi-Mode Detection Platform User Guide
Applications of Fluorescence Polarization
Fluorescence polarization measurements provide information on molecular orientation and
mobility, and are generally used to quantify the success of a binding reaction between a
smaller labeled ligand and a binding site at a much larger or immobilized molecule. FP can
also be used to quantify the dissociation or cleavage of the labeled ligand from a binding site.
FP is a homogeneous microplate assay technique and requires only mixing and measuring—
no wash steps are required as in an ELISA. It can also be miniaturized, which makes it useful
for high-throughput screening applications.
You can use the Protocol Manager in the SoftMax Pro Software to quickly find and open a
predefined protocol.
More protocols and updated protocols can be downloaded from the Knowledge Base on the
Molecular Devices support web site (www.moleculardevices.com/support) or from the
protocol sharing web site (www.softmaxpro.org).
The following detection cartridges have fluorescence polarization read mode capability:
Fluorescence Polarization (FP) Detection Cartridges, see page 125
Analyzing Fluorescence Polarization Data
Fluorescence polarization mode returns two sets of data: one for fluorescence intensity
parallel (P) to the excitation plane, and the other for fluorescence intensity perpendicular (S)
to the excitation plane. These S and P values are used to calculate the Polarization (mP) and
Anisotropy (r) values in SoftMax Pro Software.
FP assays in microplates are generally designed with two control samples:
LOW control sample: minimal polarization value resulting from unbound labeled ligand
only
HIGH control sample: maximum polarization value resulting from bound labeled ligand
only
The FP data for a sample is evaluated based on its relative position between the low and high
control values. Total intensity can also be determined from the raw data and is proportional
to the quantity of label in a sample.
Analyzing and interpreting fluorescence polarization data generally consists of the following:
Blank Correction on page 51
Data Reduction on page 51
Data Qualification and Validation on page 52
50 5014038 E
Page 51

Chapter 2: Read Modes and Read Types
mP = 1000
*
(parallel - (G * perpendicular))
(parallel + (G * perpendicular))
r =
(parallel - (G * perpendicular))
(parallel + (2G * perpendicular))
Blank Correction
Many fluorescence polarization assays use small fluorescent label concentrations in the
lower nm range. In this range, blank controls become significant when compared to samples.
A blank well contains everything used with the sample wells except the label and samplespecific compounds. Do not use an empty well for a blank.
Background wells, containing all assay components minus the fluorophore, should be
tested. If the signal in the background wells is more than 1/10 the signal in the wells
containing fluorophore, then background wells should be run on each assay plate. The
average raw signal from the background's parallel and perpendicular readings must be
subtracted from the raw parallel and perpendicular readings of each sample well before the
mP calculation is done.
For optimum results, Molecular Devices recommends that you run replicates for all blanks,
controls, and samples. In this case, the blank value that can be subtracted is the average
value of all blanks.
Data Reduction
Fluorescence polarization mode returns two sets of data: one for fluorescence intensity
parallel (P) to the excitation plane, and the other for fluorescence intensity perpendicular (S)
to the excitation plane. These S and P values are used to calculate the Polarization (mP) and
Anisotropy (r) values in SoftMax Pro Software.
Although the raw S and P values are the true actual values returned from the instrument, the
calculated Polarization (mP) and Anisotropy (r) values are treated as the raw data and
become the basis for further reduction calculations.
Polarization (mP) is calculated as follows:
Anisotropy (r) is calculated as follows:
The G factor, or grating factor, is used in fluorescence polarization to correct polarization
data for optical artifacts, converting relative mP data to theoretical mP data. Optical
systems, particularly with reflective components, pass light of different polarization with
different efficiency. Gfactor corrects this instrumental bias.
5014038 E 51
Page 52

SpectraMax Paradigm Multi-Mode Detection Platform User Guide
Z´ = 1 –
| Mean
c+
– Meanc– |
3(SD
c+
) + 3(SDc– )
Data Qualification and Validation
When validating the data of a fluorescence polarization measurement and the assay, the two
factors to look at are the precision value and the Z´ parameter.
The FP precision value is a measure of replicate uniformity determined by the standard
deviation of replicates at a label concentration of 1nM. Since the precision of a measured
signal also depends on the read time, the read time must also be specified. A longer read
time leads to a lower (better) precision value.
Z´ is the standard statistical parameter in the high-throughput screening community for
measuring the quality of a screening assay independent of test compounds. It is used as a
measure of the signal separation between the positive controls and the negative controls in
an assay.
The value of Z´ can be determined using the following formula:
where SD is the standard deviation, c+ is the positive control, and c– is the negative control.
A Z´ value greater than or equal to 0.4 is the generally acceptable minimum for an assay.
Higher values might be desired when results are more critical.
Z´ is not linear and can be made unrealistically small by outliers that skew the standard
deviations in either population. To improve the Z´ value, you can increase the quantity of
label in the sample, if acceptable for the assay, or increase the read time per well.
The assay window is dependent on the fluorophore lifetime and relative size of the receptor
to the ligand. Precision values are better (lower) at higher signals, which normally come from
higher label concentrations.
For a given assay window, Z´ is a downward sloping linear function. That is, as precision
values get higher (worse), the Z´ value gets lower (worse).
Precision is dependent upon assay characteristics (sample volume, label concentration) and
read time. In many assays, the characteristics are defined and cannot be changed. In this
case, the only way to improve precision is to increase the read time per well.
52 5014038 E
Page 53

AlphaScreen Read Mode
ALPHA stands for Amplified Luminescent Proximity Homogeneous Assay. AlphaScreen® is a
bead-based chemistry used to study molecular interactions between moieties A and B, for
example. When a biological interaction between A and B moves beads (coated with A and B,
respectively) together, a cascade of chemical reactions produce a greatly amplified signal.
The cascade finally resulting in signal is triggered by laser excitation (680nm), making a
photosensitizer on the A-beads convert oxygen to an excited (singlet) state. That energized
oxygen diffuses away from the A-bead. When reaching the B-bead in close proximity, it reacts
with a thioxene derivative on the B-bead generating chemiluminescence at 370nm. Energy
transfer to a fluorescent dye on the same bead shifts the emission wavelength into the
520nm to 620nm range. The limited lifetime of singlet oxygen in solvent (~4microseconds)
lets diffusion reach up to only around 200nm distance. Thus, only B-beads in the proximity
of A-beads yield signal, which indicates binding between moieties A and B.
An AlphaScreen measurement includes a light pulse, by turning on the laser diode for a
specified time, turning off the laser diode, followed by the measurement of the AlphaScreen
signal, as specified in the measurement protocol timing parameters.
Chapter 2: Read Modes and Read Types
Note: AlphaScreen beads are light sensitive. Beads are best handled under subdued
(<100lux) or green filtered (Roscolux filters #389 from Rosco, or equivalent) light
conditions. Do incubation steps in the dark.
The raw data can be normalized to counts per second. See Analyzing AlphaScreen Data on
page 54.
5014038 E 53
Page 54

SpectraMax Paradigm Multi-Mode Detection Platform User Guide
Applications of AlphaScreen
AlphaScreen reagent and assays are used for drug discovery purposes. Examples of
AlphaScreen assays include:
G-protein coupled receptor (GPCR) assay kits, for cAMP quantification or IP3
quantification.
Tyrosine Kinase assays.
Cytokine detection kits, such as TNF-alpha detection (immunoassay).
AlphaScreen read mode can also capture the Europium emission line of AlphaLISA®.
You can use the Protocol Manager in the SoftMax Pro Software to quickly find and open a
predefined protocol.
More protocols and updated protocols can be downloaded from the Knowledge Base on the
Molecular Devices support web site (www.moleculardevices.com/support) or from the
protocol sharing web site (www.softmaxpro.org).
To do AlphaScreen reads, the instrument requires AlphaScreen Detection Cartridges , see
page 107.
For more information, go to www.perkinelmer.com.
ALPHASCREEN and ALPHALISA are registered trademarks of PerkinElmer, Inc.
Analyzing AlphaScreen Data
The conversion rate of photons to counts and relative fluorescence units (RFU) is individual
for each reader. Therefore, raw data from the same microplate can seem to be different from
one instrument to the next. Also, the data format used by instrument manufacturers might
be counts normalized per second or not normalized counts, and therefore the raw data can
be different by several orders of magnitude. It is important to know that the number of
counts and the size of figures is in no way an indication of sensitivity. See Detection Limit on
page 55.
The raw data can be normalized to counts per second by selecting the Normalization option
in the SoftMax Pro Software Settings dialog. See “Creating a Protocol” in the SoftMax Pro
Software application help or user guide.
Analyzing and validating AlphaScreen data can consist of the following:
Background Correction on page 55
Detection Limit on page 55
Data Qualification and Validation on page 56
54 5014038 E
Page 55

Chapter 2: Read Modes and Read Types
Det Limit =
3 Stdev
blank
std – blank
conc
std
Background Correction
Although background is significantly lower than with fluorescence intensity measurements,
Molecular Devices recommends that you use blanks or assay controls for background
correction. The background can be effectively measured using blank replicates. When
reading a sample with small signal, an interference can occur from the afterglow of a very
strong emitting adjacent sample that was measured just before. Such cross talk can occur
through the wall of a white 384-well plate. To prevent such interference, you can select the
Interlaced Reading option in the SoftMax Pro Software Settings dialog. This option reads
only every other well in a checkerboard pattern, and then reads the microplate again to read
the previously omitted wells.
A blank well contains everything used with the sample wells except the label and samplespecific compounds. Do not use an empty well for a blank.
For optimum results, Molecular Devices recommends that you run replicates for all blanks,
controls, and samples. In this case, the blank value that can be subtracted is the average
value of all blanks.
Detection Limit
The detection limit is the smallest sample concentration that can be measured reliably above
the blank. Determining the detection limit requires taking a number of blank measurements
and calculating an average value and standard deviation for the blanks. The detection
threshold is defined as the average blank plus three standard deviations. If the average
sample value measures above the threshold, the sample can be detected at a statistically
significant level.
The detection limit can be described by the following equation:
where conc
is the concentration of the standard, StDev
std
is the standard deviation of the
Blan k
blank replicates, and blank and Std are average values of the replicates for the blank and
standard wells.
5014038 E 55
Page 56

SpectraMax Paradigm Multi-Mode Detection Platform User Guide
Z´ = 1 –
| Mean
c+
– Meanc– |
3(SD
c+
) + 3(SDc– )
Data Qualification and Validation
Z´ is the standard statistical parameter in the high-throughput screening community for
measuring the quality of a screening assay independent of test compounds. It is used as a
measure of the signal separation between the positive controls and the negative controls in
an assay.
The value of Z´ can be determined using the following formula:
where SD is the standard deviation, c+ is the positive control, and c– is the negative control.
A Z´ value greater than or equal to 0.4 is the generally acceptable minimum for an assay.
Higher values might be desired when results are more critical.
Z´ is not linear and can be made unrealistically small by outliers that skew the standard
deviations in either population. To improve the Z´ value, you can increase the quantity of
label in the sample, if acceptable for the assay, or increase the read time per well.
CAUTION! The assay plate and the instrument should be kept at room temperature,
since temperature variations cause fluctuations in signal.
56 5014038 E
Page 57

Western Blot TRF Read Mode
Protein detection is an important task for pharmaceutical and clinical research, and Western
Blots (WB), or protein immunoblots, are one of the most common methods employed for
this purpose. Various techniques are used to detect proteins on Western Blot membranes
including fluorescence, silver staining, and chemiluminescence. However, each technique has
its limitations, and there is a continuous need to improve quantitation, accuracy, and
dynamic range of Western Blots.
The Molecular Devices ScanLater™Western Blot Assay Kit is a novel system for protein
analysis that is incorporated into a SpectraMaxParadigm Multi-Mode Detection Platform.
Membranes are incubated with Eu-chelate labeled secondary antibodies or streptavidin that
bind specifically to the target protein-specific primary antibody. Europium has a long
fluorescence lifetime, on the order of 1msec, and detection is done in Time Resolved
Fluorescence (TRF) mode which significantly reduces background from auto-fluorescence or
other sources of short lifetime emissions. The membranes are placed into a microplate
reader where they are scanned with the ScanLater Western Blot (WB) Detection Cartridge.
The method does not involve enzyme detection, and the Eu-chelates are resistant to photobleaching, so the signal remains stable for long periods of time (weeks to months). This
permits repeat reading of membranes and the potential for comparison of band intensities
to known standards for more accurate quantitation.
Chapter 2: Read Modes and Read Types
The TRF detection employs photon counting, so the theoretical dynamic range is >105. In
practice, however, dynamic range is limited by saturation of binding sites on high-abundant
bands and non-specific binding to background membrane. There is also no camera
blooming, as can occur with chemiluminescence or fluorescence detection, so the system
gives sharp bands and excellent image quality.
5014038 E 57
Page 58

SpectraMax Paradigm Multi-Mode Detection Platform User Guide
Applications
Identify the nature of the protein or epitope effectively. Also, it can be used as a tool for
quantitative analysis of protein.
Use for chromatography components analysis, sucrose gradient analysis.
Test the endogenous or exogenous expression of phosphoprotein so as to detect the
phosphorylation signal.
Protein resilience in the function experiment.
Structure domain analysis.
Analysis of the protein expression level.
Analysis of protein content in the serum.
Analysis of regulatory proteins expressed in the cell cycle.
You can use the Protocol Manager in the SoftMax Pro Software to quickly find and open a
predefined protocol.
More protocols and updated protocols can be downloaded from the Knowledge Base on the
Molecular Devices support web site (www.moleculardevices.com/support) or from the
protocol sharing web site (www.softmaxpro.org).
The following detection cartridge has Western Blot TRF read mode capability:
ScanLater Western Blot (WB) Detection Cartridge
The ScanLater Western Blot (WB) Detection Cartridge can be used for top reads only.
Analyzing Western Blot TRF Data
After scanning a membrane for Western Blot data, the data are displayed in the SoftMax Pro
Software as an image. You can use the image tools in the Plate section to zoom, crop,
colorize, and adjust the intensity of the image. You can also select a region of interest (ROI)
and rescan the membrane at a higher resolution.
Western Blot membrane data are saved as a TIFFimage that can be analyzed by the imageanalysis tool of your choice. The SoftMax Pro Software comes with an installed version of the
ImageJ software from U.S. National Institute of Health (NIH).
For best results, use the Molecular Devices ScanLater™ Western Blot Assay Kit that matches
your application.
To ensure successful acquisition of Western Blot data, see the following topics:
Blocking Nonspecific Binding on page 59
Handling the Membrane on page 59
58 5014038 E
Page 59

Chapter 2: Read Modes and Read Types
Blocking Nonspecific Binding
To reduce noise, use blocking buffer to reduce non-specific protein from binding with the
membrane.
No single-blocking reagent is optimal for every antigen-antibody pair. Some primary
antibodies can exhibit greatly reduced signal or different nonspecific binding in different
blocking solutions. If you have difficulty detecting your target protein, changing the blocking
solution can dramatically improve the performance. If the primary antibody has worked well
in the past using chemiluminescent detection, try that same blocking solution for detection.
Other commonly used blocking buffers other than BSA are 3% casein and 5% non-fat milk.
Milk-based blockers can contain IgG that can crossreact with anti-goat antibodies. This can
significantly increase background and reduce antibody titer. Milk-based blockers can also
contain endogenous biotin or phosphoepitopes that can cause higher background.
To prevent background speckles on blots, use high-quality, ultra-pure water for buffers.
Do not over-block. Extended blocking times can cause loss of target protein from the
membrane.
Handling the Membrane
To scan the membrane in a SpectraMaxParadigm Multi-Mode Detection Platform, the
membrane must be placed in a Molecular Devices ScanLater™ Membrane Holder. See
Loading the Membrane into the Membrane Holder on page 143.
Note: Handle membranes by their edges only, using clean forceps. Do not touch the
membrane with gloved or bare hands.
The maximum size for a membrane is 109mm x 77mm to let it fit in the membrane holder.
The Western Blot should be prepared using standard blotting procedures for the membrane
being used. For optimal results, use Millipore Immobilon FL (IPFL00010). If using PVDF, prewet the membrane in 100% methanol.
Use enough antibody volume so that the entire membrane surface is sufficiently covered
with liquid at all times. Use heat-seal bags if the volume is limiting. Do not let an area of the
membrane dry out. Use agitation for all antibody incubations.
Small proteins can pass through the membrane during transfer (“blow-through”). To prevent
this, use a membrane with a smaller pore size or reduce the transfer time.
Allow the blot to dry for a minimum of 1 hour before detection.
Do not wrap the membrane in plastic when scanning.
5014038 E 59
Page 60

SpectraMax Paradigm Multi-Mode Detection Platform User Guide
60 5014038 E
Page 61

Chapter 3: Unpacking and Setting Up the Instrument
Before unpacking and setting up the SpectraMaxParadigm Multi-Mode Detection Platform,
prepare a dry, flat work area that has sufficient space for the instrument, host computer,
and required cables. See Instrument Specifications on page 167.
Unpacking and setting up the instrument includes the following procedures:
Unpacking the instrument and saving the original packaging. See Unpacking the
Instrument on page 63.
Removing the transport locks from the microplate drawer, the detection cartridge
drawer, and the PMT shutter. See Removing the Transport Locks on page 67.
Connecting the instrument cables and installing the controlling software. See Connecting
the Instrument Cables on page 72.
Unlocking the instrument using the controlling software. See Unlocking the
SpectraMaxParadigm Instrument on page 75.
You can also connect a gas supply line to the rear of the instrument.See Connecting and
Disconnecting a Gas Supply on page 76.
3
5014038 E 61
Page 62

SpectraMax Paradigm Multi-Mode Detection Platform User Guide
Contents of the Package
The package contains the instrument and the tools and accessories included in the accessory
tool box and that are required for installing the instrument as follows:
Table 3-1: Package Contents
Illustration Part Number Description
ED 000 095 Unpacking and setup guide
VZ 000 014 USB computer connection cable, 3meter (9.8foot)
VN 18S S01
or VN 18F F01 01
5018636 SoftMax Pro Software with Product Key
YW 000 006 Hex key, 2.0mm
Power cord, 115V
or Power cord, 230V
For a complete list of the contents of the package, see the enclosed packing list.
Note: Detection cartridges are shipped separately.
62 5014038 E
Page 63

Unpacking the Instrument
The packaging is specifically designed to protect the SpectraMaxParadigm Instrument
during transportation.
Transport locks are placed on the detection cartridge drawers, the photomultiplier tube
(PMT) shutter, and the microplate drawer to protect the instrument from damage during
shipping. Transport locks must be removed before powering on the instrument.
WARNING! LIFTING HAZARD. To prevent injury, use a minimum of two
people to lift the instrument.
Note: The shipping box and all packaging materials, including transport locks, should
be retained in case of future transport needs. Do not use tools that can damage the
packaging or the instrument.
CAUTION! When transporting the instrument, warranty claims are void if damage
during transport is caused by improper packing.
Chapter 3: Unpacking and Setting Up the Instrument
This procedure requires the following tool:
Table 3-2: Required Tool
Part Number Description
Not applicable Box cutter
5014038 E 63
Page 64

SpectraMax Paradigm Multi-Mode Detection Platform User Guide
To unpack the instrument:
1. Check the box for visible damage that occurred during transportation. In case of
damage, inform the supplier immediately and keep the damaged packaging.
CAUTION! Keep the box upright. Do not tip or tilt the box or place it on its side.
2. With the box facing up as indicated on the packaging, use a box cutter to carefully cut
open the side of the box labeled Open Here.
Figure 3-1: Opening the Box
64 5014038 E
Page 65

Chapter 3: Unpacking and Setting Up the Instrument
3. Grasp the handle on the cardboard and slide the instrument out of the box.
Tip: It might be easier if a second person holds the box in place while the
instrument is slid out on the cardboard.
Figure 3-2: Sliding the Instrument Out of the Box
5014038 E 65
Page 66

SpectraMax Paradigm Multi-Mode Detection Platform User Guide
1
2
4. Remove the accessory tool box.
Figure 3-3: The Instrument, the Accessories Toolbox, and the Foam Packing
Item Description
1 Accessory Tool Box
2 SpectraMaxParadigm Multi-Mode Detection Platform
CAUTION! Keep the instrument upright and level when lifting. Do not tip or shake
the instrument to prevent damage to the moving components inside the
instrument.
5. Lift one end of the instrument slightly and remove the foam packaging from that end.
6. Gently return the instrument to the ground.
7. Lift the other end of the instrument slightly and remove the foam packaging from that
end.
66 5014038 E
Page 67

8. Gently return the instrument to the ground.
9. Remove the large plastic bag from the instrument. It might be necessary to slightly lift
the instrument to get the bag over the feet.
10. With one person on each end, lift the instrument and gently place the instrument on a
dry, flat area. For information about the weight of the instrument, see Instrument
Specifications on page 167.
Note: The feet are sticky and the instrument does not slide well. It can mark the
work surface if slid.
Removing the Transport Locks
CAUTION! The instrument can be damaged if the transport locks are not removed
before the instrument is powered on.
Transport locks are placed on the detection cartridge drawers, the photomultiplier tube
(PMT) shutter, and the microplate drawer to protect the instrument from damage during
shipping. Transport locks must be removed before powering on the instrument.
Chapter 3: Unpacking and Setting Up the Instrument
This procedure requires the following tool:
Table 3-3: Required Tool
Illustration Part Number Description
YW 000 006 Hex key, 2.0mm
CAUTION! Do not touch or loosen screws or parts other than those specifically
designated in the instructions. Doing so could cause misalignment and possibly void
the warranty.
CAUTION! The front cover is held onto the front of the instrument by powerful
magnets. Keep magnetic storage devices or strips, such as hard drives, key cards, and
credit cards, away from the instrument covers.
5014038 E 67
Page 68

SpectraMax Paradigm Multi-Mode Detection Platform User Guide
To remove the transport locks:
1. Firmly pull on the top front cover to remove it and then set it aside. The top front cover
is held onto the front of the instrument by powerful magnets.
Tip: It is easiest to remove the top front cover by pulling from the bottom.
Figure 3-4: Detection Cartridge Drawer Covers Removed
2. Firmly pull on the bottom front cover to remove it and then set it aside. The bottom
front cover is held onto the front of the instrument by powerful magnets.
Tip: It is easiest to remove the bottom front cover by pulling from the top.
3. Turn the PMT shutter transport lock counter-clockwise until it is free of the threaded
hole, and then remove it from the instrument. Store the transport lock in the instrument
accessories toolbox.
68 5014038 E
Page 69

Chapter 3: Unpacking and Setting Up the Instrument
3
1
4
2
5
Figure 3-5: PMT Shutter and Detection Cartridge Drawer Transport Locks
Item Description
1 PMT shutter transport lock
2 Top detection cartridge drawer
3 Top detection cartridge drawer transport lock
4 Bottom detection cartridge drawer
5 Bottom detection cartridge drawer transport lock
4. Turn the top detection cartridge drawer transport lock counter-clockwise until it is free of
the threaded hole in the floor of the drawer compartment.
5. Gently slide the top detection cartridge drawer forward until it is outside of the main
instrument.
5014038 E 69
Page 70

SpectraMax Paradigm Multi-Mode Detection Platform User Guide
2
3
1
4
Figure 3-6: Detection Cartridge Drawer Transport Lock
Item Description
1 Top detection cartridge drawer
2 Top detection cartridge drawer transport lock
3 Bottom detection cartridge drawer
4 Bottom detection cartridge drawer transport lock
6. Lower the top detection cartridge drawer transport lock to remove it from the top
detection cartridge drawer. Store the transport lock in the instrument accessories
toolbox.
7. Gently push the top detection cartridge drawer back inside the instrument.
8. Turn the bottom detection cartridge drawer transport lock counter-clockwise until it is
free of the threaded hole in the top of the drawer compartment.
9. Gently slide the bottom detection cartridge drawer forward until it is outside of the main
instrument.
10. Lift the bottom detection cartridge drawer transport lock to remove it from the bottom
detection cartridge drawer. Store the transport lock in the instrument accessories
toolbox.
11. Replace the top front cover by aligning the magnets on the inside of the top front cover
with the magnets on the instrument base.
12. Replace the bottom front cover by aligning the magnets on the inside of the bottom
front cover with the magnets on the instrument base.
70 5014038 E
Page 71

Chapter 3: Unpacking and Setting Up the Instrument
5
1
2
43
6
13. Gently pull the yellow tab protruding from the microplate chamber door to open the
door. The microplate drawer door must be held open manually while removing the
transport lock.
Note: Be careful not to tear the yellow tab. It must remain attached to the
transport lock to make it easier to open the microplate chamber door.
Figure 3-7: Microplate Drawer Transport Lock
Item Description
1 Screw #1 fastens the lock to the internal frame of the instrument
2 Screw #2 fastens the lock to the microplate drawer
3 Screw #3 fastens the lock to the microplate drawer
4 Microplate drawer
5 Microplate chamber door in open position
6 Microplate drawer transport lock
14. Use the provided 2.0mm hex key to loosen screw #1 in the upper-left corner of the
transport lock until the lock disconnects from the instrument frame. The screw is
equipped with a retaining washer that prevents it from being removed from the lock.
15. Loosen screws #2 and #3 until the lock comes free of the microplate drawer. The screws
are equipped with retaining washers that prevent them from being removed from the
lock. Store the transport lock in the instrument accessories toolbox.
16. Gently close the microplate chamber door.
17. Save the original carton, foam inserts, accessories toolbox, and transport locks in case
the instrument must be shipped in the future.
5014038 E 71
Page 72

SpectraMax Paradigm Multi-Mode Detection Platform User Guide
Connecting the Instrument Cables
The power cords and USB cables connect to the ports on the rear of the instrument.
This procedure requires the following tools and accessories:
Table 3-4: Required Tools and Accessories
Illustration Part Number Description
VZ 000 014 USB computer connection cable, 3meter (9.8foot)
VN 18S S01
or VN 18F F01 01
5018636 SoftMax Pro Software with Product Key
Power cord, 1meter (3.3foot)
Connect the instrument to the controlling computer using the supplied USB cable. Use the
power cord supplied with the instrument to connect the instrument to a grounded wall
outlet. You can optionally connect a gas supply line. A gas supply line is not supplied in the
package.
72 5014038 E
Page 73

Chapter 3: Unpacking and Setting Up the Instrument
1
5
3
4
2
Figure 3-8: Power Switch, Fuses, and Connection Ports
Item Description
1 USB port
2 Gas inlet quick-connect fitting
3 Power switch
4 Fuse carrier
5 Power port
To connect the instrument cables:
1. Make sure that the instrument and host computer are placed on a dry, flat work area
with sufficient space for both devices and the required cables. To ensure sufficient
ventilation and provide access for disconnecting power from the instrument, maintain a
20cm to 30cm (7.9in. to 11.8in.) gap between the rear of the instrument and the wall.
2. Make sure that the power switch on the rear of the instrument is in the Offposition. See
Turning the Instrument On and Off on page 82.
Do not turn on the power to the instrument until after the software has been installed.
3. Turn on the power to the host computer.
5014038 E 73
Page 74

SpectraMax Paradigm Multi-Mode Detection Platform User Guide
4. Install the SoftMax Pro Software on the computer. See the SoftMax Pro Software
installation guide or user guide.
Note: The instrument is supported by version 6.0 or later.
5. Connect one end of the supplied USB cable to one of the USB ports on the computer,
and then connect the other end of the USB cable to the USB port on the rear of the
instrument.
6. Connect the supplied power cord to the power port on the rear of the instrument, and
then connect the other end of the power cord to a grounded electrical wall outlet.
It might be necessary to remove the temporary warning label before connecting the
power cord to the instrument.
7. If desired, connect a gas supply to the instrument. See Connecting and Disconnecting a
Gas Supply on page 76.
8. Set the power switch on the rear of the instrument to the On position and wait for the
instrument to complete its initialization routine. See Turning the Instrument On and Off
on page 82.
It might be necessary to install USB drivers before starting the software.
9. Start the SoftMax Pro Software.
74 5014038 E
Page 75

Unlocking the SpectraMaxParadigm Instrument
When a SpectraMaxParadigm Instrument is first installed, the hardware transport locks
need to be removed. As a safety precaution, internal locks controlled by the software
prevent the drawers from opening until the instrument is detected and initialized by the
SoftMax Pro Software.
Note: Do not install detection cartridges until after you have completed the following
instructions to unlock the drawers and initialize the instrument.
To unlock the drawers and initialize the instrument:
1. Make sure that the hardware transport locks have been removed. See Removing the
Transport Locks on page 67.
CAUTION: The instrument can be damaged if all the transport locks are not
removed before unlocking the drawers and initializing the instrument.
2. Make sure that all drawers have been pushed back into the instrument, the front panels
have been replaced, and the microplate door is closed.
3. Make sure that the instrument is connected to the host computer and to a power
source, and that the has been installed on the host computer. See Connecting the
Instrument Cables on page 72.
Chapter 3: Unpacking and Setting Up the Instrument
Note: If you are using a 9-pin serial-to-USBadapter cable, install the driver for the
adapter on your computer before connecting the cable to the instrument. To
make sure the adapter has been correctly installed, open the Windows Device
Manager and check for the presence of a COM port, and that there are no
conflicts with the COM port.
4. Turn on the power switch on the rear of the instrument.
If the Standby button on the front lower-right corner of the instrument is illuminated,
press the button to take the instrument out of standby mode.
The LEDs on the status panel flash and turn off, and then the amber LED turns on
indicating that the instrument drawers are locked.
5. Start the SoftMax Pro Software. See the SoftMax Pro Software installation guide or user
guide.
The amber LED on the status panel turns off and the green LED turns on, indicating a
successful connection between the instrument and the SoftMax Pro Software.
6. After successfully connecting to the instrument, the Instrument Unlocking Procedure
wizard is displayed.
7. If the Instrument Unlocking Procedure wizard does not open, then use the Instrument
Connection dialog to select and connect to the instrument. See the installation guide or
user guide.
5014038 E 75
Page 76

SpectraMax Paradigm Multi-Mode Detection Platform User Guide
Note: If the instrument does not show in the Available Instruments list of the
Instrument Connection dialog, then click Refresh above the list.
8. Follow the on-screen instructions in the Instrument Unlocking Procedure wizard to
unlock the drawers and initialize the instrument.
After completing the Instrument Unlocking Procedure wizard, the instrument does an
initialization procedure that moves the optics and microplate drawers to home positions.
The green LED on the status panel turns on, the amber LED flashes and turns off, and then
the green LED remains on. You can install the desired detection cartridges in the instrument.
Connecting and Disconnecting a Gas Supply
A gas supply, such as a CO2, nitrogen, or other gas supply, can be connected to the
SpectraMaxParadigm Multi-Mode Detection Platform. This is useful when reading plates as
part of a cell-based assay in which a CO2environment needs to be provided to keep cell
cultures alive. The gas supply is not regulated or monitored by the instrument or software.
These procedures require the following tools and accessories:
Table 3-5: Required Tools and Accessories
Part Number Description
Not applicable Polyurethane tubing, outside diameter = 4.0mm
Not applicable Slot-head screwdriver
S MS 135 100 Gas inlet unlock tool (not provided with the instrument)
76 5014038 E
Page 77

Chapter 3: Unpacking and Setting Up the Instrument
1
5
3
4
2
Figure 3-9: Power Switch, Fuses, and Connection Ports
Item Description
1 USB port
2 Gas inlet quick-connect fitting
3 Power switch
4 Fuse carrier
5 Power port
WARNING!Use a compressed gas supply in a well-ventilated area. The
instrument is not air-tight, and so gas can escape into the atmosphere surrounding
the instrument. When using potentially toxic gas, always observe the applicable
cautionary procedures as defined by your safety officer to maintain a safe working
environment.
5014038 E 77
Page 78

SpectraMax Paradigm Multi-Mode Detection Platform User Guide
To connect a gas supply to the instrument:
1. Make sure that the power switch on the rear of the instrument is in the off position.
2. Using a slot-head screwdriver, pry off the small black cap on the rear of the instrument
along the right edge to access the quick-connect fitting. Save the cap for later use.
3. Connect the tubing to the quick-connect fitting.
4. Connect the other end of the tubing to the gas supply.
5. Set the gas supply to the desired input pressure.
Note: For the maximum permitted air supply pressure for the gas inlet and
polyurethane tubing specifications, see Instrument Specifications on page 167.
To disconnect the polyurethane tubing from the instrument:
1. Make sure that the power switch on the rear of the instrument is in the off position.
2. Turn off the gas supply at the source and wait a sufficient time for the pressure to
dissipate.
3. Use the gas inlet unlock tool to press the quick-connect fitting and release the tubing.
Note: The gas inlet unlock tool is not supplied with the instrument.
4. Remove the tubing from the quick-connect fitting.
5. Replace the black cap over the quick-connect fitting.
78 5014038 E
Page 79

Chapter 4: Using the Instrument
Before operating the instrument or doing maintenance operations, make sure that you are
familiar with the Safety Information on page 7 and make sure it is set up as instructed in
Unpacking and Setting Up the Instrument on page 61.
For information on controlling the instrument with the software, see the SoftMax Pro
Software application help or user guide.
This section includes the following topics:
Front Panel Controls and Indicators on page 80
Turning the Instrument On and Off on page 82
Loading and Unloading Microplates on page 90
Using Detection Cartridges on page 84
4
5014038 E 79
Page 80

SpectraMax Paradigm Multi-Mode Detection Platform User Guide
2
5
6
7
3
1
8
9
4
Front Panel Controls and Indicators
The front panel of the SpectraMaxParadigm Instrument has LED status indicators that
provide information about instrument status, and a key pad that gives you hardware-based
controls for opening and closing the detection cartridge drawers and the microplate drawer.
To open or close the microplate drawer, press the load/eject button. See Loading and
Unloading Microplates on page 90.
To open or close a detection cartridge drawer, press the TOP READ or BOTTOM READ
button. See Using Detection Cartridges on page 84.
Table 4-1: The SpectraMaxParadigm Multi-Mode Detection Platform
Item Description
1 Key pad
2 Load/eject button for top-read detection cartridge drawer
3 Load/eject button for microplate drawer
80 5014038 E
4 Load/eject button for bottom-read detection cartridge drawer
5 Status LEDs
6 Top-read detection cartridge drawer
7 Microplate drawer
8 Bottom-read detection cartridge drawer
9 Standby button
Page 81

Chapter 4: Using the Instrument
Status Indicators
The color and activity of the LED status indicators on the front of the instrument provide
information about the instrument status.
Table 4-2: LED Status Indicators
Color Bar Activity Instrument Status
Green LED is glowing solidly. The instrument is in the ready state.
Orange LED is blinking. The instrument is not ready due to an error occurring during
initialization. View the error message in the software.
Green LED is glowing solidly, and
orange LED is glowing solidly or
blinking.
Red LED is glowing solidly. The front panel has been removed from a detection cartridge
All LEDs are circulating horizontally. The instrument is performing a read operation.
The instrument is communicating with the software.
Optics, drawers, or other mechanical items are moving within
the instrument.
drawer, or the microplate chamber door has not closed
properly.
5014038 E 81
Page 82

SpectraMax Paradigm Multi-Mode Detection Platform User Guide
1
5
3
4
2
Turning the Instrument On and Off
The power switch and power connection are on the rear of the instrument.
Figure 4-1: Power Switch, Fuses, and Connection Ports
Item Description
1 USB port
2 Gas inlet quick-connect fitting
3 Power switch
4 Fuse carrier
5 Power port
To ensure sufficient ventilation and provide access for disconnecting power from the
instrument, maintain a 20cm to 30cm (7.9in. to 11.8in.) gap between the rear of the
instrument and the wall.
82 5014038 E
Page 83

Chapter 4: Using the Instrument
1
3
2
To turn the instrument on or off, press the power switch to place the rocker in the on or off
position.
Table 4-3: Power Switch
Item Description
1 Power switch
2 On
3 Off
Before connecting or disconnecting the power cord, make sure that the power switch on the
rear of the instrument is in the Offposition.
After you use the switch on the rear of the instrument to power on the instrument, check to
see if the Standby button on the front of the instrument is illuminated. If it is, then press the
Standby button to place the instrument in operation mode. See Standby Button on page 83.
Standby Button
In the lower-right area of the is the Standby button. When the power switch on the rear of
the instrument is in the ON position, press the Standby button to switch the instrument
between standby mode and operation mode.
In standby mode, the Standby button illuminates and all LEDs on the status indicator
panel turn off. Power is removed from the internal components to prevent movement
or operation of the instrument.
In operation mode, the Standby button is not illuminated and the LEDs on the status
indicator panel turn on. Power is applied to the internal components to permit normal
operation of the instrument.
After you use the switch on the rear of the instrument to power on the instrument, check to
see if the Standby button on the front of the instrument is illuminated. If it is, then press the
Standby button to place the instrument in operation mode. See Turning the Instrument On
and Off on page 82.
5014038 E 83
Page 84

SpectraMax Paradigm Multi-Mode Detection Platform User Guide
Using Detection Cartridges
The SpectraMaxParadigm Multi-Mode Detection Platform is a modular multi-mode
microplate reader. User-installable and removable detection cartridges let the instrument be
configured for specific applications, and they expand the capabilities of the instrument. A
detection cartridge contains its own independent light source, optics, and electrical
components needed to do specific read modes for specific applications.
Application notes with specific application protocol suggestions can be found in the
Information Center and the Knowledge Base on the Molecular Devices web site at
www.moleculardevices.com.
A detection cartridge can occupy one or more positions, depending on size and functionality.
Installation and removal of each detection cartridge is the same regardless of the number of
slots it occupies in the detection cartridge drawer or whether it is installed in the top or
bottom detection cartridge drawer. There are six (6) slots available for installing detection
cartridges in each of the two (2) detection cartridge drawers. The software detects the
installed cartridge configuration and does all measurement types supported by the
detection cartridges.
CAUTION! To prevent dust from collecting inside the instrument, the detection
cartridge drawer should be open only for as long as necessary to install or remove
detection cartridges. Keep the detection cartridge drawer closed whenever possible.
For instructions for installing or removing detection cartridges, see the following topics:
Installing a Detection Cartridge on page 84
Removing a Detection Cartridge on page 88
For information about the applications and read modes enabled for a specific detection
cartridge, see Available Detection Cartridges on page 93.
Installing a Detection Cartridge
The installed detection cartridges are automatically detected by the SoftMax Pro Software.
When detected, they show in the SoftMax Pro Software Settings dialog enabling the read
modes for the installed detection cartridges. The detection cartridges must be installed in the
SpectraMaxParadigm Instrument to enable them for data acquisition in the SoftMax Pro
Software.
There are six (6) slots available for installing detection cartridges in each of the two (2)
detection cartridge drawers.
Note: When using the SoftMax Pro Software in offline mode, all detection cartridges
are available in the Settings dialog.
84 5014038 E
Page 85

Chapter 4: Using the Instrument
To install a detection cartridge:
1. Press the TOP READ button on the front panel to open the top detection cartridge
drawer, or press the BOTTOM READ button on the front panel to open the bottom
detection cartridge drawer.
CAUTION! To prevent damage to the installed detection cartridges and the
instrument, do not manually slide the detection cartridge drawer in or out when
the instrument is powered on or when one or more detection cartridges are
installed in the drawer.
Figure 4-2: Top Detection Cartridge Drawer Open
2. Select the slot or slots on the detection cartridge drawer for the detection cartridge.
3. Remove the red cap from the detection cartridge before installation, if supplied with the
detection cartridge.
4. Position the two small holes and the connector pins on the detection cartridge over the
holder pins and connector for the detection cartridge slot.
Note: Some detection cartridges occupy more than one slot, and some cannot be
installed in the rear-most slot. For the installation requirements for a specific
detection cartridge, see Available Detection Cartridges on page 93.
5014038 E 85
Page 86

SpectraMax Paradigm Multi-Mode Detection Platform User Guide
4
1
3
2
5
Figure 4-3: Top View of Detection Cartridge Drawer
Item Description
1 Holder pin
2 Holder pin
3 Detection cartridge connector
4 Retaining rod
5 Retaining rod
5. Gently but firmly push the detection cartridge onto the holder pins and connector so
that the detection cartridge is fully seated in the detection cartridge slot.
6. Push the two retaining clips on either side of the detection cartridge so that they fasten
to the retaining rods on each side of the detection cartridge drawer.
Note: Detection cartridges that occupy more than one slot have two retaining
clips on each side. Fasten all retaining clips to the retaining rods.
86 5014038 E
Page 87

Chapter 4: Using the Instrument
4
1
2
3
5
Figure 4-4: Detection Cartridge Retaining Clips and Retaining Rods
Item Description
1 Detection cartridge
2 Retaining clip unattached
3 Retaining clip attached
4 Retaining rod
5 Retaining rod
7. Install more detection cartridges, if desired.
8. Ensure that all the installed cartridges are evenly aligned.
9. Press the TOP READ or BOTTOM READ button on the front panel to close the detection
cartridge drawer.
10. Start the SoftMax Pro Software and connect to the instrument.
If the software is running and connected to the instrument, go to the Operations tab in
the ribbon and click Refresh to let the software detect the installed detection cartridges.
CAUTION! To prevent dust from collecting inside the instrument, the detection
cartridge drawer should be open only for as long as necessary to install or remove
detection cartridges. Keep the detection cartridge drawer closed whenever
possible.
5014038 E 87
Page 88

SpectraMax Paradigm Multi-Mode Detection Platform User Guide
4
1
2
3
5
Removing a Detection Cartridge
It is not necessary to remove a detection cartridge when it is not in use. You can, however,
remove a detection cartridge to make room for other detection cartridges or when the
instrument is being packed for shipping. After a detection cartridge is removed, it should be
stored in its detection cartridge box in a dry, dust-free, controlled environment.
To remove a detection cartridge from the instrument:
1. Press the TOP READ button on the front panel to open the top detection cartridge
drawer, or press the BOTTOM READ button on the front panel to open the bottom
detection cartridge drawer.
CAUTION! To prevent damage to the installed detection cartridges and the
instrument, do not manually slide the detection cartridge drawer in or out when
the instrument is powered on or when one or more detection cartridges are
installed in the drawer.
Figure 4-5: Detection Cartridge Retaining Clips and Retaining Rods
Item Description
1 Detection cartridge
88 5014038 E
2 Retaining clip unattached
3 Retaining clip attached
Page 89

Chapter 4: Using the Instrument
Figure 4-5: Detection Cartridge Retaining Clips and Retaining Rods (continued)
Item Description
4 Retaining rod
5 Retaining rod
2. Place the end of a slot-head screwdriver in the slot on the retaining clip and use it as a
lever to unfasten the retaining clips on either side of the detection cartridge.
Note: Detection cartridges that occupy more than one slot have two retaining
clips on each side. Unfasten all retaining clips from the retaining rods.
Note: When removing a detection cartridge from the bottom detection cartridge
drawer, keep a firm hold of the detection cartridge. When all retaining clips are
released, the detection cartridge drops out.
3. Lift the detection cartridge straight up or pull it down off of the connector and holder
pins on the detection cartridge slot.
4. Place the red cap on the detection cartridge, if supplied with the detection cartridge.
5. When not in use, store the detection cartridge in its original packaging.
6. Remove more detection cartridges, if desired.
7. Press the TOP READ or BOTTOM READ button on the front panel to close the detection
cartridge drawer.
CAUTION! To prevent dust from collecting inside the instrument, the detection
cartridge drawer should be open only for as long as necessary to install or remove
detection cartridges. Keep the detection cartridge drawer closed whenever
possible.
5014038 E 89
Page 90

SpectraMax Paradigm Multi-Mode Detection Platform User Guide
2
3
4
1
Loading and Unloading Microplates
To load or unload a microplate:
1. On the front panel of the instrument, press the load/eject button to move the
microplate drawer outside of the instrument.
2. Place the microplate on or remove it from the microplate drawer.
Note: Microplates can be placed on the microplate drawer in either landscape or
portrait orientation.
Figure 4-6: Microplate Drawer with Microplate Loaded in Landscape Orientation
Item Description
1 Well A1 on the microplate in landscape orientation
2 Microplate height sensor
3 Load/eject button for the microplate drawer
4 Microplate drawer
3. Press the load/eject button to move the microplate drawer inside of the instrument.
CAUTION!To prevent damage to the instrument, the microplate height and read
height must be set accurately before starting a read. See the SoftMax Pro Software
application help or user guide.
90 5014038 E
Page 91

Chapter 4: Using the Instrument
Microplate Orientation
Insert the microplate in the orientation that matches the orientation selected in the
software. See the SoftMax Pro Software application help or user guide.
Landscape puts the A1 location in the upper-left corner closest to the instrument.
Portrait puts the A1 location in the upper-right corner closest to the instrument.
Opposite Landscape puts the A1 location in the lower-right corner farthest from the
instrument.
Opposite Portrait puts the A1 location in the lower-left corner farthest from the
instrument.
Selecting Suitable Microplate Types
Depending on the application, the can read and strip wells. For micro-volume
measurements, the instrument supports SpectraDrop 24-well Micro-Volume Microplates
and SpectraDrop 64-well Micro-Volume Microplates. The instrument is capable of reading
1536-well microplates when used with specific detection cartridges.
As well as the microplates supported in the SoftMax Pro Software microplate list, you can
use the software to define a new microplate type using the specifications from the
manufacturer for well size, spacing, and distance from the microplate edge.
The type of microplate and the way it is handled can have an effect on the measurement
performance of the instrument. Select a microplate type with properties suited for the
application and for use with multi-mode microplate readers.
CAUTION!To prevent damage to the instrument, the height of the microplate must
not exceed 25mm, including the lid if the microplate is lidded.
The following are some general microplate handling guidelines:
Never touch the clear well bottom of microplates.
Visually inspect the bottom and rim of the microplate before use to make sure it is free of
dirt and contaminants.
Keep unused microplates clean and dry.
Make sure the strips on strip plates are inserted correctly and level with the frame.
Do not use V-bottom microplates unless the performance has been tested and validated
with this instrument. Irregular plastic density in the tip of the well can cause inaccurate
measurements.
For recommendations on microplate types to use for a specific detection cartridge, see
Available Detection Cartridges on page 93.
5014038 E 91
Page 92

SpectraMax Paradigm Multi-Mode Detection Platform User Guide
92 5014038 E
Page 93

Chapter 5: Available Detection Cartridges
The SpectraMaxParadigm Multi-Mode Detection Platform is a modular multi-mode
microplate reader. User-installable and removable detection cartridges let the instrument be
configured for specific applications, and they expand the capabilities of the instrument. A
detection cartridge contains its own independent light source, optics, and electrical
components needed to do specific read modes for specific applications.
Application notes with specific application protocol suggestions can be found in the
Information Center and the Knowledge Base on the Molecular Devices web site at
www.moleculardevices.com.
For information about the supported detection cartridges, see the following topics:
Absorbance Detection Cartridge, see page 94
Tunable Wavelength (TUNE) Detection Cartridge, see page 97
Multi-Mode (MULTI) Detection Cartridge, see page 102
AlphaScreen Detection Cartridges , see page 107
Cisbio HTRF Detection Cartridge on page 110
Time Resolved Fluorescence (TRF) Detection Cartridge, see page 113
Fluorescence Intensity (FI) Detection Cartridges, see page 116
Fluorescence Intensity (FI) GeneBLAzer Detection Cartridge, see page 119
Fluorescence Intensity Dual Label (FI-DL) (MultiTox-Fluor) Detection Cartridge, see page
122
Fluorescence Polarization (FP) Detection Cartridges, see page 125
Glow Luminescence (LUM) Detection Cartridges, see page 128
Dual Color Luminescence (LUM) (BRET2) Detection Cartridge, see page 131
Dual Color Luminescence (LUM) (Chroma-Glo) Detection Cartridge, see page 136
ScanLater Western Blot (WB) Detection Cartridge on page 142
Chapter 5: Available Detection Cartridges
Custom detection cartridges can be designed to meet the specific needs of your application.
For more information, see your Molecular Devices representative.
5014038 E 93
Page 94

SpectraMax Paradigm Multi-Mode Detection Platform User Guide
Absorbance Detection Cartridge
The Absorbance Detection Cartridge combines wavelength scanning and a broad spectrum
wavelength range necessary to address a variety of nucleic acids, proteins, ELISAs, and
immunoassays found in the laboratory. The Absorbance Detection Cartridge uses a
monochromator to do absorbance endpoint, kinetic, well scan, and spectrum read types
(wavelength scanning) measurements.
The Absorbance Detection Cartridge consists of two components: a detection component
(ABS-DET) which measures the absorbance, and an excitation component (ABS-MONO)
which sets the absorbance wavelengths. The detection component is installed in the top
read detection cartridge drawer and occupies one (1) detection cartridge slot. The excitation
component is installed in the bottom read detection cartridge drawer and occupies two (2)
detection cartridge slots. The two components must be installed to do absorbance
measurements with the SpectraMaxParadigm Multi-Mode Detection Platform.
For installation instructions, see Installing a Detection Cartridge on page 84.
Typical Applications
Nucleic Acid Quantitation
Protein Quantitation
ELISA
Immunoassay
Proliferation/Viability
You can create protocols that use the Absorbance Detection Cartridge in the SoftMax Pro
Software. For information on creating protocols, see “Creating a Protocol” in the SoftMax
Pro Software application help or user guide.
You can use the Protocol Manager in the SoftMax Pro Software to quickly find and open a
predefined protocol.
More protocols and updated protocols can be downloaded from the Knowledge Base on the
Molecular Devices support web site (www.moleculardevices.com/support) or from the
protocol sharing web site (www.softmaxpro.org).
94 5014038 E
Page 95

Chapter 5: Available Detection Cartridges
About Absorbance
Absorbance is the quantity of light absorbed by a solution. To measure absorbance
accurately, it is necessary to eliminate light scatter. If there is no turbidity, then
absorbance=optical density.
A=log10(I0/I)=–log10(I/I0)
where I0is incident light before it enters the sample, I is the intensity of light after it passes
through the sample, and A is the measured absorbance.
The Absorbance Detection Cartridge uses a monochromator with wavelength range of
230nm to 1000nm and a 4nm bandwidth to measure the absorbance of samples.
For more information about absorbance, see Absorbance Read Mode on page 23.
Microplate Recommendations
The following information is specific to this detection cartridge. For general microplate
selection and handling guidelines, see Selecting Suitable Microplate Types on page 91.
Table 5-1: Microplate Selection Guidelines for the Absorbance Detection Cartridge
Read Mode Microplate Type Other Considerations
Absorbance
(ABS)
allclear, clearbottom,
UVclear, flatbottom
When an application specifies a surface treatment, use
only microplates with the correct treatment.
Molecular Devices recommends using an unlidded plate
for absorbance measurements.
5014038 E 95
Page 96

SpectraMax Paradigm Multi-Mode Detection Platform User Guide
Measurement Specifications
The specifications for measurements using the Absorbance Detection Cartridge are shown in
the following table.
Table 5-2: Measurement Specifications for the Absorbance Detection Cartridge
Item Description
Detection cartridge name Absorbance Detection Cartridge
Short name ABS-MONO, ABS-DET
Part number 0200-7000
Weight ABS-MONO: 2.4 lbs. (1.1 kg)
Read Modes Absorbance (ABS)
Type NA
Number of slots ABS-MONO: 1 top
ABS-DET: 0.9 lbs. (0.4 kg)
ABS-DET: 2 bottom
Wavelength range 230nm to 1000nm
Bandwidth: 4nm
Wavelength Scan Speed 35nm per second
Wavelength Accuracy ±1.5nm
Wavelength Repeatability ±0.5nm
Photometric Range 0OD to 3.5OD
Photometric Resolution 0.0001OD
Photometric Accuracy at 2OD, 405nm ±(2% + 0.010)OD
Photometric Precision at 2OD, 405nm ±(1% + 0.005)OD
96 5014038 E
Page 97

Tunable Wavelength (TUNE) Detection Cartridge
The Tunable Wavelength (TUNE) Detection Cartridge enables several detection modes,
including:
Fluorescence Intensity (FL), see About Fluorescence Intensity on page 98.
Time-Resolved Fluorescence (TRF), see About Time-Resolved Fluorescence on page 99.
Luminescence (LUM), see About Luminescence on page 99.
The spectral optimization feature of the Tunable Wavelength (TUNE) Detection Cartridge can
help to get the maximum signal-to-background ratio for most fluorophores or luminescence
labels that are compatible with the wavelength ranges.
Using a Spectrum read, you can define a fixed excitation wavelength and scan the emission
wavelengths, or define a fixed emission wavelength and scan the excitation wavelengths. The
spectral optimization helps to get the maximum signal-to-background ratio from a
fluorescent or fluorescently labeled analyte. For more information on using the spectral
optimization feature, see the SoftMax Pro Software application help or user guide.
The Tunable Wavelength (TUNE) Detection Cartridge occupies three (3) slots in the detection
cartridge drawer. It can be installed in either the top detection cartridge drawer for top
reading, or in the bottom detection cartridge drawer for bottom reading.
Chapter 5: Available Detection Cartridges
For installation instructions, see Installing a Detection Cartridge on page 84.
Note:Molecular Devices recommends that you install the Tunable Wavelength (TUNE)
Detection Cartridge in the top detection cartridge drawer when running time-resolved
fluorescence or glow luminescence read modes.
The can do the following read types:
End Point, see Endpoint Read Type on page 20.
Kinetic, see Kinetic Read Type on page 20.
Well Scan, see Well Scan Read Type on page 21.
Spectrum, see Spectrum Read Type on page 21.
You can create protocols that use the Tunable Wavelength (TUNE) Detection Cartridge in the
SoftMax Pro Software. For information on creating protocols, see “Creating a Protocol” in
the SoftMax Pro Software application help or user guide.
You can use the Protocol Manager in the SoftMax Pro Software to quickly find and open a
predefined protocol.
More protocols and updated protocols can be downloaded from the Knowledge Base on the
Molecular Devices support web site (www.moleculardevices.com/support) or from the
protocol sharing web site (www.softmaxpro.org).
5014038 E 97
Page 98

SpectraMax Paradigm Multi-Mode Detection Platform User Guide
About Fluorescence Intensity
In fluorescence intensity read mode, the source light is directed through a tunable excitation
filter and then focused by an objective lens from above or below the microplate. The filter
passes only the specified wavelength band necessary to excite samples. The objective lens
collects the resulting fluorescence and directs it through a tunable emission filter to separate
background light from the specific wavelengths generated by samples. This signal is detected
by a photo multiplier tube.
The Tunable Wavelength (TUNE) Detection Cartridge contains filter sets for measuring
fluorescence intensity of most fluorophores that are compatible with the available
wavelength ranges. The uses high-power LEDs and tunable filters together with the photon
counting detection of the instrument, resulting in excellent detection limits and linear
dynamic range at short read times. See Measurement Specifications on page 100.
Using a Spectrum read, you can define a fixed excitation wavelength and scan the emission
wavelengths, or define a fixed emission wavelength and scan the excitation wavelengths. The
spectral optimization helps to get the maximum signal-to-background ratio from a
fluorescent or fluorescently labeled analyte. For more information on using the spectral
optimization feature, see the SoftMax Pro Software application help or user guide.
For more information about fluorescence intensity, see Fluorescence Intensity Read Mode
on page 28.
98 5014038 E
Page 99

Chapter 5: Available Detection Cartridges
About Time-Resolved Fluorescence
Time-resolved fluorescence (TRF) is a measurement technique that depends on three
characteristics that lead to better discrimination between the specific signal, proportional to
the quantity of label, and the unspecific fluorescence resulting from background and
compound interference:
Pulsed excitation light sources
Time-gated electronics faster than the fluorescence lifetime
Labels with prolonged fluorescence lifetime
The time-gating electronics introduce a delay between the cut off of each light pulse and the
start of signal collection. During the delay, the unspecific fluorescence (caused by test
compounds, assay reagents, and the microplate) vanishes while only a small portion of the
specific fluorescence from the label is sacrificed. Enough of the specific signal remains during
the decay period with the added benefit of reduced background.
The Tunable Wavelength (TUNE) Detection Cartridge uses an ultraviolet LED that emits in the
range between 350nm and 380nm for excitation of europium chelates, and comes equipped
with emission filters for europium. This enables single-label europium assays to be run. See
Measurement Specifications on page 100.
Note: Europium cryptate and terbium require excitation wavelengths below 330nm
and cannot be measured with this detection cartridge.
For more information about time-resolved fluorescence, see Time-Resolved Fluorescence
Read Mode on page 38.
About Luminescence
Luminescence is the emission of light by processes that derive energy from essentially nonthermal changes, the motion of subatomic particles, or the excitation of an atomic system by
radiation. Luminescence detection relies on the production of light from a chemical reaction
in a sample.
The Tunable Wavelength (TUNE) Detection Cartridge contains the components for measuring
the light intensity from luminescence. Since the light is emitted as a result of a chemical
reaction, no excitation light and no excitation filters are required to measure luminescence.
The luminescence can be measured with no emission filters, or an emission wavelength
selected from within the specified range. See Measurement Specifications on page 100.
Note: This detection cartridge is not suitable for measurement of flash luminescence
reactions, which require injectors.
For more information about luminescence, see Luminescence Read Mode on page 33.
5014038 E 99
Page 100

SpectraMax Paradigm Multi-Mode Detection Platform User Guide
Microplate Recommendations
The following information is specific to this detection cartridge. For general microplate
selection and handling guidelines, see Selecting Suitable Microplate Types on page 91.
Table 5-3: Microplate Selection Guidelines for the Tunable Wavelength (TUNE) Detection
Cartridge
Read Mode Microplate
Type
Other Considerations
Fluorescence Intensity
(FL) topread
Fluorescence Intensity
(FL) bottomread
Time-Resolved
Fluorescence (TRF)
Luminescence (LUM) Solid white When an application specifies a surface treatment, use
Solid black When an application specifies a surface treatment, use
only microplates with the correct treatment.
Solidblack,
clearbottom
Solid white When an application specifies a surface treatment, use
When an application specifies a surface treatment, use
only microplates with the correct treatment.
only microplates with the correct treatment.
only microplates with the correct treatment.
Molecular Devices recommends using an unlidded plate
for luminescence measurements.
Note: White microplates provide significantly higher signal than black microplates,
and are recommended if high sensitivity is required. White microplates can, however,
exhibit some detectable phosphorescence which increases background after being
exposed to light (in particular under neon lights). For maximum sensitivity, Molecular
Devices recommends to prepare microplates under reduced ambient light conditions,
and to adapt the microplates to dark for 10 to 30 minutes before measurement.
Measurement Specifications
The specifications for measurements using the Tunable Wavelength (TUNE) Detection
Cartridge are shown in the following table.
Table 5-4: Measurement Specifications for the Tunable Wavelength (TUNE) Detection
Cartridge
Item Description
Detection cartridge
name
Short name TUNE
Part number 0200-7050
Weight 3.1lbs (1.4kg)
Read Modes Fluorescence Intensity (FL)
100 5014038 E
Tunable Wavelength (TUNE) Detection Cartridge
Time-Resolved Fluorescence (TRF)
 Loading...