


FLIPR® Tetra
High Throughput Cellular Screening System
User Guide
0112-0109 H
December 2011

This document is provided to customers who have purchased Molecular Devices, LLC
(“Molecular Devices”) equipment, software, reagents, and consumables to use in the
operation of such Molecular Devices equipment, software, reagents, and
consumables. This document is copyright protected and any reproduction of this
document, in whole or any part, is strictly prohibited, except as Molecular Devices
may authorize in writing.
Software that may be described in this document is furnished under a license
agreement. It is against the law to copy, modify, or distribute the software on any
medium, except as specifically allowed in the license agreement. Furthermore, the
license agreement may prohibit the software from being disassembled, reverse
engineered, or decompiled for any purpose.
Portions of this document may make reference to other manufacturers and/or their
products, which may contain parts whose names are registered as trademarks and/or
function as trademarks of their respective owners. Any such usage is intended only
to designate those manufacturers’ products as supplied by Molecular Devices for
incorporation into its equipment and does not imply any right and/or license to use
or permit others to use such manufacturers’ and/or their product names as
trademarks.
Molecular Devices makes no warranties or representations as to the fitness of this
equipment for any particular purpose and assumes no responsibility or contingent
liability, including indirect or consequential damages, for any use to which the
purchaser may put the equipment described herein, or for any adverse circumstances
arising therefrom.
For research use only. Not for use in diagnostic procedures.
The trademarks mentioned herein are the property of Molecular Devices, LLC or their
respective owners. These trademarks may not be used in any type of promotion or
advertising without the prior written permission of Molecular Devices, Inc.
Product manufactured by Molecular Devices, LLC.
1311 Orleans Drive, Sunnyvale, California, United States of America 94089.
Molecular Devices, LLC is ISO 9001 registered.
© 2011 Molecular Devices, LLC.
All rights reserved.

Contents
Chapter 1: System Overview . . . . . . . . . . . . . . . . . . . . . 13
Fluorescence Mode. . . . . . . . . . . . . . . . . . . . . . . . . . . . 13
Luminescence Mode . . . . . . . . . . . . . . . . . . . . . . . . . . . 14
System Requirements . . . . . . . . . . . . . . . . . . . . . . . . . 14
Electrical . . . . . . . . . . . . . . . . . . . . . . . . . . . . . . . . . . 14
Minimum Space . . . . . . . . . . . . . . . . . . . . . . . . . . . . . 15
Chapter 2: System Hardware Features . . . . . . . . . . . . . 17
Overview of FLIPR Tetra System Hardware Features . . . . 17
System Diagram . . . . . . . . . . . . . . . . . . . . . . . . . . . . 18
Plate-Handling System . . . . . . . . . . . . . . . . . . . . . . . . . 18
Five-Position Stage. . . . . . . . . . . . . . . . . . . . . . . . . . . 18
Plates . . . . . . . . . . . . . . . . . . . . . . . . . . . . . . . . . . . . 21
Instrument Status Panel . . . . . . . . . . . . . . . . . . . . . . . 21
Manual Mode . . . . . . . . . . . . . . . . . . . . . . . . . . . . . . . 22
Robotic Integration. . . . . . . . . . . . . . . . . . . . . . . . . . . 23
Observation Panel . . . . . . . . . . . . . . . . . . . . . . . . . . . 24
Liquid-Handling System . . . . . . . . . . . . . . . . . . . . . . . . 25
Standard Pipettor Head. . . . . . . . . . . . . . . . . . . . . . . . 25
Cell Suspension . . . . . . . . . . . . . . . . . . . . . . . . . . . . . 27
Pin Tool Head . . . . . . . . . . . . . . . . . . . . . . . . . . . . . . 29
Compatible Plate Configurations. . . . . . . . . . . . . . . . . . 30
Tip and Pin Tool Loading . . . . . . . . . . . . . . . . . . . . . . . 31
Tip and Pin Tool Washing . . . . . . . . . . . . . . . . . . . . . . 31
Optical System . . . . . . . . . . . . . . . . . . . . . . . . . . . . . . 32
CCD Camera Options . . . . . . . . . . . . . . . . . . . . . . . . . 33
LED Modules . . . . . . . . . . . . . . . . . . . . . . . . . . . . . . . 35
Emission Filters . . . . . . . . . . . . . . . . . . . . . . . . . . . . . 37
Chiller . . . . . . . . . . . . . . . . . . . . . . . . . . . . . . . . . . . . 38
Computer System . . . . . . . . . . . . . . . . . . . . . . . . . . . . 38
Host Computer . . . . . . . . . . . . . . . . . . . . . . . . . . . . . 38
Embedded Computer . . . . . . . . . . . . . . . . . . . . . . . . . 39
Chapter 3: Startup and Shutdown . . . . . . . . . . . . . . . . . 41
0112-0109 H 3

Contents
Starting Up the System . . . . . . . . . . . . . . . . . . . . . . . . . 41
Shutting Down the System . . . . . . . . . . . . . . . . . . . . . . 42
Chapter 4: Software Installation . . . . . . . . . . . . . . . . . . 43
Installing ScreenWorks Software . . . . . . . . . . . . . . . . . . 43
Activating the ScreenWorks Peak Pro License. . . . . . . . . . 44
Online vs. Offline Installation . . . . . . . . . . . . . . . . . . . . . 45
Online (Instrument) Mode . . . . . . . . . . . . . . . . . . . . . . 45
Offline (Desktop) Mode . . . . . . . . . . . . . . . . . . . . . . . . 46
Uninstalling ScreenWorks Software. . . . . . . . . . . . . . . . . 46
Chapter 5: ScreenWorks Software Overview . . . . . . . . . 47
ScreenWorks Software Main Screen . . . . . . . . . . . . . . . . 47
Title Bar . . . . . . . . . . . . . . . . . . . . . . . . . . . . . . . . . . 48
Menu Bar. . . . . . . . . . . . . . . . . . . . . . . . . . . . . . . . . . 48
Toolbar . . . . . . . . . . . . . . . . . . . . . . . . . . . . . . . . . . . 48
Status Bar . . . . . . . . . . . . . . . . . . . . . . . . . . . . . . . . . 51
Menu Bar. . . . . . . . . . . . . . . . . . . . . . . . . . . . . . . . . . . 51
File Menu. . . . . . . . . . . . . . . . . . . . . . . . . . . . . . . . . . 52
View Menu . . . . . . . . . . . . . . . . . . . . . . . . . . . . . . . . . 54
Instrument Menu . . . . . . . . . . . . . . . . . . . . . . . . . . . . 55
Tools Menu . . . . . . . . . . . . . . . . . . . . . . . . . . . . . . . . 61
Window Menu. . . . . . . . . . . . . . . . . . . . . . . . . . . . . . . 65
Help Menu . . . . . . . . . . . . . . . . . . . . . . . . . . . . . . . . . 65
Instrument Status . . . . . . . . . . . . . . . . . . . . . . . . . . . . 66
Instrument Status Tab . . . . . . . . . . . . . . . . . . . . . . . . 66
Instrument Configuration Tab . . . . . . . . . . . . . . . . . . . 68
Process Explorer Tab. . . . . . . . . . . . . . . . . . . . . . . . . . 69
Experiment Window . . . . . . . . . . . . . . . . . . . . . . . . . . . 69
Constructing Protocols Using FLIPR Tetra Processes . . . . 70
Settings Process. . . . . . . . . . . . . . . . . . . . . . . . . . . . . . 71
Setup Read Mode . . . . . . . . . . . . . . . . . . . . . . . . . . . . 72
Assign Plate to Position . . . . . . . . . . . . . . . . . . . . . . . . 74
Data File Name. . . . . . . . . . . . . . . . . . . . . . . . . . . . . . 76
Folders . . . . . . . . . . . . . . . . . . . . . . . . . . . . . . . . . . . 76
Temperature Control. . . . . . . . . . . . . . . . . . . . . . . . . . 77
Auto Print Options . . . . . . . . . . . . . . . . . . . . . . . . . . . 78
Analysis Process . . . . . . . . . . . . . . . . . . . . . . . . . . . . . . 79
Viewing Data . . . . . . . . . . . . . . . . . . . . . . . . . . . . . . . 79
4 0112-0109 H

FLIPR® Tetra High Throughput Cellular Screening System User Guide
Analyzing Data . . . . . . . . . . . . . . . . . . . . . . . . . . . . . 87
Exporting Data. . . . . . . . . . . . . . . . . . . . . . . . . . . . . . 99
Batch Export . . . . . . . . . . . . . . . . . . . . . . . . . . . . . . 106
Image Display . . . . . . . . . . . . . . . . . . . . . . . . . . . . . 107
Notes . . . . . . . . . . . . . . . . . . . . . . . . . . . . . . . . . . . 107
Transfer Fluid Process . . . . . . . . . . . . . . . . . . . . . . . . 108
Aspirate Table (Standard Pipettor) . . . . . . . . . . . . . . . 109
Dispense Table (Standard Pipettor) . . . . . . . . . . . . . . 112
Aspirate Configuration (Pin Tool) . . . . . . . . . . . . . . . . 115
Dispense Configuration (Pin Tool) . . . . . . . . . . . . . . . 116
Mix Fluid Process . . . . . . . . . . . . . . . . . . . . . . . . . . . . 117
Mix Fluid (Standard Pipettor) . . . . . . . . . . . . . . . . . . . 117
Mix Fluid (Pin Tool). . . . . . . . . . . . . . . . . . . . . . . . . . 119
Mix with TF . . . . . . . . . . . . . . . . . . . . . . . . . . . . . . . 120
Read Process. . . . . . . . . . . . . . . . . . . . . . . . . . . . . . . 120
Read. . . . . . . . . . . . . . . . . . . . . . . . . . . . . . . . . . . . 120
Read with TF . . . . . . . . . . . . . . . . . . . . . . . . . . . . . . 122
Wash Tips or Pins Process . . . . . . . . . . . . . . . . . . . . . . 123
Wash Tips (Standard Pipettor) . . . . . . . . . . . . . . . . . . 124
Wash Pins (Pin Tool). . . . . . . . . . . . . . . . . . . . . . . . . 125
Blot Pins Process . . . . . . . . . . . . . . . . . . . . . . . . . . . . 126
Pause Pipettor Process . . . . . . . . . . . . . . . . . . . . . . . . 126
Wash Cell Reservoir Process . . . . . . . . . . . . . . . . . . . . 127
Finish With Source . . . . . . . . . . . . . . . . . . . . . . . . . . . 128
Chapter 6: Exchanging Hardware . . . . . . . . . . . . . . . . 129
Exchanging Pipettor and Pin Tool Heads . . . . . . . . . . . . 129
Uninstalling a Pipettor or Pin Tool Head . . . . . . . . . . . 129
Installing the Pipettor Head . . . . . . . . . . . . . . . . . . . . 131
Uninstalling Wash Reservoir Top . . . . . . . . . . . . . . . . 133
Installing Wash Reservoir Top . . . . . . . . . . . . . . . . . . 134
Resetting FLIPR Tetra System after Changing Pipettor Heads
134
Exchanging the 1536 Tip Gasket . . . . . . . . . . . . . . . . . 135
Installing the Gasket . . . . . . . . . . . . . . . . . . . . . . . . 135
Removing the Tip Block and Gasket . . . . . . . . . . . . . . 136
Exchanging Pin Tools . . . . . . . . . . . . . . . . . . . . . . . . . 137
Loading and Unloading the Pin Tool . . . . . . . . . . . . . . 137
Exchanging LED Modules . . . . . . . . . . . . . . . . . . . . . . 138
0112-0109 H 5

Contents
Uninstalling LED Modules. . . . . . . . . . . . . . . . . . . . . . 138
Installing LED Modules . . . . . . . . . . . . . . . . . . . . . . . 139
Changing Filters . . . . . . . . . . . . . . . . . . . . . . . . . . . . . 141
Uninstalling a Filter . . . . . . . . . . . . . . . . . . . . . . . . . . 142
Installing an Emission Filter . . . . . . . . . . . . . . . . . . . . 143
Installation of Plate Hold-Down Devices . . . . . . . . . . . . 144
Selection of Appropriate Plate Hold-Down . . . . . . . . . . 144
Cell Reservoir. . . . . . . . . . . . . . . . . . . . . . . . . . . . . . . 146
Installing Cell Reservoir. . . . . . . . . . . . . . . . . . . . . . . 146
Uninstalling Cell Reservoir. . . . . . . . . . . . . . . . . . . . . 147
Chapter 7: Calibration and Signal Test. . . . . . . . . . . . . 149
Optical Calibration . . . . . . . . . . . . . . . . . . . . . . . . . . . 149
Adding a Read Plate to Plate Library . . . . . . . . . . . . . . 149
Recalibrating the Optics. . . . . . . . . . . . . . . . . . . . . . . 150
Running a Signal Test . . . . . . . . . . . . . . . . . . . . . . . . . 153
System Check . . . . . . . . . . . . . . . . . . . . . . . . . . . . . 153
Running a Plate Prior to an Experiment . . . . . . . . . . . . 154
Chapter 8: Running an Experiment . . . . . . . . . . . . . . . 157
Overview. . . . . . . . . . . . . . . . . . . . . . . . . . . . . . . . . . 157
Preparing Cells for Adherent Assays . . . . . . . . . . . . . . . 157
Location of Cells in the Plate . . . . . . . . . . . . . . . . . . . 157
Cell Densities . . . . . . . . . . . . . . . . . . . . . . . . . . . . . . 158
Cell Seeding. . . . . . . . . . . . . . . . . . . . . . . . . . . . . . . 158
Preparing Cells for Suspension Assays. . . . . . . . . . . . . . 159
Location of Cells in the Plate . . . . . . . . . . . . . . . . . . . 159
Cell Densities . . . . . . . . . . . . . . . . . . . . . . . . . . . . . . 159
Cell Seeding. . . . . . . . . . . . . . . . . . . . . . . . . . . . . . . 159
Powering-Up the System . . . . . . . . . . . . . . . . . . . . . . . 159
Checking the System . . . . . . . . . . . . . . . . . . . . . . . . . 160
Running the Yellow Plate Signal Test. . . . . . . . . . . . . . 160
Dye-Loading the Cells for Fluorescence Assays. . . . . . . . 161
Loading Duration and Temperature. . . . . . . . . . . . . . . 161
Preparing a Source/Compound Plate . . . . . . . . . . . . . . . 162
Preparation Time for the Source Plate . . . . . . . . . . . . . 162
Recommended Source Plates . . . . . . . . . . . . . . . . . . . 162
Concentration of Compounds in the Source Plate . . . . . 162
Addition and Mixing of Compounds to the Cell Plate . . . 162
6 0112-0109 H

FLIPR® Tetra High Throughput Cellular Screening System User Guide
Compound Plates for Suspension Assays. . . . . . . . . . . 163
Setting Up an Assay Protocol. . . . . . . . . . . . . . . . . . . . 164
Creating a Protocol File . . . . . . . . . . . . . . . . . . . . . . . 164
Optimizing the Optics and Fluid Dispensing . . . . . . . . . . 165
Optimizing the Hardware Settings . . . . . . . . . . . . . . . 165
Optimizing Optics Hardware . . . . . . . . . . . . . . . . . . . 165
Adjusting the Pipettor Height. . . . . . . . . . . . . . . . . . . 167
Adjusting the Fluid Dispensing Speed . . . . . . . . . . . . . 168
Optimizing Fluid Volume . . . . . . . . . . . . . . . . . . . . . . 168
Optimizing Pin Tool Delivery . . . . . . . . . . . . . . . . . . . 169
Optimizing Cell Delivery . . . . . . . . . . . . . . . . . . . . . . 169
Start the Assay Run . . . . . . . . . . . . . . . . . . . . . . . . . 169
FLIPR Calcium Assay Kit Protocol . . . . . . . . . . . . . . . . . 170
Required Materials . . . . . . . . . . . . . . . . . . . . . . . . . . 170
Calcium Assay Kit Experimental Protocol. . . . . . . . . . . 172
Running the FLIPR Calcium Assay Kit . . . . . . . . . . . . . 174
Troubleshooting Guide . . . . . . . . . . . . . . . . . . . . . . . 176
FLIPR Membrane Potential Assay Kit Protocol . . . . . . . . 177
Required Materials . . . . . . . . . . . . . . . . . . . . . . . . . . 177
Cell Preparation for the FLIPR Membrane Potential Assay179
Dye Loading Using the FLIPR Membrane Potential Assay Kit
180
Running the FLIPR Membrane Potential Assay . . . . . . . 181
Troubleshooting the FLIPR Membrane Potential Assay Kit . .
183
Voltage Sensor Probes Assay Protocol . . . . . . . . . . . . . 184
Required Materials . . . . . . . . . . . . . . . . . . . . . . . . . . 184
Cell Preparation for the voltage Sensor Probe Assay. . . 185
Running the Voltage Sensor Probe Assay . . . . . . . . . . 187
Luminescence Assay Protocol . . . . . . . . . . . . . . . . . . . 188
Required Materials . . . . . . . . . . . . . . . . . . . . . . . . . . 188
Coelenterazine Loading For Adherent Assays . . . . . . . . 189
Coelenterazine Loading for Suspension Cell Assays . . . 190
Preparation of Cell Reservoir and Running the Assay . . 191
Optimizing an Assay . . . . . . . . . . . . . . . . . . . . . . . . . 194
Chapter 9: Troubleshooting . . . . . . . . . . . . . . . . . . . . . 197
Instrument Status Colors . . . . . . . . . . . . . . . . . . . . . . 197
Troubleshooting Start-Up . . . . . . . . . . . . . . . . . . . . . . 198
0112-0109 H 7

Contents
General Troubleshooting . . . . . . . . . . . . . . . . . . . . . . . 200
Troubleshooting the Pipettor . . . . . . . . . . . . . . . . . . . . 205
Troubleshooting the Optics . . . . . . . . . . . . . . . . . . . . . 210
Troubleshooting the Yellow Plate . . . . . . . . . . . . . . . . . 215
Troubleshooting the Tip Washer . . . . . . . . . . . . . . . . . . 216
Troubleshooting the Cell Reservoir . . . . . . . . . . . . . . . . 218
Troubleshooting Data . . . . . . . . . . . . . . . . . . . . . . . . . 218
Troubleshooting Robotic Integration . . . . . . . . . . . . . . . 219
Appendix A: Robotic Integration . . . . . . . . . . . . . . . . . 221
Introduction. . . . . . . . . . . . . . . . . . . . . . . . . . . . . . . . 221
Purpose . . . . . . . . . . . . . . . . . . . . . . . . . . . . . . . . . . 221
Document Conventions . . . . . . . . . . . . . . . . . . . . . . . 221
Interface Versioning . . . . . . . . . . . . . . . . . . . . . . . . . 221
Instrument Overview . . . . . . . . . . . . . . . . . . . . . . . . . 222
Instrument Basic Function . . . . . . . . . . . . . . . . . . . . . 222
Instrument Hardware Introduction . . . . . . . . . . . . . . . 222
Instrument Layout . . . . . . . . . . . . . . . . . . . . . . . . . . 224
Plate Layout. . . . . . . . . . . . . . . . . . . . . . . . . . . . . . . 225
Plate-Handling System . . . . . . . . . . . . . . . . . . . . . . . 225
Instrument Layout Terminology (i.e., Where’s the front?) . .
226
Robotic Plate Loading . . . . . . . . . . . . . . . . . . . . . . . . 226
Optics Access Door . . . . . . . . . . . . . . . . . . . . . . . . . . 227
Washer placement . . . . . . . . . . . . . . . . . . . . . . . . . . 227
Cell Suspension Placement. . . . . . . . . . . . . . . . . . . . . 228
Other Instrument Access Areas . . . . . . . . . . . . . . . . . 228
Monitor and Keyboard Placement . . . . . . . . . . . . . . . . 230
Required access areas. . . . . . . . . . . . . . . . . . . . . . . . 230
FLIPR Tetra System Control Architecture . . . . . . . . . . . . 233
General Description . . . . . . . . . . . . . . . . . . . . . . . . . 233
Manual Mode . . . . . . . . . . . . . . . . . . . . . . . . . . . . . . 234
Remote Mode . . . . . . . . . . . . . . . . . . . . . . . . . . . . . . 234
Communication Protocol and Address . . . . . . . . . . . . . 236
General Remote Mode Use . . . . . . . . . . . . . . . . . . . . . 236
Setting Up Protocols for Remote Control Use . . . . . . . . . 240
General Directions . . . . . . . . . . . . . . . . . . . . . . . . . . 240
Settings Screen . . . . . . . . . . . . . . . . . . . . . . . . . . . . 240
Analysis Screen . . . . . . . . . . . . . . . . . . . . . . . . . . . . 242
8 0112-0109 H

FLIPR® Tetra High Throughput Cellular Screening System User Guide
Transfer Fluid Processes . . . . . . . . . . . . . . . . . . . . . . 243
Wash Tips Processes . . . . . . . . . . . . . . . . . . . . . . . . 244
Mix Fluid Processes . . . . . . . . . . . . . . . . . . . . . . . . . 244
Read Processes . . . . . . . . . . . . . . . . . . . . . . . . . . . . 244
Finish with Source Processes . . . . . . . . . . . . . . . . . . . 244
Wash Cell Reservoir Processes. . . . . . . . . . . . . . . . . . 244
Command Set . . . . . . . . . . . . . . . . . . . . . . . . . . . . . . 244
Command Syntax. . . . . . . . . . . . . . . . . . . . . . . . . . . 244
Version<CR>. . . . . . . . . . . . . . . . . . . . . . . . . . . . . . 245
Status<CR> . . . . . . . . . . . . . . . . . . . . . . . . . . . . . . 246
Loadplate<TAB>Location, Last Plate[, BAR CODE] <CR> . .
248
Removeplate<TAB>location <CR>. . . . . . . . . . . . . . . 250
Openprotocol<TAB>File Name<CR> . . . . . . . . . . . . . 251
Findprotocols<TAB>Folder<CR> . . . . . . . . . . . . . . . . 251
Runexperiment<TAB>[Data File Name]<CR> . . . . . . . 252
Stopexperiment<CR>. . . . . . . . . . . . . . . . . . . . . . . . 253
Clearerror<CR> . . . . . . . . . . . . . . . . . . . . . . . . . . . . 254
Loadtips<CR> . . . . . . . . . . . . . . . . . . . . . . . . . . . . . 255
Unloadtips<CR> . . . . . . . . . . . . . . . . . . . . . . . . . . . 256
Cyclecameratemp<CR> . . . . . . . . . . . . . . . . . . . . . . 257
Tempcontrolonoff<TAB>Temp<CR> . . . . . . . . . . . . . 257
Washtips<TAB>Fluid Type, Wash Cycles, Volume/Stroke,
Aspirate Speed, Pump Speed, Strokes, Hold Time, Dispense
Speed<CR> . . . . . . . . . . . . . . . . . . . . . . . . . . . . . . 258
Configuration <CR> . . . . . . . . . . . . . . . . . . . . . . . . . 260
Statusex<CR>. . . . . . . . . . . . . . . . . . . . . . . . . . . . . 262
Cellflaskcontrol<TAB>Rate<CR> . . . . . . . . . . . . . . . . 264
Washcellreservoir<TAB>Fluid Type, Fill Speed, Drain
Destination, Drain Speed, Wash Cycles, Hold Time, Volume
Level<CR> . . . . . . . . . . . . . . . . . . . . . . . . . . . . . . . 265
Error Handling and Reporting . . . . . . . . . . . . . . . . . . . 267
Error Types . . . . . . . . . . . . . . . . . . . . . . . . . . . . . . . 267
Appendix A—Remote Interface Revision History. . . . . . . 270
V1.0 . . . . . . . . . . . . . . . . . . . . . . . . . . . . . . . . . . . . 270
V1.1 . . . . . . . . . . . . . . . . . . . . . . . . . . . . . . . . . . . . 270
V1.2 . . . . . . . . . . . . . . . . . . . . . . . . . . . . . . . . . . . . 270
V1.3 . . . . . . . . . . . . . . . . . . . . . . . . . . . . . . . . . . . . 271
0112-0109 H 9

Contents
Appendix B—Bar Code Specifications . . . . . . . . . . . . . . 271
About Bar Codes. . . . . . . . . . . . . . . . . . . . . . . . . . . . 271
Bar Code Recommendations . . . . . . . . . . . . . . . . . . . 271
Bar Code Specifications . . . . . . . . . . . . . . . . . . . . . . . 272
Appendix B: Data Processing Algorithms . . . . . . . . . . . 273
Hypothetical Experiment . . . . . . . . . . . . . . . . . . . . . . . 273
Crosstalk Correction . . . . . . . . . . . . . . . . . . . . . . . . . . 274
Determining Crosstalk Correction . . . . . . . . . . . . . . . . 274
Spatial Uniformity Correction . . . . . . . . . . . . . . . . . . . . 275
Determining Spatial Uniformity Correction . . . . . . . . . . 275
Negative Control Correction . . . . . . . . . . . . . . . . . . . . . 276
Determining Negative Control Correction. . . . . . . . . . . 277
Positive Control Scaling . . . . . . . . . . . . . . . . . . . . . . . . 278
Determining the Positive Control Scaling . . . . . . . . . . . 278
Subtract Bias . . . . . . . . . . . . . . . . . . . . . . . . . . . . . . . 279
Determining Subtract Bias . . . . . . . . . . . . . . . . . . . . . 279
Response Over Baseline . . . . . . . . . . . . . . . . . . . . . . . 280
Determining Response Over Baseline Correction. . . . . . 280
Appendix C: Consumables and Accessories . . . . . . . . . 283
FLIPR Tetra System Accessories . . . . . . . . . . . . . . . . . . 283
Field Installations . . . . . . . . . . . . . . . . . . . . . . . . . . . 283
Pipettor Heads . . . . . . . . . . . . . . . . . . . . . . . . . . . . . 283
Optics Consumables . . . . . . . . . . . . . . . . . . . . . . . . . 284
Pipetting Consumables . . . . . . . . . . . . . . . . . . . . . . . 285
Cell Reservoir Consumables . . . . . . . . . . . . . . . . . . . . 286
Plates . . . . . . . . . . . . . . . . . . . . . . . . . . . . . . . . . . . . 287
96-Well Read Plates . . . . . . . . . . . . . . . . . . . . . . . . . 287
96-Well Read Plate Masks . . . . . . . . . . . . . . . . . . . . . 287
96-Well Source Plates . . . . . . . . . . . . . . . . . . . . . . . . 288
384-Well Read Plates . . . . . . . . . . . . . . . . . . . . . . . . 289
384-Well Source Plates . . . . . . . . . . . . . . . . . . . . . . . 290
1536-Well Read Plates . . . . . . . . . . . . . . . . . . . . . . . 290
1536-Well Source Plates . . . . . . . . . . . . . . . . . . . . . . 291
Source Reservoirs. . . . . . . . . . . . . . . . . . . . . . . . . . . 291
Assays Performed on the FLIPR Tetra System . . . . . . . . 291
Calcium Flux Consumables. . . . . . . . . . . . . . . . . . . . . 291
FLIPR Membrane Potential Assay Kit Consumables . . . . 293
10 0112-0109 H

FLIPR® Tetra High Throughput Cellular Screening System User Guide
Equipment and Supplies Suggested to Perform
Assays with Your FLIPR Tetra System. . . . . . . . . . . . . . 293
Appendix D: Using AquaMax Sterilant . . . . . . . . . . . . . 295
Principle of Use . . . . . . . . . . . . . . . . . . . . . . . . . . . . . 295
Contents . . . . . . . . . . . . . . . . . . . . . . . . . . . . . . . . . . 295
Materials Required but Not Provided. . . . . . . . . . . . . . . 295
Storage . . . . . . . . . . . . . . . . . . . . . . . . . . . . . . . . . . 296
Reagent Preparation. . . . . . . . . . . . . . . . . . . . . . . . . . 296
Reagent Use . . . . . . . . . . . . . . . . . . . . . . . . . . . . . . . 296
Warnings, Precautions and Limitations . . . . . . . . . . . . . 296
Appendix E: Decontamination Certificate . . . . . . . . . . 299
Procedure for Completing the Certificate. . . . . . . . . . . . 299
Appendix F: Electromagnetic Compatibility (EMC) . . . 301
REGULATORY INFORMATION FOR CANADA
(ICES/NMB-001:2006) . . . . . . . . . . . . . . . . . . . . . . . . 301
ISM EQUIPMENT CLASSIFICATION (Group 1, Class A) . . 301
INFORMATION FOR THE USER (FCC NOTICE) . . . . . . . . 301
0112-0109 H 11

Contents
12 0112-0109 H

System Overview
This chapter provides an overview of the FLIPR® Tetra High Throughput
Cellular Screening System requirements.
FLIPR® Tetra Systems are fluorescence- and luminescence-based
microplate readers with an integrated 1536-, 384- or 96-pipettor. They
perform rapid throughput cell-based assays while providing accurate
and precise kinetic data. Primary applications include intracellular
calcium mobilization and membrane potential. In addition, an expanded
choice of wavelengths enables you to utilize a broad range of
fluorescent dyes.
The FLIPR® Tetra System includes:
• Simultaneous 96-, 384- or 1536-well liquid or cell transfer
• Expanded wavelength support
• User-configurable pipettors and optics
• Agile internal plate handling
• Standard, (EMCCD) camera for fluorescence applications or
Aequorin, (ICCD) camera for fluorescence and luminescence
• Cell suspension option
• Slim platform with minimal facilities requirements.
An overhead pipettor delivers compound to all wells of the read plate
simultaneously. A protocol file configured in ScreenWorks Software—
the system-control and analysis program for FLIPR® Tetra System—
coordinates timing of compound delivery with multiple time-point
exposures so that the resulting sequence of data points spans
compound addition.
ScreenWorks Software displays relative light units versus time for all
1536-, 384- or 96-wells on the system’s monitor. Updates occur in
real-time as allowed by processing speed. Data can be exported as
relative light units over time (time sequence), or as a single value per
well (statistic). Export data files are in ASCII text file format for input
into spreadsheet or database programs.
1
Fluorescence Mode
In fluorescence mode the system’s LEDs illuminate the bottom of a
1536-, 384- or 96-well ‘read’ plate containing cells loaded with
fluorescent dye, and measure the fluorescence in each well. By taking a
sequence of measurements in conjunction with compound application,
changes in fluorescence emission characteristics due to the binding of
particular ions (for example, Ca2+, H+ or Na+) can be tracked.
0112-0109 H 13

System Overview
Light-emitting diodes (LEDs) in the FLIPR® Tetra System produce light
at distinct wavelength ranges to excite the fluorescent dye that has
been added to the cells in the read plate wells. The entire well plate
bottom is illuminated. Fluorescent light emitted by the dye—again, for
the entire plate—passes through an emission filter before being
captured in a CCD camera, standard EMCCD or Aequorin ICCD.
Fluorescence is measured from each well independently, and converted
into a numerical value. The FLIPR® Tetra System can be configured with
two LED banks and three emission filters, allowing the software
configuration of up to four excitation/emission wavelength
combinations (‘read modes’). Thus, up to four different fluorescence
effects can be measured within a single experiment.
Luminescence Mode
The FLIPR® Tetra System also provides luminescence mode with the
Aequorin, ICCD camera option. The instrument has a light-tight
enclosure so that it can operate in luminescence mode and a
specialized high-sensitivity ICCD camera can be installed in place of the
standard EMCCD camera. The ICCD camera is mounted directly
beneath the read plate, so images are taken of the entire bottom of the
plate. For cell suspension experiments, an integrated Cell Reservoir
allows uniform cell suspension to be pipetted directly into the read
plate. From the 3 filter positions available on FLIPR® Tetra System, it is
recommended to have one open position, so no filter will be used
during luminescence assay.
As with fluorescence, luminescence is measured from each well
independently, and converted into a numerical value.
System Requirements
This section provides a brief overview of electrical, physical and
environmental requirements of the FLIPR® Tetra System. Please refer
to the FLIPR® Tetra System Pre-Installation Guide for full details.
Electrical
FLIPR® Tetra System consumes 5 A continuous and 9 A peak of 110 V
power and requires 90–240 VAC power source at 50–60 Hz which
equates to 2.5 A continuous and up to 4.5 A peak at 240 VAC/50 Hz.
The system is supplied with a power cord appropriate for the country it
was shipped to. Additional shared outlets are required for computer and
monitor. A power strip is acceptable for providing the additional outlets
for the computer and monitor.
14 0112-0109 H

FLIPR® Tetra High Throughput Cellular Screening System User Guide
Minimum Space
System dimensions are as follows:
• Without Cell Suspension Module or TETRAcycler™:
approximately 39 inches wide 27 inches deep 70 inches high
(991 mm wide 686 mm deep 1780 mm high).
• With Cell Suspension Module and TETRAcycler: approximately
53 inches wide 27 inches deep 70 inches high (1346 mm
wide 686 mm deep 1780 mm high).
FLIPR® Tetra System is designed with rolling castors so it can be readily
moved to make necessary adjustments and perform maintenance.
Leveling feet are also installed on the lower instrument chassis. These
feet are typically used for stabilizing the instrument when integrated
with a robot, but can also be used to establish a uniform instrument
deck level in situations where the lab floor is not flat. When running an
experiment, please make sure the instrument’s feet are lowered and
leveled.
The computer and monitor are mounted to the right front side of the
instrument with the included clamp, requiring a minimum lab space of
73 inches (1.85 m) wide 82 inches (2.08 m) deep for maneuverability.
A chiller with dimensions 11 inches wide by 13 inches deep 13 inches
high (279 mm 330 mm 330 mm) is connected via a 3-foot (914
mm) long tube to the right side of the instrument. It can be placed
anywhere within that 3 foot radius as long as the user has access to the
on/off button on the chiller.
A minimum 25 inch (635 mm) square footprint for tip wash bottles is
required to the right side of the instrument.
The cabinet should have a user access space of 48 inches (1.22 m) in
front 24 inches
(610 mm) behind 10 inches (254 mm) to the left for servicing the
instrument.
WARNING! FLIPR® Tetra System can weigh as much as 860 lbs
(390 kg). Ensure adequate personnel are present when
installing or moving the system. Follow all necessary safety
precautions and use proper moving techniques.
0112-0109 H 15

System Overview
16 0112-0109 H

System Hardware Features
Overview of FLIPR Tetra System Hardware Features
The FLIPR® Tetra System consists of a cabinet 39” (965 mm) wide 27”
(686 mm) deep 70” (1780 mm) high, with a number of components,
including wash bottles, Cell Suspension module, chiller, host computer
and monitor, outside the cabinet.
The cabinet has two compartments, top and bottom, accessed by
manual doors on the front of the cabinet.
A ‘five-position stage’ located in the top compartment is where read
and source plates are positioned during an experiment. There are also
positions for tips and tip washing, as well as the Cell Suspension
reservoir.
The TETRAcycler™ plate shuttle on the back wall of the top
compartment can be used for robotically controlled carriage of
compound or read plates and tips in and out of the cabinet during
experiments. Plates are delivered to and from a landing pad outside the
cabinet on the left hand side.
Mounted on the back wall of the top compartment, above the
TETRAcycler, is the pipettor. The pipettor transfers compounds from
source plates to the read plate, and accesses the tip loading and tip
washing positions. When the Cell Suspension option is installed, the
pipettor also transfers cells in suspension from the Cell Reservoir to the
read plate.
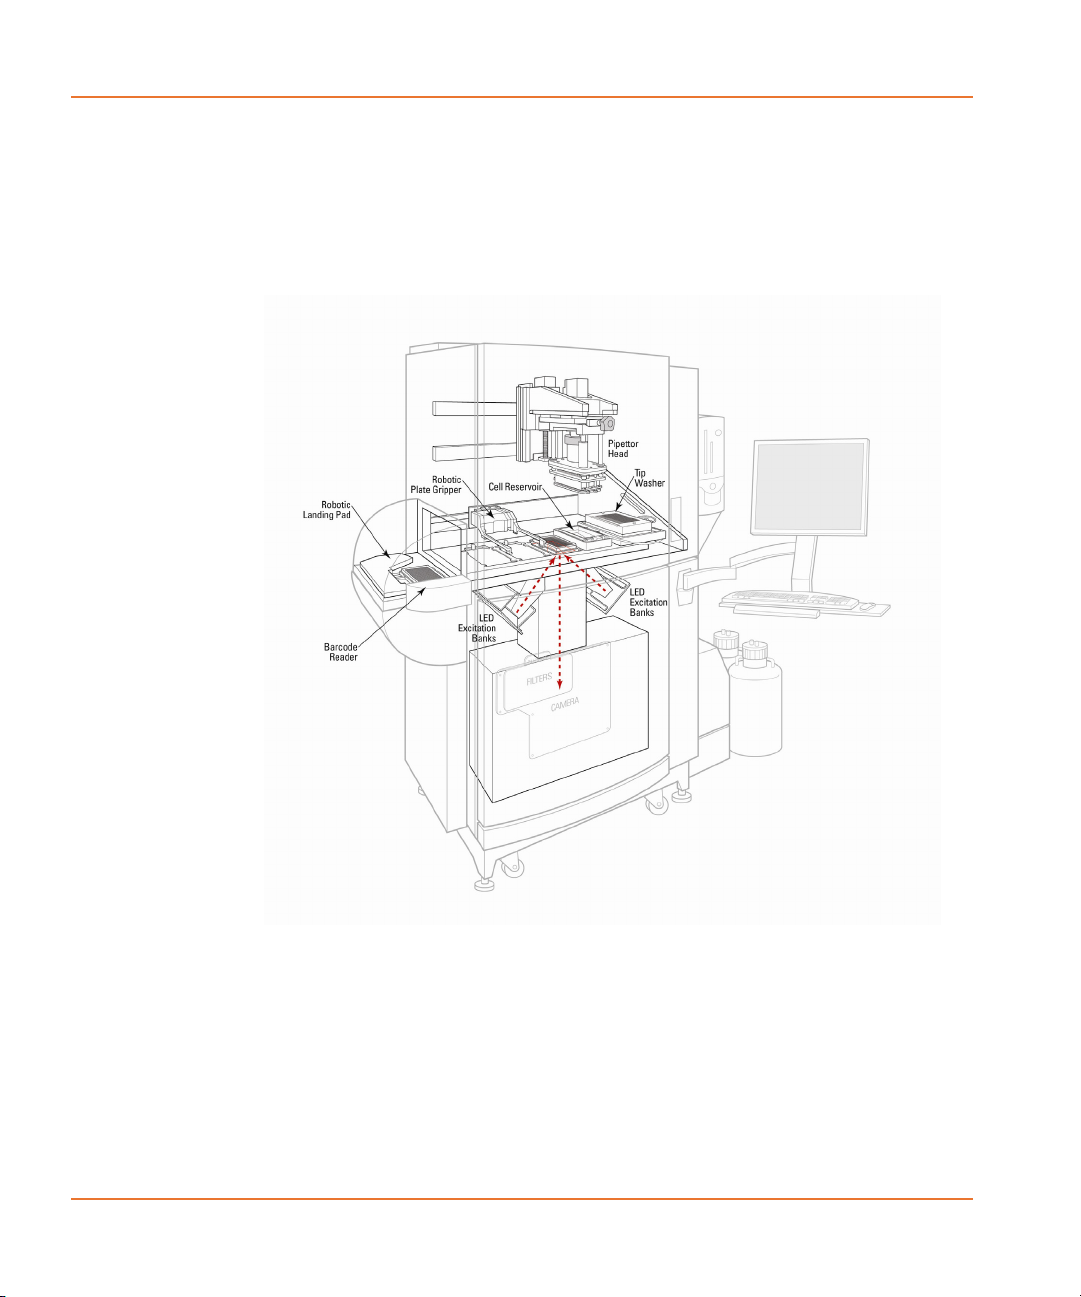
The bottom, ‘dry’, compartment, houses the FLIPR® Tetra System
optics and an embedded computer for control of basic system
functions. Two LED excitation modules, to the left and right, direct light
up onto the base of the read plate, in the five-position stage above.
Light emitted from the read plate passes down through emission filters
directly below the plate to the camera (either the Standard EMCCD
camera or the Aequorin ICCD camera).
The system computer—running ScreenWorks® Software, through which
all user interaction with the system occurs—is attached to the outside
right-hand side of the cabinet. Monitor and keyboard are on an
adjustable arm attached on the right-hand side of the cabinet front.
The Cell Suspension module, if installed, is also mounted on the lower
right side of the instrument. This external module keeps the cells in
suspension and is connected via internal tubing to a Cell Reservoir that
is installed in Position 4 (Source Plate 3). The cells are kept in
suspension via stirring and are pumped into the reservoir for transfer to
the read plate. Up to 4 additional fluid bottles can also be connected to
the reservoir for cleaning purposes.
2
0112-0109 H 17
System Hardware Features
Containers for tip washer fill fluid and waste are placed outside the
cabinet beneath the computer.
Further information on these subsystems is presented in the following
sections.
System Diagram
Figure 2-1 Diagram of the complete FLIPR® Tetra System.
Plate-Handling System
Five-Position Stage
For an experiment, read and source plates are placed in the
five-position stage in the upper compartment of the FLIPR® Tetra
System, where the pipettor is able to transfer compound between
18 0112-0109 H
FLIPR® Tetra High Throughput Cellular Screening System User Guide
them. Plates can be loaded manually through the upper compartment
door, prior to an experiment, or robotically, as the experiment proceeds
, using the TETRAcycler.
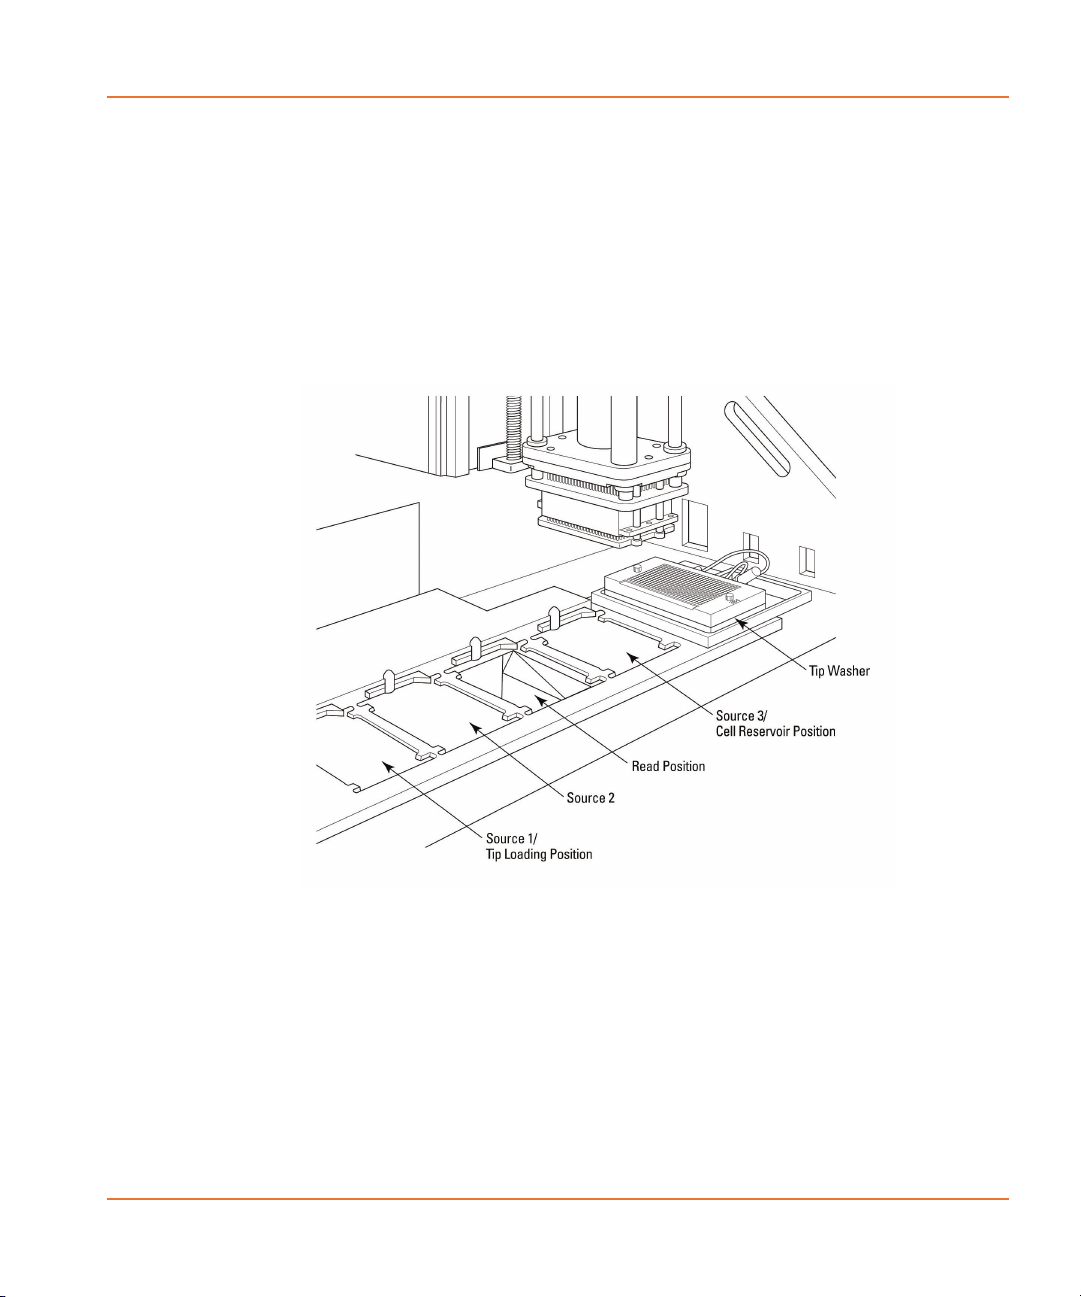
The five positions of the stage are, from left to right:
• Position 1: Tips and/or Source Plate 1
• Position 2: Source Plate 2
• Position 3: Read Plate
• Position 4: Cell Reservoir and/or Source Plate 3
• Position 5: Tip Washer
Figure 2-2 The five-position stage.
Positions 1, 2 and 4 take standard, low volume, deep well and reservoir
source addition plates.
Tip loading and unloading occurs in Position 1, but this position can
double as a source plate position once tips are removed.
Position 3 opens to the optics chamber below for excitation of
fluorophores in read plate wells and emission reading.
Position 4 can be used for the Cell Reservoir included with the Cell
Suspension option. A single Cell Reservoir is compatible with all of the
0112-0109 H 19

System Hardware Features
FLIPR® Tetra System pipettor heads. When the Cell Reservoir is not
present, this position can be used as a source plate position.
Positions 1–4 have a mechanical plate sensor to identify the presence
of plates, tips or reservoirs.
Robotic integration enables the TETRAcycler to exchange up to 12
source plates and tip racks, and one read plate, in an experiment.
A dedicated tip wash reservoir is located in Position 5 and should be
configured to match respective pipettor heads (96, 384 or 1536).
Appropriate tip wash reservoirs are included in the purchase of a
pipettor head. Specific hardware components associated with tip
washing are described in Tip Washing, page 31.
Plates and tip racks are registered with well A1 in the lower left-hand
corner using a plate indexer found in Positions 1–4. The indexers also
serve as mechanical sensors to detect plate or tip presence. If plates or
tips are not present in a Manual Mode experiment, but requested by
software, the instrument will stop and end the experiment. During
Remote Mode, the system notifies the SynchroMax™ ET or third-party
plate-handler that no plate or tip container is present and will stop the
instrument until plates or tips are detected. It is then the responsibility
of the SynchroMax ET or third-party plate-handler to deliver plates or
tips to the system.
Note: Sensors can only detect plate or tip container presence. They
cannot identify the type of plate or tips. It is the user’s responsibility to
ensure that the correct plates and tips are loaded into position.
Temperature Regulation
Positions 1, 2 and 4, for source plates, have optional temperature
control. Temperature settings range from ambient +5 °C to 40 °C.
Equilibrium temperature may take approximately 15 minutes to reach
the set temperature.
Configure temperature regulation with the Temperature Control
ON/OFF toggle command in the Instrument > Manual Operation
menu or corresponding button.
Note: FLIPR® Tetra System does not have humidified air flow.
Temperature regulation is easier to maintain during robotic integration
as temperature loss is minimized when plates are passed through the
20 0112-0109 H
FLIPR® Tetra High Throughput Cellular Screening System User Guide
Plates
FLIPR® Tetra System accepts 96-, 384- and 1536-well plates that
conform to the proposed ANSI standards submitted by the Society for
Biomolecular Sciences. A sample of suitable source and read plates is
provided in Appendix C: Consumables and Accessories on page 283.
Black walled, clear-bottomed read plates provide an optimal imaging
environment for fluorescence assays. These plates prevent signal
diffraction while allowing excitation and signal access. Black walled,
clear-bottomed plates or white walled plates can be used for
luminescence assays.
For 96-well read plates, an optional slit-shaped mask can be used to
minimize saturation and edge effects associated with these plates.
Simply place the mask over the read position. See Appendix C for types
of masks available.
No mask is required for 1536- and 384-well plates.
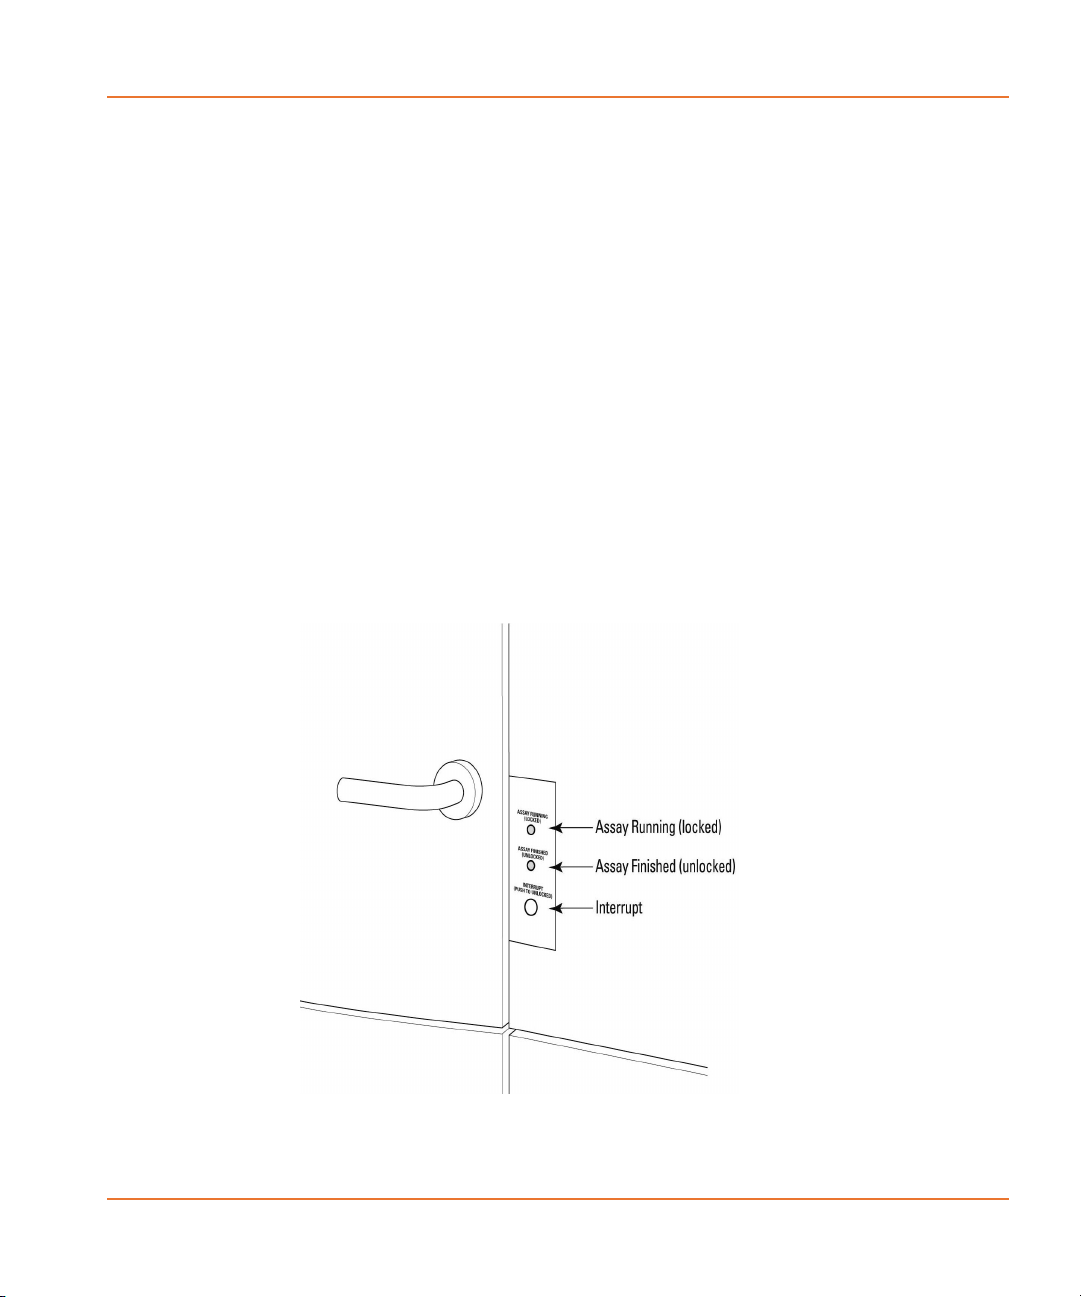
Instrument Status Panel
The Instrument Status panel, located next to the upper door handle,
indicates whether or not the instrument is running and safe to open. It
includes an emergency Interrupt button to stop any processes.
Figure 2-3 The Instrument Status panel.
0112-0109 H 21

System Hardware Features
The panel has two lights as well as the Interrupt button. From the top
of the panel these are:
• Assay Running (Locked)—Yellow light
• Assay Finished (Unlocked)—Green light
• The Interrupt button is an override button to halt all tasks, so
CAUTION! The Interrupt button immediately ends the experiment and
should only be used in emergencies. The system may need to be
reinitialized by selecting Reset from the Instrument menu prior to
resuming normal instrument function.
Manual Mode
In manual operation all assay components must be positioned in the
five-position stage by hand, through the upper manual door, prior to
running an experiment. Once the experiment starts no further plate or
tip changes can be made. If you need to exchange plates or tips during
an experiment then you must run the FLIPR® Tetra System in Remote
Mode, using the TETRAcycler to replace used tips or plates.
The FLIPR® Tetra System always starts in Manual Mode. Toggle
between manual and remote modes with the Set Manual Mode and
Set Remote Mode commands in the Instrument menu, or use the
software buttons available.
In Manual Mode, the TETRAcycler gripper parks itself on the platelanding pad.
®
The FLIPR
Tetra System is performing a task. The upper and
lower doors are locked and cannot be opened until the task
finishes or is halted using the Interrupt button.
No tasks are being run and it is safe to open the upper and
lower instrument doors.
you can access the instrument. If pressed the yellow light
flashes until the system has reached a safe state to open the
doors, when the green light comes on.
Note: The top compartment door should remain closed during normal
system operation. Do not operate the instrument if the door is open.
All system functions halt when the door is open.
22 0112-0109 H

FLIPR® Tetra High Throughput Cellular Screening System User Guide
Robotic Integration
To increase the number of plates you can use in an experiment (and
minimize personnel requirements), use the TETRAcycler internal plate
handler coupled with the SynchroMax ET or a third-party plate handler
(for example, stacker system or robotic arm). One read and up to 12
source plates and tip racks can be shuttled in and out of the FLIPR®
Tetra System in one experiment with this method.
When using automated delivery the SynchroMax ET or third-party plate
handler delivers plates to, and picks them up from, the landing pad on
the outside left of the instrument, from where the TETRAcycler shuttles
them in and out of the read compartment. The shuttle door over the
landing pad opens and closes to maintain a light-tight environment
within the compartment.
During automated operation the SynchroMax ET or third-party plate
handler controls the FLIPR® Tetra System by sending instructions to
load protocols, run experiments, and retrieve plates from the landing
pad. These commands are executed immediately upon receipt by the
instrument. Persisting instrument settings cannot be made from the
remote controlling program—these must be configured in ScreenWorks
Software before control is passed to the plate-delivery system.
To pass control to the plate-delivery software select Set Remote Mode
in the Instrument menu in ScreenWorks Software. The FLIPR® Tetra
System remains in remote control until Set Manual Mode is pressed.
The third-party plate handler software communicates with the FLIPR®
Tetra System computer via the serial communication port using TCP/IP.
SynchroMax ET software is installed with ScreenWorks Software on the
FLIPR® Tetra System computer so it is able to communicate directly
with the instrument. See Appendix A: Robotic Integration on page 221
for remote control syntax.
TETRAcycler™
The TETRAcycler is a plate gripper that runs along the back wall of the
upper read compartment, giving it access to Positions 1–4 in the
five-position stage and the landing pad on the outer left-hand side of
the cabinet. It shifts source plates and tip containers between these
locations when under the control of the SynchroMax ET or a third-party
plate handler (see above).
The TETRAcycler carries standard, low volume and deep well 96-, 384and 1536-well plates that conform to propose ANSI standards
submitted by the Society for Biomolecular Sciences. In addition, the
TETRAcycler handles Molecular Devices qualified tips. Reservoirs can be
used during robotic integration, however the TETRAcycler is not able to
move these. All reservoirs must be loaded manually prior to running an
experiment, including the Cell Reservoir.
0112-0109 H 23

System Hardware Features
Note: While the system is compatible with plates that conform to
proposed ANSI standards submitted by the Society for Biomolecular
Sciences, some plates may not be handled as reliably by the
TETRAcycler due to their low plate weight. During robotic integration,
it is recommended that handling of the plates and tips by the
TETRAcycler be evaluated for plate handling robustness prior to
starting a screen.
The FLIPR® Tetra System’s upper and lower door must remain closed
for the duration of experiment. Plates are transported in and out of the
instrument only by the TETRAcycler system’s robotic landing pad door.
WARNING! Do not place your fingers in the TETRAcycler
shuttle door as this may cause injury.
SynchroMax ET™
The SynchroMax ET is a six-stack plate handler available as an optional
purchase with the FLIPR® Tetra System. It delivers plates to and from
the landing pad, integrating with the TETRAcycler, which ferries the
plates to and from their appropriate locations in the five-position stage.
The configuration interface of the SynchroMax ET software is opened
directly from within ScreenWorks Software, making experiment
configuration straightforward.
Observation Panel
In order to view hardware movements in the upper top compartment
while troubleshooting the FLIPR® Tetra System, use the observation
panel. Under normal operating conditions the upper door must be
closed in order to run an experiment, ensuring no light enters the
chamber. When the observation panel is mounted to the chamber,
however, the door can be left open, allowing you to view movements of
the pipettor and TETRAcycler. Normal instrument control is performed
via ScreenWorks Software, SynchroMax ET, or third-party plate
handling software. For the Aequorin ICCD camera test images are
displayed.
The observation panel is stored attached to the inside of the upper
door. To mount the panel, remove it from the door and attach it with
the four captive thumbscrews to the top compartment frame.
24 0112-0109 H

FLIPR® Tetra High Throughput Cellular Screening System User Guide
To acquire quality data, reaffix the observation panel to the inner door
prior to running an experiment.
WARNING! If pretending to run in luminescence mode with the
Aequorin ICCD camera, DO NOT touch the white door switches.
Room light will damage the Intensifier. The door switches
detect the open door to protect the camera.
Note: The observation panel should only be used to view internal
pipettor movement; it should not be used during experiments when
data is being accumulated. Test data (in the case of the Aequorin ICCD
camera) or compromised data (with the Standard camera) will be
shown if not collected under dark conditions with closed doors.
Liquid-Handling System
Compounds are transferred from source plates or reservoir to read
plates by the pipettor mounted on the rear wall of the top
compartment, above the TETRAcycler. The pipettor assembly can be
fitted with a standard pipettor head, to use disposable tips, or a pin tool
head, which uses solid or slotted pins to carry compound.
All 1536, 384, or 96 tips or pins operate at the same time,
simultaneously picking up compound from all the wells in a source plate
(or a quarter of the wells; see Compatible Plate Configurations on
page 30 below) or Cell Reservoir, and similarly dispensing these
simultaneously to the read plate. Fluid mixing steps can be configured
for source plates before compound is picked up, and for read plates
once it has been dispensed.
Pipettor heads are user-installable and can be interchanged in
approximately less than 5 minutes; see Exchanging Pipettor and Pin
Tool Heads on page 129.
Standard Pipettor Head
Standard pipettor heads are available in 1536-, 384- and 96-tip
formats.
The 384- and 96-pipettor heads both use disposable plastic tips. In
contrast, the 1536-pipettor head uses a stainless steel tip block with a
disposable 1536-tip gasket.
Plastic tips can be washed or replaced between each compound
addition or at the end of an experiment. The 1536-tip block is washed
at specified times.
0112-0109 H 25
System Hardware Features
Pipettor operations are controlled from within ScreenWorks Software
protocols, or some operations, for example, loading tips, can be
performed individually, directly through commands in the Instrument
menu. Connectors on the back of the pipettor head identify the head
format as 1536, 384, or 96 tips, so ScreenWorks Software only offers
valid plate formats and pipetting parameters for protocol setup.
The standard pipettor head uses air displacement to control aspiration
and dispense speed and volume. The volume of compound to be
transferred is configured in the software, and it is possible to draw
compound from multiple source plates to dispense into one destination
plate, or to aspirate from one plate and dispense to multiple well plates
or quadrants.
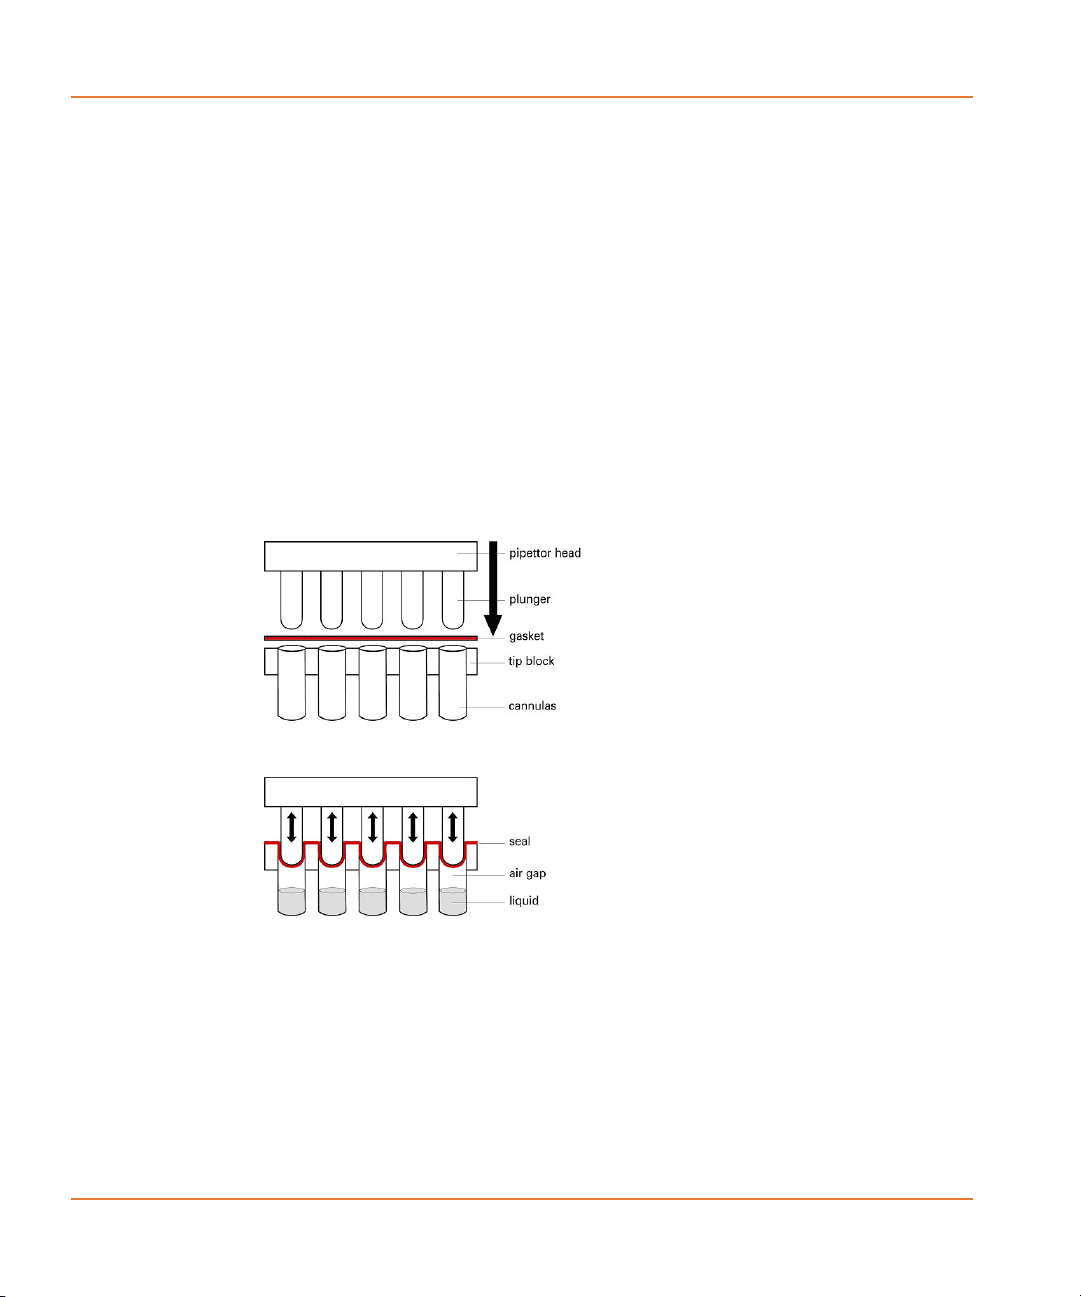
The 96- and 384-pipettor heads displace air in the disposable pipette
tips. In the 1536-pipettor head a plunger for each of the 1536 tips
presses against an elastic gasket seated on the tip block. When the
plungers move down they create an initial seal between the gasket and
tip block. Once the seal is created, further plunger movement causes
air displacement in the tip block (see Figure 2-4).
Figure 2-4 Seal creation in the 1536-pipettor head.
Minimum pipettor precision is as follows:
• 3% for 75 μL additions (96-well).
• 4% for 25 μL additions (384-well)
• 6% for 3 μL additions (1536-well)
Performance is dependent on tip/gasket seating and can be
compromised if the seal is broken. Use only Molecular Devices
recommended tips and gaskets to ensure the highest accuracy and to
reduce the possibility of damaging the pipettor. See Appendix C:
26 0112-0109 H

FLIPR® Tetra High Throughput Cellular Screening System User Guide
Consumables and Accessories on page 283 for recommended tips.
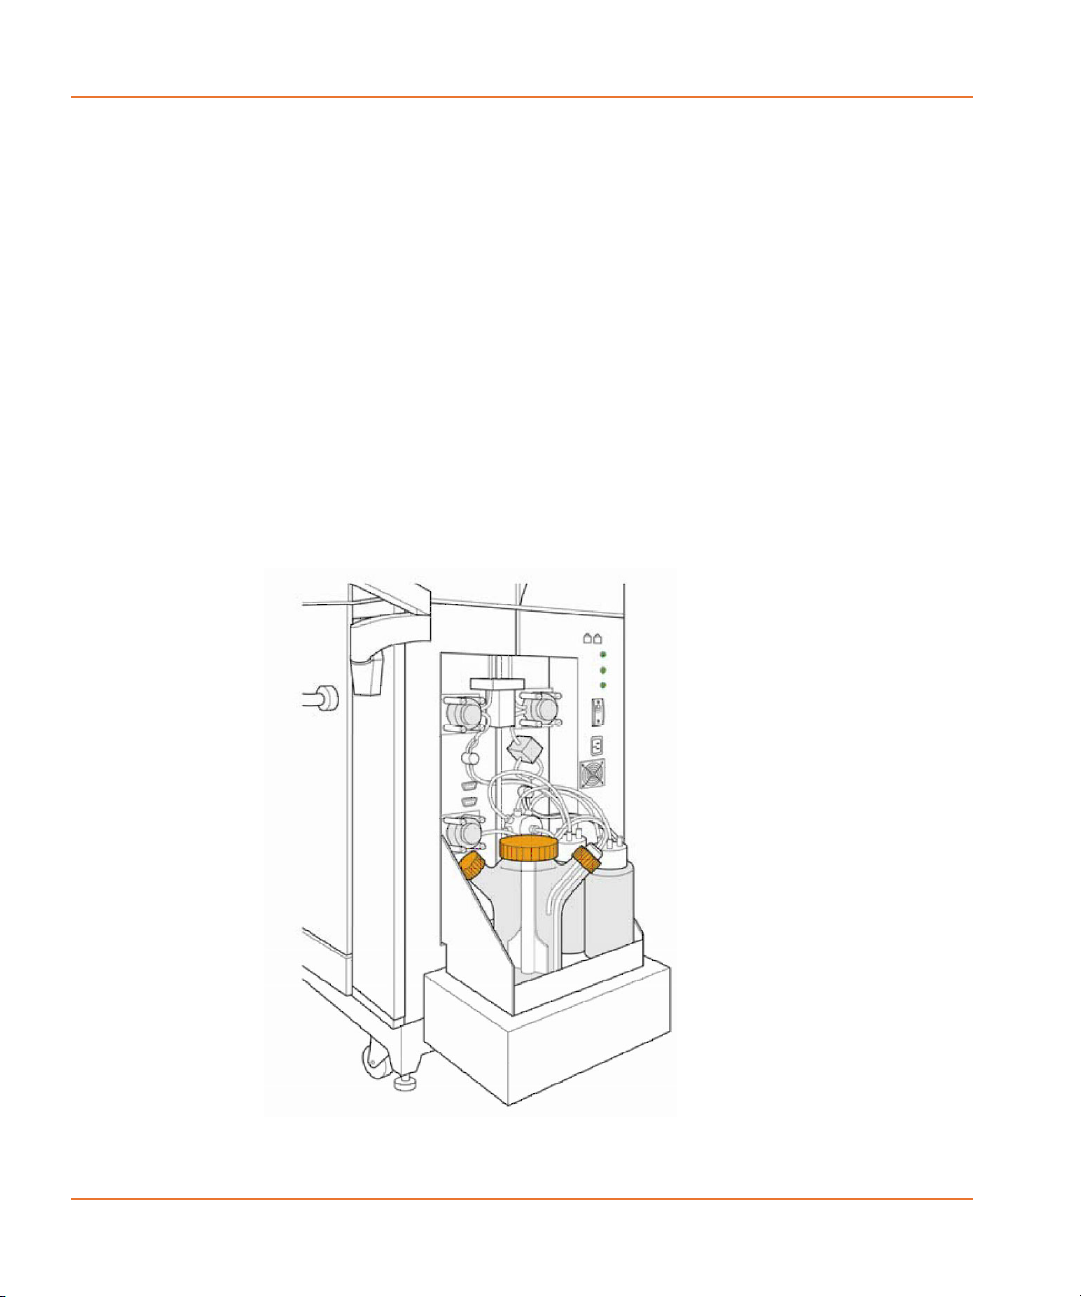
Cell Suspension
The Cell Suspension option consists of two components:
• The Cell Reservoir installable in Position 4 (Source 3) in the 5
position stage.
• The Cell Suspension module located externally on the right side
of the instrument.
The Cell Reservoir (see Figure 2-5) is user installable. The Cell
Suspension module (see Figure 2-6) consists of a shelf with a magnetic
motor mounted underneath it, a cell flask with a magnetic stirrer, up to
four fluid bottles for automated cleaning, and a removable cover for
keeping cells in a dark environment.
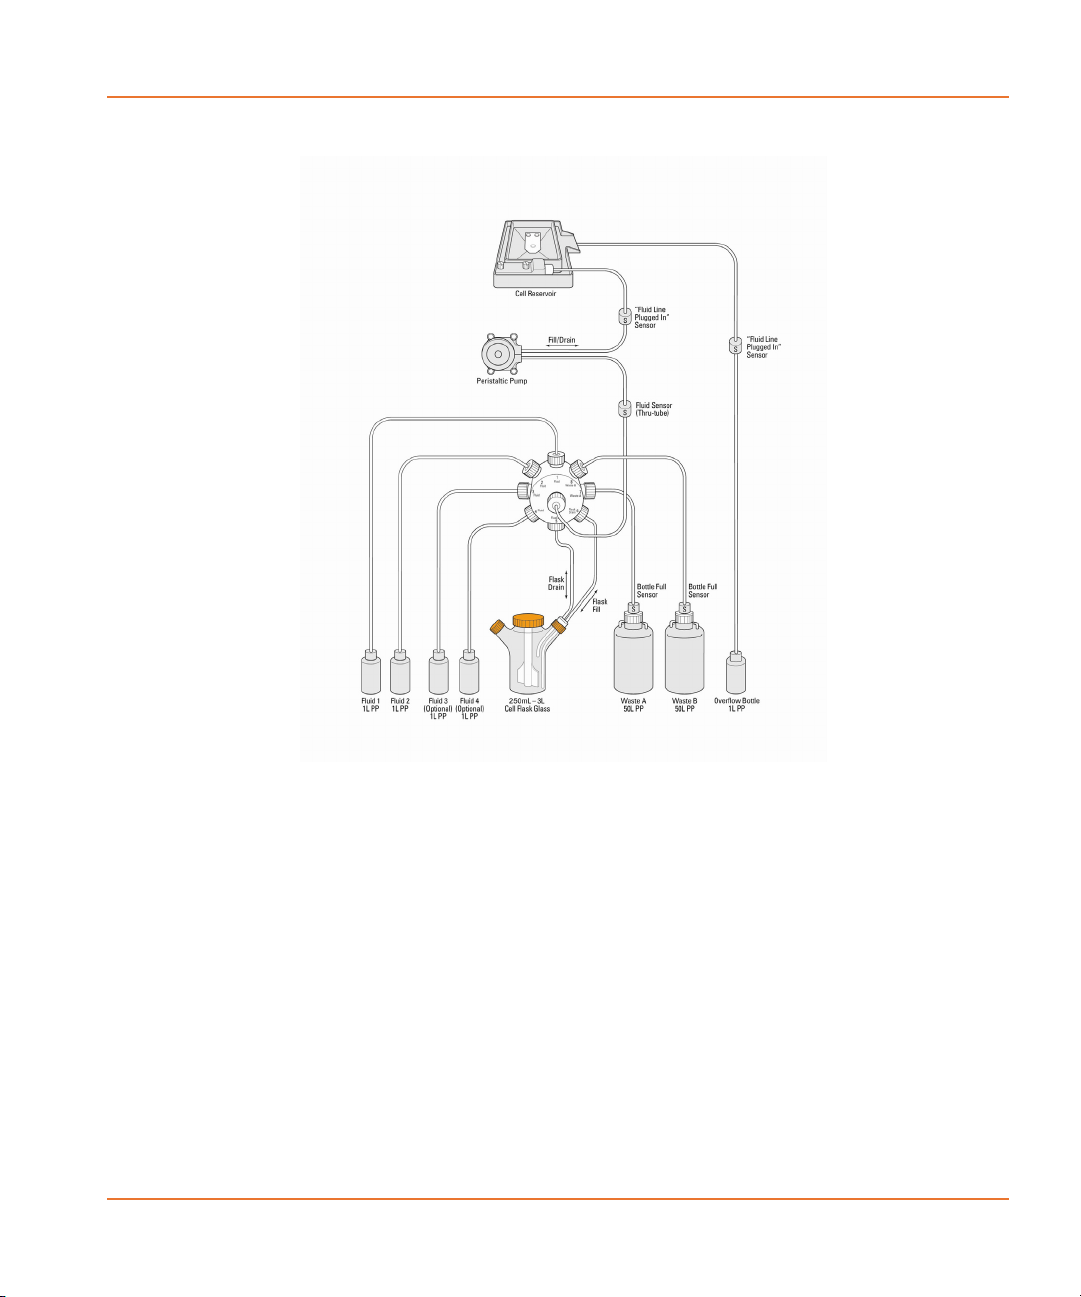
Figure 2-7 demonstrates how the system is connected and shows all
the possible combinations for protocol development.
Figure 2-5 Cell Reservoir.
The Cell Reservoir, which the user places in a source plate location, is
filled from any of the bottles in the external Cell Suspension module by
a pump with adjustable speed and direction.
The Cell Reservoir is a special plate type that has one fluid line used for
both input and output, and an electronic plate ID that is part of the
electrical/fluidic connector which identifies the reservoir to the system.
In the case of an overflow, an overflow trough catches excess fluid and
pipes it to the tip washer overflow trough, which directs it to the
overflow bottle. The reservoir is also autoclavable for cleaning
purposes.
The spinner flask contains a stirrer, which is driven by a magnetically
coupled motor mounted in the lower part of the Cell Suspension
module. The Cell Suspension stir speed can be set in a protocol or with
manual instrument controls. Stir speed of 5 equals approximately 1
0112-0109 H 27
System Hardware Features
revolution per second. From the uniform suspension in the spinner flask
cells are pumped into the Cell Reservoir, where the pipettor head in 96,
384, or 1536 format removes the appropriate amount and cells are
automatically pumped to a specified destination. A protocol in
ScreenWorks Software controls the stir speed and source/destination of
cell suspension activity.
The cell valve selects the source for filling, or the destination for
draining. There are 8 valve positions: flask fill (for filling the reservoir),
flask drain (for draining the reservoir without causing air bubbles),
Waste Bottle A, Waste Bottle B, and Fluid 1–4.
Fluid 1–4 are user specifiable, and can be cleaning solutions, water or
buffer. The user can choose to pump cells back into the cell flask or to
any other fluid bottles. Bottles for Fluid 1 and 2 are automatically
included with the Cell Suspension option.
Cell Reservoir can be washed by either adding the Wash Reservoir
process to the protocol (see Constructing Protocols Using FLIPR Tetra
Processes on page 70), selecting Wash Reservoir in the Instrument
> Manual Operation menu, or manually removing the reservoir and
autoclaving it.
Figure 2-6 Cell Suspension Module.
28 0112-0109 H
FLIPR® Tetra High Throughput Cellular Screening System User Guide
Figure 2-7 Cell Suspension Module connections.
Pin Tool Head
Pin tools are blocks of solid or slotted pins, where the pins replace the
hollow tips used with a standard pipettor. The pins use capillary action
to pick up and transfer liquid from one plate to another. Their ability to
accurately and reliably transfer compounds in nanoliter volumes allows
users to supply test compounds in 100% DMSO solution, removing the
need to prepare intermediate dilution plates.
The volume that each pin picks up is determined by the size of the pin
(and, if slotted, the size of the slot) and the withdrawal speed of the pin
from the liquid—a faster removal speed leaves more liquid on the pin.
Pins for the 384 pin tool are supplied in four sizes, giving a total range
(across all these sizes) from 84 nL to 656 nL. The 1536 pin tool has
seven different pin sizes, giving a total range from 19 nL to 117 nL.
0112-0109 H 29

System Hardware Features
Each pin size has a specified volume range that it carries:
• The lowest reported volume is for a tip removal speed of 7.8
• The highest reported volume is for a tip removal speed of 57.0
The precise volumes that will be picked up at given tip removal speeds
should be determined by users in assay development.
The FLIPR® Tetra System can be fitted with 384- or 1536-pin tool
heads. Pin tools themselves, in the appropriate 384 or 1536 format,
can be easily and rapidly replaced to change the pin size.
All the pin tools used with the FLIPR® Tetra System are available with a
hydrophobic and lipophobic coating to prevent or reduce the
nonspecific binding of proteins and lipids to the pins.
In order to ensure uniform compound pick-up across the entire pin tool,
pins can be configured to ‘float’ in source plate wells. Individual pins
are not rigidly attached to the pin block, having a small amount of
vertical movement up into the block. When set to float, the pin head
moves down very low so that all pins sit on the bottom of the well and
push up a little into the block. This ensures that all pins are equally
immersed in their wells, i.e., sitting on the bottom. This outcome could
not be guaranteed if the pins were rigidly fixed to the block, given that
plate bottoms are often not completely flat.
mm/s.
mm/s.
Compatible Plate Configurations
The 96- and 384-pipettor heads can be used with source or read plates
with equal or one order higher well number. This is because the FLIPR®
Tetra System can aspirate or dispense into quadrants of a plate. The
following combinations are possible:
• The 96-pipettor head can be used with 96- and 384-well plates.
• The 384-pipettor and pin tool head can be used with 384- and
1536-well plates.
• The 1536-pipettor head can be used only with 1536-well plates.
Deep-well plates or reservoirs can be substituted for standard well
plates.
When compound is aspirated or delivered to a plate with a greater
number of wells than the pipettor head, the quadrant number (1 to 4)
must be entered in the protocol configuration in ScreenWorks Software
for each dispense.
30 0112-0109 H

FLIPR® Tetra High Throughput Cellular Screening System User Guide
Tip and Pin Tool Loading
For all pipettor and pin tool heads, a sensor informs the software
whether or not tips or a pin tool are loaded. If desired, at the start of an
experiment, tips or a pin tool can be automatically loaded onto the
pipettor head by selecting Load Tips Position in the Settings
process. Otherwise, tip and pin tool loading or unloading must be
requested as independent operations from the Instrument > Manual
Operation menu. Directions for installation of the 1536 tip gasket are
given in Exchanging the 1536 Tip Gasket on page 135.
Tip and pin tool loading steps can be programmed to occur between
fluid transfers within experiment protocols.
Tip and Pin Tool Washing
Tip or pin tool washing is controlled with the Wash Tips or Wash Pins
process in ScreenWorks Software protocols and can be performed
between fluid transfers within an experiment, or after the last fluid
transfer, to prepare tips for the next experiment. Disposable tips, as
well as the 1536-tip head, and 384- and 1536-pin tools, can be
washed.
The washer consists of a reservoir top of the selected pipettor format,
mounted over a wash basin. Detailed instructions for exchanging the
reservoir top are located in Uninstalling Wash Reservoir Top on
page 133. The wash basin is connected to two solvent-supply carboys
and two waste carboys located on the floor beneath the computer
monitor. A basin beneath the tip washer base drains to a waste carboy,
to safely remove any solvent that overflows from the reservoir.
Wash solution fills the reservoir for a calibrated amount of time. Solvent
is then drained from the reservoir after each wash cycle. Up to five
wash cycles can be configured within a single wash process. For tips, a
user-set volume of solvent is drawn up, optionally held for a time, and
then expelled, up to 20 times. For pins, vertical motion of the tip block
is used to agitate the wash solvent around the pins. The option is
available to wash tips or pins in up to two solutions before reusing the
tip washer. When additional wash solutions are required, tips or pins
can be washed in a boat or reservoir, located in one of the source plate
positions, using the Mix Fluid process.
WARNING! High volumes of volatile, flammable solvents in the
reading chamber may cause explosive conditions. Use of 100%
isopropanol, etc., in the tip washer is particularly discouraged
without additional ventilation. Consult your facilities expert to
determine the appropriate ventilation to avoid explosive
conditions.
0112-0109 H 31

System Hardware Features
Pin tools are supplied with blotting stations that can be loaded into one
of the plate positions. Blot pin steps can be configured in the protocol to
remove fluid from the pins, for example, following pin washing.
Note: A waste bottle sensor override (P/N 0700-0827) is available in
the FLIPR® Tetra System accessory kit to bypass the waste sensor and
dispose waste in containers other than the dedicated waste carboys.
Optical System
The FLIPR® Tetra System optics are housed in the bottom compartment
of the main cabinet. In fluorescence assays, where excitation is
required, light from light-emitting diodes (LEDs) is directed at the base
of the read plate exposed in position 3 in the 5-position stage above.
Light emitted from the plate travels down through emission filters
before being captured in the CCD camera. Details on the main
components of the optical system, CCD camera options, the LEDs, and
emission filters, are presented below.
Figure 2-8 FLIPR® Tetra System optics.
32 0112-0109 H

FLIPR® Tetra High Throughput Cellular Screening System User Guide
CCD Camera Options
Two camera options are available for purchase with the FLIPR® Tetra
System. A standard, EMCCD (Electron Multiplying CCD) camera is
recommended for fluorescence only experiments, while the more
sensitive Aequorin ICCD (Intensified CCD) camera is designed for both
fluorescence as well as luminescence assays.
Standard EMCCD Camera
The CCD camera is located directly beneath the read plate on the fiveposition stage. The camera is thermoelectrically cooled and requires
about five minutes to reach its operating temperature of -60 ± 2 °C.
WARNING! Do not use the camera before it has reached its
operating temperature—this will result in noisy data. Check the
camera temperature on the Instrument Status panel before
starting an experiment.
The camera uses frame-transfer technology that shifts pixel values
from the exposed portion of the chip to the data processing portion.
This method allows a high acquisition rate and eliminates the possibility
of camera shutter failure.
The camera is an integrating-type detector using temporal integration
to build up the signal-to-noise ratio. Depending on the intensity of the
emitted light (reliant on dye efficiency and LED power), it may be
necessary to use longer camera exposures. This prevents the measured
fluorescence signal from being dominated by detector noise.
Images are taken of the bottom of the entire plate for a time specified
in the ScreenWorks Software protocol; exposure time can be set from
0.05 to 30 seconds. In ratiometric experiments for example, where two
or more wavelengths are measured, the number of images captured
increases so that an image is taken for each wavelength at the specified
rate. From each image a relative light value is calculated for each well.
The FLIPR® Tetra System reports relative light units (RLUs) in a range
from zero to approximately 12,000.
Note: Relative light units in the FLIPR® Tetra System do not have the
same value as those of previous FLIPR® Tetra Systems.
The light intensity detected by each pixel on the CCD chip can be
amplified using the Gain setting in ScreenWorks Software (Settings
Process). This parameter has a range from zero to 240. Amplification
is exponential, with increments increasing as you go higher up the
range. Fluorescence assays typically use a gain of 130 whereas
0112-0109 H 33

System Hardware Features
luminescence assays should use 200 as a starting point. Gain
optimization should be done during assay development to determine
optimal conditions for your screen.
When a luminescence experiment follows a fluorescence experiment we
recommend that you cycle the camera temperature to eliminate ghost
images that may have been created during the fluorescence assay.
Select Cycle Camera Temperature from the Instrument > Manual
Operation menu to choose this option. The camera warms up to room
temperature to release ghost images, prior to cooling back down to
approximately -60 °C.
Note: Luminescence readings continue to be available with the
Standard, EMCCD camera option, however camera sensitivity is not
optimal for this type of experiment.
Aequorin ICCD Camera
When this option is selected instead of the Standard camera, the ICCD
camera is mounted directly beneath the read plate on the five-position
stage, although at a slightly different height then the Standard EMCCD
camera. This camera operates at -20 °C and requires about 5 minutes
to reach that temperature.
Note: The instrument will detect an error if the user tries to operate
the instrument with the camera out of its recommended temperature
range of -20 °C ± 5 °C.
Similar to the Standard camera, the Aequorin camera also uses frametransfer technology that shifts pixel values from the exposed portion of
the chip to the data processing portion. In this camera, however, the
signal is enhanced prior to reaching the CCD chip: it is amplified in the
intensifier. Using this method there is less noise and therefore the
camera is significantly more sensitive then the Standard EMCCD
camera.
When using the Aequorin ICCD camera images are taken of the bottom
of the plate, amplified in the intensifier and transferred via a fiber optic
taper to the CCD chip. The gain control of the intensifier allows for
bright signal from fluorescence as well as dim signal from luminescence
to be enhanced accordingly, so as to provide the best signal and not
saturate the CCD chip below. In Fluorescence mode the Gain is preset
to 2000, whereas in Luminescence mode the Gain defaults to 280,000,
but can be lowered in the event that the luminescence assay is very
bright.
This camera has a Gate Open % feature, adjustable in Fluorescence
mode only. This feature controls how long the intensifier is on for each
34 0112-0109 H

FLIPR® Tetra High Throughput Cellular Screening System User Guide
of the frames collected during the exposure time. This controls the
signal intensity of the assay.
The recommended value range for the ICCD camera is 40,000 to
50,000 (at maximum signal). This camera does not require
temperature cycling when changing between Fluorescence and
Luminescence modes.
Both Cameras
Once calculated, RLUs are displayed in real time in the ScreenWorks
Software Analysis process window (within the limits of computer
processing speed). Data for one wavelength (for example, Read
mode), for all 1536, 384 or 96 wells of the read plate, are displayed in
the Multi-Well Graph on the right side of this view. The Detail Graph
can be populated by selecting wells in the Multi-well graph. When an
experiment is completed, post-assay analysis can be done via
ScreenWorks Software, or data can be exported.
In normal operation images are discarded once RLU values have been
measured. However, for quality control purposes, users can define the
number of images per Read with Transfer Fluid step. Up to 100
images per experiment can be retained. These images can be useful for
troubleshooting problems, such as cells lifting from well bottoms during
compound addition. Images are saved as *.tif files with the same name
and to the same directory as the data file. They can be viewed by
clicking the Image button in the Analysis process page when the
resulting data file is open in ScreenWorks Software.
Please note that the robustness of an assay is not dependent on the
size of the signal; it is better determined by the signal-to-noise ratio. A
commonly used calculation for determining assay robustness is the Z’
factor equation1.
LED Modules
The FLIPR® Tetra System has a total of four LED banks providing
illumination for plate reading. The LED banks pulse on, two at a time,
only when an image is to be captured, protecting cells from possible
dye photo-bleaching.
The LED banks are divided between two modules, one on either side of
the read plate position above. LED banks in corresponding positions in
either module are paired. The paired LED banks pulse simultaneously
during an experiment, so that light strikes the read plate base from two
directions, helping to ensure that the entire plate is maximally
illuminated.
1. Zhang J, Chung TDY and Oldenburg KR. A Simple Statistical Parameter for Use
in Evaluation and Validation of High Throughput Screening Assays. J. Biomol.
Screen. 1999; 4:67-73.
0112-0109 H 35

System Hardware Features
Typically, the two LED bank pairs are set up with LEDs of different
wavelengths, for example., one pair might have LEDs of range 470 nm
to 495 nm, while the other pair might be 510 nm to 545 nm.
Ratiometric experiments can be set up to use both of these
wavelengths, in which case the paired banks fire alternately.
Note: Despite the two excitation wavelengths firing alternately,
output data files show time points for each as occurring
simultaneously.
Deflectors around the LED banks direct all light from the LEDs through
excitation bandpass filters that further refine the wavelength. The light
is then funneled into light pipes that focus it onto the base of the read
plate.
The FLIPR® Tetra System will not operate without the full complement
of LED banks installed, however blank LED banks can be used for one
pair if only one excitation wavelength is available. Unless additional LED
banks are ordered with a purchase, FLIPR® Tetra Systems are shipped
with a set of default calcium LED banks (470–495 nm) and a set of
blank LED banks.
Configuration of LEDs for an experiment is mostly carried out in
ScreenWorks Software in the Settings window; see Setup Read Mode
on page 72 for details. LED banks can be changed by the user in
approximately 10 minutes; refer to Exchanging LED Modules on
page 138 for instructions.
LEDs do not need time to warm up prior to running an experiment.
Startup time is only dependent on the time it takes for the camera to
cool down and for the stage to heat up, if this option is used.
The LEDs are air-cooled by fans, however the light output varies
slightly as they heat up. To help with the heat transfer, a piece of foam
in inserted in the back of the LED bank on each side. Also to counteract
the temperature change, a temporal correction is automatically applied
to the LED feedback circuit to normalize the system.
Flat field calibration is automatically applied to the read plate to adjust
for non-uniformity of illumination across the plate. Refer to Optical
Calibration on page 149 for instructions on how to manually calibrate
the system.
WARNING! Do not look into LED banks when turned on,
especially at intensities over 30% or in the UV spectrum,
unless you are viewing them through the observation panel. If
light is seen escaping the instrument when the LED modules
are turned on, shut down immediately and call Molecular
Devices Technical Support.
36 0112-0109 H

FLIPR® Tetra High Throughput Cellular Screening System User Guide
Figure 2-9 LED configuration.
Emission Filters
A three-position filter slider holding up to three 60 mm diameter
interference filters is located in front of the CCD camera. The slider can
be alternated in front of the camera to separate out the emission band
of the dye being used. These filters can be used with a single excitation
wavelength or can be paired up with additional emission filters and
LEDs in a ratiometric experiment, for example, as excitation LEDs
alternate between two different wavelengths, filters change at the
same time so that each image taken by the camera matches the right
emission filter with the excitation LED bank. The most common FLIPR®
Tetra System configuration is a LED excitation wavelength of 470–495
nm with a 515–575 nm bandpass emission filter. For luminescence
experiments it is also possible to run without the filter.
Emission filters are user-changeable in approximately 5 minutes; see
Changing Filters on page 141 for instructions. Once installed, filters are
mechanically sensed and the filter configuration can be viewed in the
Instrument Configuration panel in ScreenWorks Software. The
instrument will prompt you to calibrate a new emission filter with
respect to an LED module if they are intended to be used in an
experiment.
0112-0109 H 37

System Hardware Features
Note: If a desired filter is not available, three custom filter cassettes
(P/N 0200-6221) are available for purchase to place filters created by
an outside vendor. Once installed, these filters are displayed as
Custom 1, Custom 2 and Custom 3 in ScreenWorks Software.
Chiller
Because the FLIPR® Tetra System is a light-tight instrument there is
very limited airflow inside the instrument enclosure. To provide a
suitable operating environment for both the Standard EMCCD and
Aequorin ICCD cameras, an external chiller is required. The chiller uses
a special cooling liquid supplied with the instrument and is controlled
via the embedded computer and instrument firmware. The chiller sits
outside of the instrument and is connected via cable and tubing to the
FLIPR® Tetra System.
Computer System
Host Computer
Apart from exchanging hardware and manual loading of plates, all
normal user interaction with the FLIPR® Tetra System is mediated
through the ScreenWorks Software run on an external host Intel
processor-based computer, supplied with the system. The minimum
configuration required is:
• Intel Pentium D processor (3.4 GHz or above)
• Windows XP Professional or Windows 7
• 2 GB of SDRAM (or above)
• Hard Disk Drive (160 GB or above)
• Ethernet adapter
• DVD-CDRW drive
• 1 PCI expansion slot (or above)
Please contact Molecular Devices for any specific questions regarding
the system’s host computer.
38 0112-0109 H

FLIPR® Tetra High Throughput Cellular Screening System User Guide
Embedded Computer
An embedded computer located in the lower chamber controls basic
®
FLIPR
the ScreenWorks Software control software installed on the host
computer and sent to the embedded computer to execute the function.
This setup allows data processing and instrument control to be
performed separately to ensure the greatest productivity during an
experiment.
Tetra System functions. These functions are initiated through
0112-0109 H 39

System Hardware Features
40 0112-0109 H

Startup and Shutdown
This chapter provides procedures for starting up and shutting down the
FLIPR® Tetra High Throughput Cellular Screening System. These
procedures should be followed closely in order to ensure proper
communication between ScreenWorks® Software and the hardware.
Starting Up the System
To start the FLIPR® Tetra System:
1. Turn on the computer and monitor.
2. Simultaneously press the Ctrl+Alt+Delete keys to launch the
Windows operating system.
3. At the prompt enter your password.
Note: After installation, the default password is flipr.
Wait for the operating system to finish starting-up before
proceeding.
4. Turn on the external chiller with the switch located on the left
side of the chiller.
5. Turn on the FLIPR® Tetra System’s power switch located on the
right side of the instrument. The system goes through an
initialization cycle to register all instrument components. This
cycle is not complete until the green Assay Finished (Unlock)
light is the only light illuminated on the instrument status panel.
6. Launch the ScreenWorks Software by double-clicking on the
desktop icon.
3
Note: Launching the software may take several seconds. Do not
repeatedly double-click the software icon.
Note: The system is ready for use when the camera temperature in
the instrument status window displays -60 ± 2 °C for the Standard
EMCCD camera, or -20 ± 5 °C for the Aequorin ICCD camera.
0112-0109 H 41

Startup and Shutdown
Shutting Down the System
To shut down the FLIPR® Tetra System:
1. At the end of a programmed experiment, wait for the Assay
Finished (Unlocked) light on the Instrument Status Panel
to turn green, indicating the experiment is finished.
2. We recommend making sure that tips are removed from the
pipettor head if the last protocol did not remove them. You can
do this via manual command. Failure to remove tips can result
in an error on next start up.
3. Exit ScreenWorks Software by choosing Exit from the File
menu.
4. Turn off the computer and monitor.
5. Turn off the FLIPR
6. Turn off the chiller power switch.
®
Tetra System power switch.
42 0112-0109 H

Software Installation
This chapter describes how to install ScreenWorks® System Control
Software.
You must have administrative privileges on the computer operating
system to install ScreenWorks Software.
Installing ScreenWorks Software
As of version 3.1, the installer automatically uninstalls the old software
version as long as it is same major release (3.1 to 3.2). If you are
replacing ScreenWorks Software version 2.0 manually uninstall the old
software before installing the new software. See Uninstalling
ScreenWorks Software on page 46.
1. Double-click the ScreenWorks_3_2_x.exe ScreenWorks
Software installation file. A Welcome to the ScreenWorks Setup
Wizard dialog is displayed.
2. Click Next.
3. In the License Agreement dialog box, select I accept the
terms of the license agreement, and click Next.
4. In the Online/Offline Mode dialog, designate the default mode
in which you want the software to start.
In Online, ScreenWorks Software automatically looks for a
connected instrument when the software is started.
In Offline, ScreenWorks Software does not automatically
look for a connected instrument.
Refer to Online vs. Offline Installation on page 45 for further
details.
5. Click Next.
6. In the Destination Folder dialog, the Install ScreenWorks
3.2 to field displays the default installation directory. To change
the installation directory, click Change, navigate to the desired
directory, then click OK.
7. Click Next.
8. In the Select Program Folder dialog, leave the displayed
default Program Folder settings. Select Anyone who uses
this computer to make ScreenWorks Software available to all
users on the FLIPR® Tetra System host computer, then click
Next.
4
0112-0109 H 43

Software Installation
9. In the Configuring the ScreenWorks installation dialog, if
you want to make any changes, click Back to go to the previous
screen, otherwise click Next to start the installation.
10. When the installation is complete, the Completing the
installation process dialog appears. Click Finish to exit the
wizard.
Activating the ScreenWorks Peak Pro License
Note: The Peak Pro functionality is license-protected. If the
ScreenWorks® Peak ProTM license is not activated after the trial period
expires, the Peak Pro functionality hides, but the rest of the
ScreenWorks Software version 3.2 remains functional. ScreenWorks
Peak Pro license activation enables the Peak Pro functionality any time
after the trial period expires.
To activate the ScreenWorks Peak Pro license:
1. Start the ScreenWorks Software application.
2. Click the Help Tab.
3. Click Software License.
4. If you have internet connectivity, type the provided Product
Key in the field and click Activate Online, and then follow the
on-screen instructions.
5. If you do not have Internet connectivity, click Activate Offline
and follow the on-screen instructions. Activate Off line requires
the following:
Your product key
A separate computer with Internet connectivity
A USB drive for transferring files between the computers
44 0112-0109 H

FLIPR® Tetra High Throughput Cellular Screening System User Guide
Online vs. Offline Installation
The software has two start-up modes:
• Offline (Desktop)
• Online (Instrument)
The default start-up mode is determined during software installation in
the Online/Offline dialog.
After the software is open, you can switch modes by selecting Go
Online or Go Offline from the Instrument menu.
Note: Switching modes after the software is opened does not change
the software startup mode chosen at the time of installation. To
change the default startup mode the ScreenWorks Software must be
reinstalled.
Online (Instrument) Mode
When launched in this mode, ScreenWorks Software checks for
instrument connections. If no connections are sensed, you are notified.
You may then either check the connections and attempt to connect
again, or choose to run the software in Offline mode.
If you create a protocol in Online mode, only the current instrument
settings are allowed. Protocols created in Offline mode with hardware
settings that do not match current hardware settings are flagged. You
must change the hardware settings to match those in the protocol in
order to run it.
When ScreenWorks Software is launched in Online mode and connects
to the instrument, the default installation configuration file is
overwritten using the current instrument settings and plate library
information.
If you are running in Online mode and then switch to Offline mode, the
instrument setup configuration will be the last Online configuration.
Note: To be able to select any configuration to generate protocols,
you must install the software in Offline (desktop) mode.
0112-0109 H 45

Software Installation
Offline (Desktop) Mode
When ScreenWorks Software is launched in Offline mode, you can
configure the following hardware options:
• Camera Type
• Excitation Wavelengths
• Emission Wavelengths
• Pipettor (automatically selects matching tip washer type)
• Cell suspension
• TETRAcycler™ (automatically sets bar code reader status)
Note: Regardless of the start-up mode, pipettor head and tip washer
type must always match. If the TETRAcycler is installed, it is assumed
the bar code reader is also connected.
Uninstalling ScreenWorks Software
1. Click Start > Control Panel and double-click on Add or
Remove Programs from the Windows Control Panel dialog.
2. Find ScreenWorks in the list of currently installed programs
and click Remove to initiate the uninstall process.
3. Click Next when prompted to Uninstall ScreenWorks.
4. In the Configuring the ScreenWorks installation dialog,
Click Next.
When the installation is complete, the Completing the
installation process dialog appears. Click Finish to exit the
wizard.
46 0112-0109 H

ScreenWorks Software Overview
This chapter has descriptions of windows, menus, dialog boxes, and
toolbar icons of the ScreenWorks® System Control Software.
ScreenWorks Software Main Screen
The ScreenWorks Software main screen includes title, menu, and
toolbars across the top, and a status bar at the bottom. The main
working area in the middle can have up to two sections:
• Experiment window, typically occupying the greater proportion
of the main window, for protocol configuration, data viewing and
analysis.
• Instrument Status Panel, by default on the bottom of the main
work area, for instrument information. This panel includes
instrument status and configuration in addition to the Process
Explorer where ‘processes’ used in protocol definition are
located.
Title Bar
Menu Bar
Toolbar
5
Experiment Window
Instrument Status Panel
Status Bar
Figure 5-1 Diagram of main ScreenWorks Software interface.
0112-0109 H 47

ScreenWorks Software Overview
Title Bar
The title bar extends across the top of the ScreenWorks Software
window. It reports the application name—ScreenWorks and version
number—followed by the name of the currently active protocol or data
file, open in the Experiment window.
Title bar color indicates whether or not the window is active: the title
bar of an active window is typically a different color from (and usually
brighter than) other window title bars for programs that are inactive
(which may be dimmed).
Dragging the title bar repositions the window on the screen (in window
view only; if the window has been maximized, dragging will not work).
Buttons are displayed at the right end of the title bar can be used to
minimize the window so it appears only on the task bar, maximize the
window to full screen, or to close the window.
Menu Bar
The menu bar, beneath the title bar, contains six menus that group
together related commands. Click on a menu name to display the
commands in the menu.
See Menu Bar on page 51 for a full description of each menu command.
Toolbar
The toolbar, beneath the menu bar, contains tool button shortcuts for a
number of main-menu commands.
The toolbar can be hidden or shown from the View > Toolbar toggle
command.
The table below lists the toolbar commands. See the Menu Bar on
page 51 section below for more detailed descriptions of the commands.
Button Name Description
New Document Opens a new protocol file (*.fmp) with
Open Protocol File Opens the Open File dialog to browse and
Open Data File Opens the Open File dialog to browse and
48 0112-0109 H
default settings for an assay with a single
read with fluid transfer.
Files are named Untitled[n] where n is a
number.
open protocol (*.fmp) files.
open data (*.fmd) or image files.

FLIPR® Tetra High Throughput Cellular Screening System User Guide
Button Name Description
Save File Opens the Save File dialog that allows you
to save the current file in the desired
location.
Export File Opens the Export File dialog that allows
you to manually export the current file in the
desired location.
Print Opens the Print dialog.
Experiment Summary Displays protocol contents (process steps
and correction) for the current protocol or
data file.
This button toggles with Experiment
Setup.
Experiment Setup Opens the Experiment Setup window to edit
the current protocol, view or analyze data in
a data file.
This button toggles with Experiment
Summary.
®
Help Opens the FLIPR
Tetra System Users Guide
in PDF format.
Stop Stops the experiment currently running.
Run Starts the protocol selected in the
Experiment window.
SynchroMax
Automation
Opens the SynchroMax™ Automation
window to select the desired template to run
the SynchroMax ET plate handler.
Online Mode This button is displayed when ScreenWorks
is in Offline Mode. Click to connect to the
instrument and go into Online Mode.
This button toggles with Offline Mode.
0112-0109 H 49

ScreenWorks Software Overview
Button Name Description
Offline Mode
This button is displayed when ScreenWorks
Software is in Online Mode. Click to
disconnect from the instrument and go into
Offline Mode.
This button toggles with Online Mode.
Remote Mode
Manual Mode
Instructs
manual connection and to only receive
Remote commands from a third-party robot.
This button toggles with Manual Mode.
Instructs
remote connection and to only receive
Manual commands from the
ScreenWorks Software to disable
ScreenWorks Software to disable
ScreenWorks
Software user interface.
This button toggles with Remote Mode.
Calibration Opens the Calibration dialog where Flat
Yellow Plate Signal
Test
Protocol Signal Test Opens the Protocol Signal Test dialog to
Set Spinner Flask
Stirring Rate
Field calibrations can be performed.
Opens the Yellow Plate Signal Test dialog
to display the numerical results using the
Yellow Plate.
display the numerical results prior to running
an experiment. Settings defined in this
signal test can be saved to the protocol
*.fmp file.
Opens the Spinner Flask Control dialog
where the stirring rate can be set.
Set Chamber’s
Temperature
50 0112-0109 H
Opens the Set Temperature dialog where
the chamber temperature can be set in
degrees Centigrade, or disabled.

FLIPR® Tetra High Throughput Cellular Screening System User Guide
Button Name Description
Restore Layout 1 Restores the Experiment window layout to
Restore Layout 2 Restores the Experiment window layout to
Restore Layout 3 Restores the Experiment window layout to
Restore Layout 4 Restores the Experiment window layout to
those defined as Save To Layout 1 in the
View menu.
those defined as Save To Layout 2 in the
View menu.
those defined as Save To Layout 3 in the
View menu.
those defined as Save To Layout 4 in the
View menu.
Status Bar
The status bar, across the bottom of the main window, provides tool
tips for commands in the main menu. When you open a menu from the
menu bar and place the cursor over a command, a description of the
command is displayed in the status bar.
The status bar can be hidden or shown from the View > Status Bar
toggle command.
Menu Bar
This section lists and explains the commands available in the Menu Bar
menus.
Some menu items can be opened with a keyboard shortcut using the
Alt key to underline the letter in each menu title that is used to open
the menu; for example, when you click Alt the I in the Instrument
menu is underlined. Click the I key and the Instrument menu opens.
0112-0109 H 51

ScreenWorks Software Overview
File Menu
The File menu contains commands that enable you to open, close, save
and print FLIPR
®
Tetra System data and protocol files.
Item Description
New Opens a new protocol (*.fmp) in the Experiment
Open Opens an Open File dialog to open a saved
window, with default settings for one read with
fluid transfer.
New protocols are named Untitled[n], where n is
a number.
Protocol (*.fmp), Data (*.fmd) or Image
(*.png) file, as selected in the submenu.
By default, the dialog opens in the folder set in
Tools > Set Default Directories.
Note: Only data files created with
ScreenWorks Software can be opened in
ScreenWorks Software. Data files from
previous FLIPR® Systems (versions 1.X
through 2.X) cannot be opened.
Close Closes the currently active protocol or data file,
Save Saves the currently active protocol or data file,
Save As Opens the Save As dialog and allows you to save
Save All
Files
displayed in the foreground of the Experiment
window. If modifications have been made to the
file, you are prompted to save the modifications.
displayed in foreground of the Experiment
window. Also saves If the displayed file is a
default protocol that is untitled, the Save As
dialog box is displayed so that you can name the
file.
a protocol or data file under a new name or
format (for example, save a data file as a
protocol). Also allows you to save a protocol or
data file as an earlier version of the ScreenWorks
Software. When changing formats, select the file
type from the Save as type drop-down list.
Saves all of the opened protocol and data files. If
the default protocol file was opened, the Save
As dialog is displayed so that you can name the
files.
Keyboard
Shortcut
Ctrl+N
Ctrl+O
Ctrl+Shift+O
Alt+F,C
Crtl+S
Alt+F,S
52 0112-0109 H

FLIPR® Tetra High Throughput Cellular Screening System User Guide
Item Description
Close All
Files
Export Opens the Export File or Batch Export dialog,
Page Setup Opens the Page Setup dialog to configure the
Print
Preview
Report
Print Report The Print Report dialog allows you to select the
1–6 Data
Files
7–10
Protocol
Files
Exit
Closes all of the opened protocol and data files. If
any of the files had changes since they were
opened or the default protocol file was opened,
the Save or Save As dialog is displayed so that
you can name the files.
as selected in the submenu, to manually export
data from the open data file, or other data files
on disk; see Exporting Data on page 99.
printer and print settings for the document.
Displays how the document will look when
printed.
graphs or reports to print from the current data
file. Having made the selection you can open
Print Preview Report to check before printing,
or open the Print dialog to print.
Lists the six most recently opened data files, with
the most recently opened at the top.
Lists the four most recently opened protocol files,
with the most recently opened at the top.
Closes
unsaved data, you will be prompted to save it
before closing.
ScreenWorks Software. If you have
Keyboard
Shortcut
Alt+F,G
Alt+F,V
Crtl+P
Alt+F,X
0112-0109 H 53

ScreenWorks Software Overview
Saving Data Files as Protocol Files
When the active file is a protocol file, you can add, remove, or change
processes in the file, then save the amended protocol and run it.
Protocol information stored in data files cannot be edited, nor used to
run a new experiment, however it is possible to extract this information
to a new protocol file. Experiments run using this file will have exactly
the same steps as the steps used to create the data file.
To store a data file as a protocol file, select Save As, assign a protocol
name, select *.fmp as File Type and click Save. The stored file is
stripped of all data and only associated protocol information is stored in
the protocol file.
Note: Saved changes only affect the protocol. The data file from
which the protocol was derived remains intact.
View Menu
View menu commands enable you to select which displays to show or
hide in the ScreenWorks Software main window.
The keyboard shortcut is Alt+V.
Item Description
Experiment
Setup
Experiment
Summary
Save Layout Saves the proportions displayed in the Experiment window
Restore Layout Restores the screen layout to one of four proportions saved
Instrument
Status
Toolbar Toggles the Toolbar in and out of view (see Toolbar on
Status Bar Toggles the Status Bar at the bottom of the main window in
54 0112-0109 H
Displays the Experiment Setup view of a protocol or data
file, showing processes and associated dialogs, as opposed
to the Experiment Summary.
Displays the Experiment Summary for the current protocol
or data file, in the Experiment window.
To return to the normal view, select the Experiment Setup
command, immediately below in the View menu.
(including Multi-Well and Detail Graphs as well as Group
Statistics window) and Instrument Status panel to one of
four layouts. These layouts can be toggled between when the
appropriate Restore Layout selection is made.
in the Saved Layout selection.
Toggles the Instrument Status panel in and out of view
(see Instrument Status Tab on page 66).
page 48).
and out of view (see Status Bar on page 51).

FLIPR® Tetra High Throughput Cellular Screening System User Guide
Instrument Menu
Instrument menu commands enable you to access instrument
communication and manual dialogs.
Item Description
Go
Online/Offline
Run Experiment
Stop Experiment
Manual
Operation
A toggle that switches the instrument between Online and
Offline modes (see Online vs. Offline Installation on
page 45).
Go Online—This is displayed when
Software is offline. Click to connect the software to the
®
FLIPR
of the instrument.
Go Offline—This is displayed when ScreenWorks Software
is connected to FLIPR
Tetra System, giving ScreenWorks Software control
®
Tetra System. Press to disconnect
ScreenWorks
ScreenWorks Software from the instrument.
Instructs
using the uppermost protocol file in the experiment.
Instructs
ScreenWorks Software to start an experiment
ScreenWorks Software to stop the experiment.
Note: Stop Experiment should only be used in
emergencies to halt an experiment. If used, an
instrument reset may be required.
Commands in this submenu control specific hardware
operations.
Note: The commands are disabled if the associated
hardware is not available.
Load Tips—Instructs pipettor to load tips or pin tool.
Unload Tips—Instructs pipettor to unload tips or pin tool to
the load tips/source 3 position. It is recommended that you
unload tips to a tip rack. If you choose to unload without
one, make sure there is a container in the appropriate
position to receive tips.
Wash Tips—Instructs pipettor to wash tips or pin tool. A
dialog box opens for you to configure the wash.
0112-0109 H 55

ScreenWorks Software Overview
Item Description
Manual
Operation
(continued)
Yellow Plate Signal Test—Instructs the instrument to
take a reading of the read plate for the current protocol and
to display the numerical results in the Signal Test dialog
box. For detailed information on the features and functions
of the signal test, see Signal Test on page 57.
Protocol Signal Test—Instructs the instrument to take a
reading of the read plate and to display the numerical
results in the Signal Test dialog box. Instrument settings
can be saved to the open protocol. For detailed information
on the features and functions of the protocol signal test, see
Signal Test on page 57.
Change Head—Instructs the pipettor head to move over
the read plate position. In this position, the pipettor head
can be exchanged to a new pipettor format (see Exchanging
Pipettor and Pin Tool Heads on page 129).
Change Optics—Allows the user the change the optics
(LEDs or Em filters) and informs the instrument once the
change is complete, so it can reset itself.
Cycle Camera Temperature—Only used with EMCCD
camera. Cycles the camera when you want to run a lowfluorescence or luminescence experiment immediately after
running a high-fluorescence experiment. In the
approximately 15 minute cycle period the camera is raised
to room temperature (20–25 °C) and then cooled to -60 2
°C.
Temperature Control—A toggle that turns heating on and
off for positions Source Plate 1, 2 and 3. When heating is
turned on a dialog box is displayed to enter the desired
temperature.
Cell Flask Stirring Control—Allows the user to set the stir
speed rate for the cell flask.
Wash Cell Reservoir—Enables the user to wash the Cell
Reservoir by selecting the Fluid Source, Fluid Destination,
Fill Speed, Drain Speed, along with the number of Wash
Cycles and Hold Time. It also allows the user to Pre-coat the
tubes, which is recommended for the first run with any cells
in suspension.
Drain Cell Reservoir—In case of an instrument error or
manually poured cells into the Cell Reservoir, allows the
user to drain the Cell Reservoir to a specified destination.
Note: Resetting the instrument automatically drains
the Cell Reservoir to the waste bottle.
56 0112-0109 H

FLIPR® Tetra High Throughput Cellular Screening System User Guide
Item Description
Set Remote/
Manual Mode
SynchroMax
Automation
Reset Reinitializes the system to clear any fatal errors as
Clear Error Clears minor system errors as designated in yellow at the
Calibration Opens the Calibration dialog where Flat Field Calibration
Refresh
Configuration
A toggle that switches the instrument between manual and
remote modes.
Set Remote Mode—Enables you to integrate a third-party
robotics system with FLIPR
Robotic Integration on page 221
ScreenWorks automatically goes into Remote Mode if you
open SynchroMax Automation, however Remote Mode
is not used to initiate communication with the SynchroMax
ET.
Set Manual Mode—Disables SynchroMax ET or third-party
robotics control. All instrument commands must be initiated
through ScreenWorks.
Opens the SynchroMax dialog for configuration of plate
handling with the SynchroMax ET. See SynchroMax™
Automation on page 59.
designated in red at the bottom of the Instrument Status
panel.
bottom of the Instrument Status panel.
Calibrations can be performed. See Recalibrating the Optics
on page 150.
Refreshes the instrument configuration. Use this command
after hardware settings have changed.
®
Tetra System. See Appendix A:
.
Signal Test
The signal test has two functions:
• Checking the state of the overall system: This function is
typically performed using the yellow test plate with the
respective plate format for your assay and can be accessed
through the Yellow Plate Signal Test command in the main
menu. Outlined in the table below are the default settings used
when performing the yellow plate signal test. These settings
cannot be saved to a protocol for use at a later time.
• Checking initial fluorescence of a plate prior to running an
assay: This function is typically performed to evaluate the assay
plate prior to running an experiment and can be accessed
through the Protocol Signal Test command in the main menu.
Settings outlined in the table below will default to the settings in
the currently open protocol when performing the protocol signal
test. These settings can be saved to the open protocol for use at
a later time.
0112-0109 H 57

ScreenWorks Software Overview
The table below describes the settings in the Yellow Plate Signal Test
and Protocol Signal Test dialog:
Item Description
Select Plate Choose the plate type from the drop-down list.
Excitation/Emission
Wavelength
Reading Mode Select Fluorescence or Luminescence from the list.
Camera Gain Select the camera gain for the signal test from the list.
Gate Open This option is available only for the Aequorin ICCD
Excitation Intensity Select the LED intensity for the signal test from the drop-
Exposure Time Enter the amount of time (in seconds) to keep the
Highlight Range Highlights well values that lie within the set statistical
Wells Above Range Displays the number of wells above the statistical range
Wells Below Range Displays the number of wells below the statistical range
Maximum Displays the largest value on the signal test plate.
Average Displays the average value on the signal test plate.
Minimum Displays the smallest value on the signal test plate.
Std. Dev Displays the standard deviation of the signal test plate.
Test Signal When clicked, initiates a new signal test.
Select the appropriate excitation/emission wavelength
pair for the signal test from the drop-down list.
Note: Only calibrated excitation/emission
wavelength pairs are displayed in the drop-down
list.
Typical Camera Gain is 1 for the EMCCD camera and 2000
for the ICCD camera, for the 470–495/515–575 nm
excitation/emission pair when reading a yellow test plate.
camera. Typical Gate Open values for Fluorescence are
around 6% but can be set to 100%. Luminescence gate
is always 100%, and not user-adjustable.
down list. Excitation intensity is scaled as a percentage of
the total LED output (0–100%). Typical Excitation
Intensity is 80 for the 470–495/515–575 nm
excitation/emission pair when reading a yellow test plate.
camera shutter open during the Signal Test. Typical
Exposure Time is 0.4 seconds for the EMCCD camera and
0.53 seconds for the ICCD camera, for the
470–495/515–575 nm excitation/emission pair when
reading a yellow test plate.
range. Set the statistical range by using the slider.
as determined by the Highlight Range.
determined by the Highlight Range.
58 0112-0109 H

FLIPR® Tetra High Throughput Cellular Screening System User Guide
Item Description
Save When clicked, saves the signal test as an ASCII text file
Print When clicked, prints the signal test.
Image Viewer Displays the CCD image showing where RLU values were
(*.sig).
derived for the signal test.
Show > Hide Mask—Shows or hides the mask used in
the test, indicating the pixel area used to derive the RLU
value for each well.
View Image—Refreshes signal test image.
SynchroMax™ Automation
The SynchroMax Automation command is only enabled if you have a
SynchroMax ET installed.
When you open the SynchroMax dialog from Instrument >
SynchroMax Automation, ScreenWorks Software automatically goes
into Remote Mode, giving control of the instrument to the
SynchroMax ET software. ScreenWorks Software returns to Manual
Mode when the SynchroMax dialog closes.
To run a series of experiments with the SynchroMax ET, first open the
protocol file that you want to use in ScreenWorks Software. Only one
protocol is used in a run, as many times as the SynchroMax ET supplies
plates for it.
Having prepared the protocol, open the SynchroMax dialog and select
a Stack Layout Template. These files specify, for each plate location
in the five-position stage, how many plates will be loaded to that
position, from which stack, and where they will be delivered to after
use. A number of Stack Layout Templates are supplied—select the
one that suits your assay.
When a Stack Layout Template is opened in the dialog the graphic in
the dialog displays which stacks plates should be loaded in. You can use
this as a guide for loading the plates. All plates in a single stack should
be of the same type.
If there are any stage positions that will use the same plate throughout
the duration of the run, these should be loaded manually before the run
begins. Stage positions that will have plates brought to them during the
run should be empty at the start of the run.
0112-0109 H 59

ScreenWorks Software Overview
Prior to selecting Run, please make sure all output racks are empty
prior to beginning the experiment. When plates are in position and the
FLIPR® Tetra System ready, click Run in the SynchroMax dialog. After
checking that the plate configuration is compatible with the protocol
Settings configuration, the instrument runs until all plates have been
used. During this time the Run button changes to Stop, so you can
stop the run before it completes if necessary.
Note: Stop should only be used in emergencies to halt an
experiment. If used, an instrument reset may be required.
When the SynchroMax ET is active, the system will clear all plates at
the end of an experiment. The SynchroMax remembers only those
plates it loaded during the experiment and checks if any of those plates
remain when the experiment completes. If so, they are removed. A
reagent reservoir can be used in a source position within FLIPR® Tetra
System as long as it is manually loaded and the SynchroMax template
does not include the loading or removal of plates to that position.
On completion, the Done button is enabled. Unless you want to run
another set of experiments, press this to close the dialog and return
ScreenWorks Software to Manual Mode.
60 0112-0109 H

FLIPR® Tetra High Throughput Cellular Screening System User Guide
Tools Menu
Item Description
Set Default
Directories
Opens the Set Default Directories dialog to
designate directories in which to store protocol and
data files, signal tests, group templates and to which
export files are written.
The Open > Protocol, Data and Image File
commands in the File menu open to the folders set
here, as do the File > Export dialogs. In addition,
Group Templates *.fmg can be exported and
imported from the default folder defined in the
directory.
The default protocol directory is:
C:\Documents and
Settings\[your_user_name]\My
Documents\Molecular
Devices\ScreenWorks\MyProtocols
[MyData, MySignalTests, or
MyGroupTemplates]
The default data and export directories are:
C:\Documents and
Settings\[your_user_name]\My
Documents\Molecular
Devices\ScreenWorks\MyData \
The default signal test directory is:
C:\Documents and
Settings\[your_user_name]\My
Documents\Molecular
Devices\ScreenWorks\MySignalTests
The default group template directory is:
C:\Documents and
Settings\[your_user_name]\My
Documents\Molecular
Devices\ScreenWorks\MyGroupTemplates
Note: It is recommended that you save all
protocol and data files on the local hard drive to
ensure instrument function or data is not lost if
your server fails during an experiment.
Plate Library Opens the Plate Process Definition dialog, which
0112-0109 H 61
lists current plate definitions and allows you to add
additional plate definitions to the system. See Plate
Process Definition on page 62 for details.

ScreenWorks Software Overview
Item Description
Open Error Log Opens an error log generated by the FLIPR® Tetra
Save Error Log
Assay Log For data files only, opens a dialog reporting when the
System. This feature is for technical support and
requires a password.
Save error logs. Logs are saved as *.fel (FLIPR
System
forwarded to Molecular Devices Technical Support.
protocol steps were applied.
Error Log) encrypted files. The files can be
®
Note: This log can be accessed by selecting
Ctrl+Shift+A.
Plate Process Definition
All plates currently in the system are listed in the Plate Process
Definition dialog, opened from Tools > Plate Library. They are
categorized first into read and source plates and then by well-number
format.
A description of commands in the Plate Process Definition and Define
Camera Parameters, both accessed via Tools > Plate Library is
provided below. For instructions on adding a new read or source plate,
see Appendix B: Data Processing Algorithms on page 273. The Plate
Library is camera-specific, so if any plates are added with one camera
type, they will not be available once the camera type is changed.
The Plate Process Definition dialog box is accessible only to
administrators, and is password protected. The default user name is
fliprtetra and password is flipr.
Fifteen default plates are included with the system software:
• Default 96
• Default 96 small volume
• Default 96 no slit mask
• Default 96 boat
• Default 384
• Default 384 small volume 5X3 mask
• Default 384 small volume 3X3 mask
• Default 384 boat
• Default 384 blot
• Default 1536
• Default 1536 boat
• Default 1536 blot
• Default Cell Reservoir 96
62 0112-0109 H

FLIPR® Tetra High Throughput Cellular Screening System User Guide
• Default Cell Reservoir 384
• Default Cell Reservoir 1536
Item Description
Close Closes the Plate Process Definition dialog.
Open Plate Opens the Define Basic Plate Parameters dialog for the
Copy Plate Opens the Define Basic Plate Parameters dialog
plate selected in the tree view.
allowing you to add a new plate (see Define Basic Plate
Parameters Dialog Box, below).
Note: When copying a plate, make sure that you
select a plate with a similar well format, as the
number of wells and plate mask will be transferred
to the new plate.
Delete Plate Deletes the plate displayed in the Plate Process
Collapse All Collapses the Plate Process Definition tree.
Expand All Displays all items in the Plate Process Definition tree.
Definition field.
Define Basic Plate Parameters Dialog Box
This dialog opens when you select Open Plate or Copy Plate in the
Plate Process Definition dialog. Use the dialog to inform the FLIPR®
Tetra System of the critical dimensions of the plates you are using.
Note: Dimensions of default plates cannot be modified. However, the
plate mask can be realigned.
0112-0109 H 63

ScreenWorks Software Overview
Item Description
Plate Name Enter the name you want assigned to the new plate
Plate Type Select Source Plate or Read Plate for the new plate.
Plate
Specifications
(maximum number of characters is 50).
Source Plate—Creates a plate that does not include a
plate mask. These plates are typically used for compound
storage.
Read Plate—Use for all plates that are read in the read
position and require a plate mask.
Area for entry of physical plate dimensions. Refer to the
diagram in the upper-right corner of the dialog.
For best results, obtain the plate dimensions from the
plate manufacturer.
Note: Molecular Devices is not responsible for
instrument malfunctions if plate specifications are
not correct.
Rows—Enter the number of rows on the plate.
Columns—Enter the number of columns on the plate.
Well Shape—Select the appropriate shape from the
drop-down list.
Well Volume (
microliters.
X (mm)—Enter the distance (in mm) from the left side of
the plate to the center of well A1.
Y (mm)—Enter the distance (in mm) from the top of the
plate to the center of well A1.
Bottom (mm)—Enter the distance (in mm) from the
bottom of the plate skirt to the inside of the well.
Top (mm)—Enter the distance (in mm) from the bottom
of the plate skirt to the top of the well.
Well Offset (mm)—Enter the distance (in mm) from the
center of one well to the center of adjacent well.
μL)—Enter the maximum well volume in
Define Camera Parameters Dialog Box
When Read Plate is identified as the Plate Type in the Define Basic
Plate Parameters dialog, the Finish button is enabled. Prior to
selecting Finish, a read plate with 10
in the read position. Once selected, the instrument will read the plate
and define a plate mask to the plate definition created. If a plate is
present, but no mask can be defined, the plate definition will be saved
as a source plate.
64 0112-0109 H
-8
M fluorescein should be placed

FLIPR® Tetra High Throughput Cellular Screening System User Guide
Window Menu
The commands in the Window menu allow you to change the way the
Experiment window is viewed. The keyboard shortcut is Alt+W.
Item Description
Cascade Aligns the open windows so that they are
overlapped and staggered with the title bars
visible.
Tile Divides the screen into as many segments as
there are windows and aligns them so that
they are displayed side-by-side. Each file
occupies a segment and is visible. However,
each of the file images will be scaled
according to the number of files being
displayed.
1–10 Data Files Lists the open files (up to 10).
Keyboard
Shortcut
Alt+W,C
Alt+W,T
Help Menu
The Help menu provides access to the User Guide and information
about the software. The keyboard shortcut is Alt+H.
Item Description
FLIPR® Tetra
System User
Guide (PDF)
ScreenWorks
Release Notes
About
ScreenWorks
MDC on the
Web
Show Update
Reminder
Opens a PDF version of this manual that is appropriate for
the version of software installed.
Opens a PDF version of the ScreenWorks Software Release
Notes.
Opens the About ScreenWorks dialog. This reports the
version numbers for
EC, Firmware Motion and Remote Interface.
Displays links to a number of Molecular Devices support
pages on the Web, such as the
Update page, the Technical Support page, and Technical
Support Request page. Selecting one of these commands
opens your default web browser to the selected page.
When this option is selected an Update Reminder is
displayed when
reminding the user to check for an update to the software.
ScreenWorks Software, the Firmware
ScreenWorks Software
ScreenWorks Software is launched,
0112-0109 H 65

ScreenWorks Software Overview
Instrument Status
The Instrument Status panel, by default located on the bottom of the
main screen, reports the status of and settings for the FLIPR
®
Tetra
System hardware in addition to including the processes used to create
protocols. The panel has three tabs: Instrument Status, Instrument
Configuration and Process Explorer.
The panel can be moved to different locations within the main
ScreenWorks Software window, and can be hidden entirely, using the
View menu command.
Instrument Status Tab
The current status of the system’s hardware components is reported in
the Instrument Status tab. Fields below this report information about
the step the instrument is at within an experimental run. The
color-coded communication field at the bottom-right of the tab reports
status with respect to communication between ScreenWorks Software
and the instrument.
Status messages and faults are reported at the bottom of the tab as
well. Click the button here to see a list of the last thousand messages.
Item Description
Stage Temp (°C) Displays the source plate position temperature of the
Camera Temp (°C) Displays the camera temperature. Operating
five-position stage as well as the temperature it is set
for, Set Point. Stage Status: Whether the heated stage
is turned on or not.
temperature for the camera is -60 2 °C for the
Standard EMCCD camera and
-20 5 °C for the Aequorin ICCD camera.
Camera Status: Indicates whether the camera is turned
on or off.
Intensifier: Indicates the status of the intensifier.
Pipettor Tips Reports when tips are loaded on the pipettor head.
Upper Door (Inner) Reports whether the inner-upper door (observation
panel) is open or closed.
Note: The system will run as long as the inner
door is closed, however data may not be valid if
outer door is open.
Upper Door (Outer) Reports whether the outer-upper door is open or closed.
Lower Door Reports whether the lower door is open or closed.
Tip Washer Indicates the status of the tip washer.
66 0112-0109 H

FLIPR® Tetra High Throughput Cellular Screening System User Guide
Item Description
Chiller Status Indicates whether the status of the chiller.
Read Plate Reports when a plate is present in Position 3 (Read Plate
Source Plate 1 Reports when a plate is present in Position 1 (Source
Source Plate 2 Reports when a plate is present in Position 2 (Source
Source Plate 3 Reports when a plate is present in Position 4 (Source
Cell Reservoir Indicates when the Cell Reservoir is installed.
Chiller Temp (°C) Reports the current temperature in the chiller.
Fill Bottle A Reports when fill bottle A is empty of wash solution.
Fill Bottle B Reports when bottle B is empty of wash solution.
Waste Bottle A Reports when waste bottle A is full.
Waste Bottle B Reports when waste bottle B is full.
Mode Reports whether ScreenWorks Software in Manual or
Cell Flask Rate Reports the set stir rate of the cell flask. If the Cell
Chiller Setpoint (°C) Reports the set point from the chiller.
Fluid 1 Reports the last known state of the Fluid 1 bottle. At boot
Fluid 2 Reports the last known state of the Fluid 2 bottle. At boot
Fluid 3 Reports the last known state of the Fluid 3 bottle. At boot
Fluid 4 Reports the last known state of the Fluid 4 bottle. At boot
Cell Flask Reports the last known state of the stir Cell Flask. At
position).
Plate 1 or Tip Loading position).
Plate 2).
Plate 3 or Cell Reservoir).
Remote mode.
Suspension option is installed and the stir rate is 0, an
exclamation sign is displayed.
up the state will be Unknown until that Fluid is used.
up the state will be Unknown until that Fluid is used.
up the state will be Unknown until that Fluid is used.
up the state will be Unknown until that Fluid is used.
boot up the state will be Unknown until the Cell Flask is
used.
0112-0109 H 67

ScreenWorks Software Overview
Item Description
Status Message and
History
Current instrument status, or fault conditions, are
reported at the bottom of the tab.
To see the full text of the message in a timed list of the
last thousand status messages, press the button beside
the colored Communication field.
Note: The Status History dialog can be copied
to the clipboard to paste into another application if
desired.
Instrument Configuration Tab
The Instrument Configuration tab indicates the current instrument
configuration of the LED banks, emission filters, pipettor head and
TETRAcycler. If the system is Offline, you can configure these settings
to your preference in order to define protocols.
Note: If a protocol created offline does not match instrument
configuration when opened online, the protocol will not run until the
configuration of the protocol and instrument match
.
Item Description
Excitation
Wavelengths
Displays the excitation wavelengths installed on the system.
Upper LEDs—Displays the wavelength range of the top set
of LED banks in the LED modules.
Lower LEDs—Displays the wavelength range of the lower
set of LED banks in the LED modules.
Emission
Wavelengths
Pipettor Displays the type of pipettor head (96, 384, 1536, 384 pin
Displays the emission filter wavelengths installed on the
system. Up to three filters can be installed at the same time.
tool, or 1536 pin tool) installed on the system.
Note: The pipettor head format must agree with the
tip wash reservoir format. A warning is issued if these
are different.
Tip Washer Displays the type of tip washer (96, 384 or 1536) installed
Camera Type Select from EMCCD or ICCD camera.
68 0112-0109 H
on the system.

FLIPR® Tetra High Throughput Cellular Screening System User Guide
Item Description
Chiller Reports when a chiller is installed.
TETRAcycler Reports when the TETRAcycler is installed.
Bar code Reader Reports when a bar code reader is installed. on the
Cell Reservoir Use the check box to indicate whether or not the Cell
TETRAcycler.
Reservoir is installed.
Process Explorer Tab
The Process Explorer is used to create new protocols.
The Process Explorer displays processes that can be incorporated into
experiment protocols. To add a process step to a protocol, drag the
process into the protocol setup at the top of the Experiment window.
See Constructing Protocols Using FLIPR Tetra Processes on page 70.
Note: The processes available on the screen may change based on
the instrument status, for example, the Wash Tips process is not
shown if a tip wash malfunction has occurred.
Experiment Window
The Experiment window is the main working interface in ScreenWorks
Software. It is used to create, view and edit protocols—used to control
the instrument in an experiment—and to view data files generated in
experiments.
This section gives an overview of the Experiment window; following
sections provide details of the configuration options for each of the
process types used to construct protocols in the Experiment window.
The Experiment window can have one protocol and multiple data files
open at once, with options to view these one at a time, cascaded, or
tiled (Window menu). File windows can be maximized, to occupy the
entire Experiment window, minimized, reducing to a small section of
title bar in the bottom left of the Experiment window, or arbitrarily sized
and located within the Experiment window.
Only one file is active at once. If the active file is a protocol file, it will
control the experiment if the Instrument > Run Experiment
command is given.
Protocol (*.fmp) and data (*.fmd) files both show the processes
incorporated in them at the top of the file window, ordered from left to
right. Clicking on the process icons brings forward the ‘page’ for that
particular process, displaying its configuration settings. Data files differ
from protocol files only in having recorded data to display when the
0112-0109 H 69

ScreenWorks Software Overview
Analysis process is selected, otherwise retaining all the protocol setup
information contained in the protocol file that was used to generate the
data.
Besides showing the settings for the particular processes incorporated
into a file, a one-page protocol summary can be viewed in the
Experiment window with View > Experiment Summary. Revert to
the experiment setup view with View > Experiment Setup.
ScreenWorks Software always opens with a default protocol file,
Untitled 1, containing four processes. This can be used to start
construction of a new protocol, or closed or ignored if you wish to work
with existing protocol or data files.
Constructing Protocols Using FLIPR Tetra Processes
Protocols are comprised of combinations of the following processes:
• Settings
• Analysis
• Transfer Fluid
• Mix Fluid
• Wash Reservoir
• Wash Tips or Pins
• Blot Pins (Pin Tool only)
• Pause Pipettor
• Finish with Source
• Read
The Settings and Analysis processes are required for every protocol.
They are automatically included as the first two processes in every new
protocol file you create, and cannot be removed.
Transfer Fluid, Mix Fluid, Wash Tips or Pins, Blot Pins, Pause
Pipettor, Finish with Source and Read are all available to drag into a
protocol from the Process Explorer based on the pipettor head type
installed. Wash Reservoir is only available when the Cell Suspension
option is installed.
There are two processes additional to the basic set:
• Mix with TF
• Read with TF
These perform the same functions as Mix Fluid and Read, but are
created as options within a Transfer Fluid step, and are more closely
integrated with the step, for example, a Read with TF is timed
precisely to coincide with compound addition to the read plate.
New protocols always include a Transfer Fluid step with an associated
Read with TF, but these can be removed or reordered, and of course
additional steps can be dragged across from the Process Explorer.
70 0112-0109 H

FLIPR® Tetra High Throughput Cellular Screening System User Guide
Processes can be added to the end of a protocol, or, using the right
edge of a new process you drag over, inserted between other processes
already in the protocol, providing you do not attempt to insert between
processes that are internally linked, for example, a Transfer Fluid and
associated Mix with TF.
As each new process is dragged to the Experiment window, a new page
with configuration options for the process is added to the file. The new
page is automatically displayed.
Similarly, as you click on the processes above, the sheet associated
with that process, containing its configuration settings, comes forward.
Deleting Processes from the Protocol
To delete processes that are not connected click on the process icon in
the Experiment window and click the Delete key.
To delete a connected process—Mix with TF or Read with TF—go to
the Transfer Fluid process that it is associated with and uncheck the
option for the process.
Process Icon Colors
The Settings and Analysis processes’ icons are green to indicate that
they are required to run an experiment. These processes’ are always
present and cannot be deleted.
The Transfer Fluid, Mix Fluid, Wash Tips or Pins, Wash Reservoir,
Blot Pins, Pause Pipettor and Finish with Source processes icons
are blue to indicate that they are liquid handling steps. These steps are
always in series with each other; no two of them will ever occur
simultaneously.
The Read process icon is orange to indicate that it will occur in parallel
with any liquid handling process, if possible. However, a read can be
added through the Transfer Fluid process to indicate the liquid
handling will occur at a defined time in the experiment. These linked
processes will not begin until all read and liquid handling steps prior to
the Transfer Fluid linked with Read with TF are complete.
When Mix with TF or Read with TF processes are created (from the
options in a Transfer Fluid step), the icons of all the connected
processes change to purple, to show the linkage.
Settings Process
Settings is the first process in all protocols. Use it to define read modes,
plate positions, and data directories. You can also configure automatic
printing of selected results, automatic file naming, and set plate
temperature.
Select the green Settings icon in the Experiment window to view the
Settings page where the settings are made.
0112-0109 H 71

ScreenWorks Software Overview
Setup Read Mode
The Setup Read Mode table at the top of the Settings page displays
settings for up to four read modes that the FLIPR
perform in a single experiment.
Each read mode defines:
• Reading mode (fluorescence or luminescence)
• Excitation and emission wavelengths (i.e., a pair of LED banks
and emission filter)
• Camera gain
• Camera exposure time
• Excitation intensity
• Gate open (ICCD camera only)
Molecular Devices FLIPR
use a single read mode, but ratiometric assays, such as the Voltage
Sensor Probes, require two read modes. In these cases the instrument
alternates between the two read modes for each time point, outputting
two distinct sets of readings, one for each mode. ScreenWorks
Software can then automatically calculate the ratio of the readings from
each mode, for each time point.
If you open a protocol file that uses read modes not available under the
present configuration of your instrument, the unavailable read mode
rows are displayed in red.
®
Tetra System can
®
Calcium and Membrane Potential Assay Kits
72 0112-0109 H

FLIPR® Tetra High Throughput Cellular Screening System User Guide
Edit Read Mode
To enable a read mode, click the check box in the far left of the Set
Read Mode table. Then double-click in the row or select the row and
press the Edit Mode button below the table to configure it. The Edit
Read Mode dialog has the following fields:
Item Description
Read Mode
Name
Reading Mode Select Fluorescence or Luminescence.
Excitation/
Emission
Wavelength
Enter a name for the selected read mode, if desired.
Select the desired excitation LED and emission filter
wavelength pair from the drop-down list.
Note: Only calibrated wavelength pairs are available
when the software is in Online mode; see Recalibrating
the Optics on page 150.
NONE instructs the instrument to not turn on any LEDs or
use an empty emission filter position. These are typically used
when performing luminescence experiments.
Excitation
Intensity
Exposure
Time
Camera Gain Select a value from the list to regulate the amplification of the
Camera Gate This option is only available with the Aequorin ICCD camera in
Select a value from the list to regulate the intensity of light
emitted by the LED bank for a given Fluorescence read. The
range is 20–100%.
Enter a time (in seconds) to regulate the time that light is
collected and measured by the camera. A longer exposure
increases signal intensity.
Exposure time affects the read interval for data collection. For
instance, an exposure time of 0.4 s, added to a required 0.1 s
camera integration time, makes the highest update frequency
0.5 s.
The range is 0.05 s to 30 s.
camera power. Increasing the camera gain increases the
signal. The range for the Standard EMCCD camera is 1–240.
With the Aequorin ICCD camera installed, the Fluorescence
read mode is preset to 2000, whereas in Luminescence mode
the range is 2000–280,000.
Fluorescence mode. It further regulates the signal intensity by
selecting the percentage of each frame captured.
0112-0109 H 73

ScreenWorks Software Overview
Note: Differences in Camera Gain or Exposure Time between read
modes drastically increase the minimum update time. For fastest
update time, use the same gain and exposure time for all read modes.
Assign Plate to Position
The five-position stage has four positions for plates: one for the read
plate and three for compound source plates. In order for the
TETRAcycler and pipettor to address each position, a plate type must
be assigned to each of the positions that will be used in your
experiment. Current plate assignments are reported in the Assign
Plate to Position table.
For each plate position, the table reports:
• Plate Name—the type of plate, as configured in Tools > Plate
Library.
• Bar Code Expect—Whether or not you want the system to read
a bar code from the plate. Bar code numbers can optionally be
incorporated into output data file names.
• Bar Code List—in data files only, the bar codes of plates used in
the experiment, in the given plate position.
Change these settings if required with the Edit Plate dialog (see below).
If Position 1 is to be used only for tips, and not to hold a source plate,
check the Load Tips Position check box below the table. This removes
Source Plate 1 from the table.
If the Cell Reservoir is installed in the system, Source 3 is automatically
dedicated to defaultcellres384.
74 0112-0109 H

FLIPR® Tetra High Throughput Cellular Screening System User Guide
Edit Plate
To change the plate configuration for a particular position, double-click
on the relevant row or select it and press the Edit Plate button, to
open the Edit Plate dialog.
Item Description
Position Displays the plate position you are editing.
Plate Name Select the plate type from the drop-down list.
The list contains default plates and any additional plates
that have been added using Tools > Plate Library.
Note: Only plates with the same number of wells
or one order of complexity higher than the pipettor
head format are displayed.
Bar Code Expected Check this option if using a bar code for the plate. The bar
Cell Flask Spinning
Rate
code number can be incorporated into the file names of
data files generated by the protocol (see below).
In Manual Mode, you are prompted to enter the bar
codes prior to starting an experiment.
In Remote Mode the bar code number is automatically
scanned on the TETRAcycler landing pad or is passed to
ScreenWorks by the third-party plate handler.
When the Cell Reservoir from the Cell Suspension
option is installed, spinning rate can be set here or User
Manual can be selected and the manual settings will be
applied.
CAUTION! Each plate position has a mechanical sensor to detect the
presence of a plate, tip rack or boat in each position. However, the
instrument does not distinguish the type of apparatus placed in a
position.
0112-0109 H 75

ScreenWorks Software Overview
Data File Name
The Data File Name group box is used to configure a file-naming
protocol for data files created in experiments. The file-naming protocol
applies to *.fmd (data) and *.png (image) files.
Item Description
Include Date Check to include the date in the file name. It is checked by
default.
Note: To ensure that data files are not overwritten,
we recommend that this option remains checked.
Include Bar Code When selected, the bar codes of the first five plates used in
the experiment are included in the file names. If there are
fewer than five bar codes, then only those available are
used.
Note: Bar Code Expected must be selected for
the desired plate position in order for the bar code to
be incorporated.
User Defined
Name
Enter a string of characters (up to 25) to be added to the
file name.
The base structure for file names is as follows:
Date_UserDefinedName_Barcode1_Barcode2_Barcode3_Barco
de4_ Barcode5_NNN.fmd
where NNN is an integer from 1 to 999. The integer value NNN starts at
001 and increments for each data file generated with the same base
data file name.
The date uses format: MMDDYYYY, where M = month, D = day, and
Y = year.
If a software crash or other error occurs during a run that interferes
with normal instrument operation, then a data file is automatically
stored as:
InterruptedExperiment_Date_Time_NNN.fmd
Folders
Use the two fields here to designate directories into which data and
export files will be saved.
By default, data, image and export files are stored under:
C:\Documents and Settings\[your user name]\My
Documents\Molecular Devices\ScreenWorks\MyData\
Change—An option that allows the user to pick a different directory.
76 0112-0109 H

FLIPR® Tetra High Throughput Cellular Screening System User Guide
Open Folder—An option which opens the Windows Explorer dialog box
directly to the directory designated.
Temperature Control
The Temperature Control field allows you to set the plate-stage
heaters to a desired temperature for an experiment. Temperature
range is from ambient 25 °C to 40 °C. Select Manual Settings to
control the heaters manually from ScreenWorks Software at the time
the experiment is run.
If, at the start of an experiment, the stage temperature is different
from the selected value a dialog informs you of this. You can wait until
the stage reaches the desired temperature or run the experiment
anyway.
Note: When the temperature is manually turned on through the
Instrument menu, a setting of “0” in the protocol does not affect the
temperature setting. If the user prefers to run off the temperature,
this must be manually done through Instrument > Manual
Operations > Temperature Control Off.
0112-0109 H 77

ScreenWorks Software Overview
Auto Print Options
In the Auto Print Options section, select information to be
automatically printed at the end of each experiment run with the
protocol.
Note: These are print options only—to save files of data generated in
experiments use the Auto-Export option (see Exporting Data on
page 99).
Print options are:
• Notes—Comments you have added to the protocol using the
Notes option opened from the Analysis process page.
• Experiment Summary—The experiment summary
automatically created for each protocol, viewed in ScreenWorks
Software with the View > Experiment Summary command.
Note: Read Mode and Kinetic Reduction need to be defined
for display in the following graphs.
• Multi-Well Graph—The graph showing the selected Read
Mode time-course traces for all wells independently, as
displayed in the Analysis process page. The option to include
kinetic reduction values in each well of the graph is available.
• Detail Graph—A single graph with a single average trace for
each group and read mode combination configured in the
protocol. The option to include error bars on the graph is
available.
Note: Group statistic and the option to include effective or
inhibition concentration need to be defined for the following
options.
• Group Statistic Graph—A single graph with statistics acquired
from the group statistics table for each group plotted and fit to a
four-parameter curve.
• Group Statistic Table—A table utilizing the kinetic reduction
data to define statistics (for example, mean and standard
deviation) for each group defined on the plate.
78 0112-0109 H

Analysis Process
The Analysis process is included in all protocols, and is always the
second process after Settings.
In the sections below:
• Data viewing options on the Analysis process page are covered
• Grouping and Correction are explained in Analyzing Data on
• Auto-Export is covered in Exporting Data on page 99.
Viewing Data
Acquired data can be viewed in ScreenWorks Software on the main
Analysis process page, in the Multi-Well Graph, or in larger Detail
Graph. The options are described in this section.
Multi-Well Graph
The major part of the Analysis process page consists of a grid
representing the wells of the read plate used in the protocol or data file
(for example, with 96, 384, or 1536 wells). This is called the
Multi-Well Graph. For protocol files this graph is empty, as no data
have been acquired, but in data files each cell of the graph has a trace
of one of the measurements taken from the corresponding read plate
well. The maximum and minimum RLU values of the displayed data are
reported above the Multi-Well Graph.
The Multi-Well Graph displays, for each well represented, one trace of
relative light units (RLUs) versus time. If two or more read modes were
recorded, select the mode to view from the display list box above the
graph. To see the ratio of two read modes, enable Ratiometric
Options in the Configure Corrections > Corrections dialog, and
select Ratio in the display list.
The Read Mode defined in the Multi-Well Graph is also applied to any
traces displayed in the Detail Graph.
The traces displayed in the Multi-Well Graph can be adjusted by the
application of different data-correction options available in the
Correction dialog, for example, the traces can be scaled relative to the
average positive control response (see Correction on page 92).
If groups have been defined for the assay, wells in the Multi-Well Graph
are color-coded to represent these (see Grouping on page 88). In
addition, there is the option to include the kinetic reduction value below
each well trace in the Multi-Well Graph.
Buttons, just above the Multi-Well Graph, open dialogs that offer
various data analysis options; some relevant to protocol set up, some
to already-acquired data in data files, and some to both. Multi-Well
Graph buttons and descriptions include:
FLIPR® Tetra High Throughput Cellular Screening System User Guide
in Viewing Data on page 79.
page 87.
0112-0109 H 79

ScreenWorks Software Overview
Button Name Description
Configure
Groups
Select
Groups
Opens the Grouping dialog to classify wells in the
plate into groups (for example, positive and negative
controls). Groups created in protocol files are
transferred to all the data files generated by the
protocol. In data files, new groups can be created or
existing groups edited. See Grouping on page 88.
Opens the Select Groups dialog to classify which
groups are quickly displayed in the Detail Graph
from a predefined list based on the groups defined in
the Grouping dialog.
Note: Hold down the Shift or Ctrl key to
select multiple groups.
Group
Selection
Mode
Well
Selection
Mode
Notes In protocol files, use this dialog to write comments
Images For data files only, where images have been saved
Copy Copies data in the Multi-Well graph to the clipboard so
Button toggles between Group Selection Mode and
Well Selection Mode.
During Group Selection Mode, wells selected within
a predefined group displayed in the Multi-Well Graph
will cause all wells within those groups to be
displayed in the Detail Graph.
Button toggles between Group Selection Mode and
Well Selection Mode.
Well Selection Mode only displays wells selected in
the Multi-Well Graph on the Detail Graph with their
respective group colors assigned.
that will be stored with all data files generated by the
protocol. In the data files, view the comments (now
read-only) in the same dialog.
during an experiment (by checking Save Images in
a Read with TF step) these can be viewed by
clicking the Images button.
it can be pasted in a different program such as
Microsoft Word.
80 0112-0109 H

FLIPR® Tetra High Throughput Cellular Screening System User Guide
Button Name Description
Configure
Auto-Export
Configure
Correction
Hide Kinetic
Reduction
Value
Show Kinetic
Reduction
Value
Configure
Kinetic
Reduction
Only available for protocol files, this button opens the
Auto-Export dialog allowing configuration of
statistics and time sequence files to be automatically
created whenever the protocol is run.
For data files the button changes to Export, and
opens the File Export dialog, also opened from the
File > Export command. See Exporting Data on
page 99.
Opens the Corrections dialog box to apply various
corrections to modify data display. There is also the
option to view ratiometric data. Settings made here
in protocol files will affect how data are viewed when
the protocol is run, but since all raw data are stored
in data files, these options all remain available for
acquired data as well. See Correction on page 92.
Hides the kinetic reduction values that are displayed
in the Multi-Well Graph.
Shows the kinetic reduction value in each well of the
Multi-Well Graph.
Opens the Kinetic Reduction Configuration dialog
to define the parameters used to define the kinetic
reduction.
Reduction Type—Defines the reduction to be
applied to the kinetic data traces displayed in the
Multi-Well Graph. See Kinetic Reduction Types.
Start Read—Define the first read to be used to
determine the kinetic reduction.
End Read—Define the last read used to determine
the kinetic reduction.
Read Mode—Select the read mode to apply the
kinetic reduction to.
Kinetic Reduction Types
The Reduction Type field is located in the Kinetic Reduction
Configuration dialog. Available options depend on the software
version in use. A separate software license for ScreenWorks® Peak
ProTM adds advanced peak detection and characterization
measurements to the field of standard measurement options (see
Figure 5-2). Contact your Molecular Devices Sales Representative for
details.
0112-0109 H 81

ScreenWorks Software Overview
Figure 5-2 Additional ScreenWorks Peak Pro Kinetic Reduction Types
Standard measurement options and definitions include:
• Average: Numerical average of RLU counts of the selected
reads.
• Maximum: Highest detected count (a single number) of all the
selected reads.
• Maximum-Minimum: Result of subtracting the minimum count
(a single number) from the maximum count (a single number).
• Minimum: Lowest detected count (a single number) of all the
selected reads.
• Sum: Numerical sum of RLU counts of the selected reads.
• Area Under Curve: Numerical calculation of the area under the
curve for the selected reads.
• Slope of Curve: Result of calculating the slope between two
selected reads.
82 0112-0109 H

FLIPR® Tetra High Throughput Cellular Screening System User Guide
(With optional license) Peak Pro measurement options and definitions
include:
• Peak Frequency (BPM): The Beats-Per-Minute frequency of
the peaks detected based on the inverse of the peak temporal
spacing. At least two peaks are required for this measurement.
• Peak Count: Number of peaks or action potentials detected
within the read data that meet the specifications in the
Configure Peak Detection dialog settings.
• Average Peak Width: Average peak width measurement in
seconds from the 50% peak amplitude from baseline.
• Peak Width Standard Deviation: Standard deviation of
average peak widths.
• Average Peak Amplitude: The average peak amplitude
relative to the Average Peak Baseline measurement.
• Peak Amplitude Standard Deviation: Standard deviation of
peak amplitudes.
• Average Peak Baseline: Average baseline amplitude
measurement from the base of each peak detected.
• Average Peak Spacing: Average peak spacing in seconds. At
least two peaks are required for this measurement.
• Peak Spacing Standard Deviation: Standard deviation of
peak spacing.
• Average Peak Rise Time: Average time measured on the
rising edge for each peak. Equal to the time between the 10%
and 90% peak amplitudes.
• Rise Time Standard Deviation: Standard deviation of rise
times.
• Average Peak Decay Time: Average time measured on the
falling edge for each peak. Equal to the time between the 90%
and 10% peak amplitudes.
• Peak Decay Time Standard Deviation: Standard deviation of
decay times.
• Average Peak Width at 10% Amplitude: Average peak
width in seconds at the 10% peak amplitude from baseline.
• Irregular Spacing: Identifies wells that have irregular spacing
between peaks. Wells with regular peak temporal spacings are
marked as OK. Wells with missing peaks are marked as MISS.
Wells with extra peaks are marked as EXTRA. Wells with peak
spacing characteristics of both missing and extra are marked as
IRREG.
The Configure Peak Detection button activates when a Peak Pro
measurement is selected from the Reduction Type field
(see Figure 5-3). The Configure Peak Detection dialog allows the
Peak Pro measurement settings to be adjusted and optimized
(see Figure 5-4).
0112-0109 H 83

ScreenWorks Software Overview
Figure 5-3 Configure Peak Detection button activation
Configure Peak Detection dialog options include:
• Smooth Width
• Fit Width
• Slope Threshold
• Amplitude Threshold Dynamic
• Amplitude Threshold Fixed
Figure 5-4 Configure Peak Detection dialog
84 0112-0109 H

FLIPR® Tetra High Throughput Cellular Screening System User Guide
Detail Graph
All the read modes for wells selected in the multi-well graph can be
displayed enlarged in a detail graph. You can select individual or
multiple wells to view, or select by group.
Note: When the FLIPR® Tetra System is configured for two or more
read modes, it cycles through each mode alternating between them for
each reading. Although readings from each mode within a cycle occur
at different times, they are represented as occurring simultaneously.
The data displayed in the Detail Graph have the same corrections
applied as the data displayed in the Multi-Well Graph. The Detail
Graph reports these settings at the top of the graph window:
• Subtract Bias
• Spatial Uniformity Correction
• Negative Control Correction
• Positive Control Scaling
• Response Over Baseline
• Crosstalk Correction
These correspond directly to options in the Correction dialog, opened
from the Analysis process page. To change these settings, change
them in the Correction dialog. This will change all data in the
Multi-Well Graph and Detail Graph to reflect the new correction
applied. Detail Graph allows a number of data-selection options:
Button Name Description
Copy
Graph
Copy
Graph
Data
Zoom
Mode
Auto Scale Manual prompt to automatically scale the Detail Graph
0112-0109 H 85
Copies Graph in the Detail Graph to the clipboard so it
can be pasted in a different program such as Microsoft
Word.
Copies graph data in the Detail Graph to the clipboard
so it can be pasted in a different program such as
Microsoft Excel.
Click to enable zoom capability in the graph.
Once the Zoom button is pressed, drag over a region in
the graph to view just that area enlarged to the full size
of the graph.
Alternatively, drag the cursor along a part of the x or y
axis to zoom in on just that axis.
and Multi-Well Graphs to include all data points of the
desired traces.

ScreenWorks Software Overview
Button Name Description
Auto Scale
Always
Undo
Zoom
Manual
Scale
Graph
Show/Hide
Data
Show
Point
Labels
Show/Hide
Legends
Average/
Overlay
Trace
Automatically scales the Detail Graph and Multi-Well
Graph to include all data points of the desired traces
without manual prompting.
Rescales a graph to the original settings.
Opens the Manual Scale Graph dialog to set the
maximum and minimum values for the X- and Y-axis of
the Detail Graph and Multi-Well Graph.
Toggle button that shows or hides the RLU values for
the selected traces at each read.
Show Point Labels writes the value of each data point
(for example, RLU value) beside the point on the graph.
A toggle button that displays or hides the Detail Graph
legend.
A toggle button that displays the average or overlay
traces for selected groups.
Average Group—Displays average time point values
for all wells in the selected group. A separate trace is
generated for each read mode.
Note: When Well Selection Mode selected in
the Multi-Well Graph, all traces displayed in the
Detail Graph will be averaged regardless of the
group they are assigned.
Overlay Group—Displays traces for all the wells in
selected groups.
Note: Traces are color-coded by group.
Show/Hide
Standard
Deviation
A toggle button that enables or hides the standard
deviation for the average group trace.
Note: Average Group must be enabled to
access this function.
When Well Selection Mode is selected in the
Multi-Well Graph, all traces displayed in the Detail
Graph will be averaged regardless of the group they
are assigned, and the standard deviation for this
average will be displayed.
86 0112-0109 H

FLIPR® Tetra High Throughput Cellular Screening System User Guide
Individual Well Selections
To view a single well in the Detail Graph, double-click or drag the
mouse cursor inside the well of interest.
To view the traces of multiple wells overlaid in the Detail Graph, drag
the cursor over the wells you want to view. Data from any rectangular
block of wells within the plate can be viewed in this way. Additional
wells can be added to the overlay by double-clicking or dragging the
mouse cursor over the wells of interest.
Group Selections
You can also select data to view in the Detail Graph using group
membership (see Grouping on page 88). This can be achieved using
Select Group or Group Selection Mode functions found in the
Multi-Well Graph.
Detail Graph Options
Detail graphs have a number of visualization options available in
addition to the shortcut buttons found at the top of the graph. When
you right-click on the detail graph, a menu of visualization tools is
displayed. These are summarized in the following table.
Item Description
Properties Opens the Graph Properties dialog to define Detail
Zoom Select to enable zoom capability in the graph.
Undo Zoom Rescales the graph to the original settings.
Full Scale Scales the X- and Y-axis of the Detail Graph to the
Auto Scale Manual prompt to automatically scale the Detail Graph to
Auto Scale
Always
Graph properties including: title of graph, X- or Y-axis,
graph scaling and background color.
Once the Zoom is selected, drag over a region in the graph
to view just that area enlarged to the full size of the graph.
Alternatively, drag the cursor along a part of the X- or
Y-axis to zoom in on just that axis.
parameters defined in the Manual Scale Graph option.
include all data points of the desired traces.
Automatically scales the Detail Graph to include all data
points of the desired traces without manual prompting.
Analyzing Data
The Grouping and Correction dialogs, opened from the Analysis
process page, are used to analyze data produced during an experiment.
0112-0109 H 87

ScreenWorks Software Overview
Settings made in these dialogs in a protocol file affect the way that
data, in data files generated with the protocol, are displayed when first
viewed in ScreenWorks Software. They also affect data in automatic
output options that occur when the protocol is run: automatic print
output options (see Settings Process on page 71, and Auto Print
Options on page 78) and Auto Export (see Exporting Data on page 99).
However data files created by ScreenWorks Software retain all raw data
readings, so the analysis options in the Grouping and Correction
dialogs can be applied to acquired data, modifying the display of these,
irrespective of the analysis settings configured in the original protocol.
Grouping and Correction are explained in separate sections below.
Grouping
Define groups in the Grouping dialog box, opened from the Configure
Groups button on Analysis process page.
A group is a selection of wells with a common characteristic—usually in
the type of compound added to the wells. Three groups—background
fluorescence correction, positive controls and negative controls—are
defined by default, but no wells are assigned to them. The well
assignment for these groups is left to the user.
Users can create additional groups to represent wells with a specific
ligand, or ligand concentration, or any other characteristic they want to
classify data by. Group definition includes specific input for compound
concentration, as this is commonly used for group definition.
Additionally, the Series option allows users to create a series of
groups, where a number of different concentrations are automatically
assigned to each group. This can be useful for creating groups for an
IC
or EC
50
Groups are used to select data to be viewed in the detail graph, and the
data itself can be corrected relative to responses to positive and/or
negative control groups, in the Correction dialog.
The Grouping dialog contains a grid representing the 96-, 384- or
1536-well read plate, and above this a list box where groups are
defined and selected. The basic mode of operation is to select a group
from the list box, then drag the cursor over the wells in the grid that
belong to that group. Additional groups can be defined to add to the
list.
50
experiment.
88 0112-0109 H

FLIPR® Tetra High Throughput Cellular Screening System User Guide
The table below describes the settings and options in the Grouping
dialog box:
Item Description
Groups Displays the list of defined groups, including group
name (typically compound name), concentration and
notes associated with the group. Wells assigned to a
group in the grid below have the same color as the
group in the list.
Positive Controls—Use this group to assign positive
control wells, typically the maximum response to a
concentration of an agonist.
Note: Positive Control wells need to be
defined in order to use the Positive Control
Scaling Correction.
Negative Controls—Use this group to assign negative
control wells, typically buffer addition controls.
Note: Negative control wells need to be defined
in order to use the Negative Control
Correction feature.
BF Controls—Use this group to assign wells in which
to measure background fluorescence. Measurements
for each time point from these wells are used for
Background Fluorescence Correction for ratiometric
data (see Ratiometric Options on page 94).
_add new group—Use this to define a new individual
group or a series of groups that are user-defined.
Add/Edit Group Opens the Edit Group dialog to edit the group
selected in the Groups list. This could be an existing
group, or create a new group by selecting the Add
New Group row.
Shortcut: Open the Edit Group dialog by
double-clicking on a group in the Groups list.
Delete Group Deletes the group selected in the Groups list.
Any wells assigned to the group lose their coloring,
indicating that they no longer belong to any group.
0112-0109 H 89

ScreenWorks Software Overview
Item Description
Delete All Groups Deletes all user-defined groups.
Note: Positive, negative and background
fluorescence control groups cannot be deleted,
however this command deletes all wells
assigned to these groups.
Clear All Selections Removes all group assignments from all wells. Group
Undo Last Selection Removes group membership from the last wells that
names in the top list are not affected.
were assigned to a group.
Changing Wells Assigned to Groups
To assign wells to a group:
1. Select the appropriate group from the Groups list, for example,
Positive Controls.
2. Drag the cursor over the wells from the plate layout that you
want to include in the selected group. Alternatively, the row or
column title can be selected to include all the respective wells in
the group.
Note: Wells in a group do not need to be contiguous. Multiple areas of
the plate may be selected.
You can deselect individual or neighboring wells by right clicking
in one corner of a well to be deselected, then dragging over the
well or wells to deselect.
3. Repeat Steps 1–2 to assign other wells to different groups.
Adding a New Group
To add a new group:
1. Select _add new group from the Groups list and click the
Add/Edit Group button (or double-click on the group). The
Select Type of Group dialog box opens.
2. You can choose to configure a single group with specific settings
on the Group tab, or configure a series of groups, with
incrementing concentration values, on the Series tab.
90 0112-0109 H

FLIPR® Tetra High Throughput Cellular Screening System User Guide
3. To assign a single group concentration, click the Group tab and
do the following:
Enter a name for the group (for example, compound name)
in the Group Name field.
Select or enter the concentration in the Concentration box.
Select the concentration units in the Units drop-down list.
The choices are nM, μM, mM, M or Log.
In the Notes area, type in any notes that you want
associated with the specified group and data file.
4. To assign a series of concentrations, click the Series tab and do
the following:
Note: The Series option is typically used for assigning a
dose-response curve with regular increment steps.
Enter a name for the group (for example, compound name)
in the Group Name field.
Select or enter the lowest or highest concentration of the
series in the Starting Value field.
Select or enter the change in concentration between
concentrations in the series in the Step Increment field.
Select the concentration units in the Units drop-down list.
The choices are nM, μM, mM or M.
Decide how the Step Increment is applied to the Starting
Value to create the series, for example, Plus, Minus,
Multiply or Divide, and select it from the Operation dropdown list.
If you have replicates, select whether they are aligned in row
or column format on the plate. If replicates align in both row
and column formats, indicate the number of replicates (for
example, Replicates in rows indicates all wells in the
selected rows will have same concentration). If two rows are
to include the same concentration, indicate “2” replicates. If
there are no replicates, select None.
Select the direction in which the series will increment, for
example, Left, Right, Top or Bottom.
In the Notes area, type in any notes that you want
associated with the specified group and data file.
5. When finished, click OK to save the defined group.
When a series is created, assign wells to it as described above.
Successive rows or columns are assigned different concentrations and
group color automatically, as configured in the series.
0112-0109 H 91

ScreenWorks Software Overview
Correction
Use the Correction dialog to apply data-correction algorithms, and to
view ratiometric data. These changes affect:
• Data displayed in the Multi-Well Graph and Detail Graph.
• Data displayed in group statistic table and graphs.
• Data in files are exported manually or automatically (see
Exporting Data on page 99).
• Data in printed output configured in the Settings process page
(see Auto Print Options on page 78).
Plainly, once data are exported, they cannot be changed, so settings
made in this dialog in protocol files are important for these output
options. For viewing data in ScreenWorks Software, however, since raw
data are always kept, correction options selected in protocol files can
be altered when the data are viewed in resulting data files.
The table below provides brief descriptions of the options in this dialog
box; see Appendix B: Data Processing Algorithms on page 273 for a full
description.
Item Description
Crosstalk
Correction
Positive Control
Scaling
Negative
Control
Correction
Only available with Aequorin, ICCD camera. Check this
option to correct all wells for crosstalk from neighboring
wells. The crosstalk function is based on well-to-well
distance and the measured percentage of crosstalk.
Check to average each maximum RLU value from the
positive control group and normalize all samples to this
value (set at 100%). This function is useful when graphing a
dose-response curve or when comparing data between
experiments.
Check this option to have an average negative control well
value and ratio-to-well value calculated for each sample
interval (time point). This ratio is calculated for each sample
interval and applied to all wells. This function provides a
good correction for signal drift and artifacts.
92 0112-0109 H

FLIPR® Tetra High Throughput Cellular Screening System User Guide
Item Description
Spatial
Uniformity
Correction
Subtract Bias
Based On
Sample
Response Over
Baseline
Check this option to use the initial signal to normalize signal
in each well, removing fluctuations due to well-to-well
variation in cell density and dye loading. The processing
algorithm averages the initial signal from all wells together.
It then scales each individual well relative to the average.
This correction is particularly recommended when you want
to normalize cell number, type and dye-loading conditions
throughout a plate.
Note: Spatial uniformity should only be used when
all wells in a plate are treated the same prior to an
experiment (for example, dye loading, cell numbers,
etc.).
Check this option to subtract the RLU measured at a
selected read number from all other time points in each
well. This option enables you to set the Y-axis scale so that
at the time point specified, the
Y-axis values for all data graphs is zero.
Select the read number to be subtracted in the field to the
right of the checkbox. The default is read number 1.
Check this option to display the trace as a ratio of the
response to the average of a set of predefined reads.
Baseline Start—First read to be included in the averaged
baseline value.
Baseline End—Last read to be included in the average
baseline value.
Show As Percentage—Displays response as a percent
increase over the average baseline value.
Each of the correction options can be applied alone or in combination
with the others. When a combination is selected they are applied in the
following order:
1. Crosstalk
2. Spatial Uniformity Correction or Response Over Baseline
3. Negative Control Correction
4. Positive Control Scaling
5. Subtract Bias
Note: Spatial uniformity correction and percent baseline cannot be
applied at the same time.
0112-0109 H 93

ScreenWorks Software Overview
Ratiometric Options
Where two read modes are configured, you can view the data as a ratio
of one read mode to the other, for each data point.
When this option is enabled, traces of the calculated ratio can be
displayed in the multi-well and detail graphs.
Prior to calculating the ratio, radiometric data is corrected for
fluorescence background by subtracting estimated background values
from both numerator and denominator for each time point. Once the
fluorescence background is subtracted, the ration is then calculated.
Additional user-selected corrections are applied to the ratio, beginning
with negative control correction, positive control scaling, followed by
subtract bias.
Note: Spatial uniformity correction and response over baseline are
disabled when Ratiometric Options are active.
Ratiometric parameter settings are described in the following table:
Item Description
Ratiometric
Options
Background
Fluorescence
Correction
Enable ratiometric data viewing by checking the check
box.
Specify how the ratio is defined by selecting the read
modes to be used as numerator and denominator.
Scale by BF Control Group—For each time point and
read mode in the ratio, the average value for that time
point in the background fluorescence control wells (BF
Controls, in the Grouping dialog) is subtracted. The ratio is
calculated after subtraction of the average value from both
numerator and denominator.
Scale by Constant Values—Constant values to subtract
from the numerator and denominator for each time-point
ratio are entered by the user.
You must enter these constant values in the numerator
and denominator fields when this option is selected.
94 0112-0109 H

FLIPR® Tetra High Throughput Cellular Screening System User Guide
Group Statistics
Below the Multi-Well and Detail Graphs on the Analysis process page,
the Group Statistics Table is used to analyze data produced during
an experiment. Groups defined in the Grouping dialog can only be
analyzed in this section. In addition, settings made in the Correction
dialog will influence the group statistics that are reported.
To analyze data in the Group Statistics Table, groups must first be
defined in the Grouping dialog. Once defined, the Configure Kinetic
Reduction button is selected in Multi-Well Graph to define the reads
and reduction type to be analyzed.
Features of the Group Statistics Table are explained in separate
sections below.
Button Name Description
Copy Table
Data
Collapse
All Groups
Expand All
Groups
Auto Fit All
Columns
Copies data in the Group Statistic Table to the
clipboard so it can be pasted in a different program
such as Microsoft Excel.
Collapses the Group Statistics Table to only display
the group name and relative statistics.
This works as a toggle button with Expand All Groups
which displays the individual wells and kinetic reduction
values that comprise each group statistic.
Expands the Group Statistics Table to display all the
individual wells and kinetic reduction values that
comprise each group statistic.
This works as a toggle button with Collapse All
Groups, which displays only the group name and
individual statistics.
This is used to collapse the column width so it is no
wider than the title of the column or largest data point.
0112-0109 H 95

ScreenWorks Software Overview
Button Name Description
Select
Statistics
Opens the Choose Statistics dialog box which enables
users to define groups statistics (for example,
Average, Standard Deviation and Z-score) are
displayed in the table.
Group statistics available include the following:
Concentration—Numerical concentration values
assigned to each group in the Grouping dialog.
Units—Concentration units (
assigned to each group in the Grouping dialog.
Notes—Comments assigned to each group in the
Grouping dialog.
Average—Numerical average of the kinetic reduction
values for a given group.
Maximum—Highest value (a single number) of all
kinetic reductions within a group.
Maximum-Minimum—Result of subtracting the
minimum kinetic reduction value from the maximum
count kinetic reduction value for a single group.
Minimum—Lowest kinetic reduction value within a
group.
Sum—Numerical sum of all kinetic reduction values
within a group.
Standard Deviation—Defines the numerical value
associated with one standard deviation from the
average.
Standard Deviation+1—Equals the average group
value plus one standard deviation.
Standard Deviation-1—Equals the average group
value minus one standard deviation.
for example, uM)
96 0112-0109 H

FLIPR® Tetra High Throughput Cellular Screening System User Guide
Button Name Description
Select
Statistics
(continued
)
1. Zhang, J., Chung, T. D. Y. and Oldenburg, K. R. (1997). A Simple Statistical
Parameter for Use in Evaluation and Validation of High Throughput Screening
Assays. Journal of Biomolecular Screening 4(2):67:73.
Z Score—Used to evaluate quality or performance of
the assay and is dependant on the concentration
evaluated1.
Z-factor—Used to evaluate the quality or
performance of the assay at a given concentration.
This is typically used for all concentrations, not
including the positive control. Calculation used:
Z = 1 - [3*(std dev of GROUP + std dev of neg
ctrls)/abs(mean of GROUP - mean of neg
ctrls)]
Z’-factor—A characteristic parameter for the
quality of the assay itself. This is typically
performed using data only from the positive control
concentration. Calculation used:
Z' = 1 - [3*(std dev of pos ctrls + std dev
of neg ctrls)/abs(mean of pos ctrls - mean of
neg ctrls)].
The statistics defined in the Group Statistic Table can be plotted in
the Group Statistic Graph, located behind the Detail Graph, to
quickly view a dose-response curve. All groups are included in the
graph, unless the user right-clicks on the desired group and selects
Exclude Groups From Statistic Chart. Groups not used in the graph
will have a green line through the entire row of the group. To include
the group in the graph, right-click the group and select Include
Groups In Statistic Chart. Data displayed in the Group Statistic
Graph is defined by selecting the desired group statistic from the
Group Statistic Table. Therefore, if the standard deviation is the
desired data to be evaluated, select the Standard Deviation column
header to highlight this data in the Group Statistic Table and it will be
displayed in the graph.
0112-0109 H 97

ScreenWorks Software Overview
Features of the Group Statistic Graph are explained in separate
sections below.
Button Name Description
Copy Graph Copies data in the Group Statistic Graph to the
Copy Graph
Data
Zoom Mode Press to enable zoom capability in the graph.
Auto Scale Manual prompt to automatically scale the Group
Auto Scale
Always
Undo Zoom Rescales graph to the original settings.
Manual
Scale
Graph
Show/Hide
Data
clipboard so it can be pasted in a different program
such as Microsoft Word.
Copies Graph Data in the Group Statistic Graph
to the clipboard so it can be pasted in a different
program such as Microsoft Excel.
Once the Zoom button is pressed, drag over a
region in the graph to view just that area enlarged
to the full size of the graph.
Alternatively, drag the cursor along a part of the Xor Y-axis to zoom in on just that axis.
Statistic Graph to include all data points of the
desired traces.
Automatically scales the Group Statistic Graph
to include all data points of the desired traces
without manual prompting.
Opens the Manual Scale Graph dialog to set the
maximum and minimum values for the X- and
Y-axis graph.
Toggle button that shows or hides the data for the
selected traces at each read.
Show Point
Labels
Show/Hide
Legends
Show/Hide
Smoothed
Curve
98 0112-0109 H
Show Point Labels writes the value of each data
point (for example, RLU value) beside the point on
the graph.
A toggle button that displays or hides the detail
graph legend.
A toggle button that displays or hides the
4-parameter curve fit.
This feature can be displayed at the same time as
Show/Hide Original Trace.

FLIPR® Tetra High Throughput Cellular Screening System User Guide
Button Name Description
Show/Hide
Original
Trace
Show/Hide
Real Data
Points
A toggle button that displays or hides the trace of
the graph, which connects each data point.
This feature can be displayed at the same time as
Show/Hide Smooth Curve.
A toggle button that displays or hides the data
points to create the graph.
Note: It is recommended that either the
Original Trace or Smoothed Curve
features are activated when the data points
are hidden.
Display XAxis in Log
Scale
Show/Hide
EC/ICXX
Value
A toggle button that converts the X-axis from a
concentration to a log concentration scale.
A toggle button that displays or hides the
effective/inhibition concentration from being
displayed. When activated, the user defines the
percentage of activation/inhibition that the graph
will plot.
Exporting Data
ScreenWorks Software has two means of exporting data:
• Automatic export when a protocol is run, configured in protocol
files.
• Export from already acquired data, in data files.
Export options are accessed in different ways in the two cases:
• In protocol files use the Auto Export button in the Analysis
process page.
• For data files, use File > Export, File or Batch Export, or the
Export button on the Analysis page. The Export button allows
export only of the current data file, while the File menu has
options to export the current file or batches of files on disk.
Data is exported as ASCII text format files, with a separate file
exported for each measurement configuration you ask for. When data is
exported from data files you must enter a folder to write the output
files to. In the Auto-Export option, files go to the folder defined in the
Settings process. The default export folder is:
C:\Documents and Settings\[your_user_name]\My
Documents\Molecular Devices\ScreenWorks\MyData
0112-0109 H 99

ScreenWorks Software Overview
The Auto-Export dialog has three tabs:
• Time Sequence—Exports time-point measurements for
selected read modes. The measurement values that are
exported have any corrections configured in the Correction
dialog applied. If there are two read modes and Ratiometric
Options is selected in the Correction dialog, you can also
export the ratio for each time point.
Files have a *.seqn extension, where n increments for each file
generated in the export.
• Statistics—Exports averages, maximums, and other kinetic
reduction values for selected numbers of reads for each well.
Files have a *.statn extension, where n increments for each file
generated in the export.
• Group Statistics—Exports the group statistical values for
selected numbers of reads for each group and are based on
user-defined kinetic reduction settings.
Files have a *.gstatn extension, where n increments for each file
generated in the export.
Further details about these tabs are provided in the sections below.
When exporting data files the dialog also has a Files tab where you can
set the export directory and select batch files to export if this option is
selected.
Note: Data created in previous versions of FLIPR® System operating
software cannot be viewed or exported by ScreenWorks Software.
100 0112-0109 H
 Loading...