

Page 1
Featuring:
radiation monitoring
systems
A Mirion Technologies Division
SAMS
Software
SAMS
Spectrum Acquisition and Manipulation
Software
The SAMS software package extends the RAMSYS
family spectroscopy features by adding powerful
spectrum acquisition and manipulation functions. It
allows acquisition and analysis of the monitor in true
or live time, total counting, region of interest counting
or statistical evolutions.
The RAMSYS devices that include spectroscopy are
every monitor with a LPU/SAS/NaI (liquid, iodine,
N16, N13 monitors) or with a LPU/SPIPS (ABPM,
NGM). When SAMS is connected to a monitor, it
behaves as a Multi Channel Analyzer (MCA).
APPLICATIONS
• Barrier leak control
• Ef uent release monitoring
• Radioprotection of workers
• Operational process monitoring
• Post-accident operations
FEATURES
● Display of up to 4 spectra curves with associated
data simultaneously
● Detector adjustment and spectrum energy calibration
● Treatment functions as smoothing and subtraction
● Ergonomic, user friendly, Windows® based interface
Page 2
Since norms, speci cations and designs are subject to occasional change, please ask for con rmation of the information given in this publication.
Mirion Technologies (MGPI) SA
Route d’Eyguières
FR-13113 Lamanon
France
T +33 (0) 4 90 59 59 59
F +33 (0) 4 90 59 55 18
Mirion Technologies (MGPI) Inc
5000 Highlands Parkway
Suite 150
Smyrna, GA 30082
USA
T +1 770 432 2744
F +1 770 432 9179
Mirion Technologies (MGPI H&B) GmbH
Landsberger Strasse 328a
DE-80687 Munich
Germany
T +49 (0) 89515 13-0
F +49 (0) 89515 13 169
Mirion Commercial (Beijing) Co., Ltd.
Shanghai Jiangchang Commercial Branch
Room 801, 78 Jiangchang SanLu
Zhabei District, Shanghai 200436
PR of China
T +86 21 6180 6920
F +86 21 6180 6924
SAMS
Software
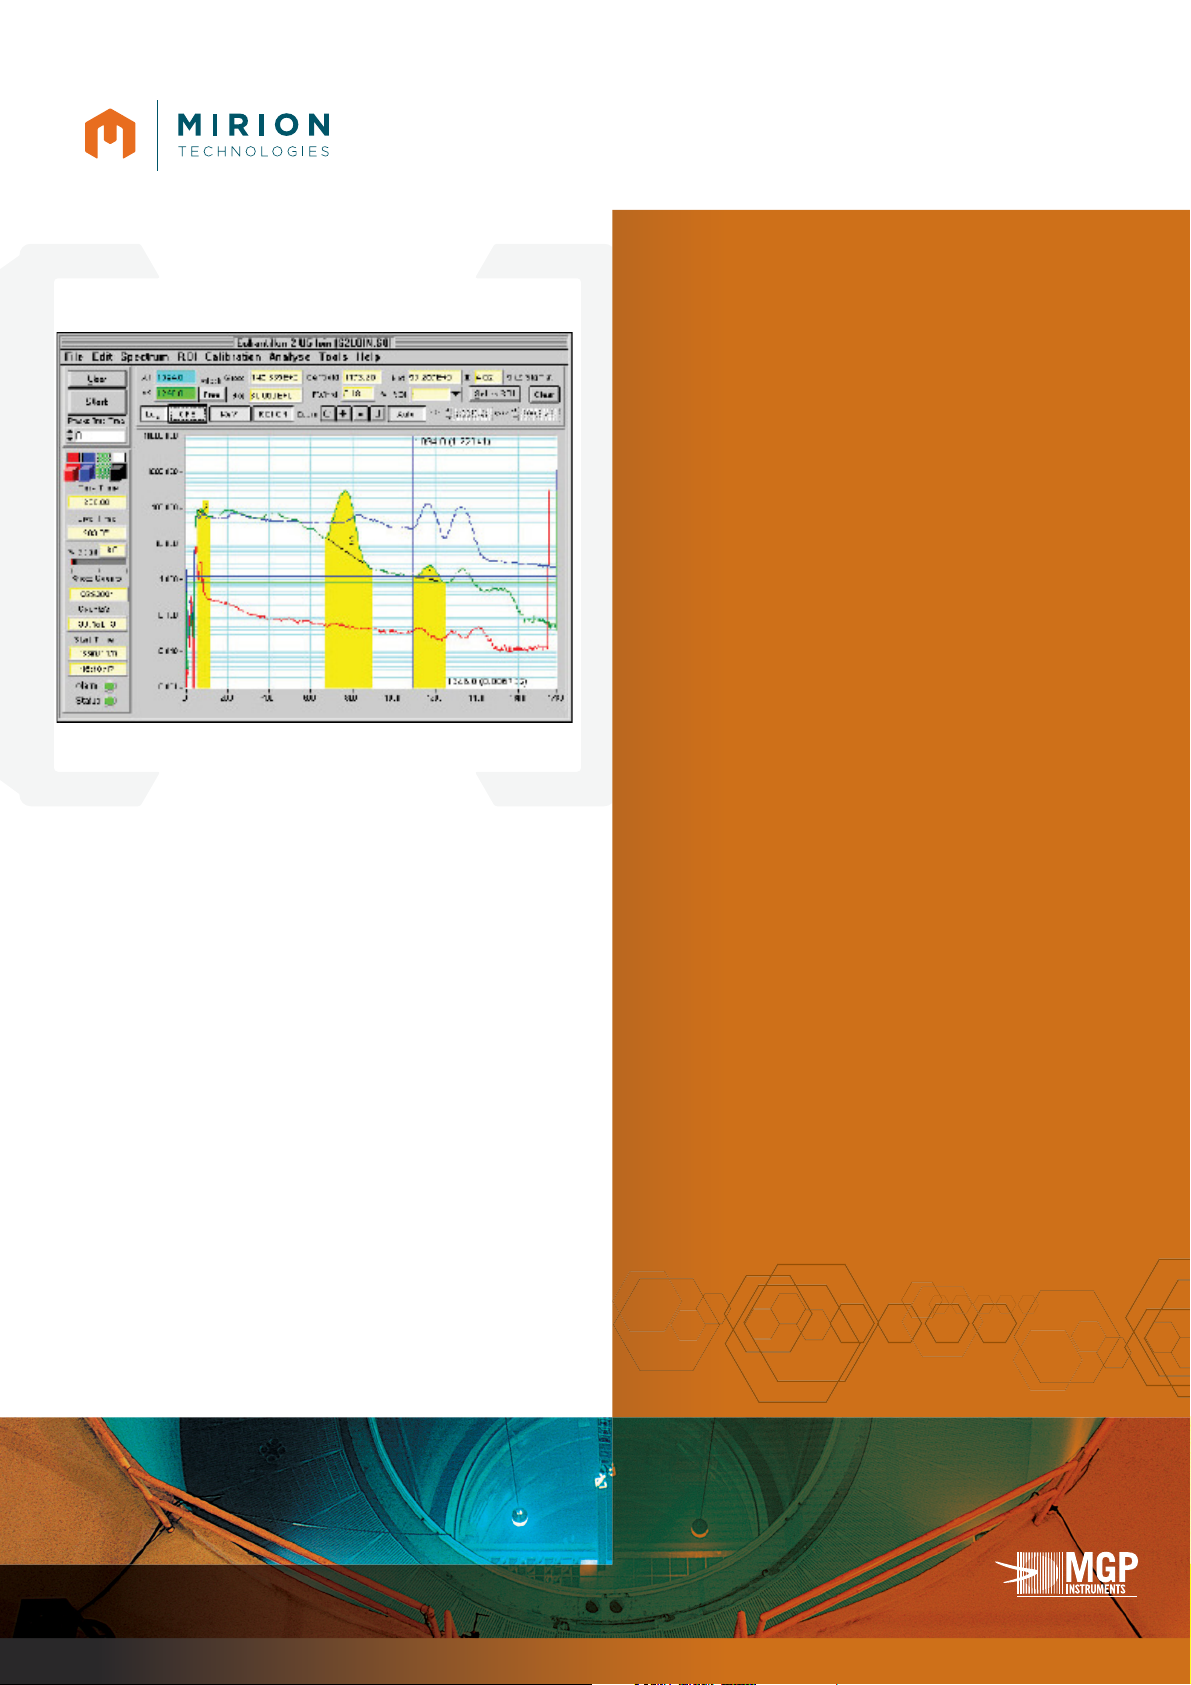
FUNCTIONAL CHARACTERISTICS
The spectrum display window gathers on the same
screen all the information the user needs to drive the
acquisition. Frequently used functions can be accessed
directly through buttons like:
● Select a spectrum’s curve to handle and/or to display
● Enter preset value of acquisition time
● Start/stop acquisition
● Clear spectrum
● Zoom in, zoom out, zoom between cursors or display
entire spectrum
● Manual/automatic vertical scale
● Lock/free cursor interval (region’s width)
● Select, de ne or clear a region of interest
Advanced capabilities are available through the menu
bar like:
● Load, save or import spectrum les
● Select communication parameters
● Print spectrum
● Copy, cut or paste a spectrum
● Load, de ne and save LPU/SAS windows as regions
of interest
● Electronic and energy calibrations
● Add a constant (offset) to the spectrum
● Smooth the spectrum
● Subtract a background spectrum
This software can be used as an operational tool for
spectrum acquisition and for detector calibration.
It gives extended spectrum diagnosis information
as well as rough isotopic discrimination. It is directly
connected to the LPU/SAS. SAMS can be used in paral-
lel with MASS2.
Above the user can follow in real-time the spectrum
data and LPU/SAS status.
www.mirion.com
144566EN-B
Computer System
Acquisition
SAM S
Maintenance
MAS S*
Operation
Field
Analysis
LPU
SAS
NaI
*MASS :Maintenance And Setup Softwar e
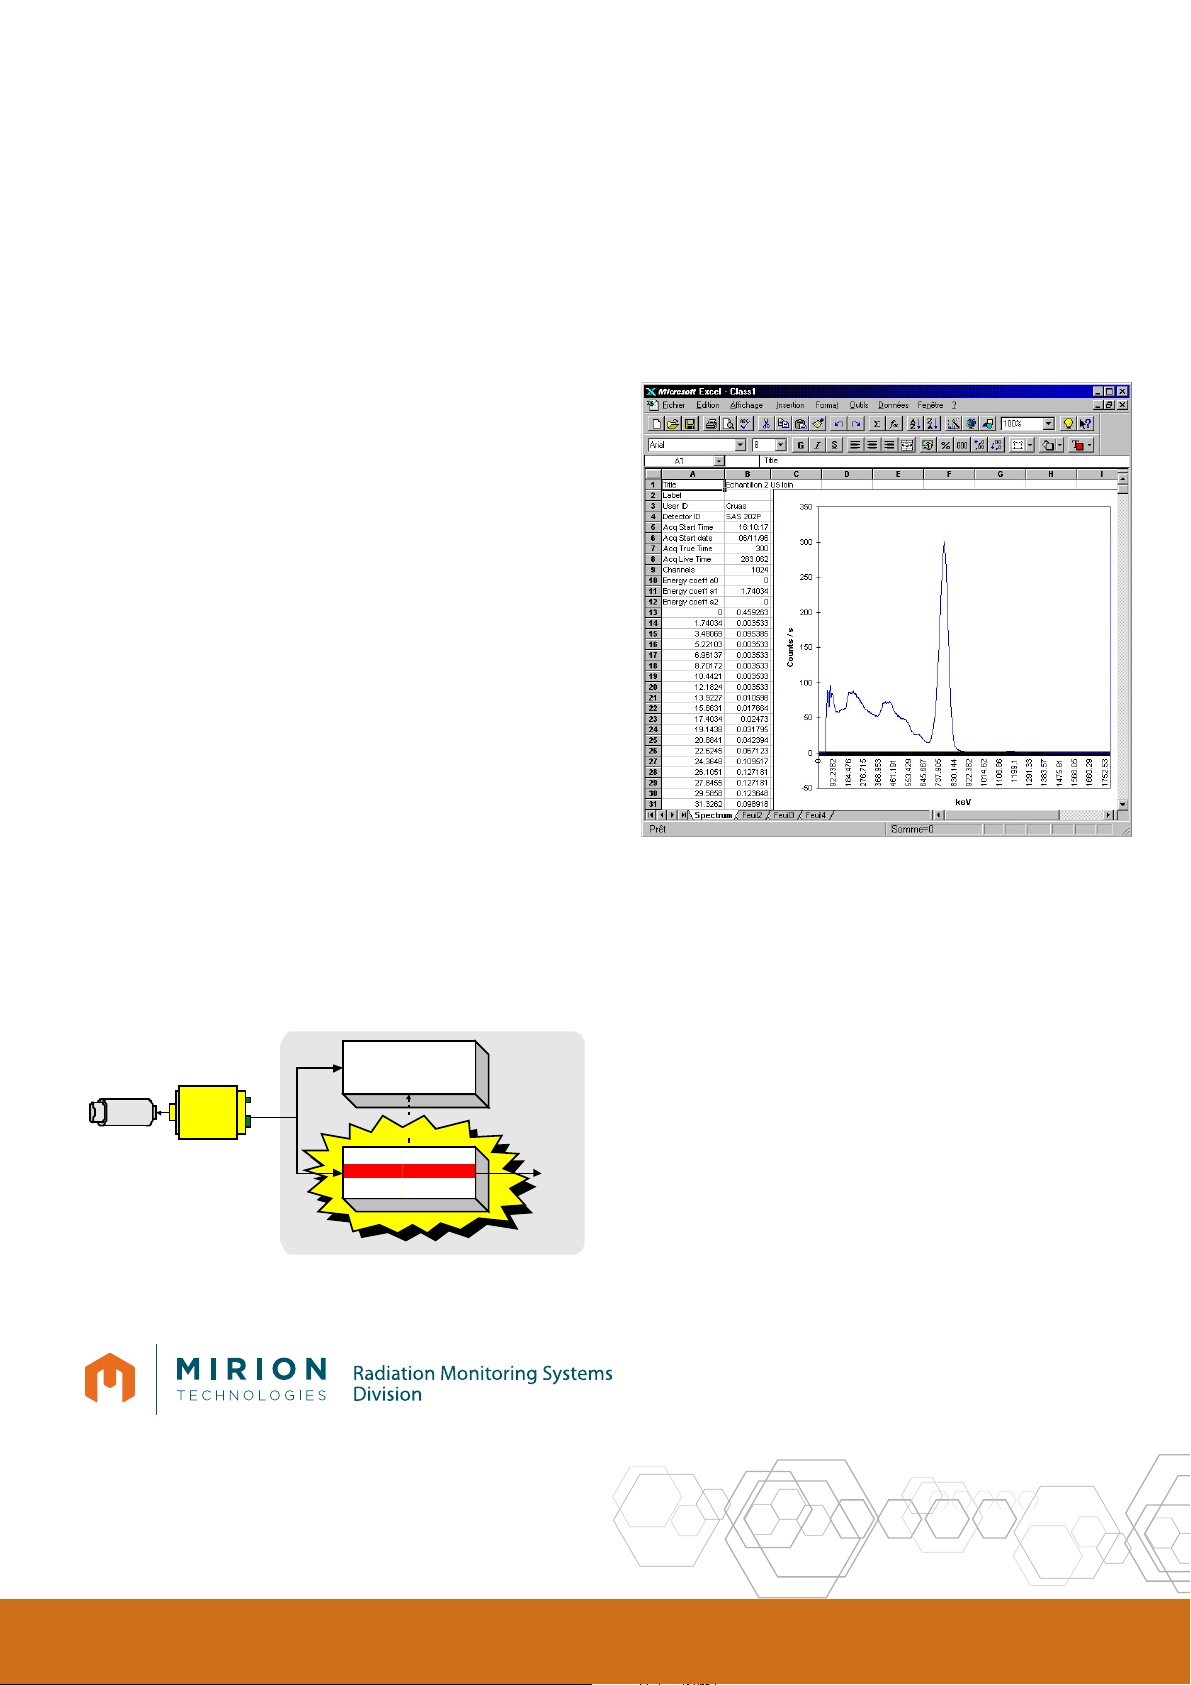
To ease report generation SAMS manages the Windows standard
clipboard to allow copy/paste operations with spectra. This allows the
user to directly import data in spreadsheet, database or word processor
software.
 Loading...