

Portable USB vector network analyzer
miniVNA Tiny &Tiny Plus

Product Overview
The professional VNA-PC software is used for data analysis and processing. The signal generator function is integrated. The measurement range is 1MHz~3000MHz, and the S parameter measurement of S11 and S21 is supported.
The miniVNA Tiny &Tiny Plus has the software open-circuit, short circuit, load, and straight-through calibration functions (the corresponding calibration components need to be prepared or purchased by the customer).
The software supports data export in multiple formats, including JPEG, Excel, ZPlots, S1P, S2P, and PDF.
Windows, Linux, and Mac
The miniVNA Tiny Plus : CNC aluminum shell (red ); The miniVNA Tiny: Plastic shell (blue).
-The upgraded version uses the CNC aluminum shell to enhance the high-frequency anti-interference capability, improve the heat dissipation of the equipment, improve the consistency and reproducibility of repeated measurement and different time measurement, and make the measurement more accurate and reliable.
** This product does not contain other accessories. If you need to use it, purchase it separately.

Product Features
Frequency range: 1MHz~3000MHz
Frequency step: 10Hz
Port configuration: Dual ports
S parameter: S11 and S21
Dynamic rang: 70dB@500MHz
Z: 1~1000 ohms
Output power: -6dB@500MHz
Full phase measurement and integration with Smith chart
With software open, short, load, and pass-through calibration functions, the test result is more accurate.
Supports data export in multiple formats (JPEG, Excel, ZPlot, S2P, and PDF).
Friendly user interface, supporting Windows, Linux, and Mac
The RF port is an SMA connector (SMA-K).
USB power supply
Super mini size, easy to carry (ultra-light and ultra-thin)

Precautions
Note 1: If the precision is high, you are advised to calibrate the device after the device is powered on and calibrate it 15 minutes after the device is powered on. Otherwise, the measurement precision may be inaccurate due to temperature changes.
Note 2: Because the minVNA Tiny&Tiny Plus needs to dissipate heat effectively, do not cover sundries on the surface to ensure good heat dissipation on the surface. Because the surface temperature is high after the device is used for a long time, take protective measures against scalding.
Note 3: Because the USB current of the device is large, you are advised to connect the USB cable to the USB port on the mainboard to increase the reliability of the USB power supply.
Note 4: The USB port of the device must be stable. You are advised to use a fixed or uncommon USB port of the PC as the minVNA Tiny &Tiny Plus port.
Note 5: All legends, scanning results, and measurement quantities in this document are for reference only because of the differences between devices, environments, proofs, and products. The test tools and accessories involved in this document must be purchased by the customer.
Note 6: A similar attenuator must be added to the test amplifier. Otherwise, the device may be damaged.

 Contents
01 |
Preparing for the Use |
|
JAVA installation |
|
Installing the Driver |
|
Querying |
|
Software running |
|
|
|
|
|
Device Ports |
|
and serial port test |
02 |
Use the Equipment |
|
|
03 |
FAQ |
JAVA installation
JAVA |
Installing |
Querying |
Software running |
installation |
the Driver |
Device Ports |
and serial port test |
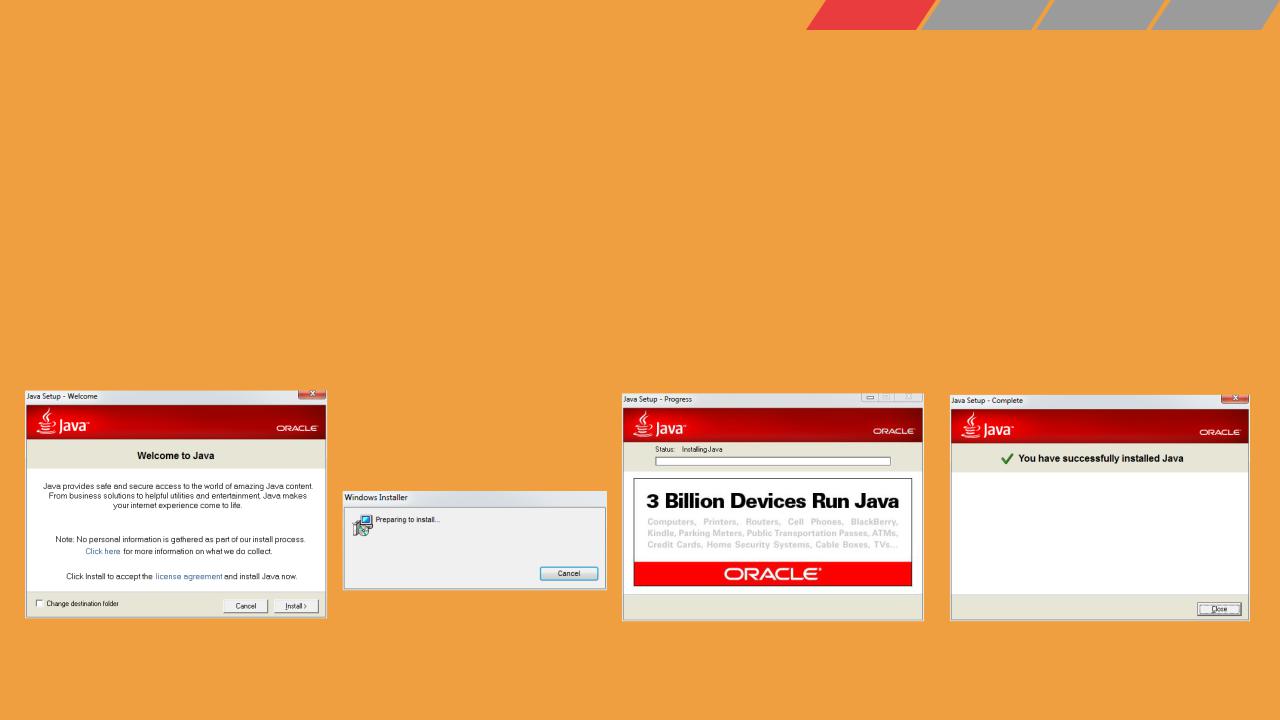
The miniVNA Tiny &Tiny Plus vector network analyzer must be used in the Java environment. Therefore, you need to install the Java software of version 7.0 or later on the computer. Select the WINDOWS/Linux/MAC system according to the actual situation and install the Java software of the 7u80 version(http://www.eastchip.com/minivnasoft.asp). If the JAVA7.0 or a later version has been installed on the PC, you do not need to install it again. If you need to install the Java of 7u80 or later, download the corresponding version from the official website of Oracle (https://www.java.com/en/download/).
The following uses the Windows 7 (64-bit) system as an example to describe how to install the Java. The file name is jre- 7u80-windows-x64.exe. Run the file as shown in the following figure to complete the installation.
Click Install |
Waiting |
Continue waiting |
Click Close |
|
|
|
|

Installing the Driver
JAVA |
Installing |
Querying |
Software running |
installation |
the Driver |
Device Ports |
and serial port test |
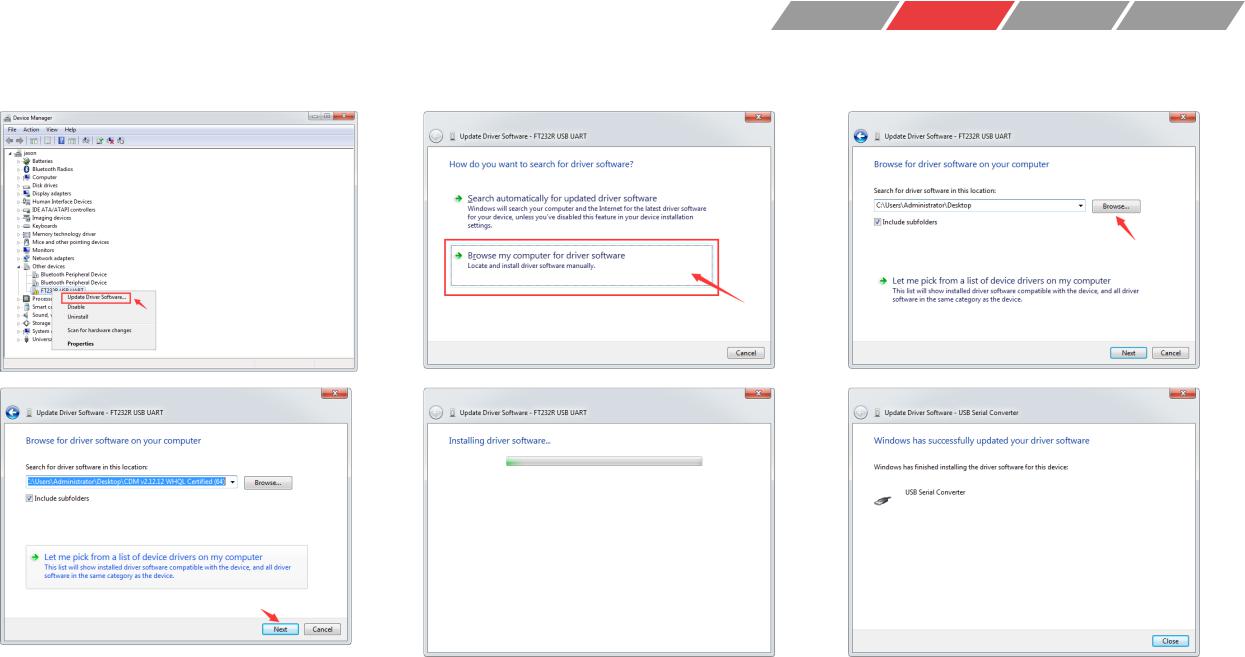
Use a USB cable to connect the miniVNA Tiny&Tiny Plus analyzer to the computer. Select the WINDOWS/Linux/MAC system according to the actual situation and download the corresponding driver according to the 32/64 bit. In this example, click http://www.eastchip.com/minivnasoft.asp or https://www.ftdichip.com/Drivers/D2XX.htm to download the CDM v2.12.12 WHQL Certified.zip. Run the file as shown in the following figure to complete the installation.
Install the driver software for FT232 USB UART and USB Serial Port according to the pattern on the continue two pages.
|
|
JAVA |
Installing |
Querying |
Software running |
|
|
Installing FT232 USB UART |
installation |
the Driver |
Device Ports |
and serial port test |
|
|
|
|
|
|
|
|
|
|
|
|
|
|
|
|
|
|
|
|
|
|
|
|
|
|
|
|
|

Installing USB Serial Port
JAVA |
Installing |
Querying |
Software running |
installation |
the Driver |
Device Ports |
and serial port test |

Querying Device Ports
JAVA |
Installing |
Querying |
Software running |
installation |
the Driver |
Device Ports |
and serial port test |
Use a USB cable to connect the miniVNA Tiny&Tiny Plus analyzer to the computer. Right-click My Computer and choose Device from the shortcut menu. In the Device Manager window shown in the following figure, check whether USB Serial Port (COM**) exists in Port (COM and LPT). If yes, the driver installation is complete. In this example, the COM port is COM78.
JAVA |
Installing |
Querying |
Software running |
installation |
the Driver |
Device Ports |
and serial port test |
Software running and serial port test |
|
|
|
Go to http://www.eastchip.com/minivnasoft.asp , download vna.3.1.9.cn.jar to the directory selected by the user, and double-click vna.3.1.9.cn.jar. (When vna.3.1.9.cn.jar is executed, the file is decompressed. For details, see FAQ 1 in this document.)
Note: The folders, parameter settings, calibration files, and exported files automatically generated by the software are saved in the vna.3.1 folder of the C:\user\Admininstrator.
Click OK. (Note: In reflection or |
Select Analyzer on the |
In the dialog box that is |
|
transmission measurement |
toolbar and click Setup... |
d i s p l a y e d , |
s e l e c t |
mode, if there is no |
|
miniVNA Tiny in the |
|
corresponding calibration data, |
|
left column and COM** |
|
the software prohibits the |
|
in the right |
column |
corresponding measurement. |
|
(port number queried |
|
For details, see the device |
|
on the previous page, |
|
calibration and test examples |
|
for example, COM78), |
|
in the specification. |
|
and click Test. |
|
After the serial port te s t i s passe d (t h e status in the dialog box is green), click Update a t t h e l o w e r r i g h t corner.
In the displayed dialog box, click OK to use the software. (The preceding figure is not displayed for the devices that have been used and calibrated.)

 Contents
01  Preparing for the Use
02 |
Use the Equipment |
|
|
Introduction to the |
|
Device Calibration |
|
Transmission |
|
Secondary |
|
Software Interface |
|
|
|
Calibration and Test |
|
calibration |
|
|
|
|
|
Cases |
|
|
03 |
FAQ |

Software
interface
Software Interface and Functions
The software version vna.3.1.9.cn is used as an example. The menu bar and three important icons are displayed. You can move the pointer over the corresponding icon to display the corresponding functions.
Device |
Transmission |
Secondary |
Calibration |
Calibration |
calibration |
File
Settings
Scales
Colors
Language
Exit
Smith icon. The test result of the positive reflection S11 is displayed in the Smith chart.
Tool
Analyze
Beacon
Cable length
Cable loss
FFT
Firmware download
Generator
Scheduler
Multi-tune
Pad-Calculator
Calibration
Frequency
Create
Load
Import
Export
Open the dialog box for loading the XML reference data. For example, after the last measurement is complete, export the XML data. After the test is complete, load the XML data. The old data is displayed in the list in the dialog box, you can also change the file stop record to compare the data before and after the upgrade.
Export
CSV
JPEG
S-parameter
S-parameter
collector
EXCEL
XML
ZPlots
Settings
Auto-Export
settings
Analyzer |
Preset |
Setup |
Load |
Info |
Save |
Reconnect |
|
Single scan |
|
Free-running scan |
|
Port extension parameter setting, usually used for reflection (S11) measurement between device and target measurement device, extension cable between device and device (such as PCB board) (this cable should be RF 50 ohm relatively low loss cable), and cable One end can be directly connected to the DUT port of miniVNA Tiny&Tiny Plus . For example, the other end of the cable needs to be soldered to the PCB (including the ground wire of the cable to be soldered). In this dialog box, the speed factor and length of the cable can be entered, that is, in the standard After the reflection is calibrated (see the reflex calibration instructions in the manual), use this operation to remove the measurement error caused by the connecting cable (the cable should be controlled in a few centimeters to ten centimeters, of course, the shorter and better, the higher the frequency or the longer the cable, the more the error Large), cable length measurement can be measured in the [Tools] - [Cable Length] in the menu bar (including speed factor measurement), the recommended cable type and speed factor are available to the cable supplier. Note: This operation is currently only for users to try, and does not guarantee the complete correctness of the test results!

Common parameters
Software |
Device |
Transmission |
Secondary |
interface |
Calibration |
Calibration |
calibration |
Common parameters on the main interface of the software (option selector)
Name |
Content |
-none- |
No data is displayed. |
|
|
RL |
Return loss (only for reflection measurement) |
|
|
RP |
The signal is a reflection measurement phase. |
|
|
TL |
Transmission loss (only for transmission |
|
measurement) |
TP |
Phase of signal transmission measurement |
|
|
SWR |
Standing wave ratio |
|
|
RSS |
Absolute value of the transmit sensor (not |
|
supported currently) |
|
|
Rs |
Rs series equivalent impedance |
|
|
Theta |
Phase angle |
|
|
Tgr |
Delay |
|
|
Xs |
XS series equivalent reactance |
|
|
|Z| |
|Z| complex impedance |
|
|

Software |
Device |
Transmission |
Secondary |
interface |
Calibration |
Calibration |
calibration |
Setting the main interface of the software |
|
||
Setting the start and end frequencies of the software main interface (upper right corner of the software)
You need to enter the frequency to be tested in the start and end frequencies based on the features and experience values of the target test components. The minimum star t frequency of miniVNA Tiny&Tiny Plus is 1 MHz and the maximum end frequency is 3GHz. The number and K/M/G input are supported, generally, it is not recommended that all frequency bands be scanned.
Preset settings on the main interface of the software (in the middle of the right part of the software)
The three icons indicate adding, deleting, and using the preset test frequency band respectively.
Add a preset test frequency segment. Enter the value to be set in Start and End Frequency. Click Add to add a preset test frequency segment.
If the cursor is in the preset test frequency segment, click the icon to delete it.
The mouse pointer is in the preset test frequency segment. Click the icon to start a single scan.
Selecting the main interface mode (lower right part of the software)
Two measurement modes Transmission (S21) Reflection (S11)
Single scanning and repeated scanning (at the lower right corner of the software) on the main interface of the software
Single scan: Connect the measurement components and set all the test parameters. Then, perform a single measurement 
Repeated scanning: You need to perform a one-time scan before selecting this option for onsite commissioning.

Software |
Device |
Transmission |
Secondary |
interface |
Calibration |
Calibration |
calibration |
Setting Interface Marking Points |
|
|
|
M: Move the cursor to the measurement result curve and the corresponding measurement data (automatic) of the current mouse position.
Mark 1: Move the mouse pointer to the measure result curve, click the left mouse button in the desired position, and then move the mouse wheel.
Triangle: Calculate the absolute difference between the data marked 1 and 2 (automatic).
Mark 2: Move the cursor to the measure result curve, press and hold the Shift key on the keyboard, and press and hold the Shift key to move the mouse wheel.
Mark 3: Move the cursor to the measure result curve, hold down the Ctrl key on the keyboard, and click the left mouse button. After the setting,
press and hold the Ctrl key and move the mouse wheel. Flag 4: Move the cursor to the measure result curve, press and keyboard to move the mouse wheel.
To cancel the mark point, remove the tick () on the right of the software tag point table area.
The following figure takes the parameters in the following figure as an example. The RL and RP parameters in the figure have the maximum and minimum automatic search functions. You only need to use the mouse to point to the RL or RP in the corresponding flag parameter.
Click , as shown in the following figure. You can view the corresponding frequency point and SWR value.
On the right of the tag point parameter table, there are two icons.
Click |
, as shown in the following figure. You can view more |
parameters, including the bandwidth, bandwidth start and end frequencies, bandwidth limit (dB), and Q value, as shown in the following figure, for parameters such as C and L, you can view the parameters related to different bandwidths by changing the value of Limit (dB), as shown in the following figure (right).

Device Calibration
Software |
Device |
Transmission |
Secondary |
interface |
Calibration |
Calibration |
calibration |
Definition: Calibration is a prerequisite for accurate measurement. It helps users accurately measure parameters. It is recommended that the miniVNA Tiny &Tiny Plus vector analyzer calibrate the equipment before each test. If the data requirement is not high, the previous calibration data can be used.
miniVNA Tiny &Tiny Plus can be used to measure the reflection and transmission modes. Before calibration, you need to set and test the serial port. In the following figure, select the reflection and transmission modes and calibrate them. Select the corresponding mode in the following figure.
Reflection measurement (for example, antenna measurement) and transmission measurement [for example, a filter, a bandpass, an amplifier, and a duplexer (note: The miniVNA Tiny&Tiny Plus is not suitable for testing the duplexer.]
In the preceding figure, two modes can be selected during calibration. The default value is Mode2 (Mode1 is used when precise calibration is required for certain frequency bands, and the frequency band and number of Mode1 are set accordingly. For details, see FAQ 2 in this document.) The number of scanning times is greater than or equal to 1 and less than or equal to 10. The number of calibration points must be greater than or equal to 100 and less than or equal to 20000. The more the set points, the more the times, and the longer the calibration time.
SMA Calibration
Part
Note: The three calibration parts in the preceding figure need to be purchased separately (SMA connectors of the calibration parts are internal screws). The three calibration parts are used for reflection (S11) calibration.
SMA straightthrough cable
Note: Generally, one or two SMA straight through cables are required in the preceding figure. The two ends of the cable are inner screw pins, which are shorter and better when the test conditions are met. A straight-through conversion connector (both ends are external screw holes) is required, the attenuator and other SMA connectors may also be required. other accessories (fewer accessories) on the non-target test samples must be added to the calibration for calibration and removal. this is usually used for transmission (S21) calibration (mainly for component transmission measurement, because the dynamic performance of the miniVNA Tiny&Tiny Plus is insufficient)., which is not applicable to the test of the duplexer. The accessories in the preceding figure need to be purchased by the customer.

Reflection calibration 1/2
DUT port. The 350MHz antenna is used as an example
(The three SMA proofs on the left are used SMA Calibration Part for reflection calibration. The SMA connectors are internal screws. You only need to perform the
corresponding operations.)
In the right pane, select the reflection mode in the lower right corner, and then choose Toolbar > Calibration > Create.
Software |
Device |
Transmission |
Secondary |
interface |
Calibration |
Calibration |
calibration |
Note: Each device has a difference. The calibration curve is for reference only.
Window displayed after the creation
The DUT is connected to the OPEN calibration component. The default number of calibration points is 10000. Click the read button in the preceding figure until the following figure is displayed (3000-10000 point calibration is recommended).
Connect the DUT to the SHORT calibration kit, and click read in the preceding figure to shortcircuit the DUT until the following figure is displayed.
Connect the DUT to the LOAD calibration component and click the read load in the preceding figure until the following figure is displayed.
(Do not remove the LOAD calibration part after the calibration is complete.)
Click Save. A dialog box is displayed, as shown in the following figure. Change the file name at the lower left corner and click Save at the lower right corner.
Click Update at the lower right corner of the following figure.
You can start to use reflection measurement to check whether the reflection measurement calibration of the device is correct. The LOAD calibration component is properly connected to the DUT interface. Click at the lower right corner to perform a single scan.
The following figure shows the scanning result.

Reflection calibration 2/2
DUT port. Take the 350MHz antenna as an example
Software |
Device |
Transmission |
Secondary |
interface |
Calibration |
Calibration |
calibration |
Note: Each device has a difference. The calibration curve is for reference only.
Click the Smith icon in the red box on the menu bar. The red circle in the preceding figure shows a green dot (the dot is in the middle of the Smith chart, and the DUT is connected to the SHORT on the left side of the Smith chart), when the DUT is connected to the OPEN, the dot is on the right side of the Smith chart. the dot thickness of each miniVNA Tiny &Tiny Plus is different or a small tail is dragged. the dots in the figure are for reference only, the three calibration parts only need to be operated in sequence. check the dot and close the figure.
Remove the LOAD calibration kit from the DUT. The DUT and DET are not connected to any component. On the menu screen, select Auto Zoom. Click Single Scan at the lower right corner of the main screen. Wait until the scan result is displayed.
Deselect Auto Zoom in the main interface of the software. If the preceding figure is displayed, it indicates that the reflector calibration of the DUT is normal.
Connect the target antenna to the DUT port on the miniVNA Tiny&Tiny Plus . If a feeder is connected, the correction point should be at the end of the feeder. If there are other extension components, the calibration point is also at the end of the miniVNA Tiny &Tiny Plus.
In the upper right corner of the main interface, set the frequency, and click Scan at the lower right corner. After the scanning is complete, click the Smith icon . The preceding figure is displayed. The calibration is complete.

Transmission calibration 1/2 |
Software |
Device |
Transmission |
Secondary |
|
interface |
Calibration |
Calibration |
calibration |
||
|
|||||
DUT to DET forward transmission. The filter is used as an example |
|
Note: Each device |
|||
|
has a difference. The |
||||
|
|
|
|||
|
|
|
calibration curve is for |
||
Two SMA straight through cables (both ends are inner screws, |
reference only. |
||||
shorter and better if the test conditions are met) and a straightthrough conversion connector (both ends are external screw holes)
Connect the DUT and DET to an SMA |
|
|
|
|
|
||
straight-through cable. Connect one |
Select the transmission mode in |
Select Create … Page after |
By default, the number of calibration |
||||
straight-through cable to the end of the |
|||||||
the lower right corner, and then |
|
|
points in the preceding figure is 1000. |
||||
straight-through cable connected to the |
|
|
|||||
choose ToolsCalibration > Create. |
|
|
Click read in the preceding figure |
||||
DUT port (for reference only). |
|
|
|
||||
|
|
|
|
|
until the legend is displayed. |
||
|
|
|
|
|
|
||
|
|
|
|
|
|
|
|
|
|
|
|
|
|
|
|
Connect the straight-through |
In the point calibration dialog box, read |
The following figure is |
|
Click Update at the lower |
You can start to use the transmission |
||
|
measurement. Check whether the |
||||||
cable between the DUT and the |
|
||||||
the loop until the preceding figure is |
displayed. Change the file |
right corner. |
transmission calibration of the device is |
||||
DET port through the straight |
|||||||
displayed. (Do not remove or disconnect |
name at the lower left corner |
|
correct. The straight-through cable connects |
||||
connector at the end. |
|
||||||
the connection after the straight line |
and click Save at the lower |
|
the DUT to the DET. Click the lower right |
||||
|
|
||||||
|
calibration is complete.) Then, click Save. |
right corner. |
|
|
corner to start a single scan. |
||
Transmission calibration 2/2 |
Software |
Device |
Transmission |
Secondary |
|
interface |
Calibration |
Calibration |
calibration |
||
|
DUT to DET forward transmission. Take the filter as an example.
Note: Each device has a difference.
The calibration curve is for reference only.
After the scanning is complete, the following figure is displayed.
Cancel the automatic scaling in the main interface of the software. The following figure is displayed. (The transmission calibration of the device is normal.)
Connect the low-pass filter to the DUT and DET respectively.
Set the frequency in the upper right corner of the main interface, and click Scan at the lower right corner. After the scanning is complete, disable the TP (°) parameter in the right column, as shown in the following figure.

 Contents
01 |
Preparing for the Use |
02 |
Use the Equipment |
|
|
03 |
FAQ |
Decompress the driver |
Frequency bands and |
Software parameter |
package based on the |
points of Mode1 |
repair |
Java driver |
|
|

Common problem 1:
After the JAVA is installed, the vna.3.1.9.cn.jar file is decompressed.
Perform the solution in sequence. If the solution is solved, you do not need to perform the following steps:
1.Right-click vna.3.1.9.cn.jar and choose --Java (TM) Platform SE binary from the shortcut menu.
2.Save the file on the right to the folder where the vna.3.1.9.cn.jar file is stored and run the
file. (Note: The folder path cannot contain Chinese characters. In this case, vna.3.1.9.cn.jar cannot be placed on the desktop because the file path on the desktop also contains Chinese characters.
Note: In the preceding information, vna.3.1.9.cn.jar is the software version. If the version is vna.3.1.8.jar, right-click the saved file and choose Edit from the shortcut menu. Change vna.3.1.9.cn.jar to vna.3.1.8.jar in English.
Save as… and rename .txt
to .cmd before use this file.

Common problem 2:
How Do I Set the Frequency Segment and Number of Mode1 Points?
Open the C:\ user \Admininstrator\vna.3.1\ presets file and open the CalRanges_miniVNA Tiny.txt file. (You are advised to back up the file.) The following table describes the parameters in red. You are advised to modify only the number of scan points and the number of scanning times. Save the modification and restart the vna.3.1.9.cn.jar. (The number of scanning times of each frequency band is greater than or equal to 1.) Less than or equal to 10 The number of calibration points must be greater than or equal to 100 and less than or equal to 20000.
Start frequency (Hz) |
End frequency (Hz) |
Scan points |
Scan times |
1000000 |
30999999 |
10000 |
2 |
31000000 |
48999999 |
500 |
1 |
49000000 |
52999999 |
2000 |
2 |
53000000 |
142999999 |
500 |
1 |
143000000 |
147999999 |
2000 |
2 |
148000000 |
428999999 |
500 |
1 |
429000000 |
441999999 |
2000 |
2 |
442000000 |
1229999999 |
500 |
1 |
1230000000 |
1310999999 |
2000 |
2 |
1311000000 |
2199999999 |
500 |
1 |
2200000000 |
2599999999 |
2000 |
2 |
2600000000 |
3000000000 |
500 |
1 |
|
|
|
|

Common problem 3:
How to solve software parameter modification can not be restored?
Close the software, open the C:\ user \Admininstrator directory, find the vna.3.1 folder, delete the vna.3.1 folder (the exported files and calibration data in the folder can be saved as required), and then run the software to generate the vna.3.1 folder again, all internal configuration data is regenerated (the folder of vna3.2.X or a later version is vna.3.2).

THANKS
 Loading...