

Page 1
AN-48-003 Rev.: G (April 12, 2018) M167331 (R93281) File: AN-48-003(G).doc
This document and its contents are the propert y of Mini-Circuits
User Guide
The PWR series covers:
0.009 – 8000 MHz
-60 to +20 dBm
50 and 75 Ω Impedance models
Peak & Average, RMS and CW models
POWER SENSORS
USB &
Ethernet
Page 2

Page 2 of 43
AN-48-003 Rev.: G (April 12, 2018) M167331 (R93281) File : AN-48-003(G).doc
This document and its contents are the property of Mini-Circuits
Important Notice
This guide is owned by Mini-Circuits and is protected by copyright, trademark
and other intellectual p r oper ty laws.
The information in this guide is provided by Mini-Circuits as an accommodation
to our customers and m ay be used only to pr om ote and accom p any the
purchase of Mini-Circuits’ Parts. This guide may not be reproduced, modified,
distributed, published, stored in an electronic database, or transmitted and the
information containe d her ei n may not be exploited in any form or by any means,
electronic, mechanical recording or otherwise, without prior written permission
from Mini-Circuits.
This guide is subject to change, qualifications, variations, adjustments or
modifications without notice and may contain errors, omissions, inaccuracies,
mistakes or deficiencies. Mini-Circuits assumes no responsibility for, and will
have no liability on account of, any of the foregoing. Accordingly, this guide
should be used as a guideline only.
Trademarks
Microsoft, Windows, Visual Basic, Visual C# and Visual C++ are registered
trademarks of Microsoft Corporation. LabVIEW and CVI are registered
trademarks of National Instruments Corporation. Delphi is a registered
trademark of Delphi Technologies, Inc. MATLAB is a registered trademark of
The MathWorks, Inc. Agilent VEE is a registered trademark of Agilent
Technologies, Inc. Linux is a registered trademark of Linus Torvalds. Mac is a
registered trademark of Apple Inc. Python is a registered trademark of Python
Software Foundation Corporation.
All other trademarks cited within this guide are the property of their respective
owners. Neither Mini-Circuits nor the Mini-Circuits USB/Ethernet Smart RF
Power Meter are affiliated with or endorsed or sponsored by the owners of the
above referenced trademarks.
Mini-Circuits and the Mini-Circuits logo are registered trademarks of Scientific
Components Corporation.
Mini-Circuits
13 Neptune Avenue
Brooklyn, NY 11235, USA
Phone: +1-718-934-4500
Email: sales@minicircuits.com
Web: www.minicircuits.com
Page 3

Page 3 of 43
AN-48-003 Rev.: G (April 12, 2018) M167331 (R93281) File : AN-48-003(G).doc
This document and its contents are the property of Mini-Circuits
Table of Contents
Chapter 1 – General Information ........................................................5-9
1.1 Scope of the User Guide ..................................................................................... 5
1.2 Warranty ............................................................................................................. 5
1.3 Definitions ........................................................................................................... 5
1.4 General Safety Pre cauti o ns ................................................................................ 6
1.5 Introduction ......................................................................................................... 6
1.6 Service and Calibration ....................................................................................... 7
1.7 Contact Information ............................................................................................. 7
1.8 Technical Description ....................................................................................... 7-9
1.8.1 Features of Mini-Circuits power sensors .................................................................. 7
1.8.2 Intended Applications .............................................................................................. 8
1.8.3 Conformity ............................................................................................................... 8
1.8.4 Supported software environments ........................................................................... 8
1.8.5 Model Selection Guide ............................................................................................. 9
Chapter 2 – Installation and S e t up ................................................. 10-15
2.1 Software Setup ..................................................................................................10
2.2 Installation .................................................................................................... 11-10
2.3 Power Sensor Physical Setup ...................................................................... 13-15
Chapter 3 – Using PWR Smart Power Se ns ors ............................. 16-37
3.1 USB Interface ............................................................................................... 16-20
3.2 Ethernet Interface (RC suffix models only) .................................................. 21-22
3.3 Main Screen ................................................................................................. 23-26
3.3.1 Left Side of Screen (Fig. 3.3) ................................................................................. 23
3.3.2 Top Center of Screen (Fig. 3.3) ............................................................................. 24
3.3.3 Bottom Center of Screen (Fig. 3.3) ........................................................................ 24
3.3.4 Right Side of Screen (Fig. 3.3) ............................................................................... 24
Page 4

Page 4 of 43
AN-48-003 Rev.: G (April 12, 2018) M167331 (R93281) File : AN-48-003(G).doc
This document and its contents are the property of Mini-Circuits
Table of Contents
3.4 Real-Time Graph................................................................................................26
3.4.1 Real-Time graph indicators and functions (Fig. 3.4) ............................................... 26
3.5 Relative Frequency Points Table ................................................................. 27-27
3.6 Creating and using Offset Files .................................................................... 28-29
3.7 Data Record Window ................................................................................... 30-32
3.7.1 Left side of Screen (Fig. 3.7).................................................................................. 30
3.7.2 Right side of Screen (Fig. 3.7) ............................................................................... 30
3.7.3 View Graph ............................................................................................................ 31
3.7.4 Open Data File ...................................................................................................... 31
3.7.5 Create Excel File ................................................................................................... 32
3.8 Firmware Update (Supported models only) .................................................. 33-34
3.9 Compact View ....................................................................................................35
3.10 Working with multiple sensors .................................................................... 36-37
Chapter 4 – Peak Power and Pulse profiling ...................................... 38
4.1 Configuring sample period & Trigger (Peak power only) ....................................38
4.1.1 Trigger Options (Fig. 4.1) ...................................................................................... 38
4.1.2 Output Options (Fig. 4.1) ...................................................................................... 38
4.2 Pulse Profile Analysis .........................................................................................39
4.2.1 Pulse profiling display options (Fig. 4.2) ................................................................. 40
4.2.2 Markers for Graphs ................................................................................................ 40
4.2.3 Zoom Graph Configuration .................................................................................... 41
4.2.4 Zoom on Pulse config window ............................................................................... 41
4.2.5 Calculated parameters........................................................................................... 42
Chapter 5 – Revision History ............................................................... 43
Page 5
Page 5 of 43
AN-48-003 Rev.: G (April 12, 2018) M167331 (R93281) File : AN-48-003(G).doc
This document and its contents are the property of Mini-Circuits
1 Chapter 1 – General Information
1.1 Scope of the User Guide
This User Guide provides general introduction, installation instructions and operating
information for Mini-Circuits PWR series of USB and Ethernet smart power sensors. For
detailed instructions on specific measurement applications using Mini-Circuits measurement
applications software see the
Application Measurement guide.
1.2 Warranty
See the Mini-Circuits website http://www.minicircuits.com/support/ordering.html for warranty
information.
1.3 Definitions
Note: A note advises on important information you may need to ensure proper operation of the equipment.
There is no risk to either the equipment or the user.
A caution advises about a condition or proced ure which can cause damage to the
equipment (no danger to users).
A warning alerts to a possible risk to the user and steps to avoid it. DO NOT proceed
until you are sure you understand the warning .
CAUTION
WARNING
Page 6

Page 6 of 43
AN-48-003 Rev.: G (April 12, 2018) M167331 (R93281) File : AN-48-003(G).doc
This document and its contents are the property of Mini-Circuits
1.4 General Safety Precautions
Please observe the following safety precautions at all times when using Mini-Circuits
smart power sensors.
1. Note the maximum input power rating in the datashee t and the conditions
specified for it. Exceeding these values may damage the power sensor.
2. Do not exceed the operational safe power levels for extended periods of time.
1.5 Introduction
Traditionally, when you wanted to measure signal power from electronic components or circuit
boards, you’d have to connect them to a bulky and expensive bench-top power meter. Not
anymore. Mini-Circ u its PW R power sensors offer a whole new approach, using a quick, simpl e,
USB or Ethernet connection to turn your Windows
®
PC or laptop into an RF/Microwave power
meter.
The PWR series offers a low-cost replacement solution for conventional RF/Microwave power
meters, but goes even further by adding portability, easy data storage, advanced dataprocessing capabilities, and remote operation via Ethernet. Unlike most conventional bench-top
instruments, they’re self-calibrating and compensate automatically for temperature. They’re
quick and easy to use, whether you’re in the field or helping someone complete a remote test
installation over the phone.
CAUTION
Page 7

Page 7 of 43
AN-48-003 Rev.: G (April 12, 2018) M167331 (R93281) File : AN-48-003(G).doc
This document and its contents are the property of Mini-Circuits
1.6 Service and Calibration
The only user-performed service possible for the PWR models is external cleaning of the case
and connectors as needed. Do not use any detergents or spray cleaning solutions to clean the
PWR unit. To clean the connectors, use an alcohol solution, and to clean the PWR case, a soft,
damp cloth. The recommended calibration cycle for Mini-Circuits PWR series smart power
sensors is once a year. Calibration service is available from Mini-Circuits. For details; see
Ordering, Pricing & Availability Information link from individual model pages on the website.
1.7 Contact Information
Mini-Circuits inc.
13 Neptune Ave
Brooklyn, NY 11235
Phone: 1-718-934-4500
General Fax: 1-718-332-4661
Sales / Customer Service Fax: 1-718-934-7092
sales@minicircuits.com
For regional offices and tech support see
http://www.minicircuits.com/contact/offices.html
1.8 Technical Description
1.8.1 Features of Mini-Circuits power sensors
✓ Pocket-sized portability
✓
Automatic frequency calibration & temperature compensation
✓
Turns a laptop or PC into a low-cost replacement power meter
✓
Effective, easy-to-use software
• User-friendly GUI for any Windows® 32- or 64-bit computer (command-line support for
Linux
®
)
• Multiple data display and output optio ns , including Excel
®
• Data averaging
• Relative measurements
• Scheduled data recording with user defined spec limits
• Multi-sensor support (up to 24), display options, and management tools
• Measurement Applications suite to simplify many common test scenarios
• Remote operation via TCP/IP networks
• DLL COM objects for both ActiveX, and .NET supporting LabVIEW
®
, Delphi®, C++, C#,
Visual Basic
®
, and more (see programming handbook and application note AN-49-001
for details)
• Download and install in seconds all required software from
https://www.minicircuits.com/softwaredownload/pm.html.
For specific model features, performance data and graphs, outline drawing, ordering information
and environmental specifications, see our catalog at:
https://www.minicircuits.com/WebStore/PortableTestEquipment.html
Page 8

Page 8 of 43
AN-48-003 Rev.: G (April 12, 2018) M167331 (R93281) File : AN-48-003(G).doc
This document and its contents are the property of Mini-Circuits
1.8.2 Intended Applications
Mini-Circuits PWR series smart power sensors are intended for indoor use in:
- Lab and test equipment setups for both manual and automated measurements
- Remote location monitori ng
- Automatic, scheduled data collection
- Evaluation of high-power, multi-port devices with built-in virtual couplers/attenuators & other
software tools
The models can be used by anyone familiar with the basics of electronics measurements.
1.8.3 Conformity
Mini-Circuits PWR series power sensors conform to all requirements for the following
international standards
:
RoHS – The models comply with EU directive for Restriction of Hazardous Substances
for 6 substances.
USB 2.0 – The models meet the specifications of the Universal Serial Bus Ver. 2.0
communication standard as described by USB-IF.
USB HID – The models meet the requirements for Universal Serial Bus Human
Interface Devices according to USB-IF’s Device Class Definition for Human
Interface Devices firmware rev. 1.11.
TCP/IP – The RC suffix series models’ Ethernet communication complies with the
specifications of the Transmission Control Protocol (TCP) and Internet
Protocol (IP) as defined in RFC 791 and RFC 793.
HTTP – The RC suffix series models’ support all requirements for commun ic at ing with
the Hypertext Transfer Protocol (HTTP) as defined in RFC 1945.
Telnet – The RC suffix series models’ support all requirements for communicating with
the Telnet protocol, as defined in RFC 854.
1.8.4 Supported software environments
Mini-Circuits PWR series power sensors have been tested in the following operating systems:
32 bit: Windows 10, Windows 8, Windows 7, Windows Vista, Windows XP Windows 98
64 bit: Windows 10, Windows 8, Windows 7, Windows Vista, Linux
The power sensors will work with almost any software environment that supports ActiveX or
.Net including: C++, C#, CVI
®
, Delphi®, LabVIEW® 8 or newer, MATLAB® 7 or newer, Python,
Agilent VEE
®
, Visual Basic®, AutoIT, Visual Studio® 6 or newer, and more
Additionally the HTTP and Telnet protocols can operate from almost any computer with a
network connection.
For more information see
Mini-Circuits programming manual on our website.
Page 9

Page 9 of 43
AN-48-003 Rev.: G (April 12, 2018) M167331 (R93281) File : AN-48-003(G).doc
This document and its contents are the property of Mini-Circuits
1.8.5 Model Selection Guide
Model
Name
Frequency Range
Impedance
(Ω)
Sensor
Type
Input Power
Measurement
Speed
(ms)
Max
DC
Current
(mA)
Control
Min Max
Min
(dBm)
Max
(dBm)
PWR-2.5GHS-75 100 kHz 2.5 GHz 75 CW -30 +20 30 70 USB
PWR-4GHS 9 kHz 4 GHz 50 CW -30 +20 30 70 USB
PWR-4RMS 50 MHz 4 GHz 50 RMS -35 +20 30 140 USB
PWR-6GHS 1 MHz 6 GHz 50 CW -30 +20 30 70 USB
PWR-6LGHS 50 MHz 6 GHz 50 CW -45 +10 30 110 USB
PWR-6LRMS-RC 50 MHz 6 GHz 50 RMS -45 +10 30 300
USB &
Ethernet
PWR-6RMS-RC 50 MHz 6 GHz 50 RMS -35 +20 30 300
USB &
Ethernet
PWR-8FS 1 MHz 8 GHz 50 CW -30 +20 10 70 USB
PWR-8GHS 1 MHz 8 GHz 50 CW -30 +20 30 70 USB
PWR-8GHS-RC 1 MHz 8 GHz 50 CW -30 +20 30 250
USB &
Ethernet
PWR-8P-RC 10 MHz 8 GHz 50
Peak
& Avg
-60 +20 0.002 450*
USB &
Ethernet
For additional details and ordering information, click on model P/N.
*With Ethernet disabled, increases to 600mA with Ethernet control enabled
Page 10
Page 10 of 43
AN-48-003 Rev.: G (April 12, 2018) M167331 (R93281) File : AN-48-003(G).doc
This document and its contents are the property of Mini-Circuits
2 Chapter 2 – Installation and Setup
System requirements for the PWR models are a computer (Pentium II or better) with support for
USB HID. To run the GUI program a Windows operating system for either 32 or 64 bits is also
required.
The RC models can also be operated remotely over a network with mains power (100-220V)
supplied using the included power adaptor.
2.1 Software Setup
If you have had any problems installing the software, we’re here to help.
Try following these complete step-by-step instructions. If you still experience problems,
give us a call at Mini-Circuits Worldwide Technical support. It’s (718) 934-4500 or e-mail
apps@minicircuits.com for North America, or go to minicircuits.com/contact/worldwide_
tech_support.html for other regional numbers and addresses.
2.1.1 First save all work in progress and close any other programs that may be running.
2.1.2 Next, Insert the Mini-Circuits CD into the CD-ROM drive, or download the full CD
software from minicircuits.com. If installing from files downloaded from the web - unzip the
downloaded files to a temporary folder on your desktop or C: drive, then open the file folder
you created and double-click the “Install” icon.
2.1.3 If installation from the CD does not start automatically, run
install.exe from the <CD drive> root directory.
Figure 2.1.3 CD file listing window
Page 11
Page 11 of 43
AN-48-003 Rev.: G (April 12, 2018) M167331 (R93281) File : AN-48-003(G).doc
This document and its contents are the property of Mini-Circuits
2.2 Installation
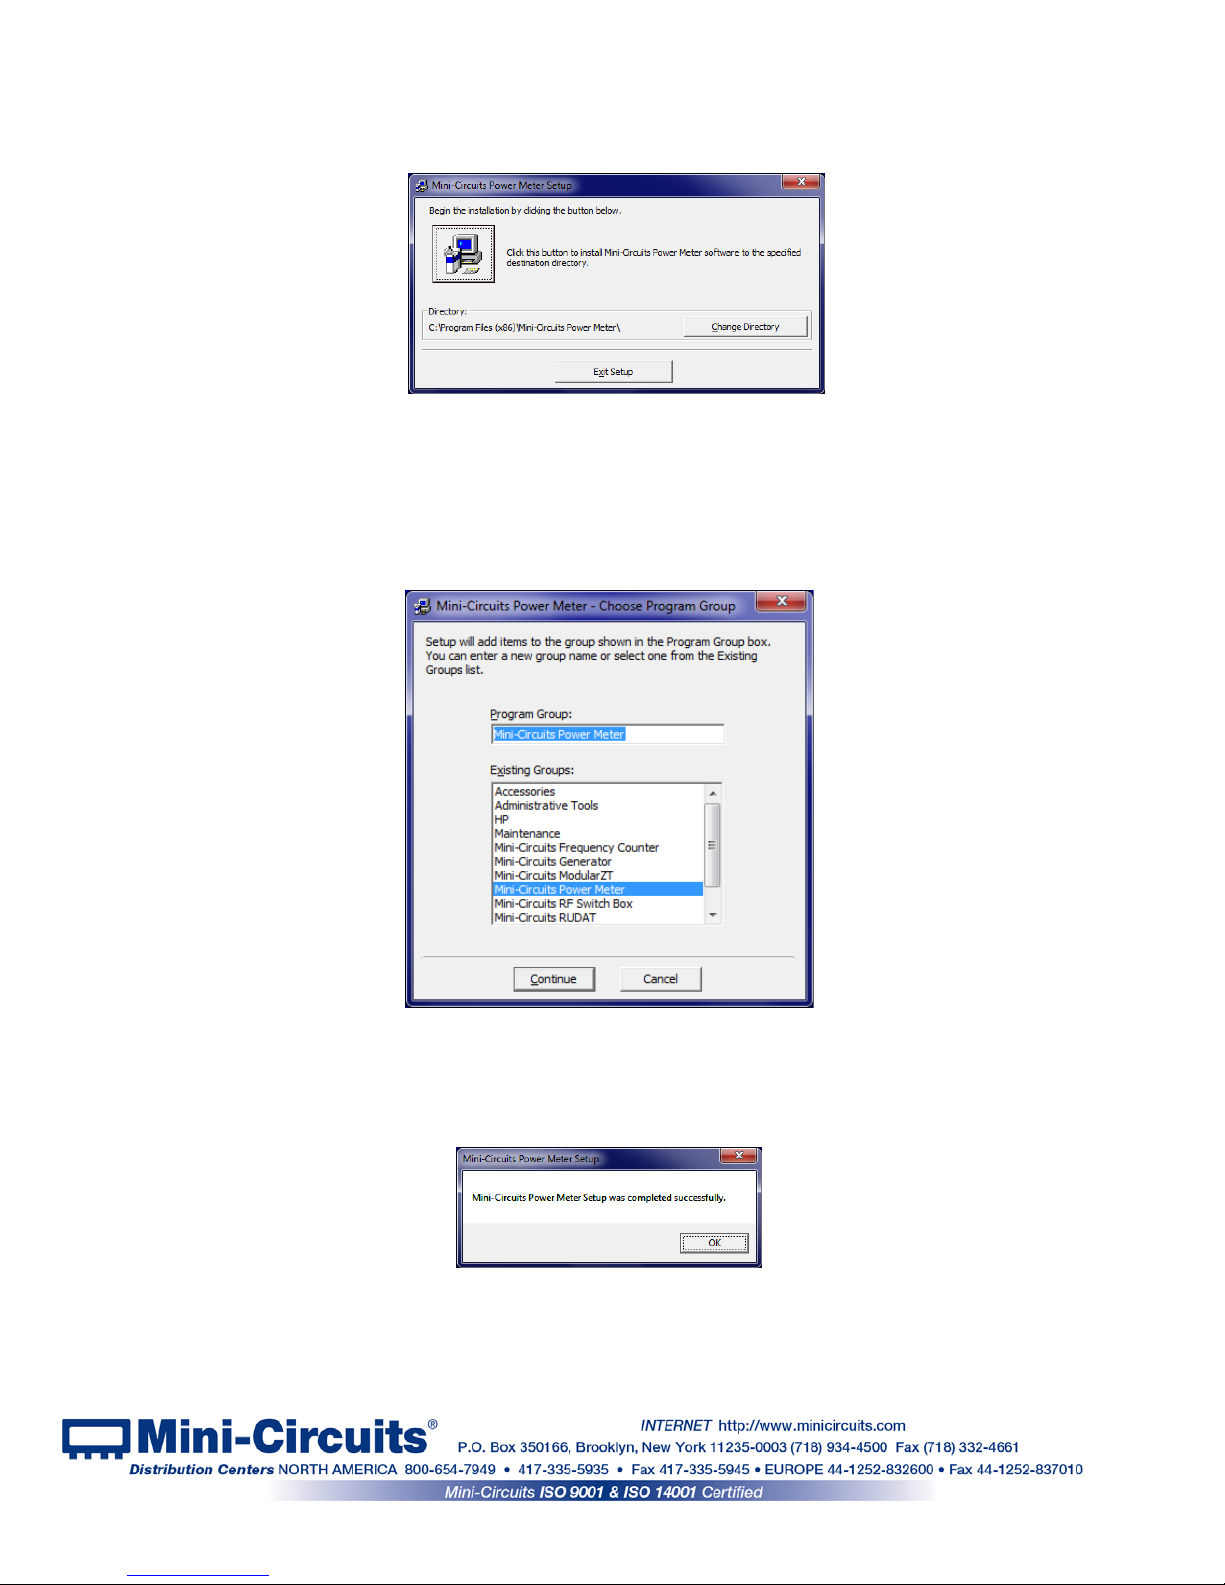
2.2.1 The installer window should now appear. Click the “Install Now” button.
Figure 2.2.1 Installation window
2.2.2 The license agreemen t should now appear. To proceed, click “I Agree” and
the “Continue” button.
Figure 2.2.2 License agreement
2.2.3 The installation program will launch. Click the “OK” button to continue.
Figure 2.2.3 Installation Program window
Page 12
Page 12 of 43
AN-48-003 Rev.: G (April 12, 2018) M167331 (R93281) File : AN-48-003(G).doc
This document and its contents are the property of Mini-Circuits
2.2.4 The destination directory window will appear. At this point it’s a good idea to
take a second and confirm the full destination address for the software. In most cases, the
default will be your computer’s hard drive (C:)\Program Files (x86)\Mini-Circuits Power Met er\.
Or Change it then click the large button at the top to continue.
Figure 2.2.4: Destination Directory window
2.2.5 The Program Group window will appear. This window allows you to select the
program group under which the link for the smart power meter program in the Start Menu will
be created. If you change the Program Group for this software, be sure to record that
information together with your destination address. Click on “Continue” to proceed.
Figure 2.2.5: Program Group Window
2.2.6 In a second or two, your installation will be complete. Click “OK” to
close the installer.
Figure 2.2.6: Installation complete
Page 13
Page 13 of 43
AN-48-003 Rev.: G (April 12, 2018) M167331 (R93281) File : AN-48-003(G).doc
This document and its contents are the property of Mini-Circuits
2.3 Power Sensor Physical Setup
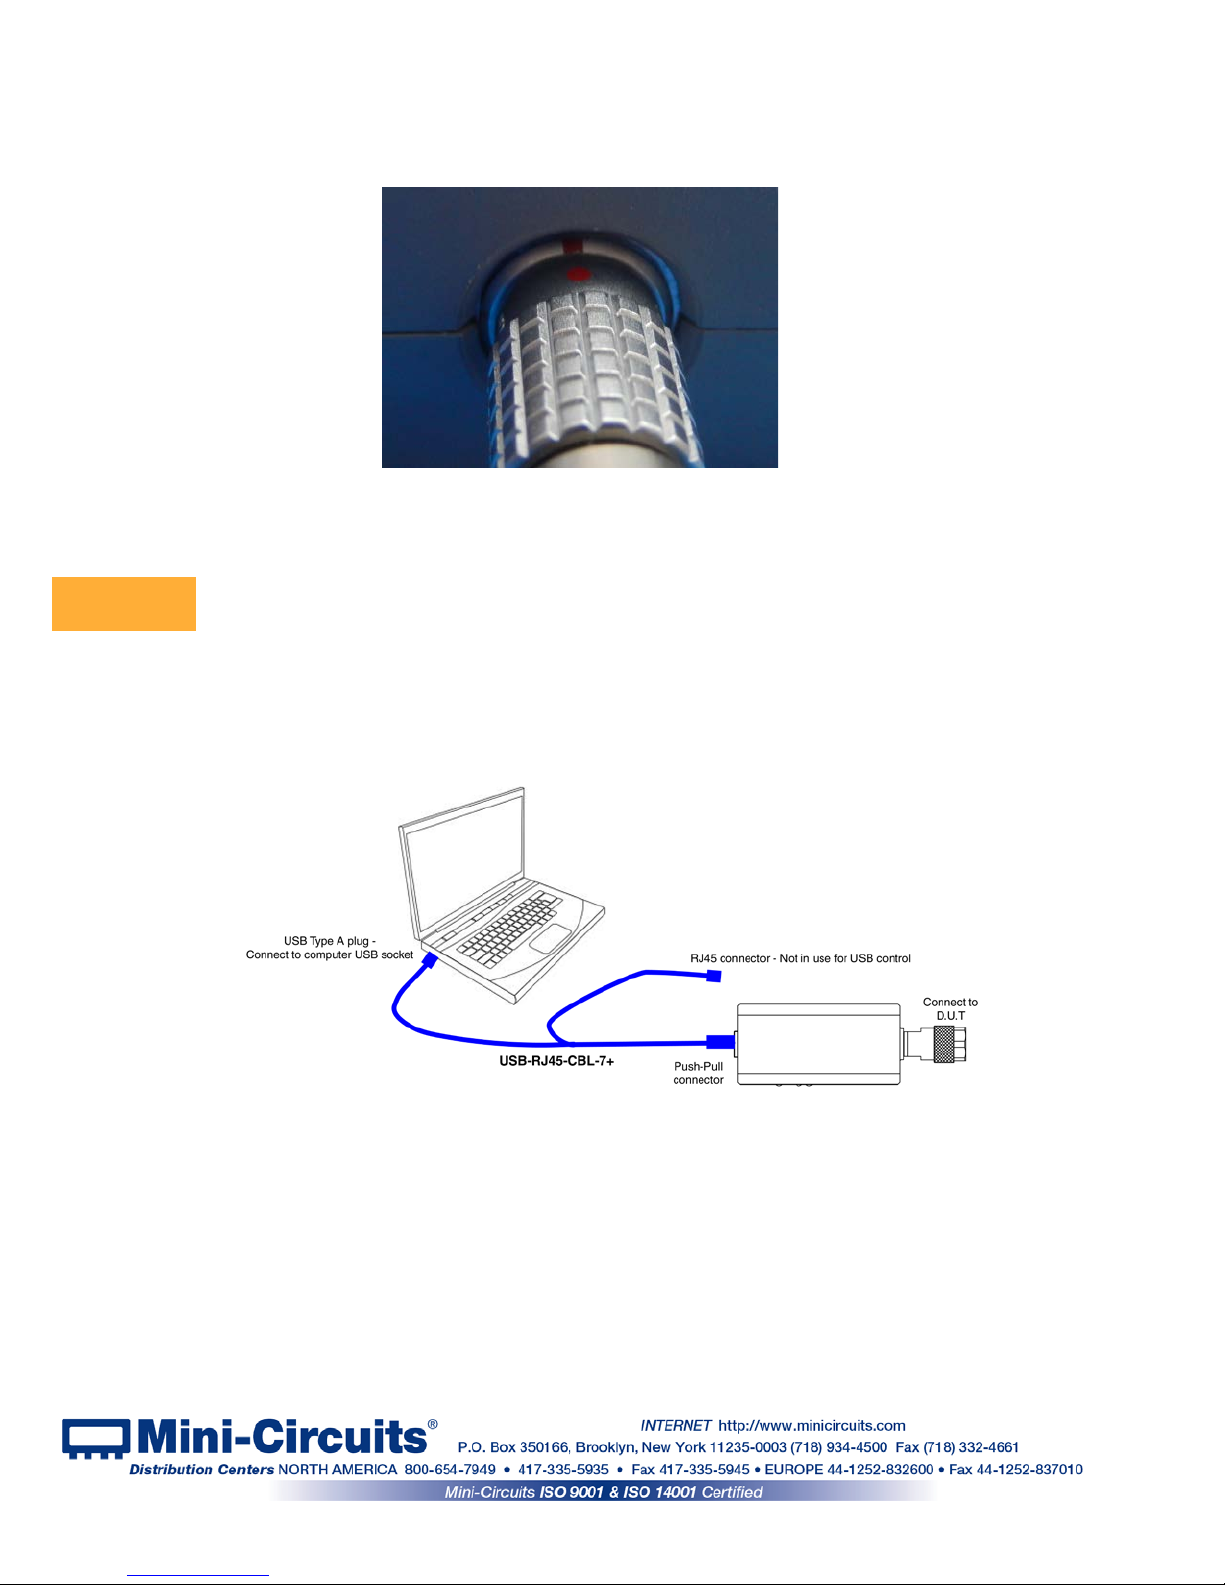
2.3.1 For CW and RMS power sensors, align the red dot at the Power Sensor
USB connection with the one on the supplied cable and press in until you hear a ‘click’.
2.3.2 For Peak power sensors, simply connect the standard USB cable supplied to
the USB port.
1. Note the maximum rating power input in the datasheet and the conditions
specified for it. Exceeding these values may damage the power sensor.
2. Do not exceed the operational safe power levels for extended periods of time.
2.3.3 For USB control, connect the USB type A plug of the supplied cable to the
computer USB port and begin testing. In RC models the RJ45 connector remains unconnected
when in USB control.
Figure 2.3.1: Plug cable into unit
Figure 2.3.3a: Connections for USB control of a CW or RMS RC model
CAUTION
Page 14

Page 14 of 43
AN-48-003 Rev.: G (April 12, 2018) M167331 (R93281) File : AN-48-003(G).doc
This document and its contents are the property of Mini-Circuits
2.3.4 For Ethernet control using AC/DC adaptor (CW and RMS RC models
only)
• Connect the USB type A plug of the 'Y' cable to the provided power adaptor and plug it
in to a mains power socket, note the power sensor's power indicator lights up.
• Connect the Ethernet plug to a network port and note power sensor's Ethernet status
indicators light up.
2.3.5 For Ethernet control using AC/DC adaptor (Peak power models
only)
• Connect the provided US B cable to the pow er ada ptor and plu g it in to a mains power
socket, note the power sensor's power indicator lights up.
• Connect the Ethernet plug to a network port and note the indicators at the power
sensor’s Ethernet port light up.
Note: Before connecting the power sensor for the first time you will need to enable Ethernet control. If
Ethernet control is not enabled indicator lights at Ethernet port will not light up.
Figure 2.3.4: Connections for Ethernet control with power adaptor
Figure 2.3.3b: Connections for USB control of Peak & Avg power sensor
Figure 2.3.5: Connections for Ethernet control of Peak & Avg power sensor
Page 15

Page 15 of 43
AN-48-003 Rev.: G (April 12, 2018) M167331 (R93281) File : AN-48-003(G).doc
This document and its contents are the property of Mini-Circuits
2.3.6 For Ethernet control using Power Over Ethernet (RC models only)
• Mini-Circuits RC power sensor models do not directly support PoE but an external PoE
splitter could be used to enable their use on a PoE network.
• Follow the instructions from the supplier to connect the splitter’s PoE interface into an
Ethernet port supporting PoE.
• Connect the power sensor’s USB connection into the splitter’s USB / DC supply port (an
adapter may be required), ensuring the sensor’s power indicator LED turns on.
• Connect the power sensor’s Ethernet connection into the splitter’s RJ45 network port,
the sensor’s Ethernet data indicator LEDs should turn on.
Figure 2.3.6: Connections for Ethernet control using Power Over Ethernet
Page 16

Page 16 of 43
AN-48-003 Rev.: G (April 12, 2018) M167331 (R93281) File : AN-48-003(G).doc
This document and its contents are the property of Mini-Circuits
3 Chapter 3 – Using PWR Smart Power Sensors
3.1 USB Interface
3.1.1 Go to the Start Menu and select All Programs>Mini-Circuits USB Power Meter
(default), or go to the other destination address you selected earlier. The “Mini-Circuits USB
Power Meter” icon should be waiting there for you. Click on it and get started!
Figure 3.1.1: Power Sensor Startup screen
3.1.2 The startup allows you to select the control method you wish to use for the PWR
units, USB or Ethernet control. All models support USB control, only models with an ‘RC’
suffix such as PWR-8GHS-RC support Ethernet control. For USB control click on the USB
button, for Ethernet control see section 3.2
3.1.3 If a single PWR power sensor is connected to the computer via USB, the
Smart RF Power meter screen will appear, already displaying your unit ready to start
measurements.
Figure 3.1.3: Main screen
Page 17

Page 17 of 43
AN-48-003 Rev.: G (April 12, 2018) M167331 (R93281) File : AN-48-003(G).doc
This document and its contents are the property of Mini-Circuits
3.1.4 If multiple PWR power sensors are connected to the computer via USB, the
initial screen will show a list of S/N for connected units. You can select a single unit, or
multiple units you wish to start with – each opening in its own window. The program can
handle up to 24 units connected
simultaneously.
Figure 3.1.4: Unit selection screen
#
Name
Description
1
Number of
sensors
Shows total number of power sensors detecte d
2
Sensor List List, by serial number of all sensors detected
3
O.K Proceed with the sensors selected
4
Select All Marks all sensors listed
5
Deselect all
Cancels selection of all sensors listed
6
Freq
Enter the frequency to be tested for best results. If multiple units are selected
all will use the compensation factor suitable for this frequency.
7
Compact View Open selected power sensors in compact view
8
Recording
Open data recording window to set data recording for one or more of the
sensors
9
Cancel Exit the program
See section 3.10 for detailed description of operating with multiple units.
3.1.5 If no PWR power sensors are connected to the computer via USB or there is
a problem with the USB connection selecting USB will cause the following alert will pop-up.
Click OK and check the USB connections before clicking the ‘reset connection’ button.
Figure 3.1.5: No USB unit found
4
5
6
7
8
9
1
2
3
Page 18

Page 18 of 43
AN-48-003 Rev.: G (April 12, 2018) M167331 (R93281) File : AN-48-003(G).doc
This document and its contents are the property of Mini-Circuits
3.1.6 After acknowledging the alert, the main measurement screen will appear with
no unit selected and a ‘Not Connected’ notice. Click on ‘reset connection’ to try connecting
again, or close the program.
3.1.7 If there's a faulty D.U.T connection, no RF power or the power is below the
sensors dynamic range a ‘Power Too Low’ notice will appear.
Figure 3.1.6: No USB Unit found
Figure 3.1.7: Power Too Low
Page 19

Page 19 of 43
AN-48-003 Rev.: G (April 12, 2018) M167331 (R93281) File : AN-48-003(G).doc
This document and its contents are the property of Mini-Circuits
3.1.8 The Ethernet Configuration (RC suffix only) screen can only be
accessed from the USB control main screen. Click on the Ethernet-Config button in the
bottom right corner of the screen, and the Ethernet configuration screen will appear.
Figure 3.1.8 Ethernet-Config button on USB main screen
3.1.9 The Ethernet Configuration screen will open showing the current
configuration. Figure 3.1.9 shows the factory default of the power sensor. If these settings fit
your local network, you do not need to access the setup before connecting the power sensor
to the network.
Figure 3.1.9: Ethernet Config. screen (showing factory default state)
Note: If you are using a proxy server for your LAN connections you may need to define a name
for the power sensor IP address, or disable the proxy server to connect to the power sensor via
Ethernet.
9 8
4
2
6
11
1
3
5
7
10
12
Page 20

Page 20 of 43
AN-48-003 Rev.: G (April 12, 2018) M167331 (R93281) File : AN-48-003(G).doc
This document and its contents are the property of Mini-Circuits
3.1.10 The Ethernet Configuration settings are:
#
Name
Description
1
MAC Address
Media Access Control Address – a unique, unchanging identifier for the
smart power meter unit.
2
Network
Gateway
IP address of the network gateway. When DHCP is selected this is assigned
by the server.
3
Subnet Mask
The Network's Subnet Mask. When DHCP is selected this is assigned by the
server.
4
IP Address
The IP address of the unit in your Network. When DHCP is selected this is
assigned by the server.
5
Use DHCP
When selected the smart power meter will query the server for appropriate
parameters with no input from the user and will disregard manually entered
IP address, subnet mask and network gateway settings.
6
Refresh Request IP address, gatew ay and subnet mask from the server.
7
Copy State
Copies current state of dynamic IP to static IP, not available when DHCP is
selected.
8
Static
Configuration
When DHCP is not selected the user must specify the values below and will
not be changed by the server.
9
Telnet Port Port to be used for Telnet communication. Cannot be changed by user
10
Store
After you've made all changes you want to click on this button to save the
settings.
11
Password
If you want to limit the users able to access the power sensor select "U se
Password" and enter the desired password (up to 20 characters).
12
HTTP Port
Specify the port to use for HTTP communication with the network (default
80). Note port address does not get assig ned by the server when DHCP is
selected. Port 23 is reserved for Telnet communication and cannot be used.
3.1.11 After making the changes you want, click on "Store" and the
changes will be saved to the smart power meter's memory. See section 3.2 for work ing with
Ethernet control.
3.1.12 For Peak and Average power sensors only, the Ethernet control circuitry
needs to be specifically enabled before power sensor can be used via Ethernet by selecting
the “Enable Ethernet” option and clicking “Store”. Once Ethernet control is enabled you can
proceed as described for other RC suffix models.
Note: When Ethernet is enabled the power sensor may draw over 500mA. This may cause
issues if attempting to power it from a USB 2.0 port.
Figure 3.1.12: Ethernet Config. screen for Peak power sensor
Page 21

Page 21 of 43
AN-48-003 Rev.: G (April 12, 2018) M167331 (R93281) File : AN-48-003(G).doc
This document and its contents are the property of Mini-Circuits
3.2 Ethernet Interface (RC suffix models only)
3.2.1 After starting the GUI (section 3.1) you can select the control method you
wish to use for the PWR, either USB or Ethernet control. All models support USB control,
only models with the RC suffix (such as PWR-8GHS-RC) support Ethernet control. To start
operation with USB see section 3.1. For Ethernet control either type the IP address and port
of the power sensor, or click on the search icon.
3.2.2 After clicking on the search icon The IP search will pop up with a list of
smart power meter IP addresses found and their HTTP ports on the left side of the screen,
and full details of each unit on the right. Mark the IP address you wish to use and click
select. The search window will close and the IP address and port will be entered in the IP
address field of the initial screen automatically.
Figure 3.2.2: Ethernet IP search window
Figure 3.2.1: Power Sensor Startup screen
Page 22

Page 22 of 43
AN-48-003 Rev.: G (April 12, 2018) M167331 (R93281) File : AN-48-003(G).doc
This document and its contents are the property of Mini-Circuits
Notes:
1) To refresh the list of units found click on the Search button.
2) The search function uses ports UDP 4950 and UDP 4951 for communication, ensure
your firewall allows access to these ports.
3) For Peak power sensor models you need to enable Ethernet control before using it for
the first time see section 3.1.12 for details.
3.2.3 After entering the IP address, enter your password if you set one (see
section 3.1.10), select the communication protocol you wish to use (HTTP or Telnet) and
click start, the unit's main screen will open.
Note: changing Ethernet settings is only possible via USB control, see section 3.1.8 for details.
3.2.4 Telnet or HTTP commands can also be used to control the power sensor
without using the GUI. Just type in the command in the address field of your Internet
browser, implement a Get/Post HTTP function in your selected application (for HTTP) or
establish a Telnet connection (for Telnet). A full list of the commands available and their
syntax is available in the PWR models programming handbook.
Note: Depending on the browser used and your network configuration you may need to
disable the proxy server for your computer, or add the smart power meter's IP address to the list
of addresses in the proxy server.
Page 23

Page 23 of 43
AN-48-003 Rev.: G (April 12, 2018) M167331 (R93281) File : AN-48-003(G).doc
This document and its contents are the property of Mini-Circuits
3.3 Main Screen
The main screen provides a simple and easy-to-use interface for measuring RF power
with the PWR power sensor (See Fig 3.3).
3.3.1 Left Side of Screen (Fig. 3.3)
Format
Select dBm or Watts format to display the data in.
Averaging
Check the averaging box and enter the number of measurements you wish to average.
Individual measurements will be taken at the specified measurement speed (see section
3.3.2). When selected the power sensor will average the power reading over the number of
measurements specified in Avg. Count and display the number of measurements averaged.
Clicking on the button to the left of the av erag e cou nt w indow will clear the averaged values
and reset the count.
Offset Val.
This feature allows the user to compensate for Loss or Gain in their DUT setup. A positive
value compensates for a Loss, and a negative value for a Gain. Click on the check box, and
enter the appropriate value (in dB) in the window below.
Offset File
Check to get offset values from a saved file. Primarily used for advanced Measurement
Applications, see section 3.6 for details.
Display Graph Check to activate real-time graph, see section 3.4 for details.
Figure 3.3: PWR Main Screen
Page 24

Page 24 of 43
AN-48-003 Rev.: G (April 12, 2018) M167331 (R93281) File : AN-48-003(G).doc
This document and its contents are the property of Mini-Circuits
3.3.2 Top Center of Screen (Fig. 3.3)
Device Temp.
Displays the power sensor’s internal temperature. Click on the drop box to select Celsius or
Fahrenheit display format. The PWR smart power sensors compensate automatically for
any temperature variation in the 0-50°C (32-122°F) range.
Freq
Displays the power sensor’s specified frequency range and allows the user to enter the
expected input frequency. For best performance, enter the approximate signal frequency
you wish to test.
Meas. Speed
(Not available for peak power sensor models, see section 0) Check the mode in which you
wish to operate. “Low Noise” – 100ms typ, “Faster” – 30 ms typ, or (for PWR-8FS only)
“Fastest” – 10ms typ.
Connection
status
Displays the status of connection to the power sensor: “Reading” – good connection,
“Searching” - attempting to reestablish connection, “Not connected” – Power sensor not
found.
3.3.3 Bottom Center of Screen (Fig. 3.3)
Relative
Check to save your current reading as a baseline value. From then until unchecked,
measurements will show how DUT power varies from that baseline. In dBm format, relative
results are given in dBc and in Watt format in %.
Rel. Table
Opens Relative Frequency points Table. When table is filled entries in the table will
supersede current reading for relative measurements. See section 3.5 for details.
Model
Displays model name of power sensor currently connected.
Serial Number
Displays serial number of power sensor currently connected.
(fw)
(Not available in all models) opens the Firmware info window to allow upgrading the
firmware of the connected sensor. See section 3.8 for details and supported models.
3.3.4 Right Side of Screen (Fig. 3.3)
Add Sensor
Click to work with more than one sensor from the same computer. For more details, see
section 3.10, “Multi-Sensor Setups”.
Reset
Connection
Click to return to initial control selection screen to reconnect a power sensor to your
computer after it was disconnected, change control method or when replacing one sensor
with another.
Record Opens the data record window, for details see section 3.7.
Measurement
Applications
Open advanced measurement applications window. See Measurement Applications Guide
for details.
Compact View
Reduce size of window. This option is usually employed for multi-sensor setups. See
section 3.9 for det ai ls.
Always on Top
Click to keep your power sensor screens on top of other applications.
Ethernet-Config
(Not available in all models) Only in USB control opens the Ethernet configuration window
to change the current configuration. See section 3.1.8 for details.
Page 25

Page 25 of 43
AN-48-003 Rev.: G (April 12, 2018) M167331 (R93281) File : AN-48-003(G).doc
This document and its contents are the property of Mini-Circuits
3.3.5 Peak power specific functions (Fig. 3.3.5)
Measured
Power display
Displays the Average power measured over the sample period, similar to the CW power
sensors, and below that the peak power. Note: if sample period is not suitable for the signal
or zoom track does not lock on pulse power display will not be correct.
Pulse profile
Opens pulse profiling windows to display the pulsed signal and calculated pulse parameters.
See Chapter 3 for details.
Peak PS config
Changes central section of screen to Peak Power Sensor configuration screen to allow
setting sample time and trigger mode. See section 0 for details.
Figure 3.3.5: Peak Power Sensor Ma in Scr een
Page 26

Page 26 of 43
AN-48-003 Rev.: G (April 12, 2018) M167331 (R93281) File : AN-48-003(G).doc
This document and its contents are the property of Mini-Circuits
3.4 Real-Time Graph
Checking the 'Display Graph' box in the lower left corner of the main screen will cause a graph
window (Fig. 3.4) showing power over time to appear below the main screen.
Figure 3.4: Real-Time graph
3.4.1 Real-Time graph indicators and functions (Fig. 3.4)
#
Name
Description
1
Auto Scale
Set Y-axis automatically to best display current data.
2
Manual Scale
Opens a small window to allow setting the Max value and value per div. of
the Y-axis. The values shown will be in the same units as those spec ified in
the Main screen format field. Clicking on the button a second time will close
the Manual Scale window.
3
Scale Current value per division of Y-axis
4
Min/Max values
Minimum and Maximum values currently displayed in graph
5
Current reading Current time and power reading
6
Max scale Max value of Y-axis
7
Min scale
Min value of Y-axis
8
Time Start time of currently displayed graph
9
Start Time Time at which real-time graph was started
10
Arrows
Use arrows to scroll back and forth in graph.
1
2
3
4
5
6
7
8
9
10
Page 27

Page 27 of 43
AN-48-003 Rev.: G (April 12, 2018) M167331 (R93281) File : AN-48-003(G).doc
This document and its contents are the property of Mini-Circuits
3.5 Relative Frequency Points Table
3.5.1 Checking the ‘Rel. Table’ check box will open the relative frequency points
table shown in Fig 3.5.1. This table allows specifying multiple points for relative
measurements. To add a point to the table enter the relevant frequency and click on ‘Add
Relative Point’ – the current power reading will be added to the table.
Figure 3.5.1: Relative Frequency Points Table
3.5.2 To delete a point click on the row you wish to delete to select it, then press the
‘Delete’ key. To delete all values from the table click on the ‘Clear Table’ button.
3.5.3 Once you’re satisfied with the entries close the table, the main screen will now
show ‘TABLE’ in relative measurement field. Checking the ‘Relative’ checkbox will change all
measurements into relative measurements referenced to the values in the table. If a
frequency not listed in the table is specified for measurement the smart power meter
program will calculate the correct reference value based on interpolation of existing data
points.
Figure 3.5.3: Measurements relative to table
Page 28

Page 28 of 43
AN-48-003 Rev.: G (April 12, 2018) M167331 (R93281) File : AN-48-003(G).doc
This document and its contents are the property of Mini-Circuits
3.6 Creating and using Offset Fil e s
3.6.1 An offset file is useful for compensating for loss/gain in the system which are
not constant over frequency. For example if you need to compensate for the loss of a
transmission line between the power sensor and the D.U.T. Measurement Applications #10,
Calibrating Thru-Path described in chapter 13 of the
Measurement Applications Guide allows
you to measure the gain/loss of the system between the power sensor and the D.U.T and
automatically creates an offset file for that system.
3.6.2 Clicking on the folder icon below the 'Offset File' check box will open a
browse window. If you have an offset file ready, select it and click OK.
3.6.3 To create an offset file manually click on the edit icon over the file name
window and a sample offset file will be created(Fig. 3.6.3). Replace the values in the sample
file with the values you need and save the file. There is no requirement for any specific file
name or suffix, however as the file is a simple text file saving it with a txt suffix to simplify
future editing is recommended.
Figure 3.6.3: Offset file browse window
Page 29

Page 29 of 43
AN-48-003 Rev.: G (April 12, 2018) M167331 (R93281) File : AN-48-003(G).doc
This document and its contents are the property of Mini-Circuits
3.6.4 When creating an offset file observe the following rules:
• Any line containing an exclamation mark character (!)will be ignored. This is
useful for adding notes to the file, or temporarily skipping certain points in the
offset file.
• The first line in the file (other than notes) shall be "Thru-Path Offset File" (Not
case sensitive).
• There shall be at least one space character between the frequency value and the
loss/gain value and only a single pair of values in a line (Separator character
between pairs is line feed carriage return).
• Values will be sorted by frequency from low to high
• All frequencies will be in MHz and Loss/Gain values in dB
Note: When reading frequencies between two sets of values the PWR sensor software will use
linear interpolation to calculate the required offset. When reading a frequency outside the range
covered by the offset file the closest value will be used. Thus when using the example shown in
Figure
3.6.3 the offset value for 5750 MHz will be -4.45 dB and for all frequencies 6000 MHz or
greater will be -4.5 dB.
3.6.5 When the 'Offset File' option is checked an "Offset value: Cal file" notice
will appear and the value calculated from the offset file for the frequency tested will be
subtracted from the reading. If needed an additional fixed offset can be added by also
checking the 'Offset Value' check box.
Note: Values in the offset file are subtracted, while values in offset value are added.
Figure 3.6.5: Offset file browse window
Page 30

Page 30 of 43
AN-48-003 Rev.: G (April 12, 2018) M167331 (R93281) File : AN-48-003(G).doc
This document and its contents are the property of Mini-Circuits
3.7 Data Record Window
Get started by clicking the Record button on the right side of the Main Screen. The Power Meter
Recording Screen will open, with the serial number of the sensor being recorded at the top:
3.7.1 Left side of Screen (Fig. 3.7)
Start Record at: Specify date and time at which to start recording, for scheduled tests.
Stop Record at:
Specify date and time at which to stop recording, for scheduled tests.
Record Interval
Specify the interval at which data points will be recorded, from every 10ms, to 9999 hours.
Make sure the measurement speed is less than the record interval.
Test Spec
If you enter specification limits in these fields data points which exceed these limits (either
above or below) will be marked in the data by an asterisk (*).
Select File
Enter the path and file name where you wish to record data, there is no required file name.
See section 3.7.4 for data format.
3.7.2 Right side of Screen (Fig. 3.7)
Record
According to
Schedule
Close record window, saving current settings and schedule. Data recording will start
according to the schedule specified.
Start Recording
Now
Close record window, saving current settings. Data recording will start immediately
Browse
Open a browse window to select an existing file, or navigate to the desired path.
View Graph
Open a graphical presentation of the data stored in the selected file.
Open Data File
Open the data file selected (read only presentation).
Create Excel
File
Export data in selected file to Excel file and open the new Excel file (requires Microsoft
Excel to be installed on the local PC)
Figure 3.7: Data Record Window
Page 31

Page 31 of 43
AN-48-003 Rev.: G (April 12, 2018) M167331 (R93281) File : AN-48-003(G).doc
This document and its contents are the property of Mini-Circuits
3.7.3 View Graph
Clicking on the 'View Graph' button in the data record window (Fig 3.6) will open a graphical
presentation of the recorded data (Fig 3.6.3). Default presentation is of power only, using the
same units as the data was recorded in, but user can select to present both power and
temperature by checking 'Show temperature graph' or change the power units by clicking on
the arrow next to the graph title.
Figure 3.7.3: View Graph Window
3.7.4 Open Data File
Data recorded is saved to a text file in the format shown in Fig. 3.7.4
Figure 3.7.4: Data File Window
Page 32

Page 32 of 43
AN-48-003 Rev.: G (April 12, 2018) M167331 (R93281) File : AN-48-003(G).doc
This document and its contents are the property of Mini-Circuits
3.7.5 Create Excel File
When exporting data to an excel file Data will initially be in format shown in Fig 3.6.5
Figure 3.7.5: Excel data Window
Page 33

Page 33 of 43
AN-48-003 Rev.: G (April 12, 2018) M167331 (R93281) File : AN-48-003(G).doc
This document and its contents are the property of Mini-Circuits
3.8 Firmware Update (Supporte d m ode ls only)
3.8.1 All power sensors are shipped with the latest available firmware and an
update is usually not required. Mini-Circuits occasionally makes firmware update files
available as a courtesy to add additional features or correct known issues. Please contact
testsolutions@minicircuits.com for details.
3.8.2 Models supporting firmware upgrade:
PWR-8GHS-RC
PWR-6RMS-RC
PWR-6LRMS-RC
PWR-6LGHS
PWR-8P-RC
3.8.3 The smart RF Power Meter GUI must be started in USB control (See
section 3.1) to allow Firmware upgrade. When in USB control, you will note an (fw) indicator
over the serial number field in the Power sensor’s main screen.
A power interruption, to either the computer or the power sensor while the firmware is
being updated may cause the firmware to be corrupted. It is therefore recommended to
only update the firmware while the computer is connecte d to an Uninterruptible Power
Supply (UPS).
3.8.4 Click on the ‘(fw)’ indicator, this will cause the firmware - info window to open
(See Fig. 3.8.4). The ‘Firmware’ listed is the version of the firmware installed in your smart
power meter. Click on “Update Firmware” to select a new firmware version to install or click
‘Exit’ to close the firmware – info window.
Figure 3.8.4: Firmware Info rmati on Wi ndow
Figure 3.8.3: Firmware indicator on main screen
CAUTION
Page 34

Page 34 of 43
AN-48-003 Rev.: G (April 12, 2018) M167331 (R93281) File : AN-48-003(G).doc
This document and its contents are the property of Mini-Circuits
3.8.5 A browse window will open to the firmware directory under the path
you selected when installing the GUI program (See Fig. 3.8.5). Navigate to where you saved
your firmware file, select the firmware version you wish to install and click ‘O.K’.
Figure 3.8.5: Firmware - Browse Window
3.8.6 The selected file will be installed in the power sensor. The process will
take up to a minute
.
Figure 3.8.6: Firmware - Progress Bar Window
3.8.7 After the firmware has updated an alert will appear. Click ‘OK’ to shut down
the smart power meter program and then restart it normally.
Figure 3.8.7: Firmware - Successful Update
Page 35

Page 35 of 43
AN-48-003 Rev.: G (April 12, 2018) M167331 (R93281) File : AN-48-003(G).doc
This document and its contents are the property of Mini-Circuits
3.9 Compact View
3.9.1 Checking ‘Compact View’ in the bottom right corner of the main screen will
cause the screen to shrink to the compact view display.
3.9.2 Clicking on any spot in the ‘Compact Vie w’ screen will cause the
program to return to the main screen. In compact view the program displays power
measurement, measurement units, Power sensor S/N, and the frequency entered but you
must return to main screen to change any parameters.
Figure 3.9.1: Compact view window
Page 36

Page 36 of 43
AN-48-003 Rev.: G (April 12, 2018) M167331 (R93281) File : AN-48-003(G).doc
This document and its contents are the property of Mini-Circuits
3.10 Working with multiple sensors
3.10.1 Starting with multiple power sensors
When the smart power meter detects multiple power sensors on startup, the power
sensor selection window will appear. Select the sensors you wish to work with, or click
‘Select all’ for all sensors.
Figure 3.10.1: Power Sensor selection window
3.10.2 Specifying frequency and Compact view
If all the sensors you are working with are testing the same frequency you may enter the
frequency in frequency field of the power sensor selection screen, instead of individually
for each sensor. When working with many power sensors s imul tan eous ly, it is
recommended to check the compact view box before starting them so as to have all
sensors open initially in compact view and only expand them when you need to modify
the settings (See Fig 3.10.2) .
Figure 3.10.2: Multiple power sensor windows
Page 37

Page 37 of 43
AN-48-003 Rev.: G (April 12, 2018) M167331 (R93281) File : AN-48-003(G).doc
This document and its contents are the property of Mini-Circuits
3.10.3 Data recording
Clicking on the ‘Recording’ button in the bottom right corner of the screen will cause the
data recording section of the window to expand below the initial power section selection
window (See Fig 3.10.3). Recording data settings in this window will apply to all power
sensors selected. For description of data recording settings see section 3.7.
Note: File names for multiple power sensor data recording are always in the format of [path]_[model S/N].txt.
Thus if the path entered is c:\test the data for power sensor serial number 11405080006 will be saved
to file c:\test_11405080006.txt
3.10.4 Add sensor
If you have already started wor k ing with a PWR pow er s ens or and wish to start a sec ond
sensor you can click on the 'Add sensor' button in the main screen. This will open a
second startup screen, as shown in section 3.1.2, showing the additional sensors
available. If only two sensors are connected via USB when clicking on USB it will
automatically open the second sensor, without displaying the power sensor selection
screen.
Figure 3.10.3: Recording Mult ip le pow er sensors
Page 38

Page 38 of 43
AN-48-003 Rev.: G (April 12, 2018) M167331 (R93281) File : AN-48-003(G).doc
This document and its contents are the property of Mini-Circuits
4 Chapter 4 – Peak Power and Pulse profiling
This chapter explains how to use the peak and average power analysis functions of peak
power sensors such as PWR-8P-RC.
4.1 Configuring sample period & Trigger (Peak power only)
Clicking on the ‘Peak PS-Config' button in the main screen (Fig 4.1) will cause the central
section of the main screen to change to a configuration view. Default settings are sample period
of 10 msec, Free mode Trigger in and external output set as video output. Click the ‘Peak PSConfig' button to return to measurement mode.
Note: Sample period should be greater than expected cycle of RF signal.
4.1.1 Trigger Options (Fig. 4.1)
Free
No Trigger used.
Internal
Internal trigger locks on first pulse detected. Detection threshold for Internal trigger is ~5 dB
over noise floor.
External – On
Rise
Sample period will start at rising edge of trigger at Trigger Input port of sensor.
External – On
Fall
Sample period will start at falling edge of trigger at Trigger Input port of sensor.
4.1.2 Output Options (Fig. 4.1)
The Peak Power sensor’s Trigger/Video Out can be set as either a negative video output,
showing the modulating signal of the RF signal (up to 10 MHz bandwidth), or as a TTL
trigger with falling edge corresponding to the start of a pulse.
Note: Sample period should be greater than expected cycle of RF signal.
Figure 4.1: Sample Period & Trigger Config. window
Page 39

Page 39 of 43
AN-48-003 Rev.: G (April 12, 2018) M167331 (R93281) File : AN-48-003(G).doc
This document and its contents are the property of Mini-Circuits
4.2 Pulse Profile Analysis
Select the "Pulse Profile" check box on the main GUI screen to open the pulse profile analysis
screens. Three new windows will appear:
• Full pulse profile display - Captures the full sample period of the sensor
• "Zoom on pulse" display - Allows any portion of the signal to be focused on / expanded
in a second graphical display
• Calculated parameters display - Summary of the measured and calculated parameters
of the signal captured in the “zoom on pulse” display
.
Figure 4.2: Pulse Profiling Windows
Page 40

Page 40 of 43
AN-48-003 Rev.: G (April 12, 2018) M167331 (R93281) File : AN-48-003(G).doc
This document and its contents are the property of Mini-Circuits
4.2.1 Pulse profiling display options (Fig. 4.2)
The menus at the top of the pulse profile displays provide the following options:
Screenshot
Select “File” from the menu to save the graph image as a jpg file or copy to the clipboard
(either the selected graph or all open windows).
Scale
Select “Auto” to reset the y-axis (power) to display the full signal being measured, or
“Manual” to open the configuration window where the max level and dB / div settings can be
customized.
Continue / Hold
Click to toggle between continuous live measurements and hold, to freeze the display and
all measured parameters.
Colors
Select from a list of alternative color combinations for the background and signal traces.
Help
(at full trace)
Accessible on the full pulse profile display. Displays the help file with a summary of all
window functions.
Zoom Pulse
(at zoom trace)
Accessible on the “zoom on pulse” display. Select “Auto” to center the zoom on the first
identified pulse, or “Config” to manually set the zoom display parameters (see
section 4.2.4).
4.2.2 Markers for Graphs
To the right of each graph is a Markers table showing up to four markers with the time
from the start of the sample period (in µs or ms), and the power level in dBm.
• To add or delete marker s click on the Add and Del buttons at the top of each table.
• To place the marker automatically at the highest signal peak visible in the trace, double
click on the marker number.
• To manually place the marker, select the marker by clicking once on the marker number
(number will become bold indicating it was selected) and then click in the graph at the
location you wish to place the marker, or use the keyboard left and right arrow buttons
to adjust the marker location.
• Markers are placed independently in each graph.
Figure 4.2.2: Marker table
1
2
3
Page 41

Page 41 of 43
AN-48-003 Rev.: G (April 12, 2018) M167331 (R93281) File : AN-48-003(G).doc
This document and its contents are the property of Mini-Circuits
#
Name
Description
1
Add & Del
Add and delete markers. Clicking on Delete will remove the highest
numbered marker currently active.
2
Marker list
Shows list of currently active markers, with selected marker in bold. Each
marker shows the time from the start of the sample period and power level at
that point.
3
Delta & Avg
List of deltas between adjacent markers. List shows delta in time and power,
and average power over the period between the two markers.
4.2.3 Zoom Graph Configuration
The zoom display allows any portion of the pulse profile from the main display to be
focused on and analyzed more closely. The zoomed section can be configured in a
number of ways:
• When the display is first opened, the trace will center on the first pulse detected.
• Any portion of the main pulse profile display (showing the full sample capture
period) can be selected for the zoom display by right-clicking in the main display,
keeping the right mouse button depressed, and dragging a rectangle around the
relevant section. Release the right mouse button to update the zoom display
• The arrow buttons around the magnifying glass icon allow the time span and time
delay of the zoomed display to be adjusted in small increments:
o Left arrow – Decreases the time delay between the start of the full pulse
profile display and the start of the zoom display.
o Right arrow – Increases the time delay between the start of the full pulse
profile display and the start of the zoom display.
o Down arrow – Decreases the time span of the zoomed display around the
same center point.
o Up arrow – Increases the time span of the zoomed display around the
same center point.
• Select “Config” from the “Zoom Pulse” menu to manually set the time delay and
time span parameters. See Figure 4.2.4 for details.
• To re-center the zoom display automatically select “Auto” from the “Zoom Pulse”
menu or click on the magnifying glass icon.
4.2.4 Zoom on Pulse config window
Figure 4.2.4: Zoom on pulse parameters
Set increment value in µs
for Left/Right arrow icons
Set increment value in µs
for Up/Down arrow icons
Set start of zoom span in
µs
Set width of zoom span in
µs (2500 Max)
Page 42

Page 42 of 43
AN-48-003 Rev.: G (April 12, 2018) M167331 (R93281) File : AN-48-003(G).doc
This document and its contents are the property of Mini-Circuits
4.2.5 Calculated parameters
The calculated parameters table provides measured and calculated details of the pulse
signal captured in the “zoom on pulse” display. To ensure accurate analysis, the “zoom
on pulse” display should be configured to capture one complete pulse period. For
extreme duty cycles (as specified in the datasheet) it may be necessary to adjust the
zoom configuration manually, or use an external trigger.
Pulse width
Time from 50% of the pulse rising edge to 50% of the pulse falling edge, calculated in µs.
Pulse Period
Time from 50% of the first pulse rising edge, to 50% of the next pulse rising edge,
calculated in µs.
Duty Cycle
Ratio of the pulse width from the pulse period, calculated as a percentage.
Rise Time
Time taken for the pulse rising edge to reach 90% of its final value, from 10% of its final
value, calculated in µs.
Fall time
Time taken for the pulse falling edge to reach 10% of its initial value, from 90% of its initial
value, calculated in µs.
Pulse Power
Average power of the pulse, measured in dBm. This is an indication of the steady peak
power level, averaging out any initial overshoot on the pulse rising edge.
Average Power
Average power for the complete sample period of the “zoom on pulse” display, measured in
dBm.
Crest Power
Ratio of the pulse power to average pow er of the signal (Pulse Power - Average Power), in
dB.
Overshoot
Ratio of the peak power to pulse power of the signa l (Peak Pow er - Pu lse Power ), in dB
Figure 4.2.5: Calculated parameters
Page 43

Page 43 of 43
AN-48-003 Rev.: G (April 12, 2018) M167331 (R93281) File : AN-48-003(G).doc
This document and its contents are the property of Mini-Circuits
1 Chapter 5 – Revision History
Nov 10, 2014: Created user guide Rev OR.
Dec 12, 2014: Updated legal disclaimer. Rev A.
Jun 18, 2015: Updated legal disclaimer. Rev B.
Aug 16, 2015: Added instructions to create offset file manually. Rev C.
Dec 22, 2015: Added PWR-6RMS-RC model, updated firmware upgrade instruction. Rev D.
May 30, 2016: Added PWR-6LRMS-RC & PWR-6LGHS models, rotated model selection guide and
removed unneeded columns. Removed references to only PWR-xxx–RC models
supporting firmware upgrade. Updated cover page.
Jan 30, 2018: Added PWR-8P-RC model, and general Peak & Average power sensor functions. Rev
F.
Apr 12, 2018: Fixed errors in table of contents. Rev G.
 Loading...