


Mimosa Help Site
Mimosa Networks Help Site Overview
Accessing the Graphical User Interface
Accessing the graphical user interface (GUI) requires that the radio first be connected to power. The Power over
Ethernet (PoE) connection process describes the steps to do this. Note that the GUI will be available approximately
one minute after applying power.
The GUI can be accessed in two ways to facilitate set-up and management.
Through the local Ethernet interface (LAN)1.
Remotely through the 5 GHz wireless link2.
Via Ethernet interface or in-band over the 5 GHz Wireless link
By default, the device IP address is 192.168.1.20 and can be accessed via the Ethernet port using this IP address in
any standard Web browser. To access the device via a locally connected computer initially (on the same LAN or
directly to the Ethernet port), the computer’s IP address must be on the same subnet as the above address. Once
you have modified the IP address (static or DHCP) of the device for remote management purposes (in-band over
wireless or over the Ethernet interface), the new specified IP address must be used to access the device. This is
important to do in order to avoid IP address conflicts with other devices on the network. Current IP addresses of
different Mimosa devices on the network can be identified using the Mimosa Device Discovery tool. The default
password for the device is "mimosa". It is highly recommended to change the default password to a unique and
secured password.
Copyright © 2015 Mimosa Page 1
Mimosa Help Site
Mimosa Networks Help Site Overview
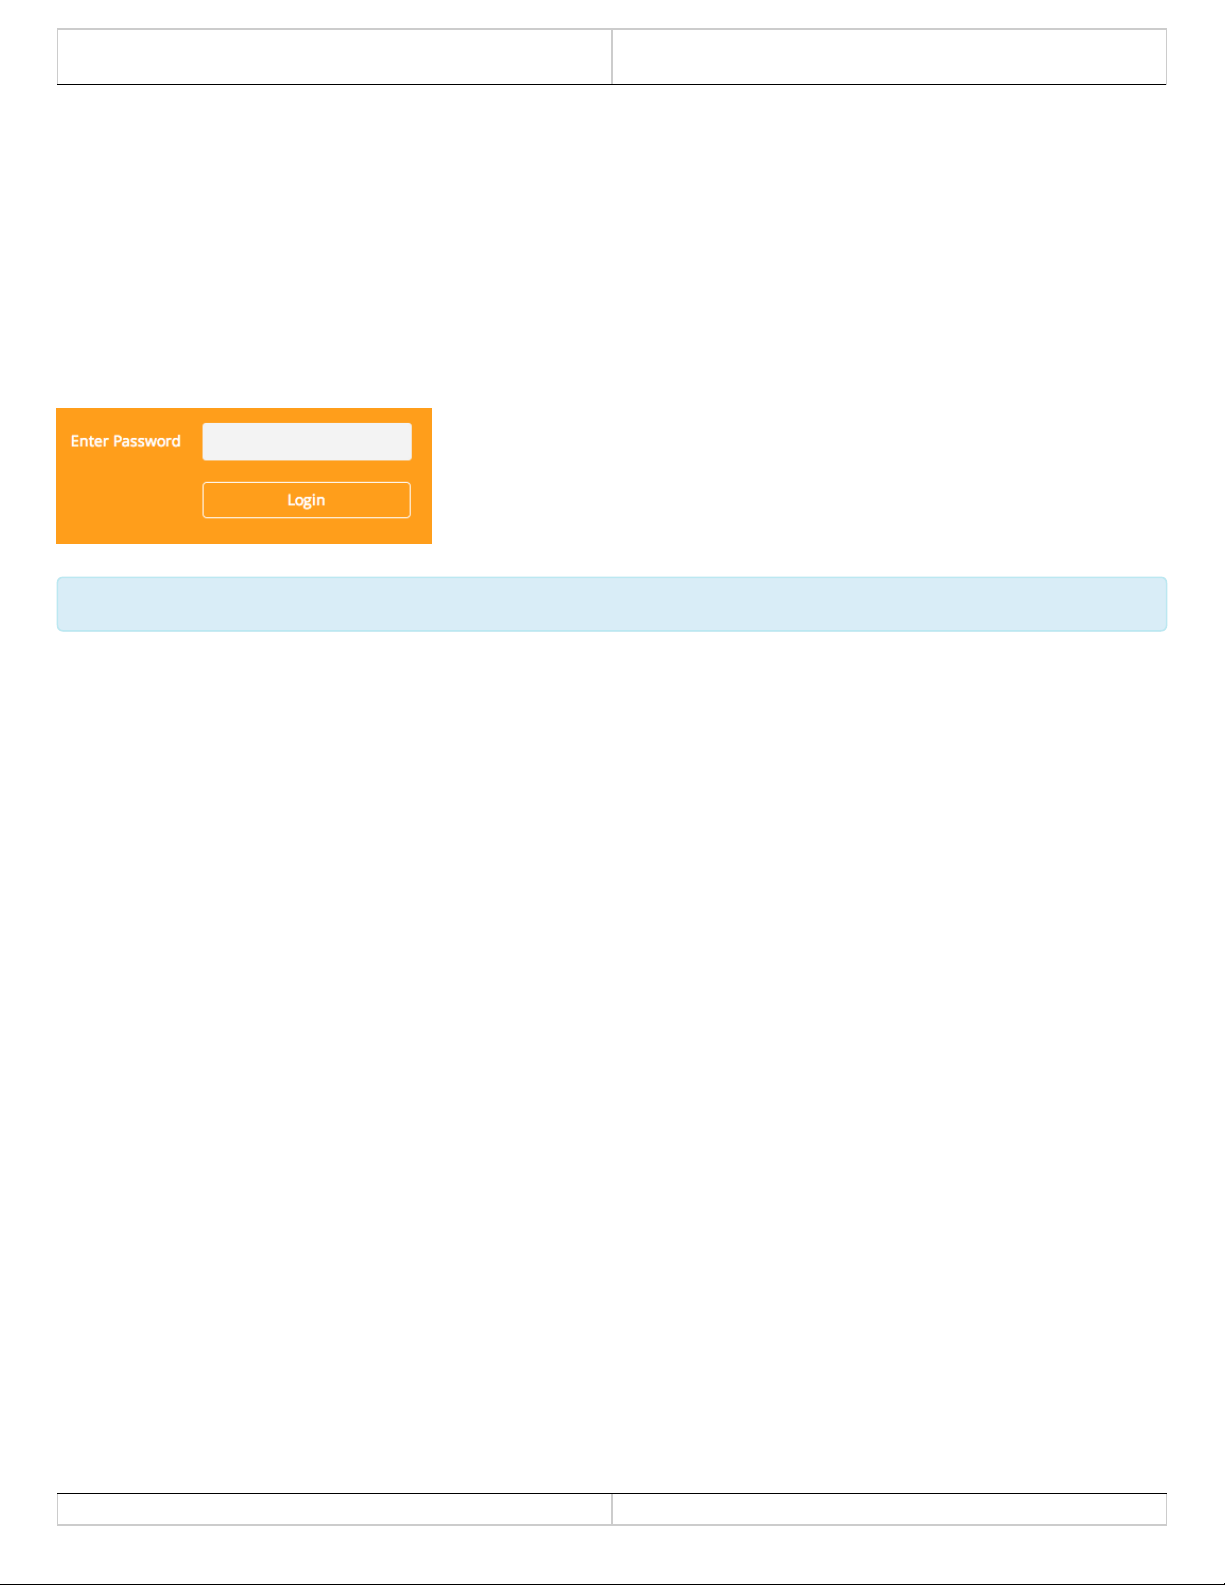
Logging In
After connecting via one of the three access methods, the GUI will prompt you to log-in with a password. The
default password is "mimosa", and should be changed immediately after login to protect your network since it gives
the user read / write priveleges. The password can be changed within the Preferences > General > Set Password
panel of the GUI.
If you are looking for the Mimosa Cloud Log In process, please see Manage User Guide: Logging In.
If you are looking for the Mimosa Cloud Log In process, please see Manage User Guide: Logging In.
Copyright © 2015 Mimosa Page 1
Mimosa Help Site
Mimosa Networks Help Site Overview
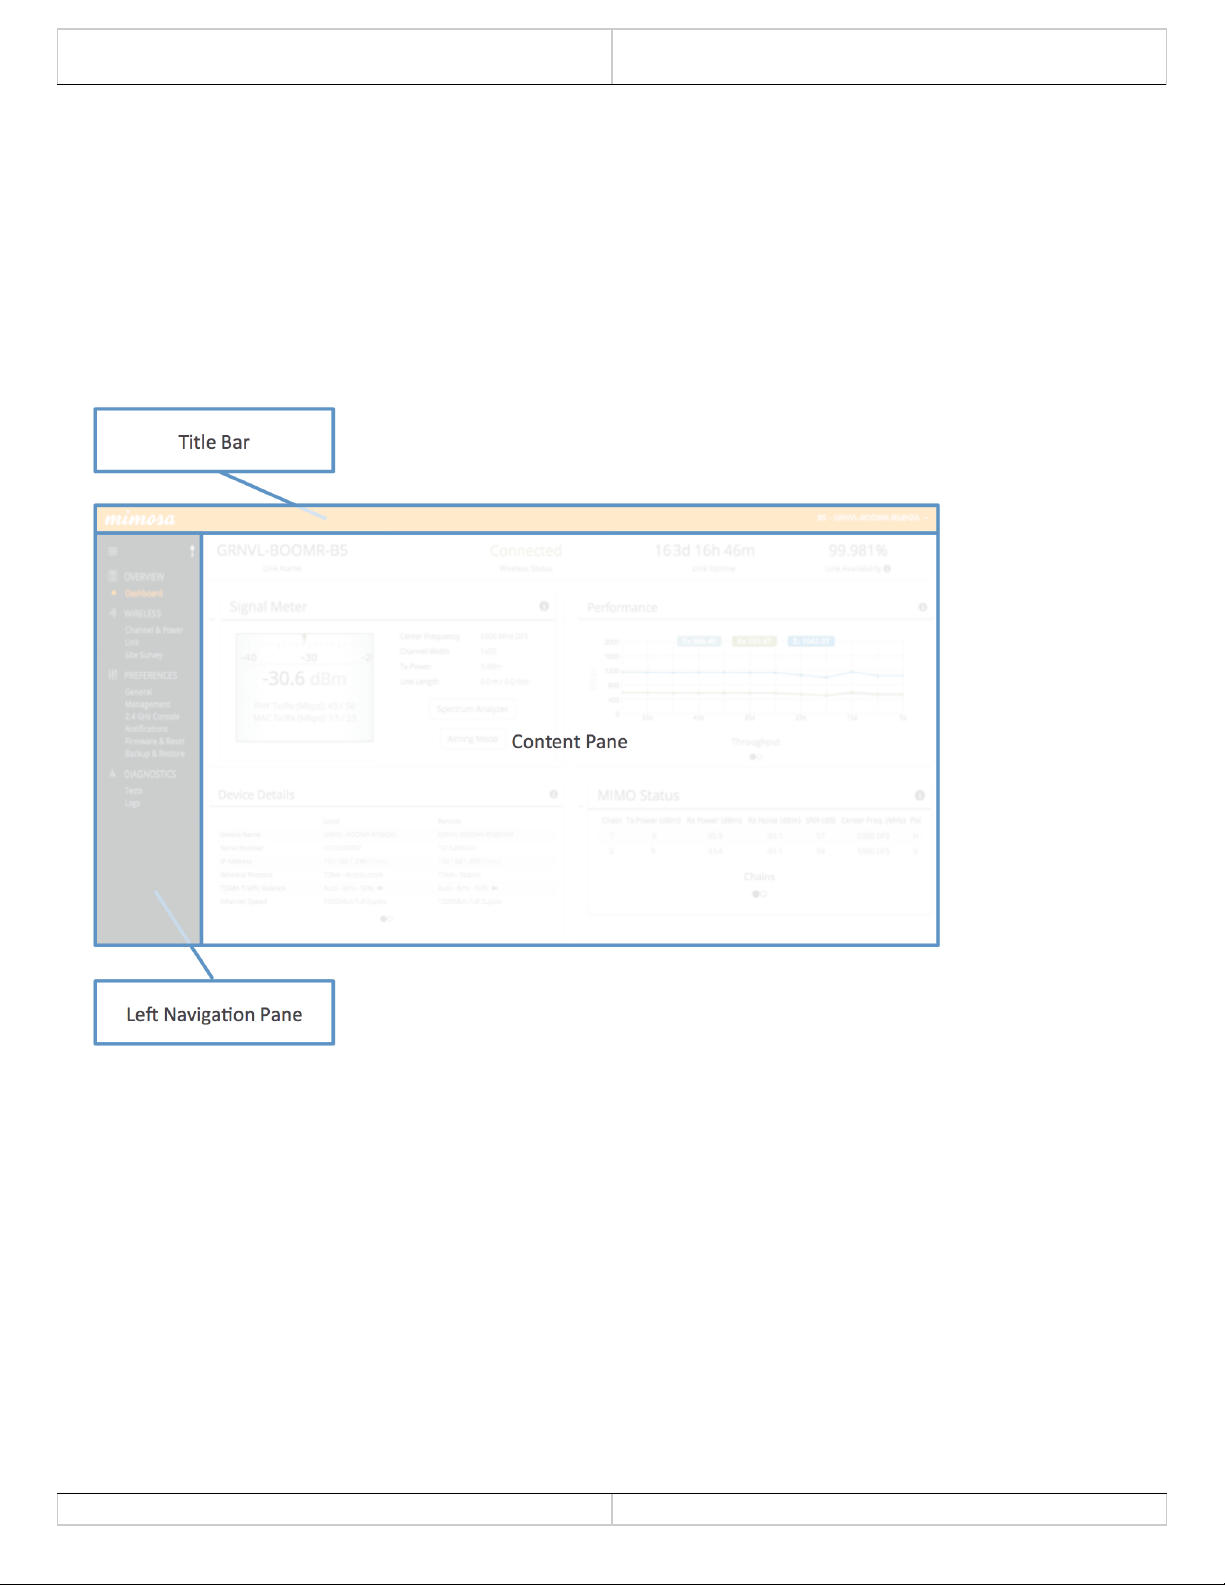
User Interface Overview
When you first log in, you’ll notice that there is a title bar with the device name shown in the top-right corner, a
navigation pane on the left, and a large content pane on the right. The default page shown in the content pane is
the Dashboard, which shows a summary of overall performance at a glance, and highlights both radio and link
parameters that affect link health.
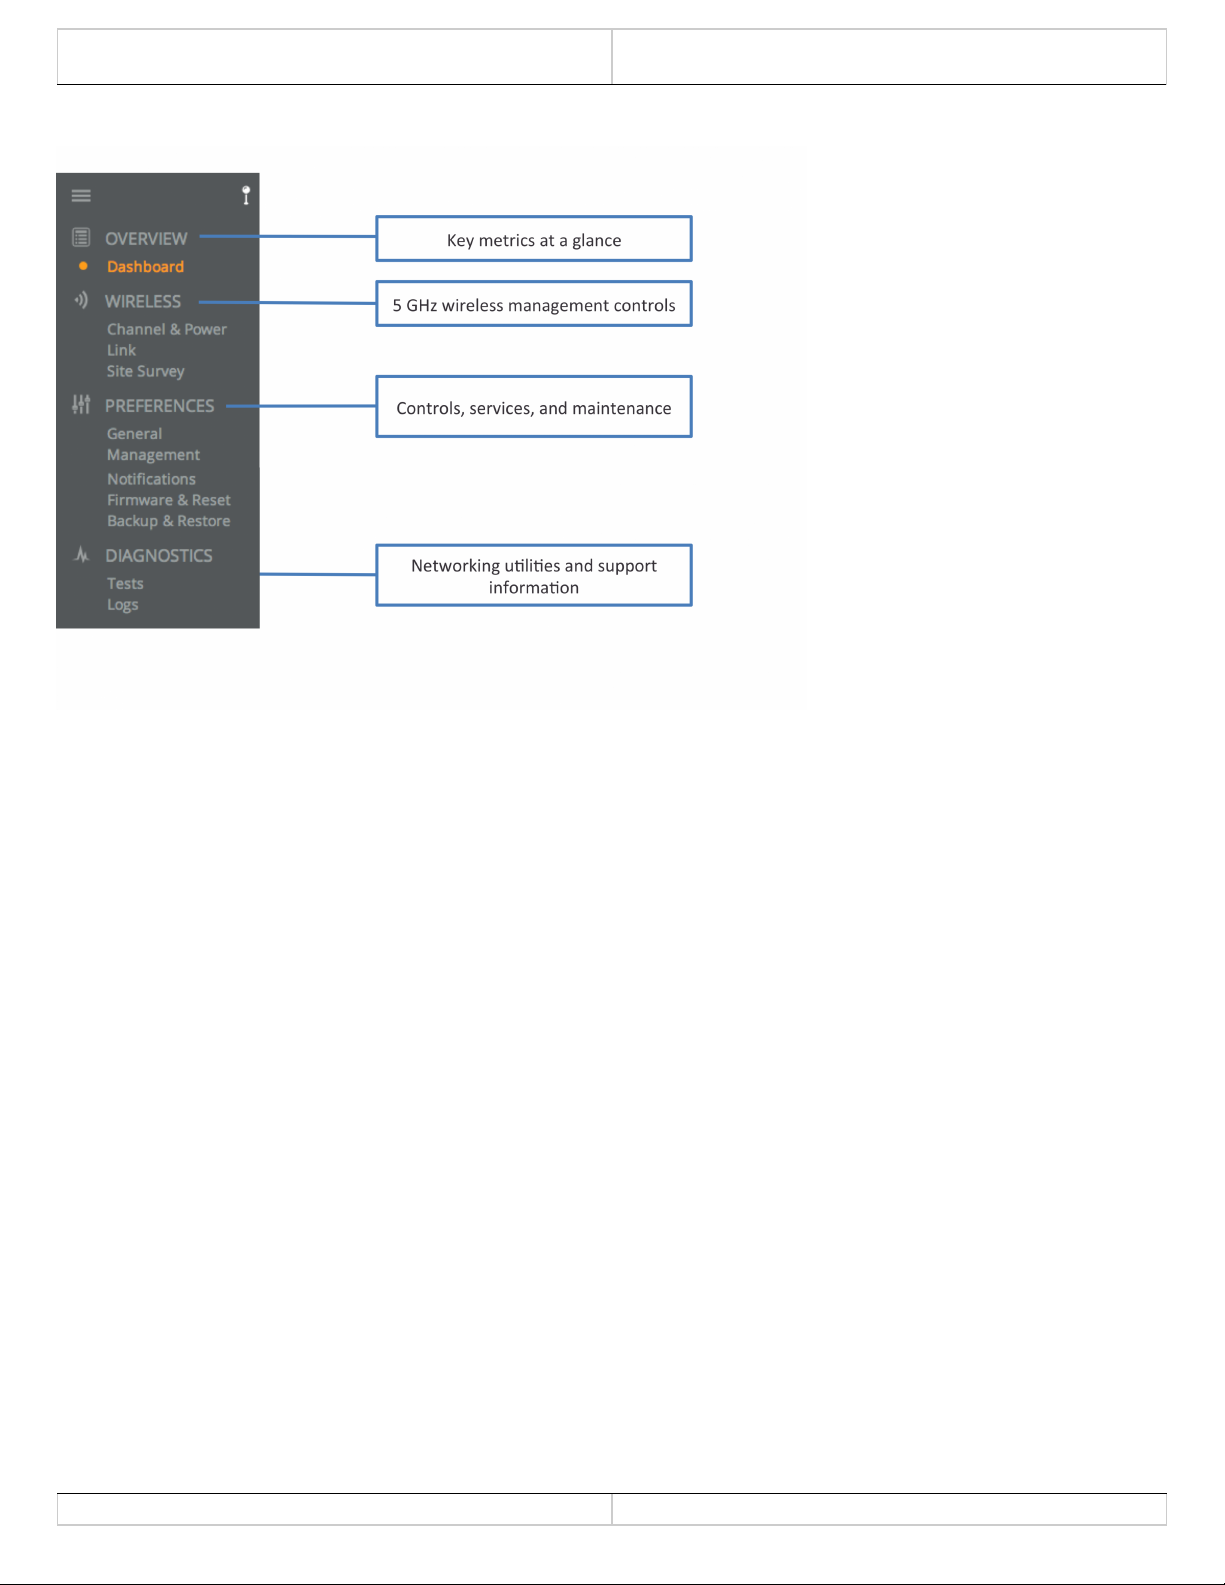
On the left navigation pane, there are four prominent sections: Overview, Wireless, Preferences, and Diagnostics.
Each of these sections contains one or more links to pages containing task-related data, controls, and tools used to
administer the radio…and you can return the Dashboard at any time by clicking on the Dashboard link in the
Overview section.
The pin in the top corner of the left navigation pane allows you to "pin" open the navigation menu for easier access.
Else, the menu contracts to provide more workspace within the GUI.
Copyright © 2015 Mimosa Page 1
Mimosa Help Site
Mimosa Networks Help Site Overview
Copyright © 2015 Mimosa Page 2
Mimosa Help Site
Mimosa Networks Help Site Dashboard
The Dashboard
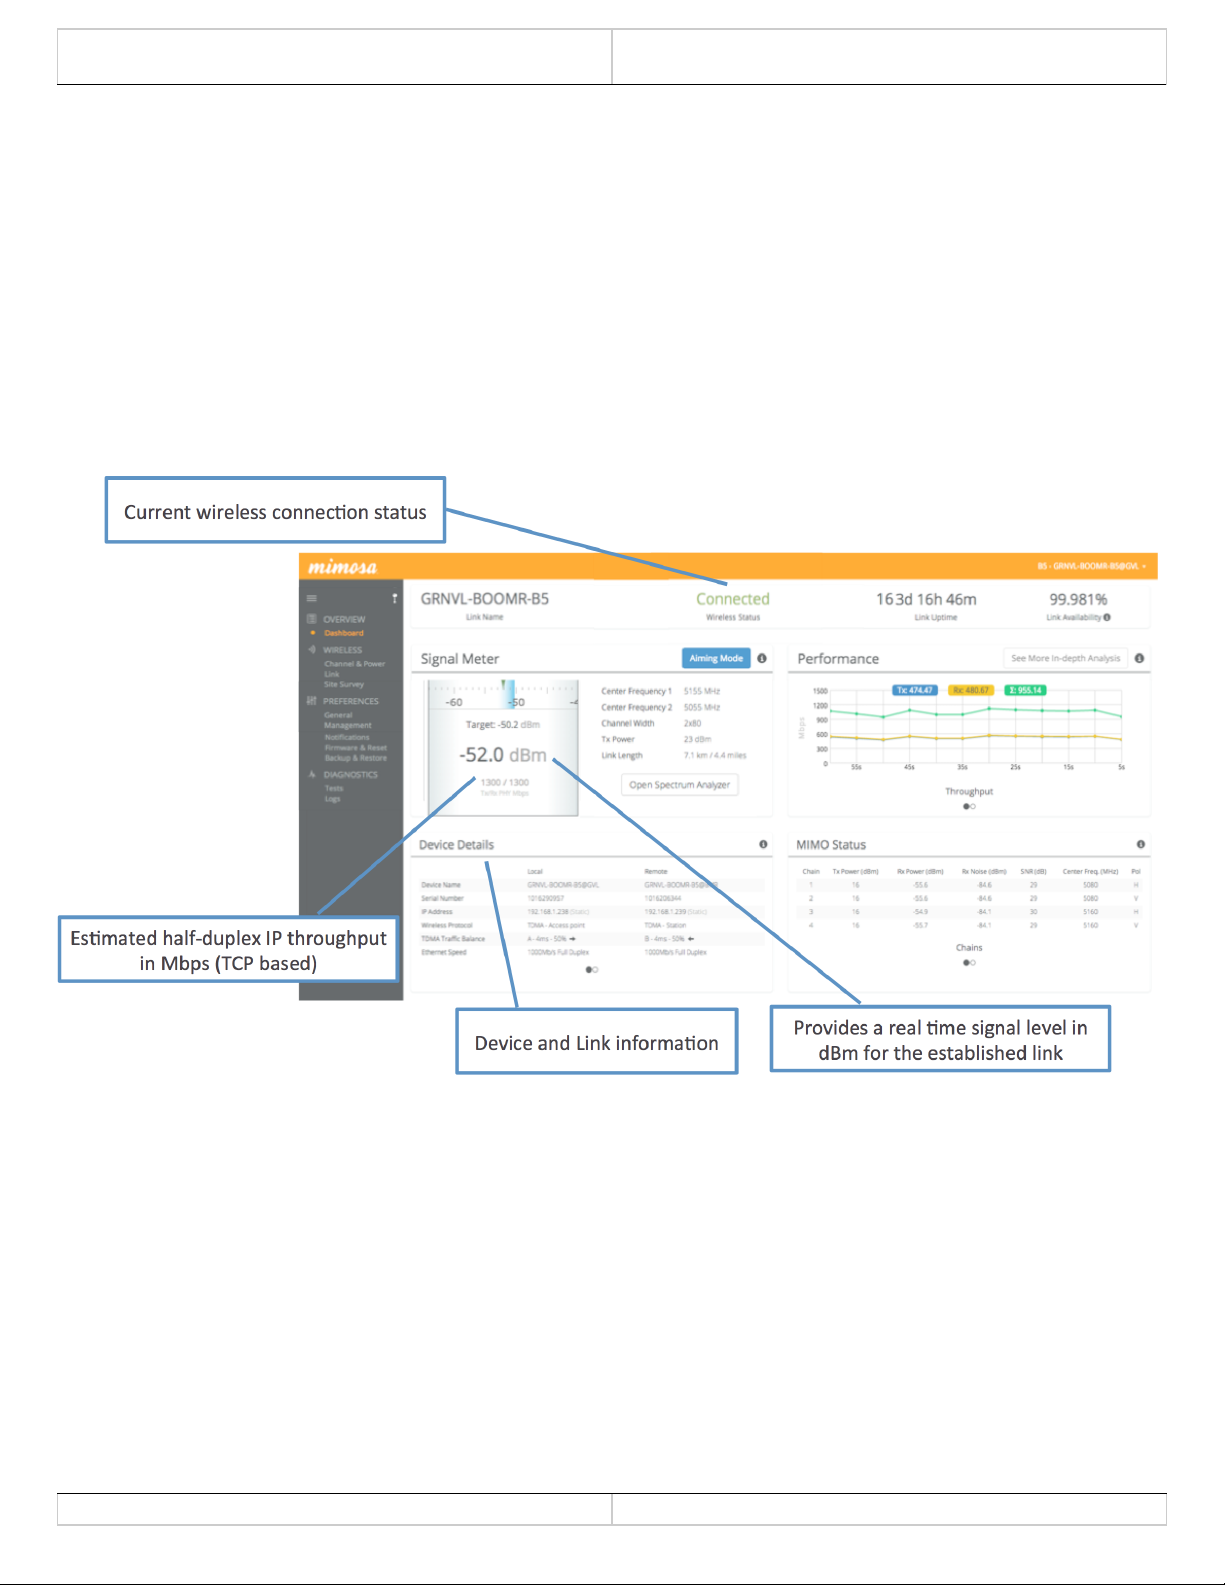
The Dashboard contains several panels used to group related items. The status panel at the top of the page shows
the link SSID, the 5 GHz link status, GPS signal quality, Link Uptime, and Link Availability since the last reboot. Two
of the values on this panel contain an information icon that shows more information when you click or hover over it
with your mouse cursor. On other panels, detailed help text can be found by clicking on the information icon in the
upper right hand corner.
Copyright © 2015 Mimosa Page 1
Mimosa Help Site
Mimosa Networks Help Site Dashboard
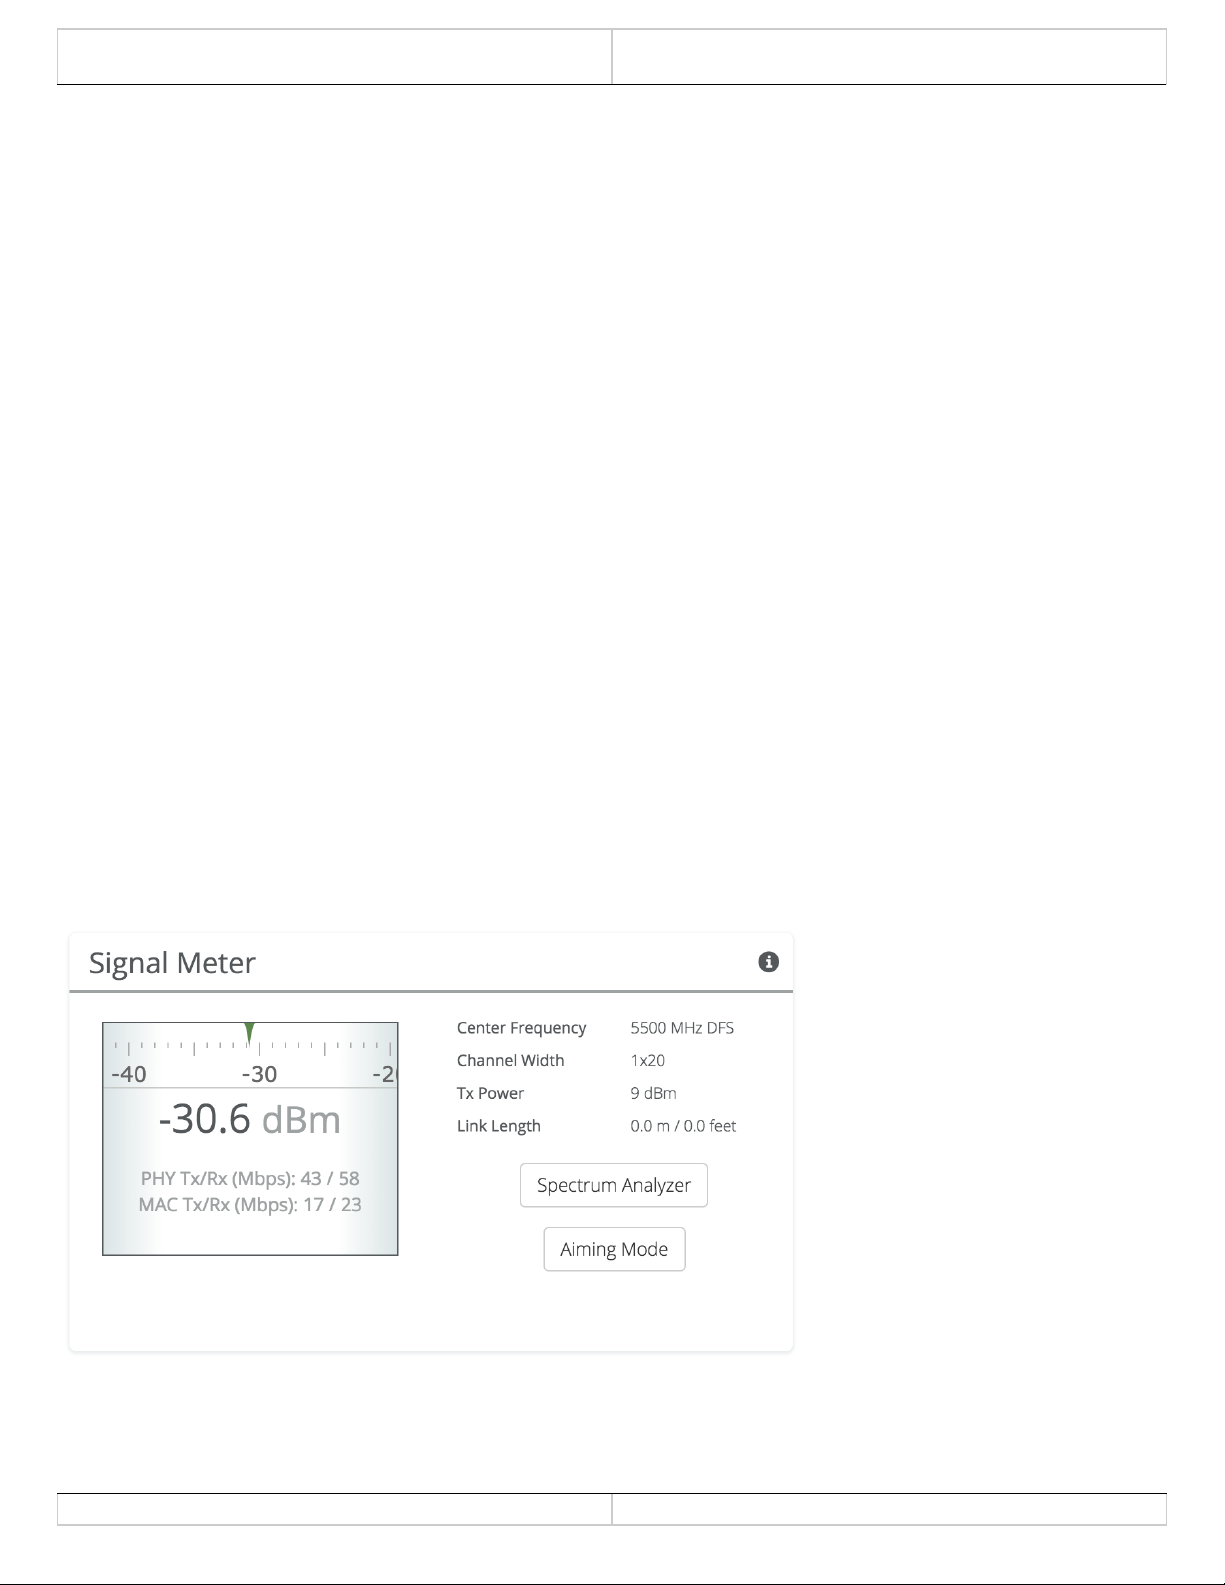
Reading the Signal Meter
Connected Link
Received signal strength is shown in large text in the center of the control, and as a green indicator in the top dial.
The blue shaded bar and text immediately below the dial represent target signal strength based on distance and
other information exchanged between radios. The objective is to align the green indicator with the blue bar as a
guideline during antenna aiming.
The resulting half-duplex PHY rates shown at the bottom of the Signal Meter control are correlated with the MCS,
and represent raw data across the link without protocol overhead. The Max Throughput values include TDMA
window size and MAC layer efficiency.
The following settings and values that affect link health are listed for reference:
●
Center Frequency: True center of the frequency range (no offset).
●
Channel Width: The width of the channel (20, 40 or 80 MHz).
●
Tx Power: Total transmit power level (dBm).
●
Link Length: Distance between local and remote radios (when connected).
Click the Spectrum Analyzer button to access the Spectrum Analyzer, which can also be found on the Channel &
Power page. This will not disturb the link.
When a link is not associated, the signal strength and PHY rates are replaced by an indicator of "Disconnected".
Aiming Mode
Once associated, the Aiming Mode button is shown. Aiming Mode opens a new window that refreshes once per
Copyright © 2015 Mimosa Page 1

Mimosa Help Site
Mimosa Networks Help Site Dashboard
second for a 5-minute period. The Aim Heading indicates the direction in which the front of the device should be
pointed based exchange of coordinates.
U-NII-1 Elevation Requirements
When mounting the Mimosa C5-Client radio, in accordance with the UNII-1 band requirements, neither dish
should exceed 30 degrees in elevation.
Copyright © 2015 Mimosa Page 2
Mimosa Help Site
Mimosa Networks Help Site Dashboard
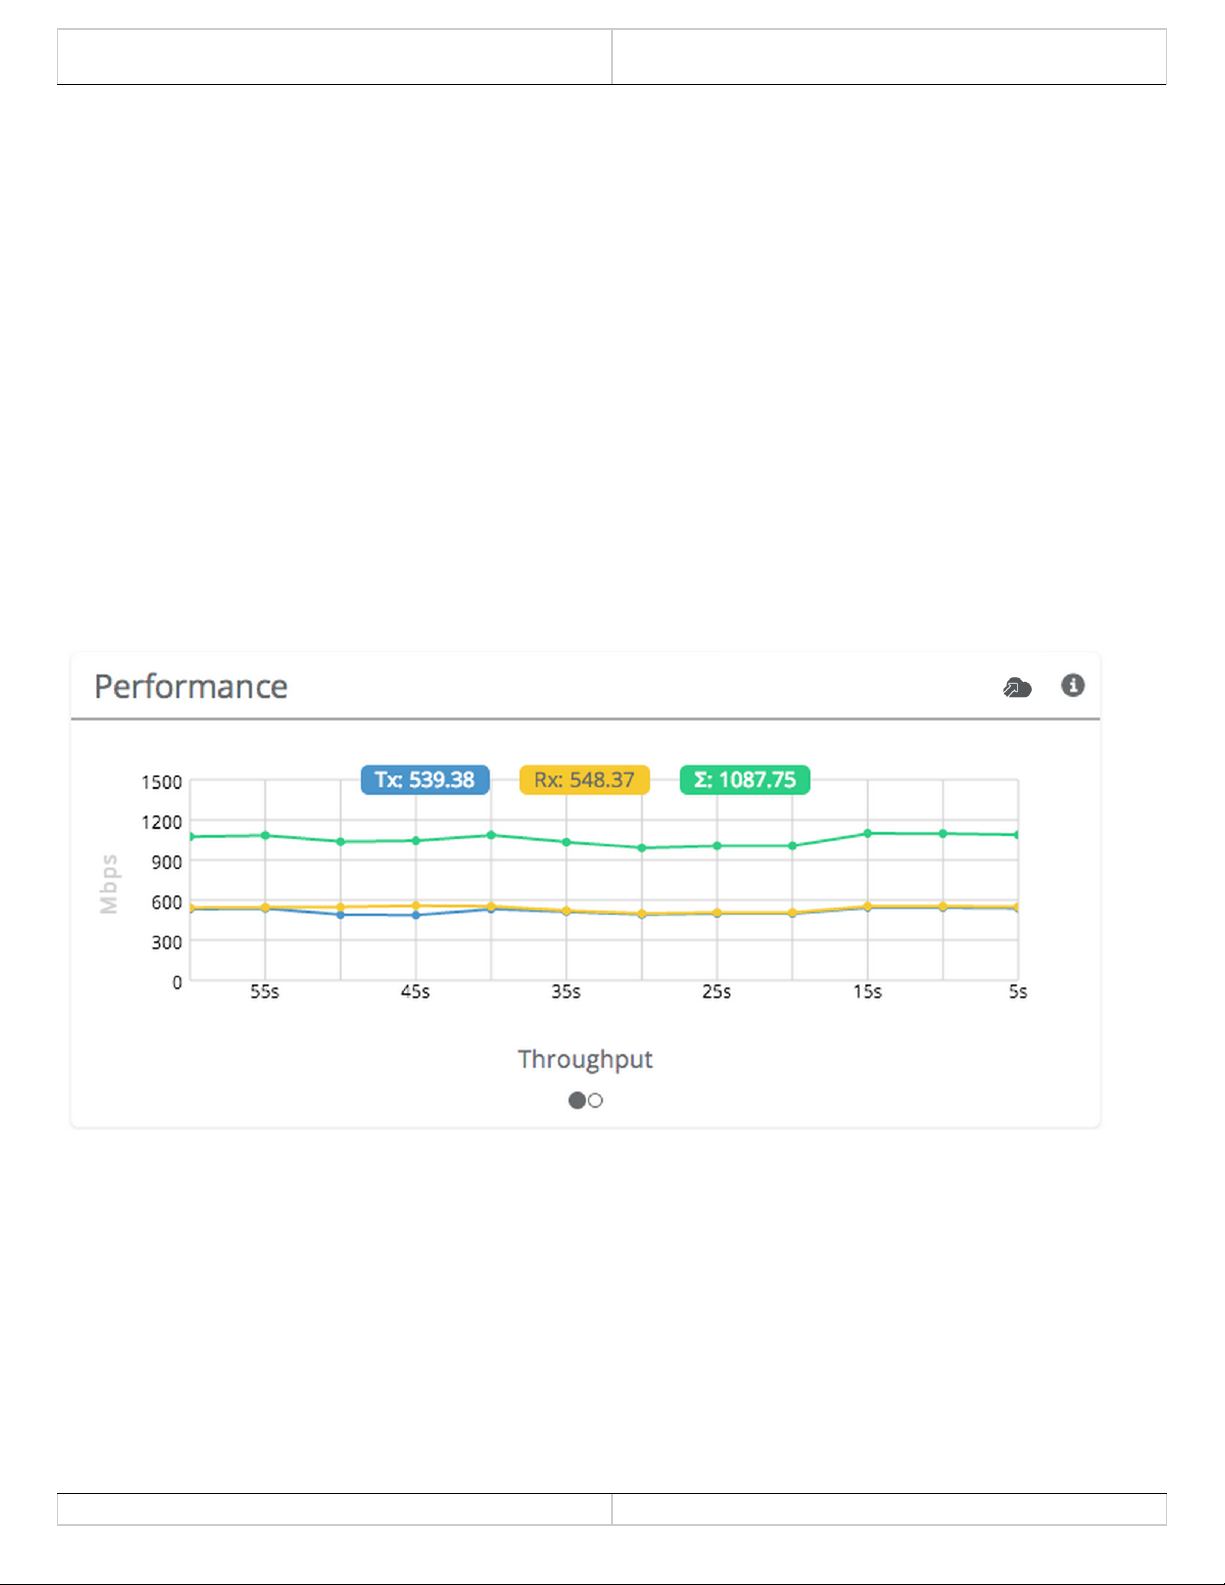
Reading the Performance Table
IP Throughput and Packet Error Rate are charted over 60 seconds in 5-second intervals. The newest data shows up
on the right and scrolls to the left over time.
The IP Throughput graph plots three lines representing transmit, receive, and aggregate (summed) throughputs at
the datagram (or packet) layer excluding any protocol or encapsulation overhead. The results here may differ from
those measured using speed test tools, due to protocol overhead and encapsulation.
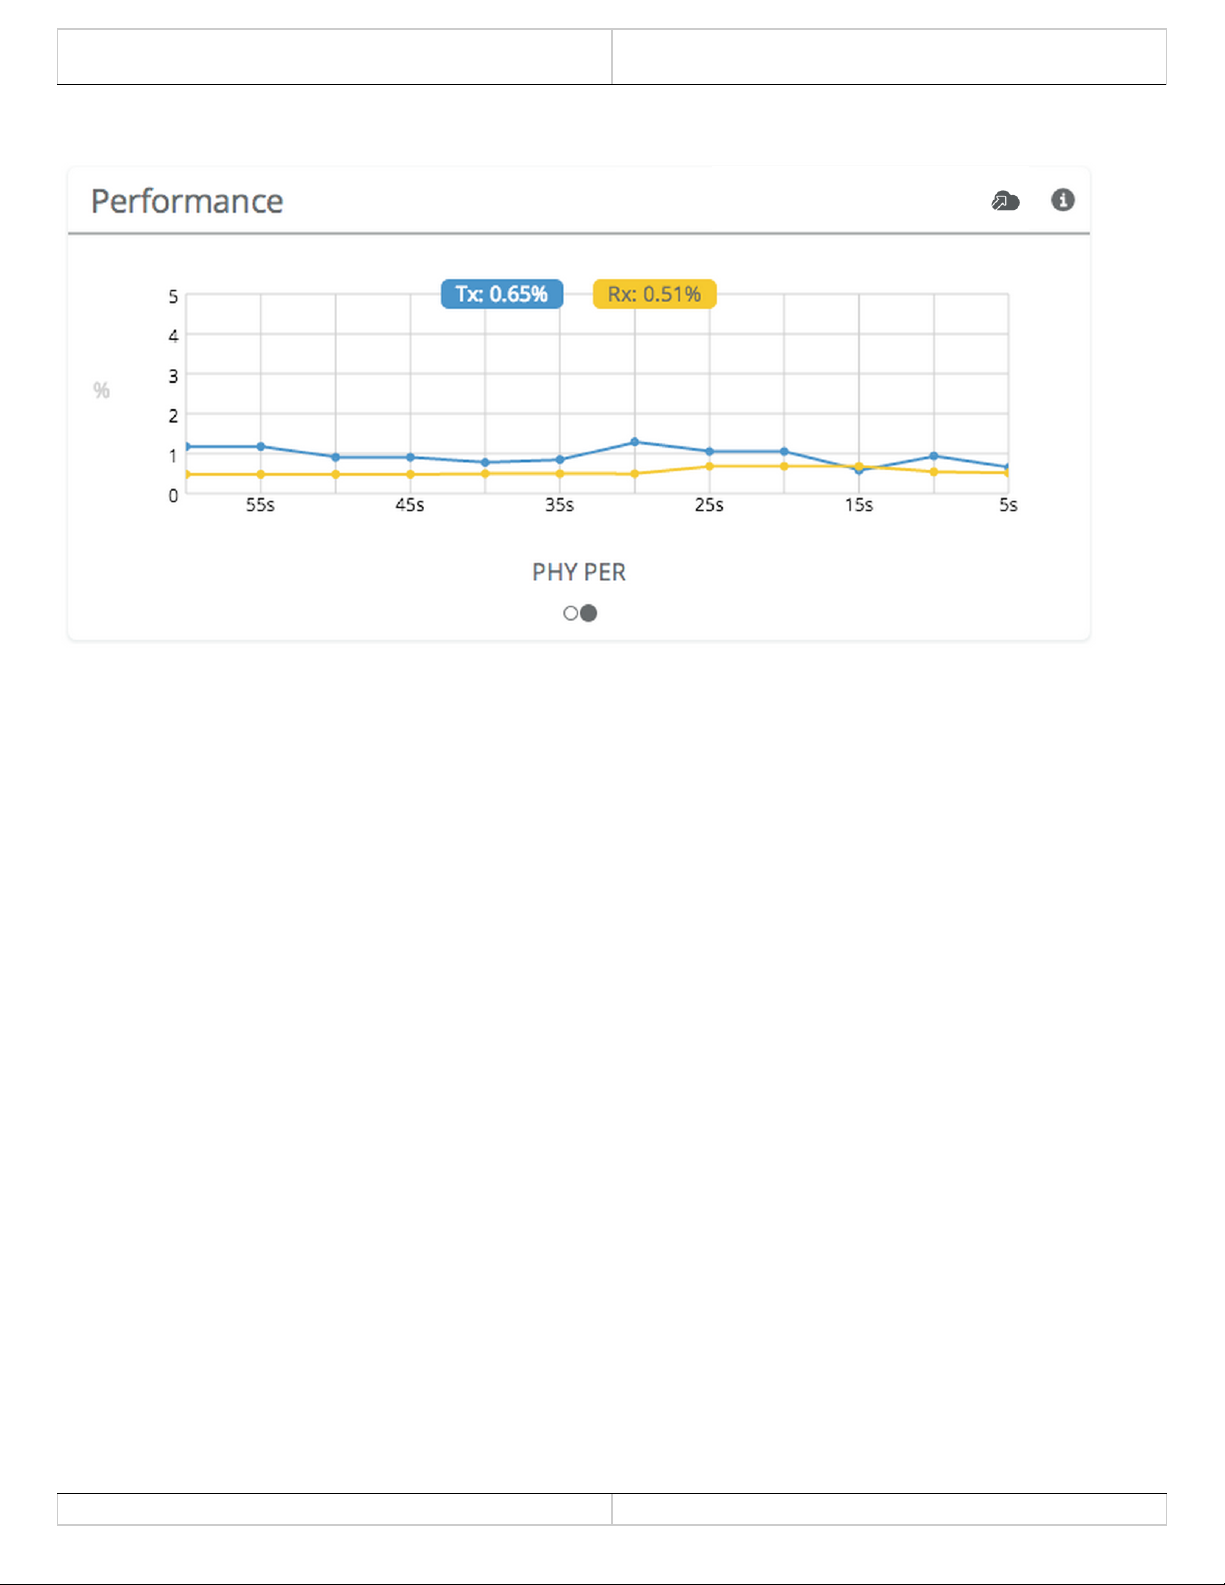
You can toggle between the charts by clicking on the navigation circles at the bottom of the panel. The PER chart
shows the ratio of packets with errors to packets without errors for both transmit and receive PHY. Lower numbers
are better, and higher numbers are an indication of interference.
If enabled, click on the cloud icon button to view historical data within the Manage application.
Copyright © 2015 Mimosa Page 1
Mimosa Help Site
Mimosa Networks Help Site Dashboard
Copyright © 2015 Mimosa Page 2
Mimosa Help Site
Mimosa Networks Help Site Dashboard
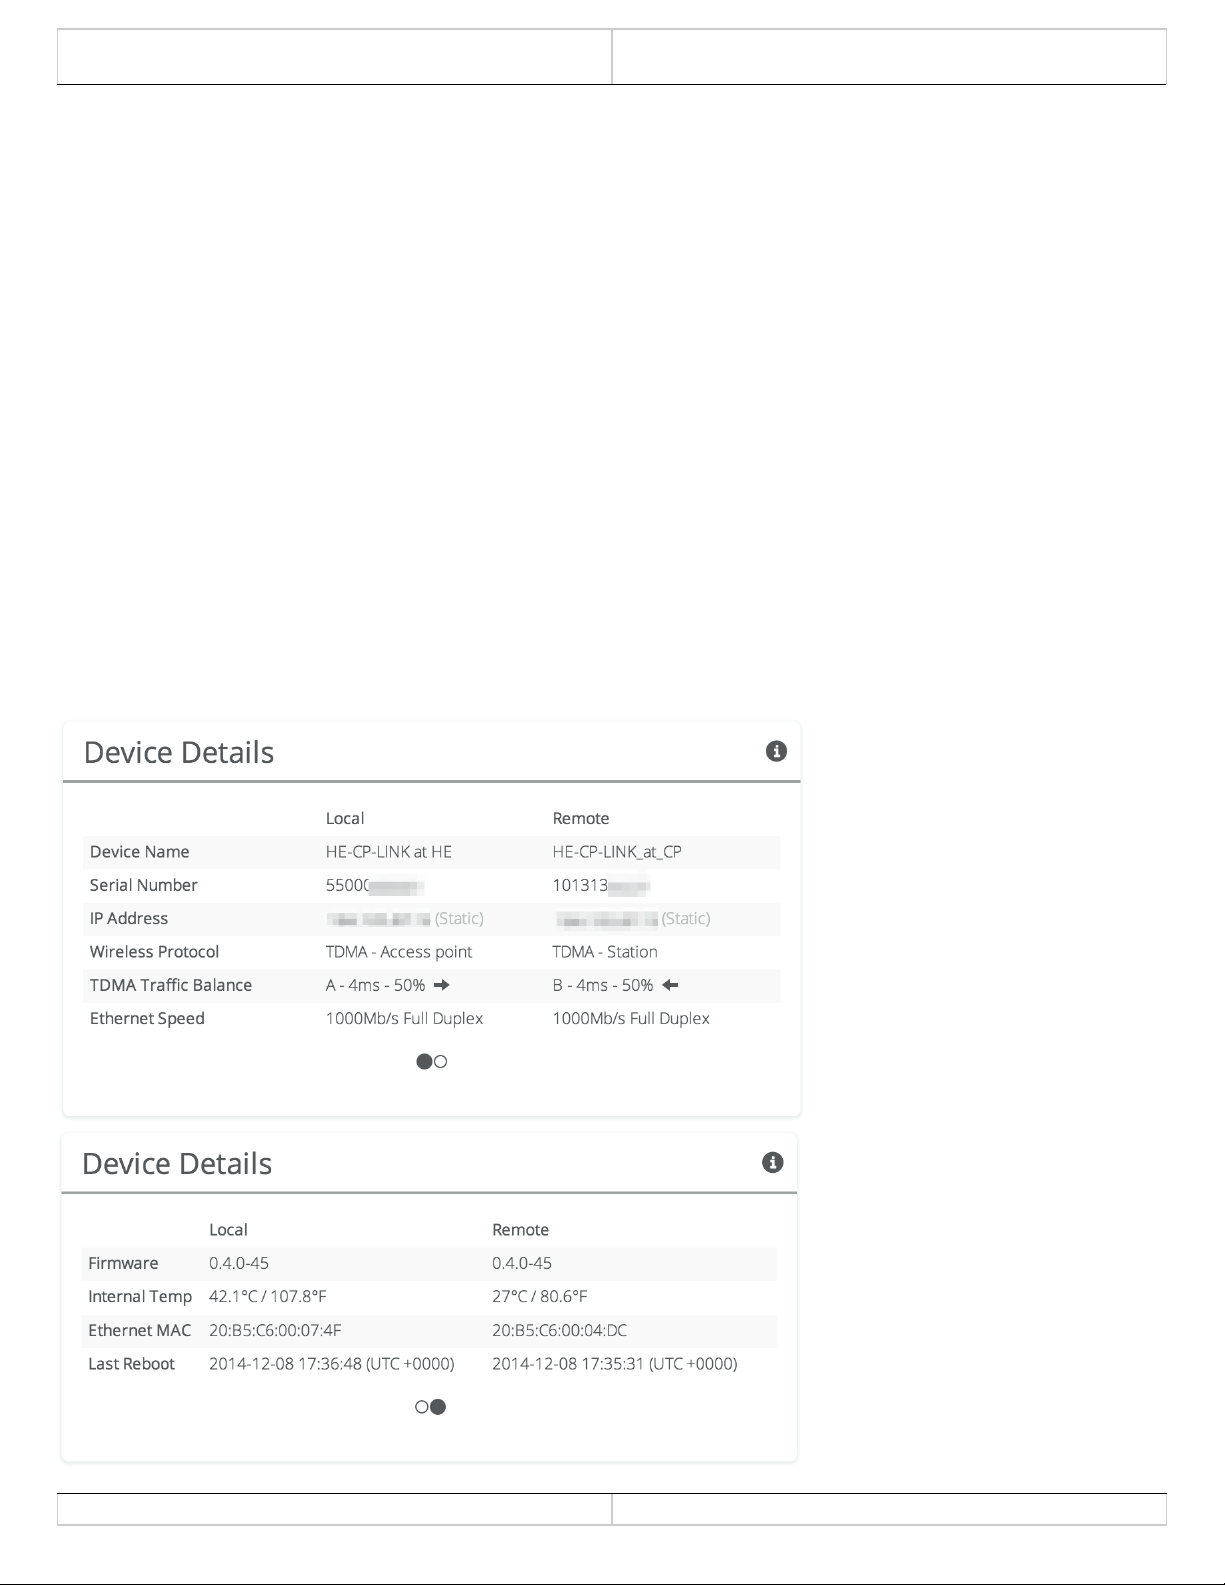
Reading Device Details
The Device Details panel shows two summary tables for the local and remote device configurations and their status.
Additional detail can be found by clicking on the navigation circles at the bottom of the panel.
The table shows the following for both Local and Remote devices:
●
Device Name: The friendly name given to each device. (Set in Preferences > General > Naming)
●
Serial Number: The unique identifier for the device assigned at the factory.
●
IP Address: The IP address of each device and how it was assigned. (Set in Preferences > Management)
●
Wireless Protocol: The MAC level protocol. (Set in Wireless > Link > MAC Configuration)
●
TDMA Traffic Balance: Identifies the "gender" of the radio, the duration for each TDMA time slot, and ratio of
bandwidth allocated for transmission. (Set in Wireless > Link > MAC Configuration)
●
Ethernet Speed: Data rate and duplex mode of the wired Ethernet interface.
●
Firmware: The latest firmware version applied to each device. (Set in Preferences > Update & Reboot)
●
Internal Temp: The measured temperature inside the device.
●
Ethernet MAC: The unique identifier for the physical Ethernet interface.
●
Last Reboot: The date and time at which each device last rebooted.
Copyright © 2015 Mimosa Page 1

Mimosa Help Site
Mimosa Networks Help Site Dashboard
Reading MIMO Status Tables
The MIMO Status tables describe the Tx/Rx MIMO status: 2 RF chains and up to 2 data streams.
The Chains table describes each chain's power, noise, SNR, frequency and polarization.
The Streams table describes each stream's MCS index, PHY rates and Rx Error Vector Magnitude (EVM).
Each table can be found by clicking on the navigation circles at the bottom of the panel.
Copyright © 2015 Mimosa Page 1
Mimosa Help Site
Mimosa Networks Help Site Channel & Power
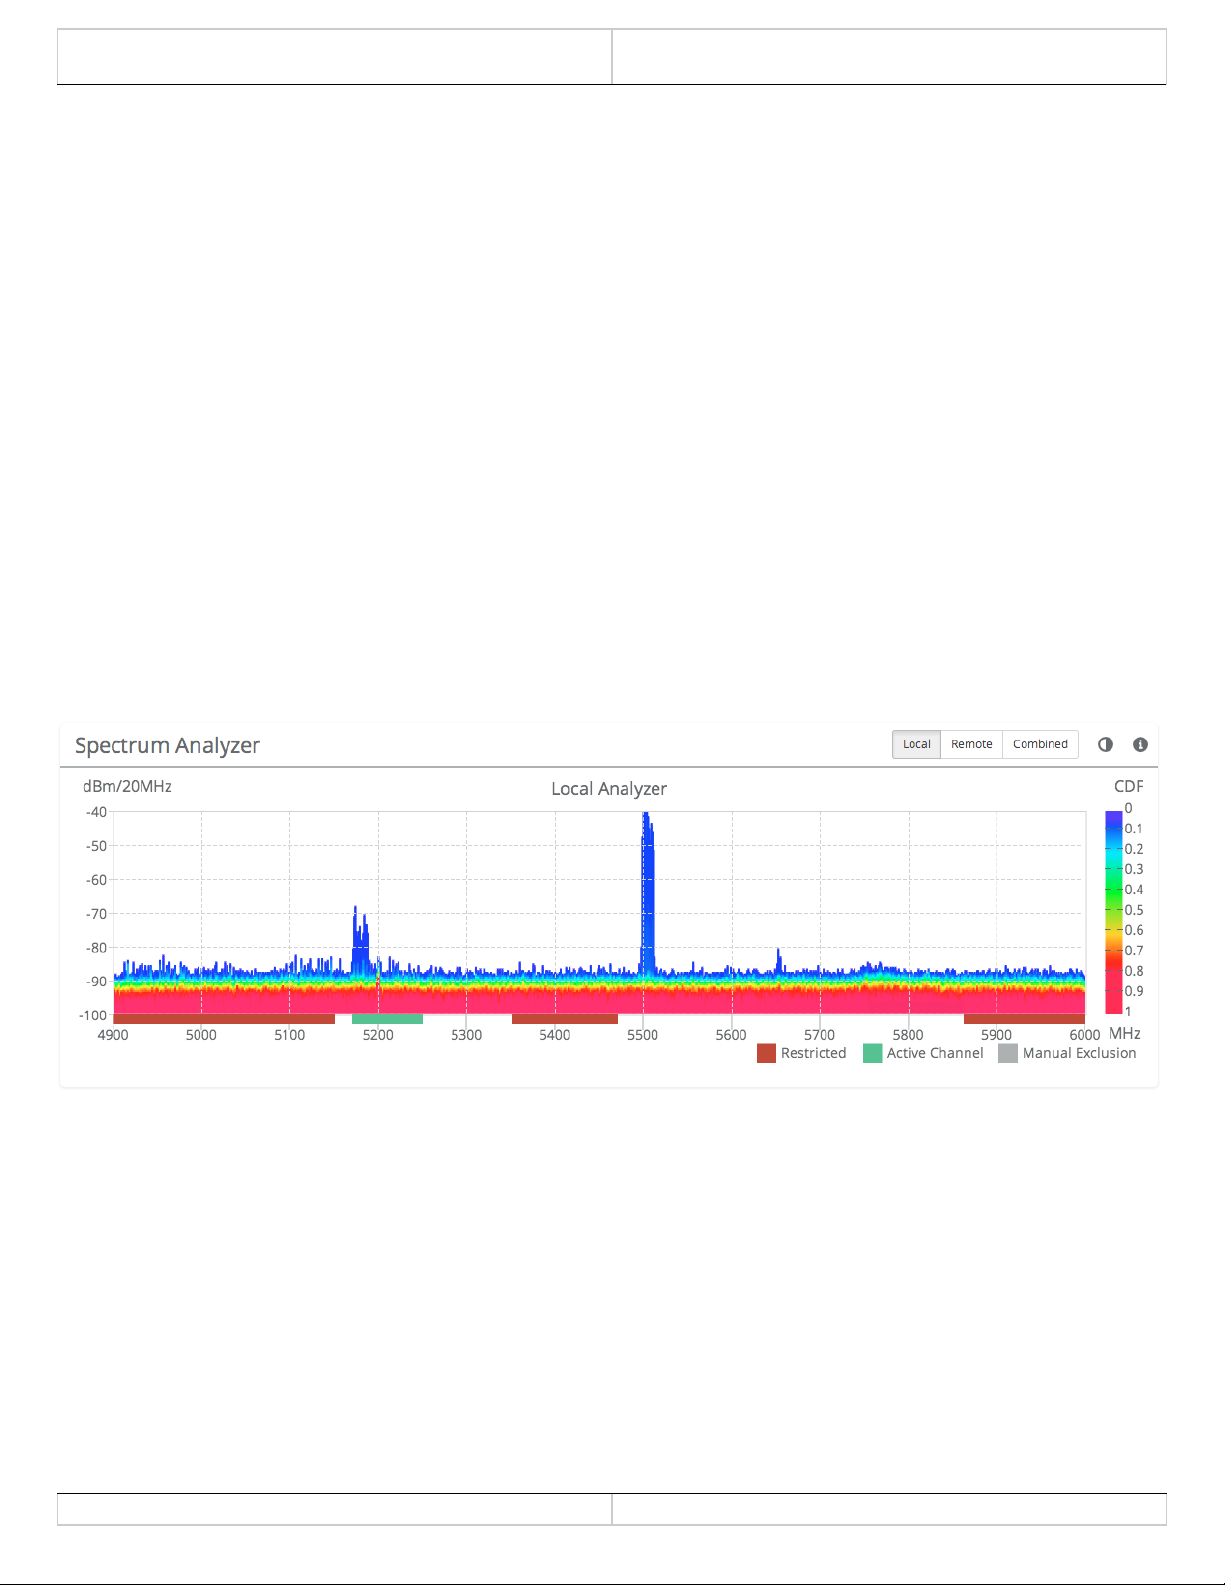
Reading the Spectrum Analyzer
The Spectrum Analyzer actively scans the 5 GHz band in the background to report on interference sources that may
impact link performance by frequency, amplitude, and probability of recurrence. The display can be shown for the
local radio, remote radio or a combination of both. Click on the half circle icon in the upper right to toggle the
graph's background color between black and white. Click the Local, Remote, or Combined buttons to view spectrum
individually or simultaneously. Please note that the remote side data may be as much as 5 minutes behind the local
radio.
Channels that are already in use have “above average” amplitude on the vertical axis, and are shaded in different
colors to represent how often the signals are likely to be on the same frequency at the same amplitude. The legend
to the right of the graph explains the color code for the Cumulative Distribution Function (CDF). The color red
suggests the highest probability (closer to 1), while blue represents the lowest probability (closer to 0).
There are three types of markings, or bars, immediately beneath the graph’s horizontal axis that indicate frequency
ranges that are restricted, manually excluded, or in active use by this link. Note that traffic from the Active Channel
is excluded from the display so that noise can be detected.
Copyright © 2015 Mimosa Page 1
Mimosa Help Site
Mimosa Networks Help Site Channel & Power
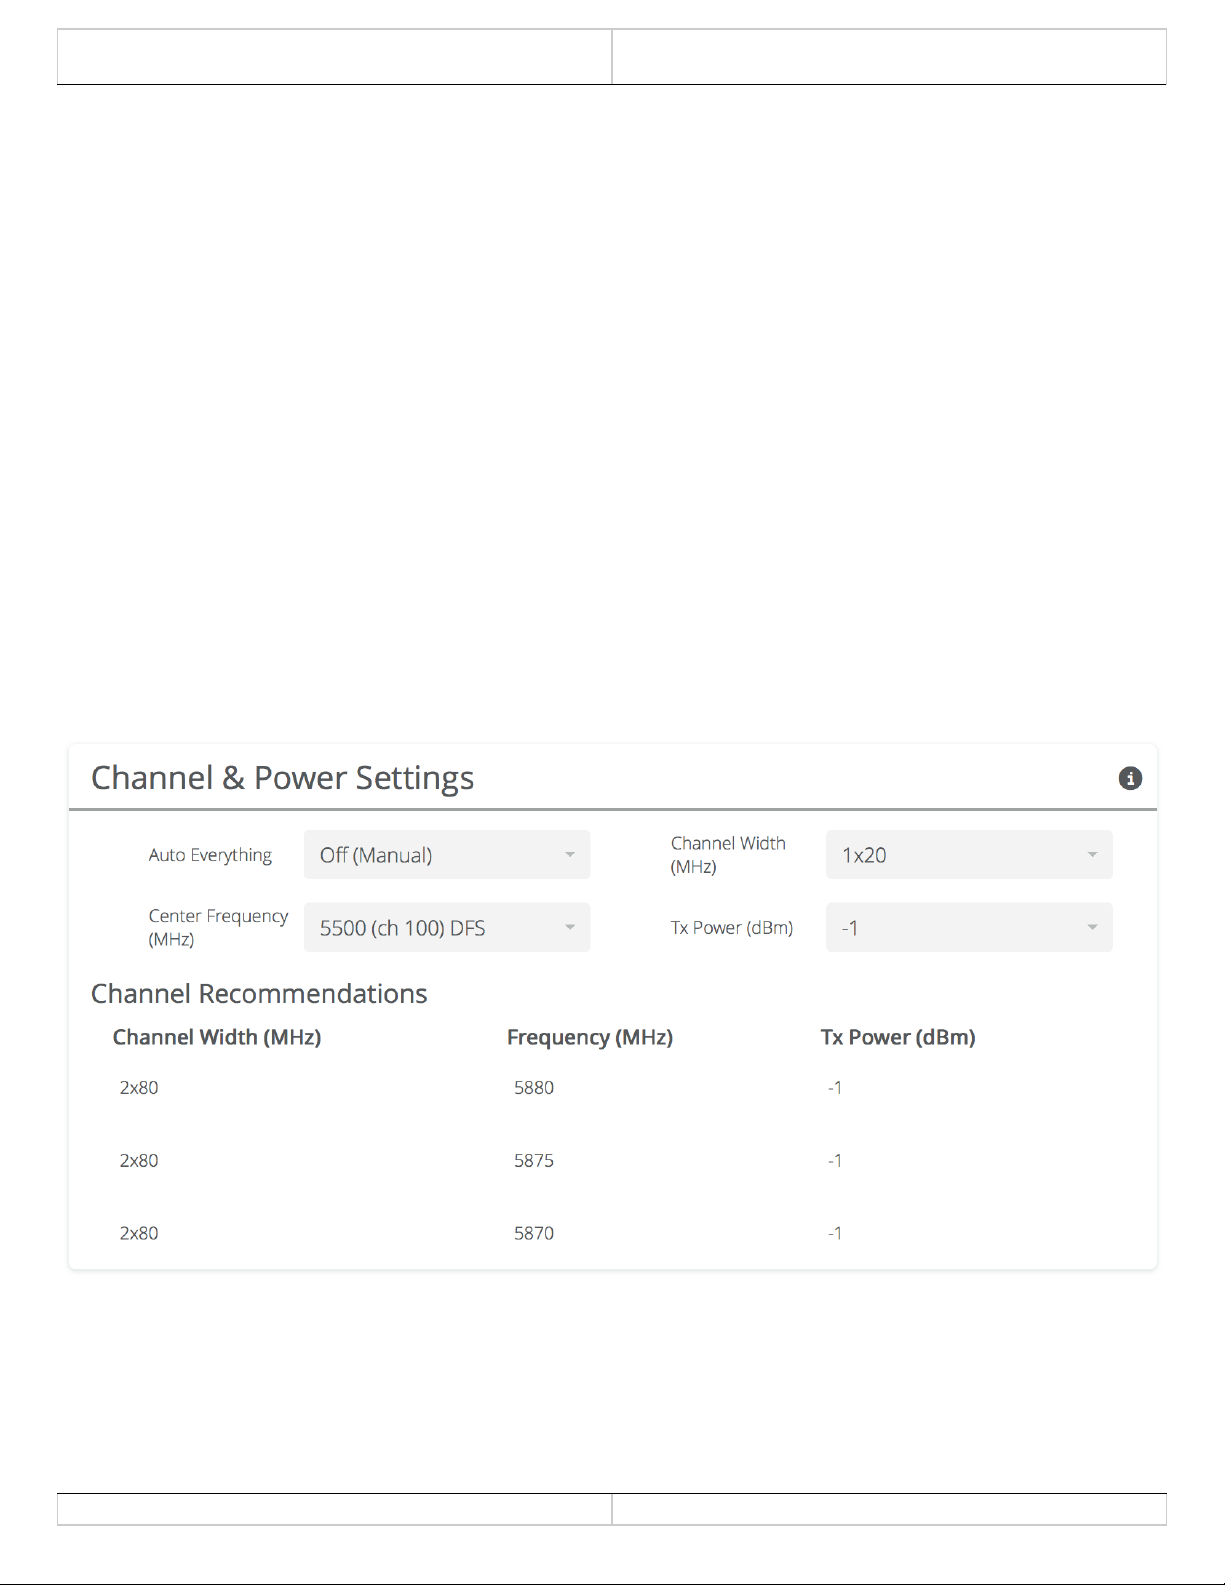
Managing Channel & Power Settings
The Chanel and Power Settings panel allows for either automatic or manual changes to frequency, channel width,
and power for either one or two channels.
●
Auto Everything - Automatically configure channel, channel width and power to optimize performance based on
spectrum data.
●
Channel Width (MHz) - Choose the width for each (20, 40, 0r 80 MHz).
●
Channel Center Frequency - In Off (Manual) mode, select the center frequency of the channel used on the link.
In all modes, the center frequency represents the absolute center of the selected channel width without any
offset, and the center can be moved in 5 MHz increments. If Auto Everything is set to On, the Channel(s) will be
automatically set, and not editable.
●
Power - Set the desired transmit power level. The allowed options are determined by a combination of country
and chosen frequency. If Auto Everything is set to On, the Channel & power will be automatically set, and not
editable.
●
Antenna Gain (dBi) - Set the gain according to antenna specifications and subtract out any cable/connector
loss. By default, this value is set to 25 dBi for the B5 and not shown.
●
Channel Recommendations - List of channel widths, center frequencies, and Tx powers that Auto Everything
would choose in order of preference (if enabled).
Note: Tx power selections may be limited based on your regulatory domain (refer to the Maximum Power chart for more details).
Copyright © 2015 Mimosa Page 1
Mimosa Help Site
Mimosa Networks Help Site Channel & Power
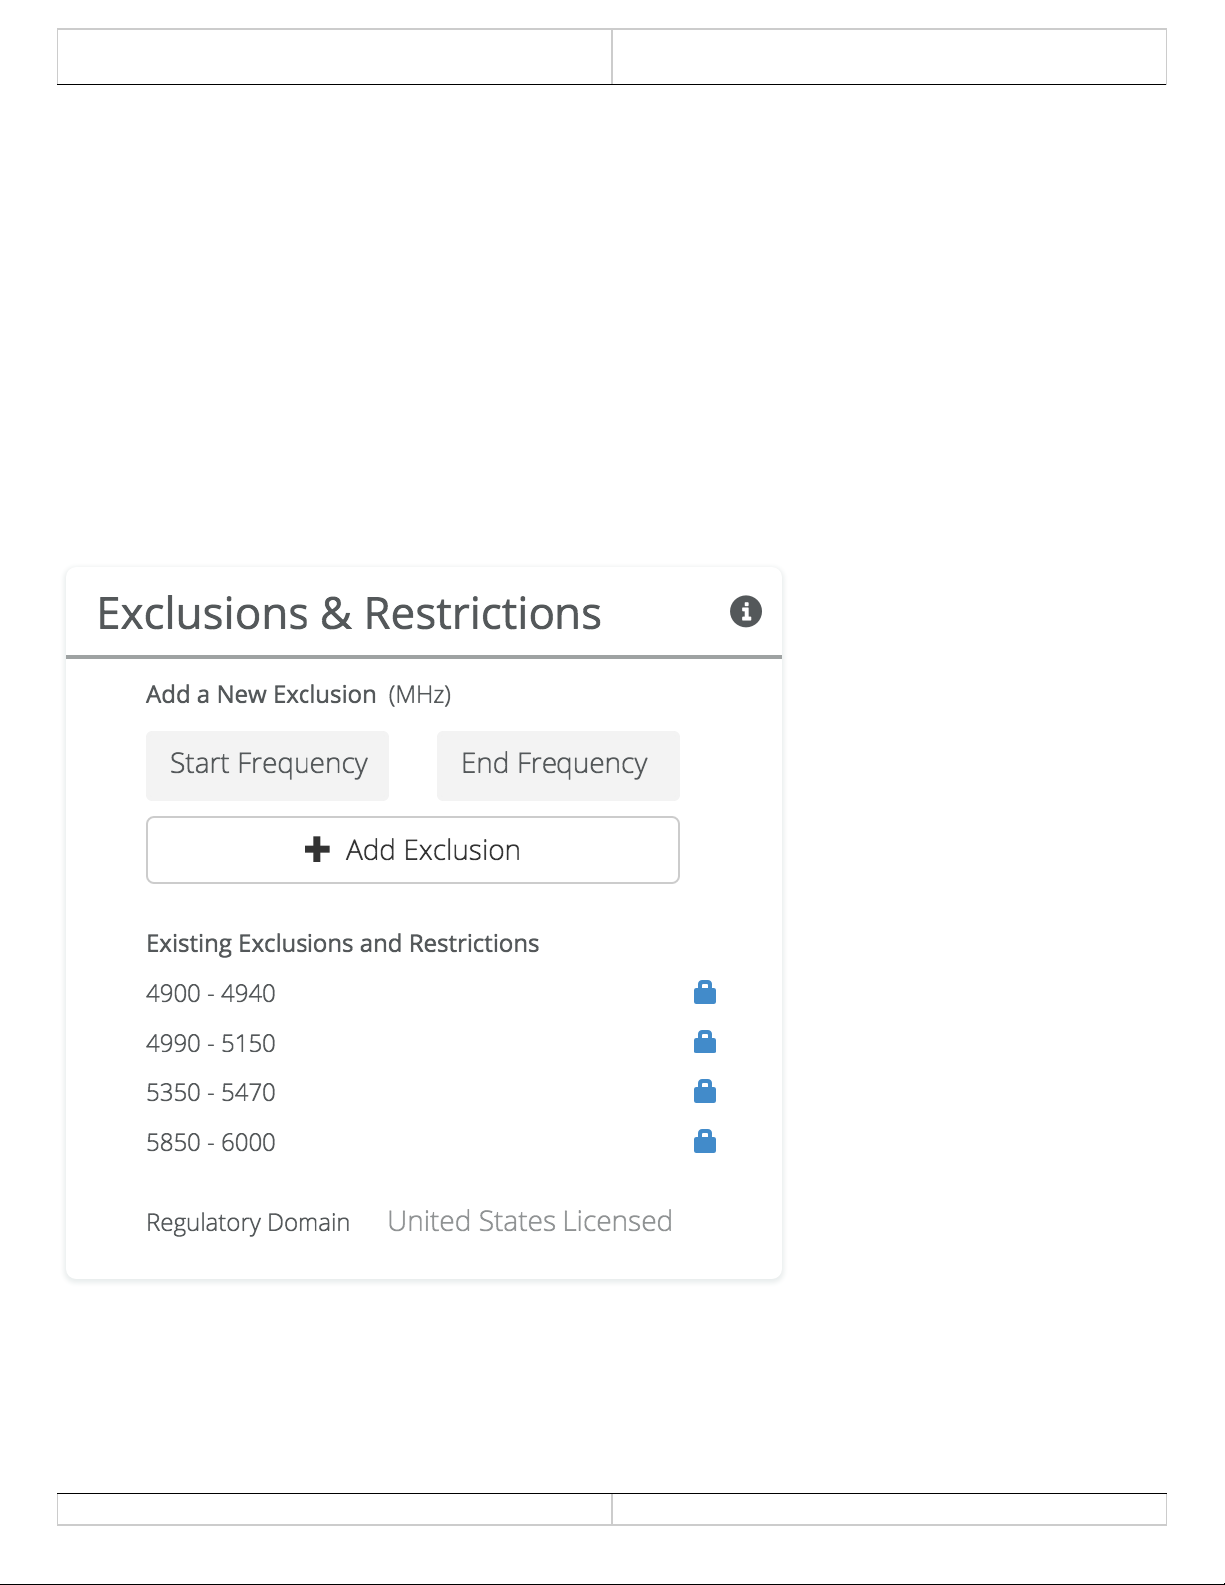
Managing Exclusions & Restrictions
Exclusions list the frequency ranges in which the device should not operate. The Auto Everything feature will avoid
these frequency bands. The excluded bands will be shown as shaded regions on the Spectrum Analyzer.
●
Start - Specify the start of the frequency range to be excluded.
●
End - Specify the end of the frequency range to be excluded.
●
Add Exclusions - The button to add the Start and End frequency to the exclusion list.
●
Existing Exclusions and Restrictions - Exclusions can be removed from the list by clicking on the trash icon. The
restricted bands with the lock icon cannot be removed. They are protected because of regulatory requirements.
●
Regulatory Domain - The country in which the device has been configured to run.
Copyright © 2015 Mimosa Page 1
Mimosa Help Site
Mimosa Networks Help Site Link
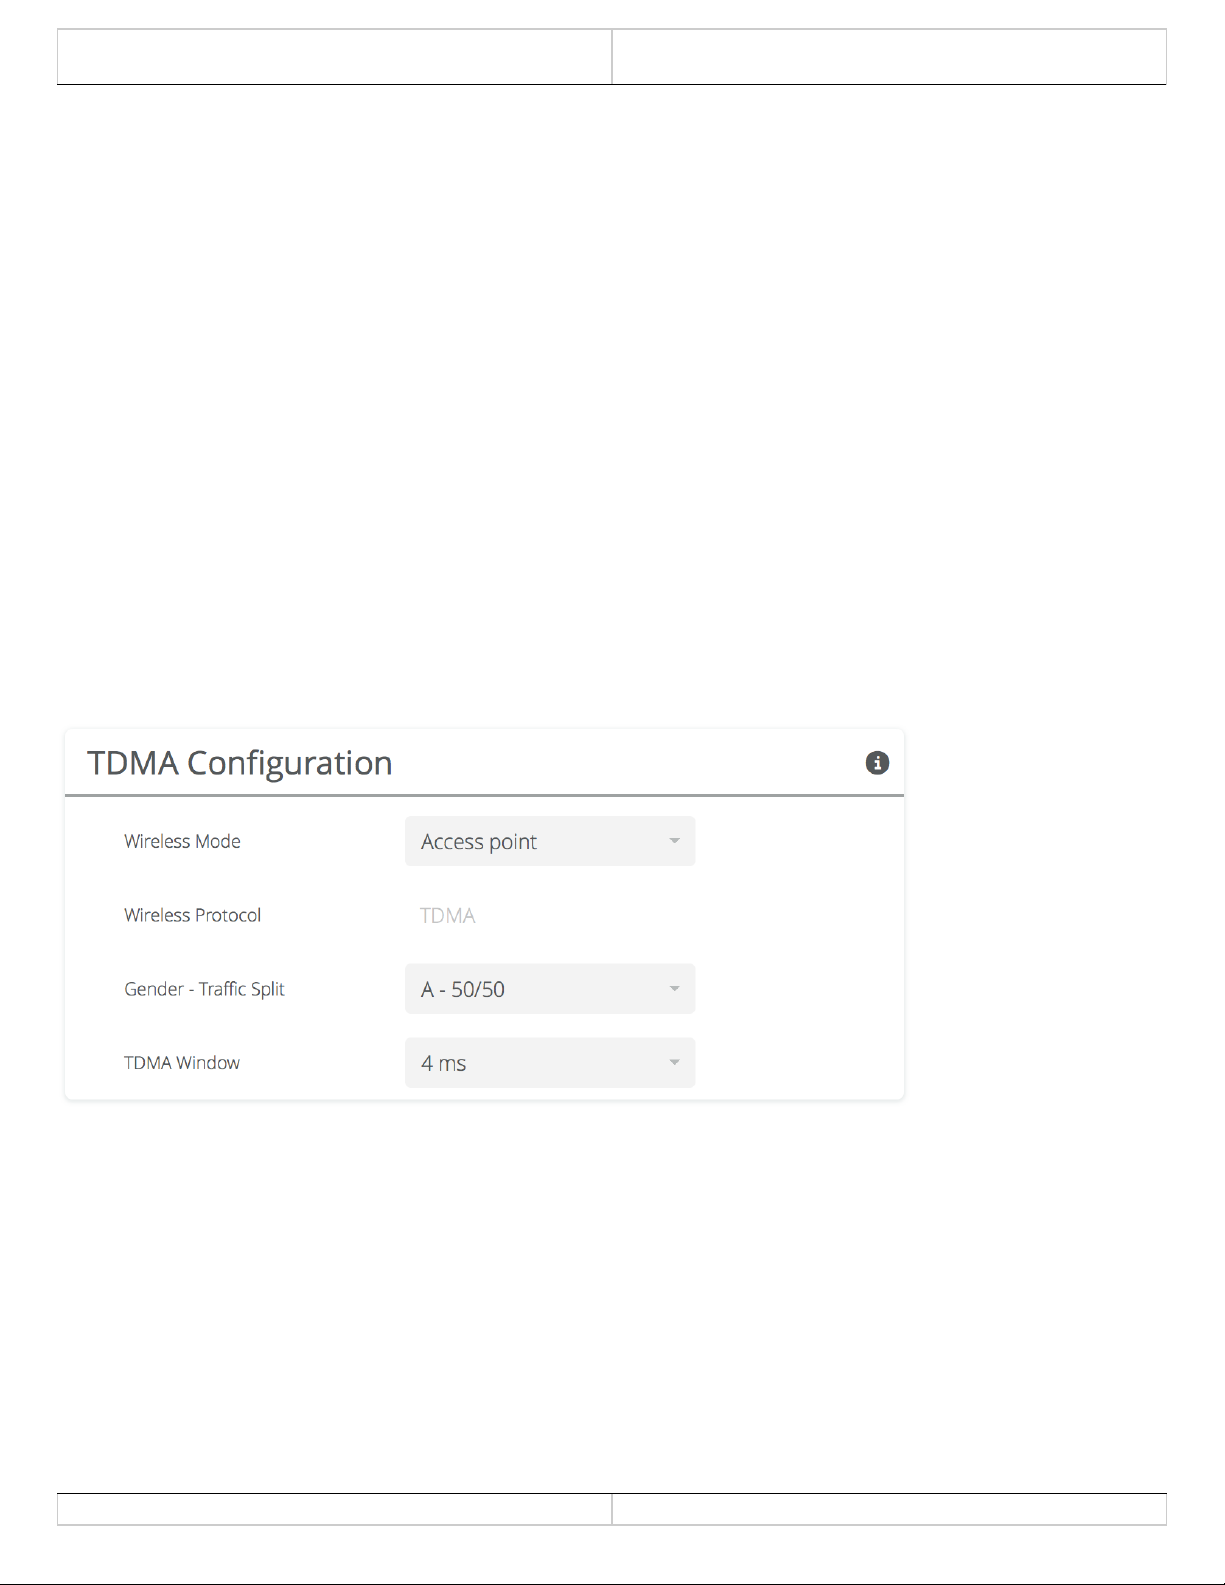
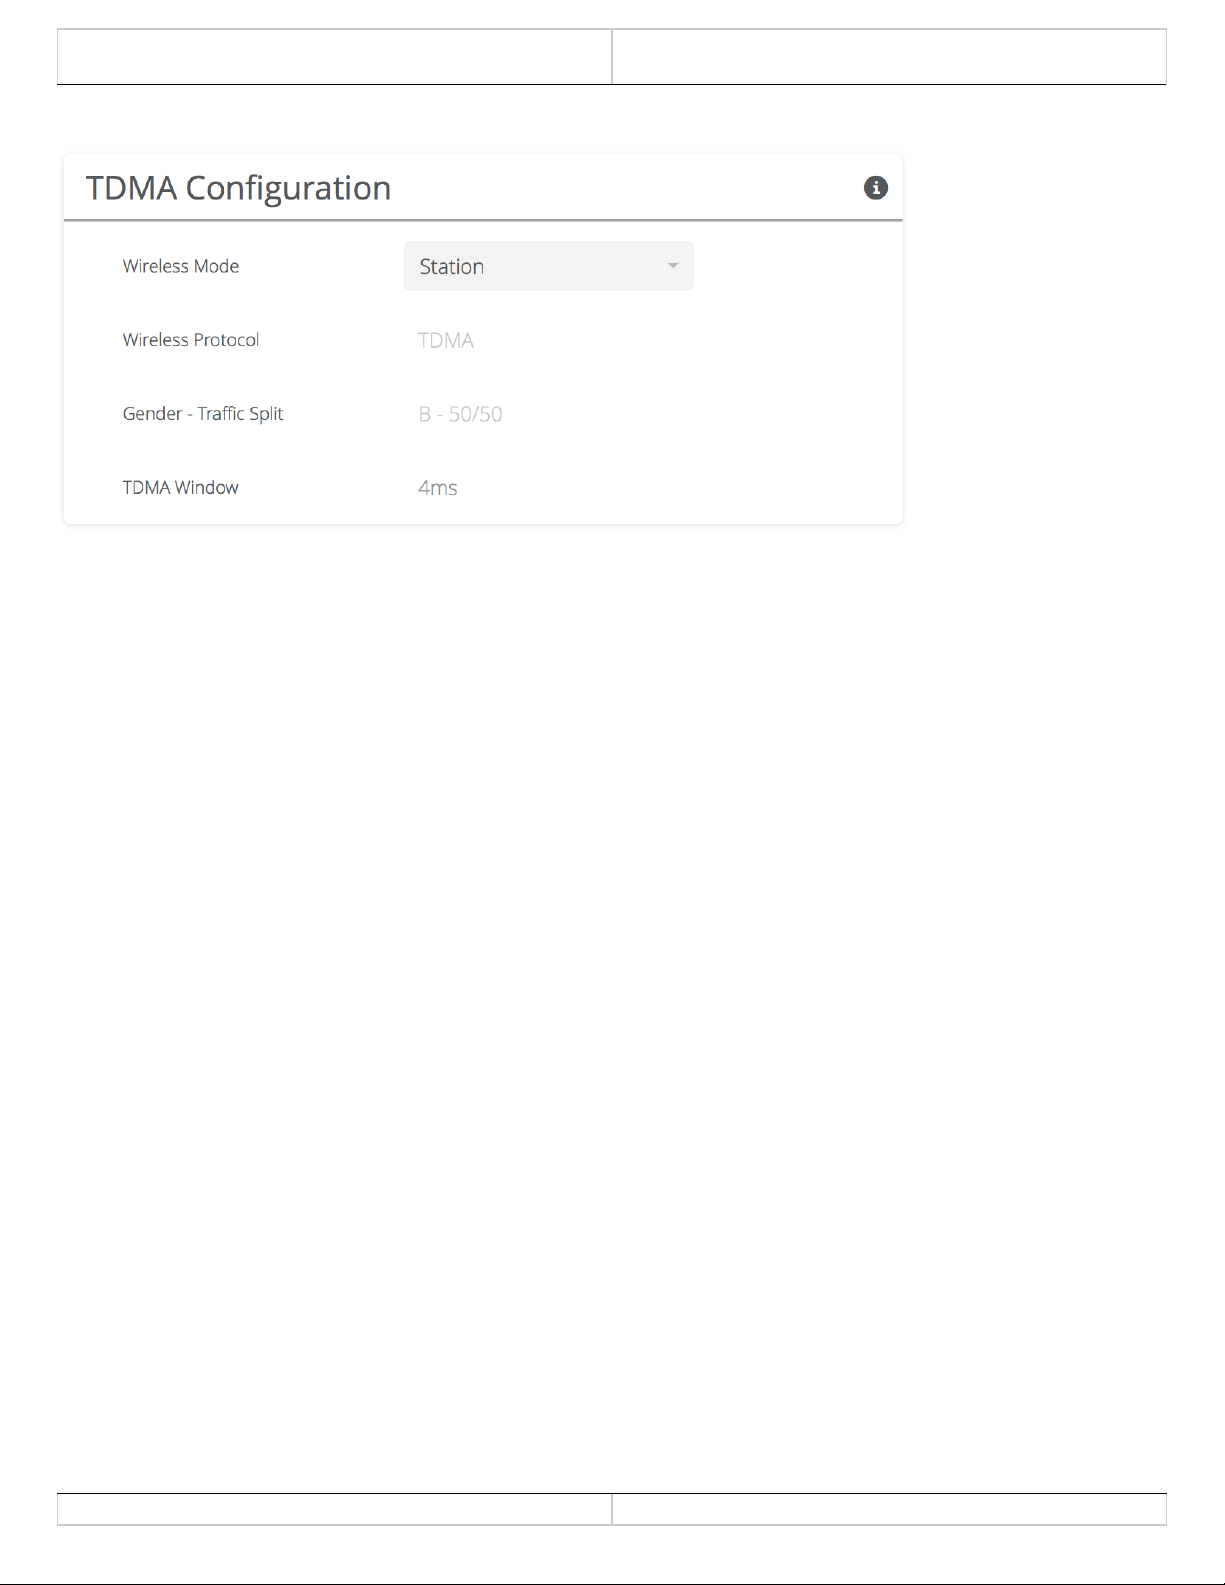
TDMA Configuration Settings
The TDMA Configuration panel contains controls for configuring and fine tuning TDMA performance. One side of the
radio link must be set as an Access point, and the other set as a Station. The Station inherits the other settings from
the AP, so the other fields are grayed out and not accessible when Station is selected.
●
Wireless Mode - Choose whether the device will act as an Access Point or a Station.
●
Wireless Protocol - TDMA is a deterministic protocol where each device is assigned a time slot during which it is
allowed to transmit.
●
Gender - Traffic Split - The radio can be configured to allocate bandwidth symmetrically (50/50) or biased
towards downstream (75/25) in environments where traffic direction is expected to be heavier in one direction
than the other. With an asymmetrical split, the local radio is represented first in the slash notation,
(local/remote). For example, in the (75/25) split, the local radio gets 75, while the remote radio gets 25. If
"Auto" is selected the radio will automatically determine, based upon traffic flow, which ratio will be used. The
radio will continue to evaluate the flow and adjust accordingly.
●
TDMA Window - Determines the length of the transmit time slot in milliseconds.
Example Access Point Settings
Example Station Settings
Copyright © 2015 Mimosa Page 1
Mimosa Help Site
Mimosa Networks Help Site Link
Copyright © 2015 Mimosa Page 2
Mimosa Help Site
Mimosa Networks Help Site Link
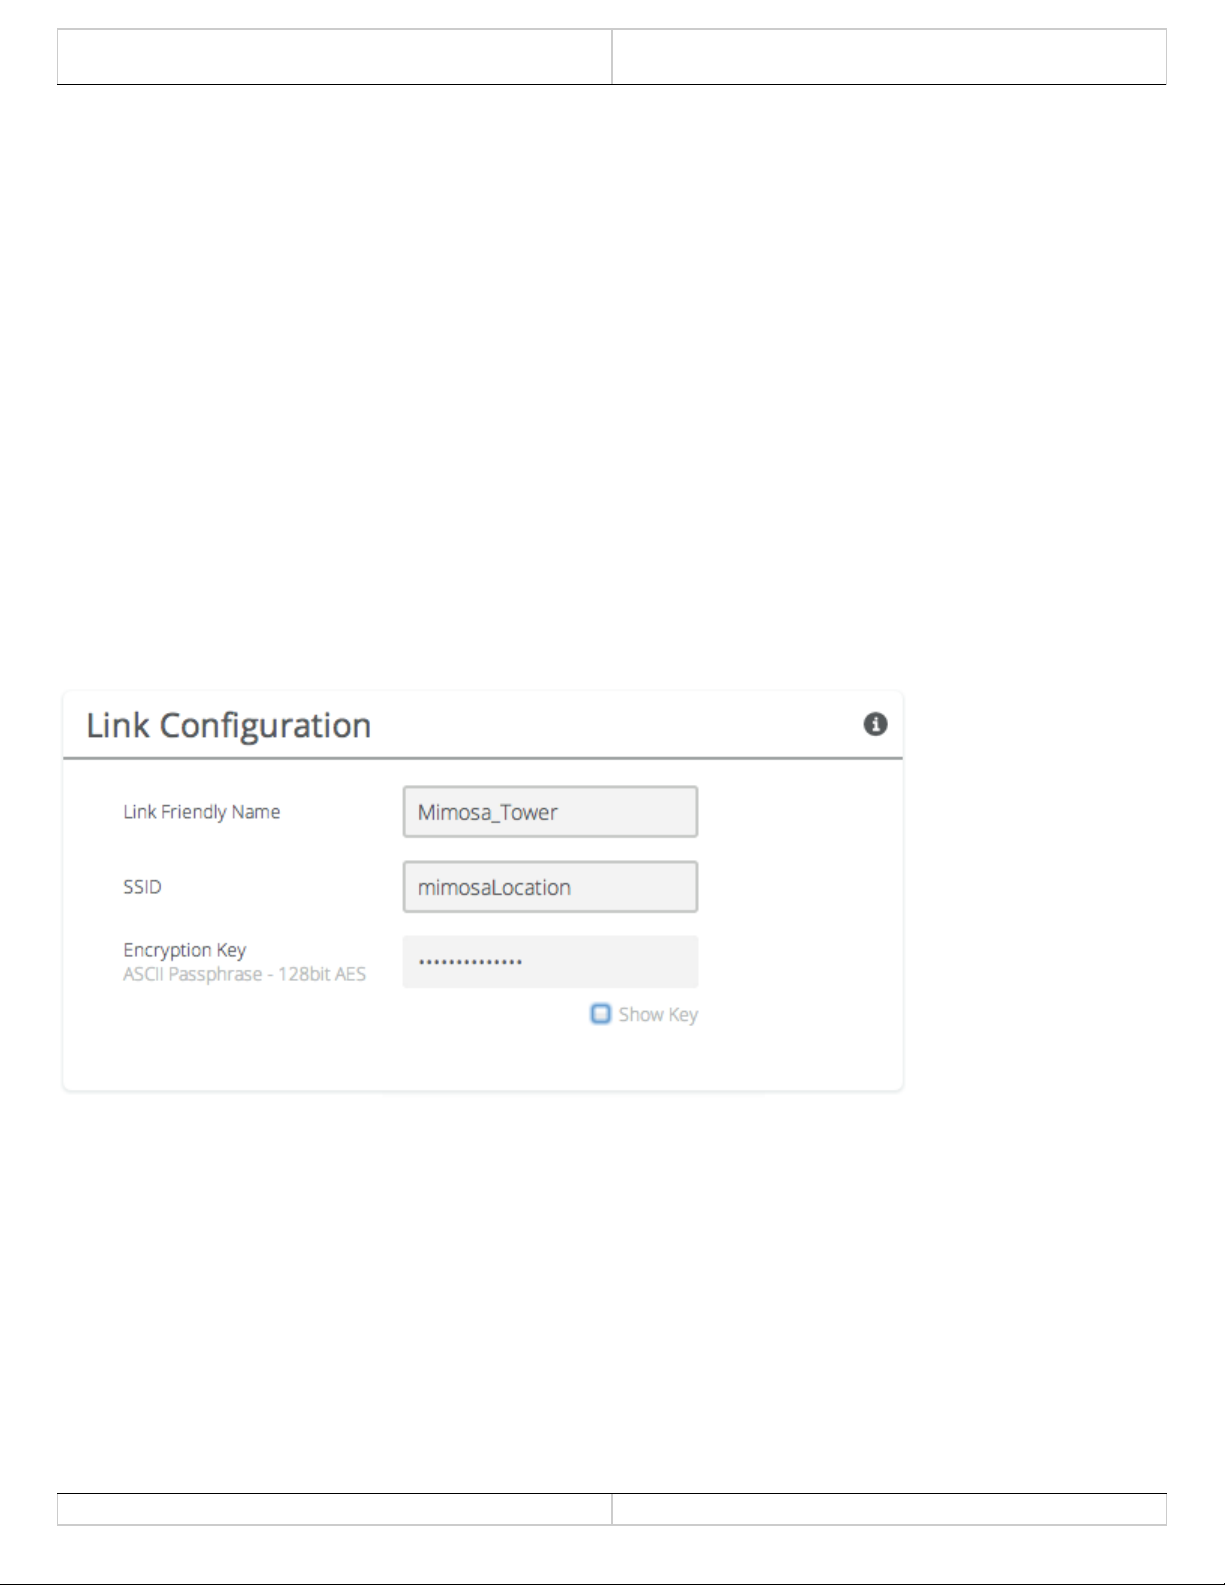
Link Configuration Settings
The Link Configuration panel includes controls to define the 5 GHz SSID and passphrase between radios:
●
Link Friendly Name - A friendly name to describe the link between the Access Point (AP) and Station. This name
is used to differentiate amongst other links.
●
SSID - The wireless link name used by both radios. Both AP and Station must use the same SSID to
communicate with each other.
●
Encryption Key - Enter the ASCII Passphrase to connect with the broadcasted SSID. Select "Show Key" to see
passphrase in plain text. Enter any combination of printable characters. The passphrase should be between 8 to
63 characters in length. The Encryption Key must be the same on both the Access Point and Station for them to
communicate with each other.
●
Scan for SSID - Causes the Station to scan and display a list of Access Points and the SSIDs they broadcast.
●
Status (Connect) - Click button to connect to the SSID. This button will be grayed out if already connected to
that network. Status shows "Connected" or "Not Connected".
Example Access Point Link Configuration
Example Station Link Configuration
Copyright © 2015 Mimosa Page 1
 Loading...